Untitled - Eclética Química Journal - Unesp
76
-
Upload
khangminh22 -
Category
Documents
-
view
0 -
download
0
Transcript of Untitled - Eclética Química Journal - Unesp
UNIVERSIDADE ESTADUAL PAULISTA
Reitor
Sandro Roberto Valentini
Vice-Reitor
Sergio Roberto Nobre
Pró-Reitor de Planejamento Estratégico e Gestão
Leonardo Theodoro Büll
Pró-Reitora de Graduação
Gladis Massini-Cagliari
Pró-Reitora de Pós-Graduação
Telma Teresinha Berchielli
Pró-Reitora de Extensão Universitária
Cleopatra da Silva Planeta
Pró-Reitor de Pesquisa
Carlos Frederico de Oliveira Graeff
INSTITUTO DE QUÍMICA
Diretor
Eduardo Maffud Cilli
Vice-Diretora
Dulce Helena Siqueira Silva
Editorial team
iq.unesp.br/ecletica
| Vol. 45 | n. 1 | 2020 |
Editorial Team
Editors Prof. Assis Vicente Benedetti, Institute of Chemistry Unesp Araraquara, Brazil (Editor-in-Chief)
Prof. Arnaldo Alves Cardoso, Institute of Chemistry Unesp Araraquara, Brazil
Prof. Antonio Eduardo Mauro, Institute of Chemistry Unesp Araraquara, Brazil
Prof. Horacio Heinzen, Faculty of Chemistry UdelaR, Montevideo, Uruguay
Prof. Maysa Furlan, Institute of Chemistry Unesp Araraquara, Brazil
Prof. Maria Célia Bertolini, Institute of Chemistry Unesp Araraquara, Brazil
Prof. Paulo Clairmont Feitosa de Lima Gomes, Institute of Chemistry, Unesp Araraquara, Brazil
Editorial Board Prof. Jairton Dupont, Instituto de Química, Universidade Federal do Rio Grande do Sul, UFRGS, RS, Brazil
Prof. Enric Brillas, Facultat de Química, Universitat de Barcelona, Spain
Prof. Verónica Cortés de Zea Bermudez, Escola de Ciências da Vida e do Ambiente,Universidade de Trás-
os-Montes e Alto Douro, Vila Real, Portugal
Prof. Lauro Kubota, Instituto de Química, Universidade Estadual de Campinas, Unicamp, SP, Brazil
Prof. Ivano Gerardt Rolf Gutz, Instituto de Química, Universidade de São Paulo, USP, SP, Brazil
Prof. Massuo Jorge Kato, Instituto de Química, Universidade de São Paulo, USP, SP, Brazil
Prof. Francisco de Assis Leone, Faculdade de Filosofia, Ciências e Letras, Universidade de São Paulo,
Ribeirão Preto, USP-RP, SP, Brazil
Prof. Roberto Santana da Silva, Faculdade de Ciências Farmacêuticas, Universidade de São Paulo, Ribeirão
Preto, USP-RP, SP, Brazil
Prof. José Antônio Maia Rodrigues, Faculdade de Ciências, Universidade do Porto, Portugal
Prof. Bayardo Baptista Torres, Instituto de Química, Universidade de São Paulo, USP, SP, Brazil
Technical Staff Gustavo Marcelino de Souza
Letícia Amanda Miguel
Eclética Química Journal 2020
Editorial
iq.unesp.br/ecletica
| Vol. 45 | n. 1 | 2020 |
Editorial
The Editor is very happy to announce the first issue of Eclética Química Journal of
2020, which contains varied and interesting subjects for the readers. The first article combines the
color parameters of digital images with artificial neural networks (ANN) to predict the bulk
density in leguminous grains of different traits. The challenge of estimating physicochemical
properties of dry grains includes variations in shape, texture, and size and similarity of grains
colors to the naked eye. The study allowed to obtain a very good correlation between the reference
values and values predicted by the ANN. In the sequence, the synthesis, characterization using
different physicochemical techniques, and theoretical calculations on the optimized structures of
the Ni(II) mixed-ligand complexes are presented and discussed. The Schiff bases are coordinated
to the Ni(II) ion via the two deprotonated phenolic oxygen and azomethine nitrogen atoms. The
presented complexes, according to biological studies, demonstrated to have antibacterial and
antioxidant properties. Following, a satisfactory method for identification and quantification of a
widely used medicinal plant, species Harpagophytum procumbens DC, is described using high-
performance liquid chromatography allows the quality control of commercial products. The
importance of this medicinal plant is promptly recognized due to the anti-inflammatory properties,
which are attributed to an iridoid glycoside. Afterwards, it is well known that the continuous
research endeavors for the optimization of mineral resource utilization efforts, justified by the
primacy of the mineral industry and the need to fulfill the demand of the global market. In this
sense, mineral characterization may be the first step, which was here achieved by grain-size
analysis of coarse and fine aggregates of verdete rock and the methodology used represents a
contribution to the mineral characterization. This issue of EQJ is closed with the description of
how to obtain of exact bound state energy spectrum of the Schrödinger equation with energy
dependent molecular Kratzer potential, using asymptotic iteration method. Particularly, the
influence of the energy-dependent Kratzer potential on some diatomic molecules is described.
The Editor and his team thank all the authors for their effective contributions, and the
reviewers for their excellent evaluation of the manuscripts, wishing everyone a prosperous year
in 2020.
Assis Vicente Benedetti
Editor-in-Chief of EQJ
Author guidelines
iq.unesp.br/ecletica
| Vol. 45 | n. 1 | 2020 |
Instructions for Authors
Preparation of manuscripts
• Only manuscripts in English will be accepted. British or American usage is acceptable, but they should
not be mixed.
• The corresponding author should submit the manuscript online at
http://revista.iq.unesp.br/ojs/index.php/ecletica/author
• Manuscripts must be sent in editable files as *.doc, *.docx or *.odt. The text must be typed using font style
Times New Roman and size 11. Space between lines should be 1.5 mm and paper size A4.
• The manuscript should be organized in sections as follows: Introduction, Experimental, Results and
Discussion, Conclusions, and References. Sections titles must be written in bold and sequentially numbered;
only the first letter should be in uppercase letter. Subsections should be written in normal and italic lowercase
letters. For example: 1. Introduction; 1.1 History; 2. Experimental; 2.1 Surface characterization; 2.1.1
Morphological analysis.
• The cover letter should include: the authors’ full names, e-mail addresses, ORCID code and affiliations,
and remarks about the novelty and relevance of the work. The cover letter should also contain a declaration of
the corresponding author, on behalf of the other authors, that the article being submitted is original and its
content has not been published previously and is not under consideration for publication elsewhere, that no
conflict of interest exists and if accepted, the article will not be published elsewhere in the same form, in any
language, without the written consent of the publisher. Finally, the cover letter should also contain the
suggestion of 3 (three) suitable reviewers (please, provide full name, affiliation, and e-mail).
• The first page of the manuscript should contain the title, abstract and keywords. Please, do not give
authors names and affiliation, and acknowledgements since a double-blind review system is used.
Acknowledgements should be added to the proof only.
• All contributions should include an Abstract (200 words maximum), three to five Keywords and a
Graphical Abstract (8 cm wide × 4 cm high) with an explicative text (2 lines maximum).
• Citations should be sequentially numbered and presented in square brackets throughout the text, and
references should be compiled in square brackets at the end of the manuscript as follows:
Journal:
[1] Adorno, A. T. V., Benedetti, A. V., Silva, R. A. G. da, Blanco, M., Influence of the Al content on the phase
transformations in Cu-Al-Ag Alloys, Eclet. Quim. 28 (1) (2003) 33-38. https://doi.org/10.1590/S0100-
46702003000100004.
Book:
[2] Wendlant, W. W., Thermal Analysis, Wiley-Interscience, New York, 3rd ed., 1986, ch1.
Author guidelines
Chapter in a book:
[3] Ferreira, A. A. P., Uliana, C. V., Souza Castilho, M. de, Canaverolo Pesquero, N., Foguel, N. V., Pilon dos
Santos, G., Fugivara, C. S., Benedetti, A. V., Yamanaka, H., Amperometric Biosensor for Diagnosis of
Disease, In: State of the Art in Biosensors - Environmental and Medical Applications, Rinken, T., ed., InTech:
Rijeka, Croatia, 2013, Ch. 12.
Material in process of publication:
[4] Valente Jr., M. A. G., Teixeira, D. A., Lima Azevedo, D., Feliciano, G. T., Benedetti, A. V., Fugivara, C.
S., Caprylate Salts Based on Amines as Volatile Corrosion Inhibitors for Metallic Zinc: Theoretical and
Experimental Studies, Frontiers in Chemistry. https://doi.org/10.3389/fchem.2017.00032.
• Figures, Schemes, and Tables should be numbered sequentially and presented at the end of the manuscript.
• Nomenclature, abbreviations, and symbols should follow IUPAC recommendations.
• Figures, schemes, and photographs already published by the same or different authors in other publications
may be reproduced in manuscripts of Eclet. Quim. J. only with permission from the editor house that holds
the copyright.
• Graphical Abstract (GA) should be a high-resolution figure (900 dpi) summarizing the manuscript in an
interesting way to catch the attention of the readers and accompanied by a short explicative text (two lines
maximum). GA must be submitted as *.jpg, *.jpeg or *.tif.
• Communications should cover relevant scientific results and are limited to 1,500 words or three pages of
the Journal, not including the title, authors’ names, figures, tables and references. However, Communications
suggesting fragmentation of complete contributions are strongly discouraged by Editors.
• Review articles should be original and present state-of-the-art overviews in a coherent and concise form
covering the most relevant aspects of the topic that is being revised and indicate the likely future directions of
the field. Therefore, before beginning the preparation of a Review manuscript, send a letter (one page
maximum) to the Editor with the subject of interest and the main topics that would be covered in the Review
manuscript. The Editor will communicate his decision in two weeks. Receiving this type of manuscript does
not imply acceptance to be published in Eclet. Quím. J. It will be peer-reviewed.
• Short reviews should present an overview of the state-of-the-art in a specific topic within the scope of the
Journal and limited to 5,000 words. Consider a table or image as corresponding to 100 words. Before beginning
the preparation of a Short Review manuscript, send a letter (one page maximum) to the Editor with the subject
of interest and the main topics that would be covered in the Short Review manuscript.
• Technical Notes: descriptions of methods, techniques, equipment or accessories developed in the authors’
laboratory, as long as they present chemical content of interest. They should follow the usual form of
presentation, according to the peculiarities of each work. They should have a maximum of 15 pages, including
figures, tables, diagrams, etc.
• Articles in Education in Chemistry and chemistry-correlated areas: research manuscript related to
undergraduate teaching in Chemistry and innovative experiences in undergraduate and graduate education.
They should have a maximum of 15 pages, including figures, tables, diagrams, and other elements.

Author guidelines
Special issues with complete articles dedicated to Symposia and Congresses can be published by Eclet. Quim.
J. under the condition that a previous agreement with Editors is established. All the guides of the journal must
be followed by the authors.
Eclet. Quim. J. Ethical Guides and Publication Copyright:
Before beginning the submission process, please be sure that all ethical aspects mentioned below were
followed. Violation of these ethical aspects may prevent authors from submitting and/or publishing articles in
Eclet. Quim. J.
• The corresponding author is responsible for listing as coauthors only researchers who have really taken
part in the work, for informing them about the entire manuscript content and for obtaining their
permission to submit and publish it.
• Authors are responsible for carefully searching for all the scientific work relevant to their reasoning
irrespective of whether they agree or not with the presented information.
• Authors are responsible for correctly citing and crediting all data used from works of researchers other
than the ones who are authors of the manuscript that is being submitted to Eclet. Quim. J.
• Citations of Master’s Degree Dissertations and PhD Theses are not accepted; instead, the publications
resulting from them must be cited.
• Explicit permission of a nonauthor who has collaborated with personal communication or discussion
to the manuscript being submitted to Eclet. Quím. J. must be obtained before being cited.
• Simultaneous submission of the same manuscript to more than one journal is considered an ethical
deviation and is conflicted to the declaration has been done below by the authors.
• Plagiarism, self-plagiarism, and the suggestion of novelty when the material was already published
are unaccepted by Eclet. Quim. J.
• The word-for-word reproduction of data or sentences as long as placed between quotation marks and
correctly cited is not considered ethical deviation when indispensable for the discussion of a specific
set of data or a hypothesis.
• Before reviewing a manuscript, the Turnitin antiplagiarism software will be used to detect any ethical
deviation.
• The corresponding author transfers the copyright of the submitted manuscript and all its versions
to Eclet. Quim. J., after having the consent of all authors, which ceases if the manuscript is rejected
or withdrawn during the review process.
• Before submitting manuscripts involving human beings, materials from human or animals, the authors
need to confirm that the procedures established, respectively, by the institutional committee on human
experimentation and Helsinki’s declaration, and the recommendations of the animal care institutional
committee were followed. Editors may request complementary information on ethical aspects.
• When a published manuscript in EQJ is also published in other Journal, it will be immediately
withdrawn from EQJ and the authors informed of the Editor decision.

Author guidelines
• Manuscript Submissions
For the first evaluation: the manuscripts should be submitted in three files: the cover letter as mentioned above,
the graphical abstract and the entire manuscript.
The entire manuscript should be submitted as *.doc, *.docx or *.odt files.
The Graphical Abstract (GA) 900 dpi resolution is mandatory for this Journal and should be submitted as *.jpg,
*.jpeg or *.tif files as supplementary file.
The cover letter should contain the title of the manuscript, the authors’ names and affiliations, and the relevant
aspects of the manuscript (no more than 5 lines), and the suggestion of 3 (three) names of experts in the subject:
complete name, affiliation, and e-mail).
When appropriate, important data to complement and a better comprehension of the article can be submitted
as Supplementary File, which will be published online and will be made available as links in the original
article. This might include additional figures, tables, text, equations, videos or other materials that are
necessary to fully document the research contained in the paper or to facilitate the readers’ ability to understand
the work. Supplementary Materials should be presented in appropriate .docx file for text, tables, figures and
graphics. The full title of the paper, authors’ names and affiliations, and corresponding author should be
included in the header. All supplementary figures, tables and videos should be referred in the manuscript body
as “Table S1, S2…”, “Fig. S1, S2…” and “Video S1, S2 …”.
• Reviewing
The time elapsed between the submission and the first response of the reviewers is around 3 months. The
average time elapsed between submission and publication is seven months.
• Resubmission (manuscripts “rejected in the present form” or subjected to “revision”): A LETTER WITH
THE RESPONSES TO THE COMMENTS/CRITICISM AND SUGGESTIONS OF
REVIEWERS/EDITORS SHOULD ACCOMPANY THE REVISED MANUSCRIPT. ALL
MODIFICATIONS MADE TO THE ORIGINAL MANUSCRIPT MUST BE HIGHLIGHTED.
• Editor’s requirements
Authors who have a manuscript accepted in Eclética Química Journal may be invited to act as reviewers.
Only the authors are responsible for the correctness of all information, data and content of the manuscript
submitted to Eclética Química Journal. Thus, the Editors and the Editorial Board cannot accept responsibility
for the correctness of the material published in Eclética Química Journal.
• Proofs
After accepting the manuscript, Eclet. Quim. J. technical assistants will contact you regarding your
manuscript page proofs to correct printing errors only, i.e., other corrections or content improvement are not
permitted. The proofs shall be returned in 3 working days (72 h) via e-mail.
• Authors Declaration
The corresponding author declares, on behalf of the other authors, that the article being submitted is original
and has been written by the stated authors who are all aware of its content and approve its submission.
Declaration should also state that the article has not been published previously and is not under consideration
for publication elsewhere, that no conflict of interest exists and if accepted, the article will not be published
elsewhere in the same form, in any language, without the written consent of the publisher.

Author guidelines
• Appeal
Authors may only appeal once about the decision regarding a manuscript. To appeal against the Editorial
decision on your manuscript, the corresponding author can send a rebuttal letter to the editor, including a
detailed response to any comments made by the reviewers/editor. The editor will consider the rebuttal letter,
and if dimmed appropriate, the manuscript will be sent to a new reviewer. The Editor decision is final.
• Contact
Gustavo Marcelino de Souza ([email protected])
Submission Preparation Checklist
As part of the submission process, authors are required to check off their submission's compliance with all of
the following items, and submissions may be returned to authors that do not adhere to these guidelines.
In Step 1, select the appropriate section for this submission.
Be sure that Authors’ names, affiliations and aknowledgements were removed from the manuscript. The
manuscript must be in *.doc, *.docx or *.odt format before uploading in Step 2.
In Step 3, add the full name of each author including the ORCID IDs in its full URL ONLY WITH HTTP,
NOT HTTPS (eg. http://orcid.org/0000-0002-1825-0097).
Add the authors in the same order as they appear in the manuscript in step 3.
Be sure to have the COVER LETTER and GRAPHICAL ABSTRACT (according to the Author Guildelines)
to upload them in Step 4.
Check if you've followed all the previous steps before continuing the submission of your manuscript.
Copyright Notice
The corresponding author transfers the copyright of the submitted manuscript and all its versions to Eclet.
Quim. J., after having the consent of all authors, which ceases if the manuscript is rejected or withdrawn
during the review process.
Self-archive to institutional, thematic repositories or personal web page is permitted just after publication.
The articles published by Eclética Química Journal are licensed under the Creative Commons Attribution
4.0 International License.
Summary
iq.unesp.br/ecletica
| Vol. 45 | n. 1 | 2020 |
SUMMARY
EDITORIAL BOARD..............................................................................................................................................3
EDITORIAL.……………………………………………………...............................................................................................4
INSTRUCTIONS FOR AUTHORS..........................................................................................................................5
ORIGINAL ARTICLES
Estimating bulk density in leguminous grains with different traits using color parameters from digital
images combined with artificial neural networks ...................................................................................... 11
Bruna Gava Floriam, Fabíola Manhas Verbi Pereira, Érica Regina Filletti
Synthesis, spectroscopic, biological activities and DFT calculations of nickel(II) mixed-ligand complexes
of tridentate Schiff bases ........................................................................................................................... 18
Abidemi Iyewumi Demehin, Mary Adelaide Oladipo, Banjo Semire
Determination of harpagoside in Harpagophytum procumbens DC tablet’s using analytical method by
high performance liquid chromatography .................................................................................................. 47
Gislane dos Santos Ribeiro, Amanda de Assis Carneiro, Diegue Henrique Nascimento Martins, Luiz
Alberto Simeoni, Dâmaris Silveira, Pérola Oliveira Magalhães, Yris Maria Fonseca-Bazzo
Grain-size mineral analysis of verdete rock coarse and fine aggregates and adjustment to two
granulometric distribution models ............................................................................................................. 56
Aline Amara Madeira
Bound state solutions of the Schrödinger equation with energy-dependent molecular Kratzer potential
via asymptotic iteration method ................................................................................................................. 65
Akpan Ndem Ikot, Uduakobong Okorie, Alalibo Thompson Ngiangia, Clement Atachegbe Onate, Collins
Okon Edet, Ita Okon Akpan, Precious Ogbonda Amadi

Original article
iq.unesp.br/ecletica
| Vol. 45 | n. 1 | 2020 |
11 Eclética Química Journal, vol. 45, n. 1, 2020, 11-17
ISSN: 1678-4618
DOI: 10.26850/1678-4618eqj.v45.1.2020.p11-17
ABSTRACT: Dry grains from leguminous species, such as soybeans (Glycine max L.), common beans (Phaseolus vulgaris L.), chickpeas (Cicer arietinum L.) and corn (Zea mays L.), are regularly consumed for human nutrition. This paper showed the possibility of estimating bulk density as quality parameter of 4 different dry grains (soybeans, common beans, chickpeas and corn) in a same model using the
average values of color descriptors from digital images combined with an artificial neural network, with low computational costs. These food products are good sources of carbohydrates, protein and dietary fiber, and they possess significant amounts of vitamins and minerals and a high energetic value. Estimation of the physicochemical properties of grains is challenging due to variations in shape, texture, and size and
because the grain colors appear similar to the naked eye. In this work, an analytical method was developed based on digital images converted into ten color scale descriptors combined with a neural model to provide an accurate parameter for grain quality control with a low computational cost. The bulk densities of four type of grains, i.e., soybeans, beans, chickpeas and corn, were predicted using numerical data represented by the average values of color histograms of a ten color scale (red - R, green - G, blue - B, hue - H,
saturation - S, value - V, relative RGB and luminosity - L) from digital images combined with artificial neural networks (ANNs). The reference bulk densities were empirically measured. A very good correlation between the reference values and values predicted by the ANN was achieved, and with a single ANN developed for the four grains, a correlation coefficient of 0.98 was observed for the test set. Moreover, the relative errors were between 0.01 and 5.6% for the test set.
Estimating bulk density in leguminous grains with different traits
using color parameters from digital images combined with artificial
neural networks Bruna Gava Floriam , Fabíola Manhas Verbi Pereira , Érica Regina Filletti+
São Paulo State University (Unesp), Institute of Chemistry, 55 Prof. Francisco Degni St, Araraquara, São Paulo, Brazil +Corresponding author: Érica Regina Filletti, Phone: +55 16 3301-9839 email address: [email protected]
ARTICLE INFO
Article history:
Received: December 18, 2018
Accepted: September 17, 2019
Published: January 1, 2020
Keywords: 1. grain 2. digital images
3. bulk density 4. learning algorithm 5. error propagation
1. Introduction
Soybeans (Glycine max L.), common beans
(Phaseolus vulgaris L.), chickpeas (Cicer arietinum L.) and corn (Zea mays L.) are a part of
most human diets, regardless of culture. These
grains are leguminous species consumed as dry grains. They are remarkable sources of
carbohydrates, protein and dietary fiber, and they
possess significant amounts of vitamins and minerals and a high energetic value1.
The quality of food grains is dependent on
several physicochemical parameters, including the
bulk density (or density in each mass). In a grain,
the bulk density is more closely related to its
shape than its size2. Stored food materials can
suffer from variations in bulk density according to
the bin depth3. Thus, a model that can monitor this parameter would be helpful to avoid losses in
agri-food supply chains. For instance, in the study
by Bart-Plange and Baryeh4 several laborious physicochemical methods were applied to
evaluate cocoa beans, as the raw material for
manufacturing chocolate and other food products, including the determination of their bulk density.
Using the method presented here, the quality of
four types of grains can be estimated using an
accurate approach based on a relevant
Original article
12 Eclética Química Journal, vol. 45, n. 1, 2020, 11-17
ISSN: 1678-4618
DOI: 10.26850/1678-4618eqj.v45.1.2020.p11-17
physicochemical parameter, i.e., the bulk density,
which is related to the storage system, type of container and characteristics of the grains.
Color data from digital images are considered
reliable sources of analytical information for
many purposes, independent of the type of device, for example, scanners, cell phones or cameras5.
The combination of digital images and an
artificial neural network (ANN) can be adapted for applications such as the shape analysis of
grains6 and for variety identification7. However, in
both cited studies, many complex steps were
necessary to develop a predictive response model with good accuracy.
The advantage of this study is that additional
information from a color histogram of a ten color scale8,9 can be determined using a simple
computational routine with fast calculations. In
addition, by using the average color values instead of the entire color histogram, which includes 2560
colors10,11, the speed of the ANN calculations is
improved, and accurate results are achieved.
Therefore, ANNs are useful tools for this research because they require less computational effort
than other numerical techniques.
ANNs are computational models consisting of simple processing units called neurons, which are
inspired by the central nervous system of
intelligent organisms that acquire knowledge through experimentation; ANNs can perform
machine learning to predict parameters and
recognize patterns12,13.
Initially, an ANN undergoes a learning phase in which some examples are presented to it during
training, and it automatically extracts the
necessary characteristics to represent the information learned by adjusting the synaptic
weights of the neurons through an adequate
learning algorithm. Then, these characteristics are
used to generate answers to the problem studied. In other words, by providing input data to an
ANN and reporting the desired output (response),
the ANN can provide coherent results for new input data that are different from those used in
training.
There are several advantages to using ANNs; for instance, ANNs are easy to use and update,
they have data error tolerance because of the
ability to respond in an acceptable way, even if
partially damaged, they have great freedom in the adjustment of synaptic weights of neurons due to
the presence of bias, which is a special processing
unit that allows better adaptation on the part of the
neural network to the knowledge provided to it,
and they provide a precise response at high speeds14-16. The main advantage of ANNs is their
ability to generalize or learn from examples17; that
is, ANNs can generalize learned information to
provide satisfactory results for cases not seen in training. Therefore, ANNs have been used in
many fields, such as chemistry18, geology19,
medicine20, neurocomputations21 and biomedical engineering22, among others.
In this sense, after an ANN has been trained
and tested, it can predict the output (desired
response) of new input data in the domain covered by the training examples. For food analysis, data
from digital images acquired using both a camera
and a desktop scanner have been applied to predict the fermentation index of cocoa beans by
ANN modeling23. An ANN was also combined
with digital images and showed excellent potential for wheat varietal identification24 using the
morphometric characteristics of these grains for
the classification of different varieties with 88%
accuracy and individual varieties with 84% and 94% accuracy.
Our study shows a feasible analytical method
based on digital images converted into ten color scale descriptors combined with an ANN to
estimate the bulk density of leguminous grains
such as soybeans, beans, chickpeas and corn.
2. Materials and methods
2.1. Procurement of samples and instruments
Grains of soybeans, beans, chickpeas and corn
were purchased locally. The grains were sorted to eliminate external material and damaged grains.
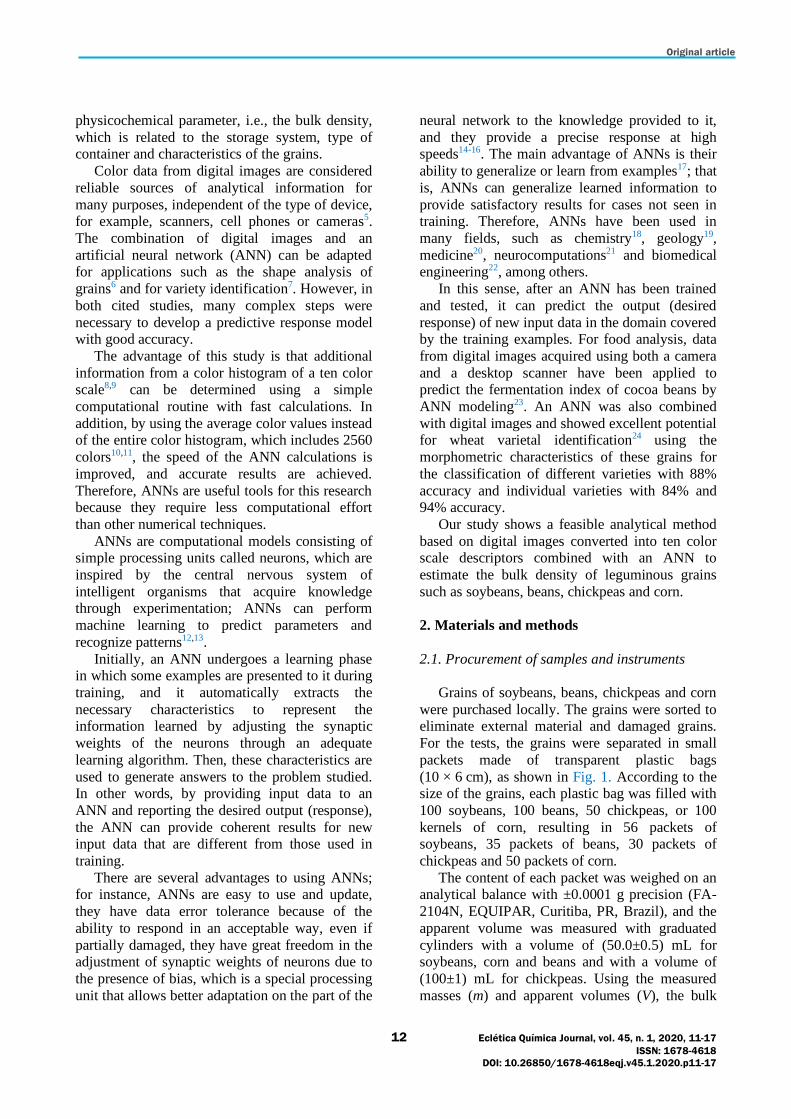
For the tests, the grains were separated in small
packets made of transparent plastic bags
(10 × 6 cm), as shown in Fig. 1. According to the size of the grains, each plastic bag was filled with
100 soybeans, 100 beans, 50 chickpeas, or 100
kernels of corn, resulting in 56 packets of soybeans, 35 packets of beans, 30 packets of
chickpeas and 50 packets of corn.
The content of each packet was weighed on an analytical balance with ±0.0001 g precision (FA-
2104N, EQUIPAR, Curitiba, PR, Brazil), and the
apparent volume was measured with graduated
cylinders with a volume of (50.0±0.5) mL for soybeans, corn and beans and with a volume of
(100±1) mL for chickpeas. Using the measured
masses (m) and apparent volumes (V), the bulk

Original article
13 Eclética Química Journal, vol. 45, n. 1, 2020, 11-17
ISSN: 1678-4618
DOI: 10.26850/1678-4618eqj.v45.1.2020.p11-17
densities of the samples were estimated using the
ratiom
V = , and these values were considered
the reference values in this study.
Figure 1. Examples of the scanned images of soybean
(A), bean (B), chickpea (C) and corn (D) grains.
Then, each packet was digitalized using a
conventional scanner (HP, LaserJet Pro 200 Color
MFP M276nw, Brazil). The final size of the
images was 550 × 1000 pixels with a resolution of
96 dots per inch (dpi).
2.2. Image treatment
The digital images were processed and converted into the average values of ten color
scale descriptors, red (R), green (G), blue (B), hue
(H), saturation (S), value (V), relative red (Rr), relative green (Rg), relative blue (Rb) and
luminosity (L), using the Matlab R2015b (The
MathWorks, Natick, MA, USA) code available in
the supplementary material of Camargo, Santos and Pereira8. Figure 2 shows an image of the data.
Using this code, the average value of each
histogram color, which includes 256 colors, is obtained; thus, each color is represented by one
value per color histogram.
Figure 2. Diagram of the input data for the ANN calculations
2.3. ANN description
A feedforward neural network25 was
implemented in Matlab R2015b. Two learning
algorithms were tested in the development of the ANN: error backpropagation and the Levenberg-
Marquardt algorithm. The Levenberg-Marquardt
algorithm presented correlation coefficients in the mean of 0.88 and RMSE (Root Mean Square
Error) equal to 0.031 for the test set, while the
backpropagation algorithm provided results with
correlation coefficient equal 0.98 and RMSE
0.014. Therefore, the backpropagation algorithm provided the best results and is described briefly
below12,13:
1) Set the initial parameters of the network 𝑤𝑖,𝑗
and 𝑏𝑖,𝑗 (weights and bias) as random numbers.
2) From a training data set with pre-assigned
input/output pairs, take the k-th (𝑝𝑖𝑘 , 𝑎𝑖
𝑘) pair,
calculate the outputs of the network with the
same input, and form the new pair (𝑝𝑖𝑘 , 𝑡𝑖
𝑘).
R G B H S V Rr Rg Rb LInputs for ANN
Averagevalue
...
Averagevalue
R G B H S V r g b L...1...256 1...256
Fre
qu
en
cy
Original article
14 Eclética Química Journal, vol. 45, n. 1, 2020, 11-17
ISSN: 1678-4618
DOI: 10.26850/1678-4618eqj.v45.1.2020.p11-17
3) Calculate the error between the desired 𝑎𝑖𝑘
and the obtained 𝑡𝑖𝑘 output values through the
formula
𝑒 = √∑ (𝑎𝑖𝑘 − 𝑡𝑖
𝑘)2
𝑖 (1)
4) Calculate the partial derivatives of error e
with respect to the weights and bias.
5) Change the weights and bias according to the steepest descent strategy and a specified learning
rate α:
𝑏𝑖,𝑗 ← 𝑏𝑖,𝑗 − 𝛼𝜕𝑒
𝜕𝑏𝑖,𝑗 (2)
and
𝑤𝑖,𝑗 ← 𝑤𝑖,𝑗 − 𝛼𝜕𝑒
𝜕𝑤𝑖,𝑗 (3)
6) Iterate steps 2 to 5 by successively modifying
𝑏𝑖,𝑗 and 𝑤𝑖,𝑗 until a defined number of learning
cycles or a stopping criterion is reached.
The parameter learning rate, number of
neurons per layer, number of layers, activation functions and number of epochs were varied by
trial and error to obtain the best result, and early
stopping of the training was performed to avoid overtraining.
3. Results and discussion
The ranges of bulk density measured using the
reference method were in g cm-3 for soybean
between 0.61 and 0.65, bean (0.75-0.78), chickpea (0.63-0.68) and corn (0.68-0.85). The variation of
values among the colors converted from the
images were: (i) soybean grains: R (174–192), G (128–135), B (83–91), H (0.079–0.081), S (0.52–
0.57), V (0.68–071), r (0.46–0.48), g (0.32–0.33),
b (0.19–0.21), and L (386–407); (ii) bean grains:
R (140–147), G (91–99), B (63–72), H (0.066–0.072), S (0.56–0.61), V (0.55–0.58), r (0.51–
0.53), g (0.29–0.30), b (0.18–0.20), and L (294–
317); chickpea grains: R (167–174), G (131–137), B (103–111), H (0.070–0.074), S (0.39– 0.42), V
(0.66–0.68), r (0.43–0.44), g (0.318–0.321), b
(0.24–0.25), and L (401–421) and (iv) corn grains: R (196–217), G (122–145), B (75–100), H (0.06–
0.07), S (0.55–0.64), V (0.77–0.85), r (0.49–0.53),
g (0.30–0.31), b (0.17–0.20), and L (397–461). In
all of cases, differences among the samples were revealed that justify an ANN model using the 10
colors as input layer. Tests were also performed
without variables H and L, for example, showed worse than all input variables were used. For this
case, the correlation coefficients were 0.94, 0.84
and 0.92 for training, validation and test sets, respectively. Therefore, the input variables of the
ANN training set were the R, G, B, H, S, V, Rr,
Rg, Rb and L color descriptors, for a total of 10
input variables for each packet of grain sample; that is, the developed ANN had 10 neurons in the
input layer (Fig. 2). The strategy of averaged
value of each histogram color was applied because the entire histogram for the 10 colors
corresponds to 2560 variables. For the ANN, 2560
values imply 2560 neuron in input layer, then the
calculations would be slower than that computed using the averaged color values, mainly
considering that the information would not be
improved. The information from the hue (H) and saturation (S) color scales was also important as
revealed by our previous evaluation8.
The ANN outputs were the reference bulk density values. The samples were randomly
divided into three sets as follows: a total of 70%
of the samples were used in the ANN training set,
15% was used for the validation of ANN, and the remaining 15% was used to test the
generalizability of the ANN. The training set
consisted of 119 samples, i.e., 38 soybean, 19 bean, 24 chickpea and 38 corn samples, the
validation set had 26 samples, i.e., 8 soybean, 10
bean, 2 chickpea and 6 corn samples, and the test set had 26 samples, i.e., 10 soybean, 6 bean, 4
chickpea and 6 corn samples. The number of
samples were related to the size of the grains and
the size of the packet (plastic bag) was the same. The main goal was to analyze the entire packet
then the variation in size of the grain had
determined the number of packets, which did not affect ANN results, since it was not necessary for
ANN to know which grain sample was being
analyzed to estimate grain density in each packet.
A single ANN was developed for all four types of grains (soybeans, beans, chickpeas and corn).
Several ANN architectures were tested with one
intermediate layer (varying the number of neurons from 10 to 20) and with two intermediate layers
(with 8 and 4 neurons in each layer, respectively).
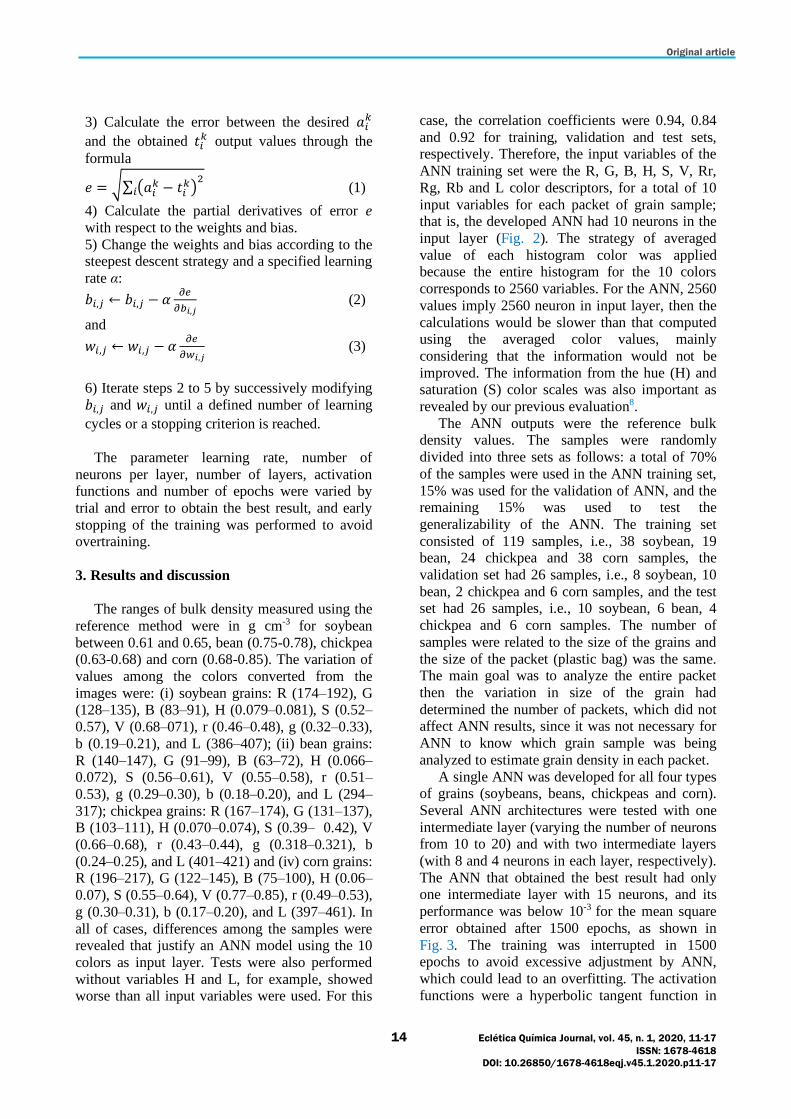
The ANN that obtained the best result had only one intermediate layer with 15 neurons, and its
performance was below 10-3 for the mean square
error obtained after 1500 epochs, as shown in
Fig. 3. The training was interrupted in 1500 epochs to avoid excessive adjustment by ANN,
which could lead to an overfitting. The activation
functions were a hyperbolic tangent function in
Original article
15 Eclética Química Journal, vol. 45, n. 1, 2020, 11-17
ISSN: 1678-4618
DOI: 10.26850/1678-4618eqj.v45.1.2020.p11-17
the intermediate layer and a linear function in the
output layer.
Figure 3. ANN performance results for the training,
validation and test sets. The green dotted line denoted
as “best” shows the lowest value of the mean square
error reached in the ANN validation in 1500 epochs.
The highest efficiency for the four types of
grains together had a learning rate of 0.8. Training was also performed with higher and lower
learning rates, but the network became unstable
with learning rates below 0.3, meaning that it failed to provide good results for the test samples.
At a learning rate of 0.8, the ANN was stable, and
the training was very fast (close to 1 min). The training error was small, approximately 10-3, and
it was stable throughout the learning process.
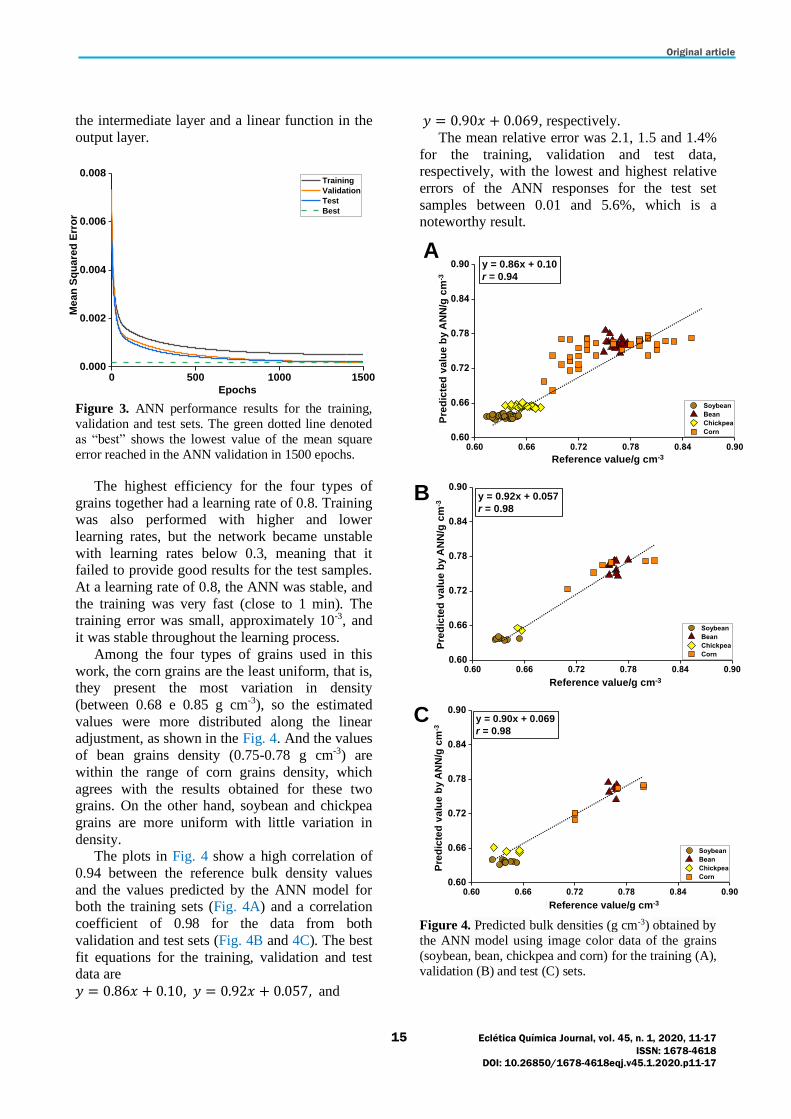
Among the four types of grains used in this
work, the corn grains are the least uniform, that is, they present the most variation in density
(between 0.68 e 0.85 g cm-3), so the estimated
values were more distributed along the linear adjustment, as shown in the Fig. 4. And the values
of bean grains density (0.75-0.78 g cm-3) are
within the range of corn grains density, which
agrees with the results obtained for these two grains. On the other hand, soybean and chickpea
grains are more uniform with little variation in
density. The plots in Fig. 4 show a high correlation of
0.94 between the reference bulk density values
and the values predicted by the ANN model for both the training sets (Fig. 4A) and a correlation
coefficient of 0.98 for the data from both
validation and test sets (Fig. 4B and 4C). The best
fit equations for the training, validation and test data are
𝑦 = 0.86𝑥 + 0.10, 𝑦 = 0.92𝑥 + 0.057, and
𝑦 = 0.90𝑥 + 0.069, respectively.
The mean relative error was 2.1, 1.5 and 1.4%
for the training, validation and test data, respectively, with the lowest and highest relative
errors of the ANN responses for the test set
samples between 0.01 and 5.6%, which is a noteworthy result.
Figure 4. Predicted bulk densities (g cm-3) obtained by
the ANN model using image color data of the grains
(soybean, bean, chickpea and corn) for the training (A),
validation (B) and test (C) sets.
0 500 1000 15000.000
0.002
0.004
0.006
0.008
Me
an
Sq
ua
red
Err
or
Epochs
Training
Validation
Test
Best
0.60 0.66 0.72 0.78 0.84 0.900.60
0.66
0.72
0.78
0.84
0.90
Soybean
Bean
Chickpea
Corn
Pre
dic
ted
va
lue
by
AN
N (
g c
m-3)
Reference value (g cm-3)
Ay = 0.86x + 0.10
r = 0.94
Reference value/g cm-3
Pre
dic
ted
va
lue
by
AN
N/g
cm
-3
0.60 0.66 0.72 0.78 0.84 0.900.60
0.66
0.72
0.78
0.84
0.90
Soybean
Bean
Chickpea
Corn
Pre
dic
ted
va
lue
by
AN
N (
g c
m-3)
Reference value (g cm-3)
B y = 0.92x + 0.057
r = 0.98
Reference value/g cm-3
Pre
dic
ted
va
lue
by
AN
N/g
cm
-3
y = 0.90x + 0.069
r = 0.98
C
0.60 0.66 0.72 0.78 0.84 0.900.60
0.66
0.72
0.78
0.84
0.90
Soybean
Bean
Chickpea
Corn
Pre
dic
ted
va
lue
by
AN
N (
g c
m-3)
Reference value (g cm-3)Reference value/g cm-3
Pre
dic
ted
va
lue
by
AN
N/g
cm
-3
Original article
16 Eclética Química Journal, vol. 45, n. 1, 2020, 11-17
ISSN: 1678-4618
DOI: 10.26850/1678-4618eqj.v45.1.2020.p11-17
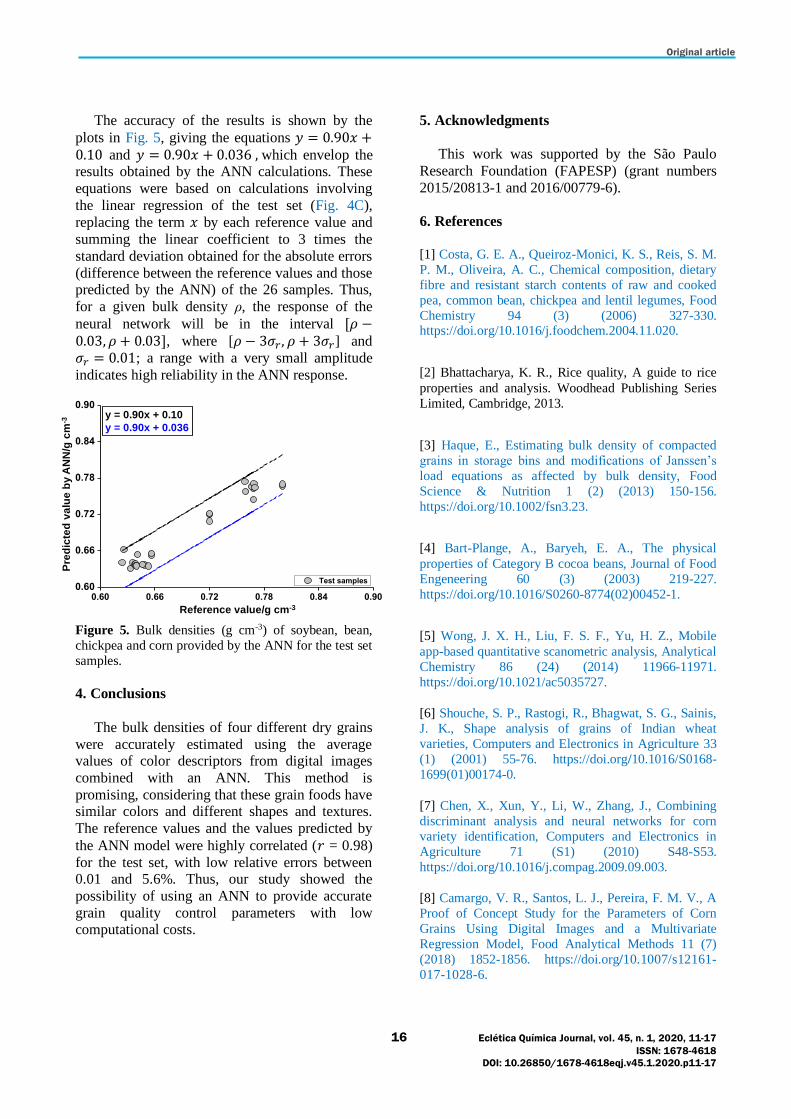
The accuracy of the results is shown by the
plots in Fig. 5, giving the equations 𝑦 = 0.90𝑥 +0.10 and 𝑦 = 0.90𝑥 + 0.036 , which envelop the results obtained by the ANN calculations. These
equations were based on calculations involving
the linear regression of the test set (Fig. 4C),
replacing the term 𝑥 by each reference value and
summing the linear coefficient to 3 times the
standard deviation obtained for the absolute errors
(difference between the reference values and those predicted by the ANN) of the 26 samples. Thus,
for a given bulk density ρ, the response of the
neural network will be in the interval [𝜌 −0.03, 𝜌 + 0.03], where [𝜌 − 3𝜎𝑟, 𝜌 + 3𝜎𝑟] and
𝜎𝑟 = 0.01; a range with a very small amplitude
indicates high reliability in the ANN response.
Figure 5. Bulk densities (g cm-3) of soybean, bean,
chickpea and corn provided by the ANN for the test set
samples.
4. Conclusions
The bulk densities of four different dry grains
were accurately estimated using the average values of color descriptors from digital images
combined with an ANN. This method is
promising, considering that these grain foods have similar colors and different shapes and textures.
The reference values and the values predicted by
the ANN model were highly correlated (𝑟 = 0.98)
for the test set, with low relative errors between 0.01 and 5.6%. Thus, our study showed the
possibility of using an ANN to provide accurate
grain quality control parameters with low computational costs.
5. Acknowledgments
This work was supported by the São Paulo
Research Foundation (FAPESP) (grant numbers
2015/20813-1 and 2016/00779-6).
6. References
[1] Costa, G. E. A., Queiroz-Monici, K. S., Reis, S. M.
P. M., Oliveira, A. C., Chemical composition, dietary
fibre and resistant starch contents of raw and cooked
pea, common bean, chickpea and lentil legumes, Food
Chemistry 94 (3) (2006) 327-330. https://doi.org/10.1016/j.foodchem.2004.11.020.
[2] Bhattacharya, K. R., Rice quality, A guide to rice
properties and analysis. Woodhead Publishing Series
Limited, Cambridge, 2013.
[3] Haque, E., Estimating bulk density of compacted
grains in storage bins and modifications of Janssen’s
load equations as affected by bulk density, Food
Science & Nutrition 1 (2) (2013) 150-156.
https://doi.org/10.1002/fsn3.23.
[4] Bart-Plange, A., Baryeh, E. A., The physical
properties of Category B cocoa beans, Journal of Food
Engeneering 60 (3) (2003) 219-227.
https://doi.org/10.1016/S0260-8774(02)00452-1.
[5] Wong, J. X. H., Liu, F. S. F., Yu, H. Z., Mobile
app-based quantitative scanometric analysis, Analytical
Chemistry 86 (24) (2014) 11966-11971.
https://doi.org/10.1021/ac5035727.
[6] Shouche, S. P., Rastogi, R., Bhagwat, S. G., Sainis,
J. K., Shape analysis of grains of Indian wheat
varieties, Computers and Electronics in Agriculture 33
(1) (2001) 55-76. https://doi.org/10.1016/S0168-
1699(01)00174-0.
[7] Chen, X., Xun, Y., Li, W., Zhang, J., Combining
discriminant analysis and neural networks for corn
variety identification, Computers and Electronics in
Agriculture 71 (S1) (2010) S48-S53.
https://doi.org/10.1016/j.compag.2009.09.003.
[8] Camargo, V. R., Santos, L. J., Pereira, F. M. V., A
Proof of Concept Study for the Parameters of Corn
Grains Using Digital Images and a Multivariate
Regression Model, Food Analytical Methods 11 (7)
(2018) 1852-1856. https://doi.org/10.1007/s12161-
017-1028-6.
y = 0.90x + 0.10
y = 0.90x + 0.036
0.60 0.66 0.72 0.78 0.84 0.900.60
0.66
0.72
0.78
0.84
0.90
Test samples
Pre
dic
ted
va
lue
by
AN
N (
g c
m-3)
Reference value (g cm-3)Reference value/g cm-3
Pre
dic
ted
va
lue
by
AN
N/g
cm
-3
Original article
17 Eclética Química Journal, vol. 45, n. 1, 2020, 11-17
ISSN: 1678-4618
DOI: 10.26850/1678-4618eqj.v45.1.2020.p11-17
[9] Santos, P. M., Wentzell, P. D., Pereira-Filho, E. R.,
Scanner digital images combined with color
parameters: a case study to detect adulterations in
liquid cow’s milk, Food Analytical Methods 5 (1)
(2012) 89-95. https://doi.org/10.1007/s12161-011-
9216-2.
[10] Borin, A., Ferrão, M. F., Mello, C., Cordi, L.,
Pataca, L. C. M., Durán, N., Poppi, R. J.,
Quantification of Lactobacillus in fermented milk by
multivariate image analysis with least-squares support-vector machines, Analytical & Bioanalytical Chemistry
387 (2007) (3) 1105-1112.
https://doi.org/10.1007/s00216-006-0971-7.
[11] Pereira, F. M. V., Milori, D. M. B. P., Pereira-
Filho, E. R., Venâncio, A. L., Russo, M. S. T., Martins,
P. K., Freitas-Astúa, J., Fluorescence images combined
to statistic test for fingerprinting of citrus plants after
bacterial infection, Analytical Methods 3 (2011) 552-
556. https://doi.org/10.1039/C0AY00538J.
[12] Hagan, M. T., Demuth H. B, Beale M., Neural
network design. PWS Publishing Company, Boston, 1996.
[13] Haykin, S., Neural Networks: a comprehensive
foundation. Prentice Hall, New Jersey, 1999.
[14] Li, G., Shi, J., On comparing three artificial
neural networks for wind speed forecasting, Applied
Energy 87 (7) (2010) 2313-2320.
https://doi.org/10.1016/j.apenergy.2009.12.013.
[15] Nafey, A. S., Neural network based correlation for
critical heat flux in steam-water flows, International
Journal of Thermal Sciences 48 (12) (2009) 2264-
2270. https://doi.org/10.1016/j.ijthermalsci.2009.04.010.
[16] Niemi, H., Bulsari, A., Palosaari, S., Simulation of
membrane separation by neural networks, Journal of
Membrane Science 102 (1995) 185-191.
https://doi.org/10.1016/0376-7388(94)00314-O.
[17] Zhang, Z., Friedrich, K., Artificial neural networks
applied to polymer composites: a review, Composites
Science and Technology 63 (14) (2003) 2029-2044.
https://doi.org/10.1016/S0266-3538(03)00106-4.
[18] Tanzifi, M., Yaraki, M. T., Kiadehi, A. D.,
Hosseini, S. H., Olazar, M., Bharti, A. K., Agarwal, S.,
Gupta, V. K., Kazemi, A., Adsorption of Amido Black 10B from aqueous solution using polyaniline/ SiO2
nanocomposite: Experimental investigation and
artificial neural network modelling, Journal of Colloid
and Interface Science 510 (2018) 246-261.
https://doi.org/10.1016/j.jcis.2017.09.055.
[19] Ramil, A., López, A. J., Rivas, T., A computer
vision system for identification of granite-forming
minerals based on RGB data and artificial neural
networks, Measurement 117 (2018) 90-95.
https://doi.org/10.1016/j.measurement.2017.12.006.
[20] Walczak, S., Velanovich, V., Improving prognosis
and reducing decision regret for pancreatic cancer
treatment using artificial neural networks, Decision
Support Systems 106 (2018) 110-118.
https://doi.org/10.1016/j.dss.2017.12.007.
[21] Ortega-Zamorano, F., Jerez, J. M., Juarez, G. E.,
Franco, L., FPGA Implementation of
Neurocomputational Models: Comparison Between
Standard Back-Propagation and C-Mantec
Constructive Algorithm, Neural Processing Letters 46
(3) (2017) 899-914. https://doi.org/10.1007/s11063-
017-9655-x.
[22] Filletti, É. R., Roque, W. L., Estimating the
mechanical competence parameter of the trabecular
bone: a neural network approach, Research in
Biomedical Engineering 32 (2) (2016) 137-143. https://doi.org/10.1590/2446-4740.05615.
[23] León-Roque, N., Abderrahim, M., Nuñez-Alejos,
L., Arribas, S. M., Condezo-Hoyos, L., Prediction of
fermentation index of cocoa beans (Theobroma cacao
L.) based on colour measurement and artificial neural
networks, Talanta 161 (1) (2016) 31-39.
https://doi.org/10.1016/j.talanta.2016.08.022.
[24] Dubey, B. P., Bhagwat, S. G., Shouche, S. P.,
Sainis, J. K., Potential of Artificial Neural Networks in
Varietal Identification using Morphometry of Wheat
Grains, Biosystems Engineering 95 (1) (2006) 61-67. https://doi.org/10.1016/j.biosystemseng.2006.06.001.
[25] Demuth, H., Beale, M., Hagan, M., Neural
Network toolbox 6: User’s Guide. The Math Works,
Natick, 2010.
Original article
iq.unesp.br/ecletica
| Vol. 45 | n. 1 | 2020 |
18 Eclética Química Journal, vol. 45, n. 1, 2020, 18-43
ISSN: 1678-4618
DOI: 10.26850/1678-4618eqj.v45.1.2020.p18-43
Synthesis, spectroscopic, biological activities and DFT calculations of
nickel(II) mixed-ligand complexes of tridentate Schiff bases Abidemi Iyewumi Demehin1 , Mary Adelaide Oladipo2+ , Banjo Semire2 1 Adeyemi College of Education, Department of Chemistry, Ondo, Ondo State, Nigeria 2 Ladoke Akintola University of Technology, Department of Pure and Applied Chemistry, Ogbomoso, Oyo State, Nigeria +Corresponding author: Mary Adelaide Oladipo, Phone: +234 803 3817017 email address: [email protected]
ARTICLE INFO
Article history: Received: March 02, 2019
Accepted: November 11, 2019
Published: January 1, 2020
Keywords: 1. Schiff bases 2. antibacterial 3. antioxidant 4. nickel(II) ion
5. mixed-ligand complex
1. Introduction
Schiff bases are compounds that are comparable
to ketone or aldehyde, they have azomethine
(HC=N) group instead of the carbonyl (C=O) group in the carbonyl compounds. Schiff bases can
also be called azomethines or imines1,2. They were
discovered by Hugo Schiff in 18643. They have the general formula RR1C=N−R2. If R equals
hydrogen, alkyl or aryl, R1 hydrogen and R2 alkyl
or aryl; the compounds are referred to as aldimines
(R1−CH=NR2) while compounds where both R and R1 are alkyl or aryl groups are called ketoimines. R2
can either be an alkyl or aryl group4-6. They are
significant chelating ligands in coordination chemistry. Their chemical properties can be
changed by varying the substituents on either the
carbonyl or the amine ring. Intra- and
intermolecular hydrogen bonds can be formed from
Schiff bases obtained from various substituted
salicylaldehydes and 2-hydroxyl-1-naphthaldehyde and these usually determine their
chemical and physicochemical properties7. They
have vital donor atoms like nitrogen and oxygen which make them resemble living systems and
display different biological properties. The
resulting imines are involved in binding with metal ions via nitrogen lone pair of electrons. Schiff
bases can bind to the central metal ions as
monodentate and polydentate8,9. Schiff bases lead
to the formation of many mononuclear and binuclear complexes with different coordination
modes and stereochemistry8.
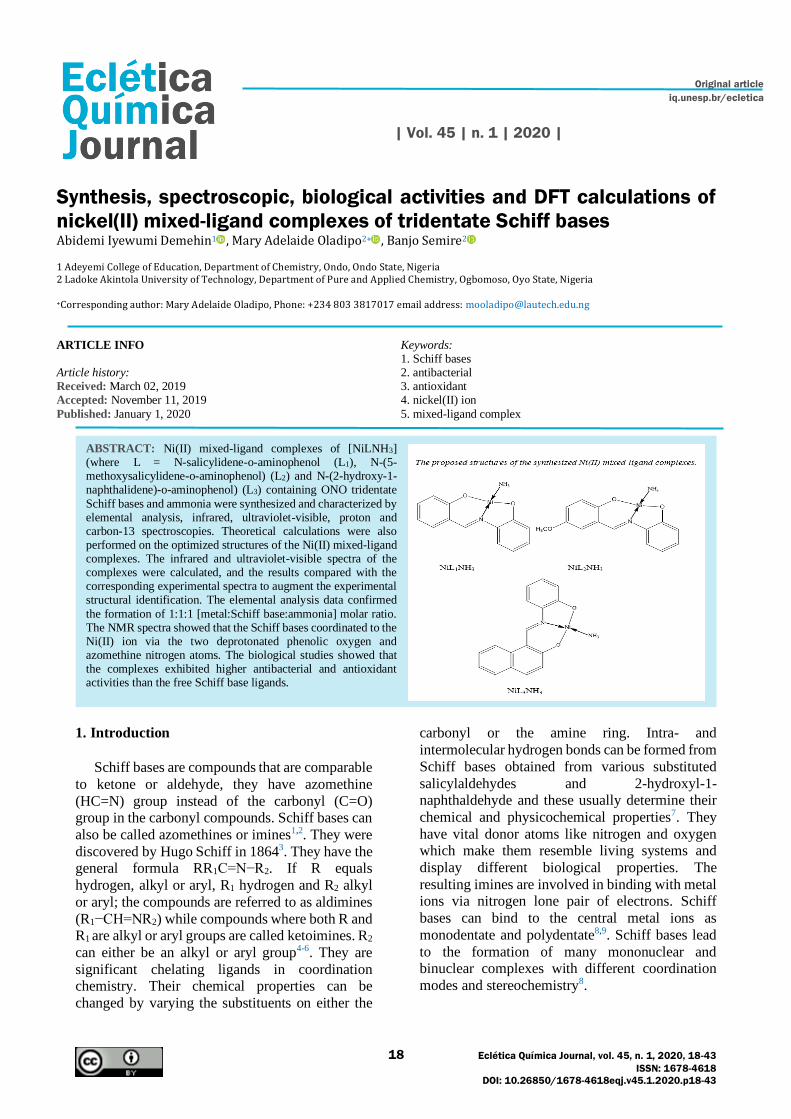
ABSTRACT: Ni(II) mixed-ligand complexes of [NiLNH3] (where L = N-salicylidene-o-aminophenol (L1), N-(5-methoxysalicylidene-o-aminophenol) (L2) and N-(2-hydroxy-1-naphthalidene)-o-aminophenol) (L3) containing ONO tridentate
Schiff bases and ammonia were synthesized and characterized by elemental analysis, infrared, ultraviolet-visible, proton and carbon-13 spectroscopies. Theoretical calculations were also performed on the optimized structures of the Ni(II) mixed-ligand complexes. The infrared and ultraviolet-visible spectra of the complexes were calculated, and the results compared with the corresponding experimental spectra to augment the experimental structural identification. The elemental analysis data confirmed
the formation of 1:1:1 [metal:Schiff base:ammonia] molar ratio. The NMR spectra showed that the Schiff bases coordinated to the Ni(II) ion via the two deprotonated phenolic oxygen and azomethine nitrogen atoms. The biological studies showed that the complexes exhibited higher antibacterial and antioxidant activities than the free Schiff base ligands.
Original article
19 Eclética Química Journal, vol. 45, n. 1, 2020, 18-43
ISSN: 1678-4618
DOI: 10.26850/1678-4618eqj.v45.1.2020.p18-43
The imine groups in Schiff bases are significant
for biological activities, they are very useful active centers of many biological systems10. Schiff bases
have played essential roles in understanding the
coordination chemistry of transition metal ions.
Studies showed that Schiff bases derived from salicylaldehyde, 2-hydroxyl-1-naphthaldehyde
including the derivatives and complexes with some
transition metals displayed significant biological properties which make them gain attention. Some
of the reported significant biological properties are
anti-inflammatory, antimicrobial, analgesic,
anticonvulsant and antioxidants which make them attract more attention1,11-19.
Many mixed-ligand complexes have been
synthesized for their pronounced biological activities. However, literature search showed that
reports on mixed-ligand complexes bearing
ammonia as co-ligand are less explored. Hence this study, which synthesized, characterized, and
carried out the biological and theoretical studies of
nickel(II) mixed-ligand complexes of tridentate
Schiff bases and ammonia. Besides the experimental studies, quantum chemical methods
were used to augment the experimental
observations9. Therefore, the molecular structures of the Schiff base ligands and complexes were
modelled, and the theoretical calculations were
carried out on their optimized structures. These were utilized for their IR, UV-Vis and NMR
spectra. A consideration of the similarities between
the calculated and experimental spectra, mostly the
electronic spectra could further be used for identification of the molecular geometry.
2. Experimental
2.1. Materials
Salicylaldehyde, 5-methoxysalicylaldehyde, 2-
hydroxy-1-naphthaldehyde, o-aminophenol, nickel(II) acetate tetrahydrate, ammonium
hydroxide and formic acid were purchased from
Merck (Germany) and used as supplied. The
solvents were of pure grade except ethanol and water which were distilled.
2.2. Instruments
A Thermo Finnigan Flash EA 1112 Series was
used for the elemental analyses (C, H, N). The
Infrared spectroscopy analysis were carried out using the attenuated (ATR) technique with a
Perkin-Elmer 400 FT-IR/FT-FIR spectrometer. An
MPD Mitamura Riken Kogyo (Japan) electrothermal was used to determine the melting
points. The nuclear magnetic resonance spectra
were carried out on a Bruker Avance III 600 Spectrometer in solution with DMSO-d6 and
tetramethylsilane (TMS) as internal standard at
600 MHz. The UV-Visible spectra were recorded
in 1.0 × 10⁻⁴ mol L-1 DMSO solution using Shimadzu UV-2600 Spectrophotometer in the
range 250-900 nm.
2.3. Syntheses
2.3.1. The Schiff bases syntheses
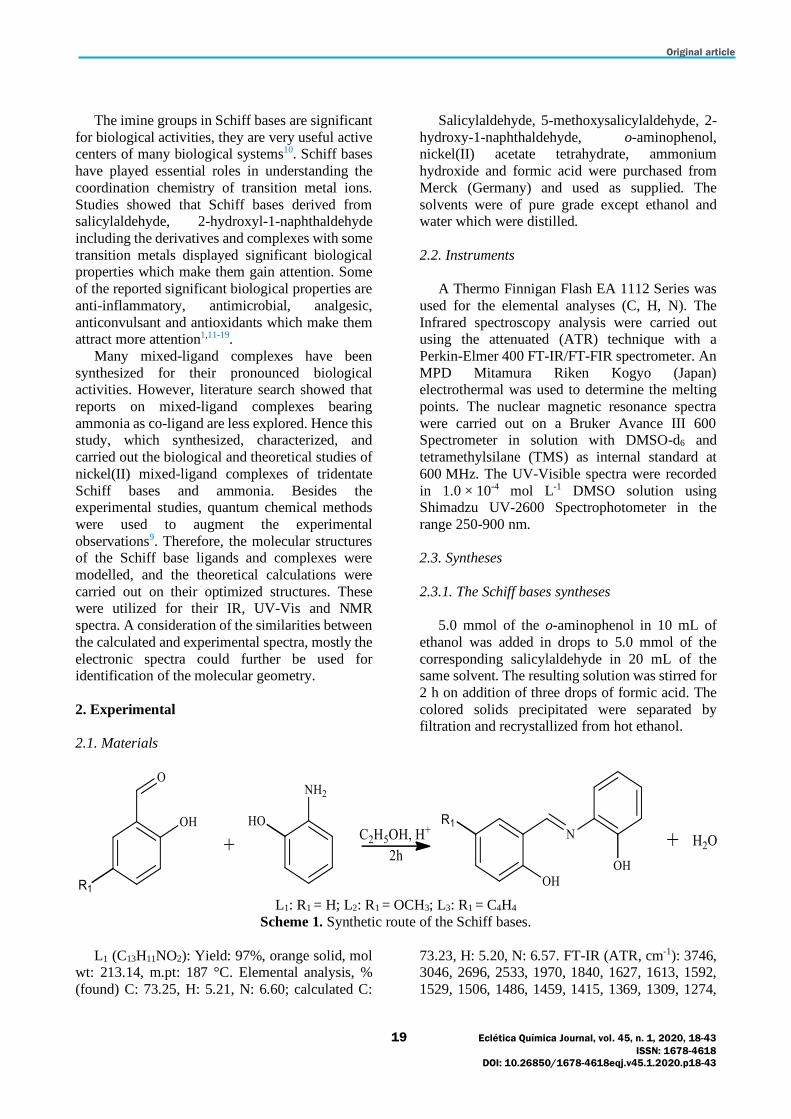
5.0 mmol of the o-aminophenol in 10 mL of
ethanol was added in drops to 5.0 mmol of the
corresponding salicylaldehyde in 20 mL of the same solvent. The resulting solution was stirred for
2 h on addition of three drops of formic acid. The
colored solids precipitated were separated by filtration and recrystallized from hot ethanol.
L1: R1 = H; L2: R1 = OCH3; L3: R1 = C4H4
Scheme 1. Synthetic route of the Schiff bases.
L1 (C13H11NO2): Yield: 97%, orange solid, mol wt: 213.14, m.pt: 187 °C. Elemental analysis, %
(found) C: 73.25, H: 5.21, N: 6.60; calculated C:
73.23, H: 5.20, N: 6.57. FT-IR (ATR, cm-1): 3746, 3046, 2696, 2533, 1970, 1840, 1627, 1613, 1592,
1529, 1506, 1486, 1459, 1415, 1369, 1309, 1274,

Original article
20 Eclética Química Journal, vol. 45, n. 1, 2020, 18-43
ISSN: 1678-4618
DOI: 10.26850/1678-4618eqj.v45.1.2020.p18-43
1241, 1220, 1176, 1159, 1137, 1115, 1097, 1047,
1019, 967, 945, 902, 853, 806, 763, 741, 725, 630, 572, 547, 525, 475. 1H NMR: 13.78 (s, 1H, −OH),
9.73 (s, 1H, −OH), 8.92 (s, 1H, −HC=N), 7.56-6.84
(m, 8H, aromatic).
L2 (C14H13NO3): Yield: 95%, deep wine solid, mol wt: 243.14, m.pt: 157 °C. Elemental analysis
% (found) C: 69.10, H: 5.38, N: 5.77; calculated C:
69.12, H: 5.39, N: 5.77. FT-IR (cm-1) 3747, 3046, 2987, 2942, 2896, 2832, 2687, 2561, 2071, 1839,
1626, 1591, 1527, 1494, 1494, 1456, 1437, 1417,
1330, 1300, 1273, 1247, 1221, 1204, 1165, 1143,
1131, 1098, 1039, 941, 931, 869, 854, 811, 787, 738, 663, 589, 566, 549, 516, 499, 479, 471. 1H NMR: 13.07 (s, 1H, −OH), 9.68 (s, 1H, −OH),
8.89 (s, 1H, −HC=N), 7.29-6.82 (m, 7H, aromatic), 3.71 (s, 3H, −OCH3).
L3 (C17H13NO2): Yield: 86%, yellow solid, mol
wt: 263.29, m.pt: 249 °C. Elemental analysis % (found) C: 77.56, H: 5.00, N: 5.29; calculated, C:
77.55, H: 4.98, N: 5.32. FT-IR (cm-1) 3119, 3017,
2925, 2427, 2175, 1617, 1584, 1547, 1547, 1513,
1459, 1407, 1354, 1316, 1270, 1238, 1210, 1170,
1140, 1114, 1039, 993, 968, 920, 854, 825, 774, 740, 647, 594, 577, 549, 519, 482, 467. 1H NMR:
13.62 (s, 1H, −OH), 10.31 (s, 1H, −OH), 9.47 (s,
1H, −HC=N), 8.34-6.70 (m, 10H, aromatic)
2.3.1. Synthesis of the mixed-ligand complexes
A methanolic solution of Ni(CH3COO)2.4H2O (5.0 mmol) was added in drops to the
corresponding Schiff base solution (5.0 mmol)
while stirring in 10ml of the same solvent. Some
drops of anhydrous ammonia were added to modify the pH of the resulting mixture to 7-7.5 and
refluxed at 60 °C for 3 h. The colored solids
precipitated were filtered by vacuum filtration, washed with distilled water, diethyl ether and
methanol. These were dried over silica gel in a
desiccator for two days and recrystallized from DMSO.
Scheme 2. Synthetic route of the Ni(II) mixed-ligand complexes.
NiL1NH3 (C13H12N2O2Ni): Yield: 85%, wine
solid, mol wt.: 286.94. m.pt: > 260 °C. Elemental
analysis % (found) C: 54.44, H: 4.23, N: 9.78;
calculated C: 54.42, H: 4.22, N: 9.76. FT-IR (ATR, cm-1): 3336, 3276, 3235, 3158, 3040, 3016, 2685,
2591, 2541, 2323, 2098, 1916, 1880, 1843, 1802,
1760, 1689, 1602, 1580, 1526, 1479, 1468, 1441, 1375, 1358, 1322, 1313, 1303, 1283, 1263, 1225,
1172, 1156, 1143, 1130, 1111, 1029, 960, 941, 926,
941, 926, 875, 840, 796, 772, 750, 743, 730, 695, 657, 614, 568, 546, 524, 484, 461. 1H NMR
(DMSO-d6, δ, ppm): 8.79 (s, 1H, −HC=N), 7.75-
6.46 (m, 8H, aromatic), 2.37 (s, 3H, −NH3). 13C
NMR (DMSO-d6, δ, ppm): 167.43, 162.96, 148.06, 139.55, 135.52, 134.04, 129.09, 120.83, 118.51,
116.56, 115.44, 114.75.
NiL2NH3 (C14H14N2O3Ni): Yield: 82%, wine solid, mol wt.: 316.97, m.pt: > 260 °C. Elemental
analysis, % (found) C: 53.10, H: 4.47, N:
8.85; calculated C: 53.05, H: 4.45, N: 8.84. FT-IR
(cm-1): 3341, 3236, 3159, 2935, 2832, 2009, 1840,
1601, 1584, 1529, 1477, 1445, 1424, 1367, 1314,
1302, 1282, 1257, 1238, 1212, 1177, 1147, 1111,
1049, 1031, 952, 939, 898, 871, 846, 821, 804, 750, 994, 658, 643, 582, 567, 550, 522 503, 487, 474,
464, 456. 1H NMR (DMSO-d6, δ, ppm): 8.65 (s, 1H,
−HC=N), 7.71-6.45 (m, 7H, aromatic), 3.69 (s, 3H, −OCH3), 2.25 (s, 3H, −NH3).
13C NMR (DMSO-d6,
δ, ppm): 167.39, 158.49, 149.25, 147.55, 139.62,
129.15, 124.40, 121.55, 120.98, 118.56, 116.34, 114.79, 56.44.
NiL3NH3 (C17H14N2O2Ni): Yield: 84%, brown
solid, mol wt.: 337, m.pt: > 260 °C. Elemental
analysis % (found) C: 60.71, H: 4.09, N: 8.27; calculated C: 60.59, H: 4.19, N: 8.31. FT-IR (cm-
1):
3340, 3239, 3163, 3038, 2338, 2148, 1613, 1600,
1578, 1533, 1509, 1476, 1457, 1428, 1397, 1361, 1344, 1314, 1297, 1280, 1262, 1252, 1205, 1171,
1145, 1111, 1041, 1029, 986, 963, 912, 835, 817,
775, 757, 693, 670, 653, 587, 563, 508, 470, 457.
Original article
21 Eclética Química Journal, vol. 45, n. 1, 2020, 18-43
ISSN: 1678-4618
DOI: 10.26850/1678-4618eqj.v45.1.2020.p18-43
1H NMR (DMSO-d6, δ, ppm): 9.25 (s, 1H,
−HC=N), 8.49-6.30 (m, 10H, aromatic), 2.37 (s, 3H, −NH3).
13C NMR (DMSO-d6, δ, ppm): 167.18,
163.60, 141.43, 140.48, 134.85, 134.39, 129.17,
128.80, 128.01, 127.12, 124.19, 123.06, 121.66,
118.36, 116.78, 114.89, 111.71.
2.4. Antibacterial study
The antibacterial potentials of the compounds
were measured against some Gram-positive and
Gram-negative bacterial strains by agar-well
diffusion method. The Gram-positive bacterial strains were Streptococcus agalactiae and
Staphylococcus aureus while Escherichia coli,
Klebsiella pneumoniae, Proteus mirabilis, Pseudomonas aeruginosa and Salmonella
typhimurium were the Gram-negative bacterial
strains used. The nutrient agar medium was used to sub-culture the isolates of bacterial strains which
were nurtured at 37 °C for 24 h. 20 mL of
disinfected nutrient agar medium was dispensed in
each germfree Petri dish after modifying the bacterial strains cultures to 0.5 McFarland
standards, these were allowed to gel. The dishes
were swabbed with the inoculum of the bacterial strains and left for 15 min to adsorb unto the gel.
Varying concentrations of the samples (5, 10 and
15 mg mL-1) were filled into the wells that were drilled on the seeded agar dishes by a sterile cork
borer of 6 mm diameter. These were kept for 1 h in
the refrigerator to allow for thorough circulation of
the samples into the medium and then nurtured for 24 h at 37 °C observing the inhibition zones.
Antimicrobial activities were expressed as
inhibition diameter zones in millimeter (mm). Standard Gentamycin (10 µg mL-1) was employed
as control17,20,21.
2.5. Phosphomolybdate total antioxidant capacity (PTAC) assay
The total antioxidant capacities (TAC) of the compounds were determined by
phosphomolybdenum assay and ascorbic acid was
used as the standard. 1.0 mL of reagent (0.6 mol L-
1 sulfuric acid, 28 µmol L-1 sodium phosphate and
4 µmol L-1 ammonium molybdate) was reacted
with a fractional part of the extract solution (1.0 mL
of 1000 µg). The covered tubes were incubated at 95 °C in a water bath for 90 min after which the
samples were cooled to room temperature and a
UV spectrophotometer was used to measure the
absorbance of the aqueous solution of each at
695 nm. The procedure was repeated for an empty solution containing 1.0 mL of reagent solution. The
TAC studies were performed three times and the
mean was expressed as equivalents of ascorbic
acid22.
2.6. Computational method
The Ni(II) complexes were modeled and
optimized using Gaussian 9 and Spartan 14
computational software packages which were
implemented on an Intel Core i3-3100M computer. They were modeled based on the electronic spectra
and elemental analyses data. Density functional
theory (DFT) was employed for the geometry optimization, chemical shifts, electronic transitions
and frequency calculations of the complexes. The
DFT calculations were performed on the optimized geometry in the ground state using Becke’s three-
parameter hybrid functional employing the Lee-
Yang-Parr correlation functional (B3LYP) and the
Empirical Density Functional 1 methods (EDF1) with 6-31G** basis set23-26.
3. Results and discussion
The Schiff base ligands and the mixed-ligand
complexes were stable and colored solids. The complexes were not soluble in water and almost all
organic solvents except in DMSO and DMF. The
mixed-ligand complexes have higher melting
points than the parent Schiff base ligands, this showed that they have better stability than the
Schiff bases. Elemental analyses data indicated the
formation of 1:1:1 [nickel:Schiff base:ammonia] molar ratio for the mixed-ligand complexes. The
crystals obtained in DMSO were not suitable for X-
ray diffraction measurement. No crystal was
obtained in DMF. Attempts to isolate single crystal suitable for X-ray diffraction measurement were
not successful.
3.1 Spectroscopic studies
3.1.1. FT-IR spectra
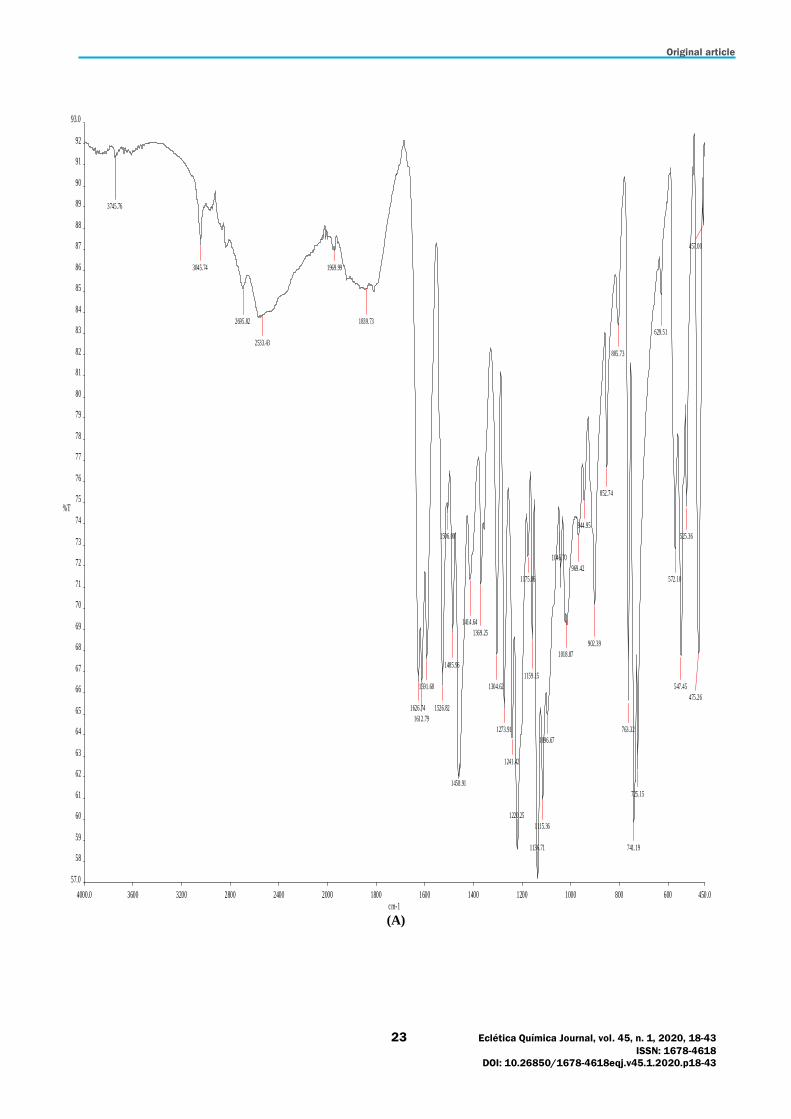
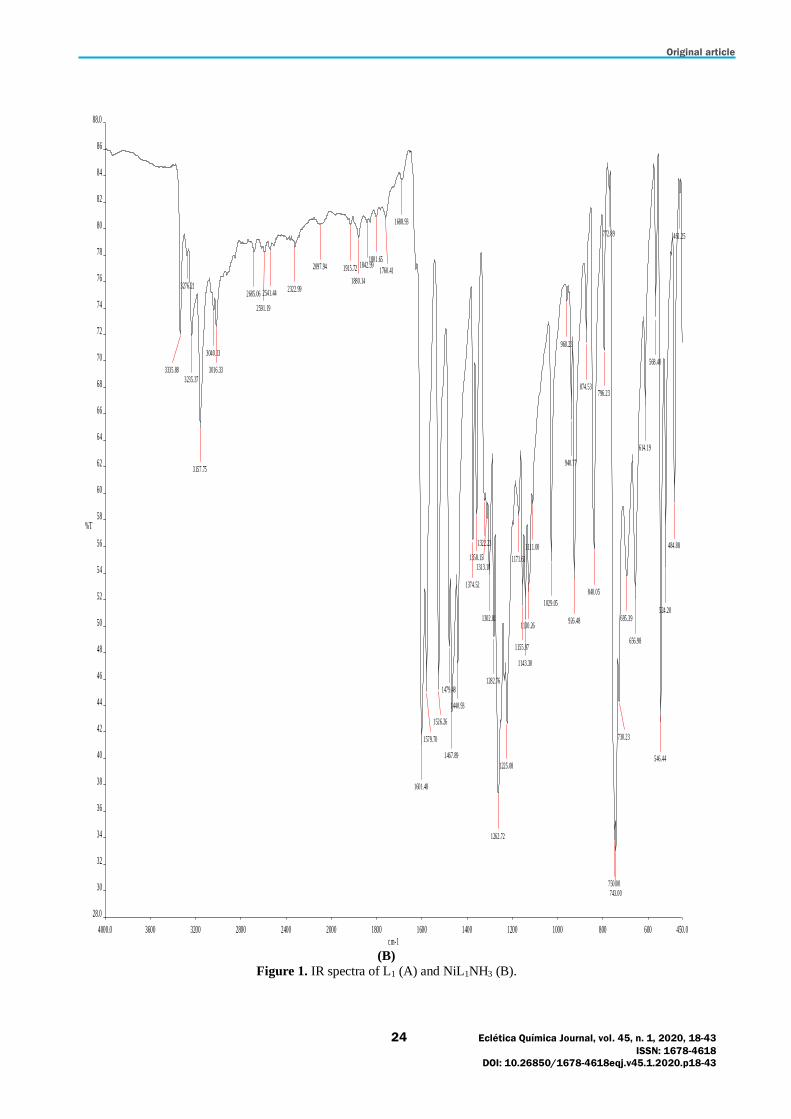
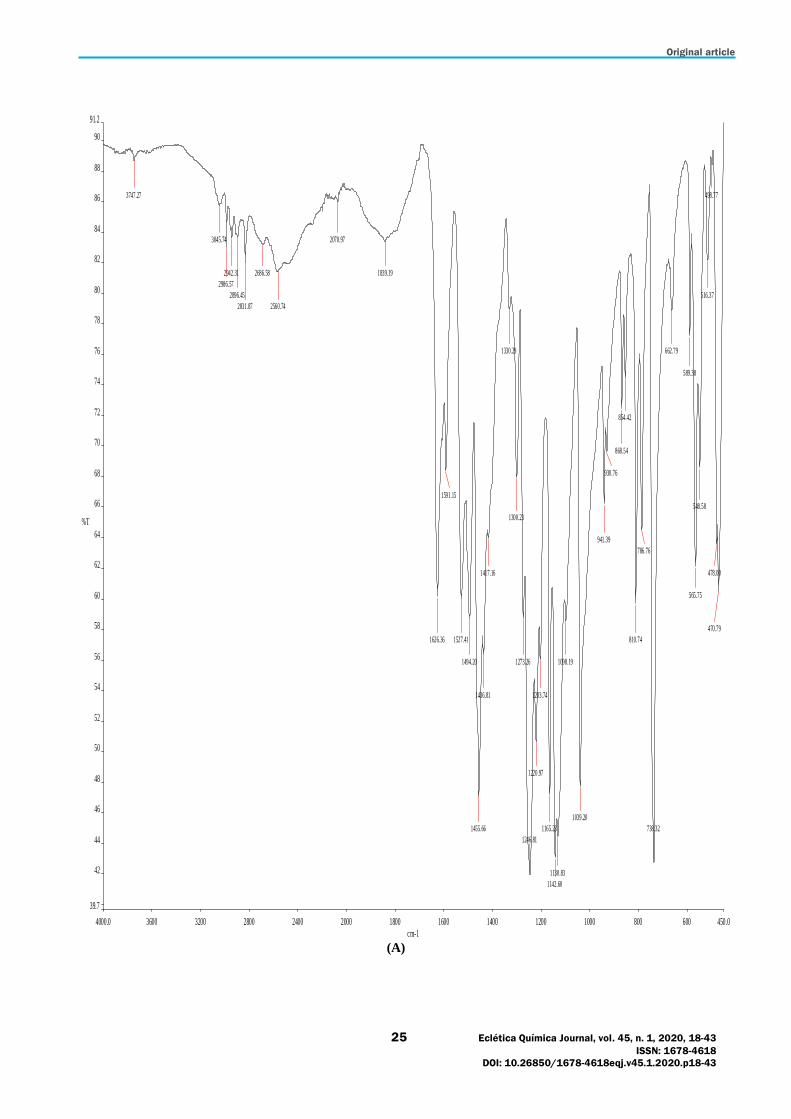
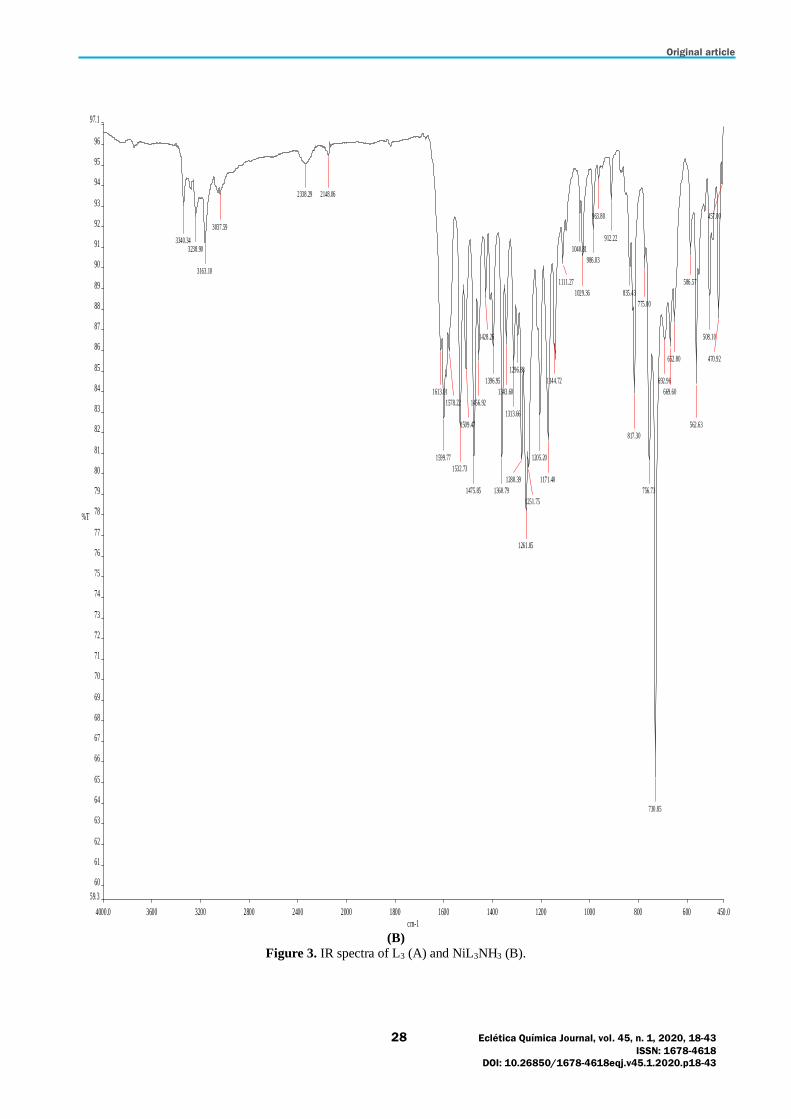
The spectra of the free Schiff base ligands (L1, L2 and L3) showed the azomethine, ⱱ(−HC=N)
bands at 1627, 1617 and 1626 cm-1 respectively, these bands shifted to lower wavenumbers (1601-
1600 cm-1) in the mixed-ligand complexes (Figs. 1-
3). This revealed the involvements of the
Original article
22 Eclética Química Journal, vol. 45, n. 1, 2020, 18-43
ISSN: 1678-4618
DOI: 10.26850/1678-4618eqj.v45.1.2020.p18-43
azomethine nitrogen atoms in coordination with the
Ni(II) ions and the formation of metal−ligand bonds. The bands at 1274, 1228 and 1247 cm-1 in
the spectra of the free Schiff base ligands were
assigned to the phenolic C−O stretching vibrations
of L1, L2 and L3 respectively. These bands shifted to higher wave numbers at 1301-1261 cm-1 in the
complexes, these showed the participation of the
oxygen atoms of phenolic groups in coordination with the Ni(II) ions. The free Schiff bases (L1, L2
and L3) exhibited hydroxyl ⱱ(O−H) absorption
bands at 3746, 3747 and 3119-2427 cm-1
respectively, these bands were absent in the complexes which further confirmed the
deprotonation of the phenolic groups and
coordination of oxygen to the Ni(II) ion8,12,27. The complexes showed new bands at 3336, 3340 and
3340 cm-1 respectively assigned to ⱱ(N−H)
stretching vibrations of ammonia (–NH3) groups, these indicated the presence of –NH3 groups in the
complexes28. The complexes displayed the
aromatic ⱱ(C−H) and ⱱ(C=C) absorption bands
around 3276-3016 and 1584-1400 cm-1
respectively. The aromatic ⱱ(C−H) bending
vibrations appeared around 875-647 cm-1. The
bands around 485-471 and 550-508 cm-1 in the complexes were assigned to the stretching
vibrations of the nickel–oxygen, ⱱ(Ni−O) and
nickel–nitrogen, ⱱ(Ni−N) respectively. These
confirmed the attachment of the Schiff bases to the central nickel ion through the phenolic oxygen
atoms and the azomethine nitrogen atoms8,11,17.
Original article
23 Eclética Química Journal, vol. 45, n. 1, 2020, 18-43
ISSN: 1678-4618
DOI: 10.26850/1678-4618eqj.v45.1.2020.p18-43
(A)
4000.0 3600 3200 2800 2400 2000 1800 1600 1400 1200 1000 800 600 450.0
57.0
58
59
60
61
62
63
64
65
66
67
68
69
70
71
72
73
74
75
76
77
78
79
80
81
82
83
84
85
86
87
88
89
90
91
92
93.0
cm-1
%T
3045.74
2695.82
2533.43
1969.99
1839.73
1626.74
1612.79
1591.68
1526.82
1506.00
1485.96
1458.91
1414.64
1369.25
1304.62
1273.91
1241.42
1220.25
1175.86
1159.15
1136.71
1115.36
1096.67
1046.70
1018.87
969.42
944.95
902.39
852.74
805.73
763.32
741.19
725.15
629.51
572.10
547.45
525.36
475.26
457.00
3745.76
Original article
24 Eclética Química Journal, vol. 45, n. 1, 2020, 18-43
ISSN: 1678-4618
DOI: 10.26850/1678-4618eqj.v45.1.2020.p18-43
(B)
Figure 1. IR spectra of L1 (A) and NiL1NH3 (B).
4000.0 3600 3200 2800 2400 2000 1800 1600 1400 1200 1000 800 600 450.0
28.0
30
32
34
36
38
40
42
44
46
48
50
52
54
56
58
60
62
64
66
68
70
72
74
76
78
80
82
84
86
88.0
cm-1
%T
3335.88
3276.21
3235.37
3157.75
3040.13
3016.33
2685.06
2591.19
2541.44 2322.99
2097.94 1915.72
1880.14
1842.991801.65
1760.41
1688.93
1601.48
1579.70
1526.26
1479.48
1467.89
1440.93
1374.52
1358.15
1322.23
1313.18
1302.81
1282.76
1262.72
1225.08
1171.61
1155.97
1143.30
1130.26
1111.00
1029.05
960.23
940.77
926.48
874.53
840.05
796.23
772.89
750.00743.00
730.23
695.39
656.98
614.19
568.40
546.44
524.20
484.88
461.25
Original article
25 Eclética Química Journal, vol. 45, n. 1, 2020, 18-43
ISSN: 1678-4618
DOI: 10.26850/1678-4618eqj.v45.1.2020.p18-43
(A)
4000.0 3600 3200 2800 2400 2000 1800 1600 1400 1200 1000 800 600 450.0
39.7
42
44
46
48
50
52
54
56
58
60
62
64
66
68
70
72
74
76
78
80
82
84
86
88
90
91.2
cm-1
%T
3747.27
3045.74
2986.57
2942.31
2896.45
2831.87
2686.58
2560.74
2070.97
1839.19
1626.36
1591.15
1527.41
1494.20
1455.66
1436.81
1417.16
1330.29
1300.23
1273.26
1246.81
1220.97
1203.74
1165.23
1142.60
1130.83
1098.19
1039.20
941.39
930.76
868.54
854.42
810.74
786.76
738.32
662.79
589.38
565.75
548.58
516.37
498.77
478.00
470.79

Original article
26 Eclética Química Journal, vol. 45, n. 1, 2020, 18-43
ISSN: 1678-4618
DOI: 10.26850/1678-4618eqj.v45.1.2020.p18-43
(B)
Figure 2. IR spectra of L2 (A) and NiL2NH3 (B).
4000.0 3600 3200 2800 2400 2000 1800 1600 1400 1200 1000 800 600 450.0
42.0
44
46
48
50
52
54
56
58
60
62
64
66
68
70
72
74
76
78
80
82
84
86
88
90
92
93.7
cm-1
%T
3340.88
3236.21
3158.97
2934.79
2832.47
2009.49 1840.00
1601.11
1583.93
1529.19
1476.95
1444.52
1423.95
1367.35
1313.99
1302.16
1282.25
1257.04
1237.50
1212.15
1176.87
1146.85
1111.12
1049.20
1030.93
951.84
938.68
897.76
870.65
846.18
821.40
804.17
749.60
694.33
658.32
642.87
584.26
566.98
549.84
521.78
503.00
486.54
473.77
464.10
456.23

Original article
27 Eclética Química Journal, vol. 45, n. 1, 2020, 18-43
ISSN: 1678-4618
DOI: 10.26850/1678-4618eqj.v45.1.2020.p18-43
(A)
4000.0 3600 3200 2800 2400 2000 1800 1600 1400 1200 1000 800 600 450.0
74.9
76
77
78
79
80
81
82
83
84
85
86
87
88
89
90
91
92
93
94
95
96
97.0
cm-1
%T
2174.92
1617.26
1583.62
1547.44
1512.81
1459.25
1406.92
1354.43
1315.82
1270.02
1238.13
1209.82
1169.25
1139.84
1114.40
1039.34
992.78
967.83
920.25
854.34
825.45
774.23
740.28
647.67
594.41
577.16
548.88
518.77
482.35
467.32
3118.64
3016.94
2925.42
2427.11
Original article
28 Eclética Química Journal, vol. 45, n. 1, 2020, 18-43
ISSN: 1678-4618
DOI: 10.26850/1678-4618eqj.v45.1.2020.p18-43
(B)
Figure 3. IR spectra of L3 (A) and NiL3NH3 (B).
4000.0 3600 3200 2800 2400 2000 1800 1600 1400 1200 1000 800 600 450.0
59.3
60
61
62
63
64
65
66
67
68
69
70
71
72
73
74
75
76
77
78
79
80
81
82
83
84
85
86
87
88
89
90
91
92
93
94
95
96
97.1
cm-1
%T
3340.343238.90
3163.10
3037.59
2338.29 2148.06
1613.01
1599.77
1578.22
1532.73
1509.47
1475.85
1456.92
1428.26
1396.95
1360.79
1343.60
1313.66
1296.88
1280.39
1261.85
1251.75
1205.20
1171.40
1144.72
1111.27
1040.81
1029.36
986.03
963.80
912.22
835.43
817.30
775.00
756.73
730.85
692.96
669.60
652.80
586.57
562.63
508.10
470.92
457.00
Original article
29 Eclética Química Journal, vol. 45, n. 1, 2020, 18-43
ISSN: 1678-4618
DOI: 10.26850/1678-4618eqj.v45.1.2020.p18-43
3.1.2. NMR spectra
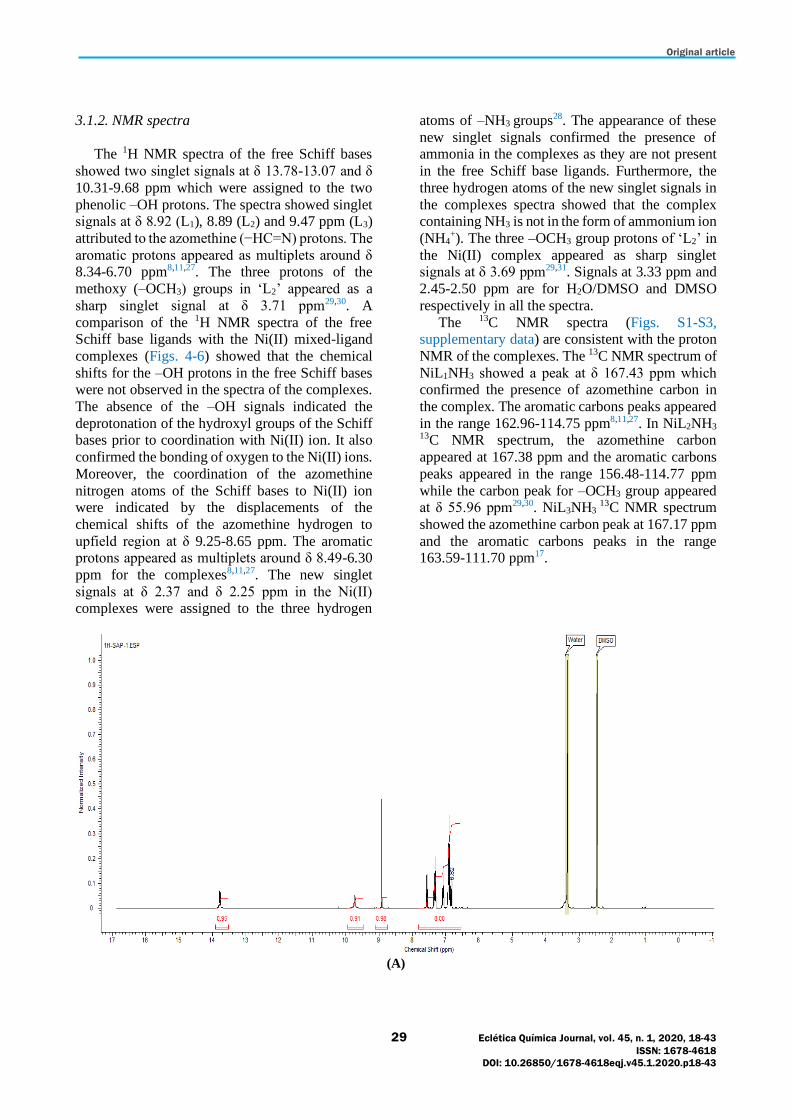
The 1H NMR spectra of the free Schiff bases
showed two singlet signals at δ 13.78-13.07 and δ
10.31-9.68 ppm which were assigned to the two
phenolic –OH protons. The spectra showed singlet signals at δ 8.92 (L1), 8.89 (L2) and 9.47 ppm (L3)
attributed to the azomethine (−HC=N) protons. The
aromatic protons appeared as multiplets around δ 8.34-6.70 ppm8,11,27. The three protons of the
methoxy (–OCH3) groups in ‘L2’ appeared as a
sharp singlet signal at δ 3.71 ppm29,30. A
comparison of the 1H NMR spectra of the free Schiff base ligands with the Ni(II) mixed-ligand
complexes (Figs. 4-6) showed that the chemical
shifts for the –OH protons in the free Schiff bases were not observed in the spectra of the complexes.
The absence of the –OH signals indicated the
deprotonation of the hydroxyl groups of the Schiff bases prior to coordination with Ni(II) ion. It also
confirmed the bonding of oxygen to the Ni(II) ions.
Moreover, the coordination of the azomethine
nitrogen atoms of the Schiff bases to Ni(II) ion were indicated by the displacements of the
chemical shifts of the azomethine hydrogen to
upfield region at δ 9.25-8.65 ppm. The aromatic protons appeared as multiplets around δ 8.49-6.30
ppm for the complexes8,11,27. The new singlet
signals at δ 2.37 and δ 2.25 ppm in the Ni(II) complexes were assigned to the three hydrogen
atoms of –NH3 groups28. The appearance of these
new singlet signals confirmed the presence of ammonia in the complexes as they are not present
in the free Schiff base ligands. Furthermore, the
three hydrogen atoms of the new singlet signals in
the complexes spectra showed that the complex containing NH3 is not in the form of ammonium ion
(NH4+). The three –OCH3 group protons of ‘L2’ in
the Ni(II) complex appeared as sharp singlet signals at δ 3.69 ppm29,31. Signals at 3.33 ppm and
2.45-2.50 ppm are for H2O/DMSO and DMSO
respectively in all the spectra.
The 13C NMR spectra (Figs. S1-S3, supplementary data) are consistent with the proton
NMR of the complexes. The 13C NMR spectrum of
NiL1NH3 showed a peak at δ 167.43 ppm which confirmed the presence of azomethine carbon in
the complex. The aromatic carbons peaks appeared
in the range 162.96-114.75 ppm8,11,27. In NiL2NH3 13C NMR spectrum, the azomethine carbon
appeared at 167.38 ppm and the aromatic carbons
peaks appeared in the range 156.48-114.77 ppm
while the carbon peak for –OCH3 group appeared at δ 55.96 ppm29,30. NiL3NH3
13C NMR spectrum
showed the azomethine carbon peak at 167.17 ppm
and the aromatic carbons peaks in the range 163.59-111.70 ppm17.
(A)
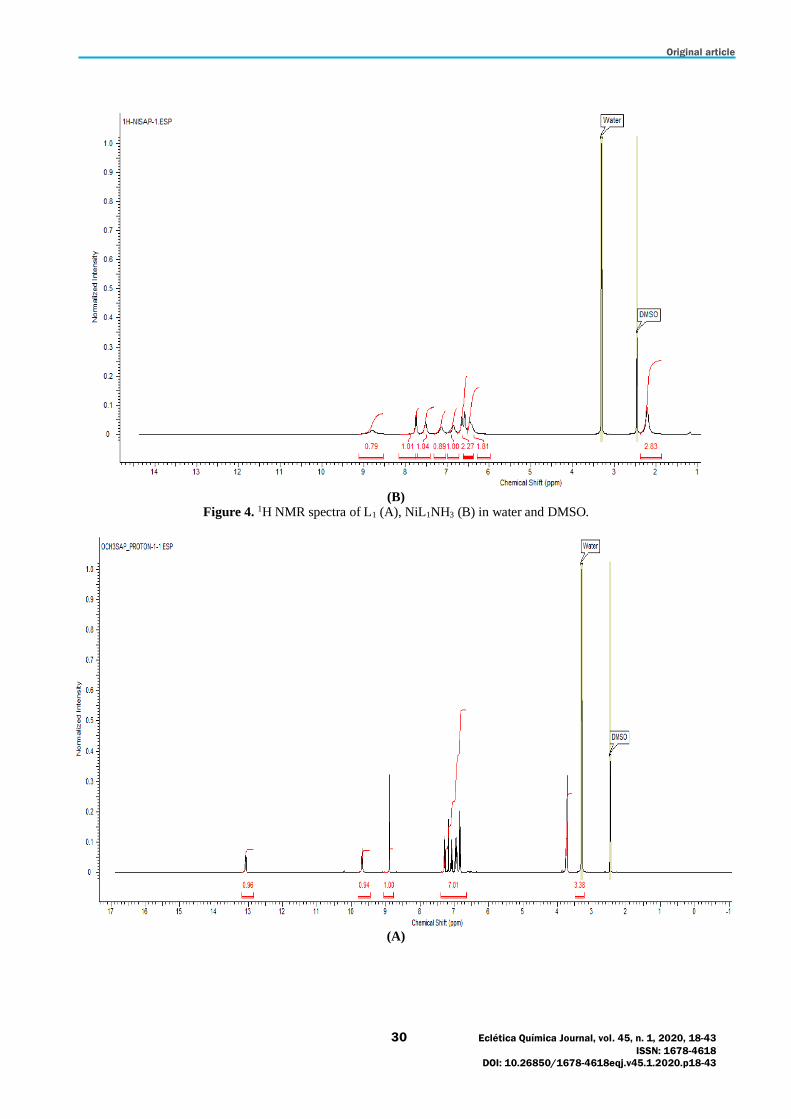
Original article
30 Eclética Química Journal, vol. 45, n. 1, 2020, 18-43
ISSN: 1678-4618
DOI: 10.26850/1678-4618eqj.v45.1.2020.p18-43
(B)
Figure 4. 1H NMR spectra of L1 (A), NiL1NH3 (B) in water and DMSO.
(A)

Original article
31 Eclética Química Journal, vol. 45, n. 1, 2020, 18-43
ISSN: 1678-4618
DOI: 10.26850/1678-4618eqj.v45.1.2020.p18-43
(B)
Figure 5. 1H NMR spectra of L2 (A), NiL2NH3 (B) in water and DMSO.
(A)
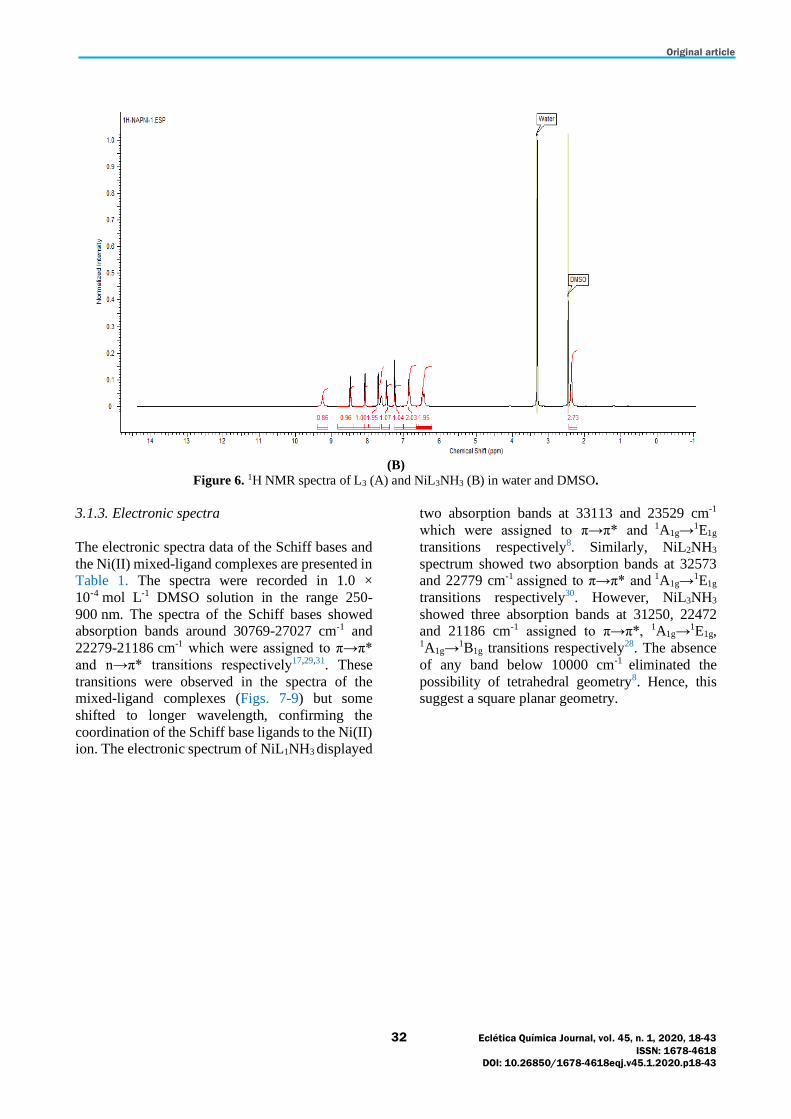
Original article
32 Eclética Química Journal, vol. 45, n. 1, 2020, 18-43
ISSN: 1678-4618
DOI: 10.26850/1678-4618eqj.v45.1.2020.p18-43
(B)
Figure 6. 1H NMR spectra of L3 (A) and NiL3NH3 (B) in water and DMSO.
3.1.3. Electronic spectra
The electronic spectra data of the Schiff bases and
the Ni(II) mixed-ligand complexes are presented in Table 1. The spectra were recorded in 1.0 ×
10
-
4 mol L-1 DMSO solution in the range 250-
900 nm. The spectra of the Schiff bases showed absorption bands around 30769-27027 cm-1 and
22279-21186 cm-1 which were assigned to π→π*
and n→π* transitions respectively17,29,31. These
transitions were observed in the spectra of the mixed-ligand complexes (Figs. 7-9) but some
shifted to longer wavelength, confirming the
coordination of the Schiff base ligands to the Ni(II) ion. The electronic spectrum of NiL1NH3 displayed
two absorption bands at 33113 and 23529 cm-1
which were assigned to π→π* and 1A1g→
1E1g
transitions respectively8. Similarly, NiL2NH3
spectrum showed two absorption bands at 32573 and 22779 cm-1 assigned to π→π* and 1A1g→
1E1g
transitions respectively30. However, NiL3NH3
showed three absorption bands at 31250, 22472 and 21186 cm-1 assigned to π→π*, 1A1g→
1E1g, 1A1g→
1B1g transitions respectively28. The absence
of any band below 10000 cm-1 eliminated the
possibility of tetrahedral geometry8. Hence, this suggest a square planar geometry.

Original article
33 Eclética Química Journal, vol. 45, n. 1, 2020, 18-43
ISSN: 1678-4618
DOI: 10.26850/1678-4618eqj.v45.1.2020.p18-43
Table 1. Experimental and theoretical electronic spectra data of the compounds.
Exp = Experimental.
(A)
Compounds Bands in cm-1 Assignments
L1
NiL1NH3 (Exp)
NiL1NH3 (B3LYP) NiL1NH3 (EDF1)
28329
33113, 23529
2317, 22422, 19377 22382, 15290
π→π*
π→π*,1A1g → 1E1g,
L2
NiL2NH3 (Exp)
NiL2NH3 (B3LYP) NiL2NH3 (EDF1)
27027
32573, 22779
24724, 23285, 22323, 19239 21685, 14794
π→π*
π→π*,1A1g → 1E1g,
L3
NiL3NH3 (Exp)
NiL3NH3 (B3LYP) NiL3NH3 (EDF1)
30769, 22272, 21186
31250, 22472, 21186
25454, 23552, 22339, 19642 22471, 21209, 15095
π→π*, n→π*, n→π*
π→π*, 1A1g → 1E1g,
1A1g → 1B1g

Original article
34 Eclética Química Journal, vol. 45, n. 1, 2020, 18-43
ISSN: 1678-4618
DOI: 10.26850/1678-4618eqj.v45.1.2020.p18-43
(B)
Figure 7. UV-Visible spectra of L1 (A), NiL1NH3 (B).
(A)
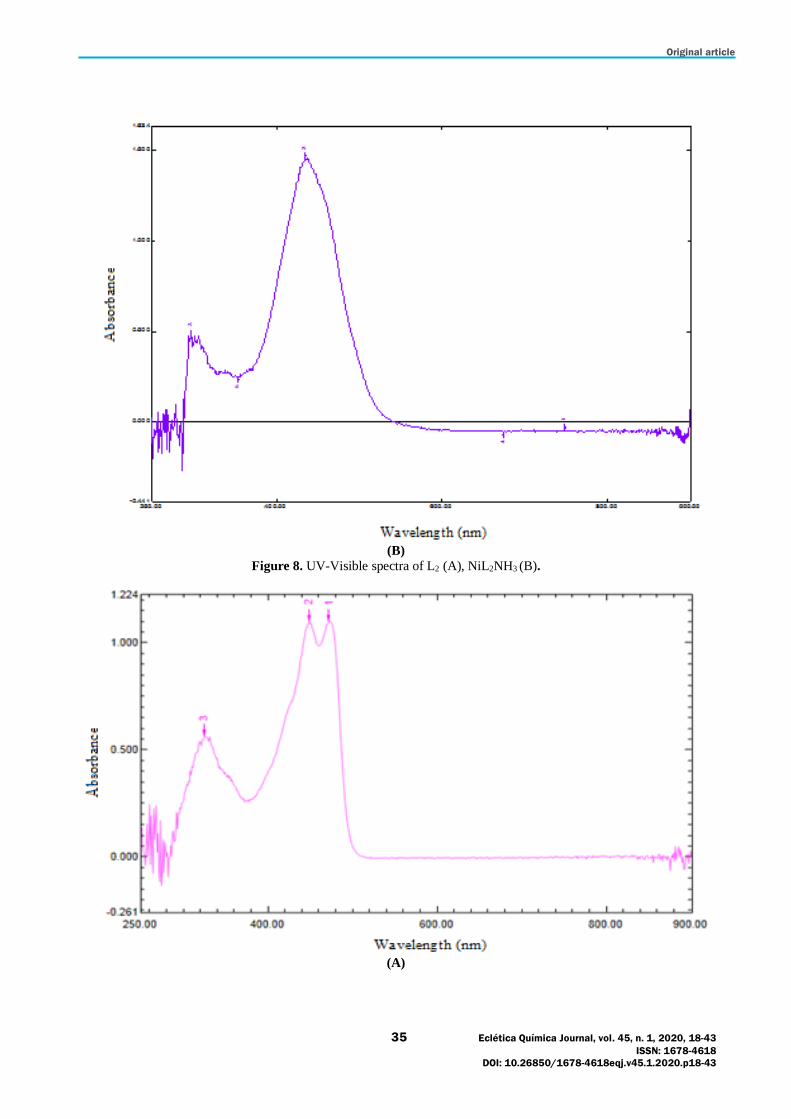
Original article
35 Eclética Química Journal, vol. 45, n. 1, 2020, 18-43
ISSN: 1678-4618
DOI: 10.26850/1678-4618eqj.v45.1.2020.p18-43
(B)
Figure 8. UV-Visible spectra of L2 (A), NiL2NH3 (B).
(A)
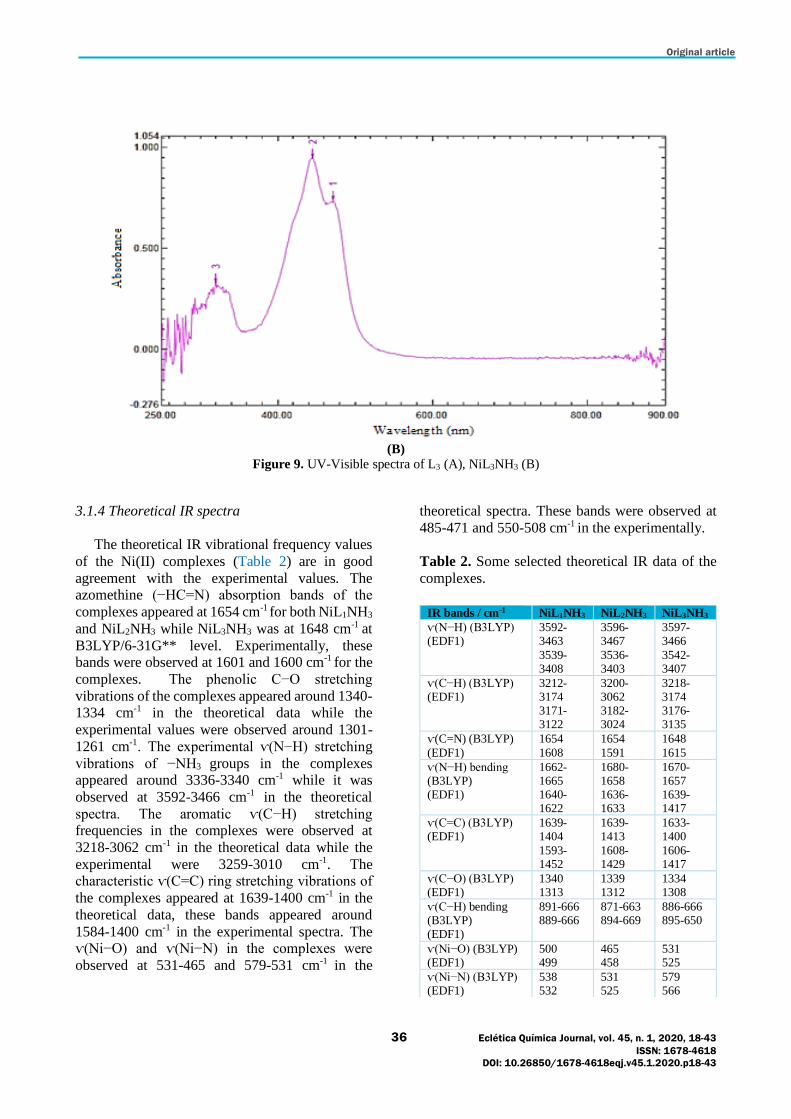
Original article
36 Eclética Química Journal, vol. 45, n. 1, 2020, 18-43
ISSN: 1678-4618
DOI: 10.26850/1678-4618eqj.v45.1.2020.p18-43
(B)
Figure 9. UV-Visible spectra of L3 (A), NiL3NH3 (B)
3.1.4 Theoretical IR spectra
The theoretical IR vibrational frequency values
of the Ni(II) complexes (Table 2) are in good
agreement with the experimental values. The azomethine (−HC=N) absorption bands of the
complexes appeared at 1654 cm-1 for both NiL1NH3
and NiL2NH3 while NiL3NH3 was at 1648 cm-1 at
B3LYP/6-31G** level. Experimentally, these bands were observed at 1601 and 1600 cm-1 for the
complexes. The phenolic C−O stretching
vibrations of the complexes appeared around 1340-1334 cm-1 in the theoretical data while the
experimental values were observed around 1301-
1261 cm-1. The experimental ⱱ(N−H) stretching
vibrations of −NH3 groups in the complexes appeared around 3336-3340 cm-1 while it was
observed at 3592-3466 cm-1 in the theoretical
spectra. The aromatic ⱱ(C−H) stretching frequencies in the complexes were observed at
3218-3062 cm-1 in the theoretical data while the
experimental were 3259-3010 cm-1. The characteristic ⱱ(C=C) ring stretching vibrations of
the complexes appeared at 1639-1400 cm-1 in the
theoretical data, these bands appeared around
1584-1400 cm-1 in the experimental spectra. The ⱱ(Ni−O) and ⱱ(Ni−N) in the complexes were
observed at 531-465 and 579-531 cm-1 in the
theoretical spectra. These bands were observed at
485-471 and 550-508 cm-1 in the experimentally.
Table 2. Some selected theoretical IR data of the
complexes.
IR bands / cm-1 NiL1NH3 NiL2NH3 NiL3NH3
ⱱ(N−H) (B3LYP) (EDF1)
3592-3463
3539-3408
3596-3467
3536-3403
3597-3466
3542-3407
ⱱ(C−H) (B3LYP) (EDF1)
3212-3174 3171-3122
3200-3062 3182-3024
3218-3174 3176-3135
ⱱ(C=N) (B3LYP)
(EDF1)
1654
1608
1654
1591
1648
1615
ⱱ(N−H) bending (B3LYP) (EDF1)
1662-1665 1640-1622
1680-1658 1636-1633
1670-1657 1639-1417
ⱱ(C=C) (B3LYP) (EDF1)
1639-1404
1593-1452
1639-1413
1608-1429
1633-1400
1606-1417
ⱱ(C−O) (B3LYP) (EDF1)
1340 1313
1339 1312
1334 1308
ⱱ(C−H) bending (B3LYP) (EDF1)
891-666 889-666
871-663 894-669
886-666 895-650
ⱱ(Ni−O) (B3LYP) (EDF1)
500 499
465 458
531 525
ⱱ(Ni−N) (B3LYP) (EDF1)
538 532
531 525
579 566
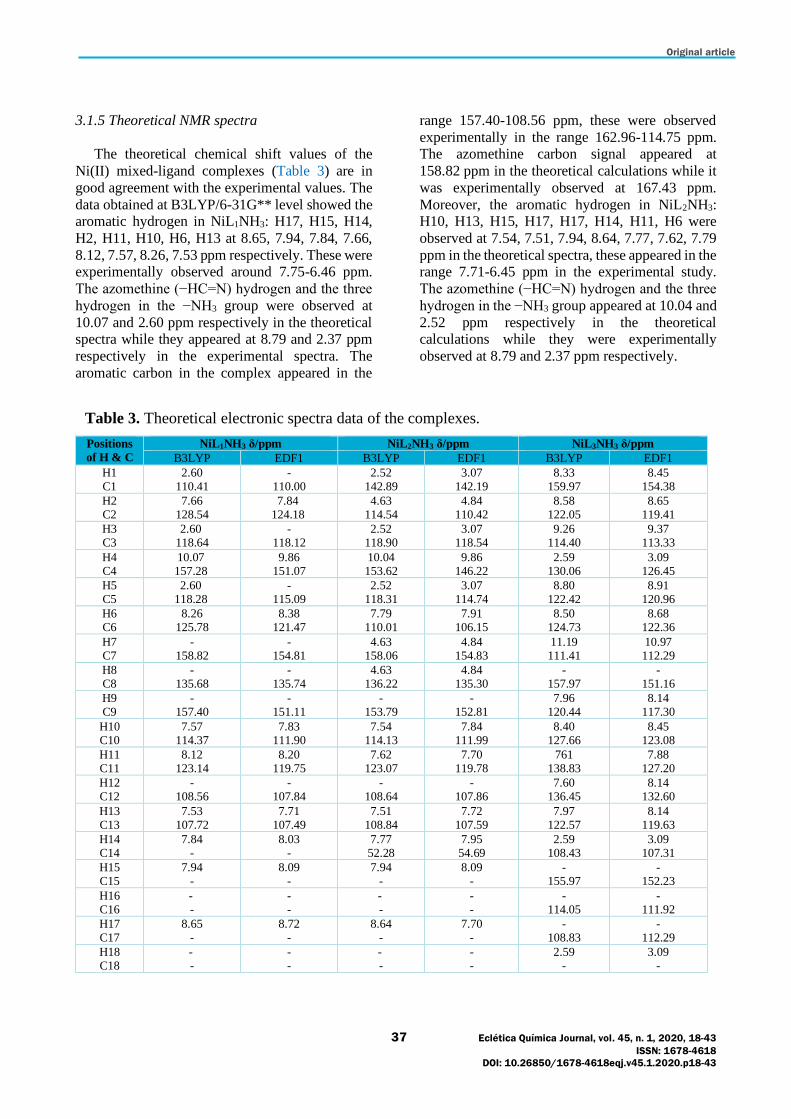
Original article
37 Eclética Química Journal, vol. 45, n. 1, 2020, 18-43
ISSN: 1678-4618
DOI: 10.26850/1678-4618eqj.v45.1.2020.p18-43
3.1.5 Theoretical NMR spectra
The theoretical chemical shift values of the
Ni(II) mixed-ligand complexes (Table 3) are in
good agreement with the experimental values. The
data obtained at B3LYP/6-31G** level showed the aromatic hydrogen in NiL1NH3: H17, H15, H14,
H2, H11, H10, H6, H13 at 8.65, 7.94, 7.84, 7.66,
8.12, 7.57, 8.26, 7.53 ppm respectively. These were experimentally observed around 7.75-6.46 ppm.
The azomethine (−HC=N) hydrogen and the three
hydrogen in the −NH3 group were observed at
10.07 and 2.60 ppm respectively in the theoretical spectra while they appeared at 8.79 and 2.37 ppm
respectively in the experimental spectra. The
aromatic carbon in the complex appeared in the
range 157.40-108.56 ppm, these were observed
experimentally in the range 162.96-114.75 ppm. The azomethine carbon signal appeared at
158.82 ppm in the theoretical calculations while it
was experimentally observed at 167.43 ppm.
Moreover, the aromatic hydrogen in NiL2NH3: H10, H13, H15, H17, H17, H14, H11, H6 were
observed at 7.54, 7.51, 7.94, 8.64, 7.77, 7.62, 7.79
ppm in the theoretical spectra, these appeared in the range 7.71-6.45 ppm in the experimental study.
The azomethine (−HC=N) hydrogen and the three
hydrogen in the −NH3 group appeared at 10.04 and
2.52 ppm respectively in the theoretical calculations while they were experimentally
observed at 8.79 and 2.37 ppm respectively.
Table 3. Theoretical electronic spectra data of the complexes.
Positions
of H & C
NiL1NH3 δ/ppm NiL2NH3 δ/ppm NiL3NH3 δ/ppm
B3LYP EDF1 B3LYP EDF1 B3LYP EDF1
H1 C1
2.60 110.41
- 110.00
2.52 142.89
3.07 142.19
8.33 159.97
8.45 154.38
H2 C2
7.66 128.54
7.84 124.18
4.63 114.54
4.84 110.42
8.58 122.05
8.65 119.41
H3 C3
2.60 118.64
- 118.12
2.52 118.90
3.07 118.54
9.26 114.40
9.37 113.33
H4 C4
10.07 157.28
9.86 151.07
10.04 153.62
9.86 146.22
2.59 130.06
3.09 126.45
H5 C5
2.60 118.28
- 115.09
2.52 118.31
3.07 114.74
8.80 122.42
8.91 120.96
H6 C6
8.26 125.78
8.38 121.47
7.79 110.01
7.91 106.15
8.50 124.73
8.68 122.36
H7 C7
- 158.82
- 154.81
4.63 158.06
4.84 154.83
11.19 111.41
10.97 112.29
H8 C8
- 135.68
- 135.74
4.63 136.22
4.84 135.30
- 157.97
- 151.16
H9 C9
- 157.40
- 151.11
- 153.79
- 152.81
7.96 120.44
8.14 117.30
H10 C10
7.57 114.37
7.83 111.90
7.54 114.13
7.84 111.99
8.40 127.66
8.45 123.08
H11 C11
8.12 123.14
8.20 119.75
7.62 123.07
7.70 119.78
761 138.83
7.88 127.20
H12 C12
- 108.56
- 107.84
- 108.64
- 107.86
7.60 136.45
8.14 132.60
H13 C13
7.53 107.72
7.71 107.49
7.51 108.84
7.72 107.59
7.97 122.57
8.14 119.63
H14 C14
7.84 -
8.03 -
7.77 52.28
7.95 54.69
2.59 108.43
3.09 107.31
H15 C15
7.94 -
8.09 -
7.94 -
8.09 -
- 155.97
- 152.23
H16 C16
- -
- -
- -
- -
- 114.05
- 111.92
H17 C17
8.65 -
8.72 -
8.64 -
7.70 -
- 108.83
- 112.29
H18 C18
- -
- -
- -
- -
2.59 -
3.09 -
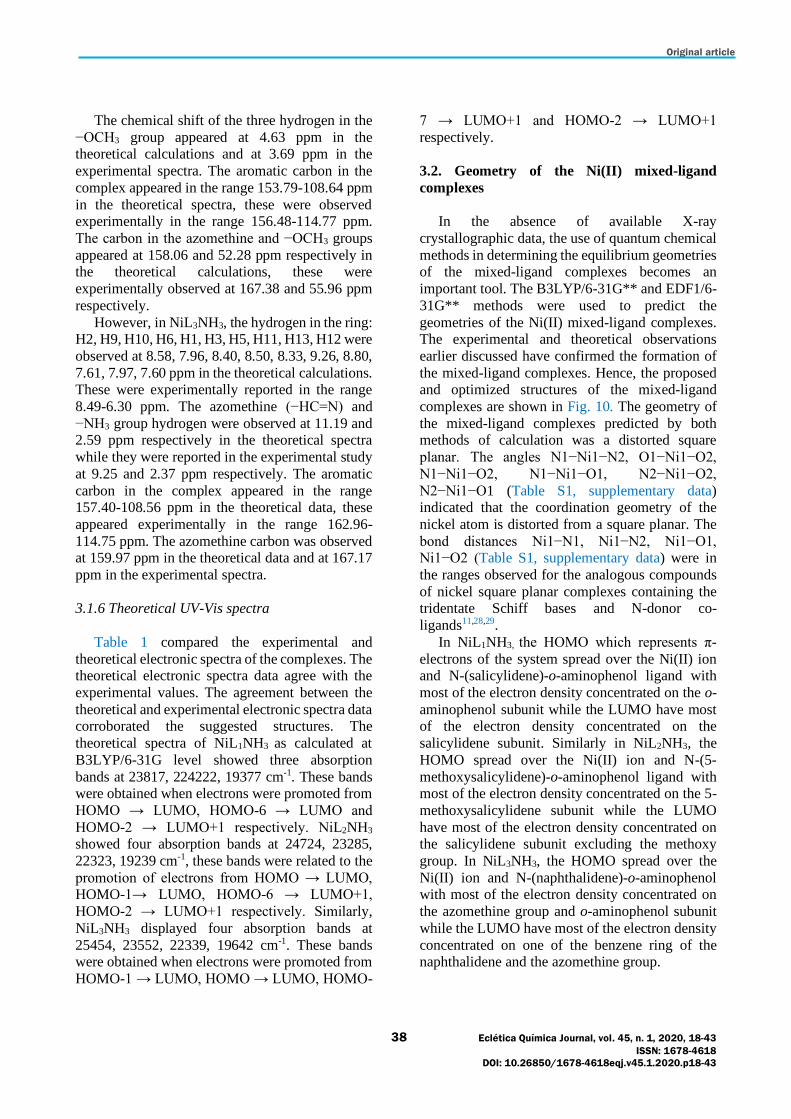
Original article
38 Eclética Química Journal, vol. 45, n. 1, 2020, 18-43
ISSN: 1678-4618
DOI: 10.26850/1678-4618eqj.v45.1.2020.p18-43
The chemical shift of the three hydrogen in the
−OCH3 group appeared at 4.63 ppm in the theoretical calculations and at 3.69 ppm in the
experimental spectra. The aromatic carbon in the
complex appeared in the range 153.79-108.64 ppm
in the theoretical spectra, these were observed experimentally in the range 156.48-114.77 ppm.
The carbon in the azomethine and −OCH3 groups
appeared at 158.06 and 52.28 ppm respectively in the theoretical calculations, these were
experimentally observed at 167.38 and 55.96 ppm
respectively.
However, in NiL3NH3, the hydrogen in the ring: H2, H9, H10, H6, H1, H3, H5, H11, H13, H12 were
observed at 8.58, 7.96, 8.40, 8.50, 8.33, 9.26, 8.80,
7.61, 7.97, 7.60 ppm in the theoretical calculations. These were experimentally reported in the range
8.49-6.30 ppm. The azomethine (−HC=N) and
−NH3 group hydrogen were observed at 11.19 and 2.59 ppm respectively in the theoretical spectra
while they were reported in the experimental study
at 9.25 and 2.37 ppm respectively. The aromatic
carbon in the complex appeared in the range 157.40-108.56 ppm in the theoretical data, these
appeared experimentally in the range 162.96-
114.75 ppm. The azomethine carbon was observed at 159.97 ppm in the theoretical data and at 167.17
ppm in the experimental spectra.
3.1.6 Theoretical UV-Vis spectra
Table 1 compared the experimental and
theoretical electronic spectra of the complexes. The theoretical electronic spectra data agree with the
experimental values. The agreement between the
theoretical and experimental electronic spectra data corroborated the suggested structures. The
theoretical spectra of NiL1NH3 as calculated at
B3LYP/6-31G level showed three absorption
bands at 23817, 224222, 19377 cm-1. These bands were obtained when electrons were promoted from
HOMO → LUMO, HOMO-6 → LUMO and
HOMO-2 → LUMO+1 respectively. NiL2NH3 showed four absorption bands at 24724, 23285,
22323, 19239 cm-1, these bands were related to the
promotion of electrons from HOMO → LUMO, HOMO-1→ LUMO, HOMO-6 → LUMO+1,
HOMO-2 → LUMO+1 respectively. Similarly,
NiL3NH3 displayed four absorption bands at
25454, 23552, 22339, 19642 cm-1. These bands were obtained when electrons were promoted from
HOMO-1 → LUMO, HOMO → LUMO, HOMO-
7 → LUMO+1 and HOMO-2 → LUMO+1
respectively.
3.2. Geometry of the Ni(II) mixed-ligand
complexes
In the absence of available X-ray
crystallographic data, the use of quantum chemical
methods in determining the equilibrium geometries of the mixed-ligand complexes becomes an
important tool. The B3LYP/6-31G** and EDF1/6-
31G** methods were used to predict the
geometries of the Ni(II) mixed-ligand complexes. The experimental and theoretical observations
earlier discussed have confirmed the formation of
the mixed-ligand complexes. Hence, the proposed and optimized structures of the mixed-ligand
complexes are shown in Fig. 10. The geometry of
the mixed-ligand complexes predicted by both methods of calculation was a distorted square
planar. The angles N1−Ni1−N2, O1−Ni1−O2,
N1−Ni1−O2, N1−Ni1−O1, N2−Ni1−O2,
N2−Ni1−O1 (Table S1, supplementary data) indicated that the coordination geometry of the
nickel atom is distorted from a square planar. The
bond distances Ni1−N1, Ni1−N2, Ni1−O1, Ni1−O2 (Table S1, supplementary data) were in
the ranges observed for the analogous compounds
of nickel square planar complexes containing the tridentate Schiff bases and N-donor co-
ligands11,28,29.
In NiL1NH3, the HOMO which represents π-
electrons of the system spread over the Ni(II) ion and N-(salicylidene)-o-aminophenol ligand with
most of the electron density concentrated on the o-
aminophenol subunit while the LUMO have most of the electron density concentrated on the
salicylidene subunit. Similarly in NiL2NH3, the
HOMO spread over the Ni(II) ion and N-(5-
methoxysalicylidene)-o-aminophenol ligand with most of the electron density concentrated on the 5-
methoxysalicylidene subunit while the LUMO
have most of the electron density concentrated on the salicylidene subunit excluding the methoxy
group. In NiL3NH3, the HOMO spread over the
Ni(II) ion and N-(naphthalidene)-o-aminophenol with most of the electron density concentrated on
the azomethine group and o-aminophenol subunit
while the LUMO have most of the electron density
concentrated on one of the benzene ring of the naphthalidene and the azomethine group.

Original article
39 Eclética Química Journal, vol. 45, n. 1, 2020, 18-43
ISSN: 1678-4618
DOI: 10.26850/1678-4618eqj.v45.1.2020.p18-43
(HOMO)
(LUMO)
NiL1NH3 NiL2NH3 NiL3NH3
Figure. 10. Proposed and optimized structures of the complexes at B3LYP/6-31G** level.
3.3. Antibacterial activity
The results of the antibacterial activities of the Schiff bases and the mixed-ligand complexes are
summarized in Table 4. The antibacterial results
revealed that all the synthesized Schiff base ligands and the mixed-ligand complexes exhibited
antibacterial activities. The mixed-ligand
complexes exhibited better inhibitory effects
compared to the parent Schiff bases. The enhancement in the antibacterial activities of the
complexes can be explained based on chelation
theory and probably the presence of ammonia
molecules in the complexes. Chelation makes the ligands more powerful and potent bactericidal
agents; consequently, killing more bacteria than the
free ligands. It facilitates the ability of the complexes to cross the cell membrane. On
chelation, the polarity of the metal ion reduces to a
greater extent due to the overlap of the ligand
orbital and partial sharing of the positive charge of the metal ion with donor groups. This process thus
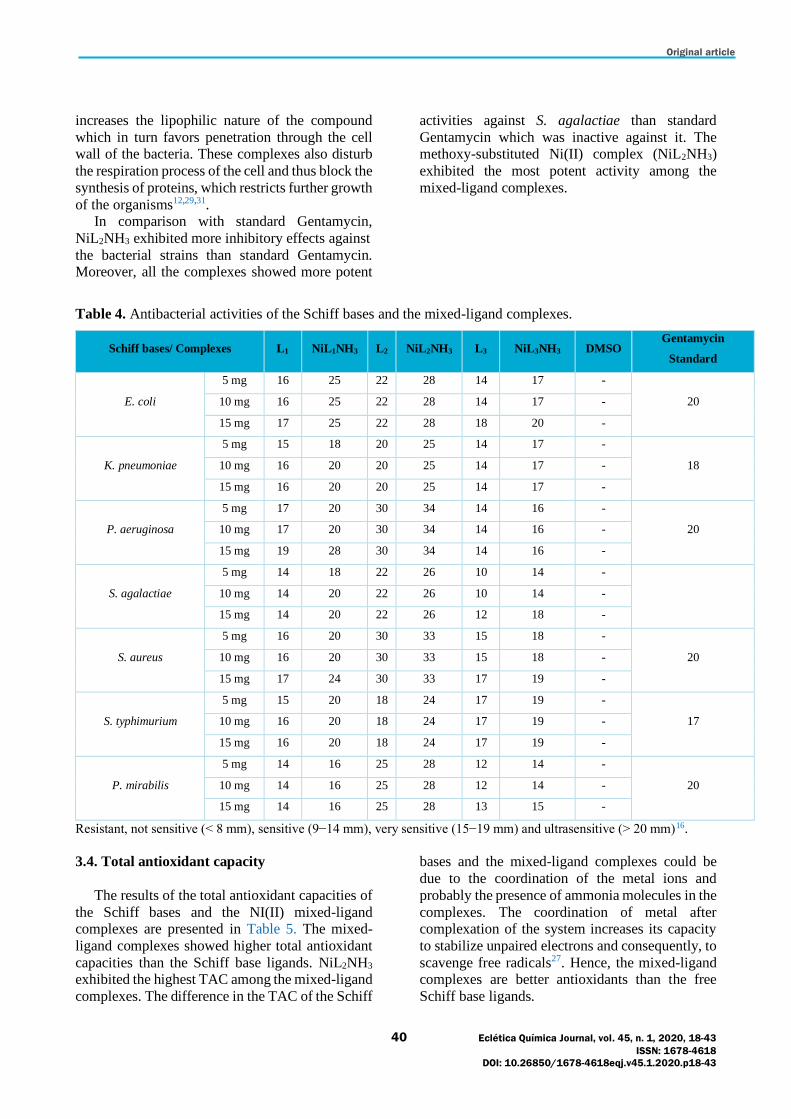
Original article
40 Eclética Química Journal, vol. 45, n. 1, 2020, 18-43
ISSN: 1678-4618
DOI: 10.26850/1678-4618eqj.v45.1.2020.p18-43
increases the lipophilic nature of the compound
which in turn favors penetration through the cell wall of the bacteria. These complexes also disturb
the respiration process of the cell and thus block the
synthesis of proteins, which restricts further growth
of the organisms12,29,31. In comparison with standard Gentamycin,
NiL2NH3 exhibited more inhibitory effects against
the bacterial strains than standard Gentamycin. Moreover, all the complexes showed more potent
activities against S. agalactiae than standard
Gentamycin which was inactive against it. The methoxy-substituted Ni(II) complex (NiL2NH3)
exhibited the most potent activity among the
mixed-ligand complexes.
Table 4. Antibacterial activities of the Schiff bases and the mixed-ligand complexes.
Schiff bases/ Complexes L1 NiL1NH3 L2 NiL2NH3 L3 NiL3NH3 DMSO Gentamycin
Standard
E. coli
5 mg 16 25 22 28 14 17 -
20 10 mg 16 25 22 28 14 17 -
15 mg 17 25 22 28 18 20 -
K. pneumoniae
5 mg 15 18 20 25 14 17 -
18 10 mg 16 20 20 25 14 17 -
15 mg 16 20 20 25 14 17 -
P. aeruginosa
5 mg 17 20 30 34 14 16 -
20 10 mg 17 20 30 34 14 16 -
15 mg 19 28 30 34 14 16 -
S. agalactiae
5 mg 14 18 22 26 10 14 -
10 mg 14 20 22 26 10 14 -
15 mg 14 20 22 26 12 18 -
S. aureus
5 mg 16 20 30 33 15 18 -
20 10 mg 16 20 30 33 15 18 -
15 mg 17 24 30 33 17 19 -
S. typhimurium
5 mg 15 20 18 24 17 19 -
17 10 mg 16 20 18 24 17 19 -
15 mg 16 20 18 24 17 19 -
P. mirabilis
5 mg 14 16 25 28 12 14 -
20 10 mg 14 16 25 28 12 14 -
15 mg 14 16 25 28 13 15 -
Resistant, not sensitive (< 8 mm), sensitive (9−14 mm), very sensitive (15−19 mm) and ultrasensitive (> 20 mm)16.
3.4. Total antioxidant capacity
The results of the total antioxidant capacities of
the Schiff bases and the NI(II) mixed-ligand complexes are presented in Table 5. The mixed-
ligand complexes showed higher total antioxidant
capacities than the Schiff base ligands. NiL2NH3 exhibited the highest TAC among the mixed-ligand
complexes. The difference in the TAC of the Schiff
bases and the mixed-ligand complexes could be
due to the coordination of the metal ions and
probably the presence of ammonia molecules in the
complexes. The coordination of metal after complexation of the system increases its capacity
to stabilize unpaired electrons and consequently, to
scavenge free radicals27. Hence, the mixed-ligand complexes are better antioxidants than the free
Schiff base ligands.
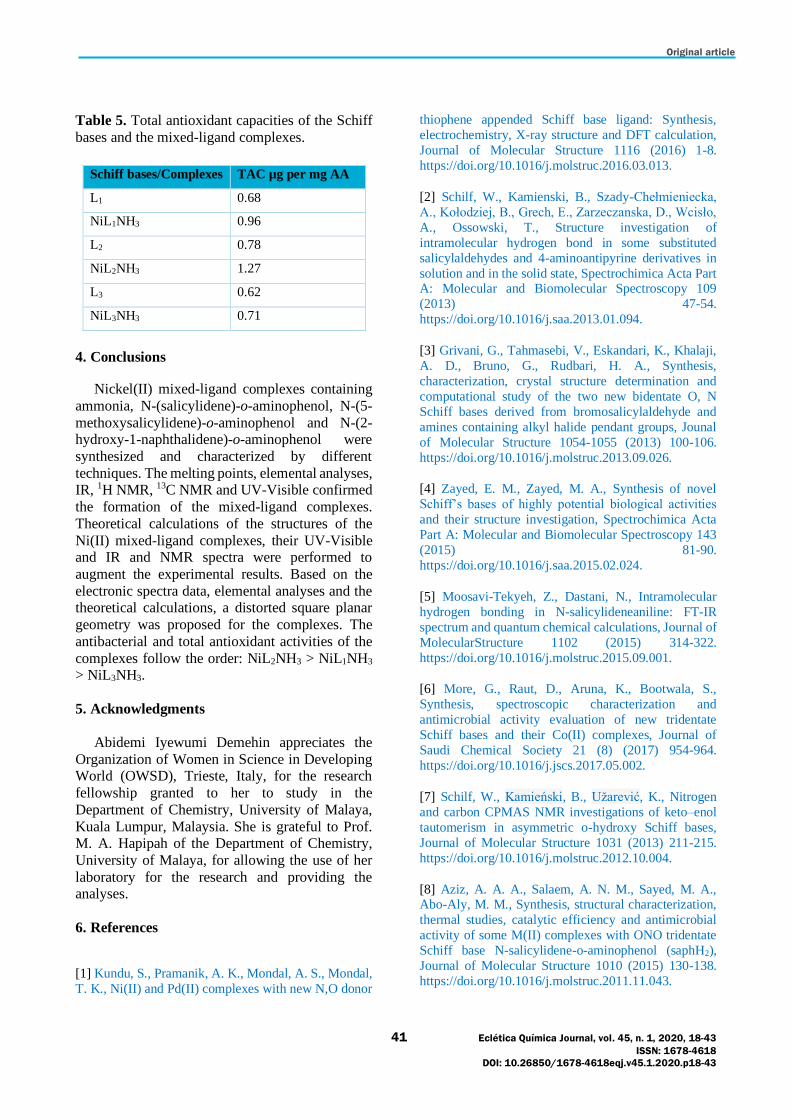
Original article
41 Eclética Química Journal, vol. 45, n. 1, 2020, 18-43
ISSN: 1678-4618
DOI: 10.26850/1678-4618eqj.v45.1.2020.p18-43
Table 5. Total antioxidant capacities of the Schiff
bases and the mixed-ligand complexes.
4. Conclusions
Nickel(II) mixed-ligand complexes containing
ammonia, N-(salicylidene)-o-aminophenol, N-(5-
methoxysalicylidene)-o-aminophenol and N-(2-hydroxy-1-naphthalidene)-o-aminophenol were
synthesized and characterized by different
techniques. The melting points, elemental analyses, IR, 1H NMR, 13C NMR and UV-Visible confirmed
the formation of the mixed-ligand complexes.
Theoretical calculations of the structures of the
Ni(II) mixed-ligand complexes, their UV-Visible and IR and NMR spectra were performed to
augment the experimental results. Based on the
electronic spectra data, elemental analyses and the theoretical calculations, a distorted square planar
geometry was proposed for the complexes. The
antibacterial and total antioxidant activities of the
complexes follow the order: NiL2NH3 > NiL1NH3 > NiL3NH3.
5. Acknowledgments
Abidemi Iyewumi Demehin appreciates the
Organization of Women in Science in Developing World (OWSD), Trieste, Italy, for the research
fellowship granted to her to study in the
Department of Chemistry, University of Malaya,
Kuala Lumpur, Malaysia. She is grateful to Prof. M. A. Hapipah of the Department of Chemistry,
University of Malaya, for allowing the use of her
laboratory for the research and providing the analyses.
6. References
[1] Kundu, S., Pramanik, A. K., Mondal, A. S., Mondal,
T. K., Ni(II) and Pd(II) complexes with new N,O donor
thiophene appended Schiff base ligand: Synthesis,
electrochemistry, X-ray structure and DFT calculation,
Journal of Molecular Structure 1116 (2016) 1-8.
https://doi.org/10.1016/j.molstruc.2016.03.013.
[2] Schilf, W., Kamienski, B., Szady-Chełmieniecka,
A., Kołodziej, B., Grech, E., Zarzeczanska, D., Wcisło,
A., Ossowski, T., Structure investigation of
intramolecular hydrogen bond in some substituted
salicylaldehydes and 4-aminoantipyrine derivatives in
solution and in the solid state, Spectrochimica Acta Part A: Molecular and Biomolecular Spectroscopy 109
(2013) 47-54.
https://doi.org/10.1016/j.saa.2013.01.094.
[3] Grivani, G., Tahmasebi, V., Eskandari, K., Khalaji,
A. D., Bruno, G., Rudbari, H. A., Synthesis,
characterization, crystal structure determination and
computational study of the two new bidentate O, N
Schiff bases derived from bromosalicylaldehyde and
amines containing alkyl halide pendant groups, Jounal
of Molecular Structure 1054-1055 (2013) 100-106.
https://doi.org/10.1016/j.molstruc.2013.09.026.
[4] Zayed, E. M., Zayed, M. A., Synthesis of novel
Schiff’s bases of highly potential biological activities
and their structure investigation, Spectrochimica Acta
Part A: Molecular and Biomolecular Spectroscopy 143
(2015) 81-90.
https://doi.org/10.1016/j.saa.2015.02.024.
[5] Moosavi-Tekyeh, Z., Dastani, N., Intramolecular
hydrogen bonding in N-salicylideneaniline: FT-IR
spectrum and quantum chemical calculations, Journal of
MolecularStructure 1102 (2015) 314-322.
https://doi.org/10.1016/j.molstruc.2015.09.001.
[6] More, G., Raut, D., Aruna, K., Bootwala, S.,
Synthesis, spectroscopic characterization and
antimicrobial activity evaluation of new tridentate
Schiff bases and their Co(II) complexes, Journal of
Saudi Chemical Society 21 (8) (2017) 954-964.
https://doi.org/10.1016/j.jscs.2017.05.002.
[7] Schilf, W., Kamieński, B., Užarević, K., Nitrogen
and carbon CPMAS NMR investigations of keto–enol
tautomerism in asymmetric o-hydroxy Schiff bases,
Journal of Molecular Structure 1031 (2013) 211-215.
https://doi.org/10.1016/j.molstruc.2012.10.004.
[8] Aziz, A. A. A., Salaem, A. N. M., Sayed, M. A., Abo-Aly, M. M., Synthesis, structural characterization,
thermal studies, catalytic efficiency and antimicrobial
activity of some M(II) complexes with ONO tridentate
Schiff base N-salicylidene-o-aminophenol (saphH2),
Journal of Molecular Structure 1010 (2015) 130-138.
https://doi.org/10.1016/j.molstruc.2011.11.043.
Schiff bases/Complexes TAC µg per mg AA
L1 0.68
NiL1NH3 0.96
L2 0.78
NiL2NH3 1.27
L3 0.62
NiL3NH3 0.71
Original article
42 Eclética Química Journal, vol. 45, n. 1, 2020, 18-43
ISSN: 1678-4618
DOI: 10.26850/1678-4618eqj.v45.1.2020.p18-43
[9] Kianfar, A. H., Farrokhpour, H., Dehghani, P.,
Khavasi, H. R., Experimental and theorectical
spectroscopic study and structural determination of
nickel(II) tridentate Schiff base complexes,
Spectrochimica Acta Part A: Molecular and
Biomolecular Spectroscopy 150 (2015) 220-229.
https://doi.org/10.1016/j.saa.2015.05.084.
[10] Köse, M., Purtas, S., Güngör, S. A., Ceyhan, G.,
Akgün, E., McKee, V., A novel Schiff base: Synthesis,
structural characterisation and comparative sensor studies for metal ion detections, Spectrochimica Acta.
Part A, Molecular and Biomolecular Spectroscopy 136
(C) (2014) 1388-1394.
https://doi.org/10.1016/j.saa.2014.10.025.
[11] Saha, S., Jana, S., Gupta, S., Ghosh, A., Nayek, H.
P., Syntheses, structures and biological activities of
square planar Ni(II), Cu(II) complexes, Polyhedron 107
(2016) 183-189.
https://doi.org/10.1016/j.poly.2016.01.034.
[12] Ghosh, A. K., Mitra, M., Fathima, A., Yadav, H.,
Choudhury, A. R., Nair, B. U., Ghosh, R., Antibacterial and catecholase activities of Co(III) and Ni(II) Schiff
base complexes, Polyhedron 107 (2016) 1-8.
https://doi.org/10.1016/j.poly.2016.01.015.
[13] Chandra, S., Vandana, V. P., Synthesis,
spectroscopic, anticancer, and antibacterial studies of
Ni(II) and Cu(II) complex with 2-
carboxybenzalaldehyde thiosemicarbazone,
Spectrochimica Acta Part A: Molecular Biomolecular
Spectroscopy 129 (2014) 333-338.
https://doi.org/10.1016/j.saa.2014.02.141.
[14] Refat, M. S., El-Sayed, M. Y., Adam, A. M. A., Structural, Electronic and Thermal Studies of
ChargeTransfer Complexes from the Schiff Base; N,N´-
Disalicylidene-l,2-Phenylenediamine with Chloranilic
Acid, p-Chloranil, TCNQ and DDQ, Canadian
Chemical Transactions 2 (2014) 149-159.
https://doi.org/10.13179/canchemtrans.2014.02.02.008
6.
[15] Maihub, A. A., Alassbaly, F. S., El-Ajaily, M. M.,
Etorki, A. M., Modification on Synthesis of Mixed
Ligand Chelates by Using Di- and Trivalent Transition
Metal Ions with Schiff Base as Primary Ligand, Green
and Sustainable Chemistry 4 (3) (2014) 103-110. https://doi.org/10.4236/gsc.2014.43015.
[16] Yousif, E., Majeed, A., Al-Sammarrae, K., Salih,
N., Salimon, J., Abdullah, B., Metal complexes of Schiff
base: Preparation, characterization and antibacterial
activity, Arabian Journal of Chemistry 10 (Supp. 2)
(2017) S1639-S1644.
https://doi.org/10.1016/j.arabjc.2013.06.006.
[17] Kiran, T., Prasanth, V. G., Balamurali, M. M.,
Vasavi, C. S., Munusami, P., Sathiyanarayanan, K. I.,
Pathak, M., Synthesis, spectroscopic characterization
and in vitro studies of new heteroleptic copper (II)
complexes derived from 2-hydroxy napthaldehyde
Schiff’s bases and N, N donor ligands: Antimicrobial,
DNA binding and cytotoxic investigations, Inorganica
Chimica Acta 433 (2015) 26-34.
https://doi.org/10.1016/j.ica.2015.04.033.
[18] Mazlan, N. A., Ravoof, T. B. S. A., Tiekink, E. R. T., Tahir, M. I. M., Veerakumarasivam, A., Crouse, K.
A., Mixed-ligand metal complexes containing an ONS
Schiff base and imidazole/benzimidazole ligands:
synthesis, characterization, crystallography and
biological activity, Transition Metal Chemistry 39 (6)
(2014) 633-639. https://doi.org/10.1007/s11243-014-
9842-9.
[19] Naik, K. H. K., Selvaraj, S., Naik, N., Metal
complexes of ONO donor Schiff base ligand as a new
class of bioactive compounds: Synthesis,
characterization and biological evolution, Spectrochimica Acta Part A: Molecular and
Biomolecular Spectroscopy 131 (2014) 599-605.
https://doi.org/10.1016/.j.saa.2014.03.038.
[20] Ali, H. A., Fares, H., Darawsheh, M., Rappocciolo,
E., Akkawi, M., Jaber, S., Synthesis, characterization
and biological activity of new mixed ligand complexes
of Zn(II) naproxen with nitrogen based ligands,
European Journal of Medicinal Chemistry 89 (2015) 67-
76. https://doi.org/10.1016/j.ejmech.2014.10.032.
[21] Ololade, Z. S., Olawore, N. O., Olasoji, S. O.,
Anosike, S. O., Chemical Composition and Bactericidal Activities of the Leaf Essential Oil of Eucalyptus
maculata Hook, Natural Products Chemistry & Research
5 (2) (2017) 257. https://doi.org/10.4172/2329-
6836.1000257.
[22] Pierre, B. K., Pierre, S. H., Tatjana, S., Study of
Polyphenol Content and Antioxidant Capacity of
Myrianthus Arboreus (Cecropiaceae) Root Bark
Extracts, Antioxidants 4 (2) (2015) 410-426.
https://doi.org/10.3390/antiox4020410.
[23] Ikram, M., Rehman, S., Khan, A., Baker, R. J.,
Hofer, T. S., Subhan, F., Qayum, F., Faridoon, M.,
Schulze, C., Sythesis, characterization, antioxidant and selective xanthine oxidase inhibitory studies of
transition metal complexes of novel amino acid bearing
Schiff base ligand, Inorganica Chimica Acta 428 (2015)
117-126. https://doi.org/10.1016/j.ica.2015.01.021.
[24] Adekunle, F. A. O., Semire, B., Odunola, O. A.,
Synthesis, Characterization and Quantum Chemical
Studies of Ru(phen)2Cl2.2H2O and Ru(bipy)2Cl2.2H2O
Original article
43 Eclética Química Journal, vol. 45, n. 1, 2020, 18-43
ISSN: 1678-4618
DOI: 10.26850/1678-4618eqj.v45.1.2020.p18-43
with 2,6- Diacetylpyridinedihydrazone, Synthesis and
Reactivity in Inorganic, Metal-Organic, and Nano-Metal
Chemistry 45 (8) (2015) 210-224.
https://doi.org/10.1080/15533174.2013.862662.
[25] Annaraj, B., Pan, S., Neelakantan, M. A., Chattaraj,
P. K., DFT study on the ground state and excited state
intramolecular proton transfer of propargyl arm
containing Schiff bases in solution and gas Phases,
Computational and Theoretical Chemistry 1028 (2014)
19-26. https://doi.org/10.1016/j.comptc.2013.11.018.
[26] Paul, M. K., Singh, Y. D., Singh, N. B., Sarkar, U.,
Emissive bis-salicylaldiminato Schiff base ligands and
their zinc(II) complexes: Synthesis, photophysical
properties, mesomorphism and DFT studies, Jounal of
Molecular Structure 1081 (2015) 316-328.
https://doi.org/10.1016/j.molstruc.2014.10.031.
[27] Shabbir, M., Akhter, Z., Ahmad, I., Ahmed, S.,
Shafiq, M., Mirza, B., Mckee, V., Munawar, K. S.,
Ashraf, A. R., Schiff base triphenylphoshine
palladium(II) complexes: Synthesis, structural
elucidation, electrochemical and biological evaluation, Journal of Molecular Structure 1118 (2016) 250-258.
https://doi.org/10.1016/j.moistruc.2016.04.003.
[28] Belal, A. A. M., El-Deen, I. M., Farid, N. Y., Rosan,
Z., Refat, M. S., Synthesis, spectroscopic, coordination
and biological activities of some transition metal
complexes containing ONO tridentate Schiff base
ligand, Spectrochimica Acta Part A: Molecular and
Biomolecular Spectroscopy 149 (2015) 771-789.
https://doi.org/10.1016/j.saa.2015.05.005.
[29] Salehi, M., Rahimifar, F., Kubicki, M., Asadi, A.,
Structural, spectrocsopic, electrochemical and antibacterial studies of some new nickel(II) Schiff base
complexes, Inorganica Chimica Acta 443 (2016) 28-35.
https://doi.org/10.1016/j.ica.2015.12.016.
[30] Barauah, J., Borah, G., Kardong, D., Ni(II), Cu(II)
and Pd(II) Complexes of Anisaldehyde-4-phenyl-
thiosemicarbazone: synthesis, spectral characterization
and biological study, Asian Journal of Chemistry 28 (11)
(2016) 2446-2452.
https://doi.org/10.14233/ajchem.2016.20013.
[31] Abo-Aly, M. M., Salem, A. M., Sayed, M. A., Aziz,
A. A. A., Spectroscopic and structural studies of the
Schiff base 3-methoxy-N-salicylidene-o-amino phenol complexes with some transition metal ions and their
antibacterial, antifungal activities, Spectrochimica Acta
Part A: Molecular and Biomolecular Spectroscopy 136
(B) (2015) 993-1000.
https://doi.org/10.1016/j.saa.2014.09.122.
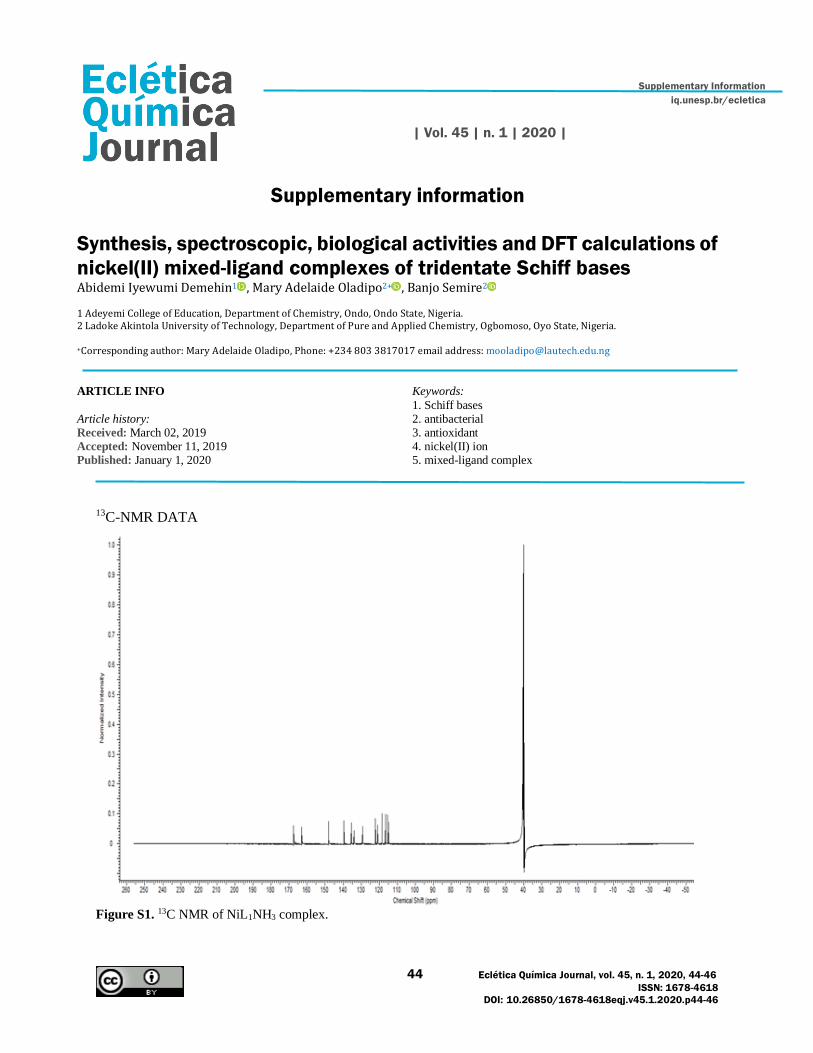
Supplementary Information
iq.unesp.br/ecletica
| Vol. 45 | n. 1 | 2020 |
44 Eclética Química Journal, vol. 45, n. 1, 2020, 44-46
ISSN: 1678-4618
DOI: 10.26850/1678-4618eqj.v45.1.2020.p44-46
Supplementary information
Synthesis, spectroscopic, biological activities and DFT calculations of
nickel(II) mixed-ligand complexes of tridentate Schiff bases Abidemi Iyewumi Demehin1 , Mary Adelaide Oladipo2+ , Banjo Semire2
1 Adeyemi College of Education, Department of Chemistry, Ondo, Ondo State, Nigeria. 2 Ladoke Akintola University of Technology, Department of Pure and Applied Chemistry, Ogbomoso, Oyo State, Nigeria. +Corresponding author: Mary Adelaide Oladipo, Phone: +234 803 3817017 email address: [email protected]
ARTICLE INFO
Article history: Received: March 02, 2019
Accepted: November 11, 2019
Published: January 1, 2020
Keywords:
1. Schiff bases 2. antibacterial 3. antioxidant 4. nickel(II) ion 5. mixed-ligand complex
13C-NMR DATA
Figure S1. 13C NMR of NiL1NH3 complex.
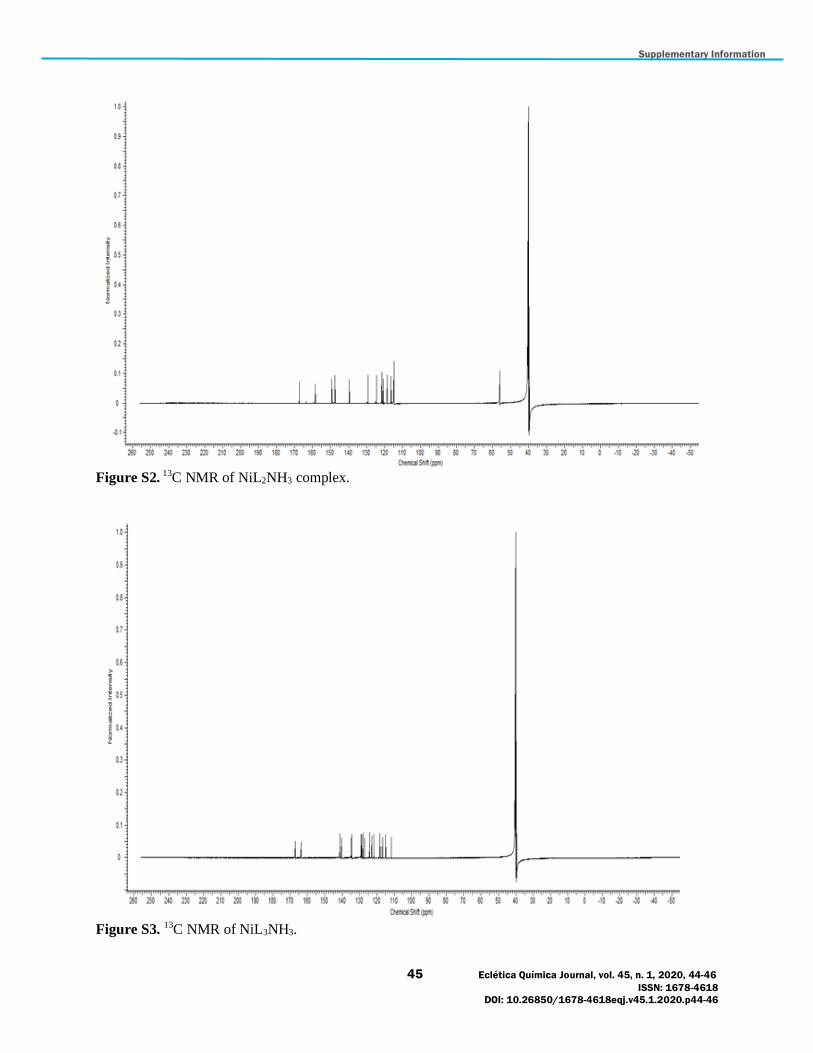
Supplementary Information
45 Eclética Química Journal, vol. 45, n. 1, 2020, 44-46
ISSN: 1678-4618
DOI: 10.26850/1678-4618eqj.v45.1.2020.p44-46
Figure S2. 13C NMR of NiL2NH3 complex.
Figure S3. 13C NMR of NiL3NH3.
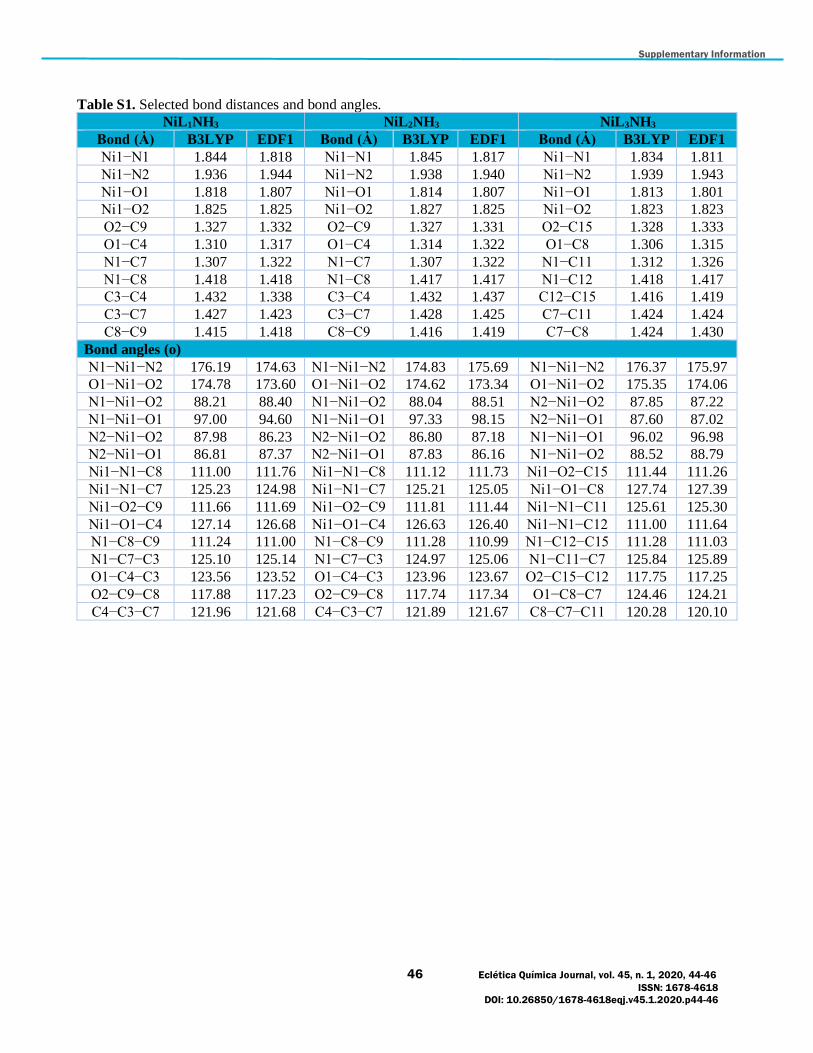
Supplementary Information
46 Eclética Química Journal, vol. 45, n. 1, 2020, 44-46
ISSN: 1678-4618
DOI: 10.26850/1678-4618eqj.v45.1.2020.p44-46
Table S1. Selected bond distances and bond angles.
NiL1NH3 NiL2NH3 NiL3NH3
Bond (Ȧ) B3LYP EDF1 Bond (Ȧ) B3LYP EDF1 Bond (Ȧ) B3LYP EDF1
Ni1−N1 1.844 1.818 Ni1−N1 1.845 1.817 Ni1−N1 1.834 1.811
Ni1−N2 1.936 1.944 Ni1−N2 1.938 1.940 Ni1−N2 1.939 1.943
Ni1−O1 1.818 1.807 Ni1−O1 1.814 1.807 Ni1−O1 1.813 1.801
Ni1−O2 1.825 1.825 Ni1−O2 1.827 1.825 Ni1−O2 1.823 1.823
O2−C9 1.327 1.332 O2−C9 1.327 1.331 O2−C15 1.328 1.333
O1−C4 1.310 1.317 O1−C4 1.314 1.322 O1−C8 1.306 1.315
N1−C7 1.307 1.322 N1−C7 1.307 1.322 N1−C11 1.312 1.326
N1−C8 1.418 1.418 N1−C8 1.417 1.417 N1−C12 1.418 1.417
C3−C4 1.432 1.338 C3−C4 1.432 1.437 C12−C15 1.416 1.419
C3−C7 1.427 1.423 C3−C7 1.428 1.425 C7−C11 1.424 1.424
C8−C9 1.415 1.418 C8−C9 1.416 1.419 C7−C8 1.424 1.430
Bond angles (o)
N1−Ni1−N2 176.19 174.63 N1−Ni1−N2 174.83 175.69 N1−Ni1−N2 176.37 175.97
O1−Ni1−O2 174.78 173.60 O1−Ni1−O2 174.62 173.34 O1−Ni1−O2 175.35 174.06
N1−Ni1−O2 88.21 88.40 N1−Ni1−O2 88.04 88.51 N2−Ni1−O2 87.85 87.22
N1−Ni1−O1 97.00 94.60 N1−Ni1−O1 97.33 98.15 N2−Ni1−O1 87.60 87.02
N2−Ni1−O2 87.98 86.23 N2−Ni1−O2 86.80 87.18 N1−Ni1−O1 96.02 96.98
N2−Ni1−O1 86.81 87.37 N2−Ni1−O1 87.83 86.16 N1−Ni1−O2 88.52 88.79
Ni1−N1−C8 111.00 111.76 Ni1−N1−C8 111.12 111.73 Ni1−O2−C15 111.44 111.26
Ni1−N1−C7 125.23 124.98 Ni1−N1−C7 125.21 125.05 Ni1−O1−C8 127.74 127.39
Ni1−O2−C9 111.66 111.69 Ni1−O2−C9 111.81 111.44 Ni1−N1−C11 125.61 125.30
Ni1−O1−C4 127.14 126.68 Ni1−O1−C4 126.63 126.40 Ni1−N1−C12 111.00 111.64
N1−C8−C9 111.24 111.00 N1−C8−C9 111.28 110.99 N1−C12−C15 111.28 111.03
N1−C7−C3 125.10 125.14 N1−C7−C3 124.97 125.06 N1−C11−C7 125.84 125.89
O1−C4−C3 123.56 123.52 O1−C4−C3 123.96 123.67 O2−C15−C12 117.75 117.25
O2−C9−C8 117.88 117.23 O2−C9−C8 117.74 117.34 O1−C8−C7 124.46 124.21
C4−C3−C7 121.96 121.68 C4−C3−C7 121.89 121.67 C8−C7−C11 120.28 120.10
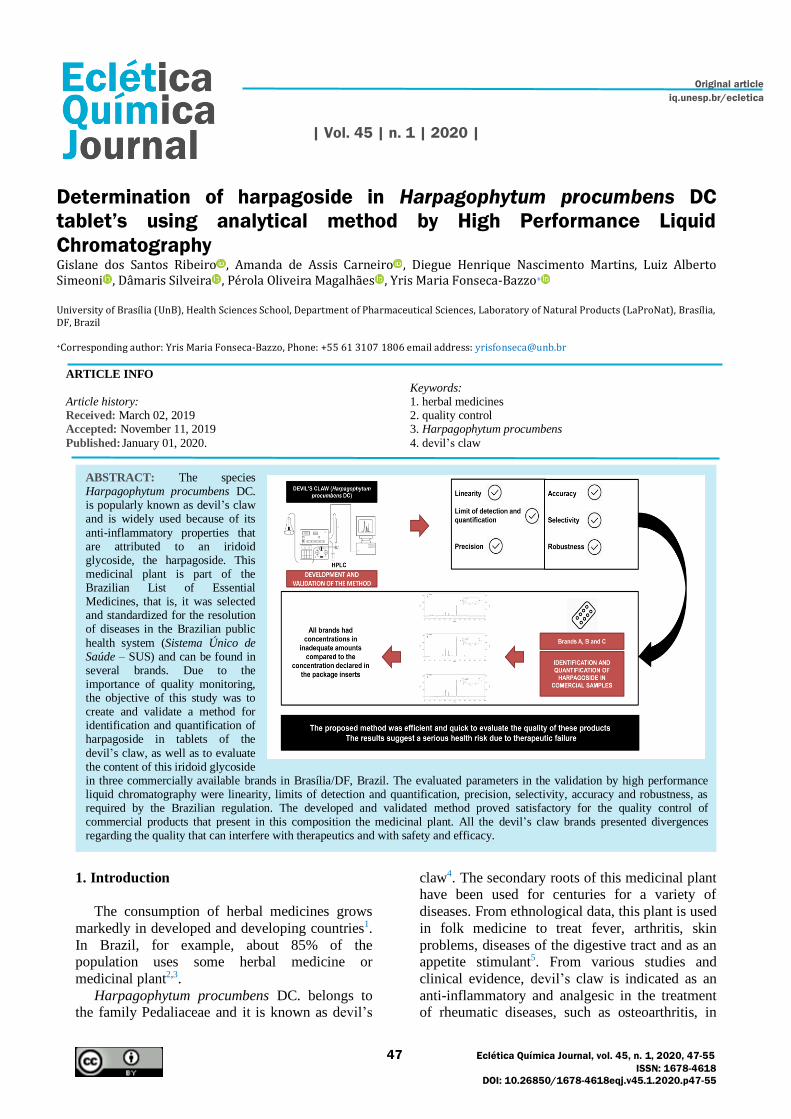
Original article
iq.unesp.br/ecletica
| Vol. 45 | n. 1 | 2020 |
47 Eclética Química Journal, vol. 45, n. 1, 2020, 47-55
ISSN: 1678-4618
DOI: 10.26850/1678-4618eqj.v45.1.2020.p47-55
ABSTRACT: The species Harpagophytum procumbens DC. is popularly known as devil’s claw and is widely used because of its
anti-inflammatory properties that are attributed to an iridoid glycoside, the harpagoside. This medicinal plant is part of the Brazilian List of Essential Medicines, that is, it was selected and standardized for the resolution of diseases in the Brazilian public
health system (Sistema Único de Saúde – SUS) and can be found in several brands. Due to the importance of quality monitoring, the objective of this study was to create and validate a method for identification and quantification of harpagoside in tablets of the
devil’s claw, as well as to evaluate the content of this iridoid glycoside in three commercially available brands in Brasília/DF, Brazil. The evaluated parameters in the validation by high performance liquid chromatography were linearity, limits of detection and quantification, precision, selectivity, accuracy and robustness, as required by the Brazilian regulation. The developed and validated method proved satisfactory for the quality control of commercial products that present in this composition the medicinal plant. All the devil’s claw brands presented divergences regarding the quality that can interfere with therapeutics and with safety and efficacy.
Determination of harpagoside in Harpagophytum procumbens DC
tablet’s using analytical method by High Performance Liquid
Chromatography Gislane dos Santos Ribeiro , Amanda de Assis Carneiro , Diegue Henrique Nascimento Martins, Luiz Alberto Simeoni , Dâmaris Silveira , Pérola Oliveira Magalhães , Yris Maria Fonseca-Bazzo+
University of Brasília (UnB), Health Sciences School, Department of Pharmaceutical Sciences, Laboratory of Natural Products (LaProNat), Brasília, DF, Brazil +Corresponding author: Yris Maria Fonseca-Bazzo, Phone: +55 61 3107 1806 email address: [email protected]
ARTICLE INFO
Article history: Received: March 02, 2019
Accepted: November 11, 2019
Published: January 01, 2020.
Keywords: 1. herbal medicines 2. quality control 3. Harpagophytum procumbens
4. devil’s claw
1. Introduction
The consumption of herbal medicines grows
markedly in developed and developing countries1.
In Brazil, for example, about 85% of the population uses some herbal medicine or
medicinal plant2,3.
Harpagophytum procumbens DC. belongs to the family Pedaliaceae and it is known as devil’s
claw4. The secondary roots of this medicinal plant have been used for centuries for a variety of
diseases. From ethnological data, this plant is used
in folk medicine to treat fever, arthritis, skin
problems, diseases of the digestive tract and as an appetite stimulant5. From various studies and
clinical evidence, devil’s claw is indicated as an
anti-inflammatory and analgesic in the treatment of rheumatic diseases, such as osteoarthritis, in
Original article
48 Eclética Química Journal, vol. 45, n. 1, 2020,47-55
ISSN: 1678-4618
DOI: 10.26850/1678-4618eqj.v45.1.2020.p47-55
addition to alleviating the symptoms of acute low
back pain, myalgias and other osteoarticular and muscular pathologies5,6.
The harpagoside is an iridoid glycoside
considered to be responsible for the
pharmacological activity of H. procumbens DC. This compound is considered the chemical marker
of this species. Therefore, it is used as a control to
standardize commercial products7. Some factors can compromise the quality of
herbal products from the cultivation of the raw
material to the final product, such as
contamination, the presence of foreign materials, botanical identification errors, among others.
These factors result from the lack of care in the
collection and identification of the species. Also, adulterations are common to increase the yield of
the product. All these factors affect the quality,
safety and efficacy of herbal medicines and emphasize the importance of quality control from
the cultivation of the raw material to the finished
product, as well as phytochemical,
pharmacological and toxicological studies8,9. Chromatographic and analytical techniques are
used in recognition of the chemical composition,
including active principle or toxic compound. These techniques allow the separation and
isolation of the substances thus allowing both
qualitative and quantitative control of the compounds considered marker of the species.
High performance liquid chromatography (HPLC)
is one of those techniques widely used for the
complete characterization of plant and herbal products, being an important tool in the control of
the quality of these products9,10.
Pharmacopoeias and monographs are relevant to establish quality standards in addition to
standardizing and systematizing knowledge of
medicinal plants. These tools present
characteristics and properties of plants such as macroscopic and microscopic description, general
aspects of the vegetal drug besides identification,
purity and assay tests that help in the quality control11.
Pharmacopeial methods (for example, in the
Brazilian Pharmacopoeia) for the quality control of the plant drug Harpagophytum procumbens
(meaning dried roots of devil’s claw) are
available. However, there isn’t specific
monograph for herbal medicines/dosage forms containing it12. In the Brazilian Pharmacopeia the
described method uses flow rate 1.5 mL in an
isocratic system with water and methanol (50:50).
In addition, the method refers to the dosage in
plant drug and not to the finished product12. According to the Brazilian regulatory agency
(Agência Nacional de Vigilância Sanitária –
Anvisa) when a monograph contemplates only
analytical method for identification and quantification of markers for the vegetal drug, it is
necessary to make adaptations and validate the
method for the finished product13. In the literature there are other published
methods for harpagoside determination using
isocratic or gradient elution with flow rate above
1 mL min-1 and analysis time around 60 min14,15. The proposed method utilizes a flow rate of
0.6 mL min-1 with gradient mode over 30 min of
analysis. A quick method with greater solvent savings.
Therefore, this study aimed to develop and
validate an analytical method using HPLC to contribute to the establishment of quality
parameters for the finished product of this widely
used medicinal plant, as well as to identify and
quantify the harpagoside in commercial samples.
2. Materials and methods
2.1 Standard, samples and reagents
Harpagoside, considered chemical marker of the species and used for standardization of
commercial products, was provided by Sigma-
Aldrich. Three different brands of devil’s claw
tablets were obtained from pharmacies in Brasília, Brazil, named as brand A, B and C. About the
concentration of dry extract of the roots of H.
procumbens, the brands A, B, and C presented, respectively, 200, 400 and 450 mg. Regarding the
total iridoid equivalents calculated as harpagoside,
each tablet of the A, B and C brands had declared
10, 20 and 18 mg, respectively. The solvents (HPLC grade) used in the assay were phosphoric
acid (Sigma), acetonitrile (Tedia) and methanol
(Tedia). The mobile phase was prepared with purified water produced in the Milli-Q system
(Millipore).
2.2 Sample and standard preparation
Twenty tablets of each brand were macerated
using mortar and pestle. A portion equivalent to 40 mg of dry extract of the roots of H.
procumbens was weighed, solubilized in methanol
and prepared at the concentration of 4 mg mL-1
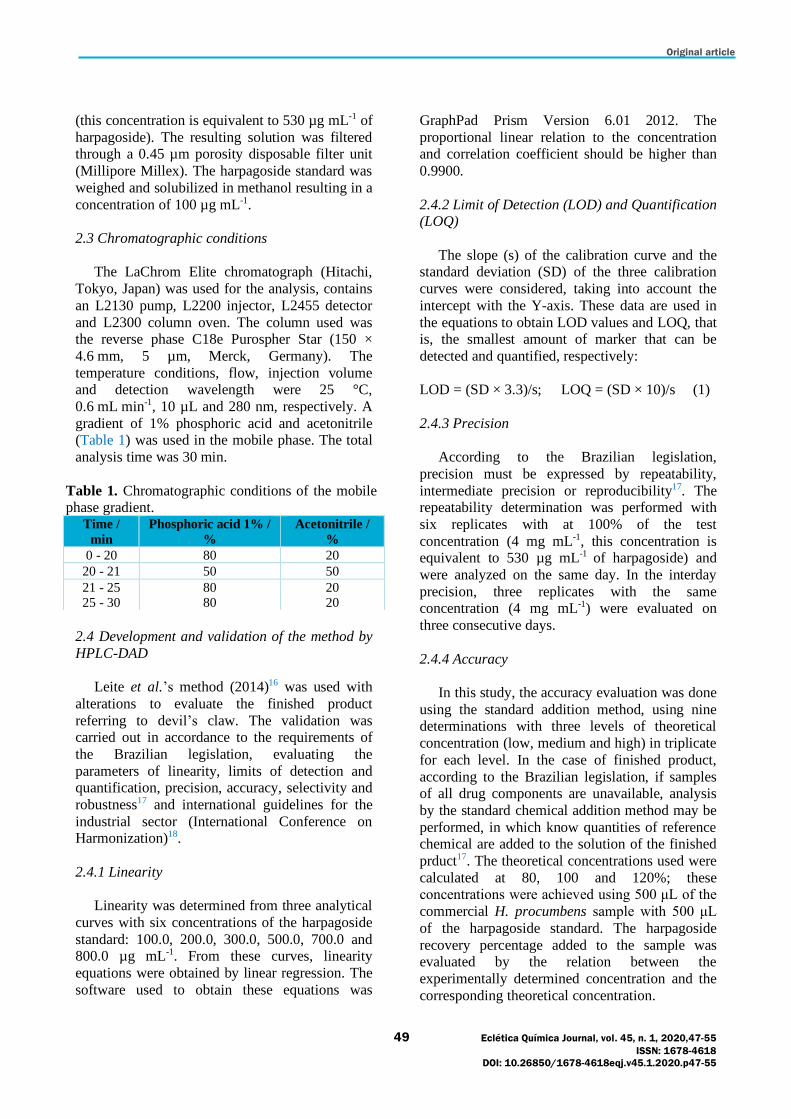
Original article
49 Eclética Química Journal, vol. 45, n. 1, 2020,47-55
ISSN: 1678-4618
DOI: 10.26850/1678-4618eqj.v45.1.2020.p47-55
(this concentration is equivalent to 530 µg mL-1 of
harpagoside). The resulting solution was filtered through a 0.45 µm porosity disposable filter unit
(Millipore Millex). The harpagoside standard was
weighed and solubilized in methanol resulting in a
concentration of 100 µg mL-1.
2.3 Chromatographic conditions
The LaChrom Elite chromatograph (Hitachi,
Tokyo, Japan) was used for the analysis, contains
an L2130 pump, L2200 injector, L2455 detector
and L2300 column oven. The column used was the reverse phase C18e Purospher Star (150 ×
4.6 mm, 5 µm, Merck, Germany). The
temperature conditions, flow, injection volume and detection wavelength were 25 °C,
0.6 mL min-1, 10 µL and 280 nm, respectively. A
gradient of 1% phosphoric acid and acetonitrile (Table 1) was used in the mobile phase. The total
analysis time was 30 min.
Table 1. Chromatographic conditions of the mobile phase gradient.
2.4 Development and validation of the method by
HPLC-DAD
Leite et al.’s method (2014)16 was used with
alterations to evaluate the finished product
referring to devil’s claw. The validation was carried out in accordance to the requirements of
the Brazilian legislation, evaluating the
parameters of linearity, limits of detection and quantification, precision, accuracy, selectivity and
robustness17 and international guidelines for the
industrial sector (International Conference on Harmonization)18.
2.4.1 Linearity
Linearity was determined from three analytical
curves with six concentrations of the harpagoside
standard: 100.0, 200.0, 300.0, 500.0, 700.0 and 800.0 µg mL-1. From these curves, linearity
equations were obtained by linear regression. The
software used to obtain these equations was
GraphPad Prism Version 6.01 2012. The
proportional linear relation to the concentration and correlation coefficient should be higher than
0.9900.
2.4.2 Limit of Detection (LOD) and Quantification (LOQ)
The slope (s) of the calibration curve and the standard deviation (SD) of the three calibration
curves were considered, taking into account the
intercept with the Y-axis. These data are used in
the equations to obtain LOD values and LOQ, that is, the smallest amount of marker that can be
detected and quantified, respectively:
LOD = (SD × 3.3)/s; LOQ = (SD × 10)/s (1)
2.4.3 Precision
According to the Brazilian legislation,
precision must be expressed by repeatability,
intermediate precision or reproducibility17. The repeatability determination was performed with
six replicates with at 100% of the test
concentration (4 mg mL-1, this concentration is equivalent to 530 µg mL-1 of harpagoside) and
were analyzed on the same day. In the interday
precision, three replicates with the same concentration (4 mg mL-1) were evaluated on
three consecutive days.
2.4.4 Accuracy
In this study, the accuracy evaluation was done
using the standard addition method, using nine determinations with three levels of theoretical
concentration (low, medium and high) in triplicate
for each level. In the case of finished product,
according to the Brazilian legislation, if samples of all drug components are unavailable, analysis
by the standard chemical addition method may be
performed, in which know quantities of reference chemical are added to the solution of the finished
prduct17. The theoretical concentrations used were
calculated at 80, 100 and 120%; these concentrations were achieved using 500 μL of the
commercial H. procumbens sample with 500 μL
of the harpagoside standard. The harpagoside
recovery percentage added to the sample was evaluated by the relation between the
experimentally determined concentration and the
corresponding theoretical concentration.
Time /
min
Phosphoric acid 1% /
%
Acetonitrile /
%
0 - 20 80 20
20 - 21 50 50
21 - 25
25 - 30
80 80
20 20
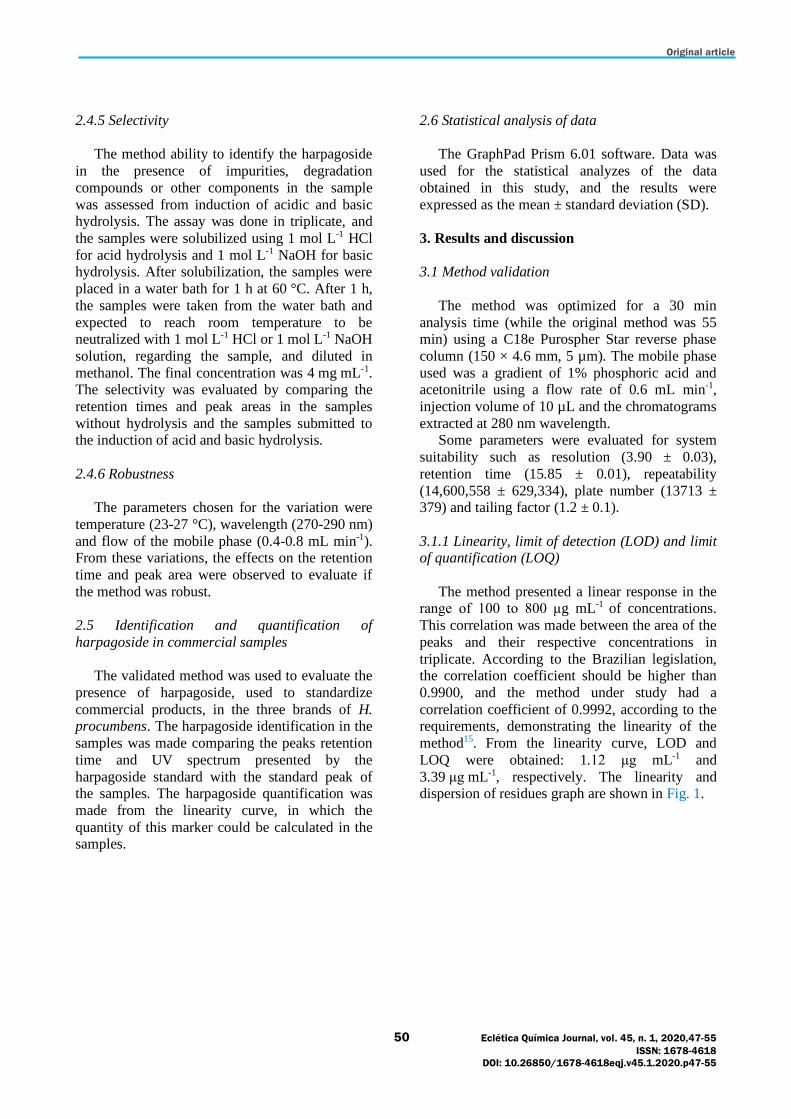
Original article
50 Eclética Química Journal, vol. 45, n. 1, 2020,47-55
ISSN: 1678-4618
DOI: 10.26850/1678-4618eqj.v45.1.2020.p47-55
2.4.5 Selectivity
The method ability to identify the harpagoside
in the presence of impurities, degradation
compounds or other components in the sample
was assessed from induction of acidic and basic hydrolysis. The assay was done in triplicate, and
the samples were solubilized using 1 mol L-1 HCl
for acid hydrolysis and 1 mol L-1 NaOH for basic hydrolysis. After solubilization, the samples were
placed in a water bath for 1 h at 60 °C. After 1 h,
the samples were taken from the water bath and
expected to reach room temperature to be neutralized with 1 mol L-1 HCl or 1 mol L-1 NaOH
solution, regarding the sample, and diluted in
methanol. The final concentration was 4 mg mL-
1. The selectivity was evaluated by comparing the
retention times and peak areas in the samples
without hydrolysis and the samples submitted to the induction of acid and basic hydrolysis.
2.4.6 Robustness
The parameters chosen for the variation were
temperature (23-27 °C), wavelength (270-290 nm)
and flow of the mobile phase (0.4-0.8 mL min-1). From these variations, the effects on the retention
time and peak area were observed to evaluate if
the method was robust.
2.5 Identification and quantification of
harpagoside in commercial samples
The validated method was used to evaluate the
presence of harpagoside, used to standardize
commercial products, in the three brands of H. procumbens. The harpagoside identification in the
samples was made comparing the peaks retention
time and UV spectrum presented by the
harpagoside standard with the standard peak of the samples. The harpagoside quantification was
made from the linearity curve, in which the
quantity of this marker could be calculated in the samples.
2.6 Statistical analysis of data
The GraphPad Prism 6.01 software. Data was
used for the statistical analyzes of the data
obtained in this study, and the results were
expressed as the mean ± standard deviation (SD).
3. Results and discussion
3.1 Method validation
The method was optimized for a 30 min
analysis time (while the original method was 55 min) using a C18e Purospher Star reverse phase
column (150 × 4.6 mm, 5 µm). The mobile phase
used was a gradient of 1% phosphoric acid and acetonitrile using a flow rate of 0.6 mL min-1,
injection volume of 10 µL and the chromatograms
extracted at 280 nm wavelength. Some parameters were evaluated for system
suitability such as resolution (3.90 ± 0.03),
retention time (15.85 ± 0.01), repeatability
(14,600,558 ± 629,334), plate number (13713 ± 379) and tailing factor (1.2 ± 0.1).
3.1.1 Linearity, limit of detection (LOD) and limit of quantification (LOQ)
The method presented a linear response in the range of 100 to 800 μg mL-1 of concentrations.
This correlation was made between the area of the
peaks and their respective concentrations in
triplicate. According to the Brazilian legislation, the correlation coefficient should be higher than
0.9900, and the method under study had a
correlation coefficient of 0.9992, according to the requirements, demonstrating the linearity of the
method15. From the linearity curve, LOD and
LOQ were obtained: 1.12 μg mL-1 and
3.39 μg mL-1, respectively. The linearity and dispersion of residues graph are shown in Fig. 1.
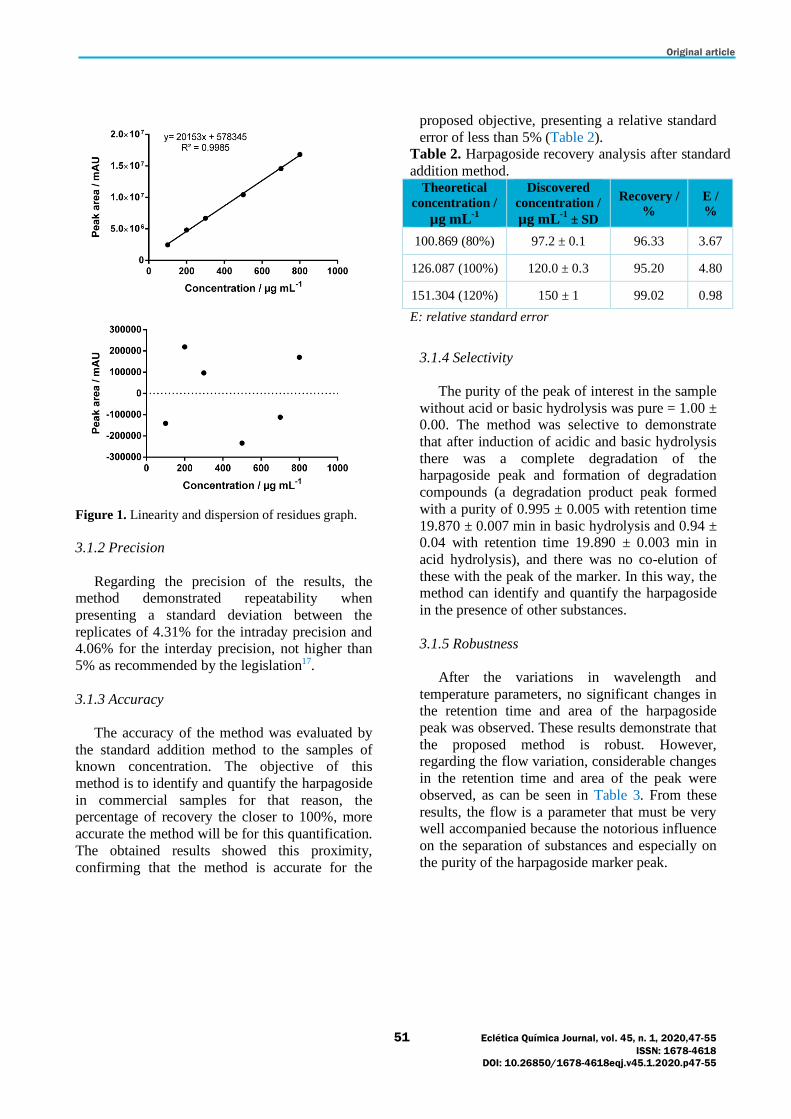
Original article
51 Eclética Química Journal, vol. 45, n. 1, 2020,47-55
ISSN: 1678-4618
DOI: 10.26850/1678-4618eqj.v45.1.2020.p47-55
Figure 1. Linearity and dispersion of residues graph.
3.1.2 Precision
Regarding the precision of the results, the method demonstrated repeatability when
presenting a standard deviation between the
replicates of 4.31% for the intraday precision and 4.06% for the interday precision, not higher than
5% as recommended by the legislation17.
3.1.3 Accuracy
The accuracy of the method was evaluated by
the standard addition method to the samples of known concentration. The objective of this
method is to identify and quantify the harpagoside
in commercial samples for that reason, the percentage of recovery the closer to 100%, more
accurate the method will be for this quantification.
The obtained results showed this proximity,
confirming that the method is accurate for the
proposed objective, presenting a relative standard
error of less than 5% (Table 2). Table 2. Harpagoside recovery analysis after standard
addition method. Theoretical
concentration /
µg mL-1
Discovered
concentration /
µg mL-1
± SD
Recovery /
%
E /
%
100.869 (80%) 97.2 ± 0.1 96.33 3.67
126.087 (100%) 120.0 ± 0.3 95.20 4.80
151.304 (120%) 150 ± 1 99.02 0.98
E: relative standard error
3.1.4 Selectivity
The purity of the peak of interest in the sample
without acid or basic hydrolysis was pure = 1.00 ± 0.00. The method was selective to demonstrate
that after induction of acidic and basic hydrolysis
there was a complete degradation of the harpagoside peak and formation of degradation
compounds (a degradation product peak formed
with a purity of 0.995 ± 0.005 with retention time
19.870 ± 0.007 min in basic hydrolysis and 0.94 ± 0.04 with retention time 19.890 ± 0.003 min in
acid hydrolysis), and there was no co-elution of
these with the peak of the marker. In this way, the method can identify and quantify the harpagoside
in the presence of other substances.
3.1.5 Robustness
After the variations in wavelength and
temperature parameters, no significant changes in the retention time and area of the harpagoside
peak was observed. These results demonstrate that
the proposed method is robust. However, regarding the flow variation, considerable changes
in the retention time and area of the peak were
observed, as can be seen in Table 3. From these
results, the flow is a parameter that must be very well accompanied because the notorious influence
on the separation of substances and especially on
the purity of the harpagoside marker peak.
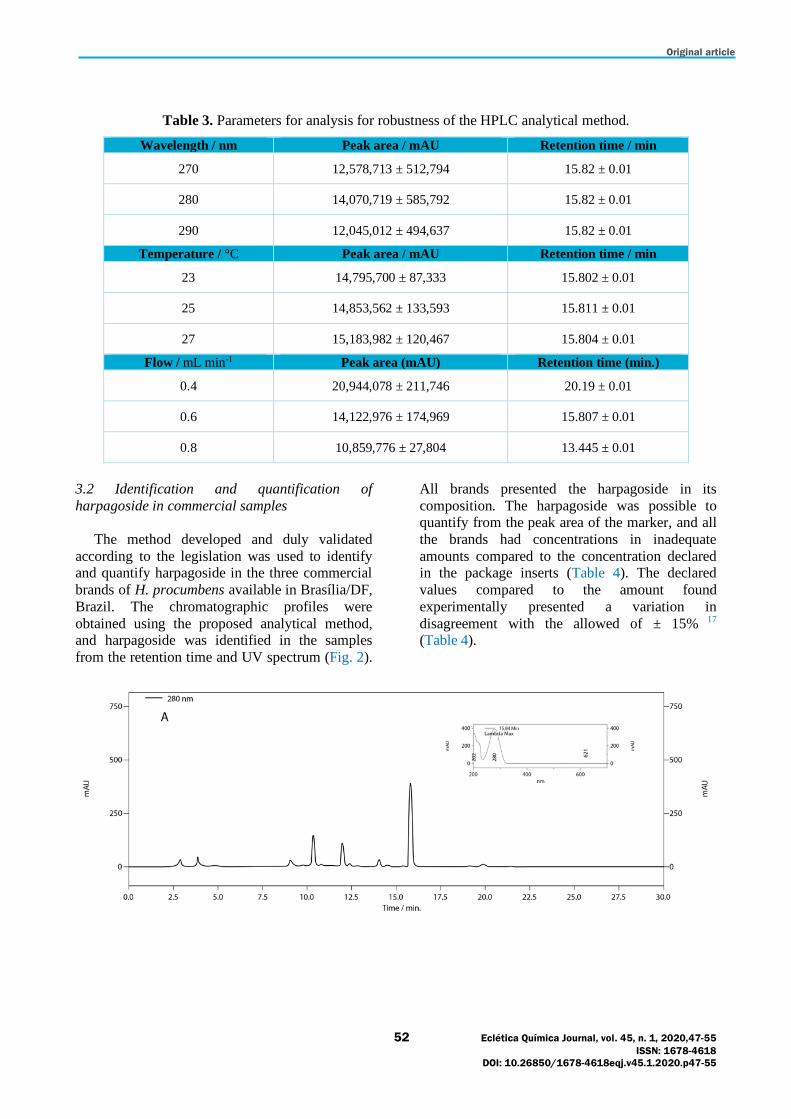
Original article
52 Eclética Química Journal, vol. 45, n. 1, 2020,47-55
ISSN: 1678-4618
DOI: 10.26850/1678-4618eqj.v45.1.2020.p47-55
Table 3. Parameters for analysis for robustness of the HPLC analytical method.
Wavelength / nm Peak area / mAU Retention time / min
270 12,578,713 ± 512,794 15.82 ± 0.01
280 14,070,719 ± 585,792 15.82 ± 0.01
290 12,045,012 ± 494,637 15.82 ± 0.01
Temperature / °C Peak area / mAU Retention time / min
23 14,795,700 ± 87,333 15.802 ± 0.01
25 14,853,562 ± 133,593 15.811 ± 0.01
27 15,183,982 ± 120,467 15.804 ± 0.01
Flow / mL min-1 Peak area (mAU) Retention time (min.)
0.4 20,944,078 ± 211,746 20.19 ± 0.01
0.6 14,122,976 ± 174,969 15.807 ± 0.01
0.8 10,859,776 ± 27,804 13.445 ± 0.01
3.2 Identification and quantification of
harpagoside in commercial samples
The method developed and duly validated
according to the legislation was used to identify and quantify harpagoside in the three commercial
brands of H. procumbens available in Brasília/DF,
Brazil. The chromatographic profiles were
obtained using the proposed analytical method, and harpagoside was identified in the samples
from the retention time and UV spectrum (Fig. 2).
All brands presented the harpagoside in its
composition. The harpagoside was possible to quantify from the peak area of the marker, and all
the brands had concentrations in inadequate
amounts compared to the concentration declared in the package inserts (Table 4). The declared
values compared to the amount found
experimentally presented a variation in
disagreement with the allowed of ± 15% 17
(Table 4).
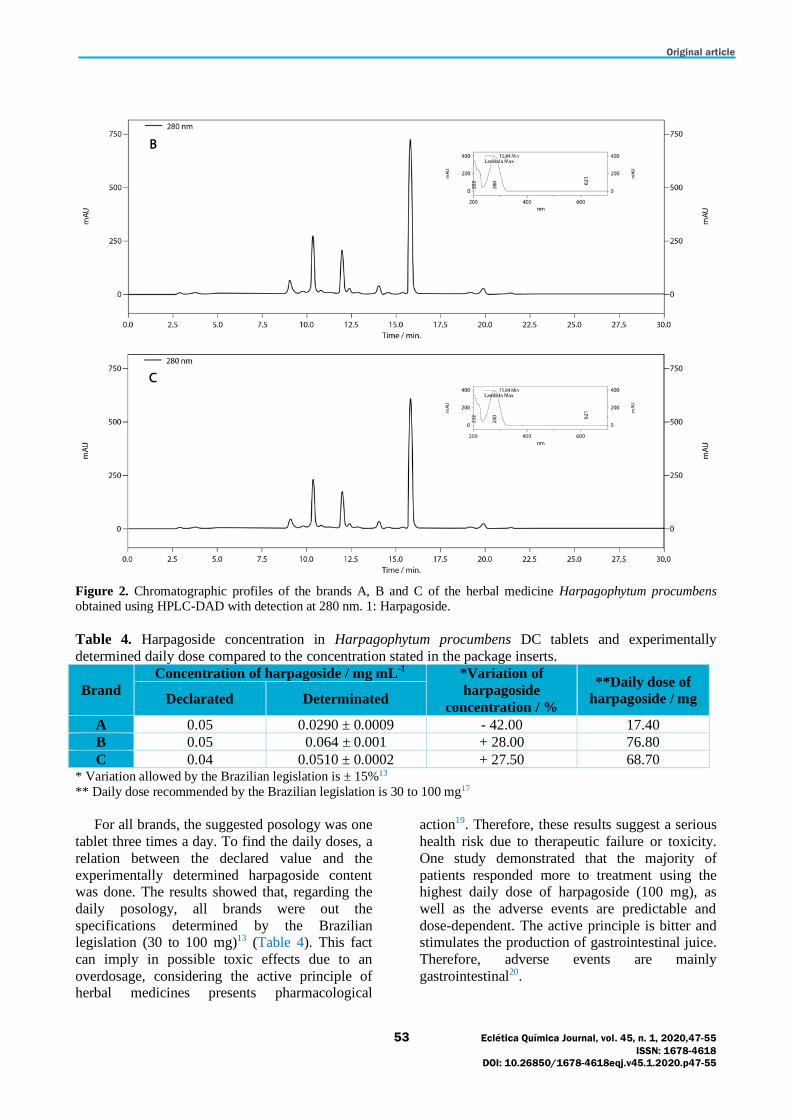
Original article
53 Eclética Química Journal, vol. 45, n. 1, 2020,47-55
ISSN: 1678-4618
DOI: 10.26850/1678-4618eqj.v45.1.2020.p47-55
Figure 2. Chromatographic profiles of the brands A, B and C of the herbal medicine Harpagophytum procumbens obtained using HPLC-DAD with detection at 280 nm. 1: Harpagoside.
Table 4. Harpagoside concentration in Harpagophytum procumbens DC tablets and experimentally
determined daily dose compared to the concentration stated in the package inserts.
Brand
Concentration of harpagoside / mg mL-1 *Variation of
harpagoside
concentration / %
**Daily dose of
harpagoside / mg Declarated Determinated
A 0.05 0.0290 ± 0.0009 - 42.00 17.40
B 0.05 0.064 ± 0.001 + 28.00 76.80
C 0.04 0.0510 ± 0.0002 + 27.50 68.70 * Variation allowed by the Brazilian legislation is ± 15%13
** Daily dose recommended by the Brazilian legislation is 30 to 100 mg17
For all brands, the suggested posology was one
tablet three times a day. To find the daily doses, a
relation between the declared value and the
experimentally determined harpagoside content was done. The results showed that, regarding the
daily posology, all brands were out the
specifications determined by the Brazilian legislation (30 to 100 mg)13 (Table 4). This fact
can imply in possible toxic effects due to an
overdosage, considering the active principle of herbal medicines presents pharmacological
action19. Therefore, these results suggest a serious
health risk due to therapeutic failure or toxicity.
One study demonstrated that the majority of
patients responded more to treatment using the highest daily dose of harpagoside (100 mg), as
well as the adverse events are predictable and
dose-dependent. The active principle is bitter and stimulates the production of gastrointestinal juice.
Therefore, adverse events are mainly
gastrointestinal20.
Original article
54 Eclética Química Journal, vol. 45, n. 1, 2020,47-55
ISSN: 1678-4618
DOI: 10.26850/1678-4618eqj.v45.1.2020.p47-55
4. Conclusion
The proposed method in this study for the
identification and quantification of harpagoside in
the herbal medicine devil’s claw was efficient and
quick to evaluate the quality of these products to ensure authenticity, credibility, safety and
therapeutic efficacy. The obtained results
emphasize the importance of quality control since we observed, in all three medicinal products,
significant variations in the quantity of
harpagoside in comparison to the value declared
in the registry of these products.
5. Acknowledgments
The authors greatly acknowledge Research
program for the SUS: shared management in
health PPSUS - FAP/DF/SESDF/MS/CNPQ (Grant number 193.000.860/2014), National
Council for Scientific and Technological
Development (CNPq), Foundation for Research
Support of the Federal District (FAPDF), Coordination of Improvement of Higher
Education Personnel (CAPES) and University of
Brasília (DPP/UnB) for the financial support to carry out this research.
6. References
[1] Terra-Junior, O. N., Maldonado, J. V., Arnobio, A.,
Estudo do desempenho comercial dos insumos
farmacêuticos vegetais sob a ótica do Comércio
Exterior, Revista Fitos 9 (3) (2015) 233-246. https://www.arca.fiocruz.br/handle/icict/19237.
[2] Brasil, Ministério da Saúde. Política Nacional de
Plantas Medicinais e Fitoterápicos, Brasília: Ministério
da Saúde (2006).
http://bvsms.saude.gov.br/bvs/publicacoes/politica_nac
ional_fitoterapicos.pdf.
[3] Moura, M. G., Lopes, L. C., Biavatti, M. W., Busse,
J. W., Wang, L., Kennedy, S. A., Bhatnaga, N.,
Bergamaschi, C. C., Brazilian oral herbal medication of
osteoarthritis: a systematic review protocol, Systematic
Reviews 5 (86) (2016) 1-7.
https://doi.org/10.1186/s13643-016-0261-1.
[4] Tropicos. Missouri Botanical Garden,
Harpagophytum procumbens, Tropicos (2017).
http://www.tropicos.org/Name/24300038.
[5] Grant, L., McBean, D. E., Fyfe, L., Warnock, A.
M., A review of the biological and potencial
therapeutic actions of Harpagophytum procumbens,
Phytotherapy Research 21 (3) (2007) 199-209.
https://doi.org/10.1002/ptr.2029.
[6] Mncwangi, N., Chen, W., Vermaak, I., Viljoen, A.
M., Gericke, N., Devil’s Claw - A review of the
ethnobotany, phytochemistry and biological activity of
Harpagophytum procumbens, Journal of
Ethnopharmacology 143 (3) (2012) 755-771. https://doi.org/10.1016/j.jep.2012.08.013.
[7] Georgiev, M. I., Ivanovska, N., Alipieva, K.,
Dimitrova, P., Verpoorte, R., Harpagoside: from
Kalahari Desert to pharmacy shelf, Phytochemistry 92
(2013) 8-15.
https://doi.org/10.1016/j.phytochem.2013.04.009.
[8] Oliveira, E. M. A., Maywald, P. G., Rosa, G. A. A.,
Distribuição de plantas medicinais e fitoterápicos
através do SUS, E-RAC 3 (1) (2013) 3-19.
http://www.computacao.unitri.edu.br/erac/index.php/e-
rac/article/view/141.
[9] Souza-Moreira, T. M., Salgado, H. R. N., Pietro, R.
C. L. R., O Brasil no contexto de controle de qualidade
e plantas medicinais, Revista Brasileira de
Farmacognosia 20 (3) (2008) 435-440.
https://doi.org/10.1590/S0102-695X2010000300023.
[10] Tistaert, C., Dejaegher, B., Heyden, Y. V.,
Chromatographic separation techniques and data
handling methods for herbal fingerprints: A review,
Analytica Chimica Acta 690 (2) (2011) 148-161.
https://doi.org/10.1016/j.aca.2011.02.023.
[11] Veiga Junior, V. F., Mello, J. C. P., As monografias sobre plantas medicinais, Revista
Brasileira de Farmacognosia 18 (3) (2008) 464-471.
https://doi.org/10.1590/S0102-695X2008000300022.
[12] Brasil, Agência Nacional de Vigilância Sanitária,
Farmacopeia Brasileira, Brasília: Agência Nacional de
Vigilância Sanitária 5 (Suppl. 2) (2017) 1-1016.
http://portal.anvisa.gov.br/documents/33832/259143/Se
gundo+Suplemento+FB+5/9cfb1239-875c-4a77-8741-
b59416684d29.
[13] Brasil, Agência Nacional de Vigilância Sanitária,
Instrução normativa nº 4, de 18 de junho de 2014,
Determina a publicação do Guia de orientação para registro de medicamento fitoterápico e registro e
notificação de produto tradicional fitoterápico, Diário
Oficial da União (2014).
http://portal.anvisa.gov.br/documents/33836/2501251/
Guia%2Bfinal%2Bdicol%2B180614+%282%29.pdf/f4
00c535-e803-4911-9ef8-100c0c2bb3c6.

Original article
55 Eclética Química Journal, vol. 45, n. 1, 2020,47-55
ISSN: 1678-4618
DOI: 10.26850/1678-4618eqj.v45.1.2020.p47-55
[14] Nalluri, B. N., Kumar, S., Characterization and
estimation of harpagoside in dried root extract and oral
powder formulations of Harpagophytum procumbens
by validated RP-HPLC-PDA Method, Journal of Drug
Delivery and Therapeutics 9 (2) (2019) 38-46.
http://jddtonline.info/index.php/jddt/article/view/2459/
1788.
[15] Avato, P., Argentieri, M. P., Quality Assessment
of Comercial Spagyric Tinctures of Harpagophytum
procumbens and Their antioxidant properties, Molecules, 24 (12) (2019) 2-15.
https://doi.org/10.3390/molecules24122251.
[16] Leite, C. F. M., Leite, B. H. M., Barros, I. M. C.,
Gomes, S. M., Fagg, C. W., Simeoni, L. A., Silveira,
D., Fonseca, Y. M., Determination of rutin in
Erythroxylum suberosum extract by liquid
chromatography: applicability instandardization of
herbs and stability studies, Boletín Latinoamericano y
del Caribe de Plantas Medicinales y Aromáticas 13 (2)
(2014) 135-143.
[17] Brasil, Agência Nacional de Vigilância Sanitária. Resolução da Diretoria Colegiada nº 166, de 24 de
julho de 2017, Dispõe sobre a validação de métodos
analíticos e dá outras providências, Diário Oficial da
União (2017). http://www.in.gov.br/materia/-
/asset_publisher/Kujrw0TZC2Mb/content/id/19194581
/do1-2017-07-25-resolucao-rdc-n-166-de-24-de-julho-
de-2017-19194412.
[18] European Medicines Agency. ICH Topic Q2B;
Note for guidelines on Validation of Analytical
Procedures: Text and Methodology, European
Medicines Agency (1995). https://www.ema.europa.eu/en/documents/scientific-
guideline/ich-q-2-r1-validation-analytical-procedures-
text-methodology-step-5_en.pdf.
[19] Bettega, P. V. C., Czlusniak, G. R., Piva, R.,
Namba, E. L., Ribas, C. R., Grégio, A. M. T., Rosa, E.
A. R., Fitoterapia: dos canteiros ao balcão da farmácia,
Archives of Oral Research 7 (1) (2011) 89-97.
https://periodicos.pucpr.br/index.php/oralresearch/articl
e/view/23149/22243.
[20] Vlachojannis, J., Roufogalis, B. D., Chrubasik, S.,
Systematic review on the safety of Harpagophytum
preparations for osteoarthritic and low back pain, Phytotherapy Research 22 (2) (2008) 149-152.
https://doi.org/10.1002/ptr.2314.
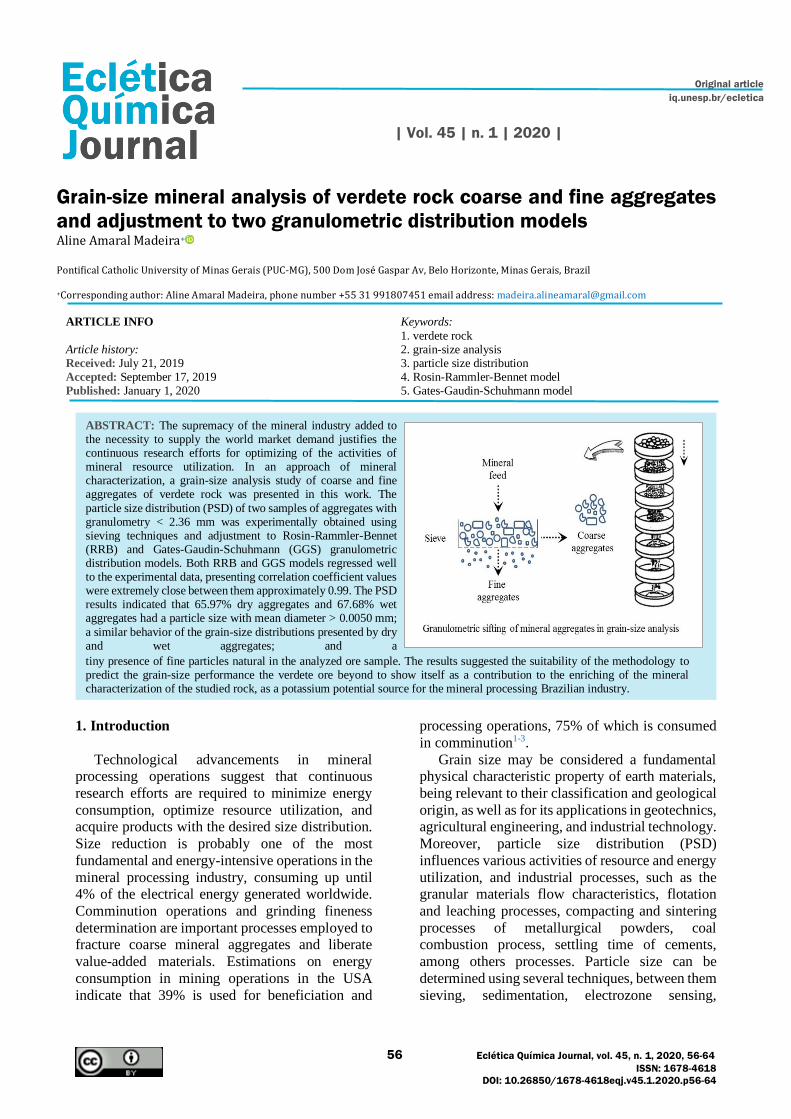
Original article
iq.unesp.br/ecletica
| Vol. 45 | n. 1 | 2020 |
56 Eclética Química Journal, vol. 45, n. 1, 2020, 56-64
ISSN: 1678-4618
DOI: 10.26850/1678-4618eqj.v45.1.2020.p56-64
Grain-size mineral analysis of verdete rock coarse and fine aggregates
and adjustment to two granulometric distribution models Aline Amaral Madeira+
Pontifical Catholic University of Minas Gerais (PUC-MG), 500 Dom José Gaspar Av, Belo Horizonte, Minas Gerais, Brazil +Corresponding author: Aline Amaral Madeira, phone number +55 31 991807451 email address: [email protected]
ARTICLE INFO
Article history: Received: July 21, 2019
Accepted: September 17, 2019
Published: January 1, 2020
Keywords:
1. verdete rock 2. grain-size analysis 3. particle size distribution 4. Rosin-Rammler-Bennet model 5. Gates-Gaudin-Schuhmann model
1. Introduction
Technological advancements in mineral processing operations suggest that continuous
research efforts are required to minimize energy
consumption, optimize resource utilization, and acquire products with the desired size distribution.
Size reduction is probably one of the most
fundamental and energy-intensive operations in the
mineral processing industry, consuming up until 4% of the electrical energy generated worldwide.
Comminution operations and grinding fineness
determination are important processes employed to fracture coarse mineral aggregates and liberate
value-added materials. Estimations on energy
consumption in mining operations in the USA
indicate that 39% is used for beneficiation and
processing operations, 75% of which is consumed
in comminution1-3.
Grain size may be considered a fundamental physical characteristic property of earth materials,
being relevant to their classification and geological
origin, as well as for its applications in geotechnics, agricultural engineering, and industrial technology.
Moreover, particle size distribution (PSD)
influences various activities of resource and energy
utilization, and industrial processes, such as the granular materials flow characteristics, flotation
and leaching processes, compacting and sintering
processes of metallurgical powders, coal combustion process, settling time of cements,
among others processes. Particle size can be
determined using several techniques, between them
sieving, sedimentation, electrozone sensing,
ABSTRACT: The supremacy of the mineral industry added to the necessity to supply the world market demand justifies the continuous research efforts for optimizing of the activities of mineral resource utilization. In an approach of mineral characterization, a grain-size analysis study of coarse and fine aggregates of verdete rock was presented in this work. The
particle size distribution (PSD) of two samples of aggregates with granulometry < 2.36 mm was experimentally obtained using sieving techniques and adjustment to Rosin-Rammler-Bennet (RRB) and Gates-Gaudin-Schuhmann (GGS) granulometric distribution models. Both RRB and GGS models regressed well to the experimental data, presenting correlation coefficient values were extremely close between them approximately 0.99. The PSD results indicated that 65.97% dry aggregates and 67.68% wet aggregates had a particle size with mean diameter > 0.0050 mm;
a similar behavior of the grain-size distributions presented by dry and wet aggregates; and a
tiny presence of fine particles natural in the analyzed ore sample. The results suggested the suitability of the methodology to predict the grain-size performance the verdete ore beyond to show itself as a contribution to the enriching of the mineral characterization of the studied rock, as a potassium potential source for the mineral processing Brazilian industry.

Original article
57 Eclética Química Journal, vol. 45, n. 1, 2020, 56-64
ISSN: 1678-4618
DOI: 10.26850/1678-4618eqj.v45.1.2020.p56-64
microscopy techniques, X-ray attenuation, and
laser diffraction4. Several models and expressions have been
developed to describe the PSD of particulate
materials3. These models ranging from the normal
and log-normal distributions to the Rosin-Rammler-Bennet (RRB) and Gates-Gaudin-
Schuhmann (GGS) models. RRB equation is
probably the most well-known distribution in the chemical industries, widely used to analyze all
types of materials and GGS equation is another
uncomplicated popular model used in the metallic
ferrous mining industry5. RRB and GGS mathematical models have been widely applied to
describe the size distribution of several particles
types, such as maize grains2; fenugreek seed5; sorghum bagasse6; copper tailing7; babassu, canola,
castor seed and sunflower residual cakes8; particle
assemblages9, and several ores, such as quartz and marble3; iron10; uranium11; phosphate12; apatite13;
chromite14; among others. Other numerous
granulometric distribution models have also been
proposed for greater accuracy in estimating the PSDs, but they have limit applications due to their
greater mathematical complexity1.
In Brazil, one of the most abundant potassium silicates is regionally known as verdete, a
metasedimentary rock formed during the
Neoproterozoic era. Verdete is a greenish and banded rock, which has fine granulometry and clay
matrix, and it is composed essentially by
glauconite, quartz, and kaolinite minerals and
potassium feldspars15. According to Santos et al.16, the rock occurs in Serra da Saudade, Alto
Paranaíba Region (MG), geologically located in
the San Francisco Craton. The municipality of Cedro do Abaeté is known to have reasonable
reserves of verdete (57.4 million tons)17. Potassium
oxide (K2O) high contents in the verdete rock were
reported in the literature15,18-20. According to Silva and Lana21, the Cedro do Abaeté’s verdete may
contain until 14% of K2O.
According to the journal Brasil Mineral22, the first mineral project of an industrial processing
plant of verdete rock recently was inaugurated in
Dores do Indaiá, Minas Gerais State, Brazil. Pioneer in the processing of this potassium rock,
the complex of the Kalium Mineração S.A.
disposes of a glauconite deposit located in the
municipalities of Serra da Saudade and Quartel Geral in Minas Gerais, with total reserves of 218
million tons of ore and an average content of 10.6%
K2O. The mining process certified by Intertek
predicts an innovative treatment through
processing techniques of crushing/grinding; acid cure; aqueous lixiviation; liquid-solid separation;
crystallization; thermic decomposition; and
sulfuric acid regeneration. The company mining
intended the verdete rock use for the potassium salts production, whose processed products may be
applicated as potassium fertilizers, for example,
seeking to supply part of great demand of the potassium national market23.
However, a few previous scientific studies
worked with the verdete rock until recently. So far,
stand out researches involving chemical, stratigraphic, petrographic and mineralogical
characterizations were performed15,19,24,25, besides
other technological studies based on thermal treatment focusing on its reactivity increase20,26 and
its metal availability21,27-31. No meaningful
previous contributions were found that consistently explored the particle size distribution of verdete
rock through grain-size analysis and adjustment to
RRB and GGS mathematical models.
In this context, based on the relevance of continuous research efforts in mineral processing
studies, as well as on the lack of consistent
scientific contributions regarding particle size distribution of the verdete rock through the grain-
size property, the present article delineates a new
study of grain-size of verdete coarse and fine aggregates. For that, this work strives to describe
the particle size distribution of such aggregates
using sieving techniques and adjustment to Rosin-
Rammler-Bennet (RRB) and Gates-Gaudin-Schuhmann (GGS) granulometric distribution
models, with the purpose of providing subsidies to
a verdete rock characterization as potassium potential source for the mineral processing
Brazilian industry.
2. Experimental
Grain-size analysis of verdete rock was realized
at environmental conditions at room temperature (298.15 K) under atmospheric pressure
(101,325 Pa). Initially, a representative sample of
20 kg of verdete rock from Cedro do Abaeté in Minas Gerais was properly homogenized and
ground in a ball mill (Sew-Eurodrive, model
FA37B DRE80S4). The grinding product was
passed through a 2.36 mm sieve (8 mesh), getting a sample with granulometry < 2.36 mm.
Approximately 2.0 kg of verdete rock were
weighed on a balance (Urano, model UDC POP).
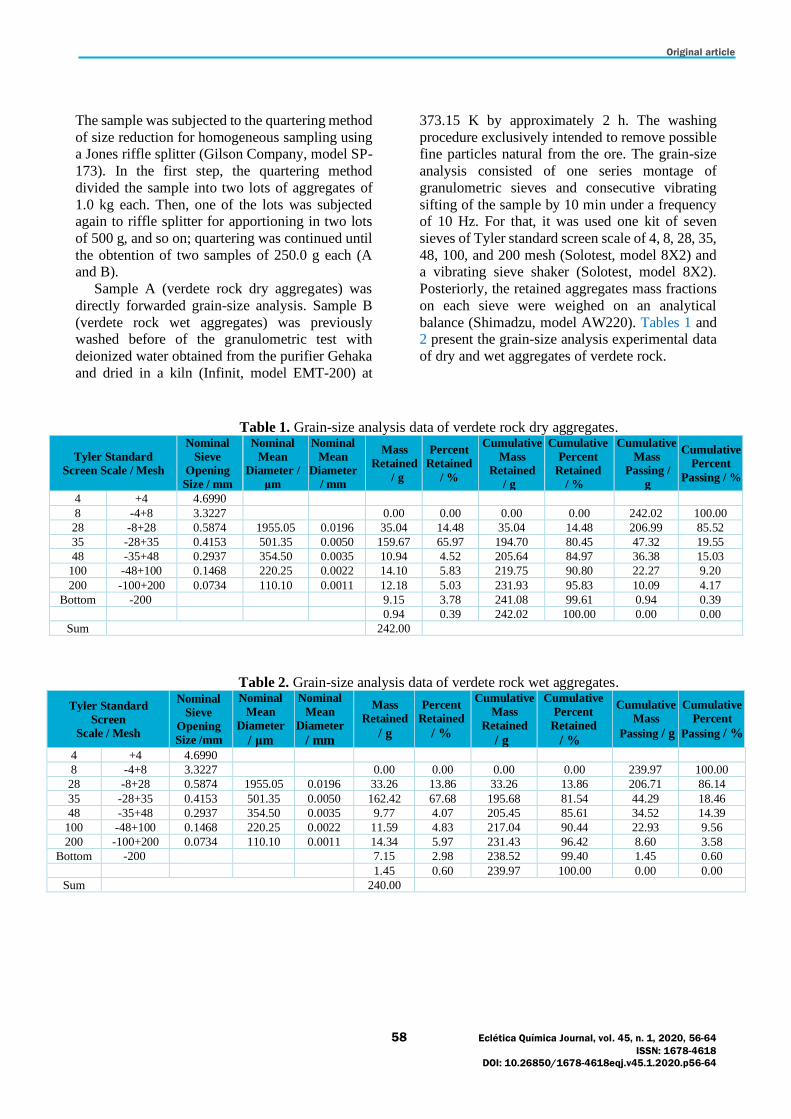
Original article
58 Eclética Química Journal, vol. 45, n. 1, 2020, 56-64
ISSN: 1678-4618
DOI: 10.26850/1678-4618eqj.v45.1.2020.p56-64
The sample was subjected to the quartering method
of size reduction for homogeneous sampling using a Jones riffle splitter (Gilson Company, model SP-
173). In the first step, the quartering method
divided the sample into two lots of aggregates of
1.0 kg each. Then, one of the lots was subjected again to riffle splitter for apportioning in two lots
of 500 g, and so on; quartering was continued until
the obtention of two samples of 250.0 g each (A and B).
Sample A (verdete rock dry aggregates) was
directly forwarded grain-size analysis. Sample B
(verdete rock wet aggregates) was previously washed before of the granulometric test with
deionized water obtained from the purifier Gehaka
and dried in a kiln (Infinit, model EMT-200) at
373.15 K by approximately 2 h. The washing
procedure exclusively intended to remove possible fine particles natural from the ore. The grain-size
analysis consisted of one series montage of
granulometric sieves and consecutive vibrating
sifting of the sample by 10 min under a frequency of 10 Hz. For that, it was used one kit of seven
sieves of Tyler standard screen scale of 4, 8, 28, 35,
48, 100, and 200 mesh (Solotest, model 8X2) and a vibrating sieve shaker (Solotest, model 8X2).
Posteriorly, the retained aggregates mass fractions
on each sieve were weighed on an analytical
balance (Shimadzu, model AW220). Tables 1 and 2 present the grain-size analysis experimental data
of dry and wet aggregates of verdete rock.
Table 1. Grain-size analysis data of verdete rock dry aggregates.
Tyler Standard
Screen Scale / Mesh
Nominal
Sieve
Opening
Size / mm
Nominal
Mean
Diameter /
μm
Nominal
Mean
Diameter
/ mm
Mass
Retained
/ g
Percent
Retained
/ %
Cumulative
Mass
Retained
/ g
Cumulative
Percent
Retained
/ %
Cumulative
Mass
Passing /
g
Cumulative
Percent
Passing / %
4 +4 4.6990
8 -4+8 3.3227 0.00 0.00 0.00 0.00 242.02 100.00
28 -8+28 0.5874 1955.05 0.0196 35.04 14.48 35.04 14.48 206.99 85.52
35 -28+35 0.4153 501.35 0.0050 159.67 65.97 194.70 80.45 47.32 19.55
48 -35+48 0.2937 354.50 0.0035 10.94 4.52 205.64 84.97 36.38 15.03
100 -48+100 0.1468 220.25 0.0022 14.10 5.83 219.75 90.80 22.27 9.20
200 -100+200 0.0734 110.10 0.0011 12.18 5.03 231.93 95.83 10.09 4.17
Bottom -200 9.15 3.78 241.08 99.61 0.94 0.39
0.94 0.39 242.02 100.00 0.00 0.00
Sum 242.00
Table 2. Grain-size analysis data of verdete rock wet aggregates.
Tyler Standard
Screen
Scale / Mesh
Nominal
Sieve
Opening
Size /mm
Nominal
Mean
Diameter
/ μm
Nominal
Mean
Diameter
/ mm
Mass
Retained
/ g
Percent
Retained
/ %
Cumulative
Mass
Retained
/ g
Cumulative
Percent
Retained
/ %
Cumulative
Mass
Passing / g
Cumulative
Percent
Passing / %
4 +4 4.6990
8 -4+8 3.3227 0.00 0.00 0.00 0.00 239.97 100.00
28 -8+28 0.5874 1955.05 0.0196 33.26 13.86 33.26 13.86 206.71 86.14
35 -28+35 0.4153 501.35 0.0050 162.42 67.68 195.68 81.54 44.29 18.46
48 -35+48 0.2937 354.50 0.0035 9.77 4.07 205.45 85.61 34.52 14.39
100 -48+100 0.1468 220.25 0.0022 11.59 4.83 217.04 90.44 22.93 9.56
200 -100+200 0.0734 110.10 0.0011 14.34 5.97 231.43 96.42 8.60 3.58
Bottom -200 7.15 2.98 238.52 99.40 1.45 0.60
1.45 0.60 239.97 100.00 0.00 0.00
Sum 240.00
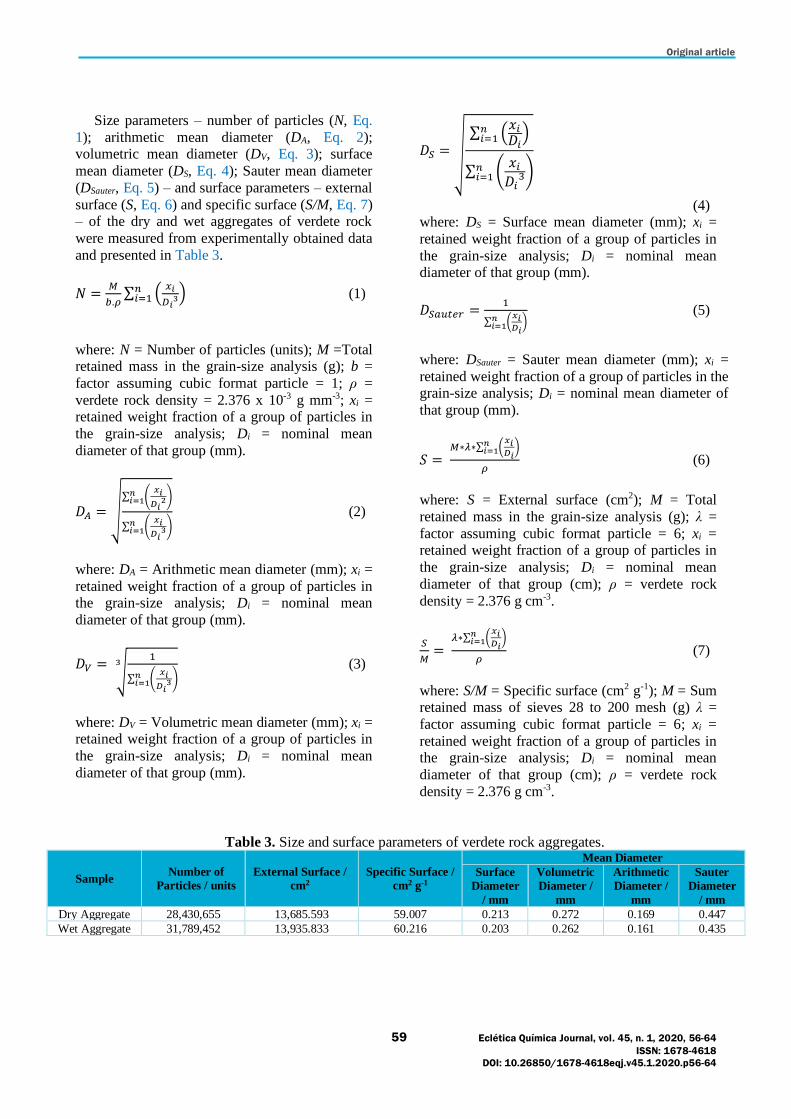
Original article
59 Eclética Química Journal, vol. 45, n. 1, 2020, 56-64
ISSN: 1678-4618
DOI: 10.26850/1678-4618eqj.v45.1.2020.p56-64
Size parameters – number of particles (N, Eq.
1); arithmetic mean diameter (DA, Eq. 2); volumetric mean diameter (DV, Eq. 3); surface
mean diameter (DS, Eq. 4); Sauter mean diameter
(DSauter, Eq. 5) – and surface parameters – external
surface (S, Eq. 6) and specific surface (S/M, Eq. 7) – of the dry and wet aggregates of verdete rock
were measured from experimentally obtained data
and presented in Table 3.
𝑁 =𝑀
𝑏.𝜌∑ (
𝑥𝑖
𝐷𝑖3)𝑛
𝑖=1 (1)
where: N = Number of particles (units); M =Total retained mass in the grain-size analysis (g); b =
factor assuming cubic format particle = 1; ρ =
verdete rock density = 2.376 x 10⁻³ g mm-3; xi = retained weight fraction of a group of particles in
the grain-size analysis; Di = nominal mean
diameter of that group (mm).
𝐷𝐴 = √∑ (
𝑥𝑖
𝐷𝑖2)𝑛
𝑖=1
∑ (𝑥𝑖
𝐷𝑖3)𝑛
𝑖=1
(2)
where: DA = Arithmetic mean diameter (mm); xi =
retained weight fraction of a group of particles in the grain-size analysis; Di = nominal mean
diameter of that group (mm).
𝐷𝑉 = √
1
∑ (𝑥𝑖
𝐷𝑖3)𝑛
𝑖=1
3 (3)
where: DV = Volumetric mean diameter (mm); xi = retained weight fraction of a group of particles in
the grain-size analysis; Di = nominal mean
diameter of that group (mm).
𝐷𝑆 = √
∑ (𝑥𝑖𝐷𝑖
)𝑛𝑖=1
∑ (𝑥𝑖
𝐷𝑖3)𝑛
𝑖=1
(4) where: DS = Surface mean diameter (mm); xi =
retained weight fraction of a group of particles in
the grain-size analysis; Di = nominal mean diameter of that group (mm).
𝐷𝑆𝑎𝑢𝑡𝑒𝑟 =1
∑ (𝑥𝑖𝐷𝑖
)𝑛𝑖=1
(5)
where: DSauter = Sauter mean diameter (mm); xi =
retained weight fraction of a group of particles in the grain-size analysis; Di = nominal mean diameter of
that group (mm).
𝑆 = 𝑀∗𝜆∗∑ (
𝑥𝑖𝐷𝑖
)𝑛𝑖=1
𝜌 (6)
where: S = External surface (cm2); M = Total
retained mass in the grain-size analysis (g); λ =
factor assuming cubic format particle = 6; xi = retained weight fraction of a group of particles in
the grain-size analysis; Di = nominal mean
diameter of that group (cm); ρ = verdete rock
density = 2.376 g cm-3.
𝑆
𝑀=
𝜆∗∑ (𝑥𝑖𝐷𝑖
)𝑛𝑖=1
𝜌 (7)
where: S/M = Specific surface (cm2 g-1); M = Sum retained mass of sieves 28 to 200 mesh (g) λ =
factor assuming cubic format particle = 6; xi =
retained weight fraction of a group of particles in the grain-size analysis; Di = nominal mean
diameter of that group (cm); ρ = verdete rock
density = 2.376 g cm-3.
Table 3. Size and surface parameters of verdete rock aggregates.
Sample Number of
Particles / units
External Surface /
cm2
Specific Surface /
cm2 g-1
Mean Diameter
Surface
Diameter
/ mm
Volumetric
Diameter /
mm
Arithmetic
Diameter /
mm
Sauter
Diameter
/ mm
Dry Aggregate 28,430,655 13,685.593 59.007 0.213 0.272 0.169 0.447
Wet Aggregate 31,789,452 13,935.833 60.216 0.203 0.262 0.161 0.435
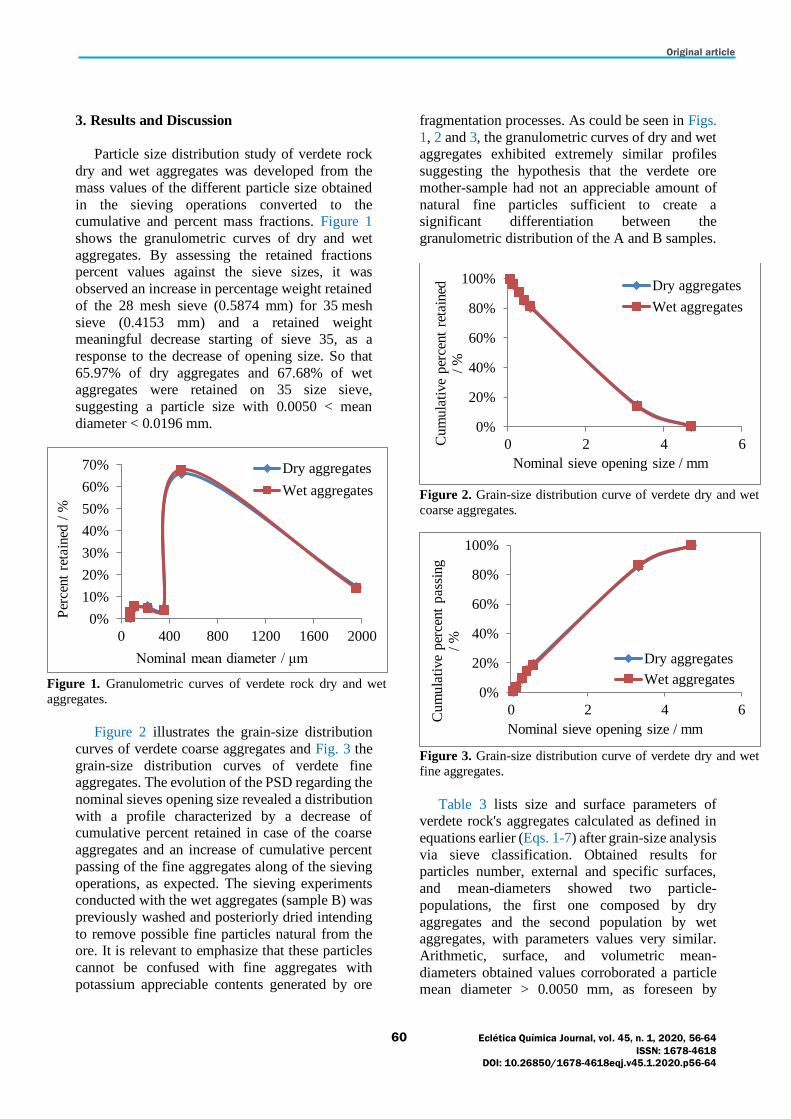
Original article
60 Eclética Química Journal, vol. 45, n. 1, 2020, 56-64
ISSN: 1678-4618
DOI: 10.26850/1678-4618eqj.v45.1.2020.p56-64
3. Results and Discussion
Particle size distribution study of verdete rock
dry and wet aggregates was developed from the
mass values of the different particle size obtained
in the sieving operations converted to the cumulative and percent mass fractions. Figure 1
shows the granulometric curves of dry and wet
aggregates. By assessing the retained fractions percent values against the sieve sizes, it was
observed an increase in percentage weight retained
of the 28 mesh sieve (0.5874 mm) for 35 mesh
sieve (0.4153 mm) and a retained weight meaningful decrease starting of sieve 35, as a
response to the decrease of opening size. So that
65.97% of dry aggregates and 67.68% of wet aggregates were retained on 35 size sieve,
suggesting a particle size with 0.0050 < mean
diameter < 0.0196 mm.
Figure 1. Granulometric curves of verdete rock dry and wet
aggregates.
Figure 2 illustrates the grain-size distribution
curves of verdete coarse aggregates and Fig. 3 the
grain-size distribution curves of verdete fine aggregates. The evolution of the PSD regarding the
nominal sieves opening size revealed a distribution
with a profile characterized by a decrease of cumulative percent retained in case of the coarse
aggregates and an increase of cumulative percent
passing of the fine aggregates along of the sieving
operations, as expected. The sieving experiments conducted with the wet aggregates (sample B) was
previously washed and posteriorly dried intending
to remove possible fine particles natural from the ore. It is relevant to emphasize that these particles
cannot be confused with fine aggregates with
potassium appreciable contents generated by ore
fragmentation processes. As could be seen in Figs.
1, 2 and 3, the granulometric curves of dry and wet aggregates exhibited extremely similar profiles
suggesting the hypothesis that the verdete ore
mother-sample had not an appreciable amount of
natural fine particles sufficient to create a significant differentiation between the
granulometric distribution of the A and B samples.
Figure 2. Grain-size distribution curve of verdete dry and wet
coarse aggregates.
Figure 3. Grain-size distribution curve of verdete dry and wet
fine aggregates.
Table 3 lists size and surface parameters of verdete rock's aggregates calculated as defined in
equations earlier (Eqs. 1-7) after grain-size analysis
via sieve classification. Obtained results for particles number, external and specific surfaces,
and mean-diameters showed two particle-
populations, the first one composed by dry
aggregates and the second population by wet aggregates, with parameters values very similar.
Arithmetic, surface, and volumetric mean-
diameters obtained values corroborated a particle mean diameter > 0.0050 mm, as foreseen by
0%
10%
20%
30%
40%
50%
60%
70%
0 400 800 1200 1600 2000
Per
cent
reta
ined
/ %
Nominal mean diameter / μm
Dry aggregates
Wet aggregates
0%
20%
40%
60%
80%
100%
0 2 4 6Cum
ula
tive
per
cent
reta
ined
/
%Nominal sieve opening size / mm
Dry aggregates
Wet aggregates
0%
20%
40%
60%
80%
100%
0 2 4 6
Cum
ula
tive
per
cent
pass
ing
/ %
Nominal sieve opening size / mm
Dry aggregates
Wet aggregates
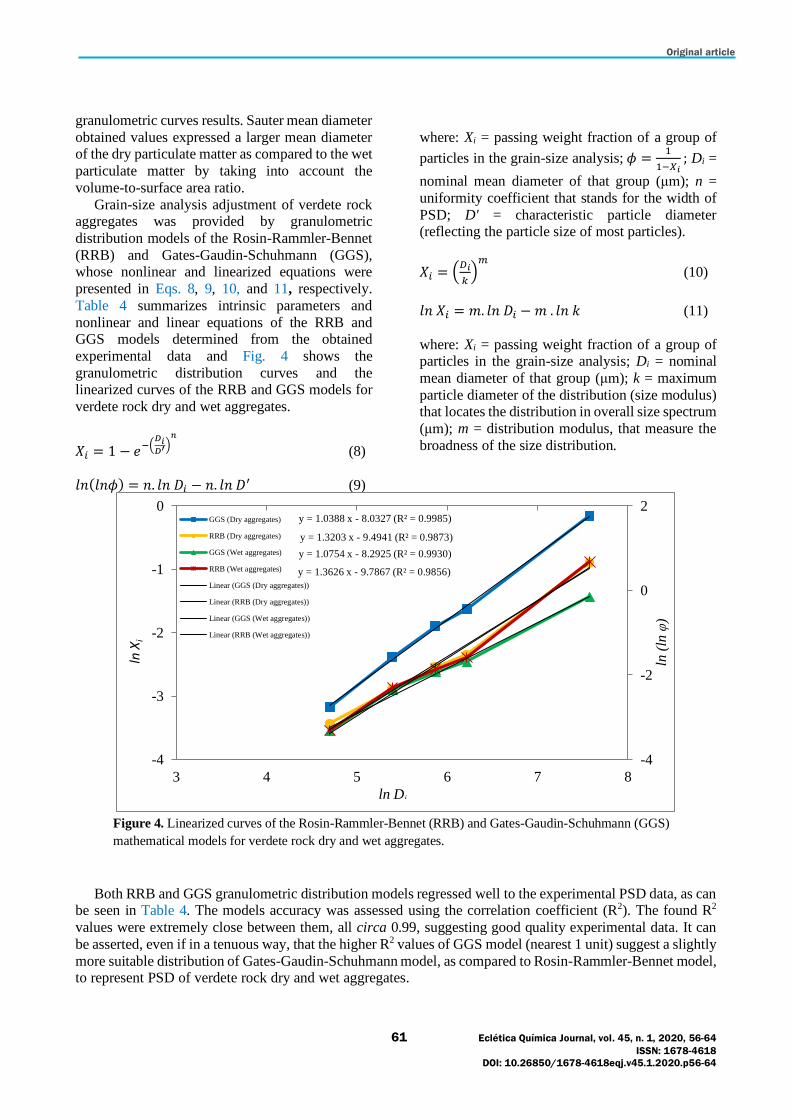
Original article
61 Eclética Química Journal, vol. 45, n. 1, 2020, 56-64
ISSN: 1678-4618
DOI: 10.26850/1678-4618eqj.v45.1.2020.p56-64
granulometric curves results. Sauter mean diameter
obtained values expressed a larger mean diameter of the dry particulate matter as compared to the wet
particulate matter by taking into account the
volume-to-surface area ratio.
Grain-size analysis adjustment of verdete rock aggregates was provided by granulometric
distribution models of the Rosin-Rammler-Bennet
(RRB) and Gates-Gaudin-Schuhmann (GGS), whose nonlinear and linearized equations were
presented in Eqs. 8, 9, 10, and 11, respectively.
Table 4 summarizes intrinsic parameters and
nonlinear and linear equations of the RRB and GGS models determined from the obtained
experimental data and Fig. 4 shows the
granulometric distribution curves and the linearized curves of the RRB and GGS models for
verdete rock dry and wet aggregates.
𝑋𝑖 = 1 − 𝑒−(
𝐷𝑖𝐷′)
𝑛
(8)
𝑙𝑛(𝑙𝑛𝜙) = 𝑛. 𝑙𝑛 𝐷𝑖 − 𝑛. 𝑙𝑛 𝐷′ (9)
where: Xi = passing weight fraction of a group of
particles in the grain-size analysis; 𝜙 =1
1−𝑋𝑖; Di =
nominal mean diameter of that group (μm); n =
uniformity coefficient that stands for the width of
PSD; D' = characteristic particle diameter (reflecting the particle size of most particles).
𝑋𝑖 = (𝐷𝑖
𝑘)
𝑚
(10)
𝑙𝑛 𝑋𝑖 = 𝑚. 𝑙𝑛 𝐷𝑖 − 𝑚 . 𝑙𝑛 𝑘 (11)
where: Xi = passing weight fraction of a group of particles in the grain-size analysis; Di = nominal
mean diameter of that group (μm); k = maximum
particle diameter of the distribution (size modulus) that locates the distribution in overall size spectrum
(μm); m = distribution modulus, that measure the
broadness of the size distribution.
Figure 4. Linearized curves of the Rosin-Rammler-Bennet (RRB) and Gates-Gaudin-Schuhmann (GGS)
mathematical models for verdete rock dry and wet aggregates.
Both RRB and GGS granulometric distribution models regressed well to the experimental PSD data, as can be seen in Table 4. The models accuracy was assessed using the correlation coefficient (R2). The found R2
values were extremely close between them, all circa 0.99, suggesting good quality experimental data. It can
be asserted, even if in a tenuous way, that the higher R2 values of GGS model (nearest 1 unit) suggest a slightly
more suitable distribution of Gates-Gaudin-Schuhmann model, as compared to Rosin-Rammler-Bennet model, to represent PSD of verdete rock dry and wet aggregates.
y = 1.0388 x - 8.0327 (R² = 0.9985)
y = 1.3203 x - 9.4941 (R² = 0.9873)
y = 1.0754 x - 8.2925 (R² = 0.9930)
y = 1.3626 x - 9.7867 (R² = 0.9856)
-4
-2
0
2
-4
-3
-2
-1
0
3 4 5 6 7 8
GGS (Dry aggregates)
RRB (Dry aggregates)
GGS (Wet aggregates)
RRB (Wet aggregates)
Linear (GGS (Dry aggregates))
Linear (RRB (Dry aggregates))
Linear (GGS (Wet aggregates))
Linear (RRB (Wet aggregates))
ln Di
ln (
ln φ
)
ln X
i

Original article
62 Eclética Química Journal, vol. 45, n. 1, 2020, 56-64
ISSN: 1678-4618
DOI: 10.26850/1678-4618eqj.v45.1.2020.p56-64
Table 4. Rosin-Rammler-Bennet (RRB) and Gates-Gaudin-Schuhmann (GGS) mathematical model
parameters and determined equations.
Sample
Granulometric
Distribution
Model
Parameters Nonlinear equation Linear equation
Correlation
Coefficient
(R2)
Dry Aggregate
RRB 𝑛 𝐷′
𝑋𝑖 = 1 − 𝑒[−(
𝐷𝑖1327.2517
)1.3203
]
𝑙𝑛 [𝑙𝑛 (1
1 − 𝑋𝑖
)] = 1.3203 𝑙𝑛 𝐷𝑖
− 9.4941
0.9873 1.3203 1,327.2517
GGS 𝑘 𝑚
𝑋𝑖 = (𝐷𝑖
2281.6915)
1.0388
𝑙𝑛 𝑋𝑖 = 1.0388 𝑙𝑛 𝐷𝑖 − 8.0327 0.9985 2,281.6915 1.0388
Wet Aggregate
RRB 𝑛 𝐷′
𝑋𝑖 = 1 − 𝑒[−(
𝐷𝑖1316.0261
)1.3626
]
𝑙𝑛 [𝑙𝑛 (1
1 − 𝑋𝑖
)] = 1.3626 𝑙𝑛 𝐷𝑖
− 9.7867
0.9856 1.3626 1, 316.0261
GGS 𝑘 𝑚 𝑋𝑖 = (𝐷𝑖
2232.9620)
1.0754
𝑙𝑛 𝑋𝑖 = 1.0754 𝑙𝑛 𝐷𝑖 − 8.2925 0.9930
According to Liu et al.32, D' and n parameters of
RRB distribution model play a dominant role in the determination of the distribution characteristics, in
other words, the PSD of any particle system
described by using this model can be distinguished with values of D' and n. Lower values of m
parameter of GGS distribution model suggest that
more fine aggregates, more large particles (coarse
aggregates) and fewer particles in the middle range will be produced33. Comparing the RRB and GGS
models parameters obtained for dry and wet
aggregates, it was observed a good convergence between the found values, corroborating the
hypothesis that the ore mother-sample did not have
an amount of fine particles sufficient to create
appreciable differentiation between the A and B samples, as foreseen in results obtained by
granulometric curves and size and surface
parameters. Due to the lack of studies in the literature
dedicated to the description of the particle size
distribution of the verdete rock aggregates and its modeling through RRB and GGS models, the work
presented here suggests the suitability of the
methodology proposed by means of sieving
techniques for predicting the grain-size performance the verdete rock beyond enriching its
mineral characterization. The developed study
could be optimized and enlarged in the purpose to corroborate the described forecasts and to increase
of the results representativeness. In this sense, it is
recommended to use the method described with other verdete ore granulometry and coming of
other mineral reserves, as well as to realize the
sieving experiments in triplicate.
4. Conclusions
A grain-size analysis study of verdete rock and
adjustments to the Rosin-Rammler-Bennet (RRB)
and Gates-Gaudin-Schuhmann (GGS) granulometric distribution models were
satisfactorily developed through sieving
techniques with sieves of Tyler standard screen
scale of 4, 8, 28, 35, 48, 100, and 200 mesh. Both RRB and GGS granulometric models regressed
well to the experimental particle size distribution
data, presenting correlation coefficient values were extremely close between them approximately 0.99.
The PSD results suggested that: 65.97% dry
aggregates and 67.68% wet aggregates had a
particle size with mean diameter > 0.0050 mm; an extremely similar behavior of the grain-size
distributions presented by samples of ore dry and
wet aggregates; and a tiny presence of fine particles natural from the analyzed ore sample. The results
suggested the suitability of the methodology
proposed by work to predict the grain-size performance the verdete ore beyond to show itself
as a contribution to the enriching of the mineral
characterization of the studied rock, as a potassium
potential source for the mineral processing Brazilian industry.
5. References
[1] Ahmed, M. M., A contribution to new measure for
evaluation of a particle size distribution, Mineral
Processing and Extractive Metallurgy: Transactions of
the Institution of Mining and Metallurgy: Section C 116
(4) (2007) 221-230.
http://doi.org/10.1179/174328507X198726.
Original article
63 Eclética Química Journal, vol. 45, n. 1, 2020, 56-64
ISSN: 1678-4618
DOI: 10.26850/1678-4618eqj.v45.1.2020.p56-64
[2] Bolaji, O. T., Awonorin, S. O., Sanni, L. O., Shittu,
T. A., Adewumi, J. K., Modeling of particle size
distribution and energy consumption of wet milled
maize at varying soaking period and method in the
production of Ogi, Particulate Science and Technology
37 (1) (2017) 94-102.
https://doi.org/10.1080/02726351.2017.1343882.
[3] Petrakis, E., Stamboliadis, E., Komnitsas, K.,
Evaluation of the relationship between energy input and
particle size distribution in comminution with the use of piecewise regression analysis, Particulate Science and
Technology 35 (4) (2016) 479-489.
https://doi.org/10.1080/02726351.2016.1168894.
[4] Kimura, S., Ito, T., Minagawa, H., Grain-size
analysis of fine and coarse non-plastic grains:
comparison of different analysis methods, Granular
Matter 20 (3) (2018) 1-15.
https://doi.org/10.1007/s10035-018-0820-3.
[5] Savitha, HG., Manohar, B., Studies on grinding and
extraction of oil from fenugreek (Trigonella foenum-
graecum) seed, International Journal of Food Engineering 11 (2) (2015) 275-283.
https://doi.org/10.1515/ijfe-2014-0262.
[6] Miranda, M. R., Cardoso, C. R., Ataíde, C. H.,
Physical and chemical characterization of sorghum
bagasse, Materials Science Forum 727-728 (2012)
1683-1688.
https://doi.org/10.4028/www.scientific.net/MSF.727-
728.1683.
[7] Liu, S., Li, Q., Song, J., Study on the grinding
kinetics of copper tailing powder, Powder Technology
330 (2018) 105-113. https://doi.org/10.1016/j.powtec.2018.02.025.
[8] Castro, A. M., Castilho, L. R., Freire, D. M. G.,
Characterization of babassu, canola, castor seed and
sunflower residual cakes for use as raw materials for
fermentation processes, Industrial Crops and Products
83 (2016) 140-148.
https://doi.org/10.1016/j.indcrop.2015.12.050.
[9] Cho, J., Sohn, H. Y., Effects of particle shape and
size distribution on the overall fluid-solid reaction rates
of particle assemblages, The Canadian Journal of
Chemical Engineering 94 (8) (2016) 1516-1523.
https://doi.org/10.1002/cjce.22533.
[10] Singh, M., Kumar, S., Kumar, S., Nandan, G.,
Gupta, M., Characterization of iron-ore suspension at in-
situ conditions, Materials today: proceedings 5 (9)
(2018) 17845-17851.
https://doi.org/10.1016/j.matpr.2018.06.110.
[11] Kacham, A. R., Suri, A. K., Application of a
topochemical reaction model to predict leaching
behavior of high carbonate uranium ores in alkaline
solutions: an experimental case study, Hydrometallurgy
141 (2014) 67-75.
https://doi.org/10.1016/j.hydromet.2013.10.005.
[12] Xiong, Y., Wu, B., Zhu, J., Fan, X., Cai, P., Wen,
J., Liu, X., Preparation of magnesium hydroxide from
leachate of dolomitic phosphate ore with dilute waste
acid from titanium dioxide production, Hydrometallurgy 142 (2014) 137-144.
https://doi.org/10.1016/j.hydromet.2013.11.013.
[13] Santana, R. C., Ribeiro, J. A., Santos, M. A., Reis,
A. S., Ataíde, C. H., Barrozo, M. A. S., Flotation of fine
apatitic ore using microbubbles, Separation and
Purification Technology 98 (2012) 402-409.
https://doi.org/10.1016/j.seppur.2012.06.014.
[14] Taşdemir, A., Taşdemir, T., Comparative study on
PSD models for chromite ores comminuted by different
devices. Particle and Particle Systems Characterization
26 (1-2) (2009) 69-79. https://doi.org/10.1002/ppsc.200800035.
[15] Piza, P. A. T., Bertolino, L. C., Silva, A. A. D.,
Sampaio, J. A., Luz, A. B., Verdete da região de Cedro
de Abaeté (MG) como fonte alternativa para potássio,
Geociências 30 (3) (2011) 345-356.
https://www.periodicos.rc.biblioteca.unesp.br/index.ph
p/geociencias/article/view/5551.
[16] Santos, W. O., Mattiello, E. M., Costa, L. M.,
Abrahão, W. A. P., Characterization of verdete rock as
a potential source of potassium, Revista Ceres 62 (4)
(2015) 392-400. https://doi.org/10.1590/0034-737X201562040009.
[17] Santos, W. O., Mattiello, E. M., Vergutz, L., Costa,
R. F., Production and evaluation of potassium fertilizers
from silicate rock, Journal of Plant Nutrition and Soil
Science 179 (4) (2016) 547-556.
https://doi.org/10.1002/jpln.201500484.
[18] Guimarães, D., Geologia do Brasil, Rio de Janeiro,
1964.
[19] Moreira, D. S., Uhlein, A., Fernandes, M. L. S.,
Mizusaki, A. M., Galéry, R., Delbem, I. D.,
Estratigrafia, petrografia e mineralização de potássio em
siltitos verdes do grupo Bambuí na região de São Gotardo, Minas Gerais, Geociências 35 (2) (2016) 157-
171.
http://www.ppegeo.igc.usp.br/index.php/GEOSP/articl
e/view/9016/8281.

Original article
64 Eclética Química Journal, vol. 45, n. 1, 2020, 56-64
ISSN: 1678-4618
DOI: 10.26850/1678-4618eqj.v45.1.2020.p56-64
[20] Silva, A. A. S., Medeiros, M. E., Sampaio, J. A.,
Garrido, F. M. S., Verdete de Cedro do Abaeté como
fonte de potássio: caracterização, tratamento térmico e
reação com CaO, Matéria (Rio de Janeiro) 17 (3) (2012)
1062-1074. https://doi.org/10.1590/S1517-
70762012000300004.
[21] Silva, A. A., Lana, R. M. Q., Incubação do verdete
com diferentes fontes de ácidos para disponibilização de
potássio, cálcio, magnésio do solo, Holos 5 (2015) 73-
83. https://doi.org/10.15628/holos.2015.3210.
[22] Revista Brasil Mineral, Potássio: Projeto da Kalium
opera em novembro, 2018.
http://www.brasilmineral.com.br/noticias/projeto-da-
kalium-opera-em-novembro.
[23] Kalium Mineração S.A., Projeto Glauconita, KM
Kalium Mineração S.A. (2017) 1-41.
https://docplayer.com.br/74701318-Km-kalium-
mineracao-s-a-projeto-glauconita.html.
[24] Silva, A. A. S., Medeiros, M. E., Sampaio J. A.,
Garrido, F. M. S., Caracterização do verdete de Cedro
do Abaeté para o desenvolvimento de um material com liberação controlada de potássio, Holos 5 (2012) 42-51.
https://doi.org/10.15628/holos.2012.1093.
[25] Lima, O. N. B., Uhlein, A., Britto, W., Estratigrafia
do grupo Bambuí na Serra da Saudade e geologia do
depósito fosfático de Cedro do Abaeté, Minas Gerais,
Revista Brasileira de Geociências 37 (4, suppl.) (2007)
204-215. https://doi.org/10.25249/0375-
7536.200737S4204215.
[26] Santos, W. O., Mattiello, E. M., Pacheco, A. A.,
Vergutz, L., Souza-Filho, L. F. S., Abdala, D. B.,
Thermal treatment of a potassium-rich metamorphic rock in formation of soluble K forms, International
Journal of Mineral Processing 159 (2017) 16-21.
https://doi.org/10.1016/j.minpro.2016.12.004.
[27] Eichler, V., Lopes, A. S., Disponibilidade do
potássio do Verdete de Abaeté, calcinado com e sem
calcário magnesiano, para a cultura do milho (Zea mays
L.), em solo de textura argilosa, Ciência e Prática 7 (2)
(1983) 136-156.
[28] Leite, P. C., Efeitos de tratamentos térmicos em
misturas de verdete de Abaeté, fosfato de Araxá e
calcário magnesiano, na disponibilidade de potássio e
fósforo. 1985. 146 f. Dissertation (Master’s in Agronomy) - School of Agriculture of Lavras, Lavras,
1985.
[29] Martins, V., Gonçalves, A. S. F., Marchi, G.,
Guilherme, L. R. G., Martins, E. S., Solubilização de
potássio em misturas de verdete e calcário tratadas
termoquimicamente, Pesquisa Agropecuária Tropical
45 (1) (2015) 66-72. https://doi.org/10.1590/1983-
40632015v4527917.
[30] Pereira, A. C., Carvalho, I. S. B., Rocha, S. D. F.,
Glauconite-bearing rocks as alternative potassium
source for fertilizer by thermal processing with
additives, Brazilian Applied Science Review 3 (2)
(2019) 1455-1467. https://doi.org/10.34115/basrv3n2-
050.
[31] Pereira, A. C., Becheleni, E. M. A., Gomes, M. R. S., Rocha, S. D. F., Fluoride aided potassium extraction
from Verdete rock by thermal processing with ferrous
sulfate heptahydrate, Brazilian Applied Science Review
3 (2) (2019) 1373-1384.
http://www.brjd.com.br/index.php/BASR/article/view/
1565.
[32] Liu, S., Li, Q., Xie, G., Li, L., Xiao, H., Effect of
grinding time on the particle characteristics of glass
powder, Powder Technology 295 (2016) 133-141.
https://doi.org/10.1016/j.powtec.2016.03.030.
[33] Lu, P., Jefferson, I. F., Rosenbaum, M. S., Smalley, I. J., Fractal characteristics of loess formation: evidence
from laboratory experiments, Engineering Geology 69
(3-4) (2003) 287-293. https://doi.org/10.1016/S0013-
7952(02)00287-9.
Original article
iq.unesp.br/ecletica
| Vol. 45 | n. 1 | 2020 |
65 Eclética Química Journal, vol. 45, n. 1, 2020, 65-76
ISSN: 1678-4618
DOI: 10.26850/1678-4618eqj.v45.1.2020.p65-77
Bound state solutions of the Schrödinger equation with energy-
dependent molecular Kratzer potential via asymptotic iteration method Akpan Ndem Ikot1 , Uduakobong Okorie1,2 , Alalibo Thompson Ngiangia1, Clement Atachegbe Onate3 , Collins Okon Edet1+ , Ita Okon Akpan4, Precious Ogbonda Amadi1
1. University of Port Harcourt, Department of Physics, Theoretical Physics Group, Nigeria 2. Akwa Ibom State University, Department of Physics, Ikot Akpaden, Nigeria 3. Landmark University, Department of Physical Sciences, Omu-Aran, Nigeria 4. University of Calabar, Department of Physics, Nigeria +Corresponding author: Collins Okon Edet, email address: [email protected]
ARTICLE INFO
Article history: Received: July 21, 2019
Accepted: October 24, 2019
Published: January 1, 2020
Keywords: 1. Kratzer potential 2. Schrödinger equation 3. asymptotic iteration method 4. bound state
1. Introduction
The exact or approximate solutions of the
Schrödinger equations play a vital role in many
branches of modern physics and chemistry1,2. The solution of this equation is used in the description
of particle dynamics in the non-relativistic
regime3,4. Even though the Schrödinger equation was developed many decades ago, it is still very
challenging to solve it analytically5,6. The solution
of the Schrödinger equation contains all the necessary information needed for the full
description of a quantum state such as the
probability density and entropy of the system7,8.
The Schrödinger equation with many physical potentials model have been investigated in recent
times with different advance mathematical
technique such as Nikiforov-Uvarov (NU)
method9-11, asymptotic iteration method (AIM)12-16, functional analysis approach16, supersymmetric
quantum mechanics (SUSYQM)17-20 among
others21. One of such potential models is the
Kratzer potential22, 2
2
1( ) 2
2
a aV r D
r r
= − −
(1)
where D is the dissociation energy and a is the
equilibrium internuclear length.
The Kratzer potential has been used as a
potential model to describe internuclear vibration
of diatomic molecules23,24. Many authors have investigated the bound state solutions of the
Kratzer potential within relativistic and non-
relativistic quantum mechanics25,26. Recently,
Budaca27 studied an energy-dependent Coulomb-
ABSTRACT: In this paper, we obtained the exact bound
state energy spectrum of the Schrödinger equation with energy dependent molecular Kratzer potential using asymptotic iteration method (AIM). The corresponding wave function expressed in terms of the confluent hypergeometric function was also obtained. As a special case, when the energy slope parameter in the energy-dependent molecular Kratzer potential is set to zero, then the well-known molecular Kratzer potential is recovered.
Numerical results for the energy eigenvlaues are also obtained for different quantum states, in the presence and absence of the energy slope parameter. These results are discussed extensively using graphical representation. Our results are seen to agree with the results in literature.
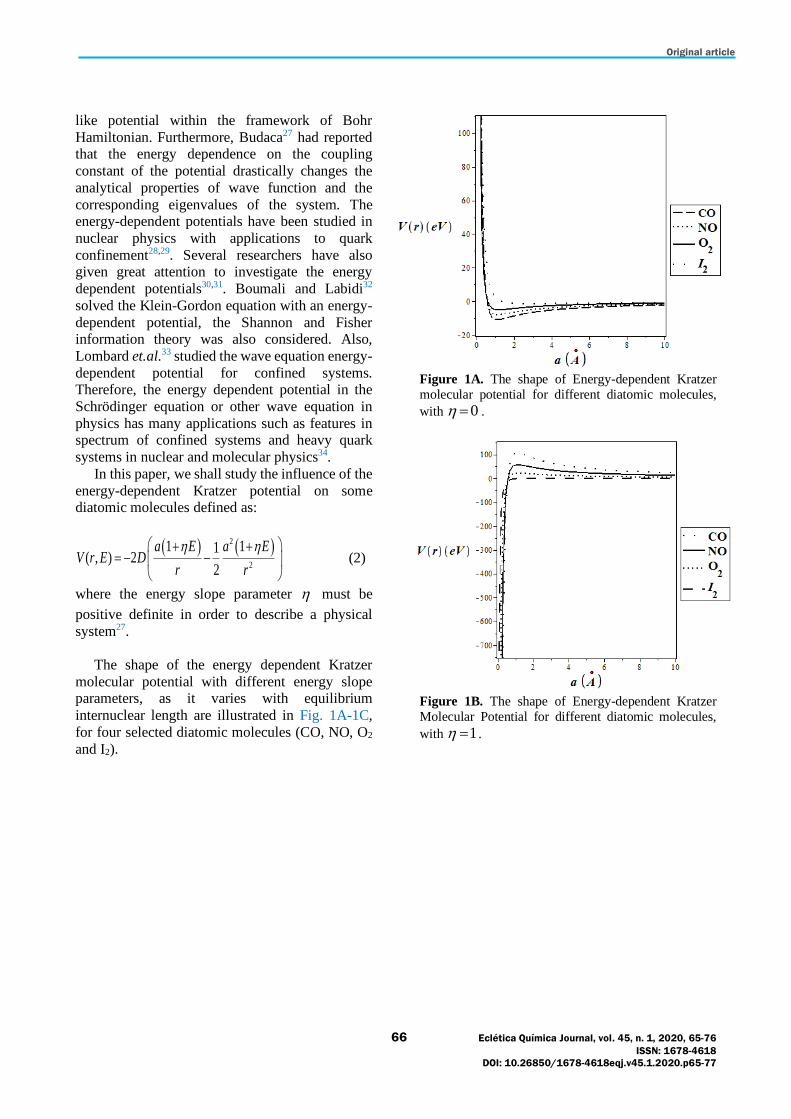
Original article
66 Eclética Química Journal, vol. 45, n. 1, 2020, 65-76
ISSN: 1678-4618
DOI: 10.26850/1678-4618eqj.v45.1.2020.p65-77
like potential within the framework of Bohr
Hamiltonian. Furthermore, Budaca27 had reported that the energy dependence on the coupling
constant of the potential drastically changes the
analytical properties of wave function and the
corresponding eigenvalues of the system. The energy-dependent potentials have been studied in
nuclear physics with applications to quark
confinement28,29. Several researchers have also given great attention to investigate the energy
dependent potentials30,31. Boumali and Labidi32
solved the Klein-Gordon equation with an energy-
dependent potential, the Shannon and Fisher information theory was also considered. Also,
Lombard et.al.33 studied the wave equation energy-
dependent potential for confined systems. Therefore, the energy dependent potential in the
Schrödinger equation or other wave equation in
physics has many applications such as features in spectrum of confined systems and heavy quark
systems in nuclear and molecular physics34.
In this paper, we shall study the influence of the
energy-dependent Kratzer potential on some diatomic molecules defined as:
( ) ( )2
2
1 11( , ) 2
2
a E a EV r E D
r r
+ += − −
(2)
where the energy slope parameter must be
positive definite in order to describe a physical
system27.
The shape of the energy dependent Kratzer
molecular potential with different energy slope parameters, as it varies with equilibrium
internuclear length are illustrated in Fig. 1A-1C,
for four selected diatomic molecules (CO, NO, O2
and I2).
Figure 1A. The shape of Energy-dependent Kratzer
molecular potential for different diatomic molecules,
with 0 = .
Figure 1B. The shape of Energy-dependent Kratzer
Molecular Potential for different diatomic molecules,
with 1 = .

Original article
67 Eclética Química Journal, vol. 45, n. 1, 2020, 65-76
ISSN: 1678-4618
DOI: 10.26850/1678-4618eqj.v45.1.2020.p65-77
Figure 1C. The shape of Energy-dependent Kratzer
molecular potential for different diatomic molecules,
with 1 =− .
2 Asymptotic Iteration Method
The AIM has been proposed and used to solve
the homogenous linear second-order differential
equation of the form12-16:
0 0( ) ( ) ( ) ( ) ( )y x x y x s x y x = + (3)
where 0 0 and the prime denote the derivative
with respect to x .
The functions, 0 ( )s x and 0 ( )x must be
sufficiently differentiable. Differentiating Eq. 3
with respect to x , we get
1 1( ) ( ) ( ) ( ) ( )y x x y x s x y x = + (4)
where, 2
1 0 0 0
1 0 0 0
( ) ( ) ( ) ( )
( ) ( ) ( ) ( )
x x x s x
s x s x s x x
= + +
= + (5)
Taking the second derivative of Eq. 3 yields
2 2( ) ( ) ( ) ( ) ( )y x x y x s x y x = + (6)
where,
2 1 0 1 1
2 1 0 1
( ) ( ) ( ) ( ) ( )
( ) ( ) ( ) ( )
x x x x s x
s x s x s x x
= + +
= + (7)
Again by taking the ( )1k th+ and ( )2k th+
order derivative of Eq. 3 for 1,2,3....k = , we
obtain the following differential equations:
( )
( )
1
1 1
2
( ) ( ) ( ) ( ) ( )
( ) ( ) ( ) ( ) ( )
k
k k
k
k k
y x x y x s x y x
y x x y x s x y x
+
− −
+
= +
= + (8)
where,
1 2 0 2 2
1 0 2 2
1 0 1 1
0 1 1
( ) ( ) ( ) ( ) ( )
( ) ( ) ( ) ( )
( ) ( ) ( ) ( ) ( )
( ) ( ) ( ) ( )
k k k k
k k k
k k k k
k k k
x x x x s x
s x s x x s x
x x x x s x
s x s x x s x
− − − −
− − −
− − −
− −
= + +
= +
= + +
= +
(9)
Solving Eq. 8, we obtain the following relation:
( )
( )
2
1
11
1
( )( ) ( ) ( )
( )( )
( ) ( )( ) ( ) ( )
( )
kkk
k
k
kk
k
s xx y x y x
xy x
y x s xx y x y x
x
+
+
−−
−
+
= +
(10)
For sufficiently large values of k , the ( )x
values are obtained as
1
1
( ) ( )( )
( ) ( )
k k
k k
s x s xx
x x
−
−
= = (11)
This method consists of converting the
Schrödinger-like equation into the form of Eq. 3 for
a given potential model. The corresponding energy eigenvalues are calculated by means of the
quantization condition12-16.
1 1( ) ( ) ( ) ( ) ( ), 1,2,3....k k k k kx s x x x s x k − −= − = (12)
The general solutions of Eq. 3 is obtain from
Eq. 10 as:
( ) ( )1 1 2 1 0 2 2 2 1( ) exp ( ) exp ( ) 2 ( )x x x
y x x dx C C x x dx dx = − + + (13)
where 1C and 2C are integration constant.

Original article
68 Eclética Química Journal, vol. 45, n. 1, 2020, 65-76
ISSN: 1678-4618
DOI: 10.26850/1678-4618eqj.v45.1.2020.p65-77
Also, the eigenfunction can be obtained by
transforming the Schrödinger-like equation of the form:
1
2 2
1( ) 2 ( ) ( )
1 1
N N
N N
ax t Wxy x y x y x
bx x bx
+
+ +
+ = − −
− − (14)
The exact solutions for Eq. 14 are given by
( ) ( ) ( )2 2
2 1( ) 1 ( 2) , ; ; N
ny x C N F n n bx += − + − + (15)
where,
( )( ) ( )
( )
2 1 22 3, ,
2 2n
n t b at N
N N b
+ + ++ += = =
+ + (16)
3. Bound state solution of the Schrödinger
equation with energy-dependent Kratzer
potential
The radial part of the Schrödinger equation with
energy dependent potential ( , )nlV r E reads35:
( ) 22
2 2 2
12( , ) ( ) 0
2
nlnl nl nl
l ldE V r E r
dr r
++ − − =
(17)
where is the reduced mass of the molecules, nlE
is the energy of the system, denotes the reduced
Planck constant, n and represent the principal
and orbital angular momentum quantum numbers
respectively.
Substituting Eq. 1 into Eq. 17 yields,
( ) ( ) ( )2 22
2 2 2 2
1 1 12 12 ( ) 0
2 2
nlnl nl
a E a E l ldE D r
dr r r r
+ + ++ + − − =
(18)
Now using a new variable transformation,
y ar= , we obtain a second order differential
equation of the form:
( )22
2 2
1( ) 0nl
n nl
dy
dy y y
+ + − + − =
(19)
with the following definitions for the used
parameters:
( )
( )( )
( )
2
2 2 2
2
2
4 12, ,
2 11 1
nln
D EE
a
Da El l
+= − =
++ = + +
(20)
In order to transform Eq. 19 into form suitable
for the AIM, we write the wave function in the
form:
1( ) ( )n y
nl y y e f y −+= (21)
Substituting Eq. 21 into Eq. 19, we obtain:
( ) ( )2 2 1 2 1( ) ( ) ( )
n nyf y f y f y
y y
− + + − = +
(22)
where,
( )
( )
0
0
2 2 1( ) ,
2 1( )
n
n
yy
y
s yy
− +=
+ −=
(23)
By applying the AIM quantization of Eq. 12 by substituting Eq. 23, we obtain the following
iterations:
( )
( )
( )
0 10
0 1 0
1 21
1 2 1
322
2 3 2
, 0,2 1
, 1,2 2
, 22 3
s sn
s sn
ssn
= = =+
= = =+
= = =+
(24)
Generally, for arbitrary n , we have
( )2 1n
n n
=
+ + (25)
Using Eq. 20 with Eq. 25, the energy
eigenvalues of the Schrödinger equation with
energy-dependent Kratzer potential is obtained as:
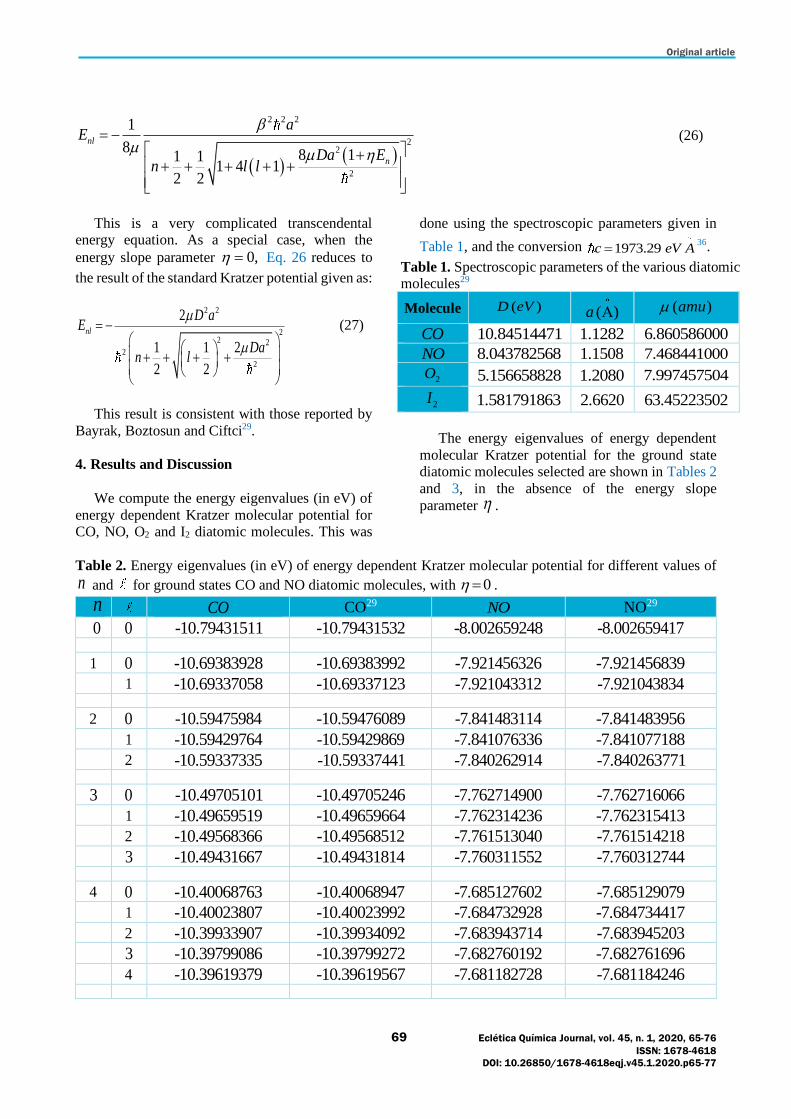
Original article
69 Eclética Química Journal, vol. 45, n. 1, 2020, 65-76
ISSN: 1678-4618
DOI: 10.26850/1678-4618eqj.v45.1.2020.p65-77
( )( )
2 2 2
22
2
1
88 11 1
1 4 12 2
nl
n
aE
Da En l l
= − + + + + + +
(26)
This is a very complicated transcendental energy equation. As a special case, when the
energy slope parameter 0, = Eq. 26 reduces to
the result of the standard Kratzer potential given as:
2 2
22 2
2
2
2
1 1 2
2 2
nl
D aE
Dan l
= −
+ + + +
(27)
This result is consistent with those reported by
Bayrak, Boztosun and Ciftci29.
4. Results and Discussion
We compute the energy eigenvalues (in eV) of
energy dependent Kratzer molecular potential for CO, NO, O2 and I2 diatomic molecules. This was
done using the spectroscopic parameters given in
Table 1, and the conversion 1973.29c eV A=36.
Table 1. Spectroscopic parameters of the various diatomic molecules29
Molecule ( )D eV ( )a
( )amu
CO 10.84514471 1.1282 6.860586000
NO 8.043782568 1.1508 7.468441000
2O 5.156658828 1.2080 7.997457504
2I 1.581791863 2.6620 63.45223502
The energy eigenvalues of energy dependent
molecular Kratzer potential for the ground state diatomic molecules selected are shown in Tables 2
and 3, in the absence of the energy slope
parameter .
Table 2. Energy eigenvalues (in eV) of energy dependent Kratzer molecular potential for different values of
n and for ground states CO and NO diatomic molecules, with 0 = .
n CO CO29 NO NO29
0 0 -10.79431511 -10.79431532 -8.002659248 -8.002659417
1 0 -10.69383928 -10.69383992 -7.921456326 -7.921456839
1 -10.69337058 -10.69337123 -7.921043312 -7.921043834
2 0 -10.59475984 -10.59476089 -7.841483114 -7.841483956
1 -10.59429764 -10.59429869 -7.841076336 -7.841077188
2 -10.59337335 -10.59337441 -7.840262914 -7.840263771
3 0 -10.49705101 -10.49705246 -7.762714900 -7.762716066
1 -10.49659519 -10.49659664 -7.762314236 -7.762315413
2 -10.49568366 -10.49568512 -7.761513040 -7.761514218
3 -10.49431667 -10.49431814 -7.760311552 -7.760312744
4 0 -10.40068763 -10.40068947 -7.685127602 -7.685129079
1 -10.40023807 -10.40023992 -7.684732928 -7.684734417
2 -10.39933907 -10.39934092 -7.683943714 -7.683945203
3 -10.39799086 -10.39799272 -7.682760192 -7.682761696
4 -10.39619379 -10.39619567 -7.681182728 -7.681184246

Original article
70 Eclética Química Journal, vol. 45, n. 1, 2020, 65-76
ISSN: 1678-4618
DOI: 10.26850/1678-4618eqj.v45.1.2020.p65-77
5 0 -10.30564512 -10.30564735 -7.608697730 -7.608699509
1 -10.30520171 -10.30520394 -7.608308928 -7.608310719
2 -10.30431500 -10.30431723 -7.607531456 -7.607533248
3 -10.30298523 -10.30298747 -7.606365544 -7.606367349
4 -10.30121273 -10.30121499 -7.604811550 -7.604813368
5 -10.29899796 -10.29900024 -7.602869968 -7.602871795
Table 3. Energy eigenvalues (in eV) of energy dependent Kratzer molecular potential for different values of
n and for ground states O2 and I2 diatomic molecules, with 0 = .
n 2O O229
2I I229
0 0 -5.126358490 -5.126358625 -1.579082564 -1.579082577
1 0 -5.066640766 -5.066641151 -1.573687115 -1.573687151
1 -5.066291936 -5.066292323 -1.573677890 -1.573677925
2 0 -5.007960488 -5.007961116 -1.568319272 -1.568319330
1 -5.007617702 -5.007618329 -1.568310094 -1.568310152
2 -5.006932272 -5.006932904 -1.568291737 -1.568291796
3 0 -4.950293764 -4.950294624 -1.568291737 -1.562978927
1 -4.949956880 -4.949957740 -1.562969715 -1.562969796
2 -4.949283254 -4.949284119 -1.562951452 -1.562951533
3 -4.948273160 -4.948274034 -1.562924059 -1.562924140
4 0 -4.893617382 -4.893618469 -1.557665652 -1.557665755
1 -4.893286268 -4.893287355 -1.557656567 -1.557656670
2 -4.892624178 -4.892625268 -1.557638398 -1.557638501
3 -4.891631378 -4.891632476 -1.557611144 -1.557611248
4 -4.890308272 -4.890309388 -1.557574807 -1.557574911
5 0 -4.837908798 -4.837910103 -1.552379504 -1.552379630
1 -4.837583322 -4.837584627 -1.552370466 -1.552370591
2 -4.836932504 -4.836933812 -1.552352389 -1.552352514
3 -4.835956606 -4.835957923 -1.552325274 -1.552325399
4 -4.834656026 -4.834657357 -1.552289121 -1.552289247
5 -4.833031292 -4.833032637 -1.552243934 -1.552244060
Our results are very consistent with the results
obtained by Bayrak, Boztosun and Ciftci29. Also, it
is observed that the energy eigenvalues become more bounded as the quantum states of these
molecules increases. Moreover, with the
introduction of the energy slope parameter, the energy eigenvalues for the different diatomic
molecules tends to increase drastically (See Tables
4-6), as compared to the absence of energy slope
parameter in Tables 2 and 3.
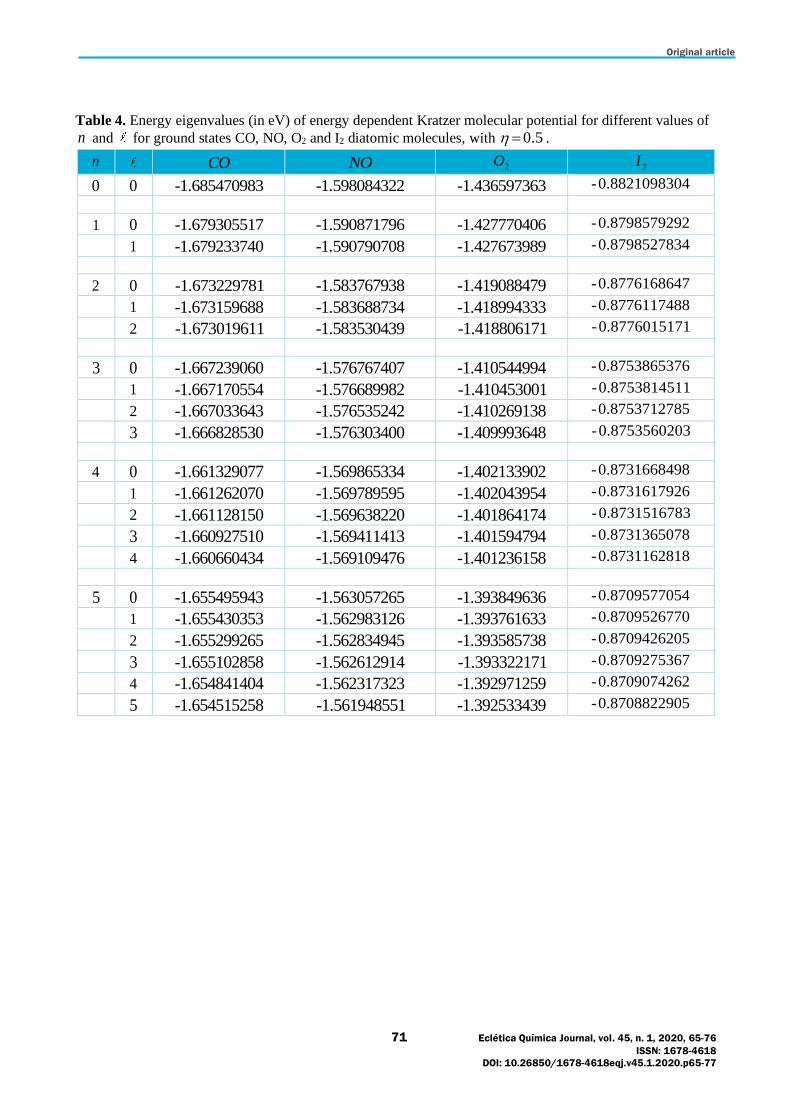
Original article
71 Eclética Química Journal, vol. 45, n. 1, 2020, 65-76
ISSN: 1678-4618
DOI: 10.26850/1678-4618eqj.v45.1.2020.p65-77
Table 4. Energy eigenvalues (in eV) of energy dependent Kratzer molecular potential for different values of
n and for ground states CO, NO, O2 and I2 diatomic molecules, with 0.5 = .
n CO NO 2O 2I
0 0 -1.685470983 -1.598084322 -1.436597363 -0.8821098304
1 0 -1.679305517 -1.590871796 -1.427770406 -0.8798579292
1 -1.679233740 -1.590790708 -1.427673989 -0.8798527834
2 0 -1.673229781 -1.583767938 -1.419088479 -0.8776168647
1 -1.673159688 -1.583688734 -1.418994333 -0.8776117488
2 -1.673019611 -1.583530439 -1.418806171 -0.8776015171
3 0 -1.667239060 -1.576767407 -1.410544994 -0.8753865376
1 -1.667170554 -1.576689982 -1.410453001 -0.8753814511
2 -1.667033643 -1.576535242 -1.410269138 -0.8753712785
3 -1.666828530 -1.576303400 -1.409993648 -0.8753560203
4 0 -1.661329077 -1.569865334 -1.402133902 -0.8731668498
1 -1.661262070 -1.569789595 -1.402043954 -0.8731617926
2 -1.661128150 -1.569638220 -1.401864174 -0.8731516783
3 -1.660927510 -1.569411413 -1.401594794 -0.8731365078
4 -1.660660434 -1.569109476 -1.401236158 -0.8731162818
5 0 -1.655495943 -1.563057265 -1.393849636 -0.8709577054
1 -1.655430353 -1.562983126 -1.393761633 -0.8709526770
2 -1.655299265 -1.562834945 -1.393585738 -0.8709426205
3 -1.655102858 -1.562612914 -1.393322171 -0.8709275367
4 -1.654841404 -1.562317323 -1.392971259 -0.8709074262
5 -1.654515258 -1.561948551 -1.392533439 -0.8708822905
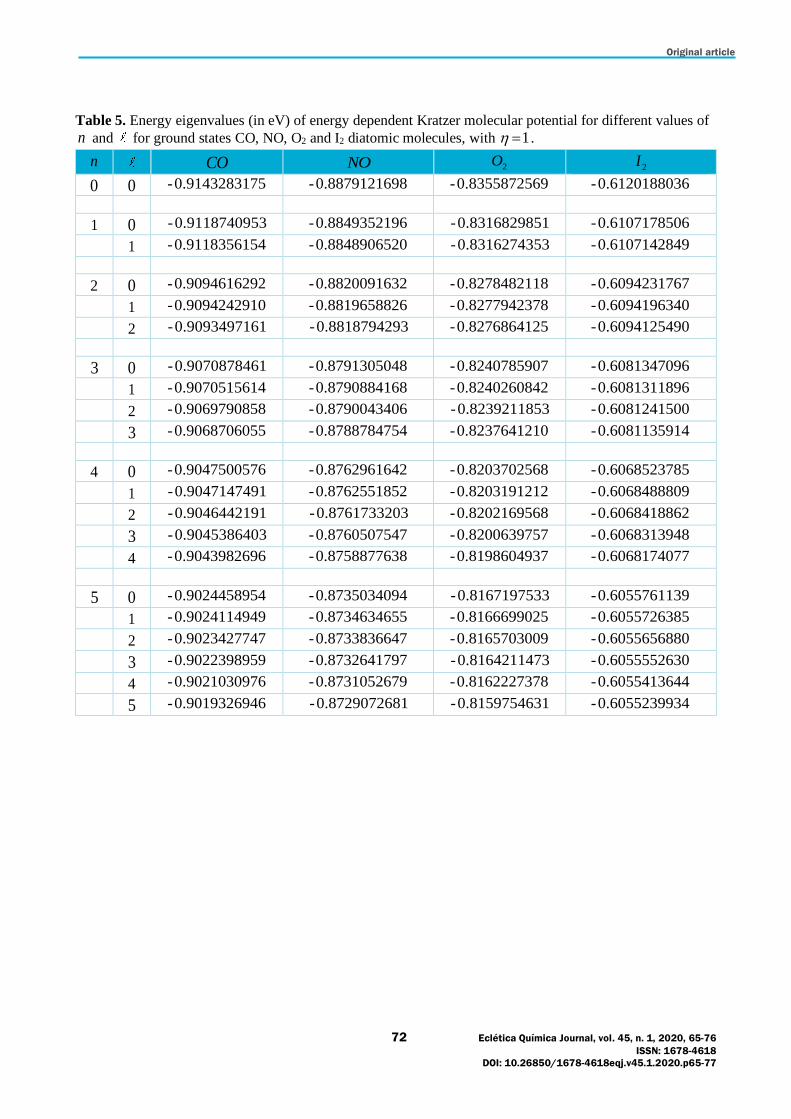
Original article
72 Eclética Química Journal, vol. 45, n. 1, 2020, 65-76
ISSN: 1678-4618
DOI: 10.26850/1678-4618eqj.v45.1.2020.p65-77
Table 5. Energy eigenvalues (in eV) of energy dependent Kratzer molecular potential for different values of
n and for ground states CO, NO, O2 and I2 diatomic molecules, with 1 = .
n CO NO 2O 2I
0 0 -0.9143283175 -0.8879121698 -0.8355872569 -0.6120188036
1 0 -0.9118740953 -0.8849352196 -0.8316829851 -0.6107178506
1 -0.9118356154 -0.8848906520 -0.8316274353 -0.6107142849
2 0 -0.9094616292 -0.8820091632 -0.8278482118 -0.6094231767
1 -0.9094242910 -0.8819658826 -0.8277942378 -0.6094196340
2 -0.9093497161 -0.8818794293 -0.8276864125 -0.6094125490
3 0 -0.9070878461 -0.8791305048 -0.8240785907 -0.6081347096
1 -0.9070515614 -0.8790884168 -0.8240260842 -0.6081311896
2 -0.9069790858 -0.8790043406 -0.8239211853 -0.6081241500
3 -0.9068706055 -0.8788784754 -0.8237641210 -0.6081135914
4 0 -0.9047500576 -0.8762961642 -0.8203702568 -0.6068523785
1 -0.9047147491 -0.8762551852 -0.8203191212 -0.6068488809
2 -0.9046442191 -0.8761733203 -0.8202169568 -0.6068418862
3 -0.9045386403 -0.8760507547 -0.8200639757 -0.6068313948
4 -0.9043982696 -0.8758877638 -0.8198604937 -0.6068174077
5 0 -0.9024458954 -0.8735034094 -0.8167197533 -0.6055761139
1 -0.9024114949 -0.8734634655 -0.8166699025 -0.6055726385
2 -0.9023427747 -0.8733836647 -0.8165703009 -0.6055656880
3 -0.9022398959 -0.8732641797 -0.8164211473 -0.6055552630
4 -0.9021030976 -0.8731052679 -0.8162227378 -0.6055413644
5 -0.9019326946 -0.8729072681 -0.8159754631 -0.6055239934
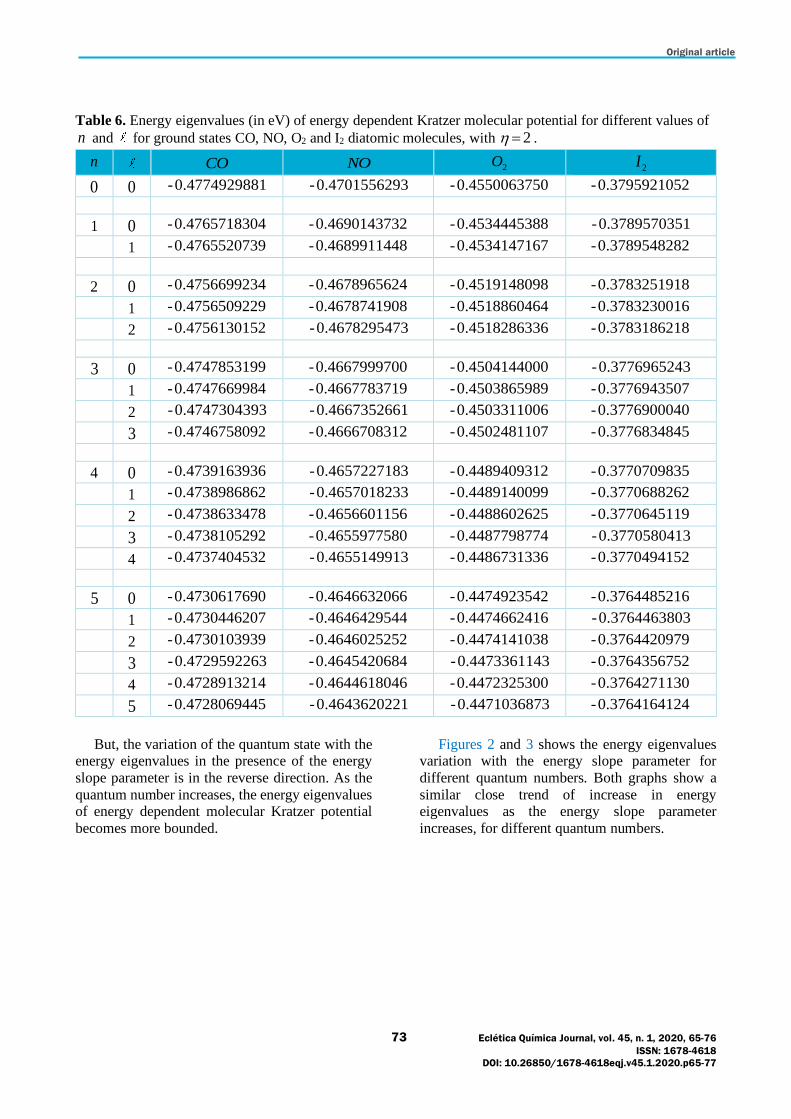
Original article
73 Eclética Química Journal, vol. 45, n. 1, 2020, 65-76
ISSN: 1678-4618
DOI: 10.26850/1678-4618eqj.v45.1.2020.p65-77
Table 6. Energy eigenvalues (in eV) of energy dependent Kratzer molecular potential for different values of
n and for ground states CO, NO, O2 and I2 diatomic molecules, with 2 = .
n CO NO 2O 2I
0 0 -0.4774929881 -0.4701556293 -0.4550063750 -0.3795921052
1 0 -0.4765718304 -0.4690143732 -0.4534445388 -0.3789570351
1 -0.4765520739 -0.4689911448 -0.4534147167 -0.3789548282
2 0 -0.4756699234 -0.4678965624 -0.4519148098 -0.3783251918
1 -0.4756509229 -0.4678741908 -0.4518860464 -0.3783230016
2 -0.4756130152 -0.4678295473 -0.4518286336 -0.3783186218
3 0 -0.4747853199 -0.4667999700 -0.4504144000 -0.3776965243
1 -0.4747669984 -0.4667783719 -0.4503865989 -0.3776943507
2 -0.4747304393 -0.4667352661 -0.4503311006 -0.3776900040
3 -0.4746758092 -0.4666708312 -0.4502481107 -0.3776834845
4 0 -0.4739163936 -0.4657227183 -0.4489409312 -0.3770709835
1 -0.4738986862 -0.4657018233 -0.4489140099 -0.3770688262
2 -0.4738633478 -0.4656601156 -0.4488602625 -0.3770645119
3 -0.4738105292 -0.4655977580 -0.4487798774 -0.3770580413
4 -0.4737404532 -0.4655149913 -0.4486731336 -0.3770494152
5 0 -0.4730617690 -0.4646632066 -0.4474923542 -0.3764485216
1 -0.4730446207 -0.4646429544 -0.4474662416 -0.3764463803
2 -0.4730103939 -0.4646025252 -0.4474141038 -0.3764420979
3 -0.4729592263 -0.4645420684 -0.4473361143 -0.3764356752
4 -0.4728913214 -0.4644618046 -0.4472325300 -0.3764271130
5 -0.4728069445 -0.4643620221 -0.4471036873 -0.3764164124
But, the variation of the quantum state with the energy eigenvalues in the presence of the energy
slope parameter is in the reverse direction. As the
quantum number increases, the energy eigenvalues of energy dependent molecular Kratzer potential
becomes more bounded.
Figures 2 and 3 shows the energy eigenvalues variation with the energy slope parameter for
different quantum numbers. Both graphs show a
similar close trend of increase in energy eigenvalues as the energy slope parameter
increases, for different quantum numbers.
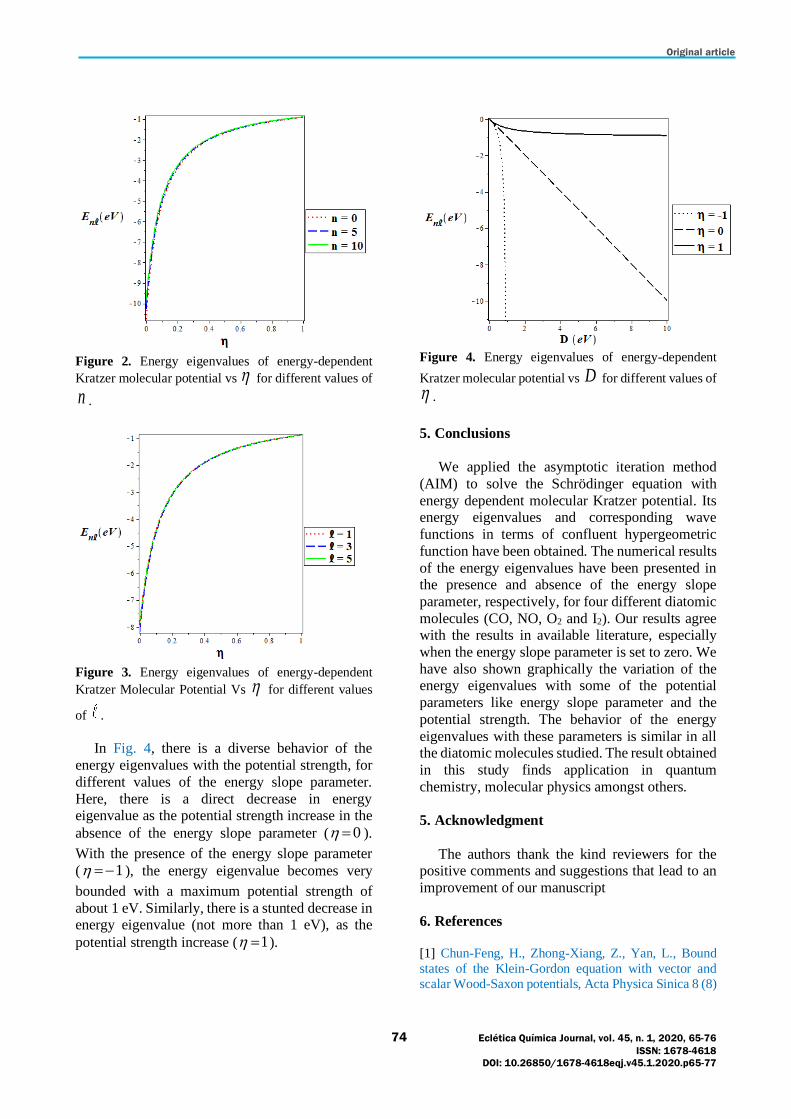
Original article
74 Eclética Química Journal, vol. 45, n. 1, 2020, 65-76
ISSN: 1678-4618
DOI: 10.26850/1678-4618eqj.v45.1.2020.p65-77
Figure 2. Energy eigenvalues of energy-dependent
Kratzer molecular potential vs for different values of
n .
Figure 3. Energy eigenvalues of energy-dependent
Kratzer Molecular Potential Vs for different values
of .
In Fig. 4, there is a diverse behavior of the
energy eigenvalues with the potential strength, for
different values of the energy slope parameter.
Here, there is a direct decrease in energy eigenvalue as the potential strength increase in the
absence of the energy slope parameter ( 0 = ).
With the presence of the energy slope parameter
( 1 =− ), the energy eigenvalue becomes very
bounded with a maximum potential strength of
about 1 eV. Similarly, there is a stunted decrease in energy eigenvalue (not more than 1 eV), as the
potential strength increase ( 1 = ).
Figure 4. Energy eigenvalues of energy-dependent
Kratzer molecular potential vs D for different values of
.
5. Conclusions
We applied the asymptotic iteration method
(AIM) to solve the Schrödinger equation with
energy dependent molecular Kratzer potential. Its energy eigenvalues and corresponding wave
functions in terms of confluent hypergeometric
function have been obtained. The numerical results
of the energy eigenvalues have been presented in the presence and absence of the energy slope
parameter, respectively, for four different diatomic
molecules (CO, NO, O2 and I2). Our results agree with the results in available literature, especially
when the energy slope parameter is set to zero. We
have also shown graphically the variation of the energy eigenvalues with some of the potential
parameters like energy slope parameter and the
potential strength. The behavior of the energy
eigenvalues with these parameters is similar in all the diatomic molecules studied. The result obtained
in this study finds application in quantum
chemistry, molecular physics amongst others.
5. Acknowledgment
The authors thank the kind reviewers for the positive comments and suggestions that lead to an
improvement of our manuscript
6. References
[1] Chun-Feng, H., Zhong-Xiang, Z., Yan, L., Bound
states of the Klein-Gordon equation with vector and
scalar Wood-Saxon potentials, Acta Physica Sinica 8 (8)

Original article
75 Eclética Química Journal, vol. 45, n. 1, 2020, 65-76
ISSN: 1678-4618
DOI: 10.26850/1678-4618eqj.v45.1.2020.p65-77
(1999) 561-565. https://doi.org/10.1088/1004-
423X/8/8/001.
[2] Sever, R., Tezan, C., Yesiltas, O., Bucurgat, M.,
Exact Solution of Effective Mass Schrödinger Equation
for the Hulthen Potential, International Journal of
Theoretical Physics 47 (9) (2008) 2243-2248.
https://doi.org/10.1007/s10773-008-9656-7.
[3] Ikhdair, S. M., An approximate κ state solutions of
the Dirac equation for the generalized Morse potential
under spin and pseudospin symmetry, Journal of Mathematical Physics 52 (5) (2011) 1-22.
https://doi.org/10.1063/1.3583553.
[4] Maghsoodi, E., Hassanabadi, H., Zarrinkamar, S.,
Spectrum of Dirac Equation Under Deng–Fan Scalar
and Vector Potentials and a Coulomb Tensor Interaction
by SUSYQM, Few-Body Systems 53 (3-4) (2012) 525-
538. https://doi.org/10.1007/s00601-012-0314-5.
[5] Ikot, A. N., Akpabio, L. E., Umoren, E. B., Exact
Solution of Schrödinger Equation with Inverted Woods-
Saxon and Manning-Rosen Potential, Journal of
Scientific Research 3 (1) (2011) 25-33. https://doi.org/10.3329/jsr.v3i1.5310.
[6] Qiang, W. C., Dong, S. H., Analytical
approximations to the solutions of the Manning–Rosen
potential with centrifugal term, Physics Letters A 368
(1-2) (2007) 13-17.
https://doi.org/10.1016/j.physleta.2007.03.057.
[7] Yahya, W. A., Oyewumi, K. J., Thermodynamic
properties and approximate solutions of the ℓ-state
Pöschl–Teller-type potential, Journal of the Association
of Arab Universities for Basic and Applied Sciences 21
(1) (2016) 53-58. https://doi.org/10.1016/j.jaubas.2015.04.001.
[8] Sun, Y., He, S., Jia, C-S., Equivalence of the
deformed modified Rosen–Morse potential energy
model and the Tietz potential energy model, Physica
Scripta 87 (2) (2013) 1-5. https://doi.org/10.1088/0031-
8949/87/02/025301.
[9] Edet, C. O., Okoi P. O., Any l-State Solutions of
the Schrödinger Equation for q Deformed Hulthen plus
Generalized Inverse Quadratic Yukawa Potential in
Arbitrary Dimensions, Revista Mexicana de Física 65
(2019) 333-344.
https://doi.org/10.31349/RevMexFis.65.333.
[10] Edet, C. O., Okorie, U. S., Ngiangia, A. T., Ikot,
A. N., Bound state solutions of the Schrödinger
equation for the modified Kratzer potential plus
screened Coulomb potential, Indian Journal of Physics
(2019) 1-9. https://doi.org/10.1007/s12648-019-01477-
9.
[11] Edet, C. O., Okoi P. O., Chima S. O, Analytic
solutions of the Schrödinger equation with non-central
generalized inverse quadratic Yukawa potential, Revista
Brasileira de Ensino de Física 42 (e20190083) (2019) 1-
9. https://doi.org/10.1590/1806-9126-RBEF-2019-
0083.
[12] Ciftci, H., Hall, R. L., Saad, N., Asymptotic
iteration method for eigenvalue problems, Journal of Physics A: Mathematical and General 36 (47) (2003)
11807-11816. https://doi.org//10.1088/0305-
4470/36/47/008.
[13] Falaye, B. J., Any ℓ-state solutions of the Eckart
potential via asymptotic iteration method, Central
European Journal of Physics 10 (4) (2012) 960-965.
https://doi.org/10.2478/s11534-012-0047-6.
[14] Qiang, W. C., Dong, S. H., Proper quantization rule,
EPL Europhysics Letters 89 (1) (2010) 10003.1-
10003.2. https://doi.org/10.1209/0295-5075/89/10003.
[15] Ikhdair, S. M., Sever, R., Exact quantization rule to the Kratzer-type potentials: an application to the
diatomic molecules, Journal of Mathematical Chemistry
45 (4) (2009) 1137-1152.
https://doi.org/10.1007/s10910-008-9438-8.
[16] Okorie, U. S., Ikot, A. N., Edet, C. O., Akpan, I. O.,
Sever, R., Rampho, R., Solutions of the Klein Gordon
equation with generalized hyperbolic potential in D-
dimensions, Journal of Physics Communication 3
(095015) (2019). https://doi.org/10.1088/2399-
6528/ab42c6.
[17] Onate, C. A., Ojonubah, J. O., Eigensolutions of the Schrödinger equation with a class of Yukawa potentials
via supersymmetric approach, Journal of Theoretical
and Applied Physics 10 (1) (2016) 21-26.
https://doi.org/10.1007/s40094-015-0196-2.
[18] Ikot, A. N., Obong, H. P., Abbey, T. M., Zare, S.,
Ghafourian, M., Hassanabadi, H., Bound and scattering
state of position dependent mass Klein–Gordon
equation with Hulthen plus deformed-type hyperbolic
potential, Few-Body Systems 57 (9) (2016) 807-822.
https://doi.org/10.1007/s00601-016-1111-3.
[19] Onate, C. A., Onyeaju, M. C., Ikot, A. N.,
Ojonubah, J. O., Analytical solutions of the Klein–Gordon equation with a combined potential, Chinese
Journal of Physics 54 (5) (2016) 820-829.
https://doi.org/10.1016/j.cjph.2016.08.007.
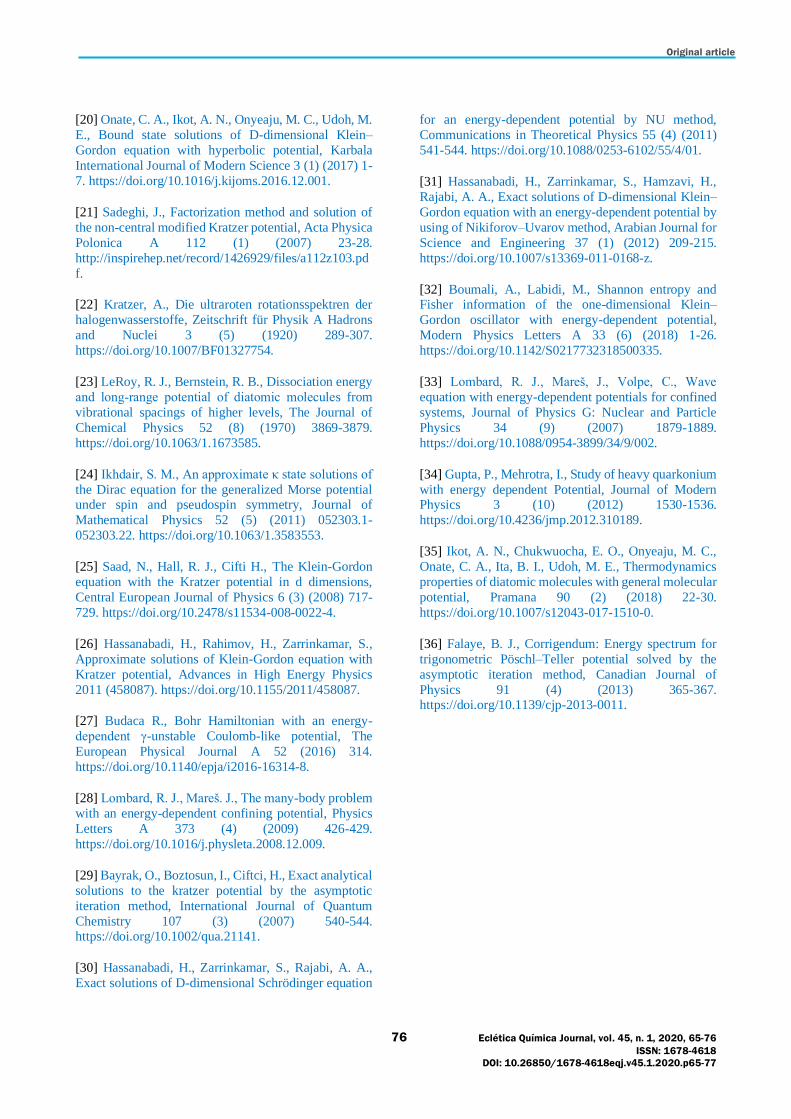
Original article
76 Eclética Química Journal, vol. 45, n. 1, 2020, 65-76
ISSN: 1678-4618
DOI: 10.26850/1678-4618eqj.v45.1.2020.p65-77
[20] Onate, C. A., Ikot, A. N., Onyeaju, M. C., Udoh, M.
E., Bound state solutions of D-dimensional Klein–
Gordon equation with hyperbolic potential, Karbala
International Journal of Modern Science 3 (1) (2017) 1-
7. https://doi.org/10.1016/j.kijoms.2016.12.001.
[21] Sadeghi, J., Factorization method and solution of
the non-central modified Kratzer potential, Acta Physica
Polonica A 112 (1) (2007) 23-28.
http://inspirehep.net/record/1426929/files/a112z103.pd
f.
[22] Kratzer, A., Die ultraroten rotationsspektren der
halogenwasserstoffe, Zeitschrift für Physik A Hadrons
and Nuclei 3 (5) (1920) 289-307.
https://doi.org/10.1007/BF01327754.
[23] LeRoy, R. J., Bernstein, R. B., Dissociation energy
and long‐range potential of diatomic molecules from
vibrational spacings of higher levels, The Journal of
Chemical Physics 52 (8) (1970) 3869-3879.
https://doi.org/10.1063/1.1673585.
[24] Ikhdair, S. M., An approximate κ state solutions of
the Dirac equation for the generalized Morse potential under spin and pseudospin symmetry, Journal of
Mathematical Physics 52 (5) (2011) 052303.1-
052303.22. https://doi.org/10.1063/1.3583553.
[25] Saad, N., Hall, R. J., Cifti H., The Klein-Gordon
equation with the Kratzer potential in d dimensions,
Central European Journal of Physics 6 (3) (2008) 717-
729. https://doi.org/10.2478/s11534-008-0022-4.
[26] Hassanabadi, H., Rahimov, H., Zarrinkamar, S.,
Approximate solutions of Klein-Gordon equation with
Kratzer potential, Advances in High Energy Physics
2011 (458087). https://doi.org/10.1155/2011/458087.
[27] Budaca R., Bohr Hamiltonian with an energy-
dependent γ-unstable Coulomb-like potential, The
European Physical Journal A 52 (2016) 314.
https://doi.org/10.1140/epja/i2016-16314-8.
[28] Lombard, R. J., Mareš. J., The many-body problem
with an energy-dependent confining potential, Physics
Letters A 373 (4) (2009) 426-429.
https://doi.org/10.1016/j.physleta.2008.12.009.
[29] Bayrak, O., Boztosun, I., Ciftci, H., Exact analytical
solutions to the kratzer potential by the asymptotic
iteration method, International Journal of Quantum
Chemistry 107 (3) (2007) 540-544. https://doi.org/10.1002/qua.21141.
[30] Hassanabadi, H., Zarrinkamar, S., Rajabi, A. A.,
Exact solutions of D-dimensional Schrödinger equation
for an energy-dependent potential by NU method,
Communications in Theoretical Physics 55 (4) (2011)
541-544. https://doi.org/10.1088/0253-6102/55/4/01.
[31] Hassanabadi, H., Zarrinkamar, S., Hamzavi, H.,
Rajabi, A. A., Exact solutions of D-dimensional Klein–
Gordon equation with an energy-dependent potential by
using of Nikiforov–Uvarov method, Arabian Journal for
Science and Engineering 37 (1) (2012) 209-215.
https://doi.org/10.1007/s13369-011-0168-z.
[32] Boumali, A., Labidi, M., Shannon entropy and Fisher information of the one-dimensional Klein–
Gordon oscillator with energy-dependent potential,
Modern Physics Letters A 33 (6) (2018) 1-26.
https://doi.org/10.1142/S0217732318500335.
[33] Lombard, R. J., Mareš, J., Volpe, C., Wave
equation with energy-dependent potentials for confined
systems, Journal of Physics G: Nuclear and Particle
Physics 34 (9) (2007) 1879-1889.
https://doi.org/10.1088/0954-3899/34/9/002.
[34] Gupta, P., Mehrotra, I., Study of heavy quarkonium
with energy dependent Potential, Journal of Modern Physics 3 (10) (2012) 1530-1536.
https://doi.org/10.4236/jmp.2012.310189.
[35] Ikot, A. N., Chukwuocha, E. O., Onyeaju, M. C.,
Onate, C. A., Ita, B. I., Udoh, M. E., Thermodynamics
properties of diatomic molecules with general molecular
potential, Pramana 90 (2) (2018) 22-30.
https://doi.org/10.1007/s12043-017-1510-0.
[36] Falaye, B. J., Corrigendum: Energy spectrum for
trigonometric Pöschl–Teller potential solved by the
asymptotic iteration method, Canadian Journal of
Physics 91 (4) (2013) 365-367. https://doi.org/10.1139/cjp-2013-0011.