Atlantic Geoscience Society Abstracts: 45th Annual Colloquium ...

Dig_fieldwk_pap_revised KJM etal. page 1 of 35
Unlocking the spatial dimension: digital technologies and the future of geoscience fieldwork
McCaffrey, K.J.W.1, Jones, R.R.2,3, Holdsworth, R.E.1, Wilson, R.W.1, Clegg, P.1, Imber, J.1,
Holliman, N.2 & Trinks, I.2
1Reactivation Research Group, Department of Earth Sciences, University of Durham, DH1 3LE, 2e-science Institute, University of Durham, DH1 3LE, 3Geospatial Research Ltd, Department of Earth Sciences, University of Durham, DH1 3LE. (e-mail: [email protected])
Keywords: Geospatial data, fieldwork, digital mapping, survey, visualisation Abstract: The development of affordable digital technologies that enable the collection and
analysis of georeferenced field data potentially represents one of the most significant changes in
field-based geoscientific study since the invention of the geological map. In this paper, we describe
a range of digital mapping and surveying systems and give examples of their use. Digital methods
make it easier to re-use pre-existing data (e.g. previous field data, geophysical survey, satellite
images) to provide supplementary information during renewed phases of fieldwork. Increased
spatial accuracy is central to modern methods of geostatistics and geospatial analysis that inform
hypothesis testing during fieldwork. New high resolution geomatic surveys, including laser
scanning methods, enable 3D photorealistic outcrop data to be captured and interpreted using
novel visualisation and analysis methods.
Collectively, the new techniques allow 3D models of geological architectures to be
constructed directly from field data, in ways that are more robust compared to the abstract models
constructed by individual geoscientists, and which permit explicit information on uncertainty to be
carried forward from field data to the final product. In addition, better data management on projects
is possible using geospatially referenced databases that match institutional and/or agreed national
or international data standards. Current work is focused upon the development and implementation
of a more streamlined digital workflow from the initial data acquisition stage to the final project
output.
Words 8424, Figure 5, Tables 5

Dig_fieldwk_pap_revised KJM etal. page 2 of 35
Geoscientists understand that their subject is inherently both spatial and temporal in nature. While
advances in geochronological and chronostratigraphical methods have improved our temporal
resolution markedly in recent years, spatial resolution, particularly for field-based observations, has
not improved significantly during the last two centuries. With the recent convergence of key digital
technologies for the collection and analysis of spatial data, we are now on the threshold of
significant improvements in spatial resolution in general geoscience fieldwork. Specifically, digital
fieldwork methods that have previously only been available to industry and national survey
personnel are now within the price range of most geoscientists.
Since the mid-18th century geospatial data have generally been presented on geological
maps (Greenly & Williams, 1930), and are a fundamental tool that show the distribution of rocks on
the surface of the earth and their three-dimensional arrangement underground (Maltman 1998).
Geologists debated 150 years ago whether it was better to report observations in a narrative form
or a graphical form using maps (Turner 2000). The modern-day ubiquity of the geological map was
emphasised by Wallace in a 1975 Jacklin lecture (quoted in Barnes & Lisle 2004) “There is no
substitute for a geological map and section – absolutely none. There never was and there never
will be”. In this paper we pose the question whether the acquisition, visualisation and analysis of
high-resolution digital geospatial field databases will similarly revolutionise the Earth Sciences by
adding an unparalleled degree of spatial precision to geoscientific observations.
Paper-based fieldwork methods have made fundamental contributions to our current state of
knowledge of the Earth’s surface and subsurface geology. However they have remained virtually
unchanged and are essentially the same as those used 200 years ago. In the geosciences, as in
all scientific disciplines, digital methods are increasingly used for data management, analysis, and
visualization, but for fieldwork these activities generally take place back in the laboratory and are
rarely used routinely in the field. Most geoscientists already digitize their field data by transcribing
into spreadsheets or databases, and by reproducing field maps on cartographic or graphic
packages in the office or laboratory. More generally, there are ongoing national survey initiatives to
‘digitize’ existing paper maps at a range of scales. We view this type of digitizing as a secondary

Dig_fieldwk_pap_revised KJM etal. page 3 of 35
process and contrast it with primary digital field data acquisition that is the focus of this paper. We
suggest that the latter offers clear advantages to traditional methods.
A number of technological advances have increasingly helped to make methods of digital
field data acquisition a practical, low-cost alternative to paper-based fieldwork systems (Fig. 1). In
addition, these methods offer new types of spatial analysis that were previously impossible or
impractical to achieve by conventional mapping methods. The cheaper components include
handheld GPS (Global Positioning Systems); lightweight palmtop or hand-held computers capable
of running mobile GIS (Geographic Information System) software with wireless communication.
More expensive alternatives offer more functionality and spatial precision and include: more
accurate differential GPS (DGPS) and Survey-grade GPS receivers; laser ranging and scanning
devices; and lightweight, energy efficient 2D (and increasingly, 3D) mobile display technology. A
parallel development has been the increased availability of digital map and topographic data from
national and international survey organisations. Pioneers have claimed that digital methods can
improve the quality and efficiency of field data collection because they: 1) have potentially better
spatial accuracy than traditional methods; 2) streamline the workflow from ‘data acquisition to
published product’; 3) allow better visualization of data in 2D and 3D; and 4) yield further geological
insights because of the enhanced ability to perform geospatial analysis in addition to more
traditional geometrical or temporal analysis of geological architectures.
The aim of this paper is to explore the new digital fieldwork methods and examine their
potential to improve our understanding of geological architectures. Where possible we use
quantitative data to examine critically the benefits of digital versus traditional methods, and where
quantitative information is lacking we provide a qualitative assessment on the advantages and
disadvantages of digital methods compared with conventional approaches. Finally we discuss the
current and future development of digital methodologies for geoscience fieldwork.
Geoscientific fieldwork
Geoscientific fieldwork is undertaken using a large variety of methods over a range of scales, and
includes geochemical sampling, collecting geophysical data, reconnaissance mapping using
Dig_fieldwk_pap_revised KJM etal. page 4 of 35
remote sensing or highly detailed ‘cairn’ mapping (Table 1). Traditional fieldwork methods are well
covered elsewhere (Greenly & Wiliams 1930; Barnes 1981; Compton 1985; Barnes & Lisle 2004).
We describe here digital data acquisition systems that can be used for a range of geoscience
fieldwork purposes. For some activities, such as geological mapping, it is desirable to interpret
observations during the mapping process and to modify the interpretation as more information is
acquired (Jones et al. 2004). By incorporating visualisation and analysis into the mapping
workflow, digital methods can aid the interpretation process and examples are given at the end of
this section.
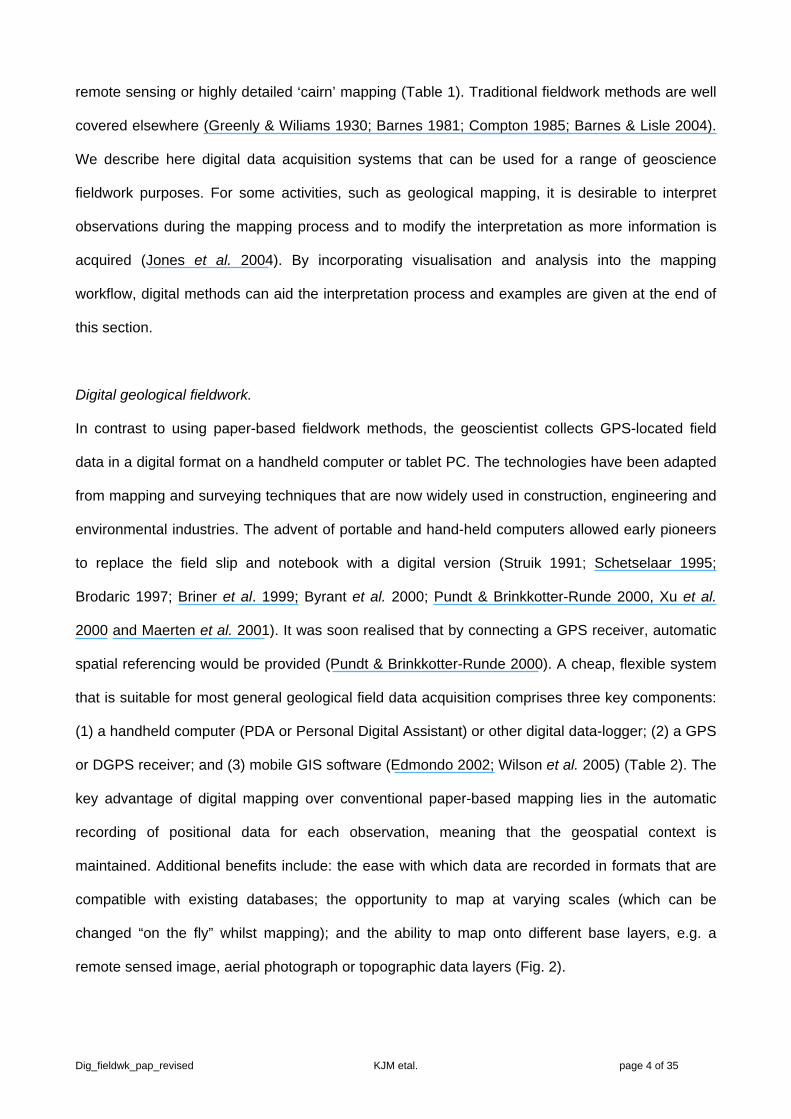
Digital geological fieldwork.
In contrast to using paper-based fieldwork methods, the geoscientist collects GPS-located field
data in a digital format on a handheld computer or tablet PC. The technologies have been adapted
from mapping and surveying techniques that are now widely used in construction, engineering and
environmental industries. The advent of portable and hand-held computers allowed early pioneers
to replace the field slip and notebook with a digital version (Struik 1991; Schetselaar 1995;
Brodaric 1997; Briner et al. 1999; Byrant et al. 2000; Pundt & Brinkkotter-Runde 2000, Xu et al.
2000 and Maerten et al. 2001). It was soon realised that by connecting a GPS receiver, automatic
spatial referencing would be provided (Pundt & Brinkkotter-Runde 2000). A cheap, flexible system
that is suitable for most general geological field data acquisition comprises three key components:
(1) a handheld computer (PDA or Personal Digital Assistant) or other digital data-logger; (2) a GPS
or DGPS receiver; and (3) mobile GIS software (Edmondo 2002; Wilson et al. 2005) (Table 2). The
key advantage of digital mapping over conventional paper-based mapping lies in the automatic
recording of positional data for each observation, meaning that the geospatial context is
maintained. Additional benefits include: the ease with which data are recorded in formats that are
compatible with existing databases; the opportunity to map at varying scales (which can be
changed “on the fly” whilst mapping); and the ability to map onto different base layers, e.g. a
remote sensed image, aerial photograph or topographic data layers (Fig. 2).

Dig_fieldwk_pap_revised KJM etal. page 5 of 35
Most handheld GPS receivers designed for the leisure industry provide locational
information to 3-10m precision (Table 2) and are adequate for mapping at scales of 1:10,000 or
smaller. Differential GPS receivers use additional data from geostationary satellites or land-based
beacon stations to reduce systematic errors (e.g, due to atmospheric conditions) and provide
spatial precision to 0.3m which is adequate for mapping at scales up to 1:300. An example of a
simple digital mapping project carried out to provide a teaching resource is shown in Figure 2. The
Assynt region, NW Scotland is a world-famous site to view the Moine Thrust Zone and its foreland
geology of metamorphic Lewisian basement overlain by red-bed deposits of the Torridonian and
the Cambro-Ordovician shelf sequence (Johnson & Parsons 1979). Digital geological mapping to a
precision of 0.3m was carried out over a small part of this region. Contacts were mapped as line
boundaries and structural data (bedding dip/strike) collected as point measurements (Fig. 2a)
allowing polygons to be drawn to represent geological formations. Digital photographs of key
outcrops were also taken. This small area (3 km2) was mapped in approximately half a day and the
results processed and displayed in a further half day on-site. The GIS data were overlain or
‘draped’ onto a digital elevation model, in the form of a surface fitted to a raster map of elevation
values, to produce a display that has been referred to as a 2.5D1 representation (Pundt &
Brinkkotter-Runde 2000; Longley et al. 2001) as it represents a 2D surface with topography, i.e,
the Earth’s surface textured with the GIS data. The resulting digital geology may be displayed on a
variety of topographic, photographic or other bases and the model may be zoomed or rotated to
various vantage points (Fig. 2b), Digital photographs are linked to their location (‘hot-linked’) and
within the GIS may be accessed by clicking on specific points on the map. Viewing the geology in
2.5D provides a much better appreciation of how geology interacts with topography and has been
shown to enhance student’s 3D understanding in complex areas (McCaffrey et al. 2003).
New high-resolution digital survey methods
1 2.5D is used as a shorthand notation for 2.cD where c describes the volume filling capability of a topographic surface whose dimensionality must lie between 2 (plane) and 3 (solid object).

Dig_fieldwk_pap_revised KJM etal. page 6 of 35
Fine scale (centimetre) digital acquisition is now possible using a variety of geomatic surveying
equipment (Table 2) with either automatic attribute (e.g. colour intensity) or user-enabled attribute
(e.g. surface slope, bedding dip) recorded along with the positional data. Recorded data may be
ported to high performance visualisation systems and viewed at scales up to and larger than 1:1.
Although largely developed for engineering use, these methods are now being adapted for
geoscience data (Xu et al. 2000; Bellian et al. 2002; Rowlands et al. 2003; Ahlgren & Holmlund
2003; Jones et al. 2004; Pringle et al. 2004; Clegg et al. 2005). Laser scanning or reflectorless
surveying methods (Fig. 1) are best used on steep, vertical or overhanging sections whereas aerial
photogrammetric methods are more appropriate for beach or outcrop pavements. Kinematic or
survey-grade GPS (Fig. 1) is used to geospatially reference individual surveys or can be used as a
stand-alone acquisition tool.
The cluster of 3D data points generated during a survey is known as a ‘point cloud’ and may
be meshed to form a 2.5D outcrop surface. Attributes such as bedding dip may be directly mapped
on to this surface by using data collected at sample locations, or summarized on a contoured plot
(Fig. 3a). Alternatively, the surface may be textured from digital photographs to form a 2.5D photo-
realistic outcrop image displayed on a computer monitor (Fig. 3b-e).
Digital survey methods allow the user to carry out detailed interpretation in the laboratory
on large 3D images. The user can map stratigraphical contacts, meso-scale tectonic and
sedimentary structures, or weathering and other surface processes. The advantage over mapping
on conventional outcrop photographs is the ability to constrain the true 3D spatial architecture of
the outcrop. The ability to access parts of exposures that are inaccessible or require specialist-
climbing apparatus is also a significant improvement. The user can easily continue the analysis at
a later date to enhance the existing interpretation, add more detailed data, or supplement one
dataset with other types of information. It is clearly desirable to add information that places
constraints on the attribute of interest in the third dimension, i.e., into or out of the outcrop surface.
This may be information from a borehole, a geophysical, or a statistical model of attribute values.
As an example we present results of a digital survey of 3D fault geometry. A very fine-scale
network of minor faults were formed in Permian sandstones in the hangingwall to the Ninety

Dig_fieldwk_pap_revised KJM etal. page 7 of 35
Fathom Fault, a Late Paleozoic to Mesozoic basin-bounding fault that is exposed at Cullercoats,
NE England (Kimbell et al. 1989; Knott et al. 1996; Clegg et al. 2005; De Paola et al. 2005). The
outcrops were captured using a high-resolution laser scanner and the points coloured from digital
photographs taken from the same georeferenced position. The data were then loaded into an
interactive visualisation and fault surface fitting software package that allowed the 3D faults traces
to be picked on the topographic surface (Trinks et al. in press). 3D surfaces were fitted to the fault
traces and the resulting fracture network visualized and analysed (Fig 4). The dataset is spatially
referenced in global coordinates to 1 cm accuracy. The laser scan data took 3 hours to acquire,
including set-up time, followed by 2 days of laboratory analysis in which all discrete faults and fault
arrays with spacing of 2cm or greater were interpreted. To achieve this level of accuracy using
traditional field surveying methods would be virtually impossible. A direct comparison between the
virtual interpretation and the fault network geometries established by conventional structural
analysis (DePaola et al. 2005) is in progress.
Field-based digital visualisation
Geological information gathered by traditional geological mapping has generally been displayed in
2D representations such as geological maps, with cross-sections giving an interpretation of the
sub-surface geology. In the laboratory, increasingly powerful visualisation packages combined with
3D screen technology can be used on workstations and desktop computers and now provide
sophisticated immersive capabilities for data interpretation (Fig. 5). As discussed above, it is
particularly useful to use 2.5D perspective views to study how geological formations and structures
are related to topography. True 3D data volumetric data can be incorporated to build ‘solid’ geology
models rather than a series of stacked surfaces or parallel cross-sections (Kessler & Mathers
2004), which may then be ‘exploded’ to examine details of the model.
To date, the 2D screens on hand-held computers have generally been small, and the limited
graphics capabilities of on-board mapping packages largely restrict data visualization to simple
map-type displays in the field. Fortunately, graphics displays are now increasingly capable of
Dig_fieldwk_pap_revised KJM etal. page 8 of 35
displaying raster data at high resolution and this now allows an aerial photograph or digital
elevation model to be used as a backdrop onto which new data are displayed. These displays can
be used to view the equivalent of a traditional geological field-slip. However, they also allow more
flexible methods of visualisation that can be easily tailored to individual requirements. For example,
on-screen data may be viewed at different scales in 2D using zoom and pan functions with
different combinations of data layers displayed as required. The next stage will be to incorporate
3D viewer capability in hand-held computers with software that will allow 2.5D models to be viewed
in the field while the data are being collected or for auto-stereoscopic screens to provide a genuine
3D perspective (Holliman 2005).
Field-based digital analysis methods
Digital geospatial referencing of all field data enables powerful spatial statistical and analytical
methods to be applied to geoscientific problems (Berry 1987; 2000). Spatial statistics incorporate a
variety of methods to describe how discrete or continuous data vary across a given area. These
methods (e.g., point process, variograms and kriging) are particularly useful for data derived from
digital fieldwork methods and allow the interpolation between sample points (Fig. 3a) and the
calculation of standard error displays. Spatial analysis has developed from simple ‘geo-query’
searches on databases, (e.g., “what is at location xyz?”), to methods involving map algebra, which
perform mathematical functions on different map layers (Berry 1987). For example, Piazolo et al.
(2004) integrated geological and geophysical datasets in a GIS to define the shapes and patterns
of structural domains at a variety of scales in the northern Nagssugtoqidian orogen, west
Greenland.
Many of these spatial statistical and analytical methods have yet to be developed for direct
use in the field on a hand-held computer, but can easily be performed on a lap-top at the field
base. On-the-outcrop analysis methods such as rose diagrams, stereonet projections, frequency
plots, dip analysis, structure contour estimation, and intersecting plane calculations could relatively
easily be programmed into hand-held computers or provided as an ‘add-in’ to existing packages.
Dig_fieldwk_pap_revised KJM etal. page 9 of 35
Assessing digital field data acquisition methods
Digital field data acquisition methods are evolving rapidly and here we discuss, and where possible
test, the claimed improved data management, spatial accuracy, reproducibility of results, efficiency
of workflow, and understanding of 3D architecture that results from their use. We also assess the
perceived disadvantages of digital acquisition methods, including: poor integration and compatibly
of software and hardware; bulkiness and ruggedness of field equipment; potential data loss; and
the effects on traditional mapping skills.
Improved data management capabilities
Geoscientists collect a wide range of different types of field data and record these on a variety of
media when using traditional (non-digital) methods (Table 3). Digital geospatial databases allow
many different types of geological data to be stored together, so that the user has a visual interface
to all of the data collected for an area. Examples of data that may be included are field
photographs, regional geophysical maps, aerial photography, satellite imagery, topographic data,
previously digitised geological information, sample catalogues, geochronological data,
geochemical data, etc. By comparison, such disparate types of data would traditionally be spread
widely between field notebook, paper maps, isolated files on a computer, boxes of photographic
slides or prints, library journals, and loose papers. Digital data models are increasingly used to
store geoscientific information and systems have been devised to handle combinations of
numerical, descriptive and other non-numeric (e.g. image-based) data. A properly managed digital
database offers considerably improved data retrieval, database searching, archiving and remote
accessibility compared to conventional paper-based methods.
Since most geoscientific data is spatial in nature, i.e. specific to a given location, it is not
surprising that Geographical Information Systems (GIS) are now widely used. GIS has evolved
from its early use as a computer cartographic system and is now defined as ‘an information
management system for organizing, visualizing and analysing spatially-orientated data’ (Rhind
1992; Longley et al. 2001; Coburn & Yarus 2000 p.1). In its original guise, GIS largely dealt with 2D
data that was mapped onto the Earth’s surface (Rhind 1992). However, it was recognised that in

Dig_fieldwk_pap_revised KJM etal. page 10 of 35
order to deal with volumetric spatial information or 3D geometries from sub-surface data, a 3D GIS
or a GSIS (GeoScientific Information System) was required (Turner 1992, Mallet 1992) and these
have since been developed. GIS now combines digital database, spatial analysis and multi-
dimensional mapping capabilities, which makes it a powerful analytical tool for the geoscientist.
Increasingly Earth scientists solve new problems by analyzing old data in light of new
theories or knowledge (Rasmussen 1995). Systematic fieldwork has been carried out in the British
Isles for approximately 200 years, with generations of geoscientists having revisited the same
locations, made observations, drawn maps and logged sections. The output from the mapping
process, e.g. maps and papers published on a given study area, by necessity only provide an
interpretive summary of the primary field data that has been collected during that specific survey.
Much of the raw field data remains in field notebooks, field slips and slide collections and is
inaccessible to anyone else who wants to use it. This leads to an enormous amount of replication
of expensive data collection each time a new study takes place in any particular location. This cost
implication places limitations on the use of field data as a test of experimental or numerical studies
of Earth processes. In Britain, this is now recognized in current NERC (Natural Environmental
Research Council) policy statements that ‘regard datasets as a valuable resource in their own right’
and ‘requires that recipients of NERC grants offer to deposit with NERC a copy of datasets
resulting from the research supported…’. The National Geoscience Data Centre (NGDC) provides
long-term stewardship of geoscience datasets for onshore UK with a similar facility provided for
offshore data. Since the 1990s there have been efforts to agree international standards for
geospatial data (ISO/TC 211 and ISO 19100 series) and the definition of a Global Spatial Data
Infrastructure. Most major software vendors and the main user groups accept that these standards
will provide a framework for the long-term storage of data and will lead to a reduction in expensive
primary data reproduction. Digital mapping and survey methods also can be used to standardize
field working practices and help to ensure that data collection may be compatible with institutional
database formats. We view these developments as a positive step for the long-term stewardship of
field data compared to analogue methods whereby data remains hidden in field notebooks and
field slips.

Dig_fieldwk_pap_revised KJM etal. page 11 of 35
Increased spatial precision of field observations
The precision or error in a GPS position may be estimated by making observations at the same
location over a given length of time. The precision achievable by GPS receivers generally varies
with cost which impinges on the applications that these units should be applied to (Table 4). The
accuracy (how close the calculated position is to the ‘true’ position) can be determined by making
observations on a known survey trigonometric point. Using GPS to locate field data leads to a
significant reduction in uncertainty regarding location errors (Maerten et al. 2001). We have
benchmarked a range of GPS receivers and found that levels of precision range from 3.5 m to 1
mm (Table 4). Unsurprisingly, precision is largely related to GPS cost, but so too is the functionality
built-in to the receiver units. It is clearly important that the unit being used is fit for purpose, e.g. it is
inappropriate to locate a laser-scanned dataset with (inherent mm precision) with a hand-held GPS
receiver, whereas millimetre precision is not required for most mapping applications. We suggest
that for most digital mapping applications, a handheld GPS (e.g. Garmin etrex, Garmin Geko,
Magellan eXplorist) will give precision levels that are fit for purpose. Real-time differential GPS
systems (e.g. Trimble ProXR & GeoExplorer, Leica GS20) which regularly give precision to
approximately 0.3m in the horizontal plane should be used for detailed mapping applications. For
digital survey applications, it is essential to use a survey-grade GPS receiver in which satellite data
collected continuously at a base station are post-processed along with the data collected by a
rover unit. For rapid acquisition of high-resolution positional data, a Real Time Kinematic GPS is
required (Table 4). The positional precision and accuracy that may be achieved using all GPS units
is dependant on variations in the input satellite configuration (an error summarised by the Dilution
of Precision statistic calculated continuously by GPS receivers). By obscuring the unit from direct
line of sight to satellites, steep topography or buildings can limit the number of input satellites
available to a GPS receiver and degrade, or even prevent, a locational fix. This means that
accurate positioning near cliffs, tall buildings or in deep valleys may be difficult to achieve. As these
are often situations familiar to geoscientists, it is then necessary to collect locational data using a

Dig_fieldwk_pap_revised KJM etal. page 12 of 35
laser device or a total station with reference to nearby fixed points where sight lines to satellites are
not obscured. Another possible source of error known as ‘multi-path’ can occur when locating near
a metallic object (e.g., a chain link fence) and is due to the satellite signals travelling through the
object before encountering the receiver.
For accurate 3D reconstructions of geological architectures, the z-coordinate (i.e. elevation)
for all positions is essential. Most mobile-GIS applications allow this to be incorporated into the
data table. Despite GPS having poorer resolution in the z direction, in good conditions, a
differential GPS can give a vertical precision of approximately 1-2m. Alternatively, 2D data may be
converted to 3D by locating the positions on a digital elevation model. However, the horizontal
spacing of the grid nodes (typically 10-50m) and the precision of the values at each node (typically
± 3-10m) limits the resolution.
Increased reproducibility of results
The ability to reproduce observations and measurements is a cornerstone of scientific
methodology. In the past, it has often proved difficult to verify another geoscientist’s field
observations. Indeed the great ‘Highlands Controversy’ of the 19th century arose in part before
systematic mapping had taken place because different observers had difficulty replicating the
observations of their opponents and could never be sure they were looking at the same exposures
(Oldroyd 1990). Grid references in scientific papers are given as 8 figures at best (more commonly
6 figures), so that a given observation is located within a 10 m2 or 100 m2 grid square. In many
cases when mapping in remote areas, the precision with which a position was located using
sighting compass and field slip is probably only sufficient to warrant the use of 6 figure grid
references. Standard compass-based transit (cross-bearing) methods are not accurate enough to
be able to locate that grid square with confidence so it makes it exceedingly difficult to revisit old
field observations. Digital mapping has powerful features that improve the capability of one
geoscientist to visit the exact location an observation was made. This is because most GPS and
DGPS receivers have built-in functions to navigate back to a stored location. For example, in a
blind test a fault dataset was loaded into a handheld computer and another fieldworker who had

Dig_fieldwk_pap_revised KJM etal. page 13 of 35
not collected the data used the onboard mapping program and a real time differential GPS to
navigate to a specified fault sample location. On reaching the position stored in the database the
sampled location was 25cm north of the fieldworker. The accuracy level (approximately 0.5m2) is a
considerable improvement over the analogue methods. Real-time kinematic GPS provides even
better (sub-centimetre) precision, meaning that georeferenced observations can be reliably
revisited and re-checked. Thus arguments about interpretation are less likely to be affected by
uncertainty regarding where exactly the observation was made.
Improved efficiency
The efficiency of fieldwork can be thought of solely in terms of the time it takes to collect the field
data. In our experience of general digital fieldwork, the time savings made during acquisition of
field data are often marginal when compared with traditional methods of mapping. However, the
inherent digital nature of the acquired data gives large time savings when subsequently carrying
out detailed analysis (e.g. producing maps, stereonets, spatial analyses) and producing reports
(Maerten et al. 2001, Jones et al. 2004). For detailed digital survey applications, however, the
timesavings are very considerable, but difficult to quantify. For example, to perform a geospatial
analysis of fold structures at Cullercoats (Fig. 3a) took approximately 20 hours of data acquisition,
but this might take up to 3 weeks (or more) to carry out using traditional plane tabling methods. In
such cases it is unlikely that this type of detailed study would be ever be undertaken by traditional
methods.
Operational efficiency is difficult to assess in a quantitative manner. On the one hand, PDA
units with on-board mapping are now capable of displaying both raster and vector GIS data at a
variety of scales. Newly acquired field data can then be displayed along with snippets from large
existing databases, leading to an improved appreciation of the relationship between individual
localities and the regional architectures. Improved 3D display capabilities for PDAs mean that in
the near future the geoscientist will be able to use 3D displays whilst collecting data. This could
have many advantages when attempting to visualize complex 3D architectures in the field and may
allow better ‘on-the-spot’ hypothesis testing while carrying out the fieldwork. On the other hand, the

Dig_fieldwk_pap_revised KJM etal. page 14 of 35
complexity of PDA units with on-board mapping means that the simplicity of paper-based methods
is lost and could lead to a loss of focus on the problem at hand (see below).
Improved understanding of 3D architecture
It is frequently claimed that digital methods can improve our understanding of 3D architecture
(Pundt & Brinkkotter-Runde 2000; Maerten et al. 2001; McCaffrey et al. 2003, Jones et al. 2004;
Kessler & Mathers 2004, Clegg et al. 2005, Wilson et al. 2005). While the 2.5D perspective views
discussed earlier allow an improved appreciation of 3D structure in areas of topographic relief (see
McCaffrey et al. 2003), the ability to work in ‘true’ 3D is essential to those working in many
petroleum, mining and other applied geoscience industries. Here, the data (drill-hole core and logs,
depth-migrated 3D seismic reflection surveys etc) provide precise x,y,depth-located (z) information
on sub-surface geological architectures. For the field-based geoscientist, the cross-section (and
fence diagram) have long been the principal tools for depicting the interpreted sub-surface and
above-surface three-dimensional architecture. Both digital mapping and digital survey methods
produce 3D geospatially located data that can be input into 3D GIS that provide an alternative to
paper-based cross-section drawing methods (Kessler & Mathers 2004). These ‘solid’ models
provide a volumetric understanding of the true 3D significance of the data collected relative to all
other data in the model. New immersive technologies mean that complex solid architectures are
explored from ‘within’ rather than viewed from the outside (e.g. Fig. 5). Thus digital fieldwork
methods offer the field geoscientist a similar environment to the industry professional in which to
explore and interpret their datasets and allow more direct comparisons between surface and sub-
surface data to be made (Clegg et al. 2005).
Uncertainty in field data collection
An inherent property of any fieldwork is that the data collected on a 2 or 2.5D surface occupy a
very small part of a 3D volume, i.e. the datasets are sparse in 3D space. To make 3D
interpretations from field data it is necessary to reduce uncertainty in 3D volume predictions by
using additional control from bore-holes or geophysical exploration, e.g. (Pringle et al. 2004; Zeng

Dig_fieldwk_pap_revised KJM etal. page 15 of 35
et al. 2004). Failing this, the volume must be populated by either stochastic or deterministic
methods and 3D visualisation then becomes a tool in which to visualise the 3D structure of the
numerical model and allows validation using field datasets.
In addition to representing an accurate and efficient means of collecting field data, digital
mapping techniques open up new possibilities to include an assessment of the certainty or
uncertainty associated with the mapping process and using this to evaluate the validity of
competing interpretations (Jones et al. 2004; Table 5). In the traditional paper-based approach,
these uncertainties are at worst ignored or at best noted in the field notebook. They then tend not
to be considered further in the analysis process, and consequently are not available to the end-
user. GIS-based data structures provide a means of including geospatially located qualitative
statements of uncertainty together with quantitative data (such as precision levels of GPS
measurements) in 3D models. Key to this is that the ‘solid’ 3D models of the Earth’s architecture
explicitly use the geospatially located data in its ‘real’ position relative to all other data in the model.
This permits uncertainty statements regarding data quality to be analysed by various logic-based
methods and their locations viewed relative to the resulting geological interpretations in 3D. This
potentially provides a powerful new method of handling uncertainty in field-based geological
architectures.
Field performance/operational issues
The cost of robust, weather resistant equipment is still relatively high (although prices are falling
rapidly). Handheld computers (PDA) are largely designed for office and personal use, although with
care may be used in the field (Wilson et al. 2005). Cheaper equipment is generally not robust
enough for long-term use or expedition fieldwork.
Developments in battery technology have played a key role in the usability of digital
geological mapping and survey equipment. Lightweight, long-life rechargeable batteries are
required to power handheld computers and GPS equipment. Typically the fieldworker will get a
maximum of 6-8 hours use from most units, meaning that extra power cells are required for long

Dig_fieldwk_pap_revised KJM etal. page 16 of 35
days. Recharge times must be taken into consideration when planning fieldwork, particularly when
camping. Wireless communications protocols now allow field units (GPS, PDA) to transmit data to
each other and transfer files to lap-top and desk-top computers and thus remove issues associated
with cables and connectors between the various parts of the equipment.
There is always potential for data loss or corruption in the event of equipment failure so a
systematic data back-up strategy is essential. Loss of a complete digital database that has not
been backed-up is just as disastrous as losing a full field notebook. It is relatively easy to copy data
to a laptop at the field base each evening, in contrast it is relatively difficult to routinely back-up a
field notebook!
The physical size and weight of the amount of equipment that must be carried is another
major consideration. Digital geological mapping systems are relatively compact and portable and
will fit onto or into a small rucksack. Digital survey equipment such as RTK GPS systems and laser
scanning equipment are bulky and are not easily transported far from a vehicle, placing limits on
the outcrops that may be surveyed at high resolution.
Many of the core technologies for both digital geological mapping and survey are not
currently fully integrated with one another, so that workflows for digital mapping are not fully
optimized. Problems remain with compatibility of hardware and software, and with different data
formats required between successive stages in the workflow from field acquisition to visualization
and analysis. Software vendors are attempting to use more ‘open’ formats or are providing tools
that allow data to be converted from one format to another, although there is still a long way to go
until the process could be described as ‘seamless’.
User resistance and demise of mapping skills
Most geoscientists will initially find traditional fieldwork methods easier to use than the digital
alternatives because they are familiar with these from their undergraduate training. This distinction
is much less marked with recent undergraduates (i.e. those born in the 1980’s), for whom digital
devices have always been a central aspect of their educational and social environments. With any

Dig_fieldwk_pap_revised KJM etal. page 17 of 35
technological advance there will always be a section of the user community who would prefer to
continue with the old tried and tested methods.
There are also concerns that there will be a demise of generic mapping skills. However, we
feel that most of the important skills: observation, interpretation, analysis and ongoing hypothesis
testing that would be expected from an experienced and talented fieldworker should be enhanced
by using digital methods. For example, the ability to plot an instant stereonet in the field, call up an
old dataset, or see how a contact mapped at one particular locality would project through the whole
field area, must enhance the interpretation process. There could be a loss of cartographic skills in
the sense that there would no-longer be a need to use pencils, mapping pens and colouring
pencils, but these can be regarded as mechanistic rather than generic mapping skills. A parallel
example was the transition from hand-drafted to computer-drawn figures in the past 15 years.
Admittedly, in the first few years, computer drawn diagrams were crude and not aesthetically
pleasing, but now almost all published diagrams are computer drafted and the standard is
generally equivalent or better than before. With improved accessibility to mapping technology,
expertise in fieldwork will not be restricted to people with good artistic skills. Nevertheless, we
emphasise that it is important that undergraduates are still trained in traditional paper-based
mapping methods so when the batteries run out or there is no satellite coverage they can still
function in the field.
The publication of colour 3D diagrams impinges on digital geological mapping and survey
practice. 3D models are best viewed on a computer screen because features may need to be
coloured differently, and the ability to move the model relative to the viewers eye gives an
important depth perspective to the model. Problems arise when trying to publish these models, as
most journals still have a paper-based format and publishing diagrams in colour is expensive.
Journal publishing houses are launching electronic publishing formats that can display colour 3D
diagrams and animations along with hyperlinked images and text. These initiatives will enable 3D
models produced by geoscientists using digital mapping and survey methods to be published with
equal merit alongside traditional papers.

Dig_fieldwk_pap_revised KJM etal. page 18 of 35
Unlocking the spatial dimension
We suggest that the adoption of digital fieldwork practices will provide the geoscientist with
significant advantages. The increased spatial accuracy of field data enables methods of geospatial
analysis and geostatistics to inform hypothesis testing during fieldwork. 3D models of geological
architectures can be based on ‘real’ data locations rather than abstractions/cartoons based on the
geoscientists ‘mind’ model. Robust estimates of uncertainty in field data can be carried forward to
become explicit in published 3D models. Other advantages include better data management on
projects, with much better reproducibility of observations, and the ability to carry pre-existing data
into the field to provide supplementary information to aid data collection, interpretation and
hypothesis testing. All data-types can now be integrated into a single geospatially referenced
database to institutional and/or agreed national or international data standards. It is now feasible to
implement a more streamlined digital workflow from the initial data acquisition stage to the final
project output.
The main disadvantages of digital fieldwork methods are the associated equipment costs,
which mean that digital methods are not, as yet, suitable for routine use by undergraduates. The
equipment is bulky whilst cheaper equipment is not very robust, requiring a lot of battery power,
cable connections and IT skills. It is to be expected that there will be user resistance in the
community and possibly some demise of traditional cartographic skills may be anticipated. All of
these issues are expected to diminish as new technologies and methodologies are introduced into
mainstream fieldwork.
In 5-10 years time, we predict that digital mapping and survey systems will be much easier to
use, more streamlined physically, durable, with long-life batteries and wireless connectivity.
Extensive analysis software will be available in the field on hand-held devices. The iterative
interpretation cycle will be shortened and will possibly take place largely on the outcrop. 3D
autostereo screens will be available on PDAs and flexible foldable large screens will allow field-
based visualisation and interpretation of large models. Fieldwork may become more dynamic –
remote databases could be updated on the fly via a wireless link from a computer at base – this

Dig_fieldwk_pap_revised KJM etal. page 19 of 35
would permit the undertaking of live sensitivity analysis on field-based 3D models. Common
repositories field data will be developed so that field geoscientists can make use of – and add to –
a common body of geological field data, rather than only having their own notebook. Reliable voice
recognition capabilities added to field devices will make the transition from field notebook to
electronic database easier. Software advances will allow more ‘semantic’ based collection of field
notes (Jones et al. 2004) and prior information will be recorded and distinguished from new data
and incorporated into 3D models and used to estimate uncertainty.
We posed the question in the introduction as to whether the acquisition, visualisation and
analysis of high-resolution digital geospatial field databases will revolutionise the Earth Sciences. A
perhaps not totally unbiased answer form this study is yes. There is an enormous potential to be
gained from unlocking the spatial dimension in geoscience fieldwork. The underlying philosophies
and technologies will no doubt take some time to become widely accepted and universally used.
We suggest however that digital fieldwork methods and their underlying geospatial databases will
be the new ‘standard tool’ for geoscientists and may well prove to be as durable as the geological
map has been to our 18th to 20th century ancestors.
Acknowledgements
Our digital fieldwork capability was developed as part of a NERC Ocean Margins LINK project
(NER/T/S/2000/01018) and tied studentship (NER/S/S/2001/06740) in an attempt to replicate subsurface
data acquisition and analysis methods. The project was co-funded by Statoil (UK) and BP. We thank
reviewers E. McAllister and D. Irving for suggesting improvements to the manuscript. We are indebted to
Tony Dore (Statoil) for continuing support of the Reactivation Research group at Durham, RDR (Leeds) for
sharing their pioneering digital mapping expertise with us and Steve Waggott from Halcrow Group for
introducing us to laser scanning. Schlumberger, Midland Valley Exploration and Badley Geosciences have
contributed software and expertise in a variety of forms. Geospatial Research Ltd is a university ‘spin-out
company’ that has benefited from NERC Follow-on Fund (NE/C506964/1) support. We thank Catherine
Allsop, Lorraine Beacom, Michael Beling, Nicola De Paola, Danny Donoghue, Mark Pearce, Steve Smith,
Dave Stevenson & Gary Wilkinson for their help and encouragement.

Dig_fieldwk_pap_revised KJM etal. page 20 of 35
References
Ahlgren, S. & Holmlund, J. 2003. Using 3-D outcrop laserscan for fracture analysis. American
Association of Petroleum Geologists Search and Discovery Article 40099.
Barnes, J.W. 1981. Basic Geological Mapping, Geological Society of London Handbook Series.
Open University Press, 112pp.
Barnes, J.W. & Lisle, R.J. 2004. Basic Geological Mapping. John Wiley & Sons Ltd, 184 pp.
Bellian, J.A. Jennette, D.C., Kerans, C., Gibeaut, J., Andrews, J., Yssldyk, B. & Larue, D. 2002. 3-
Dimensional Digital Outcrop Data Collection and Analysis Using Eye-safe Laser (LIDAR)
Technology. American Association of Petroleum Geologists Search and Discovery Article
40056.
Berry, J.K. 1987. A mathematical structure for analyzing maps. Journal of Environmental
Management, 11, 317-325.
Berry, J.K. 2000. Geographic Information systems (GIS) Technology: A brief history, trends, and
probable future. In: Coburn, T.C. & Yarus, J.M. (eds) Geographic information systems in
petroleum exploration and development. AAPG Computer Applications in Geology, 4, 9-16.
Briner, A.P., Kronenberg, H., Mazurek, M., Horn, H., Engi, M. & Peters, T. 1999. FieldBook and
GeoDatabase - tools for field data acquisition and analysis. Computers & Geosciences, 25,
1101-1111.
Brodaric, B. 1997. Field data capture and manipulation using GSC FIELDLOG v3.0. In: Soller, D.R.
(ed.) Proceedings of a workshop on Digital Mapping Techniques: Methods for Geologic Map
Capture, Management and Publication. US Geological Survey, Open File Report, 77-81.
Bryant, I., Carr, D., Cirilli, P., Drinkwater, N., McCormick, D., Tilke, P & Thurmond, J. 2000. Use of
3D digital analogues as templates in reservoir modelling. Petroleum Geosciences, 6, 195-
201.

Dig_fieldwk_pap_revised KJM etal. page 21 of 35
Clegg, P., Trinks, I., McCaffrey, K.J.W. Holdsworth, R.E., Jones, R.R., Hobbs, R. & Waggott, S.
2005. Towards the virtual outcrop. Geoscientist, 15, 1, 8-9.
Coburn, T.C. & Yarus, J.M. 2000. Geographic information systems in petroleum exploration and
development. AAPG Computer Applications in Geology, 4, 315 pp.
Compton, R.R. 1985, Geology in the Field. John Wiley, New York. 398pp.
De Paola, N, Holdsworth, R.E. & McCaffrey, K.J.W. 2005. Strain partitioning, reactivation and
lithological control during complex transtensional faulting: an example from the 90-Fathom
Fault, NE England. Journal of the Geological Society of London, 162, In press.
Edmondo, G.P. 2002. Digital Geologic Field Mapping Using ArcPad. Digital Mapping Techniques
2002, Workshop Proceedings, USGS.
Greenly, E. & Williams, H. 1930. Methods in Geological Surveying. Thomas Murby, London,
420pp.
Holliman, N. 2005. 3D display systems. Handbook of Optoelectronics, IOP Press. In Press.
Jones, R.R., McCaffrey, K.J.W., Wilson, R.W. & Holdsworth, R.E. 2004. Digital field acquisition:
towards increased quantification of uncertainty during geological mapping. In: Curtis, A. &
Wood, R. (eds) Geological Prior Information. Geological Society of London, Special
Publication, 239, 43-56.
Johnson, M.R.W. & Parsons, I. 1979. Geological Excursion Guide to the Assynt District of
Sutherland. Edinburgh Geological Society.
Kessler, H. & Mathers S. 2004. Maps to Models. Geoscientist, 14, 10 4-6.
Kimbell, G.S., Chadwick, R.A., Holliday, D.W. & Werngren, O.C. 1989. The structure an evolution
of the Northumberland Trough from new seismic reflection data and its bearing on modes of
continental extension. Journal of the Geological Society of London, 146, 775-787.

Dig_fieldwk_pap_revised KJM etal. page 22 of 35
Knott, S.D., Beach, A., Brockbank, P.J., Brown, J.L., McCallum, J.E. & Welbon, A.I. 1996. Spatial
and mechanical controls on normal fault populations. Journal of Structural Geology, 18, 359-
372.
Longley, P.A., Goodchild, M.F., Maguire, D.J. & Rhind, D.W. 2001. Geographic Information
Systems and Science. Wiley & Sons Ltd, Chichester, 454 pp.
Maerten, L., Pollard, D.D. & Maerten, F. 2001. Digital Mapping of three dimensional structures of
the Chimney Rock fault system, central Utah. Journal of Structural Geology, 23, 585-592.
Mallet, J.L. 1992. GOCAD: A computer aided design program for geological applications. In:
Turner, A.K. (ed) Three-Dimensional Modeling with Geoscientific Information Systems.
NATO ASI Series C: Mathematical and Physical Sciences, 354. Kluwer Academic
Publishers, Dordrecht, Netherlands, 123-141.
Maltman, A. 1998. Geological Maps 2nd edition. Wiley & Sons Ltd. 260pp.
McCaffrey, K.J.W., Holdsworth, R.E., Clegg, P. Jones, R.R., & Wilson, R. 2003. Using Digital
Mapping Tools and 3D visualization to improve Undergraduate fieldwork. Planet Special
Edition 5, 34-36.
Oldroyd, D.R. 1990. The Highlands Controversy: Constructing Geological Knowledge through
Fieldwork in Nineteenth-Century Britain. The University of Chicago Press, Chicago, London.
438 pp.
Piazolo, S., Alsop, G.I., Møller Nielsen, B. & Van Gool, J.A.M. 2004. The application of GIS to
unravel patterns of deformation in high grade terrains: a case study of indentor tectonics from
west Greenland. In: Alsop, G.I., Holdsworth, R.E., McCaffrey, K.J.W. & Hand, M. (eds). Flow
processes in Faults and Shear Zones. Geological Society of London, Special Publications,
224, 63-78.
Pringle J.K., Westerman, A.R., Clark, J.D., Drinkwater, N.J. & Gardiner, A.R., 2004. 3D high-
resolution digital models of outcrop analogue study sites to constrain reservoir model
Dig_fieldwk_pap_revised KJM etal. page 23 of 35
uncertainty: an example from Alport Castles, Derbyshire, UK. Petroleum Geoscience, 10
343-352.
Pundt, H. & Brinkkotter-Runde, K. 2000. Visualization of spatial data for field based GIS.
Computers & Geosciences, 26, 51-56.
Rasmussen, K. 1995. An overview of database analysis and design for geological systems. In:
Giles, J.R.A. Geological Data Management. Geological Society, London, Special Publication,
97, 5-11.
Rhind, D.W. 1992. Spatial data handling in the Geosciences. In: Turner, A.K. (ed) Three-
Dimensional Modeling with Geoscientific Information Systems. NATO ASI Series C:
Mathematical and Physical Sciences, 354. Kluwer Academic Publishers, Dordrecht,
Netherlands, 13-27.
Rowlands KA, Jones LD, Whitworth M. 2003. Landslide Laser Scanning: a new look at an old
problem Quarterly Journal of Engineering Geology and Hydrogeology. 36,155-157,
Schetselaar, E.M. 1995. Computerized field-data capture and GIS analysis for generation of cross
sections in 3D perspective views. Computers & Geosciences, 21, 687-701.
Struik, L.C., Atrens, A. & Haynes, A. 1991. Hand-held computer as a field notebook and its
integration with the Ontario Geological Survey's ‘FIELDLOG’ program. In: Geological Survey
of Canada, Current Research, Part A, 279-284.
Trinks, I., Clegg, P., McCaffrey, K.J.W., Jones, R.R., Holliman, N., Waggott, S., Wilson, R., Imber,
J. & Holdsworth, R.E. In Press. Mapping virtual outcrops. Visual Geosciences.
Immo Trinks , Phillip Clegg , Ken McCaffrey2, Richard Jones2, Richard Hobbs1, Nick Holliman1,
Steve Waggott , Robert Wilson2, Jonny Imber2, Bob Holdsworth2
Turner, A.K. 2000. Geoscientific modeling: Past, present, and Future. In: Coburn, T.C. & Yarus,
J.M. (eds) Geographic information systems in petroleum exploration and development.
AAPG Computer Applications in Geology, 4, 27-36.

Dig_fieldwk_pap_revised KJM etal. page 24 of 35
Turner, A.K. 1992. Three-Dimensional Modeling with Geoscientific Information Systems. NATO
ASI Series C: Mathematical and Physical Sciences, 354. Kluwer Academic Publishers,
Dordrecht, Netherlands, 443 pp.
Wilson, R.W., McCaffrey, K.J.W., Jones, R.R., Clegg, P. & Holdsworth, R.E. 2005. Digital Mapping
of Lofoten’s Faults. Geoscientist, 15, 2, 4-9.
Xu, X, Battacharya, J.A., Davies, R.K. & Aiken, C.L.V. 2000. Digital Geologic Mapping of the
Ferron sandstone, Muddy Creek, Utah, with GPS and reflectorless Laser Rangefinders. GPS
Solutions, 5, 15-23.
Zeng, X., McMechan, G.A., Bhattacharya, J.P., Aiken, C.L.V., Xu, X, Hammon III, W.S. &
Corbeanu, R.M. 3D imaging of a reservoir analogue in point bar deposits in the Ferron
sandstone, Utah, using ground-penetrating radar. Geophysical prospecting, 2004, 52, 151-
163.

Dig_fieldwk_pap_revised KJM etal. page 25 of 35
Figure Captions
Figure 1. A typical workflow for digital fieldwork. For mapping applications, outcrop data (attributes
images, topography, etc) are geospatially referenced using GPS and laser units (see text) and
collected via a handheld computer. High resolution survey methods are used to acquire cm-scale
coverage of outcrops. At base the data is uploaded to desk- or lap-top computers and a variety of
visualisation and analysis outputs produced. Abbreviations: GPS – Global Positioning System,
PDA – Personal Digital Assistant, RTK – Real Time Kinematic.
Figure 2. Displays from a digital mapping database for Loch Assynt, NW Scotland. a) On an aerial
photographic base the geological boundaries and faults are mapped as vector lines, geological
units as vector polygons (coloured overlays), and structural data (dip symbols) and digital photo
localities as vector points. b) the boundaries and faults visualized in 2.5D perspective by draping
the data onto a digital elevation model. Vertical exaggeration x2.
Figure 3. Digital Survey. a) Results from a digital survey from Cullercoats (NE England). Attributes
(in this case bedding dip in dolostones) are measured at stations that are precisely located (to sub-
cm scale) by a RTK GPS. The display shows geostatistically interpolated bedding information from
and permits a fine-scale analysis of geological structure. b-e) Results from a laser scan of cliffs
comprised of Permian sandstones at Cullercoats. b) a point-cloud of x,y,z coordinates c) the point
colud coloured with the intensity of the reflected laser signal. d) the point cloud coloured from a
georeferenced digital image d) a surface mesh fitted to the point cloud on which the digital image
has been draped.
Fig. 4. Fitting 3D surfaces for a) bedding and, b) faults from points picked on a laser scan dataset
from Cullercoats.
Fig. 5. – Examples of immersive 3D display technology displaying data at different scales. a) a
digital elevation model of northern Scotland with the offshore West Orkney Basin (brightly coloured
area) toward the top of the image (Sclumberger Inside Reality™). The horizon displayed offshore is
most likely to be the top of the middle Devonian (unpublished data). b) geoscientists interpreting a
laser scan from Cullercoats using Durham HIVE (High Impact Visualisation Environment).

Dig_fieldwk_pap_revised KJM etal. page 26 of 35

Dig_fieldwk_pap_revised KJM etal. page 27 of 35

Dig_fieldwk_pap_revised KJM etal. page 28 of 35

Dig_fieldwk_pap_revised KJM etal. page 29 of 35

Dig_fieldwk_pap_revised KJM etal. page 30 of 35

Dig_fieldwk_pap_revised KJM etal. page 31 of 35
Table Captions
Table 1 An illustration of the ranges of geological fieldwork and digital equivalents.
Table 2. Hardware used for digital mapping and survey, typical speeds, use and cost.
Table 3. Typical field data types and their digital alternatives.
Table 4. Compilation of different types of GPS units, their use and an indication of their
performance in general fieldwork use. Note. inclusion in the table is not an endorsement by the
authors of any particular product.
Table 5. Types of uncertainty encountered in geoscience fieldwork (from Jones et al. 2004)

Dig_fieldwk_pap_revised KJM etal. page 32 of 35
Table 1. Mapping type Reconnaissance Regional Standard* Detailed Typical map scale 1:250,000 or smaller 1:100,00-1:50,000 1:10,000-1:25:000 1:10,000 or larger Traditional methods
Remote sensing, photogeology, ‘blind’ spot sampling (e.g. using helicopter)
Appropriate scale base maps/aerial photographs or simplified 1:10,000 scale field slips
1:10,000 field slips Planetabling
Geospatial abstraction
Very high implicit in sampling strategy prior to fieldwork
High in field and also during cartography
Medium levels of abstraction in the field, captures some outcrop structure
Very little abstraction – can capture the entire outcrop
Typical wavelength (of structures)
>105 m 102-105 102-104 10-3-103
Digital equivalents Remote sensing, Aerial photography
Digital elevation models, digitised maps and GPS- referenced data collection
Digital elevation models and GPS or Differential GPS- referenced data collection
Real Time Kinematic GPS, Laser scan etc (see text for details)
*this refers to normal UK practice which corresponds to BGS standard surveying and university undergraduate projects Table 2. Hardware Typical
Claimed Accuracy
Speed Use Cost
Handheld GPS, computer and mobile GIS
c. 3-10m Instant locational fix
Reconnaissance and regional mapping
£500
Differential GPS and mobile GIS
c. 0.3 m Instant fix Detailed mapping and attribute collection
>£2000
Real-time Kinematic (RTK) GPS units
Better than 10mm
Instant point collection on trigger
Attribute collection at c. 10 cm resolution over outcrops; Surveying outcrops and base stations for other methods
> £10,000
Reflectorless total station
3 mm at 200m range
Instant point collection on trigger
Attribute collection at c. 10 cm resolution over outcrops – better for vertical faces than RTK GPS
> £6,000
Terrestrial Laser Scanner (Ground-based LIDAR – LIght Detection And Ranging)
6 mm at 200m range
Automatic point collection up to 12,000 points per sec; colour intensity mapping from digital cameras
Acquiring surface topography on outcrops, allows draping of photographs to form a 2.5D image of an outcrop
> £20,000
Aerial and ground based photogrammetric methods
Variable depending on distance
Fast acquisition (minutes), slow set-up and processing (days)
Acquiring detailed images of beach-section and other flat-lying exposures.
Variable £500-£10,000

Dig_fieldwk_pap_revised KJM etal. page 33 of 35
Field data example media Digital alternative Mapping on a Field slip
1:10,000 base map Paper map Drawing lines on digital base on PDA
Metadata Date, weather, location
Paper Notebook Database on PDA
Observation Grain size, texture, mineralogy, geometry,
Paper notebook Database entry PDA
Locality Grid reference Paper notebook Database entry(GPS)
Sketches Outcrop interpretation
Paper notebook or artbook
Digital sketching on a photograph
Photograph Outcrop image Transparency, print Digital photograph Section logging Sedimentary log Logging sheets A digital logging
template on PDA

Dig_fieldwk_pap_revised KJM etal. page 34 of 35
Table 4
GPS units for digital mapping GPS units for digital
surveying
Garmin III+ handheld
Garmin Geko 201
CSI GBX PRO
Trimble Geoexplorer XT (built in GIS)
Promark 2 handheld
Promark 2 (Survey Mode)
Trimble 5700/5800
Instrument details
DGPS correction N/A WAAS
available Beacon WAAS WAAS L1-carrier
wave L1 & L2 carrier wave + RTK
Real/time or post process N/A N/A Real time Real time Real time Post-process Post-process Precision tests No. of positional fixes 101 99 108 56 107 N/A N/A Horiz. Sd (m) 3.42 0.16 0.36 0.41 0.36 0.001* 0.001* Vert. Sd (m) 3.78 0.74 0.68 0.48 0.52 0.003* 0.002* PDOP during test 1.9 1.5 2.7 2.3 3.6 <4 <4 Operational
Time for position 2min 2min 45s 2min 150s c. 30 mins
observation*
c 10mins observation*/1s
for RTK Bulk Low Low Intermediate Intermediate Low High High Achievable accuracy 3-5m 1-3m 0.5-1m 0.5-3m 0.5-3m 1-10mm 1-10mm Purpose Mapping >
100m scale Mapping > 10 m scale
Mapping > 10 m scale
Mapping > 10 m scale
Mapping > 10 m scale
Survey sub-cm scale
Survey sub-cm scale
Cost c. £200 c.£120 c. £1,800 c.£5,000 c. £4,000 c. £4,000 c. 25,000 WAAS - Wide Area Augmentation System – provides differential correction data for GPS from geostationary satellites RTK - Real time Kinematic – provides instantaneous positioning to millimetre precision
*These figures are calculated accuracy values derived from the post-processing software

Dig_fieldwk_pap_revised KJM etal. page 35 of 35
Table 5 Leve
l Type of uncertainty Examples
Positional “how sure am I of my current location?” “how reliable is my base map?” “what is the precision of my GPS measurements?” “is the borehole straight, or has it deviated without me knowing?”
Measurement “what is the precision of my clinometer?” “what is the accuracy of my dip/strike readings?”
Scale-dependant variability
“how much does the dip and strike vary over the scale of the outcrop?” “is my reading representative of the surrounding area?”
Observational “is this rock best described as a granite?” “is this fossil the brachiopod pentamerus?” “is that a stretching lineation or an intersection lineation?”
Temporal “how reliable is this way-up criteria?” “is the relative age of these structures identified correctly?”
Dat
a ac
quis
ition
Sampling bias “is my data biased by the natural predominance of sub-horizontal exposures?”
“has my sampling been skewed by me focusing only on the zones of high strain?”
Correlation “is this limestone the same unit as the limestone at the last outcrop?” “is it valid to correlate the S2 fabric here with the S2 fabric observed on the other side of the area?”
Interpolation “how likely is it that all the ground between these two outcrops of slate also consists of slate?”
“how much control do I have over the geometry of this fold trace?”
Prim
ary
inte
rpre
tatio
n
Inference from topography
“is there really a fault running along the unexposed valley floor?” “does this sharp change in slope correspond to a lithological boundary?”
Finished 2D map
Geological cross-section
Com
poun
d in
terp
reta
tio
3D structural model
“how can I quantify the uncertainty associated with this sophisticated interpretive model that I have slowly built up through a long iterative process of data collection and individual primary interpretations?!”
Copyright © 2022 FDOKUMEN