ABSTRACTS - Geoscience Society of New Zealand
102
Geoscience Society of New Zealand 2012 Conference HAMILTON 25 - 28 November 2012 ABSTRACTS
-
Upload
khangminh22 -
Category
Documents
-
view
6 -
download
0
Transcript of ABSTRACTS - Geoscience Society of New Zealand

Geoscience Society of New Zealand 2012 Conference
HAMILTON 25 - 28 November 2012
ABSTRACTS

Annual Conference of the Geoscience Society of New Zealand
Abstracts
Conference Convenor Adrian Pittari (University of Waikato)
Organising Committee Roger Briggs, Rochelle Hansen, Chris Hendy, Steve Hood, Peter Kamp, David Lowe, Cam
Nelson, Sydney Wright (University of Waikato)
Administration Janet George (Absolutely Organised Ltd)
Symposium Convenors Peter Almond, Greg Bignall, Carolyn Boulton, Karin Bryan, Hamish Campbell, Martin Crundwell, Jennifer Eccles, Susan Ellis, David Hamilton, Peter Kamp, Gert Lube, David Lowe, Vicki Moon,
Nick Mortimer, Adam Munro, Rewi Newnham, Adrian Pittari, Mark Quigley, Andrew Rae, Catherine Reid, Martin Reyners, Glenn Vallender, Russ Van Dissen, Jenny Webster-Brown
Field Trip Leaders Roger Briggs, Mike Hall, Chris Hendy, Peter Kamp, Kerri Lanigan, David Lowe, Vicki Moon,
Cam Nelson, David Palmer, Adrian Pittari, Andrew Rae Photographs on front cover: Maria Lowe (top), Wendy Peel (bottom left)
Abstracts are organised in alphabetical order by family name of first author
The bibliographic reference for abstracts is:
Author, A.N. (2012). Title of Abstract. In: Pittari, A., Hansen, R.J. (eds). Abstracts, Geosciences 2012 Conference, Hamilton, New Zealand. Geoscience Society of New Zealand Miscellaneous Publication 134A. p. x. ISBN 978-1-877480-25-6 ISSN (print) 2230-4487 ISSN (online) 2230-4495
1
Improved Gravimetric Solution for the Height Reference Surface in New Zealand
A. Abdalla
1 and R. Tenzer
1
1National School of Surveying, Div. of Sciences, University of Otago, 310 Castle St., Dunedin
We evaluate the new regional quasigeoid model (OTG12) for New Zealand using the method which utilizes the discretized integral-equation approach for computing the near-zone contribution. The far-zone contribution is computed using the far-zone modified spherical harmonics which are related to spherical harmonics by means of Molodensky’s truncation coefficients. Adopting the remove-compute-restore computation scheme, the near- and far-zone contributions are computed for the residual gravity field quantities, while the reference gravity field is evaluated using a global gravitational model. For the numerical realization, the GOCO-02S coefficients complete to degree 55 of spherical harmonics are used to
generate the reference gravity field. The 11 arc-min grid data of terrestrial gravity anomalies are used to compute the near-zone contribution. The far-zone contribution is evaluated using the EGM2008 coefficients from degree 56 up to degree 2160 of spherical harmonics. The newly-adjusted levelling data are used to validate the available regional geoid/quasigeoid models. The assessment of gravimetric solutions for the GPS-levelling testing network reveals that the accuracy of OTG12 is compatible with the existing regional geoid/quasigeoid models; the STD of residuals between the geometric and gravimetric height anomalies is 13 cm (after applying the 3-parameter correction model).
Accuracy Assessment of the Global and Regional Gravimetric Geoid/Quasigeoid
A. Abdalla
1 and R. Tenzer
1
1National School of Surveying, Div. of Sciences, University of Otago, 310 Castle St., Dunedin
The jointly adjusted levelling networks for the South and North Islands of New Zealand (in combination with GPS data) are used to assess the accuracy of the currently available regional gravimetric geoid/quasigeoid models (NZGeoid2009, BEM-quasigeoid and KTH-geoid). The least squares analysis is applied to combine the gravity and GPS-levelling data using a three-parameter model. The GPS and
levelling data are further used to evaluate the accuracy of the recently released satellite-only global geopotential models (GGMs) compiled using GRACE and GOCE data. The regional accuracy of these GGMs in New Zealand is compared with the combined models EGM2008 and EIGEN-GL04C. The analysis of regional gravimetric solutions reveals that the fit of the KTH geoid model with GPS-levelling data is 12 cm in terms of the standard deviation (STD) of differences. The STD fit of the NZGeoid2009 and BEM quasigeoid models with GPS-levelling data is 14 and 15 cm, respectively. This accuracy is better (except for NZGeoid2009) than the STD fit obtained when applying the average offsets of individual local vertical data. The analysis of GGMs reveals that the GOCE satellite-only model GO-CONS-GCF-2 version TIM-R2 has the best agreement with GPS-levelling data; the STD of differences is 57 cm and the mean of differences is 2 cm. Precambrian Zircons in New Zealand Rocks:
Evidence for Zealandia’s Place within Rodinia
C.J. Adams
GNS Science, Private Bag 1930, Dunedin 9054, New Zealand
Zealandia has no proven Precambrian basement. However, Precambrian minerals are quite common in New Zealand rocks; a detrital zircon age compilation from over 60 Cambrian to Cretaceous sandstone datasets reveals Precambrian ages often comprise 10-30% of the sample total. These are mostly late Proterozoic (1000-1150, 750-850 and 550-650 Ma) but many (occasionally >20%) are Archean, (up to 3500 Ma). They also occur as xenocrysts in igneous rocks such as Dunedin Miocene volcanics (E. Belousova, pers. comm.). It is conventionally supposed that these old detrital zircons must come from Australia and Antarctica, where Precambrian rocks do occur. However, when possible provenances are examined in detail, these latter sources rarely have appropriate age, extent and composition, or are very distant (>5000 km).
An unexpected resolution to this dilemma comes from by zircon age datasets from some Late Cretaceous (<85 Ma) sandstones deposited in Zealandia after separation from Gondwanaland. These have especially high proportions of of Precambrian detrital zircons. Furthermore, the ratio of
2
Precambrian, Rodinia (R, 700-1600 Ma) to early Paleozoic, Gondwana (G, 440-550 Ma) zircon groups, is also unusually high (R/G>2.0). There were no rocks from the several Early Cretaceous-Cambrian basement terranes exposed across Zealandia at that time that could have provided (either singly or combined) zircon sources with such a high R/G ratio. The principal deficit appears to be in sources of late Mesoproterozoic age, 1000-1150 Ma. This suggests that a Rodinia core must exist, now hidden, somewhere within Zealandia.
Preliminary data analysis of the above age groups, particularly from southwestern Zealandia (Campbell Plateau and South Westland), indicates that a hidden late Mesoproterozoic complex, c.1050 Ma, is probably accompanied by late Neoproterozoic rocks (550-650 Ma). Data from the latter seem to form part of a larger group associated with early Gondwana assembly, principally the extensive granitoid complexes in the Ross-Delamerian Orogen of Antarctica-Australia, whose ages are typically slightly younger (450-550 Ma).
Along the presently-exposed northeastern margin of Zealandia (Takaka Terrane near Takaka) there is a local, but striking, increase in Archean (up to 3500 Ma) zircons in Ordovician quartzites. The nearest obvious source for these at that time would seem to be extremely remote, either in Western Australia or the Napier Complex of Antarctica.
In a reconstruction of the Precambrian, Rodinia supercontinent at 750 Ma, the birthplace of the New Zealand continent, Zealandia, would have been surrounded by the Australia, Antarctica, Laurentia and South China, the last of which is particularly significant. South China has Mesoproterozoic and Neoproterozoic complexes at its southern margin and an Archean core. It is thus proposed that, at the time of initial Rodinia breakup (c. 700-600 Ma), a small Zealandia continental fragment of Mesoproterozoic rocks was adjacent to South China. From c. 650 Ma onwards, Zealandia then separated from southeastern Australia and South China, with the development of magmatic arcs (650 to 450 Ma) forming the early Gondwanaland margins.
Inviscid Flows in Discrete Subterranean Explosions: Insights from Analogue
Experiments
R.G. Andrews1, J.D.L. White
1, B. Zimanowski
2
and T. Dürig2
1Department of Geology, University of Otago,
PO Box 56, Dunedin, New Zealand 2Physikalisch-Vulkanologisches Labor,
Universität Würzburg, Würzburg, Germany [email protected]
Discrete volcanic eruptions – those exhibiting non-steady state conditions – are relatively poorly understood volcanological phenomena (Zimanowski et al., 1991; Taddeucci et al., 2009; White & Ross, 2011). Whereas the nature of the fragmentation zone in steady state, open vent volcanic eruptions has been comprehensively assessed through the use of both fieldwork and analogue experimentation over the last few decades (e.g. Cas & Wright, 1995) the natures of explosion-generating zones in various types of discrete eruptions are open to a wide range of interpretations (Ross et al., 2008c; White & Ross, 2011). The initial mobilisation and entrainment of particles is a process affecting both discrete jets and inception of subsequently sustained ones that has rarely been addressed. A recent set of analogue experiments demonstrates that this initial mobilisation and entrainment may be complex. Our experiments show that different ejected particle populations may take very different trajectories, with movement beginning at very different times, in response to a single driving explosion source. The timing and physical nature of the initial coupling that drives movement may lead to a dynamic segregation of the surrounding, entrained material, with rapid, uneven distribution of momentum during the initial blast generating multiple, upwards-thrusting jets.
Magnetic Mineral Enrichment in Tauranga Harbour and Bay of Plenty Sediments
F. Badesab1, T. von Dobeneck
1, H. Müller
1, K.
Bryan2 and R. Briggs
2
1MARUM-Center for Marine Envir. Sci. and Fac. of Geosci., Univ. of Bremen, Bremen, Germany
2Dept. of Earth and Ocean Sciences, Univ. of
Waikato, Private Bag 3105, Hamilton [email protected]
Magnetic iron minerals are widespread and indicative heavy mineral constituents in estuarine, coastal and shelf systems. We
3
combined environmental magnetic, sedi-mentological, numerical and most recently electromagnetic benthic profiling methods to identify magnetite-enriched placer-like zones and their formation mechanisms in and around Tauranga Harbour, the largest barrier-enclosed tidal estuary of New Zealand. Magnetic susceptibility and remanence measurements on 245 surficial sediment samples revealed several discrete enrichment zones (up to 3 mass% compared to a background of 0.05 mass%) controlled by local hydrodynamic conditions. Active magnetite enrichment takes place in tidal channels, which feed into two coast-parallel nearshore magnetite-enriched belts centered at water depths of 6–10 m and 10–20 m. A close correlation between magnetite content and magnetic grain size was found, where higher susceptibility values are associated within coarser magnetic crystal sizes.
Two key mechanisms for magnetite enrichment were identified: First, tide-induced residual currents enable magnetite enrichment within the estuarine channel network. A coast-parallel, fine sand magnetite enrichment belt in water depths of less than 10 m along the barrier island has a strong decrease in magnetite content away from the southern tidal inlet and is apparently related to active coast-parallel transport combined with mobilizing surf zone processes. A second, less pronounced, but more uniform magnetite enrichment belt at 10–20 m water depth is composed of non-mobile, medium-coarse-grained relict sands, which have been reworked during post-glacial sea level transgression. We demonstrate the potential of combined magnetic and granulometric methods to reveal and differentiate coastal magnetite enrichment patterns and investigate their formative mechanisms. A detailed electromagnetic survey of the inner Bay of Plenty in November 2012 is expected to provide more detailed insights into the linkage of hydrodynamics and heavy mineral accumulation and we hope to present some first results during the conference.
Trace Element Analysis of Suspended Sediment from Lake Okataina, New Zealand.
E. Bagley
1 and C. Hendy
1
Dept. of Chemistry, University of Waikato, Hamilton, New Zealand [email protected]
Suspended material samples were gathered from the north basin of Lake Okataina, using a
Schindler's trap were digested with reverse aqua regia and analysed using Inductively Coupled Plasma Mass Spectrometry (ICP-MS). The results were compared to the top 2 cm lake floor sediment, and peeper data. The samples were also examined using a Scanning Electron Microscope (SEM) to compare the diatoms present in the water column and sediment.
The results showed that concentrations of copper, strontium, lead and phosphorus did not change significantly between the suspended material and sediment. There was significantly less manganese present in the suspended material than in the sediment and peeper data of pore water and near bottom waters show that manganese diffuses up through the sediments and precipitates at the sediment surface. Arsenic was shown to have concentrations 60 times higher than the World Health Organisation drinking water standards as diagenesis released it from the suspended material.
The SEM images taken show that the abundance and the species changes through the water column. Diatom frustules dominated the suspended material at the lake floor (65m) where the dominant genus was Aulacoseira, whereas Flagilaria, Asterionella and Brachysira was dominant in shallower waters (1 m, 10 m, 60 m) respectively.
Utilizing Infrared Absorption Spectroscopy to Measure Light Stable Isotope Ratios to
Evaluate Hydrothermal Alteration and Fluid Flow Pathways in Paleohydrothermal
Systems: Implications for Mineral Exploration and Geothermal Energy
S. Barker1,2
1Dept. of Earth and Ocean Sciences, University of Waikato, Private Bag 3105, Hamilton 3240. 2Mineral Deposit Research Unit, Univ. British Columbia, Vancouver, BC V6T1Z4, Canada
[email protected] Rocks which have interacted with hydrothermal fluids typically have different light stable isotope ratios (of elements such as H, C, O and S) as compared to similar host rocks which have not undergone interaction with hydrothermal fluids. Thus, variations in light stable isotope ratios within rocks affected by hydrothermal fluid flow can be utilized to evaluate time-integrated hydrothermal fluid fluxes, and determine the spatial extent and nature of hydrothermal fluid flow pathways.
In recent years, instruments based on off-axis integrated cavity output spectroscopy
4
(OA-ICOS), a cavity-enhanced laser absorption technique, have become increasingly popular to measure trace gas concentrations and the isotopic composition of environmental water and gas samples in the laboratory and in the field. The development of OA-ICOS now offers an alternative to conventional stable isotope ratio mass spectrometry, with the ability to measure isotopic ratios in several gas species (including H2O, CO2, CH4 and N2O) at significantly reduced operating costs, as well as with much more rapidly than most IRMS techniques. This OA-ICOS approach fundamentally changes the way in which stable isotope data can be collected, as many more samples can be analyzed compared to conventional IRMS.
By applying a recently published method for measuring the carbon and oxygen isotope ratio of carbonate minerals via OA-ICOS (Barker et al, 2011), we have measured the carbon and oxygen isotope ratios of more than 5,000 samples of carbonate rock which host auriferous paleohydrothermal systems in Nevada. These results demonstrate the spatial extent of hydrothermal fluid flow, reveal controls on permeability and provide vectors towards economic concentrations of gold. The implications of these results for understanding hydrothermal fluid flow within precious metal mineralized hydrothermal systems, as well as geothermal systems will be discussed. Barker, S.L.L., Dipple, G.M., Dong, F. and Baer, D. 2011. Use of laser spectroscopy to measure the
13C/
12C and
18O/
16O compositions of
carbonate minerals. Analytical Chemistry DOI: 10.1021/ac103111y
Late Holocene (<3000 years)
Paleoearthquakes of the Southern Alpine Fault and Fiordland Subduction Zone, New
Zealand, Based on Stacked Turbidites
P.M. Barnes1, H. Bostock
1, H. Neil
1, L.
Strachan2 and M. Gosling
2
1National Institute of Water & Atmospheric Research (NIWA), Private Bag 14901,
Wellington 2University of Auckland, School of Environment,
Private Bag 92019, Auckland 3University of Otago, PO Box 56, Dunedin
Turbidite records obtained from seafloor sediment cores in zones of seismically active plate boundary deformation can be used to infer the ages and return time of strong ground-
shaking earthquakes, and in some cases the rupture extents of particular faults that have experienced earthquakes. We present results of a study of paleo-earthquakes beneath the offshore Fiordland margin, where strong ground shaking is associated largely with strike-slip earthquakes on the southern Alpine Fault and thrust earthquakes on the Fiordland subduction zone. We document late Holocene (<3 ka) turbidites over a 65 km length of the margin, focussing on three cores from near-shore strike-slip basins along the Alpine Fault. Analysis including physical property logging, x-radiography, grainsize, carbonate, mineralogy, and foraminifera composition, demonstrate that the cores comprise a succession of 8-15, variably-graded sand to silt turbidites, that are stacked with essentially no intervening hemipelagite. Whilst radiocarbon dating of foraminifera and analysis of
210Pb radionuclide
activity constrain sediment source ages, and not direct event ages, the favourable situation in which the submarine source regions of the deposits have been largely evacuated during earthquakes and subsequently re-nourished between events by waves and storms, has facilitated age modelling via an unconventional application of the OxCal Sequence code. Consideration of possible triggering mechanisms indicates that the basin turbidites represent an earthquake ground shaking record. The data indicate a mean earthquake recurrence decreasing southwards from about 190 years at the northern site off George Sound, to about 145 years at the southern site off Thompson Sound. This decreasing mean recurrence coincides with an increase in the coefficient of variation from 0.30 in the north to >0.60 in the south. The recurrence intervals are significantly shorter and more variable than the recently published recurrence data from the onshore section of the Alpine Fault in south Westland, suggesting that these sites reflect a mixed Alpine Fault and subduction earthquake record, and possibly increased fault interactions. Wrinkles in Time − Putting the New Zealand Glacier Landform Record of Climate Change
on the World Map
D.J.A. Barrell
GNS Science, Private Bag 1930, Dunedin, New Zealand
A glacier is an expression of climatic conditions, representing a balance between snow
5
accumulation and ice ablation. Distinctively wrinkly-textured morainal landforms demarcate the former extents of glacier ice. Moraine-defined ice limits provide a basis for reconstructing the geometries of the former ice surfaces, estimating the elevations of the equilibrium line, and in turn deriving quantitative estimates of climatic conditions.
As recently as a decade ago, the spectacular arrays of glacier moraines delineating the footprints of former glaciers of the Southern Alps, New Zealand, were more a geomorphological curiosity rather than a quantitative paleoclimatic proxy. Although the moraines are readily subdivisible using relative age indicators, such as the degrees of weathering and landform degradation, the direct age control throughout the Southern Alps amounted to a few handfuls of radiocarbon dates.
Surface exposure dating using in-situ terrestrial cosmogenic nuclides, especially
10Be,
has provided a breakthrough in quantifying the ages of moraine landforms. A
10Be production-
rate derived from a radiocarbon-dated, 9600 calendar year BP (9.6 cal. ka), debris flow in the Macaulay valley, Southern Alps, showed that the previously adopted
10Be production rate was
~12% to ~14% too high; the Macaulay production rate alleviated an apparent mismatch between radiocarbon and
10Be ages. Recently
published 10
Be results from the Southern Alps, with errors of typically as little as ± 3% of the median age, demonstrate that the Last Glacial Maximum terminated ~18 cal. ka, a late-glacial ice advance culminated ~13.0 cal. ka, and that glaciers progressively shrank in length through the early Holocene. Since ~6.7 cal. ka, Southern Alps glaciers have maintained consistent maximum terminal positions, with minor millennial-centurial fluctuations. The Southern Alps glacier paleo-record is now on a sufficiently precise chronological footing to enable global-scale comparisons with other proxy records, facilitating close enquiry into leads, lags and drivers of natural climatic changes.
Cosmogenic Nuclide Exposure Ages of West Coast Moraines
T. Barrows1,
P. Almond
2, R. Rose
3, L. Fifield
4,
S. Mills5 and S. Tims
4
1Geography, College of Life and Environmental
Sciences, University of Exeter, Devon, UK 2Department of Soil and Physical Sciences,
Lincoln University, Christchurch, New Zealand 3CRL Energy Ltd, Greymouth, New Zealand 4Dept. of Nuclear Physics, The Australian National University, Canberra, Australia
5Sch.of Geog., Geol. and the Env., Kingston
University London, Kingston upon Thames, UK. [email protected]
On the relatively narrow piedmont near the Taramakau River on the West Coast of the South Island, deposits from Pleistocene glaciers descending from the Southern Alps interfinger with interglacial near-shore deposits formed during high sea-level stands. Exposure of the stratigraphy and preservation of sequences of glacial and interglacial landforms has been enhanced by uplift. The clear relationships between glacial and interglacial deposits and landforms have made this the type locality for the Pleistocene glacial stratigraphy of New Zealand. The dating of the stratigraphy has been largely based on bracketing radiocarbon ages, and correlation (supported by palynology) to deep-sea oxygen isotope chronozones (OICs). Recent application of luminescence dating has extended the range of radiometric ages beyond the limit of radiocarbon. However, problems of accuracy, precision or interpretation affect all of these dating methods. Here we present exposure ages from cosmogenic nuclides in surface boulders, supported by tephrostratigraphy, that directly date moraines formed in the last (Otira) glaciation. Our study sites in the Taramakau Valley and at Lake Moana are near the type sections of the three Otiran glacial formations: the Loopline, Larrikins and Moana formations.
We find that the Loopline Formation is not OIC 4 in age as previously thought, but culminated around 24,900 ± 800 yr. Kawakawa/Oruanui Tephra stratigraphically lies immediately above it. This formation is the same age as that previously attributed to an older part of the Larrikins Formation. Dating of the Larrikins Formation demonstrates there is no longer a basis for subdividing it into an older and a younger phase with the advance occurring at 20,800 ± 500 to 20,400 ± 500 yr. The Moana Formation represents the last major advance of

6
ice and is younger than expected, based on limited previous dating, at 17,300 ± 500 yr.
Multiscale Semi-Quantitative Predictive Substrate Mapping of the Kermadec-Colville
Volcanic Region using Backscatter Reflectivity
S. Barton1, R. Wysoczanski
1, G. Lamarche
1,
C. de Ronde2, A. Pallentin
1 and K. Mackay
1
1National Institute of Water & Atmospheric
Research, Private Bag 14901, Wellington. 2GNS Science
In recent years there has been a large increase in the use of multibeam acoustic imaging to map the seafloor of the southern Kermadec arc and Havre Trough. This has resulted in detailed bathymetric maps over much of this region that reveal seafloor features such as volcanoes, basins and ridges in great detail. To date however, the acoustic reflectivity (or backscatter) data collected routinely along with multibeam echo-sounders (MBES) remains underutilised, despite its proven ability to provide semi-quantitative seafloor substrate information.
The intensity of the backscattered signal (the Backscatter Strength) depends on the substrate volume heterogeneity and seafloor roughness – parameters that relate to the material density and composition. For example a strong return signal is likely to result from a hard surface such as unaltered volcanic rock, whereas a weak return signal results from interaction with a soft surface such as sediment or altered rock. Through analysis of the returned signal a backscatter reflectivity map can be constructed that provides insight into the composition of the seafloor.
Used in conjunction with bathymetry the backscatter thus provides a powerful proxy of seafloor substrate from which an added level of information on magmatic and tectonic activity can be extracted. When combined with other physical parameters, such as water currents and temperature, this substrate information obtained from backscatter enables the development of habitat maps at a variety of scales (e.g. 50 m -100 km) for use in science, industry and ocean floor management.
We will present a backscatter reflectivity map of data from the southern Kermadec Arc and Havre Trough region, including some EM302 (MBES) data from the NIRVANA voyage of October 2012, and discuss how backscatter data can be used to help constrain geological
processes and biological habitats. This work will form the basis of a newly commenced PhD research project.
The Difficult Question of Recycled Sediment in Provenance Analysis: SEM-
Cathodoluminescence on Quartz from Andrill SMS Core
K. Bassett
1, T. Williams
2 and B. Storey
2
1Dept of Geological Sciences, University of
Canterbury, Christchurch, NZ 2Gateway Antarctica, University of Canterbury,
Christchurch, NZ
[email protected] Scanning Electron Microscope-Cathodoluminescence (SEM-CL) combined with optical microscopy has been used to identify recycled quartz grains in the Andrill Southern McMurdo Sound drill core. The majority (88%) of quartz grains are plutonic and have healed microcracks, bright-patchy SEM-CL and undulose extinction in thin section (TS). Another 8% of quartz grains are metamorphic and have a dark, featureless appearance in SEM-CL, undulose extinction and polycrystallinity in TS. The remaining (4%) of quartz grains are ambiguous with non-undulose extinction and a generally featureless appearance with bright SEM-CL; they could be volcanic or plutonic. Quartz grains are evenly mixed between angular and well-rounded. In TS <1% of grains have visible remnant silica cement rims. but in SEM-CL ~10% of quartz grains have visible cement rims. Taken together, rounding and remnant cements indicate 30-40% of quartz grains are recycled.
The Victoria Land Basin is part of the West Antarctic Rift system, with sediment derived from the Transantarctic Mountains and local McMurdo Volcanics. Plutonic quartz grains in the SMS core were likely derived from the Cambrian Granite Harbour Group and metamorphic quartz grains from the Proterozoic metasedimentary Koettlitz Group, which make up the basement rocks of the Transantarctic Mountains. Recycled quartz grains were likely derived from Lower Beacon Supergroup sediments that were also sourced primarily from the Granite Harbour Group and to a lesser extent the Koettlitz Group.Well-rounded ‘ambiguous’ grains are likely to be the stronger cores of plutonic quartz grains that have not been broken during transport, although they could also be from the volcanics associated with the Granite Harbour Group. The high

7
percentage of recycled grains identified in our study will have a significant bearing on interpretations of glacial advances and retreats, and calculated exhumation rates based on sediment provenance.
Characterisation of the Modern and Paleo-Liquefaction Features within Avonside, Christchurch Following the 2010-2011
Canterbury Earthquake Sequence
S. Bastin1, M. Quigley
1 and K. Bassett
1,
Department of Geological Sciences, University of Canterbury, Private Bag 4800, Christchurch
The liquefaction of late Holocene (12,000 years ago – present) fluvial and estuarine sedimentary deposits during the 2010 Darfield Mw 7.1 earthquake and subsequent aftershocks caused severe land and infrastructure damage. The most severe liquefaction occurred in Christchurch’s eastern suburbs. Geomorphic mapping of the distribution of liquefaction features was conducted within the now red zoned suburb of Avonside, with two sites chosen for trenching. Detailed surface mapping of eight distinct liquefaction events was combined with sand blow and subsurface trenching to characterise the geometry of the modern liquefaction feeder dikes.
Trenching of surface ejecta preserved at the Bracken St address from the June 13 (2 events) and Dec 23 (2 events) earthquakes revealed four distinct packages of fine grained sand overlain by silt drapes, indicating different liquefaction episodes could be preserved within the geologic record. Subsurface trenching investigations at both Bracken Street and the nearby Sullivan Park revealed sub-vertical planar feeder dykes and lateral spreading cracks that fed the surface vents were re-activated during each liquefaction episode. Silt drapes separating events were also identified. The location of these modern liquefaction features in the subsurface was found to correspond with paleo-liquefaction features including sand sills and dykes. At Sullivan Park these were cut by anthropogenic pits and paleo-flood deposits from the early 1900’s.
The presence of paleo-liquefaction confirms that previously undocumented liquefaction has occurred within eastern Christchurch prior to the Darfield earthquake sequence. This can constrain the likely recurrence intervals for liquefaction causing earthquakes within the Christchurch area. The
alignment of the modern and paleo-liquefaction features suggests that the same zone of weakness is re-used in subsequent events, therefore mapping the distribution of modern liquefaction ejecta provides important information on the likely location of future surface ejection events. The observations are relevant to land zonation decisions during the re-building of Christchurch.
Postseismic Strain and Fault Slip in the Region Between the Darfield and
Christchurch Earthquakes
J. Beavan1, C. Pearson
2 and N. Palmer
1
1GNS Science, PO Box 30368, Lower Hutt, New
Zealand 2School of Surveying, University of Otago, PO
Box 56, Dunedin. New Zealand [email protected]
We use data from continuous GPS sites, plus three surveys of a 30-station GPS network observed between February and August 2012, to show that significant strain is continuing in a region from east of the Greendale Fault to at least the east coast. Displacement rates of individual GPS sites are 10 mm/yr or smaller and are generally not significant at 95% confidence, but coherent patterns of displacement are nevertheless evident in the data. The maximum right-lateral shear strain rate in the 40×40 km region enclosing the GPS network is 0.31±0.16×10
-6/yr acting across azimuth
70º±15º, where the quoted uncertainties are at 95% confidence. After rejecting data from some apparently anomalous sites, the displacement rates can be modelled as uniform slip on a buried dislocation. Fixing the bottom depth of the dislocation to 12 km (because the data are not sensitive to this parameter) and the length to 40 km (because we have no constraints at the eastern, offshore, end) all other parameters can be inverted for. We find nearly right-lateral slip of 70 mm/yr between 7 and 12 km depth on a plane striking 75º and dipping steeply to the SSE. This plane underlies both the main aftershock zone leading ENE from near Rolleston and the main slip patches of the February 2011 earthquake. The equivalent moment release rate between Rolleston and the coast is MW 5.7/yr, which is much larger than can be explained by aftershocks in the region. We infer that aseismic slip is occurring on a fault or faults at depth below both the 2011 earthquakes and the aftershock zone east of Rolleston.
8
Urban Geological Mapping: Medium Term Goals and Progress on Christchurch
J.G. Begg1, K.E. Jones
1, D.J.A. Barrell
2, M.S.
Rattenbury1 and R. Ramilo
3
1GNS Science, PO Box 30368, Lower Hutt, New
Zealand 2GNS Science, Private Bag 1930, Dunedin, New
Zealand 3GHD PO Box 1746, Wellington, New Zealand
A geological mapping programme to better understand the geology beneath the country’s urban areas is now underway. About 72% of New Zealand’s population live in our 15 largest cities, with 86% in towns of >40,000. Although the area represented by these urban communities makes up only 3% of the country’s land area, individual and governmental (local, regional and national) investment within this area is extremely high. A number of urban geological maps at varying scales have been published during the last 35 years. In most cases little digital information was available on sub-surface materials, and suitable software did not exist to manage it. Urban centres have been prioritised according to parameters such as population; rate of growth; quality of best available existing data; and geological hazards present. Medium term effort will be focussed on Palmerston North, Dunedin, Napier-Hastings and Queenstown Lakes. Existing digital urban geological maps have been made available via the internet.
The advent of the earthquake sequence from September 2010 established Christchurch as the urgent priority. Lidar data provide a basis for detailed geomorphic mapping. Subsurface data includes the pre-existing Environment Canterbury digital borehole log database which records lithological information on materials to depths of up to 200-300 m. Subsequent to the Darfield earthquake a large number of boreholes and geotechnical soundings (mostly to depths of up to 40 m) provide high quality digital data across the central and eastern city. Existing and new subsurface data have been assembled, simplified and modelled in terms of stratigraphic unit, lithology and geotechnical characteristics, including soil behaviour type (SBTn) and density (N(160)). Models reveal different aspects of Christchurch surface and its relationship with subsurface geology, providing interpolated boundaries and volumes valuable for a wide range of purposes, including foundation conditions, liquefaction susceptibility, and ground shaking amplification.
Geophysical Exploration for Deep Geothermal Resources in the Taupo Volcanic
Zone
T. Bertrand1, G. Caldwell
1, S. Bannister
1, G.
Hill1, S. Bennie
1 and S. Bourguignon
1
1GNS Science, PO Box 30368, Lower Hutt, New
Zealand [email protected]
The Taupo Volcanic Zone (TVZ) is a rifted arc and supports 23 high-temperature geothermal systems. Many of these systems have been developed to a maximum of 3 km depth and provide NZ with ~14% of its electricity demand. To maintain, or to increase this level of geothermal energy in the long-term, will require production from depths greater than 3km where temperatures may approach 400°C.
In 2008, the government of NZ funded an integrated research project (Hotter-and-Deeper) to guide future deep exploration in the TVZ. For this project, 220 Magnetotelluric (MT) measurements were made (with 2 km spacing) that form an array of soundings in the Taupo-Reporoa basin. These MT data were collected by GNS Science and Auckland University to provide a comprehensive picture of the 3-D conductivity structure down to the brittle-ductile transition (~7 km depth). Inverse models of these data (in 2-D and 3-D) show the first-ever images of narrow, vertical low-resistivity zones beneath the shallow geothermal systems that are interpreted to be convection plumes of hot-fluids rising from the brittle-ductile transition.
In addition, a 40 site broadband passive-seismic array (with 4 km spacing) was deployed in the same area as the MT survey. This array recorded local shallow (<10 km depth) seismicity as well as earthquakes in the subducted Pacific plate (50-100 km depth beneath the array). The recorded earthquake data have been used to generate body wave tomography models, focusing on Vp, Vp/Vs and Q at 0-20 km depth. Together, the seismic and MT models provide strong constraints on the mechanisms that control the flow of fluids at 3-7 km depth beneath the TVZ.
9
δ2H and δ
18O Compositions of Extra-Tropical
Meteoric Waters across New Zealand: Implications for Palaeotempestology
J.M. Blackstock1, T. Brookman
1 and T.W.
Horton1
1Department of Geological Sciences, University of Canterbury, Private Bag 4800, Christchurch
[email protected] Understanding the frequency of tropical cyclone activity is a crucial issue relevant to the impacts of modern global climate change, including the increased hazards cyclones pose to life, infrastructure, property, and land use practices. Tropical cyclone activity is related to (multi) decadal oscillations in ocean-atmospheric processes and conditions, thus assessments of cyclone activity derived from historical records alone are limited. In the case of New Zealand, the first documented extra-tropical cyclone occurred in 1939 although prior events most certainly occurred. Satellite-based data collection and documentation extends only as far back as 1970, however the development of high-resolution proxies, capable of discerning seasonal to sub-seasonal variations in δ18O composition, present an unprecedented opportunity to reconstruct records of severe weather for the recent geological past. To date, palaeotempestological proxies remain uncalibrated in New Zealand. Here, we present both intra-storm and monthly average meteoric water δ2H and δ18O values for multiple sites across New Zealand experiencing extra-tropical cyclones. Intrastorm variability in Christchurch, New Zealand exhibits major shifts (>10 ‰ δ18O) in isotopic composition. Anomalous negative shifts (>5‰ δ18O) are also recorded in monthly samples collected from sites widely dispersed across the North Island. These observations agree well with documented negative shifts in meteoric water isotopic compositions associated with tropical and extra-tropical cyclone activity. This study provides a critical baseline dataset for the calibration and interpretation of palaeotempestological datasets derived from New Zealand proxies, particularly new, sub-seasonal resolution dendrochemical records. Extra-tropical cyclone activity reconstructions from these dendrochemical records could provide vital clues to palaeo-ENSO cyclicity given the inherent links between La Niña and cyclone frequency. Currently our ability to interpret these proxy records is severely limited by the lack of long-term monitoring of the
isotopic composition of meteoric waters across New Zealand.
Spatiotemporal Analysis of Hydrothermal Fluids in the Taupo Volcanic Zone, New
Zealand
J.M. Blackstock1, F. Bégué
1, T.W. Horton
1, D.
Gravely1, C. Deering
2 and K. Brown
3
1Department of Geological Sciences, University of Canterbury, Private Bag 4800, Christchurch
2Geology Dept., University of Wisconsin at
Oshkosh, 800 Algoma Blvd., Oshkos, WI, USA 3Geokem, P.O. Box 30-125, ST Martins, 8246,
Christchurch [email protected]
Geochemical tracers, including B, Cl, Cs, and Li, are commonly applied in crustal fluid-flow investigations as they are assumed to behave conservatively along complex flowpaths spanning a wide range of temperatures and pressures. Several studies in the Taupo Volcanic Zone, New Zealand (TVZ) have used elemental ratios (e.g. B/Cl and Li/Cs) to argue that crustal fluids in the TVZ are derived from two spatially discrete sources: an arc-type fluid in the eastern TVZ and a rift-type fluid in the west. Since the initial interpretations were published, the geochemical composition of crustal fluids has been extensively monitored at both high spatial and temporal resolutions. Analysis of this larger dataset demonstrates that two distinct B/Cl ratios are present. Contrary to earlier work, our results do not exhibit an east-west spatial pattern related to this fluid chemistry. Rather, higher B/Cl ratios occur on both the eastern and western margins of the TVZ implying that local structures and permeability are perhaps more significant controls of this fluid chemistry than the fluid source(s). The observation that fluids in geothermal fields can exhibit both B/Cl ratio types through time further suggests that a simple two end-member arc- and rift-type fluid system cannot fully describe the complex source at greater depths. Unlike the B/Cl ratios, the Li/Cs ratios of the same fluids are similar, irrespective of source(s) at greater depths, indicating conservative behaviour. This discrepancy indicates that B and Cl are not behaving conservatively, and unique water-rock interactions may be altering the B/Cl ratios of fluids along the eastern and western margins of the TVZ. Further research is needed, however, to ultimately determine the source(s) of B, Cl, Cs, and Li in the TVZ fluids and what impacts
10
local geological structures might have on the ratios of B/Cl and Li/Cs.
It’s Actually Quite Simple! Depositional Architecture of Eastern Zealandia as
Revealed by Pegasus Basin
K.J. Bland1, M.J. Isaac
1 and C.I. Uruski
1,2
1GNS Science, PO Box 30-368, Lower Hutt,
5040, New Zealand 2OMV New Zealand Ltd, PO Box 2624,
Wellington 6140, New Zealand [email protected]
Analysis of data collected in 2010 by the New Zealand Government’s high-quality 2D “PEG10” seismic survey has confirmed the occurrence of an extensive and thick sedimentary succession within Pegasus Basin, as predicted from several regional seismic lines and gravity anomalies. The basin is located off southeastern North Island, entirely east of the modern subduction interface.
Four megasequences encompass the stratigraphic framework of Pegasus Basin: 1) meta-sedimentary “basement” rocks within a Mesozoic accretionary wedge, 2) Early Cretaceous over-thickened crust of the Hikurangi Plateau, 3) non-accreted “cover” strata age-equivalent to the youngest parts of the Gondwana accretionary wedge, with overlying Late Cretaceous–Paleogene sediments deposited during a phase of passive margin subsidence, and 4) Neogene sediments deposited since the renewal of subduction beneath eastern North Island. These four megasequences also encompass all the stratigraphy cropping out in the much-more deformed East Coast Basin. Understanding the distribution, thickness, and character of these megasequences is critical for petroleum resource evaluation, as well as for understanding the tectonic development of eastern Zealandia.
Subduction of the relatively buoyant Hikurangi Plateau beneath the Chatham Rise part of the Gondwana margin in the late Early Cretaceous is inferred to have choked the subduction system at c. 110–105 Ma, after which Pegasus Basin developed as a northward-prograding passive margin. Late Cretaceous and Paleogene successions are relatively thin, suggesting minimal sediment supply. During the Neogene, sediments were deposited from the south and west, mainly as turbidite and contourite deposits. The Neogene succession contrasts with older units in that it is very thick;
more than 6 km of Neogene sediments are estimated to fill the basin axis.
We dedicate this presentation to a great friend and scientist, Professor Cam Nelson, under whose tutelage and guidance generations of young geologists gained their interests in New Zealand’s geological origins.
Weak Fault Cores, Alpine Fault, New Zealand
C.J. Boulton1, N.C. Barth
2, B.M. Carpenter
3
and V.G. Toy2
1Dept. of Geological Sciences, PB 4800,
Christchurch, New Zealand 2Dept. of Geology, University of Otago, PO Box
56, Dunedin. New Zealand 3 Istituto Nazionale di Geofisica e Vulcanologia,
Rome, Italy [email protected]
Integrated field, mineralogical, microstructural and rock deformation studies show that the Alpine Fault core comprises frictionally weak, clay-rich fault gouges (e.g., Boulton et al., 2012). Along the central section of the Alpine Fault, oblique thrust segment principal slip zones (PSZs) are composed of < 0.05 m-thick striated fault gouges composed of quartz-albite/anorthite-orthoclase/microcline-calcite-smectite-muscovite/illite-chlorite. Friction experiments on saturated PSZ gouges show that these fault rocks are velocity strengthening, with friction coefficients between 0.31 and 0.44. In contrast, clast-supported foliated and nonfoliated cataclasites in the immediate hanging wall are sometimes velocity weakening, with friction coefficients between 0.51 and 0.57.
The southern onshore section of the Alpine Fault is lithologically and structurally distinct (Barth et al., submitted). Here, clay-rich gouges form 1 m to 12 m-thick subvertical fault cores. Mineralogy of the gouges varies along strike, with a 1.5 m-thick fault core at the Martyr River containing velocity strengthening quartz-orthoclase/microcline-albite-calcite-mucovite/illite-chlorite gouges with friction coefficients between 0.32 and 0.37. At McKenzie and Hokuri Creeks, a wider fault core contains saponite-chlorite-serpentinite-rich weaker velocity strengthening gouges with friction coefficients between 0.11 and 0.13.
Clay transformation reactions produce weak PSZ gouges on the Alpine Fault. The presence of recycled gouge clasts suggests that earthquake ruptures preferentially reshear these clay-rich fault rocks. Velocity strengthening materials should theoretically arrest earthquake

11
rupture propagation, but positive feedback mechanisms activated during high velocity slip may weaken the principal slip surface and facilitate large magnitude (~ Mw 8), large displacement (~ 8 – 9 m horizontal slip) earthquakes on the Alpine Fault. Barth, N.C., Boulton, C.J., Carpenter, B.M., Batt, G.E., and V.G. Toy (submitted). Nature and timing of slip localization on the southern Alpine Fault, New Zealand. Tectonics. Boulton, C.J., Carpenter, B.M., Toy, V.G., and C. Marone (2012). Physical properties of surface outcrop cataclastic fault rocks, Alpine Fault, New Zealand. Geochemistry, Geophysics, Geosystems, doi:10.1029/2011GC003872.
Seismicity and 3D Velocity Image of the Harihari-Ross Segment of the Central Alpine
Fault, New Zealand, from ALFA Seismic Array Data
S. Bourguignon
1 and S. Bannister
1
1GNS Science, PO Box 30368, Lower Hutt, New
Zealand [email protected]
Two temporary seismometer arrays, ALFA’08 and ALFA’09, placed along and near the Alpine Fault between Harihari and Inchbonnie, recorded more than 1400 local earthquakes between 2008 and 2010 along this segment of the central Alpine Fault and the surrounding region. Within the bounds of the ALFA09 array we estimate a completeness magnitude of ca. 1.5 for the period of recording. We used the double-difference method tomoDDPS to invert travel-time data from 1062 of these earthquakes to obtain refined estimates of the earthquake hypocentres and seismic properties Vp, Vs and Vp/Vs. The results provide more precise information on the seismicity distribution in the area, both spatially and with depth, and will help us to understand some of the important factors that control seismogenesis near the Alpine Fault.
The seismicity appears divided into three zones. 1) Directly below the surface trace of the Alpine Fault, a number of earthquakes appear uniformly distributed between 5 and 10 km depth. These earthquakes, probably located in the Alpine Fault foot wall, may result from the stresses accumulating at the tip of the locked Alpine Fault. 2) Within a 10 km-wide zone adjacent to the Alpine Fault, there are only a few earthquakes, most at 4-6 km depth, suggesting that frictional and ductile strengths
are very low. 3) The majority, 70% of the earthquakes recorded by ALFA’09 are located between 10 and 25 km southeast of the Alpine Fault, a large proportion of which are at 3-5 km depth, while 95% of these events occur above 7-8 km depth. The depth distribution of these events suggests the transition to ductile behaviour (in feldspars) occurs at about 8 km, corresponding to a temperature ~450-500
oC.
Submarine Fans in the Eastern Taranaki Basin and Plate Convergence During the
Oligocene
R. Brand Kea Petroleum Holdings Ltd, P O Box 19-140,
Courtenay Place 6149, Wellington [email protected]
Submarine fan sandstones of Oligocene age are present in the subsurface of the eastern Taranaki Basin. The Tariki Sandstone of Whaingaroan age is the best documented and forms the primary reservoir in the Tariki, Ahuroa, Kahili and Kauri/Rimu gas-condensate fields. A younger fan of Duntroonian age and similar upper bathyal depositional environment has also been drilled in a number of recent exploration wells.
In its type locality the Tariki Sandstone is some 200m thick, composed of fine to medium grained quartzose sandstone in multi-storey beds up to 5m thick interberdded with thin carbonaceous silty mudstones. Both core and FMI scans show sharp tops and bases with minimal internal form, except for water escape structures, suggestive of debris-flow mass emplacement. A coarsening / thickening upwards electric log signature is diagnostic of a progradational / regressive sequence. Most of the well intersections lie on a S to N transect, along the Tarata Thrust Zone, which appears to parallel the depocentre axis. A variety of ‘confined fan’ depositional models have been proposed, the major similarity between them being the silled western margin and an eastern sediment source.
Seismic and well data show sediment thickness for the Oligocene increasing dramatically towards the eastern margin of the Taranaki Basin – a typical foreland basin, subsiding in front of a westwards directed thrust front. Petrography of the sandstones shows an upwards increase in immaturity from quartz arkoses to arkosic litharenites, reflecting progressive unroofing of older provenance terranes. The Lwh age (30MA) of this uplift and
12
erosion thus defines the onset of convergence between the Maitai-Murihiku and the Brook Street Basement Terranes along the Taranaki Fault. This event may also correlate with early subduction beneath the North Island, some 9MA prior to the emplacement of the Northland Allochthon and a suitable time prior to the extrusion of volcanics in the Western Province during the Early Miocene.
Infrared Imaging of the New Vent Area, Changes Since the Eruption and Post-
Eruptive Degassing at Tongariro
M. Brenna1, S.J. Cronin
1, K. Németh
1 and G.
Lube1
Volcanic Risk Solutions, Massey University, Private Bag 11222, Palmerston North
Following the eruption of Mount Tongariro on the 6
th of August 2012, helicopter flights were made
and infrared images of the eruption area were taken from distances between 50-300 m at 3, 18 and 23 days after the eruption. Infrared images were collected with a JENOPTIC VarioCAM (spectral range 7.5-14 μm). Flights were performed in generally light easterly winds, low to moderate humidity and clear to overcast weather. Images were post-processed using IRBIS 3 Analysis Thermographic Software. An emissivity of 0.8 was applied for the gas plumes. Quantitative measurements indicate maximum fumarole temperature in excess of 200°C but less than 300°C, particularly in those fumaroles (solfataras) associated with intense sulphur encrustations. Comparison of the infrared images with visible light images of the eruption site taken at similar positions shows that the hotter areas are associated with fumarole activity, but also reveals warmer ground areas where degassing is absent. Approximately 20 days following the eruption, a large fracture resembling an elongate collapse feature to the south of Upper TeMari crater has become connected with fractures to the southeast of Lower TeMari crater by a developing area of warmer ground (30-60°C, in contrast to 0-10°C background). This has become visible as an area of darkening ground. On the basis of the current survey of the aftermath of the Tongariro eruption it is clear that infrared thermal imaging is a powerful tool to 1) identify areas of fracturing and weakening, 2) and lateral development of the hydrothermal system, 3) locate and differentiate solfataras from fumaroles, and 4) understand the emitted plume dynamics. These
results along with updated data prior to August will be presented to understand changes in the post-eruptive crater area that may indicate settlement of the site post-eruption and/or sites of potential collapse or new fumarole breakouts.
Crystallisation Ages of Silicic Dome Lavas: 206
Pb/238
U LA-ICPMS Dating of Zircons from the Whitianga Volcanic Centre, Coromandel
Volcanic Zone
R. Briggs and X. Ganqing Dept. of Earth and Ocean Sciences, University of Waikato, Private Bag 3105, Hamilton 3240
The Whitianga volcanic centre (WVC) is a Late Miocene silicic caldera complex in northeastern Coromandel Volcanic Zone. Early thick (>400 m) intracaldera ignimbrites known from borehole data are overlain by a complex stratigraphic succession of fall tuffs and lapilli tuffs, intensely deformed subaqueous intracaldera pyroclastics, younger ignimbrites up to 50 m thick, intercalated fluvial gravels and sands, and lacustrine silts. A later sequence of at least 10 rhyolitic lava domes and flows with carapace breccias and occasional hyaloclastic breccias overlie the intracaldera fill and caldera rims. Gravity modelling by Malengreau et al. (2000) of the Whitianga caldera indicated an estimated volume of low density intracaldera fill of 179 km
3,
a diameter of 15 km, and a depth of 1 to 1.5 km. U/Pb ages of zircons from 7 rhyolitic dome lavas by LA-ICPMS were tightly grouped in age from 8.18 to 8.83 Ma although there are large errors in the age determinations. This compares with K/Ar ages by Adams et al. (1994) and unpublished data from Takagi (1995) for 6 of the dome lavas in the WVC which range from 7.3 to 8.1 Ma. Several zircons gave older U/Pb ages of 14.4 ± 5 Ma, 19.0 ± 1.26 and 28.5 ± 2.8 Ma, which could correspond to detrital zircon ages of the Paritu Plutonics of northern CVZ and the Whangaroa Volcanics in Northland, and 3 detrital zircons in Purangi dome lavas gave similar concordant Proterozoic ages with a mean of 2289 ± 310 Ma. This provides evidence for crustal inheritance of basement rocks in the petrogenesis of CVZ silicic volcanism, which is supported by major and trace element and isotopic compositions of Whitianga rhyolites.
13
Ngatamariki Test Rig
K.L. Brown1 and S.J. Addison
2
1GEOKEM, PO Box 30-125, Barrington,
Christchurch 8244, New Zealand
2Mighty River Power Limited, PO Box 245,
Rotorua 3010, New Zealand [email protected]
At an early stage of the development of the Ngatamariki field, Mighty River Power designed and constructed a test rig utilising geothermal fluids from NM7 to simulate and test a variety of plant designs and conditions. Both a flash test plant and a binary test plant were constructed and tested, to help design the optimal plant for Ngatamariki. Scaling rates and elemental analysis of the deposited scale were determined for test sections located throughout the process for each trial. Additional measurements included silica polymerisation times and acid titration curves.
Three flash plant trials were conducted using a dual-flash design, all utilising acid dosing to a pH25 of 5.0. The low pressure (LP) separation pressure was varied between the trials, ranging from 1.7 bar(g) to 0.44 bar(g), corresponding to a temperature range between 130˚C and 110˚C. Results indicated that the scaling rate increased with a lower flash pressure and temperature, with the scaling rate being acceptable at a LP separation pressure of 1.7 barg, correlating to a silica saturation index (SSI) of 1.8–1.9. For all flash plant trials algae contamination of test pieces was observed, which is thought to be due to operational processes around the flushing and drying of pipes prior to analysis.
Three binary trials were conducted with exit temperatures tested being 95˚C, 90˚C and 85˚C. For all trials, condensate was added to the brine prior to the preheater section to reduce the pH prior to increasing the SSI to >1.0 within the preheater. In all cases both antimony sulphide and arsenic sulphide deposited within the heat exchanger, but for an exit temperature of 85˚C, significant arsenic sulphide also deposited after the preheater, limiting the design exit temperature to 90˚C. Silica deposition was insignificant in all binary trials, indicating that acid dosing is not required to control silica scaling.
Shallow High-Amplitude Anomalies in Seismic Reflection Data from the Reinga
Basin, Northwest of New Zealand
C. Bruce1, A.R. Gorman
1 and I.A. Pecher
2,3
1Dept. of Geology, University of Otago, PO Box
56, Dunedin 9054
2School of Environment, University of Auckland,
Private Bag 92091, Auckland 1142
3GNS Science, PO Box 30368, Lower Hutt 5040
[email protected] The Reinga Basin is a relatively unexplored sedimentary basin located to the northwest of Northland; it is regarded as the northern continuation of the Northland Basin. The Reinga Basin is bounded to the west by the compressional West Norfolk and Wanganella Ridges. To the northeast, the basin is bounded by Reinga Ridge and the Vening-Meinesz Fracture Zone. In 2008-2009, New Zealand Petroleum and Minerals, jointly with CGG Veritas, acquired two 2-D multi-channel petroleum speculation seismic surveys, Stratus-2D and Reinga-09, within the Reinga Basin. To date, no bottom-simulating reflections (BSRs) indicating the presence of gas hydrates have been conclusively identified in either survey. However, several areas of anomalously high amplitude and unresolved polarity have been identified within the probable gas hydrate stability zone (GHSZ). Prestack inversion on prestack Kirchhoff time-migrated CMP gathers using the Hampson-Russell inversion suite has been undertaken on these anomalous amplitude areas to determine the nature of these strong reflections. Due to the lack of well control in the Reinga Basin, background velocity models required for the prestack inversion were calculated by 1-D travel-time inversion. Prestack inversion results from a portion of the STRATUS-2D suggest that the areas of anomalous amplitude are associated with igneous intrusions. P-wave inversions of at least two regions indicate that there is possibly free gas structurally trapped by a faulted pop-up that formed over a shallow igneous intrusion approximately 600 m (500 ms) below the seafloor. Reflection coefficients and inverted P-wave velocities also indicate that basalt may occur beneath the seafloor to the north of the pop-up.
14
Modelling the Recent Evolution of Estuarine Basins: A Synthesis
K. R. Bryan1, S. Hunt
1, B. Van Maanen
2 and G.
Coco3
1Department of Earth and Ocean Sciences,
University of Waikato, Hamilton, New Zealand 2University of Bordeaux, Bordeaux, France
3Universidad de Cantabria, Santander, Spain
Many estuaries in New Zealand are infilling at a rapid rate, as catchment derived-sedimentation rates have been substantially enhanced by land-use changes over the last 150 years. These sediments change the seabed morphology, alter tidal drainage networks, and can enhance the rate of transfer of sediments from the shelf environment. Most New Zealand estuaries are dominated by tidal currents, and so sedimentation rates depend subtly on the balance between the strength and duration of the flood versus ebb currents. Early theory suggests that mature estuaries with well-developed inter-tidal flats tend to be ebb-dominant, where as deep basins begin their development as flood-dominant. The morphological maturity can be quantified by the distribution of area with depth or by the hypsometry. The initial flood dominance develops as the tidal wave crest propagates more quickly than the trough, thus causing the incoming face of the wave to be steep. This steepness drives a pressure gradient which causes a stronger flood tide than ebb tide to develop. This flood-dominance transports sediments to the upper reaches of the estuary, causing the tidal flats to infill. Tidal flats tend to be high friction environments, caused by, for example, mangrove pneumatophores, seagrass meadows, ripples and crab burrows. This frictional effect slows the flood tide down and gradually causes the change from flood to ebb dominance. Thus the subtle interplay of the flood and ebb dominance is hypothesised to control the evolution of estuaries. This paper summarises the results of a number of modelling experiments on idealised basins that show that elements of these early predictions can be replicated. Modelling experiments are performed using three dimensional hydrodynamic models which are forced by simple M2 tidal oscillations on the seaward boundary.
Why the Chathams?
H.J. Campbell1, A. Malahoff
1, D. Crowley
2
1GNS Science, PO Box 30368, Lower Hutt
2Institute of Natural Sciences, Massey
University, Palmerston North [email protected]
What is so fascinating about the Chathams? And why are they there? These questions will be addressed from a geological perspective.
Firstly, the Chathams provide a window on the geology of the eastern Chatham Rise and they provide insight on the potential subsurface geology of Canterbury at the western end of the Chatham Rise. Of particular note are phosphorite-bearing formations (e.g. Paleocene Takatika Grit; only exposed on Chatham Island) and organic-rich fluvial and estuarine successions (mid-Cretaceous Tupuangi Formation; only exposed on Pitt Island). The latter is a potential source rock for hydrocarbons and is considered to occur extensively in basins offshore of eastern New Zealand. In a broader context, the Chatham Islands represent an exposed fragment of undeformed Zealandia.
Secondly, collaborative research in recent years involving GNS Science, Massey University and Monash University (in the main) has examined aspects of the physical volcanic record. We have systematically explored most of the ‘cones’ preserved in the Chathams. They are all considered to be erosional remnants of small submarine volcanoes. Two episodes of dominantly submarine basaltic volcanism are identified: a Paleogene episode associated with the stretching and sinking of Zealandia and a Neogene episode associated with plate boundary convergence and uplift of New Zealand. Conveniently, the two episodes can be characterised in the field on the basis of phenocryst composition. The Paleogene volcanism lacks hornblende whereas the Neogene volcanism is charged with hornblende.
From a mapping perspective, this ready distinction is particularly useful. But what does it mean? It may well be simple and relate to regional tectonism: Paleogene extension followed by Neogene compression. It also tends to support the idea that the Chathams are up, forming a high point on the Chatham Rise, as a function of magmatism and mantle inflation.
15
Magnetic and Gravity Changes at White Island Volcano Prior to the 2012 Unrest
Episode
L. Chardot1,2
, A.W. Hurst3, N. Fournier
2, A.D.
Jolly2, B.J. Scott
2 and A. Mazot
2
1Dept. Geol. Sci., University of Canterbury,
Private Bag 4800, Christchurch. New Zealand 2GNS Science, Wairakei Research Centre, Private Bag 2000, Taupo, New Zealand
3GNS Science, PO Box 30368, Lower Hutt, New
Zealand [email protected]
Following 12 years of relatively minor hydrothermal activity including moderate gas discharge, minor crater floor deformation, and low level seismic activity, some sustained periods of volcanic tremor started at White Island volcano in June 2012 with crater lake fluctuations observed from July. This period of heightened unrest later developed into the weak eruptive activity observed from 5 August, which is still underway at the time of writing. We present results from three magnetic and three gravity surveys acquired prior to this unrest episode, between May 2011 and June 2012. Data were collected at the White Island volcano crater floor on 67 magnetic pegs and 10 gravity tiles when possible. We then compare these results with other monitoring datasets (e.g. levelling, CO2 soil flux) and assess whether the recorded geophysical signals may have been driven by magmatic or hydrothermal processes. Finally, we review the relevance of magnetic and gravity surveys for volcano monitoring at White Island. The 2012 Eruption of Te Mari: Pre- and Post-Eruption Gas Signatures from the Magmatic-
Hydrothermal System
B.W. Christenson1, K. Britten
2, A. Mazot
2 and
J. Fitzgerald1
1GNS Science, PO Box 31312, Lower Hutt, New
Zealand 2GNS Science, Private Bag 2000, Taupo, New
Zealand [email protected]
The August 6 eruption from Te Mari, Mt Tongariro was accompanied by precursory volcano-tectonic earthquakes, and by marked changes in chemical signatures of gases emitted from Lower Te Mari fumaroles. Gas samples collected from the fumarole area on the western rim of Lower Te Mari crater on 22 May 2012
during the annual GeoNet survey of thermal features in Tongariro National Park showed no significant changes from earlier (baseline) values. Earthquake activity commenced on 13 July, and intensified over the period of 18-21 July. A GeoNet response gas survey conducted on July 21 revealed significant increases in magmatic gas signatures from the Lower Te Mari fumaroles by this time, with key ratios CO2/CH4 and N2/Ar increasing from 5,400 to 91,200 and 91 to 1,245 respectively, and increasing further to 121,000 and 1,300 respectively by 27 July. Interestingly, there was only a subtle increase in discharge pressures in the fumarole area, and no change in discharge temperature over the period, consistent with relatively restricted permeability in the near-surface hydrothermal environment.
C/S mole ratios fell from 4.7 in May to 2.6 by 21 July. Post-eruption C/S ratios of plume gases (measured by airborne platform) were also low, ranging from 2.0 on 9 August to 2.9 on 29 August. These immediate pre- and post-eruption ratios are lower than those found on other TVZ volcanoes (e.g., ~ 5 for White Island), and can be attributed to either degassing from an already gas-depleted magma supply at depth, or remobilisation and entrainment of S from the hydrothermal environment during this phase of activity.
Phosphorous Geochemistry in Coastal Meltwater Ponds in McMurdo Sound,
Antarctica
H. Christenson1,2
, J. Webster-Brown1, I.
Hawes1,2
and A. Jungblut3
1Waterways Centre for Freshwater
Management, University of Canterbury, Christchurch
2Gateway Antarctica, University of Canterbury,
Christchurch 3Department of Botany, The Natural History
Museum, London, United Kingdom
Phosphorous plays an essential role in the biochemistry of all living organisms, and understanding factors controlling its availability in an ecosystem can provide insight into how the ecosystem will respond to change. Freshwater ecosystems in Antarctica contain vibrant microbial communities, dominated by cyanobacteria in structured benthic mats. Productivity in meltwater ponds is generally considered to be limited by nitrogen availability in coastal areas and by phosphorous availability
16
inland, however the sources of phosphorous and factors controlling its bioavailability in Antarctic meltwaters are not well understood.
In January 2011 the concentration and distribution of phosphorous in coastal meltwater ponds in McMurdo Sound were investigated. Ponds at three sites were studied: Cape Royds and Cape Evans on Ross Island, and Bratina Island on the McMurdo Ice Shelf. Phosphorous distribution between pond water, sediment, soil, soil salts, snow and the ponds’ bacterial mat was determined for up to 5 ponds at each site. These results have been compiled to construct a model of the phosphorous cycle in each pond, and to identify key reservoirs and transfer processes. In the ponds studied, more than 98 % of phosphorous in the water is contained in the bacterial mats. Pond sediments contain less than 20 % of the total phosphorous in surrounding soils, which have up to 500 mg/kg of water soluble phosphorous, and up to 7 g/kg of total phosphorous. This suggests that recently flooded soils have a major role as an immediate source of phosphorous to newly formed ponds. Research is continuing to quantify the transfer processes in these systems.
Nutrient Flows into Lake Okataina
A. Christophers1 and C. Hendy
1
Dept. of Chemistry, University of Waikato, Hamilton, New Zealand [email protected]
Measurement of the concentration of nutrients and trace elements in groundwaters, stream waters and lake waters of samples taken from Lake Okataina during April and May 2012 show that; a) Evaporation raises the concentration of conservative elements showing that about 30% of the inflow water evaporates. b) Concentrations of nutrient species (phosphorus, nitrate, ammonium and silicon) are all significantly higher in groundwaters than in stream waters, and significantly higher in stream waters than in lake waters. Silicon concentrations in Lake Okataina (~9mg.L-1) are well above limiting values for diatom growth, but both phosphorus and nitrate are close to growth limiting concentrations. c) Concentrations of toxic heavy metals (lead, mercury and arsenic) were measured. Lead showed concentrations up to 70 ug.L-1 in groundwaters but were all well below drinking water tolerance (10ug.L-1) in streams and lake. Mercury concentrations were all lower than
drinking water tolerance (0.5ug.L-1). Arsenic showed significantly higher concentrations in the lake water (7ug.L-1) than any of the inputs, indicating that a concentrating mechanism is operating in the lake. d) Higher Iron and Manganese concentrations in groundwaters than in streams or lake waters indicate reducing conditions in the groundwaters, leading to dominance by ammonium over nitrate with concentrations up to 4mg.L-1. Highest nutrient concentrations were found between the public toilets septic tank drainage field and the lake. Bonsai Trees – Phylogenetics of Character-Poor Spissatella and Eucrassatella (Bivalvia,
Crassatellidae) using Stratocladistics and Morphometrics
K.S. Collins
1, J.S. Crampton
1,2 and M.J.
Hannah1
1School of Geography, Environment and Earth
Sciences, VUW, PO Box 600, Wellington 6140 2GNS Science, PO Box 30368, Lower Hutt 5040,
New Zealand [email protected]
Fossils are the only remnants we have of over 99% of the species that have ever existed, many of which represent ancestors or sisters of extant groups. Characterisation of the Tree of Life is a central goal of biology and palaeobiology, but if we wish to recover the true tree, we have to include the branches that have been pruned. We also have to include small or difficult groups, and for these we sometimes have to amend our methodologies. Techniques for phylogenetic analysis of large datasets have been developed and depend largely on sheer brute-force computing power and heuristic tree-searching algorithms. The advantage of a small group is that we can run an exhaustive search for the most parsimonious solution – but a lack of data overall will render that advantage moot.
The larger fossil Crassatellidae of New Zealand are one such small, character-poor group. Fossil datasets have an advantage over those that only include extant taxa, in that associated stratigraphic data impart knowledge as to patterns of occurrence through time, and inclusion of these data has been shown to increase the resolving power of cladistics.
Integrating stratigraphy with multivariate morphometrics, we have produced a phylogeny of the larger New Zealand Crassatellidae. This
17
talk will present this phylogeny and discuss a new revision of the species and genera included.
Platinum Stable Isotopes in Authigenic Marine Sediments
L. Corcoran
1, M. Handler
1, J. Baker
1, J.
Creech1 and V. Bennett
2
1School of Geog, Env and Earth Sciences,
Victoria University of Wellington, Wellington 2Research School of Earth Sciences, Australian
National University, Canberra, ACT 0200 [email protected]
Platinum is a non-bio-essential transition metal with six stable isotopes (
190Pt,
192Pt,
194Pt,
195Pt,
196Pt, and
198Pt) and several naturally occurring
oxidation states: Pt0, Pt
2+ and Pt
4+. Platinum is
generally considered to exist in the hydrosphere as Pt
2+ although its behaviour in the marine
environment is poorly constrained, and Pt4+
may also be present. Variations in ocean redox state, together with changes in source fluxes to the oceans, may therefore lead to small variations in the stable isotopic composition of marine Pt, raising the potential of adding Pt to the growing arsenal of paleoceanographic tracers. Iron-manganese (Fe-Mn) oxyhydroxide deposits form the largest sink for Pt in the modern oxic marine environment, exhibiting enrichments of up to 80 times over pelagic sediments (Goldberg et al., 1986) with Pt concentrations of 6 to 940 ppb. Fe-Mn (oxy) oxyhydroxides precipitate directly from seawater, recording changes in seawater chemistry, Pt concentration and isotopic composition in authigenic Fe-Mn crusts and nodules providing the potential to track variations in marine Pt, both spatially and temporally. This study represents the first investigation of Pt stable isotopes in marine authigenic sediments. A method based on the use of a Pt “double-spike” , anion exchange chemistry to separate platinum from Fe-Mn oxyhydroxide sediments, and high precision analysis using multi-collector inductively coupled plasma mass spectrometry has been developed to measure Pt stable isotopes. Analyses of natural Fe-Mn oxyhydroxide deposits coupled with experiments are being used to evaluate Pt speciation, incorporation into Fe-Mn oxyhydroxides, and variations of Pt stable isotopes. Goldberg, E.D., et al., 1986. Applied Geochemistry, 1, 227-232
SW Pacific Ocean Response to a Warmer Climate – Lessons from the Last Interglacial
G. Cortese
1, G. Dunbar
2, G. Scott
1, L. Carter
2,
H. Bostock3, M. Bowen
4, H. Neil
3, M.
Crundwell1, B. Hayward
5, I. Martinez
6 and A.
Sturm7
1Department of Paleontology, GNS Science,
New Zealand 2Antarctic Research Center, Victoria University
of Wellington, New Zealand 3National Institute of Water and Atmospheric
Research, Wellington, New Zealand 4School of Environment, University of Auckland,
New Zealand 5Geomarine Research, Auckland, New Zealand
6Universidad EAFIT, Medellin, Colombia
7Alfred Wegener Institute for Polar and Marine
Research, Bremerhaven, Germany [email protected]
Although its orbital configuration is different from that of the Holocene, the interglacial Marine Isotope Stage (MIS) 5e is a valuable analogue to assess the SW Pacific Ocean’s response to warmer temperatures. This is because MIS 5e is well recorded in a sufficient number of sediment cores with published archives to capture the diverse ocean water-masses and currents in the region.
Using foraminiferal assemblages to determine water masses and sea surface temperatures (SST), we assessed ocean changes from MIS 6 to 5 on 17 cores from tropical to subantarctic latitudes, east and west of New Zealand. Both maximum and mean SSTs for MIS 5e highlight a pronounced southward warming along eastern Australia to southern Tasmania where SSTs were 2 to 3
o C warmer
than present (WTP). This is consistent with the modern oceanography, which reveals a 350km southward extension of the East Australian Current. This change has warmed offshore Tasmania by +2
o C since 1944. Presently, warm
subtropical water reaches the North Island via the Tasman Front, which was maintained in MIS 5e when the Front’s SST was 1.9
o C WTP.
However, a second trans-Tasman inflow seems to have established from Tasmania that introduced subtropical water to the Campbell Plateau and Southland Front where SSTs were >2
o C WTP. That temperature anomaly also
included heat that was introduced by a warmer and possibly strengthened Subantarctic Front, again a mechanism consistent with the modern ocean circulation. This overall warming of Campbell Plateau by subtropical and subantarctic sources helped thermally stratify the
18
uppermost ocean to produce conditions favourable for coccolithophorid blooms as evinced by the plateau-wide deposition of coccolith ooze (mainly Gephyrocapsa carribeanica). While marine productivity changed from zooplankton- to phytoplankton-based in MIS 5e, the amount of pelagic productivity was similar to the Holocene as indicated by similar mass accumulation rates of biogenic carbonate. Longitudinal Temperature Profile of the Avon
River, Post-Earthquake Christchurch, New Zealand
S.C. Cox1, C.A. Cox
2, A. Sims
3 and H. Rutter
4
1GNS Science, Private Bag 1930, Dunedin. 2John McGlashan College, 2 Pilkington St,
Dunedin. 3Dept. of Geography, University of Otago, PO
Box 56, Dunedin. Aqualinc Research, P O Box 20-462,
Bishopdale, Christchurch [email protected]
Distributed temperature sensing is being increasingly applied to delineate areas of leakage and recharge in rivers. In this study we aimed to: 1) characterise the temperature regime in Avon River - a spring fed river which discharges to the sea; 2) look for temperature anomalies that might be caused by groundwater recharge and/or earthquake-related ground damage; 3) trial a fast, cheap, method of distributed temperature sensing using kayaks, a hand-held Garmin Etrex GPS unit and submerged Hobo U20 temperature loggers.
A longitudinal temperature profile was collected on 10 June 2012, shortly after a wintery blast blanketed Christchurch with 10-15 cm of snow and the city had experienced the lowest maximum daily temperatures (0.4°C) in its 149 year climate record. Temperature logger (accuracy ±0.37°C, precision ±0.1°C) and GPS (±3 m relative, ~10 m absolute) clocks were synchronised then instruments set at 15 min recording intervals. Loggers were towed behind kayaks, submerged to 40 cm depth. 973 measurements (average spacing 17 m) were made between 0830-1530 hrs over a 17.5 km reach, paddling upstream to ensure different packets of water were sampled. To remove any effects of diurnal warming, temperatures were corrected according to variation at a base station logger.
Avon River is sourced in the suburbs of Ilam, Riccarton and Fendalton where groundwater emerges as a series of springs at 12-14°C. As water flows downstream it changes
temperature, depending strongly on the season. On 10 June 2012, the water was progressively cooler from the headwaters at Hagley Park (11.8°C) to the estuary mouth (7.2°C), while daily base station variation was only 1°C. Importantly, the apparent 4.6°C cooling of Avon water occurred in a series of distinct steps. The longitudinal profile did not follow an exponential decay downstream, which might be expected if cooling was caused by a simple conductive equilibration with the environment. Instead, data steps are indicative of a thermal regime dominated by mixing processes. Steps correspond to places where water enters the Avon at culverts, side-streams or pump stations, or from the tide. No distinct temperature anomalies were found that can be clearly attributed to groundwater recharge, for example where ground damage was most extensive in the eastern suburbs, although the possibility that small ‘thermally insignificant’ volumes of seepage were occurring cannot be ruled out. Aragonite Axe Angst: Assessing Aragonitic
Megabias in the Fossil Record
J.S. Crampton1,2
, C.S. Nelson3 and A.G. Beu
1
1GNS Science, PO Box 30368, Lower Hutt, New
Zealand 2School Geography, Environment & Earth
Sciences, Victoria University, PO Box 600, Wellington
3Dept. of Earth and Ocean Sciences, University of Waikato, PB 3105, Hamilton, New Zealand
[email protected] There is abundant evidence to indicate that early post-mortem dissolution of aragonitic marine shells is widespread, with dissolution occurring either on the sea bed or during early burial: this is the ‘aragonite axe’ of the title. Whereas this taphonomic bias is evident at the scale of individual fossil beds or formations, recently there has been debate about the extent to which it is a megabias that profoundly affects the fossil record when viewed at the scale of regional faunas and stages. Thus, for example, it may be that diverse, dominantly aragonitic gastropods are strongly underrepresented in the fossil record, skewing paleobiodiversity, evolutionary and paleoecological interpretations. Alternatively, there may be sufficient redundancy in the fossil record, or preservation as moulds or mineral replacements, to mitigate the effects of the aragonitic axe at larger scales.
In this study, we examine this question using average, per-stage sampling probabilities
19
for New Zealand Cenozoic marine mollusc species; this is the first time that species sampling probabilities have been brought to bear on the problem. We find that there is no discernible difference in sampling probabilities of aragonitic versus calcitic species at the scale of the entire Cenozoic fossil record, or if examined stage-by-stage for the interval post-20 Ma or prior to 35 Ma. In contrast, there is a strong relative bias against aragonitic taxa of ~30% sampling probability for the interval between 35 Ma and 20 Ma, centred on the Oligocene. This interval corresponds to the time of deposition of carbonate-dominated strata in the New Zealand region. We infer that this pattern reflects dissolution of aragonite in relatively less carbonate saturated temperate water settings experiencing low sedimentation rates.
Megabias or not? Yes and no! It seems that in temperate settings there is no aragonite megabias in siliciclastic successions, but there is within cool-water carbonate formations.
Late-Ordovician Tectonics Along the Gondwana Paleo-Pacific Margin: Re-Os Data from Au-Associated Structures in the Ross -
Delamerian Orogens (Antarctica And Australia)
L. Crispini
1, H. Stein
2.3, L. Federico
1, G. Yang
2,
I. Pitcairn4, F. Bierlein
5 and G. Capponi
1
1DISTAV, University of Genova, Corso Europa
26, 16132 Genova, Italy 2AIRIE Program, Colorado State University, Fort
Collins, CO 80523-1482 USA 3Physics of Geological Processes, University of
Oslo, 0316 Oslo, Norway 4Department of Geological Sciences, Stockholm
University, 10691 Sweden 5AREVA, Forestville, SA 5035, Australia
In northern Victoria Land (Antarctica) a system of steeply-dipping reverse and strike-slip faults (Federico et al., 2010) overprint Cambrian–Ordovician ductile structures of the Ross orogeny. This fault system is locally associated with diffuse veining and hydrothermal alteration, but its age is poorly constrained. In the Bowers Mountains, this fault system is associated with gold mineralization at the Dorn deposit (Crispini et al., 2011), that is the first described occurrence of gold in Paleozoic terranes of Antarctica; analogy with Au mineralization in the Stawell zone (Australia) is suggested.
To provide age constraints for the gold mineralization, and their hosting structures we
applied the Re-Os chronometer to Au-associated arsenopyrite-pyrite. We also acquired Re-Os data for an arsenopyrite-rich Au sample from Stawell (Australia) for comparison. Well-constrained Re-Os ages of 450-440 Ma were previously obtained for Au-associated arsenopyrites-pyrites at the nearby Bendigo Au mine, Lachlan fold belt, Australia (Arne et al., 2001). For Stawell, well-measured, but notably low
187Re/
188Os ratios (<40) are coupled with
significant common Os and preliminary results point toward a late Neoproterozoic age. For the Dorn vein system (Antarctica), Re-Os isotopic data for arsenopyrite-pyrite are somewhat scattered; this is attributed to variably fresh outcrop samples. In sum, poor isochroneity for five analyzed samples with two replicates is coupled with highly variably negative initial Os ratios for most sample groupings, precluding reliable age results: just a crude indication of lower Paleozoic - Neo proterozoic age is derived. Re and Os concentrations were low at 2-25 ppb and 30-170 ppt, respectively.
The application of Re-Os presents a two-fold opportunity: (1) reconstruction of the pre-breakup architecture of the Gondwana Pacific margin, and (2) refining the space-time transition from the Ross-Delamerian to the Lachlan orogeny along the Pacific margin of Gondwana. Support for Re-Os analytical work – AIRIE Program-45%, MIUR-PNRA-25%, Stockholm University-30%
Mt. Tongariro (New Zealand) 6 August 2012 Eruption: Big Questions from a Small Event
S.J. Cronin
1, G. Jolly
2, H. Keys
3 and the NZ
volcanic response team 1Volcanic Risk Solutions, Institute of Natural Resources, Massey University, Palmerston
North 2GNS Science, Wairakei Research Centre, PO
Box 2000, Taupo 3Department of Conservation, Tongairo
Conservancy, Turangi [email protected]
After 115 years of quiescence, Mt. Tongariro erupted suddenly at 2350 hrs on 6 August 2012. The eruption occurred on the volcano’s northern flanks from the upper Te Maari Crater, previously active in 1869, 1892 and 1896-1897. These past eruptions were brief vulcanian and phreatic explosions, generating ash plumes along with wet surges and lahars. The Te Maari
20
area hosts a hydrothermal field and pre-event gas indicated underlying degassing magma. A swarm of shallow (<7 km) earthquakes preceded the eruption by three weeks, but had all but stopped by 6 August. The 2012 eruption lasted <10 min, depositing wet surges and debris jets as well as ballistic blocks up to 2.2 km from source. An ash plume ascended to 6.5 km before depositing a light dusting of ash up to 200 km eastwards. A landslide from the vent area began 2.5 min before the eruption, emplacing a debris flow deposit up to 2 km long. This may have unroofed the pressurised hydrothermal system, possibly inducing instability in an underlying small, shallow, crystalising dyke of andesitic magma. Initial explosions were laterally directed from a shallow locus, rapidly followed by a vertical ash column. The pyroclastic deposits comprise dominantly fractured lava, hydrothermally altered rock, crystal fragments, along with 5-10 vol.% of fresh glass shards, mostly in the <63 µm fraction. Glass compositions reflect a range in microlite-contents and range from blocky fragments, through to pale brown, isotropic, microlite-poor variants with sharp, cuspate surfaces. Post eruptive degassing of >2100 tonne SO2/day also indicates involvement of the magmatic system in the explosions. The c. 400,000 m
3 of ash
produced during this event was extremely widely dispersed and its surface chemical composition is very complex, raising questions around the current methods for evaluating environmental and health consequences volcanic eruptions.
Paleocene Dinoflagellate Cyst Biostratigraphy and Paleoenvironments in
Eastern New Zealand
E.M. Crouch1, P.S. Willumsen
2, D. Kulhanek
1,
S. Gibbs3 and M. Tayler
4
1GNS Science, PO Box 30368, Lower Hutt, New
Zealand 2Dept. of Geology, Lund University, Sölvegatan
12, 223 62 Lund, Sweden 3National Oceanography Centre, University of Southampton, Southampton SO12 3ZH, UK
4Dept. of Earth and Ocean Sciences, University of Waikato, Private Bag 3105, Hamilton 3240
Diverse and abundant organic-walled dinoflagellate cyst (dinocyst) assemblages are found in almost all marine settings of Paleocene (Teurian) age throughout New Zealand. Until now, the New Zealand Teurian Stage has been encompassed by three formal dinocyst zones.
Here we establish a more detailed Paleocene zonation and better correlate this scheme to the New Zealand and International Timescales.
We have examined dinocyst assemblages from five sections in eastern New Zealand: Tawanui, Angora Road and Toi Flat-1 core in the East Coast Basin, mid-Waipara River in Canterbury Basin, and ODP Site 1121 on the eastern margin of the Campbell Plateau. Calcareous nannofossil assemblages have also been examined to assist with the age and correlation of dinocyst assemblages. Based on results from these sections, along with published earliest Paleocene records from Marlborough and Canterbury Basin, we propose a revised Paleocene dinocyst zonation. The eight New Zealand Dinocyst Paleocene zones, NZDP1 to NZDP8, are all interval zones and encompass the entire Paleocene, from the Cretaceous–Paleogene boundary (66.04 Ma) to the Paleocene–Eocene boundary (55.96 Ma). The NZDP zones are correlated with the 2012 International Geologic Timescale (Gradstein et al., 2012), utilising mainly calcareous nannofossil bioevents.
Dinocyst assemblages record distinct relative abundance variations through the Paleocene. Peridinioid dinocysts, thought to represent primarily heterotrophic dinoflagellates, are abundant in two time intervals. A succession of peridinioid genera, such as Trithyrodinium, Palaeoperidinium and Vozzhennikovia, dominate assemblages through the Early Paleocene. In the late Middle–early Late Paleocene peridinioid dinocysts, mainly Senegalinium species, are abundant in an interval that correlates with deposition of the organic-rich Waipawa (Tartan) Formation. Gradstein, F., Ogg, J., Schmitz, M., Ogg, G. (Editors), 2012: The Geologic Time Scale 2012. Elsevier.
Planktic Foraminiferal Records of Climatically-Forced Changes in Regional
Oceanic Circulation
M.P. Crundwell GNS Science, PO Box 30368, Lower Hutt 5040
The Neogene history of oceanic circulation and oceanic front development in the New Zealand region of the Southwest Pacific is intimately linked to global climatic changes. These changes are recorded in stratigraphic records of planktic foraminifera recovered from deep-sea

21
sites drilled during the Deep Sea Drilling Project (DSDP), Ocean Drilling Program (ODP, and Integrated Ocean Drilling Program (IODP). Some of the most distinctive planktic foraminiferal events clearly involve major changes in regional oceanic circulation.
For example, a marked mid Lillburnian (~13.7 Ma) increase in the abundance of Paragloborotalia occurs at about the same time as the Mi3 global cooling event – a negative 1‰ δ
18O shift that marks the establishment of a large
permanent East Antarctic Ice Sheet. It may also have been when the Subtropical Front moved northwards across the New Zealand subcontinent to its present-day position, over the Chatham Rise.
Disappearances of the water-water species Globoquadrina dehiscens provide more examples of climatically-forced changes in oceanic circulation. In subantarctic waters it disappears mid Lillburnian (~13.7 Ma), and in temperate waters it disappears mid Tongaporutuan (8.95 Ma), except for rare expatriates near the Miocene-Pliocene boundary in parts of New Zealand influenced by the warm East Cape Current. The expatriates are presumed to have been transported from low latitude regions where the stratigraphic range of Globoquadrina dehiscens extends up to the Miocene-Pliocene boundary (5.32 Ma). This pattern of disappearances is interpreted to represent stepwise equatorward contractions in the species biogeographic range, as oceanic circulation adjusted to major episodes of global cooling.
These are just some of the planktic foraminiferal events that have been linked to climatically-forced changes in regional oceanic circulation. The important question we need to ask is – where planktic foraminiferal events like these occur near the middle of New Zealand stages, should they be adopted as formal criteria for stage subdivisions?
Combined (238
U/230
Th) Disequilibrium and (U-Th)/He Dating of Zircon as a Tool for Late
Quaternary Tephrochronology
M. Danišík1,2
, A.K. Schmitt3 and P.J.J. Kamp
1
1Dept. of Earth & Ocean Sciences, University of
Waikato, Hamilton, New Zealand 2John de Laeter Centre of Isotope Research,
Curtin University, Perth, Australia 3Dept. of Earth and Space Sciences, University
of California, Los Angeles, USA [email protected]
K/Ar, Ar/Ar and radiocarbon methods are the chief chronological approaches for constraining the age of late Quaternary volcanic deposits. However, these methods are often limited by a scarcity of materials suitable for dating, open-system behaviour of radioactive parent-daughter pairs, mass-dependent kinetic isotopic fractionation, uncertainties in the calibrations, and/or limitations in analytical sensitivity.
(U-Th)/He dating of zircon, when combined with
238U/
230Th disequilibrium dating
(Schmitt et al., 2006) is a novel method that has the potential to be a reliable tool in Quaternary geochronology (e.g., Danišík et al., 2012). This dating approach is based on the vastly different diffusive properties of the daughter products of U and Th decay in zircon (
230Th and
4He). The
238U/
230Th system is closed at magmatic
temperatures (~900°C) and records the zircon crystallization age, whereas eruption age is recorded by the (U-Th)/He age because fast-diffusing helium atoms only accumulate in zircon after it cools below ~180°C. This dating approach offers several advantages: it allows the same zircon crystal to be used for both dating methods yielding both crystallization and eruption ages on a single crystal; it provides an internal consistency check for
238U/
230Th and (U-
Th)/He methods; single grain dating allows identification of outliers and relict age components (e.g., zircon xenocrysts or antecrysts) inherited from earlier stages in the magmatic evolution; unlike radiocarbon methods, the approach has virtually no upper age limitation.
In this talk, I will summarize methodology and requirements of the dating technique, and present a few examples of its successful application. Schmitt A.K. et al. (2006) J. Volcanol. Geoth. Res. 158 (3-4), 281-295. Danišík M. et al. (2012) EPSL 349-350, 240-250.
22
Enlightening the Public or Advertising the Outfit? Science Outreach from a Manager’s
Point of View
D. Darby GNS Science, PO Box 30368, Lower Hutt 5040
A good place to start thinking about science outreach is where many of us started gaining our appreciation of science, that is, at our own primary or secondary school. Educationalists have developed four or five compelling reasons why science should be taught at school. I suggest these reasons are very similar to the reasons that motivate us, as idealistic individuals, to undertake science outreach to the general public. But the world is not ideal for science outreach in at least two respects.
Firstly, we can fall into traps, such as believing naively in the knowledge-deficit theory (“if only they understood our science, they would see how good it is”); or we may come across as an advocate for some position rather than as an explainer of how the world works (“the obvious benefits of this science far outweigh the relatively minor risks”).
Secondly, in order to undertake any significant outreach program, one usually requires a source of funding from an employer or sponsor, whether this is for salary, travel, or internet/print publication costs. Therefore, one has to consider some less idealistic and more pragmatic organisational motives for funding and undertaking outreach. These organisational motives may be altruistic, but are more likely to be pragmatic and strongly influenced by the organisation’s business model, that is, where its revenue stream comes from in both the shorter and longer terms. As with any funded project, it then becomes more important to define precisely what we mean by an outreach activity, how we can assess its effectiveness in satisfying the interests of the funder, and how we can surmount obstacles.
Ultimately and philosophically, I do not think it really matters whether the motives for science outreach are altruistic or pragmatic. The important thing is that it is done.
Sub-Glacial Volcanism in Western Ross Sea?
F. Davey1, J. Lee
2, Y. Kim
2 and L. Lawver
3
1 GNS Science, PO Box 30368, Lower Hutt, New
Zealand
2 Korea Polar Research Institute, Incheon, 406-
840, Korea 3UTIG, Jackson School of Geoscience, Univ. Of
Texas, Austin, TX, USA [email protected]
New multibeam bathymetry data in the western Ross Sea, Antarctica, extend the field of unusual flat topped seafloor mounds located west of Franklin Island (OGS Explora Mounds) by about 6 km further east. An additional six mounds have been delineated, with some appearing to be coalesced features. The total field covers an area about 20 km square and lies at a depth of about 500 m. The north-western margin trends NNE, drops sharply away into water depths of about 850 m and is probably fault controlled. The mounds have a northerly trend and tend to be circular in the east and linear in the west. The largest mound is about 4 km across and 100 m high. The mounds have a steepest slope to the south-east, and shallowest slope to the northwest, consistent with erosion by a northwest icesheet movement. Three similar features were delineated about 25 km to the south of Franklin Island at a depth of 650 m, and one 5 km east of Franklin Island at a depth of about 400 m. Seismic, gravity and magnetic data indicate that the mounds are largely low density, non-magnetic bodies overlying a largely non-disrupted sedimentary section. Some mounds, however, have an associated small (~ 50 nT), short wavelength, normal or reversed magnetic anomaly, suggesting a magnetic core to the mounds. Their morphology and proximity to inferred subsurface gas hydrates and associated mud volcanoes and pock marks suggest they may be carbonate banks, but they also occur close to a major volcanic bank and similar mounds are found along the volcanic Franklin Island ridge. Our preferred interpretation is that they are of volcanic origin, erupted under a grounded ice sheet as hyaloclastite edifices. This is supported by recent dredging.
23
Rearrangement of the New Zealand Segment of the Gondwana Margin Following Hikurangi
Plateau Subduction and Jamming
B. Davy1
GNS Science [email protected]
The c. 1200 km long Chatham Rise has been long thought of as a near-linear E-W fossil convergent margin of Gondwana. This contrasts with the WNW-ESE trend of basement geology onshore eastern South Island. Closer examination of the basement fabric in the Bouguer gravity map reveals that while segments of the Chatham Rise align E-W the rise is segmented into several offset lengths which overall give a more WNW-ESE orientation to the rise.
Arising from gravity/magnetic derived interpretations of basement faulting beneath Canterbury, undertaken consequent to the Christchurch earthquakes, it is now possible to map the onshore continuation of the Chatham Rise fabric.
In a similar manner to the rotation of Cretaceous spreading-ridge and transform-fault fabric between the Osbourn Trough spreading ridge and the Hikurangi Plateau the convergence direction at the Gondwana margin was rotated anti-clockwise to N-S. It is proposed that this rotation occurs as a consequence of the slowing and jamming of Hikurangi Plateau subduction beneath the South Island.
My talk will discuss the implications of margin rotation for the development of the Great South Basin and Canterbury Basin as well as discussing revealed convergent margin fabric and speculating on the extent of Hikurangi Plateau subduction both onshore and offshore.
Plutonic-Volcanic Associations Reveal the Anatomy of the Okataina Volcanic Centre
Magmatic System, New Zealand
C. Deering1, R. Turnbull
2, J. Cole
3 and O.
Bachmann4
1Dept of Geology, Univ. of Wisconsin-Oshkosh,
800 Algoma Rd, Oshkosh, WI, USA 2GNS Science, Dunedin Research Centre, 764 Cumberland St, Private Bag 1930, Dunedin 3Dept of Geological Sciences, University of
Canterbury, Private Bag 4800, Christchurch 4Institute of Geochemistry & Petrology, Dept of
Earth Sciences, ETH, 8092 Zurich, Switzerland [email protected]
In order to fully understand processes that contribute to silicic eruptions, it is important to not only study the volcanic rocks, but also that portion of the magma system that remains in the mid- to upper-crust. Despite many studies of individual volcanoes, the relationship between volcanism and plutonism is not well understood. This study evaluates the chemistry, mineralogy, and texture of both volcanic rocks and plutonic lithics, found in eruptive deposits from the Okataina Volcanic Centre (OVC), and compares them with older, eroded plutonic systems, which reveal a close association between the two types of magmatic systems.
Plutonic clasts have been principally found in three OVC pyroclastic deposits; Matahina Ignimbrite, Rotoiti Ignimbrite and Kaharoa Tephra, with the greatest variety in lithic lag breccias associated with the Rotoiti Ignimbrite. These include hornblende microgranites and biotite granites, the latter having weakly developed granophyric textures in isolated patches. In the Matahina Ignimbrite there are coarse-grained, amphibole-bearing intermediate clasts showing evidence of mingling, and rare, basaltic clasts containing small acicular hornblende. The Kaharoa Tephra contains granodiorite clasts, rare gabbro and olivine clinopyroxenite clasts, and basalt, mingled with the host rhyolite.
Together, the geochemistry, mineralogy, and textures of the eruptive deposits and plutonic lithics, and processes recognised in older plutonic systems suggest that: 1) Extraction of rhyolite melts from an intermediate mush, which forms a cumulate at ~8-15 km depth following melt extraction. 2) The rhyolite melt fraction rises to higher levels in the crust as ‘pods’ (~3-6 km) from which it may erupt although some portions sometimes reach a quasi-solid state. Cumulate that remains must become largely crystalline (brittle) at times to
24
allow basaltic dikes to penetrate, and sometimes erupt (e.g. Tarawera in 1886). Occasionally, a number of the rhyolitic ‘pods’ may erupt together to form a large silicic ignimbrite, and associated caldera collapse.
Characterisation of Geotechnical Units on Mount Taranaki and Influence on Edifice
Stability
O.K. Deutschle1, M.A. Brideau
1 and J.N.
Procter2
1School of Environment, The University of
Auckland, Auckland, New Zealand 2Institute of Natural Resources, Massey
University, Palmerston North, New Zealand [email protected]
Andesite stratovolcanoes are characterised by a cycle of edifice growth and collapse. Volcanic edifice collapse producing destructive debris avalanches poses a significant geological hazard. Mount Taranaki is a typical example of an andesite stratovolcano. At least 14 debris avalanche deposits have been identified within the <200 ka ring-plain record indicating edifice collapse occurs on average every 10-14,000 years, with five collapses identified over the last 30 ka, suggesting an increase in frequency. The debris avalanche runout is at least 25 km onshore (with some measured at over 40 km) and at least a further 6 km offshore. The current morphology of Mount Taranaki with steep upper slopes indicates the volcano is almost completely regenerated and nearing the end of a cycle, making it primed for collapse.
The main objective of this project is to test the hypothesis that there is a limiting height to Mt. Taranaki. This will be achieved by using field (discontinuity mapping, geological strength index (GSI) estimates, and Schmidt Hammer hardness rebound values) and laboratory (point load, uniaxial, and slake durability) techniques to identify and characterise the geotechnical units present. The results are used to derive rock mass strength parameters for each unit to build 2D geotechnical models using limit equilibrium and finite element codes. The limit equilibrium method is used to find the factor of safety using the method of slices. Scenarios varying the stratigraphy, pore pressure, seismicity, alteration grade and edifice height were considered to assess their influence of the slope stability conditions. The finite element method uses the shear strength reduction technique to investigate the edifice deformation.
Crustal Structure and Tectonics of the South Wanganui Basin – Taranaki Fault Zone along the SAHKE2 Transect
J. Dimech
1, H. Horgan
1, T. Stern
1, B. Tozer
1,
S. Henrys2 and H. Sato
3
1SGEES, Victoria University of Wellington, PO
Box 600, Wellington, New Zealand 2GNS Science, PO Box 30368, Lower Hutt, New
Zealand 3Earthquake Research Institute, University of
Tokyo, Tokyo 113-0032, Japan [email protected]
As part of the SAHKE project a 140 km-long multi-channel seismic line (SAHKE2) was run from southwest of Kapiti Island to the northwest of D’Urville Island. To image the deep and shallow sections, a 10 km-long streamer and a 6000 cu-in airgun array were used to produce 15 s of high quality twt data. In the shallow section a spectacular view of a ~1500 m-high drowned mountain range represents the northward extension of the Marlborough Sounds. Subsidence of this Miocene-Pliocene mountain range probably occurred in the Pleistocene, associated with clearly visible sedimentary onlap. Beneath the range and other areas of structural complexity, diffractions and multiples have obfuscated deep crustal reflectivity across much of the line.
Robust frequency and dip filtering have been applied to isolate the deep crustal response. Our interim analysis of the deep section shows three key features: (1) The top of the subducted Pacific plate has an apparent westward dip of 23 degrees between 9 and 15 s twt; (2) Where the subducted plate abuts the Australian plate the lower crust and Moho of the Australian plate appears to be buckled; and (3) Fault planes from at least two faults that appear at or near the surface seem to continue right through to Moho depths. One is the well known Taranaki Fault, but the strongest feature is an unnamed fault that penetrates to the Moho from the northward projection of the middle of the Marlborough Sounds. This fault coincides with the highest peak of the buried mountain range seen in the shallow section, but has not been active since the sediments were laid down. However, diffractions and multiples are still pervasive in the deep section and we need to do more work on removing these before a final interpretation. Nevertheless, the section shows strong evidence for shortening in the Miocene – Pliocene period.
25
In Search of Hidden Surface Sources of Deformation and Earthquakes: A Catalogue of High Resolution Stress Rates of Surface
Expressions
L.L. Dimitrova1, J. Haines
2, L.M. Wallace
2,
C.A. Williams3 and R.J. Beavan
3
1Institute for Geophysics, University of Texas,
Austin, United States 2GNS Science, Dunedin, New Zealand
3GNS Science, Wellington, New Zealand
Understanding subsurface hazard sources – buried faults, slow slipping faults, locked faults, and deep magma reservoirs – as fully as possible is of paramount importance to hazard mitigation; however, such sources are difficult to detect due to a lack of clear surface expressions. Analysis of GPS velocities has potential to uncover previously unknown sources of deformation that are non-dormant. Currently, such analysis is done in three ways: (1) by fitting prescribed sources, modelled with few free parameters, directly to GPS velocities; (2) by fitting rigid-block models with elastically-behaving zones at prescribed major bounding faults directly to GPS velocities; and (3) by converting horizontal GPS velocities into horizontal strain rates. All of these methods have severe shortcomings, either in terms of the inherently broad wavelength of the GPS velocities, inflexible-prescription of the sources considered, or potentially non-physical optimization employed in the case of strain rate calculations.
We propose that the vertical derivatives of horizontal stress (VDoHS) rates, being inherently much more localized, are substantially higher resolution surface expressions of the subsurface sources than are the GPS velocities or the GPS-derived strain rates. Our first area of study calculating the VDoHS rates will be New Zealand. In order to interpret VDoHS rates in this and future studies, we present an extensive catalogue of surface distributions of the VDoHS rates for a complete range of generic subsurface sources: point subsurface sources and shear and tensile cracks. We will show that the lateral extent of lobes in the VDoHS rates provides quite precise estimates of the depths of the sources. The VDoHS rates are physically the most spatially compact surface manifestations of subsurface sources, and the catalogue we will present is an essential tool for the interpretation of VDoHS rates into type, size and location of subsurface deformation and hazard sources.
Teaching Geology with 21st Century Techniques
J. Dohaney1, E. Brogt
2 and B. Kennedy
1
1Dept of Geological Sciences, University of Canterbury, PB 4800, Christchurch, New
Zealand 2 Academic Development Group, University of
Canterbury, Christchurch [email protected]
In the last decade, there has been a global movement towards the development of effective teaching techniques and educational technology which supports university-level science learning. We’ve designed two innovative learning tools which are aimed at giving geology students the opportunity to learn practical skills needed for their careers: 1) The GeoThermal World videogame and 2) The Volcanic Hazards Simulation.
GeoThermal World is a 3D, immersive, videogame which was designed to teach students geothermal field concepts and skills. It gives the student the opportunity to explore the (fictitious) Sapphire Pools as a geothermal field geologist from their own computer. They are tasked with collecting qualitative (e.g. observations) and quantitative (e.g. measuring conductivity) data in order to thoroughly characterize the hot springs. We’ve tested to see whether our videogame compares with a real field teaching excursion to Orakei Korako. Overall results from pre-post tests showed that we were able to reproduce statistically similar learning gains with the videogame compared with the field trip.
The Volcanic Hazards Simulation is a dynamic, teamwork, role-play simulation in which students are tasked with forecasting volcanic activity and managing the disaster which unfolds. Students are required to communicate as colleagues and to the public (in mock press conferences) under stressful, realistic conditions. Preliminary results indicate that the student’s abilities to communicate are significantly improved after participating in the Simulation which is a result of directed, feedback-rich practice and positive attitudinal changes about their ability to communicate.
Both of these unique teaching tools are used in our department to build-up the student’s competency and capability by applying geological concepts to real life situations. Additionally, they learn and practice transferable skills (i.e. communication, teamwork, fieldwork) that will be needed as they go onto postgraduate studies or the geology workforce.
26
Surface Exposure Dating of Late Quaternary Moraines on Tongariro and Ruapehu Volcanoes, Central North Island, New
Zealand
S. Eaves1,2
, A. Mackintosh1,2
, J. Schaefer3, G.
Winckler3, K. Norton
2 and D. Townsend
4
1Antarctic Research Centre, Victoria University
Wellington, Kelburn, Wellington 6012 2SGEES, University Wellington, Kelburn,
Wellington 6012 3Lamont-Doherty Earth Observatory, Palisades,
NY, USA 4GNS Science, PO Box 30-368, Lower Hutt 5040
Cosmogenic surface exposure dating (SED) is one of the most rapidly developing and most frequently applied geochronological techniques in Earth science research. This technique can be applied in a variety of geomorphic settings (e.g. glacial, volcanic, mass-movement, seismic), to date events that have created fresh rock surfaces, with an age range of 1 x 10
2 to 1 x 10
7
a. SED has become the most commonly used method to date Quaternary glacier activity as it represents the only method with the ability to provide direct, numerical ages for moraine formation. Recent applications to moraines in the central Southern Alps have greatly improved understanding of glacier fluctuations and hence, palaeoclimate, from the LGM to present day.
We will utilise SED techniques to constrain the timing of past glacier activity in central North Island, New Zealand. Geomorphic evidence for former, more extensive glaciation on the central North Island volcanoes has long been recognised; however, the precise timing of past glacial advances remains unknown. The volcanic terrains of New Zealand have so far been avoided by SED practitioners due to the absence of quartz, which is the preferred mineral phase for the most commonly used cosmogenic nuclide,
10Be. Instead, we will target cosmogenic
3He in pyroxene, which has been successfully
applied in similar settings in South America. To date, 40 samples have been collected from moraines that have been morphostratigraphically inferred as spanning the pre-LGM to the late-glacial period. Further work will also target younger, Holocene moraine sequences, to fully capture late Quaternary glacier fluctuations in the region. This poster outlines our sample areas and the planned
3He mass spectrometry work to
be conducted at Lamont-Doherty Earth Observatory, USA.
Reconstructing Late Quaternary Glacier Activity on Tongariro and Ruapehu
Volcanoes, Central North Island, New Zealand
S. Eaves1,2
, A. Mackintosh1,2
, D. Townsend3,
B. Alloway2 and B. Anderson
1
1Antarctic Research Centre, Victoria University
Wellington, Kelburn, Wellington 6012 2SGEES, Victoria University Wellington, Kelburn,
Wellington 6012 3GNS Science, PO Box 30-368, Lower Hutt 5040
[email protected] Evidence for former, more extensive glaciation of the central North Island volcanoes has long been recognised, however the frequency, extent and timing of these glacial advances remain largely unknown. Glacier fluctuations are strongly controlled by climatic factors such as temperature and precipitation. Reconstruction of former ice margins, coupled with precise chronologies, can therefore provide a powerful tool for understanding past climate change. New Zealand is one of the few mid-latitude Southern Hemisphere locations where terrestrial palaeoclimate can be reconstructed to test hypotheses concerning the mechanisms of past global/regional climate change at orbital/millennial timescales. Addition of a well-constrained palaeoclimate record from the central North Island will therefore provide important insight to past Southern Hemisphere mid-latitude changes in the atmosphere-ocean system.
Large moraines have previously been identified flanking several major valleys on Ruapehu and interpreted to represent two major glacier advances, tentatively correlated to MIS2 and MIS4 (McArthur and Shepherd, 1990, J. R. Soc. NZ). Detailed field- and remote sensing-based geomorphological mapping has revealed a more complex moraine record, potentially documenting orbital and millennial-scale glacier fluctuations from the late Quaternary to present day. The timing of past glacier advances will be determined in areas with the best preserved geomorphic record, using Quaternary dating techniques such as cosmogenic nuclide dating and tephrochronology. Using these empirically-derived geomorphological and chronological constraints, a physically-based numerical glacier model will be applied to provide quantified estimates of palaeoclimatic parameters, such as temperature and precipitation. This presentation will outline the plans, progress and preliminary findings of this work.
27
Seismic Investigation of the Alpine Fault at Gaunt Creek, Central Westland, New Zealand.
J.D. Eccles
1, R. Sutherland
2, J. Townend
3,
V.G. Toy4 and P.E. Malin
1
1Institute of Earth Science and Engineering,
University of Auckland, Auckland, New Zealand 2GNS Science, Lower Hutt, New Zealand
3SGEES, Victoria University of Wellington,
Wellington, New Zealand 4Department of Geology, University of Otago,
Dunedin, New Zealand [email protected]
In April 2012 a multi-purpose explosive seismic survey was undertaken across the Alpine Fault at Gaunt Creek, central Westland, where a cliff exposure shows hanging wall mylonites and cataclasites, exhumed from c. 30 km depth, thrust over Quaternary gravels. The survey aims to bridge the gap between the detailed observations of fault zone properties made in the boreholes drilled during the first phase of the Deep Fault Drilling Project (DFDP-1) and the larger-scale seismic response. In addition to seismometers installed as part of the DFDP-1 borehole observatory, a string of eight borehole geophones were installed in the DFDP-1A borehole and 126 additional channels deployed on the surface. This experiment was the first field-trial of REF TEK 160 'GOES' systems for seismic; each of the eighteen ‘GOES’ consisted of a standalone unit with GPS timing, an internal three-component 2 Hz sensor and capacity to record six external channels (for twelve units this was cabled 15 Hz vertical geophones). These units enabled the profile to straddle physiographic obstacles such as Gaunt Creek and facilitated straightforward correlation of shot timing. Moreover, standalone units proved easy to transport upriver into rough terrain to extend the profile azimuth. Forty-one explosive shots, 0.15–1.2 kg in size, were detonated along a 2D profile perpendicular to the Alpine Fault’s strike for seismic reflection imaging, vertical seismic profiling and tomography. The preliminary findings based on this data set are presented here.
Effect of the AD1655 Burrell Lapilli Eruption on Treeline Vegetation, Egmont Volcano
J.T. Efford
1, B.D. Clarkson
1 and R.J. Bylsma
1
1Environmental Research Institute, University of
Waikato, Private Bag 3105, Hamilton [email protected]
Tree-ring dating (dendrochronology) and isopach mapping of volcanic deposits by A.P Druce in the 1960s elucidated the recent volcanic history of Egmont volcano (Mt Taranaki). The AD1655 Burrell Lapilli shower was directed to the east-southeast of the summit vent by strong winds, leaving a well-defined dispersal axis from which the depth of lapilli decreases from 40–0 cm. In this study, we quantitatively surveyed the present-day treeline vegetation across the Burrell Lapilli gradient with a network of thirty-six 10 x 15 m quadrats. Despite the lapse of time since the eruption, significant compositional and structural differences remain in the vegetation.
Weinmannia was absent from treeline vegetation affected by the Burrell Lapilli, but abundant outside the lapilli distribution. Libocedrus was also supressed from treeline, but only in severely affected areas (25–40 cm lapilli). In moderately affected areas (5–25 cm lapilli), cohorts of both Libocedrus and Podocarpus were initiated. Griselinia and Podocarpus have been the most successful; dominating treeline within the Burrell Lapilli distribution at the expense of Weinmannia and Libocedrus, common treeline species elsewhere on the mountain. A quantification of these species’ relative light requirements using hemispherical photography partially explained the compositional differences across the lapilli gradient. Defoliation and tree death associated with the lapilli shower opened up the canopy to the extent that light-demanding species could proliferate, though complex interactions between species’ substrate and climatic tolerances have also played a role. Current regeneration patterns suggest that the compositional differences will persist, at least until the next volcanic disturbance. Given the infrequency of volcanic events and the significant role they have played in shaping vegetation patterns across the North Island, a new eruption such as that from Mt Tongariro provides a rare opportunity to examine first-hand the effects an eruption has on vegetation, and furthermore, permits the establishment of a monitoring programme to assess vegetation recovery.
28
Nutrients in Lake and Catchment Waters of Lake Okataina
S. Elliot
1 and C. Hendy
1
1Dept. of Chemistry, University of Waikato,
Hamilton, New Zealand [email protected]
Water samples were collected from catchment streams, lake surface, hypolimnion (65 meters), sediment cores from Northern and Southern Basins and ground water in April 2012. Nutrient concentrations were determined by discrete analyser and inductively coupled plasma mass spectrometry (icp-ms). Nitrogen enters the lake water in organic matter, as it sinks it is consumed and re-mineralised. Phosphorus adsorbed to sediment particles, and as organic matter settles; reaching anoxic conditions it is released as phosphate in the presence of ferrous, and manganous ions. The analysis of nutrients from lake and catchment water depicts; a) NH
+4 concentrations are highest in the
nepheloid layer at the base of the hypolimnion suggesting reduction occurs due to anaerobic respiration just above the lake sediment. Ammonium then diffuses back to the surface waters. b) NO
-3 is reduced in anoxic conditions,
observed in the low level of nitrate in the core samples and the nepheloid layer and higher levels in surface, ground and stream water. NO
-3
found in cores is likely to have occurred during lab analysis. c) Phosphorus is released as orthophosphate just above the lake / sediment interface d) The highest concentrations of NH
+4 and
NO-3 are found in ground water between the
public toilets block and the lake edge, streams and surface water, respectively. Lower concentrations of phosphate in the streams compared to ground waters suggest uptake by aquatic or riparian plants.
How does Unusually Strong Crust Influence Stress Build-up and Release on Faults?
Lessons from the Canterbury Earthquake Sequence, New Zealand
S. Ellis1, C. Williams
1, M. Reyners
1, D.
Eberhart-Phillips2, J. Beavan
1 and S. Buiter
3.
1GNS Science, PO Box 30368, Lower Hutt, New
Zealand 2University of California Davis, Davis, CA, United
States 3Geological Survey of Norway, Trondheim,
Norway [email protected]
The recent Canterbury earthquake sequence occurred in what is believed to be unusually strong crust. We have investigated the link between crustal structure and rheology, orientation of the faults with respect to regional loading, and tectonics for north Canterbury prior to and after the Mw 7.1 Darfield earthquake of September 2010. By combining these different data within a three-dimensional numerical model, we can compare regions inferred to slip in the unstable brittle field (as determined from the pattern of seismicity before and after the earthquake) with the inferred distribution of brittle and ductile rocks in the crust.
Results help to explain why: (1) The 90 percentile cutoff-depth for seismicity prior to the Darfield event was deep (> 30 km) but shallowed dramatically after the earthquake to 10 km, consistent with isolation of fault-induced stress perturbations in the uppermost brittle layer from deeper brittle layers via ductile patches that can sustain only low stresses; (2) The stress field and aftershocks appear to have been perturbed by Banks Peninsula. Models suggest that a strong, rigid block that pinches out ductile layers can influence stress distribution with depth, while having little effect on maximum horizontal stress orientations in the brittle layers; (3) The aftershock decay sequence is unusually long, consistent with unusually slow postseismic stress relief occurring through a mix of strong brittle layers and thin ductile layers.
The Canterbury faults exhibit the type of behaviour expected when a strong, infrequently-rupturing fault is loaded tectonically by lateral stresses, rather than from a creeping patch below the fault. We infer that stress loading rates are significantly reduced by the absence of a well-developed, weakened mylonite zone beneath the fault.
29
Bryozoans Generating Sediments: How do they do it?
S. Enke
1 and A.M. Smith
1
1Department of Marine Science, University of Otago, P. O. Box 56, Dunedin, New Zealand
Bryozoan sediments blanket large areas of the southern shelves and platforms around New Zealand and Australia, forming deposits 1-2 km deep. Despite these very extensive deposits, areas where large sediment-forming bryozoans live in abundance are few. Mid-shelf bryozoan thickets off Otago Peninsula, concentrated around 60-100 m water depth, allow us to investigate how these colonial organisms could produce so much sediment. We examined attachment sites of individual bryozoans collected by dredges on the Otago Shelf, and characterised them according to the probable substrate on which they settled. Far from needing ‘hardgrounds’ or cobble deposits on which to settle, many bryozoan colonies began their existence on soft ephemeral substrata such as sponges and chitinous worm tubes. Numerous specimens settled on other bryozoans, showing that once established, bryozoan colonies can create a carbonate-producing community without requiring hard substrate. It is not necessary to invoke hardgrounds or ‘carbonate factories’ in order to generate extensive carbonate deposits. Bryozoans, settling on ephemeral or small substrata, eventually stabilise sediments, allowing more carbonate-producing organisms to establish, and themselves become a settlement surface. This taphonomic feedback is capable of producing widespread (if patchy) bryozoan-dominated bioherms and extensive carbonate sediment deposits. The fact that we no longer see these communities extant may be due to the extent of trawling and fishing effort on our southern shelves.
Quaternary Palaeogeography of Taharoa
R.B. Evans Geotechnics Ltd, PO Box 9360, Newmarket,
Auckland [email protected]
Recent drilling investigations undertaken by NZ Steel in the Taharoa Ironsand Deposit, principally for the purpose of resource assessment, provide a coincidental insight into
local Quaternary palaeogeography and sedimentary history.
Published geophysical studies indicate that the area was initially a drowned coastal embayment, cut into the local, predominantly greywacke (Murihiku Group) substrate. Recent drilling reveals an interesting succession of Quaternary stratigraphic events.
The lowest part of the Quaternary infill intersected in boreholes consists of quartzofeldspathic barrier dunes to seaward, with alluvium landward of the dunes.
Deposition of pumiceous silts and sands above this was accompanied by the formation of new barrier dunes, with increased ferromagnesian content, partially enclosing a small inland harbour with an infill of mud, sandy mud, sand, and occasional shells.
Ultimately the harbour was overwhelmed and infilled with ferromagnesian dunes (Te Akeake Formation). Drainage to the coast was then restricted to channels coincident with the present day Mitiwai and Wainui Streams.
Subsequent incursion of the youngest ferromagnesian dunes (Mitiwai Sand), possibly accompanied by rising sea level, has then partially blocked the Wainui Stream, leading to the impoundment and partial infilling of the former inner harbour to create a lake (Lake Taharoa).
The preliminary stratigraphic and palaeogeographic synopsis, interpreted from drilling, presents a basic model for further testing. A comprehensive database of boreholes, and cores retained by NZ Steel from deeper geotechnical boreholes, offer potential for further, more detailed study of the stratigraphic sequence present, and for its formal correlation with known West Coast stratigraphy.
Assessment of MODIS Precipitable Water Vapor over New Zealand using GPS and
Radiosondes Measurements
A. Fadil1 and P. Sirguey
1
1National School of Surveying, University of
Otago, Dunedin, New Zealand [email protected]
Precipitable water vapor (PW) is an important and highly variable constituent of the atmosphere. Knowledge of its variability is vital for operational weather forecasting and climate research, and required for geodetic applications such as InSAR. Space and ground based PW instruments are complementary rather than competitive systems [e.g., MODIS, GPS,
30
Radiosondes (RS), Water Vapor Radiometer (WVR)]. Ground-based units can provide good temporal but poor spatial coverage, whereas space-based units have the opposite characteristics. This study reports on an intercomparison of PW derived from (i) homogeneously reprocessed GPS data using GIPSY-OASIS II software, (ii) RS measurements, and (iii) MODIS AQUA/TERRA near-infrared water vapor products (MOD05_L2). PW estimates are obtained from 95 continuous GPS stations covering the entire New Zealand land area over a 12 month period at a 5 minutes sampling interval. Collocated PW estimates are obtained near-daily from both MODIS instruments. In addition, PW estimates are derived from three RS in the vicinity of six GPS stations. GPS PW exhibits a bias and scale factor of -0.2 mm and 0.98, respectively, compared to RS measurements, with correlation higher than 0.98, and standard deviation of 1.4 mm. MODIS PW appears to be overestimated when compared to RS PW, with scale factor of 1.5 and standard deviation of 2.5 mm. Nevertheless, there is a better agreement with GPS PW, with scale factor and standard deviation of 1.1 and 1.7 mm, respectively. This comparison suggests that GPS PW provides a suitable reference dataset to assess the performance of the MODIS product. MODIS and GPS PW time series analysis shows that the error is not multiplicative. Thus large relative errors are expected from MOD05 in dry atmosphere. Moreover, it is demonstrated that the geometry of the image acquisition does not affect the performance. Finally, the bias associated with measurements from MODIS/AQUA is consistently larger than measurements from MODIS/TERRA.
Satellite Interferometric Measurements of Interseismic and Postseismic Deformation in
Canterbury, New Zealand
P. Faegh Lashgary1, J. Beavan
2, M. Motagh
3
and J. Townend1
1School of Geography, Environment, and Earth
Sciences, Victoria University of Wellington 2GNS Science, PO Box 30368, Lower Hutt, New
Zealand 3Helmholtz Centre Potsdam, GFZ German
Research Centre for Geosciences, Germany [email protected]
Synthetic Aperture Radar Interferometry (InSAR) has a unique advantage in its ability to measure surface deformation with mm- to cm-scale
accuracy over large areas (with dimensions of a few hundred kilometres). Our capabilities for ground deformation monitoring have been further enhanced by advanced InSAR algorithms such as the Persistent Scatterer (PS) and Small Baseline (SB) methods that enable the analysis of deformation time series and velocity maps using SAR data, overcoming drawbacks of conventional InSAR techniques caused by temporal and baseline decorrelation and atmospheric artefacts.
In this study, we utilize the InSAR time-series analysis method known as the Small BAseline Subset (SBAS) to investigate interseismic and postseismic ground deformation in the Christchurch region. We present preliminary measurements of the rate of deformation due to interseismic strain accumulation prior to the Mw 7.1 Canterbury earthquake of 4 September 2010 using Envisat data from 2003 until 2010 and postseismic deformation following the 22 February 2011 Christchurch earthquake using TerraSAR-X data acquired between February 2011 and August 2011.These results can be used to assess the spatiotemporal evolution of deformation along active faults in the Christchurch region during different periods of the seismic cycle.
Do Winds Control the Confluence of Subtropical and Subantarctic Surface Waters
East of New Zealand?
D. Fernandez1, M. Bowen
2 and L. Carter
1
1Antarctic Research Centre, Victoria University,
Wellington, New Zealand 2University of Auckland, Auckland, New Zealand
The confluence region east of New Zealand is one of only a few places in the world where the Antarctic Circumpolar Current meets the strong southward-flowing boundary current of a subtropical gyre. The convergence of subtropical and subantarctic water creates strong fronts with clear signatures in sea-surface height (SSH) and temperature. Fronts are ideal places to investigate ocean/climate variability because important processes such as air-sea transfer of heat, greenhouse gases and mixing of nutrients occur in these regions. The location and extent of the New Zealand confluence should respond to changes in large-scale wind patterns, as changes in South Pacific currents have been linked to wind shifts. However, recent studies have shown that highly energetic eddies, local winds, and the bathymetry may be significant
31
controls of currents and associated fronts. Analysis of the 18-year time series, from
1993 to 2010, of SSH mapped from satellite altimetry was used to investigate the location and extent of fronts and the eddy activity and relate these to the wind forcing. The SSH gradients and the eddy kinetic energy in the confluence are intensifying in response to an increasing wind stress curl in the South Pacific region. While these results suggest a connection between the variability in the confluence and South Pacific winds, there is a preferential location of the strongest fronts and eddies northeast of Bounty Plateau and Bollons Seamount, indicating some bathymetric control. If wind stress continues to increase, as current trends indicate, front intensity and eddy activity will also increase, enhancing the transfer of heat and nutrients that, respectively, influence energy transfer and biological productivity.
Seal Rock Quality in the Taranaki Basin –
Preliminary Results from Onshore Outcrops.
B.D. Field1, M.J.F. Lawrence
1, T.J.
Berthelsen1, D.P. Strogen
1
1GNS Science, PO Box 30368, Lower Hutt
The initial results of a GNS Science FRST-funded project assessing seal rock quality in several New Zealand basins are presented.
A suite of samples were taken from the Taranaki coastal section covering four generic mudstone depositional settings that can be recognised elsewhere in seismic: condensed section, base of slope, slope-channel overbank, and shelf. Mercury Injection Capillary Pressure (MICP), grain size and x-ray diffraction analyses were performed on the samples to characterise seal types. Initial results indicate distinct variability between settings. For example, condensed section mudstones are the finest grained and most cemented with base of slope mudstones being less cemented. The shallower slope mudstones are mainly coarse silt with patchy cement, and shelf muds are calcareous and coarser, commonly up to sandy siltstone. This suggests that for coarser grained shallower mudstones cementation will be critical for good seal quality. MICP results will be used to determine theoretical seal capacities, i.e. hydrocarbon column heights that could be held by the seal. Measured column heights in producing fields will be compared with the theoretical heights to help assess seal rock key qualities.
Core is rarely acquired in wells from mudstone intervals so wireline logs are the prime source of data for rock properties such as porosity, primary mineralogy (including clay) and carbonate content. Data from key wells is currently being assessed and calibrated against lab measurements from available core and side-wall core samples as well as outcrop data from equivalent depositional settings. The aim is to apply interpretations to seismic facies data wells to get a better understanding of likely seal properties and quality on field to regional scales to help quantify pre-drill assessments of reserves. Ultimately, the aim is to extend concepts to other areas such as the East Coast, Canterbury and Great South basins. Whanganui Inlet (NW Nelson, NZ) Sea-Level
Curve Based on Salt Marsh Foraminiferal Proxy Record
B.O. Figueira
1,2, B.W. Hayward
2 and H.R.
Grenfell2
1School of Environment, University of Auckland,
Auckland. 2Geomarine Research, Auckland.
Salt marsh foraminifera provide a record of former tidal elevations that can be used to produce sea-level reconstructions and extend the record well beyond tide-gauge records (e.g. pre-1900 for New Zealand). Rates of sea-level change vary around the world, thus understanding how New Zealand sea level has behaved for the past 500 years is of importance in predicting and preparing for future changes and their impacts on coastal areas around the country. Whanganui Inlet (NW Nelson) is considered to be relatively tectonically stable and has pristine salt marsh surrounded by a national park. Modern analogue data were collected along transects to document the foraminiferal assemblage distribution according to marsh elevation. From this, transfer functions were derived and used to estimate the tidal elevation of fossil foraminifera down a 90-cm-long salt marsh foraminifera core. This led to the reconstruction of a late Holocene sea-level curve based on an age model obtained using isotopic analyses and palynology. These data show that at Whanganui Inlet a steep sea-level fall occurred before 1350 AD, followed by a slowly accelerating rise up to the beginning of the 20
th
Century (0.3 ± 0.6 mm/yr). Since 1910, there has been an average sea level rise of 3.6 ± 0.6 mm/yr in the region. Although these values are
32
within error of other foraminiferal proxy data from Pounawea, Catlins (2.8 ± 0.5 mm/y), they are greater than values found from New Zealand tide gauges. This difference could be due to one or a combination of many factors, which include: tide gauge inaccuracy; tectonic subsidence; foraminiferal proxy inaccuracy; and auto-compaction. A Review of Megabeds within the Deep-Water Sediment Gravity Flow Spectrum: Using the
Waitemata Basin, New Zealand as a Case Study
C. Fildes1, L.J. Strachan
1, W.D. McCaffrey
2,
P.D. Haughton3 and R. Butler
4
1School of Environment, The University of
Auckland, Auckland, New Zealand 2School of Earth and Environment, University of
Leeds, Leeds, England 3School of Geological Sciences, University College Dublin, Belfield, Dublin 4, Ireland
4Geology and Petroleum Geology, The
University of Aberdeen, Aberdeen, Scotland
[email protected] There has been some confusion in the past regarding the appropriate use of the terms megabed and megaturbidite. Previous works has defined megaturbidites based of textural properties rather than flow mechanisms. The current definition suggests megaturbidites have exceptional thickness, differ in composition from the enclosing strata and are laterally extensive. Here a detailed review of existing literature coupled with a quantitative study of sediments within the Waitemata Basin, aims to establish a new flow process model for megabeds.
Some of the literature uses the terms megabed and megaturbidite synonymously, yet they always refer to exceptionally thick or large-volume event beds. There does however appear to be a difference between the vertical profile of megabeds based on grain-size (block, pebble and sand). The pebble and sandstone grade examples often show sedimentary structures typical of the Lowe and Bouma sequences, thus suggesting the deposits are the result of high and low density turbidity currents. It is therefore appropriate to name these deposits large-volume turbidity currents or megaturbidites.
The block-size deposits often have a unique vertical profile consisting of five divisions (I-V), grading from I) basal breccia; II) conglomerate with outsized rip-up clasts; III) graded conglomerate; IV) graded sandstone; V) mudstone. This vertical sequence is observed
world-wide and here defines a megabed deposit. Waitemata megabeds are an order of magnitude thicker than the enclosing strata. Megabeds are the result of a single transport event with a distinct flow process of a cohesive debris flow transforming into a turbidity current. A megabed is deposited as either a debrite-turbidite couplet or with a preserved transitional flow. The stacking of a turbidite sand on the debrite can be related to surface transformation due to reverse shear whereby mixing at the front of a debris flow produces a trailing turbulent wake.
Characterisation of Modern Sand on the Continental Shelf of South Otago, New
Zealand
B. Fleming1, C. Moy
1 and A. R. Gorman
1
1Department of Geology, University of Otago,
P.O. Box 56, Dunedin 9054 [email protected]
The Clutha River is the dominant source of sediment on the continental shelf off southern Otago, with minor input from the Southland Shelf, forming a shore-parallel sediment wedge. Construction of dams on the Clutha River during the 20
th century has trapped both bedload and
suspended sediment from the upper catchment resulting in reduced sediment input and subsequent transport on the Otago shelf. Previous studies in the early 1980s characterised the thickness and extent of modern sand. Our study expands upon this earlier work and uses modern equipment and methods to: 1) charcterize the current thickness and extent of the wedge, and 2) establish if any changes in sediment distribution has occurred in the last 20-30 years.
Single-channel sub-bottom profiling (boomer) data and sediment grab samples were collected along a 20 km-long shore perpendicular (W-E) transect across the sediment wedge from the mouth of the Clutha River. Reprocessed boomer data collected in 1989 were used to extend the interpretation of regional sediments. In addition, a 50 km-long coast-parallel boomer line was positioned along the crest of the sediment wedge to the NE. We mapped the distribution of sedimentary facies using sample texture, carbonate and organic content, grain surface textures, and mineralogy. We then compared our facies distribution with the morphology of the wedge as determined by seismic reflection data.
Results show a facies progression across the shelf related to the source and supply
33
patterns of sediment. When boomer and sediment data are combined, the sedimentary facies largely mirror the form and extent of the wedge. Mineral assemblage data suggest a larger proportion of Southland sand entering the wedge near the Clutha River than previously reported. From these observations, we infer a relative decrease in Clutha-derived sand to the wedge, which may be due to 20
th century
damming of the river.
Progress Towards a 4D Taranaki Model
M. Fohrmann1, K. Kroeger
1, M. Hill
1, H. Zhu
1,
S. Bull1 and the 4D Taranaki Team
1GNS Science, 1 Fairway Drive, Avalon, Lower
Hutt, 5011 [email protected]
This talk presents the preliminary results of 3D petroleum system modelling from within the Taranaki Basin, carried out as part of the 4D Taranaki Project.
The 4D Taranaki Project currently develops a new, industry-standard, technologically advanced petroleum geoscience atlas, comprising a compendium of maps that illustrate the evolution of basin structure and sediment distribution, and derive map-based 3D models of petroleum generation, migration and entrapment in Taranaki Basin through geological time.
We will present results from the completed first phase covering the Kupe area, located in the Southern Taranaki Bight, immediately south of the Taranaki coastline. The interpretation and mapping of 17 seismic horizons over Kupe, which also includes the Kupe gas/condensate field, has led to a greater understanding of the area’s geological and structural development, through the improved lateral and vertical resolution of the new time-structure and depth-structure maps. These results are currently being published as GNS Science Data Series 12a.
The new Kupe area interpretation has then been utilized to build high resolution (100 x 100 m cell size) 3D petroleum systems models. These models were designed to reconstruct the thermal and petroleum generation history of southeastern Taranaki Basin. Subsequently, migration from onshore and offshore areas into Kupe region fields and prospects was modelled to assess source-reservoir relationships. These models show how carrier bed connectivity and tectonic structures control charge of the Kupe and Kapuni fields while the Toru and Tahi
structures don’t have any significant accumulations. In addition, these models will help to assess remaining prospectively of the area.
In addition, we will present our preliminary 3D structural model of the adjacent Central area. Changes in Plant Macrofossil Assemblages and Sediment Character Since c. 14,000 cal yr BP at Adelaide Tarn, Northwest Nelson,
and Implications for Palaeoclimatic Reconstruction
C.R. Foster
1, D.J. Lowe
1, I.A. Jara
2, R.M.
Newnham2, M.J. Vandergoes
3, B.D. Clarkson
4
and C.E.C. Gemmill5
1Dept. of Earth and Ocean Sciences, University of Waikato, Private Bag 3105, Hamilton 3240 2School Geog., Environ. & Earth Sci., Victoria
Univ. Wellington, PO Box 600, Wellington 6140 3GNS Science, PO Box 30368, Lower Hutt 5040
4Faculty of Science and Engineering, University of Waikato, Private Bag 3105, Hamilton 3240
5Dept. of Biological Sciences, University of
Waikato, Private Bag 3105, Hamilton 3240 [email protected]
Adelaide Tarn is a small alpine lake in Kahurangi National Park at ~1200 m altitude. It was formed ~14,000 cal yr BP within a cirque basin in Buller terrane sequences and is now ~7.6 m deep with two small outlet streams. Regional present-day vegetation is dominated by Nothofagus menziesii (silver beech) and N. solandri var. cliffortioides (mountain beech) with tree line at ~1260 m. A 5.6 m-long core taken from the lake comprises 0.8 m of fine inorganic grey silt with occasional thin (~20 mm) gravel lenses overlain by 4.8 m of brown organic silt with multiple pale-brown layers and interfingering thin (~10 mm) organic-rich layers and plant macrofossils. A chronology was developed for the core using 12 14
C dates (AMS) and a spline-cubic function age model. The plant macrofossils were identified using light microscopy. Additionally, we undertook DNA ‘barcoding’ analyses of some of these plant fragments. Other analyses of the sediments included pollen analysis (qv Jara et al.), high-resolution grain-size measurements, magnetic susceptibility, X-radiography, and
stable isotope analyses (13
C and 15
N). Very few plant macrofossils are evident
prior to ~10,000 cal yr BP, although the pollen record shows abundant N. fusca (red beech) in this zone. There is an abrupt appearance at ~10,000 cal yr BP (3.1 m depth in core) of N.
34
menziesii leaves with occasional N. fusca and N. solandri var. cliffortioides leaves. These beech leaves, primarily N. menziesii, dominate the plant macrofossil assemblages, together with liverwort/moss and Hebe (Veronica) spp. and sparse Libocedrus bidwillii and possible Phyllocladus spp. Most of the N. menziesii leaves have been well preserved whereas leaves of the other beech species are degraded. From ~2200 cal yr BP (1 m depth) grass fragments predominate together with mosses and only sparse L. bidwillii and N. solandri var. cliffortioide leaves.
Early Miocene Climate of New Zealand Closely Linked to Antarctic Climate
B. Fox1, G.S. Wilson
2,1 and D.E. Lee
1
1Department of Geology, University of Otago,
PO Box 56, Dunedin. New Zealand 2Department of Marine Science, University of Otago, PO Box 56, Dunedin. New Zealand
[email protected] A transient glaciation of Antarctica lasting ~200 ka and peaking at the Oligocene/Miocene boundary (23.03 Ma) has been inferred from deep-sea benthic isotope data and sedimentological studies close to the Antarctic margin. It is known as the Mi-1 isotopic event. Clear obliquity forcing in these data implies a strong link between orbital variations and the pulsing of the Antarctic ice sheet. An annually-resolved ~120 m long maar lake sediment core from Otago, New Zealand, is the first terrestrial record of this period from the Southern Hemisphere. The core is dated by
40Ar/
39Ar
dating, magnetostratigraphy, palynology and astronomical tuning to the first ~100 ka of the Miocene, coeval with the deglaciation phase of Mi-1. The density and luminosity data from the core clearly correlate with both obliquity variation and deep-sea oxygen isotope data, suggesting that climate in earliest Miocene New Zealand was closely linked with Antarctic climate. High density and low luminosity correlate with periods of high ice-volume/low deep-sea temperature, suggesting that during these periods diatom productivity in the lake was reduced and terrestrial input increased. Orbital frequencies in magnetic susceptibility data suggest that vegetation cover was paced by precession.
Diatoms in the Avon-Heathcote Estuary, a Study on Ecosystem Health in Response to
Human Settlement
S. Freeman1, C. Reid
1, S. Gaw
2, U. Cochran
3
1Dept. of Geological Sciences, University of
Canterbury, Private Box 4800, Christchurch, NZ 2Dept. of Chemistry, University of Canterbury,
Private Box 4800, Christchurch, New Zealand 3GNS Science, PO Box 30368, Lower Hutt, New
Zealand [email protected]
The Avon-Heathcote Estuary (AHE) is a small, microtidal, weather-dominated estuary found within the confines of Christchurch city. Since settlement of the Canterbury region by Maori, the area surrounding the AHE has been used for foraging and minor land development for dwelling. More extensive land use modifications have developed post European settlement in 1815 where major changes in sedimentation rates and pollutant input have been recorded. By using diatom (Bacillariophyceae) diversity and density this work focuses on understanding the extent to which human urbanisation of the Canterbury region has impacted estuary ecosystem health.
The first phase of the study, currently underway, has been to quantify distribution of modern diatoms in the AHE and attempt to calibrate these to modern parameters such as exposure, salinity, substrate and trace metals. The second phase, yet to be undertaken, will examine core materials to determine the recent geological history of the AHE and potential changes in microflora linked to pollutants, additionally we wish to develop a record of both historic and pre-historic diatoms of the AHE. In modern samples the overall diatom diversity is lower than expected across the AHE and between sites a wide variation in diatom assemblages and concentration is seen. Interestingly comparisons between live and dead diatom assemblages seem to differ in concentration and species types, potentially showing a direct response to changes induced by the February 2011 Earthquake. Additional works to be undertaken include taking core samples, processing and analysis to compare to modern samples. Understanding that diatoms can react rapidly to changes in the ecosystem can be a valuable tool in understanding how modern urbanisation or areas and industrial processes are effecting modern estuarine environments. As a primary producer and key food source they could be applied to predict
35
response to future modification of environments such as the Avon-Heathcote Estuary. The Last Interglacial Shoreline in Northland –
a Potential Analogue for Sea-Level Rise Effects from Global Warming
J.G. Gibb
Coastal Management Consultancy Ltd, 200 Rangitane Road, RD 1, Kerikeri 0294, B.O.I.
[email protected] During the Last Interglacial (LIG) climax about 125 ka, global mean surface temperatures were about 2° C above present, comparable to projections for future climate change by about AD 2100. Global studies from many sites indicate that sea-level peaked about 6.6 m above present during the climax and likely exceeded 8.0 m. If this was the case then we could expect to find shoreline features above present-day forming features at comparable elevations in tectonically stable sites in NZ.
Along the east coast of Northland, we have identified LIG shoreline features so far, within the relatively sheltered coastal environments of Whangarei, Tutukaka, Whangamumu, and Parengarenga Harbours, and at many sheltered sites in the Bay of Islands, at estimated formation heights of 2-3 m above their modern analogues. These features include wave-cut shore platforms, ancient sand and gravel beaches, and estuarine formations.
It is generally accepted that the east coast of Northland has been tectonically stable over at least the last 125 ka and possibly longer. If so, this would suggest that the LIG shoreline features identified so far, may be reliable indicators of eustatic sea-levels in the NZ region at 125 ka and potential analogues for sea-level rise effects from forecast global warming of several degrees over the next 1-2 centuries.
The Northland heights of the LIG shoreline are consistent with heights of 3.0 ± 0.3m already observed at other tectonically stable sites around NZ, particularly those that provided the “zero-datums” for the “NZ regional Holocene eustatic sea-level curve“, in both the North and South Islands, published in 1986.
In Northland, the Holocene coastal plain formed over the last 7.5 ka during the Present Interglacial, is generally narrow in width and only 1-2 m above present sea-level. Parts of state highways and towns like Dargaville occupy the coastal plain and will be permanently inundated from a 2-3 m rise in sea level.
Preliminary Modelling of the Upper 3 km of Plate-Boundary Crust Based on Travel-time Inversion of the 2011 WhataDUSIE Seismic
Experiment
A.R. Gorman1 and A. Kovács
2
1Department of Geology, University of Otago,
PO Box 56, Dunedin 9054 [email protected]
Near-surface topography and geology in the vicinity of the Alpine Fault complicates the acquisition and analysis of land-based seismic reflection surveys. Previous large-scale seismic refraction / wide-angle reflection (R/WAR) surveys have investigated the structure of the plate boundary in the central part of the Alpine Fault. However, such work does not have sufficient resolution to characterise the fault zone with enough accuracy to guide proposed deep (<1km) drilling operations.
The Whataroa Valley, in the central sector of the Alpine Fault, provides rare access to the SE (hanging wall) side of the fault for the purpose of a seismic survey. During January and February 2011 a 5.5 km long seismic line was collected to image the upper crust to depths of a few kilometres. Acquisition was undertaken with the use of five independent systems consisting of 21 Geode and two Seistronix seismographs with a total capacity of 638 channels. Geophone spacing varied from 4 to 8 m. Sources were 400 g Pentex charges buried in 1.3 to 2 m deep holes dug by either excavator or hand. At the north end of the line, 78 single holes had a separation of ~25 m. At the south end of the line, shots were deployed in 21 patterns of five, with a nominal spacing of 125 m. These data have been analysed using a ray-theoretical travel-time tomography routine that is potentially capable of constraining velocities and interface depths with much higher accuracy than a conventional seismic reflection section.
Initial analyses of the data are helping to constrain the thicknesses and P-wave velocities of the major units of the hanging wall of the Alpine Fault beneath the Whataroa Valley: a lower basement of Alpine Schist rocks overlain by fluvio-glacial sediments. The Alpine Fault is identified as a dipping reflection in the seismic data.
36
Source to Surface Geothermal Research Programme: University of Canterbury and
Mighty River Power Ltd.
D. Gravley1, J. Cole
1, C. Deering
2, S.
Hampton1, T. Horton
1, B. Kennedy
1, C. Oze
1,
T. Powell3 and M. Villeneuve
1
1 Department of Geological Sciences, University of Canterbury, Private Bag 4800, Christchurch
2 Dept of Geology, University of Wisconsin-
Oshkosh, 800 Algoma Rd, Oshkosh, WI, USA 3 Powell Geoscience Ltd,17 Pryce Rd, RD5,
Rotorua, [email protected]
The Source to Surface (S2S) programme seeks to characterize the full vertical extent of mass and heat transfer from magma source to surface soils in geothermal systems of the Taupo Volcanic Zone (TVZ). The key objective of the project is to improve, refine and develop new field, experimental and theoretical techniques to ultimately establish an integrated approach to well targeting and the discovery of blind geothermal systems. To accomplish this objective, there is a team of experts and student research projects from the University of Canterbury, in collaboration with Mighty River Power, GNS Science and international institutions and collaborators.
S2S is a 5 year project funded by Mighty River Power Ltd. The programme seeks to graduate highly qualified students that have the necessary background and skills required by the geothermal industry in New Zealand. An important outcome for the S2S programme is to transfer existing expertise, through well-supervised research projects, to students that will inevitably become the future of geothermal in New Zealand. In 5 years, 18+ students will graduate from the S2S Programme. This will provide the necessary continuity of expertise as the geothermal industry grows both in New Zealand and overseas.
Future growth of high-enthalpy geothermal power generation in New Zealand hinges upon the discovery of viable resource targets that lack obvious surface manifestations. To contribute to this goal of future growth, S2S is focusing first on characterising the volatile and heat transfer along the vertical extent of known geothermal systems to establish a method for exploring unknown systems. Our study ranges from regional- to drillhole-scale, and is divided into 3 major project areas: the magmatic source, the geothermal reservoir, and surface waters and gases. Our approach is to integrate geology,
geomechanics and geochemistry with other research groups focusing on geophysics. The First Proxy-Based 20
th Century Rates of
Sea-Level Rise from New Zealand’s North Island
H. Grenfell
1, B. Hayward
1, R. Nomura
2 and A.
Sabaa1
1Geomarine Research, 49 Swainston Rd., St.
Johns, Auckland 2Department of Education, Shimane University,
Matsue, Japan. [email protected]
A sea-level history, which extends beyond the longest nearby tide-gauge record, has been extracted from salt-marsh sediments using the tidal elevation of foraminifera as a proxy. Transects through high-tidal salt marsh at Puhinui, Manukau Harbour, Auckland, New Zealand indicate a zonation of dominant foraminifera (with increasing elevation): Ammonia spp.-Elphidium excavatum, Ammotium fragile, Miliammina fusca, Haplophragmoides wilberti-Trochammina inflata, Trochamminita salsa-Miliammina obliqua. The transect sample faunas are used as a training set to generate a transfer function for estimating past tidal elevations in two short cores nearby. Heavy metal,
210Pb and
137Cs isotope analyses provide
age models that indicate 35 cm of sediment accumulation since ~1890 AD. The first proxy-based 20
th Century rates of sea-level rise from
New Zealand’s North Island at 0.28 ± 0.05 cm y-1
and 0.33 ± 0.07 cm y
-1 are estimated. These are
faster than average Corrected Relative Sea level records for the region based on tide gauges and CGPS (0.19 ± 0.05 cm y
-1), but are comparable
to a similar proxy records from southern New Zealand (0.28 ± 0.05 cm y
-1). Analysis of air
photographs (1939-2010) shows that the coastline previously extended at least 25 m seaward, and demonstrates erosion of the Puhinui salt marsh of ~30 cm y
-1 due to the
progressive sea-level rise.

37
Tight Coupling of Peat Carbon Processing and Northern Hemisphere Warming Over the
Last 1100 years
A. Hartland1, I.J. Fairchild
2, J.R. Larsen
3, W.
Müller4, G. Mariethoz
3, A. Baker
3, M.F.
Benedetti5 and J.R. Lead
6,7
1Dept. of Chemistry, University of Waikato,
Private Bag 3105, Hamilton 32401 2School of Geog., Earth and Envir. Sci.,
University of Birmingham, Birmingham, UK 3Connected Waters Initiative Res. Centre, Water Res. Lab., Univ. of NSW, Manly Vale, Australia 4Department of Earth Sciences, Royal Holloway
University of London, Egham, Surrey, UK 5Université Paris Diderot, Sorbonne Paris Cité,
IPGP, UMR 7154, Paris cedex 13, France 6Environmental Nanoscience and Risk
SmartState Center, Univ. of South Carolina, USA
7Fac. for Environmental Nanoscience Analysis
and Characterisation, Univ. of Birmingham, UK [email protected]
Soil organic carbon (OC) represents the largest terrestrial carbon store (~twice the mass of atmospheric C), plays a key role in the carbon cycle, and is thought to be susceptible to anthropogenic climate change, yet the sensitivity of carbon in this reservoir to past climate changes remains poorly understood. Recent studies indicate that OC in peatlands may be particularly sensitive to warming and associated fluctuations in groundwater levels. While OC breakdown in peat bogs is typically inhibited by high concentrations of phenolic compounds, during the summertime, lowered water tables in peats allow oxygen introduction and facilitate increases in the rate of microbial processing of OC. The short-term nature of field studies makes it difficult to disentangle how these different mechanisms are related to climate forcings, but where peatlands overlie karst landscapes, annually-banded cave stalagmites provide high-resolution proxy records of palaeomoisture and humification in their luminescent (organic-rich) layers.
We show that trace metals bound to organic ligands are captured by cave stalagmites, providing long-term quantitative records of the composition of soil OC. Our sub-annually resolved record of trace metals (Cu, Zn, Pb) in a Scottish stalagmite indicates that the composition of OC flushed from an overlying peat bog has co-varied with the Northern Hemisphere temperature anomaly for the last ~1100 years. We interpret this relationship to be driven by the sensitivity of microbial OC
processing (e.g. depolymerisation) to persistent temperature deviations. Furthermore, it is shown that this sensitivity is only significant for low quality (i.e. less decomposable) OC, suggesting that the observed change in soil OC during the warming trend of the last ~40 years was facilitated by very low quality carbon. Our data imply a pronounced feedback and probable acceleration in the rate of CO2(g) efflux from northern peatlands in response to regional warming. QMAP Web Services – Geological Map Data
for New Zealand via the Internet
S.N. Haubrock1, D.W. Heron
1 and M.S.
Rattenbury1
1GNS Science, PO Box 30368, Lower Hutt, New
Zealand [email protected]
The recently completed QMAP 1:250 000 geological map series is available as printed paper maps and GIS datasets. A new initiative is making these GIS datasets accessible as layers via the Internet for web mapping and online GIS applications using state-of-the-art technologies. QMAP data are being served via the Internet as a Web Map Service (WMS). A WMS converts original source GIS data for a selected area in real time into a symbolised raster image that is delivered to the Web browser or spatial client application, such as desktop GIS software. The portrayal of the data is controlled by the service using Styled Layer Descriptors (SLDs), so a geological map with, for example, QMAP-standard coloured geological units, oriented fault line styles and structural measurement symbols, is delivered via the Internet. Layers are being served individually as well as in integrated maps (layer groups).
The WMS geological map data can be combined with topographic, hydrological, cultural and many other data available from WMS provided by other organisations. The interconnection of many services from multiple agencies is the substance of New Zealand’s emerging national spatial data infrastructure (SDI).
Web Feature Services (WFS) are a more complex but richer way of delivering spatial data via the Internet using a standardised exchange format that includes the feature geometry. These features can be extracted, analysed and symbolised by the client. Within the geological community, a new standard called Geoscience Markup Language (GeoSciML) is
38
used. Geological concepts such as faults, folds and metamorphic zones are represented in a standardised way, so the data can be interpreted by software applications and users alike. Parallel work in developing international standardised vocabularies for geological terminology, for example, geologic time scale, rock names, and structural feature types are supported by GeoSciML which is leading to easier exchange of geological information.
Where is the Benefit to New Zealand from Fundamental Science?
K.L. Hayes
1, C. Kroger
1 and I.J. Graham
1
1Research Office, GNS Science, PO Box 30368,
Lower Hutt, New Zealand [email protected]
Is the only purpose of fundamental science to satisfy curiosity? Would that in turn satisfy funders, thus guaranteeing you continued investment? We argue that it is important to be able to clarify a ‘value chain’ leading from fundamental science, via applied science and end-users, all the way to impact.
In developing the value chain for science, the question ‘Who is the user of my research?’ should be asked and answered. Users can be other scientists receiving your outcomes through peer-reviewed publications, or companies via presentations and reports. But how does the content of your paper/report benefit their research? How does it progress the science in your field? May be only the immediate next users of research outcomes can be identified, which is acceptable, considering the potential scope of some underpinning research. Ultimately, the benefits should be tangible to the wider society somewhere down the track.
We will show, using real-life examples from basic, applied, and strategic geoscience, that by developing a value chain for research your project will gain focus and orientation, provide justification for investment by funders, allow early uptake of research outcomes by (end-users), and may even reveal surprising uses and/or synergies with complementing research that weren’t anticipated. An example for a value chain with serendipitous use of research outcomes is the study of tectonic behaviour of the Hikurangi Margin that generates knowledge of benefit to volcanologists investigating the Taupo Volcanic Zone, who work with social scientists understanding hazard,
who in turn work with civil defence agencies implementing their findings.
Bucklands Beach Beachrock Clues to Holocene Auckland
B.W. Hayward
1 and M.S. Morley
1
1Geomarine Research, 49 Swainston Rd, St
Johns, Auckland [email protected]
Limonite- and motukoreaite-cemented basalt pebble conglomerate and coarse sandstone outcrops intertidally at the north end of Bucklands Beach, near the mouth of Tamaki Estuary, Auckland. A radiocarbon date on an in-situ dog cockle bivalve shell within this beachrock gives ~5000 cal yr BP. Today this site is relatively sheltered and the beach sediment is primarily silt and medium sand. We infer that the basalt pebbles and sand of the beachrock were sourced from Motukorea (Browns Island) when, prior to the eruption of Rangitoto, this area was far more exposed to storm waves. Tuff reefs indicate that ~400 m of tuff and lapillituff eroded from the north side of Motukorea between 7500 and 600 yrs ago. This material was swept south around the island and built up an extensive marine terrace on the lee side of the island. Some of the basaltic sand and pebbles were carried 2-4 km south (partly aided by strong tidal currents entering Tamaki Estuary) and deposited on the adjacent mainland coast at least as far as Bucklands Beach. The presence in the beachrock of a large geoduck, Panopea zelandica shell also supports the inference of more exposed conditions than today. The double shells of a dog cockle, Tucetona laticostata, and two Ruditapes largillierti are preserved in life-orientation in the beachrock at mid-tide level. Dog cockles do not live intertidally and Ruditapes does not live above MLWS level. Thus their presence indicates that 5000 yrs ago, the relative sea level around Auckland was a minimum of 1.3 m above present, consistent with the numerous Holocene marine terraces around the sheltered Auckland coast that are 1.5-2 m above present MHWS level, including those at Motukorea and Bucklands Beach.
39
Implications of Magnetotelluric Data for the Plate Coupling of the Hikurangi Subduction
Interface, New Zealand
W. Heise1, T.G. Caldwell
1, G.J. Hill
1, E.A.
Bertrand1 and S.L. Bennie
1
GNS Science, PO Box 30368, Lower Hutt, New Zealand
[email protected] The subduction interface beneath the Raukumara Peninsula in northern part of the Hikurangi subduction margin off the east coast of New Zealand's North Island is exceptionally shallow (depth <15 km) compared with other well studied subduction margins. GPS data shows the upper and lower plates are weakly coupled in this part of the subduction margin. Slow-slip episodes equivalent in magnitude to an M7 earthquake also occur just off-shore. Non-volcanic tremor (thought to represent slip on the interface too small to be detected geodetically) has also been observed in this region. The mechanisms controlling slow-slip are poorly understood but may be controlled in part by fluids. Fluids may also provide an explanation for the weak coupling in the northern part of the Hikurangi subduction margin.
Magnetotelluric (MT) data from a pilot study on the Raukumara Peninsula show that a marked decrease in the conductivity of the fore-arc sediments coincides with the onset of seismicity at ~10 km depth. Below the sediments, a dipping band of seismicity and intermediate conductivity at or above the subduction interface connects to a deeper more conductive zone above the down-going plate which we interpret to be a region of under-plated sediments with the dipping zone of intermediate resistivity marking a region of upward fluid escape and downward sediment transport within the so-called ‘subduction channel’.
Results from a MT profile in the southern part of the Hikurangi subduction margin, where the plates are locked, show the conductivity structure is markedly different than beneath the Raukumara Peninsula. This suggests that the change in the fluid content of the plate interface may be a major factor in the difference in plate coupling between the northern and southern parts of the Hikurangi subduction.
Recycling of Silicon from New Zealand Lake Sediments
C.H. Hendy
1, L.K. Pearson
1 and D.P. Hamilton
2
1Chemistry Department, University of Waikato,
Private Bag 3105, Hamilton 3240 2Department of Biological Sciences, University of
Waikato, Private Bag 3105, Hamilton 3240 [email protected]
Intact sediment cores were taken from the deepest basins of 28 New Zealand lakes show that the silicon (Si) concentrations in pore waters and the flux of Si to the overlying lake water can be modelled assuming first order kinetics for the rates of dissolution or precipitation and Fick’s Law. A model for silicon transport model (cx
= c∞ + (c0 - c∞)exp(-x√(k/D))) was developed from the gradients of the pore water concentration (cx) of silicon measured in lakes ranging in trophic state from oligotrophic to supertrophic. The model simulated the Si transport gradient with high precision (r
2 > 0.95,
p > 0.01) in lakes with no volcanic tephra layers or significant geothermal discharges to the lake water. The lithology of the sediments was a significant determinant in the steady state pore water concentration of silicon as observed at depth within the sediments. Sediments dominated by diatomaceous ooze or rhyolitic glass shards achieved steady state concentrations (c∞) of 25 – 30 mg Si L
-1.
Sediments dominated by greywacke, granite or schist silts had much lower c∞ values. The extent of the flux of silicon was also found to be controlled by the trophic status of the lake, being greatest in eutrophic lakes where diatom populations were able to reduce epilimnitic silicon concentrations (c0) to < 1 mg L
-1. The
concentration gradients of silicon in sediment pore waters are also shown to reflect recent changes in lake ecology providing a history of trophic status change.
QMAP Seamless GIS Geological Map Data
D.W. Heron1, S.N. Haubrock
1, B. Lukovic
1 and
M.S. Rattenbury1
1GNS Science, PO Box 30368, Lower Hutt, New
Zealand [email protected]
QMAP 1:250 000 geological map data are now seamless. Combining the 21 individual QMAP sheet GIS data into a continuous national seamless GIS dataset has proved to be more of
40
a challenge than first anticipated, particularly for geological map units and metamorphic grade layers. This is mostly due to the evolution of geological ideas, new data and improvements in radiometric dating over the 18 years of map production.
The task of stitching the 21 map sheets together was made technically easier by the strict database design imposed on authors from the project outset. The database structure was defined and has changed little over the last 20 years. Limited additions were made to the restricted vocabularies that control allowable values to many fields e.g. stratigraphic age, rock names and structural measurement types and as a consequence there is excellent data compatibility across all map sheets. The new dataset has many new stratigraphic fields that allow greater versatility for GIS analysis and portrayal options.
The intention is to release the QMAP Seamless GIS data on DVD in the near future but these data are already available online at http://maps.gns.cri.nz/geology/web as a Web Map Service (WMS). The WMS provides symbolised map layers as images derived in real time from the original GIS data to Web browsers or GIS software but with the added advantage that you can obtain information on individual features.
Future plans for the QMAP Seamless GIS include data delivery through a Web Feature Service (WFS) and greater harmonisation of data attributes across old sheet boundaries. There will also be increasing conformance to international vocabularies being developed by the IUGS Commission for the Management and Application of Geoscience Information (CGI), and structural redesign to integrate more effectively with the new international GeoSciML geology data model and exchange standard.
An Electrical Resistivity Image of the Magmatic System Beneath the Tongariro
Volcanic Complex, New Zealand
G.J. Hill
1, T.G. Caldwell
1, Y. Ogawa
2, H.M.
Bibby1, S.L. Bennie
1, E.A. Bertrand
1 and H.
Keys3
1GNS Science, PO Box 30368, Lower Hutt, New
Zealand 2Tokyo Institute of Technology, Japan
3Department of Conservation, Turangi, New
Zealand [email protected]
A key step in understanding a volcanic system is the determination of the location and size of the magma reservoir beneath the volcano. The electrical conductivity or resistivity of a magma reservoir containing an interconnected melt fraction will be much more conductive than the surrounding host rock. Here we use the results from 136 magnetotelluric (MT) measurements to determine the location and structure of the magmatic system beneath the Tongariro Volcanic Complex. 3-D inverse resistivity modelling of the MT data shows a narrow vertical conductive zone located beneath Mount Ngauruhoe linked to but offset from a larger more conductive region about 4 km beneath the surface centred under the north-eastern flanks of Mount Tongariro. The location of the recent eruption and seismicity prior to the eruption occurred at the margin of this larger conductive region. Investigating Potential Gas Hydrate Release
Structures on the Chatham Rise and Canterbury Shelf
J.I.T. Hillman1, A.R. Gorman
1, I. Pecher
2,3 and
A. Pallentin4
1Dept. of Geology, University of Otago, PO Box
56, Dunedin 9054 2School of Environment, University of Auckland,
Private Bag 92019, Auckland 1142 3GNS Science, PO Box 30-368, Lower Hutt 5040
4NIWA, 301 Evans Bay Parade, Hataitai,
Wellington 6021 [email protected]
The role of methane gas hydrates in climate change is still poorly understood. Processes such as ice sheet dynamics and sediment deposition, isostatic adjustment, mass wasting and erosion, changes to bottom water temperature and sea level fluctuations all have significant impacts on gas hydrate stability over
41
glacial-interglacial cycles. Pockmark formations at depths of 500-1100 m on the seafloor are thought to have formed as a result of gas hydrate release during glacial-interglacial cycles. Multi-beam bathymetry data collected on the Chatham Rise off the east coast of New Zealand has revealed many of these seafloor depressions. These features may be due to gas hydrate dissociation occurring as a result of sea level lowering (i.e., decreases in pressure) and bottom water warming.
The aim of this project is to establish whether gas hydrate dissociation was responsible for the formation of these structures and to investigate potential implications for existing gas hydrate deposits worldwide if ocean temperatures increase in the future. This poster presents the initial results and findings of the project. Detailed bathymetric data collected in March 2012 on the Polaris II has been combined with existing data to investigate the size and distribution of pockmark structures along the Canterbury Shelf and the western part of the Chatham Rise. Seafloor lithologies in the vicinity of the pockmark structures have been modelled using backscatter analysis in combination with ground truth data to further enhance understanding of the mechanism of formation of these structures.
Early Eocene Mg/Ca Paleo-Ocean Thermometry of the Central East Coast
Basin, New Zealand
B.R. Hines1, C.J. Hollis
2, C.B. Atkins
1, J.A.
Baker1, H.E.G. Morgans
2 and D.K. Kulhanek
2
1SGEES, Victoria University of Wellington, P.O.
Box 600, Wellington, New Zealand 2GNS Science, PO Box 30368, Lower Hutt, New
Zealand [email protected]
The Early Eocene was a period of markedly increased global warmth, known as the Early Eocene Climatic Optimum (EECO). Paleogene sediments of the central East Coast Basin are well-exposed and contain a largely understudied paleoclimate and paleoenvironmental record of this interval. However, the high terrigenous component of these sediments and variable preservation of foraminiferal assemblages means that organic carbon proxies and traditional stable isotope records are of limited use. We used laser ablation inductively coupled plasma mass spectrometry (LA-ICP-MS) to measure trace element/Ca ratios of foraminifera thereby circumventing issues arising from
variable preservation and diagenesis. Detailed mapping, combined with calcareous nannofossil and foraminiferal biostratigraphy has been used to document an early Paleogene succession at Tora on the southeast Wairarapa coast. This is complemented by samples from the Tawanui and Aropito sections in the southern Hawke’s Bay to produce a composite paleotemperature record from the Early to Middle Eocene. Four genera of foraminifera were analysed to reconstruct paleo-sea temperatures. Morozovella and Acarinina were used as sea surface temperature (SST) indicators, Subbotina was used for thermocline temperatures, and Cibicides used to derive bottom water temperatures (BWT).
Stable isotope (δ18
O and δ13
C) analysis of sediment bulk carbonate yielded variable results, with strongly negative δ
18O values
suggesting diagenetic alteration of the original carbonate. Diagenetic overprinting of primary foraminiferal calcite can have significant ramifications for paleo-sea temperatures derived from trace element data, so stringent screening and processing criteria were developed and applied to the trace element data. Preliminary results show that high SSTs of ~30°C and BWTs of ~15°C characterised the Early Eocene. This study provides a key North Island reference for paleo-sea temperatures during the EECO. We compare our results with paleoclimate studies from the Canterbury Basin (mid-Waipara River and Hampden Beach) as well as DSDP Site 277 (Campbell Plateau), and discuss how these findings can be used to test climate models for Eocene greenhouse conditions. An Investigation of Holocene Westerly Wind
Variability using Sedimentary and Water Column Records from Fiordland, New
Zealand
J. Hinojosa1,2,3
, C. Moy1, G. Wilson
2 and C.
Stirling3
1Dept. of Geology, University of Otago, PO Box
56, Dunedin, New Zealand 2Dept. of Marine Science, University of Otago,
PO Box 56, Dunedin, New Zealand 3Dept. of Chemistry, University of Otago, PO
Box 56, Dunedin, New Zealand [email protected]
The strength and latitudinal position of the Southern Hemisphere westerly winds play a major role in regulating Southern Ocean CO2 flux: modeling studies predict that winds centered over the Antarctic Circumpolar Current
42
lead to CO2 outgassing, while when winds shift north, atmospheric CO2 is entrained in downwelling intermediate waters. Resolving past westerly wind variability is crucial for evaluating how the winds influence the Southern Ocean CO2 sink, yet broadly distributed paleoclimate records and conflicting interpretations amongst existing records currently limit our ability to do so. We are developing high-resolution records of Holocene westerly wind variability from sediment cores collected in selected fjord sub-basins in Fiordland, New Zealand. Fiordland intersects the northern reach of the modern wind field maximum and there is a strong relationship between wind strength and amount of precipitation falling at interannual timescales. Additionally, the New Zealand fjords offer basins yielding high-resolution sediment records of climate, environmental, and hydrographic change.
Using seismic data, sediments, and water samples from four sites in Fiordland, we characterized the physical oceanography of the fjords, the extent of anoxia, and the relative input of marine and terrestrial sources. From this preliminary work, we propose to track Holocene changes in the westerlies by evaluating marine versus terrestrial organic matter input over time as a proxy for precipitation and circulation within the fjords, and evaluating intermittent variations in anoxic conditions related to changes in wind strength and circulation. We will present a preliminary stratigraphic record of C and N isotopes and discuss implications for Holocene variations at the northern margin of the westerlies. We will also present our water column geochemical data, including concentrations of redox-sensitive trace metals such as uranium, and discuss how these trace metal proxies can be used to characterize the modern water column and reconstruct past redox conditions from sediment cores.
Mantle Xenoliths and Metasomatism Under the Kakanui Range, North Otago
A. Hodgkinson
1 and J. Scott
1
Dept. of Geology, University of Otago, PO Box 56, Dunedin. New Zealand
Ultramafic xenoliths represent fragments of the upper mantle brought to the Earth’s surface during mafic volcanism and offer a rare opportunity to study the mineralogy, textures and processes associated with the mantle. The present study was based at Kattothyrst, a
volcanic neck in the Kakanui Range of north Otago. The basanite outcrop of the Waipiata Volcanic Group is host to an abundance of mantle xenoliths of spinel lherzolite, harzburgite, dunite and wehrlite composition with a typical mineralogy of olivine, enstatite, spinel ± Cr-diopside. Rare samples have been found to contain modal apatite, a metasomatic mineral introduced to the mantle beneath Otago by a mobile fluid or melt which has undergone incompatible element exchange with the surrounding mantle.
Thermobarometry of the xenoliths yielded relatively consistent temperatures of crystallisation of 878-990°C (for pressures of between 10 and 20 Kb). Chemical analyses of clinopyroxene grains show the whole suite has been enriched in light rare earth elements (LREE). Harzburgites are extensively melt depleted and show M (middle) REE and H (heavy) REE depletion trends that probably pre-date LREE enrichment. The trace element study, coupled with the fluid inclusion and microprobe analysis indicates the metasomatic agent was probably rich in fluorine. The temperature differences between specimens from Kattothyrst and nearby enable a broad Miocene mantle stratigraphy to be constructed beneath the Kakanui Range, which is probably representative of old Gondwana processes.
Radiocarbon Calibration – the Southern Hemisphere Curve Update and Calibration
Problems in the Younger Dryas
A.G. Hogg Carbon Dating Laboratory, University of
Waikato, Hamilton, New Zealand [email protected]
Radiocarbon dating is the most widely used tool for defining events that have shaped the last 60,000 years. However, past atmospheric radiocarbon concentration has varied, and consequently carbon dates do not equate directly with calendar time. The best approach for correcting carbon dates is to construct a calibration curve by dating wood whose calendar age is determined precisely by tree-ring counting. Because radiocarbon ages of tree rings formed at the same time in opposite hemispheres are different, separate curves are required for both Northern Hemisphere (NH: IntCal) and Southern Hemisphere (SH: SHCal) radiocarbon calibration.
The SH calibration curve (SHCal04) will be updated in 2012, with the addition of new
43
huon pine (Waikato, ANSTO, and CAMS) and kauri (Waikato) datasets extending measurements to 2145 cal BP and including the ANSTO Younger Dryas (YD) huon pine dataset.
We will also present an initiative aimed at radiocarbon measurement of a floating New Zealand YD kauri chronology presently spanning the time interval ca 13.1 ka cal BP – 11.7 ka cal BP. Research focused upon the causes, timing, duration, geographic extent and impact of this important cooling episode has been hampered by inconsistencies in radiocarbon, ice core and varve chronologies. This research will significantly improve linkage of the floating Lateglacial Pine record to the absolute tree-ring timescale.
Analyses are currently being undertaken by 3 carbon dating laboratories – University of Waikato, University of California at Irvine, and University of Oxford. We will present the results for 12 successive decadal samples analysed by 5 laboratories for quality assurance purposes and will discuss possible causes and implications of inter-lab variability.
Although the radiocarbon analyses are incomplete, it is already clear there are significant misalignments in the IntCal datasets for this time interval, creating calibration errors of 50-100 years. Early Paleogene Temperature History of the
Southwest Pacific Ocean
C.J. Hollis1, K.W.T. Taylor
2, R.D. Pancost
2,
B.R. Hines3, K. Littler
4, J.C. Zachos
4, D.K.
Kulhanek1 and C.P. Strong
1
1GNS Science, PO Box 30368, Lower Hutt, New
Zealand 2Organic Geochemistry Unit, School of
Chemistry, University of Bristol, Bristol, UK 3School of Geography, Environment & Earth Sciences, Victoria University of Wellington 4Earth & Planetary Sciences, University of California, Santa Cruz, CA 95060, USA
[email protected] A multiple proxy approach to marine temperature reconstructions has been used to develop a new temperature history for the Southwest Pacific during the early Paleogene, extending from the Cretaceous-Paleogene boundary to the middle Eocene (Bortonian). We have developed a paleo-calibration for the thaumarchaeol lipid-based TEX86 sea surface temperature (SST) proxy, which is used to interrogate and revise published SST records from onshore Canterbury Basin (mid-Waipara and Hampden sections) and
the East Tasman Plateau (ODP Site 1172). These TEX86-derived SST records are complemented by SST and bottom water temperature (BWT) data derived from foraminiferal δ
18O and Mg/Ca ratios from
Canterbury Basin and Campbell Plateau (DSDP Site 277, ODP Site 1121). Our findings indicate that for the mid-latitude (50-65°S) Southwest Pacific, the Paleocene was generally cool (warm temperate, SST ~15-17°C) and that the early to middle Eocene was distinctly warmer (warm subtropical, SST ~21-25°C). Two episodes of pronounced cooling are identified within the Paleocene: SST falls to 12-14°C in the earliest Paleocene and at the Middle/Late Paleocene boundary. Two episodes of pronounced warming are identified within the Eocene: SST increased to 26-30°C during the Paleocene-Eocene thermal maximum (PETM) and Early Eocene climatic optimum (EECO). Although usually interpreted as mean annual temperatures, it is likely that these SST estimates are biased towards summer temperatures at these latitudes (>50°S). During the PETM and EECO, BWT peaked at ~15-18°C and suggests a low latitude source for the intermediate waters that bathed the bathyal sites on Campbell Plateau and in Canterbury Basin.
Late-Glacial to Holocene Pollen-Based Vegetation and Temperature Reconstruction from Lake Rangatuanui, Central North Island
K. Holt1, S. Cronin
1, A. Moebis
1, M.
Bebbington1 and J. Wilmshurst
2
Institute of Natural Resources, Massey University, PB 11222, Palmerston North
Ecosystems and Global Change, Landcare Research, P.O. Box 40, Lincoln
[email protected] We present a new pollen-based vegetation and temperature reconstruction covering the Last Glacial-Holocene transition from a lake site near the township of Ohakune in the central North Island. Lake Rangatauanui preserves a c. 4-m-thick sequence of sediments consisting of alternating tephra and organic silt layers which spans the period from approximately 23,000 cal yr BP to the present. Tephras within this sequence are derived from both andesitic (TgVC, EVC) and rhyolitic (TVC, OVC) sources, and provide crucial time control over the sequence, with 10 out of the 22 NZ-INTIMATE tephra markers present. The core was sampled for pollen at 5 cm intervals, equating to a ~300 year sampling resolution. A pollen-based
44
reconstruction of mean annual temperature (MAT) for the site was obtained using the modern analogue-based transfer function of Wilmshurst et al. (2007, J. Quat. Sci.). Pollen data shows three distinct vegetation zones, corresponding to the LGM, post glacial and Holocene phases. During the latter part of the LGM, MAT at the site were 2-4° C below present, and the vegetation comprised an open shrubland-grassland mosaic with stands of Nothofagus, Halocarpus and Phyllocladus. This assemblage persisted up until 16 cal ka BP, suggesting a delay in post-glacial warming at this site. From 16 to 11 cal. ka BP, temperatures increased (1-3° C below present) and the vegetation was characterised by a Podocarpus-Prumnopitys forest assemblage, with levels of Dacrydium cupressinum rapidly increasing towards the beginning of the Holocene. The late-glacial climate reversal reported elsewhere in NZ may be represented here as a 1° C drop in MAT between 13 and 11.2 cal. ka BP. At 11 cal. ka BP temperatures rose rapidly, and vegetation became dominated by Dacrydium-Podocarpus/Prumnopitys forest. Throughout the Holocene MAT remained within +/- 1°C of present. A sustained phase of cooler temperatures begins at 3 cal. ka BP.
Automated Pollen Counting: The Dream is Approaching Reality
K. Holt1, J. Flenley
1, R. Hodgson
2, K. Bennett
3
and R. Newnham4
Institute of Natural Resources, Massey University, Palmerston North
School of Engineering & Advanced Technology, Massey University, Palmerston North
School of Geography, Archaeology and Palaeoecology, Queens’s University Belfast,
U.K. School of Geography, Environment and Earth
Sciences, Victoria University of Wellington [email protected]
Palynology (the science of pollen, spores, and all sorts of other microscopic particles...) is applied in many branches of geoscience. Most notable examples include Quaternary environmental reconstruction, biostratigraphy, and oil exploration. Palynology also serves societal interests as well, for example, airborne pollen analysis and pollen forecasting are crucial for allergy management during the pollen season, while melissopalynological analysis plays a major role in quality control and determining provenance of honey, which forms the basis of a
multi-million dollar industry in New Zealand. Yet common to all of these applications of palynology is the need for laborious, time-consuming pollen counting, typically performed by a trained analyst at a microscope. Aside from laboratory processing, counting and microscope work is arguably one of the main limiting factors in palynological research. Thus it is no surprise that the call for automation of pollen counting and identification has featured frequently within the scientific literature since the 1960s. Over the following decades advances in image processing, microscopy and computer processing power have increased considerably. Harnessing these advances, a team of palynologists and engineers at Massey University has spent the last 15 years developing a system directed at the automated imaging and classification of pollen grains on conventional glass slides. This system, known as Classifynder (www.classifynder.com) comprises a robotic digital microscope combined with image processing and neural network software. Preliminary testing of the system on slides of fresh pollen and slides containing (Quaternary) fossil pollen have indicated that the system can count and classify pollen and spores as consistently as a human palynologist. In the current climate where funding to cover research, environmental monitoring, and virtually everything else is increasingly harder to secure. An automated system such as this has potential to offer significant benefits to geoscience-based palynology, aeroallergen palynology, and melissopalynology, both here in New Zealand and globally.
Indicators of Stress and Structural Anisotropy on the Canterbury Plains
R.A. Holt
1, E.M. Syracuse
2, M.K. Savage
1, J.
Townend1, C.H. Thurber
2 and J.H. Johnson
1,3
1Institute of Geophysics, Victoria University of
Wellington, New Zealand 2Department of Geoscience, University of
Wisconsin-Madison, USA 3Hawaii Volcano Observatory, US Geological
Survey, USA [email protected]
The aftershock sequence of the Darfield earthquake was recorded by dense networks of 3-component seismometers deployed by Victoria University of Wellington, the University of Auckland and the University of Madison at Wisconsin from 8 September 2010 to early January 2011. P and S arrival times for 2979
45
events have been used to calculate VP/VS ratios, shear-wave splitting parameters, accurate earthquake hypocenters and focal mechanisms. The shear-wave splitting parameters have been mapped using tomographic inversion and spatial averaging. The fast direction of anisotropy (φ) is generally parallel to the axis of maximum horizontal compressive stress (SHmax) estimated for the region, but there are also many measurements sub-parallel to the strikes of nearby faults. One station (MQZ) exhibits φ perpendicular to the arrival azimuth, which suggests that the anisotropy has a vertical axis of symmetry. δt tomography and the observed lack of correlation between δt and hypocentral distance suggest that the anisotropy in the region is heterogeneous. A lack of agreement between initial polarisations estimated from splitting parameters and those calculated from focal mechanism parameters suggests that some re-splitting of shear-waves occurs. Further work will include detailed stress inversions using the newly derived focal mechanisms.
Fossil Cuticles – a Potential Tool for Palaeoenvironmental Studies
A.M. Homes
1, J.L. Van Dijk
2 and M.A. Harper
1
1Sch. of Geography, Environmental and Earth
Sci., Victoria University of Wellington, Wellington 2Department of Soil and Physical Sciences,
Lincoln University, Christchurch, New Zealand [email protected]
Plant cuticles have distinctive morphologies and are widely used to assist the identification of fossil leaves. Cutin is resistant to degradation and disseminated cuticles can be recovered from sediments even when all visible traces of leaves have disappeared. A pilot study was undertaken using residual samples from a core taken through post-glacial swamp deposits at Motukakara, Canterbury, New Zealand. Dispersed cuticles and other macro remains show three main phases in the development of the swamp. A basal sequence of estuarine silts grades up into organic-rich saline mud. Principle cuticles in this phase are from Leptocarpus, Juncus and rare Zostera. This is followed by a relatively dry phase with sedges, grasses and dicotyledonous wood. The sedge peat is overlain by a sequence of organic-rich fresh water lake and lake margin sediments with Leptocarpus, Juncus pallidus, Phormium tenax, Potamageton and ferns.The succession outlined is in broad agreement with evidence from palynology and diatoms.
Taken together, evidence from pollen and cuticles indicates a mosaic of salt and fresh-water communities controlled by differences in water level and salinity. Differences between the pollen record and macro remains can be accounted for by the greater dispersability of pollen, while macrofossils reflect the more immediate environment. It is concluded that disseminated cuticles and other macrofossils in building up a picture of regional vegetation and palaeoenvironments. Meaningful quantification of macro remains could be difficult.
Recent Rupture History of the Greendale Fault, Canterbury, Integrating Paleoseismic
Trenching and Geophysical Techniques
S. Hornblow1, M. Quigley
1, A. Nicol
2, R.
VanDissen2, P. Sasnett
1, K. Newton
1 and D.
Barrell3
1Dept. of Geological Sciences, University of
Canterbury, Christchurch 2GNS Science, Avalon, Lower Hutt 5011
3GNS Science, Dunedin
The September 2010 MW 7.1 earthquake on the Greendale Fault demonstrated the destructive potential of active faults beneath the Canterbury Plains. The fault was undiscovered prior to the earthquake, due to the paucity of high quality geophysical data across the fault, the possibility of long recurrence times relative to the presumed age of the faulted surface, and the potential for any fault-related structures on the low-relief, alluvial braid plain to have been eroded, buried, or otherwise obscured as a result of agricultural practices. Using geomorphic mapping, fault trenching, and Ground Penetrating Radar data, we evaluate evidence for fault-related deformation in the near surface resulting from the 2010 earthquake and potential earlier events. Of particular interest is the nature of a dominantly strike slip, large offset (Dmax 5.3± 0.5 m) fault rupture in the near surface and the way in which displacement is distributed at the surface of the thick alluvial cover through which the rupture propagates. The alluvial plain setting of the rupture provides us with many potential paleoseismic markers in the form of gravel bars and sand lenses, although the distributed nature of the 2010 rupture suggests a lack of sharp offset in the case of potential previous events. Trenching yielded 2 discrete fault structures in each wall, each of which showed only ~15% of the total vertical offset at the site, suggesting the remaining displacement
46
is taken up across the network of Riedel shears (mapped in the trench and across the trenched paddock) which dissipate in weak gravel layers ~1 m from the surface. Preliminary results show no structures from earlier events and imply only one rupture has occurred in the near surface material.
Soil Stabilization and the Quality Control of Engineering Properties Modification of Nile
Delta Silty Clay Soil to be Applicable as Road Bases
A.I.M. Ismail1 and N. Ryden
2
1Geological Sciences Dept., National Research
Centre, Egypt 2 Dept. of Engineering Geology, Lund Institute of
Technology, Lund, Sweden [email protected]
Clay soil with low bearing capacities can present great problems underlying pavement and light structures due to uncertainty associated with their performance. They are often unstable and structure and they are susceptible to problems from changes in moisture content. It is possible to overcome the problems by strengthening the soil underlying the structure or diminishing the leads transmitted from the foundation to the soil. . Clay soils tend to swell and become soft when wetted and may shrink and become stiff when dried. From an engineering aspect, an increase in water content has a number of disadvantageous consequences: cohesion decreases, the soil swells, the alternating dry-out/shrinkage and wetting/swelling effects destroy the rock or soil structure.
These precautions can be taken by modifying the foundation system and /or altering the soil itself or improving the properties of the soils, which can be achieved either by chemical stabilization. From a construction point clayey soil materials are unfavourable to building ground due to the change in water content. To achieve a satisfactory foundation, the clay rich materials and the medium to highly plastic soils have to be exchanged by sand and gravel or sufficiently improved. The improvement of the soil materials could make the material suitable as fill materials, foundation and / or road base construction for dam sections. The quality control for the stabilized soils was investigated using sonic measurements and strength gain.
Shallow Earthquake Swarms: Symptoms of Broad-Scale Subduction Zone Activity?
K. Jacobs1 E.G.C. Smith
1 and M.K.Savage
1
1Institute of Geophysics, PO Box 600, Victoria
University, Wellington [email protected]
We investigate earthquake sequences in the Taupo Volcanic Zone (TVZ) to show what role complete earthquake catalogues have in revealing physical mechanisms at work during individual sequences, and what sequence activity can reveal about regional processes and hazard forecasting. We use a recently developed method (CURATE) to identify earthquake sequences and to study the statistical behaviour of the sequences and of the remaining (declustered) earthquakes. The main catalogue examined is a 14-year period of the GeoNet earthquake catalogue (Mc > 2.45) in the TVZ. Our findings indicate that large regions (TVZ-wide) show the expected Poisson distribution of earthquakes in a declustered catalogue, but that smaller regional subsets show deviations in the expected random timing. Preliminary results suggest that these deviations are associated with an increased rate of earthquake sequences (not just earthquakes) in a period around 1998, and possibly a second, more recent, period around 2009.
We also examine sequences from a specific period of increased activity around the southern end of Lake Taupo in mid-2009 to try to associate physical processes with observed patterns in rate development of individual sequences. The 2009 activity included a doublet of two M ~ 4.4 earthquakes within days of each other. The doublet and surrounding sequence of earthquakes appear to show a fluid diffusion signature. The weeks preceding the doublet had earthquake swarms to the south, but this activity does not appear to be related to the same fluid diffusion. We investigate the possibility that the earlier southern swarms and the fluid diffusion signal associated with the doublet is triggered by a broad-scale change or event within the subduction zone. This leads us to propose that the deviations in Poisson behaviour are evidence of the same deep or broad-scale processes within the subduction zone.
47
Diagensis and Pore Water Chemistry of the Sediments of Lake Okataina
S. James
1 and C. Hendy
1
Dept. of Chemistry, University of Waikato, Hamilton, New Zealand
Pore waters extracted at 1cm intervals from 8 cores taken from the sediments of Lake Okataina in April 2012 have been analysed by inductively coupled plasma mass spectrometry and compared to those collected by Pearson from the deepest portions of two of the three basins in the lake. Under anoxic conditions manganese is reduced and becomes a major cation. Silicon from dissolving diatom frustules diffuses back to the lake waters, and arsenic is released into solution, reaching concentrations exceeding 600 micrograms per litre. Sulfate diffuses down into the sediment and appears to be reduced to sulfide, combining with ferrous iron and precipitating.
Stratigraphy and Palynology of a c. 14,000 Yr-Long Lake Sediment Record from
Adelaide Tarn, Northwest Nelson, and some Palaeoclimatic Implications
I. Jara1, R.M. Newnham
1, M.J. Vandergoes
2,
C.R. Foster3, D.J. Lowe
3, P. Moreno
4, B.V.
Alloway1
1Sch. of Geography, Environment & Earth Sci., Victoria University of Wellington,Wellington 2GNS Science, PO Box 30368, Lower Hutt
3Department of
Earth and Ocean Sciences,
University of Waikato, PB 3105, Hamilton 3240 4Department of Ecological Sciences,
Universidad de Chile, Santiago, Chile [email protected]
Late Quaternary pollen records may provide detailed information about past environmental changes and insights into biogeography and paleoecology. Climate reconstructions from New Zealand are important globally because of its key position in the mid-latitudes of the Southern Hemisphere.
The correlation of multiple overlapping sediment cores obtained from a small lake situated near the tree line in Northwest Nelson at ~1200 m elevation (40° 56’ S; 172° 32’ E) allowed us to generate a 560-cm sedimentary record. Twelve AMS radiocarbon dates provided the chronological control and indicate ~14,000 cal years of continuous sedimentation in the lake. The aims of this presentation are (1) to
describe the stratigraphy and chronology of the sedimentary record, (2) to reconstruct the main vegetation/climate changes since ~14,000 cal yr BP, and (3) to compare the Adelaide Tarn sequence with a similar record from southwest Chile (40°S).
The lower part of the sedimentary record features inorganic grey/brown silts and several gravel layers whereas the upper part is dominated by organic brown silts with abundant plant macrofossils remains and multiple organic bands. The pollen record shows the overall dominance of Nothofagus spp, with the exception of a period of low abundance between ~12,000 and ~8,000 cal yr BP, when successive expansions of podocarp trees are observed. The last ~9,000 years of the record are marked by a stepwise increment in Nothofagus fuscas-type (Fuscospora) and the aquatic Isoetes.
The abundance of Nothofagus pollen in the bottom portion of the record suggests that the northwest Nelson area could have been a glacial forest refugium. An early-Holocene thermal maximum and a mid-to-late Holocene deterioration are also indicated. Similar paleoclimate trends observed in southwest Chile suggest the existence of a zonal synchronism of atmospheric circulation across the middle latitudes of the Southern Hemisphere.
Detecting the 2012 Te Maari Eruption and Subsurface Processes with Geophysics and
Gas Chemistry
A.D. Jolly1, B. Christenson
2, S. Sherburn
1, T.
Hurst2, A. Mazot
1, N. Fournier
1, B. Scott
1 and
G.E Jolly1
1GNS Science, Wairakei Research Centre,
Taupo, New Zealand 2GNS Science, PO Box 30368, Lower Hutt, New
Zealand
On 12 July 2012, Tongariro volcano displayed an increase in the number of volcanic earthquakes, which occurred at rates unseen for at least a decade. The new activity prompted GeoNet to increase the alert level from Level 0, (usual dormant state), to Level 1 (signs of volcanic unrest) on 20 July 2012. GeoNet also repeated geochemical sampling at fumaroles and installed 4 temporary portable broadband seismic sensors within the volcanic massif, joining 4 permanent GeoNet seismic sensors.
A range of seismic event types characterised the new activity including classical hybrid, and strongly resonant tornillo earthquakes. The events had magnitudes
48
between 0.5-2.6 ML and hypocenters distributed between Te Maari crater and the northern flank of Tongariro at depths <6 km, a similar location to a prior swarm first identified in June 2001. The majority of earthquakes are repetitious in nature with onsets having remarkably similar waveforms from event to event. A small number of earthquakes, occurring mostly at the onset of the swarm, are probably not from the same earthquake family. Three distinct swarms have been recorded, with peak event numbers occurring on 13, 20 and 29 July, 2012. Compositions of fumarolic gas discharged from lower Te Maari on 22 May 2012 were very similar to baseline values for that part of the Tongariro hydrothermal system. Samples collected 21 July 2012, however, showed significant increases in magmatic signatures, seemingly proving the link between the observed seismic swarms and magmatic processes at depth.
The three swarms were followed by a seismically quiet period of approximately 1 week which ended late on 6 August 2012 when the TeMaari crater erupted. The eruption chronology is beautifully captured on the seismo-acoustic network showing that the event was preceded by an initial surface failure followed by a multi-phased eruption that included several spasmodic bursts.
Diagenetic Loss of Organic Matter in Sediments from Lake Okataina, New Zealand.
O. Jordan
1 and C. Hendy
1
Dept. of Chemistry, University of Waikato, Hamilton, New Zealand
[email protected] Core samples were taken from various depths (30 metres to 65 metres) in the three basins in Lake Okataina using a gravity corer. These cores were then divided into centimetre increments and analysed separately for their organic matter content using the method of Loss on Ignition (LOI). Calibration of the organic content was achieved by carbon and nitrogen elemental analysis with an attached mass spectrometer.
This analysis showed a steady decline in organic matter until reaching the Tarawera tephra at approximately 23 cm sediment depth, where the organic matter declined to near zero in all cores taken. As the carbon percentage reaches zero, there is still a remnant loss on ignition of around 3.5% which is interpreted to be
dehydration of amorphous silica (rhyolitic glass and diatom frustules).
Carbon and nitrogen contents closely parallel each other indicating that diagenesis of the organic matter does not result in selective fractionation of these two elements. The organic carbon is likely to be metabolised to carbon dioxide and methane, whereas the bulk of the nitrogen metabolised to ammonium.
Petroleum Basin Explorer: A New Science Delivery Method
Z. Juniper
1, P. Scaddan
1 and C. Jones
1
1GNS Science, PO Box 30368, Lower Hutt, New
Zealand [email protected]
New Zealand’s Exclusive Economic Zone and Extended Continental Shelf encompasses an extensive area of submerged continental crust, within which are 18 sedimentary basins covering 1.7 million km
2. Following decades of successful
petroleum exploration and production from Taranaki Basin, a renewed phase of interest in New Zealand’s frontier exploration areas—several of which are known to have working petroleum systems—is currently underway.
To help support this exploration effort GNS Science has developed and launched “New Zealand’s Petroleum Basin Explorer (PBE)”, a free-to-access data portal developed as a web-based interface to publicise, promote and communicate freely the results of GNS Science’s publically funded scientific work. Support from the Petroleum Exploration Geoscience Initiative (PEGI), which was co-funded by the Ministry of Economic Development and GNS Science, enabled the project to be fast-tracked for public release in May 2012.
Visitors can search for and discover a wide range of material relating to the New Zealand’s oil and gas industry and exploration potential. The accessible within PBE data include seismic surveys, geochemistry databases, and well summary sheets for key exploration wells.
Spatial data are available as interactive maps delivered through interactive web maps. Powerful text search facilities allow users to investigate metadata, data products, and even the contents of all public domain petroleum reports. The maps can be customised to show, among other things, wells, seismic data, swath data, bathymetry, and current permit boundaries. Each layer has searchable metadata, links to
49
data custodians, plus links to additional information and studies.
This presentation will demonstrate and highlight some of the technical studies and data available to scientists and students and how it can play an important part of geo-education to scientists with little background to New Zealand’s geology.
Insights from a Numerical Model of the Evolution of the New Zealand Plate Boundary
System Coupled to Paleogeography
P.J.J. Kamp1, J. Lee
1 and M. Tayler
1
1Dept. of Earth and Ocean Sciences, University
of Waikato, Private Bag 3105, Hamilton [email protected]
The age structure of the Cenozoic sea floor surrounding continental New Zealand demands that 820 - 850 km of dextral displacement has been accommodated through the continental crust of New Zealand since 27 Ma. A coherent explanation of this observation is required to better understand the Cenozoic paleogeographic development of New Zealand.
We have developed a numerical model constrained by relative motions between the Australia and Pacific plates and the distribution of basement terranes on land in New Zealand, which accounts for the 820-850 km of dextral displacement since 27 Ma. The model is validated in part by paleomagnetic data about tectonic rotations in eastern North Island. It is clear that the two ends of the Maitai Terrane (remeasured to be offset by 450 km) do not faithfully constrain the total offset on the Alpine Fault. A mega shear zone characterises the deformation in Eastern North Island. Run backwards in time, the model precisely locates at 1 m.y. steps Cenozoic strata to their prior positions, including their depositional location, as a fundamental input for determination of the related paleogeography.
Several new insights about New Zealand geology arise from the model. Strain calculated from the model (i) identifies the occurrence of an Early Miocene fold-thrust belt along the eastern margin of Taranaki Basin; (ii) the occurrence of a Mid to Late Miocene mountain range (Northern Alps) in the present vicinity of Wanganui Basin; and (iii), substantial Pliocene-Pleistocene crustal thickening in Wairarapa and southern Hawke’s Bay. The bend in the Alpine-Wairau fault is a Pliocene feature and is related to substantial shortening in the Murchison area and the Westland region.
Deep Anisotropic Structure Beneath the Southernmost Extension of the Hikurangi
Subduction Zone
S. Karalliyadda1, M. Savage
1 and T. Stern
1
1Institute of Geophysics, PO Box 600, Victoria
University, Wellington [email protected]
Shear-wave splitting of 20 teleseismic SKS phases recorded on the 11-station SHAKE broad-band array and two permanent stations during 2010 – 2011 are used to investigate the deep anisotropic structure in the fore-arc region of the Hikurangi subduction zone under the Wellington region. Delay times (δt) from 40 good quality splitting measurements from variable back-azimuths range from 0.8 s to 3.7 s. Fast polarisation orientations (φ) vary between 10
° –
80°
with an average of NE-SW, sub-parallel to the plate-boundary and the predominant upper-plate fault strikes, and independent of station position. Small-scale variations in φ appear to correlate with the back-azimuths. Events recorded on the array from approximately the same back-azimuths show an increase in δt from SE to NW. δt show no clear evidence for frequency dependent splitting. Changes in φ from NNE at 120
° back-azimuth to NE at 70
°
back-azimuth and relatively large delays (> 2 s) from ray paths at ~120
0 back-azimuths are
observed. These back-azimuthal variations suggest sensitivity of splitting measurements to the flow patterns in the subduction system and to deep-seated shear zones beneath the major faulting in the fore-arc region. The increase in δt along the array implies laterally heterogeneous anisotropic structure associated with the fault zones in the fore-arc region. Comparison between splitting parameters in the ray and geographic coordinate system indicates that the splitting parameters are only slightly affected by the structures with dipping symmetry axis. This implies that the observed back-azimuthal variations of the splitting parameters are possibly due to multiple splitting from two or more anisotropic layers with small changes in the orientation of anisotropy and with a horizontal to sub-horizontal axis of symmetry or due to complex symmetry systems.
50
Improving Learning in Undergraduate Geology
B. Kennedy1 and E. Brogt
2
1Dept of Geological Sciences, University of Canterbury, PB 4800, Christchurch, New
Zealand 2Academic Development Group, University of
Canterbury, Christchurch [email protected]
As part of an Ako Aotearoa national project fund grant, we examined several courses in Geological Sciences at the University of Canterbury. We used and adapted the Carl Wieman Science Education Initiative (CWSEI) methodology from the University of British Columbia.
The CWSEI methodology emphasises a data-driven approach to influence changes in teaching practices through a two-stage model that involves a “baseline” and a “transformation”. In the first stage, qualitative and quantitative data are collected to measure the existing situation in order to create a baseline. During the baseline phase, the learning outcomes are evaluated and changes in course content are planned. In the subsequent transformation stage, learner-centred interventions are designed and implemented with the aim of achieving the new learning outcomes and data are taken to measure the effects on student learning.
We examined four courses: two first year, one second year and one third year. We gathered data using a combination of: concept tests to measure student knowledge; perception surveys to measure attitudes toward science; classroom observations to measure engagement and student interviews to assist the development of learner-centred activities that were best suited to the socio-dynamics of the classroom and the lecturers’ teaching styles.
This data was collected during ongoing Canterbury earthquakes and therefore direct comparisons between baseline and transformed courses were difficult at times. However, student interviews showed unanimous support for the learner-centred activities during lectures such as the use of “clickers” and in-class exercises and discussion. Observation results show that significant increases in student engagement occurred in the transformed courses. In addition, the transformed courses showed large learning gains and more expert-like student attitudes. Departmental and inter-institute collaborations are continuing in order to improve lecturing techniques and student learning.
Coseismic Displacement of Boulders in the Port Hills, New Zealand During the 2010
Darfield Earthquake; Implications for Field Estimates of Shaking Intensity
N. Khajavi
1, M.Quigley
1, S.T. McColl
1 and A.
Rezanejad2
1Geological Sciences Department, University Of
Canterbury, Christchurch, New Zealand 2A&H Company, Christchurch, New Zealand
[email protected] Measurements of co-seismic displacement of boulders relocated during the September 2010 Mw 7.1 Darfield earthquake in addition to boulder morphologies and local site characteristics (soil thickness, ridge orientation, socket depths, slope) provide non-instrumental constraints on strong ground motion spatial distribution and intensity variability. 54 boulders ranging in mass from 10 to 5000 kg were displaced 8 to 970 cm from hosting soil sockets of <1cm to 5o cm depth at several sites in the Port Hills, ~5 km south of Christchurch Centre and ~35 km southeast of the earthquake epicentre. The majority of the boulders were relocated on N-striking ridges above 400 m elevation and show a horizontal displacement azimuth of 250± 20°. This displacement azimuth is subparallel with the direction of instrumentally recorded transient peak ground horizontal accelerations at nearby stations. Boulder displacement azimuth and distance versus slope and boulder displacement distance versus soil socket depth and mass reveal no clear relationship except a partial correlation between slope and displacement distance. The lateral displacement of many boulders from low slope ground surfaces on ridge crests exceeds nearby instrumentally recorded ground displacement by up to an order of magnitude. This suggests that seismic waves were amplified at the study site. Applied 2-D FLAC modelling suggests that topographic amplification may explain part of our observation. We surmise that other local factors such as subtle variability in soil depth, bedrock fracture density, microtopography of bedrock-soil contact, and boulder-socket interaction could have influenced boulder dynamics because non-displaced boulders were found at the vicinity of displaced boulders. Intriguingly, remapping of boulders following the February 2011 Mw 6.2 Christchurch earthquake reveals no subsequent relocation. Field and modelling observations could partially explain this phenomenon, but highlight the complexity of ground response.
51
The Earthlearningidea: A Global Online Initiative of the International Geoscience
Education Organisation
C. King1, P. Kennett
1, E. Devon
1 and G.
Vallender2
1 Earth Science Education Unit, Keele University,
Keele ST5 5BG,UK. 2Educational Research and Science Resources:
EdRSR Ltd [email protected]
This poster presents a summary of an initiative by the International Geoscience Organisation (IGEO) to provide a global online teaching and learning resource called the Earthlearningidea. This grew out of the IYPE project and was developed in 2008. In this initiative, which was based on interactive inquiry, simple activities were developed to motivate and develop geoscience thinking skills. The writing of activities was voluntary and there are now available on line through the website www.earthlearningidea.com more than 116 activities ranging from the latest activity on “Who ate the ammonites” to activities on Earth systems, Earth in Space, Earth materials, evolution, geological time and natural hazards. This initiative has been highly successful and activities have now been translated into seven different languages. This poster provides some impressive statistics on the growth of this initiative and invites the NZ geoscience community to voluntarily contribute quality activities for teachers, teachers in training and students across the globe.
Depositional History of the Late Neogene Tauranga Group at the Causeway, State Highway 16, Upper Waitemata Harbour,
Auckland
P.A. Kirk
Aurecon NZ Ltd, PO Box 9762, Newmarket, Auckland
The New Zealand Transport Agency is planning to widen and upgrade SH16 as part of Auckland’s Western Ring Route project. The 4km long Causeway section of SH16 crosses a shallow embayment on the southern shore of the upper Waitemata Harbour between the Point Chevalier and Te Atatu peninsulas.
An interpretative section has been developed across the Causeway, based largely on c. 250 drillholes – drilled for the current
project; previous SH16 developments; original Causeway construction (in the 1950s); and for other projects planned adjacent to the alignment. The section cuts across an unusually thick (60m+) sequence of the Puketoka Formation, preserved within a 3km-wide graben-like structure. The basin’s eastern margin is at the Causeway Bridge, where Puketoka sediments lie unconformably on a steep bank cut in East Coast Bays Formation rock, interpreted as the eroded fault scarp of the Avondale Fault (Kenny et al 2011). The western margin is stepped, probably at scarps associated with northern extensions of Kenny et al’s Kelston Fault.
The Puketoka Formation is informally subdivided into lower and upper units. The lower part of the formation is predominantly fine soils, with common sandy lenses. The upper part of the formation is dominated by organic soil and peat, and includes numerous tephric layers. Byrami’s (2005) study of two boreholes in the western part of the basin suggests a 400,000 year time gap between the upper and lower units. In the upper unit, tephric layers can be correlated across the basin and suggest that in the west of the basin primary tephras were deposited in a raised mire environment, while to the east, much thicker redeposited tephric units accumulated in low-lying parts of the adjacent floodplain.
Within the wider upper Waitemata area, the distribution of Puketoka Formation, and distinctive tephric deposits within it, lends support to the concept of a Plio-Pleistocene upper Waitemata graben that strongly influenced the deposition and preservation of sediments within it.
The Character of Holocene Alpine Fault Deformation Near the DFDP-1 and DFDP-2
Sites: Insights from LiDAR
R. Langridge1, N.C. Barth
2, G. De Pascale
3
and R. Sutherland1
1GNS Science, PO Box 30368, Lower Hutt, New
Zealand 2Dept. of Geology, University of Otago, PO Box
56, Dunedin, New Zealand 2Dept. of Geology, University of Canterbury,
Private Bag 4800, Christchurch, New Zealand [email protected]
A light detection and ranging (LiDAR) survey was flown along the central Alpine Fault between Franz Josef and Whataroa to uncover fault-related surface deformation obscured by dense bush. The subsequent 2-m DEM produced
52
beautiful bare earth images of fault expression along the rangefront. Initial results from this work include exposing a scarp and thrust fault that probably moved during the AD 1717 earthquake (De Pascale & Langridge, 2012) and detailed analysis of the orientation of the fault and its shallow structure (Barth et al., 2012). A goal of the LiDAR data has been to improve our understanding of the fault location and structure near the two DFDP sites (Gaunt Creek, Whataroa valley). Near the DFDP-1 site at Gaunt Creek, the LiDAR revealed a NNW-striking thrust trace and a flight of uplifted terraces on the hangingwall side of the fault. In addition, the partitioned nature of the surface traces of the fault was recognised SW of Gaunt Creek, where single- and multi-event displacements are observed along the inboard zone of strike-parallel slip. While surface traces are absent where the Alpine Fault crosses the Whataroa river alluvial fan, the LiDAR data constrains fault structure to the W and NE, which in turn constrains the fault geometry beneath the proposed DFDP-2 site to the SE. NE of the river, the Alpine Fault deforms a post-glacial age fluvial surface. In this area particularly (Parker to Vine creeks), the shallow partitioning and dip of the fault and the style of deformation can be elucidated from the shape of the deformed terrace using profiles from the LiDAR DEM. West of the Whataroa River, several important strike-slip traces offset streams incised into a similar fluvial surface, which we have dated at c. 11 kyr. This talk presents results of mapping and analysis in terms of deformation caused by the fault to Holocene landforms. Structural and Sedimentological Analysis of Borehole Image Data From Wells Tuhara-1a, Kauhauroa-2 and Kauhauroa-5, East Coast,
North Island.
M.J.F. Lawrence1, B.D. Field
1
1GNS Science, PO Box 30368, Lower Hutt
Image logs are an important source of sedimentological and structural information in the sub-surface. A full suite of conventional wireline and borehole image data was acquired in three wells covering the stratigraphy from the Altonian Waingaromia Mudstone and Kauhauroa Limestone up to the Tongaporutuan Pindari Mudstone. Schlumberger raw resistivity borehole image curves (FMI™) were processed to generate false-colour images of rock fabrics on the borehole wall. Planar features in the
borehole images were classified and their orientations were determined (dip picking). Non-planar features and fabrics were also noted.
Although the wells are relatively close there are major differences in structural dip, with dip magnitudes increasing to the west. In contrast, fractures show broadly similar strikes in the wells with some displaying visible displacement. Strike directions are consistent with outcrop data. The vast majority of fractures are dark in appearance indicating they could be open and filled with conductive drilling mud/fluid, closed and filled with conductive mud smear or sulphide minerals or any combination. This means fractures could be open, closed, or partially open/closed. There appears to be a lithological control on fracture distribution. In-situ stress directions are broadly similar in all the wells.
A combination of borehole image properties along with conventional wireline open-hole log responses (e.g. gamma, density) and curves derived from the wireline data (e.g. Vsh) were used to erect a borehole image facies classification. The image facies are directly comparable to outcrops at nearby localities (e.g. Tunanui Formation on the coast). Sediment dispersal directions from sandstones in the Tunanui Formation in Tuhara-1 well are highly variable as might be expected from turbiditic successions. Identifiable image facies in the Kauhauroa Limestone in wells Kauhauroa-2 and -5 are essentially the same in both wells but bedding dips reflect the local structural setting.
New Paleogeographic Reconstructions for the Murchison Basin, Westland.
S. Lee
1 and P.J.J. Kamp
1
1Dept. Earth and Ocean Sciences, University of
Waikato, Hamilton, New Zealand [email protected]
The Murchison Basin is one of several sedimentary basins located in the Westland region of the South Island, New Zealand. This basin has a complex depositional history and structural evolution as a result of the evolving tectonic regime during the Mid to Late Cenozoic. The provenance of the basin fill has previously been defined from petrography of sandstone units and conglomerate clasts. Stratigraphic ages of the formations are variably-well constrained by pollen studies. Apatite and zircon fission track dating in addition to zircon U-Pb dating was carried out on samples from all parts of the basin stratigraphy to help constrain
53
the provenance and thermal history of the basin succession. Results of apatite fission track dating show that the oldest (Late Eocene - Oligocene) sediments were heated through burial to undergo partial thermal overprinting of inherited fission track age, whereas the Neogene succession contains apatite with provenance ages inherited from source terranes. The zircon double-dating approach, which involves obtaining both a fission track age and a U-Pb age for individual crystals, highlights key Early Miocene - Pliocene changes in sediment provenance. The Caples Terrane was a significant sediment source during the deposition of the Middle Miocene Longford Formation. At that time the Caples Terrane now in northern Southland/Otago lay to the southeast of the basin on the opposite side of the Alpine Fault. The younger Rappahannock Group sediments have a largely Torlesse-derived provenance with the youngest formation (Devil’s Knob Formation) having been derived from the Alpine Schist. These new insights into the Murchison Basin provenance have aided the construction of new paleogeographic maps for the region and help validate new tectonic models of the movement of the basement terrane blocks along the Alpine Fault during the Neogene.
The Diagenesis of Trace Elements in the Sediments of Lake Okataina
A. Leonard
1 and C. Hendy
1
1Dept. of Chemistry, University of Waikato,
Hamilton, New Zealand [email protected]
Lake Okataina was sampled over a three day period in April 2012 to obtain cores from all three basins and inflow samples to determine a budget for the bottom waters. Diagenesis, reduction precipitation and dissolution processes were observed in all three basins.
Barium is released back into solution as sulfate is reduced to sulfide and re-enters the water column, binds with sulfate and returns to the sediment to complete the cycle. Diagenesis remobilises potassium, iron, manganese, copper, cadmium, barium and silver.
There are very high levels of arsenic cycling within the sediments, raising the pore water concentrations to 600ug/L. There was no obvious source for the arsenic into the lake, but it is possible that there may have been a geothermal spring submerged by the flooded lake.
The phosphorus is accumulating from sedimentation of nutrients within the water table and is recycled back into the bottom waters by diagenesis.
The sulfur and iron accumulates 15 cm below sediment surface and probably precipitating out as pyrite. Selenium also precipitates 10-15 cm below surface probably in the reduced form of selenides.
The cause of uranium recycling in the sediments was not immediately obvious.
Near-Surface Controls on Gas Escape at White Island Volcano Prior to the August 5
th
2012 Eruption
M. Letham1, B. Kennedy
1, E. Bowman
2, B.
Scheu3, A. Jolly
4, K. Mayer
3, M. Heap
5, A.
Dougherty6, T. Reuschlé
5, E. Smid
6, H.
Ogawa6, N. Win
1, D.B. Dingwell
3
1Dept. of Geological Sciences, University of
Canterbury, Christchurch 2Dept. of Civil & Natural Resources Engineering,
University of Canterbury, Christchurch 3Dept. of Earth and Env. Sci., Ludwig-
Maximilians Universitat,Theresienstr. Munich, Germany
4GNS Science, Wairakei Research Centre,
Private Bag 2000, Taupo 5Institut de Physique du Globe de Strasbourg,
Université de Strasbourg, Strasbourg, France 6School of Environment, The University of Auckland, Private Bag 92019, Auckland
White Island volcano in Bay of Plenty erupted for the first time in more than 11 years on August 5
th
2012. Shortly prior to this eruption we, completed a field mapping and sampling campaign in the crater to constrain the nature of near-surface gas escape. Shallow (<3m deep) bore holes, surface mapping, ground penetrating radar and sample collection illustrate the distribution of White Island’s near surface crater fill deposits. Variously altered by the vigorous hydrothermal system, we have subdivided the deposits into (1) well-bedded, unconsolidated predominantly ash-lapilli airfall; (2) well-bedded, unconsolidated ash airfall altered to distinct clay layers; (3) sulphur and iron crust precipitates deposited around fumaroles and in stream beds; and (4) lithified ash-lapilli exposed in crater walls. We have measured the permeability, strength behaviour, and fragmentation characteristics of these deposits and integrate these experimental data with our field mapping to limit the style of fluid flow in the
54
hydrothermally active crater. We present a model of the shallow hydrothermal system that explains some of the changes in fluid flow prior to the August 2012 eruption.
Timescales of Glacial and Periglacial Processes on the Old Woman Range, Otago,
New Zealand
K. Lilly1, D. Fink
2 and C. Mifsud
2
1Dept. of Geology, University of Otago, PO Box
56, Dunedin, New Zealand
2Australian Nuclear Science and Technology
Org., LB 2001, Kirrawee, NSW 2232, Australia. [email protected]
The Old Woman Range in Central Otago is characterised by low-relief ridge tops, which suggests the possibility of ice cover during past glacial maxima. Another suggested cause is the periglacial processes that are ongoing today. Two-isotope surface exposure dating enables us to distinguish between these two hypotheses, as well as to determine whether pre-existing landscape features have been buried and preserved under cold-based ice cover.
We measured 10
Be and 26
Al concentrations in tors, in exposed bedrock surfaces, and in patterned ground sediments, to investigate rates of periglacial processes and determine existence of former ice cover.
The low-relief surface along the tops of the Old Woman Range extends to all elevations above 1300 m, and we find that this area is dominated by periglacial surface lowering processes, and was not covered by a significant thickness of ice at the LGM. Exposure ages of tors are more closely correlated with tor height than with site elevation.
We identify one small area of LGM ice cover at the range summit, above 1600 m. This ice field was less than 10 km
2 in area and fed
one cirque glacier. The cirque basin is very shallow, and not immediately obvious as a glacial feature, presumably a result of the low precipitation rates at this location, or perhaps also because of short-lived glaciation. Moraines were deposited at 22 ka, the summit ice field was gone by 21 ka, and the cirque was mostly deglaciated at 17 ka, with a remaining small glacier within this larger cirque disappearing at 9 ka.
Production of Clean Geothermal Steam for Direct Use as Process Heat
L. Lind1,2
and E. Mroczek1
1GNS Science, PB Box 2000, Taupo, New
Zealand 2Present Address: LindPE, SRC 16G-702,
Minhang District, Shanghai, China [email protected]
Geothermal resources are capable of delivering high efficiency process heat to industries located close to geothermal fields. Several industrial processes in New Zealand, such as milk drying, honey making and forest processing facilities have shown great success in using geothermal energy as a source of direct heat.
In an innovative design by Norske Skog Tasman (NST) (Joss and Hotson, 1990) clean process steam is generated by converting raw geothermal steam into quality boiler feedwater in a geothermal condensate treatment plant. The plant consists of a flash tank where most of the non-condensable gases are removed, followed by steam stripping carried out in a packed column, where the remainder of the dissolved carbon dioxide (CO2) and hydrogen sulphide (H2S) are removed, while maintaining a certain level of ammonia (NH3). The feedwater contains no oxygen and the ammonia maintains a high alkaline pH, which helps control corrosion.
The NST process design was adopted in 2010 by Ngati Tuwharetoa Geothermal Assets Limited (NTGAL) to supply high pressure clean steam to SCA Hygiene Australasian’s (SCA HA) Kawerau Tissue Mill, who changed over from natural gas to geothermal energy (Bloomer, 2011). The original process generated steam at 3.5 bar.g (148
oC) but it was uncertain whether
the stream stripping would operate as efficiently at the required much higher pressure of 16.5 bar.g (206
oC). The concentration of CO2, H2S
and NH3 in the final condensate is key to its quality and suitability as boiler feed water. A required condensate quality of less than 0.1 mg/L H2S had to be met. Using the modelling code CNDSR (Weres, 1983) the stripping plant was modelled. To denote the separation efficiency of the packed column it was set up in the model as 3 theoretical equilibrium stages. This was based on the experience gained by NST. The modelling reviewed the process sensitivity to the incoming condensate temperature and the quantity of stripping steam required.
The models developed provided confidence that a stripping column with 3 theoretical equilibrium stages would be effective
55
in reducing the H2S concentration to less than 0.1 mg/L while also providing the opportunity to retain residual NH3 in the condensate to create clean condensate that can be used to produce high quality process steam. The model calculated that 11.4% of the condensate flow as steam was required to achieve the required condensate water quality which was close to the optimized operating value of 9%. We thank NTGAL for permission to present the results of our study. Bloomer, A. 2011. Kawerau Direct Heat Use: Historical Patterns and Recent Developments. New Zealand Geothermal Workshop. Auckland, New Zealand. Joss, S., Hotson, J., Boiler Feed Quality Water from Geothermal Steam, APPITA (1990). Weres, O. 1983. Documentation for computer program CNDSR. Lawrence Berkeley Report LBID-622.
Revised Age for the Late-Glacial Cool Episode (Climate Event NZce-3) at Kaipo Bog, Eastern North Island, Derived Using
Bayesian Modelling
D.J. Lowe1, M. Blaauw
2, A.G. Hogg
3 and R.M.
Newnham4
1Dept. of Earth & Ocean Sciences, University of
Waikato, Private Bag 3105, Hamilton 3240 2School of Geogr., Archaeol. & Palaeoecol,,
Queen’s Univ., Belfast, N Ireland BT7 1NN, UK 3Radiocarbon Dating Laboratory, University of Waikato, Private Bag 3105, Hamilton 3240
4School of Geog., Environ. & Earth Sci., Victoria Univ. Wellington, PO Box 600, Wellington 6140
Because no single climate record is currently available to provide a definitive INTIMATE stratotype for the New Zealand region, a composite inter-regional stratotype has been developed from three high-quality records that include the Kaipo bog sequence, the designated stratigraphic type record for the late-glacial period. The Kaipo sequence comprises an exposure of interbedded peat, mud, and tephra layers at montane Kaipo bog (980 m asl) in Te Urewera National Park, eastern North Island. We applied a new Bayesian-based flexible depositional age-modelling programme, ‘Bacon’, and the IntCal09 data set, to re-evaluate the timing of the late-glacial climate reversal, now
called the late-glacial cool episode (designated climate event NZce-3 in the New Zealand climate event stratigraphy) at Kaipo bog. The ~1200-yr-long climate event NZce-3 is defined by a high-resolution pollen-derived cooling signal derived from analysis of >60 contiguous samples taken at ~5-mm intervals through a 52-cm-thick, pale grey inorganic mud unit within encapsulating peat deposits at Kaipo. The Waiohau tephra (erupted 14,009 ± 155 cal yr
BP, 2 range), was deposited several centuries before the start of cooling.
The cooling began 13,739 ± 125 cal. yr BP and ended 12,550 ± 140 cal yr BP (mid-point ages of the 95% highest posterior density regions of the modelling). These ages for the start and end of NZce-3 additionally demark boundaries of adjacent climate events NZce-4
(ca. 15.613.8 cal ka BP) and NZce-2 (ca.
12.611.9 cal ka BP) that are also defined at the Kaipo bog stratotype. NZce-3 overlaps a large part of the entire Antarctic Cold Reversal (ACR)
(ca. 14.112.4 cal ka BP), and an early part of Greenland Stadial-1 (Younger Dryas) (ca.
12.911.7 cal ka BP). The timing of event NZce-3 at Kaipo is broadly consistent with latitudinal patterns in the ACR signal suggested for the New Zealand archipelago from marine and terrestrial records. New Ages for 24 Widespread Marker Tephras
Erupted Since 30,000 Years Ago in New Zealand Provide a Revised
Chronostratigraphic Framework for the NZ-CES
D.J. Lowe1, M. Blaauw
2, A.G. Hogg
3, R.M.
Newnham4 and M.J. Vandergoes
5
1Dept. of Earth & Ocean Sciences, University of
Waikato, Private Bag 3105, Hamilton 3240 2School of Geogr., Archaeol. & Palaeoecol,,
Queen’s Univ., Belfast, N Ireland BT7 1NN, UK 3Radiocarbon Dating Laboratory, University of Waikato, Private Bag 3105, Hamilton 3240
4School of Geog., Environ. & Earth Sci., Victoria Univ. Wellington, PO Box 600, Wellington 6140
5GNS Science, PO Box 30368, Lower Hutt 5040
Tephras play a key role in the NZ-INTIMATE project because they link all three records comprising the composite inter-regional stratotype developed for the New Zealand climate event stratigraphy (NZ-CES). We used three methods to generate new calibrated ages: (i)
14C-based wiggle-match dating of wood from
trees killed by eruptions; (ii) flexible age-depth
56
modelling of a high-resolution radiocarbon-dated age-depth sequence at Kaipo bog using two Bayesian-based modelling programmes, Bacon and OxCal’s P_Sequence function, and the IntCal09 dataset (SH offset-corrected by -44 ± 17 yr); and (iii) calibration of
14C ages using
SHCal04 and (offset-corrected) IntCal09 datasets in conjunction with outlier analysis and Bayesian combining procedures using OxCal’s Tau_Boundary function.
Preferred dates or calibrated ages for the tephras are (youngest to oldest, mid-point or mean ages of 95% probability ranges): Kaharoa AD 1314 ± 12; Taupo (Unit Y) AD 232 ± 10; Mapara (Unit X) 2059 ± 118 cal. yr BP; Whakaipo (Unit V) 2800 ± 60 cal. yr BP; Waimihia (Unit S) 3401 ± 108 cal. yr BP, Stent (Unit Q) 4322 ± 112 cal. yr BP; Unit K 5111 ± 210 cal. yr BP; Whakatane 5526 ± 145 cal. yr BP; Tuhua 6577 ± 547 cal. yr BP; Mamaku 7940 ± 257 cal. yr BP; Rotoma 9423 ± 120 cal. yr BP; Opepe (Unit E) 9991 ± 160 cal. yr BP; Poronui (Unit C) 11,170 ± 115 cal. yr BP; Karapiti (Unit B) 11,460 ± 172 cal. yr BP; Okupata 11,767 ± 192 cal. yr BP; Konini 11,880 ± 183 cal. yr BP; Waiohau 14,009 ± 155 cal. yr BP; Rotorua 15,635 ± 412 cal. yr BP; Rerewhakaaitu 17,496 ± 462 cal. yr BP; Okareka 21,858 ± 290 cal. yr BP; Te Rere 25,171 ± 964 cal. yr BP; Kawakawa/Oruanui 25,358 ± 162 cal. yr BP; Poihipi 28,446 ± 670 cal. yr BP; and Okaia 28,621 ± 1428 cal. yr BP.
Seismic Stratigraphy and Foreland Basin Development in South-Eastern Taranaki
Basin
K. Lucas1 and P.J.J. Kamp
1
1Dept. Earth and Ocean Sciences, University of
Waikato, Hamilton. New Zealand. [email protected]
This study involves mapping of an extensive industry-acquired seismic reflection data set of southern Taranaki Basin using Kingdom SMT™. The study area is approximately 12,000 km
2 and
includes most of the offshore southeastern Taranaki Basin region. Multiple horizons within the Oligocene and Miocene succession have been mapped as well as the prominent Late Miocene erosion surface. This has enabled a series of structure contour and isopach maps to be produced. These help characterise the geometry of the basin at different stages in its development. Preliminary results have identified the characteristic foreland wedge shape of the basin for the Late Oligocene to Middle Miocene.
Two foredeeps located either side of the Manaia Anticline have been identified as forming during the Late Oligocene through to Middle Miocene, indicative of synsedimentary deformation within the Manaia Anticline. This fault-fold structure marks the most basinward thrust fault along the eastern basin margin. The rest of the fold and thrust belt lay to the east and involved the Taranaki Fault and related faults. The formation of this fold-thrust belt, which dates from the beginning of the Late Oligocene (c. 29-27 Ma), manifests the start of oblique crustal shortening through New Zealand. This affected the Taranaki Peninsula region before other regions farther to the south. During the Late Miocene the southern Taranaki Basin more widely was inverted and this reflects the propagation of the fold-thrust belt into the foreland basin.
Isotope Chemistry of Lake Okataina Sediments
J. Lyon
1 and C. Hendy
1
1Dept. of Chemistry, University of Waikato,
Hamilton, New Zealand [email protected]
The isotope chemistry of lake sediments from Lake Okataina shows an interesting relationship between carbon and nitrogen in the organic matter. Core samples from the North Basin at 58 and 30m depth respectively were analysed using a mass spectrometer to measure the amount of organic matter in the sediments. Peaks of carbon dioxide and nitrogen emitted from the burning of the sediment samples give the abundance of organic carbon and organic nitrogen down through the sediment cores. Isotope ratios, C
12/C
13, and N
14/N
15 were also
produced. Both cores indicate a decrease in the abundance or organic matter with depth from the sediment-water interface. With most of the organic matter in the shallower core already lost before it reached the sediments (sample 8-1, 2.8%C). The deeper site indicated nearly double the amount of organic matter made it into the sediment (sample 4-1, 5.4%C). The decline in abundance of organic matter within the sediments is due to the diagenesis and metabolising of the lake sediments in an anoxic environment. Furthermore, the data indicates that the relationship between the loss of organic carbon and nitrogen are linearly linked. This suggests that the organisms responsible are metabolising the organic matter for energy with no preference to carbon or nitrogen. Fractionation of the isotopes also occurs as the
57
organic matter is metabolised with preferential loss of
13C and
14N. Leaving the residue
enriched in 15
N but depleted in 13
C.
LGM-Holocene Glacial and Depositional History from Sediment Cores at Coulman
High Beneath the Ross Ice Shelf
S.M. Maas1, R. McKay
1, T. Naish
1,2, R. Levy
2
and G. Dunbar1
1Antarctic Research Centre, Victoria University of Wellington, PO Box 600, Wellington 6140
2GNS Science, PO Box 30368, Lower Hutt, New
Zealand
[email protected] Sediment cores collected from the shallow sub-sea floor beneath the Ross Ice Shelf at Coulman High have been analysed to constrain the retreat history of the LGM ice sheet in the Ross Embayment, and to determine when the modern-day calving line location of the Ross Ice Shelf was established. A characteristic vertical succession of facies was identified in these cores, which can be linked to ice-sheet and ice-shelf extent in the Ross Embayment. The base of this succession is a muddy diamict, interpreted to be deposited subglacially or proximal to the grounding line. This is overlain by a clast-rich mud, characterizing the lift-off of the grounding line. These proximal facies pass upwards into a mud with elevated biogenic content. The uppermost facies consist of ~20 cm thick diatom ooze with abundant clasts and pervasive bioturbation, indicative of a condensed section deposited during periodically open marine conditions. During post-LGM retreat of the ice sheet margin in western Ross Sea, and prior to the first open marine conditions at Coulman High, it is hypothesized that the grounding and calving line were in relative close proximity to each other. As the calving line became “pinned” in the Ross Island region, the grounding line likely continued its retreat toward its present-day location. New corrected radiocarbon ages on the foraminifera shells, in the interval of the mud with elevated biogenic content, provide some of the first inorganic ages from the Ross Sea that show the first open marine conditions in the vicinity of Ross Island were 7,600
14C yr BP. Although retreat of the
calving line south of its present-day position is implied during this period of mid-Holocene warmth, at present it is not possible to constrain the magnitude of retreat or attribute this to climate change rather than normal calving dynamics.
Cosmogenic Exposure Dating of Paleo-Rockfall Deposits, Port Hills, Canterbury
B.H. Mackey1 and M.C. Quigley
1
1Department of Geological Sciences, University
of Canterbury, Christchurch [email protected]
The 22
nd February 2011 Christchurch
earthquake occurred on a previously unrecognised blind thrust fault and generated severe localised ground accelerations. Constraining recurrence intervals for such faults is challenging as there is no direct evidence of faulting (e.g., scarps, fault traces) which can be studied directly. However, the earthquake generated a range of secondary effects, including extensive rockfall and cliff collapse at many locations around the Port Hills south of Christchurch. Many of these sites also feature pre-historic rockfall deposits. Here we ask whether paleo-rockfall deposits can serve as a proxy for paleo-earthquakes, and can be used to constrain the timing of previous episodes of severe shaking.
We employ cosmogenic exposure dating of paleo-rockfall boulders to assess the age since boulders were emplaced. The basaltic rock contains abundant clinopyroxene (augite) which is able to quantitavely retain cosmogenic 3He, a rare isotope produced when cosmic rays interact with rocks at the Earth’s surface. We use a shielded sample (one not exposed to cosmic rays) to constrain the amount of inherited 3He derived from mantle inclusions or produced radiogenically since the rock cooled. Preliminary data from a site at Rapaki indicates measureable concentrations of cosmogenic 3He, with boulder exposure ages ranging from 4 to 40 kyr. This data will be augmented with further cosmogenic exposure measurements and an inheritance model to develop a probability distribution function of paleo-rockfall emplacement age.
58
Resilience of Organisms to Catastrophic Sedimentation at Te Angiangi Marine Reserve, Hawke's Bay, New Zealand
D. Macpherson
1, C. Battershill
2 and C.
Nelson1
1Department of Earth and Ocean Sciences,
University of Waikato, Hamilton 3240 2Environmental Research Institute, University of
Waikato, Tauranga 3110 [email protected]
The Te Angiangi Marine Reserve protects 446 hectares of coastline considered to be representative of the nearshore marine environment of central Hawke’s Bay. During a severe storm event in April 2011 the reserve was subjected to catastrophic sedimentation from large-scale mass wasting of the adjacent coastal hills. The landslides introduced a significant amount of muddy terrestrial sediment directly into the reserve that potentially could have smothered benthic organisms. Some pre-reserve (baseline) and post-reserve (monitoring) ecological data sets exist, which provide a pre-storm baseline and therefore the opportunity to study whether the protection offered by the reserve has increased the resilience of the organic communities present.
The hills adjoining the reserve consist of weak, massive, slightly calcareous, Late Miocene mudstone that is rich in illite and smectite clay minerals and contains scattered dolomitic concretions. Rapid wetting-and-drying causes breakdown and frittering of the mudstone into finer and finer fragments that facilitates offshore transport. Nearshore sediments are fine sand dominated and increase in mud content with increasing depth and distance offshore, suggesting that the finer-grained sediment is being carried and deposited on or just outside the reserve boundary.
An intertidal ecological survey was conducted at eight sites, four from within and four outside the reserve. At each site the demography of the key species: paua (Haliotis spp) and kina (Evechinus chloroticus), along with seagrass (Zostera muelleri) cover and health, was recorded and reviewed in the context of the degree of likely sedimentary inundation. The study is in an attempt to correlate sedimentary smothering with ecological resilience, an ambitious goal. Results need to be viewed cautiously, but differences were observed inside and outside of the reserve and this talk will critically assess the hypothesis of resilience being afforded by protection.
Simulating Oblique Subduction Zones Through 3D Numerical Models
C. Malatesta
1, T. Gerya
2, L. Crispini
1, L.
Federico1, M. Scambelluri
1 and G. Capponi
1
1DISTAV, University of Genova, Corso Europa
26, 16132 Genova, Italy 2Institute of Geophysics, ETH Zentrum,
Sonneggstrasse 5, 8092 Zürich, Switzerland [email protected]
We have used 3D numerical models to study subduction zones characterized by an oblique convergence between plates. In these settings, a trench-normal motion of the subducting slab is coupled with trench-parallel displacement of the plates. The models that we have run are based on thermo-mechanical equations that are solved with finite differences method and marker-in-cell techniques and depict either an infinite oceanic basin delimited by a continental margin or a narrow oceanic basin (500 km-wide). The basin is floored by layered or heterogeneous oceanic lithosphere. The location of subduction initiation and therefore the plate margins geometry are controlled by a weak zone in the mantle. Through 3D simulations we have tested the role of different shear component of convergence and plate margin geometries on oblique subduction dynamics.
In all the simulations, a low-viscosity serpentinite channel forms after the hydration of a restricted area of the mantle wedge by the fluids that arise from the downgoing slab. The shape and internal dynamics of the serpentinite channel vary laterally along the subducting plate.
In particular, we have observed different behaviors of the overriding plate during the subduction process. Along one single subduction zone, the overriding plate can in fact be both tectonically eroded or coupled with the descending plate; in this last case the overriding plate is dragged coherently in the subduction channel.
Finally, some of these models highlighted that temperature of the upper-plate continental margin controls the place of subduction initiation in basins floored by serpentinite-rich oceanic lithosphere: colder continental margins favor stable subduction at the weak zone; hotter continental margins promote the migration of subduction at the ocean/continent margin interface.
59
Brymbo Fossil Forest: A New Exposure of a Carboniferous Fossil Forest in Wales, UK
J. Malpas
Chair Association of Welsh RIGS Groups, 30 Peel Hall Lane, Ashton, Chester, UK, CH3 8DE
Sites showing Late Carboniferous (Pennsylvanian) deltaic, coal floras are well known across Europe and North America, but generally they only yield drifted plant remains. Brymbo in contrast has in situ arborescent lycopphytes and horsetails.
Brymbo lies at the northern border of the Denbighshire Coalfield in North East Wales and was one of the largest steelworks in Europe, but was closed in 1992. Recent redevelopment of the site involved opencast coal extraction and burial of steelworks contaminated waste in the resulting void. During this process a small area of sandstones and mudstones was exposed, which to date has yielded over 20 in situ lycophytes up to 2m in height and 1.5m in diameter with attached Stigmaria root systems. Dense groups of Calamites up to 1.5m in height, some of which have branching stems, and diverse fern fronds and spores.
The poster will describe the context and plant fossils of Brymbo, a new internationally important site that provides new insights into the environment in which these plants grew. Promoting the Understanding of Geodiversity
and Geoconservation in a Welsh Protected Landscape
J. Malpas
Geodiversity Officer, Loggerheads Country Park, Nr Mold, North Wales, UK
The Clwydian Range and Dee Valley is a designated Area of Outstanding Natural Beauty (AONB) in North East Wales, UK, one of only five AONBs in Wales. The area stretches from the North Wales coast to the town of Llangollen and is administered by Denbighshire County Council. It is close to the conurbations of Liverpool and Manchester and is a popular destination for both education and leisure activities.
The area of 160 sq.km features extensive exposures of classic Silurian and Carboniferous rocks with key fossil horizons, Sites of Special Scientific Interest as well as over sixty Regionally Important Geodiversity Sites
(RIGS), designated on the basis of scientific, educational, historic and aesthetic criteria. Despite this level of geodiversity in the region, geology received little or no attention in the management plans or educational activities of the AONB, with no statutory provision for geoconservation, despite quarrying being significant on the borders of the Clwydian Range. Over the past six years, under project funding from the Welsh Government, a Geodiversity Action Plan (GAP) has been developed and implemented to rectify this omission.
The GAP has led to a sustainable geodiversity management plan for the Range, with policies to ensure effective geoconservation and sustainable use of geo-resources. It has established local partnerships with industry, conservation groups and educational establishments to promote and ensure effective geoconservation. Particular emphasis has been placed on increasing the geological knowledge and understanding of local schools, colleges and universities, while the promotion of geodiversity among local people and visitors has sought to drive sustainable geotourism and stimulate the local economy.
This talk will describe the context and issues in the Clwydian Range and Dee Valley AONB and present practical examples of elements of the project’s implementation. It will focus on educational and local outreach aspects including those with local industry. Late Quaternary Beetles and Ants from Rano
Kau, Easter Island
M. Marra1, M. Horrocks
2, T.W. Baisden
3 and J.
Flenley4
1University of Waikato, Private Bag 3105,
Hamilton, New Zealand 2Microfossil Research Ltd, 31 Mont Le Grand Rd, Mt Eden, Auckland 1024, New Zealand
3National Isotope Centre, GNS Science, PO Box
31312, Lower Hutt 5040, New Zealand 4Institute of Natural Resources, Massey
University, Private Bag 11222, Palmerston North 4442
As part of an extensive, multi-proxy investigation of late Quaternary environmental change on Easter Island, we included insect fossil evidence which provides insights into the pre-settlement invertebrate fauna of Easter Island. Radiocarbon determinations identify the oldest sediments in the Rano Kau core record as
60
20,340 ± 160 and 34,260 ± 440 14
C BP. There is a hiatus in the early to mid-Holocene with most of the sediments having been deposited after c. 3,500 cal BP.
The fossil insect data include two new native species of weevils (Curculionidae), which first appear in the pre-Holocene deposits. The weevils are Cossoninae of the tribe Dryotribini and have not previously been described for Rapa Nui. Most Dryotribini of the Pacific Islands are associated with Cyathea tree ferns. The fossil fauna also includes Allodessus skottsbergi (Dytiscidae), which occurs in the majority of samples younger than 2,843-2,720 cal BP. The origin of A. skottsbergi is not well understood but it is likely to be a native species of Easter Island.
Two species of ants, Tetramorium bicarinatum and Pheidole sp. (Formicidae), were also identified in the fossil fauna from sediments aged around 1,500 cal PB, although the
14C
ages of the ants are considerably older. Tetramorium bicarinatum is known in the modern Easter Island fauna; Pheidole sp. is a new species for the island. Eastern Polynesia’s ant species are all thought to have been introduced; however, our
14C ages on the ant exoskeletons
all date to well before the generally accepted timing of settlement, which could suggest that natural ant distributions were far wider than previously thought. Alternatively, apparent
14C
ages of the fossil ants could have been increased by reservoir effects.
The Changing Ecology of Lake Okataina as Revealed by Diatom Assemblages.
K. Mauriohooho
1 and C. Hendy
1
1Dept. of Chemistry, University of Waikato,
Hamilton, New Zealand [email protected]
The biological stratigraphy in the sediment of Lake Okataina is dominated by the siliceous frustules of diatoms and the remains of terrestrial vegetation (spores, pollen) and larvae. Aulacoseira, Cyclotella, Fragilaria and Epithemia assemblages generally dominate the first five centimetres of the cores. With increasing depth, Rhopalodia, Pinnularia, Eunotia, Surirella, and Achnanthidium genus appear with lesser amounts of Cyclotella and Epithemia. The Southern Basin (core six) exhibits the greatest species diversity. The assemblages are an indication of the ecological conditions at the time, with Aulacoseira and the Fragilaria crotonensis species considered to be summer diatoms, Cyclotella an autumn diatom and other
species of Fragilaria, Asterionella formosa (found in the water column) and Syndera spring diatoms. At approximately 25 cm pumice or glass shards are widely distributed with few intact diatom frustules suggesting this is the region of Tarawera Tephra. Diffuse CO2 Degassing at Te Māri Prior to the
6th
August Eruption
A. Mazot1, B. Christenson
2, L. Chardot
1,3 and
K.Britten1
1GNS Science, Private Bag 2000, Taupo, New
Zealand 2GNS Science, PO Box 30368, Lower Hutt, New
Zealand 3Dept. of Geol. Sci., University of Canterbury,
Private Bag 4800, Christchurch, New Zealand [email protected]
Tongariro showed volcano seismic unrest beginning in mid-July 2012. Prior to this, the last eruption at Tongariro volcano was from Te Māri craters in 1896, which reportedly distributed ash as far as Napier 115 km away from the volcano. In response to this activity, we conducted soil and air gas measurements. One week before the 6
th August eruption at Upper Te Māri crater,
115 CO2 flux measurements were performed on Upper and Lower Te Māri craters by means of the accumulation chamber method. The average CO2 flux was 322 ± 102 g/m
2/d with a flux
ranging from 0 to 9,076 g/m2/d. The total CO2
output from both craters was estimated to be 33.9 t/day. In general the CO2 flux was twice higher in Upper Te Māri crater than Lower Te Māri crater. Moreover, the results showed a spatial correlation between the highest CO2 fluxes measured and the new vents that appeared at Upper Te Māri crater during the eruption. In 2002 only a few CO2 flux measurements were made in the craters area and no comparison could be made with the new data.
In addition, we tested a Tuneable Diode Laser technique to measure CO2 air concentration at Lower Te Māri crater. 16 transects were performed with path lengths between 50 to 656 m. The mean CO2 concentration was 382 ± 11 ppm. The lowest mean CO2 concentration measured was 369 ± 10 ppm representing the background CO2 concentration in the area. The highest mean CO2 concentration was 398 ± 3 ppm and showed that the total level of CO2 concentration at Lower Te Māri was up to 29 ppm higher than the typical CO2 background concentration in the
61
atmosphere. This suggests that before the eruption there was a large contribution of CO2 into the atmosphere from the volcanic-hydrothermal system of Te Māri.
Mueller Rockslide – a Large, Slow-Moving Rockslide in Aoraki/Mount Cook National
Park
S.T. McColl Dept. of Geological Sciences, University of
Canterbury, Christchurch [email protected]
Recent monitoring of the 200 million m
3 slow-
moving Mueller Rockslide in Aoraki/Mount Cook National Park shows that the rockslide is more active than previously thought and provides information on the movement of ice-buttressed slopes. Field mapping and GPS surveying since April 2010 were used to define the structural control and movement characteristics of the rockslide. The head of the rockslide is near to the ridge-crest of the Sealy Range, at an elevation of 1800 m.a.s.l., and the rockslide is assumed to extend to the base of the Mueller Glacier at an elevation of about 1000 m.a.s.l., with the glacier buttressing the lower 200 m of the slope. The sliding surface(s) is sandstone/mudstone bedding planes of the western limb of an overturned anticline. GPS surveys indicated creep movement of several cm per year but with a displacement of 4 metres being recorded over one 12-month interval, which may have been triggered during a period of heavy rainfall. The displacement vectors indicate that the glacier ice accommodates some of the rockslide movement, which supports a recent notion that slope movement can cause deformation of glaciers. Large, dilated joints in the upper part of the ridge, in the location of the fold hinge, may be opening in response to movement of the rockslide; however, further monitoring is necessary to confirm this and to assess whether there is any threat to an alpine hut situated on the ridge. Continued thinning of the glacier is likely to accelerate slope movement and may facilitate rapid failure, which has the potential to block the valley, affect the mass-balance of the glacier, and possibly send a lobe of rock avalanche debris splashing into the Mueller proglacial lake. Suggestions are welcomed for improving the current monitoring strategy and the development of a warning system for the site.
A Large Chunk of Proterozoic Mantle Underlying the South Island
A.J. McCoy-West1, V.C. Bennett
1, I.S. Puchtel
2
and R.J. Walker2
1Research School of Earth Sciences, Australian National University, Canberra, 0200, Australia
2Department of Geology, University of Maryland,
College Park, Maryland 20742, USA [email protected]
Zealandia formed at the eastern margin of Gondwana during the Phanerozoic with its constituent fragments generally considered to have close geologic affinities with portions of Australia and Antarctica. To further test this idea and to explore the development of this micro-continent, a suite of mantle xenoliths was assembled from 12 localities throughout New Zealand, including the North, South, and Chatham Islands. The
187Re-
188Os isotopic
systematics of 27 xenoliths yield model ages between 0 and 2.3 Ga. The ages are geographically distributed with North Island samples being younger than those from South Island localities. Six samples from the newly defined Waitaha domain, South Island, have a narrow range of rhenium depletion model ages
from 1.6‒1.9 Ga, in agreement with an aluminochron melt depletion ‘age’ for this mantle domain of ca. 1.95 Ga, and a 3-point Re-Os isochron age of 2.26 ± 0.10 Ga. These ages are 500 Myr older than model ages preserved in other regions of East Gondwanan lithospheric mantle, e.g., southeastern Australia and Marie Byrd Land, Antarctica, and >1 Gyr older than the oldest crustal rocks exposed in New Zealand.
Thus, the lithospheric mantle of Zealandia has a complex age structure, including a region of Paleoproterozoic cratonic mantle with a minimum extent of ca. 45,000 km
2.
This ancient mantle resided at the margins of several supercontinents during the past ~2 Gyr, attesting to the durability of sub-continental lithospheric mantle, even when decoupled from its overlying contemporaneous crust and in an oceanic setting distanced from stable cratonic nuclei. Additionally, this rigid mantle block may have controlled the tectonic development of New Zealand and the propagation of the Australian-Pacific plate boundary through southern Zealandia, with the Alpine Fault appearing to dogleg around the western border of the Waitaha mantle block.
62
Improving Geodiversity: a New Concept for the Quarrying Industry.
K.R. Miller
Holcim (NZ) Ltd, PO Box 17015, Greenlane, Auckland, New Zealand [email protected]
Quarries are a valuable source of geological information. However, in recent years it has become difficult to gain access to operating quarries as a result of increasingly stringent safety requirements. Better recognition of the value of geodiversity by quarrying companies provides a reason to improve access to faces in both operating and closed quarries.
Examples are given from the United Kingdom, where the concept of geodiversity is well developed, and from Holcim sites at Cape Foulwind, Weston, Foulden Hills and Bombay.
Protection of quarry faces when a quarry closes needs to be planned. In New Zealand the emphasis is on restoration, often including the removal of hazards such as faces and covering all surfaces with vegetation. Instead, where the value of geodiversity is recognised, significant exposures would be retained and safe access routes would be provided.
Element Balance of Lake Okataina
B. Monahan1 and C. Hendy
1
1Dept. of Chemistry, University of Waikato,
Hamilton, New Zealand [email protected]
Lake Okataina has a catchment area of approximately 6,290 ha and an average rainfall of approximately 1,600 mm/yr producing approximately 35 Mm
3 of stream and
groundwater input to the lake each year. Nutrient and trace element concentrations were analysed by ICP-MS and FIA, these have been converted to an annual input to the lake. The increase in concentration of conservative ions suggests approximately 23% of the water that flows into the lake evaporates ; enabling the annual export into Lake Tarawera to be estimated. The balance between influx and export is assumed to be incorporated into the sediments. The balance shows that: 1. Annually more boron, sodium and arsenic are exported from the lake than enters:. The export of arsenic exceeds the influx observed from stream and groundwaters by a factor of two indicating sources within the lake.
2. Approximately 51 tonnes of nitrogen, 2 tonnes of phosphorus and 690 tonnes of silicon enter the lake each year, of these 12 tonnes of Nitrogen, 0.1 tonnes of Phosphorus and 230 tonnes of silicon are exported from the lake leaving a loss of 1.9 tonnes of phosphorus and 460 tonnes of silicon to be lost to the sediments and 39 tonnes of nitrogen to be lost mainly to denitrification. 3. On average approximately 100% of the aluminium, iron, manganese, zinc and lead that flow into the lake become incorporated within the sediments. 4. 30% of the magnesium, 60% of the sulfur and potassium, and 50% of the calcium and strontium entering the lake remain locked in the sediments.
Landslide Susceptibility Mapping at a Regional Scale Using Sparse Landslide
Inventory Data
V. Moon1 and R. Schicker
2
1Department of Earth and Ocean Sciences,
Private Bag 3105, Hamilton 3240, New Zealand 2Opus International Consultants, Private Bag
3057, Hamilton, New Zealand [email protected]
Landslide susceptibility assessment was undertaken for the Waikato Region. The GeoNet landslide catalogue provided the base data to derive statistical models of landslide susceptibility. Input parameters considered as predictors included elevation, slope, aspect, geology, soils, landuse, mean monthly rainfall, and distances to rivers, roads, and known faults. Both bivariate weights of evidence and multivariate logistic regression statistical models were applied. The GeoNet catalogue included few landslides in the region (1.4 % of area), and is limited in terms of length and completeness of record, and location uncertainty. This database contrasts with those normally used for research purposes, which are typically complete and accurate, but is representative of the type of data that may be available to territorial authorities wanting to derive maps for planning purposes. The predictive capacity of maps derived using this database was assessed by comparison with an independent landslide dataset compiled using Google Earth observations for a randomly selected subset of the area.
Susceptibility maps derived using both statistical methods were evaluated using success, prediction, and ROC curves. Comparison with validation samples from the
63
original database showed that both methods gave models with fair predictive capacity, with areas under ROC curves (AUC) of 0.71 to 0.75. Lower overall predictive capacity was achieved for the independent dataset, particularly for the weights of evidence model; logistic regression gave the best prediction (AUC = 0.71). An incomplete landslide inventory was not a problem for the logistic regression method as the model produced predictions that extrapolated landslide locations beyond the recorded sites adequately, giving similar AUC values for both the original and independent landslide datasets. Conversely, the weights of evidence method generated a map which successfully replicated known landslides, but was poor at generalising this to predict landslides beyond those in the original data.
A regional scale landslide susceptibility map for the Waikato Region is developed; of necessity this is a low resolution map, but by use of a logistic regression technique it is clear that adequate maps can be derived using limited initial landslide data. This methodology should be applicable to smaller areas at higher resolution to derive more focused maps for planning purposes.
Eruptive Processes of Shallow-Marine
Volcanoes on the Oligocene Continental Shelf, North-East Otago, New Zealand
B.L. Moorhouse
1 and J.D.L. White
1
1Dept. of Geology, University of Otago, PO Box
56, Dunedin. New Zealand [email protected]
The North Otago region of the South Island of New Zealand is well known for its volcanic deposits, including the Boatmans Harbour Pillow Lava and the Kakanui Mineral Breccia, each of which has attracted the interest of geologists since the late 1800’s including geologists such as J. Park, M. Gage and D.S. Coombs. Three distinct periods of volcanism are known to have occurred across North Otago during the Cenozoic, and this project focuses on products of the second period (late Eocene to early Oligocene) in an area of roughly 60 km by 30 km from north Oamaru to south Moeraki. This period of volcanism produced a number of monogenetic intraplate volcanoes, locally well-exposed in sea cliff outcrops, known as the Waiareka-Deborah volcanic group. They were erupted onto a submerged continental shelf between 35-30 Ma producing Surtseyan volcanoes.
Current work is focused along the coastline near Oamaru analysing well exposed pyroclastic and reworked volcaniclastic rocks, pillow lavas and breccias as well as contemporaneously deposited shelf sediments. The aim of the project is to gain a volcano by volcano interpretation of shallow-marine eruption processes by better understanding (1) precise depositional processes, bed by bed; (2) how the currents or suspensions that formed the beds were produced by the eruption along with the effects of these; (3) the particulate current- or suspension- generating processes above the vent for parts of the eruption we can be sure took place subaqueously; (4) any recognizable characteristics that point towards the eruption becoming emergent; (5) any variations in eruptive activity and (6) a possible water depth for time of eruptive activity. Previous work recognizes two main volcanoes differentiated into the Waiareka and Deborah Volcanic Formations. However evidence from bedding orientations and lithofacies may suggest multiple, or a single and complex volcano in the Waiareka Formation.
Diverse Late Cretaceous Volcano-Tectonic Regimes in and Around Zealandia
N. Mortimer1, K. Hoernle
2, P.B. Gans
3, P. van
den Bogaard2 and F. Hauff
2
1GNS Science, Private Bag 1930, Dunedin, New
Zealand 2GEOMAR, Wischhofstr. 1-3, D-24148 Kiel,
Germany 3University of California, Santa Barbara, CA
93106, USA [email protected]
We report new Ar-Ar geochronological, geochemical and isotopic data from widely separated onland and offshore sites in New Zealand and the SW Pacific Ocean. A normal mid-ocean ridge basalt (N-MORB) from DSDP Site 595 (-23.8S, long 165.5W) gives consistent primary whole rock step-heating and plagioclase laser ages of 84±3 Ma that reliably approximate to the age of cessation of seafloor spreading at the Osbourn Trough. A dredged rift tholeiite basalt from Bollons Gap, east of Campbell Plateau, gives a very precise adularia step-heating age of 78.1±0.2 Ma that provides a minimum age for initiation of Zealandia-West Antarctic sea floor spreading between the Bollons and Antipodes fracture zones. A magnesian basaltic andesite (Kopi Boninite) from the Pahaoa Group of the Wairarapa district
64
of the southern North Island gives an imprecise step-heating age of 85±10 Ma, in agreement with a Late Cretaceous age inferred from stratigraphy; this dates the re-initiation of arc volcanism off North Zealandia.
Combined with other recently published age and geochemical data on igneous rocks from the Tonga Trench, Hikurangi Plateau, Wishbone Ridge, Zealandia and West Antarctica, we propose the following series of events: (1) at 100-110 Ma subduction ceased under the North and South Zealandia edge of Gondwana due to collision of the Hikurangi Plateau, but subduction continued beneath the West Antarctica edge of Gondwana. (2) spreading at the Osbourn Trough continued until c. 84 Ma - well after plateau collision - with development of a long-offset Wishbone transform. (3) between 75 and 95 Ma subduction re-initiated along the edge of North Zealandia creating the boninite and, ultimately, the Matakaoa-Tangihua-Poya back-arc basins. (4) from c. 84 Ma oceanic spreading propagated on a new trend into Gondwana and split Zealandia from West Antarctica. Our new data considerably clarify the space-time development of this poorly known part of the SW Pacific. A South American Perspective on Holocene
Southern Hemisphere Westerly Wind Variability
C.M. Moy1, R.B. Dunbar
2, P.I. Moreno
3 and T.
P. Guilderson4
1 Dept. of Geology, University of Otago, PO Box
56, Dunedin, New Zealand 2Dept. of Environmental Earth System Science,
Stanford University, Stanford, CA, USA 3Dept. of Ecological Sciences, Universidad de
Chile, Santiago, Chile 4Lawrence Livermore National Laboratory,
Livermore, CA, USA [email protected]
The Southern Hemisphere westerly winds play a fundamental role in global climate by mediating air-sea gas exchange in the Southern Ocean through wind-induced upwelling of deep water. Despite global relevance, our understanding of past westerly variability and its potential influence on the global carbon cycle is limited by broadly distributed paleoclimate records that yield conflicting interpretations during the Holocene. Here, we reconstruct Holocene
changes in the strength of the westerlies at a latitude where the winds play a fundamental role in the hydrographic processes responsible for deep-water ventilation in the Southern Ocean. We utilize highly resolved and well-dated lacustrine sedimentary records from SW Patagonia (52° S) and Tierra del Fuego (55° S) to monitor changes in hydrology and lake dynamics associated with the overall strength of the Southern Hemisphere westerlies at the core of modern wind belt. Multiple proxies imply moderately strong westerlies during the Late Glacial/Holocene transition, followed by an overall reduction in wind intensity during the early Holocene between 9,000 and 6,000 cal yr BP, which is followed by a gradual increase in strength that culminates within the last 400 years of our records. The Holocene changes observed in these records are broadly synchronous with the timing of CO2 variations recorded in Antarctic ice cores; taken at face value, this covariance suggests a westerly influence on the carbon cycle. Our westerly wind variations also appear to be synchronous with shifts in Northern Hemisphere temperature and tropical climate at millennial and multi-millennial timescales. This latter result suggests that the coupled oceanic and atmospheric processes linking high latitude climate of both hemispheres during glacial terminations may also operate along multi-millennial timescales during the Holocene.
Towards a Robust Framework for Probabilistic Tsunami Hazard
Assessment (PTHA) for Local and Regional Tsunami in New Zealand
C. Mueller
1, W. Power
1, S. Fraser
1 and X.
Wang1
1GNS Science, 1 Fairway Drv., Lower Hutt,
5010, New Zealand
[email protected] Probabilistic Tsunami Hazard Assessment (PTHA) is conceptually closely related to Probabilistic Seismic Hazard Assessment (PSHA). The main difference is that PTHA needs to simulate propagation of tsunami waves through the ocean and cannot rely on simple attenuation relationships, which makes PTHA computationally more expensive.
The wave propagation process can be assumed to be linear as long as water depth is much less than the wave length of the tsunami. Beyond this limit a non-linear scheme has to be employed with significantly higher algorithmic run times. PTHA considering far-field
65
tsunami sources typically uses unit source simulations, and relies on the linearity of the process by later scaling and combining the wave fields of individual simulations to represent the intended earthquake magnitude and rupture area. Probabilistic assessments are typically made for locations offshore but close to the coast. Inundation is calculated only for significantly contributing events (de-aggregation).
For local tsunami (local PTHA) it has been demonstrated that earthquake rupture complexity has a significant effect on the tsunami amplitude distribution offshore and also on the run-up onshore, so a unit source approach cannot easily be applied. Thus PTHA for local tsunami has to take variable slip distributions into account, which is seen as an aleatory uncertainty and can be incorporated directly into the rate calculation.
We have developed a framework that manages the large number of simulations required for local PTHA. As an initial case study the effect of rupture complexity on tsunami run-up and the statistics of the distribution of wave heights have been investigated for plate-interface earthquakes in the Hawke's Bay region. Assessing the probability that water levels will be in excess of a certain threshold requires the calculation of cumulative probability density functions. We generally find that the onshore maximum water levels do not follow a normal distribution, and propose that empirical cumulative distribution functions (ECDF) be used in the assessment.
We compare our results with traditional estimates for tsunami run-up and tsunami simulations that do not consider rupture complexity.
Lake-Floor Sediment and Pore Fluid Composition of a Geothermally Active
Volcanic Crater Lake, Lake Rotomahana
S. Muir1, A. Pittari
1, C. Hendy
2 and C. de
Ronde3
1Dept. of Earth and Ocean Sciences, University
of Waikato, Private Bag 3105, Hamilton 2Dept. of Chemistry, University of Waikato,
Private Bag 3105, Hamilton 3Marine Geosciences, GNS Science, PO Box
30-368, Lower Hutt [email protected]
Modern Lake Rotomahana is a flooded volcanic crater lake that formed as a consequence of volcanic excavation and crater-rim deposition
around the crater rim during the 10 June, 1886 Tarawera eruption, and subsequent volcaniclastic and biogenic sedimentation over the last 126 years. Prior to the eruption, the area that is now submerged, and partially excavated and buried beneath the current lake, consisted of two smaller lakes, their catchments, and a subaerial geothermal system that hosted the Pink and White Terraces. In addition, a new, extensive active geothermal system has been discovered in the southern part of the modern lake floor. This study characterises the sediment composition and pore fluid chemistry of sediment cores retrieved from the upper 20-40 cm below present-day Rotomahana lake floor. Sediment grain size distributions and component characteristics were assessed by laser sizer and SEM studies; the geochemical composition of the sediment and pore fluid was characterised by ICP-MS. The top ~20 cm is generally comprised of suspended, dark organic, bioturbated diatomaceous silt, with mixed diatom species and clay flakes, typical of a low energy lacustrine biogenic environment. This sharply overlies grey laminated fine silt comprised of a less diverse diatom population, mixed clay and granular particles, and glass shards representing lacustrine reworked volcanogenic sediment derived from the 1886 Rotomahana Mud. The upper suspended layer was absent from a core retrieved near a geothermal vent, most likely due to plume turbulence. Silica concentration in pore fluids decreases from around 52 mg L
-1 at the
sediment-water interface to ~30 mg L-1
below a sediment depth of 10 cm, and coincides with the precipitation of ~200 nm-sized spheroidal silica on the surfaces of sediment grains. This suggests that the lake-floor sediments are showing the early stages of silica sinter development.
Mapping the Magnetic Susceptibility and Electric Conductivity of Marine Surficial Sediments by Benthic Electromagnetic
Profiling
H. Müller1, T. von Dobeneck
1,2, B. Baasch
1
and C. Hilgenfeldt1
1MARUM-Center for Marine Envir. Sci. and Fac. of Geosci., Univ. of Bremen, Bremen, Germany
2Dept. of Earth and Ocean Sciences, Univ. of
Waikato, Private Bag 3105, Hamilton [email protected]
Distribution, accumulation, and diagenesis of surficial sediments in coastal and continental shelf systems follow complex chains of localized
66
processes and form deposits of great spatial variability. Given the environmental and economic relevance of ocean margins deposits, there is need for innovative non-acoustic geophysical exploration methods. The electromagnetic benthic profiler NERIDIS III (NERItic DIScoverer) of MARUM (Bremen) uses controlled-source electromagnetic (CSEM) imaging technology and permits to coevally quantify the magnetic susceptibility and the electric conductivity of marine deposits at high precision and resolution.
These two physical properties differ fundamentally insofar as magnetic susceptibility mostly assesses solid particle characteristics such as terrigenous or iron mineral content, redox state, and contamination level, while electric conductivity primarily relates to the fluid-filled pore space and detects salinity, porosity, and grain-size variations. We develop and validate a layered half-space inversion algorithm for submarine multifrequency CSEM with concentric sensor configuration. A modified commercial land CSEM sensor for submarine application was mounted into a nonconductive and nonmagnetic modular bottom-towed sled. The profiler achieves 25 soundings/second at 3–4 knots over continuous profiles of up to a hundred kilometers. Magnetic susceptibility is determined from the 75 Hz in-phase response (90% signal originates from the top 50 cm), while electric conductivity is derived from the 5 kHz out-of-phase (quadrature) component (90% signal from the top 92 cm).
Exemplary survey data from the north-west Iberian margin underline the excellent sensitivity, functionality, and robustness of the
system in littoral (∼0–50 m) and neritic (∼50–300 m) environments. Susceptibility versus porosity crossplots successfully identify known lithofacies units and their transitions. All presently available data indicate an eminent potential of CSEM profiling for assessing the complex distribution of shallow marine surficial sediments. The system is available for coastal research in New Zealand from November 1012 until March 2013.
Fissure-Aligned Lava Spatter Cone Growth, Evolution of Lava Lakes and Volcanic Cone Rafting in the 1256 AD Al-Madinah Eruption
in the Kingdom of Saudi Arabia
H. Murcia1, K. Nemeth
2,3, J. Lindsay
1, R.
Moufti3, N. El-Masry
3, S.J. Cronin
2 and I.E.M.
Smith1
1School of Environment, The University of
Auckland, Auckland, New Zealand 2Volcanic Risk Solutions, Massey University,
Palmerston North, New Zealand 3Geologic Hazards Research Unit, King
Abdulaziz University, Jeddah, Saudi Arabia [email protected]
The 52 day long Al-Madinah eruption occurred in 1256 AD 20 km southeast of Al-Madinah city (~1.3 million inhabitants) in Saudi Arabia. The activity was concentrated along a ~2 km long NNW-SSE-aligned fissure which emitted mainly a’a lava flows and lava spatter-dominated pyroclastic cones. The a’a lava flows have textural features indicative of rapid, viscous movement at their proximal areas, related to steep flanks at their feeding points. Pyroclasts were erupted from at least seven vents, which resulted in individual and nested lava spatter cones with agglutinated bomb horizons forming ramps along the fissure. More energetic explosive eruptive episodes from the main central cones generated finer-grained pyroclastic fall deposits, with Pelee’s tears and hair and in cases reticulite. The vents hosted lava lakes 10s to 100s of metres wide, as evidenced by lava benches and drain-back textures on crater walls. Lava lakes were tapped and at times drained through “boccas” or collapse-pipes/cavities formed along the axis of the fissure, at times triggering changes to higher lava fountaining and even Strombolian activity. Lava lake break-outs also occurred in places due to confining crater wall collapses, indicated by circular fissures along the crater margins and the presence of crater-ward groove-marks on underlying welded lava spatter horizons. The shape of individual cones was repeatedly modified by lava flow break out at the tip of the fissures and rafting and subsequent reheating of spatter cone fragments. This resulted in a nested and complex volcano morphology involving variously rotated pieces of lava spatter cones tens of metres across on top of lava flows within a few hundred metres from the lava break out points. The composition range of erupted magmas is narrow 45-46 wt.% SiO2, but at least two different sub-groups can be differentiated by K2O-contents. Preliminary results indicate a
67
direct relationship between the magma composition and the temporal and spatial distribution of their sources.
Revision of Volcaniclastic Stratigraphy in Eastern Egmont National Park, Taranaki
V.E. Neall
1, A.G. Hogg
2 and A.V. Zernack
1
1Institute of Natural Resources, Massey
University, Palmerston North 2Radiocarbon Dating Laboratory, University of
Waikato, Hamilton [email protected]
Recent quarrying on York Road, alongside the eastern boundary of Egmont National Park has exposed a well preserved buried forest, overlain by a sequence of log-bearing volcaniclastics. Radiocarbon dating of the sequence verifies the existence of four major mid-late Holocene volcaniclastic formations in the area, rather than the two currently portrayed on the 1:100,000 Quaternary geological map of Taranaki (Neall & Alloway 2004). The basal buried forest has been radiocarbon dated at 3,236 ± 35 yrs BP (Wk-26598) and was overwhelmed by a massive volcanic debris flow (lahar) previously mapped as the Ngatoro Formation (Neall 1979). Subsequently, two further volcaniclastic deposits dated at 2,470 ± 33 yrs BP (Wk-27022) and 2,265 ± 38 yrs BP (Wk-27114) have been collectively mapped as the Te Popo Formation (Neall & Alloway 2004). The whole of this sequence is preceded by a volcaniclastic unit that up until now has not been separately mapped. It is here informally recognised as the Piakau formation and is dated at circa 5,000 ± 90 yrs BP (NZ3352).
The origin of the Piakau formation is likely to be block and ash flows that were emplaced in the Manganui Gorge region and in the Ngatoro catchment, which transformed down slope into lahars. The Ngatoro and Te Popo Formations’ distribution suggests an origin either from the summit cone or from localised gorges at 1200 m altitude; the latter implies a heavy rain-triggering origin.
Experimental Investigations of Granular Matter Flow Regimes Leading to Insight into
Lahar Flow Dynamics
A. Neather1, G. Lube
1, J. Jones
2, S. Cronin
1
1Volcanic Risk Group, Massey University,
Private Bag 11 222, Palmerston North 4442 2School of Engineering and Advanced
Technology, Massey University [email protected]
A fascinating aspect about granular matter is the co-existence of two or all three of the states of matter (solid, liquid, gas) and their frequent transitions between flow regimes. Despite the ubiquity of these transitions in natural and industrial applications, the fundamental physics of granular matter remains a mystery, to the extent that a unified theory to describe the motion and behaviour of granular matter is still absent in the literature.
In order to close this gap, the traditional view of granular flows in steady, energy-balanced and hence non-transitional motion must be widened to describe their transient behaviour that occurs under unsteady situations.
An important type of granular flow, in regards to its possible effect on human life, are lahars; debris and water-based flows, initiated by volcanic processes.
We aim to investigate the effect of acceleration (and deceleration) on a fluid/particulate solid mixture in a rotating drum. It is hoped that such experiments will give insight into how changing topography influences lahar flow, and in turn their erosional and depositional effects on the areas with which they interact. A rotating drum, 0.15 m in width and 0.25 m in radius, has been constructed. The drum will be filled with a mixture of fluid and particulate solids, and then rotated at a set velocity. By varying this velocity and studying what happens as the drum accelerates between steady velocities, we can gain insight into lahar flow dynamics – it is possible to draw analogues between this behaviour and the erosion/deposition by a lahar as it de/accelerates topographical changes. Such an experiment has not been previously undertaken to our knowledge; other workers have focused on static rotational regimes, which have limited applicability to unsteady natural flows.
This work forms part of the new laboratory for experimental volcanology at Massey University.
68
Undersea New Zealand
H.L. Neil1,2
1on behalf of NIWA – Ocean Sediments and
Ocean Geology groups
2NIWA, Private Bag 14901, Kilbirnie, Wellington,
6241, New Zealand [email protected]
New Zealand sits astride an active plate margin, which results in a highly complex and diverse seascape from submarine trenches to underwater volcanoes, to active submarine canyons and channels. Undersea New Zealand provides a unique insight into the deep-sea, and for the first time since its original release in 1997, NIWA is publishing an updated product. Using a Kongsberg EM-302 multi-beam echo-sounder, and its predecessor (EM300), which have now been used for mapping the New Zealand realm from the Equator to the Antarctic for over twelve years, an additional 500,000 km
2 of the New
Zealand seafloor has been mapped in high resolution by NIWA. The inclusion of this data, and fifteen years of additional survey data has resulted in a new digital elevation model that reveals, for the first time, many features that have remained hidden beneath the waves. This vast submerged continental region comprises a variety of geomorphological and geological structures ranging from: - narrow shelves fed by short-reach rivers, with catchments that have some of the highest sediment yields observed globally;
- rocky reefs, rugged submarine trenches, open slopes and vertical escarpments, current-swept, eroded rises, and large quiescent carbonate plateaux; - a seamount-rich topography, underwater volcanoes, hydrocarbon seeps and biogenic (coral) reefs; and
- areas influenced by large active submarine landslides, and a continental margin bisected by submarine canyon and channel complexes and major tectonic faults.
A combination of seabed maps, characterising the shape and composition of the seafloor, and deep-sea photography, allows us to illustrate and describe the morphological features of the SW Pacific in New Zealand’s waters, providing a unique view of the topography of the seafloor, its ecological characteristics and biodiversity hotspots. This mapping product provides significant benefit for all New Zealanders and for all users of the marine environment, revealing potential for fisheries, environmental management, conservation, hazard mitigation, and energy and
mineral opportunities, iwi and recreational use, as well as providing key baseline knowledge on which to build well targeted future scientific research.
“A Fizzy Rock” – An Educational Resource on New Zealand Limestones
C. Nelson
1, C. Milne
2, S. Hood
1, A. Rowden
3
and K. McGrath4
1 Earth & Ocean Sciences, University of
Waikato, Private Bag 3105, Hamilton, New Zealand
2 Science Learning Hub, University of Waikato,
Private Bag 3105, Hamilton, New Zealand 3 NIWA, Private Bag 14901, Kilbirnie, Wellington,
New Zealand 4 Chemical & Physical Sciences, Victoria
University, PO Box 600, Wellington, New Zealand
The Science Learning Hub (www.sciencelearn.org.nz), funded by Ministry of Business, Innovation and Employment and managed by University of Waikato, provides science educational resources for teachers for school years 5-10. Resources are closely linked to the science curriculum, are developed by educators in collaboration with practicing New Zealand scientists, and explore some of the latest research being undertaken in New Zealand in science and technology. The Hub learning approach is underpinned by ‘contexts’, each of which explores a major scientific theme and provides an opportunity for teachers and students to further investigate topics related to the theme. Each context is supported by multimedia files, classroom resources and activities, and an association with active scientists in New Zealand’s science and technology sectors. Of the 31 contexts currently available online, at least 12 are geosciences-related, including for example on earthquakes, volcanoes, dating the past, future fuels, and the ocean in action.
Here we report the addition of a new teaching resource about limestones, aptly titled “A Fizzy Rock”, which goes live in late 2012. The module describes the nature, properties, distribution, origins and economic uses of limestones, highlighting New Zealand occurrences. Special emphasis is given to contrasting limestones developed in tropical seas, where coral reefs and chemical precipitates abound, with those formed in temperate regions that are constructed primarily
69
of the fragmental shell remains of bryozoans, molluscs, echinoderms and foraminifera, typical of most New Zealand limestones of Tertiary age (last 65 million years). Other topics addressed include how organisms go about secreting a carbonate shell (biomineralisation), how loose seafloor carbonate sediments are eventually converted into hard limestone (diagenesis), why limestones often act as oil reservoirs, the nature of specialised faunal communities and carbonates associated with escape of methane gas at the seabed (cold seep carbonates), and the development of spectacular limestone landscapes (karst). Unravelling the Ash Generation Mechanism
of the 6 August, 2012, Mt. Tongariro Eruption: Was it Hydrothermal or
Phreatomagmatic?
K. Németh1,2
, N. Pardo1, S.J. Cronin
1, C.I.
Schipper 3,4
, J.D.L. White5, M. Irwin
1, M.
Brenna1, J. Agustín-Flores
1, A. Auer
5, A.
Zernack1, R.B. Stewart
1, V.E. Neall
1, R.C.
Wallace1 and A. Pittari
6
1Volcanic Risk Solutions, INR, Massey
University, Private Bag 11 222, Palmerston North
2 Geol. Hazards Research Unit, King Abdulaziz University, Jeddah, Kingdom of Saudi Arabia
3School of Geography, Environment and Earth
Sciences, Victoria University of Wellington 4 Institut des Sciences de la Terre d’Orléans,
ISTO – l’Université d’Orléans, France 5Geology Department, University of Otago,
POBox 56, Dunedin 6Department of Earth and Ocean Sciences,
University of Waikato, Hamilton [email protected]
Only weak seismic signals immediately preceded the recent explosive Tongariro eruption, raising an important eruption-response question; was new magma involved in the event, or were hydrothermal processes alone responsible for the explosive eruption?
Within the 2-4 φ size fractions, 61% of the ash particles are recycled volcanic lithic grains, including grey-and-white altered ones with mottled texture, unaltered grey and brown porphryritic andesites and red-to-yellow hydrothermally altered clasts. Up to 28% of the particles are crystals (pyroxene and plagioclase, with <5% magnetite and <1% pyrite).
In sieved, acid-cleaned, and density-separated ash, delicate, fresh, isotropic, brown glassy pyroclasts (56-77 % SiO2, varying with
microlite content) make up 12% of particles finer than 3 φ. Glassy pyroclasts are microlite-rich to microlite-poor, and range from sub-rounded to blocky and bubble-wall shard types of variable vesicularity. SEM-imagery shows poorly vesicular pyroclasts and some fluidal surfaces, but more common are conchoidal fractures, stepped surfaces and fine adhering ash, inferred to indicate magma-water interaction. Considering that since the last eruption (1896) there has been weak hydrothermal activity and pervasive alteration of deposits surrounding the vent area, the intricately-shaped fresh glass shards are unlikely to be accessory or recycled grains. They probably formed by explosive interaction of a small volume of magma (~0.0002 km
3-uncorrected for vesicularity) with a saturated
hydrothermal system. Grain-size distributions are commonly
bimodal with a main mode at 5-6 φ, and a secondary mode at 2-2.5 φ that is possibly from particle aggregation (the finest particles fell as clusters deposited at the same time as particles of the coarse mode), but may also represent the crystal sizes. The eruption produced debris-jets, and high-energy transport of ballistics, and ejected fine particles that rose to 7 km and were transported over 200 km to the east, at velocities of ~80 km/hr, to cover an area of ~6000 km
2.
Subdivision of the Holocene
R.M. Newnham
School of Geography, Environment and Earth Sciences. Victoria University of Wellington.
A Working Group, established by the International Commission on Stratigraphy (ICS), has proposed a formal subdivision of the Holocene Series/Epoch. The proposal was published in the Journal of Quaternary Science in mid-September (Walker et al. DOI: 10.1002/jqs.2565). Although previous attempts to subdivide the Holocene have proved inconclusive, recent developments in Quaternary stratigraphy, notably the definition of the Pleistocene-Holocene boundary and the emergence of formal subdivisions of the Pleistocene Series/Epoch, mean that it may be timely to revisit this matter. The Quaternary literature reveals a widespread informal but variable usage of a tripartite division of the Holocene (‘early’, ‘middle’ or ‘mid’, and ‘late’), and the working group argue that this de facto subdivision should now be formalised to ensure consistency in stratigraphic terminology. The
70
group is proposing an Early-Middle Holocene Boundary at 8.2 ka BP and a Middle-Late Holocene Boundary at 4.2 ka BP, each of which is linked to a Global Stratotype Section and Point (GSSP). Should the proposal find a broad measure of support from the Quaternary community, a submission will be made to the International Union of Geological Sciences (IUGS), via the SQS and the ICS, for formal ratification of this subdivision of the Holocene Series/Epoch.
This paper will outline the proposal and context for subdividing the Holocene and consider the broader implications for geosciences in New Zealand. Two questions in particular will be considered: (1) would this subdivision be of any practical use (and would it be recognised?); and (2) to what extent are the two proposed boundaries recognised in our records from the New Zealand region? Comments and reactions are sought from the New Zealand geosciences community and these can be conveyed to the Working Group that submitted the proposal.
Three-Dimensional Structure of the Alpine Fault Zone in the Region Around the Waitangi-taona and Whataroa Rivers
R.J. Norris1, A.F. Cooper
1, V. Toy
1, S. Read
1
and L. Easterbrook1
1Dept. of Geology, University of Otago, PO Box
56, Dunedin. New Zealand [email protected]
The region around the Waitangi-taona and Whataroa rivers in central Westland north of Franz Josef encompasses one of the best studied outcrops of the Alpine Fault zone at Gaunt Creek. The first Alpine Fault drilling project (DFDP-1) was undertaken in this area and is where the deeper DFDP-2 is proposed. The fault zone here demonstrates serial partitioning, where oblique thrust sections are linked by strike-slip faults, as proposed by Norris and Cooper (1995, J. Structural Geology) and supported by recent Lidar data (Barth et al., in press, Lithosphere). A synthesis of surface mapping data shows that the fault zone with a complete cataclasite/mylonite sequence forms a c. 055° striking, 40° SE-dipping, oblique thrust zone south of Gaunt Creek, with near surface parallel partitioning of part of the strike-slip onto a steeply dipping fault in the hanging wall. North of Gaunt Creek, the fault zone swings to the NNE (025°) and dips at a lower angle of 20-30° SE. Here, just south of “Big Knob”, which is
composed of granitoids and country rock of the Western Province, the thrust-dominated fault zone links with a ESE striking (075°) steep fault zone which runs back towards the Whataroa River. There are at least two prominent lineaments within this fault zone, and creek deflections suggest dextral strike-slip. The fault rocks exposed immediately south of these features change from cataclasite and mylonite at the western end to proto-mylonite and “curly” schist at the eastern end. Exposures near to the main lineament show steeply dipping crush and gouge zones. North of the Whataroa River, the fault is not well exposed but strikes again at around 055° as an oblique thrust zone. Using these field observations, and models of fault zone segmentation, a 3-D model of the Alpine Fault in this region is presented.
A Decade-Long Record of Foraminifera Fluxes in Subtropical and Subantarctic
Waters, East of New Zealand
L.C. Northcote1 and S.D. Nodder
1
1NIWA, Private Bag 14901, Kilbirnie, Wellington,
New Zealand [email protected]
The ocean carbonate system is buffered by the production and dissolution of inorganic carbon, and the transfer of this material, either in its dissolved or solid phase, from the surface to the deep ocean interior and ultimately to the sea-floor. Carbonate production in the deep-sea is generally a biogenic process, with foraminifera (calcite) being one of the dominant contributors to downward particle flux to the sea-floor, acting as mineral ballast to enhance the natural sequestration of organic carbon to the deep-sea. Foraminifera, preserved in ocean sediments, also provide archives of ocean temperature and chemistry over millennial time-scales, so the temporal variability of present-day downward fluxes is a requisite for understanding these paleo-interpretations. Furthermore, climate-mediated changes in ocean pH could have a significant effect on both carbonate production and flux in the future.
A sampling programme of particle fluxes in warm, macronutrient-depleted subtropical and cold, micronutrient-limited subantarctic waters was concluded in March 2012, providing just over more than a decade-long record. From this time-series, a record of seasonal and interannual variations in the fluxes of foraminifera has been elucidated. These analyses have revealed substantial differences in the species
71
composition and abundances of foraminifera in the two biogeochemically different water masses over a variety of time-scales. Foraminiferal fluxes in subantarctic waters are typically higher than in subtropical waters (annual maximums >10 000 tests/m
2/d cf. 7000), dominated by
Globigerina bulloides, Turborotalita quinqueloba and Neogloboquadrina incompta, with maximum fluxes in spring and autumn. In subtropical waters, T. quinqueloba dominates, in association with G. bulloides and Globoconella inflata, reaching peak fluxes mainly in spring and winter. Relationships of foraminiferal fluxes to variations in pteropod and organic carbon flux, and to potential climatic drivers (e.g., El Niño-La Niña, IPO), over the 11½ year times-series will be discussed.
The Influence of Seasonally Anoxia in Bottom Waters on the Trace Metals and
Nutrient Elements within the Nepheloid Layer in the Northern Basin of Lake Okataina
D. O’Connor
1 and C. Hendy
1
1Dept. of Chemistry, University of Waikato,
Hamilton, New Zealand [email protected]
Sampling of bottom waters was undertaken during April-May 2012 using four specifically designed peeper devices deployed for one month at 65.5, 63.3, 60.0 and 58.0m depth respectively in the northern basin of Lake Okataina). Site 1 at 65.5 m water depth showed the greatest depletion of dissolved oxygen while sites 3 & 4 displayed trends indicating slightly higher dissolved oxygen concentrations. The following observations were made from the results: a) The increasing iron and manganese concentrations in the nepheloid layer of sites 1 & 2, indicate anoxic conditions are establishing in the deepest parts of the northern basin. Sites 3 & 4 appear to remain largely oxygenated. b) Barium concentrations increase within the anoxic zone, most likely as a result of the reduction of sulphate to sulphide releasing barium into solution from barite. The sulphide present then appears to be precipitating out, most likely with iron as pyrite. c) Arsenic increases to well above safe drinking water standards in the two deepest sites, this most likely reflects a reduction of adsorped arsenic V to soluble arsenic III within the sediment and then diffusion into the overlying anoxic water column.
d) Nutrient elements phosphorus and silica both show increases immediately above the sediment. Phosphorus increases are most likely due to reducing conditions releasing adsorped phosphorus from the sediment, while increasing silica concentration are likely due to the accumulation of diatom frustules within the nepheloid layer and subsequent dissolution.
Coal Measures – How Suitable a Proxy to Test the Oligocene – Miocene Total
Submergence Hypothesis?
J. Palmer1, C. Shepherd
1 and D. Mildenhall
2
1Massey University, Palmerston North
2GNS Science, Lower Hutt [email protected]
Definitive ages on the Paleogene Waikato Coal Measures are not achievable with the present palynomorph zonation scheme. Based upon the present zonation, the Waikato Coal Measures near Huntly (Rotowaro Coalfied) are dated Late Eocene (Ak-Ar) and they young southwards. At Whatawhata they are Early Oligocene (Lwh), and at Bennydale (Mangapehi Coalfield)t they are Late Oligocene (Ld-Lw). Integration of palynostratigraphy with nannostratigraphy gives added confidence to the Late Oligocene age for the top of the Waikato Coal Measures at Benneydale. However, these ages are not sufficiently constrained on their own to be a valid test as to whether or not Zealandia completely submerged during the early Miocene.
The age of the Neogene Maryville Coal Measures is largely inferred from the biostratigraphy of the enclosing marine units. New palynostratigraphic ages on samples of Maryville Coal Measures are indicative of the Early Miocene (Pl-Po)
In both coal measure sequences the samples are consistent with deposition in a very near shore marine environment or coastal terrestrial deltaic environment. Few key age diagnostic taxa were found in the samples so the assigned ages are poorly constrained. Individual taxa do not provide the sufficient resolution of time to prove/disprove the total marine inundation hypothesis, but they can still solve this problem. The question arises – could a comparison of the palynological assemblages and their diversity from each of the coal measure sequences provide sufficient information from which to infer whether or not Zealandia completely submerged during the latest Oligocene-early Miocene? It is proposed that the similarity between the taxa present in the
72
Maryville and Waikato coal measures is too great to support the hypothesis of complete submergence of Zealandia. The elimination of all the terrestrial environments, to be followed by a re-emergence of a new landmass, with new taxa indistinguishable in composition and diversity to that which had existed previously is unlikely.
A Geodetic Study of Otago and South Westland
C. Pearson
1, P. Denys
1, R. Norris
2 and M.
Denham1
1Survey Department, University of Otago,
Dunedin, New Zealand 2Dept. of Geology, University of Otago, PO Box
56, Dunedin. New Zealand [email protected]
We present recent GPS derived velocities on a corridor extending across the South Island from Dunedin to Haast, which crosses both the Alpine Fault and the Otago Fault System. This transect is dominated by a series of actively growing north-east trending asymmetric anticlines above buried reverse faults in central Otago.
We have analysed over 10 years of recent satellite based geodetic data for about 35 stations distributed over a broad corridor extending from Haast to Dunedin. This includes the Haast GPS transect that was established in 1995 and resurveyed in 1998 and 2012 and the Central Otago Deformation network which was established in 2004-5 and has been surveyed twice a year since then.
Over most of the profile, the strain rate field is dominated by dextral shear consistent with elastic strain accumulation on the Alpine Fault. However, near the east cost, the strain rates are changes to uniaxial shortening that is consistent with thrust fault activity on the Otago fault system.
Dislocation modelling shows that the GPS data near Haast is consistent with the accommodation of 20-25 mm/yr of strike slip motion on the Alpine Fault. The locking coefficient appears to be near 1. The convergent component of plate motion is accommodated through distributed faulting within the Southern Alps and, to a lesser extent, within Central Otago.
Gas Hydrate Resources: Key Findings from New Zealand’s First Gas Hydrates
Programme
I.A. Pecher1,2
, M. Fohrmann2, A. Plaza
Faverola2, R. Srinivasan Navalpakam
3, D.
Fraser3, A.R. Gorman
3, P. Barnes
4, J.
Mountjoy4, A. Rowden
4, D. Bowden
4, R.
Archer5 and L. Abraham
5
1School of Environment, Univ. of Auckland,
Private Bag 92091, Auckland, New Zealand 2GNS Science, PO Box 30368, Lower Hutt, New
Zealand 3Dept. of Geology, Univ. of Otago, PO Box 56,
Dunedin, New Zealand 4NIWA, Private Bag 14901, Wellington, New
Zealand 5Dept. of Engineering Science, Univ. of
Auckland, Private Bag 92091,Auckland, New Zealand
[email protected] Gas Hydrates Resources (GHR) from 2010-2012 was New Zealand’s first dedicated gas hydrates programme involving scientists at GNS Science, NIWA, the University of Otago, and the University of Auckland. Much of this research has focused on the Hikurangi Margin. We summarise key results from GHR’s research, which include:
Source of gas for hydrate formation: On the southern Hikurangi Margin, some of this gas may originate from the subducted sediment sequence.
Gas hydrate reservoir rocks: In order to delineate high-quality reservoirs, we have developed a framework to assist with constraining the lithology of layers crossing the base of gas hydrate stability based on reflection strength of bottom simulating reflections.
Quantification of gas hydrates: Amplitude-versus-offset and high-resolution velocity analysis allowed us to quantify gas hydrate saturation in a submarine channel.
First production models: Based on seismic reservoir characterisation and gas hydrate quantification, first production models were conducted for this channel.
Seafloor communities: We have conducted initial studies into seafloor communities on the Hikurangi Margin that may be affected by gas hydrate production.
Gas hydrates in other parts of New Zealand’s economic zone: We have found indirect evidence for gas hydrates in the deep-water Northland and Taranaki Basins as well as the Chatham Rise.
73
A longer-term gas hydrates programme (HYD) funded by the Ministry of Business, Innovation, and Employment has now been established. We will present an overview on our future research plans within this programme. Lithic Clasts from the 1886 AD Rotomahana
Pyroclastics: Implications for the Pre-Eruptive Subsurface Geology and Vent
Configuration
A. Pittari1, R. Briggs
1, H. Goddard
1, C. Timm
2
and C. de Ronde2
1Dept. of Earth and Ocean Sciences, University
of Waikato, Private Bag 3105, Hamilton 2Marine Geosciences, GNS Science, PO Box
30-368, Lower Hutt [email protected]
The landscape and geology surrounding the famous siliceous sinter deposits of the Pink and White Terraces was partially excavated and buried as a consequence of the Tarawera eruption on the June 10, 1886. The area is now partially submerged beneath the modern Lake Rotomahana. In 1859, Ferdinand von Hochstetter documented the distribution of rhyolitic and hydrothermally altered rocks, sinter deposits and alluvium in the area. Nairn (1979, N.Z. J. Geol. Geophys. 22, 363-378.) documented the abundance of fresh to hydrothermally altered rhyolitic and tuffaceous lithic clasts, and up to 30% basalt, in the 1886 Rotomahana Pyroclastics around the lake. In this study, 7-9 m thick deposits of the Rotomahana Pyroclastics comprising massive to medium-bedded, poorly sorted, lithic block and lapilli coarse-ash, exposed on the northern and southern lake shores, and within the Waimangu forest to the north, have been described, with particular emphasis on the petrography and geochemistry of the lithic clasts. A diverse range of white, light to dark grey, green, and red to brown rhyolite lavas comprise the dominant lithic type, and vary in phenocryst assemblage, size and proportions, and texture (spherulitic, perlitic, glassy to crystalline). Lithic fragments of ignimbrites and silicified siltstone occur in smaller proportions. Many lithic clasts are variably hydrothermally altered, including pervasive silicification and propylitic and argillic alteration. Massive and banded white, grey, green and mauve siliceous fragments also occur, but cannot be definitely attributed to any surface sinter features exposed at the time of the eruption. The phenocryst assemblages and geochemical characteristics of most of the lithic
clasts do not match those of exposed lakeshore volcanic units or any exposed rhyolite lavas in the Rotomahana and Tarawera area, suggesting that the 1886 eruption conduit-vent system excavated a deep volcanic stratigraphy, derived from early and older Okataina rhyolitic volcanism.
New Zealand Mine Drainage Geochemistry
J. Pope1
1CRL Energy, 97 Nazareth Ave, Christchurch,
New Zealand [email protected]
The chemical composition of mine drainage in New Zealand is predictable based on geochemical analysis of host rocks and broad geological correlations. Our two commonly mined bituminous coal measures produce starkly different mine drainages. Mine drainages sourced in Brunner Coal Measures are ubiquitously acidic, those from Paparoa Coal Measures are neutral. The mine drainages from our mesothermal gold deposits are mostly weakly acidic to neutral with elevated As +- Sb. Our epithermal gold deposits, sub-bituminous coal deposits and lignite deposits all have predictable aspects of their mine drainage chemistry. In general the predictable aspects of mine drainage chemistry can be related back to depositional, diagenetic, metamorphic or hydrothermal processes.
The challenge for mine drainage geochemistry lies in predicting changes in the concentrations of acid and trace elements in mine drainage with time. The purpose of these studies is to identify treatment or management options required at some point in the future. Predictions for changes in mine drainage chemistry with time can be made on a strictly chemical basis, however, integration of environmental conditions and the effectiveness of management options on the chemistry of our mine drainages is more difficult. Present research focusses on determining the acid and trace element concentrations in mine drainages using a combination of laboratory based long term kinetic testing, field trials and monitoring of mining infrastructure.
This study draws on site specific laboratory studies conducted by industry, information from regional research projects and data from large scale field trials that are underway at mine sites in New Zealand. This study is an update the predictability of changes in New Zealand mine drainage chemistry with
74
time and identifies opportunities for future research.
On Shaky Ground: Caldera Unrest in New Zealand
S.H. Potter
1,2, G.E. Jolly
1, D.M. Johnston
2,3
and V.E. Neall4
1GNS Science, Private Bag 2000, Taupo, New
Zealand 2Joint Centre for Disaster Research, Massey University, PO Box 756, Wellington, New
Zealand 3GNS Science, PO Box 30-368, Lower Hutt,
New Zealand 4Institute of Natural Resources, Massey
University, Private Bag 11 222, Palmerston North
New Zealand has eleven large, collapsed caldera volcanoes, eight of which are in the Taupo Volcanic Zone. Prior to eruptions, these volcanoes exhibit signs of unrest which may include damaging earthquakes, metres of ground deformation and explosive hydrothermal eruptions. Episodes of unrest usually occur without resulting in an eruption, causing high levels of uncertainty amongst the scientists, local authorities and the public in responding to these events. While eruptions are generally few and far between, episodes of calderas unrest occur much more frequently.
Recent research on historical episodes of heightened activity at Taupo Caldera has identified nearly 100 episodes in the past 140 years. This includes episodes of caldera unrest in 1895, 1922, 1964-5 and 1983, as previously identified in the literature, which are at the higher end of the scale in unrest intensity. Two further periods of activity at a similar scale have been identified in 1897 and 1974. Many others occurred at a lower intensity, including in 1996-9 and 2008. These newly recognised episodes of heightened activity include reports of increased hydrothermal activity, frequent and damaging seismicity, potential volcanic tremor, abrupt lake level changes and surface waves, and lake water becoming warm and sulphurous. Social effects reported included public alarm and impacts on tourism and both national and local economies. A multi-parameter unrest catalogue has been created for Taupo Caldera based on historical media articles, local and scientific literature and, more recently, monitoring by GeoNet.
Caldera unrest management is a challenging and relatively underdeveloped field combining volcanology and emergency management. Bridging the gap between scientists and decision-making officials for effective unrest management becomes a vital issue potentially affecting lives, property, infrastructure and the economy. The Caldera Advisory Group, a multi-agency strategic planning group has been created to help prepare for the next caldera unrest episode in New Zealand.
Paleochemotaxonomic Investigation of Tertiary Fossil Resins from Southern New Zealand by Gas Chromatography - Mass
Spectrometry: Preliminary Results
N.G. Powell1, D.E. Lee
2, and U. Kaulfuss
2
1Forensic & Industrial Science Ltd, PO Box 20103, Glen Eden, Auckland 0641, New
Zealand 2Department of Geology, University of Otago,
PO Box 56, Dunedin 9054, New Zealand [email protected]
Amber and other fossil resins are widely distributed in the geological record. The chemistry of such materials can be investigated by instrumental analysis for comparative purposes and to shed light on their botanical origins. However, modern resins contain volatile and labile compounds that are susceptible to loss or reconstitution under geological conditions, and the botanical origin of a diagenetically-modified resin cannot be established by simple comparison with a putative modern analogue. Fossil resin material is known from several southern New Zealand paralic and non-marine units, including the Oligocene Pomahaka and Chatton formations, the late Oligocene–early Miocene Gore Lignite Measures, and the Miocene Manuherikia Group. We have investigated eight resin specimens from five Oligocene and Miocene localities in Otago and Southland by gas chromatography – mass spectrometry (GC-MS). Most resins investigated have undergone minor diagenetic change, with several labile and volatile compounds preserved. Preliminary analytical investigation shows abietic acid and dehydroabietic acid are present in all specimens investigated, which together with other aspects of their chemistry suggests an Araucariacean origin. Extant Araucariacean genera (Wollemia, Araucaria and Agathis) are prodigious resin producers but their resins differ only slightly in
75
the chemistry of their major constituents. Current paleochemotaxonomic methodology does not allow fossil resins to be linked to a particular genus and is hence of limited taxonomic utility. We are exploring possible analytical routes that might improve the specificity of paleochemotaxonomic methods for fossil resins. We are investigating the chemistry of modern Araucariacean resins by GC-MS with a view to identifying stabile taxon-specific biomarker compounds in Wollemia, Agathis and Araucaria which if identified in fossil resins could reveal their botanical origin. Elucidation of synthetic routes responsible for generating geoterpenoids in fossil resins from corresponding bioterpenoid precursors might enable us to ascertain taxonomic affinities of the resin-producing plants in the New Zealand fossil record.
Holocene and Modern Dinoflagellate Cyst Flux in Subtropical and Subantarctic Waters,
Southwest Pacific Ocean
J. Prebble1,2
, E.M. Crouch2, L. Carter
1, G.
Cortese2, S. Nodder
3
1Antarctic Research Centre, Victoria University
of Wellington, P.O. Box 600, Wellington 2GNS Science, PO Box 30368, Lower Hutt 5040,
New Zealand 3National Institute of Water and Atmospheric
Research (NIWA), Private Bag 14901, Wellington
[email protected] A three year (2005-2008) record of dinoflagellate cyst (dinocyst) flux is derived from two time-incremental sediment traps deployed at 1500 m water depth in two biogeochemically distinct water masses to the east of New Zealand: (i) subtropical and (ii) subantarctic waters. Dinocyst compositions in core-top sediments from the vicinity of the trap moorings are compared with these modern fluxes to evaluate biases inherent in using dinocysts as palaeoceanographic environmental proxies.
Trap assemblages are dominated by peridinoid cysts, notably Brigantedinium spp, which comprise almost ~98% of the cyst flux. Nineteen dinocyst taxa or taxonomic groups were identified from the trap samples. The seasonality of dinocyst flux differs between the traps, with a pronounced spring flux coincident with peak productivity in the northern subtropical trap, while annual variation in the southern subantarctic trap is relatively muted.
A notable discrepancy between dinocyst flux and cyst assemblages of nearby sea-floor sediments is observed. Dinocysts susceptible to degradation in oxygenated sediments are highly under-represented in the sea-floor assemblages. In contrast, cysts that are relatively resistant to oxidation are over 30 times more abundant in sea-floor sediments than would be expected from the three years of flux measurements. The most likely explanation for the under-representation of the less resistant cyst types in sea-floor sediments is oxidation in the sediment. The reason for over-representation of resistant cysts in the sediment is less clear. Two likely possibilities are considered, transport in bottom currents from near-shore waters, or the restriction of cyst formation to optimal years not sampled by our trap record.
These discrepancies do not prevent use of core top dinocyst assemblages from this region as training sets for quantitative interpretation of palaeo records, but do suggest mean-annual rather than seasonal climatologies are more appropriate for deep ocean dinocyst-based quantitative palaeoenvironmental reconstructions in the New Zealand region. Conveying Geological Map Information with
New Technology
M.S. Rattenbury
GNS Science, PO Box 30368, Lower Hutt, New Zealand
[email protected] Innovative new technology is being applied to the acquisition, upkeep and delivery of geological map information. Traditional printed paper geological maps portraying surface geology are now supported by sophisticated underlying digital GIS-based datasets. These GIS datasets are increasingly conforming to the international GeoSciML geology data model and exchange format and are adopting global nomenclatural standards (vocabularies) for rock names, stratigraphic age, fault and fold characteristics amongst many others. These international standards bring specific meaning, rich detail and multi-lingual capabilities to geoscience data organisation.
Much of New Zealand’s geological map data are now available through GNS Science-hosted web map services and some of their layers are accessible through the OneGeology web portal http://portal.onegeology.org. The recently completed QMAP series of 21 geological maps and their digital seamless GIS
76
equivalent dataset, incorporating local updates and structural refinements, are being served as a series of layers. The WMS provides imaged geological map data layers of selected areas and themes in real time with fast broadband. The services can be viewed and interrogated (consumed) by many GIS and other map software packages. The services can be integrated with others delivered by other agencies e.g. topographic and hydrological, as part of what is developing into New Zealand’s national spatial data infrastructure (SDI).
Building and delivering geological map information in 3D is another maturing technological capability that has considerable potential for conveying geological understanding. Some of the challenges include overcoming hardware and software limitations, rendering geological complexity, measuring uncertainty, and conveying the information in useful formats. Completed or well-advanced 3D geological maps of Wellington CBD, Hutt Valley and Christchurch are the basis for derived 3D geotechnical models to support decisions around development and asset protection. Interpretation of airborne geophysical data is a critical part of 3D geological mapping, particularly of mineral provinces and other resource areas.
Calculating Sedimentation Rates from the Growth of Colonial Invertebrates
C.M. Reid
Department of Geological Sciences, University of Canterbury, Private Bag 4800, Christchurch.
Bryozoans are colonial marine invertebrates with a geological history spanning the Ordovician to Recent. The live span of individual colonies is variable, as is the total size attained, and in most instances they live in low turbidity settings so as to avoid clogging of the feeding structures. The upright rigid nature of colonies does mean however that sediment may be able to accumulate around the colony and that provided the growing colony tips are clear of the sediment interface the colony can continue to grow and be supported by the surrounding sediment. Spectacular examples of this are shown by the erect foliose forms found in Permian glaciomarine carbonates of Maria Island, Tasmania. Here foliose colonies of Stenopora tasmaniensis are regularly of 75cm diameter with several examples over 100cm in colony diameter and up to 80 cm in height.
Study of skeletal morphology is underway to determine whether we can define annual growth cycles in Palaeozoic bryozoans and therefore determine the life-span of individual colonies. Outcomes of this include 1) estimation of annual carbonate production and 2) calculation of sedimentation rates. Preliminary results show that Permian branching forms precipitate calcium carbonate at rates comparable to modern forms in Antarctica. This suggests colony size has been achieved by long lifespans in keeping with cold-water environments typically having low benthic invertebrate settlement rates and reduced competition for space allowing successful settlers to achieve larger size over a longer life. These large foliose forms are in life position and offer an opportunity to determine sedimentation rates in glaciomarine settings. Preliminary findings are highlighting both very low and very high sediment accumulation rates over short time frames that are linked to terrigenous sediment supply rates.
Structural and Tectonic Evolution of the Southern Taranaki Basin, New Zealand, since
the Late Cretaceous
C. Reilly1,2
, A. Nicol1, J. Walsh
2
1GNS Science, 1 Fairway Drive, Avalon, Lower
Hutt 5011 2Fault Analysis Group, University College Dublin,
Ireland [email protected]
The Southern Taranaki Basin, located between Taranaki Peninsula and northern South Island, contains sedimentary rocks up to 8km thick that record multiple phases of faulting and folding since ~80Ma. The deformation history provides constraints on New Zealand plate boundary development. It has been examined using 2D and 3D seismic reflection lines to generate fault displacement-time curves and basin-wide isopach maps. Up to 16 seismic reflectors tied to 35 wells have been mapped within the basin, producing a temporal resolution of 1-5Ma since ~22Ma and 5-10Ma prior to the Miocene. Three main phases of tectonic activity have been recognised; Late Cretaceous and Early Palaeogene extension (~80-55Ma), Oligocene and younger contraction and Plio-Pleistocene (~4-0Ma) extension. Most of the largest faults (e.g., Cape Egmont fault) accrued displacement during the Late Cretaceous and were reactivated one or more times during subsequent episodes of deformation. The oldest phase of extension
77
occurred during Gondwana breakup and was ubiquitous throughout the basin. Later contraction may have commenced on the largest faults along the eastern margin of the basin (i.e. Taranaki and Manaia faults) synchronous with the onset of subduction no later than Early Oligocene. Contraction occurred throughout the basin during the Miocene and was episodic on many structures, with Latest Miocene (~8-5 Ma) reverse faults and folds being particularly widespread. This period of accelerated shortening has been observed throughout the Hikurangi subduction margin and could have been triggered by changes in the boundary conditions (e.g., adjustments in the trend and magnitude of the plate motion vector). Plio-Pleistocene extension migrated from the northern Taranaki Basin and was accompanied by southward migration of contraction which is now mainly confined to the northern South Island. This migration could have been due to steepening of the subducting plate and/or to southward movement of the southern termination of the Hikurangi subduction system.
Subducting an Old Subduction Zone Sideways Provides Insights into what
Controls Plate Coupling
M. Reyners1, D. Eberhart-Phillips
1,2 and S.
Bannister1
1GNS Science, PO Box 30368, Lower Hutt, New
Zealand 2Dept. of Geology, University of California Davis,
Davis, CA 95616, USA [email protected]
The Hikurangi Plateau has been subducted beneath New Zealand twice – firstly at ca. 100 Ma during north-south convergence with Gondwana, and currently during east-west convergence between the Pacific and Australian plates. As a result of this ninety degree change in convergence direction, we are now subducting an old subduction zone sideways, and the tectonic history of the subducted plate varies dramatically along the strike of the Hikurangi Margin. In the central South Island, the Hikurangi Plateau is subducting for a second time. Given that the plateau there would have been largely dehydrated during Gondwana subduction, the pore fluid pressure ratio in the currently subducting plateau will be low, facilitating the continental collision and uplift of the Southern Alps we see in this region. Here the plateau is capped by greywackes and schist, the lower structural levels of the exhumed Gondwana
forearc (marked by the Chatham Rise offshore). This structure provides an explanation for the unusual features of the continuing, destructive Canterbury earthquake sequence. In the southern North Island, the incoming plateau is capped by Late Cretaceous – Early Oligocene chalks and mudstones deposited along the northern flank of the Chatham Rise, and overlying Plio-Pleistocene sediments. Still further north in the Raukumara Peninsula region, the rough topography of the Hikurangi Plateau is being subducted for the first time. The changing tectonic history of the plateau at shallow depth along the strike of the margin is mirrored in the changing distribution of intraslab seismicity, and changes in the nature of the plate interface region revealed by seismic tomography. It is likely that the changing nature of the rocks at the plate interface along strike provides first-order control on the current distributions of both plate coupling and slow slip events.
Oligo-Miocene, Mixed Carbonate-Clastic Sedimentation Along a Submarine Fault Scarp, Nile Group, North Westland, New
Zealand
N. Riordan1, C. Reid
1 and K. Bassett
1
1Dept. of Geological Sciences, University of
Canterbury, Christchurch [email protected]
Oligo-Miocene strata (Nile Group) along the Kongahu Coast in North Westland are complex and reflect mixed carbonate-clastic sedimentation proximal to an active submarine fault-scarp. The fault active phase is reflected in a mixed clastic carbonate facies association characterized by flysch-like, clastic sediments alternating between matrix-supported granitic and gneissic debris flows and micaceous marls, and the fault inactive phase in a platform facies association consisting of carbonate-rich lithologies alternating between argillaceous and bioclastic wackestone and packstone.
The fault active facies include micaceous marls as background basinal sedimentation, punctuated by scarp-derived mass-flow deposits. The oldest, scarp-derived lithologies are strikingly immature (e.g. basal breccia) and trend upwards into more mature, carbonate-rich facies. This trend is less apparent in the marls, nevertheless a notable decrease in clastic content was observed. We interpret this lithostratigraphic pattern as a function of an increasingly distal, less productive clastic sediment source, which in this case is the fault
78
itself. Progressive basin fill shifts a particular site of deposition away from the exposed, actively eroding scarp. This movement may only amount to 100’s of metres, a negligible change in many marine environments, however, as this study shows, adjacent to an active fault scarp, this distance can be sufficient for significant compositional and textural change.
In contrast to the tectonically-controlled style of sedimentation characteristic of the mixed clastic-carbonate facies association, the younger lithologies of the platform facies association are alternating, decimetre-scale beds of micritic and bioclastic, temperate limestone and more closely resemble deposition governed by sea level. Furthermore, the compositional shift from clastic to carbonate-dominated sedimentation is interpreted as a product of inactivity along the fault scarp and/or burial of the scarp due to rates of sedimentation exceeding rates of subsidence. Thus, the transition between these two units represents a switch from tectonically- to eustatically-controlled sedimentation.
Aeromagnetic and Gravity Interpretation in the Franklin Area
D.J. Robertson
1, P. Vidanovich
2, S.K.
Zoellner1, J.B. Meyers
3 and J. Wood
3
1Physics Department, University of Auckland,
PO Box 92019, Auckland 1142 2PV Consulting Ltd., [email protected], 5/3
Parliament St, Auckland Central, 1010 3 Resource Potentials Pty Ltd,
[email protected], PO Box 167, WA 6865, Australia
Recently released high resolution aeromagnetic data covering (inter alia) the Franklin area, flown by Sinosteel Australia in 2007, will be discussed. It contains signatures of a number of well-known geological features and some new ones that were completely unsuspected. In some cases, modelling of the magnetic data has been possible and is supported by gravity work and palaeomagnetic data from volcanic rocks. These include: (a) the Franklin-Bombay Basalt field, which incorporates both normally and reversely magnetised extrusive centres and lava flows, and has curiously abrupt E-W boundaries to the north and south; (b) the source body for the Junction Magnetic Anomaly (JMA) which runs generally N-S through New Zealand; (c) a lineation evident both in topography and aeromagnetic images, trending NNW-SSE through Mauku; (d) a lineation between Waipipi
and Onewhero, comprising nine igneous intrusive pipes (some normally and others reversely magnetised), which define a remarkably straight line, bearing 305°; (e) large channel deposits of the Waikato River; and specifically (f) ox-bow palaeochannels of the Waikato River observed e.g. at Rangiriri; (g) magnetic striations picking out horizons within the Kawhia Syncline at Port Waikato; (h) a suite of arcuate magnetic anomalies centred about 3km north of Clarks Beach, possibly due to a buried Miocene volcanic centre; (i) numerous faults, including a pervasive fault suite striking ca. 048°, one of which is downthrown to the south at Limestone Downs; (j) a shallow lineament striking at 340°, appearing to extend the Kaimango Syncline axis across the Waikato river for at least 20km; and (k) very strong magnetic anomalies characteristic of shallow, aeolian ironsand deposits. Geological mapping of the Franklin-Bombay basalts is largely congruent with magnetically based mapping of the same formation, but the aeromagnetic images show much more detail in terms of extrusive centres, lava flow geometry and buried volcanic deposits.
Dealing with Multiple Vent Eruptions in Developing Volcanic Event Records for
Distributed Volcanic Fields; Harrat Rahat, Saudi Arabia
M.G. Runge
1, J.M.Lindsay
1, M. Bebbington
2,
S.J. Cronin2 and T. Mokhtar
3
1School of Environment, University of Auckland,
Private Bag 92019, Auckland 2Institute of Natural Resources, Massey
University, Private Bag 11222, Palmerston North 3Fac. of Earth Sci., King Abdulaziz University,
P.O. Box 80200, Jeddah, 21589, Saudi Arabia [email protected]
The monogenetic volcanic field of Harrat Rahat in Saudi Arabia is a highly complex volcanic system with 1000+ volcanic cone or crater landforms distributed over 20,000 km
2 and with
evidence of volcanic activity spanning from >10 Ma to eruptions in 641AD and 1256AD. This record, and a possible recent stalled eruption in 1999, drives a need to quantify the likelihood and hazard of future eruptions. This has stimulated research about the controlling subsurface processes essential for estimating eruption frequency, magnitude and style of distributed basaltic-trachytic volcanism, as well as the probable location of a future event.
79
Temporal and spatial clustering of vents within volcanic fields is common, on a variety of scales as seen by chains of cones/craters, overlapping cones and/or closely clustered structures. Despite this being widely recognised, in the absence of detailed site-by-site mapping few have attempted to disentangle multiple-vent eruptions to develop a field-wide volcanic event/episode record. Particularly in rifting or extensional environments, magma reaches the surface in a dyke form that may erupt through multiple vents within a brief period (hours to months). Such vents should be considered, for hazard purposes, as a single eruption episode or eruptive event. This will avoid overestimation and/or bias of the hazard and allow for better modelling of the style and size of the event, and hence the consequent risk.
Determination of eruptive events within Harrat Rahat is approached using a variety of techniques including; isotropic and anisotropic kernels, a Bayesian approach incorporating multiple data sets as likelihood distributions, volume to event estimations, and a sample to population method incorporating an expectation-maximisation algorithm.
Terrestrial Vegetation and Climate Reconstruction for Warm to Super-Warm
Interglacial Stages 1, 5e and 11, from Marine Sediment Cores, South Island, New Zealand
M.T. Ryan1, 2
, R.M. Newnham1, M.J.
Vandergoes3, G.B. Dunbar
2, H.L. Neil
4,
H. Bostock4, B.V. Alloway
1
1 School of Geography, Environment and Earth
Sciences, VUW. 2 Antarctic Research Centre, VUW.
3 GNS Science, 1 Fairway Drive, Avalon, Lower
Hutt. 4 National Institute of Water and Atmospheric Research, Private Bag 14-901, Wellington.
There is considerable interest in using past analogues to provide insight into vegetation response to climate warming. However, beyond the last glacial-interglacial cycle, little is known about how mid-latitude Southern Hemisphere (MLSH) terrestrial vegetation responded to climatic forcing during the Quaternary. Previous terrestrial palynological records of MLSH interglacial periods are often fragmentary and poorly dated. These problems can be circumvented by extracting terrestrial palynomorphs from marine sediments. Here, we present palynological data at <2 ka resolution
through Marine Isotope Stages (MIS) 1, 5e and 11 from two giant piston cores (MD06-2990 and 2991) collected from the eastern Tasman Sea (943 and 886 mbsl, respectively). The core locations are situated as far as ~100 km west of New Zealand’s South Island on the north levee bank of the submarine Hokitika canyon where sediment is accumulating between 2.8 and 7 cm/kyr. Chronological control is provided by matching the benthic foraminifera δ
18O record
from each core with the global benthic isotope stack of LR04 (Lisiecki and Raymo, 2005) and from tephra analysis, enabling the relative timing of terrestrial pollen events to be compared with the history of sea surface temperature (SST), global ice volume and insolation.
SST estimates from assemblages of planktonic foraminifera from the same submarine canyon setting show both MIS 5e and MIS 11 were interglacials of similar warmth (Hayward et al., 2011), up to ~3° C warmer than the present MIS 1 interglacial. The composition and relative abundance of tall tree pollen taxa for the three interglacial periods discussed will be evaluated to determine the extent this warmth is reflected in the adjacent maritime terrestrial environment.
Foraminiferal-Based Sea-Surface Temperatures and History of the Subtropical
Front Passing around the South of New Zealand during MIS2-1
Ashwaq T. Sabaa
1, Bruce W. Hayward
1 and
Helen M. Bostock2
1Geomarine Research, 49 Swainston Rd, St
Johns, Auckland 2NIWA, Private Bag 14901, Wellington
[email protected] Sea-surface temperatures (SST) during MIS2-1 are estimated using modern analogue technique based on planktic foraminiferal census counts (71 samples) in four cores off southern New Zealand. Estimated SSTs during MIS2 in all four sites were 6-7º C (2-5º C cooler than today). In MIS1 SSTs warmed to: 8-10º C east of Stewart Island (TAN1106-89) beneath the eastern margin of the present Subtropical Front (STF); 8-11º C west of Auckland Islands (TAN1106-43) south of the present STF; and 9-12º C west of Stewart Island in Solander Trough (TAN0803-09, TAN1106-28), beneath and north of the present STF. An early Holocene warm period is recognisable in most sites. When combined with two indices for surface water masses (Neogloboquadrina incompta/N. pachyderma ratio; % N. pachyderma + Globigerina bulloides)
80
we infer that little or no STW (nor STF) flowed around the south of New Zealand during the cooler periods of MIS2, but returned during the early part of the deglaciation. Estimated SSTs warmed several thousand years earlier than planktic oxygen isotope records of the deglaciation at the head of Solander Trough (TAN0803-09). The main deglaciation SST warming began ~18 ka and was largely complete by 16.5 ka, and probably records the restart of the STF, with its warm subtropical water component, flowing south around New Zealand at this time. Here the bulk of the SST warming leads the isotope signal of ice melting by ~5 kyr, a similar pattern to that recorded from the Bounty Trough using Mg/Ca paleothermometry.
Dissolution was stronger during MIS2 at all sites. Planktic foraminiferal abundance was greater in MIS1 than MIS2, particularly in the two sites near the head of Solander Trough. Grain size and percent calcium carbonate were also highest during MIS1 and suggest that terrigeneous sediment supply into the basin was far greater during the lower sea levels of MIS2.
Analogue Modelling of Surface Ruptures along Strike-Slip Faults: Implications for
Greendale Fault Mechanics and Paleoseismology
P. Sasnett
1, M. Quigley
1, A.R. Cruden
2, D.
Boutelier2 and P. Villamor
3
1Department of Geological Sciences, University of Canterbury, Private Bag 4800, Christchurch
2School of Geosciences, Monash University,
Melbourne, Victoria 3800, Australia 3GNS Science, Lower Hutt 5040, New Zealand
Analogue modelling of strike-slip surface ruptures provides insight into the development and behaviour of faults through several earthquake cycles, with relevance for understanding how information recorded in paleoseismologic trenches relates to the earthquake behaviour of active faults. The well-exposed and well-documented 2010 Greendale Fault surface rupture, resulting from the Darfield earthquake in Canterbury, New Zealand, is being analysed as a case study of this type of system. We are investigating the patterns of surface deformation in analogue experiments using cohesive and non-cohesive granular materials above linear and stepped strike-slip basement faults. The surface of the experiments is monitored by 3D PIV (particle image
velocimetry) and 2D time lapse photography. Preliminary analysis is focused on the geometry of step-overs and associated pop-up structures, and on how these features develop as a fault zone matures. We are also looking at patterns of fracture reactivation from earthquake to earthquake, and considering how each event will be recorded in the geologic record. This will help constrain locations for paleoseismological trenches that will more effectively reveal paleo-ruptures.
Mantle Heterogeneity Beneath Central-Southern Zealandia, and Association with
Plate Boundary Development
J. Scott
Dept. of Geology, University of Otago, PO Box 56, Dunedin, New Zealand [email protected]
Plate boundary reconstructions and plate rotation models demonstrate that the central portion of the Australia-Pacific plate boundary, the Alpine Fault, cuts across pre-existing crustal discontinuities. Intriguing new insights into early plate boundary evolution are preserved in Miocene mantle peridotite xenoliths erupted across southern Zealandia. Petrological data (modal calculations, olivine XMg, spinel XCr, clinopyroxene Yb, etc) reveal that an extensive (>100 km long) melt-depleted upper mantle domain, geochemically decoupled from the overlying quartzofeldspathic Rakaia Terrane crust and strikingly distinct from the adjacent fertile East Otago upper mantle, underlay West Otago (Southern Alps) at precisely the time at which the adjacent plate boundary was propagating through Zealandia (23 Ma). The West Otago peridotites are LREE-enriched and strongly deformed. Olivine flow law and grain size measurements suggest that, for the calculated temperatures, annealing should have taken place in the West Otago upper mantle unless deformation was taking place at/close to the time of xenolith entrainment. P-wave calculations on the West Otago suite show this deformed domain was seismically faster than adjacent East Otago upper mantle. 1) there was a major compositional difference in upper mantle composition beneath Zealandia in the Miocene; 2) the Pacific-Australian plate boundary probably propagated through (or perhaps along?) a melt depleted upper mantle; and 3) a degree of mantle anisotropy existed beneath the Southern Alps well before the development of a lithospheric root (< 7 Ma).
81
Stratification of Miocene Mantle on the Flank of the Emerald Basin in Southern Zealandia
J. Scott
Dept. of Geology, University of Otago, PO Box 56, Dunedin, New Zealand [email protected]
Rifting of tectonic plates perturbs the lithospheric mantle. Thinning of the continental and oceanic crust causes asthensopheric mantle to rise, decompress and melt. Interaction between decompressed asthenosphere with shallow mantle is a prime site for melt-rock reactions, and density changes by melt extraction or melt addition can alter the lithospheric mantle buoyancy and affect the ability to support high topography and stabilise continental crust. The peridotite mantle beneath the Auckland Islands, on the eastern flank of the Emerald Basin south of New Zealand mainland, was tapped by alkaline volcanism in the Miocene. Peridotite xenoliths show that the upper mantle (spinel facies) was stratified, with a cooler and melt depleted upper mantle domain – probably related to melt extraction in the Cretaceous or older – underlain by a hot deeper mantle that contains garnet breakdown textures and extensive metasomatic re-equilibration. A steep geothermal gradient existed within the spinel facies at the time of xenolith entrainment (at least 300
oC from top to base, < ~ 40 km).
Variations in Auckland Island peridotite temperatures, textures, and chemistry could be a result of the interaction of the sub-continental lithospheric mantle with upwelling of asthenospheric mantle and low-degree partial melts during Eocene-Oligocene extension in the Emerald Basin. In any case, the Auckland Islands xenolith suite demonstrates that the upper mantle Zealandia was, in places, vertically chemically heterogeneous and that a rough mantle stratigraphy can be established.
Geometry and Kinematics of the Taupo Rift
H. Seebeck1,2
, A. Nicol1, J. Ristau
1, J.
Pettinga2 and P. Villamor
1
1GNS Science, PO Box 30368, Lower Hutt, New
Zealand 2Dept. of Geol. Sciences, University of
Canterbury, Private Bag 4800, Christchurch [email protected]
The kinematics of the continental intra-arc Taupo Rift has been investigated mainly using a large catalogue of new and published focal
mechanisms (N=186) and geological fault-slip (N=73) data. The average extension direction is approximately orthogonal to the average trend of the rift and its constituent faults (α=76-84°). In detail the strike of normal faults and trend of the extension direction swing clockwise in unison by up 20° northwards along the rift, suggesting a relationship between fault orientation and extension direction. In the southern rift normal faults are parallel to, and probably reactivate, Mesozoic basement fabric (e.g., faults and bedding). By contrast, in the northern rift faults diverge from basement fabric by up to 55° and may have formed since rift initiation 1-2 Ma ago. Here, focal mechanisms indicate oblique to right lateral strike slip along basement fabric and dip slip on newly formed rift faults. A small amount of right-lateral strike slip is also common on faults throughout the rift, accommodating a minor amount (<1.5 mm/yr) of the total margin-parallel plate motion. Crustal-scale normal faults that border the eastern rift margin are sub-parallel to the strike of the slab and located along the crest of the mantle wedge. These relationships suggest that the underlying subducting plate provides a first-order control on the location and geometry of faulting. The kinematics of rift faults are generally compatible with slab-rollback/steepening and continental collision at the southern termination of subduction associated with vertical-axis rotations of the eastern North Island.
Computational Modelling of Seismic Anisotropy due to Stress in the Crust at
Mount Asama, Japan
A. Shelley1, M. Savage
1, C. Williams
2, Y.
Aoki3, B. Gurevich
4, O. Collet
4
1Victoria University of Wellington
2GNS Science, Avalon, New Zealand
3Earthquake Research Institute, University of
Tokyo 4Curtin University and CSIRO
[email protected] Using shear wave splitting to examine stress changes in the crust has been proposed as a way to monitor volcanic activity and predict eruptions. We have created a forward model to investigate the proposed link between processes that alter the state of stress in the crust and seismic anisotropy. With it we expect to analyze the effect of crustal stress on surface shear wave-splitting measurements. A finite element method is used to create a stress model through which ray paths are traced. We use the 3D
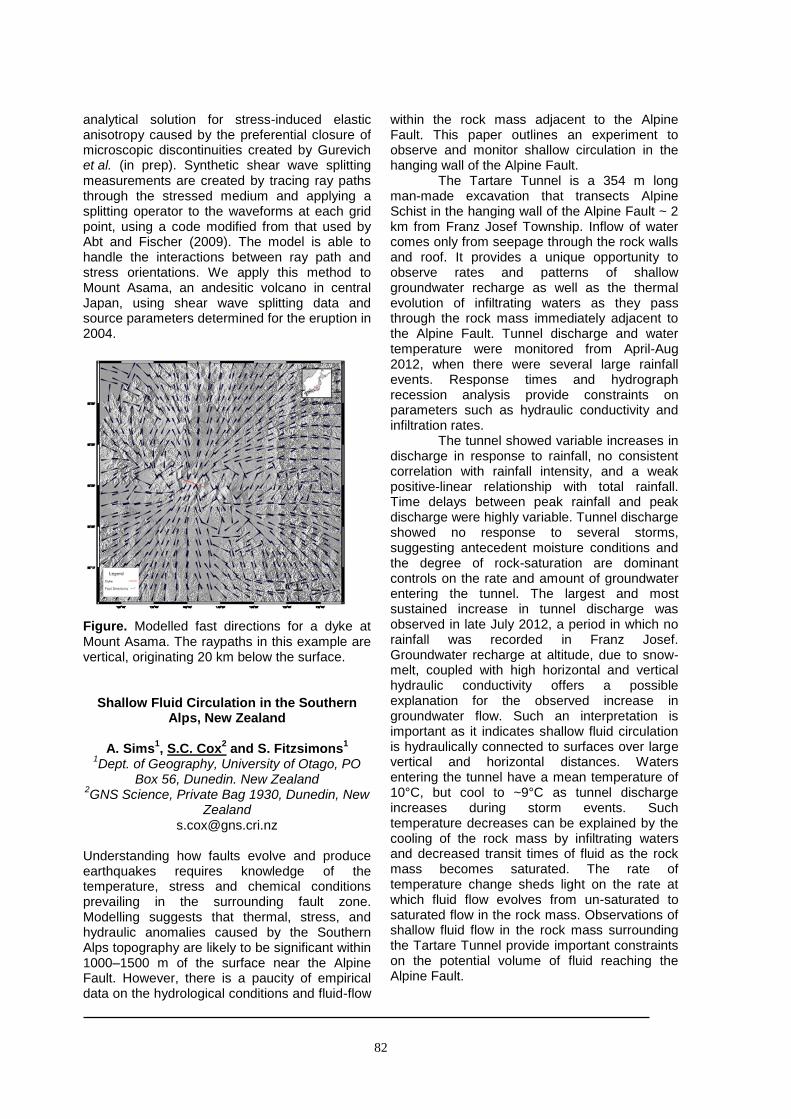
82
analytical solution for stress-induced elastic anisotropy caused by the preferential closure of microscopic discontinuities created by Gurevich et al. (in prep). Synthetic shear wave splitting measurements are created by tracing ray paths through the stressed medium and applying a splitting operator to the waveforms at each grid point, using a code modified from that used by Abt and Fischer (2009). The model is able to handle the interactions between ray path and stress orientations. We apply this method to Mount Asama, an andesitic volcano in central Japan, using shear wave splitting data and source parameters determined for the eruption in 2004.
Figure. Modelled fast directions for a dyke at Mount Asama. The raypaths in this example are vertical, originating 20 km below the surface.
Shallow Fluid Circulation in the Southern Alps, New Zealand
A. Sims1, S.C. Cox
2 and S. Fitzsimons
1
1Dept. of Geography, University of Otago, PO
Box 56, Dunedin. New Zealand 2GNS Science, Private Bag 1930, Dunedin, New
Zealand [email protected]
Understanding how faults evolve and produce earthquakes requires knowledge of the temperature, stress and chemical conditions prevailing in the surrounding fault zone. Modelling suggests that thermal, stress, and hydraulic anomalies caused by the Southern Alps topography are likely to be significant within 1000–1500 m of the surface near the Alpine Fault. However, there is a paucity of empirical data on the hydrological conditions and fluid-flow
within the rock mass adjacent to the Alpine Fault. This paper outlines an experiment to observe and monitor shallow circulation in the hanging wall of the Alpine Fault.
The Tartare Tunnel is a 354 m long man-made excavation that transects Alpine Schist in the hanging wall of the Alpine Fault ~ 2 km from Franz Josef Township. Inflow of water comes only from seepage through the rock walls and roof. It provides a unique opportunity to observe rates and patterns of shallow groundwater recharge as well as the thermal evolution of infiltrating waters as they pass through the rock mass immediately adjacent to the Alpine Fault. Tunnel discharge and water temperature were monitored from April-Aug 2012, when there were several large rainfall events. Response times and hydrograph recession analysis provide constraints on parameters such as hydraulic conductivity and infiltration rates.
The tunnel showed variable increases in discharge in response to rainfall, no consistent correlation with rainfall intensity, and a weak positive-linear relationship with total rainfall. Time delays between peak rainfall and peak discharge were highly variable. Tunnel discharge showed no response to several storms, suggesting antecedent moisture conditions and the degree of rock-saturation are dominant controls on the rate and amount of groundwater entering the tunnel. The largest and most sustained increase in tunnel discharge was observed in late July 2012, a period in which no rainfall was recorded in Franz Josef. Groundwater recharge at altitude, due to snow-melt, coupled with high horizontal and vertical hydraulic conductivity offers a possible explanation for the observed increase in groundwater flow. Such an interpretation is important as it indicates shallow fluid circulation is hydraulically connected to surfaces over large vertical and horizontal distances. Waters entering the tunnel have a mean temperature of 10°C, but cool to ~9°C as tunnel discharge increases during storm events. Such temperature decreases can be explained by the cooling of the rock mass by infiltrating waters and decreased transit times of fluid as the rock mass becomes saturated. The rate of temperature change sheds light on the rate at which fluid flow evolves from un-saturated to saturated flow in the rock mass. Observations of shallow fluid flow in the rock mass surrounding the Tartare Tunnel provide important constraints on the potential volume of fluid reaching the Alpine Fault.
83
Paleovolcanology of the Late Miocene-Early Pliocene Mercury Basalts, Coromandel
Volcanic Zone (CVZ)
D. Skinner GNS Science, PO Box 30-368, Lower Hutt 5040
Charles Heaphy in Hochstetter (1864) was the first to recognise basaltic rocks in the CVZ. Basaltic rocks (Mercury Basalts) erupted during the Late Miocene and Early Pliocene within, but trending mostly perpendicular to, the NNW-trending, andesitic-dacitic-rhyolitic, Neogene CVZ of northern New Zealand. K/Ar dating defines two broad periods of activity at c. 9 to 8 Ma and c. 6 to 3.8 Ma, each period corresponding to major eruptions of caldera-associated rhyolites and ignimbrites.
The older group erupted on northern Great Mercury Island and along the ENE-trending Kuaotunu Peninsula as stacked lava flows with interlayered breccias and tuffs, some of which include sanidine-bearing rhyolitic material. Other features are relict scoria spatter mounds, agglomerate-filled rifts, dike swarms, a composite lava dome, rarely pillow lavas, and plugs with doleritic to microgabbroic textures. The rocks consist of ol-hy, hy-ol and Q-hy normative basalts and Q-hy normative basaltic andesites, within a range of 50-55% SiO2.
The younger group occurs predominantly offshore, east of the Kuaotunu Peninsular on the ENE-trending Mercury Islands, but is also associated onshore with the rhyolites and ignimbrites of the Kapowai Caldera in the eastern CVZ. The two largest occurrences (Red Mercury Island-Whakau and Stanley Island-Atiu) are remnants of small shield volcanoes that consist of stacked and ponded lava flows, with intercalated breccias and tuff breccias that include sanidine-bearing rhyolitic pumice and crystal tuffs. There are also scoria cone and lava neck volcano residuals, scoriaceous tephra layers, welded agglomerate and spatter-filled vent residuals, sills, dikes and doleritic to microgabbroic plugs, and rarely pillow lavas. The rocks consist of hy-ol normative picritic basalt and basalt, and Q-hy basalt, basaltic andesite and low SiO2 andesite, within a range of 48-58% SiO2.
A Giant Antacid? Carbonate Saturometry in Interstitial Waters
A.M. Smith1 and C.J. Garden
1
1Department of Marine Science, University of Otago, PO Box 56, Dunedin. New Zealand
One of the consequences of an acidifying ocean is the possibility of increasing dissolution of carbonate sediments, at and below the sea floor. What we don’t yet know is how carbonate dissolution changes with distance below the sea-floor. We therefore developed a method of emplacing carbonate of different mineralogies at various levels below the sea-floor down to 1 m, in sediments located in Otago Harbour and off Otago Peninsula, as well as at Port Pegasus, Stewart Island for periods of 3 months to two years. The specimens included biogenic mollusc aragonite, biogenic mollusc low-Mg calcite, marble, and limestone. Weight loss, and therefore carbonate dissolution, in most samples was minimal. It appears that interstitial waters at depths up to 1 m in sediment are not yet undersaturated with respect to aragonite or calcite. Bottom waters in all three locations have saturation levels of 2.3 to 2.8 wrt aragonite, and 3.6 to 4.3 wrt calcite, so this result is consistent with surface advection into sediments of up to 1 metre. When surface waters become undersaturated wrt calcite and aragonite, however, it could be expected that carbonate dissolution will not just occur at the sea floor but well below the so-called ‘taphonomically active zone’.
Crustal Structure, Seismic Tremor and Shallow Seismicity of the Central Section of
Alpine Fault: A Combined Interpretation
T. Stern1, C. Boese
1, D. Okaya
2, A. Wech1 and
J. Townend1
1Institute of Geophysics, Victoria University of
Wellington, Wellington 2Department of Geosciences, University of Southern California, CA, United States
We combine seismic wide-angle reflection observations, teleseismic delay times and seismicity data to construct a composite interpretation of processes within the Alpine fault zone. Crustal thickness is well determined on and between SIGHT lines 1 and 2 and on line 1 a low P-wave velocity zone is resolved in the mid- to lower crust. Dipping fabric within the
84
Alpine fault zone can be tracked with seismic reflection data between depths of 15 and 35 km and the dip varies between 60 and 45 degrees. The low-velocity zone (–10% drop in Vp) extends between depths of 6 and 25 km and is interpreted to correspond to high ambient fluid pressures. Since 2009, we have operated a borehole seismograph array (SAMBA) in the central Southern Alps. Upper crustal seismicity is distributed throughout the upper crust except within the region of inferred high fluid pressures. Deeper mantle earthquakes are located at depths exceeding 50 km, occur mainly to the south of SIGHT line 2, and exhibit predominantly reverse focal mechanisms. At depths of 25–40 km we observe a vertically oriented zone of seismic tremor. The northern extent of the tremor terminates abruptly just north of the Mt Cook region, whereas the southern extent of tremor cannot yet be defined with existing seismic networks. Tremor appears most prominent beneath the Copland Valley region. Tremor at depths of 25–40 km can be interpreted in two ways. High fluid pressure causes embrittlement of rocks while at the same time reducing the maximum normal stress across pre-existing fault surfaces. Hence smaller earthquakes at greater depths are one predicted manifestation of high fluid pressures. High strain rates will, however, also lead to brittle behaviour in rocks at temperatures and pressures where ductile flow would otherwise be expected. High strain rates and high fluid pressure are not mutually exclusive and a good case can be made for both factors affecting the distributions of tremor and seismicity. Imaging the Base of the Pacific Lithospheric Plate Beneath Wellington, New Zealand, from
500 kg Dynamite Shots Recorded on the SAHKE Line
T. Stern
1, S. Henrys
2, D. Okaya
3 H. Sato
4, T.
Iwasaki4
1Institute of Geophysics, Victoria University of
Wellington 2 GNS Science, P.O. Box 30368, Lower Hutt
3 Earthquake Research Institute , University of
Tokyo, Japan [email protected]
Seismic P and S-wave reflections are recorded from a west-dipping horizon at depth of 105 km beneath Wellington, New Zealand. From the depth and dip of this horizon we interpret this horizon to be the bottom of the subducting Pacific plate. The 100 km-long SAHKE seismic
line had ~1000 seismographs spaced between 50-100 m apart and the 500 kg shots were in 50 m-deep, drill holes. An exceptionally high-resolution image for the top of the subducting Pacific Plate at a depth of 20-25 km beneath the Wellington region is seen. In addition, on some of the shots are a pair of 10-14 Hz reflections between 27 and 29 s two-way-travel-time (twtt) at zero offset. When converted to depth and ray-traced the best solution for these deep events is a west-dipping (~ 15 degree dip) horizon at a depth of about 105 km. This is consistent with the dip of the upper surface of the plate beneath Wellington, and therefore we argue that the deep (~105 km) reflector is the base of the Pacific plate. On two of the shots another pair of 5-8 Hz reflections can also be seen between 47 and 52 s, and the move-out of these events is consistent with them being S-wave reflections from the same 105 km deep, west-dipping, boundary for a Vp/Vs ~ 1.74. As the top of the plate is at depth of 20-25 km the plate is ~ 80 km thick and this is consistent with the thickness of old (> 100 my) oceanic plates measured elsewhere with passive seismic methods.
Both the P-and S-wave reflections occur in pairs of twtt-thickness of 2 and 5 s, respectively. The reflection pair define a ~ 6-8 km thick channel at the base of the plate with a Vp/Vs ratio~ 5/2 or 2.5. Such a high value of Vp/Vs is consistent with the channel containing fluids or partial melt of an unknown percent. Volcanic Ashfall, Drinking Water and Public Health – Recent Experiences from the 2011 Puyehue-Cordón Caulle and 2012 Tongariro
Eruptions
C. Stewart1, T. Wilson
1, S. Cronin
2, A.
Zernack2, M. Brenna
2, B. Christenson
3, and H.
Bickerton1
1University of Canterbury, Private Bag 4800,
Christchurch 2Volcanic Risk Solutions, Institute of Natural Resources, Massey University, Palmerston
North 3GNS Science, National Isotope Centre, PO Box
31-312, Lower Hutt [email protected]
In most cases, the physical presence of volcanic ashfall in raw water sources and water treatment systems will outweigh any chemical contamination problems, despite commonly-held perceptions to the contrary. Suspended ash (turbidity) can cause a range of operational problems for water treatment plants, particularly
85
abrasion of pump impellers and blocking of sand filter beds. Plants can usually remain operative throughout an ashfall, albeit with an intensified level of maintenance. The major risk for halting water production as a consequence of an eruption is an ash-induced power outage.
The 4 June 2011 eruption of the Puyehue-Cordón Caulle volcanic complex, Chile, deposited ashfall over a wide area of Argentina, including the population centres of Villa la Angostura, San Carlos de Bariloche and Ingeniero Jacobacci. Argentinian authorities analysed over 500 surface water samples throughout the region, but did not report any appreciable compositional changes. The Bariloche water treatment plant experienced a range of operational problems largely because turbidity in the raw water source (Lago Nahuel Huapi) exceeded the normal operating range of the plant. In Jacobacci, the water supply system was secure as it is entirely based on a groundwater supply and is enclosed, but problems were experienced in meeting water demand for sustained cleanup operations. In Villa la Angostura, repeated problems were experienced with stream-fed community water supplies.
In the case of the 6 August 2012 eruption of Tongariro volcano, New Zealand, ashfall was rapidly collected and analysed in accordance with recently-developed protocols for characterizing volcanic ash leachate. Ashfall hazards were limited by the short duration of the eruption and minor volume of ash produced, plus subsequent heavy rainfall. Preliminary data on ash leachate composition suggested that even in the event of heavier ashfalls there would have been a low level of hazard to public health from drinking water supplies.
Proximal Silt Turbidites from Offshore Fiordland
L.J. Strachan1, H. Bostock
2 and P. Barnes
2
1Geology, School of Environment, University of
Auckland, NewZealand 2National Institute of Water & Atmospheric
Research (NIWA), Wellington, New Zealand [email protected]
Silt-rich turbidites are an often overlooked part of the gravity flow spectrum. Where encountered they are commonly associated with distal deposition of turbidity current tails or low concentration turbidity currents. Here we use silt-rich turbidites of sediment cores from the offshore Looking Glass and Secretary basins, to
highlight a surprising range of proximal-to-source (1-4 km) deposit types. We’ve undertaken an integrated marine geomorphological, sedimentological, and paleontological study to construct a Late Holocene (<2500 years) record of sedimentation. A wide range of variable (inverse and normal) and complexly graded silt-dominated and silt-sand beds are observed that are interpreted in terms of friction-dominated gravity flow processes. Almost all deposits are erosive, with sediment entrained from a range of water depths (40-600 m), suggestive of non-equilibrium slopes. Integration of multibeam data with detailed flow process interpretations reveal steep slopes dominated by localised networks of dendritic submarine channels that become unconfined to form intraslope lobes adjacent to extensive segmented Alpine Fault scarps that act to pond and even reflect flows.
Reservoirs and Source Rocks in the
Cretaceous-Paleogene of Offshore Northwest Zealandia: Facts, Models and Issues
D.P. Strogen
GNS Science, PO Box 30368, Lower Hutt, New Zealand
This talk addresses some of the issues faced in petroleum exploration of the offshore northwestern frontier of Zealandia, primarily in Deepwater Taranaki and Reinga/Northland basins. Significant uncertainties exist in our understanding of the petroleum system in these areas. Issues, caused primarily by a lack of well penetrations, are primarily focused around the presence, age and nature of both reservoirs and source rocks. These facies are likely to be primarily of Cretaceous age, although Paleogene and younger examples may occur. The major issues, will be discussed, with support for models from seismic and other data. Where possible alternative models exist, discrepancies and which models are favoured will be discussed.
The following is a list some of the issues to be addressed. What control do we have on the age of the Taranaki Delta succession? What facies are present, and do these include source rocks? If so, what sort of source facies? What is the likely age and lithology of the early basin-fill in Deepwater Taranaki. Is the assumed age of Late Jurassic-Early Cretaceous realistic, or could they be younger? What are the likely facies and are source rocks possibly present? What is the age of pre-Rakopi succession in northern
86
Taranaki through to Northland? Is this an extension of the Taniwha Formation depocentre or is it part of the Murihiku Terrane system? Are Waipawa Formation equivalent organic-rich mudstones present within the Late Paleocene of northern Taranaki to Reinga/Northland? Do we understand their depositional setting and likely source richness? Are Paleocene-Eocene transgressive sand reservoirs present throughout Northland-Reinga basins and what are their likely facies, thickness, provenance and reservoir quality?
Analogues for these systems will also be considered from elsewhere in Zealandia, such as the East Coast, Canterbury-Great South, and West Coast basins as well as basins in Australia, such as the Gippsland Basin.
‘Moving Mountains?’: CERRA and the Rebuilding of Christchurch
L. Strongman
Social Sciences, Open Polytechnic, Private Bag 31914, Lower Hutt 5040
On 4 September 2010, a 7.1 magnitude earthquake struck Christchurch, New Zealand’s second largest city, and its hinterland. In response, the government partly suspended the constitution in the region, granting the Earthquake Recovery Minister plenipotentiary powers to recommend exemptions, modification or modifications to any but five Acts of Parliament. In terms of the Canterbury Earthquake Response and Recovery Act 2010 (CERRA), a recommendation by the Minister “may not be challenged, reviewed, quashed, or called into question in any court”. This was followed on February 22
nd 2011 by a magnitude
6.3 earthquake which caused extensive damage to infrastructure and the loss of life. As a consequence the New Zealand government established the Canterbury Earthquake Recovery Authority (CERA) by an Act of Parliament. CERA has almost as wide ranging power over the recovery of the Canterbury region as does CERRA. New Zealanders are united in their commitment to rebuilding Christchurch’s infrastructure and the efficient restoration of normality for residents. Nevertheless, increasing alarm is being expressed that the powers of the CERRA are too extensive and far ranging. What is of concern to the academics – experts in constitutional law – is that, “in particular, individual government ministers, through orders in Council, may
change virtually every part of New Zealand’s statute book in order to achieve very broadly defined ends, thereby effectively handing to the executive branch Parliament’s power to make law.” (“The Public Issues Committee of the Auckland District Law Society”, 2010) The legislation is seen as being too sweeping and high-handed in so far as it appears to forbid legal recourse to examining the reasons for decisions necessitating an ‘Order in Council’ as well as the process undertaken to arrive at that decision. However, from the legal perspective, “Only formal, legal means of accountability, ultimately enforceable through the courts, are constitutionally acceptable”. (“The Public Issues Committee of the Auckland District Law Society”, 2010)
DFDP-1 Drilling Reveals Fluid Control on Architecture and Rupture of the Alpine Fault,
New Zealand
R. Sutherland1, V.G. Toy
2, J. Townend
3, S.C.
Cox4, J.D. Eccles
5, D.R. Faulkner
6, D.J.
Prior2,6
, R.J. Norris2, E. Mariani
6, C. Boulton
7,
B.M. Carpenter8, C.D. Menzies
9, T.A. Little
3,
M. Hasting5, G.P. De Pascale
7, R.M.
Langridge1, H.R. Scott
2, Z. Reid Lindroos
2, B.
Fleming2 and A.J. Kopf
10
1GNS Science, PO Box 30368, Lower Hutt 5040,
New Zealand 2University of Otago, PO Box 56, Dunedin 9054,
New Zealand 3Victoria University of Wellington, PO Box 600,
Wellington 6140, New Zealand 4GNS Science, Private Bag 1930, Dunedin 9054,
New Zealand 5IESE, University of Auckland, Private Bag
92019, Auckland, New Zealand 6University of Liverpool, Merseyside L69 3GP,
UK 7University of Canterbury, Private Bag 4800,
Christchurch 8140, New Zealand 8Istituto Nazionale di Geofisica e Vulcanologia,
Rome 00143, Italy 9University of Southampton, Southampton,
SO14 3ZH, UK 10
MARUM, University of Bremen, PO Box 330440, 28344 Bremen, Germany
Results from the first two boreholes (DFDP-1) drilled through the Alpine Fault, which is late in its 200–400 year earthquake cycle, reveal a >50 m-thick ‘alteration zone’ formed by fluid-rock interaction and mineralization above background regional levels. The alteration zone, which
87
comprises cemented low-permeability cataclasite and ultramylonite dissected by clay-filled fractures, obscures the boundary between the damage zone and fault core. The fault core contains a <0.5 m-thick principal slip zone (PSZ) of low electrical resistivity and high spontaneous potential within a 2 m-thick layer of gouge and ultracataclasite. A 0.53 MPa step in fluid pressure measured across this zone confirms a hydraulic seal, and is consistent with laboratory permeability measurements of order 10 m
2.
Slug tests in the upper part of the borehole yield a permeability within the distal damage zone of c. 10 m
2, implying a six order-of-magnitude
reduction in permeability within the alteration zone. Low permeability within 20 m of the PSZ is confirmed by a sub-hydrostatic pressure gradient, pressure relaxation times, and laboratory measurements: this suggests that dynamic pressurization likely promotes earthquake slip and motivates the hypothesis that fault zones may be regional barriers to fluid flow and sites of high fluid pressure gradient. We suggest that hydrogeological processes within the alteration zone modify permeability, strength, and seismic properties of major faults throughout their earthquake cycles. Plans for future monitoring and drilling will be presented.
Towards Monitoring New Zealand Tectonic Motion with VLBI
H. Takiguchi1, T. Natusch
1, S. Weston
1, J.
Lovell2, M. Sekido
3, and S. Gulyaev
1
1Institute for Radio Astronomy and Space
Research, AUT, Private Bag 92006, Auckland 1142
2University of Tasmania, Private Bag 37, Hobart,
Tasmania, 7001, Australia 3Kashima Space Technology Center, NICT,
Kashima, Ibaraki, 314-8501, Japan [email protected]
The Warkworth 12-m radio telescope (WARK12M) is equipped with L, S and X band systems and is actively used for astronomical and geodetic research, and for navigation/tracking of spacecraft. WARK12M participates in the IVS (International VLBI Service for Geodesy and Astrometry) regular sessions by using the VLBI (Very Long Baseline Interferometry) technique. Co-operative observation for geodetic purposes with NICT (National Institute of Information and Communications Technology, Japan) and University of Tasmania (Australia) recently started. The baseline of WARK12M and NICT's
antenna (KASHIM11) is a long north-south baseline of over 8,000-km. The first observation of the WARK12M-KASHIM11 baseline was carried out in April 2012 and a preliminary value for the baseline length has been determined as 8,075,003,545±150 mm. By repeating the observation, we expect to obtain information about the relative tectonic motion of Japan and New Zealand. Also, we are working to establish the ability to derive EOP (Earth Orientation Parameters) ultra-rapidly by utilising this baseline, existing UT1 products (such as from INT2 experiment of IVS session) and the high-speed network. The University of Tasmania operates three 12-m radio telescopes located in Hobart (HOBART12), Yarragadee (YARRA12M), and Katherine (KATH12M) under the AuScope project. These three telescopes and WARK12M have a similar design and system. All are located on the Australian tectonic plate and consequently are ideally placed for measurements of intra-plate deformation. WARK12M-AuScope observations started in July 2012. In this presentation, we specifically stress the importance of establishing a new VLBI station in New Zealand’s South Island as a means of contributing to the study of the Australian/Pacific plate boundary.
Authigenic Mineral Production in an Oligocene Cool-water Carbonate Sequence
Stratigraphic Framework, Waitaki Basin, New Zealand
N.K. Thompson
1, C.M. Reid
1, K.N. Bassett
1
and P.K. Pufahl2
1Dept. of Geological Sciences, University of
Canterbury, Private Bag 4800, Christchurch 2Dept. of Earth & Environmental Science, Acadia
University, Wolfville, Nova Scotia, Canada [email protected]
Glaucony and phosphate production is characteristic of low sedimentation rates within low energy, oxygen-depleted environments, and is often related to condensed sections and unconformities associated with sea-level highstands, especially in siliciclastic systems. The Mid-Tertiary rocks of the Waitaki Basin, South Island, New Zealand, contain multiple cool-water carbonate and greensand sequences formed at a passive margin within a regional transgression. This carbonate basin formed to the east of low-relief remnant Zealandia islands, and was bound at its eastern edge by a volcanic-induced high.
88
In the basal sequence bryozoan grainstones form a shoal on the eastern volcanic seamount, while westward of the shoal are impure wackestones. The overlying sequence boundary is represented by a karst surface around the high in the east, and a firmground in the west, developed as a result of sea-level fall and lowstand conditions. During this lowstand the terrigenous supply of silt and clay was moved closer to the basin and was then available for glauconitisation. Calcareous glaucony- and phosphate-rich greensands accumulated during the subsequent transgression, with the glaucony and phosphate content decreasing through this second sequence to form pure packstones during highstand and subsequent regression. The second sequence boundary shows similar karst and firmground distribution to the first, and has a similar greensand transgressive sequence deposited above it.
In this cool-water setting, where the carbonate factory is located on an offshore volcanic-induced high, authigenic mineral production occurs at lowstand settings. Mud-sized terrigenous clay minerals are introduced to the basin from the west, smothering the carbonate factory and supplying the building blocks for glaucony production. Through the transgressive phase this terrigenous clay supply is progressively shut down and the system returns to carbonate production at highstand. Sea-level rise thus encourages the development of the cool-water carbonate factory, and a decrease in production from the authigenic factory.
Stratigraphy, Structure and Emplacement Mechanisms of One of the Earliest Mt
Ruapehu Debris Avalanche.
M.Tost1, J.N. Procter
1, S.J. Cronin
1, V.E.
Neall1
1Institute of Natural Resources, Massey
University, Private Bag 11 222, Palmerston North, NZ
Volcanic debris avalanches are generated from either full or partial failure of a volcanic cone which can result in the rapid acceleration of large masses of material that may reach velocities of >100km/h. Mt Ruapehu, located at the southeastern end of the Tongariro Volcanic Centre, is one of the most active volcanoes of New Zealand. The two major river systems on
the southeastern ring plain of Mt Ruapehu are the Hautapu and the Whangaehu River. Sedimentological features of the basal deposits within both river catchments are equivalent. They consist of a clay-rich matrix with subangular to subrounded jig-saw fractured andesitic clasts <4 m, and minor Tertiary mudstone megaclasts >5 m in size. The deposits reflect a mass-wasting event most likely related to partial cone failure of Mt Ruapehu. The subrounded boulders suggest a transformation of a debris avalanche into a debris flow with emplacement mechanisms changing from dominantly mechanical fluidization plus fragmentation into a more cohesive flow state. The debris avalanche runout along the proto-Hautapu catchment is >60 km, a reconstructed inundation area of c. 216-256 m2 would result in an approximate volume of 0.9-2.6 km3. The Whangaehu debris avalanche covers an area of c. 80-120 km2 with a runout of 40 to >60 km this would result in a volume of c. 0.8-3.6 km3. The soil (loess and paleosol) stratigraphy overlying both formations suggests a similar depositional age between 110-150 ka. A single cone failure during this period results in a volume of c. 1.7-6.4 km3 for both river systems exceeding the size of any debris avalanche events known from Mt Ruapehu. Paleo-volumes of a proto-Ruapehu cone of the Te Herenga and Wahianoa Formations or cone building phases could possibly contain and produce the required debris avalanche.
A Tectonic Stress Map of New Zealand
J. Townend
1, S. Sherburn
2, R. Arnold
3, C.
Boese1 and L. Woods
3
1Sch. of Geography, Environment, and Earth
Sciences, Victoria Univ. of Wellington, Wellington
2GNS Science, Wairakei
3Sch. of Mathematics, Statistics, and Operations Res., Victoria Univ. of Wellington, Wellington
The tectonic stress field exerts a first-order control on lithospheric deformation and faulting processes In recent decades, the importance of understanding tectonic stress has gained new recognition within the petroleum and geothermal sectors, especially from the standpoint of borehole design and borehole stability assessment. In this presentation, we summarize the results obtained in the largest study to date of the tectonic stress field in New Zealand (EPSL, 353–354, p. 47–59,
89
doi:10.1016/j.epsl.2012.08.003). In this study we have inferred tectonic stress parameters at 100 locations along the Australia–Pacific plate boundary using a newly compiled data set of 3424 focal mechanisms. Our results reveal pronounced changes in the azimuth of maximum horizontal compressive stress SHmax along the shallow portion (<50 km depths) of the Hikurangi subduction margin, with a marked change from margin-parallel SHmax north of Hawke's Bay (latitude c. 40°S) to a more oblique SHmax orientation further south. This change appears to coincide with the along-strike variations in subduction thrust coupling inferred from geodetic and seismological observations. In contrast, the orientation of SHmax is highly uniform across most of the South Island (averaging c. 115°) and collinear with the axis of relative contractional strain rate. Analysis of focal mechanisms recorded before and after the damaging MW6.2 Christchurch earthquake of 22 February 2010 reveals no significant change in SHmax orientation or the overall stress regime. This suggests that even the high-stress drop Christchurch earthquake was incapable of substantially modifying the ambient stress field, at least on the scales at which stress orientations can be examined using focal mechanism analysis.
Petrophysical Characteristics of Alpine Fault
Zone Fault Rocks Inferred from DFDP-1 Wireline Logging Data and Core Samples
J. Townend
1, R. Sutherland
2, V.G. Toy
3, J.D.
Eccles4, S.C. Cox
5, C.J. Boulton
6, D.
McNamara7 and G. O'Brien
1
1Sch. of Geography, Environment, and Earth
Sciences, Victoria Univ. of Wellington, Wellington
2GNS Science, Lower Hutt
3Department of Geology, University of Otago,
Dunedin 4Institute of Earth Science and Engineering,
University of Auckland, Auckland 5GNS Science, Dunedin
6Department of Geological Sciences, University
of Canterbury, Christchurch 6GNS Science, Wairakei
The relationship between fault zone structure and earthquake rupture is of fundamental scientific and societal interest, and understanding how geological structures accommodate and modulate earthquake processes requires integration of theoretical,
field, and laboratory results. Wireline data and rock cores extending from one side of the Alpine Fault to the other have been acquired in two boreholes drilled at Gaunt Creek, South Westland, New Zealand, in the first phase of the Deep Fault Drilling Project (DFDP-1). Together and separately, the wireline and rock core datasets provide rare insight into the structural and lithostratigraphic architecture of a major continental transform fault late in the cycle of strain accumulation and anticipated coseismic release.
In this presentation, we describe the key petrophysical characteristics of fault rocks encountered in the DFDP-1 boreholes by combining wireline logging data with a lithological model constructed on the basis of core descriptions, and petrographic and geochemical analysis. The larger wireline data set from DFDP-1B reveals systematic differences between the principal lithologies, which we infer to represent different protolith compositions as well as deformation and alteration within the fault zone. Of particular interest are the characteristics of the gouge and the principal slip zone encountered in DFDP-1B at c. 128 m. The gouge exhibits markedly different properties from the rocks above and below, particularly with respect to density (lower by c. 0.3 g/cc than in all other cored lithologies), neutron porosity (a factor of almost two higher) and, most distinctively, low electrical resistivity, high spontaneous potential, and low seismic velocity (by c. 1 km/s with respect to the other cored lithologies). The single footwall lithology cored in DFDP-1B exhibits the lowest mean seismic velocity and density of all lithologies other than the gouge. This means that the footwall within c. 10 m of the Alpine Fault principal slip zone at c. 128 m is more compliant (less stiff) than the hanging wall at comparable distances from the principal slip zone. This macroscopic fault zone asymmetry may affect rupture and seismic wave propagation within the fault zone, coseismic changes in fault strength and ground motion distributions, and preferred rupture propagation directions.
Sedimentology of Lake Okataina
D. Travers1 and C. Hendy
1
1Dept. of Chemistry, University of Waikato,
Hamilton, New Zealand [email protected]
The sediments of Lake Okataina consist of diatomaceous ooze typically 18cm thick,
90
overlying the Rotomahana mud unit of the Tarawera tephra. The diatomaceous ooze had an equivalent grain size of 80 microns (as determined by laser sizer) while the Rotomahana mud had variable grain size up to 300 microns. Typically an increase in grain size was observed in the diatomaceous ooze between 8 and 12cm depth, which may reflect diagenesis within the sediment. There was a slight coarsening and thinning of the diatomaceous ooze and a significant coarsening of the Tarawera tephra with shallowing water depth.
Geological Science Education in the New Zealand Certificate of Educational
Achievement: NCEA
G.D. Vallender Educational Research and Science Resources:
EdRSR Ltd [email protected]
An overview of NZ curriculum history is presented in relation to high stakes assessment in the New Zealand Science curriculum. Assessment in New Zealand schools is controlled by the NCEA which is expressed as criterion referenced assessment and delivered via achievement standards. This is both internally (School based) and externally NZQA moderated and set examinations from Year 11 (student age 15/16 years) to Year 13 (student age 17/18 years). Criteria for assessment judgement statements are derived from the achievement standards which in turn are derived from the national science curriculum in the form of achievement standards.
A brief discussion of the philosophy of NCEA within a geological science context is presented along with examples of how assessment criteria are expressed. An analysis of candidate numbers and school data for NCEA levels 1, 2 and 3 geoscience assessment is also presented. Note that scholarship examinations are not part of the NCEA, but examination questions are derived from the Level 3 NCEA standards.
Key findings show that geological science education is an endangered subject in New Zealand schools and that despite content changing from an earth materials and geological history emphasis to an ‘earth systems’ and ‘surface features’ approach, student numbers continue to decline. Although the numbers of schools offering Levels 2 and 3 Science has always been low due to lack of resources,
traditions and few qualified geoscience teachers, it is hoped with the introduction of Earth and Space Science (ESS) at levels 2 and 3 (and now is a scholarship opportunity) the numbers of students engaged in learning geoscience will increase. Because a ‘standards’ based approach to assessment offers choices, time will tell if teachers will offer more in the geosciences. If history is anything to go by, this is unlikely and the challenge for educators is to find ways of addressing issues connected with the teaching and learning of geological time, materials, structures and processes. Distributed Strike-Slip Surface Fault Rupture
and its Impact on Man-Made Structures During the Mw 7.1 Darfield Earthquake, New
Zealand
R. Van Dissen1, N. Litchfield
1, P. Villamor
1, S.
Hornblow2, M. Quigley
2 and D.J.A. Barrell
1
1GNS Science, NZ;
2University of Canterbury, NZ
Surface rupture of the Greendale Fault during the Darfield earthquake was predominantly dextral strike-slip (average 2.5 m, maximum 5.3 m) and extended for ~29.5 km across gravel-dominated alluvial plains west of Christchurch. The rupture comprised a series of en echelon east-west striking, left-stepping traces and resulted in a variety of damaging impacts on man-made structures within, or crossing, the surface-rupture deformation zone.
About a dozen buildings were affected by surface rupture, but none collapsed. This was because most of the buildings were relatively flexible single-storey timber-framed structures, and surface rupture deformation was distributed over a relatively wide zone. There were, however, notable differences in the respective performances of the buildings. Houses with only lightly-reinforced concrete slab foundations suffered moderate to severe structural damage. Three other types of buildings performed more favourably: one had a robust concrete slab foundation, another had a shallow-seated pile foundation that isolated ground deformation from the superstructure, and the third had a structural system that enabled the building to tilt and rotate as a rigid body.
Many linear features (e.g. roads, fences) were displaced by the fault rupture. These were surveyed and provided ideal markers for measuring the amounts and patterns of surface rupture deformation. Perpendicular to fault strike,
91
dextral displacement was distributed across a ~30 to 300 m wide deformation zone, largely as horizontal flexure. The width of the surface rupture deformation zone is greatest at step-overs, and damaging ground strains developed within these. On average, 50% of the horizontal displacement occurred over 40% of the total width of the deformation zone with offset on discrete shears, where present, accounting for less than ~25% of the total displacement. These fault displacement characterisations are relevant for planning fault avoidance set-back distances, and designing surface-rupture resilient buildings and infrastructure in New Zealand and globally. Cheap, Simple and Robust Seismometers for
New Zealand Schools
K. van Wijk1, L. Adam
2, T. Channel
3 and M.
Smith4
1Dept of Physics, The University of Auckland,
Private Bag 92019, Auckland
2School of the Environment, The University of
Auckland, Private Bag 92019, Auckland
3Boise State University, Boise, ID 83725, USA
4Blindgoat Geophysics, Sharon, VT 05065, USA
[email protected] For the past six years, a team of mostly secondary-school educators and geoscientists have been developing a program to educate secondary-school students about the basic tectonic processes of our Earth. The central component of this project is a seismometer that is simple enough to be built by the students themselves, yet robust and accurate enough to provide relevant earthquake data (seismograms). As such, it becomes a central part of the students' earth science curriculum. Data can be shared online with students around the world to discuss the detection and location of earthquakes, as well the variations in local tectonic settings at each seismic station. We have successfully introduced this concept in institutes of K12 education in the US, mostly in junior high schools. In addition, several instruments are now running in schools in Australia and Europe. We welcome the opportunity to introduce our project to New Zealand, and its secondary school system. In this presentation, we will discuss the workings of the seismometer, as well as experiences in the classroom with the instrument.
Liquefaction Induced by the 2010-2011 Canterbury Earthquake Sequence and Implications from Recently Discovered
Paleoliquefaction Features
P. Villamor1, P. Almond
2, M. Tuttle
3, R.
Langridge1, K. Clark
1, A. Eger
2, S. Bastin
4, M.
Quigley4, P. Barker
1 and M. Vandergoes
1
1GNS Science, NZ
2Lincoln University
3M. Tuttle & Associates, USA
4University of Canterbury, NZ
Extensive liquefaction occurred in Christchurch city and the surrounding area during the 2010-2011 Canterbury earthquake sequence. In this low strain rate region where many of the faults have no surface expression, the timing of prior events such as those in 2010-2011 is not directly known. Identifying paleoliquefaction features in the region affected by the 2010-2011 events may provide information on paleoearthquake timing and potential earthquake source. Here we present our studies in the Lincoln area, 16 km southwest of Christchurch city centre, where liquefaction occurred during the 4 September 2010 (Mw 7.1; 29 km away; 0.6-0.8 g PGA at Lincoln) and the 22 February 2011 (Mw 6.2, 17 km away; 0.1-0.2 g PGA at Lincoln) earthquakes. The study area occurs on a low lying (< 6 m AMSL) late Holocene floodplain-delta complex formed on the margins of Lake Ellesmere by paleo-distributary channels of the Waimakariri River.
At two sites we excavated trenches to 1.5 m depth and hand cored to greater depth to document the subsurface characteristics of liquefaction features, identify sources of liquefiable material, search for evidence of prior events, and find radiocarbon material for dating. The main liquefaction features that formed in 2010-2011 included sand volcanoes or sand blows, surface mounds up to 30 cm high and 1.5 m in diameter formed by deformation of the soil due to intrusion of sand dykes and sills (blisters), and related feeder sand dykes (1-4 cm wide). Sand volcanoes commonly coalesced along fissures, forming 30 m long and 2 m wide sand ridges. Weathered sand dykes and a buried sand blow crosscut by modern sand dykes indicate at least one paleoliquefaction event. Radiocarbon ages constrain the paleoliquefaction features to about 800 year B.P. Additional paleoliquefaction data across the region are needed to interpret the location and magnitude of this paleoearthquake.
92
An Automated Grading System for Shear Wave Splitting
E. Walsh
1, M. Savage
2 and R. Arnold
1
1SMSOR, Victoria University of Wellington, PO
Box 600, Wellington, 6140 2SGEES, Victoria University of Wellington, PO
Box 600, Wellington, 6140 [email protected]
Shear wave splitting is a useful tool for determining anisotropy in the Earth using seismograms of earthquakes. The measured anisotropy can in turn be related to mineral orientation and deformation or cracks and stress. However, it is important to ensure the results are reliable through a grading of the quality of the observations. Manual grading involves visual inspection of adjusted waveforms, and other graphical diagnostics from the Silver and Chan (1991) method of estimating shear wave splitting delay times and fast directions. The grading process is time consuming and conclusions may differ between different graders, and a grader may also find it difficult to grade a large number of events consistently. Therefore, we automated grading first by manually grading 146 events obtained from station BOR on Reunion Island Hotspot. We then developed a set of numerical criteria that as far as possible characterised the features that the manual grader used to classify the events. Finally we performed a multiple linear regression analysis on the set of numerical criteria as predictors of the manual grade. A stepwise model selection procedure was used to select the most important of the numerical criteria.
The automated method produced grades that roughly match the manual grades and the method can clearly distinguish between good results and bad results. The most strongly predictive of the numerical criteria are related to the contour map of the eigenvalues and the corrected polarisation waveform. The process of automation led us to review some of the manual grades, which were discordant with the predicted grades from the automated system, confirming the inconsistencies that can occur with manual grading.
Investigating Potential Artefacts in Shear Wave Splitting
E. Walsh
1, M. Savage
2 and R. Arnold
1
1SMSOR, Victoria University of Wellington, PO
Box 600, Wellington, 6140 2SGEES, Victoria University of Wellington, PO
Box 600, Wellington, 6140 [email protected]
Shear wave splitting is a commonly used tool for measuring anisotropy in the Earth’s interior. However, shear wave splitting measurements often yield larger variation between the results than is expected from the normal errors generated by computer programs. Furthermore, recent measurements on multiplets of nearly identical events have yielded large variations and “jumps” in apparent splitting parameters as a function of time rather than smooth variations as expected for slow changes in path properties. We carried out a systematic analysis of the Silver and Chan method. We examined the variations of shear wave splitting on a family of 513 earthquakes recorded at station BOR on Piton de la Fournaise Volcano on La Reunion Island. Earthquakes were assigned to families based on cross-correlation of the P waveform with values higher than 90%. Of these 513 events, only 268 high quality events were used. A fixed 2 pole Butterworth bandpass filter with corner frequencies of 4 and 10Hz was applied. Several clusters of fast directions appeared so we chose to analyse the cluster with the most (146) events, which had fast directions between 0 and 45 degrees. The analysis window was then fixed at 3.88-4.39 seconds for all events.
On close examination, we discovered that the cause of the jumps is most likely related to a new variety of cycle skipping. Cycle skipping in shear wave splitting is a phenomenon that is known to lead to delay time shifts that are half integer multiples of the dominant period and can create 90 degree errors in the fast direction. Animations of changing delay times show this phenomenon also causes 90 degree flips in the fast direction and that the incoming polarisation is also affected by these “jumps”.
The Kinematics of Conjugate Strike-Slip Faulting: An Example from the Tibetan
Plateau
E. Warren-Smith1 and
P. England
2
1SGEES, Victoria University of Wellington, PO
BOX 600, Wellington, New Zealand 2Department of Earth Sciences, University of
93
Oxford, South Parks Road, Oxford, OX1 3AN, UK
Coeval left- and right-lateral strike-slip faults are a common feature of continental plate-boundary zones. In northwestern South Island, New Zealand, closely related left- and right-lateral strike-slip faults are active today. However, the kinematic relation between them is unclear. Here, we analyse the kinematics of strike-slip faulting in the India-Eurasia collision zone, in Tibet, where active left- and right-lateral strike-slip faults are well exposed in the arid landscape.
Satellite imagery and quantitative geomorphological tools are combined in this study to create “Tibet-StrikeSlip-1.0”, the most detailed digital map of strike-slip faults across the Tibetan Plateau to date. The orientation of faults in relation to the principal axes of strain, derived from GPS, is largely explained by Andersonian faulting. However, faults in the central plateau show a bimodal distribution of strikes. These conjugate right- and left-lateral faults formed and continue to actively slip at 16° and 31° away from the direction of maximum extensional strain respectively, angles that cannot be explained by Andersonian theory of faulting. Previously outlined modes of deformation for strike-slip faulting in the central Tibetan Plateau are investigated through comparison with the improved fault map produced in this study. These previous kinematic modes are found to be inconsistent with faults in “Tibet-StrikeSlip1.0”. Instead, this study proposes a new mode of deformation through a relationship between the moment tensor and fault orientation. In this relationship, pre-existing lines of crustal weakness determine strikes of right-lateral faults in the central plateau, whilst left- lateral faults strike northeast at 45° away from these weaknesses. A new method for quantifying slip along strike-slip faults is also outlined by considering vertical offsets of normal faults across tensional fault bends.
Elevated Arsenic, Molybdenum and Uranium in Antarctic Meltwaters
J.G. Webster-Brown1 and I. Hawes
1
1Waterways Centre for Freshwater
Management, U. Canterbury, PB 4800, Christchurch
Terrestrial life in Antarctica is critically dependent on the presence of liquid water, and on the chemistry of that water. Seasonal meltwater ponds and lakes, on ice and rock surfaces, form aquatic habitats for various microorganisms including cyanobacterial mats, phytoplankton and rotifers. Understanding the range of chemical conditions that the organisms experience during the seasonal freeze/thaw cycle, is critical to understanding how they may respond to future environmental change.
Ponds and lakes between 77oS
(Wright/Victoria Valleys) and 80oS (Darwin
Glacier) in Victoria Land, range in composition from dilute freshwaters to highly saline brines, formed as a consequence of evaporation and freeze concentration. If trace elements were to behave as conservatively as sodium or chloride during brine formation, their concentrations would become elevated and potentially toxic to aquatic organisms. However, ponds undergo periods of anoxia and H2S genesis over winter; conditions which can become permanent in the base of some stratified lakes. Consequently, significant enrichment of thiophylic trace elements such as Fe, Cu, Pb and Zn is rarely observed. Until recently, Mn was the only trace element that had been observed to consistently experience enrichment to the degree observed for conservative major ions in saline brines.
However significant As, Mo and U enrichment has now been observed during pond freezing, to levels which would be of environmental concern in more temperature systems. Mo appears to be removed from the water only during the final stages of freeze concentration, as observed during IPY late season sampling at Bratina Island. Similarly in salinity-stratified Lake Wilson, As, U and Mo are elevated in the water column below 40m depth. For all three trace elements, regional geology appears to be a key factor determining the background concentrations of these elements in the more dilute meltwaters of the catchments.
94
Revised Geometry for the Hikurangi Subduction Thrust: Application to Slow Slip Event Inversions and Hydrological Modelling
on the Hikurangi Subduction Interface
C. Williams1, S. Ellis
1, K. Marson-Pidgeon
1, D.
Eberhart-Phillips2, L. Wallace
3, J. Beavan
1, D.
Barker1, S. Henrys
1 and M. Reyners
1
1GNS Science, PO Box 30368, Lower Hutt, New
Zealand 2University of California Davis, Davis, CA, United
States 3University of Texas-Austin, Austin, Texas, USA
[email protected] Slow slip events (SSEs) occur along nearly the entire Hikurangi subduction margin. Long duration, deep, large events occur at the southern Hikurangi margin, while short duration, shallow, smaller events occur at the northern and central Hikurangi margin. We are attempting to understand the factors controlling the distribution of these SSEs by 1) Providing a more accurate description of the interface geometry; 2) Including effects of material heterogeneity in geodetic inversions of slow slip; and 3) Examining the effects of pore fluid pressure on frictional fault behaviour.
Accurate knowledge of interface geometry is critical in both forward and inverse models of SSEs. To address this, we have combined recent seismic reflection results and trench bathymetry with seismicity results. Using this merged geometric model, we then use the New Zealand-wide 3D seismic velocity model and the finite element code PyLith to generate Green's functions to perform inversions for slow slip distributions constrained by GPS observations. The improved geometry in combination with the inclusion of material heterogeneity should provide much more accurate predictions of the slip distributions. Finally, we examine the effects of pore fluid pressure on fault frictional behaviour by examining a 2D seismic reflection profile near Gisborne. This profile captures a subducting seamount, as well as a region of SSE activity downdip of the seamount. Using geometric and material property constraints provided by the seismic reflection data, we use the finite element code SUTRA to model the fluid flow for this region. We then use PyLith to model the frictional interface, using the predicted pore fluid pressures from SUTRA to modify the initial effective normal stress on the fault. By combining the fluid flow model with a frictional fault model, we hope to gain a better understanding of the factors controlling SSE
occurrence along the Hikurangi subduction margin. New Zealand Palaeoclimate Stages Through
the Last Glacial Cycle – a Speleothem Perspective
P.W. Williams
1, H. Neil
2 and J-X. Zhao
3
1Auckland University, PB 92910, Auckland, New
Zealand 2National Institute of Water and Atmospheric
Research, PB 14901, Wellington, New Zealand 3Radiogenic Isotope Laboratory, University of
Queensland, Brisbane, Queensland, Australia
The Quaternary research community in New Zealand has focused on identifying palaeoclimate events over the last 30 000 years. Results from a range of proxies have been synthesized and, despite some dating uncertainties and better information on temperature fluctuations than water balance changes, there is a general consensus on the pattern of climatic events since the start of the LGM. As a result of this success, it is now appropriate to consider probing deeper into the past. Therefore this paper presents a review of stable isotope and dating evidence from NZ speleothems back to MIS5. The record is based on samples from both North and South Islands and from several authors. No individual record is longer than 60 000 years but, in spite of gaps, the collected series reveals the nature of major events through the Last Glacial cycle. Speleothem information from the Last Interglacial is surprisingly scarce, but stable isotope data from one sample from northwest Nelson indicates that from 128 to 119 ka the interglacial around MIS5e was warmer than present. Speleothem samples from across the MIS5–MIS4 transition are few in number and so suggest that conditions at that time were not very favourable for speleothem growth (maybe too dry and cold?). A cool excursion in MIS4 at 65–70 ka was probably as cold as the LGM. A major interstadial in MIS3 from 55–46 ka was almost as long as the Holocene, but was cooler and more variable. It included a cool excursion around 49.7 ka that was probably associated with a glacial advance in the Southern Alps. This may also have been the case during two other cool excursions at 42.6 ka and 39.4 ka. Then followed a short interstadial from 36 to 33.4 ka, immediately prior to the onset of the LGM at 30 ka.
95
Post-Earthquake Sheltering Needs in Wellington Following a Large Wellington
Fault Earthquake
K.C. Wright1, W.J. Cousins
1, D.M. Johnston
1,2,
M. Emch3, S.K. McBride
1, R. Van Dissen
1
1GNS Science
2Massey University, Wellington
3University of North Carolina at Chapel Hill
Wellington City has a population of ~200,000 people, concentrated in high-rise buildings in the Central Business District and mostly timber houses in surrounding hillside suburbs. The city is bisected by the Wellington-Hutt Valley segment of the Wellington Fault and a large surface rupture earthquake (M~7.5) on this section of fault will result in many dwellings within the city being damaged and unsafe for habitation, transportation routes and critical lifeline services will also be severely disrupted, and evacuation out of the city will not be possible immediately after the quake.
To aid earthquake planning and response, we undertook a sheltering needs assessment to determine the number of people living in Wellington City that will be displaced and need alternative shelter following a large Wellington Fault earthquake. A model framework for calculating post-earthquake sheltering requirements was developed based on a variety of damage (e.g. building collapse, lifeline utility interruption) and non-damage related factors. Our modelling suggests that at least 30,000 people could be displaced, with 5,000 people potentially out of their homes for more than twelve months. Loss of utility services to homes not structurally compromised is expected to affect an additional 140,000 residents.
The tens of thousands of Wellington residents potentially requiring emergency shelter, and the difficulties expected in restoration of access routes and lifeline utilities, especially water supplies, creates a substantial challenge for emergency managers in the Wellington region. Non-structural factors (e.g. loss of income or services, feelings of loss of safety in neighbourhoods, inability to move because of mobility or dependency issues) are not considered here, but are expected to contribute to an increase in the number of citizens requiring shelter - further increasing the challenges faced by emergency management planners and responders.
This investigtion was undertaken as part of the RiskScape and It’s Our Fault programmes.
The Trace Element Composition of Biota in Lake Okataina
M. Wright
1 and C. Hendy
1
1Dept. of Chemistry, University of Waikato,
Hamilton, New Zealand [email protected]
Lake Okataina is inhabited by many species of native and exotic organisms. A selection of these organisms including fish, koura and plants were taken in April 2012. The samples were freeze dried, digested, and then analysed using an Inductively Coupled Plasma Mass Spectrometry (ICP-MS). The results showed the following; a) Concentrations of chromium, boron, sodium, magnesium, phosphorous, sulphur, potassium, calcium, cobalt, zinc, selenium, strontium, cadmium, mercury and nickel were significantly higher in the biota then the lake sediment and suspended material. b) Distinct differences were observed between animals and plants, and between the carapaces and flesh. Phosphorus, vanadium, chromium, cobalt, nickel, zinc, selenium and mercury are concentrated in the animals and iron, manganese and arsenic are concentrated in plants. c) Distinct differences were observed between the koura flesh and carapaces. Boron, sodium, potassium, vanadium, chromium, copper, zinc, arsenic, selenium, cadmium and mercury are concentrated in the koura flesh and calcium, manganese, strontium, barium and uranium are concentrated in the carapaces. d) Toxic heavy metals including arsenic, mercury, cadmium, chromium and lead were shown to have concentrations well above the maximum recommended level for consumption by humans. The Origin of the Kermadec Pumice “Raft” in
Late July – Early August 2012
R. Wysoczanski1, H. Bostock
1, M. Rotella
2, S.
Barker2 and J. Mitchell
1
1National Institute of Water & Atmospheric
Research, Private Bag 14901, Wellington. 2School of Geography, Environment and Earth
Sciences, Victoria University of Wellington [email protected]
Marine surveillance flights and NASA satellite images showed a large white slick on the surface of the southwest Pacific Ocean in late July 2012. In early August the HMNZS Canterbury was undertaking the resupply of
96
Raoul Island and altered its route to investigate this feature. The ship first intercepted the pumice raft at 5pm on the 9th August at 30°59.25S, 178°50.73E, and several samples were collected ranging in size from 1 cm to 10 cm, although pieces up to 30 cm in diameter were observed floating in the water. At midnight the ship hit a large raft of pumice at 30°39.61S, 179°25.01E about 1 m thick and as far as they could see with the ship’s spotlights. Further fresh pumice was found floating just offshore and on the beach on the south side of Raoul Island around the 14th August.
Samples of the pumice have been analysed for their glass chemistry and are similar to the chemistry of pumice previously dredged from around Havre Volcano. Other analytical work is on-going, including whole rock major and trace element analyses, and textural work looking at pyroclast vesicularities and bubble size distribution, and number densities. These data will help to answer some key questions about deep marine erupted pyroclasts.
We also hope to re-survey Havre Volcano using an EM302 multibeam system in an upcoming RV Tangaroa voyage in October to determine if there have been any changes to the seafloor as a result of the eruption. Petrology of Pyroxenite Xenoliths Enclosed in Basaltic Rocks from Jeju Island, Korea
J. Yu
1 and K. Yang
1
1Dept. of Geological Sci., Div. of Earth Envir. System, Pusan National University, Busan,
Korea [email protected]
A variety of ultramafic xenoliths hosted in basalts is exposed in Sinsanri locality, Jeju Island, Korea. The pyroxenite xenoliths occupying about 5 vol% among these ultramafic xenoliths occur as a websteritic dyke phase with 1~2cm in width within peridotite xenolith or as discrete xenoliths with 3~7cm in width in the host basalt. They are olivine websterite – websterite - clinopyroxenite in modal composition. Olivine websterite and websterite show a textural continuity from protogranular to porphyroclastic texture, which is similar to peridotite xenoliths trapped in the same host basalt, whereas clinopyroxenite occur as a discrete clinopyroxene megacryst showing pegmatitic character. The major element compositions of the constituent olivine (Mg#[=100×Mg/(Mg+Fet)]=89, NiO=0.40~0.47 wt.%), orthopyroxene (Mg#= 87~90, Al2O3=4.2~7.4 wt.%), clinopyroxene
(Mg#=88~91, Al2O3=6.2~8.9 wt.%) and spinel (Cr#[=100×Cr/(Cr+Al)]=5~9, Al2O3=58-62 wt.%) are consistent with the mantle-derived worldwide pyroxenite. They also show geochemical continuity with those of peridotite xenoliths trapped in the same host basalt. The textural and major composition characteristics of the studied pyroxenite xenoliths suggest that they have been evolved from peridotite in the upper mantle by the short-time differentiation or they are the products of refertilization.
Mt. Tongariro (New Zealand) 2012 Eruption – Complex Ash Leachate Compositions and
Implications for Volcanic Health Hazard Evaluation
A.V. Zernack
1, S. Cronin
1, M. Brenna
1, C.
Stewart3, B. Christenson
2, N. Pardo
1 and T.
Wilson3
1Volcanic Risk Solutions, INR, Massey
University, Private Bag 11222, Palmerston North, NZ
2GNS Science, National Isotope Centre, PO Box
31-312, Lower Hutt, NZ 3Dept. of Geological Sciences, University of
Canterbury, Private Bag 4800, Christchurch, NZ [email protected]
After 115 years of quiescence, Mt. Tongariro erupted suddenly at 2350 hrs (NZ time) on 6 August 2012. The eruption produced a fine ash of minor volume (0.004 km
3) but wide
distribution, extending over 200 km from source. The threat of further eruptions sparked an investigation of the possible health and agricultural impacts of any future eruptions from this volcano, particularly since the most recent large-scale ash falls in New Zealand in 1995-1996 had generated significant agricultural problems, including livestock deaths. Mt. Tongariro ash was sampled between 5 and 200 km from the volcano within hours of settling and before rainfall. Analysis of this revealed several unusual features. Using a series of three repeated leaches of the same samples, strong variations in ash properties could be established. Typical single-leaching analyses, most commonly recommended for volcanic ash health impacts showed highly variable results, in many cases considerably underestimating the potential chemical impact of these tephras. Leachant/sample ratios of 1:20 appeared unsuitable for estimating total fluoride and sulphate concentrations and may also have limitations for metal analysis. Leaching experiments using 1:100 ratios were also limited.

97
In addition to method-related variability, concentrations of soluble components also varied for ash produced at different times of the eruption. Using the example of fluoride (F), a single leach of the earliest erupted/deposited ash extracted c.75-90% of the total F removed in three sequential leaches. Subsequently erupted ash, deposited only minutes later in an adjacent area due to shifting wind direction, had far less soluble forms of F, with single leaches yielding only c.30-40% of the total amount extracted over three leaches. This property is also reflected in sulphate concentrations, indicating that even if rapid results are required for health hazard assessment, a full understanding of time-dependent leaching behaviour is required before definitive recommendations can be made. Using the Physical Properties of the 30-25 ka
Poto Tephras from Mt. Taranaki, New Zealand, as a Tool for Correlation Between
Outcrop and Core Records
A.V. Zernack1, V.E. Neall
1 and R. Tinkler
1
1Institute of Natural Resources, Massey
University, Private Bag 11222, Palmerston North, NZ
[email protected] The period leading up to the Last Glacial Maximum (LGM) is of major interest for climate studies. However, the sedimentary record of this time period is typically poor in datable organic material, often requiring alternative methods such as tephrochronology to obtain age estimates of deposits. The widespread 26.5 ka
Aokautere Ash was deposited just prior to the LGM, thus representing a valuable marker horizon in New Zealand. Despite being identified in several locations of the volcaniclastic ring plain surrounding Mt. Taranaki, this time-marker is absent from swamp cores taken near Eltham, which are currently the focus of a palynological reconstruction of Last Glacial climate fluctuations. Core material accumulated around the age of the Aokautere Ash is poor in pollen and also lacks datable material possibly due to a combination of deteriorating climate conditions coinciding with the emplacement of a voluminous debris-avalanche deposit burying vast areas of eastern Taranaki. To gain better age control of the Eltham Swamp core pollen record and to fill the apparent gap, we focus on several discrete andesitic tephra beds preserved in the core and their correlation to the 30-25 ka Poto Tephras from Mt. Taranaki based on their physical properties. Close to their type locality near Cardiff fifteen closely spaced coarse ash and lapilli Poto beds are exposed with average grain sizes between -2 and 0.2 phi and strongly varying quantities of lithic and pumiceous components. Although these properties are useful indicators they also vary with distance (the core site being located c. 10 km SE from the studied outcrop). Thus, mineral assemblages appear to be more reliable diagnostic criteria to distinguish individual Poto beds, in particular varying proportions of feldspar and pyroxene and the occurrence/absence of hornblende. Interestingly, the Poto.c member contains abundant phlogopite phenocrysts, which provide a distinctive criterion for correlation purposes.
Geosciences 2012
HOST SponsorDepartment of Earth and Ocean Sciences
Faculty of Science and Engineering
Broad Memorial Fund
GOLD Sponsors
BRONZE Sponsors
NZJGG BBQ Sponsor TEA BREAK Sponsor
EXHIBITORS
DINNER PRIZES