UNIQUE PUBLISHERS (I) PVT. LTD.
140
UNIQUE PUBLISHERS (I) PVT. LTD. Content developed by UNIQUE PUBLISHERS (I) PVT. LTD.
-
Upload
khangminh22 -
Category
Documents
-
view
0 -
download
0
Transcript of UNIQUE PUBLISHERS (I) PVT. LTD.
UNIQUE P
UBLISHERS (I
) PVT. L
TD.
Content developed by UNIQUE PUBLISHERS (I) PVT. LTD.
UNIQUE P
UBLISHERS (I
) PVT. L
TD.
Content developed by UNIQUE PUBLISHERS (I) PVT. LTD.
UNIQUE P
UBLISHERS (I
) PVT. L
TD.
Content developed by UNIQUE PUBLISHERS (I) PVT. LTD.
Dedicated toMy students, the strength of this book.

UNIQUE P
UBLISHERS (I
) PVT. L
TD.
Content developed by UNIQUE PUBLISHERS (I) PVT. LTD.

UNIQUE P
UBLISHERS (I
) PVT. L
TD.
Content developed by UNIQUE PUBLISHERS (I) PVT. LTD.
v
I would like to convey my deepest thanks to Mr Brijendra Singh at Vajiram and Ravi IAS Institute, for his constant support in planning and reviewing the book.
A special thanks to my idols.
• Shri Rajiv Mehrishi IAS (Comptroller and Auditor General of India)
• Shri Sanjeev Tripathi IPS (Secretary, Research and Analysis Wing-R&AW)
• Shri Vikram Sood IPS (Secretary, Research and Analysis Wing-R&AW)
• Shri Tilak Devasher IPS (Special Secretary, Research and Analysis Wing-R&AW)
• Shri Rakesh Bansal IAS (Chairman, BSE, Madhya Pradesh)
• Shri Y.K. Chaudhary IRS (Chief Commissioner, Income Tax)
• Shri Shishir Priyadarshi IAS (India’s Representative to WTO, Geneva)
• Shri MK Dhar IPS ( Joint Director, Intelligence Bureau)
• Smt Meera Mehrishi IAS
A very special thanks to my former colleague, Mr DKSP (name withheld for security reasons), of the R&AW, who is presently unleashing an inner rajnikanth somewhere deep inside Pakistan and Afghanistan. After all, the dirtiest actions should be carried out by the most honest men.
Loads of thanks are due to all my friends and well-wishers, specially including, Sonali Bansal, Avani Mishra, Neha Bhatia, Priti Shinde & Prateek Thube IPS, Abhishek Shingte, Dipika Goyal IFoS, Asmita Tripathi, VK Jain, Sanjiv Manocha, Avadh Ojha, Dr. Pawan Kapuria, Dr. Rahul Shanker, Satwick Bhan, Iqbal Singh, Jayant Parikshit, Atish Mathur, Sushant Verma, Bhawna Malhotra, Vaishali Anand, Hima Bindu, Shabbir Bashir, Minister Ashok Kumar, R. Elangovan sir of Vajiram. The academic family- Neeta Tripathi madam, Happymon Jacob sir of JNU, and Sanjay Kumar Raju sir, Dr. Preeti and Vinay Mishra. Thank you Shivani Shingte for your support in the book.
I would like to thank my family members for their understanding and patience. A special thanks to Jasbir Singh, Moneesha Singh, Dizzy, KJ Singh, Sarita Singh, Robinder Singh, Sasha Singh, Sukanya Singh, Shishir Deo, Trinity Nagpal, PS Kochar & Manjit Kochar, Devnita Bakshi, Amar, Param, Kaushik and Kavleen.
—Pavneet Singh
ACKNOWLEDGEMENTS

UNIQUE P
UBLISHERS (I
) PVT. L
TD.
Content developed by UNIQUE PUBLISHERS (I) PVT. LTD.
vi
Dear Students,As we are already in the month of February, the time is running out for the preliminary exam 2020. This is the time when the students get burdened with revision and memorization. Two important sources called Economic Survey and India Year Book are important for the Prelims and both combined give 10-12 questions in the Prelims. In this book, I have made 100 questions from the economic survey. I would suggest that you revise your basic economics sources and integrate survey with the same.
I normally recommend a three-step strategy for economics. First, read the basic book called Indian Economy by Sanjiv Verma. Once done, the second step is to read a proper textbook on economics. Here, you can decide either Indian Economy by Mishra and Puri or Jayant Parikshit. I don’t find the need to read any NCERT book of economy or any “colored books” for two reasons because the above sources incorporate the needed information from NCERT books and also the sources above are written by subject experts who have spent a decade teaching their subject and not some random inexperienced & poor quality content creators normally hired for fooling aspirants. Third step is to read current affairs from newspapers and make your backward and forward linkages. It is at the third step that Economic Survey comes.
The book covers all the relevant information, needed for the Prelims and Mans exam, from the Budget 2020 and Economic Survey 2020 (Volume-1 and 2) in 100 questions and their answers. The content has been presented in easy to remember question and answer format. All relevant information and tables, sourced directly from the economic survey, have been presented, as needed for the civil services exam. The book will not only help in the Preliminary exam but also preparing for Economics in the GS Mains Paper-III for the Mains examination. The book is written in question and answer format and has 100 questions in total from both the volumes and this format will enable the readers to understand the concept and the context of the issues from the survey with clarity.
If you have any concerns or questions, please email me at [email protected]
Pavneet Singh
WHY TO READ THIS BOOK?
UNIQUE P
UBLISHERS (I
) PVT. L
TD.
Content developed by UNIQUE PUBLISHERS (I) PVT. LTD.
vii
VOLUME-I 3-50
1. Wealth Creation: the Invisible Hand Supported by the Hand of Trust 5-8
� What is the Role of the Invisible Hand of the Market- Historically and Today? 5
� What is the Role of Wealth Creation? 5 � Is there a Correlation of Wealth Creation by
Entrepreneurs to the Taxes Paid Representing Another Important Benefit to Society From Wealth Creation? 5
� Has Our Traditional Economic Thinking Has Always Emphasized Enabling Markets and Eliminating Obstacles to Economic Activity? 6
� Are Commerce and the Pursuit of Prosperity an Intrinsic Part of Indian Civilizational Ethos? 6
� Does Evidence Suggest That Since 1991 to Show That Enabling the Invisible Hand of Markets Has a Huge Impact in Enhancing Wealth Both in the Aggregate and Within Sectors? 6
2. Entrepreneurship and Wealth Creation At the Grassroots 9-10
� Present an Overview of Growth of New Firms in India? 9
� What Can Be Inferred by Analyzing Spatial Heterogeneity in Entrepreneurial Activity in India? 9
� What are the Factors That Drive Such Heterogeneity? 9
� What are Certain Policy Implications for Fast Tracking Entrepreneurial Activity and Wealth Creation? 10
3. Pro-Business Versus Pro-Crony 11-14
� What is the Concept of Creative Destruction? 11 � What is the Difference Between Pro-Business
and Pro-Crony Policy? 11 y Pro-Business 11
� In the Indian Case, Do You Think that the Sensex does Represent a Process of Creative Destruction Rather Than Spurious Dynamism? Discuss? 11
� What Does This Trend Indicate? is it a Cause for Concern or a Potential Case of More Concentration or a Reversal in Creative Destruction in the Economy? 12
� What are the Dangers of Regulatory Capture by Private Interests? Give an Example Using the Concept of ‘Connected’ Firms? is there a Relationship Between Such Connections and Rent-Seeking Activities When Institutional Checks and Balances are Weak? 12
� Do Global Studies Reinforce the Relationship Between Connections and Rent-Seeking Activities When Institutional Checks and Balances are Weak? 13
C ONTENTS
GENERAL OVERVIEW
� What Does the Survey 2020 Intend to Achieve? 1 � What are the Historical Roots of the Idea of Wealth Creation? 1 � What Levers are Identified by the Survey for Wealth Creation? 1
UNIQUE P
UBLISHERS (I
) PVT. L
TD.
Content developed by UNIQUE PUBLISHERS (I) PVT. LTD.
viii
� Evidence From Asia 13 y China 13 y Thailand 13 y Indonesia 14 y Malaysia 14 y Vietnam 14
� The Pro-Business Policies Increase Competition, Correct Market Failures, or Enforce Business Accountability, Pro-Crony Policies Hurt Markets. Discuss? 14
4. Undermining Markets: When Government Intervention Hurts More Than it Helps 15-24
� In the Global Indices of Economic Freedom, Why Does India Rank in the Bottom Half? 15
� Indian Economy is Replete With Examples Where Government Intervenes Even If there is No Risk of Market Failure and in Some Instances Its Intervention Has Created Market Failures. Substantiate With Example of Essential Commodities Act? 15
� Discuss the Significance of the Drugs Prices Control Order (Dpco) in Public Health? 17
� The Intervention of Government in Food Grain Market Has Led to a Strong Disconnect Between Demand and Supply of Grains in Food Grains Markets. Illustrate by Examining the Government Strategy of Food Security and Intervention of the Food Corporation of India? 18
� Given the Prevalence of Government Intervention in the Form of Farm Debt Relief in India, Present an Analysis of the Consequences on Both the Beneficiaries and the Credit Market in General? 20
� Debt Waivers Impact Credit Markets Negatively. Illustrate With an Examples? 20
� There is Evidence That India is Still Stuck With Several Forms of Government Intervention That are Anachronistic With Today’s Economy. Illustrate Through Examples Where India Has Traverse the Transition From a Command and Control Economy to a Market-Driven Economy? 21
5. Jobs and Growth by Specializing to Exports in Network Products 25-28
� Present an Analysis of Evolution of India’s Trade Sector Since 1991? 25
� Is India’s Lackluster Export Performance Caused by a Lack of Diversification in Its Export Basket (Extensive Margin) or is it Because of a Lack of Specialization (Intensive Margin)? Build Your Answer by Giving an Illustration of India’s Under-Performance in Exports Vis-À-Vis China? 25
� Is it Desirable to Promote Strong Local Linkages for Domestic Industries by Sourcing Intermediate Inputs Domestically or to Participate in GVCS Wherein Linkages are Globally Dispersed? 26
� Given Our Comparative Advantage in Labour-Intensive Activities and the Imperative of Creating Employment for a Growing Labour Force, Which Groups of Industries That Hold the Greatest Potential for Export Growth and Job Creation? Present a Case of How India Can Emerge as a Major Hub for “Network Products” (NP)? 27
� The Basic Trade Theory Teaches Us That a Country’s Gains From Free Trade Arise From the Fact That it Leads to a More Efficient Allocation of a Country’s Resources. Does the Evidence Support the Naïve Mercantilist’s Perspective? Examine in the Light of the Recent Debate About India Not Joining the Regional Comprehensive Economic Partnership (RCEP) Agreement Analyzing the General Efficacy of Free Trade Agreements (FTAS)? 28
6. Targeting Ease of Doing Business in India 29-31
� A Major Challenge Most Companies Face is the Complex Architecture of the Indian Governance Framework Including the Density of Legislation and Statutory Compliance Requirements. Give a List of the Rules Required to Be Complied, With, by Manufacturing Units? 29
� What is Authorised Economic Operator Programme? 30
� Who is Entitled for Aeo Certification 31 y Eligibility 31
� Present a Survey of the Banking Sector in India? 32 � What is the Overall Value That the Taxpayer
Derives From Her Investment in PSBS? 32
7. Golden Jubilee of Bank Nationalisation: Taking Stock 32-39
� India Needs to Recognise that the Fulfilment of Social Goals Can Happen at Scale Through Financial Intermediation. Examine the Statement by Analyzing the Case of Microfinance Sector? 33

UNIQUE P
UBLISHERS (I
) PVT. L
TD.
Content developed by UNIQUE PUBLISHERS (I) PVT. LTD.
ix
� Examine the Banking Structure in India Since Nationalization Till Today? 34
� What Did Bank Nationalization Achieve? Analyze 34
� Present an Argument on How to Strengthen Public Sector Banks in India. What is the Way Forward? 35
� What is Fintech? Why Should Psbs Embrace It? How Can Fintech Integrate With Emerging Technologies of Machine Learning (ML), Artificial Intelligence (AI) and Big Data? 37
� What is Shadow-Banking System? 40 � What is the Conceptual Framework of
Rollover Risks? 40
8. Financial Fragility in the NBFC Sector 40-41
� Discuss the UK Model of Privatization? 42 � are Their Any Benefits of Privatization?
Substantiate With Evidence? 42
9. Privatization and Wealth Creation 42-44
� Trace the Evolution of Disinvestment Policy of India? 43
� What is Temasek Holdings Model of Singapore? 44
10. Is India’s GDP Growth Overstated? No! 45-45
� Has the Change in the Base Year for GDP Supported Global Standardization and Comparability? 45
� Is India’s Gdp Overstated? Present Your Argument? 45
� Can We Relate Economics to the Common Person’s Life Every Day? Illustrate with Thalinomics? 46
� How is the Price of Thali Constructed? 46
11. Thalinomics: the Economics of a Plate of Food in India 46-50
� Discuss Some Major Initiatives for Enhancing Productivity of Agriculture and Efficiency of Agricultural Markets? 47
� Discuss the Share of a Day’s Wage of a Worker Needed to Afford Two Vegetarian and Non-Vegetarian Thalis for a Household of Five Individuals? 48
VOLUME-II 51-123
1. State of the Economy 53-63
� Give a Glimpse of the Output of the Global Economy? 53
� Discuss the Overall Size of the Indian Economy? is India Poised to Rebound for a 5 Trillion Dollar Economy? 53
� How has Indian Economy Faired with Respect to Inflation? 54
� As Several Polices Have Been Implemented to Enhance the Formalization of the Economy, Examine the Impact of these Policies on the Formalization of the Economy? 54
� How Has India’s External Sector Performed in 2019? 55
� What is the Concept of Virtuous Cycle of Higher Fixed Investment-Higher Gdp Growth-Higher Consumption Growth? 58
� What is the Cause of Drag of Financial Sector on Private Corporate Investment? is it Possible that this Excessive Bank Lending, Driven by the Irrational Exuberance of the Boom Period, Led to a Decline in Corporate Investments in the Future? 59
� What are ‘Quasi-Corporates’? 59 � What is the Outlook for 2020? Discuss
the Downside and Upside Risks to an Expected Acceleration in GDP Growth? 59
y Downside Risks 60 y Upside Risks 60 y Projection of GDP Growth in 2020-21 61
� Government in 2019-20 has taken important Reforms to Boost the Overall Investment, Consumption and Exports in the Economy. Discuss? 61
� Measures to Boost Consumption 62 � Measures to Boost Exports 63 � Give a Glimpse of Fiscal Developments
in 2019? What are the Observations of Medium Term Fiscal Policy? 64

UNIQUE P
UBLISHERS (I
) PVT. L
TD.
Content developed by UNIQUE PUBLISHERS (I) PVT. LTD.
x
2. Fiscal Developments 64-78
� Discuss the Major Reforms in Corporate Taxation? 68
y Rationale Behind the Reform 69 y Who Will Benefit? 70
� Discuss the Major Initiatives for Disinvestment by the Government in 2019? 70
� Major Initiatives Taken by Dipam 70 y Strategic Disinvestment: 70 y Reduction of Shareholding in Select
CPSES Below 51% While Retaining Management Control 70
y Asset Monetization Framework 71 y Debt ETF 71
� Discuss the Major Measures Taken for Indirect Taxes During 2019-20? 71
y Basic Custom Duty (BCD) 71 y Goods and Services Tax (GST) 72 y A Single Source Fully Automated
Return System 72 y Generation and Quoting of Document
Identification Number 72 y Sabka Vishwas (Legacy Dispute Settlement)
Scheme 2019 72 y Quick Response (QR) Code 73 y Exemption From Filing of Annual Returns
for Small Taxpayers: 73 y Changes With Respect to Rates on Goods 73 y Changes With Respect to Rates on Services 74 y Measures Taken for MSMES During 2019-20 74
� Discuss the Major Measures taken for Direct Taxes During 2019-20 and Other Measures? 74
� Exemption From Deeming of Fair Market Value of Shares for Certain Transactions 76
� Other Measures Taken During the Year 2019-20 77
3. External Sector 79-83
� Who are the Top 10 Trading Partners of India? 79 � Analyze India’s Wto Diplomacy in 2019? 81 � What is the Performance of India with
Respect to Trade Logistics? 82 � How Have Fdi and Fpi Performed in the
Year of 2019? 82 � Discuss the Major Policy Changes Related
to Banking Regulation in India? 84
4. Monetary Management and Financial Intermediation 84-88
� Discuss the Changes in the Nbfc Sector? 85 � What is a Bilateral Netting Agreement? 86
y Major Steps Taken During Fy 2019–20 88
5. PricesandInflation 89-92
� Discuss the Current Trends in Inflation? 89 � Discuss the Measures Government has taken
to Stabilize Prices of Essential Food Items? 92
6. Sustainable Development And Climate Change 93-105
� India Follows a Holistic Approach for Achieving the SDGS by Implementing a Comprehensive Array of Schemes. Discuss? 93
� Target-Based Approach for SDG can Help Reinforcement of Policies and its Implementation. Examine with Examples? 93
� Make an Assessment of India’s Position with Respect to Climate Change? 94
� How has the Financial System of India Aligned with Sustainability? 97
� What is Green Climate Fund? 97 � What Was India’s Diplomacy at COP 25? 98 � Discuss India’s Initiatives for Climate Change
at the Global Level? 98 � India is Among a Few Countries in the World
Where, Despite Ongoing Developmental Efforts, Forest and Tree Cover are Increasing Considerably. Analyze? 100
� Burning of Agricultural Wastes in the Fields is a Practice That Results in a Number of Environmental Problems. Suggest Methods to Resolve the Concern? 103
� Unscientific Disposal of C&D Waste is One of the Key Contributors to the Air and Water Pollution. Suggest a Remedy? 104
� Discuss the Various Direct Income/Investment Support Schemes Introduced by the Government? 106
� Pradhan Mantri Kisan Samman Nidhi (Pm-Kisan) 106

UNIQUE P
UBLISHERS (I
) PVT. L
TD.
Content developed by UNIQUE PUBLISHERS (I) PVT. LTD.
xi
� Krushak Assistance for Livelihood and Income Augmentation (Kalia) Scheme of Odisha 106
� Mukhya Mantri Krishi Ashirwad Yojana of Jharkhand 106
� Rythu Bandhu of Telangana 106
7. Agriculture and Food Management 106-109
� Focus on Water Use Efficiency at Farm Level Through Precision or Micro Irrigation (Drip and Sprinkler Irrigation) has Become a Farm Imperative to Ensure a Sustainable Agricultural Practice. Discuss? 107
� What is National Crop Insurance Portal? 107 � Discuss the Achievements of Pradhan
Mantri Fasal Bima Yojana? 107 � Discuss the Features and Achievements
of Pradhan Mantri Kisan Sampada Yojana? 108 � What is the Concept of One Nation,
One Ration Card? 108
8. Industry and Infrastructure 110-115
� Industrial Sector Performance is Critical to Achieving the Ambitious Goal of Making India a Five-Trillion Economy. Give a Glimpse of the Performance of the Sector? 110
� Startups Drive Economic Growth, Create Employment and Foster a Culture of Innovation. Analyze the Performance of the Startups in 2019? 111
� What is the Concept of National Infrastructure Pipeline? 113
� Discuss the Different Verticals of the Pradhan Mantri Awas Yojana- Urban? 114
9. Services Sector 116-118
� How Does India Fair in World Commercial Services Export? 116
� Discuss the Share of Tourism and Employment Generation in the States in 2019? 117
� Discuss Various Schemes for School Education? 119 � Discuss Various Programs for Higher Education? 119
10. Social Infrastructure, Employment and Human Development 119-123
� A Wide Range of Reforms Has Been Introduced to the Apprenticeship Rules, 1992 for Expansion and Outreach of Apprenticeship Policy. Discuss? 120
� Discuss the Steps Taken by the Government for the Formalization Of Labor Market? 120
� To Encourage Female Participation in the Economy, Various Programmes/ Legislative Reforms are in Place. Discuss? 121
� Prime Minister’s Employment Generation Programme (Pmegp) 121
� Deendayal Antyodaya Yojana 122 � The Introduction of National Health Policy,
2017 Aims for Universal Access to Good Quality Health Care Services. Analyze? 122
BUDGET 2020 HIGHLIGHTS 124-128

UNIQUE P
UBLISHERS (I
) PVT. L
TD.
Content developed by UNIQUE PUBLISHERS (I) PVT. LTD.
UNIQUE P
UBLISHERS (I
) PVT. L
TD.
Content developed by UNIQUE PUBLISHERS (I) PVT. LTD.
General Overview 1
GENERAL OVERVIEW
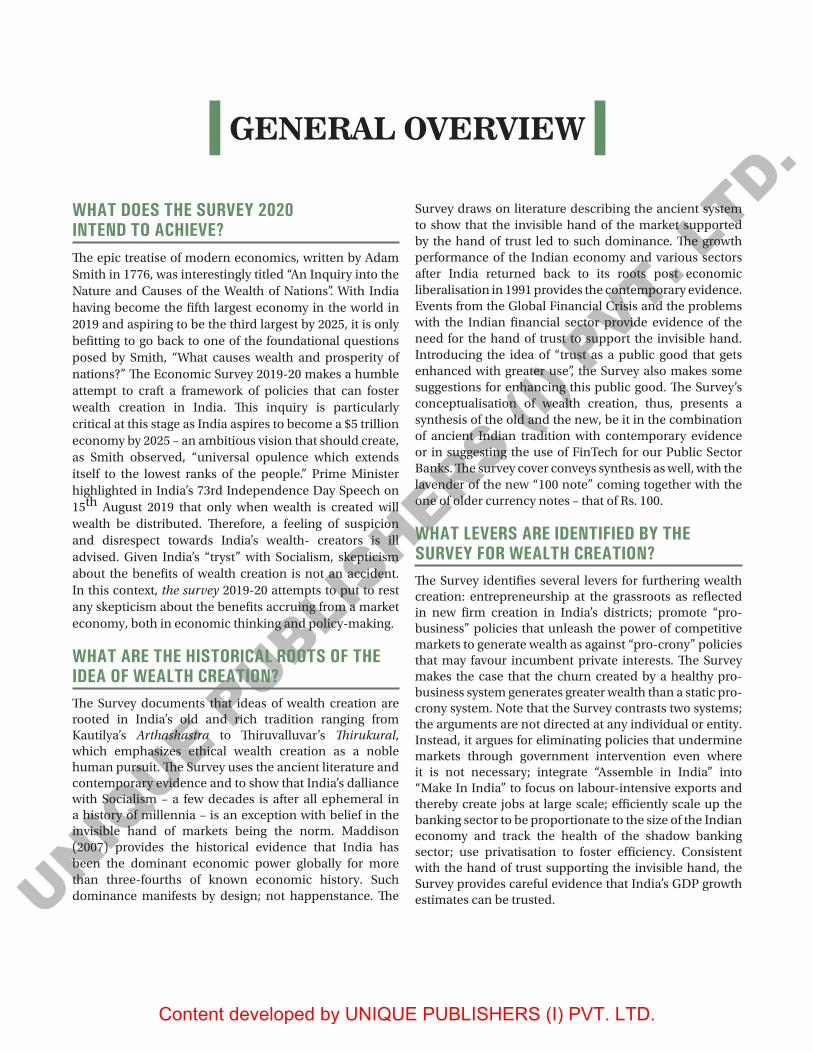
WHAT DOES THE SURVEY 2020 INTEND TO ACHIEVE?The epic treatise of modern economics, written by Adam Smith in 1776, was interestingly titled “An Inquiry into the Nature and Causes of the Wealth of Nations”. With India having become the fifth largest economy in the world in 2019 and aspiring to be the third largest by 2025, it is only befitting to go back to one of the foundational questions posed by Smith, “What causes wealth and prosperity of nations?” The Economic Survey 2019-20 makes a humble attempt to craft a framework of policies that can foster wealth creation in India. This inquiry is particularly critical at this stage as India aspires to become a $5 trillion economy by 2025 – an ambitious vision that should create, as Smith observed, “universal opulence which extends itself to the lowest ranks of the people.” Prime Minister highlighted in India’s 73rd Independence Day Speech on 15th August 2019 that only when wealth is created will wealth be distributed. Therefore, a feeling of suspicion and disrespect towards India’s wealth- creators is ill advised. Given India’s “tryst” with Socialism, skepticism about the benefits of wealth creation is not an accident. In this context, the survey 2019-20 attempts to put to rest any skepticism about the benefits accruing from a market economy, both in economic thinking and policy-making.
WHAT ARE THE HISTORICAL ROOTS OF THE IDEA OF WEALTH CREATION?The Survey documents that ideas of wealth creation are rooted in India’s old and rich tradition ranging from Kautilya’s Arthashastra to Thiruvalluvar’s Thirukural, which emphasizes ethical wealth creation as a noble human pursuit. The Survey uses the ancient literature and contemporary evidence and to show that India’s dalliance with Socialism – a few decades is after all ephemeral in a history of millennia – is an exception with belief in the invisible hand of markets being the norm. Maddison (2007) provides the historical evidence that India has been the dominant economic power globally for more than three-fourths of known economic history. Such dominance manifests by design; not happenstance. The
Survey draws on literature describing the ancient system to show that the invisible hand of the market supported by the hand of trust led to such dominance. The growth performance of the Indian economy and various sectors after India returned back to its roots post economic liberalisation in 1991 provides the contemporary evidence. Events from the Global Financial Crisis and the problems with the Indian financial sector provide evidence of the need for the hand of trust to support the invisible hand. Introducing the idea of “trust as a public good that gets enhanced with greater use”, the Survey also makes some suggestions for enhancing this public good. The Survey’s conceptualisation of wealth creation, thus, presents a synthesis of the old and the new, be it in the combination of ancient Indian tradition with contemporary evidence or in suggesting the use of FinTech for our Public Sector Banks. The survey cover conveys synthesis as well, with the lavender of the new “100 note” coming together with the one of older currency notes – that of Rs. 100.
WHAT LEVERS ARE IDENTIFIED BY THE SURVEY FOR WEALTH CREATION?The Survey identifies several levers for furthering wealth creation: entrepreneurship at the grassroots as reflected in new firm creation in India’s districts; promote “pro-business” policies that unleash the power of competitive markets to generate wealth as against “pro-crony” policies that may favour incumbent private interests. The Survey makes the case that the churn created by a healthy pro-business system generates greater wealth than a static pro- crony system. Note that the Survey contrasts two systems; the arguments are not directed at any individual or entity. Instead, it argues for eliminating policies that undermine markets through government intervention even where it is not necessary; integrate “Assemble in India” into “Make In India” to focus on labour-intensive exports and thereby create jobs at large scale; efficiently scale up the banking sector to be proportionate to the size of the Indian economy and track the health of the shadow banking sector; use privatisation to foster efficiency. Consistent with the hand of trust supporting the invisible hand, the Survey provides careful evidence that India’s GDP growth estimates can be trusted.

UNIQUE P
UBLISHERS (I
) PVT. L
TD.
Content developed by UNIQUE PUBLISHERS (I) PVT. LTD.
Economic Survey & Budget2

UNIQUE P
UBLISHERS (I
) PVT. L
TD.
Content developed by UNIQUE PUBLISHERS (I) PVT. LTD.
General Overview 3
VOLUME-I

UNIQUE P
UBLISHERS (I
) PVT. L
TD.
Content developed by UNIQUE PUBLISHERS (I) PVT. LTD.
Economic Survey & Budget4

UNIQUE P
UBLISHERS (I
) PVT. L
TD.
Content developed by UNIQUE PUBLISHERS (I) PVT. LTD.
Wealth Creation: The Invisible Hand Supported by the Hand of Trust 5
WHAT IS THE ROLE OF THE INVISIBLE HAND OF THE MARKET- HISTORICALLY AND TODAY?For more than three-fourths of known economic history, India has been the dominant economic power globally. Such dominance manifested by design. During much of India’s economic dominance, the economy relied on the invisible hand of the market for wealth creation with the support of the hand of trust. Specifically, the invisible hand of markets, as reflected in openness in economic transactions, was combined with the hand of trust by appealing to ethical and philosophical dimensions.
Figure: Global contribution to world’s GDP by major economies from 1 AD to 2003 AD
Note: X-axis of graph has non-linear scale, especially for 1-1500 AD, which underestimates the dominance of India.
There is contemporary evidence following the liberalization of the Indian economy support the economic model advocated in our traditional thinking. The exponential rise in India’s GDP and GDP per capita post liberalisation coincides with wealth generation in the stock market. Similarly, the evidence across various sectors of the economy illustrates the enormous benefits that accrue from enabling the invisible hand of the market. Indeed, the data clearly that sectors that were liberalized grew significantly faster than those that remain closed. The events in the financial sector during 2011-13 and the consequences that followed from the same illustrate the second pillar - the need for the hand of trust to support the invisible hand.
WHAT IS THE ROLE OF WEALTH CREATION?Economic dominance over such long periods manifests by design, and not by mere chance and our age-old traditions
have always commended wealth creation. While Kautilya’s Arthashastra is given as a canonical example, wealth creation as a worthy human pursuit is recognised by other traditional literature as well. The Thirukural, a treatise on enriching human life written in the form of couplets by Tamil saint and philosopher Thiruvalluvar, asserts in verses 753 of Chapter 76: “Wealth, the lamp unfailing, speeds to every land; Dispersing darkness at its lord’s command.” In verse 759 of the same chapter, which forms the second part of the Thirukural called Porul Paal or the essence of material wealth, Thiruvalluvar, declares: “Make money – there is no weapon sharper than it to sever the pride of your foes.” Needless to say, Thirukural advocates wealth creation through ethical means – an aspect that is discussed later in this chapter. Verse 754 in the same chapter avows: “(Wealth) yields righteousness and joy, the wealth acquired capably without causing any harm.”
Despite such a “rich” tradition of emphasizing wealth creation, India deviated from this model for several decades after independence. However, India returned back to these roots post economic liberalisation in 1991.
Sensex has not only grown after 1991, but has grown at an accelerating pace. Whereas crossing the first incremental 5000 points took over 13 years from its inception in 1986, the time taken to achieve each incremental milestone has substantially reduced over the years. Note that the acceleration in the Sensex was not due to the base effect. In fact, the higher acceleration stemmed from higher cumulative annual growth rate (CAGR). Yet, given India’s “tryst” with socialism, it is essential to emphasise its benefits in today’s milieu.
IS THERE A CORRELATION OF WEALTH CREATION BY ENTREPRENEURS TO THE TAXES PAID REPRESENTING ANOTHER IMPORTANT BENEFIT TO SOCIETY FROM WEALTH CREATION?Yes, It has been known that the wealth created by an entrepreneur correlates strongly with benefits that accrue to the employees working with the entrepreneur’s firms.
1Wealth Creation: The Invisible Hand Supported by the Hand of Trust

UNIQUE P
UBLISHERS (I
) PVT. L
TD.
Content developed by UNIQUE PUBLISHERS (I) PVT. LTD.
Economic Survey & Budget6
The wealth created by an entrepreneur correlates strongly with raw materials procured by the entrepreneur’s firms, which proxies the benefits that suppliers reap by supplying raw materials to the entrepreneur’s firms.
The wealth created by an entrepreneur correlates strongly with the capital expenditures made by the entrepreneur’s firms, which proxies the benefits that manufacturers of capital equipment reap by supplying such equipment to the entrepreneur’s firms.
Revenues earned in foreign exchange enable macroeconomic stability by enabling the country to pay for its imports and keeping the current account deficit at manageable levels.
The wealth creation by entrepreneurs correlates strongly with the foreign exchange revenues earned by the entrepreneurs’ firms.
The wealth created by an entrepreneur helps the country’s common citizens. Tax revenues enable Government spending on creating public goods and providing welfare benefits to the citizens. We correlate the wealth created by the entrepreneur with the direct taxes paid. Clearly, direct taxes underestimate the benefits accruing to the Government because it does not include the indirect taxes paid by the entrepreneur’s firms, the direct taxes paid by the employees or the suppliers. Yet, as a proxy for the benefits accruing to the citizens through spending of tax revenues by the Government, this figure captures the benefits accruing to the country’s common citizens. Therefore, the strong correlation of wealth creation by entrepreneurs to the taxes paid represents another important benefit to society from wealth creation.
HAS OUR TRADITIONAL ECONOMIC THINKING HAS ALWAYS EMPHASIZED ENABLING MARKETS AND ELIMINATING OBSTACLES TO ECONOMIC ACTIVITY? Kautilya averred that the root of wealth is economic activity and lack of it brings material distress. In the absence of fruitful economic activity, both current prosperity and future growth are in danger of destruction. A king can achieve the desired objectives and abundance of riches by undertaking productive economic activity. Kautilya advocates economic freedom by asking the King to “remove all obstructions to economic activity”.
A stakeholders- model existed in India as is discernible in Arthashastra in which entrepreneurs, workers and consumers share prosperity and Arthashastra as a treatise on economic policy was deeply influential in the functioning of the economy until the 12th century. During much of India’s economic dominance, the economy relied on the invisible hand of the market.
ARE COMMERCE AND THE PURSUIT OF PROSPERITY AN INTRINSIC PART OF INDIAN CIVILIZATIONAL ETHOS?A key contributor to ancient India’s prosperity was internal and external trade. Two major highways Uttarapatha (the Northern Road) and Dakshinapatha (the Southern Road) and its subsidiary roads connected the sub-continent. Meanwhile, ports along India’s long coastline traded with Egypt, Rome, Greece, Persia and the Arabs to the west, and with China, Japan and South East Asia to the east. Much of this trade was carried out by large corporatized guilds akin to today’s multinationals and were funded by temple-banks. Thus, commerce and the pursuit of prosperity is an intrinsic part of Indian civilizational ethos.
DOES EVIDENCE SUGGEST THAT SINCE 1991 TO SHOW THAT ENABLING THE INVISIBLE HAND OF MARKETS HAS A HUGE IMPACT IN ENHANCING WEALTH BOTH IN THE AGGREGATE AND WITHIN SECTORS?Data suggests that credit in the banking sector expanded at much higher rates after the sector was opened for competition through licenses granted to private sector banks. As competition expanded the banking choices available to citizens, the sector experienced strong growth. The data shows a similar effect in the mutual funds sector following its opening up to competition in 2003.
While we examine growth in an open sector, which is defined as one where citizens can choose among many different producers, vis-à-vis a closed sector, where the citizen cannot exercise this choice, data suggests the growth in the cargo volumes in an open sector (small ports) versus a closed sector (large ports) and show the growth in freight and passenger traffic in an open sector (roads) when compared to a closed sector (railways); thus highlight the positive impact of enabling economic choice for citizens in the economy.

UNIQUE P
UBLISHERS (I
) PVT. L
TD.
Content developed by UNIQUE PUBLISHERS (I) PVT. LTD.
Wealth Creation: The Invisible Hand Supported by the Hand of Trust 7
BOX: TRUST AS A PUBLIC GOOD: ARISTOTLE AND KAUTILYA VS. MACHIAVELLI
The Survey introduces the idea of “trust as a public good that gets enhanced with greater use”. Trust can be conceptualized as a public good with the characteristics of non-excludability i.e., the citizens can enjoy its benefits at no explicit financial cost. Trust also has the characteristics of non-rival consumption i.e., the marginal cost of supplying this public good to an extra citizen is zero. It is also non-rejectable i.e., collective supply for all citizens means that it cannot be rejected. Unlike other public goods, trust grows with repeated use and therefore takes time to build (Gambetta, 1998). Lack of trust represents an externality where decision makers are not responsible for some of the consequences of their actions.
Given the importance of trust in an economy, one might reasonably expect economic theory to address it, especially in the literature on transaction cost economics or incomplete contracts. However, this is not the case. Nobel laureate Oliver Williamson who specializes in transaction cost economics plainly states that there is no such thing as trust within economic activity: ‘It is redundant at best and can be misleading to use the term “trust” to describe commercial exchange for which cost-effective safeguards have been devised in support of more efficient exchange. Calculative trust is a contradiction in terms’ (Williamson, 1993, p. 463). Williamson does concede that there is a role of calculative co-operation based on incentives and governance structures: ‘Machiavellian grabbing is not implied if economic agents have a more far-sighted understanding of the economic relations of which they are a part than myopic Machiavellianism ascribes to them’ (Williamson, 1993, p. 474). He argues that calculative co- operation is more likely when agents have longer time horizons, which is also true for trust.
Equally, one would expect trust to be addressed in the incomplete contracts literature. The incomplete contracting paradigm was pioneered by Nobel laureate Oliver Hart with his co-authors Sanford Grossman, and John Moore. They argue that contracts cannot specify what is to be done in every possible contingency. So, it is reasonable to expect trust as a concept to be addressed in such a paradigm because economic agents will only risk entering into incomplete contracts if they trust their counterparts to adapt to unexpected outcomes in a manner that respects a fair division of economic returns. However, while the incomplete contracting literature analyses self-enforcing implicit contracts where myopic behaviour, i.e. opportunism, is restricted by concern for calculative, yet long-term, interest of either party (Baker et al. 1998).
In contrast to the transaction cost or incomplete contracting paradigm, individuals not only have material needs but also needs of self-esteem and self-actualization (Maslow, 1943).
This view of humans relates directly to Benabou and Tirole (2006)’s schema, where people take actions to signal to themselves who they are. People’s self-esteem needs could inter alia stem from their intrinsic motivation to be “trustworthy.”
This contrast between modern economic theory’s view of people as “knaves” derives from the view of humans that Machiavelli and Hume present. Hume (1964) for instance posits: “Every man ought to be supposed to be a knave and to have no other end, in all his actions, then in his private interest. By this interest we must govern him, and, by means of it, make him, notwithstanding his insatiable avarice and ambition, cooperate to public good.” Economic policy today largely proceeds according to Hume’s maxim.
Yet, Aristotle’s view is in stark contrast to that of Hume or Machiavelli. Aristotle holds that “good laws make good citizens,” by inculcating habits and social virtue. Confucius advices government that “Guide them with government orders, regulate them with penalties, and the people will seek to evade the law and be without shame. Guide them with virtue, regulate them with ritual, and they will have a sense of shame and become upright.” People become “upright” when guided by “virtue” and regulated by “ritual” rather than by orders and penalties. Kautilya is often presented as the Machiavelli of India. This is derived from a partial reading of the Arthashastra based on selectively quoting sections on spies and internal/external security. The Arthashastra literally means “The Treatise on Wealth” and it extensively discusses issues ranging from urban governance to tax administration and commerce. The book explicitly presents its intellectual framework right in the beginning by stating that good governance is based on the following branches of knowledge: Varta (economic policy), Dandaneeti (law and enforcement), Anvikshiki (philosophical and ethical framework) and Trayi (cultural context). The importance of Anvikshiki in Kautilya’s writings is often ignored but is critical to understanding his worldview. Interestingly this mirrors Adam Smith who did not just advocate the “invisible hand” but equally the importance of “mutual sympathy” (i.e. trust). The same idea is reflected in the writings of Friedrich Hayek, who advocated not only economic freedom but also a set of general rules and social norms that applies evenly to everyone.
Aristotle’s, Confucius’ and Kautilya’s notions may seem quaint in a 21st century worshipping self-interested greed. Yet, the events leading to and following the Global Financial Crisis clearly demonstrate that the intrinsic motivation to be “trustworthy” can generate trust as a public good while the intrinsic motivation of uninhibited greed can debase the same public good of trust. For
UNIQUE P
UBLISHERS (I
) PVT. L
TD.
Content developed by UNIQUE PUBLISHERS (I) PVT. LTD.
Economic Survey & Budget8
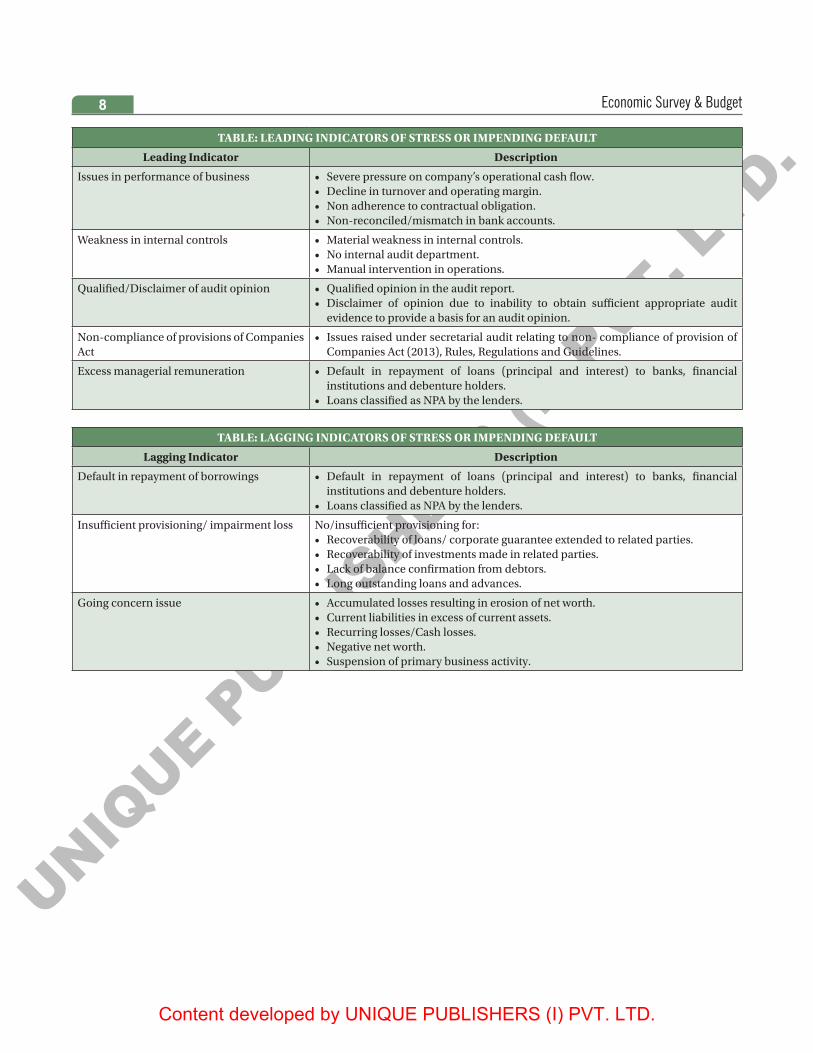
TABLE: LEADING INDICATORS OF STRESS OR IMPENDING DEFAULT
Leading Indicator Description
Issues in performance of business • Severe pressure on company’s operational cash flow.• Decline in turnover and operating margin.• Non adherence to contractual obligation.• Non-reconciled/mismatch in bank accounts.
Weakness in internal controls • Material weakness in internal controls.• No internal audit department.• Manual intervention in operations.
Qualified/Disclaimer of audit opinion • Qualified opinion in the audit report.• Disclaimer of opinion due to inability to obtain sufficient appropriate audit
evidence to provide a basis for an audit opinion.
Non-compliance of provisions of Companies Act
• Issues raised under secretarial audit relating to non- compliance of provision of Companies Act (2013), Rules, Regulations and Guidelines.
Excess managerial remuneration • Default in repayment of loans (principal and interest) to banks, financial institutions and debenture holders.
• Loans classified as NPA by the lenders.
TABLE: LAGGING INDICATORS OF STRESS OR IMPENDING DEFAULT
Lagging Indicator Description
Default in repayment of borrowings • Default in repayment of loans (principal and interest) to banks, financial institutions and debenture holders.
• Loans classified as NPA by the lenders.
Insufficient provisioning/ impairment loss No/insufficient provisioning for:• Recoverability of loans/ corporate guarantee extended to related parties.• Recoverability of investments made in related parties.• Lack of balance confirmation from debtors.• Long outstanding loans and advances.
Going concern issue • Accumulated losses resulting in erosion of net worth.• Current liabilities in excess of current assets.• Recurring losses/Cash losses.• Negative net worth.• Suspension of primary business activity.
UNIQUE P
UBLISHERS (I
) PVT. L
TD.
Content developed by UNIQUE PUBLISHERS (I) PVT. LTD.
Entrepreneurship and Wealth Creation at the Grassroots 9
PRESENT AN OVERVIEW OF GROWTH OF NEW FIRMS IN INDIA?The World Bank’s EODB Entrepreneurship data together with that from the U.S. Census Bureau tells us that India has the 3rd largest entrepreneurship ecosystem in the world. On a per-capita basis, India has low rates of entrepreneurship in the formal economy.
While the number of new firms in the formal sector grew at a cumulative annual growth rate of 3.8 per cent from 2006-2014, the growth rate from 2014 to 2018 has been 12.2 per cent. As a result, from about 70,000 new firms created in 2014, the number has grown by about 80 per cent to about 1,24,000 new firms in 2018.
This data suggests the importance of entrepreneurship as an engine of economic growth and change in India. They further mute the view that entrepreneurial activity in emerging economies like India is largely necessity driven and typically borne from a lack of alternative employment options. Rather, the incidence of productive and growth-focused entrepreneurial activity in the formal sector in India. If we see the spatial dispersion in entrepreneurial activity as defined by establishment of new firms, we find that, though the peninsular states dominate entry of new firms, entrepreneurship is dispersed across India and is not restricted just to a few metropolitan cities. Movement of labour from other unproductive sectors and subsistence entrepreneurship into entrepreneurship in formal manufacturing and services can help close India’s productivity gaps. To the extent that the manufacturing and services sectors are underdeveloped relative to economies of similar size, greater entrepreneurial activity will help close such gaps.
WHAT CAN BE INFERRED BY ANALYZING SPATIAL HETEROGENEITY IN ENTREPRENEURIAL ACTIVITY IN INDIA?All regions demonstrate strong growth in entrepreneurial activity over time with the exception of the eastern states. States in the highest quintile of relative entrepreneurial activity in the Agriculture sector are Manipur, Meghalaya, Madhya Pradesh, Assam, Tripura and Orissa. Establishments in the North East are more likely to be private enterprises in the food business such as organic
produce farms and tea plantations while a majority of the establishments in Madhya Pradesh and Orissa are farmer producer companies, designed as hybrids between cooperative societies and private limited companies that organize farmers into a collective to improve their bargaining strength in markets.
Manufacturing sector is highest in the regions of Gujarat, Meghalaya, Puducherry, Punjab and Rajasthan. Within Gujarat, the most entrepreneurially active districts in the Manufacturing sector are Surendranagar, Rajkot, Bhavnagar and Surat. Establishments in these regions are focused on textiles, chemicals, metals, plastics, and pharmaceuticals manufacturing. The nature of establishments in each of these regions attests to agglomeration economies documented by prior research in the Indian manufacturing sector
That is, incumbent industrial structures for input and output markets and specialized labour in a region are strongly linked to higher entrepreneurial activity in that industry-region.
The entrepreneurial activity in the Services sector is highest in the regions of Delhi, Mizoram, Uttar Pradesh, Kerala, Andaman and Nicobar, and Haryana. The nature of establishments in these regions is not reflective of agglomeration economies and spans diverse industries such as trading, financial services, tourism and hospitality services, retailing, and even religious leagues and missions.
The entrepreneurial activity in the Infrastructure sector is highest in the states of Jharkand, Arunachal Pradesh, Himachal Pradesh, Mizoram, Jammu and Kashmir and Bihar, some of which are characterized by poor levels of extant infrastructure. Not surprisingly, new firms in these states are largely engaged in construction, logistics and transport, utilities generation, transmission and distribution, alternative energy distribution, and Infratech.
WHAT ARE THE FACTORS THAT DRIVE SUCH HETEROGENEITY?While these attributes do not constitute an exhaustive list of conditions, they are widely featured in prior research on entrepreneurship and economic development in India. These measures of social infrastructure largely relate to the general education levels. Higher education levels enable the development of better human capital that relates
2Entrepreneurship and Wealth Creation at the Grassroots

UNIQUE P
UBLISHERS (I
) PVT. L
TD.
Content developed by UNIQUE PUBLISHERS (I) PVT. LTD.
Economic Survey & Budget10
to increased supply of ideas and entrepreneurs. Higher education also increases the supply of talent available to entrepreneurs for managing and growing their companies. Therefore, it is expected that states with better education levels will have higher entrepreneurial activity. The measures of physical infrastructure include access to basic physical infrastructure in the district as well as physical connectivity that captures across- district infrastructure in most cases. Physical connectivity is measured as the mean distance from a population centre that has at least 500,000 people. Proximity to large population centers likely allows the startup to expand markets and scale operations.
WHAT ARE CERTAIN POLICY IMPLICATIONS FOR FAST TRACKING ENTREPRENEURIAL ACTIVITY AND WEALTH CREATION?First, measures to increase the literacy levels rapidly through the institution of more schools and colleges will spur entrepreneurship and consequently local wealth creation. Following the successful contribution of privatization of engineering colleges to India’s software
exports, governments could also explore the privatization of education to augment education capacity at all levels of education.
Second, better connectivity of villages through tar roads will likely improve access to local markets and improve entrepreneurial activity. However, in terms of prioritization, this may not be as crucial as investments in education. Moreover, increasing the access to local markets might create other types of opportunities which might discourage entrepreneurship. Hence investments in infrastructure especially those undertaken to increase entrepreneurial activity should be weighed against how improved infrastructure creates other kinds of opportunities that might be consequential. Third, policies that foster ease of doing business and flexible labour regulation foster entrepreneurial activity, especially in the manufacturing sector. As the manufacturing sector has the potential to create the maximum jobs, states must focus on enabling ease of doing business and flexible labour regulation to foster job creation. This fact reflects India’s new economic structure, i.e. comparative advantage in the Services sector.

UNIQUE P
UBLISHERS (I
) PVT. L
TD.
Content developed by UNIQUE PUBLISHERS (I) PVT. LTD.
Pro-Business versus Pro-Crony 11
3Pro-Business versus Pro-Crony
WHAT IS THE CONCEPT OF CREATIVE DESTRUCTION?Creative destruction is a “process of industrial mutation that incessantly revolutionizes the economic structure from within, incessantly destroying the old one, incessantly creating a new one.” Creative destruction brings new innovations into the market that serve people better than the old technologies they displace. It brings new firms into the markets, which compete with existing firms and lower prices for consumers. It brings dynamism to the marketplace that keeps firms on their toes, always on the lookout for the next big way to serve consumers. It has only one pre- requisite – a pro-business policy stance that fosters competitive, unfettered markets. When creative destruction is fostered, sectors as a whole will always outperform individual companies within the sector in creating wealth and maximizing welfare. Therein lies the motivation for India to pursue pro-business, rather than pro-crony, growth.
WHAT IS THE DIFFERENCE BETWEEN PRO-BUSINESS AND PRO-CRONY POLICY?
Pro-business
• Firms compete on a level playing field• Resource allocation in the economy is efficient• Citizens’ welfare is maximized Pro-crony• Some incumbent firms may receive preferential
treatment• Resource allocation in the economy may not be
efficient• Citizens’ welfare may not be maximized
IN THE INDIAN CASE, DO YOU THINK THAT THE SENSEX DOES REPRESENT A PROCESS OF CREATIVE DESTRUCTION RATHER THAN SPURIOUS DYNAMISM? DISCUSS?The liberalization of the Indian economy in 1991 unleashed competitive markets. It enabled the forces of creative destruction, generating benefits that we still witness today.
Broadly, the growth of the Sensex can be divided into three phases after 1999. Phase I from 1999 to 2007 saw
an acceleration in the growth of the Sensex, with each successive 5000-point mark taking lesser and lesser time to achieve. Phase II from 2007 to 2014 saw a slowdown in the index’s growth. This phase coincides with the global slowdown in 2008 among other unfavorable events. Phase III began in 2014 and saw a revival in response to structural reforms and improvement in global liquidity. Strikingly, in this phase, the Sensex jumped from the 30,000 mark to the 40,000 mark in just two years.
The relationship between pro-business policy and creative destruction is mirrored in the composition of the Sensex over the years. For the first ten years since the Sensex’s inception in 1986, the firms that constituted the index barely changed. The firms that constituted the index during its inception in 1986, nearly all the firms were retained for the majority of the next decade. On the other hand, the constituents of the Sensex of 1997 were steadily churned out over the next decade, so that the Sensex of 2006 had barely half the firms from the Sensex of 1997.
The lack of dynamism in the constitution of the index in its initial years was largely representative of the lack of dynamism in the Indian economy in general. However, the years following 1991 liberalization saw the rapid emergence of new firms, new ideas, new technologies and new operating processes, causing a steep revision of the Sensex in 1996. In 1996, half of the constituents of the index were replaced. After 1996, the Sensex underwent more frequent revisions, owing to the more dynamic nature of the now substantially more competitive Indian market.
Pro-business policy, i.e., liberalization caused a spike in the number of firms churned in the years that immediately followed it, but the churn rate did not decline to pre-liberalization levels in later years.
Ten firms were churned out in the five years from 2006 to 2010, eight in 2011-15 and ten in 2016-19. Put differently, every five years, roughly one-third of the firms in the index are replaced. The firms that displaced the incumbents on the Sensex brought with them new ideas, technologies and processes. New sectors like banks and financials entered the index for the first time, eroding the predominance of the manufacturing sector on the index, placing the services sector on the map for the first time, and reflecting the far- reaching changes that the Indian economy was witnessing in the wake of liberalization. The initial Sensex of 1986 was dominated by the Materials and Consumer Discretionary

UNIQUE P
UBLISHERS (I
) PVT. L
TD.
Content developed by UNIQUE PUBLISHERS (I) PVT. LTD.
Economic Survey & Budget12
sectors, accounting for two-thirds of the firms on the Sensex. Sectors like financials, telecommunications and information technology were non-existent in the index then. With the entry of these new sectors, today’s Sensex is far less concentrated than the Sensex of the 1980s and 1990s, and mirrors the far lower sectoral concentration of the Indian economy as a whole.
Today’s Sensex is not only composed of a larger number of sectors, but is also far more democratic in terms of the size of companies. In 1991, the largest firm on the index was roughly 100 times the smallest in terms of market capitalization. Ten years later, the ratio declined to roughly 75. In 2018, the ratio was only 12. The benefit of liberalizing markets does not end with a one- time drop in the ratio and continues to be felt even today.
The forces of creative destruction following liberalization in the Indian economy have led to the rise of new sectors such as financials and information technology which virtually non-existent in the Sensex of the early 1990s and the share of these sectors in the total market capitalization has increased over the years, so much so that these sectors dominate the Sensex today.
WHAT DOES THIS TREND INDICATE? IS IT A CAUSE FOR CONCERN OR A POTENTIAL CASE OF MORE CONCENTRATION OR A REVERSAL IN CREATIVE DESTRUCTION IN THE ECONOMY?We can expect today’s dominant firms to remain dominant for only one-fifth of the time that their pre- liberalization counterparts did. New sectors bringing with them new technologies and products are displacing the sectors once considered mainstays of the Indian economy. The competitive advantage of entrenched firms is being rapidly challenged by new, smaller and more agile firms; every five years, roughly one in three firms in the Indian economy can expect to be challenged in a massive way by the forces of creative destruction. Finally, the difference between the sizes of the largest and smallest firms is rapidly shrinking, and consequently monopoly power in the economy is declining and making way for more competitive markets. Consumer benefit from an increased variety of goods and services, lower prices and incessant improvement in the quality of existing products.
There is a common misconception that people who are in favour of a free market are also in favour of everything that big business does. Nothing could be further from the truth. Pro-crony policy supports incumbent firms but does not necessarily foster competitive markets. On the other hand, policy that fosters competitive markets (hereafter pro-business policy) creates a level playing field for businesses to compete. It unleashes the powerful forces of creative destruction, which create wealth.
WHAT ARE THE DANGERS OF REGULATORY CAPTURE BY PRIVATE INTERESTS? GIVE AN EXAMPLE USING THE CONCEPT OF ‘CONNECTED’ FIRMS? IS THERE A RELATIONSHIP BETWEEN SUCH CONNECTIONS AND RENT-SEEKING ACTIVITIES WHEN INSTITUTIONAL CHECKS AND BALANCES ARE WEAK?Raghuram Rajan and Luigi Zingales, who stressed the need for “saving capitalism from the capitalists” in their eponymous book referred to the dangers of regulatory capture by private interests.
Pro-crony policies, in contrast to pro- business ones, erode wealth in the economy as cronyism fosters inefficiencies by inhibiting the process of creative destruction.
Ambit Pvt Ltd, a brokerage, publishes a stock market index of 75 Indian firms that they define as “connected”. Prior to 2010, it clearly paid a firm and its shareholders if the firm’s promoters had “connections”. The index of “connected” firms consistently outperformed the BSE 500 index as these firms systematically made more profits than would have been possible in a more competitive economy. The market priced the current and future abnormal profits of these firms. In late 2010, the Comptroller and Auditor General’s audit report on the 2G spectrum allocation named a list of private companies that benefitted from alleged collusions in the allocation of the 2G spectrum. he CAG report on the 2G allocations appears to have reversed the fortunes for “connected” firms. The “connected” index started to underperform the market starting 2011. In fact, the gap for the investor wealth destroyed by “connected” firms is widening over time, which reflects the inability of such firms to systematically create value for their investors from extracting rents based on their political connections. Had an investor invested ` 100 in these “connected” firms at the start 2007, her investment would have grown to ` 190 by the start of 2010. On the other hand, had she invested ` 100 in the BSE500, the investment would have grown to ` 150. The “connected” index yielded an average return of 17.5 per cent per annum during this period, whereas the BSE 500 index yielded an average return of 10.5 per cent per annum. “Connected” firms thus outperformed the broad index of the stock market by 7 percentage points a year on average till 2010. Put differently, from 2007 to 2010, “connected” firms realized 7 percentage points higher returns than they would have in a more competitive market.

UNIQUE P
UBLISHERS (I
) PVT. L
TD.
Content developed by UNIQUE PUBLISHERS (I) PVT. LTD.
Pro-Business versus Pro-Crony 13
This pre-2010 outperformance of “connected” firms indicates the possible extent of rents extracted by these firms at society’s expense. In contrast, the significant post-2010 underperformance – following the release of the CAG report – illustrates the fact that such “connected” firms were likely to have been inefficient ones. Between 2007 and 2016, “connected” firms have earned, on average, 7.5 percentage points lower returns than the BSE 500 index per annum. This phenomenon of rent-seeking by inefficient, “connected” firms, though unhealthy to the economy, is not unique to India. Pro-crony, when compared to pro- business, policies can create various indirect costs as well. When opportunities for crony rent-seeking exist, firms shift their focus away from growth through competition and innovation towards building political relationships, thus undermining the economy’s capacity for wealth creation Further, the rents sought by cronies are paid for by genuine businesses and citizens who are not receiving any preferential treatment. Such a transfer of wealth exacerbates income inequality in the economy, as crony firms leverage their connections to extract a larger share of existing wealth instead of expanding the available wealth.
DO GLOBAL STUDIES REINFORCE THE RELATIONSHIP BETWEEN CONNECTIONS AND RENT-SEEKING ACTIVITIES WHEN INSTITUTIONAL CHECKS AND BALANCES ARE WEAK?Several studies from around the globe find that political connections lead to rent extraction.
Faccio (2006) examines politically connected firms in 47 countries and finds that around the time that a firm announces that managers or large shareholders are entering politics, there is a positive impact on stock price. The result is consistent with the theory that markets anticipate additional sources of profit for the now politically connected firm despite no change in firm fundamentals. Faccio et al. (2006) study financial distress in politically connected firms in 35 countries and find that distressed politically connected firms are significantly more likely to be bailed out by the government than their non-connected counterparts. Claessens et al. (2008) show that Brazilian firms that provided contributions to (elected) federal deputies experienced higher stock returns than firms that did not make such contributions around the 1998 and 2002 elections. Further, contributing firms substantially increased their bank financing relative to a control group after each election, indicating that access to bank finance is an important channel through which political connections operate. They estimate the economic costs of
this rent seeking over the two election cycles to be at least 0.2 per cent of gross domestic product per annum.
A recent World Bank study of cronyism in Ukraine finds that the country would grow 1 to 2 per cent faster if all political connections were eliminated (Kahkonen 2018)! Politically connected firms in Ukraine account for over 20 per cent of the total turnover of all Ukrainian companies. The study finds that these politically connected firms (i) are larger than non-connected peers, (ii) pay lower effective tax rates, (iii) are less productive in terms of total factor productivity (TFP), (iv) are less profitable, and (v) grow slower (World Bank 2018).
EVIDENCE FROM ASIA
China
Firth et al. (2009) find that political connections play a role in the allocation of bank loans to Chinese firms. They find that having the state as a minority owner helps firms obtain bank credit. Political connections especially benefit firms located in areas with a less developed banking sector. Deng, Zeng & Zhu (2019) provide evidence that firms in China actively build political connections to alleviate the cost of market frictions. Firms facing severe market frictions are not as financially constrained as they would be expected to be; the key reason is that they possess strong political connections which alleviate these costs. Chan et al. (2012) find that politically connected firms in China display much lesser financing constraints compared to firms without such connections. Chen et al. (2017) find that politically connected underwriters increase the likelihood of clients’ IPO applications being approved by the Chinese Securities Regulatory Commission. Further, consistent with the rent-seeking argument, they document the post-IPO underperformance of such firms, indicating that minority shareholders’ interests may be compromised.
Thailand
Bunkanwanicha & Wiwattanakantang (2009) find in Thailand that when business owners come to political power, the market valuation of their firms increases dramatically. Business owners in top offices use their policy-decision powers to implement regulations and public policies favorable to their firms. Civilize et al. (2015) undertake a longitudinal study of firms in Thailand and conclude that higher realized stock returns are systematically associated with political connectedness. Consistent with the view that such a relationship provides economic rents, this finding is particularly prominent in more regulated industries. The politically connected
UNIQUE P
UBLISHERS (I
) PVT. L
TD.
Content developed by UNIQUE PUBLISHERS (I) PVT. LTD.
Economic Survey & Budget14
premium is higher for higher level political connections and when the political bodies hold an equity stake in the firm.
Indonesia
Fisman (2001) estimates the value of political connections in Indonesia by looking at how stock prices of firms with differing degrees of political exposure moved when former President Suharto’s health was reported to change. Adverse health reports led politically connected firms to realize lower returns than less dependent firms.
Malaysia
Johnson & Mitton (2003) find that the imposition of capital controls in Malaysia in 1998 primarily benefitted firms with strong ties to the President, suggesting that capital controls provided a screen behind which firms with political ties leveraged their connections for favours. A study of Malaysian politically connected firms finds that such firms are perceived as being higher risk by the market, audit firms and lenders. Such firms have higher likelihoods of reporting a loss, having negative equity, and being charged higher interest rates by lenders (Bliss and Gul 2012).
Vietnam
Rand (2017) examines over 2000 Vietnamese SMEs over a 10-year period and finds that political connections decrease the likelihood of a firm being credit-constrained by 4 percentage points. Further, politically connected firms accessing credit face lower cost-of-capital than non-connected SMEs not excluded from formal financial markets.
These studies unanimously document a myriad of benefits enjoyed by politically connected firms. These benefits represent direct and indirect forms of rent unduly enjoyed by the connected firm’s shareholders at the expense of unconnected firms and society at large.
THE PRO-BUSINESS POLICIES INCREASE COMPETITION, CORRECT MARKET FAILURES, OR ENFORCE BUSINESS ACCOUNTABILITY, PRO-CRONY POLICIES HURT MARKETS. DISCUSS?Such policies may promote narrow business interests and may hurt social welfare because what crony businesses may want may be at odds with the same. For example, crony businesses may lobby the government to limit competition in their industry, restrict imports of competing goods or reduce regulatory oversight. These initiatives enhance the lobbying group’s income but undermine markets and reduce aggregate welfare. Thus, pro-crony policy can inadvertently end up being hurtful to businesses in general.
Pro-business policies, for example, those that make it easy to start a business, register property, enforce contracts, obtain credit, bid for natural resources, get permits, and resolve insolvency help firms to function effectively and thereby enable competitive markets. Making it easy to do business in a jurisdiction furthers the eventual goal of maximizing social welfare. Reforms aimed in this direction must continue. However, catering to the needs of crony businesses alone without regard for other businesses and the remaining stakeholders in the economy may end up benefitting the preferentially treated firms at the expense of other firms, market efficiency and social welfare.
UNIQUE P
UBLISHERS (I
) PVT. L
TD.
Content developed by UNIQUE PUBLISHERS (I) PVT. LTD.
Undermining Markets: When Government Intervention Hurts More Than It Helps 15
IN THE GLOBAL INDICES OF ECONOMIC FREEDOM, WHY DOES INDIA RANK IN THE BOTTOM HALF?Though India has made significant progress in enhancing economic freedom for firms and its citizens, it still counts among the shackled economies in the world.
The Index of Economic Freedom, which is brought out by the Heritage Foundation, and the Global Economic Freedom Index, which is brought out by the Fraser Institute, measure economic freedom as the freedom of choice enjoyed by individuals in acquiring and using economic goods and resources. In the Index of Economic Freedom, India was categorized as ‘mostly unfree’ with a score of 55.2 in 2019 ranking the Indian economy 129th among 186 countries, i.e., in the bottom 30 per cent of countries
In the component pertaining to “investment freedom”, which measures the ease of flow of investment capital both internally and across the country’s borders, India scores a low 40.0 on a scale of 0-100 (repressed) against the world average of 58.5. In the Index of Global Economic Freedom too, India ranks 79th among 162 countries with 108th rank in business regulation.
Economic freedom enhances wealth creation by enabling efficient allocation of entrepreneurial resources and energy to productive activities, thereby promoting economic dynamism. This is manifested in the close correlation of the ranks in the two referred indices of economic freedom with per capita GDP of the countries
The low rank in economic freedom makes it evident that India chains opportunities for wealth creation by shackling economic freedom for its citizens.
While there is a case for Government intervention when markets do not function properly, excessive intervention, especially when markets can do the job of enhancing citizens’ welfare perfectly well, stifles economic freedom. Explain?
Government can affect markets either through direct participation (as a market maker or as a buyer or supplier of goods and services), or through indirect participation in private markets (for example, through regulation, taxation, subsidy or other influence). Any Government intervention of the first kind, however, affects the dynamic interaction of
supply and demand in markets and thereby determination of ‘equilibrium’ market prices. When the price is too high, there is an excessive amount of the product for sale compared to what people want. When the price is too low, it causes consumers to want more of the product than producers have available. In both cases, serious welfare loss results because not enough of the good is sold. The wasted chance to create both producer and consumer welfare from such sales leads to ‘deadweight loss’ - income that is lost forever. In addition to creating deadweight loss, an artificially high price transfers profits from consumers to producers and creates opportunities for rent seeking and an artificially low price leads to transfer of profits from producers to consumers and leads to low incentive to invest further and aggravates the scarcity of the product.
INDIAN ECONOMY IS REPLETE WITH EXAMPLES WHERE GOVERNMENT INTERVENES EVEN IF THERE IS NO RISK OF MARKET FAILURE AND IN SOME INSTANCES ITS INTERVENTION HAS CREATED MARKET FAILURES. SUBSTANTIATE WITH EXAMPLE OF ESSENTIAL COMMODITIES ACT?The above phenomena may be partly due to the legacy of post-independence economic policies that the country followed. However, as the role of markets has been recognized globally, it is only natural that markets are allowed to work to enable quick wealth creation and thereby economic growth.
Essential Commodities Act (ECA), 1955 was enacted to control the production, supply and distribution of, and trade and commerce in, certain goods considered as essential commodities. The Act itself does not lay out Rules and Regulations but allows the States to issue Control Orders related to dealer licensing, regulate stock limits, restrict movement of goods and requirements of compulsory purchases under the system of levy. The Act also provides for action to confiscate the stock seized; to suspend/ cancel licences, if any and impose punishments like imprisonment. The Act also gives the power to fix price limits, and selling the particular commodities above the limit will attract penalties. Most of the powers under the
4Undermining Markets: When
Government Intervention Hurts More Than It Helps

UNIQUE P
UBLISHERS (I
) PVT. L
TD.
Content developed by UNIQUE PUBLISHERS (I) PVT. LTD.
Economic Survey & Budget16
Act have been delegated by the Central Government to the State Governments with the direction that they shall exercise these powers. Food and civil supply authorities in States execute the provisions of the Act.The major commodity groups included in the Act are(i) Petroleum and its products, including petrol, diesel,
kerosene, Naphtha, solvents etc(ii) Food stuff, including edible oil and seeds, vanaspati,
pulses, sugarcane and its products like, khandsari and sugar, rice paddy
(iii) Raw Jute and jute textiles(iv) Drugs- prices of essential drugs are still controlled by
the DPCO(v) Fertilisers- the Fertiliser Control Order prescribes
restrictions on transfer and stock of fertilizers apart from prices
(vi) Onion and Potato(vii) Seeds of food crops, fruits and vegetables, cattle
fodder, Jute seeds and Cotton seedsThe Essential Commodities Act (ECA), 1955 controls
the production, supply and distribution of, and trade and commerce in, certain goods such as vegetables, pulses, edible oils, sugar etc., which are treated as essential commodities. Under the Act, the powers to implement the provisions of the Act are delegated to the States. When the price of any of these essential commodities rises, the regulator can impose stockholding limits on the commodity, restrict movement of goods, and mandate compulsory purchases under the system of levy. Consequently, all wholesalers, distributors, and retailers dealing in the product must reduce their inventories to comply with the holding limit. The purported aim of this Act is to ensure affordability of essential commodities for the poor by restricting hoarding. It is an overarching legislation regulating agricultural marketing and production.
The ECA, however, affects the efficient development of agricultural markets by creating market distortions. See the diagram below.
Weakensdevelopment of
Agricultural value-chain
Reduced producerprofit
Inhibitsdevelopment of
vibrant commodityderivative markets
Reduced incentiveto invest in storage
Marketdistortions from
stock limits underECA
Increased price volatility- reduced consumerwelfare - Opposite of
what ECA is intended for
Figure: Agricultural Market distortions due to ECA
As agriculture is a seasonal activity, it is essential to store produce for the off-season to ensure smoothened availaibility of a product at stable prices throughout the year. Therefore, producers face an inherent trade- off between building an inventory in the harvest season and drawing down inventory in the lean season. ECA interferes with this mechanism by disincentivising investments in warehousing and storage facilities due to frequent and unpredictable imposition of stock limits. As stockholding limits apply to the entire agriculture supply chain, including wholesalers, food processing industries and retail food chains, the Act does not distinguish between firms that genuinely need to hold stocks owing to the nature of their operations, and firms that might speculatively hoard stocks. Further, this reduces the effectiveness of free trade and flow of commodities from surplus areas to markets with higher demand. ECA also affects the commodity derivative markets as traders may not be able to deliver on the exchange platform the promised quantity, owing to stock limits. The Act distorts markets by increasing uncertainty and discouraging the entry of large private sector players into agricultural-marketing. These market distortions further aggravate the price volatility in agricultural commodities- the opposite of what it is intended for. This market distortionary impact is clearly evident from several experiences. The ineffectiveness of stock limits in controlling price volatility, as described above, is not restricted to a specific commodity or a specific time period. The recent experience with rise in onion prices illustrate the same phenomenon. There are three harvesting seasons in India for the onion crop viz., Kharif (October-December), Late Kharif (January-March) & Rabi (March- May). There is a period from around May to September in the year wherein the demand for onions has to be met by the stocks kept by the traders/wholesalers. Due to heavy rains in August-September, 2019, the kharif crop of onions was adversely affected leading to lower market arrivals and upward pressure on onion prices. This kharif crop usually caters to the demand during the period from October to December till fresh produce from late kharif crop comes in the market. In view of a sustained increase in onion prices, stock limits under the ECA were imposed across the country on September 29, 2019 (the limits equaled 100 quintals on retail traders and 500 quintals on wholesale traders which were subsequently reduced to 20 quintals and 250 quintals respectively). The stock limits were imposed to control the price rise of onions by facilitating the release of stocks in the market and preventing hoarding by traders to enhance supply in the market. However, the imposition of stock limits has had no effect on the volatility of the wholesale and retail prices for onions after September, 2019. The lower stock
UNIQUE P
UBLISHERS (I
) PVT. L
TD.
Content developed by UNIQUE PUBLISHERS (I) PVT. LTD.
Undermining Markets: When Government Intervention Hurts More Than It Helps 17
limits must have led the traders and wholesalers to offload most of the kharif crop in October itself which led to a sharp increase in the volatility from November, 2019 onwards. The volatility in retail prices mirrors that in wholesale prices. This effect of the imposition of stock limits is also evident in the trend of the wedge between the wholesale and retail prices of pulses and onion In the case of onions, the wedge has shown a sharp increasing trend from November, 2019 onwards as most of the kharif crop, which itself was lower, would have had to be offloaded in the market in October itself. Absent government intervention through ECA, traders would store a part of their produce to ensure smooth availaibility of a product at stable prices throughout the year.
The increasing wedge between wholesale and retail prices reinforces that ECA reduces welfare of consumers. In the long term, the Act disincentivizes development of storage infrastructure thereby leading to increased volatility in prices following production/ consumption shocks – the opposite of what it is intended for. The evidence across different commodities and different time periods - not just onions or sugar where cartelisation is often suspected - suggests that the ineffectiveness of ECA stems from unnecessary government intervention that undermines markets. Under the ECA, states are required to enforce the adherence to any stock limits specified under the Act. Given that around 76000 raids were conducted during 2019 and assuming that a minimum of 5 persons are involved in a raid, a considerable administrative effort is utilized for the enforcement of the Act.
A simple analysis shows that such raids conducted by States have had no impact on both the wedge between retail and wholesale onion prices and volatility in these prices in consumer or producer states, thereby raising concerns on their effectiveness
The analysis shows that in states that are primarily consumer of essential commodities, there is a negative relationship between the probability of being caught (reflected by the ratio of prosecution to raids) and wedge between retail and wholesale prices. This shows that ECA is only effective when it is executed properly. A beginning was made by setting up of the Price Stabilization Fund (PSF) in 2014-15 to help regulate the price volatility of important agri-horticultural commodities like onion, potatoes and pulses. It provides for maintaining a strategic buffer of aforementioned commodities for subsequent calibrated release to moderate price volatility and discourage hoarding and unscrupulous speculation. This needs to be strengthened further as it supplements the market forces rather than substitute them which the ECA does.
The ECA was enacted at a time when speculative hoarding and black marketing was a threat as agricultural
markets were fragmented and transport infrastructure was poorly developed. But the Act, while penalising speculative hoarding, also ends up penalising the much desirable consumption- smoothing that storage provides. With the agricultural markets in India increasingly becoming more integrated and competitive, the utility of the Act is dubious and is incompatible with development of an integrated competitive national market for food. The anti-hoarding provisions of ECA discourage open reporting of stock holdings, storage capacities, trading and carry forward positions. There is no aggregated data of the total private storage capacity available in the country, which would enable policymakers to assess the impact of any production shocks on the prices. Besides discouraging investment in modern methods of storage and in market intelligence, the lack of information on trades makes it harder for market participants to make accurate forecasts for the future. Supporting development of commodity futures markets would help efficient discovery of market expected future prices, which can provide a better basis for private storage decisions and avoid ‘peaks’ and ‘troughs’ in prices. Development of effective forecasting mechanisms, stable trade policies, and increasing integration of agricultural markets can serve the purpose of stabilising prices of agricultural markets more efficiently than government fiat imposed through ECA.
DISCUSS THE SIGNIFICANCE OF THE DRUGS PRICES CONTROL ORDER (DPCO) IN PUBLIC HEALTH?The Drugs Prices Control Order (DPCO) is an order issued under Sec. 3 of Essential Commodities Act (ECA), 1955 that seeks to regulate the prices of pharmaceutical drugs. The DPCO, among other things, specifies the list of drugs that come under the price ceiling and the formula for calculating the ceiling price. The National List of Essential Medicines (NLEM) lists the pharmaceutical drugs that fall under price control. The DPCO, 2013 for instance, contains 680 scheduled drug formulations spread across 27 therapeutic groups whose prices are regulated.
National Pharmaceutical Pricing Authority (NPPA) is responsible for fixing and revising the prices of pharmaceutical products as well as the enforcement of the DPCO. The Government of India has amended the DPCO several times and most recently in 2013. Until 2013, DPCO specified the price ceiling using the cost-based pricing method in which the ceiling price was calculated as a multiple of the cost that it took producers to promote and distribute a pharmaceutical drug. This multiple referred to as the Maximum Allowable Post-manufacturing Expenses (MAPE) was set at 50 per cent for formulations

UNIQUE P
UBLISHERS (I
) PVT. L
TD.
Content developed by UNIQUE PUBLISHERS (I) PVT. LTD.
Economic Survey & Budget18
imported into India and at 100 per cent for indigenously manufactured formulations.
In 2013, for the first time, India transitioned from cost-based pricing to market-based pricing. Under the market-based pricing method, the Government determines the ceiling prices as the maximum mark-up that a retailer can charge over the reference price, which is the simple average of the prices of the all the brands with market share of greater than or equal to 1 per cent based on market data provided by IMS Health, a market research firm. The order capped the maximum mark-up to 16 per cent for all formulations specified in the NLEM.
Given the important task of ensuring access to essential lifesaving drugs and to avoid poor households from falling into poverty, Governments often resort to price controls for drugs. In India, the Government has historically relied on price controls to regulate the prices of pharmaceutical drugs through the National Pharmaceutical Pricing Authority (NPPA) and Drug (Prices Control) Order (DPCO). The National List of Essential Medicines (NLEM), prepared by Ministry of Health and Family Welfare, is a list of medicines considered essential and high priority for India’s health needs. It is based on aspects like prevalence of disease in the population, safety and efficacy of the medicine, and current affordability. DPCOs are issued by the Government, in exercise of the powers conferred under section 3 of the ECA to ensure that the medicines listed under NELM are available at a reasonable price to the general public.
THE INTERVENTION OF GOVERNMENT IN FOOD GRAIN MARKET HAS LED TO A STRONG DISCONNECT BETWEEN DEMAND AND SUPPLY OF GRAINS IN FOOD GRAINS MARKETS. ILLUSTRATE BY EXAMINING THE GOVERNMENT STRATEGY OF FOOD SECURITY AND INTERVENTION OF THE FOOD CORPORATION OF INDIA?In the grain markets in India, Government has sought to achieve food security while ensuring remunerative prices to producers and safeguarding the interest of consumers by making supplies available at affordable prices. In trying to achieve this, the state controls input prices such as those of fertilizer, water, and electricity, sets output prices, undertakes storage and procurement through an administrative machinery, and distributes cereals across the country through the PDS. The Food Corporation of India (FCI) was set up in 1965 under the Food Corporations Act, 1964 with the primary duty to purchase, store, move/transport, distribute and sell foodgrains and other
foodstuffs. The main objectives of FCI are (a) procurement of foodgrains from farmers at Minimum Support Prices (MSP) announced by the Government; (b) distribution of foodgrains to consumers through PDS, particularly the vulnerable sections of society at affordable prices; and (c) maintenance of buffer stock of foodgrains for food security and price stability. Thus, it is mandated to serve the interests of producers and consumers alike.
Subsequent to this mandate, the Government has emerged as the single largest procurer and hoarder of foodgrains. Government procures around 40-50 per cent of the total markets surplus of rice and wheat emerging as the dominant buyer of these grains. In some States like Punjab and Haryana, this share of purchase by Government reaches as high as 80-90 per cent . A record procurement of 44.4 million tonnes of rice and 34 million tonnes of wheat was done in 2018-19. Thus the government, as the single largest buyer of rice and wheat, is virtually a monopsonist in the domestic grain market and is a dominant player crowding out private trade. This disincetivizes the private sector to undertake long-term investments in procurement, storage and processing of these commodities. These procurement operations largely support the MSPs that are designed to be indicative prices for producers at the beginning of the sowing season and floor prices as an insurance mechanism for farmers from any fall in prices. However, the secular increasing trend in these prices have served to give a signal to farmers to opt for the crops which have an assured procurement system. An increase in MSP translates into farmers offering their produce for the open-ended procurement by the Government. This also indicates that market prices do not offer remunerative options for the farmers and MSPs have, in effect, become the maximum prices rather than the floor price – the opposite of the aim it is intended for.
Given the obligations under the Targeted Public Distribution System (TPDS) earlier and now under the National Food Security Act (NFSA), 2013 that covers upto 75 per cent of the rural population and 50 per cent of the urban population to receive subsidized foodgrains, Government has also emerged as the single largest hoarder of rice and wheat.
The inefficiency of FCI (estimated by the wedge between Economic Cost excl Distribution Cost and average wholesale prices) increases with the increasing level of stocks. It is evident that if foodgrain markets are opened for active participation of private players with Government as an equal player (and not as a monopsonist in procurement and monopolist in storage and distribution), competition would lead to more efficiency in the operations and development of adequate infrastructure in storage and warehousing.

UNIQUE P
UBLISHERS (I
) PVT. L
TD.
Content developed by UNIQUE PUBLISHERS (I) PVT. LTD.
Undermining Markets: When Government Intervention Hurts More Than It Helps 19
These policies have led to burgeoning burden of food subsidy which largely covers the procurement cost of FCI (difference between the MSP and the Central issue prices (CIP) of foodgrains under PDS) and distribution and carrying costs of FCI. Given fiscal constraints, there is always a trade-off between allocating money through subsidies and increasing investments. The growth in
public investments in agriculture is negatively correlated to increases in food subsidy outlay. As investments are the crucial input to increase in productivity, the increasing focus on subsidies is harming the growth of agricultural sector in the long-run. This imbalance between subsidies and investments needs to be urgently corrected for sustainable growth in Indian agriculture and overall inclusive growth.
BOX: EXAMPLES OF SUCCESSFUL CONDITIONAL CASH TRANSFER SCHEMES
Country Year Modalities Impact
Brazil: Bolsa Familia 2003 • Covers 25 per cent of total population• Eligible beneficiaries below income level of
$60 and further identified through house-hold surveys
• Size of trasfer – R$15-95• Access payments through banks, lottery
offices, retail stores using debit card• Conditions – Minimum 85 per cent attendance
and compulsory attending of health checkups for women and children
• Cost of scheme – 0.5 per cent of GDP
• 80 per cent of benefits went to identified beneficiaries
• Decline in households that are food inadequate
• Decrease in number of children malnourished
• Increase in food consumption• Over 60 per cent transactions made
through non-bank agencies
Mexico: Oportunidades
1997 • Focus on geographically poor regions. Households identified in these regions using marginal index
• Covers 20 per cent of total Population• Cost of scheme – 0.4 per cent of GDP• Size of trasfer – 235 pesos (average)• Payments made bimonthly• Benefits can be withdrawn form bank branches
and authorized non-financial agencies• Conditions – Minimum attendance
requirement and mandatory health checkups
• 60 per cent of benefits went to poorest 20 pre cent of the population
• 12 per cent decrease in incidence of illnesses
• Increase in enrollment of children into schools and redution in dropout rates
• Increase in likelihood of women deciding on how benefits to be spent
Philipines: Pantawid Pamilyang Pilipino Program
2007 • Covers 20 per cent of total population• Beneficiaries identified through Household
surveys• Cost of scheme – 0.5 per cent of GDP• Conditions – Minimum attendance
requirement and mandatory health chech-ups, participate in monthly community-based Family Development Sessions.
• 20 million Filipinos benefited• Program has led to a poverty
reduction of 1.4 percentage points per year
• 10.18 million children currently benefit from CCT
• Drastic decrease in alcoholism in 4Ps households (spending on vices was lower by 39 per cent)
Source: World Bank FAQ (2017), ICRIER (2017)
NSS 73rd round on consumer expenditure shows that the share of cereals in Monthly Per Capita Expenditure (MPCE) has fallen by about 33 per cent in rural India and about 28 per cent in urban India from 2004-05 to 2011-12 (latest estimates available). Further, the share of cereals declines steadily as MPCE level increases, from about 19 per cent for the bottom decile class of rural India to about 5-6 per cent for the top decile class, and from 15 per cent for the bottom decile class of urban India to under 3 per cent for the top decile class. This is in line with decreasing
consumption of food and increasing expenditure on non-food items as incomes rise. The declining share of cereals in consumer expenditure while the production of rice and wheat has reached new records. This trend of decreasing demand for cereals and increasing supply of cereals shows that the production pattern is not synchronized with the demand patterns. The farmers are deriving their signals, not from the demand patterns (reflected in the actual market prices) but from the Government policies of procurement and distribution policies for grains. Thus, the intervention

UNIQUE P
UBLISHERS (I
) PVT. L
TD.
Content developed by UNIQUE PUBLISHERS (I) PVT. LTD.
Economic Survey & Budget20
of Government has led to a disconnect between demand and supply of grains in foodgrain markets. It is evident from the analysis above that there has been a paradigm shift on food (cereal) front between the time when FCI was created and today. India has moved from being a food scarce country to a food surplus country with a substantial increase in production and has emerged as a net exporter of cereals. The Government policies of assured procurement and distribution gave the right incentives to increase production at that time. The current foodgrain economy is, however, riddled with various economic inefficiencies described above. These policies, therefore, need to move on now to incentivize diversification and environmentally sustainable production. The farmers need to be be empowered through direct investment subsidies and cash transfers, which are crop neutral and do not interefere with the cropping decisions of the farmer. The coverage of NFSA needs to be restricted to the bottom 20 per cent and the issue prices for others could be linked to the procurement prices. A better alternative would be giving income transfers to consumers through Direct Benefit Transfers (DBT). It may be noted here that internationally, there is a move towards conditional cash transfers (CCTs), aimed at tackling problems of food insecurity and poverty and for nudging people towards improved health and education levels.
Therefore, the foodgrains policy needs to be dynamic and allow switching from physical handling and distribution of foodgrains to cash transfers/food coupons/ smart cards. At the macro level, the agricultural marketing, trade (both domestic and foreign) and distribution policies need to be aligned so that farmers receive the correct signals for diversification into remunerative and sustainable production.
GIVEN THE PREVALENCE OF GOVERNMENT INTERVENTION IN THE FORM OF FARM DEBT RELIEF IN INDIA, PRESENT AN ANALYSIS OF THE CONSEQUENCES ON BOTH THE BENEFICIARIES AND THE CREDIT MARKET IN GENERAL?Government intervention in credit markets, in the form of full or partial, conditional or unconditional, debt relief has become increasingly common at the state level in India. The phenomenon of granting debt waivers to farmers just before or after an election, which was to fulfill the promise made in the election manifesto, had died down in the early nineties. However, this phenomenon has become widespread after the large-scale farm debt waiver announced by the union government in 2008. This
was followed by announcement of waivers in states such as Andhra Pradesh, Telangana, Uttar Pradesh, Madhya Pradesh, Rajasthan, Punjab, Maharashtra, and others.
When arguing the benefits of debt waivers on farmers, proponents postulate that borrowers suffer from the problem of “debt overhang”. This refers to a situation where all current income gets used up in repaying the accumulated debt, leaving little incentives to invest either in physical or human capital. The incentives become muted because any incremental benefit of such investment in physical or human capital is likely to go to the lenders in the form of repayment of existing obligations and not the farmer. Such borrowers are unlikely to receive new funding, either equity or debt, as the ability of the borrower to repay additional loans or grow his/her business/farm is in question. Debt overhang, therefore, leads to abandonment of beneficial investment and hence reduces social welfare. Given this situation, proponents of debt relief argue that a debt waiver helps the borrowers to come out of the debt trap as it cleans their balance sheet and reduces the burden of debt servicing. This clean-up of borrowers’ balance sheet is likely to lead to both new investments as well as fresh fund rising as borrowers’ repayment capacity increases even if there is no change in income.
Kanz (2016) examines the 2008 debt waiver offered by Government of India and tests whether any of these effects actually play out. He uses the fact that farmers having less than 2 hectares of land received full relief while those with less than 2 hectares of land received only partial relief. A farmer having 1.98 hectares of land is not different from another farmer having 2.02 hectares of land. However, the farmer having 1.98 hectares of land receives the full relief while the farmer having 2.02 hectares of land receives only partial relief. If debt relief indeed benefits the farmers, then the former set of farmers should be definitely better off than the latter set. The results, however, are quite the opposite of what proponents of debt waivers believe. Neither agricultural investment nor productivity increased after the waiver. Consequently, there was little impact on consumption as well. In other words, a stimulus worth close to 2 per cent of the GDP did not have any meaningful real impact on the lives of the farmers.
DEBT WAIVERS IMPACT CREDIT MARKETS NEGATIVELY. ILLUSTRATE WITH AN EXAMPLES?Bolton and Rosenthal (2002) argue that debt relief can help as long as they are awarded under exceptional circumstances and remain unanticipated. In such situations, a debt relief can prevent farmers going out of farming and the consequent reduction of output.

UNIQUE P
UBLISHERS (I
) PVT. L
TD.
Content developed by UNIQUE PUBLISHERS (I) PVT. LTD.
Undermining Markets: When Government Intervention Hurts More Than It Helps 21
However, they also note that an anticipated waiver may lead to moral hazard and destroy the credit culture. Given the nature of the 2008 waiver, the later consequences seem to have prevailed. Gine and Kanz (2017) find that the waiver led to increased loan defaults on future loans and no improvement in wages, productivity, or consumption. They compare districts based on their exposure to the 2008 debt waiver provided by Government of India. A one percentage increase in exposure to the debt waiver increased the amount of non-performing assets by about 7 per cent. Most worryingly, they find that the loan performance deteriorated the most in areas that were headed for election, indicating strategic default in anticipation of waiver. Ironically, flow of bank credit to waiver beneficiaries declined after the waiver. A one standard deviation increase in the exposure of a district to the waiver led to a 4-6 per cent decline in the number of new loans and a 14-16 per cent decline in the amount of post- program lending.
Tantri (2018) finds that the Andhra Pradesh government’s 2010 intervention in micro-finance loans had a contagious impact on other segments of credit markets such as bank loans. In October, 2010, the government of Andhra Pradesh issued an ordinance virtually banning almost all loan recovery practices of micro-finance lenders. However, the loan delinquency rates in the micro-finance went up significantly following this intervention. The intervention had a contagious impact on bank loans as well. Rate of defaults and the rate of non-performing assets rose on bank loans increased by 12.4 per cent and 24.5 per cent respectively following this intervention. Finally, as the flow of new credit reduced by half, government intervention that intended to help micro-finance borrowers ended up hurting borrowers by depriving them of credit. Mukherjee, Subramanian, and Tantri (2018), who also examine the 2008 waiver provided by the Government of India, make a much more nuanced point. They study the impact of the waiver on distressed and non- distressed borrowers separately by using crop insurance claims and weather conditions to identify economic distress of the borrowers. They find that loan performance of genuinely distressed borrowers improved by about 9 per cent due to the loan waiver. However, the loan performance of non-distressed beneficiaries deteriorated by about 23 per cent after the waiver. They use the waiver eligibility cut-off date of December 31, 2007 to carefully construct a regression discontinuity based identification strategy. It is crucial to note that the cut-off date for deciding beneficiaries was February 29, 2008 and hence borrowers were not aware about the cut-off date as on December 31.
Consider two distressed farmers, A and B who defaulted on their crop loans on December 30th 2007 and January
1st 2008, respectively. Due to the December 31st cut- off date for being eligible for the waiver, borrower A gets his/her loan waived whereas borrower B does not. Otherwise, both the borrowers are comparable. The study shows that loan performance of distressed borrower A improves after the waiver. Now consider two non-distressed farmers, C and D who defaulted on their crop loans on December 30th 2007 and January 1st 2008, respectively.
Borrower C gets his/her loan waived whereas borrower D does not. Otherwise, both the borrowers are comparable. The study shows that loan performance of borrower D worsens after the waiver. In other words, a waiver helps only when the beneficiaries are genuinely distressed but fuels even greater default when relief is not made conditional on genuine distress.
It is clear from the above studies that an unconditional and blanket debt waiver is a bad idea. It does not achieve any meaningful real outcomes for the intended beneficiaries while the costs to the exchequer are significant. Most importantly, debt waivers disrupt the credit culture and end up reducing the formal credit flow to the very same farmers it intends to help. As noted by Mukherjee, Subramanian, and Tantri (2018) and Bolton and Rosenthal (2002), there is a case for a limited relief only when distress can be identified credibly. In other words, a waiver can at best be an emergency medicine to be given in rare cases after a thorough diagnosis and identification of illness and not a staple diet. In most cases, its side effects, the unintended consequences, far outweigh any plausible short term benefits.
THERE IS EVIDENCE THAT INDIA IS STILL STUCK WITH SEVERAL FORMS OF GOVERNMENT INTERVENTION THAT ARE ANACHRONISTIC WITH TODAY’S ECONOMY. ILLUSTRATE THROUGH EXAMPLES WHERE INDIA HAS TRAVERSED THE TRANSITION FROM A COMMAND AND CONTROL ECONOMY TO A MARKET-DRIVEN ECONOMY?Competitive markets are effective in allocating resources in an economy. However, while the ideal of a completely efficient market is rare, the costs of Government intervention may outweigh the benefits when “market failures” – a term that economists use to denote situations where markets may not work very well in allocating resources – are not severe. Of course, governments play a crucial role by intervening in situations where “market failures” are acute

UNIQUE P
UBLISHERS (I
) PVT. L
TD.
Content developed by UNIQUE PUBLISHERS (I) PVT. LTD.
Economic Survey & Budget22
TABLE: TRAVERSING THE ‘FULL CIRCLE’ – FROM ‘CONTROL’ TO ‘MARKET’
Act Market Distortion Transformation towards Developing a Market Economy
Capital Issues (Control) Act, 1947
The Government decided which company could raise how much capital – Control over the amount as well as pricing of shares led to ineffective valuation of capital
Repealed and replaced by The Securities and Exchange Board of India (SEBI) Act, 1992 as a regulator of the capital markets. SEBI has steered the capital markets to ensure price discovery, governance of securities, allowing efficient mobilisation and allocation of capital, protecting the interest of investors in mind enabling enormous wealth creation (as detailed in chapter 1)
Oil and Natural Gas Commission (ONGC) Act, 1959
ONGC was created with the mandate to plan, promote, organize and implement programmes for the development of petroleum resources – created a Government monopoly in this sector
On 4 September 1993, the Act was repealed and ONGC was converted into a company. The evolution of hydrocarbons policy has been from state monopoly in 1948, to the beginning of deregulation in 1991 through nomination, to competitive bidding and profit sharing under New Exploration Licensing Policy (NELP), 1997, to gas pricing guidelines in 2014, to discovered small field policy in 2015 and, finally, to a uniform licence for exploration and production of all forms of hydrocarbon and revenue sharing under Hydrocarbon Exploration and Licensing Policy (HELP) in 2016.
Banking Componies (Acquisition and Trasfer of Undertakings) Act of 1970 & State Bank of India Act, 1955
To provide for the acquisition and trasfer of the undertakings of certain banking companies created – created 27 nationalized banks – Private sector banks were allowed only after 1994
Merger of banks announced which will reduce public sector banks from 27 to 12. Further, attempts to create a level playing field between private sector banks and public sector banks are in place.
Monopolies and Restrictive Trade Practices (MRTP) Act, 1969
MRTPC was constituted to prevent concentration of economic power, control of monopolies, prohibition of monopolistic practices, prohibition of restrictive and unfair trade practices. This restricted companies to grow and achieve a global scale and led to proliferation of small companies.
Repealed to give way to the Competition Act in 2002. The Competition Act aims to “promote and sustain competition in markets, protect interests of consumers, ensure freedom of trade carried on by other participants in markets and prohibition of abuse of dominant position”. The focus has shifted from ‘prevention of dominance’ to ‘regulating abuse of dominance’
The Coking Coal Mines (Nationalisation) Act, 1972 and Coal Mines (Nationalization) Act, 1973
Government took over the management of coking and non-coking coal mines as energy sector became a crucial sector
Repealed in 2018. Private firms have been permitted to enter the commercial coal mining industry. The mines will be auctioned to the firm offering the highest per tonne price. The move broke the monopoly of Coal India Limited over commercial mining.
Nationalisation of Life Insurance, 1956 and General Insurance Business (Nationalisation) Act, 1972
Acquisition and trasfer of shares of Indian insurance companies and undertakings of other existing insurers to create LIC and GIC – led to cheap mobilisation of resources for investment in sectors decided by Government
Amended various times Insurance Regulatory Development Authority of India (IRDAI) Act, 1999 enacted to open the insurance sector. This was a journey from nationalisation to creation of a monopoly to opening up to private competition.
Foreign Exchange Regulation Act, 1973
Imposed restriction on foreign equity in companies to 40 percent and permission was needed from RBI to operate, if their shareholding was higher. This restricted access to foreign capital and technology
Repealed and replaced by Foreign Exchange Management Act (FEMA), 1999 to facilitate external trade and payments. Under FERA, everything was prohibited unless special permissions were received, while under FEMA, everything was permitted unless specifically restricted or regulated to enable development of forex market.

UNIQUE P
UBLISHERS (I
) PVT. L
TD.
Content developed by UNIQUE PUBLISHERS (I) PVT. LTD.
Undermining Markets: When Government Intervention Hurts More Than It Helps 23
Act Market Distortion Transformation towards Developing a Market Economy
Maruti Limited (Acquisition and Transfer of Undertakings) Act, 1980
The purpose was to modernise the automobile industry and ensure higher production of motor vehicles
On 14 May 2007, the government exited the company through a two-stage process: a rights issue of Rs. 400 crore followed by the sale of its existing shares through a public issue
Air Corporations Act of 1953 Nationalise nine airlines to form Air India and Indian Airlines – intended to provide safe, efficient, adequate, economical and properly coordinated air trasport services, whether internal or international or both. A market-driven, services-oriented, consumer-centric business was nationalised.
Replaced by Air Corporations (Transfer of Undertaking and Repeal) Act, 1994 wherein Private operators were allowed to provide air transport services. The Airports Authority of India (Amendment) Act of 2003 introduced the term “private airport” and authorised Airports Authority of India (AAI) to transfer operations and management of its existing airports by way of long-term lease to private players. The Airports Economic Regulatory Authority (AERA) of India Act, 2008 was enacted to regulate tariff and other charges and to monitor performance standards
Urban Land Ceiling and Regualtion Act, 1976
Imposition of a ceiling on acquisition of vacant land in urban agglomerations for the acquisition to prevent the concentration of urban land in the hands of the few and bring equity to subserve the common good. This led to distortion of land markets in urban areas, rise in slums, creation of artificial land scarcity and skyrocketing land prices.
Repealed in 1999.
Sick Industrial Companies Act (SICA), 1985
Timely detection of sick and potentially sick companies and speedy determination of preventive, ameliorative, remedial and other measures by Board of Industrial and Financial Reconstruction (BIFR). It put in place a debtor-friendly regime, in which defaulting borrowers could delay resolution for long periods of time and strip assets of value
The Act was repealed on 1 January 2004, and BIFR was dissolved on 1 December 2016 to give way to the Insolvency and Bankruptcy Code (IBC), 2016.
TABLE: NEED TO COMPLETE THE TRANSFORMATION : ACTS WHICH NEED TO BE REPEALED/AMENDED
Act Market Distortion Created Need for repeal/amendment
Factories Act, 1948 Regulates occupational safety and health in factories and docks. Gives prosecutor powers to a ‘chief inspector’ – Raises cost of such entitlements and may nudge capital away from labour. This may be merged with
It is proposed to be subsumed by the Occupational Safety, Health and Working Conditions Code, 2019 which is in the Parliament.
Essential Commodities Act (ECA), 1955 and Prevention of Black marketing and Maintenance of Supplies of Essential Commodities Act, 1980
Enables the Government to regulate the production, supply and distribution of ‘essential’ commodities such as drugs, oils, kerosene, coal, iron, steel and pulses. It imposes stock limits which discourages large-scale private investments in agricultural markets
These Acts owe their origin in times of shortage and inefficient linking of markets. With enhanced production and integration of markets, these Acts have become an instrument of coercion and inhibit proper functioning of markets of these essential commodities.

UNIQUE P
UBLISHERS (I
) PVT. L
TD.
Content developed by UNIQUE PUBLISHERS (I) PVT. LTD.
Economic Survey & Budget24
Act Market Distortion Created Need for repeal/amendment
Food Corporation of India (FCI), 1965
FCI was created for purchase, storage, transport, distribution and sale of food grains and other foodstuff to safeguard the interests of farmers, maintain buffer stocks for food security and make grains accessible at reasonable prices to the weaker and vulnerable through the public distribution system (PDS).
With a comfortable production scenario of foodgrains, the role of FCI, with a total storage capacity of more than 80 million tonnes, must be re-examined. Procurement operations of wheat, paddy and rice need to be given to states. FCI should primarily focus on creating competition in every segment of foodgrain supply chain, from procurement to stocking to movement and finally distribution in TPDS. This would reduce costs and plug leakages in the food management system.
Sick Textile Undertakings (Nationalisation) Act, 1974
To acquire sick textile units, reorganize and rehabilitate them. 103 sick textile mills were nationalised and trasferred to the National Textile Corporation (NTC). The Act was amended in 1995 to allow NTC to transfer, mortgage or dispose of land, plant, machinery or other assets for the better management, modernization, restructuring or revival of a sick textile undertaking.
Land of textile units has been monetised to create offices and residential buildings in Mumbai’s Lower Parel area. However, the nationalisation of these mills failed to achieve the desired objectives of rehabilitating or reorganising them and failed to deliver yarn, cloth, fair prices or jobs. This Act, therefore, needs to be repealed and NTC should be divested.
Recovery of Debts due to Banks and Financial Institutions Act, 1993
Led to establishment of Debt Recovery Tribunals (DRTs) for “expeditious adjudication and recovery of debts due to banks and financial institutions”. However, there are huge delays due to insufficient number of presiding officers, recoveries taking two years instead of the recommended statutory six months, lack of sufficient judicial experience by recovery officers, and inconsistency of the decision-making process between tribunals
With the IBC now firmly in place to fix the problem of non-performing assets, the DRTs can be phased out or integrated with the IBC.
Markets can...
Keep prices in checkUse resources efficientlyEncourage innovationIncrease consumer choiceCreate wealthMaximize aggregate welfare
Markets cannot...
Provide public goodsPrevent abuse of monopoly powerInternalize externalitiesOvercome information asymmetryDistribute wealth equitablyEnsure ethical practices
Wh
at
ma
rk
ets
ca
n d
oW
ha
t ma
rk
ets
ca
nn
ot d
o
Figure: Strengths and Weaknesses of Markets
UNIQUE P
UBLISHERS (I
) PVT. L
TD.
Content developed by UNIQUE PUBLISHERS (I) PVT. LTD.
Jobs and Growth by Specializing to Exports in Network Products 25
PRESENT AN ANALYSIS OF EVOLUTION OF INDIA’S TRADE SECTOR SINCE 1991?Post the 1991 reforms, India’s share in merchandise (goods) exports has grown at 13.2 per cent per annum and our share in world exports has increased from 0.6 per cent in 1991 to 1.7 per cent in 2018. Yet, even by 2018, India’s world market share remains paltry compared to 12.8 per cent for China. Further, merchandise exports as a percentage of GDP remained consistently lower for India compared to the world average by a significant margin Imports of merchandise have grown faster (at the rate of 14.9 per cent per annum during 1993-2018) than exports, resulting in increasing trade deficits On the other hand, exports of services generally grew faster than imports, providing some cushion to current account deficit.
IS INDIA’S LACKLUSTER EXPORT PERFORMANCE CAUSED BY A LACK OF DIVERSIFICATION IN ITS EXPORT BASKET (EXTENSIVE MARGIN) OR IS IT BECAUSE OF A LACK OF SPECIALIZATION (INTENSIVE MARGIN)? BUILD YOUR ANSWER BY GIVING AN ILLUSTRATION OF INDIA’S UNDER-PERFORMANCE IN EXPORTS VIS-À-VIS CHINA?Each country’s share of world exports of manufactured products is decomposed into the effects of diversification versus concentration. China- India gap in world market share is almost fully driven by the effect of specialization. On the other hand, India is clearly catching up with China in terms of diversification across products and markets. Overall, high diversification combined with low specialization implies that India is spreading its exports thinly over many products and partners, leading to its lacklustre performance compared to China. The specialization effect can change, over the years, due to changes in the quantity and/or the prices of exported commodities. China- India gap with respect to specialization has been fully driven by the quantity effect. The bottom line is that if India wants to become a major exporter, it should specialize more in the areas of its comparative advantage and achieve significant quantity expansion.
Despite being abundant in labour, the share of traditional unskilled labour- intensive industries in India’s non-oil merchandise exports declined by almost one- half from 30.7 per cent in 2000 to 16.3 per cent in 2018. The fast growing commodities in India’s export basket are capital and skill intensive. In fact, India’s participation in GVCs has been low compared to the major exporting nations in East and Southeast Asia. In contrast, China’s export composition shows a strong bias towards traditional labour- intensive industries and labour-intensive stages of production processes within capital- intensive industries (in particular, assembly of electronics and electrical machinery). Notwithstanding its decline over the years, unskilled labour-intensive products account for a higher share in China’s export basket compared to India’s. During the first decade of its trade liberalization (1980- 1990) China’s export growth was mainly based on its specialisation in unskilled labour intensive products; its share in China’s export basked increased from 27.8 per cent in 1980 to 46.5 per cent in 1990. On the other hand, the share of unskilled labour intensive products in India’s export basket remained around 30 per cent during 1980-2000, before experiencing a premature decline since 2000 While capital-intensive products account for a higher share in China’s export basket than that of India’s, it is important to emphasize two contrasting patterns. First, exports of capital-intensive products from China expanded since 2000 after the country recorded a major export expansion, for nearly two decades (1980-2000), of traditional unskilled labour intensive products. By contrast, India had not undergone a similar transition. Second, in contrast to India, export growth of capital-intensive products from China has been driven by its high level of participation in GVCs within these industries. China’s export promotion policies since the 1990s have relied heavily on a strategy of integrating its domestic industries within the GVCs. Making use of imported parts and components, China emerged as a major assembly hub for several capital-intensive products.
The dominance of capital intensive products in the export basket along with a low level of participation in GVCs have resulted in a disproportionate shift in India’s geographical direction of exports from traditional rich country markets to other destinations. The high-income
5Jobs and Growth by Specializing to Exports in Network Products

UNIQUE P
UBLISHERS (I
) PVT. L
TD.
Content developed by UNIQUE PUBLISHERS (I) PVT. LTD.
Economic Survey & Budget26
OECD markets accounted for 49.7 per cent of China’s exports in 2018 while the corresponding figure for India was 40.2 per cent similarly, high-income OECD and other high- income countries together accounted for 63.9 per cent of China’s exports while that of India was 56.7 per cent. That India’s market penetration in high-income countries is perceptibly low, and has declined disproportionately during the recent decades, is not difficult to understand given the distorted pattern of its specialization. Developing countries, especially those with low level of participation in GVCs, find it extremely difficult to export capital intensive products to the quality/brand conscious markets in richer countries. In contrast to capital-intensive products, high-income countries generally provide relatively a larger market for India’s unskilled labour-intensive products. On the other hand, Chinese products, irrespective of whether they are capital intensive or unskilled labour-intensive, are able to penetrate equally both in high income and low & middle income countries. For China, this pattern is expected as it is an assembly centre for the world market, irrespective of who the buyer is. The extent of China-India gap in terms of dollar value of total exports, specialization effect, diversification effect, quantity effect and price effect.
On an average, China’s export value in dollar terms exceeds that of India by about 743 per cent per year during the period 2000-2015. The bulk of this gap is accounted by specialization and quantity effects. Interestingly, however, China-India gap almost fully disappears once the effect of China’s high trade orientation with richer trading partners is taken into account
A general perception is that China’s exchange rate policy mainly contributed to its export success. However India’s export under-performance persists over two decades when India’s exchange rate depreciated significantly. In fact, multivariate analysis using regressions, which are omitted for brevity, shows that exchange rate does not significantly explain China-India gap. It can be concluded that China’s remarkable export performance, compared to India, is
driven by a set of interrelated factors including a high level of participation in GVCs, a high degree of specialization in labour intensive production activities, large scale in the chosen sectors of specialisation, and a high level of export penetration in traditional rich country markets.
IS IT DESIRABLE TO PROMOTE STRONG LOCAL LINKAGES FOR DOMESTIC INDUSTRIES BY SOURCING INTERMEDIATE INPUTS DOMESTICALLY OR TO PARTICIPATE IN GVCS WHEREIN LINKAGES ARE GLOBALLY DISPERSED?A higher level of participation in GVCs implies that, for any given country, the share of foreign value added in gross exports is higher than when most inputs are sourced locally. However, owing to scale and productivity effects of selling in the world markets, participation in GVCs can lead to higher absolute levels of domestic value added and domestic job creation. Chinese dominance of assembly in iPod and iPhone illustrates this phenomenon. Within the iPod value chain, China specializes in assembly while parts & components are imported. The factory-gate price of an assembled iPod was estimated to be $144 in 2008, but only $4 of this constituted Chinese value added (3 per cent of factory gate price). However, China assembled almost all of the 54.83 million iPods that Apple sold, which led to aggregate domestic value added of $219 million.
China makes only US$8.46 from the assembly of an iPhone 7. However, total Chinese value added is very high ($8.46 × number of iPhones sold in the world). iPod and iPhone are just two examples. There are thousands of such products, where China has emerged as an assembly centre. The participation in GVCs, as measured by the sectoral ratio of foreign value added to gross exports, leads to higher absolute levels of gross exports, domestic value added and employment. It can be seen that a 10 per cent
Greater Use ofImported Inputs
Scale and ProductivityEffect for Producing for
the World
GreaterParticipationin Assembly
Share ofForeign
Value Addedin GrossExports
increases
$ value ofgross exports
risessignificantly
$ value ofDomestic
Value Addedincreases
significantly
Number ofJobs
Increasessignificantly
Figure: The Conceptual Framework for Gains from “Assembling in India” as part of “Make in India”

UNIQUE P
UBLISHERS (I
) PVT. L
TD.
Content developed by UNIQUE PUBLISHERS (I) PVT. LTD.
Jobs and Growth by Specializing to Exports in Network Products 27
increase in foreign value added share of gross exports leads to 17.9 per cent increase in the dollar value of gross exports which in turn, causes domestic value added (from exports) to increase by 7.7 per cent. Finally, 7.7 per cent increase in domestic value added increases employment by 13.2 per cent. These relationships are robust to different model specifications with full set of control variables. The bottom line is that India can reap rich dividends by adopting policies aimed at strengthening its participation in GVCs.
The scale effect creates millions of jobs and is therefore particularly suited for implementation in a labour-intensive economy such as India.
GIVEN OUR COMPARATIVE ADVANTAGE IN LABOUR-INTENSIVE ACTIVITIES AND THE IMPERATIVE OF CREATING EMPLOYMENT FOR A GROWING LABOUR FORCE, WHICH GROUPS OF INDUSTRIES THAT HOLD THE GREATEST POTENTIAL FOR EXPORT GROWTH AND JOB CREATION? PRESENT A CASE OF HOW INDIA CAN EMERGE AS A MAJOR HUB FOR “NETWORK PRODUCTS” (NP)?First, there exists a significant unexploited export potential in India’s traditional unskilled labour-intensive industries such as textiles, clothing, footwear and toys. The GVCs in these industries are controlled by “buyer driven” networks wherein the lead firms that are based in developed countries concentrate in higher value added activities such as design, branding and marketing. Physical production is carried out, through sub-contracting arrangements, by firms in developing countries. Examples include the production networks of Wal-mart, Nike, Adidas etc.
Second, India has huge potential to emerge as a major hub for final assembly in a range of products, referred to as “network products” (NP) The GVCs in these industries are controlled by leading MNEs such as Apple, Samsung, Sony etc. within “producer driven” networks. In general, these products are not produced from start to finish within a given country; instead, countries specialize in particular tasks or stages of the good’s production sequence. Within the production network, each country specializes in a particular fragment of the production process; this specialization is based on the country’s comparative advantage. Labour abundant countries, like China, specialize in low skilled labour-intensive stages of production such as assembly while the richer countries specialise in capital and skill-intensive stages such as R&D. Thus, the lead firms retain skill and knowledge-intensive
stages of production in high-income headquarters (e.g., the U.S.A, E.U and Japan) but locate assembly related activities in low wage countries (e.g., China and Vietnam).
Together, NPs accounted for nearly 30 per cent of world exports in 2018, with the share of Electrical Machinery (SITC 77) being the highest at 10.4 per cent. Using trade data at a detailed level of disaggregation and the UN-Broad Economic Categories (BEC) system, it is possible to disentangle total trade in these NP into its two main sub-categories - parts & components (P&C) and assembled end products (AEP).
After Government of India established Maruti Udyog Limited (MUL) in 1981, MUL entered into a license and joint venture agreement with Suzuki Motor Co Ltd in 1982. Suzuki acquired 26 per cent stake in MUL in return for providing latest technologies and management practices. The company started its operation with the import of totally assembled cars in Japan, followed first by assembly of semi- knocked down (SKD) packs and then by completely- knocked down (CKD) packs supplied by Suzuki. During the early stage, assembly of cars in India involved fitting low-technology and low-value components and equipment into the imported car (Hamaguchi, 1985). During 1985-89 the import value of auto components shot up rapidly (D’Costa, 1995). India’s imports of auto parts from Japan increased from US$4 million in 1980 to US$155 million in 1986, accounting for 77 per cent of India’s total auto parts imports. However, with the development of domestic auto ancillary industry, imports of auto parts declined sharply since the late 1980s. In the meanwhile, the success of the joint venture led Suzuki to increase its equity from 26 per cent to 40 per cent in 1987, to 50 per cent in 1992, and further to 56.21 per cent in 2013. Indian government sold the remaining 18 per cent of its shares in 2007.
From about the early 2000s, the Indian automobile industry has undergone a remarkable transformation from production for the domestic market, which remained its modus operandi for over a half century, to global integration. The country has emerged as a major assembly centre for compact cars. India’s exports of completely built units (CBUs) increased from about US$225 million in 2001 to US$8.8 billion in 2017, while exports of parts and accessories increased from US$408 million to US$5.5 billion between these two years (see panel (a) in the figure below). The pattern is quite different on the import side with parts and accessories growing significantly faster than assembled vehicles during the same period (see panel (b) in the figure below). In 2017, the import value of assembled vehicles stood below US$1 billion compared to about US$5.4 billion worth of imports of parts and accessories. While assembled motor vehicles constitute the bulk of India’s automobile exports, parts and accessories account
UNIQUE P
UBLISHERS (I
) PVT. L
TD.
Content developed by UNIQUE PUBLISHERS (I) PVT. LTD.
Economic Survey & Budget28
for the lion’s share of total automobile imports. This pattern is consistent with the emergence of India as an assembly centre for automobiles.
The key learning from the successful case study of the Indian Automobiles sector is that domestic firms graduate up the production value chain by first starting with low-technology operations such as assembly and then moving to manufacturing of components. In the process, imports of components increase in the short run. Following a policy of import substitution right from the outset does not enable the process of graduation up the production value chain.
India toppled Vietnam to become the second largest manufacturer of mobile phones globally following China in 2018 with a world share of 11 per cent. India could manufacture around 1.25 billion handsets across various segments by 2025, firing up an industry worth around $230 billion (ICEA-McKinsey report, 2018). Between 2013 and 2017, while India’s import of telecom handsets declined from US$4.47 billion to US$3.31 billion that of telecom parts increased steadily from US$1.34 billion to US$9.41 billion. At the same time exports of telecom handset increased significantly during the last three years. This pattern is consistent with the emergence of India as an assembly centre for telecom handsets.
THE BASIC TRADE THEORY TEACHES US THAT A COUNTRY’S GAINS FROM FREE TRADE ARISE FROM THE FACT THAT IT LEADS TO A MORE EFFICIENT ALLOCATION OF A COUNTRY’S RESOURCES. DOES THE EVIDENCE SUPPORT THE NAÏVE MERCANTILIST’S PERSPECTIVE? EXAMINE IN THE LIGHT OF THE RECENT DEBATE ABOUT INDIA NOT JOINING THE REGIONAL COMPREHENSIVE ECONOMIC PARTNERSHIP (RCEP) AGREEMENT ANALYZING THE GENERAL EFFICACY OF FREE TRADE AGREEMENTS (FTAS)?An apprehension is that most of the FTAs that India had signed in the past had not worked in “India’s favour.” The argument that is put forward is that the agreements led to worsening of India’s trade deficit with the partner countries with which the agreements have been signed. This is the mercantilist way of evaluating the gains from trade.
It can be seen that, manufactured products from India has clearly benefitted from eight out of the fourteen trade agreements considered here. These are: MERCOSUR, ASEAN, Nepal, Singapore, Chile, Bhutan, Afghanistan and Japan. Four of the agreements (SAFTA, BIMSTEC,
Thailand and Sri Lanka) had no effect on exports of manufactured products while the bilateral agreements with Korea and Japan exerted a negative effect. Turning to overall merchandise exports, only four trade agreements (MERCOSUR, Nepal, Singapore, and Chile) show a positive impact. The differential effect on overall merchandise exports as compared to the manufacturing subset is not surprising as several primary products are usually included in the negative/sensitive list of the trade agreements. Therefore, a majority of the trade agreements exerted no effect on overall merchandise exports. Compared to manufactured exports, a fewer number of trade agreements exerted a positive impact on India’s manufactured imports. The agreements that exerted a positive effect on India’s imports include Japan, Korea and Chile for manufactured products and Japan, Korea, Chile, Singapore and Sri Lanka for overall merchandise imports. Even as some of the agreements led to increase in imports, for most of the cases, the percentage increase in exports is higher than the percentage increase in imports. The exceptions are the bilateral agreements with Korea, Japan and Sri Lanka, where the percentage increase in imports are higher than that of exports.
The overall impact on India’s exports to the partners, with which the agreements have been signed, is 13.4 per cent for manufactured products and 10.9 per cent for total merchandise. The overall impact on imports is found to be lower at 12.7 per cent for manufactured products and 8.6 per cent for total merchandise. Therefore, from the perspective of trade balance, India has clearly “gained” in terms of 0.7 per cent increase in trade surplus per year for manufactured products and of 2.3 per cent increase in trade surplus per year for total merchandise.
The experience of countries that have achieved rapid and sustained export growth suggests that India can reap rich dividends by adopting policies aimed at strengthening its involvement in the export market for network products (NP). Given our vast manpower with relatively low skill, India’s current strength lies primarily in assembly of NP. While the short to medium term objective is the large scale expansion of assembly activities by making use of imported parts & components, giving a boost to domestic production of parts & components (upgrading within GVCs) should be the long term objective. Assembly is highly labour intensive, which can provide jobs for the masses, while domestic production of parts & components can create high skill jobs.
A highly feasible target of raising India’s export market share to about 3.5 per cent by 2025 and 6 per cent by 2030 would create about 38.5 million additional jobs in the country by 2025 and about 82 million additional jobs by 2030. The incremental value added in the economy from the target level of exports of network products would make up about one-quarter of the increase required for making India a $5 trillion economy by 2025.

UNIQUE P
UBLISHERS (I
) PVT. L
TD.
Content developed by UNIQUE PUBLISHERS (I) PVT. LTD.
Targeting Ease of Doing Business in India 29
6Targeting Ease of Doing Business in India
A MAJOR CHALLENGE MOST COMPANIES FACE IS THE COMPLEX ARCHITECTURE OF THE INDIAN GOVERNANCE FRAMEWORK INCLUDING THE DENSITY OF LEGISLATION AND STATUTORY COMPLIANCE REQUIREMENTS. GIVE A LIST OF THE RULES REQUIRED TO BE COMPLIED, WITH, BY MANUFACTURING UNITS?Most of the manufacturing units in India have small capacities and consequently low manufacturing
efficiencies which are a disadvantage in the global supply chain. Countries like Bangladesh, China, Vietnam are able to progress in the value chain by increasing their competitiveness in the international market by improving their delivery time and domestic production capacity.
Compared to Bangladesh, China, and Vietnam, which have more than 80 per cent of market value of exports by large enterprises, India has 80 per cent by small enterprises. Moreover, in India it can take 7-10 days to reach a port whereas in countries like China, Bangladesh and Vietnam it takes less than a day. Thus, the Indian supply chain ends up with a large number of small consignments clogging already inefficient logistics pathways.
TABLE: APPLICABLE RULES AND STATUTORY LAWS FOR MANUFACTURING
S. No. Name of the Act (A) No. ofSections
(B)
No. ofRules, etc.
(A + B)
Total
1. Apprentices Act, 1961 37 14 51
2. Air (Prevention & Control of Pollution) Act, 1981 54 – 54
3. Central Excise Act, 1944 40 90 130
4. Central Excise Tariff Act, 1985 5 – 5
5. Central Sales Tax Act, 1956 26 9 35
6. Companies Act, 2013 470 19 489
7. Contract Labour (Regulation and Abolition) Act, 1970 35 83 118
8. Customs Act, 1962 161 53 214
9. Customs Tariff Act, 1975 13 – 13
10. Depositories Act, 1996 31 – 31
11. Employee Compensation Act, 1923 36 52 88
12. Employee State Insurance Act, 1948 100 211 311
13. Employment Exchanges (Compulsory Notificaiton of Vacancies) Act, 1959 10 8 18
14. Environment (Protection) Act, 1986 26 88 114
15. Employee Provident Funds & Miscellaneous Provisions Act, 1952 22 156 178
16. Equal Remuneration Act, 1976 18 6 24
17. Factories Act, 1948 120 128 248
18. Foreign Exchange Management Act, 1999 49 102 151
19. Foreign Trade (Development & Regulation) Act, 1992 20 18 38
20. Finance Act, 1994 36 43 79
21. Guidelines of Department of Scientific and Industrial Research – 6 6

UNIQUE P
UBLISHERS (I
) PVT. L
TD.
Content developed by UNIQUE PUBLISHERS (I) PVT. LTD.
Economic Survey & Budget30
S. No. Name of the Act (A) No. ofSections
(B)
No. ofRules, etc.
(A + B)
Total
22. Income Tax Act, 1961 298 125 423
23. Indian Stamp Act, 1899 78 22 100
24. Indian Boiler Act, 1923 34 626 660
25. Indian Electricity Act, 2003 185 – 185
26. Indian Wireless Telegraphy Act, 1933 11 13 24
27. Indian Standard Codeof Practice for Selection, Installation and Maintenance of Portable First Aid Fire Extinguishers
– 16 16
28. Industrial Disputes Act, 1947 40 80 120
29. Industrial Employment (Standing Orders) Act, 1946 15 22 37
30. Legal Metrology Act, 2009 57 64 121
31. Maternity Benefit Act, 1961 30 – 30
32. Minimum Wages Act, 1948 31 32 63
33. Motor Vehicles Act, 1988 217 164 381
34. Narcotic Drugs and Psychotropic Substances Act, 1985 51 68 119
35. Payment of Gratuity Act, 1972 15 17 32
36. Patents Act, 1970 161 139 300
37. Payment of Wages Act, 1936 26 13 39
38. Payment of Bonus Act, 1965 40 5 45
39. Petroleum Act, 1934 31 202 233
40. Poisons Act, 1919 9 – 9
41. Securities and Exchange Board of India Act, 1992 31 334 365
42. Securities Contract (Regulation) Act, 1956 31 21 52
43. Special Economic Zones Act, 2005 58 6 64
44. Water (Prevention and Control of Pollution) Act, 1974 64 – 64
45. Water (Prevention and Control of Pollution) Cess Act, 1977 17 9 26
46. Shops and Establishment Act State-wise State-wise State-wise
47. Trade Marks Act, 1999 159 185 344
Total 3,214 3,582 6,796
WHAT IS AUTHORISED ECONOMIC OPERATOR PROGRAMME?Authorised Economic Operator (AEO) is a programme under the aegis of the World Customs Organization (WCO) SAFE Framework of Standards to secure and facilitate Global Trade. The programme aims to enhance international supply chain security and facilitate movement of goods. AEO encompasses various players in the international supply chain. Under this programme, an entity engaged in international trade is approved by Customs as compliant with supply chain security standards and granted AEO status. An entity with an AEO status is considered a ‘secure’ trader and a reliable
trading partner. AEO is a voluntary programme. It enables Indian Customs to enhance and streamline cargo security through close cooperation with the principle stakeholders of the international supply chain viz. importers, exporters, logistics providers, custodians or terminal operators, custom brokers and warehouse operators, who benefit from preferential treatment from customs authorities. Benefits include expedited clearance times, fewer examinations, improved security and communication between supply chain partners, and more. The Circular 33/2016 – Customs dated July 22, 2016 provides the statutory framework for the AEO programme.
There are three tiers of certification in the new AEO Programme for importers and exporters:

UNIQUE P
UBLISHERS (I
) PVT. L
TD.
Content developed by UNIQUE PUBLISHERS (I) PVT. LTD.
Targeting Ease of Doing Business in India 31
1. AEO T1 – Verified on the basis of document submission only.
2. AEO T2 – In addition to document verification, onsite verification is also done.
3. AEO T3 – For AEO T2 holders who have enjoyed the status for two years only on the basis of document verification and for AEO T2 holders who have not enjoyed the status continuously or have introduced major changes in business, the applicant is subjected to physical verification.For logistics providers, custodians or terminal
operators, custom brokers and warehouse operators there is only one tier:
AEO LO – Here onsite verification is done in addition to document verification.
WHO IS ENTITLED FOR AEO CERTIFICATION Anyone involved in the international supply chain that undertakes Customs related activity in India can apply for AEO status irrespective of size of the business. These may include exporters, importers, logistic providers (e.g.
carriers, airlines, freight forwarders, etc.), custodians or terminal operators, customs house agents and warehouse owners. Others who may qualify include port operators, authorized couriers, stevedores. The list is not exhaustive.
Eligibility
Any legal entity that undertakes Customs related work can apply for the AEO Programme if they fulfil the following conditions: 1. They have handled 25 Import or Export documents in
last Financial Year. 2. They have had their business activity for last three
Financial Year (can be waived in deserving cases). 3. The applicant must have been Financially Solvent for
the last three financial years. 4. The applicant must not be issued a show cause
notice involving ‘fraud, forgery, outright smuggling, clandestine removal of excisable goods or cases where Service Tax has been collected from customers but not deposited to the Government during last three financial years.
UNIQUE P
UBLISHERS (I
) PVT. L
TD.
Content developed by UNIQUE PUBLISHERS (I) PVT. LTD.
Economic Survey & Budget32
PRESENT A SURVEY OF THE BANKING SECTOR IN INDIA?In 2019, India completed the 50th anniversary of the bank nationalization programme undertaken in 1969. It is, therefore, apt to celebrate the accomplishments of the 389,956 officers, 295,380 clerks, and 121,647 sub-staff who work in public sector banks (PSBs). As PSBs account for 70 per cent of the market share in banking, an assessment of the state of India’s public sector banks (PSBs) is apposite. Even though PSBs are the dominant players in the banking sector, they lag considerably in performance metrics when compared to their peers. India’s banks are disproportionately small compared to the size of its economy. In 2019, when Indian economy is the fifth largest in the world, our highest ranked bank—State Bank of India— is ranked a lowly 55th in the world and is the only bank to be ranked in the Global top 100. India has only one bank in the global top 100 and gets grouped on this characteristic with countries that are a fraction of its size: Finland (about 1/11th), Denmark (1/8th), Norway (1/7th), Austria (about 1/7th), and Belgium (about 1/6th). Countries like Sweden and Singapore, which are respectively about 1/6th and 1/8th the economic size of India, have thrice the number of global banks as India does.
A fit of the number of banks in the global top 100 and the size of the economy shows clearly that India is a significant outlier on the negative side. All the largest economies have proportionately large banks with China being an outlier on the positive side with 18 banks in the global top 100.
India as an outlier when the penetration of credit to the private sector is plotted against the GDP per capita of a country; as credit in India is provided primarily by banks, this measure proxies the penetration of credit by banks in India. While greater population does lower penetration of credit, such penetration is disproportionately lower in India when compared to our population. A large economy needs an efficient banking sector to support its growth.
Yet, credit growth among PSBs has declined significantly since 2013 and has also been anaemic since 2016. Even as NPBs grew credit at between 15 per cent and 29 per cent per year between 2010 and 2019, PSB credit growth essentially stalled to the single digits after 2014, ending up at a 4.03 per cent growth in 2019 compared 15 per cent to 28 per cent from 2010 to 2013. Studies suggest that Yet, Figure 5 shows
that credit growth among PSBs has declined significantly since 2013 and has also been anaemic since 2016. Even as NPBs grew credit at between 15 per cent and 29 per cent per year between 2010 and 2019, PSB credit growth essentially stalled to the single digits after 2014, ending up at a 4.03 per cent growth in 2019 compared 15 per cent to 28 per cent from 2010 to 2013.
Historically, in the last 50 years, the top-five economies have always been ably supported by their banks. The support of the U.S. Banking system in making the U.S. an economic superpower is well documented. Similarly, in the eighties during the heydays of the Japanese economy, Japan had 15 of the top 25 largest banks then. In recent times, as China has emerged as an economic superpower, it has been ably supported by its banks—the top four largest banks globally are all Chinese banks. The largest bank in the world—Industrial and Commercial Bank of China—is nearly two times as big as the 5th or 6th largest bank, which are Japanese and American banks respectively. Using the above relationship, we estimate that if Indian banks were proportionately large in relation to the size of the Indian economy, we should have at least six banks in the global top 100. Similarly, India becoming a $ 5 trillion economy will require at least eight Indian banks to be large enough to belong in the top 100 globally. The state of the banking sector in India, therefore, needs urgent attention.
WHAT IS THE OVERALL VALUE THAT THE TAXPAYER DERIVES FROM HER INVESTMENT IN PSBS?As PSBs account for 70 per cent of the market share in Indian banking, the onus of supporting the Indian economy and fostering its economic development falls on them. However, in 2019, PSBs’ collective loss— largely due to bad loans—amounted to over ` 66,000 crores, an amount that could nearly double the nation’s budgetary allocation for education. PSBs account for 85 per cent of reported bank frauds while their gross non- performing assets (NPAs) equal ` 7.4 lakh crores which is more than 150 per cent of the total infrastructure spend in 2019. Estimate of return on equity in 2019 highlights that every rupee of taxpayer money invested in PSBs as equity by the Government loses 23 paise. The market-to-book ratio, which indicates the quality of a bank’s governance, is 0.8 as on 20th January,
7 Golden Jubilee of Bank Nationalisation: Taking Stock

UNIQUE P
UBLISHERS (I
) PVT. L
TD.
Content developed by UNIQUE PUBLISHERS (I) PVT. LTD.
Golden Jubilee of Bank Nationalisation: Taking Stock 33
2020 for PSBs while that of the average NPB is close to 4. To enable PSBs to become efficient and thereby catalyse the banking sector and stimulate economic growth, structural solutions are necessary. Over ` 4,30,000 crores of taxpayer money is invested as Government’s equity in PSBs. In 2019, every rupee of taxpayer money invested in PSBs, on average, lost 23 paise. In contrast, every rupee of investor money invested in “New Private Banks” (NPBs)—banks licensed after India’s 1991 liberalization—on average gained 9.6 paise. As PSBs and NPBs operate in the same domestic market, there is a case for enhancing the efficiency of PSBs.
To understand the scale of inefficiencies in PSBs, we estimate the potential gain only from changes in the return on the taxpayer’s investment in PSBs. The return earned by an investor in an average NPB represents the benchmark that must be employed to estimate the losses that the taxpayer bears from her investment in PSBs. Using this benchmark, the foregone return on the taxpayer’s investment in PSBs must rank as one of the largest subsidies as the foregone amount of over ` 1.4 lakh crores compares similarly to the amount provided for the food subsidy.
For this purpose, we use the ratio of stock market-to- book value of PSBs on average vis-à-vis that of new private sector banks (NPBs). As on 20th January 2020, we note that every rupee of this taxpayer money fetches a market value of 71 paise. In stark contrast, every rupee invested in NPBs fetches a market value of ` 3.70 i.e., more than five times as much value as that of a rupee invested in PSBs. This leads to the natural question: What if the market-to-book ratio of each PSB doubled, which envisages an extremely modest and unambitious increase, as the average PSB will still generate about one-third the value that a NPB generates on average? Figure 7 shows that the gain would be ` 5.2 lakh crores, an amount that is about five times the budgeted estimate for disinvestment for 2019 (` 1.05 lakh crores). A more realistic, but not desperately modest, scenario would be to assume that the market-to-book ratio of each PSB becomes equal to that of the second worst performing NPB; this is a realistic scenario as the worst performing NPB has a market-to- book ratio that is greater than the average for PSBs. Thus, we assume here that the taxpayer investment in each PSB would at least equal the market-to-book ratio of the NPBs that are at the bottom of their heap. This change would gain the Government about `9.1 lakh crores, which is more than about 8.5 times budgeted estimate for disinvestment for 2019. A change in the market-to-book ratio of each PSB to the median for the NPBs would gain the Government ` 10.2 lakh crores, which is over nine times the disinvestment target for 2019. Finally, a change in the market-to-book ratio of each PSB
to the median for the NPBs would gain the Government ` 11.8 lakh crores, which is about 11 times the disinvestment target for 2019. As argued above, the primary difference between PSBs and NPBs stems from the difference in efficiencies and all the consequent differences that result from the same. This scenario analysis clearly suggests that the costs stemming from inefficiency of PSBs are enormous.
INDIA NEEDS TO RECOGNISE THAT THE FULFILMENT OF SOCIAL GOALS CAN HAPPEN AT SCALE THROUGH FINANCIAL INTERMEDIATION. EXAMINE THE STATEMENT BY ANALYZING THE CASE OF MICROFINANCE SECTOR?India is at a critical inflection point in her growth trajectory due to a unique confluence of factors, which (i) a positive demographic dividend; (ii) a modern digital infrastructure supported by the JAM “trinity” of near-100 per cent financial inclusion, a biometrics-based unique identity system, and a mobile network structure, and (iii) a de novo GST network with uniform, electronic indirect taxation system across India. These investments set the stage for a modern economy in which tens of crores of individuals and businesses are entering the formal financial system.
Given India’s demographics and the growth opportunities on hand, we need a thriving banking sector now. A vibrant banking system can support and unleash a multiplier effect and permanently alter India’s growth trajectory in a positive way. Conversely, inefficient PSBs can severely handicap the country’s ability to exploit the unique opportunities she can utilize today. The result could be a generational setback to the country’s economic growth. As mentioned earlier, no country has been a dominating global economy without the support of an efficient banking system. So for India to march in its goal of becoming a $5 trillion economy, PSBs—the dominant banks in our banking system—need to become efficient.
The microfinance sector, especially given its transformation since 2000, provides a good illustration of how social goals can be achieved at scale using business models that are different from that of PSBs. Most microfinance institutions (MFIs) started as not-for-profit institutions. Post 2000, while their objective remained poverty alleviation via inclusive growth and financial inclusion, MFIs moved from purely pursuing social goals to the double bottom-line approach of achieving social and financial returns. The emphasis on social impact at the “bottom of the pyramid” combined with good financial returns of some of the leading MFIs, brought

UNIQUE P
UBLISHERS (I
) PVT. L
TD.
Content developed by UNIQUE PUBLISHERS (I) PVT. LTD.
Economic Survey & Budget34
many mainstream commercial entities into the sector. For instance, some banks partnered with MFIs by lending to MFIs for on-lending the money to this segment and thereby fulfil their priority lending obligations. The United Nation’s declaration of Microfinance year in 2005 highlighted the role of MFIs in poverty alleviation. Some MFIs have transformed themselves into banks as well. Figure A shows the exponential growth in the impact that MFIs have had since 2000. As of 2016, 97 per cent of the borrowers were women with SC/ST and minorities accounting for around 30 per cent and 29 per cent of the borrowers. This shows that the loans given by these MFIs primarily cater to the marginal sections of the society.
EXAMINE THE BANKING STRUCTURE IN INDIA SINCE NATIONALIZATION TILL TODAY?Banking in India dates back to thousands of years. Several of India’s ancient texts including those in the Vedic period mention bank lending functions. The modern banking system in India has its roots in the colonial era starting in the 1800s. India’s public sector banks (PSBs) are essentially legacy banks from the colonial period that were subsequently nationalized. For example, India’s largest PSB which is currently the 55th largest bank globally, State Bank of India (SBI), was founded as Bank of Calcutta in 1806, took the name Imperial Bank of India in 1921 and became state-owned in 1955. The remaining PSBs in India were formed through two waves of nationalizations, one in 1969 and the other in 1980. After the 1980 nationalization, PSBs had a 91 per cent share in the national banking market with the remaining 9 per cent held by “old private banks” (OPBs) that were not nationalized.
The market structure of the banking sector has evolved in the 50 years since the 1969 nationalization. As of March 2019, PSBs had ` 80 lakh crore in deposits, held ` 20 lakh crore in government bonds, and made loans and advances of ` 58 lakh crore, representing between 65 per cent and 70 per cent of the aggregates for all scheduled commercial banks operating in India.2 They also hold about ` 20 lakh crore of the government debt, a large part of it driven by the requirements for a minimum “statutory liquidity” ratio. PSBs thus continue to have a significant footprint today albeit with a market share that is less than the 91 per cent share after the 1980 nationalization. The decline in PSB market share has been largely absorbed by “new private banks” (NPBs), which were licensed in the early 1990s after a liberalization of licensing rules that earlier regulated bank entry. PSBs, OPBs, and NPBs are currently subject to similar banking regulations on virtually all aspects of their functioning including branching and priority sector lending. The key difference between the state- owned
PSBs and private banks is that PSBs enjoy less strategic and operating freedom because of majority government ownership. The government exercises significant control over all aspects of PSB operations ranging from policies on recruitment and pay to investments and financing and bank governance including board and top management appointments. The majority ownership of the government and its writ on bank functioning also results in an implicit promise of the bailout of bank liabilities which is an implicit cost to the taxpayer. The majority ownership by the government also subjects PSB officers to scrutiny of their decisions by the central vigilance commission and the comptroller auditor general. With no real restrictions on what can be investigated and under what circumstances, officers of state-run banks are wary of taking risks in lending or in renegotiating bad debt, due to fears of harassment under the veil of vigilance investigations.
WHAT DID BANK NATIONALIZATION ACHIEVE? ANALYZEThe allocations of banking resources to rural areas, agriculture, and priority sectors increased. Consider some of the raw statistics in the first decade after the 1969 nationalization. The number of rural bank branches increased ten-fold from about 1,443 in 1969 to 15,105 in 1980 compared to a two-fold increase in urban and semi-urban areas from 5,248 to 13,300 branches. Credit to rural areas increased from ` 115 crore to ` 3,000 crore a twenty-fold increase and deposits in rural areas increased from ` 306 crore to ` 5,939 crore, again a twenty-fold increase. Between 1969 and 1980, credit to agriculture expanded forty-fold from ` 67 crore to ` 2,767 crore, reaching 13 per cent of GDP from a starting point of 2 per cent. This growth represents a significant correction to the undersupply of credit to farmers that drove nationalization. Both rural bank deposit mobilization and rural credit increased significantly after the 1969 nationalization.
However, some caution is necessary in interpreting the above trends as being entirely caused by nationalisation. A key confounder in such an interpretation is the role played by other interventions around bank nationalization. For instance, the government initiated a “green revolution” between 1967 and 1977. In addition, multiple anti-poverty programmes mark India’s 4th and 5th five- year plans that bookend its nationalization. Confounding effects are introduced by the policies pursued by RBI after nationalization. Its directed lending programmes set lending targets for priority sectors, using a complex mix of pricing formulas that determined the rates of interest to be charged by banks on different types of credit, in styles reminiscent of central planning rather than market

UNIQUE P
UBLISHERS (I
) PVT. L
TD.
Content developed by UNIQUE PUBLISHERS (I) PVT. LTD.
Golden Jubilee of Bank Nationalisation: Taking Stock 35
economies. RBI used both formal means and moral suasion to persuade banks to achieve the targets it set. These tools carried special force given that banks were essentially operating in a marketplace sheltered from entry.
Conclusions about what nationalisation has achieved must consider the counter-factual situation of what could have been achieved had there been no nationalization. The benefits of nationalization can only be estimated using this counterfactual. There have been some careful studies that have looked at the impact of bank nationalization using this careful lens. The findings are mixed.
Conclusions about what nationalisation has achieved must consider the counter-factual situation of what could have been achieved had there been no nationalization. The benefits of nationalization can only be estimated using this counterfactual. There have been some careful studies that have looked at the impact of bank nationalization using this careful lens. The findings are mixed. policy led to significant reduction in poverty in financially less developed states. However, Kochar (2005) argues that integrated rural development program (IRDP), the Government’s flagship poverty alleviation program, was actively implemented during this period with greater intensity in financially less developed states. Therefore, it is almost impossible to conclude that government bank branch expansion caused reduction in poverty. Panagariya (2006) also rejects the findings in Burgess and Pande (2005) by arguing that the branch expansion program of similar intensity existed even before nationalization and hence the 1977-1991 period is not special in terms of branch expansion. In other words, differential impact on poverty seen during 1977-1991 cannot be attributed to nationalization.
Finally, Cole (2009) carefully examines the impact of the second wave of bank nationalization undertaken in the year 1980. He exploits the fact that banks above certain threshold size were nationalized and compares regions having higher proportion of banks that marginally crossed the nationalization threshold and regions having higher proportion of banks that narrowly missed the threshold. The study finds no significant benefit of nationalization on the real economy. In fact, he shows that employment in trade and services declines and the quality of financial intermediation deteriorated. There was increase only in the quantity of credit.
Over and above these studies, we also know that despite nationalization a significant portion of the poor remained unbanked till 2014. Financial inclusion, in large part, happened in August 2014 through the Pradhan Mantri Jan Dhan Yojana (PMJDY), the first week of which saw more than 18 million bank accounts—a record in the Guinness Book of World Records.
PRESENT AN ARGUMENT ON HOW TO STRENGTHEN PUBLIC SECTOR BANKS IN INDIA. WHAT IS THE WAY FORWARD?The key drivers of India’s growth prospects are now (a) highly favourable demographics – with 35 per cent of its population between 15 and 29 years of age; (b) a modern and modernizing digital infrastructure that encompasses the “JAM” trinity of financial inclusion, the Aadhaar unique identification system, and a well- developed mobile phone network, and (c) a uniform indirect taxation system (GST) to replace a fragmented, complex state-level system. India’s growth path depends on how quickly and productively these growth levers are deployed using a well-developed financial system.
Previously, the Narasimhan Committee (1991, 1997), Rajan Committee (2007) and P J Nayak Committee (2014) have provided several suggestions to enhance the efficiency of PSBs.
India’s growth opportunities today, which stem from a unique confluence of several positives, position PSBs well to utilise FinTech. One is India’s demographic dividend. 62 per cent of India’s population is between 15 and 60 and a further 30 per cent of the population is under 15. Thus, India is poised to enjoy the benefits of a substantial working age population for a long period of time. The second force driving India’s growth opportunities is the JAM “trinity,” viz., the PMJDY bank account programme, the Aadhaar unique identity programme, and the mobile phone infrastructure, each of which has been implemented to cover practically the entire country. The growth in digital transactions as a result of these two factors has been significant. The use of direct benefit transfers, which increased from has increased exponentially over the last five years, has helped to bring both credit and deposits into the banking system across all geographies (rural, semi-urban, urban and metropolitan). The high elasticities across all geographies for Indian banks to benefit from the greater clearly demonstrate the opportunity that exists use of DBT by the Government. The new programmes have resulted in a surge of individuals and businesses being brought into the formal economy. Perhaps more important is that the inclusion is backed by state-of-art digital infrastructure that generates and stores an abundance of high quality structured data on the all aspects of the economic lives of firms and individuals. Such data are, of course, the gold mine for economic growth in the 21st century. They offer essentially unlimited and uncharted possibilities, especially for firms and individuals who have been traditionally excluded from the financial system.

UNIQUE P
UBLISHERS (I
) PVT. L
TD.
Content developed by UNIQUE PUBLISHERS (I) PVT. LTD.
Economic Survey & Budget36
PSBs have many important ingredients in place to cater to this new demand. For example, they have local market insights and relationships based on operating histories spanning many decades. Their geographic footprint is vast. PSBs, however, need significant investments are in the capabilities to exploit the coming data-rich environment in India. Analytics based on market data are quite capable of providing accurate predictions of corporate distress. Variants of such approaches appear to hold promise for both consumer loans and commercial and industrial loans.
The data that can be employed for credit analytics is available in both structured and unstructured form. Data in a structured form include credit information and credit scores based on loan grants and repayments held in the credit registries or credit bureaus. The richer, though unstructured, micro-data is available in text, images, geo-tagged data, social network data, mobile apps, as well as other shallow or deep digital footprints of current and potential customers. Leveraging these data requires new data, analytics, and modelling skills. Likewise, banks need to invest in credit recovery infrastructure. The adoption of these new technologies to exploit a data rich environment will require complementary investments such as specialist human capital with an orientation towards analytics. The barriers to such technologies are not insurmountable. While there are some instances in which PSBs have been lax, technology aversion does not seem to be an intrinsic characteristic of PSBs. For example, when credit bureaus were introduced in India, PSBs in the aggregate were relatively quick to adopt scoring for their new clients
A large proportion of NPAs of Indian banks, especially PSBs, could have been prevented if data and analytics were employed in corporate lending. The rates of default were the highest with larger loans (above INR 100 crores). Data demonstrate clearly the several leading indicators that data and analytics could have clearly highlighted about wilful defaulters. The systematic differences in the disclosure of related party transactions, pledging of promoter shares, and large loans to related parties between wilful defaulters and non-defaulters, on the one hand, and wilful defaulters and distressed defaulters, on the other hand. These are easily quantifiable measures that a robust credit analytics platform could have easily picked up and provided warning signals.
In June 2017, the Reserve Bank of India (RBI) identified twelve companies constituting 25 per cent of India’s total Non- Performing Assets (NPAs). As shown in Figure 22, the accounting quality of these large defaulters is much below the median accounting quality of other similar listed corporates in 2012, 2013 and 2014. As accounting quality is
easily quantifiable, a robust credit analytics platform could have easily picked up and provided warning signals.
Similarly, an analysis of the annual reports of the large defaulters suggests that the quality of audit disclosure in these firms was very poor. Broadly, out of the twelve large defaulters, one of them had just one indicator disclosed with most others having three to four indicators disclosed of the eight leading indicators. Again, this is an easily detectable characteristic that a robust credit analytics platform could easily flag.
Most corporate term loans are secured and lenders have recourse to pledged assets in the event of default. However, when dealing with wilful defaulters, lenders find their hands tied even when they have a contractual lien on pledged assets. Wilful defaulters have a natural incentive to misrepresent the value of collateral. In more egregious cases, they may pledge fictitious collateral. If they pledge genuine collateral, they have an incentive to dispose of these assets without the lender’s knowledge, lest they lose control of valuable assets after they default.
Data can come to lenders’ rescue in such cases. For example, geo-tagging – the process of adding geographical identification such as latitude and longitude to photos, videos or other media – can help lenders keep track of the location of assets. If borrowers are mandated to periodically share geo-tagged evidence of collateralized assets with their lenders, it would be difficult for them to remove these assets by stealth. Several government departments have already taken the lead in geo- tagging; the Ministry of Rural Development geo-tags MGNREGA assets and the Department of Land Resources geo-tags watershed projects. Lenders may learn from these examples to monitor their collateral. Geo-tagging can also help verify the value of pledged land or property. Armed with the exact location of land, lenders are better placed to evaluate the market value of these assets, the bulk of whose value derives from their location.
GPS systems can confer even more monitoring power. GPS devices, when affixed to collateralized equipment or machinery, can alert lenders if these assets are moved out of the plant. Such tracking systems ensure that the asset never leaves the lender’s sight. For instance, renting companies that lease laptops, appliances etc. have demonstrated a powerful use of remote monitoring using GPS. These electronic items often come with remote kill switches that disable all functions if the renter attempts to tamper with the asset, dispose of it, or delay rent payments. It may similarly serve lenders well if they could, say, disable a vehicular asset remotely if the borrower attempts to dispose of it or wilfully defaults on the loan. Kingfisher Airlines pledged a few helicopters (among other
UNIQUE P
UBLISHERS (I
) PVT. L
TD.
Content developed by UNIQUE PUBLISHERS (I) PVT. LTD.
Golden Jubilee of Bank Nationalisation: Taking Stock 37
assets) to obtain loans. Only when the lenders attempted to take possession of these assets did they realize that the helicopters had fallen into disrepair and could fetch little more than scrap value. Therein lies a strong application of low-cost technology to track the presence, use and quality of assets.
Integrated data on collateral across all lenders in a geography may be particularly useful in curbing double-pledging of collateral. For example, a party may pledge the same collateral to multiple lenders to obtain multiple lines of credit for the same project, or a buyer and his seller may both separately obtain credit for the same trade by presenting the same invoice to their respective lenders. As long as lenders rely on human control processes and paper-based documentation to verify trades, such double-pledging easily escapes notice. SWIFT India – the messaging platform that PNB used to transmit messages in the Nirav Modi case – recently announced a pilot blockchain effort that allows lenders to log invoices and e-bills submitted to them online, allowing other lenders to verify whether a trade they are looking to finance has already been funded or the underlying collateral already pledged. Such integrated data systems are essential to protect lenders.
While these technologies are powerful, they carry an important risk, i.e., the risk of infringing upon the borrower’s privacy and dignity. Enforcement of debt obligations should not encroach into the borrower’s private sphere, as much as a lender may suspect an impending case of wilful default. Therefore, strong and clear policy guidelines are needed on what data may be collected, how, by whom and for how long.
In sum, wilful default would not be as much of a drain on an economy’s wealth if lenders could fully recover their dues from selling pledged assets. Technology and data can be put to powerful use to keep these assets secure and saleable, thus keeping intact an important recourse for lenders. In fact, the threat of losing valuable assets may itself be a deterrent to wilful default in the first place, as these firms often wilfully default only when they are unafraid of losing control of other valuable pledged assets.
Retail lending in India passed through a painful and steep learning curve after 2007- 2008. The NPAs in retail loans primarily impacted the unsecured loans originated by NPBs. While the size of the NPAs was insignificant from a systemic perspective, the sector took its learning from the same. The NPA levels across various retail products has been less than 5 per cent during 2016-19. The use of credit analytics and the resultant reduction in defaults offers important lessons that can be implemented in corporate lending in India.
In fact, the use of data and credit analytics, such as consumer credit bureau data, has significantly enhanced growth in retail lending. India has now caught up the OECD economies in the proportion of population covered using credit bureau data. NPBs, in fact, expanded the use of consumer credit bureau data significantly since 2006.
WHAT IS FINTECH? WHY SHOULD PSBS EMBRACE IT? HOW CAN FINTECH INTEGRATE WITH EMERGING TECHNOLOGIES OF MACHINE LEARNING (ML), ARTIFICIAL INTELLIGENCE (AI) AND BIG DATA?The PSBs they need to embrace FinTech, which is revolutionising the global financial landscape. FinTech is forcing traditional banks to review their outdated business paradigms to come up with effective, low- cost, banking solutions. PSBs have the maximum to gain from FinTech as their use of even conventional information technology is not all-pervasive, except in the use of core banking solutions. As of now, PSBs employ technology mostly for MIS and reporting while most information processing on loans happens manually which causes inefficiency, frauds and loan defaults. Information processing includes all activities related with the ex-ante screening of potential borrowers and the ex-post monitoring of their behaviour. FinTech has radically changed the way information is processed by banks. In corporate lending, for instance, a huge mass of quantitative data such as company financials and qualitative data such as company filings and analyst call reports are machine-analysed using both supervised and unsupervised learning algorithms. Tools such as Machine Learning (ML), Artificial Intelligence (AI) as well as Big Data and matching provide banks the ability to recognize patterns quickly by analysing vast datasets, an activity that would be virtually impossible for humans, even using conventional information technology. The idea is not new as even standard econometric models are but tools for pattern recognition. The novelty lies in analysing extremely large sets of data using algorithms that explore, learn and identify patterns. As investments in FinTech in India are significant, PSBs can benefit from the expertise that already resides in India in this area. Currently, PSBs face many challenges such as high operating costs, disjointed process flows from manual operations and subjective decision making. These challenges hinder PSB’s ability to rigorously screen corporate borrowers ex-ante by evaluating the prospects of the potential borrowers and the value of the collateral that they may be posting. They also need to monitor the borrower ex-post along the whole duration of the lending relationship, possibly enforcing

UNIQUE P
UBLISHERS (I
) PVT. L
TD.
Content developed by UNIQUE PUBLISHERS (I) PVT. LTD.
Economic Survey & Budget38
covenants capable of limiting losses in case of default. Using FinTech allows banks to better screen borrowers and set interest rates that better predict ex-post loan performances PSBs will be able to enhance their efficiency by fulfilling their role of delegated monitors if all the PSBs can pool their data into one entity. Private information held by their corporate borrowers leads to contracting problems, because it is costly to assess the solvency of a borrower or to monitor her actions after lending has taken place. Moreover, the delegation of screening and monitoring to banks has been shown to be an efficient mechanism. This efficiency can be enhanced further by packaging all the information held by various PSBs into a common entity. This would have the additional benefit of reducing the costs of screening and monitoring. As the Government is the owner of all the PSBs, it can mandate the PSBs to share
this data so that economies of scale can be utilized to make the necessary investments in undertaking analytics using Artificial Intelligence and Machine Learning (AI- ML). The survey proposes establishment of a GSTN like entity, called PSBN (PSB Network), to use technology to screen and monitor borrowers comprehensively and at length. Apart from utilizing data from all PSBs, which would provide a significant information advantage, PSBN would utilize other Government sources and service providers to develop AI-ML ratings models for corporates. The AI-ML models can not only be employed when screening the corporate for a fresh loan but also for constantly monitoring the corporate borrower so that PSBs can truly act as delegated monitors. Box below provides the architecture and solution flow for the proposed PSBN for all types of bank customers including individuals, SMEs and large corporations.

UNIQUE P
UBLISHERS (I
) PVT. L
TD.
Content developed by UNIQUE PUBLISHERS (I) PVT. LTD.
Golden Jubilee of Bank Nationalisation: Taking Stock 39
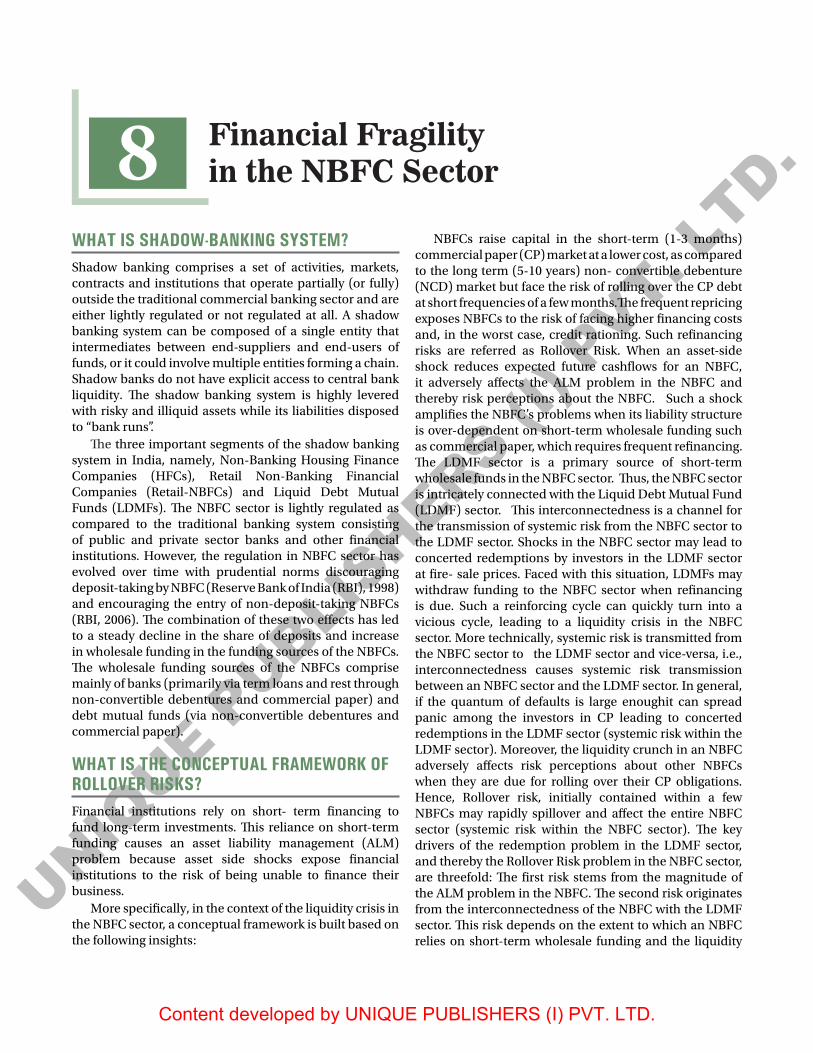
UNIQUE P
UBLISHERS (I
) PVT. L
TD.
Content developed by UNIQUE PUBLISHERS (I) PVT. LTD.
Economic Survey & Budget40
8 Financial Fragility in the NBFC Sector
WHAT IS SHADOW-BANKING SYSTEM?Shadow banking comprises a set of activities, markets, contracts and institutions that operate partially (or fully) outside the traditional commercial banking sector and are either lightly regulated or not regulated at all. A shadow banking system can be composed of a single entity that intermediates between end-suppliers and end-users of funds, or it could involve multiple entities forming a chain. Shadow banks do not have explicit access to central bank liquidity. The shadow banking system is highly levered with risky and illiquid assets while its liabilities disposed to “bank runs”.
The three important segments of the shadow banking system in India, namely, Non-Banking Housing Finance Companies (HFCs), Retail Non-Banking Financial Companies (Retail-NBFCs) and Liquid Debt Mutual Funds (LDMFs). The NBFC sector is lightly regulated as compared to the traditional banking system consisting of public and private sector banks and other financial institutions. However, the regulation in NBFC sector has evolved over time with prudential norms discouraging deposit-taking by NBFC (Reserve Bank of India (RBI), 1998) and encouraging the entry of non-deposit-taking NBFCs (RBI, 2006). The combination of these two effects has led to a steady decline in the share of deposits and increase in wholesale funding in the funding sources of the NBFCs. The wholesale funding sources of the NBFCs comprise mainly of banks (primarily via term loans and rest through non-convertible debentures and commercial paper) and debt mutual funds (via non-convertible debentures and commercial paper).
WHAT IS THE CONCEPTUAL FRAMEWORK OF ROLLOVER RISKS?Financial institutions rely on short- term financing to fund long-term investments. This reliance on short-term funding causes an asset liability management (ALM) problem because asset side shocks expose financial institutions to the risk of being unable to finance their business.
More specifically, in the context of the liquidity crisis in the NBFC sector, a conceptual framework is built based on the following insights:
NBFCs raise capital in the short-term (1-3 months) commercial paper (CP) market at a lower cost, as compared to the long term (5-10 years) non- convertible debenture (NCD) market but face the risk of rolling over the CP debt at short frequencies of a few months.The frequent repricing exposes NBFCs to the risk of facing higher financing costs and, in the worst case, credit rationing. Such refinancing risks are referred as Rollover Risk. When an asset-side shock reduces expected future cashflows for an NBFC, it adversely affects the ALM problem in the NBFC and thereby risk perceptions about the NBFC. Such a shock amplifies the NBFC’s problems when its liability structure is over-dependent on short-term wholesale funding such as commercial paper, which requires frequent refinancing. The LDMF sector is a primary source of short-term wholesale funds in the NBFC sector. Thus, the NBFC sector is intricately connected with the Liquid Debt Mutual Fund (LDMF) sector. This interconnectedness is a channel for the transmission of systemic risk from the NBFC sector to the LDMF sector. Shocks in the NBFC sector may lead to concerted redemptions by investors in the LDMF sector at fire- sale prices. Faced with this situation, LDMFs may withdraw funding to the NBFC sector when refinancing is due. Such a reinforcing cycle can quickly turn into a vicious cycle, leading to a liquidity crisis in the NBFC sector. More technically, systemic risk is transmitted from the NBFC sector to the LDMF sector and vice-versa, i.e., interconnectedness causes systemic risk transmission between an NBFC sector and the LDMF sector. In general, if the quantum of defaults is large enoughit can spread panic among the investors in CP leading to concerted redemptions in the LDMF sector (systemic risk within the LDMF sector). Moreover, the liquidity crunch in an NBFC adversely affects risk perceptions about other NBFCs when they are due for rolling over their CP obligations. Hence, Rollover risk, initially contained within a few NBFCs may rapidly spillover and affect the entire NBFC sector (systemic risk within the NBFC sector). The key drivers of the redemption problem in the LDMF sector, and thereby the Rollover Risk problem in the NBFC sector, are threefold: The first risk stems from the magnitude of the ALM problem in the NBFC. The second risk originates from the interconnectedness of the NBFC with the LDMF sector. This risk depends on the extent to which an NBFC relies on short-term wholesale funding and the liquidity
UNIQUE P
UBLISHERS (I
) PVT. L
TD.
Content developed by UNIQUE PUBLISHERS (I) PVT. LTD.
Financial Fragility in the NBFC Sector 41
buffers in the LDMF sector to absorb redemption pressure. The third risk stems from the inherent resilience of the NBFC, as reflected in the strength of the balance sheet, which allows it to absorb shocks in the first place.
These three risks work in tandem to cause Rollover Risk. At the time of refinancing their CP obligations, the NBFCs having stronger balance sheets are successful in rolling over CPs, albeit at a higher cost. Other NBFCs with weaker balance sheets face higher default probabilities and find it difficult to access the CP market at affordable rates or are unable to raise money at all, i.e., they are unable to avoid default.
At the most fundamental level, the root cause of the liquidity crisis in the NBFC sector can be traced to the over-dependence of NBFCs on the short-term wholesale funding market. This factor works through two channels, a direct channel and an indirect channel. First, an increase in short-term wholesale funding causes a direct effect by increasing the amount of funding that is subject to frequent repricing, and therefore, Rollover Risk. Second, there are indirect
effects in that an increase in short- term wholesale funding influences the two key drivers of Rollover Risk - it worsens the ALM mismatch problem and increases the degree of interconnectedness of the NBFC sector with the LDMF sector. In addition, if the NBFC’s balance sheet strength is suspect, Rollover Risk is further exacerbated. In short, over- dependence on short-term wholesale funding has direct and indirect impact on Rollover Risk.
Figure below illustrates the drivers of rollover risk in the NBFC sector. Redemptions pressures in the LDMF sector are exacerbated when NBFCs face an asset-side shock and experience an ALM problem, which gets compounded due to interconnectedness and lack of balance sheet resilience. Faced with redemption pressures, the LDMF sector is reluctant to roll over loans to the NBFC sector (Rollover Risk), causing a liquidity crunch in the NBFC sector.
To develop policy implications, financial metrics were employed to estimate the drivers of Rollover Risk and weigh them appropriately based on their relative contribution to Rollover Risk. This procedure helps to generate a measure of the health of an NBFC. This measure is called as the Health Score, which is an indicator of potential rollover risk issues faced by an NBFC. The validity of this indicator as a predictor of future performance is also tested using market data.
UNIQUE P
UBLISHERS (I
) PVT. L
TD.
Content developed by UNIQUE PUBLISHERS (I) PVT. LTD.
Economic Survey & Budget42
9 Privatization and Wealth Creation
DISCUSS THE UK MODEL OF PRIVATIZATION?The British privatization programme started in 1980 under the stewardship of then Prime Minister of United Kingdom (UK), Margaret Thatcher. In the initial phase (1979-81), the focus was on privatizing already profitable entities to raise revenues and thus reduce public-sector borrowing like in British Aerospace and Cable & Wireless. In the next phase (1982-86), focus shifted to privatizing core utilities and the government sold off Jaguar, British Telecom, the remainder of Cable & Wireless and British Aerospace, Britoil and British Gas. In the most aggressive phase (1987-91), British Steel, British Petroleum, Rolls Royce, British Airways, water and electricity were sold.
The dominant method was through an initial public offering (IPO) of all or a portion of company shares. British Aerospace was privatized in 1981 with an IPO of 52 per cent of its shares, with remaining shares unloaded in later years. The British Telecom (BT) IPO in 1984 was a mass share offering, and more than two million citizens participated in the largest share offering in world history to that date. The OECD (2003: 24) called the BT privatization “the harbinger of the launch of large- scale privatizations” internationally. In subsequent years, the British government proceeded with large public share offerings in British Gas, British Steel, electric utilities, and other companies. A second privatization method is a direct sale or trade sale, which involves the sale of a company to an existing private company through negotiations or competitive bidding. For example, the British government sold Rover automobiles and Royal Ordnance to British Aerospace. Other privatizations through direct sale included British Shipbuilders, Sealink Ferries, and The Tote. A third privatization method is an employee or management buyout. Britain’s National Freight Corporation was sold to company employees in 1982, and London’s bus services were sold to company managers and employees in 1994.
In most cases, British privatizations went hand-in-hand with reforms of regulatory structures. The government understood that privatization should be combined with open competition when possible. British Telecom, for example, was split from the post office and set up as an arms-length government corporation before shares were sold to the public. Then, over time, the government opened BT up to competition. The British government opened up
intercity bus services to competition beginning in 1980. That move was followed by the privatization of state-owned bus lines, such as National Express. Numerous British seaports were privatized during the 1980s, and the government also reformed labour union laws that had stifled performance in the industry. Florio (2004) in his extensive research on UK privatization has found that the divestiture benefited shareholders and employee (especially managers), small impact on firms and other employees. Sector specific studies (Affuso, Angeriz, & Pollitt, 2009) found that privatization in train companies in UK was associated with increased efficiency. Parker (2004) found that the privatization facilitated creation of competitive market.
ARE THEIR ANY BENEFITS OF PRIVATIZATION? SUBSTANTIATE WITH EVIDENCE?Brown et al. (2015) found that the average privatization effects are estimated to be significantly positive, about 5-12 per cent, but these vary across countries and time periods. There is evidence of significant positive impacts for better quality firms and in better macroeconomic and institutional environments. Chibber and Gupta (2017) showed that disinvestment has a very strong positive effect on labour productivity and overall efficiency of PSUs in India. O’ Toole et al. (2016) in their study from Vietnam find that privatization improves capital allocation and economic efficiency. Chen et al. (2008) showed that there is a significant improvement in performance of Chinese companies after transfer of ownership control, largely due to cost reductions but only when the new owner is a non- state entity.
Subramanian, K. and Megginson, W (2018) found that stringent employment protection laws (EPL) are a deterrent to privatization, and the effect of EPL on privatization is disproportionately greater in industries with higher relocation rates and in less productive industries. Megginson and Netter (2001), Boardman and Vining (1989), La Porta and Lopez de Silanes (1999) found that in the post- privatization period, firms show significantly higher profitability, higher efficiency, generally higher investment levels, higher output, higher dividends, and lower leverage post privatization. According to Gupta (2005), both the levels and growth rates of profitability,

UNIQUE P
UBLISHERS (I
) PVT. L
TD.
Content developed by UNIQUE PUBLISHERS (I) PVT. LTD.
Privatization and Wealth Creation 43
labour productivity, and investment spending improve significantly following partial privatization. Majumdar (1996) documented that efficiency levels are significantly higher than state owned enterprises which show efficiency only during efficiency drives only to decline afterwards based on a study of Indian firms over the period 1973-89.
Borisova and Megginson (2010) indicated that on an average across firms, a one percentage point decrease in government ownership is associated with an increase in the credit spread, used as a proxy for the cost of debt, by three-quarters of a basis point. According to Li et al. (2016), profitability of newly privatized companies increases significantly (by 2-3 percentage points) after adjusting for negative listing effect. Capital spending and sales growth also improve significantly based on triple difference-in-difference tests. Wolf and Pollitt (2008) showed that privatization is associated with significant and comprehensive performance improvements over 7-year period (−3 to +3 years). Oum et al. (2006) provides strong evidence that airports with majority government ownership and those with multi-level government ownership are significantly less efficient than those with private majority ownership. Increased customer satisfaction comes in form of reduction in tariffs, increased data usage etc. in the telecommunication sector; increased penetration of banking services in the rural areas; and reduced air-fares comparable to high-end consumers in the railways.
TRACE THE EVOLUTION OF DISINVESTMENT POLICY OF INDIA?The liberalization reforms undertaken in 1991 ushered in an increased demand for privatization/ disinvestment of PSUs. In the initial phase, this was done through the sale of minority stake in bundles through auction. This was followed by separate sale for each company in the following years, a method popularly adopted till 1999-2000. India adopted strategic sale as a policy measure in 1999-2000 with sale of substantial portion of Government shareholding in identified Central PSEs (CPSEs) up to 50 per cent or more, along with transfer of management control. This was started with the sale of 74 per cent of the Government’s equity in Modern Food Industries Limited (MFIL). Thereafter, 12 PSUs (including four subsidiaries of PSUs), and 17 hotels of Indian Tourism Development Corporation (ITDC) were sold to private investors along with transfer of management control by the Government.
In addition, 33.58 per cent shareholding of Indo Bright Petroleum (IBP) strategically sold to Indian Oil Corporation (IOC). IBP, however, remained a PSU after this strategic sale, since IOC held 53.58 per cent of its paid-
up equity. Another major shift in disinvestment policy was made in 2004-05 when it was decided that the government may “dilute its equity and raise resources to meet the social needs of the people”, a distinct departure from strategic sales.
Strategic Sales have got a renewed push after 2014. During 2016-17 to 2018-19, on average, strategic sales accounted for around 28.2 per cent of total proceeds from disinvestment. Department of Investment and Public Asset Management (DIPAM) has laid down comprehensive guidelines on “Capital Restructuring of CPSEs” in May, 2016 by addressing various aspects, such as, payment of dividend, buyback of shares, issues of bonus shares and splitting of shares. The Government has been following an active policy on disinvestment in CPSEs through the various modes:• Disinvestment through minority stake sale in listed
CPSEs to achieve minimum public shareholding norms of 25 per cent. While pursuing disinvestment of CPSEs, the Government will retain majority shareholding, i.e., at least 51 per cent and management control of the Public Sector Undertakings;
• Listing of CPSEs to facilitate people’s ownership and improve the efficiency of companies through accountability to its stake holders - As many as 57 PSUs are now listed with total market capitalisation of over ` 13 lakh crore.
• Strategic Disinvestment; • Buy-back of shares by large PSUs having huge surplus; • Merger and acquisitions among PSUs in the same
sector; • Launch of exchange traded funds (ETFs) - an equity
instrument that tracks a particular index. The CPSE ETF is made up of equity investments in India’s major public sector companies like ONGC, REC, Coal India, Container Corp, Oil India, Power Finance, GAIL, BEL, EIL, Indian Oil and NTPC; and
• Monetization of select assets of CPSEs to improve their balance sheet/reduce their debts and to meet part of their capital expenditure requirements. NITI Aayog has been mandated to identify PSUs for
strategic disinvestment. For this purpose, NITI Aayog has classified PSUs into “high priority” and “low priority”, based on (a) National Security (b) Sovereign functions at arm’s length, and (c) Market Imperfections and Public Purpose. The PSUs falling under “low priority” are covered for strategic disinvestment. To facilitate quick decision making, powers to decide the following have been delegated to an Alternative Mechanism in all the cases of Strategic Disinvestment of CPSEs where Cabinet Committee on Economic Affairs (CCEA) has given ‘in principle’ approval for strategic disinvestment:

UNIQUE P
UBLISHERS (I
) PVT. L
TD.
Content developed by UNIQUE PUBLISHERS (I) PVT. LTD.
Economic Survey & Budget44
(i) The quantum of shares to be transacted, mode of sale and final pricing of the transaction or lay down the principles/ guidelines for such pricing; and the selection of strategic partner/ buyer; terms and conditions of sale; and
(ii) To decide on the proposals of Core Group of Disinvestment (CGD) with regard the timing, price, terms & conditions of sale, and any other related issue to the transaction.
On November 20, 2019, the government announced that full management control will be ceded to buyers of Bharat Petroleum Corporation Ltd. (BPCL), Shipping Corporation of India (SCI) and Container Corporation of India Ltd (CONCOR). On January 8, 2020, strategic disinvestment was approved for Minerals & Metals Trading Corporation Limited (MMTC), National Mineral Development Corporation (NMDC), MECON and Bharat Heavy Electricals Ltd. (BHEL).
WHAT IS TEMASEK HOLDINGS MODEL OF SINGAPORE?Temasek Holdings was incorporated by Government of Singapore on 25 June 1974, as a private commercial entity, to hold and manage its investments in its government-
linked companies (GLCs). Temasek Holdings is wholly owned by the Ministry for Finance and operates under the provisions of the Singapore Companies Act. Temasek’s board comprises 13 members—mostly non-executive and independent business leaders from the private sector. The company has since expanded its operations to cover key areas of business in sectors such as telecommunications, media, financial services, energy, infrastructure, engineering, pharmaceuticals and the bio-sciences.
Many of the original investments that Temasek managed included national treasures such as shipping firms (NOL, Keppel, Sembawang), a bank (DBS Bank), and systems engineering conglomerates (Singapore Technologies, Singapore Telecom). Temasek has retained strategically important investments, including its original stakes in all of these GLCs. Since March 2002, Temasek began diversifying its portfolio outside of Singapore such that a third of its investments are in developed markets, a third in developing countries and a third in Singapore. Some of the company’s major investments in foreign companies include Standard Chartered, ICICI Bank (India), Bank Danamon (Indonesia), Telekom Malaysia and ShinCorp (Thailand). Temasek’s investments in local companies include Singapore Airlines, Singtel, DBS Bank, SMRT, ST Engineering, MediaCorp and Singapore Power.

UNIQUE P
UBLISHERS (I
) PVT. L
TD.
Content developed by UNIQUE PUBLISHERS (I) PVT. LTD.
Is India’s GDP Growth Overstated? No! 45
HAS THE CHANGE IN THE BASE YEAR FOR GDP SUPPORTED GLOBAL STANDARDIZATION AND COMPARABILITY?The Base Year of the GDP Series was revised from 2004-05 to 2011-12 and released on 30 January, 2015 after adaptation of the sources and methods in line with the System of National Accounts (SNA) 2008 of the United Nations. The methodology of compilation of macro aggregates was finalized by the Advisory Committee on National Accounts Statistics (ACNAS) comprising experts from academia, National Statistical Commission, Indian Statistical Institute (ISI), Reserve Bank of India (RBI), Ministries of Finance, Corporate Affairs, Agriculture, NITI Aayog and selected State Governments. The decision taken by the Committee was unanimous and collective after taking into consideration the data availability and various methodological aspects.
For the purpose of global standardization and comparability, countries follow the SNA evolved in the UN after elaborate consultation. The SNA 2008 is the latest version of the international statistical standard for the national accounts, adopted by the United Nations Statistical Commission (UNSC) in 2009 and is an update of the earlier 1993 SNA. The Inter-Secretariat Working Group on National Accounts (ISWGNA) in India was mandated to develop the 2008 SNA through intense discussions and consultation with member countries. India also participated in the deliberations of the Advisory Expert Group. In its adoption of the 2008 SNA the UNSC encouraged Member States, regional and sub-regional
organizations to implement its recommendations and use it for the national and international reporting of national accounts statistics based on the available data sources.
IS INDIA’S GDP OVERSTATED? PRESENT YOUR ARGUMENT?GDP growth is a critical variable for decision-making by investors as well as policymakers. Therefore, the recent debate about whether India’s GDP is correctly estimated following the revision in estimation methodology in 2011 is extremely significant.
As countries differ in several observed and unobserved ways, cross-country comparisons have to be undertaken with care to separate out the effect of other confounding factors and isolate the effect of the methodology revision alone on GDP growth estimates.
The models that incorrectly over-estimate GDP growth by 2.7 per cent for India post-2011 also mis-estimate GDP growth over the same time period for 51 other countries out of 95 countries in the sample. Several advanced economies such as UK, Germany and Singapore turn out to have their GDPs misestimated when the econometric model is incompletely specified.
Correctly specified models that account for all unobserved differences among countries as well as differential trends in GDP growth across countries fail to find any mis-estimation of growth in India or other countries. Concerns of a misestimated Indian GDP are unsubstantiated by the data and are thus unfounded.
10Is India’s GDP Growth Overstated? No!

UNIQUE P
UBLISHERS (I
) PVT. L
TD.
Content developed by UNIQUE PUBLISHERS (I) PVT. LTD.
Economic Survey & Budget46
11 Thalinomics: The Economics of a Plate of Food in India
CAN WE RELATE ECONOMICS TO THE COMMON PERSON’S LIFE EVERY DAY? ILLUSTRATE WITH THALINOMICS?Though economics affects each one of us in our everyday lives, this fact often remains unnoticed by the common man or woman. Economists possibly owe themselves this predicament; after all, broody, technical conversations on “heteroscedasticity” can frighten away even the most diligent and intelligent. Thalinomics: The economics of a plate of food in India” – an attempt to quantify what a common person pays for a Thali across India. As food is a necessity, a rapid rise in the price of a Thali has the most direct and conspicuous effect on the common man. Indeed, food and beverages constitute around 45.9 per cent in the Consumer Price Index- Combined. The most effective way, therefore, to communicate the trends in prices to the common man is through the cost incurred in putting together one complete, homemade meal – the Indian Thali.
Given its enormous diversity, India has very diverse cuisines with variety of food items, which is a delicious mix of variety of vegetables, cereals, fruits, and spices that grow across the country. Indian traditional diet has always been a healthy mix of vegetables and cereals along with fish, meat and eggs. Thali prices are constructed for 25 States/UTs taking into account the prices for cereals (rice or wheat), sabzi (vegetables plus other ingredients), dal (pulses with other ingredients) as well as the cost of fuel that goes into making a meal in a household. Two types of Thalis are analysed: a vegetarian Thali and a non-vegetarian one. A vegetarian Thali comprises of a serving of cereals, sabzi and dal and the non-vegetarian Thali comprises of cereals, sabzi and a non- vegetarian component. The evolution of prices of these two Thalis during the period from 2006-07 to October, 2019-20 is analysed.
Both across India and the four regions – North, South, East and West – we find that the absolute prices of a vegetarian Thali have decreased since 2015-16 though it increased during 2019. This is owing to significant moderation in the prices of vegetables and dal from 2015-16 when compared to the previous trend of increasing prices. In fact, the increase in prices of both components has contributed to the increase in the Thali price during
2019- 20 (April - October) as well. If the prices of a vegetarian Thali had followed the trend obtained till 2015-16, an average household comprising of five individuals would have had to spend `10887 more on average per year for eating minimum two healthy Thalis a day. In other words, after 2015-16, the average household gained ̀ 10887 per year on average from the moderation in Thali prices. Similarly, an average household that eats minimum two healthy non-vegetarian Thalis per day gained around `11787 on average during the same period. As another benchmark, we examine an industrial worker’s ability to pay for two Thalis a day for his/her household of five individuals.
Using this measure, we find that affordability of vegetarian Thalis has improved over the time period from 2006-07 to 2019-20 by 29 per cent and that for non-vegetarian Thalis by 18 per cent. Note that though non-vegetarian. Thalis are costlier than the vegetarian Thalis, the gains and therefore the affordability stem from the trends prevailing in the respective Thali till 2015-16.
HOW IS THE PRICE OF THALI CONSTRUCTED?Thalis were constructed using average monthly price data (used for preparation of Consumer Price Index-Industrial Workers (CPI-IW)) for the period April 2006 to October 2019 from Labour Bureau, Government of India, for 78 centres in 25 States/UTs. Average monthly prices of various commodities are averages of the open market prices of specified variety of an item prevailing in the selected outlets in the selected markets in a given centre. For rationed items, the prices for the centres are weighted average prices, the weights being the proportion of the quantity available through Public Distribution System and quantity procured from the open market in different centres in relation to base year (2001) requirements of an average working class family.
Two types of Thali were considered for the analysis: a vegetarian Thali and a non-vegetarian Thali. The quantities of constituents required for preparation of a Thali were based on the dietary guidelines prescribed for Indians. We have taken the requirements for an adult male engaged in heavy work. Therefore, the estimated prices are likely to overestimate the cost of a meal to the

UNIQUE P
UBLISHERS (I
) PVT. L
TD.
Content developed by UNIQUE PUBLISHERS (I) PVT. LTD.
Thalinomics: The Economics of a Plate of Food in India 47
average household than underestimate it. We have taken the quantities for cereals, vegetables, pulses and non-vegetarian items for each Thali assuming that atleast two full meals would be consumed in a day such that the daily dietary requirements for these elements would be met. Vegetarian Thali consists of a serving of cereals (300 grams), vegetables (150 grams) and pulses (60 grams). Two cereals have been taken: rice and wheat. Potato, onion, tomato have been taken as the staple vegetables and brinjal, cabbage, cauliflower and lady’s finger have been taken as the additional vegetables, broadly covering all the seasons, pan-India availability and general consumption. For dals, arhar, gram dal, masur dal, moong dal and urad dal have been taken. Other commodities include spices and condiments used in preparation of the vegetable and dal recipes. Mustard oil, groundnut oil, and coconut oil have been taken, depending on the state-wise differences in the type of oil used for cooking. For non-vegetarian dish, prices of eggs, fish (fresh) and goat meat have been taken, which are generally consumed across regions as well as religions. In the case of non-vegetarian Thali, dal is replaced by non-vegetarian component (60 grams); rest of the components remain unchanged. For fuel, cooking gas prices as well as firewood prices have been taken for which
the data is available consistently. As such, the quantities of the items should not affect the analysis as the weights of the components could be scaled in any direction, and still the direction of price changes would remain the same.
Weighted price for each serving of the cereals (300 grams) is based on the quantity weights of rice and wheat in each State based on the data from NSS 68th Round Household Consumer Expenditure Survey. Average monthly consumption, each of rice and wheat, per capita, have been calculated from the household survey data for each State. Similarly, weighted prices of portions of vegetables as well as dals have been calculated based on the same data. Similar exercise was also done for non-vegetarian food. Fuel consumption per meal is calculated by dividing the total quantity, respectively, of LPG and firewood consumed in a month for a household by the average number of meals prepared at home obtained from the NSS 68th Round data. This is then used to calculate the weighted average price of fuel for one meal.
The weights from the Consumer Expenditure Survey are used along with the prices data to arrive at the weighted prices of the main components. ‘Other ingredients’ weightage is based on standardised recipes used to prepare the Thalis.
DISCUSS SOME MAJOR INITIATIVES FOR ENHANCING PRODUCTIVITY OF AGRICULTURE AND EFFICIENCY OF AGRICULTURAL MARKETS?
S. No. Name of Scheme Description
1. Pradhan Mantri Annadata Aay Sanrakshan Abhiyan (PM-AASHA)
PM-AASHA, launched in 2018, covers three sub-scheme i.e. Price Support Scheme (PSS), Price Deficiency Payment Scheme (PDPS) and pilot of Private Procurement & Stockist Scheme (PDPS). Under PSS, physical procurement of pulses, oilseeds and Copra is done by Central Nodal Agencies with proactive role of State governments. PDPS covers all oilseeds for which MSP is notified. Under this, direct payment of the difference between the MSP and the selling/modal price is made to pre-registered farmers selling his produce in the notified market yard through a trasparent auction process.
2. Pradhan Mantri Krishi Sinchayee Yojana (PMKSY) - Per Drop More Crop
PMKSY was implemented in the year 2015-16. It focuses on enhancing water use efficiency through expansion of cultivable area under assured irrigation, improve on-farm water use efficiency to reduce wastage of water, enhance the adoption of precision-irrigation and other water saving technologies, enhance recharge of aquifers and introduce sustainable water conservation practices.
3. Pradhan Mantri Fasal Bima Yojana (PMFBY) PMFBY was introduced in 2015-16 to provide better insurance coverage for agricultural crops and thereby mitigate risk. A total of 69.9 lakh farmers have benefited from PMFBY. The scheme aims to provide comprehensive insurance coverage to farmers.
4. Soil Health Card Soil Health Card scheme was introduced in the year 2014-15 to assist State Governments to issue soil health cards to all farmers in the country. Soil health card provides farmers information on the nutrient status of their soil along with recommendation on appropriate dosage of nutrients to be used for their soil conditions.
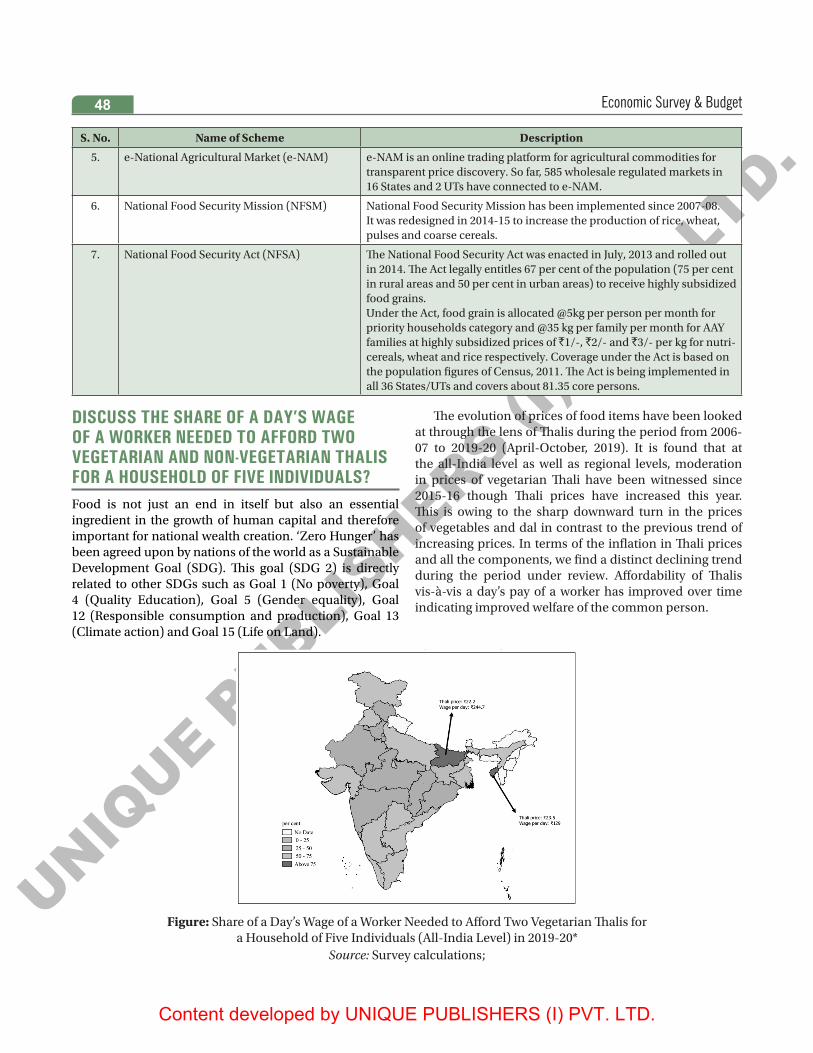
UNIQUE P
UBLISHERS (I
) PVT. L
TD.
Content developed by UNIQUE PUBLISHERS (I) PVT. LTD.
Economic Survey & Budget48
S. No. Name of Scheme Description
5. e-National Agricultural Market (e-NAM) e-NAM is an online trading platform for agricultural commodities for transparent price discovery. So far, 585 wholesale regulated markets in 16 States and 2 UTs have connected to e-NAM.
6. National Food Security Mission (NFSM) National Food Security Mission has been implemented since 2007-08. It was redesigned in 2014-15 to increase the production of rice, wheat, pulses and coarse cereals.
7. National Food Security Act (NFSA) The National Food Security Act was enacted in July, 2013 and rolled out in 2014. The Act legally entitles 67 per cent of the population (75 per cent in rural areas and 50 per cent in urban areas) to receive highly subsidized food grains.Under the Act, food grain is allocated @5kg per person per month for priority households category and @35 kg per family per month for AAY families at highly subsidized prices of `1/-, `2/- and `3/- per kg for nutri-cereals, wheat and rice respectively. Coverage under the Act is based on the population figures of Census, 2011. The Act is being implemented in all 36 States/UTs and covers about 81.35 core persons.
DISCUSS THE SHARE OF A DAY’S WAGE OF A WORKER NEEDED TO AFFORD TWO VEGETARIAN AND NON-VEGETARIAN THALIS FOR A HOUSEHOLD OF FIVE INDIVIDUALS?Food is not just an end in itself but also an essential ingredient in the growth of human capital and therefore important for national wealth creation. ‘Zero Hunger’ has been agreed upon by nations of the world as a Sustainable Development Goal (SDG). This goal (SDG 2) is directly related to other SDGs such as Goal 1 (No poverty), Goal 4 (Quality Education), Goal 5 (Gender equality), Goal 12 (Responsible consumption and production), Goal 13 (Climate action) and Goal 15 (Life on Land).
The evolution of prices of food items have been looked at through the lens of Thalis during the period from 2006-07 to 2019-20 (April-October, 2019). It is found that at the all-India level as well as regional levels, moderation in prices of vegetarian Thali have been witnessed since 2015-16 though Thali prices have increased this year. This is owing to the sharp downward turn in the prices of vegetables and dal in contrast to the previous trend of increasing prices. In terms of the inflation in Thali prices and all the components, we find a distinct declining trend during the period under review. Affordability of Thalis vis-à-vis a day’s pay of a worker has improved over time indicating improved welfare of the common person.
Figure: Share of a Day’s Wage of a Worker Needed to Afford Two Vegetarian Thalis for a Household of Five Individuals (All-India Level) in 2019-20*
Source: Survey calculations;
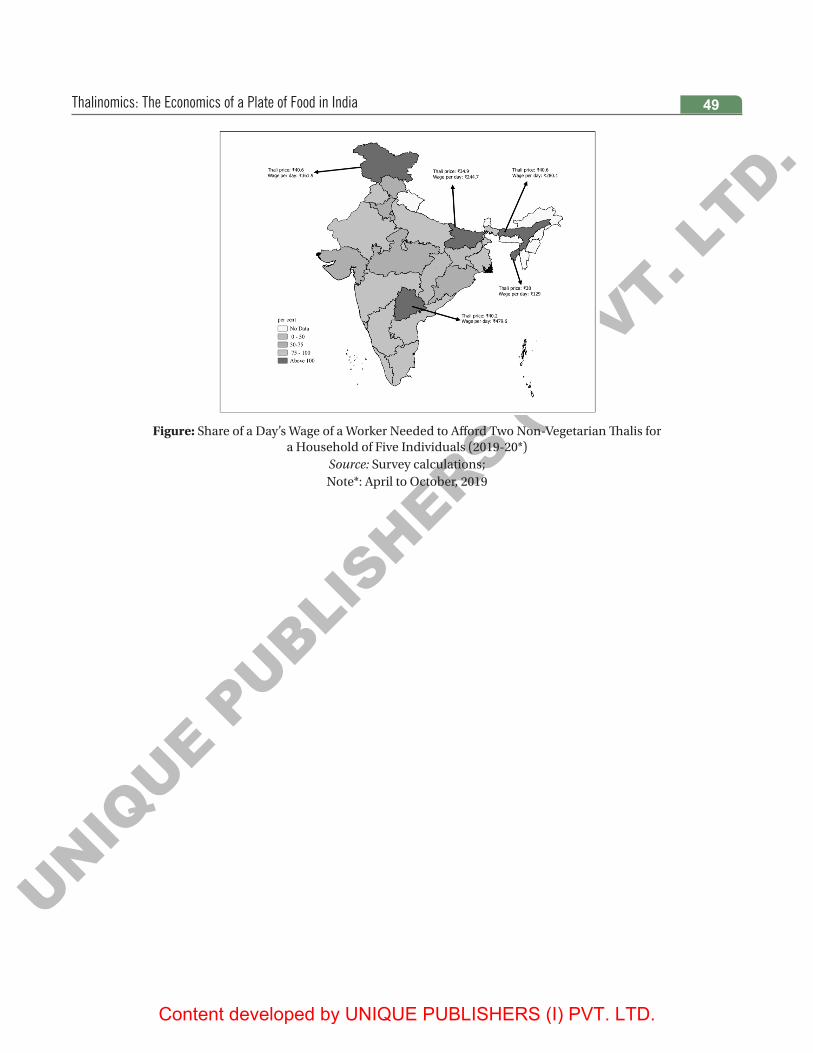
UNIQUE P
UBLISHERS (I
) PVT. L
TD.
Content developed by UNIQUE PUBLISHERS (I) PVT. LTD.
Thalinomics: The Economics of a Plate of Food in India 49
Figure: Share of a Day’s Wage of a Worker Needed to Afford Two Non-Vegetarian Thalis for a Household of Five Individuals (2019-20*)
Source: Survey calculations;Note*: April to October, 2019

UNIQUE P
UBLISHERS (I
) PVT. L
TD.
Content developed by UNIQUE PUBLISHERS (I) PVT. LTD.

UNIQUE P
UBLISHERS (I
) PVT. L
TD.
Content developed by UNIQUE PUBLISHERS (I) PVT. LTD.
VOLUME-II

UNIQUE P
UBLISHERS (I
) PVT. L
TD.
Content developed by UNIQUE PUBLISHERS (I) PVT. LTD.

UNIQUE P
UBLISHERS (I
) PVT. L
TD.
Content developed by UNIQUE PUBLISHERS (I) PVT. LTD.
State of the Economy 53
GIVE A GLIMPSE OF THE OUTPUT OF THE GLOBAL ECONOMY?The World Economic Outlook (WEO) Update of January 2020 published by IMF has estimated the global output to grow at 2.9 per cent in 2019, declining from 3.6 per cent in 2018 and 3.8 per cent in 2017. The global output growth in 2019 is estimated to be the slowest since the global financial crisis of 2009, arising from a geographically broad- based decline in manufacturing activity and trade. Stabilising, yet uncertain, trade tensions between China and the USA have contributed to the decline of world output and trade. The growth of advanced economies has similarly declined from 2.5 per cent in 2017 to 2.2 per cent in 2018 and is estimated to further decline to 1.7 per cent in 2019. The larger group of OECD countries has also seen a drop in their growth from 2.6 per cent in 2017 to 2.3 per cent in 2018 and is estimated to grow at 1.7 per cent in 2019. WEO has projected the declining growth of global output to rebound in 2020 with a modest uptick to 3.3 per cent. As in other major economies, India’s Gross Domestic Product (GDP) growth also correlates with the growth of global output, an observation earlier made in the Economic Survey of 2015-16. Not surprisingly, the deceleration in India’s GDP growth since 2017 has tracked the decline in world output. However, for three years prior to 2017, when global output growth was not declining, India surged ahead of the rest of the world, recording in 2014-18 an average growth significantly higher than that of any comparable peer, both among advanced and emerging market economies. The WEO Update of January 2020 has projected the growth of Indian economy to increase to 5.8 per cent in 2020 expecting India to contribute significantly to an eventual pickup in the growth of world output.
India’s GDP in nominal prices was `190.1 lakh crore (US$ 2.7 trillion) in 2018-19. Along with the weakening of global economic activity, inflation the world over also remained muted in 2019. Inflation softened in advanced and emerging economies reflecting a slack in consumer demand. From the supply side, lower energy prices in 2019 also contributed to softening of inflation. In India, inflation slightly rose to 4.1 per cent in April- December 2019, after a sharp decline from 5.9 per cent in 2014 to 3.4 per cent in 2018. The global slack in consumer demand affected industrial activity, which slumped in most of the major economies in 2019. In particular, global production in automobile industry fell sharply due to a decline in demand, which was caused by changes in technology and emission standards in many countries. India also experienced a similar downturn in the auto industry (IMF’s World Economic Outlook October, 2019 and January 2020). As global industrial activity slowed down, there was a drop in growth of manufacturing exports from major economies. Increasing trade barriers as well as trade uncertainty stemming from growing trade tensions also weakened business confidence and further limited trade. India’s manufacturing exports also fell.
DISCUSS THE OVERALL SIZE OF THE INDIAN ECONOMY? IS INDIA POISED TO REBOUND FOR A 5 TRILLION DOLLAR ECONOMY?The WEO of October 2019 has estimated India’s economy to become the fifth largest in the world, as measured using GDP at current US$ prices, moving past United Kingdom and France. The size of the economy is estimated at US$ 2.9 trillion in 2019.
1State of the Economy
TABLE: TOP 10 ECONOMIES IN THE WORLD IN TERMS OF GDP AT CURRENT US$ TRILLIONSl. No. Country 2017 2018 2019 (E) Change in position
in 20191. United States 19.5 20.6 21.4 -2. China 12.1 13.4 14.1 -3. Japan 4.9 5.0 5.2 -4. Germany 3.7 4.0 3.9 -5. India 2.7 2.7 2.9 6. United Kingdom 2.6 2.8 2.7 7. France 2.6 2.8 2.7 8. Italy 2.0 2.1 2.0 -9. Brazil 2.1 1.9 1.8 -
10. Korea 1.6 1.7 1.6 -Data Source: World Economic Outlook, October 2019 databaseNotes: E : IMF’s estimate; indicates improvement in rank; indicates drop in rank and - indicates unchanged rank
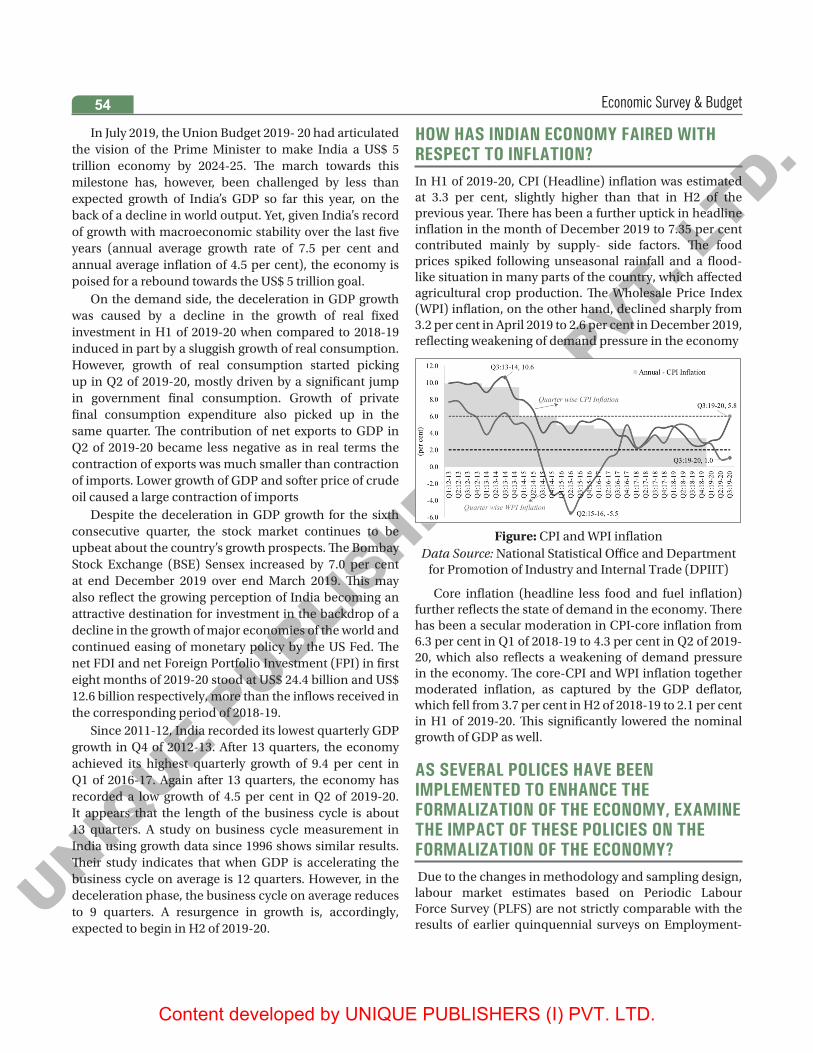
UNIQUE P
UBLISHERS (I
) PVT. L
TD.
Content developed by UNIQUE PUBLISHERS (I) PVT. LTD.
Economic Survey & Budget54
In July 2019, the Union Budget 2019- 20 had articulated the vision of the Prime Minister to make India a US$ 5 trillion economy by 2024-25. The march towards this milestone has, however, been challenged by less than expected growth of India’s GDP so far this year, on the back of a decline in world output. Yet, given India’s record of growth with macroeconomic stability over the last five years (annual average growth rate of 7.5 per cent and annual average inflation of 4.5 per cent), the economy is poised for a rebound towards the US$ 5 trillion goal.
On the demand side, the deceleration in GDP growth was caused by a decline in the growth of real fixed investment in H1 of 2019-20 when compared to 2018-19 induced in part by a sluggish growth of real consumption. However, growth of real consumption started picking up in Q2 of 2019-20, mostly driven by a significant jump in government final consumption. Growth of private final consumption expenditure also picked up in the same quarter. The contribution of net exports to GDP in Q2 of 2019-20 became less negative as in real terms the contraction of exports was much smaller than contraction of imports. Lower growth of GDP and softer price of crude oil caused a large contraction of imports
Despite the deceleration in GDP growth for the sixth consecutive quarter, the stock market continues to be upbeat about the country’s growth prospects. The Bombay Stock Exchange (BSE) Sensex increased by 7.0 per cent at end December 2019 over end March 2019. This may also reflect the growing perception of India becoming an attractive destination for investment in the backdrop of a decline in the growth of major economies of the world and continued easing of monetary policy by the US Fed. The net FDI and net Foreign Portfolio Investment (FPI) in first eight months of 2019-20 stood at US$ 24.4 billion and US$ 12.6 billion respectively, more than the inflows received in the corresponding period of 2018-19.
Since 2011-12, India recorded its lowest quarterly GDP growth in Q4 of 2012-13. After 13 quarters, the economy achieved its highest quarterly growth of 9.4 per cent in Q1 of 2016-17. Again after 13 quarters, the economy has recorded a low growth of 4.5 per cent in Q2 of 2019-20. It appears that the length of the business cycle is about 13 quarters. A study on business cycle measurement in India using growth data since 1996 shows similar results. Their study indicates that when GDP is accelerating the business cycle on average is 12 quarters. However, in the deceleration phase, the business cycle on average reduces to 9 quarters. A resurgence in growth is, accordingly, expected to begin in H2 of 2019-20.
HOW HAS INDIAN ECONOMY FAIRED WITH RESPECT TO INFLATION?In H1 of 2019-20, CPI (Headline) inflation was estimated at 3.3 per cent, slightly higher than that in H2 of the previous year. There has been a further uptick in headline inflation in the month of December 2019 to 7.35 per cent contributed mainly by supply- side factors. The food prices spiked following unseasonal rainfall and a flood-like situation in many parts of the country, which affected agricultural crop production. The Wholesale Price Index (WPI) inflation, on the other hand, declined sharply from 3.2 per cent in April 2019 to 2.6 per cent in December 2019, reflecting weakening of demand pressure in the economy
Figure: CPI and WPI inflationData Source: National Statistical Office and Department
for Promotion of Industry and Internal Trade (DPIIT)
Core inflation (headline less food and fuel inflation) further reflects the state of demand in the economy. There has been a secular moderation in CPI-core inflation from 6.3 per cent in Q1 of 2018-19 to 4.3 per cent in Q2 of 2019-20, which also reflects a weakening of demand pressure in the economy. The core-CPI and WPI inflation together moderated inflation, as captured by the GDP deflator, which fell from 3.7 per cent in H2 of 2018-19 to 2.1 per cent in H1 of 2019-20. This significantly lowered the nominal growth of GDP as well.
AS SEVERAL POLICES HAVE BEEN IMPLEMENTED TO ENHANCE THE FORMALIZATION OF THE ECONOMY, EXAMINE THE IMPACT OF THESE POLICIES ON THE FORMALIZATION OF THE ECONOMY? Due to the changes in methodology and sampling design, labour market estimates based on Periodic Labour Force Survey (PLFS) are not strictly comparable with the results of earlier quinquennial surveys on Employment-

UNIQUE P
UBLISHERS (I
) PVT. L
TD.
Content developed by UNIQUE PUBLISHERS (I) PVT. LTD.
State of the Economy 55
Unemployment conducted by National Sample Survey Organization (NSSO). Yet a limited comparability has been attempted to highlight the shift towards increased employability in formal sector jobs. As per the latest available data on employment, there has been an increase in the share of formal employment, as captured by ‘Regular wage/salaried’, from 17.9 per cent in 2011-12 to 22.8 per cent in 2017-18.
Figure: Distribution of workers by all ages in usual status (PS + SS) by statuses in employment
Data Source: Periodic Labour Force Survey 2017-18, Ministry of Statistics & Programme Implementation
Note: PS- Principal Status, SS- Subsidiary Status
This 5 percentage points increase in the share of ‘Regular wage/salaried’ group has been on account of 5 percentage points decrease in the share of casual workers, which reflects formalization in the economy. As a result, in absolute terms, there was a significant jump of around 2.62 crore new jobs over this period in the usual status category with 1.21 crore in rural areas and 1.39 crore in urban areas. Remarkably, the proportion of women workers in ‘Regular wage/salaried’ employees category has increased by 8 percentage points (from 13 percent in 2011- 12 to 21 per cent in 2017-18) with addition of 0.7 crore new jobs for female workers in this category. The drop in casual labour has mainly originated from the rural sector where rural labourers have shifted from agricultural to industrial and services activity. In urban region, there has been a shift of employment from self- employed to salaried jobs.
The provisional Annual Survey of Industries for fiscal year ending March 2018, also shows an increase in jobs in the organized manufacturing sector. Between 2014-15 and 2017-18, total number of workers increased by 14.7 lakh and total persons engaged increased by 17.3 lakh, in the organised manufacturing sector in India.
HOW HAS INDIA’S EXTERNAL SECTOR PERFORMED IN 2019?In October and November 2019, major commodity groups have shown a positive growth in exports over the corresponding month of the previous year while imports of major commodity groups have contracted. However, the slower contraction in merchandise exports as compared to imports has so far resulted in improvement in trade balance in 2019-20. The contraction in import bill was partly contributed by a decline in oil prices in the current year as compared to 2018-19, while slower contraction of exports may have resulted from a pick-up in global activity. The depreciation of real exchange rate since July 2019 may have been supportive of resurgence in India’s exports, though the evidence for exchange rate depreciation contributing to exports seems tenuous. Despite muted growth of services exports, the trade balance on the services account continued to be positive in 2019-20. The trade surplus on services account has been estimated at US$ 40.5 billion in H1 of 2019-20, as compared to US$ 38.9 billion in 2018-19.
Figure: Crude oil prices (Indian Basket) – US$ per barrelData Source: Petroleum Planning and Analysis Cell
Figure: Exchange Rate of Indian RupeeData Source: RBI
Note: REER refers to Real Effective
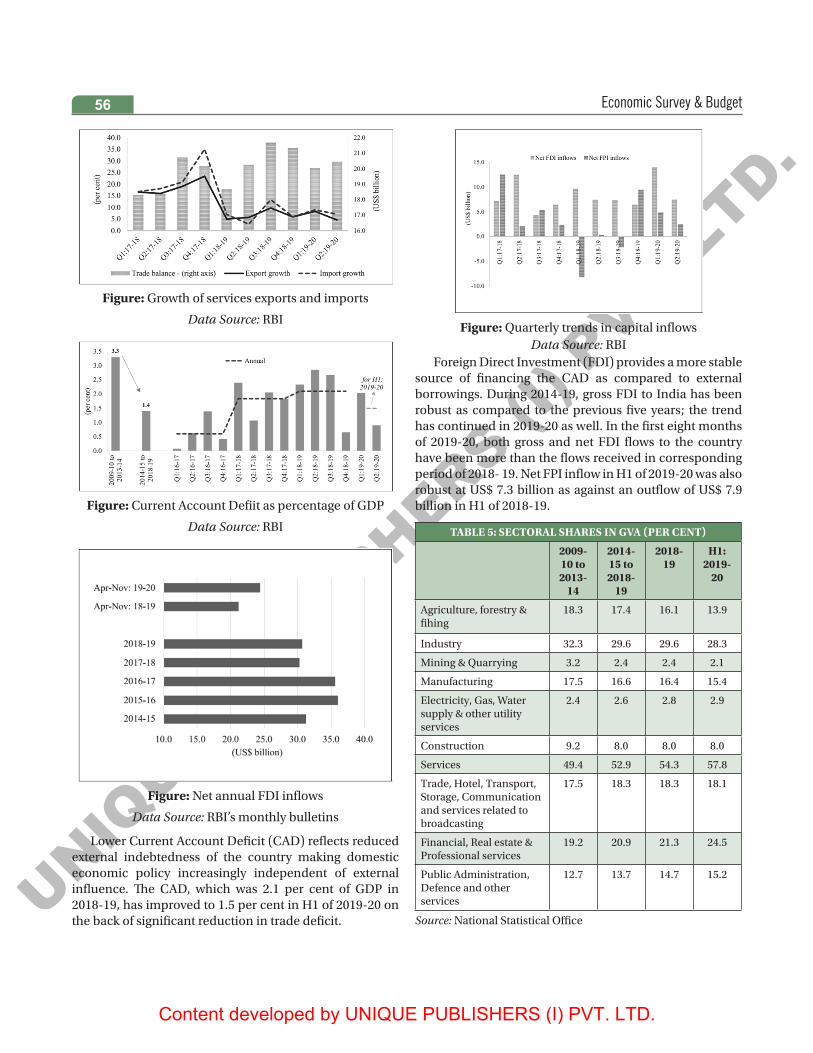
UNIQUE P
UBLISHERS (I
) PVT. L
TD.
Content developed by UNIQUE PUBLISHERS (I) PVT. LTD.
Economic Survey & Budget56
Figure: Growth of services exports and imports
Data Source: RBI
Figure: Current Account Defiit as percentage of GDP
Data Source: RBI
Figure: Net annual FDI inflows
Data Source: RBI’s monthly bulletins
Lower Current Account Deficit (CAD) reflects reduced external indebtedness of the country making domestic economic policy increasingly independent of external influence. The CAD, which was 2.1 per cent of GDP in 2018-19, has improved to 1.5 per cent in H1 of 2019-20 on the back of significant reduction in trade deficit.
Figure: Quarterly trends in capital inflowsData Source: RBI
Foreign Direct Investment (FDI) provides a more stable source of financing the CAD as compared to external borrowings. During 2014-19, gross FDI to India has been robust as compared to the previous five years; the trend has continued in 2019-20 as well. In the first eight months of 2019-20, both gross and net FDI flows to the country have been more than the flows received in corresponding period of 2018- 19. Net FPI inflow in H1 of 2019-20 was also robust at US$ 7.3 billion as against an outflow of US$ 7.9 billion in H1 of 2018-19.
TABLE 5: SECTORAL SHARES IN GVA (PER CENT)
2009-10 to 2013-
14
2014-15 to 2018-
19
2018-19
H1: 2019-
20
Agriculture, forestry & fihing
18.3 17.4 16.1 13.9
Industry 32.3 29.6 29.6 28.3
Mining & Quarrying 3.2 2.4 2.4 2.1
Manufacturing 17.5 16.6 16.4 15.4
Electricity, Gas, Water supply & other utility services
2.4 2.6 2.8 2.9
Construction 9.2 8.0 8.0 8.0
Services 49.4 52.9 54.3 57.8
Trade, Hotel, Transport, Storage, Communication and services related to broadcasting
17.5 18.3 18.3 18.1
Financial, Real estate & Professional services
19.2 20.9 21.3 24.5
Public Administration, Defence and other services
12.7 13.7 14.7 15.2
Source: National Statistical Office
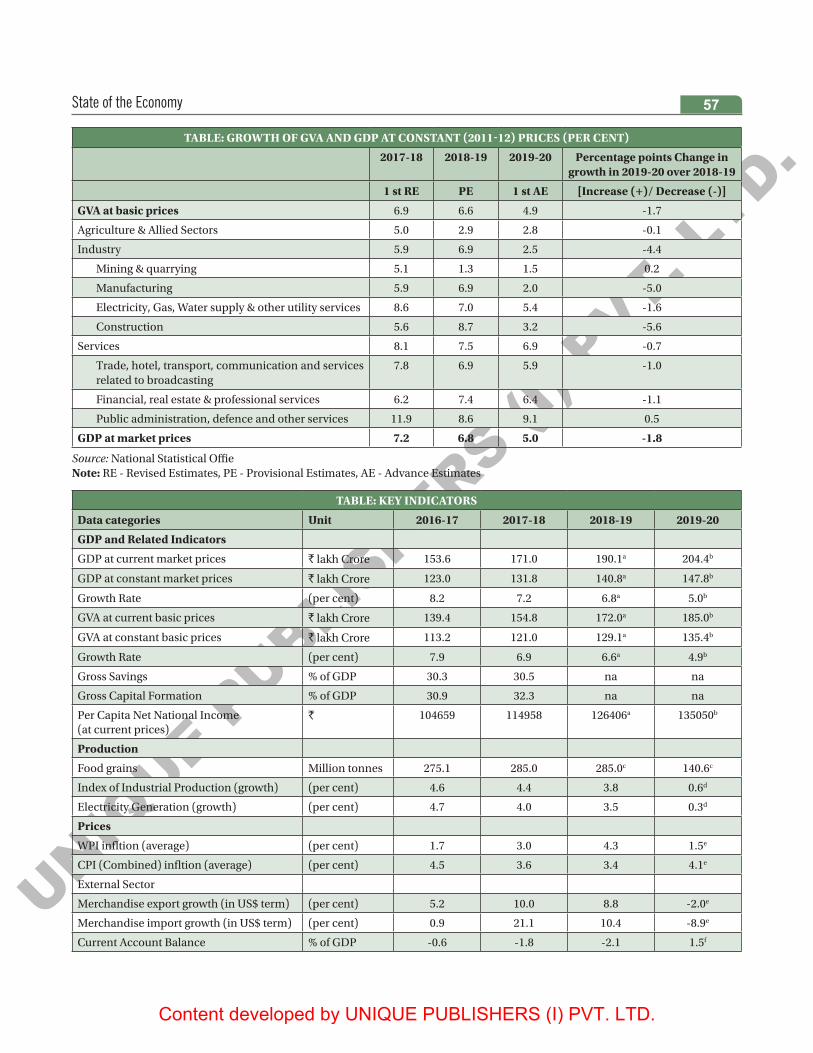
UNIQUE P
UBLISHERS (I
) PVT. L
TD.
Content developed by UNIQUE PUBLISHERS (I) PVT. LTD.
State of the Economy 57
TABLE: GROWTH OF GVA AND GDP AT CONSTANT (2011-12) PRICES (PER CENT)
2017-18 2018-19 2019-20 Percentage points Change in growth in 2019-20 over 2018-19
1 st RE PE 1 st AE [Increase (+)/ Decrease (-)]
GVA at basic prices 6.9 6.6 4.9 -1.7
Agriculture & Allied Sectors 5.0 2.9 2.8 -0.1
Industry 5.9 6.9 2.5 -4.4
Mining & quarrying 5.1 1.3 1.5 0.2
Manufacturing 5.9 6.9 2.0 -5.0
Electricity, Gas, Water supply & other utility services 8.6 7.0 5.4 -1.6
Construction 5.6 8.7 3.2 -5.6
Services 8.1 7.5 6.9 -0.7
Trade, hotel, transport, communication and services related to broadcasting
7.8 6.9 5.9 -1.0
Financial, real estate & professional services 6.2 7.4 6.4 -1.1
Public administration, defence and other services 11.9 8.6 9.1 0.5
GDP at market prices 7.2 6.8 5.0 -1.8
Source: National Statistical OffieNote: RE - Revised Estimates, PE - Provisional Estimates, AE - Advance Estimates
TABLE: KEY INDICATORS
Data categories Unit 2016-17 2017-18 2018-19 2019-20
GDP and Related Indicators
GDP at current market prices ` lakh Crore 153.6 171.0 190.1a 204.4b
GDP at constant market prices ` lakh Crore 123.0 131.8 140.8a 147.8b
Growth Rate (per cent) 8.2 7.2 6.8a 5.0b
GVA at current basic prices ` lakh Crore 139.4 154.8 172.0a 185.0b
GVA at constant basic prices ` lakh Crore 113.2 121.0 129.1a 135.4b
Growth Rate (per cent) 7.9 6.9 6.6a 4.9b
Gross Savings % of GDP 30.3 30.5 na na
Gross Capital Formation % of GDP 30.9 32.3 na na
Per Capita Net National Income (at current prices)
` 104659 114958 126406a 135050b
Production
Food grains Million tonnes 275.1 285.0 285.0c 140.6c
Index of Industrial Production (growth) (per cent) 4.6 4.4 3.8 0.6d
Electricity Generation (growth) (per cent) 4.7 4.0 3.5 0.3d
Prices
WPI infltion (average) (per cent) 1.7 3.0 4.3 1.5e
CPI (Combined) infltion (average) (per cent) 4.5 3.6 3.4 4.1e
External Sector
Merchandise export growth (in US$ term) (per cent) 5.2 10.0 8.8 -2.0e
Merchandise import growth (in US$ term) (per cent) 0.9 21.1 10.4 -8.9e
Current Account Balance % of GDP -0.6 -1.8 -2.1 1.5f

UNIQUE P
UBLISHERS (I
) PVT. L
TD.
Content developed by UNIQUE PUBLISHERS (I) PVT. LTD.
Economic Survey & Budget58
Data categories Unit 2016-17 2017-18 2018-19 2019-20
Foreign Exchange Reserves (end of year) US$ Billion 370.0 424.5 412.9 457.5j
Average Exchange Rate ` /US$ 67.1 64.5 69.9 70.4e
Money and Credit
Broad Money (M3) growth (annual) (per cent) 10.1 9.2 10.5 9.8g
Scheduled Commercial Bank Credit (growth)
(per cent) 8.2 10.0 13.3 7.2g
Fiscal Indicators (Centre)
Gross Fiscal Defiit % of GDP 3.5 3.5 3.4h 3.3i
Revenue Defiit % of GDP 2.1 2.6 2.2h 2.3i
Primary Defiit % of GDP 0.4 0.4 0.2h 0.2i
Notes: Na: Not available,a: Provisional estimates, b: First advance estimate, c: Fouth AE for 2018-19 and fist AE for 2019-20,d: (April-November) 2019, e: (April-December) 2019, f: (April-September) 2019, g: November 2019,h: Revised Estimate i. Budget Estimate j. End of December 2019
WHAT IS THE CONCEPT OF VIRTUOUS CYCLE OF HIGHER FIXED INVESTMENT-HIGHER GDP GROWTH-HIGHER CONSUMPTION GROWTH?The Economic Survey, 2018-19 describes the virtuous cycle of growth wherein increase in the rate of fixed investment accelerates the growth of GDP that in turn induces a higher growth in consumption. Higher growth of consumption improves the investment outlook, which results in still higher growth of fixed investment that further accelerates the growth of GDP, inducing a still higher growth of consumption. This virtuous cycle of higher fixed investment-higher GDP growth-higher consumption growth generates economic development in the country.
Figure: Virtuous cycle of growth
UNIQUE P
UBLISHERS (I
) PVT. L
TD.
Content developed by UNIQUE PUBLISHERS (I) PVT. LTD.
State of the Economy 59
Conversely, when this virtuous cycle rotates slowly, declining rate of fixed investment decelerates GDP growth with a lag, which eventually causes a deceleration in the growth of consumption as well. In case of India, the lag between rate of fixed investment and its impact on GDP growth is seen to be of three to four years. Similarly, the impact of GDP growth on consumption growth gets reflected in one to two years. Therefore, a contemporaneous comparison of trends of GDP growth and investment is not appropriate, given the negative correlation seen between the two. The Indian economy, since 2011-12, has been under the influence of slowing cycle of growth. The fixed investment rate has started declining sharply since 2011- 12 and subsequently plateaued from 2016- 17 onwards. Given the lagged impact of the investment rate on GDP growth (with the effect being most pronounced after four years), the deceleration in growth since 2017-18 is consistent with the framework described here.
The drop in fixed investment by households from 14.3 per cent to 10.5 per cent explains most of the decline in overall fixed investment between 2009-14 to 2014- 19. Fixed investment in the public sector marginally decreased from 7.2 per cent of GDP to 7.1 per cent during the two periods. However, the stagnation in private corporate investment at approximately 11.5 per cent of GDP between 2011-12 to 2017- 18 has a critical role to play in explaining the slowing cycle of growth and, in particular, the recent deceleration of GDP and consumption.
WHAT IS THE CAUSE OF DRAG OF FINANCIAL SECTOR ON PRIVATE CORPORATE INVESTMENT? IS IT POSSIBLE THAT THIS EXCESSIVE BANK LENDING, DRIVEN BY THE IRRATIONAL EXUBERANCE OF THE BOOM PERIOD, LED TO A DECLINE IN CORPORATE INVESTMENTS IN THE FUTURE?To make sense of the decline in corporate investment when it stems from issues related to the financial sector, we must understand the boom in credit. It is now well recognized that a sudden credit expansion, which is purely supply led, results in short lived expansion of output and employment but causes significant contraction in the long run. The International Monetary Fund (2017) finds this relationship for 80 countries. In most of these cases, the credit channel works through household debt where households increase demand using debt in the short run and reduce demand later during the deleveraging phase, thereby, resulting in recessions. In the Indian context, the credit channel has worked through corporate investment. The bust following
the boom was characterized by deleveraging and low investment rate in the corporate sector, eventually causing the recent deceleration of GDP growth. Here, it may be useful to ask if the origins of slowing cycle of growth lie in the enormous lending boom of the mid and late 2000s when non- food bank credit almost tripled between 2003-04 to 2007-08 and doubled between 2007-08 to 2011-12.
WHAT ARE ‘QUASI-CORPORATES’?The household sector includes family households as well as ‘quasi-corporates’.
Unincorporated enterprises belonging to households, which have complete sets of accounts, are called ‘quasi-corporates’. A break-down of household sector investment shows that investment in the groups ‘Machinery and equipment’ and ‘Dwellings, other buildings and Structures’ together account for more than two-thirds of total household sector investment.
Unincorporated household enterprises, in addition to supplying directly for retail consumption, are also suppliers to incorporated enterprises from the back end of the value chain. The stagnation in machinery and equipment investment of households at around 2.4 per cent of GDP, from 2011-12 to 2017-18, can possibly be linked with the leveling of private corporate investment during the same period.
The decline in household investment in ‘Dwellings, other buildings and Structures’, over 2011-12 to 2017-18 is a reflection of slower growth in purchase of houses by households. The real estate sector, and residential property in particular, has been reeling with issues of delayed project deliveries and stalled projects leading to a build-up of unsold inventory over the years.
WHAT IS THE OUTLOOK FOR 2020? DISCUSS THE DOWNSIDE AND UPSIDE RISKS TO AN EXPECTED ACCELERATION IN GDP GROWTH?The IMF in its January 2020 update of World Economic Outlook has projected India’s real GDP to grow at 5.8 per cent in 2020-21. World Bank in its January 2020 issue of Global Economic Prospects also sees India’s real GDP growing at 5.8 per cent in 2020-21.
Based on the first Advance Estimates of India’s real GDP growth in 2019-20, an uptick in GDP growth in H2 of 2019-20 is expected as compared to first half of the same year. With a view to making an assessment of the likely growth in GDP, both the downside and upside risks to an expected acceleration in GDP growth are discussed below.

UNIQUE P
UBLISHERS (I
) PVT. L
TD.
Content developed by UNIQUE PUBLISHERS (I) PVT. LTD.
Economic Survey & Budget60
Downside Risks
• Continued global trade tensions could delay the recovery in the growth of global output, which may constrain the export performance of the country. Weaker export growth may reduce the inducement to increase the fixed investment rate in the economy.
• Escalation in US-Iran geo-political tensions may increase the price of crude oil and depreciate the rupee. Net FPI inflows may weaken, as a result, adding further pressure on the rupee to depreciate. If a fuller pass-through of the costlier crude oil is allowed, it may fuel inflationary pressure in the economy, cause the growth of private consumption to decline and weaken the inducement to invest. Even if a partial pass-through happens, fiscal deficit may swell, may increase the yield on G-sec and thereby, increase the cost of capital that may again weaken the inducement to invest.
• Growth in advanced countries has weakened with very low inflation. The conventional monetary policy has almost run its full course. Subsequently, quantitative easing may fuel inflation and reduce the real interest rate. At some point in future, if short-term interest rates are raised by the central banks to contain inflation, it may result in capital flight from emerging and developing market economies (EMEs) including India. The rupee may come under pressure making imports costlier. Leakage from the domestic circular flow of income may increase which may adversely impact private consumption and investment. If instead, fiscal expansion is the preferred policy option in advanced countries, increase in short-term interest rates may happen all the more earlier and weaken the growth impulse in EMEs including India.
• The implementation of IBC Code is making progress, albeit slowly. Unless this speeds up, the risk aversion of banks to lend further may not reduce. Risk premiums may then continue to be high and cuts in repo rates may not transmit to lowering lending rates. Private investment may, therefore, remain muted.
• Investment in the public sector may increase, as is expected after the announcement of the National Infrastructure Pipeline (NIP) of projects worth ` 102 lakh crore. If this leads to expansion of fiscal deficit, bond yields may increase, thereby, possibly crowding out private investment. If instead private investment seeks external funding, CAD would widen and depreciate the rupee, bringing in its wake the adverse impact on consumption, investment and growth.
• Should productivity gains not significantly increase with reforms, it may raise the requirement of fixed investment rate to boost economic growth.
• A non-rising gross domestic savings rate may further deteriorate the CAD, depreciate the rupee and make the virtuous cycle more difficult to realize.
Upside Risks• There are tentative signs that manufacturing activity
and global trade are bottoming out. This may positively impact India’s exports. At the same time, there is renewed initiative to boost exports through various reform measures including scaling up of logistics infrastructure that may increase export competitiveness.
• Government’s thrust on affordable housing is evident, in order to boost the real estate sector and consequently the construction activity in the country. Higher investment in housing by households may increase the fixed investment in the economy. Existing unsold housing inventory can be cleared and the balance sheets of both bank/ non-bank lenders cleaned if the real estate developers are willing to take a ‘hair-cut’ by allowing the house-prices to drop.
• Global sentiment continues to favor India as reflected in robust and rising inflows of net FDI into the country. Relocation of investors from other countries to India in the wake of trade tensions will also add to the flow. The announcement of NIP may further increase FDI inflows into the country in both brown-field and green-field infrastructure projects. Continuous relaxation of FDI guidelines may address the concerns of foreign investors and improve the investment climate.
• A boost to Make in India may not only enhance exports but replace imports of products in which India has sufficient scope for expansion in domestic manufacturing.
• India has been making steady progress in improving its rank in the Ease of Doing Business, assessed for about 190 countries by the World Bank. Earlier the rank had improved with the implementation of GST. Lately the improvement in rank has resulted from progress in trade facilitation as cross-border movement of goods has involved lesser waiting time. As the implementation of GST further settles down, the increased unification of the domestic market may reduce business costs and facilitate fresh investment. Reforms in land and labor market may further reduce business costs.
• Reduction in the base corporate tax rate to 15 per cent for new manufacturing companies may increase the rate of return on investment above the hurdle rate of the cost of capital and encourage a surge in new investments.
• Merger of public sector banks may increase the financial strength of the merged entities, lower the risk aversion and result in lowering of lending rates.

UNIQUE P
UBLISHERS (I
) PVT. L
TD.
Content developed by UNIQUE PUBLISHERS (I) PVT. LTD.
State of the Economy 61
Projection of GDP growth in 2020-21
1.58 On a net assessment, it appears that the upside risks should prevail, particularly when the government, with a strong mandate, has the capacity to deliver expeditiously on reforms. GDP growth of India should strongly rebound in 2020-21 and more so on a low statistical base of 5 per cent growth in 2019-20. On a net assessment of both the downside/upside risks, India’s GDP growth is expected to grow in the range of 6.0 to 6.5 per cent in 2020-21.
GOVERNMENT IN 2019-20 HAS TAKEN IMPORTANT REFORMS TO BOOST THE OVERALL INVESTMENT, CONSUMPTION AND EXPORTS IN THE ECONOMY. DISCUSS?• In December 2019, Cabinet approved the Insolvency
and Bankruptcy Code (Second Amendment) Bill, 2019. The amendments aim at fast-tracking the insolvency resolution process and to further improve the ease of doing business.
• On 31st December 2019, the government released the Report of the Task Force on National Infrastructure Pipeline (NIP) for each of the years from 2019-20 to 2024-25. The report has submitted proposals for projects whose aggregate value is estimated at `102 lakh crore.
• Government has brought in Taxation Laws (Amendment) Ordinance 2019 to make certain amendments in the Income-tax Act 1961 and the Finance (No. 2) Act 2019.(i) A new provision has been inserted in the Income-
tax Act with effect from 2019-20 which allows any domestic company an option to pay income-tax at the rate of 22 per cent subject to condition that they will not avail any exemption/incentive. The effective tax rate for these companies shall be 25.17 per cent inclusive of surcharge & cess. Also, such companies shall not be required to pay Minimum Alternate Tax.
(ii) In order to attract fresh investment in manufacturing and thereby boost the ‘Make-in- India’ initiative of the Government, a new provision has been inserted in the Income-tax Act with effect from 2019-20 which allows any new domestic company incorporated on or after 1st October 2019 making fresh investment in manufacturing, an option to pay income-tax at the rate of 15 per cent. This benefit is available to companies which do not avail any exemption/incentive and commences their production on or before 31st March, 2023. The effective tax rate for
these companies shall be 17.01 per cent inclusive of surcharge & cess. Also, such companies shall not be required to pay Minimum Alternate Tax. Corporate income tax rates in India are now amongst the lowest in the world.
• Rapid growth requires rapid investment which in turn is dependent on robust supply of credit. Government has taken notable steps in this regard: (i) Budget 2019-20 announced an infusion of `70,000
crore into Public Sector Banks (PSBs) to boost credit and investment in the economy. As of November 2019, `60,314 crore has been infused from this provision, thereby, equipping banks for growth and investment.
(ii) Strong banks are imperative to achieve a US$ 5 trillion economy. Along with numerous governance reforms, government has proposed an amalgamation of 10 PSBs to form 4 merged entities with a view to create next generation banks with strong national presence and global reach. Operational efficiency gains arising due to this consolidation are expected to reduce the cost of lending.
(iii) The Monetary Policy Committee of RBI changed its stance from calibrated tightening to neutral in February 2019 and to accommodative from June 2019 onwards. Accordingly, the policy rate has been reduced by 135 bps since February 2019.
(iv) In order to enhance debt flow to housing and infrastructure projects, government has proposed to establish an organization, Credit Enhancement for Infrastructure and Housing Projects.
(v) As per RBI, all new floating rate retail loans and floating rate loans to micro and small enterprises extended by banks with effect from 1st October 2019 are to be linked to one of the specified external benchmarks. These benchmarks consist of the policy repo rate, Government of India 3-months or 6-months Treasury Bill yields, or any other benchmark indicated by the Financial Benchmarks India Private Ltd (FBIL).
• Government has taken various measures to boost the growth of the auto sector:(i) one-time registration fees being deferred till June
2020,(ii) BS IV vehicles purchased till 31st March 2020 to
remain operational for entire period of registration (iii) additional 15 per cent depreciation on all vehicles
to increase to 30 per cent acquired during the period from now till 31st March 2020,

UNIQUE P
UBLISHERS (I
) PVT. L
TD.
Content developed by UNIQUE PUBLISHERS (I) PVT. LTD.
Economic Survey & Budget62
(iv) both Electrical Vehicles (EVs) and Internal Combustion Vehicles (ICVs) will continue to be registered and,
(v) to boost demand, government will lift the ban on replacing old vehicles with purchage of new vehicles by Goverment Departments.
• In December 2019, modifications to the MSME Interest Subvention Scheme were approved to further smoothen operational difficulties and to improve access to credit at a reduced cost.
• Government has approved creation and launch of Bharat Bond Exchange Traded Fund (ETF) to create an additional source of funding for Central Public Sector Undertakings (CPSUs), Central Public Sector Enterprises (CPSEs), Central Public Financial Institutions (CPFIs) and other government organizations. Bharat Bond ETF would be the first corporate bond ETF in the country.
• With a view to boosting the realty sector and incentivising the consumers to buy houses, the government has taken some notable measures (i) Government has approved the establishment of
a ‘Special Window’ fund to provide priority debt financing for the completion of stalled housing projects that are in the ‘Affordable and Middle-Income’ Housing sector. For the purpose of the fund, government shall act as the Sponsor and the total commitment to be infused by the government would be upto `10,000 crores. The fund is seeking matching contributions from banks, LIC and others to generate a total corpus of around ̀ 25,000 crore. The fund will be set up as a Category-II AIF (Alternate Investment Fund) debt fund registered with SEBI and would be run professionally.
(ii) Eligible beneficiaries of Pradhan Mantri Awas Yojana (Gramin) are to be provided 1.95 crore houses with amenities like toilets, electricity and LPG connections during its second phase (2019-20 to 2021-22).
(iii) External Commercial Borrowings (ECB) guidelines will be relaxed to facilitate financing of home buyers who are eligible under the Pradhan Mantri Awas Yojana (PMAY), in consultation with RBI. This is in addition to the existing norms for ECB for affordable housing.
(iv) House Building Advance: The interest rate on House Building Advance shall be lowered and linked with the 10 Year G Sec Yields.
(v) Additional deduction up to `1.5 lakh for interest paid on loans borrowed up to 31
st March, 2020 for purchase of house valued up to `45 lakh to
promote affordable housing.(vi) Banks to launch Repo rate /external benchmark
linked loan products. Reduced EMI for housing loans by directly linking Repo rate to interest rates
(vii) Additional liquidity support to HFCs of `20,000 crore by National Housing Bank (NHB), thereby, increasing it to `30,000 crore.
• To guarantee support and enable NBFCs/Housing Finance Companies (HFCs) to resolve any temporary liquidity or cash flow mismatch issues, government has rolled out the ‘Partial Credit Guarantee Scheme’ for purchase of high-rated pooled assets from financially sound NBFCs / HFCs by PSBs. The amount of overall guarantee is limited to first loss of up to 10 per cent of fair value of assets being purchased by the banks under the Scheme, or `10,000 crore, whichever is lower, as agreed by Department of Economic Affairs (DEA). The scheme would cover NBFCs / HFCs that may have slipped into SMA-0 category during the one-year period prior to 1st August 2018, and asset pools rated ‘BBB+’ or higher.
• The Stand Up India Scheme has been extended upto the year 2025. The Scheme aims to facilitate bank loans between `10 lakh to `100 lakh to atleast one Scheduled Caste (SC) or Scheduled Tribe (ST) borrower and atleast one woman borrower per bank branch for setting up a greenfield enterprise. In case of non-individual enterprises, at least 51 per cent of the shareholding and controlling stake should be held by either an SC/ST or woman entrepreneur.
• Government has put in place an investor friendly FDI policy by liberalizing the policy to allow upto 100 per cent FDI by automatic route on most of the sectors.
• To mitigate genuine difficulties of startups and their investors, Section 56(2)(viib) of the Income-Tax Act (regarding angel tax) will no longer be applicable to startups registered with DPIIT.
MEASURES TO BOOST CONSUMPTION• Government has taken various measures to boost the
incomes especially rural incomes to usher spending and consumption levels in the economy.
• Increase in the Minimum Support Prices (MSPs) for all mandated Rabi crops and Kharif crops for 2019-20 season.
• To provide an assured income support to the small and marginal farmers, the cash transfer scheme Pradhan Mantri Kisan Samman Nidhi (PM-KISAN) providing an income support of `6,000 per year has been extended to all eligible farmer families irrespective of the size of land holdings.
UNIQUE P
UBLISHERS (I
) PVT. L
TD.
Content developed by UNIQUE PUBLISHERS (I) PVT. LTD.
State of the Economy 63
• With a move towards attaining universal social security, Government has approved a new scheme that offers pension coverage to the trading community. Under this scheme all shopkeepers, retail traders and self-employed persons are assured a minimum monthly pension of `3,000 per month after attaining the age of 60 years.
• W.e.f. 1st August 2019, GST rate on all electric vehicles has been reduced from 12 per cent to 5 per cent and of charger or charging stations for EVs from 18 per cent to 5 per cent . Hiring of electric buses (of carrying capacity of more than 12 passengers) by local authorities will be exempted from GST.
MEASURES TO BOOST EXPORTS• The scheme for Remission of Duties or Taxes on Export
Product (RoDTEP) will replace Merchandise Exports from India Scheme (MEIS) for reimbursement of taxes & duties for export promotion. Textiles and all other sectors which currently enjoy incentives upto 2 per cent over MEIS will transit into RoDTEP. In effect, RoDTEP will more than adequately incentivize exporters than existing schemes put together.
• Special Economic Zones (Amendment) Bill, 2019 has been approved wherein a trust or any entity notified
by the Central Government will be eligible to be considered for grant of permission to set up a unit in Special Economic Zones.
• In order to boost credit to the export sector, RBI enhanced the sanctioned limit to be eligible under priority sector lending norms. The limit has been raised from `25 crore to `40 crore per borrower. Furthermore, the existing criterion of ‘units having turnover of up to ` 100 crore’ has been removed.
• Export Credit Guarantee Corporation (ECGC) will expand the scope of Export Credit Insurance Scheme (ECIS) to offer higher insurance cover to banks lending working capital for exports. This will enable reduction in overall cost of export credit including interest rates, especially to MSMEs
• Government has approved the Sugar export policy for evacuation of surplus stocks during sugar season 2019-20. This shall involve providing a lump sum export subsidy at the rate of `10,448 per Metric Tonne (MT) to sugar mills for the sugar season 2019-20. The total estimated expenditure of about `6,268 crore will be incurred for this purpose.
• For enabling handicrafts industry to effectively harness e-commerce for exports, mass enrolment of artisans across India will be effected in collaboration with Ministry of Textiles.

UNIQUE P
UBLISHERS (I
) PVT. L
TD.
Content developed by UNIQUE PUBLISHERS (I) PVT. LTD.
Economic Survey & Budget64
GIVE A GLIMPSE OF FISCAL DEVELOPMENTS IN 2019? WHT ARE THE OBSERVATIONS OF MEDIUM TERM FISCAL POLICY?Amidst the global setting of subdued growth and intensified trade tensions, the Budget 2019-20 presented in July 2019 reaffirmed Government’s commitment to growth with macroeconomic stability.
The Medium Term Fiscal Policy (MTFP) Statement presented with the Budget 2019-20, pegged the fiscal deficit target for 2019-20 at 3.3 per cent of GDP, which was further expected to follow a gradual path of reduction and attain the targeted level of 3 per cent of GDP in 2020-21, and continue at the same level in 2021-22. It was further projected that Central Government liabilities will come down to 48.0 per cent of GDP in 2019-20. The declining path of Central government debt was expected to continue with debt reaching 46.2 per cent of GDP and 44.4 per cent of GDP in 2020-21 and 2021-22, respectively. This declining debt trajectory was expected based on a stable inflation regime and reduction in fiscal deficit.
Figure: Medium Term Fiscal Policy Statement: Fiscal Indicators
Source: Medium Term Fiscal Policy Statement, Budget 2019-20 (July 2019)
Figure: Trends in DefiitsSource: Union Budget Documents & CGA BE: Budget
Estimate, PA: Provisional Actuals FD: Fiscal Defiit; RD: Revenue Defiit; PD: Primary Defiit.
Note: RD/FD has no units.
Figure: Composition of taxes in Gross Tax Revenue in 2019-20 BE
Source: Union Budget Documents & CGAGTR: Gross Tax Revenue, CIT: Corporation Tax,
ToI: Taxes on Income other than Corporation Tax(includes STT), C: Customs, UED: Union Excise
Duties, GST: Goods and Services Tax
2 Fiscal Developments

UNIQUE P
UBLISHERS (I
) PVT. L
TD.
Content developed by UNIQUE PUBLISHERS (I) PVT. LTD.
Fiscal Developments 65
Figure: Taxes as a percent of GDPSource: Union Budget Documents & CGA
Note: 1. CIT: Corporation Tax, ToI: Taxes on Income other than Corporation Tax (includes STT), UED: Union Excise Duties, GST: Goods and Services Tax, 2. GST includes CGST, IGST and Compensation Cess
TABLE: MAJOR ITEMS OF REVENUE EXPENDITURE
Items 2014-15 2015-16 2016-17 2017-18 2018-19 PA* 2 0 1 9 - 2 0 BE
In ` lakh crore
Revenue Expenditure 14.67 15.38 16.91 18.79 20.07 24.48
(6.9) (4.8) (9.9) (11.2) (6.8) (21.9)
of which,
a. Salaries (pay & allowances) 1.34 1.45 1.77 1.94 2.18 2.35
(13.6) (7.9) (22.6) (9.3) (12.7) (7.5)
b. Pensions 0.94 0.97 1.31 1.46 1.60 1.74
(25.0) (3.4) (35.8) (10.9) (9.9) (8.9)
c. Interest payment 4.02 4.42 4.81 5.29 5.83 6.60
(7.5) (9.7) (8.8) (10.0) (10.2) (13.4)
d. Major subsidies 2.49 2.42 2.07 1.91 1.97 3.02
(1.6) (-2.7) (-14.8) (-7.5) (3.1) (53.1)
e. Defence Services 1.40 1.46 1.65 1.86 1.96 2.02
(12.9) (3.9) (13.3) (12.5) (5.3) (3.0)
Source: Union Budget Documents & CGABE: Budget Estimate, PA: Provisional ActualsNumbers in parenthesis are growth rates*The fiure for Salaries (Pay & allowances) for 2018-19 is Revised Estimate (RE).
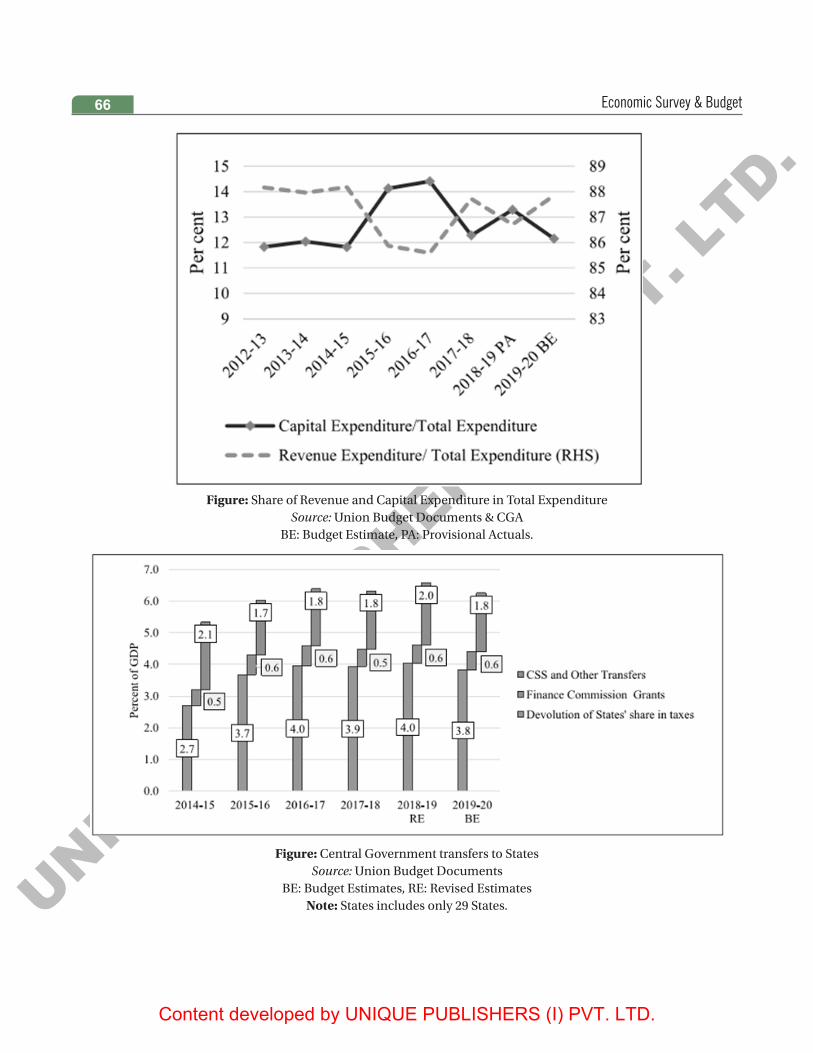
UNIQUE P
UBLISHERS (I
) PVT. L
TD.
Content developed by UNIQUE PUBLISHERS (I) PVT. LTD.
Economic Survey & Budget66
Figure: Share of Revenue and Capital Expenditure in Total ExpenditureSource: Union Budget Documents & CGA
BE: Budget Estimate, PA: Provisional Actuals.
Figure: Central Government transfers to StatesSource: Union Budget Documents
BE: Budget Estimates, RE: Revised EstimatesNote: States includes only 29 States.
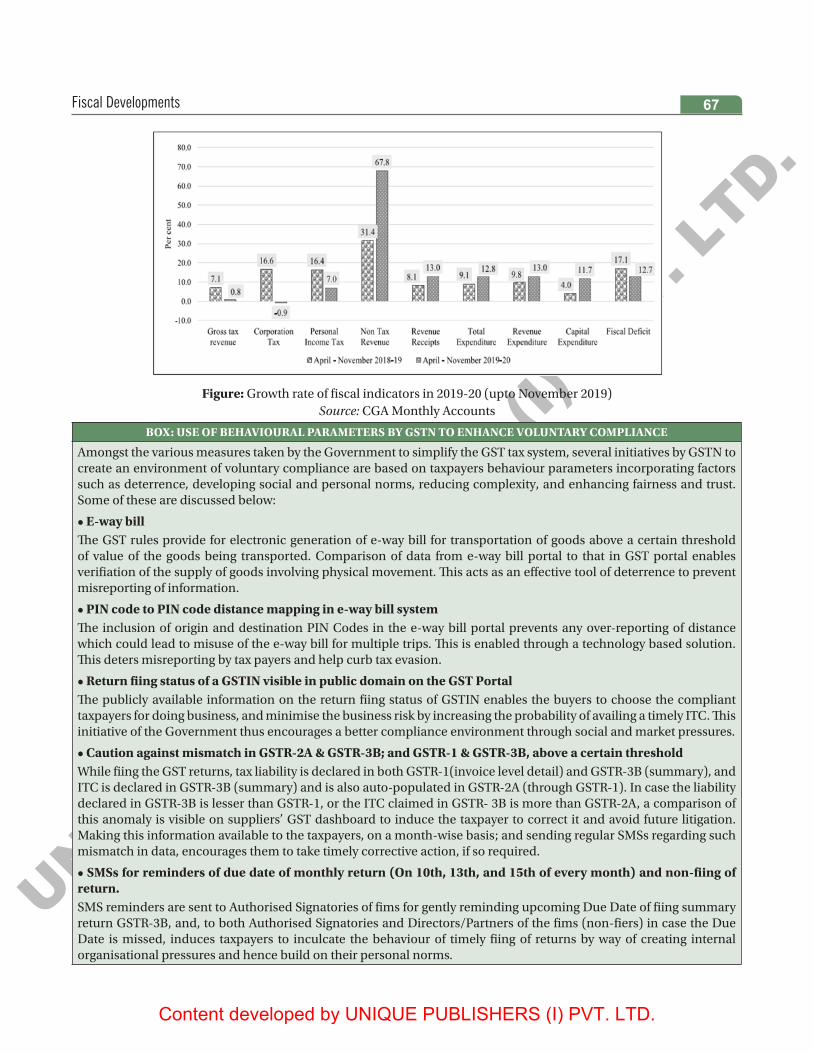
UNIQUE P
UBLISHERS (I
) PVT. L
TD.
Content developed by UNIQUE PUBLISHERS (I) PVT. LTD.
Fiscal Developments 67
Figure: Growth rate of fiscal indicators in 2019-20 (upto November 2019)Source: CGA Monthly Accounts
BOX: USE OF BEHAVIOURAL PARAMETERS BY GSTN TO ENHANCE VOLUNTARY COMPLIANCE
Amongst the various measures taken by the Government to simplify the GST tax system, several initiatives by GSTN to create an environment of voluntary compliance are based on taxpayers behaviour parameters incorporating factors such as deterrence, developing social and personal norms, reducing complexity, and enhancing fairness and trust. Some of these are discussed below:
• E-way billThe GST rules provide for electronic generation of e-way bill for transportation of goods above a certain threshold of value of the goods being transported. Comparison of data from e-way bill portal to that in GST portal enables verifiation of the supply of goods involving physical movement. This acts as an effective tool of deterrence to prevent misreporting of information.
• PIN code to PIN code distance mapping in e-way bill systemThe inclusion of origin and destination PIN Codes in the e-way bill portal prevents any over-reporting of distance which could lead to misuse of the e-way bill for multiple trips. This is enabled through a technology based solution. This deters misreporting by tax payers and help curb tax evasion.
• Return fiing status of a GSTIN visible in public domain on the GST PortalThe publicly available information on the return fiing status of GSTIN enables the buyers to choose the compliant taxpayers for doing business, and minimise the business risk by increasing the probability of availing a timely ITC. This initiative of the Government thus encourages a better compliance environment through social and market pressures.
• Caution against mismatch in GSTR-2A & GSTR-3B; and GSTR-1 & GSTR-3B, above a certain thresholdWhile fiing the GST returns, tax liability is declared in both GSTR-1(invoice level detail) and GSTR-3B (summary), and ITC is declared in GSTR-3B (summary) and is also auto-populated in GSTR-2A (through GSTR-1). In case the liability declared in GSTR-3B is lesser than GSTR-1, or the ITC claimed in GSTR- 3B is more than GSTR-2A, a comparison of this anomaly is visible on suppliers’ GST dashboard to induce the taxpayer to correct it and avoid future litigation. Making this information available to the taxpayers, on a month-wise basis; and sending regular SMSs regarding such mismatch in data, encourages them to take timely corrective action, if so required.
• SMSs for reminders of due date of monthly return (On 10th, 13th, and 15th of every month) and non-fiing of return.SMS reminders are sent to Authorised Signatories of fims for gently reminding upcoming Due Date of fiing summary return GSTR-3B, and, to both Authorised Signatories and Directors/Partners of the fims (non-fiers) in case the Due Date is missed, induces taxpayers to inculcate the behaviour of timely fiing of returns by way of creating internal organisational pressures and hence build on their personal norms.

UNIQUE P
UBLISHERS (I
) PVT. L
TD.
Content developed by UNIQUE PUBLISHERS (I) PVT. LTD.
Economic Survey & Budget68
• Free accounting & billing software provided to small tax payersIn order to ease the compliance in the technology driven GST regime, GST Council has decided to offer free services like preparing invoices, GST returns, Income Tax returns, Balance sheet and Profi & Loss statement through accounting & billing software for the small businesses, which constituted more than 80% of all GST taxpayers in March 2019.
• Questionnaire based fiing of return and showing the relevant tablesIn order to reduce the complexity of returns and simplify the process, the GST portal adopts a questionnaire based return fiing system, whereby based on the reply given by the taxpayer in the questionnaire, only relevant tables for fiing will be visible to taxpayer on returns dashboard. This simplifiation is meant to ease compliance for the taxpayers.
• Compliance rating score of the taxpayers available in the public domainGST Act provides for public display of compliance rating score of every registered GST tax-payer based on taxpayer record of compliance with provisions of GST Act. Government is in the process of fialising the method of computation of this compliance rating. Once fialised and made available in public domain, this would enable buyers to choose compliant taxpayers for doing business, as their timely ITC claim is dependent on timely fiing of GST return by the seller. The deterrence of a possible loss of business on account of a low compliance rating score would induce taxpayers to be more compliant. In addition, public display of this information would increase the transparency and lead to improved trust of the businesses in the tax administration and develop a social norm of good compliance in the long run.
• Acknowledging contribution of compliant tax payersGovernment has decided to issue a certifiate to compliant GST taxpayers, and acknowledge their contribution towards nation building. This appreciation serves to motivate taxpayers to continue their compliant behaviour in future as well.
Source: Goods and Services Tax Network (GSTN)
TABLE: EXPENDITURE ON MAJOR SUBSIDIES
Items Budget Estimate(In `lakh crore)
April to November (In `lakh crore)
2019-20 2017 2018 2019
Total Major Subsidies 3.02 2.06 2.19 2.35
Food Subsidy 1.84 1.35 1.42 1.32
Nutrient Based Fertilizers Subsidy 0.26 0.18 0.20 0.22
Urea Subsidy 0.54 0.32 0.33 0.51
Petroleum 0.37 0.21 0.23 0.30
Source: CGA Monthly Accounts
DISCUSS THE MAJOR REFORMS IN CORPORATE TAXATION?On Sept 20, 2019, the Government announced a major cut in the corporate income tax (CIT) rate applicable to the domestic companies. This was followed by the ‘Taxation Laws (Amendment) Act, 2019 dated Dec 12, 2019, which introduced two new sections viz. 115BAA and 115BAB in the Income Tax Act. The existing companies have been given an option to forego certain deductions and
exemptions availed under the Act and choose a new CIT rate structure with a maximum marginal rate (MMR), inclusive of surcharge and cess, of 25.17 per cent as against the existing MMR of 34.61 per cent. In order to give boost to the manufacturing sector, the new manufacturing companies registered on or after 1.10.2019 have been given an option to choose a CIT rate with MMR of 17.16 per cent. The new CIT rate structure is available with effect from the current financial year i.e. 2019-20. However the CIT rate applicable to the foreign companies remained unchanged.

UNIQUE P
UBLISHERS (I
) PVT. L
TD.
Content developed by UNIQUE PUBLISHERS (I) PVT. LTD.
Fiscal Developments 69
TABLE: COMPARISON OF EXISTING AND NEW RATES OF CORPORATE INCOME TAX FOR DOMESTIC COMPANIES FOR THE FIANCIAL YEAR 2019-20
Existing rate New rate
Base CIT rate Criteria Rate Criteria Rate
If Total turnover or gross receipt in the fiancial year 2017-18 does not exceed `400 Crore
25% (a) If a company opts for section 115BAA*
22%
If a manufacturing company set up on or after 1.3.2016 opts for section 115BA
(b) If a manufacturing company set up on or after 1.10.2019 opts for section115BAB** and commences manufacturing on or before 31.03.2023.
15%
If not covered by (a) or (b) 30% If not covered by (a) or (b) Old rate structure applicable
MAT rate All companies 18.5% If not in (a) or (b) 15%
If in (a) or (b) NIL
Surcharge rate If Total Income not more than `1 crore 0% All companies 10%
If total income more than `1 crore but not more than `10 crore
7%
If total income is more than `10 crore 12%
Cess rate All companies 4% All companies 4%
* Companies included under Section 115BAA: Existing domestic companies that opt for new CIT rate and satisfy the following pre-conditions:• Deductions or exemptions are not claimed under section 10AA, or 32(1) (iia), or 32AD, or 33AB, or 33ABA, or 32(2AA)/(2AB) (1)(ii)/(iia)/(iii), or 35AD, or 35CCC, or 35 CCD, or under any provisions of Chap VI-A other than section 80JJAA.• Set-off of carried forward / current losses or depreciation attributable to any of the aforesaid deductions is not availed.• Only depreciation other than additional depreciation under section 32(1)(iia) is claimed** Companies included under Section 115BAB: New manufacturing companies that are set up and registered on or after Oct 1, 2019, which bring in fresh investment, commence manufacturing on or before March 31, 2023 and satisfy certain preconditions including the aforesaid pre-conditions.
Rationale behind the reform
All over the world, many countries had reduced CIT rate to attract investment and create employment opportunities. The act of reduction of CIT rate by other countries, in particular Asian developing countries, which compete with India to attract investments, provided an impetus to lower the CIT rates in India. It is expected that this would spur investment, stimulate growth and create job opportunities in India. A comparison of the CIT rates in ASEAN countries, with the reduced CIT rate in India (for new manufacturing companies in particular), presented in the fiure below, shows that the CIT rate in India is now lower thanmost ASEAN countries. The stimulus provided by the corporate tax cut is also expected to have a multiplier effect on the economy. Fresh investments in the coming future are expected to not only result in creation of new jobs but also lead to increased income levels. As a result, tax collections are also likely to rise in the medium to long run.
Figure: Corporate Tax Rate across ASEAN countries
UNIQUE P
UBLISHERS (I
) PVT. L
TD.
Content developed by UNIQUE PUBLISHERS (I) PVT. LTD.
Economic Survey & Budget70
Who will benefit?
An analysis conducted by Tax Policy Research Unit (TPRU), based on income tax return (ITR) data of corporates for the fiancial year 2016-17, points out that most of the companies (99.1 per cent) have a gross turnover of below `400 crore (say small and medium companies) and are already taxed at the base CIT rate of 25 per cent. With surcharge and cess, their MMR varies from 26 per cent to 29.12 per cent. On the other hand, only 0.9 per cent of the companies i.e. 4,698 companies have gross turnover of over `400 crore (say large companies) and their MMR varies from 30.9 per cent to 34.61 per cent. Thus, the impact of CIT rate cut varies from gain of about 3.2 per cent to 13.5 per cent of the existing tax liability for small/medium companies to about 18.5 per cent to 27.3 per cent of the existing tax liability for large companies.
DISCUSS THE MAJOR INITIATIVES FOR DISINVESTMENT BY THE GOVERNMENT IN 2019?The B.E. for disinvestment proceeds for the year 2019-20 was fixed at `1.05 lakh crore. As on 31st December 2019, the Government has mobilised `0.18 lakh crore using a variety of instruments like Initial Public Offers (IPOs), Offer for Sale (OFS), Exchange Traded Funds (ETF) etc. Details are as under:
Listing of shares (IPO): During the year 2019-20, two IPOs namely Indian Railway Catering and Tourism Corporation (IRCTC) and Rail Vikas Nigam Ltd (RVNL) were successfully listed yielding `636 crore and `475.89 crore respectively, while five more PSEs, namely, Indian Railway Finance Corporation (IRFC), Kudremukh Iron Ore Company Limited (KIOCL) (FPO), RailTel, Water and Power Consultancy Services (WAPCOS) and Telecommunications Consultants India Limited (TCIL) are in the process of listing (as on 31.12.2019).
Offer for sale (OFS): During the year 2019-20, OFS of Railway Infrastructure Technical and Economic Service (RITES) has been concluded yielding `729.45 crore.
ETFs: ETFs were the biggest source of receipts during current year with Further Fund Offer-5 (FFO) of CPSE-ETF fetching `10,000.39 crore and FFO-2 of Bharat 22 ETF fetching `4,368.80 crore in July 2019 and October 2019 respectively. In aggregate, ETFs have fetched `14,369.19 crore in 2019-20 (as on 31.12.2019).
Others: Sale of Enemy Shares by Custodian of Enemy Property for India (CEPI): `1,881.21 crore
MAJOR INITIATIVES TAKEN BY DIPAM
1. Strategic Disinvestment:
The CCEA has given in-principle approval (on 20.11.2019) for strategic disinvestment of the GoI shareholding in five public sector enterprises along with management control. These are: Bharat Petroleum Corporation Ltd
(BPCL); Shipping Corporation of India (SCI); Container Corporation of India (CONCOR); Tehri Hydro Power Development Corporation (THDCIL), and North Eastern Electric Power Corporation Ltd (NEEPCO). The strategic sale of THDC, NEEPCO and Numaligarh subsidiary of BPCL will be made to a CPSE buyer. The CCEA has also given in principle approval (on 08.01.2020) of strategic disinvestment of Government of India shareholding in Neelachal Ispat Nigam Ltd. (NINL). With this, a total of 34 CPSEs/Subsidiaries/Units of CPSEs (including Air India) have now been accorded ‘in-principle’ approval by the government for strategic disinvestment. The Government strategically sold its stake in 5 CPSEs namely Hindustan Petroleum Corporation Limited (HPCL), Rural Electrification Corporation Limited (REC), Dredging Corporation of India Limited (DCIL), Hospital Services Consultancy Corporation Limited (HSCC) & National Projects Construction Corporation Limited (NPCC) in last two years which resulted in a yield of `52,869 crore. The process for strategic disinvestment in identified CPSEs in the current year has been initiated.
Streamlining the procedure for strategic disinvestment: In order to make the procedure for strategic disinvestment more expeditious and result-oriented, CCEA has approved a modified procedure for strategic disinvestment, whereby, the Inter-Ministerial Group (IMG) chaired by the Secretary, DIPAM and Co-Chaired by Secretary of the Administrative ministry/department concerned will drive the procedure and play a pivotal role in the entire process.
2. Reduction of Shareholding in select CPSEs below 51% while retaining management control:
In the Budget Speech of 2019-20 the Government had announced the decision to modify present policy of retaining 51% Government stake to retaining 51% stake inclusive of the stake of government controlled institutions. Accordingly, the CCEA has given in principle approval (on 20.11.2019) for reduction of Government of India paid-up

UNIQUE P
UBLISHERS (I
) PVT. L
TD.
Content developed by UNIQUE PUBLISHERS (I) PVT. LTD.
Fiscal Developments 71
share capital below 51% in select CPSEs while retaining the management control, taking into account the Government shareholding post such reduction and the shareholding of Government controlled institutions. This policy decision will increase the bandwidth for disinvestment through minority stake sale.
3. Asset Monetization Framework
The Union Cabinet in February 2019 approved the procedure and mechanism for Asset Monetization of CPSEs/PSUs/other Government organizations and Immovable Enemy Properties. This will enable monetization of identified non-core assets of CPSEs under strategic disinvestment and Immovable Enemy Property under the custody of Custodian of Enemy Property (CEPI), Ministry of Home Affairs. This Framework is also available to monetize assets of other CPSEs/PSUs/other Government Organizations and loss making/sick CPSEs.
4. Debt ETF
Cabinet Committee on Economic Affairs (CCEA) has approved the creation and launch of India’s first corporate Debt Exchange Traded Fund (Debt ETF) which would create an additional source of funding for Central Public Sector Enterprises (CPSEs), Central Public Financial Institutions (CPFIs), and other Government organizations and would increase the retail participation in the Indian corporate bond market. Bharat Bond ETF was launched on 12th December, 2019 which received a strong response from investors across different segments and was oversubscribed by 1.7 times. It has provided a new window of access to retail investors in bond market. With regular issuances, the Bharat bond ETF will help in deepening the bond market in India and develop a yield curve for CPSEs over a period of time.
DISCUSS THE MAJOR MEASURES TAKEN FOR INDIRECT TAXES DURING 2019-20?
A. Basic Custom Duty (BCD)
• The basic customs duty rates in general are Nil/2.5%/5%/7.5% on the inputs/ intermediate products [industrial chemicals, ores and concentrates, fuels, textile fibres and yarns etc] used in industries for manufacturing. Finished items of consumption attract higher duty, e.g., items like paper and paper products, marble slabs, auto parts, electronic items etc.
• In line with the efforts made to remove inversions in duty structure, Tariff Commission and Department for Promotion of Industry and Internal Trade (DPIIT) examined the issues of inversion/ negative effective protection to the domestic industry. In majority of cases Tariff Commission did not find any inversion. Appropriate corrections were made in few cases recommended by them. The inversion now being spoken about essentially emanates from Free Trade agreements (FTA) and ITA.
• To safeguard the strategic interests of the country specified Defence equipment and their parts, imported by the Ministry of Defence or the Armed Forces, have been exempted from Basic Customs Duty in the Budget 2019-20.
• In line with “Make in India” initiative of the Government, and to provide level playing field, ensure better capacity utilization and achieve import substitutions, custom duty was increased on goods like specified electrical/electronics/telecom equipment and hardware, Poly Vinyl Chloride, specified articles of nylon, HDPE and plastics, stainless steel and other alloy steel and their semi-finished products, wires of alloy steels, certain automobile parts, newsprint, uncoated paper used for printing of newspapers and lightweight coated paper used for printing of magazines. The end use based exemption granted to Palm stearin and fatty oils was also withdrawn.
• Further, to reduce input costs and/or to remove duty inversion, and in turn incentivize the domestic value addition in these sectors, customs duty was reduced on certain goods like specified parts for manufacture of electric vehicles, naphtha, ethylene dichloride (EDC), propylene oxide (PO) and raw material for manufacture of artificial kidneys, disposable sterilized dialyzer and micro-barrier of artificial kidney. Moreover, capital goods used for manufacturing of electronic items, namely populated PCBA, camera module of cellular mobile phones, charger/adapter of cellular mobile phone, lithium ion cell, display module, set top box and compact camera module were exempted from BCD.
• To incentivize exports, the export duty on EI leather has been abolished and on Hides, skins and leathers (tanned and untanned, all sorts) the export duty has been reduced.
• Moreover, as part of revenue augmentation exercise, customs duty rates on all precious metals like gold, silver, platinum, waste of precious metal etc. (other than rhodium), gold and silver dore, gold/silver bought by an eligible passenger has been raised by 2.5% (10% to 12.5%).

UNIQUE P
UBLISHERS (I
) PVT. L
TD.
Content developed by UNIQUE PUBLISHERS (I) PVT. LTD.
Economic Survey & Budget72
B. Goods and Services Tax (GST)
• The introduction of GST has been a game changer for the Indian economy as it has replaced multi-layered, complex indirect tax structure with a simple, transparent and technology- driven tax regime. GST has integrated India into a single common market by breaking barriers to inter-state trade and commerce. By eliminating cascading of taxes and reducing transaction costs, it has enhanced ease of doing business and has provided an impetus to ‘Make in India’ campaign.
• However, there are criticisms of the implementation of the GST. There are too many rates, too large a set of commodities has been excluded, and the system is more complex than it needs to be especially in the matter of crediting taxes paid on inputs and providing refunds to exporters. The government has acknowledged many of these problems and they are being addressed on regular basis.
• To bring about further reforms in the indirect tax system, the government is coming up with following measures:
C. A single source fully automated return system:
• Since the inception of Goods and Services Tax (GST), the main intention of the government was to have a robust system for allowing invoice level reconciliation of transactions. It was envisioned in the form of the returns GSTR-1, GSTR-2 and GSTR-3. However, keeping taxpayer convenience and revenue interest, a simplified return in Form GSTR 3B read with GSTR 1 was introduced. The government intended to implement its principle idea of invoice- level reconciliation by following the sequence of returns GSTR-1, GSTR-2 and GSTR-3.
• The New Return System, which is proposed to be introduced w.e.f. 01.04.2020 aims to reduce manual efforts and uses technology extensively, while maintaining a similar working model.It aims to achieve this by having a single main return (GST RET-1/2/3) supported by two annexures (GST ANX-1 & GST ANX-2) that work dynamically on a separate facility. II. Fully electronic refund process through FORM GST RFD-01 and single disbursement:
• The necessary capabilities for making the refund procedure fully electronic, in which all steps of submission and processing shall be undertaken electronically, have been deployed on the common portal with effect from 26.09.2019.
• Further, separate disbursement of refund amounts under different tax heads by different tax authorities, i.e. disbursement of Central tax, Integrated tax and
Compensation Cess by Central tax officers and disbursement of State tax by State tax officers, was causing undue hardship to the refund applicants. In order to facilitate refund applicants on this account, both the sanction order and the corresponding payment order for the sanctioned refund amount, under all tax heads, is issued by one officer only. III. Rationalization of cash ledger:
• With regards to single cash ledger, rationalisation of the ledger in such a manner that earlier 20 heads are merged into 5 major heads is on the anvil. Unified Cash Ledger will be rolled out w.e.f. 01.02.2020.
D. Generation and quoting of Document Identification Number
• In keeping with the Government’s objective of transparency and accountability in indirect tax administration through widespread use of information technology CBIC w.e.f. 08.11.2019 has introduced Document Identification Number (DIN), for all communications sent by its offices to taxpayers and other concerned persons. Presently DIN is applicable for search authorization, summons, arrest memos, inspection notices and letters issued in the course of any enquiry.
E. Sabka Vishwas (Legacy Dispute Settlement) Scheme 2019
• The scheme is a one-time measure for liquidation of past disputes of Central Excise, Service Tax and 26 other indirect tax enactments. It provides an opportunity of voluntary disclosure to non-compliant taxpayers. Cases covered under the scheme are (i) A show cause notice or appeals arising out of a show cause notice pending as on the 30th day of June, 2019 (ii) An amount in arrears (iii) An enquiry, investigation or audit where the amount has been quantified on or before the 30th day of June, 2019 and (iv) A voluntary disclosure.
• The scheme provides that eligible persons shall declare the unpaid tax dues and pay the same in accordance with the provisions of the scheme. The scheme provides for certain immunities including penalty, interest or any other proceedings including prosecution to those persons who pay the declared tax dues. VI. Electronic invoicing
• The Government has proposed to introduce electronic invoicing system (e-invoice) for all B2B invoices in a phased manner. Phase 1 would be voluntary and is proposed to be rolled out from Jan 2020. Further, it is proposed to make e-invoicing mandatory for those having annual turnover of more than 100 crores w.e.f.
UNIQUE P
UBLISHERS (I
) PVT. L
TD.
Content developed by UNIQUE PUBLISHERS (I) PVT. LTD.
Fiscal Developments 73
01.04.2020. This would help in seamless flow of credit and invoice matching as envisaged in the GST regime. Further, it would help in real- time updation of data on the GSTN system and thereby, drastically reducing the time taken in filing the returns.
F. Quick Response (QR) Code
• The Government is proposing to implement the system of invoice with dynamic QR code for all B2C invoices for the taxpayers having annual aggregate turnover of more than 500 crores w.e.f. 01.04.2020. Further, to ensure the smooth roll out, these taxpayers would have an option to voluntarily issue invoices with QR code w.e.f. 01.03.2020.
G. Exemption from filing of Annual Returns for small taxpayers:
• The Government has exempted the small taxpayers having annual aggregate turnover of ` 2 crores and less from filing the annual returns in the format GSTR 9 for the period 2017- 18 and 2018-19 vide Notification No. 47/2019-CT dated 09.10.2019 which provides that if these taxpayers have not filed their annual returns by the due date, it should be considered as deemed to be furnished by due date.
H. Changes with respect to rates on Goods:
• The changes in GST rates during the year 2019 have been made to make the GST rate structure simpler, promote exports, address issues of credit accumulation, resolve disputes for past periods etc. The details are mentioned below: (a) Reduction in the GST rate on supply of goods:
i. 12% to 5% on all electric vehicles ii. 18% to 5% on charger or charging stations for
Electric vehicles iii. 18% to 12% on parts of Slide Fasteners iv. 18% to 5% on Marine Fuel 0.5% (FO) v. 12% to 5% on Wet Grinders (consisting stone
as a grinder) vi. 5% to Nil on Dried tamarind and Plates and
cups made up of leaves/ flowers/bark vii. 3% to 0.25% on cut and polished semi-
precious stones viii. Applicable rate to 5% on specified goods for
petroleum operations undertaken under Hydrocarbon Exploration Licensing Policy (HELP)
(b) Exemptions from GST/IGST on: i. imports of specified defence goods not being
manufactured indigenously (upto 2024) ii. supply of goods and services to FIFA and
other specified persons for organizing the Under-17 Women’s Football World Cup in India.
iii. supply of goods and services to Food and Agriculture Organisation (FAO) for specified projects in India.
(c) GST rates have been increased from:i. 5% to 12% on goods, falling under chapter
86 of tariff like railway wagons, coaches, rolling stock (without refund of accumulated ITC). This is to address the concern of ITC accumulation with suppliers of these goods.
ii. 18% to 28% +12% compensation cess on caffeinated Beverages
(d) Measures for Export Promotion:i. Exemption from GST/IGST: (a). at the time
of import on Silver/Platinum by specified nominated agencies (b). supply of Silver/Platinum by specified nominated agency to exporters for exports of Jewellery. ii. Inclusion of Diamond India Limited (DIL) in the list of nominated agencies eligible for IGST exemption on imports of Gold/ Silver/Platinum so as to supply at Nil GST to Jewellery exporters.
(e) GST concession in certain cases for specific period: i. Exemption to Fishmeal for the period
01.07.17 to 30.09.19. There were doubts as regards taxability of fishmeal in view of the interpretational issues. However, any tax collected for this period shall be required to be deposited.
ii. 12% GST during the period 1.07.2017 to 31.12.2018, on pulley, wheels and other parts (falling under heading 8483) and used as parts of agricultural machinery. GST rate structure on auto and auto parts has been discussed and debated significantly in last few months. Auto sector contributes significantly to GST revenue. Therefore, any change in GST rate of automobiles and parts will have a significant implication to revenue and compensation requirement. The GST rates on auto sectors has been discussed in the GST Council. The Council did not recommend any change. It

UNIQUE P
UBLISHERS (I
) PVT. L
TD.
Content developed by UNIQUE PUBLISHERS (I) PVT. LTD.
Economic Survey & Budget74
was felt that temporary auto slowdown may be attributable to certain other reasons such as lack of credit, base effect (as in last few years auto sector has grown rapidly), and structural changes like adoption of newer fuel standards from BS-IV to BS-VI from April 20 etc.
I. Changes with respect to rates on Services:
• The GST rates on services were fitted into 4 slabs i.e 5%, 12%, 18% and 28%, largely based on the Pre-GST indirect tax incidence both of Centre and States, including the embedded taxes. These rates were recommended by the GST Council in its 14th and 15th meetings held on 18.05.2017 and 03.06.2017 respectively.
• The said GST rate structure was reviewed by the GST Council in its subsequent meetings and certain changes in the rate structure were recommended.
• Notably multiple reliefs from GST taxation have been provided to following categories of services: Agriculture, farming and food processing industry, Education, training and skill development, Pension, social security and old age support, Banking/ Finance/ Insurance services, Government Services, Tourism and hospitality services, Construction and works contract services, Transportation services, Hospitality and tourism industry
• Details of major decisions taken in 2019-20 for GST rates on services is as below: a) Measures taken for Common Man during 2019-20
• In order to boost the demand of real estate sector, with effective from 01.04.2019, GST at effective rate of 1% without ITC on affordable residential apartments and 5% without ITC on residential apartments outside affordable segment has been levied.
• Intermediate tax on development right, such as Transfer of Development Rights, long term lease (premium), Floor Space Index has been exempted to address the cash flow issues in the real estate sector.
• GST rate on hotel accommodation service are redistributed under following tax slabs: `1001 to `7500 12%
• GST on outdoor catering services other than in premises having daily tariff of unit of accommodation of ̀ 7501 has been reduced from 18% to 5% without ITC.
Measures taken for MSMEs during 2019-20
i. To boost the MSME sector, with effect from 01.04.2019, composition scheme for service providers has been introduced. The scheme can be availed by a registered
person having annual turnover upto `50 lakhs in the preceding financial year. The service providers opting
Transaction Value per Unit (`) per day
GST
`1000 and less Nil
`7501 and more 18%
Fiscal Developments for new composition scheme can now pay GST @ 6% and would not be eligible to avail any input tax.
ii. GST rate on supply of job work services in relation to diamonds has been reduced from 5% to 1.5%.
iii. GST rate has been reduced from 18% to 12% on supply of all job work services, which are not currently eligible for the 5% rate (such as machine job work in engineering industry), except supply of job work in relation to bus body building which would remain at 18%.
DISCUSS THE MAJOR MEASURES TAKEN FOR DIRECT TAXES DURING 2019-20 AND OTHER MEASURES?A. Summary of important measures announced in the Union Budget 2019-20: • Reduction in corporate tax rate - The rate of income-
tax for companies with a turnover up to `400 crore in FY 2017-18 has been reduced to 25 per cent as against prevailing rate of 30% for others.
• Provisions of Tax Deducted at Source (TDS) – It has been provided that: deduction of TDS at the rate of 5% is to be done by individual or HUF on payments made to contractors or professionals exceeding `50 lakhs; a deduction at the rate of two per cent is to be done on cash withdrawal in excess of one crore rupees in aggregate during the year from a banking company/cooperative bank/post office unless the persons making the withdrawals have been exempted; while deducting TDS of one percent on the consideration paid for purchase of immovable property, the consideration shall include all charges of the nature of club membership fee, car parking fee, electricity and water facility fees, maintenance fee, advance fee or any other charges of similar nature, which are incidental to transfer of the immovable property; at the time of pay out of any sum under life insurance policy, TDS will be deducted at the rate of five per cent on income component of the pay-out i.e. sum paid out minus amount of premium paid. That in case of non-deduction of TDS on payment made to a non-resident, the deductor will not to be considered as assessee in

UNIQUE P
UBLISHERS (I
) PVT. L
TD.
Content developed by UNIQUE PUBLISHERS (I) PVT. LTD.
Fiscal Developments 75
default, if the non-resident has filed ITR declaring such income before the due date of filing of return.
• Deemed accrual of gift made to a person outside India- It has been provided that certain gifts made by residents to persons outside India on or after 05.07.2019, shall be income deemed to accrue or arise in India subject to provisions of Double Taxation Avoidance Agreement (DTAA) between India and the foreign country.
• Mandatory furnishing of ITR- It has been provided that persons entering into high value transactions such as having a deposit of an amount/aggregate of the amounts exceeding one crore rupees in one or more current account, incurred expenditure of an amount/aggregate of the amounts exceeding two lakh rupees for himself or any other person foreign travel, has paid an electricity bill of an amount/aggregate of the amounts exceeding one lakh rupees or fulfils any other prescribed condition shall be mandatorily required to file ITR.
• Interchangeability of PAN and Aadhaar – It has been provided that in case of a person who does not have PAN but has Aadhaar, PAN will be allotted to such person on the basis of Aadhaar if the person enters into certain reportable transactions. Further, a person who has linked his Aadhaar to his PAN can use Aadhaar instead of his PAN wherever required.
• Pre-filling of return - Pre-filled Income tax Returns (ITR) have been provided to individual taxpayers with income from salary, house property, capital gains from securities, bank interest, dividends and various tax deductions. Information regarding these incomes and deductions are being collected from concerned sources such as banks, mutual funds, EPFO etc. to enable pre-filling. The scope of furnishing of Statement of Financial Transactions (SFT) has been widened by requiring more organisations/institutions to submit information in respect of financial transactions facilitated or undertaken by them.
• Promoting Digital Payments – In order to promote digitalization of the economy it has been provided that certain prescribed electronic modes will also be acceptable forms of electronic modes of payment under the Act. Further, section 269SU has been introduced in the Income-tax Act, 1961(the Act) to provide that with effect from 01.11.2019 every person, carrying on business in which the total sales exceeds ` 50 cr. in the previous financial year, shall be required to provide a facility for accepting payment through the prescribed electronic modes, in addition to the facility for other electronic modes of payment, if any.
• Incentives to International Financial Services Centre (IFSC) - Several direct tax incentives have been provided
to an IFSC such as 100 % profit-linked deduction under section 80-LA of the Act in any ten-year block within a fifteen-year period, exemption from dividend distribution tax from current and accumulated income to companies and mutual funds, exemptions on capital gain to Category-III AIF and interest payment on loan taken from non-residents.
• Incentives to certain Non-banking Financial Companies (NBFCs)- It has been provided that interest on bad or doubtful debts made by RBI-regulated NBFCs will be taxed on receipt basis and deduction on such interest payment will also be allowed to borrowers on payment basis if it is actually paid on or before the due date of furnishing the return of income of the relevant previous year.
• Relaxation in conditions of special taxation regime for offshore funds- Section 9A of the Act which provides for the conditions under which the operation of an offshore fund will not constitute business connection in India has been amended to provide that minimum corpus amount of ` 100 crore can be met by a new fund, either within six months of it being set up or by the end of the financial year, whichever is later and the renumeration paid to the fund manager should be at least equivalent to the amount calculated as per the prescribed manner.
• Promotion of Electric Vehicles – Section 80EEB has been inserted to the Act to provide deduction in respect of interest on loan taken for purchase of an electrical vehicle from any financial institution up to a maximum of ` 1,50,000/- subject to the condition that the loan has been sanctioned during the period beginning on the 01.04.2019 to 31.03.2023.
• Exemption of certain interest income of a non-resident - In order to incentivize low cost foreign borrowings, section 194LC and section 10 of the Act have been amended to provide that the interest income on account of interest payable by an Indian company or a business trust to a non-resident, including a foreign company, in respect of rupee denominated bond issued outside India during the period 17.09.2018 to 31.03.2019 shall be exempt.
• Housing for All- For realization of the goal of affordable housing for all, section 80IBA of the Act has been amended to extend the profit linked deduction up to 31.03.2020 for developers of affordable housing projects. Section 80EEA has also been amended to provide an additional deduction of up to ` 1,50,000/- for interest paid on loans borrowed up to 31.03.2020 for purchase of an affordable house valued up to ` 45 lakh.
• Incentives to National Pension System (NPS) subscribers - The limit of exemption has been increased to 60 per cent of the total amount payable to

UNIQUE P
UBLISHERS (I
) PVT. L
TD.
Content developed by UNIQUE PUBLISHERS (I) PVT. LTD.
Economic Survey & Budget76
the person at the time of closure or his opting out of the NPS scheme. Section 80 CCD has been amended to increase the limit from 10 to 14 per cent of contribution made by the Central Government to the account of its employee. In addition, any amount paid or deposited by a Central Government employee as a contribution to Tier-II account of the new pension scheme shall be eligible for deduction under section 80C subject to the specified conditions.
• Incentives for start-ups – To facilitate ease of doing business in the case of an eligible start-up, it has been provided to allow previous year losses to be carried forward and set off against the income of the previous year if the existing shareholders continue as shareholders in the closely held eligible start-up, irrespective of the change in shareholding pattern. Further the period of exemption of capital gains arising from sale of residential house for investment in start-ups up has been extended up to 31.3.2021.
• Incentives for Category II Alternative Investment Fund (AIF)- In order to facilitate venture capital undertakings, section 56 of the Act has been amended to exempt Category II AIF from payment of tax on the excess amount of consideration received, in case when the aggregate consideration received for issue of shares exceeds the fair market value.
• Incentive for resolution of distressed companies – It has been provided that distressed companies whose Board of Directors have been suspended by the NCLT and temporary directors have been appointed on the recommendation of the Central Government and a change in the shareholding has taken place in accordance with a resolution plan approved by NCLT, then such companies will be allowed to carry forward and set off their losses.
EXEMPTION FROM DEEMING OF FAIR MARKET VALUE OF SHARES FOR CERTAIN TRANSACTIONSIt has been provided that certain class of persons will be exempted from the provisions relating to deeming of fair market value of shares while computing capital gains and deemed gift, in case the parties to the transaction have no control over the determination of price of shares. • Tax on buy-back of shares of listed companies- Section
115QA of the Act has amended to provide that tax on the buy-back of shares of listed companies will be applicable. The Taxation Laws Amendment, Act (2019) (TLAA) amended the date of effectivity to provide that buy-back tax on listed shares will not apply in case of buy-backs announced on or before 05.07.2019.
• Cancellation of registration of exempt institution- It has been provided that a charitable institution/trust which is exempt under the Act, is required to comply with the provisions of any law which is material for its purpose, violation of which will lead to cancellation of the registration.
• Facilitating demerger of Ind-AS compliant companies- Section 2 of the Act has been amended to provide that in case of demerger, the requirement of recording property and liabilities at book value by the resulting company shall not be applicable in a case where the property and liabilities of the undertakings received by it are recorded at a value different from the value appearing in the books of account of the demerged company immediately before the demerger in compliance to the Indian Accounting Standards.
• Modification of return of income filed in consequence to signing of the Advance Pricing Agreement (APA) - Section 92CD of the Act has been amended to clarify that in cases where assessment or reassessment has already been completed and modified return of income has been filed by the tax payer pursuant to signing of APA, the total income is to be computed accordingly by the Assessing Officer.
• Secondary Adjustment- In order to make the secondary adjustment regime more effective and easy to comply with, section 92CE has been amended to, inter alia, provide that the excess money may be repatriated from any of the associated enterprises of the assessee which is not resident in India and in a case where the excess money or part thereof has not been repatriated in time, the assessee will have the option to pay additional income-tax at the rate of eighteen per cent on such excess money or part thereof which will be considered as the final payment of tax and no credit shall be allowed in respect of the amount of tax so paid.
• Concessional rate of Short-term Capital Gains (STCG) tax to certain equity-oriented fund of funds – In order to incentivise fund of funds set up for disinvestment of Central Public Sector Enterprises (CPSEs), the concessional rate of tax for short-term capital gains has been extended in respect of transfer of units of such fund of funds.
• Pass through of losses in cases of Category I and Category II AIF - Section 115UB of the Act has been amended to provide pass through of certain losses in cases of Category I and Category II AIF.
• Definition of the “accounting year” in section 286 – Section 286 of the Act which provides for furnishing of a Country-by Country Report (CbCR) by a parent entity or alternate reporting entity (ARE) resident in India of an international group of which it is a constituent , has

UNIQUE P
UBLISHERS (I
) PVT. L
TD.
Content developed by UNIQUE PUBLISHERS (I) PVT. LTD.
Fiscal Developments 77
been amended to provide that in case when the CbCR is to be furnished by the ARE, the reporting accounting year shall be the one applicable to the parent entity.
• Maintenance of Master File- Section 92D of the Act has been amended to provide that the Master File will be maintained by a constituent entity of an international group resident in India, even when there is not international transaction undertaken by the constituent entity.
• Determination of penalty for under reporting of income – Section 270A of the Act has been amended to provide a manner of computing the quantum of penalty in a case where the person has under-reported income and furnished his return for the first time under section 148.
• Prosecution in case of failure to file return of income- It has been provided that prosecution for failure of filing return of Income shall not be initiated in cases where the total tax payable after adjusting for self-assessment tax and tax collected at source in addition to other taxes already paid does not exceed ` 10,000/-.
• Recovery of tax in pursuance of agreements with foreign countries- It has been provided that in case where a tax defaulter is resident in India or other any country, the relevant tax recovery officer having jurisdiction over that person can recover tax against the properties of the said defaulter (irrespective of whether details of property are available or not) in respective countries.
• Claim of refund- The procedure for claiming of refund has been simplified by amending section 239 of the Act so as to provide that every claim for refund shall be made by furnishing return in accordance with the provisions of section 139 of the Act.
OTHER MEASURES TAKEN DURING THE YEAR 2019-20 • The Taxation Laws (Amendment) Ordinance, 2019
was promulgated on 20.09.2019. Subsequently the Ordinance has been replaced by the TLAA which provides that:
• existing domestic companies may opt for a concessional tax regime at an effective tax rate of 25.17% (22% tax, plus surcharge at 10% and cess at 4%), if they do not avail the specified deductions and incentives and fulfill certain pre-conditions.
• new manufacturing domestic companies set up on or after 01.10.2019 and which commence manufacturing or production by 31.03.2023 may opt to be taxed at an effective tax rate of 17.16% (15% tax, plus surcharge at 10% and cess at 4%), provided that they do not avail of any specified incentives or deductions and fulfill certain pre- conditions.
• the companies opting for the concessional tax regime will not be required to pay MAT.
• for companies which do not opt for the concessional tax regimes, the rate of MAT has been reduced from 18.5% to 15.5%.
• the enhanced surcharge introduced vide the Finance (No.2) Act, 2019 will not apply on the capital gains arising on account of transfer of certain securities and units on which securities transaction tax has been paid. The enhanced surcharge will also not apply to the capital gains income of FPIs arising out of transfer of any security including derivatives, having c Prescribed electronic modes for purpose of section 269SU – It has been notified vide Notification No. 105/2019 dated 30.12.2019 through GSR. 960 (E) published in the Official Gazette, that with effect from 01.01.2020, any debit card powered by Rupay, Unified Payments Interface(UPI)(BHIM-UPI) and Unified Payments Interface Quick Response Code (UPI QR Code)(BHIM-UPI QR Code) shall be the prescribed electronic modes as mandated under section 269SU, for accepting payments by businesses whose total sales exceeds ` 50 crore in the year immediately preceding the financial year.
• Enhanced Depreciation on Automobiles - In order to provide relief to tax payers purchasing new vehicles for the purpose of business or profession, enhanced depreciation of 30 % for motor cars and 45 % for motors buses/lorries has been provided with effect from 23.08.2019 vide Notification no. 69/2019 dated 20.09.2019 through GSR No. 679(E) published in the Official Gazette.
• E-Assessment Scheme-2019- In order to remove the existing human interface and personal interaction prevailing in the assessment procedure, a scheme of faceless assessment in electronic mode involving no human interface has been notified vide Notification No. 61/2019 dated 12.09.2019 through S.O. 3264(E) published in the Official Gazette.
• Simplification of compliance norms for Startups - A Start-up Cell under the aegis of Member (IT&C), CBDT has been constituted to redress grievances and to address various tax related issues in the cases of Start-ups. A consolidated circular clarifying the provisions pertaining to assessment of Startups has also been issued which clarifies that the outstanding income-tax demand relating to additions made relating to angel tax would not be pursued and no communication in respect of outstanding demand would be made with the Start-up entity. Further, other income-tax demand of the Start-ups would not be pursued unless the demand was confirmed by ITAT.
UNIQUE P
UBLISHERS (I
) PVT. L
TD.
Content developed by UNIQUE PUBLISHERS (I) PVT. LTD.
Economic Survey & Budget78
• Document Identification Number (DIN)- Every communication of the department whether it is related to assessment, appeals, investigation, penalty, and rectification among other things issued from 01.10.2019 onwards will mandatorily have a computer-generated unique document identification number (DIN). Any communication such as tax notice, summon or letter issued to any corporate or individual tax payer will be invalid without this number.
• Reduction in Litigation - The monetary thresholds for filing of departmental appeals have been raised from `20 lakh to `50 lakh for appeal before ITAT, from `50 lakh to `1 crore for appeal before High Court and from `1 crore to `2 crore for appeal before Supreme Court.
Pending appeals involving tax effect lower than these thresholds shall also be withdrawn or not pressed by the Department.
• Relaxation in norms for prosecution – It has been provided that prosecution in appropriate cases will be launched only if the quantum of tax evasion is above a minimum threshold. Further, in cases where evasion is below the minimum monetary threshold, launch of prosecution has to be approved by a collegium comprising of two high ranking officers. Further, the 12-month time limit for filing compounding application has been relaxed as a one-time measure, to mitigate hardship in genuine cases.
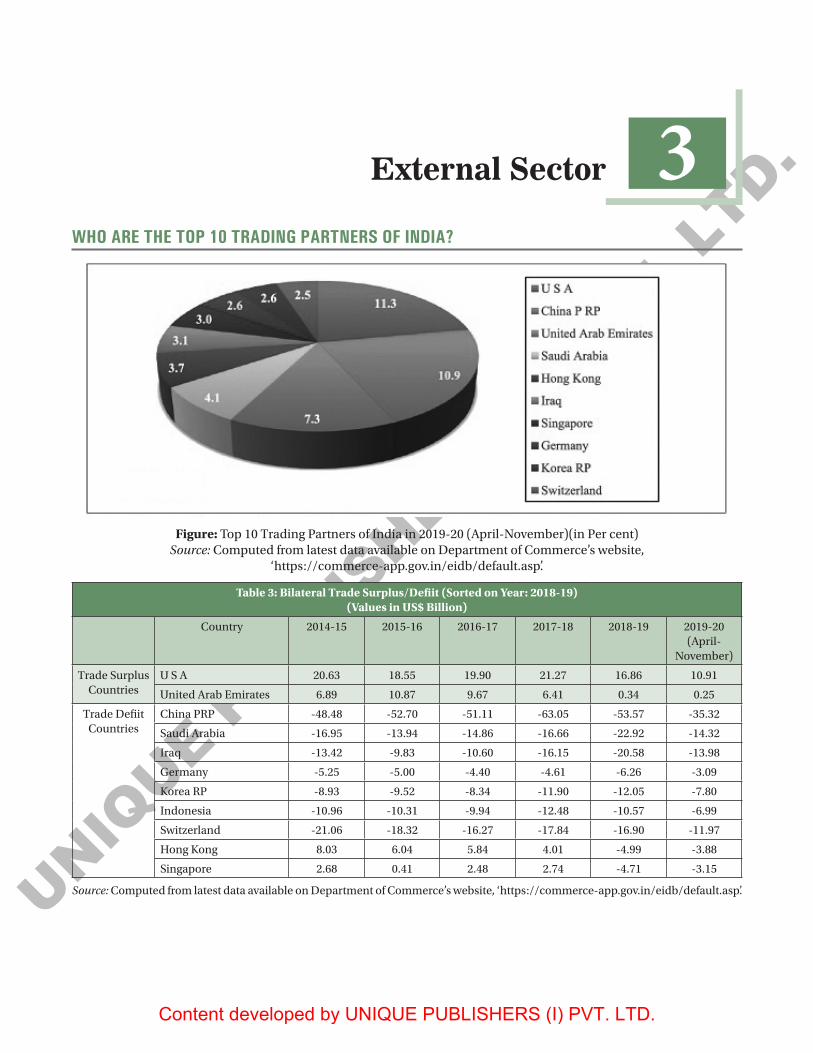
UNIQUE P
UBLISHERS (I
) PVT. L
TD.
Content developed by UNIQUE PUBLISHERS (I) PVT. LTD.
External Sector 79
3External Sector
WHO ARE THE TOP 10 TRADING PARTNERS OF INDIA?
Figure: Top 10 Trading Partners of India in 2019-20 (April-November)(in Per cent)Source: Computed from latest data available on Department of Commerce’s website,
‘https://commerce-app.gov.in/eidb/default.asp’.
Table 3: Bilateral Trade Surplus/Defiit (Sorted on Year: 2018-19)(Values in US$ Billion)
Country 2014-15 2015-16 2016-17 2017-18 2018-19 2019-20(April-
November)
Trade Surplus Countries
U S A 20.63 18.55 19.90 21.27 16.86 10.91
United Arab Emirates 6.89 10.87 9.67 6.41 0.34 0.25
Trade Defiit Countries
China PRP -48.48 -52.70 -51.11 -63.05 -53.57 -35.32
Saudi Arabia -16.95 -13.94 -14.86 -16.66 -22.92 -14.32
Iraq -13.42 -9.83 -10.60 -16.15 -20.58 -13.98
Germany -5.25 -5.00 -4.40 -4.61 -6.26 -3.09
Korea RP -8.93 -9.52 -8.34 -11.90 -12.05 -7.80
Indonesia -10.96 -10.31 -9.94 -12.48 -10.57 -6.99
Switzerland -21.06 -18.32 -16.27 -17.84 -16.90 -11.97
Hong Kong 8.03 6.04 5.84 4.01 -4.99 -3.88
Singapore 2.68 0.41 2.48 2.74 -4.71 -3.15
Source: Computed from latest data available on Department of Commerce’s website, ‘https://commerce-app.gov.in/eidb/default.asp’.
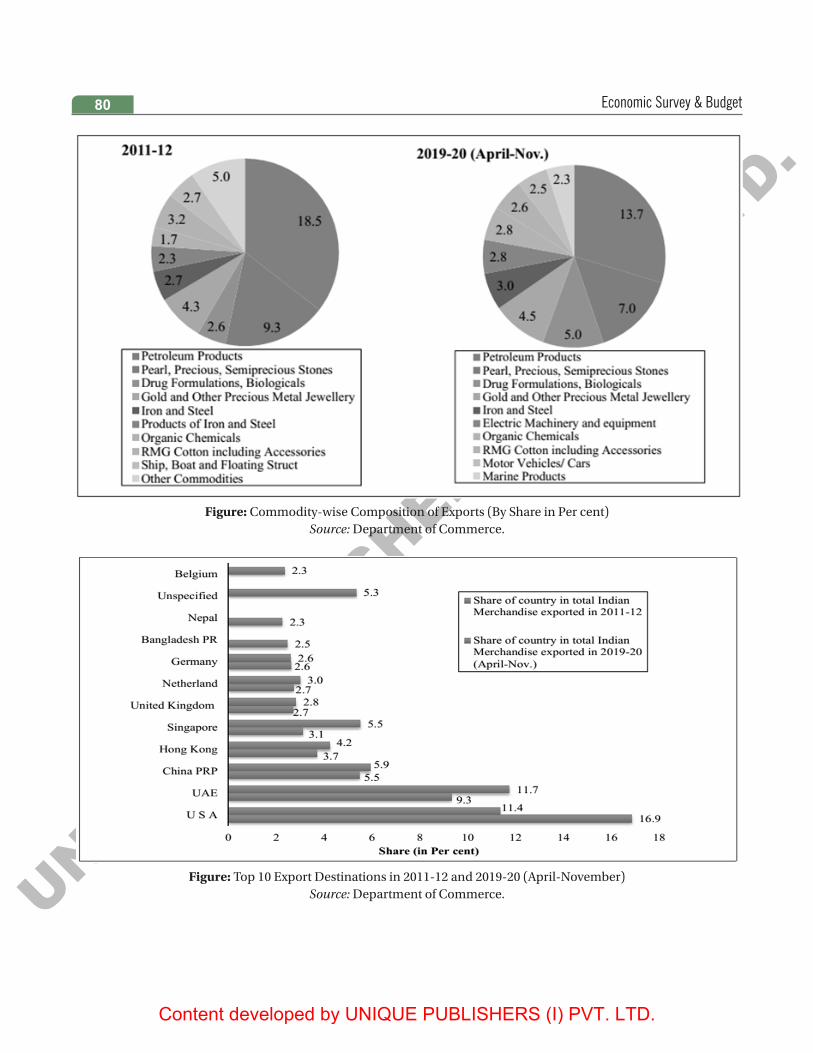
UNIQUE P
UBLISHERS (I
) PVT. L
TD.
Content developed by UNIQUE PUBLISHERS (I) PVT. LTD.
Economic Survey & Budget80
Figure: Commodity-wise Composition of Exports (By Share in Per cent)Source: Department of Commerce.
Figure: Top 10 Export Destinations in 2011-12 and 2019-20 (April-November)Source: Department of Commerce.
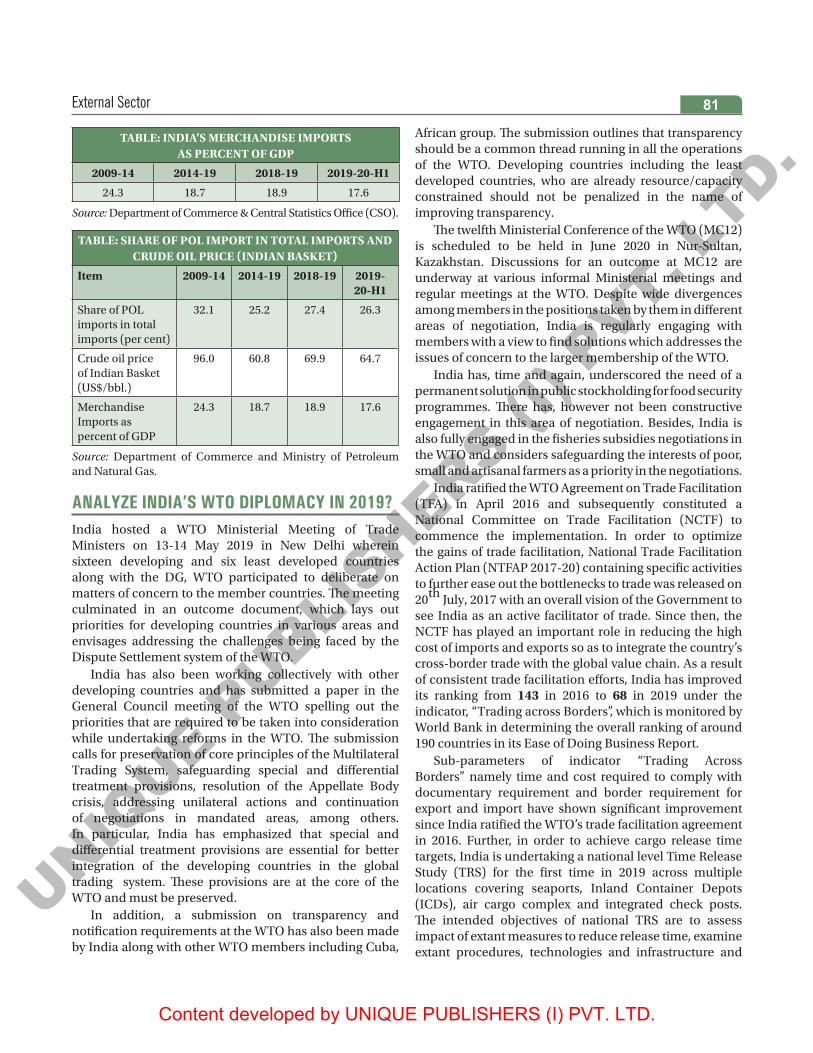
UNIQUE P
UBLISHERS (I
) PVT. L
TD.
Content developed by UNIQUE PUBLISHERS (I) PVT. LTD.
External Sector 81
TABLE: INDIA’S MERCHANDISE IMPORTS AS PERCENT OF GDP
2009-14 2014-19 2018-19 2019-20-H1
24.3 18.7 18.9 17.6
Source: Department of Commerce & Central Statistics Office (CSO).
TABLE: SHARE OF POL IMPORT IN TOTAL IMPORTS AND CRUDE OIL PRICE (INDIAN BASKET)
Item 2009-14 2014-19 2018-19 2019-20-H1
Share of POL imports in total imports (per cent)
32.1 25.2 27.4 26.3
Crude oil price of Indian Basket (US$/bbl.)
96.0 60.8 69.9 64.7
Merchandise Imports as percent of GDP
24.3 18.7 18.9 17.6
Source: Department of Commerce and Ministry of Petroleum and Natural Gas.
ANALYZE INDIA’S WTO DIPLOMACY IN 2019?India hosted a WTO Ministerial Meeting of Trade Ministers on 13-14 May 2019 in New Delhi wherein sixteen developing and six least developed countries along with the DG, WTO participated to deliberate on matters of concern to the member countries. The meeting culminated in an outcome document, which lays out priorities for developing countries in various areas and envisages addressing the challenges being faced by the Dispute Settlement system of the WTO.
India has also been working collectively with other developing countries and has submitted a paper in the General Council meeting of the WTO spelling out the priorities that are required to be taken into consideration while undertaking reforms in the WTO. The submission calls for preservation of core principles of the Multilateral Trading System, safeguarding special and differential treatment provisions, resolution of the Appellate Body crisis, addressing unilateral actions and continuation of negotiations in mandated areas, among others. In particular, India has emphasized that special and differential treatment provisions are essential for better integration of the developing countries in the global trading system. These provisions are at the core of the WTO and must be preserved.
In addition, a submission on transparency and notification requirements at the WTO has also been made by India along with other WTO members including Cuba,
African group. The submission outlines that transparency should be a common thread running in all the operations of the WTO. Developing countries including the least developed countries, who are already resource/capacity constrained should not be penalized in the name of improving transparency.
The twelfth Ministerial Conference of the WTO (MC12) is scheduled to be held in June 2020 in Nur-Sultan, Kazakhstan. Discussions for an outcome at MC12 are underway at various informal Ministerial meetings and regular meetings at the WTO. Despite wide divergences among members in the positions taken by them in different areas of negotiation, India is regularly engaging with members with a view to find solutions which addresses the issues of concern to the larger membership of the WTO.
India has, time and again, underscored the need of a permanent solution in public stockholding for food security programmes. There has, however not been constructive engagement in this area of negotiation. Besides, India is also fully engaged in the fisheries subsidies negotiations in the WTO and considers safeguarding the interests of poor, small and artisanal farmers as a priority in the negotiations.
India ratified the WTO Agreement on Trade Facilitation (TFA) in April 2016 and subsequently constituted a National Committee on Trade Facilitation (NCTF) to commence the implementation. In order to optimize the gains of trade facilitation, National Trade Facilitation Action Plan (NTFAP 2017-20) containing specific activities to further ease out the bottlenecks to trade was released on 20th July, 2017 with an overall vision of the Government to see India as an active facilitator of trade. Since then, the NCTF has played an important role in reducing the high cost of imports and exports so as to integrate the country’s cross-border trade with the global value chain. As a result of consistent trade facilitation efforts, India has improved its ranking from 143 in 2016 to 68 in 2019 under the indicator, “Trading across Borders”, which is monitored by World Bank in determining the overall ranking of around 190 countries in its Ease of Doing Business Report.
Sub-parameters of indicator “Trading Across Borders” namely time and cost required to comply with documentary requirement and border requirement for export and import have shown significant improvement since India ratified the WTO’s trade facilitation agreement in 2016. Further, in order to achieve cargo release time targets, India is undertaking a national level Time Release Study (TRS) for the first time in 2019 across multiple locations covering seaports, Inland Container Depots (ICDs), air cargo complex and integrated check posts. The intended objectives of national TRS are to assess impact of extant measures to reduce release time, examine extant procedures, technologies and infrastructure and
UNIQUE P
UBLISHERS (I
) PVT. L
TD.
Content developed by UNIQUE PUBLISHERS (I) PVT. LTD.
Economic Survey & Budget82
administrative concerns and thereby identify manual processes and physical touch points, bottlenecks and inefficiencies (by stakeholders) to bring down the overall release time.
The key initiatives contributing to reduction in overall cargo release time and consequent improvement in ranking of India under the indicator “Trading across Borders” include the following: • Enablement of Single Window Interface for Facilitating
Trade (SWIFT) on Customs Portal,• Enablement of post clearance audit,• Self e-sealing through RFID tag by trusted exporters,• Requirement of only 3 mandatory documents for
import/export,• Introduction of ‘E-Sanchit’ for lodging supporting
documents online,• Tracking of imported cargo clearance time through
Indian Customs Ease of Doing Business Dashboard (ICEDASH),
• 24X7 online customs clearance facility,• Elimination of merchant overtime fees,• Launch of Atithi mobile App for international
passengers and• Elimination of merchant overtime fees and installation
of drive through scanners.New schemes like Direct Port Delivery (DPD) for
imports and Direct Port Entry (DPE) for exports are facilitating faster clearances at the ports. Up-gradation of port infrastructure, putting up new scanners at ports, development of robust risk based measures and introduction of new Port Community System at all major ports, have led to improvement in average dwell time at sea ports. New initiatives like ‘Turant’ customs will make customs clearance faster and faceless.
In a recently released UN global survey on digital and sustainable trade facilitation 2019, India has not only improved its overall trade facilitation score from 69 per cent to 80 per cent but also outperformed other countries in the Asia-pacific and South and South-west Asia region.
WHAT IS THE PERFORMANCE OF INDIA WITH RESPECT TO TRADE LOGISTICS?According to World Bank’s Logistics Performance Index, India ranks 44th in 2018 globally, up from 54th rank in 2014. The top 5 countries in the world in Logistics Performance Index (LPI) are shown in Table 15, along with India, with their rankings in LPI and each separate indicator.
To improve trade logistics, Government is building infrastructure through ambitious projects like the Bharatmala, Sagarmala and the Dedicated Freight Corridors. Inland waterways are being developed as
a cost effective means of transportation. Multimodal logistic parks are being created to promote multimodal transportation. These are part of the infrastructure project pipeline worth `102 lakh crore whose details have been released by government in December, 2019. The infrastructure projects will be created over the next five years.
The Government of India is working on a National Logistics Policy and a National Logistics Action Plan. Major commodities have been identified and will be encouraged to be transported by the cheapest mode. Movement by other modes like railways, coastal, waterways and slurry pipelines are being promoted through infrastructure and policy interventions. Fast-tags have been made mandatory to cut delays at toll plazas. Qualification packs have been created to improve skilling in the sector. Apprentice programmes are being promoted through industry participation. Standards are being developed to bring in efficiency.
The government’s focus going forward is to bring down the cost of logistics which will boost the competitiveness of our manufacturing sector. Driving logistics cost down from estimated current levels of 13-14 per cent of GDP to 10 per cent in line with best-in class global standards is essential for India to become globally competitive.
HOW HAVE FDI AND FPI PERFORMED IN THE YEAR OF 2019?Net FDI in the first eight months of 2019-20 stood at US$ 24.4 billion. An increase in net FDI improves the BoP position. The impressive improvement in BoP position from March, 2014 to March, 2019 is mainly attributed to almost doubling of net FDI into the country from 2009-14 to 2014-19. Net FDI inflows have continued to be buoyant in 2019- 20 attracting in the first half itself an amount more than 50 per cent of the previous year level. Continuous liberalization of FDI guidelines has been responsible for rising inflows of foreign investment into the country.
An increase in net FDI also provides a more stable source of funding the CAD and in that sense provides greater stability to the improvement in BoP position as compared to other capital inflows. Net FDI’s financing of CAD in the first half of 2019-20 has been higher than the same period of 2018-19
Net FPI in the first eight months of 2019- 20 stood at US$ 12.6 billion. An increase in net FPI flows improves the BoP position and arises on account of cross-border transactions involving debt or equity securities, other than those included in direct investment or reserve assets. However, FPI is often referred to as “hot money” because of its tendency to flee at the first signs of trouble in an
UNIQUE P
UBLISHERS (I
) PVT. L
TD.
Content developed by UNIQUE PUBLISHERS (I) PVT. LTD.
External Sector 83
economy or improvement in investment attractiveness elsewhere in the world, particularly in the US at the hands of the Federal Reserve. In relation to net FDI, dependence on net FPI to finance the CAD was less in 2014-19 at 17.1 per cent as compared to 45.6 per cent in 2009- 14. In 2018-19, there was a net portfolio outflow from the country that was seen as weakening of confidence of investors in India’s economy. However, portfolio flows in H1 of 2019-20 have turned positive which could be attributed to the dovish monetary policy stance of the US, enhanced liquidity in global markets and reinforced growth prospects for India post budget announcements and reform measures .
The debt-equity composition of net FPI matters in terms of impacting servicing of external debt. A lower debt component reduces the debt servicing burden and improves the BoP position. In recent quarters until Q1 of 2019-20, a change in the composition of FPI flows
towards more non debt creating equity and investment funds is discernible. However, on the flip side increase in investment in debt instruments is important to deepen the debt market in the country.
A report on assessment of India’s BoP in 2018-19 published by RBI in November, 2019 stated that the highest FPI outflow in the debt segment took place from the sovereign sector (i.e., G-Secs). In this regard the recent policy initiatives of enhancing investment limits of FPIs in government securities and easing of minimum residual maturity are likely to boost FPI flows. In April, 2018, RBI revised the limit for FPI investment in central government securities (G-secs) wherein the limit would be increased by 0.5 per cent each year to 5.5 per cent of outstanding stock of securities in 2018-19 and 6 per cent of outstanding stock of securities in 2019-20. Based on latest data available, the utilization rate of FPI limits in G-secs increased from 68.6 per cent in March 2019 to 75.6 per cent in December, 2019.

UNIQUE P
UBLISHERS (I
) PVT. L
TD.
Content developed by UNIQUE PUBLISHERS (I) PVT. LTD.
Economic Survey & Budget84
DISCUSS THE MAJOR POLICY CHANGES RELATED TO BANKING REGULATION IN INDIA?
BOX: MAJOR POLICY CHANGES RELATED TO BANKING REGULATIONS
1. Permitting One-time Restructuring of Existing Loans to MSMEs Classified as ‘Standard’ without a Downgrade in the Asset ClassificationA one-time restructuring of existing loans to MSMEs that were in default but with assct classification as ‘standard’ as on January |, 2019, was permitted without an asset classification downgrade. The scheme is available to MSMEs qualifying with objective criteria including, inter alia, a cap of & 25 crore on the aggregate exposure of banks and NBFCs as on January |, 2019. The restructuring will have to be implemented by March 31, 2020 and an additional provision of 5 per cent will have to be maintained in respect of accounts restructured under this scheme.
2. Bank Lending to Infrastructure Investment Trusts (InvITs)It was decided to permit banks to lend to InvITs, subject to certain safeguards which include a Board approved policy on exposures to InvITs, assessment of all critical parameters including sufficiency of cash flows at InvIT level, overall leverage of the InvITs and the underlying SPVs to be within the leverage permitted under the Board approved policy, monitoring of performance of the underlying SPVs on an ongoing basis and lending to only those InvITs where none of the underlying SPVs are facing ‘financial difficulty’.
3. Resolution of Stressed AssetsReserve Bank released the new Prudential Framework for Resolution of Stressed Assets, The fundamental principles underlying the regulatory approach for resolution of stressed assets are as under:(i) Early recognition and reporting of default in respect of large borrowers by banks, Fls and NBFCs;(ii) Complete discretion to lenders with regard to design and implementation of resolution plans, subject to the specified timeline
and independent credit evaluation;(iii) Harmonised framework for resolution of stressed assets, in supersession of all earlier resolution schemes (S4A, SDR, 5/25,
etc.);(iv) Asystem of disincentives in the form of additional provisioning for delay in implementation of resolution plan or initiation of
insolvency procecdings;(v) Withdrawal of asset classification dispensations on restructuring. Future upgrades to be contingent on a meaningful
demonstration of satisfactory performance for a reasonable period;(vi) For the purpose of restructuring, the definition of ‘financial difficulty’ to be aligned with the guidelines issued by the Basel
Committee on Banking Supervision; and,(vii) Signing of inter-creditor agreement (ICA) by all lenders to be mandatory, which will provide for a majority decision making
criteria,
4. External Benchmark Based LendingAs the transmission of policy rate changes to the lending rate of the banks under the current MCLR framework was not satisfactory, guidelines were issued to banks on September 4, 2019 mandating banks wef October f, 2019 to link all new floating rate personal or retail loans and floating rate loans to MSE to an external benchmark as under:(a) Benchmarks: The banks are free to choose one of the several benchmarks from Repo Rate, 3 Months or 6 Months Treasury
Bill yield and any other benchmark market interest rate published by the Financial Benchmark India Private Ltd (FBIL).(b) Spread: Banks are free to decide the spread over the external benchmark. However, credit risk premium may undergo change
only when borrower’s credit assessment undergoes a substantial change, as agreed upon in the loan contract. Further, other components of spread including operating cost could be altered once in three years,
(c) Reset of interest rates: The interest rate under external benchmark shall be resct at teast once in three months.
4 Monetary Management and Financial Intermediation

UNIQUE P
UBLISHERS (I
) PVT. L
TD.
Content developed by UNIQUE PUBLISHERS (I) PVT. LTD.
Monetary Management and Financial Intermediation 85
5. Revised guidelines on compensation of whole time directiors/chief executive officers/ material risk takers and Control Function staff for all Private Sector Banks (including LABs, PBs, WOS, and foreign banks) to be effective from April 01, 2020:(a) Substantial portion of compensation i.e. at least 50 per cent should be variable (Earlier no threshold was prescribed)(b) Employee Stock Ownership Plans (ESOPs) to be included as a component of variable pay as share-linked instrument. (Earlier
excluded)(c) Variable Pay is to be capped at 300 per cent of Fixed Pay (Earlier Variable Pay was capped at 70 per cent of Fixed pay but did
not include ESOPs/share-linked instrument)(d) Minimum 50 per cent of Variable pay is to be via non-cash component (such as ESOPs), (Earlier no specific proportion was
prescribed)(e) Mandating a compulsory deferral mechanism for variable pay, regardless of quantum of variable pay (Earlier it was mandated
only beyond a specified threshold)(f) Mandating imposition of malus in case of divergence in NPA/provisioning beyond RBI prescribed threshold for public
disclosure. (New addition)(g) Quantitative and Qualitative criteria are being prescribed for indentification of Material Risk Takers (New addition).
DISCUSS THE CHANGES IN THE NBFC SECTOR?
BOX: MAJOR POLICY CHANGES RELATED TO NON-BANKING FINANCIAL REGULATION /SUPERVISION
In the aftermath of the IL&FS event, several measures were undertaken to strengthen the regulation and supervision of the NBFC sector, as sct out below.1. Amendment to the RBI Act, 1934 to Strengthen the Regulation and Supervision of the NBFC Sector vesting additional powers with the Reserve Bank to:a. Raise the minimum net owned fund requirement for NBFCs up to & 100 crore (from existing & 2 crore);b. Remove Director of an NBFC from the office (other than Government companics);c. Supersede the Board of Directors of NBFC (other than Government companies);d. Remove or debar statutory auditor from exercising the dutics as auditor of any of the RBI regulated entities:e. Resolve NBFCs through amalgamation, reconstruction, splitting the viable and non-viable businesses in separate units;f. Direct an NBFC to annex its financial statements such as statements and information relating to the business or affairs of any
group company of the NBFC and to cause an inspection or audit to be made of any group company of an NBFC and its books of account.
g. To increase the quantum of penalties that the Reserve Bank may impose.
2. Eligible NBFC-ND-SIs as Authorised Dealers (ADs) - Category II: The Reserve Bank allowed non-deposit taking systemically important NBFC-ICCs to obtain AD-Category II license, effective April 16, 2019, in order to increase accessibility and efficiency of the services extended to the members of the public for their day-to-day non-trade current account transactions. Eligible NBFCs will have to satisfy certain conditions and scek specific permission from the Reserve Bank.
3. Liquidity Risk Framework for NBFCs: All non-deposit taking NBFCs with assct size of Rs. 100 crore and above, systemically important Core Investment Companics and all deposit taking NBFCs irrespective of their asset size, shall adhere to the set of liquidity risk management guidelines:(a) Granular maturity buckets and tolerance limits,(b) Liquidity risk monitoring tools/ metrics to capture strains in liquidity position,(c) Adoption of “stock” approach to liquidity, in addition to structural & dynamic liquidity,(d) Extension of principles of sound liquidity risk management to aspects like off-balance sheet and contingent liabilities, intra-
group fund transfers, etc., and (e) Introduction of Liquidity Coverage Ratio (LCR) for all non deposit taking NBFCs (excluding Core Investment Companies, Non-
operating Financial Holding Companics Standalone Primary Dealers and Type-1 NBFCs) with asset size Rs. 5,000 crore and above and all deposit taking NBECs irrespective of size to maintain sufficient High Quality Liquid Assets (HQLA) to survive any acute liquidity stress. The LCR will be progressively increased to 100 per cent by December 1, 2024,
4. Review of Limits for NBFC-Micro Finance Institutions (NBFC-MF1s): The houschold income limits for borrowers of NBFC-MFIs have been raised from the current level of Rs. 1,00,000 for rural areas and Rs. 160,000 for urban/semi urban areas to Rs. 1,25,000 and Rs. 2,00,000, respectively, along with increase in lending limit from Rs. 1,00,000 to Rs. 1,25,000 per eligible borrower effective November 8, 2019.Housing Finance Companies: The regulation of Housing Finance Companies (HFCs) has been transferred by Government of India from National Housing Bank (NHB) to the RBI with effect from August 9,2019
UNIQUE P
UBLISHERS (I
) PVT. L
TD.
Content developed by UNIQUE PUBLISHERS (I) PVT. LTD.
Economic Survey & Budget86
WHAT IS A BILATERAL NETTING AGREEMENT?
BOX: BENEFITS OF ENABLING BILATERAL NETTING FOR FINANCIAL CONTRACTS IN INDIA
A bilateral netting agreement cnables two counterparties in a financial contract to offset claims against cach other to determine a single net payment obligation due from one counterparty to the other. Similarly, a muftilateral netting agreement allows counterparties to offset claims against cach other through a Central Counterparty (CCP) in a clearing house. Under instances of default, including insolvency, dissolution or winding-up of counterparty, close-out netting enables the non-defaulting counterparty to prematurely terminate the financial contract and sum the mutual claims to determine a single net amount duc from one counterparty to the other.
At present, there are legal provisions for multilateral close-out netting for financial transactions intermediated through a CCP, such as the Clearing Corporation of India Limited (CCIL), under the Payment and Settlement Systems (Amendment) Act (2015), Wowever, bilateral netting for financial contracts is not permitted in India. This negatively impacts banks and other financial market participants via several channels:
(i) Inthe absence of bilateral netting, RBI’s regulations require banks to measure credit exposure to a counterparty for OTC derivative contracts based on gross marked-to-market (MTM) exposure instead of net MTM exposure. This increases credit risk for financial market participants, especially in the event of insolvency of a counterparty, which could then raise systemic risk.
(ii) In implementing the Basel III regulatory reforms’, RBI requires banks to calculate regulatory capital requirements for OTC derivative transactions based on gross MTM exposure to a counterparty instcad of net MTM exposure. This forces banks to hold more regulatory capital than what would be required under bilateral netting. According to RBI estimates, bilateral netting arrangcmcnts could have helped 31 major banks participating in India’s OTC derivativcs markct savc about Rs. 22.58 billion in regulatory capital during FY2017-18.
(iii) The RBI, currcnt proposal for implementing global OTC derivatives markct reforms. rcquires financial institutions to exchange marginlcollatcral) with countaparties for OTC derivative transactions based on gnus counterparty exposure instead of ner countcrparty exposure. Implemcmation of this reform going forward would force banks to divert more capital towards collatcral requirements than what would be required if bilateral netting is permitted. According to CCIL estimates. banks and primary dealers would have had to hold about Rs.436.98 billion of additional capital as margin” as of March 2018 if margin rcgulations wcrc implemented.
(iv) Higher regulatory capital burden makes trading activity for financial contracts morc capital intensivc, translating into higher cost of transaction. This discourages market panicipation by banks and primary dcalcrs. affectthg market liquidity and market development in terms of depth. This is one of the major thetors hindering activity in India’s Credit Default Swaps (CDS) market (RBI Report of Working Group on Development of Corporate Bond Market in India, 2016).
Global regulatory bodies such as the Financial Stability Board (FSB) and the Basel Committee on Banking Supervision have supported the use of close-out netting due to its positive impact on financial stability. Al prcsent, major jurisdictions such as the U.S. U.K., Australia. Canada. Japan. France, Gemiany, Singapore and Malaysia have legal provisions in place for netting agrecmcnts.
Hence. establishing a legal framework for bilatcral close-out netting in India would help: (a) reduce credit risk and regulatory capital burden for banks, freeing up capital for other productive uses; (b) reduce hedging costs and liquidity needs for banks. prim, dealers and othcr markct-makers, thercby cncouraging participation in the OTC dcrivativcs markct to hcdgc against risk. Incrcased market participation in thc CDS market would also providc an impctus for corporatc bond markct development; (c) establish an efficient recovery mechanism for financial contracts under instances of default by a counterpart, and (d) adhere to India, G20 and FSB commitment to implement global regulatory refonns in the OTC derivatives market.
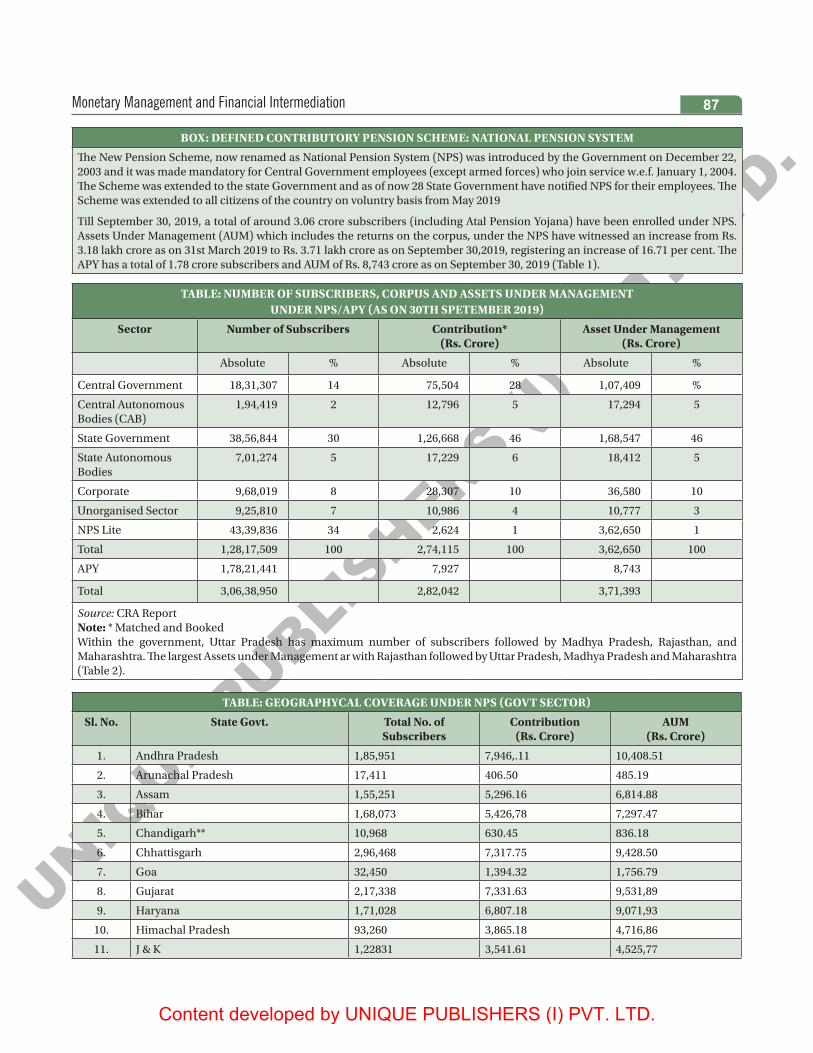
UNIQUE P
UBLISHERS (I
) PVT. L
TD.
Content developed by UNIQUE PUBLISHERS (I) PVT. LTD.
Monetary Management and Financial Intermediation 87
BOX: DEFINED CONTRIBUTORY PENSION SCHEME: NATIONAL PENSION SYSTEM
The New Pension Scheme, now renamed as National Pension System (NPS) was introduced by the Government on December 22, 2003 and it was made mandatory for Central Government employees (except armed forces) who join service w.e.f. January 1, 2004. The Scheme was extended to the state Government and as of now 28 State Government have notified NPS for their employees. The Scheme was extended to all citizens of the country on voluntry basis from May 2019
Till September 30, 2019, a total of around 3.06 crore subscribers (including Atal Pension Yojana) have been enrolled under NPS. Assets Under Management (AUM) which includes the returns on the corpus, under the NPS have witnessed an increase from Rs. 3.18 lakh crore as on 31st March 2019 to Rs. 3.71 lakh crore as on September 30,2019, registering an increase of 16.71 per cent. The APY has a total of 1.78 crore subscribers and AUM of Rs. 8,743 crore as on September 30, 2019 (Table 1).
TABLE: NUMBER OF SUBSCRIBERS, CORPUS AND ASSETS UNDER MANAGEMENT UNDER NPS/APY (AS ON 30TH SPETEMBER 2019)
Sector Number of Subscribers Contribution*(Rs. Crore)
Asset Under Management(Rs. Crore)
Absolute % Absolute % Absolute %
Central Government 18,31,307 14 75,504 28 1,07,409 %
Central Autonomous Bodies (CAB)
1,94,419 2 12,796 5 17,294 5
State Government 38,56,844 30 1,26,668 46 1,68,547 46
State Autonomous Bodies
7,01,274 5 17,229 6 18,412 5
Corporate 9,68,019 8 28,307 10 36,580 10
Unorganised Sector 9,25,810 7 10,986 4 10,777 3
NPS Lite 43,39,836 34 2,624 1 3,62,650 1
Total 1,28,17,509 100 2,74,115 100 3,62,650 100
APY 1,78,21,441 7,927 8,743
Total 3,06,38,950 2,82,042 3,71,393
Source: CRA ReportNote: * Matched and BookedWithin the government, Uttar Pradesh has maximum number of subscribers followed by Madhya Pradesh, Rajasthan, and Maharashtra. The largest Assets under Management ar with Rajasthan followed by Uttar Pradesh, Madhya Pradesh and Maharashtra (Table 2).
TABLE: GEOGRAPHYCAL COVERAGE UNDER NPS (GOVT SECTOR)
Sl. No. State Govt. Total No. ofSubscribers
Contribution(Rs. Crore)
AUM(Rs. Crore)
1. Andhra Pradesh 1,85,951 7,946,.11 10,408.51
2. Arunachal Pradesh 17,411 406.50 485.19
3. Assam 1,55,251 5,296.16 6,814.88
4. Bihar 1,68,073 5,426,78 7,297.47
5. Chandigarh** 10,968 630.45 836.18
6. Chhattisgarh 2,96,468 7,317.75 9,428.50
7. Goa 32,450 1,394.32 1,756.79
8. Gujarat 2,17,338 7,331.63 9,531,89
9. Haryana 1,71,028 6,807.18 9,071,93
10. Himachal Pradesh 93,260 3,865.18 4,716,86
11. J & K 1,22831 3,541.61 4,525,77
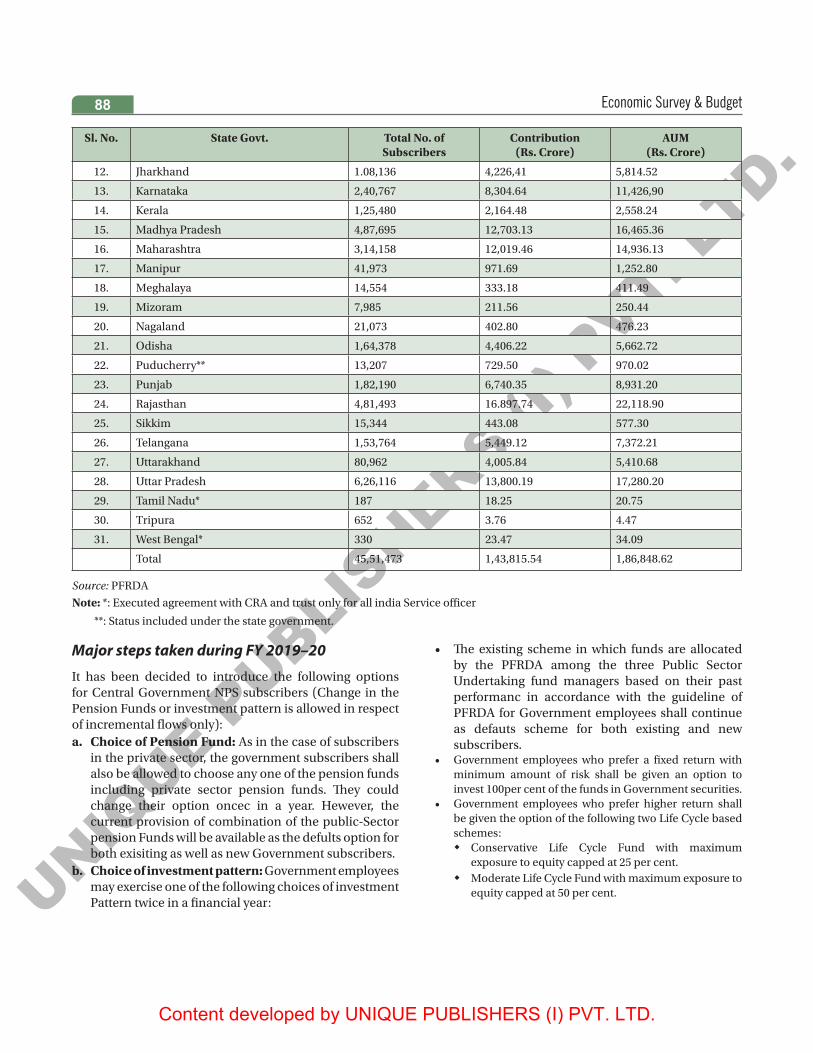
UNIQUE P
UBLISHERS (I
) PVT. L
TD.
Content developed by UNIQUE PUBLISHERS (I) PVT. LTD.
Economic Survey & Budget88
Sl. No. State Govt. Total No. ofSubscribers
Contribution(Rs. Crore)
AUM(Rs. Crore)
12. Jharkhand 1.08,136 4,226,41 5,814.52
13. Karnataka 2,40,767 8,304.64 11,426,90
14. Kerala 1,25,480 2,164.48 2,558.24
15. Madhya Pradesh 4,87,695 12,703.13 16,465.36
16. Maharashtra 3,14,158 12,019.46 14,936.13
17. Manipur 41,973 971.69 1,252.80
18. Meghalaya 14,554 333.18 411.49
19. Mizoram 7,985 211.56 250.44
20. Nagaland 21,073 402.80 476.23
21. Odisha 1,64,378 4,406.22 5,662.72
22. Puducherry** 13,207 729.50 970.02
23. Punjab 1,82,190 6,740.35 8,931.20
24. Rajasthan 4,81,493 16.897.74 22,118.90
25. Sikkim 15,344 443.08 577.30
26. Telangana 1,53,764 5,449.12 7,372.21
27. Uttarakhand 80,962 4,005.84 5,410.68
28. Uttar Pradesh 6,26,116 13,800.19 17,280.20
29. Tamil Nadu* 187 18.25 20.75
30. Tripura 652 3.76 4.47
31. West Bengal* 330 23.47 34.09
Total 45,51,473 1,43,815.54 1,86,848.62
Source: PFRDA
Note: *: Executed agreement with CRA and trust only for all india Service officer
**: Status included under the state government.
• The existing scheme in which funds are allocated by the PFRDA among the three Public Sector Undertaking fund managers based on their past performanc in accordance with the guideline of PFRDA for Government employees shall continue as defauts scheme for both existing and new subscribers.
• Government employees who prefer a fixed return with minimum amount of risk shall be given an option to invest 100per cent of the funds in Government securities.
• Government employees who prefer higher return shall be given the option of the following two Life Cycle based schemes:
� Conservative Life Cycle Fund with maximum exposure to equity capped at 25 per cent.
� Moderate Life Cycle Fund with maximum exposure to equity capped at 50 per cent.
Major steps taken during FY 2019–20
It has been decided to introduce the following options for Central Government NPS subscribers (Change in the Pension Funds or investment pattern is allowed in respect of incremental flows only):a. Choice of Pension Fund: As in the case of subscribers
in the private sector, the government subscribers shall also be allowed to choose any one of the pension funds including private sector pension funds. They could change their option oncec in a year. Hewever, the current provision of combination of the public-Sector pension Funds will be available as the defults option for both exisiting as well as new Government subscribers.
b. Choice of investment pattern: Government employees may exercise one of the following choices of investment Pattern twice in a financial year:

UNIQUE P
UBLISHERS (I
) PVT. L
TD.
Content developed by UNIQUE PUBLISHERS (I) PVT. LTD.
Prices and Inflation 89
DISCUSS THE CURRENT TRENDS IN INFLATION?Headline inflation based on CPI-C has been sliding on a downward path since 2014. The average CPI-C headline inflation, which was 5.9 per cent in 2014- 15, has fallen continuously to around 3.4 per cent in 2018-19. This has been led by a drastic fall in food inflation, which has fallen from 6.4 per cent in 2014-15 to 0.1 per cent in 2018-19. In 2019-20, there has been slight uptick in the headline and food inflation numbers since August, 2019. Overall, CPI -C headline inflation in December, 2019 stood at 7.4 per cent, while CPI-food inflation increased to 14.1 per cent mainly driven by the rise in vegetable prices. Core (non-food non-fuel) inflation has also increased to 3.8 per cent in December, 2019.
5Prices and Inflation
During 2019-20, WPI based inflation has been on a continuous fall declining from 3.2 per cent in April 2019 to 0.6 per cent in November 2019, but increased to 2.6 per cent in December 2019. Food index which declined on an annual basis between 2017-18 and 2018-19, saw an uptick during the current financial year (April-December, 2019).
Since July 2018, CPI-Urban inflation, has been consistently above CPI-Rural inflation. This is in contrast to earlier experience where rural inflation has been mostly higher than urban inflation. The divergence has been mainly on account of the differential rates of food inflation between rural and urban areas witnessed during this period. In 2019-20, there has been sudden change in the trend. Since July 2019, urban areas have registered much higher food inflation when compared to rural areas. Divergence in rural-urban food inflation in 2019-20 was mainly led by cereals, eggs, fruits, vegetables etc.
Figure: Rural Urban CPI food infltionSource: NSO.

UNIQUE P
UBLISHERS (I
) PVT. L
TD.
Content developed by UNIQUE PUBLISHERS (I) PVT. LTD.
Economic Survey & Budget90
Figure (a): CPI infltion rate of cereals Figure (b): CPI infltion rate of vegetables
Figure (c): CPI infltion rate of fruits
Figure (d): CPI infltion rate of eggsSource: NSO.
Figure: Variability in rural and urban infltion across States in 2019-20 (April-December)Source: NSO.
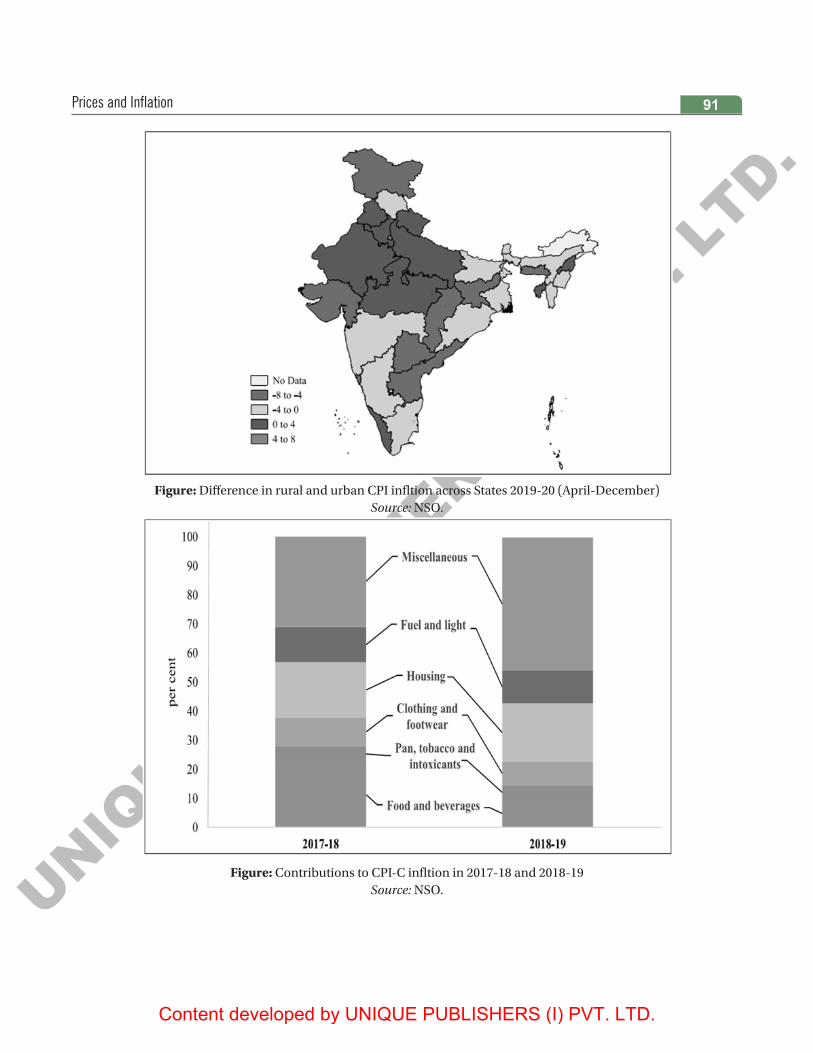
UNIQUE P
UBLISHERS (I
) PVT. L
TD.
Content developed by UNIQUE PUBLISHERS (I) PVT. LTD.
Prices and Inflation 91
Figure: Difference in rural and urban CPI infltion across States 2019-20 (April-December)Source: NSO.
Figure: Contributions to CPI-C infltion in 2017-18 and 2018-19Source: NSO.
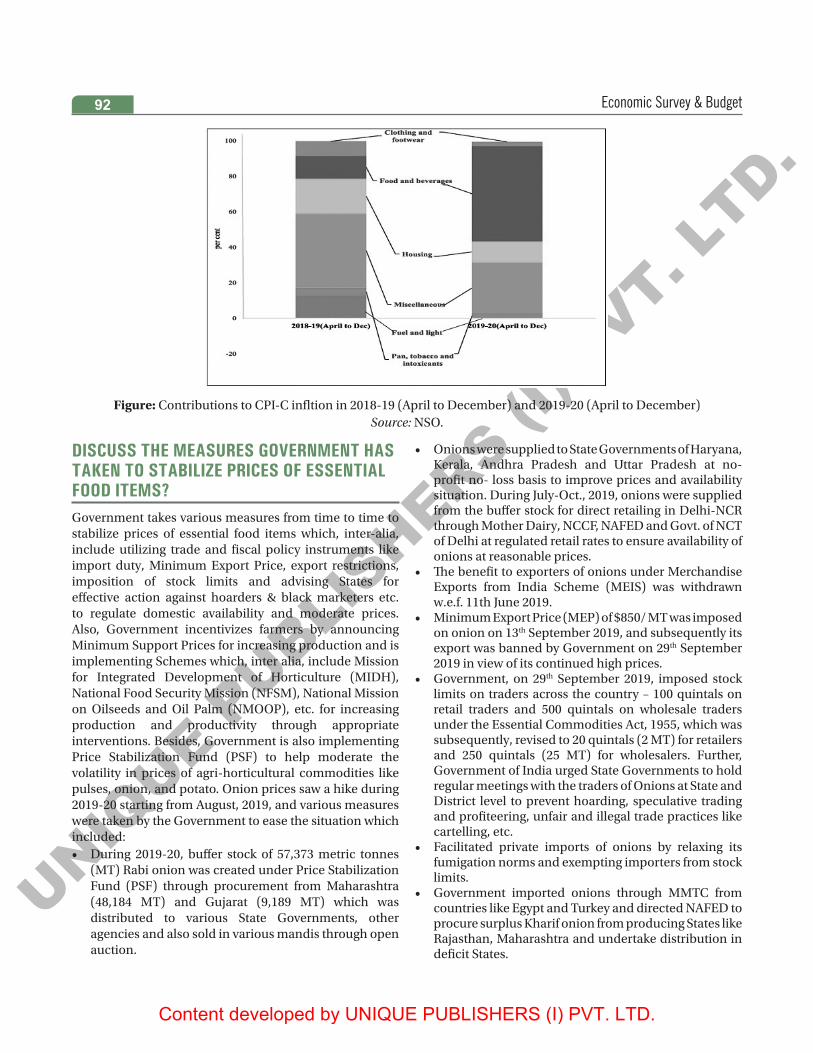
UNIQUE P
UBLISHERS (I
) PVT. L
TD.
Content developed by UNIQUE PUBLISHERS (I) PVT. LTD.
Economic Survey & Budget92
Figure: Contributions to CPI-C infltion in 2018-19 (April to December) and 2019-20 (April to December)Source: NSO.
DISCUSS THE MEASURES GOVERNMENT HAS TAKEN TO STABILIZE PRICES OF ESSENTIAL FOOD ITEMS?Government takes various measures from time to time to stabilize prices of essential food items which, inter-alia, include utilizing trade and fiscal policy instruments like import duty, Minimum Export Price, export restrictions, imposition of stock limits and advising States for effective action against hoarders & black marketers etc. to regulate domestic availability and moderate prices. Also, Government incentivizes farmers by announcing Minimum Support Prices for increasing production and is implementing Schemes which, inter alia, include Mission for Integrated Development of Horticulture (MIDH), National Food Security Mission (NFSM), National Mission on Oilseeds and Oil Palm (NMOOP), etc. for increasing production and productivity through appropriate interventions. Besides, Government is also implementing Price Stabilization Fund (PSF) to help moderate the volatility in prices of agri-horticultural commodities like pulses, onion, and potato. Onion prices saw a hike during 2019-20 starting from August, 2019, and various measures were taken by the Government to ease the situation which included: • During 2019-20, buffer stock of 57,373 metric tonnes
(MT) Rabi onion was created under Price Stabilization Fund (PSF) through procurement from Maharashtra (48,184 MT) and Gujarat (9,189 MT) which was distributed to various State Governments, other agencies and also sold in various mandis through open auction.
• Onions were supplied to State Governments of Haryana, Kerala, Andhra Pradesh and Uttar Pradesh at no-profit no- loss basis to improve prices and availability situation. During July-Oct., 2019, onions were supplied from the buffer stock for direct retailing in Delhi-NCR through Mother Dairy, NCCF, NAFED and Govt. of NCT of Delhi at regulated retail rates to ensure availability of onions at reasonable prices.
• The benefit to exporters of onions under Merchandise Exports from India Scheme (MEIS) was withdrawn w.e.f. 11th June 2019.
• Minimum Export Price (MEP) of $850/ MT was imposed on onion on 13th September 2019, and subsequently its export was banned by Government on 29th September 2019 in view of its continued high prices.
• Government, on 29th September 2019, imposed stock limits on traders across the country – 100 quintals on retail traders and 500 quintals on wholesale traders under the Essential Commodities Act, 1955, which was subsequently, revised to 20 quintals (2 MT) for retailers and 250 quintals (25 MT) for wholesalers. Further, Government of India urged State Governments to hold regular meetings with the traders of Onions at State and District level to prevent hoarding, speculative trading and profiteering, unfair and illegal trade practices like cartelling, etc.
• Facilitated private imports of onions by relaxing its fumigation norms and exempting importers from stock limits.
• Government imported onions through MMTC from countries like Egypt and Turkey and directed NAFED to procure surplus Kharif onion from producing States like Rajasthan, Maharashtra and undertake distribution in deficit States.
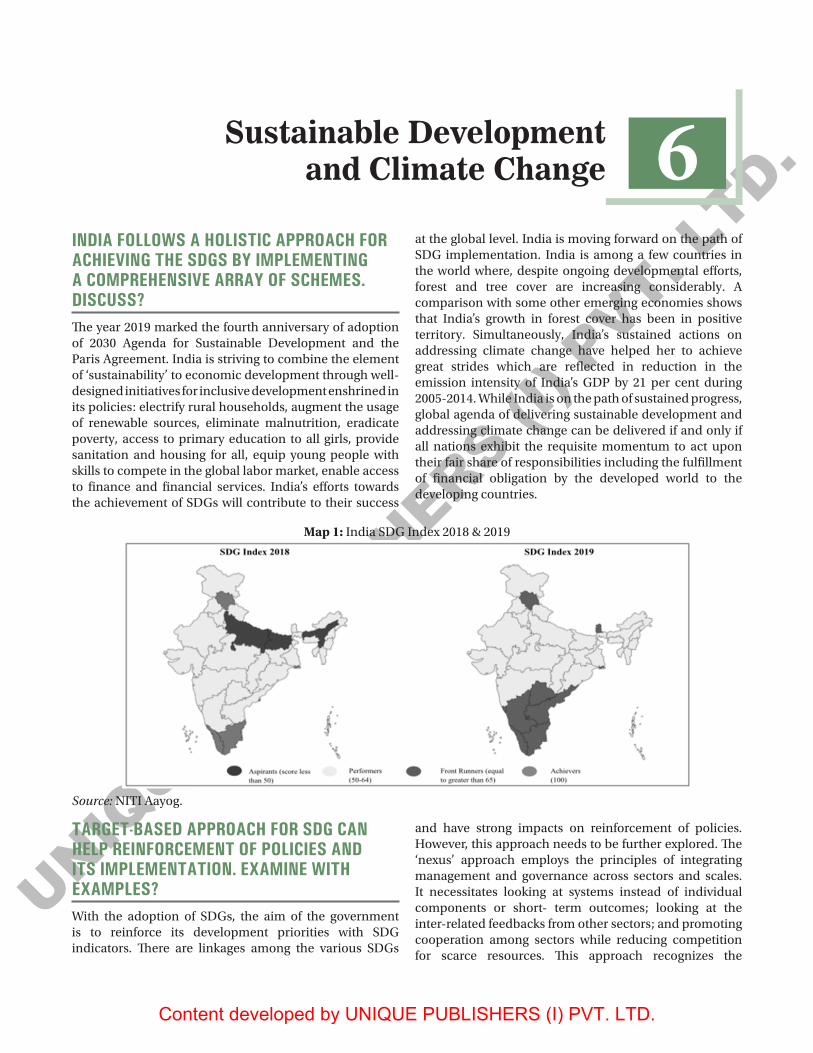
UNIQUE P
UBLISHERS (I
) PVT. L
TD.
Content developed by UNIQUE PUBLISHERS (I) PVT. LTD.
Sustainable Development and Climate Change 93
6Sustainable Development and Climate Change
INDIA FOLLOWS A HOLISTIC APPROACH FOR ACHIEVING THE SDGS BY IMPLEMENTING A COMPREHENSIVE ARRAY OF SCHEMES. DISCUSS?The year 2019 marked the fourth anniversary of adoption of 2030 Agenda for Sustainable Development and the Paris Agreement. India is striving to combine the element of ‘sustainability’ to economic development through well-designed initiatives for inclusive development enshrined in its policies: electrify rural households, augment the usage of renewable sources, eliminate malnutrition, eradicate poverty, access to primary education to all girls, provide sanitation and housing for all, equip young people with skills to compete in the global labor market, enable access to finance and financial services. India’s efforts towards the achievement of SDGs will contribute to their success
at the global level. India is moving forward on the path of SDG implementation. India is among a few countries in the world where, despite ongoing developmental efforts, forest and tree cover are increasing considerably. A comparison with some other emerging economies shows that India’s growth in forest cover has been in positive territory. Simultaneously, India’s sustained actions on addressing climate change have helped her to achieve great strides which are reflected in reduction in the emission intensity of India’s GDP by 21 per cent during 2005-2014. While India is on the path of sustained progress, global agenda of delivering sustainable development and addressing climate change can be delivered if and only if all nations exhibit the requisite momentum to act upon their fair share of responsibilities including the fulfillment of financial obligation by the developed world to the developing countries.
Map 1: India SDG Index 2018 & 2019
Source: NITI Aayog.
TARGET-BASED APPROACH FOR SDG CAN HELP REINFORCEMENT OF POLICIES AND ITS IMPLEMENTATION. EXAMINE WITH EXAMPLES?With the adoption of SDGs, the aim of the government is to reinforce its development priorities with SDG indicators. There are linkages among the various SDGs
and have strong impacts on reinforcement of policies. However, this approach needs to be further explored. The ‘nexus’ approach employs the principles of integrating management and governance across sectors and scales. It necessitates looking at systems instead of individual components or short- term outcomes; looking at the inter-related feedbacks from other sectors; and promoting cooperation among sectors while reducing competition for scarce resources. This approach recognizes the

UNIQUE P
UBLISHERS (I
) PVT. L
TD.
Content developed by UNIQUE PUBLISHERS (I) PVT. LTD.
Economic Survey & Budget94
various socio- ecological processes that are inter-linked, and pressures felt on certain resources can get further exacerbated leading to serious long-term challenges due to demands from other ‘nexus’ sector activities. This demands greater co-ordination across institutions at local, national and international levels.
This approach aims to achieve the balance between environmental, social, and economic boundaries and simultaneously ensure well- being of the people. To follow this basic concept in India, the SDG goals are used as a medium which allows for interlinkages of different sectors and thematic areas. Since, a few SDGs have overlapping objectives with one another, the policies developed and aligned to achieve the goals must consider and identify these linkages and in-turn identify the potential trade-offs that might limit the physical achievement of the target under a goal.
Electricity in schools is a part of basic infrastructure requirements to provide quality education. It has been observed that basic infrastructure like electricity, separate toilets for girls and boys in schools create a healthy and positive environment at schools (UNDESA, 2014). It is observed that with electricity, the schools’ access to modern methods and techniques of teaching helps holistic development of students and increase their attraction towards learning. Access to Information and Communication Technologies (ICTs) methods and imparting knowledge of computer at schools requires reliable electricity connections. It then becomes obvious that schools having quality and reliable power would generally tend to have the facilities that the Government is providing under its Sarva Shiksha Abhiyan programme. Globally it is observed that schools with electricity outperform the non-electrified schools in terms of staff-retention, drop-outs and other educational indicators. It is observed that States with lower literacy rates have low electricity rates at the schools and vice-versa. Net Enrolment Ratio (NER) and electrification of schools for selected States with low, medium and high Human Development Index (HDI) respectively. In case low and high HDI states, NER and electricity rate shows positive trend during 2014 to 2017. In case of medium HDI states, there is no conclusive trend because of the rate of growth of electrified school is not so high to the of number of schools getting constructed as compared to high and low HDI states during the same time period.
Many of the health improvement schemes- providing pediatric care, new- born emergency services, and successful vaccination rely heavily on the availability of electricity at the health centers. With the growing importance of the indicators under the SDG goals, it is important that reliable electricity connections are provided at the health care centers. As witnessed, there is a positive relationship between the electricity consumption and fall in the Infant Mortality Rate (IMR) in the country.
MAKE AN ASSESSMENT OF INDIA’S POSITION WITH RESPECT TO CLIMATE CHANGE?India submitted its Nationally Determined Contribution (NDC) under the Paris Agreement on a “best effort basis” keeping in mind the developmental imperatives of the country. In its NDC, India promised to reduce its emission intensity of GDP by 33 to 35 per cent below 2005 levels by the year 2030; 40 per cent of cumulative electric power installed capacity would be from non-fossil fuel sources by 2030 and increase its forest cover and additional carbon sink equivalent to 2.5 to 3 billion tons of carbon dioxide by 2030. The Paris Agreement is to be implemented in post-2020 period in line with the guidelines adopted under Paris Agreement Work Programme.
Figure: India’s national GHG inventory (2014)* (Gigagram)Source: Ministry of Environment, Forest and Climate Change, Government of India.
1 Gigagram (Gg) = 109 grams; Greenhouse gases are converted to CO
2 equivalent (CO
2e or CO
2eq) using their
respective Global Warming Potentials. *TOTAL without LULUCF.
India has strived to ensure that it follows a growth path that delivers sustainable development and protects

UNIQUE P
UBLISHERS (I
) PVT. L
TD.
Content developed by UNIQUE PUBLISHERS (I) PVT. LTD.
Sustainable Development and Climate Change 95
existing social, economic and environmental stresses. India has decided to revise the NAPCC in line with the NDCs under the Paris Agreement to make it more comprehensive in terms of priority areas.
Another major initiative is launching of Climate Change Action Program (CCAP) in 2014, a central sector scheme, with a total cost of `290 crore for five years, to build and support capacity at central and state levels, strengthening scientific and analytical capacity for climate change assessment, establishing appropriate institutional framework and implementing climate actions. Energy Audit Studies have revealed savings potential to the extent of 40 per cent in end use. The Energy Conservation Building Code (ECBC) sets minimum energy performance standards. It resulted in estimated energy saving of 84.34 million kWh, reduction in GHG emission of 69,154 tons of CO
2 per year. The same is also launched for residential sector. ECBC 2017 prescribes energy performance standards for new commercial buildings to be constructed across India to achieve a 50 per cent reduction in energy use by 2030 translating to energy savings of about 300 Billion Units by 2030 and peak demand reduction of over 15 GW in a year. Schemes like UJALA for LED bulb distribution has crossed 360 million whereas under street light national program, 10 million conventional streetlights have been replaced by LED street lights thus cumulatively saving 43 million tons of CO
2 emission. As part of the National Electric Mobility Mission Plan (NEMMP) 2020, Faster Adoption and Manufacturing of (Hybrid &) Electric Vehicles in India (FAME India) scheme was formulated in 2015 to promote manufacturing and sustainable growth of electric and hybrid vehicle technology. As of November 2019, a total of 280,994 vehicles have been sold. The National Bio-fuels Policy 2018 targets 20 per cent blending of ethanol in petrol and 5 per cent blending of biodiesel in diesel by 2030. National Adaptation Fund on Climate Change (2015) supports concrete adaptation activities for the States/UTs that are particularly vulnerable to the adverse effects of climate change and are not covered under on-going schemes. The allocation for the period 2017-18 to 2019-20 is of `364 crores. The Scheme has been taken as Central Sector Scheme with National Bank for Agriculture and Rural Development (NABARD) as the National Implementing Entity. Till date 30 projects on adaptation in agriculture, water, forestry, ecosystem & biodiversity, etc. have been approved.
the environment by investing in various schemes aligned with its NDC, like Swachh Bharat Mission, National Smart Grid Mission, Atal Mission for Rejuvenation and Urban Transformation etc. Not with standing the economic actualities, India’s mitigation strategies have emphasized on clean and efficient energy system, enhanced energy efficiency, resilient urban infrastructure, safe, smart and sustainable green transportation network, planned afforestation, as well as holistic participation across all sectors. Swachh Bharat Mission (Urban) was launched in 2014 with the twin objectives of ensuring 100 per cent scientific solid waste management and making urban India open defecation free (ODF), to achieve total environmental improvement. In a span of five years, the Mission has made significant progress- all urban areas of 35 States/ UTs have become ODF and the percentage of waste processing rose from around 18 per cent in 2014 to 60 per cent. The year 2019 has seen a significant leap forward for renewable energy with India undertaking one of the world’s largest renewable energy expansion programmes in the world. India had announced 175 Gigawatt (GW) targets for renewables by 2022 and has already achieved 83 GW. Further, Prime Minister in his address at the UN Climate Action Summit in September 2019 has stated that “India’s renewable energy capacity would be increased to much beyond 175 GW and later till 450 GW”. As a Party to the UNFCCC, India submitted its Second Biennial Update Report (BUR) to the UNFCCC towards fulfillment of the reporting obligation under the Convention. As per the BUR, the emission intensity of India’s GDP has reduced by 21 per cent over the period of 2005-2014 which is the result of India’s proactive and sustained actions on climate change. India is on track to achieve its nationally determined targets. In 2014, the net national GHG emissions after including LULUCF (Land Use, Land Use Change and Forestry) were 23,06,295Gg CO
2 equivalent (around 2.306 billion tons of CO2 equivalent).
Launched in 2008, India’s National Action Plan on Climate Change (NAPCC) identifies a number of measures that simultaneously advance the country’s development and climate change related objectives of adaptation and mitigation through focused National Missions. It was also meant to focus on key adaptation requirements and creation of scientific knowledge and preparedness as climate change acts as a “risk multiplier” for the vulnerable groups, worsening

UNIQUE P
UBLISHERS (I
) PVT. L
TD.
Content developed by UNIQUE PUBLISHERS (I) PVT. LTD.
Economic Survey & Budget96
BOX: NATIONAL MISSIONS AND PROGRESS
The Perform, Achieve and Trade (PAT) scheme under National mission for Enhanced Energy Efficiency (NMEEE) designed on the concept of reduction in Specific Epecific Energy Consumption. In pat cycle- V (April 2019), 110 Designated Dustomers (DC) form the existing sectors have been notified. The total energy consumption of these DCs comes out to be 15.244 million Tons of Oil Equivalent (Mtoe) and it is expected to get a total energy saving of 0.5130 Mtoe. It is envisaged that by 2020, about 20 Mtoe of energy saving will be achieved through the implementation of this scheme.
National Solar Mission amis to increase to share of solar energy in the total energy mix. The cumulative targets under the mission for grid connected solar power projects consists of 40 GW grid connected Rooftop projected and 60 GW large and medium size land based solar power projects. The combined target is now set at 100 GW. The total investment in setting up 100 GW will be around Rs. 6,00,000 crore. A cumulative 32.5 GW of solar electric generation capacity has been installed
National water Mission focuses on monitoring of ground water, aquifer mapping, capacity building, water quality monitoring and other baseline studies. There are 1071 assessment units categorized as over exploited as per 2011 assessment of Central Ground Water Authority (CGWA). Direction have been issued by CGWA under Section 5 of “The Environment Protection Act, 1986” for mandatory Rain water Harvesting / Roof Top Rain Water Harvesting for all target areas in the country including UTs. While granting ‘No Objection Certificate’ for drawing ground water, CGWA insists for mandatory rain water harvesting as per the guidelines issued.
National Mission for a Green India enevisages a holistic view of greening and focuses on multiple ecosystem services along with carbon sequestrain and emission reduction. The mission emphasized the landscape approach to treat large contiguous areas of both forest and non-forest, public and private land with a key role of the local communities is planning, implementation and monitoring. A sum of Rs. 343.08 crore has so far been released under the mission for undertaking afforestation activities over an area of 126916.32 ha in 13 states. Energy efficient devices have been provided to 56,319 households to promote alternative energy sources in project areas. Convergence guidelines with mahatma Gandhi National Rural employment Gurantee scheme and compensatory afforestaion found management and planning authority have been issued.
National Mission on Sustainable Habitat is being implemented through three programmes: Atal Mission on Rejuvenation Building Rules 2018 for commercial buildings having connected load of 100 KW or above has been made mandatory. Mass Rapid Transit systems are being implemented across the country and standard have been developed for six sub-sectors namely, solid waste management, water and sanitation, storm water drainage, urban planning, energy efficiency and urban transport. Under mass rapid transit system, 585 km of metro rail is in operation; 620 km in under construction. Under the bus rapid Transit system, (BRT), 223 kms of BRT corridors operational in 8 cities and 505 kilometers of BRT corridors are under construction in 14 cities
National mission for sustainable agriculture aims at enhancing food security and protection of resources. Key targets include covering 3.5 lakh hectare of area under organic farming, 3.70 under precision irrigation,4.0 lakh hectare under system of Rice Intensification, 341 lakh hectare under diversification to less water consuming crop, 3.09 lakh hectare additional area under plantation in arable land and 7 bypass protein feed making. The mission has resulted in the formation of national innovations on climate resilient agriculture, a network project.
National Mission for sustaining the Himalayan Ecosystem aims to evove suitable management and policy measures for sustaining and safeguarding the Himalayan Geology, thematic task forces in 6 lead institution, state climate change centers in 11 out of 12 Himalayan state, formation of inter-University consortium of 4 universities on Himalayan Cryosphere and climate change.
National Mission on strategic knowledge for climate change seeks to build a knowledge system that would inform and support national action for ecologically sustainable development key achievements include setting up of 11 centres of excellence and 10 state climate change Centres. 116 Training programmes have been launched and 14000 people have been trained; a total of 23 major R&D programmes have been spread over the country; 7 Human Capacity Building and National Knowledge Network programmes in the areas of climate changes science, adaptation and mitigation have been launched. 8 Global Technology Watch Groups in the areas of Renewable Energy Technology, Advance Coal Technology, Enhanced Energy Efficiency, Green Farest, Sustainable Havitat, Water, Sustainable Agriculture and Manufacturing have been set up.

UNIQUE P
UBLISHERS (I
) PVT. L
TD.
Content developed by UNIQUE PUBLISHERS (I) PVT. LTD.
Sustainable Development and Climate Change 97
Figure: Climate Change Projects (as on 31 December 2019) by NABARD (In Number)
Source: NABARD.
HOW HAS THE FINANCIAL SYSTEM OF INDIA ALIGNED WITH SUSTAINABILITY?Cleaner forms of production essentially require a sound financial system. This is more so as estimates points towards requirement of trillions of dollars to achieve SDGs globally. Hence, the spotlight is now on aligning the financial system with sustainable development. In December 2007, RBI had sensitized banks in India to the various international initiatives and was asked to keep abreast of the developments in the field of sustainability and dovetail/modify their lending strategies/plans in the light of such developments. In 2012, the Securities and Exchange Board of India (SEBI), mandated the Annual Business Responsibility Reporting (ABRR), a reporting framework based on the National Voluntary Guidelines (NVGs) on Social, Environmental and Economic Responsibilities of Business released by the Ministry of Corporate Affairs. These guidelines serve as a driver to pursue sustainable management practices. Indian Institute of Corporate Affairs in 2011 developed a concept of NVG for adoption by the corporate sector. SEBI mandated adoption of NVGs by the listed Indian companies including banks. In 2014-15, a Working Group was set up by Indian Banks’ Association (IBA) to generate the concept of responsible financing. The Working Group finalized the guidelines on ‘NVGs for Responsible Financing’. These guidelines lay down 8 principles, which cover different aspects of environmental,
social and governance (ESG) responsibilities to informed business action. Each principle details its ‘Description and Applicability’ and ‘Areas of Disclosure’ which would enable Financial Institutions to integrate the ESG principles in their business decision making, structure and processes.
Green bonds are debt securities issued by financial, non-financial or public entities where the proceed sare used to finance 100 percent green projects and assets. The first half of 2019 saw sustainability/SDG bonds maintaining their place in a wider labeled market with US$ 10.3 billion of transactions as issuers and investors continues to adopt policies and strategies linked to SDGs. Social bonds also maintained visibility with US$ 5.5 billion of issuance within the labeled market which totals a healthy US$ 145.4 billion for the half year. Climate Bonds remains focused on green bonds, which are specifically linked to climate-change mitigation, adaptation and resilience. India has the second largest Emerging green bond market after China. A number of Government agencies have contributed to issuance: Indian Renewable Energy Development Agency (IREDA) and the Indian Railway Finance Corporation (IRFC). In 2018, the SBI entered the market with an US$ 650 million Certified Climate Bond.
In order to scale up the environmentally sustainable investments, India joined the International Platform on Sustainable Finance (IPSF) in October 2019. The Platform acknowledges the global nature of financial markets which has the potential to help finance the transition to a green, low carbon and climate resilient economy by linking financing needs to the global sources of funding. The main objectives are exchange and disseminate information to promote best practices in environmentally sustainable finance; compare the different initiatives and identify barriers and opportunities to help scale up environmentally sustainable finance internationally while respecting national and regional contexts.
WHAT IS GREEN CLIMATE FUND?Under the UNFCCC and also Paris Agreement, the intent and obligation of climate finance is unambiguous, that developed country Parties shall provide financial resources to developing countries to undertake adaptation and mitigation actions in accordance with the country needs and priorities. In 2009, developed countries committed to a goal of mobilizing jointly US$ 100 billion a year by 2020 to address the needs of developing countries and decided that a significant portion of such funding should flow through
UNIQUE P
UBLISHERS (I
) PVT. L
TD.
Content developed by UNIQUE PUBLISHERS (I) PVT. LTD.
Economic Survey & Budget98
the GCF. In contrast, the total pledges to the GCF in the Initial Resource Mobilization (IRM) in 2014, the largest dedicated climate fund, are a megre US$ 10.3 billion. Approximately US$ 10.2 billion of the pledges had been converted into contribution agreements/arrangements. The GCF Board has approved US$ 5.2 billion to support the implementation of 111 climate change adaptation and mitigation projects and programmes in 99 developing countries. GCF’s first replenishment (2020- 2023) process so far witnessed 28 countries pledging resources to replenish the Fund for an amount of US$ 9.7 billion, which is even quantitatively lower than the IRM period. While the calls for raising of the ambition level of all countries and closing the emissions gap to limit temperature rise by 1.5 – 2 degree C above pre-industrial level were very intense at the recent climate talks, the key enabler, the climate finance, the major crunch issue remained unresolved
WHAT WAS INDIA’S DIPLOMACY AT COP 25?The 25th session of the Conference of the Parties (COP 25) to the UNFCCC was held at Madrid, Spain under the Chilean Presidency. India reiterated its commitment to implement the Paris Agreement in its letter and spirit and to act collectively to address climate change including consideration of principles of equity and common but differentiated responsibilities and respective capabilities. The COP 25 decision, titled Chile Madrid Time for Action, emphasizes the continued challenges that developing countries face in accessing financial, technology and capacity-building support, and recognizes the urgent need to enhance the provision of support to developing country Parties for strengthening their national adaptation and mitigation efforts. The decision also recalls the commitment made by developed country Parties to a goal of mobilizing jointly US$ 100 billion per year by 2020 to address the needs of developing countries. On the issue of global ambition for combating climate change, the decision adopted provides for a balanced and integrated view of ambition that includes not only efforts for climate change mitigation, but also for adaptation and means of implementation support from developed country parties to developing country parties.
Under the review of Warsaw International Mechanism (WIM) for Loss and Damage, the decision recognizes urgency of scaling-up of action and support, including finance, technology and capacity- building, for developing countries for averting, minimizing and addressing loss and damage. The decision also established the Santiago network for catalyzing technical assistance for implementation of relevant approaches in developing countries. On adaptation matters, the COP 25 decision
recalls that the provision of scaled-up financial resources should aim to achieve a balance between adaptation and mitigation, taking into account country-driven strategies, and the priorities and needs of developing country Parties, considering the need for public and grant-based resources for adaptation. On technology matters, the adopted decision requests the Technology Executive Committee (TEC) and the Climate Technology Centre and Network (CTCN) to continue to implement their mandates with strengthened efforts on all themes of the technology framework. GCF has also been requested to collaborate with CTCN and TEC for strengthening cooperative action on technology development and transfer at different stages of the technology cycle. India hosted ‘India Pavilion’ at COP-25 with the theme ‘150 years of celebrating the Mahatma’, designed to depict Mahatma Gandhi’s life and messages around sustainable living.
DISCUSS INDIA’S INITIATIVES FOR CLIMATE CHANGE AT THE GLOBAL LEVEL?International Solar Alliance is the first treaty based inter- governmental organization headquartered in India. With 83 signatory countries, ISA creates a multi-stakeholder ecosystem where sovereign nations, multilateral organizations, industry, policymakers and innovators work together to promote the common and shared goal of meeting energy demands of a secure and sustainable world. The ISA aims to pave the way for future solar generation, storage and technologies for Member countries’ needs by mobilizing over US$ 1000 billion by 2030. Achievement of ISA’s objectives will also strengthen the climate action in Member countries, helping them fulfill the commitments expressed in their NDCs. In 2019, ISA has taken up the role of an ‘enabler’ by institutionalizing 30 Fellowships from the Member countries with a premier institution (IIT Delhi) in the host country, and training 200 Master Trainers from ISA Member countries; of a ‘facilitator’ by getting the lines of credit worth US$ 2 Billion from EXIM Bank of India and US$ 1.5 Billion from Agence Francaise de Development (AfD), France, by ensuring MDB investments in solar, and garnering project preparation support; of an ‘incubator’ by nurturing initiatives like the Solar Risk Mitigation Initiative and of an ‘accelerator’ by developing tools to aggregate demand for more than 1000 MW solar rooftop, 10,000 MW of Solar Mini-Grid and 270,000 solar water pumping systems.
The ISA’s Programme on Scaling Solar Applications for Agriculture Use focuses on providing greater energy access and a sustainable irrigation solution through deployment of Solar Water Pumping Systems in member countries. To make the projects viable and affordable,

UNIQUE P
UBLISHERS (I
) PVT. L
TD.
Content developed by UNIQUE PUBLISHERS (I) PVT. LTD.
Sustainable Development and Climate Change 99
the ISA aggregated demand for solar water pumps from various countries in an effort to substantially reduce the system costs. The ISA received a cumulative demand of approx. 2.72 lakhs of solar water pumping systems from 22 member countries. The discovered prices through the tender would serve as the benchmark or reference prices for these member countries for procuring pumps.
In the field of innovative financing instruments, the Solar Risk Mitigation Initiative, launched by World Bank and AfD in support of the ISA, aims at supporting the development of bankable solar programs in developing countries leveraging private sector investments. World Bank has also committed US$ 337 million Risk Mitigation Fund for 23 member countries in off grid sector in Africa in partnership with ISA. The European Investment Bank has started working on a 60 Million Euros grant project to create a concessional financial facility and risk mitigation Fund to promote off grid applications in Africa. The ISA secretariat is also developing a robust implementation plan for the Scaling Solar Mini-grids Programme. The Asian Development Bank is providing a US$ 2 Million Knowledge Support and Technical Assistance (KSTA) to Six South Asian Countries in partnership with the ISA. The KSTA will facilitate deployment of Solar Energy at scale via three pillars: Identification and preliminary development of Solar Project Pipeline; Identification of Financial Instruments and mobilization of low-cost finance; and Knowledge support & Capacity Building.
To strengthen ISA’s partnership with the UN and its agencies and responding to the mandate received from the first Assembly of the ISA, the Secretariat has initiated follow-up actions for requesting a Permanent Observer Status of the ISA at the UN General Assembly and for negotiating a cooperation agreement with the UN for establishing institutional linkages between the ISA and the UN. ISA has also signed MoU with UNESCAP in May 2019 and with Sustainable Energy (SE4) All in June 2019, institutionalized solar awards in collaboration with Government of Haryana (Kalpana Chawla Solar Award), Government of Madhya Pradesh (Acharya Vinoba Bhave international award) and Government of Karnataka (Sri Visveswaraya Award) to strengthen the institution.
India launched the Coalition for Disaster Resilient Infrastructure (CDRI) on the sidelines of UN Secretary General’s Climate Action Summit in September, 2019. This international partnership of national governments, UN agencies, multilateral development banks, private sector, and knowledge institutions will promote the resilience of new and existing infrastructure systems to climate and disaster risks, thereby ensuring sustainable development. Developed through consultations with more than 35 countries, CDRI envisions enabling measurable reduction
in infrastructure losses from disasters, including extreme climate events. CDRI aims to enable the achievement of objectives of expanding universal access to basic services and enabling prosperity as enshrined in the SDGs, while also working at the intersection of the Sendai Framework for Disaster Risk Reduction and the Paris Climate Agreement.
CDRI will conduct country-specific and global activities and provide member countries technical support and capacity development, partnerships to facilitate and encourage investment in disaster resilient infrastructure systems. In its formative stage, CDRI will focus on developing resilience in ecological infrastructure, social infrastructure with a concerted emphasis on health and education, and economic infrastructure with special attention to transportation, telecommunications, energy, and water. Within 2-3 years, the coalition aims to have a 3-fold impact of achieving considerable changes in member countries’ policy frameworks, future infrastructure investments and high reduction in economic losses from climate-related events and natural disasters across sectors.
India hosted 14th session of the Conference of Parties (COP 14) to the United Nations Convention to Combat Desertification (UNCCD) from 2-13 September, 2019. The commemoration of World Day to Combat Desertification 2019 envisaged the release of COP 14 Logo with the Slogan “Restore Land, Sustain Future”. India, as President of COP to UNCCD stated that human actions have contributed to accelerating climate change, land degradation, and biodiversity loss and that, similarly, strong human intent, intelligence as well as technology will be needed to reverse the damage. Hon’ble Prime Minister of India while addressing the High-Level Segment on 9th September, 2019 announced India’s support for, among other actions, for enhanced South-South Cooperation that aims to share India’s experiences with cost- effective and sustainable land management strategies; and a “Global Water Action Agenda” to maximize synergies through holistic land and water management. As a party to the UNCCD, India has voluntarily committed to raise its ambition of the total area that would be restored from its land degradation status, from 21 million to 26 million hectares between now and 2030. His announcement, inter-alia, include, to set up a centre for excellence in India at the Indian Council of Forestry Research and Education; and has offered its resources in space and remote sensing technology to member countries who wish to manage their land degradation programmes through cutting-edge technology. COP 14 adopted the New Delhi Declaration: Investing in Land and Unlocking Opportunities. Through the Declaration, Ministers expressed support for new initiatives or coalitions aiming to improve human health

UNIQUE P
UBLISHERS (I
) PVT. L
TD.
Content developed by UNIQUE PUBLISHERS (I) PVT. LTD.
Economic Survey & Budget100
and well-being, the health of ecosystems, and to advance peace and security. Attention was also drawn to the role of private sector in land restoration, including through promoting sustainable value chains.
INDIA IS AMONG A FEW COUNTRIES IN THE WORLD WHERE, DESPITE ONGOING DEVELOPMENTAL EFFORTS, FOREST AND TREE COVER ARE INCREASING CONSIDERABLY. ANALYZE?A comparison with some other emerging and advanced economies shows that India’s growth in forest cover has
been in positive territory (Figure 10). In terms of canopy density classes, area covered by Very Dense Forest (VDF) is 99,278 sq. km (3.02 per cent), Moderately Dense Forest (MDF) is 3,08,472 sq. km (9.39 per cent) and Open Forest (OF) is 3,04,499 sq. km (9.26 per cent) (Figure 11). The forest and tree cover have reached 80.73 million hectare which is 24.56 per cent of the geographical area of the country. The total forest cover of the country, as per current assessment 2019 is 7,12,249 sq. km which is 21.67 per cent of the total geographic area of the country. There has been an increase of 3,976 sq. km (0.56 per cent) of forest cover, 1,212 sq. km (1.29 per cent) of tree cover and 5,188 sq. km (0.65 per cent) of forest and tree cover put together, at the national level as compared to the previous assessment 2017.
Figure: Annual change in forest cover (per cent)Source: World Development Indicators.
Figure: Forest Cover of India (2019) (per cent)Source: India State of Forest Report 2019.

UNIQUE P
UBLISHERS (I
) PVT. L
TD.
Content developed by UNIQUE PUBLISHERS (I) PVT. LTD.
Sustainable Development and Climate Change 101
The States/UTs showing significant gain in forest cover are Karnataka (1,025 sq. km), Andhra Pradesh (990 sq. km), Kerala (823 sq. km) and Jammu & Kashmir (371 sq. km) whereas States showing loss in forest cover are Manipur, Meghalaya, Arunachal Pradesh and Mizoram India is one of the 17 mega diverse countries in the world. This is evident in the Shannon-Weiner Index for Diversity which is used for measuring species richness and abundance. The index also compares diversity of species among various habitats. India State of the Forest Report 2019 assessed Shannon-Weiner Index for 16 bio- diverse areas. The index for six
bio-diverse areas such as Tropical wet evergreen forest, Tropical semi-evergreen forest, Tropical moist deciduous forest, Littoral and Swamp forest, Tropical dry deciduous forest and Tropical Thorn forests are given in Figure 13. The Index shows that Tropical Evergreen forest is high in Karnataka followed by Kerala. Tropical moist deciduous forests cover is high in Arunachal Pradesh, Karnataka and Maharashtra. Tropical dry deciduous forest is high in Arunachal Pradesh and semi-evergreen forest are high in Karnataka. Tropical Littoral and swamp forests are high in UP and tropical thorn forests are seen widely in Andhra Pradesh.
Figure: Change in the forest cover for India in 2019 as compared to 2017 (area in sq. km)Source: World Development Indicators.

UNIQUE P
UBLISHERS (I
) PVT. L
TD.
Content developed by UNIQUE PUBLISHERS (I) PVT. LTD.
Economic Survey & Budget102
Figure: Shannon-Weiner Index for TreesSource: India State to Forest Report 2019.
Figure: Forest area for top ten countries (per cent)Source: India State to Forest Report 2019.

UNIQUE P
UBLISHERS (I
) PVT. L
TD.
Content developed by UNIQUE PUBLISHERS (I) PVT. LTD.
Sustainable Development and Climate Change 103
Figure: Carbon Stock (Million Cubic Metres)Source: India State to Forest Report 2019.
Figure: Net Change in Carbon Stock in forest in 2019 as compared to 2017Source: India State to Forest Report 2019.
BURNING OF AGRICULTURAL WASTES IN THE FIELDS IS A PRACTICE THAT RESULTS IN A NUMBER OF ENVIRONMENTAL PROBLEMS. SUGGEST METHODS TO RESOLVE THE CONCERN?India, being the second largest agro-based economy with year-round crop cultivation, generates a large amount of agricultural waste, including crop residues. Open burning of crop residues in the agricultural fields has become an environmental concern in India, particularly during paddy harvesting season. Varieties of surplus crop residues are
burnt especially in northern States of Punjab, Haryana, UP, and Rajasthan depending on the agro-climatic region; however, about 50 per cent of all crop residue burnt in the country are residues of rice crop (TIFAC, 2018). Use of combine harvesters leaves the crop residues in field, and in order to clear the fields for the next crop in easiest way, farmers’ burn the residues. About 178 million tonnes of surplus crop residues are available in the country (TIFAC, 2018). Burning of these residues leads to rise in pollutant levels and deterioration of air quality.
Various source apportionment studies at city scales have shown that agricultural burning contributes significantly in PM2.5 (particulate matter, diameter

UNIQUE P
UBLISHERS (I
) PVT. L
TD.
Content developed by UNIQUE PUBLISHERS (I) PVT. LTD.
Economic Survey & Budget104
measurements of 2.5 micrometers or less) concentrations. Because huge volumes of residues are burnt in a very short duration (of few weeks), it leads to significant contributions in pollutant levels like PM2.5 (TERI, 2018, SAFAR 2019). The effect of stagnant atmospheric condition over Delhi during the harvest season of kharif crop has aggravated the deterioration of the ambient air quality in the region. Emission pollutants released due to burning depends on the type of crop residue e.g. PM2.5 emission (g/Kg) from the burning of different crop residues followed this order; Sugarcane (12.0), Maize (11.2), Cotton (9.8), Rice (9.3), wheat (8.5) (TERI, 2019). There are studies which have reported that open burning of crop residues has ill effects on soil organic carbon and soil fertility.
The stubble burning incidents in the month of October and November, 2019 are given in which shows the fire hot spot detected by NASA NPP-VIIRS satellite over North India during October-November, 2019. This satellite overpass India sometime around 1:30 local solar time (afternoon). As the figure shows, number of fire events are high from the mid of October till the first week of November, 2019. This has led to an increase in PM 2.5 and PM10 in Delhi in the month of October and November as compared to that of September, 2019 . In the month of September, the highest level of PM10 and PM2.5 was 134 and 80.34 respectively. In the month of October, the highest level of PM10 was 384 which is more than double as compared to the maximum PM10 of September, 2019. Similarly, the highest level of PM2.5 in the month of October was 306 which is higher than the September assessment. In the month of November, PM10 crossed 550 and PM2.5 crossed 510. PM10 and PM2.5 started falling in December, 2019 and the lowest level of PM10 and PM2.5 was 188 and 153 respectively.
Various studies suggest ways to address this issue, which include:• Promote the practice of conservation of agriculture
with low lignocellulosic crop residues like rice, wheat, maize etc. Agricultural machineries can help farmers to sow the seeds of the next crop without any problem associated with residues of the previous crops and also without affecting the crop productivity. This can improve or sustain the productivity of the crop land in the long term, as in-situ management. Apart from this, there are other options to utilize the crop residues ex situ from the crop land and some efforts have already been made for ex situ utilization of the crop residues.
• Create markets for crop residue-based briquettes and mandate nearby thermal power plants to undertake co-firing of crop residues with coal. It is also important to create infrastructure for setting up biomass depots for storage of bailed crop residues in areas that have
shown high fire incidents or high production of a particular crop.
• Create special credit line for financing farm equipment and working capital for private sector participation.
• Promote use of crop residue-based biochar briquettes in local industries, brick kiln and hotel/dhaba as an alternate fuel.
• Pollution control as a parameter for deciding incentives and allocation to States/UTs. National Green Tribunal in the order passed on
10.12.2015, directed and prohibited agricultural residue burning in any part of the NCT of Delhi, State of Rajasthan, State of Punjab, State of Uttar Pradesh and State of Haryana. Any person or body that is found violating the directions of National Green Tribunal is liable to pay Environmental Compensation which is collected by the concerned State Governments. In 2014, the Union government had released the National Policy for Management of Crop Residue, which NGT directed the States to implement. Burning crop residue is a crime under Section 188 of the IPC and under the Air and Pollution Control Act of 1981.
A new Central Sector Scheme on ‘Promotion of Agricultural Mechanization for In-Situ Management of Crop Residue in the States of Punjab, Haryana, Uttar Pradesh and NCT of Delhi’ for the period from 2018-19 to 2019-20 is being implemented with the total outgo from the Central funds of `1151.80 crore (`591.65 crore in 2018-19 and `560.15 crore in 2019- 20). Under this Scheme, the agricultural machines and equipment for in-situ crop residue management such as Super Straw Management System for Combine Harvesters, Happy Seeders, Hydraulically Reversible MB Plough, Paddy Straw Chopper, Mulcher, Rotary Slasher, Zero Till Seed Drill and Rotavators are provided with 50 per cent subsidy to the individual farmers and 80 per cent subsidy for establishment of Custom Hiring Centres.
With various efforts, overall, the total number of burning events recorded significant reduction. However, continuation of this practice by farmers is reported every year starting winter and the serious concerns about its impact on air quality are raised.
UNSCIENTIFIC DISPOSAL OF C&D WASTE IS ONE OF THE KEY CONTRIBUTORS TO THE AIR AND WATER POLLUTION. SUGGEST A REMEDY?In 2009, the Municipal Corporation of Delhi and IL&FS Environmental Infrastructure and Services Ltd. (IEISL) pioneered setting up a project to recycle 500 Tonnes Per Day (TPD) of C&D waste at Burari, Delhi (first of its kind facility in the country) to address the waste generated
UNIQUE P
UBLISHERS (I
) PVT. L
TD.
Content developed by UNIQUE PUBLISHERS (I) PVT. LTD.
Sustainable Development and Climate Change 105
during Commonwealth Games preparations. Since then, the Burari facility along with two other C&D recycling facilities (under East Delhi Municipal Corporation and Delhi Metro Rail Corporation respectively) in Delhi are together recycling over 2,650 TPD C&D waste. The pioneering facility of Burari also helped in paving the way forward in formulating the C&D Waste Management Rules, 2016. All three Delhi plants have together processed over 5 million tonnes C&D waste.
Application of recycled C&D products: Standards for utilization of manufactured Coarse and Fine Aggregates have been prescribed by Bureau of Indian Standards (BIS).
The recycled products have been included in the Delhi Schedule of Rates issued by CPWD. The civic bodies of Delhi and other Government Departments such as CPWD, DDA, DMRC, NBCC, PWD, Delhi State Industrial and Infrastructure Development Corporation Ltd., Irrigation & Flood Control (I&FC) are actively using the recycled C&D materials & products for ongoing civil works. Among the landmark projects where it has been used is the Supreme Court Annex building and MP flats, where over 2.3 million bricks were used. The material has also been used in the construction of a 100m wide road connecting NH-1 and Bakkarwala, Delhi.
UNIQUE P
UBLISHERS (I
) PVT. L
TD.
Content developed by UNIQUE PUBLISHERS (I) PVT. LTD.
Economic Survey & Budget106
DISCUSS THE VARIOUS DIRECT INCOME/INVESTMENT SUPPORT SCHEMES INTRODUCED BY THE GOVERNMENT?With a view to encourage higher investment and production, the Government announces Minimum Support Prices (MSPs) for twenty-two mandated crops; and Fair and Remunerative Price for Sugarcane. The Union Budget, 2018-19 had announced pre-determined principle to keep MSPs at levels of one and half times of the cost of production. Accordingly, Government had increased MSPs for all mandated kharif, rabi and other commercial crops with a return of 1.5 times over all India weighted average cost of production for the season 2018-19. Government has recently increased the MSPs for all mandated kharif and rabi crops for 2019-20 season in line with this principle.
PRADHAN MANTRI KISAN SAMMAN NIDHI (PM-KISAN)PM-KISAN is a Central Sector scheme with 100 per cent funding from Government of India. The Scheme is effective from 1.12.2018 and covers all the farmers (subject to certain exclusion criteria). Under the Scheme an income support of `6000 per year is provided to all farmer families across the country in three equal installments of `2000 at an interval of every four months.
KRUSHAK ASSISTANCE FOR LIVELIHOOD AND INCOME AUGMENTATION (KALIA) SCHEME OF ODISHAThis scheme was launched by Government of Odisha in 2018-19 Rabi season onwards, to accelerate agricultural prosperity and elimination of poverty in the State. Benefits provisioned under different components are: financial support of `25,000 per farm family over five seasons will be provided to small and marginal farmers so that farmers can purchase inputs like seeds, fertilizers, pesticides, labour & other investments. For landless agriculture households, financial assistance of ̀ 12500 will be provided
to each landless agricultural household for agricultural allied activities such as small goat rearing unit, mini-layer unit, duckery units, fishery kits for fisherman, mushroom cultivation and bee-keeping, etc. Vulnerable cultivators/landless agricultural labourers will get financial assistance of `10,000 per family per year to enable them to take care of their sustenance. The scheme also has life and accident insurance covers for the farmers at very nominal premiums.
MUKHYA MANTRI KRISHI ASHIRWAD YOJANA OF JHARKHANDUnder the scheme, all the small and marginal farmers of the State, who have arable land up to a maximum of 5 acres, will be given a grant-in-aid at the rate of `5000 / - per acre per year, which will help them reduce their dependence on loans. This amount would be given in two installments through Direct Benefit Transfer to the beneficiary’s bank account. This is in addition to PM Kisan Nidhi Yojana under which each small & marginal farmer’s family having combined landholding/ ownership of up to two hectares is paid `6,000 per year.
RYTHU BANDHU OF TELANGANA Government of Telangana has come up with a new concept of providing Investment Support at the rate of `4,000 per acre per season to all the farmers (Pattadars) in the State towards purchase of various inputs like seeds, fertilizers etc., as initial investment before the crop season. The scheme is being implemented from Kharif 2018 onwards. A financial outlay of `12,000 crore has been allocated during 2018-19. During Kharif 2018-19, 51.50 lakh farmers were benefitted to the tune of `5,260.94 crore and it was disbursed by way of cheques. During Rabi 2018-19, the Government has taken a decision to transfer the amount through treasury e-Kuber to deposit money into the accounts of the farmers. An amount of `5,244.26 crore was transferred into the accounts of 49.03 Lakh farmers. During 2019-20, Government of Telangana has enhanced the amount under Investment Support Scheme from `4,000 to `5,000 per acre per season.
7 Agriculture and Food Management
UNIQUE P
UBLISHERS (I
) PVT. L
TD.
Content developed by UNIQUE PUBLISHERS (I) PVT. LTD.
Agriculture and Food Management 107
FOCUS ON WATER USE EFFICIENCY AT FARM LEVEL THROUGH PRECISION OR MICRO IRRIGATION (DRIP AND SPRINKLER IRRIGATION) HAS BECOME A FARM IMPERATIVE TO ENSURE A SUSTAINABLE AGRICULTURAL PRACTICE. DISCUSS?Considering this, the Pradhan Mantri Krishi Sinchayee Yojana (PMKSY) was launched on 1st July, 2015 with the motto of ‘Har Khet Ko Paani’ for providing end-to end solutions in irrigation supply chain, viz. water sources, distribution network and farm level applications. Per Drop More Crop component of PMKSY (PMKSY-PDMC) is operational from 2015-16 in the country focussing on water use efficiency at farm level.
Micro Irrigation, which includes drip and sprinkler irrigation, is a proven technology which has gained immense popularity amongst the farmers. Strengths of this technology include - efficient deployment of inputs such as water, electricity, fertilizers,
labour, increase in crop productivity, better quality of produce leading to higher realization of sale price resulting in increased income of farmer. With this technology, additional area can be irrigated with the same amount of water compared to conventional method of irrigation. In addition, water deficient, cultivable waste land and undulating land areas can be brought under cultivation due to ease of irrigation. There is also good scope for using this technology in closely spaced crops like rice, wheat, onion, potato etc. In a nutshell, following benefits have accrued to the farmers:
• Saving of irrigation water from 20 to 48 per cent; • Energy saving from 10 to 17 per cent; • Saving of labour cost from 30 to 40 per cent; • Saving of fertilizers from 11 to 19 per cent; • Increase in crop production from 20 to 38 per cent; • Increase in net annual income of the farmer
beneficiaries. • A dedicated Micro Irrigation Fund (MIF) created with
NABARD has been approved with an initial corpus of `5000 crore facilitating the States in mobilizing the resources for expanding coverage of Micro Irrigation envisaged under PMKSY-PDMC and also in bringing additional coverage through special and innovative initiatives by State Governments.
WHAT IS NATIONAL CROP INSURANCE PORTAL? National Crop Insurance Portalis a web-based integrated IT platform that provides interface among all stakeholders to access/enter data relating to insured farmers under PMFBY and Restructured Weather Based Crop Insurance Scheme (RWBCIS). For this purpose, all stakeholders, viz., States, banks, insurance companies (ICs), farmers (for direct online enrollment) and the Common Service Centre (CSC) involved in the enrolment process have been provided an interface on the NCIP through which the enrolment process is executed. In this manner the data on enrolment for non-loanee farmers through different sources is completely available on the NCIP.
Crop insurance portal envisages creation of demand for Government share of premium subsidy from the portal itself, on the basis of which funds would be released to concerned ICs and as a next step the portal would facilitate that the admissible claims could be settled directly to farmers bank accounts by respective ICs through portal to avoid delay in credit of claim amount to farmers account and for proper monitoring.
DISCUSS THE ACHIEVEMENTS OF PRADHAN MANTRI FASAL BIMA YOJANA?Pradhan Mantri Fasal Bima Yojana (PMFBY) has been under implementation since kharif 2016 season in the country. It provides comprehensive coverage of risks from pre-sowing to post harvest against natural non-preventable risks. The insurance premium is paid to insurance companies on actuarial/on bidding basis, with very low share contributed by the farmers across the country (2 per cent and 1.5 per cent of the sum insured for food and oilseed crops for kharif and rabi seasons, respectively) and 5 per cent for commercial/horticultural crops and balance premium to be paid upfront and shared equally between Central and State Governments. It also provides better protection for the farmers in terms of sum insured which has been made equal to the scale of finance. PMFBY envisages increase in coverage from the existing 23 per cent to 50 per cent of Gross Cropped Area (GCA) in the country. Target for 2016-17 was 30 per cent of GCA. The targets could not be covered due to the announcement of Debt Waiver Scheme in two big States namely, Maharashtra and
UNIQUE P
UBLISHERS (I
) PVT. L
TD.
Content developed by UNIQUE PUBLISHERS (I) PVT. LTD.
Economic Survey & Budget108
Uttar Pradesh during 2017-18 and in Madhya Pradesh and Rajasthan in 2018-19. Direct Benefit Transfer (DBT) was introduced by the Government in April 2017 to help farmers receive claims directly in their bank accounts, which made registration through Aadhar number mandatory. This was a deliberate step by the Government to weed out ghost/duplicate beneficiaries and help genuine farmers through Aadhar based verification. Substantial progress with more ground coverage compared to erstwhile crop insurance schemes has been made under PMFBY. During 2018-19 season, 564.50 lakh farmer applications (tentatively) covering an area of 517.70 lakh ha have been insured for a sum of about `2,35,642 crore. Substantial progress with more ground coverage compared to erstwhile crop insurance schemes has been made under PMFBY. Though the scheme is voluntary for the States, 26 States/UTs implemented the scheme in 2017-18. In 2018-19, 23 States/ UTs implemented the scheme.
On the basis of the experience of implementation of PMFBY and with a view to ensuring better transparency, accountability and timely payment of claims to the farmers, Government has comprehensively revised the operational guidelines of the scheme which have become effective from 01.10.2018 and, inter-alia, include the following:
i) Provision of 12 per cent interest rate per annum to be paid by the Insurance Company to farmers for delay in settlement of claims beyond 10 days of prescribed cut-off date for payment of claims;
ii) State Governments have to pay 12 per cent interest rate for delay in release of State share of subsidy beyond three months of prescribed cut-off date/ submission of requisition by Insurance Companies;
iii) Increased time for change of crop name for insurance - upto 2 working days prior to cut-off date for enrolment instead of earlier provision of one month before cut-off date;
iv) Time for intimation of loss due to localized calamities and post-harvest losses has been increased from 48 hours to 72 hours;
v) Detailed Standard Operating Procedures (SOPs) for settlement of claims under localized calamities, post-harvest losses, mid-season adversity and prevented sowing and redressal of disputes regarding yield data including add on features;
vi) Inclusion of perennial crops and add on coverage for damage by wild animals on pilot basis.
The ICAR with its 113 research institutes and 716 KVKs is geared up to enhance the competitiveness of Indian farming to make farming a viable, self-sustaining and internationally competitive enterprise through digital agricultural platform- Cyber Agro-Physical Systems (CAPS). The CAPS while integrating the use of sensors with computers, satellite imagery, supercomputing facility for research will also help reducing uncertainty and risk in agriculture operations through Artificial Intelligence enabled farmers’ advisories for critical agricultural operations and climatic events. Also, New Digital Apps have been developed for making Indian agriculture in line with Digital India theme. The DARE launched the Agricultural Education Portal EKTA (Ekikrit Krishi Shiksha Takniki Ayaam) for integrated online management information system, developed 9 mobile apps such as mango cultivation, e-kalpa, oil palm (English, Hindi and Telugu); pomegranate, onion and garlic, black pepper, mushrooms and 02 mobile Apps for farming community (Kisan Suvidha and Pusa Krishi).
DISCUSS THE FEATURES AND ACHIEVEMENTS OF PRADHAN MANTRI KISAN SAMPADA YOJANA?Overnment has restructured its schemes under a new central sector scheme of Pradhan Mantri Kisan Sampada Yojana (PMKSY). With a financial allocation of `6,000/- crore for the period 2016-20, PMKSY provides subsidy-based support to create robust modern infrastructure for agriculture and agro-based industries along the entire value/supply chain. It is expected to reduce wastage of agriculture produce, increase the processing level, enhance the export of the processed foods, enable availability of hygienic and nutritious food to consumers at affordable prices. The scheme components are: Mega Food Parks, Integrated Cold Chain and Value Addition Infrastructure, Creation/Expansion of Food Processing & Preservation Capacities, Infrastructure for Agro-processing Clusters, Creation of Backward and Forward Linkages, Food Safety and Quality Assurance Infrastructure, Human Resources and Institutions, and Operation Greens.
WHAT IS THE CONCEPT OF ONE NATION, ONE RATION CARD?The Department of Food & Public Distribution in collaboration with all States/UTs is implementing a
UNIQUE P
UBLISHERS (I
) PVT. L
TD.
Content developed by UNIQUE PUBLISHERS (I) PVT. LTD.
Agriculture and Food Management 109
Scheme namely “Integrated Management of Public Distribution System (IM-PDS)” during 2018-19 and 2019-20. The main objective of the scheme is to introduce nation-wide portability of ration card holders under NFSA through ‘One Nation One Ration Card’ System, to lift their entitled foodgrains from any Fair Price Shop (FPS) in the country without the need to obtain a new ration card. This system would largely benefit numerous migratory beneficiaries who frequently change their place of dwelling in search of work/employment or for other reasons across the country and eventually get deprived of their quota of subsidised foodgrains under NFSA due to migration from their native place. Through this system migatory beneficiaries shall be able to access their food security entitlements from any FPS of their choice/convenience
by using their same/existing ration cards after biometric/ Aadhaar authentication on electronic Point of Sale (ePoS) devices at the FPS in another State/UT.
At present the facility of inter-State portability is enabled in 8 States i.e. in four clusters of 2-adjoining States of Andhra Pradesh & Telangana, Gujarat & Maharashtra, Haryana & Rajasthan, and Karnataka & Kerala. It is further envisaged that all four clusters, as above, and a few other States having already implemented intra-State portability shall be integrated together into single national platform. Thereafter, rollout of National Portability in other States/UTs shall be done as and when the national de-duplication of all ration cards,beneficiaries under NFSA is completed and biometric/Aadhaar authentication based distribution is enabled in the State/UT.
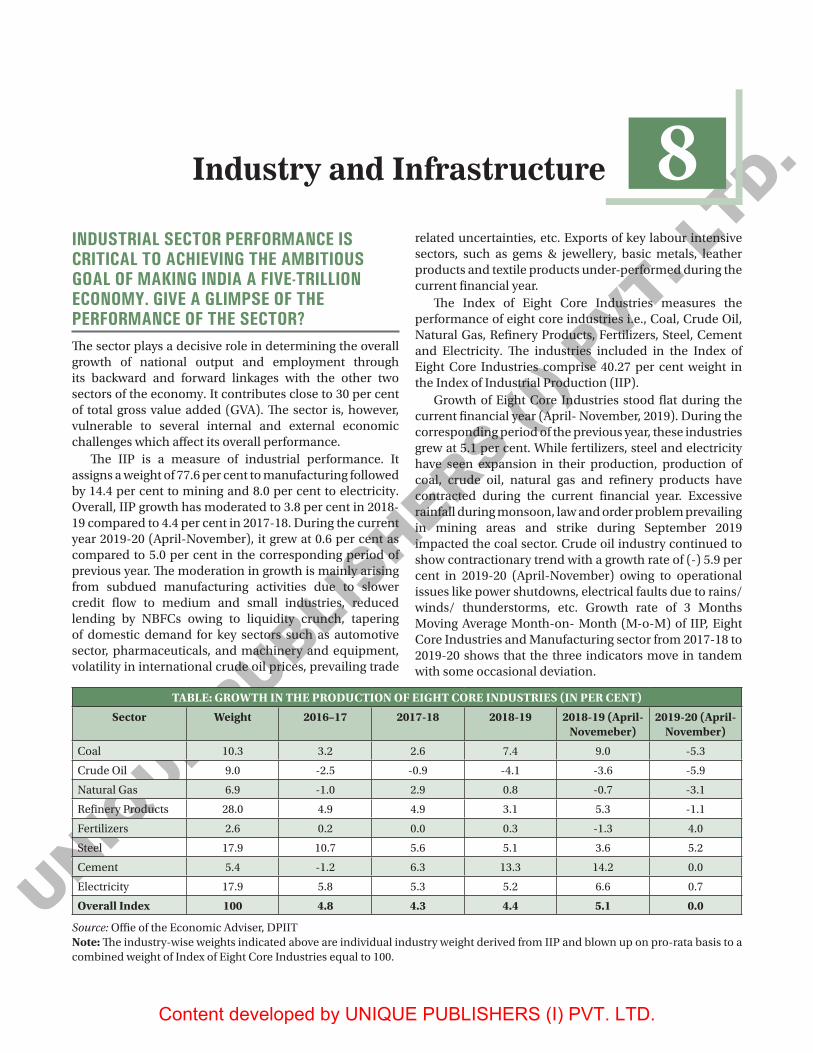
UNIQUE P
UBLISHERS (I
) PVT. L
TD.
Content developed by UNIQUE PUBLISHERS (I) PVT. LTD.
Economic Survey & Budget110
INDUSTRIAL SECTOR PERFORMANCE IS CRITICAL TO ACHIEVING THE AMBITIOUS GOAL OF MAKING INDIA A FIVE-TRILLION ECONOMY. GIVE A GLIMPSE OF THE PERFORMANCE OF THE SECTOR?The sector plays a decisive role in determining the overall growth of national output and employment through its backward and forward linkages with the other two sectors of the economy. It contributes close to 30 per cent of total gross value added (GVA). The sector is, however, vulnerable to several internal and external economic challenges which affect its overall performance.
The IIP is a measure of industrial performance. It assigns a weight of 77.6 per cent to manufacturing followed by 14.4 per cent to mining and 8.0 per cent to electricity. Overall, IIP growth has moderated to 3.8 per cent in 2018-19 compared to 4.4 per cent in 2017-18. During the current year 2019-20 (April-November), it grew at 0.6 per cent as compared to 5.0 per cent in the corresponding period of previous year. The moderation in growth is mainly arising from subdued manufacturing activities due to slower credit flow to medium and small industries, reduced lending by NBFCs owing to liquidity crunch, tapering of domestic demand for key sectors such as automotive sector, pharmaceuticals, and machinery and equipment, volatility in international crude oil prices, prevailing trade
related uncertainties, etc. Exports of key labour intensive sectors, such as gems & jewellery, basic metals, leather products and textile products under-performed during the current financial year.
The Index of Eight Core Industries measures the performance of eight core industries i.e., Coal, Crude Oil, Natural Gas, Refinery Products, Fertilizers, Steel, Cement and Electricity. The industries included in the Index of Eight Core Industries comprise 40.27 per cent weight in the Index of Industrial Production (IIP).
Growth of Eight Core Industries stood flat during the current financial year (April- November, 2019). During the corresponding period of the previous year, these industries grew at 5.1 per cent. While fertilizers, steel and electricity have seen expansion in their production, production of coal, crude oil, natural gas and refinery products have contracted during the current financial year. Excessive rainfall during monsoon, law and order problem prevailing in mining areas and strike during September 2019 impacted the coal sector. Crude oil industry continued to show contractionary trend with a growth rate of (-) 5.9 per cent in 2019-20 (April-November) owing to operational issues like power shutdowns, electrical faults due to rains/winds/ thunderstorms, etc. Growth rate of 3 Months Moving Average Month-on- Month (M-o-M) of IIP, Eight Core Industries and Manufacturing sector from 2017-18 to 2019-20 shows that the three indicators move in tandem with some occasional deviation.
8Industry and Infrastructure
TABLE: GROWTH IN THE PRODUCTION OF EIGHT CORE INDUSTRIES (IN PER CENT)
Sector Weight 2016–17 2017-18 2018-19 2018-19 (April-Novemeber)
2019-20 (April-November)
Coal 10.3 3.2 2.6 7.4 9.0 -5.3
Crude Oil 9.0 -2.5 -0.9 -4.1 -3.6 -5.9
Natural Gas 6.9 -1.0 2.9 0.8 -0.7 -3.1
Refinery Products 28.0 4.9 4.9 3.1 5.3 -1.1
Fertilizers 2.6 0.2 0.0 0.3 -1.3 4.0
Steel 17.9 10.7 5.6 5.1 3.6 5.2
Cement 5.4 -1.2 6.3 13.3 14.2 0.0
Electricity 17.9 5.8 5.3 5.2 6.6 0.7
Overall Index 100 4.8 4.3 4.4 5.1 0.0
Source: Offie of the Economic Adviser, DPIITNote: The industry-wise weights indicated above are individual industry weight derived from IIP and blown up on pro-rata basis to a combined weight of Index of Eight Core Industries equal to 100.

UNIQUE P
UBLISHERS (I
) PVT. L
TD.
Content developed by UNIQUE PUBLISHERS (I) PVT. LTD.
Industry and Infrastructure 111
Figure: Growth rate of 3 Months Moving Average Month-on-Month (M-o-M) of IIP, Eight Core Industries and Manufacturing sector from 2017-18 to 2019-20 (in per cent)
Source: Survey Calculation using Offie of the Economic Adviser, DPIIT and NSO data.
STARTUPS DRIVE ECONOMIC GROWTH, CREATE EMPLOYMENT AND FOSTER A CULTURE OF INNOVATION. ANALYZE THE PERFORMANCE OF THE STARTUPS IN 2019?In order to promote innovation and entrepreneurship among enterprising youth, the Prime Minister of India had announced the “Startup India, Stand-up India” initiative on August 15, 2015. The initiative aims to create an ecosystem that is conductive for the growth of startups. A plan comprising 19 action points was unveiled on January 16, 2016. As on January 8, 2020, 27,084 startups were recognized across 551 districts, 55 per cent of which are from Tier I cities , 45 per cent from Tier II and Tier III cities.
43 per cent of recognized startups have at least one woman director. Steps have been taken for easing regulations such as exemptions from Income tax on investments raised by startups; implementation of 32 regulatory reforms to improve Ease of Doing Business for startups; self-certification regime for six labour laws and three environmental laws; and Startup India Hub as ‘One Stop Shop’ for the startup ecosystem in which 3,67,773 users have availed free Startup India learning Program to build business plans, etc. Maharashtra, Karnataka and Delhi are the top three performers in terms of State-wise distribution of recognized startups in India. As per industry-wise distribution of recognized startups, IT Services accounted for 13.9 per cent followed by Healthcare and Life Sciences (8.3 per cent) and education (7.0 per cent)
Figure: Major State-wise distribution of recognized startups in India (in per cent)Source: DPIIT.

UNIQUE P
UBLISHERS (I
) PVT. L
TD.
Content developed by UNIQUE PUBLISHERS (I) PVT. LTD.
Economic Survey & Budget112
Figure 8: Major Industry-wise distribution of recognized startups in India (in per cent)Source: DPIIT.
TABLE: STATUS OF KEY INITIATIVE FOR FASTER GROWTH OF MSMES AND PROMOTING EASE OF DOING BUSINESS
S.No. Initiative Status
1. In-principle approval for loans up to Rs. 1 crore within 59 minutes through online portal.
1,59,422 number of loans, involving Rs. 49,330 crore have been sanctioned and 1,38,646 number of loans, involving Rs. 37,106 crore have been disbursed (up to October 2019).
2. interest subvention of 2 per cent for all GST registered MS-MEs on incremental credit up to Rs. 1 crore.
SIDBI has received and settled the claims of Rs. 18 crore from 43 Banks/NBFCs for the period (02.11.2018–31.03.2019).
3 All companies with a turnover of more than Rs. 500 crore to be mandatorily on TReDS platform to enable entrepre-neurs to access credit from banks, based on their upcoming receivales
There were 1881 non-compliant Companies, out of these 1881 non-compliant Companies identified by Ministry of Corporate Affairs for taking action, so far 329 companies have registered themselves on the TRe DS portal.
4. All CPSUs to compulsorily procure at least 25 per cent from MSEs instead of 20 per cent of their total purchases
During 2019-20 (up to October 2019), CPSUs have pro-cured goods and services worth Rs. 15,936,39 crore from 59,903 MSEs and that is 28.26 per cent of the total procure-ment by CPSUs during the same period.
5. Out of the 25 per cent procurement mandated from MSEs, 3 per cent reserved for women entrepreneurs.
During 2019-20 (up to October 2019) procurement from 1471 women MSEs is of Rs. 242.12 crore and that is 0.43 per cent of the total procurement.
6. All CPSUs to compulsorily procure through GeM portal. 258 CPSUs/CPSBs have been on boarded/ registered on GeM portal post 02.11.2018. Total 57,351 MSE Sellers & Service providers registered on GeM portal and 50.30 per cent of orders value on GeM portal is from MSEs.
7. 20 Technology Centres (TCs) and 100 Extension Centers (ECs) to be established at the cost of Rs. 6,000 crore
Till date, six locations have been indentified for TCs, RFP issued for PMC for 20 TCs, DPRs of 20 ECs approved and Rs. 99.30 crore are released. 10 more ECs planned in FY 2019-20.
8. Government of india to bear 70 per cent of the cost for establishing Pharma clusters.
Four districts viz. Solan (Baddi), Indore, Aurangabad and Pune were selected for assisting pharama clusters for developing common facilities. In principle approval was granted for the proposal from Pune on 31.01.2019.

UNIQUE P
UBLISHERS (I
) PVT. L
TD.
Content developed by UNIQUE PUBLISHERS (I) PVT. LTD.
Industry and Infrastructure 113
S.No. Initiative Status
9. Returns under 8 labour laws and 10 Union regulations to be filed once in a year.
All regional Heads were advised to vigorously reach out to the employers in their region to make them aware about the facility of filing online Unified Annual Return on Shram Suvidha Portal under 8 Labour Laws and 10 Central Rules.
10. Establishment to be visited by an Inspector will be decide through a computerized random allotment.
Total 3080 inspections have been conducted which were assigned through computerized random allotment system and all inspection reports have been uploaded on Shram Suvidha Portal.
11. Single consent under air and water pollution laws, Returns will be accepted through self certification and only 10 per-cent MSME units to be inspected
All the operations were stayed by Hon ble High court of Delhi. As of now the matter is sub-judice.
12. For minor violations under the Companies Act, entrepre-neurs no longer have to approach court but can correct them through simple procedures.
So far action has been taken against two companies which fall in the category of MSME by imposition of penalty in-stead of filing case in the court as per Ordinance/Amend-ment Act.
Source: Ministry of Micro, Small and Medium Enterprises
WHAT IS THE CONCEPT OF NATIONAL INFRASTRUCTURE PIPELINE?Investment in Infrastructure is necessary for growth. To achieve the GDP of $5 trillion by 2024-25, India needs to spend about $1.4 trillion (`100 lakh crore) over these years on infrastructure. The challenge is to step-up annual infrastructure investment so that lack of infrastructure does not become a binding constraint to the growth of the Indian economy. To implement an infrastructure program of this scale, it is important that projects are adequately prepared and launched.
To draw up the National Infrastructure Pipeline (NIP) for each of the years from FY 2019-20 to FY 2024-25, an inter-ministerial Task Force was set up in September 2019 under the chairmanship of Secretary (DEA), Ministry of Finance.
NIP is expected to enable well-prepared infrastructure projects which will create jobs, improve ease of living, and provide equitable access to infrastructure for all, thereby making growth more inclusive. NIP also intends to facilitate supply side interventions in infrastructure development to boost short-term as well as the potential GDP growth. Improved infrastructure capacities will also drive competitiveness of the Indian economy.
The Finance Minister released the Report of the Task Force on National Infrastructure Pipeline (abridged version) on 31.12.2019. The NIP has projected total infrastructure investment of `102 lakh crore during the period FY 2020 to 2025 in India. Energy (24 per cent), Roads (19 per cent), Urban (16 per cent), and Railways
(13 per cent) amount to over 70 per cent of the projected capital expenditure during the said period.
As per the NIP, Central Government (39 per cent) and State Government (39 per cent) are expected to have equal share in funding of the projects followed by the Private Sector (22 per cent). It is expected that private sector share may increase to 30 per cent by 2025. Out of the total expected capital expenditure of ` 102 lakh crore, projects worth ` 42.7 lakh crore (42 per cent) are under implementation, projects worth ` 32.7 lakh crore (32 per cent) are in conceptualization stage and rest are under development. Hence about two-thirds of the pipeline is already firmed up. It is also expected that projects of certain states would be added to the pipeline in due course.
The Task Force has given its recommendations on required changes to several key sectoral policies and other reform initiatives by the Central and State Governments such as developing a robust bond market for infrastructure companies, speedy resolution of infrastructure disputes, optimal risk sharing through better and balanced PPP contracts, and sanctity and enforceability of contracts.
The NIP captures the infrastructure vision of the country for the period FY20-25. This is the first- ever exercise undertaken in the country. However, it is recognized that financing of the National Infrastructure Pipeline would be a challenge. It is hoped that a bouquet of well-prepared projects would attract investment from Central and State Governments, Urban Local Bodies, Banks and Financial Institution, PE funds, and private investors, both local and foreign.

UNIQUE P
UBLISHERS (I
) PVT. L
TD.
Content developed by UNIQUE PUBLISHERS (I) PVT. LTD.
Economic Survey & Budget114
Ministry/Department FY 20-25 (Amount in Rs. Crore)
Power 11,75,995
Renewable Energy 9,29,500
Atomic Energy 1,54,088
Petroleum and Natural Gas 1,94,666
Total Energy 2,454,249
Roads 19,63,943
Railways 13,68,523
Ports 1,00,923
Airports 1,43,398
Urban (AMRUT, SMART Cities, MRTS, affordable Housing, Jal Jeevan Mission)
16,29,012
Telecommunication 3,20,498
Irrigation 7,72,678
Rural Infrastructure
Rural Infrastructure 4,10,955
Water and Sanitation 3,61,810
Total Rural Infrastructure 7,72,765
Agriculture infrastructure 54,298
Food Processing Industries 1,255
Food and Public Distribution 5,000
Total Agriculture & Food Processing Infrastructure
60,553
Higher Education 1,18,348
School Education 37,791
Health and Family Welfare 1,68,622
Sports 7618
Tourism 24,321
Total Social Infrastructure 3,56,701
Industries and Internal Trade 2,99,237
Steel 8,2-25
Total Industrial Infrastructure 3,07,462
Total (Rs Crore) 102,50,704*
Note:# As on 31.12.2019 Subject to change as more data becomes available.
DISCUSS THE DIFFERENT VERTICALS OF THE PRADHAN MANTRI AWAS YOJANA- URBAN?The Pradhan Mantri Awas Yojana- Urban (PMAY-U) was launched in June, 2015 to provide pucca house with basic amenities to all eligible urban poor. The States/UTs were mandated to conduct demand survey to estimate
the housing demand in their respective cities/towns. So far, a validated demand of 1.12 crore houses has been registered. Urban habitats and cities are the epicentres of economic growth which has contributed significantly to the Indian economy. Over 60 per cent of India’s current GDP comes from the cities and towns. The construction sector accounts for 8.2 per cent of GDP which includes housing and employs about 12 per cent of the workforce. Therefore, the investment made under PMAY (U) not only provides pucca houses to the eligible families to achieve the goal of ‘Housing for All’ but also triggers multiplier effect on the overall economy. PMAY-U is one of the largest housing schemes of the world covering complete urban India. PMAY (U) is being implemented through four verticals.
The scheme of PMAY (U) is rapidly moving towards achieving the vision for providing a pucca house to every household by 2022. Out of 1.03 crore houses approved, 60 lakhs have been grounded for construction, of which 32 lakh houses have been completed and delivered.
The significant progress of PMAY (U) with regard to earlier schemes is an outcome of comprehensive strategy of inclusion, scheme architecture, use of digital/space technology, funding mechanism etc. As a principle, the scheme adopts demand driven approach carrying forward the ethos of cooperative federalism. Unlike the earlier schemes, the States/UTs have been authorised to prepare and approve the projects based on city wise demand survey to meet the requirement of their housing demand. A State Level Appraisal Committee (SLAC) for Technical Appraisal of the Projects and a State Level Sanctioning and Monitoring Committee (SLSMC) under the chairmanship of Chief Secretary of the States/UTs for approval of the projects have been constituted in each State/UT. As land and colonisation is the State subject, the function of beneficiary identification based on eligibility criteria has also been entrusted to States/UTs. Such flexibility has resulted in greater participation of the States/UTs and the citizens. The scheme has mandated ownership of the house in the name of female of household or in the joint name along with male member of the household to enable women’s empowerment.
Given the large number of houses sanctioned under the Mission, arrangement for regular funding for project is vital for grounding and completion of projects. Over and above the year-on-year budgetary provisions, a separate mechanism through creation of National Urban Housing Funds (NUHF) has been approved by Union Cabinet to mobilise resources through Extra Budgetary Resources (EBR) to the tune of ` 60,000 crore for funding PMAY(U). Such arrangement has enabled the Ministry to provide Central assistance in a time bound manner for
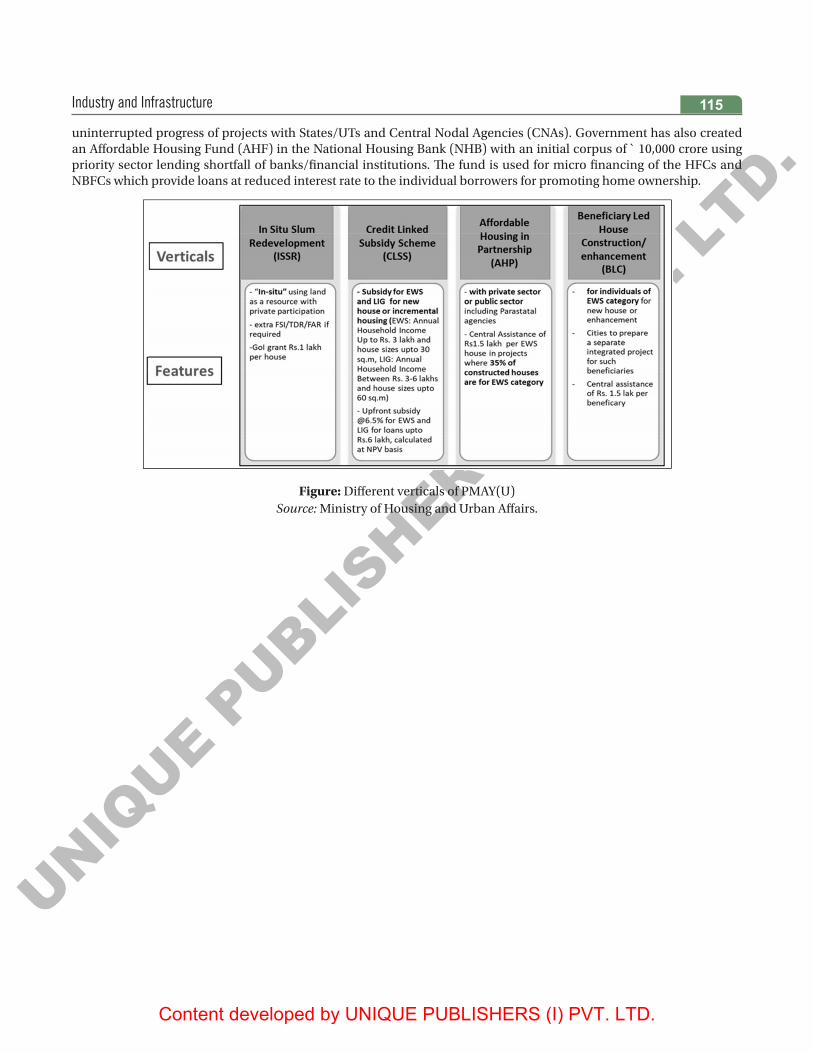
UNIQUE P
UBLISHERS (I
) PVT. L
TD.
Content developed by UNIQUE PUBLISHERS (I) PVT. LTD.
Industry and Infrastructure 115
uninterrupted progress of projects with States/UTs and Central Nodal Agencies (CNAs). Government has also created an Affordable Housing Fund (AHF) in the National Housing Bank (NHB) with an initial corpus of ` 10,000 crore using priority sector lending shortfall of banks/financial institutions. The fund is used for micro financing of the HFCs and NBFCs which provide loans at reduced interest rate to the individual borrowers for promoting home ownership.
Figure: Different verticals of PMAY(U)Source: Ministry of Housing and Urban Affairs.

UNIQUE P
UBLISHERS (I
) PVT. L
TD.
Content developed by UNIQUE PUBLISHERS (I) PVT. LTD.
Economic Survey & Budget116
HOW DOES INDIA FAIR IN WORLD COMMERCIAL SERVICES EXPORT?
BOX: INDIA IN WORLD COMMERCIAL SERVICES EXPORTS
The increasing role of services in economic activity is also reflcted in the growing importance of services in global trade and in India’s trade. Looking at two time periods, 2005-11 and 2012-2018, it is evident that both commercial services2 exports and goods exports have slowed in India and globally in the recent years (Table A). However, while merchandise exports were growing faster than commercial services exports during 2005-11, commercial services exports have outperformed goods exports lately. This has led to an increase in the share of commercial services exports in overall exports both in India and globally.
TABLE A: PERFORMANCE OF SERVICES AND MERCHANDISE EXPORTS IN INDIA AND WORLD
Country Growth in merchandise exports (per cent)
Growth in commercial services exports (per cent)
Share of commercialservices exports in total
exports (per cent)
CAGR2005-11
CAGR2012-18
CAGR 2005-11 CAGR 2012-18 2005 2018
World 9.7 0.8 8.9 4.4 19.8 22.9
India 20.4 1.5 17.7 5.9 34.2 38.6
Source: WTO.Note: Calculations are on calendar year basis.According to WTO data, India’s share in world’s commercial services exports has risen steadily over the past decade to reach 3.5 per cent in 2018, twice the share in world’s merchandise exports at 1.7 per cent. India now ranks 8th among the world’s largest commer-cial services exporters and continues to register strong growth performance relative to the other major services-exporting countries as well as world services export growth (Table B).
TABLE B: COMMERCIAL SERVICES EXPORTS IN TOP 10 EXPORTING COUNTRIES
Country Share in glob-al commercial
services exports in 2018
Global ranking in 2018
Growth in Commercial Services Exports (per cent YoY)
2017 2018 Jan-June2019
World 8.0 7.7 N.A.
USA 14.0 1 5.2 3.8 0.7
UK 6.5 2 2.4 5.6 -3.0
Germany 5.6 3 8.0 7.3 -2.4
France 5.0 4 5.7 6.2 -7.0
China 4.6 5 8.7 17.1 4.2
Netherlands 4.2 6 14.3 11.4 3.4
Ireland 3.6 7 20.5 14.3 10.9
India 3.5 8 14.5 10.7 7.1
Japan 3.2 9 6.4 3.1 3.6
Singapore 3.2 10 10.0 6.6 -2.1
2 Commercial services exports refer to all services exports excluding government services.
9Services Sector

UNIQUE P
UBLISHERS (I
) PVT. L
TD.
Content developed by UNIQUE PUBLISHERS (I) PVT. LTD.
Services Sector 117
Among the major services-exporting economies, India also has a relatively high share of services exports in overall exports (Figure A).
Figure: Share of Commercial Services Exports in Total Exports for Major Economies in 2018
Source: Calculations based on WTO data.
Note: Calculations are on calendar year basis.
DISCUSS THE SHARE OF TOURISM AND EMPLOYMENT GENERATION IN THE STATES IN 2019?
BOX: SHARE OF TOURISM IN GVA AND EMPLOYMENT OF STATES
The Ministry of Tourism along with the National Council of Applied Economic Research (NCAER) has prepared a Tourism Satellite Account (TSA) following the methodology recommended by the UN World Tourism Organization. The state-wise share of Tourism Direct Gross Value Added (TDGVA) in state GVA and share of tourism employment in total state employment have been estimated in the Ministry of Tourism and NCEAR’s draft report (Table A).
TABLE A: SHARE OF TOURISM IN STATE GVA AND EMPLOYMENT
States Share of TDGVA in State GVA in 2015-16 Share of Tourism Employment in State Em-ployment in 2015-16
Direct (per cent) Direct and Indirect (per cent)
Direct (per cent) Direct and Indirect (per cent)
Andaman & Nicobar Islands
4.63 10.39 11.09 24.07
Andhra Pradesh 2.29 4.66 5.41 12.84
Arunachal Pradesh 1.21 2.39 2.20 4.76
Assam 2.19 4.32 4.41 8.75
Bihar 2.96 5.99 4.17 10.50
Chandigarh 3.87 9.17 6.70 12.37
Chhattisgarh 2.13 4.44 2.41 7.65
Dadra & Nagar Haveli 0.79 1.79 7.01 23.81
Daman & Diu 0.75 1.36 11.71 29.35
Delhi 4.32 7.78 12.40 21.05
Goa 5.50 11.55 19.38 40.92

UNIQUE P
UBLISHERS (I
) PVT. L
TD.
Content developed by UNIQUE PUBLISHERS (I) PVT. LTD.
Economic Survey & Budget118
States Share of TDGVA in State GVA in 2015-16 Share of Tourism Employment in State Em-ployment in 2015-16
Direct (per cent) Direct and Indirect (per cent)
Direct (per cent) Direct and Indirect (per cent)
Gujarat 1.78 3.96 5.85 15.39
Haryana 1.95 3.88 5.98 10.15
Himachal Pradesh 3.20 6.89 10.23 20.23
Jammu & Kashmir 3.68 7.48 6.74 16.45
Jharkhand 2.10 4.18 3.89 9.12
Karnataka 2.63 5.74 5.46 17.74
Kerala 4.34 8.72 11.20 25.87
Lakshadweep 4.30 9.02 21.95 49.71
Madhya Pradesh 2.39 4.90 3.34 8.45
Maharashtra 3.08 5.52 5.66 12.46
Manipur 2.38 5.50 6.25 12.05
Meghalaya 2.39 5.22 2.87 10.44
Mizoram 1.25 2.55 4.57 10.96
Nagaland 1.87 3.55 3.58 8.34
Odisha 2.43 5.00 5.27 12.11
Puducherry 1.73 4.08 14.25 56.24
Punjab 1.90 3.75 6.69 12.33
Rajasthan 2.73 5.63 5.18 11.26
Sikkim 2.12 4.40 6.84 13.07
Tamil Nadu 2.59 5.37 6.36 15.97
Telengana 2.29 5.07 5.13 17.83
Tripura 1.53 2.99 3.05 5.05
Uttar Pradesh 2.24 4.63 4.46 11.39
Uttarakhand 2.29 5.27 7.99 21.18
West Bengal 2.09 4.30 6.41 14.34
Source: Ministry of Tourism, NCAER
UNIQUE P
UBLISHERS (I
) PVT. L
TD.
Content developed by UNIQUE PUBLISHERS (I) PVT. LTD.
Social Infrastructure, Employment and Human Development 119
10 Social Infrastructure, Employment and Human Development
DISCUSS VARIOUS SCHEMES FOR SCHOOL EDUCATION?Earlier, Sarva Shiksha Abhiyan (SSA) effective till 2017-18 was the designated Centrally Sponsored Scheme to meet the objectives of the RTE Act in elementary schools, provided assistance to State Governments and UTs for universalization of elementary education in the country. The Department of School Education and Literacy has launched an Integrated Scheme for School Education - Samagra Shiksha w.e.f. 2018-19, which subsumes three erstwhile Centrally Sponsored Schemes of Sarva Shiksha Abhiyan (SSA), Rashtriya Madhyamik Shiksha Abhiyan (RMSA) and Teacher Education (TE). The new integrated scheme envisages school education as a continuum from pre-school to senior secondary level and aims to ensure inclusive and equitable quality education. Under Samagra Shiksha, States and UTs are supported for strengthening of existing government schools, and for creation and augmentation of infrastructure facilities based on proposals received from respective States/UTs. The scheme also envisages an annual recurring composite school grant varying from ` 25,000/- to ` 1,00,000/- per annum depending upon the enrollment of students, for all government schools. Each school is required to spend at least 10 per cent of the composite school grant on activities related to Swachhata Action Plan. The scheme also provides for annual maintenance and repair of existing school building, toilets and other facilities to upkeep the infrastructure in good condition besides various interventions for improvement of quality of education such as induction and in-service training of teachers and school heads, learning enhancement programmes, use of ICT in education, assessment of learning outcomes, provision of libraries and supplementary graded material to schools etc. • To further focus on quality education, the Central RTE
Rules have been amended to include reference on class-wise and subject-wise Learning Outcomes. The Learning Outcomes for each class in Languages (Hindi, English and Urdu), Mathematics, Environmental Studies, Science and Social Science up to the elementary stage have, accordingly, been finalized and shared with all States/UTs. These would serve as a guidelines for States and UTs to ensure that all children acquire appropriate learning level. The RTE Act, 2009 was amended in 2017 to ensure that all teachers acquire the minimum qualifications prescribed under the Act
by 31st March, 2019 to reinforce the Government’s emphasis on improvement of quality of elementary education.
• The Navodaya Vidyalaya Scheme provides for opening of one Jawahar Navodaya Vidyalaya (JNV) in each district of the country to bring out the best of rural talent. Its significance lies in the selection of talented rural children as the target group and aims to provide them quality education comparable to the best in a residential school system.
• A National Mission called NISHTHA – National Initiative for School Heads’ and Teachers’ Holistic Advancement under the Centrally Sponsored Scheme of Samagra Shiksha in 2019- 20 is being launched to improve learning outcomes at the elementary level. The Integrated Teacher Training Programme envisages to build the capacities of around 42 lakh teachers and head of schools, faculty members of SCERTs, DIETs, Block Resource Coordinators, and Cluster Resource Coordinators. The aim of this training is to motivate and equip teachers to encourage and foster critical thinking in students, handle diverse situations and act as first level counsellors.
• Promoting joyful learning through cultural activities including art, music, dance and theatre is playing a very critical role in a student’s life and school activities. The National Curriculum Framework emphasized the importance of such activities and how they helped to enhance learning.
• Pradhan Mantri Innovative Learning Program (DHRUV) was launched to identify and encourage talented students to enrich their skills and knowledge.
• To broadbase technology aided teaching and learning, States and UTs are being actively involved to contribute and use the Digital Infrastructure for Knowledge Sharing (DIKSHA) platform. Steps are also being taken to improve the quality and diversify the nature of e-content on DIKSHA. Other e-content sites like e-pathsala, National Repository of Open Educational Resources (NROER) are also being integrated with DIKSHA to ensure easy access.
DISCUSS VARIOUS PROGRAMS FOR HIGHER EDUCATION?The government launched Pandit Madan Mohan Malaviya National Mission on Teachers and Teaching (PMMMNMTT) which aims at building a strong
UNIQUE P
UBLISHERS (I
) PVT. L
TD.
Content developed by UNIQUE PUBLISHERS (I) PVT. LTD.
Economic Survey & Budget120
professional cadre of teachers by setting performance standards and creating top class institutional facilities for innovative teaching and professional development of teachers in higher education. Teachers of existing
Central, State Universities/Educational Institutions including private institutions can participate in capacity building programmes as well as induction training.• Higher Education Financing Agency (HEFA) was
established to provide sustainable financial model for higher education institutions, Kendriya Vidyalayas, Navodaya Vidyalayas, AIIMS and other educational institutions of the Ministry of Health with the objective to fund projects to the tune of ` 1 lakh crore by 2022.
• National Educational Alliance for Technology (NEAT) announced a PPP Scheme for using technology for better learning outcomes in Higher Education. The objective is to use Artificial Intelligence to make learning more personalised and customised as per the requirements of the learner. This requires development of technologies in Adaptive Learning to address the diversity of learners. EdTech companies would be responsible for developing solutions and manage registration of learners through the NEAT portal.
• The Department of Higher Education, in the Ministry of Human Resource Development has finalized and released a five-year vision plan named Education Quality Upgradation and Inclusion Programme (EQUIP). EQUIP is a vision plan aiming at ushering transformation in India’s higher education system by implementing strategic interventions in the sector over the next five years (2019-2024).
• SWAYAM 2.0 was launched to offer online degree programmes with enhanced features and facilities by top ranking universities. ‘Deeksharambh’ a guide to student induction programme and ‘PARAMARSH’ scheme is to mentor institutions seeking National Assessment and Accreditation Council accreditation are some of the other major schemes of Department of Higher Education launched in 2019.
A WIDE RANGE OF REFORMS HAS BEEN INTRODUCED TO THE APPRENTICESHIP RULES, 1992 FOR EXPANSION AND OUTREACH OF APPRENTICESHIP POLICY. DISCUSS?• Increasing upper limit for engaging apprentices from
10 to 15 per cent of total strength of establishment; • Decreasing the size limit of an establishment with
mandatory obligation to engage apprentices from 40 to 30;
• Payment of stipend for 1st year has been fixed rather than linking it to minimum wages;
• 10 to 15 per cent hike in stipend for 2nd and 3rd year of apprenticeship;
• Duration of apprenticeship training for optional trade can be from 6 months to 3 years.
• The minimum amount of stipend prescribed ranges from `5,000 per month - for school pass outs between Class 5th-9th, to `9,000 per month to graduate or degree apprentices in any stream.
DISCUSS THE STEPS TAKEN BY THE GOVERNMENT FOR THE FORMALIZATION OF LABOR MARKET?• For portability of Provident Fund accounts, EPFO
launched a “Universal Account Number” service for contributing members.
• Government is paying 12 per cent of employer contribution to EPFO in respect of the new employees drawing salary up to `15,000 per month for the first three years of their employment, under Pradhan Mantri Rozgar Protsahan Yojana (PMRPY). The scheme has ended on 31st March, 2019.
• Mandatory wage ceiling of subscription to EPS increased from `6,500 to `15,000 per month. The Code on Wages Act, 2019 to ensure minimum wages to all and timely payment of wages to all employees irrespective of the sector of employment without any wage ceiling, except MGNREGA.
• MUDRA and STAND-UP India for creating formal credit to businesses.
• Rate of ESI contribution reduced from 6.5 per cent to 4 per cent with effect from 1st July, 2019. Employer’s share of contribution reduced from 4.75 per cent to 3.25 per cent and employees’ share from 1.75 per cent to 0.75 per cent.
• National Career Service (NCS) Project launched in 2015, provides a host of career-related services such as dynamic job matching, career counselling, job notifications and information on skill development courses and rich career content on a digital platform. NCS works towards bridging the gap between job-seekers and employers candidates seeking training and career guidance, agencies providing training and career counselling by transforming the National Employment Service.
UNIQUE P
UBLISHERS (I
) PVT. L
TD.
Content developed by UNIQUE PUBLISHERS (I) PVT. LTD.
Social Infrastructure, Employment and Human Development 121
TO ENCOURAGE FEMALE PARTICIPATION IN THE ECONOMY, VARIOUS PROGRAMMES/ LEGISLATIVE REFORMS ARE IN PLACE. DISCUSS?A number of protective provisions have been incorporated in various labour laws for creating congenial work environment for women workers such as child care centers, time-off for feeding children, enhancement in paid maternity leave from 12 weeks to 26 weeks, provisions for mandatory crèche facility in the establishments having 50 or more employees, permitting women workers in the night shifts with adequate safety measures, etc. The Equal Remuneration Act, 1976 provides for payment of equal remuneration to men and women workers for same work or work of similar nature without any discrimination. Under the provisions of the Minimum Wages Act, 1948, the wages fixed by the appropriate Government are equally applicable to both male and female workers without any gender discrimination. In order to enhance the employability of female workers, the Government is providing training to them through a network of women Industrial Training Institutes, National Vocational Training Institutes and Regional Vocational Training Institutes. Besides these, various initiatives have been implemented for empowerment of women across the country. The details of these major schemes are as under:• Safety of Women at Workplace: Safety and security
of women in the country is of utmost priority for the Government. The Sexual Harassment of Women at Workplace (Prevention, Prohibition and Redressal) Act, 2013 covers all women, irrespective of their age or employment status and protects them against sexual harassment at all workplaces both in public and private sector, whether organized or unorganized. The Act mandates all the workplace having more than 10 workers to constitute Internal Complaint Committee (ICC) for receiving complaints of sexual harassment. Similarly, the appropriate Government is authorized to constitute Local Complaint Committee (LCC) in every district which will receive complaints from organizations having less than 10 workers or if the complaint is against the employer himself.
• Mahila Shakti Kendra Scheme: This scheme aims to empower rural women through community participation. The scheme envisages community engagement through College Student Volunteers to empower rural women in 115 aspirational districts as part of block level initiatives.
• Provision of safe and affordable accommodation: To provide safe and affordable accommodation to working women, Working Women Hostels have been
established. These hostels have day care facility for the children of inmates too.
• Women Helpline Scheme (WHL): WHL implemented since 1st April, 2015 to provide 24 hours emergency and non-emergency response to women affected by violence through referral and information about women related government schemes/programmes across the country through a single uniform number (181).
• One Stop Centre (OSC): This scheme facilitates access to an integrated range of services including police, medical, legal, psychological support and temporary shelter to women affected by violence. One Stop Centres are being set up in all districts of the country.
• Female Entrepreneurship: To promote female entrepreneurship, the Government has initiated schemes like: MUDRA, Stand Up India and Mahila e-Haat (online marketing platform to support women entrepreneurs/ SHGs/NGOs). Pradhan Mantri Mudra Yojana (PMMY) provides access to institutional finance to micro/small business units upto `10 lakh. Out of total beneficiaries, almost 75 per cent were women borrowers. To encourage further coverage of women borrowers, the Micro Units Development and Refinance Agency Ltd. (MUDRA) extends a rebate of 0.25 per cent on its refinance interest rate for PMMY loans given by Micro Finance Institutions to women borrowers. Stand-UP India, the Government provides bank loans between ̀ 10 lakh and ̀ 1 crore to at least one Scheduled Caste (SC)/ Scheduled Tribe (ST) borrower and at least one- woman borrower per bank branch for setting up greenfield enterprises in the manufacturing, services or the trading sector.
• Rashtriya Mahila Kosh (RMK) is an apex micro-finance organization that provides micro-credit at concessional terms to poor women for various livelihood and income generating activities. Among other things, RMK also promotes and supports expansion of entrepreneurship skills among women.
PRIME MINISTER’S EMPLOYMENT GENERATION PROGRAMME (PMEGP)Under the scheme, women entrepreneurs are provided 25 per cent and 35 per cent subsidies for the project set up in urban and rural areas respectively. For women beneficiaries, own contribution is only 5 per cent of the project cost while for general category it is 10 per cent. All the entrepreneurs including women are eligible for 2 weeks Entrepreneurship Development Programme (EDP) after the sanction of their projects from banks for financial assistance to setup their unit and also imparting training under EDP.

UNIQUE P
UBLISHERS (I
) PVT. L
TD.
Content developed by UNIQUE PUBLISHERS (I) PVT. LTD.
Economic Survey & Budget122
DEENDAYAL ANTYODAYA YOJANANational Rural Livelihoods Mission (DAY-NRLM) - seeks to reach out to 8-9 crore rural poor households and organize one-woman member from each household into affinity-based women SHGs and federations at village and at higher levels. Support is provided to the women for employment and self- employment venture under the scheme to enhance their farm livelihoods and non-farm livelihood through various components of schemes such as organic farming, Krishi Sakhi, Pashu Sakhi, dairy value chain interventions, Aajeevika Grameen Express Yojana, Start-up Village Entrepreneurship Programme etc. DAY-NRLM provides Revolving Funds (RF) at the rate of ` 10,000-15,000 per SHG and Community Investment Support Fund (CISF) to the extent of ` 2.5 lakh per SHG to support their income generating and livelihood activities.
THE INTRODUCTION OF NATIONAL HEALTH POLICY, 2017 AIMS FOR UNIVERSAL ACCESS TO GOOD QUALITY HEALTH CARE SERVICES. ANALYZE?The introduction of National Health Policy, 2017 for universal access to good quality health care services, and subsequent launch of Ayushman Bharat, with its two components: 1) Health & Wellness Centres to provide comprehensive primary health care, and 2) Pradhan Mantri Jan ArogyaYojana (PMJAY) to provide health cover to 10.74 crore poor & vulnerable families upto ` 5 lakh per family per year for secondary & tertiary hospitalization, speaks about Government’s efforts for a healthy India. The focus of healthcare is on four important pillars - preventive healthcare, providing affordable healthcare, building medical infrastructure and mission mode interventions for maternal health, child health and to combat communicable and non-communicable the marked increase in burden of non-communicable diseases, the Government is now focused on addressing this epidemiological transition from communicable diseases (CDs) to non- communicable diseases (NCDs).
To promote preventive healthcare, one and half lakh Ayushman Bharat- Health & Wellness Centres (AB-HWCs) are proposed to be set up by 2022. A total of 28,005 have already been set up (as on 14 Jan 2020) to deliver comprehensive Primary Health Care services with focus on universal high quality screening, prevention, control and management of common
NCDs such as Hypertension, Diabetes, and the three common Cancers – Oral Cavity, Breast and Cervical Cancer, while continuing to provide services for Reproductive,
Maternal, Adolescent and Child health (RMNCH+A) and for communicable diseases.
Under Mission Indradhanush, 3.39 crore children and 87.18 lakh pregnant women in 680 districts across the country (including Gram Swaraj Abhiyan [GSA] & extended GSA) have been vaccinated. New vaccines such as Measles-Rubella (MR), Pneumococcal Conjugate Vaccine (PCV), Rotavirus Vaccine (RVV) and Inactivated Polio Vaccine (IPV) have been introduced.
Ayushman Bharat- Pradhan Mantri Jan Arogya Yojana (PM-JAY), the world’s largest health insurance scheme, is a major step towards providing affordable healthcare to the identified poor. The Scheme has been rolled out based on the deprivation and occupational criteria of the Socio- Economic Caste Census for rural and urban areas respectively. In addition, AB-HWCs will provide free essential medicines and diagnostic services closer to the community for their primary healthcare needs thereby aiming to reduce OoPE.
Recognising the threat of nicotine addiction among youth and children through gateway products such as e-cigarettes, the government recently banned all commercial operations in e-cigarettes. Large pictorial warnings and
Quit line number on tobacco packs and the resulting increased call volumes from 20,000 to 2.50 lakh calls per month at the quit line services, indicate that government’s efforts to reduce tobacco use are starting to bear fruit.
Under Free Drugs Service initiative, substantial funds have been given to States for provision of free drugs. All States/UTs have notified policy to provide essential drugs free in health facilities. Drugs procurement, quality system and distribution has been streamlined through IT based Drug Distribution Management Systems in 29 States.
Free Diagnostics Service initiative was launched to address the high OoPE on diagnostics and improve quality of healthcare services. The guidance document for implementation of Free Laboratory Services in States/ UTs was released in August 2019 to guide States/ UTs on planning and implementing Labs services in Hub and Spoke model, and the range of diagnostics tests have been expanded from earlier 7 tests to 14 tests at Sub Centre/ Health & Wellness Centre level, 19 tests to 63 tests at PHC level, 39 tests to 97 tests at CHC level and 56 tests to 134 tests at DH level. The tests encompass hematology, serology, bio-chemistry, clinical pathology, microbiology, radiology, and cardiology.
In addition to the above, Pradhan Mantri Bharatiya Jan Aushadi Pariyojana (PMBJP) and Pradhan Mantri National Dialysis Programme (PMNDP) are some of the new initiatives that address the issue of high OoPE on account of drugs and hospital care.
UNIQUE P
UBLISHERS (I
) PVT. L
TD.
Content developed by UNIQUE PUBLISHERS (I) PVT. LTD.
Social Infrastructure, Employment and Human Development 123
In order to intensify efforts towards achievement of SDGs, the Government has launched ambitious programmes such as Ayushman Bharat, marking a paradigm shift in the way health care is delivered. Ayushman Bharat targets universal health coverage by focusing on preventive, promotive and palliative care apart from ambulatory care; and by providing protection against catastrophic health expenditure for secondary and tertiary hospital care. The new paradigm recognizes and addresses the emerging challenges of NCDs due to changing epidemiology and also targets to sustain the efforts for RMNCH+A and communicable diseases through
initiatives such as as Surakshit Matritva Aashwasan (SUMAN), Social Awareness and Action to Neutralise Pneumonia Successfully (SAANS) and TB Harega Desh Jeetega.
The AB-HWCs would follow a well- defined referral and return linkages to ensure continuum of care. At all levels, tele- consultation would be used to improve referral advice and undertake virtual consultation including case management support by doctors and specialists. Several states have also initiated the use of digital platforms such as ECHO for continuous capacity building of the primary health team.

UNIQUE P
UBLISHERS (I
) PVT. L
TD.
Content developed by UNIQUE PUBLISHERS (I) PVT. LTD.
Economic Survey & Budget124
BUDGET 2020 HIGHLIGHTS
Fiscal deficit target pegged at 3.8% of GDP for FY20. Insurance cover for bank depositors has been raised from Rs 1 lakh to Rs 5 lakh.
In a shot in the arm for the middle class, Sitharaman has proposed a new simplified tax regime soon. The 10% tax for income between 5 lakh-7.5 lakh; 15% tax for income between 7.5 lakh to 10 lakh; 20% tax for income between 10 lakh to 12.5 lakh; 25% tax for income between 12.5 lakh to 15 lakh ; 30% tax for income above 15 lakh. No income tax for those with taxable income below Rs 5 lakh,”
UNION BUDGET 2020 HIGHLIGHTS1. Between 2006-2016, 271 million are out of poverty.2. Country has moved on from over 4 per cent growth in
1950s to 7.4 per cent to 2014-19 period.3. Total of 60 lakh new taxpayers and 105 crore e-way
bills generated under GST. Average household now saves 4 percent of monthly spend due to reduced GST rates.
4. Government debt reduced to 48.7 per cent of GDP in 2019 from 52.2 per cent.
5. A 16-point guide to make India an aspirational economy. India is now 5th largest economy in world.
6. Government to incentivise farmers to go solar. Over 6 crore farmers under Pradhan Mantri Fasal Bima Yojna have been insured. Pradhan Mantri Kisan Urja Suraksha and Utthan Mahabhiyan (PM KUSUM) to be expanded, providing 20 lakh farmers in setting up standalone solar pumps.
7. Railways will set up Kisan Rail through PPP model so that perishable goods can be transported quickly. Krishi Udaan scheme to transport agri products to national as well international destinations to be launched.
8. Agri-credit target for the year 2020-21 has been set at Rs 15 lakh crore.
9. Rs 69,000 crores for allocated for the healthcare sector.
10. Education and training: Rs 99,300 crore allocated for education in FY21. Government will start Ind-Sat Exam to promote study in India and a degree-level online education programme for the deprived. A total of Rs 3,000 crore will be given for skill development.
11. Allocation for Swachh Bharat Mission for 2020-21 stands at Rs 12,300 crore. In further push to PM Modi’s ‘Nal se jaal’ scheme, govt proposes Rs 3.6 lakh crore towards piped water supply to households.
12. National Textile Mission to be launched with a proposed Rs 1,480 crore allocation.
13. To boost infrastructure, Sitharaman says 9,000 km of economic corridor will be set up. “Chennai-Bengaluru expressway will also be started. Delhi-Mumbai expressway to be completed By 2023.
14. 550 WiFi facilities have been commissioned at railway stations. 1 lakh gram panchayats to get optical fibre link. An allocation of Rs 6,000 crore will be provided for BharatNet scheme.
15. Allocation of Rs 27,300 crore for development of industry and commerce.
16. Rs 20,000 crore for renewable energy sector in a bid to tackle pollution and climate change. A new scheme of smart meters will be launched.
17. A proposal to setup 100 more airports to be developed by 2025. FM also said 1,150 trains will run under the public private partnership (PPP) mode, also four stations will be redeveloped with the help of the private sector. Besides, the minister promised more Tejas type trains to connect tourist destinations.
An allocation of Rs 8,000 crore will be made for National Mission on Quantum Computing and Technology.
18. Rs 35,600 crore allocated for nutritional related programme in FY21 while Rs 85,000 crore has been budgeted for the welfare of Scheduled Castes and other backward classes. Tourism promotion gets Rs 2500 crore.
19. Women schemes, senior citizens in Budget: enrolment ration for girls under ‘Beti Bachao Beti Padhao‘ is higher than boys. “Gross enrollment of girls is 94.32 per cent in elementary levels, 81.32 per cent in secondary level and 59.7 per cent in higher secondary level,”. Further, Rs 28,600 crore will be allocated in FY21 for women-linked programmes. Allocation for senior citizens and ‘Divyang’ enhanced to Rs 9500 crore.
20. Rs 4,400 crore to tackle Delhi’s air pollution problem. 21. Insurance cover for bank depositors raised
from Rs 1 lakh to Rs 5 lakh. Currently, in the (unlikely) event of a bank going bust in India, a depositor has claim to a maximum of Rs 1 lakh per account as insurance cover — even if the deposit in their account far exceeds Rs 1 lakh. Depositors holding more than Rs 1 lakh in their account have no legal remedy in case of the collapse of the bank.

UNIQUE P
UBLISHERS (I
) PVT. L
TD.
Content developed by UNIQUE PUBLISHERS (I) PVT. LTD.
Budget 2020 Highlights 125
22. Foreign direct investment (FDI) into the country has increased to $284 billion during 2014-19 from $190 billion in previous five years.
23. Nirvik (Niryat Rin Vikas Yojana) scheme to provide enhanced insurance cover and reduce premium for small exporters.
24. Focus on MSMEs: More than 5 lakh MSMEs benefited from RBI’s restructuring of loans. “Government has asked RBI to consider extending window of debt structuring by one year to March 2021 for this purpose.
25. Fiscal deficit target pegged at 3.8% of GDP for FY 2019-20. FY21 fiscal deficit target pegged at 3.5% of GDP. Fiscal deficit is considered the most important marker of a government’s financial health. Not letting the fiscal deficit go completely out of control has been one of the standout achievements of the Modi government.
26. Government to sell part holding in LIC. Besides, govt to also sell stake in IDBI Bank to private investors. That LIC has been identified as a candidate for a potential public listing by the government. The government’s move is a part of efforts to push through an aggressive disinvestment and asset monetisation programme.
27. Nominal growth of GDP for 2020-21 has been estimated at 10 per cent.
28. A simplified tax regime soon. New income tax rates: 10% tax for income between 5 lakh-7.5 lakh; 15% tax for income between 7.5 lakh to 10 lakh; 20% tax for income between 10 lakh to 12.5 lakh; 25% tax for income between 12.5 lakh to 15 lakh; 30% tax for income above 15 lakh.
29. On account of the income tax relief, it will cost the exchequer Rs 48,000 crore revenue loss. “Dividend Distribution Tax to be removed. Dividend shall be taxed at the hands of the recipients.
30. To boost investments and shore up the lagging economy, corporate tax for existing companies slashed to 22 per cent. Government proposes 100 per cent tax concession to sovereign wealth funds on investment in infra projects. Moreover, concessional tax rate of 15 per cent extended to power generation companies.
31. Coming to affordable housing now: government extends additional Rs 1.5 lakh tax benefit on interest paid on affordable housing loans to March 2021. In another boost, government proposes tax holiday to affordable housing developers.
32. ‘Vivad se Vishwas’ scheme announced by government for direct tax payers whose appeals are pending at
various forum. 4.83 lakh direct cases pending in various appellate forums.
“Under the scheme, taxpayer to pay only amount of disputed tax. They will get complete waiver on interest and penalty if scheme is availed by March 31, 2020.
33. 15th Finance Commission has cut state share of central taxes by one percentage point to 41 per cent.
34. The Finance Secretary has stated that LIC IPO may come in the second half of the Fiscal Year 2021
Items that will become Costlier
• Imported footwear• Imported furniture — Seats, articles of bedding,
including mattresses, lamps, lighting, illuminated signs• Imported medical equipment• Cigarettes, tobacco products• Household items — Tableware/kitchenware made of
porcelain or China ceramic, clay iron, steel, copper, glassware, padlocks, brooms, hand sieves, combs, vacuum flasks
• Electrical equipment– Fans, food grinders/mixers, shavers and hair removing appliances, water heaters, hair/hand drying apparatus, ovens, cookers, toasters, coffee/ tea makers, insect repellents, heaters, irons
• Stationery items — Filing cabinets, paper trays, binders, clips, staples, sign-plates, name plates, numbers and symbols made from base metal
• Parts of commercial vehicles, other than electric vehicles
• Toys — Tricycles, scooters, scale models, dolls• Certain alcoholic beverages• Mobile Phones• Imported electric vehicles
Items that will become Cheaper
• Light weight coated paper, newsprint• Sports goods — Willow allowed duty free import up
to 3% of FOB value of sports goods exported in the preceding financial year
• Anti-dumping duty on purified terephthalic acid (PTA) abolished
• Raw sugar, agro-animal based products, Tuna bait, skimmed milk, soya fibre, soya protein
• Microphone and parts: Microphone cartridge, microphone holder, microphone grill, microphone body
• Precious metals: Platinum and Palladium

UNIQUE P
UBLISHERS (I
) PVT. L
TD.
Content developed by UNIQUE PUBLISHERS (I) PVT. LTD.
Economic Survey & Budget126

UNIQUE P
UBLISHERS (I
) PVT. L
TD.
Content developed by UNIQUE PUBLISHERS (I) PVT. LTD.
Budget 2020 Highlights 127

UNIQUE P
UBLISHERS (I
) PVT. L
TD.
Content developed by UNIQUE PUBLISHERS (I) PVT. LTD.