Computational Evaluation of Shock Wave Interaction with a ...
Upload
independentCategory
view
1download
0
INTERNATIONAL JOURNAL FOR NUMERICAL METHODS IN ENGINEERINGInt. J. Numer. Meth. Engng 2003; 58:609–630 (DOI: 10.1002/nme.791)
Underwater shock-free surface–structure interaction
T. G. Liu1, B. C. Khoo2;3;∗;†, K. S. Yeo2 and C. Wang2
1Institute of High Performance Computing; 1 Science Park Road; #01-01 The Capricorn;Singapore Science Park II; Singapore 117528; Singapore
2Department of Mechanical Engineering; National University of Singapore; 10 Kent Ridge Crescent;Singapore 119260; Singapore
3Singapore-MIT Alliance; 4 Engineering Drive 3; National University of Singapore;Singapore 117576; Singapore
SUMMARY
A recently developed numerical method has been employed to evaluate the in�uence of free surfaceon shock loading in a cylindrical underwater explosion carried out near to both a free surface and acylindrical rigid structure. In the usual simulation of underwater shock–structure interaction, the shockloading tends to accelerate=move the (rigid) structure only in the resultant force direction. The presenceof a free surface and explosion bubble suggests the existence of a reverse loading and provides anadditional torque (rotational moment) on the loaded structure. The numerical results also demonstratethe possible existence of a cavitation zone=region in the immediate vicinity of the free surface due tothe near-surface underwater explosion. Copyright ? 2003 John Wiley & Sons, Ltd.
KEY WORDS: underwater shock; free surface; wave interaction; submerged structure; gas bubble–waterinterface
1. INTRODUCTION
An underwater explosion generates a very strong shock wave propagating in all directionsand a bubble of gaseous products at high temperature and pressure. Such a strong underwatershock poses a severe threat to the integrity of any nearby structure. Besides the considerabledamage on the structure due to the shock, the subsequent much later development of thebubble and its interaction with the surrounding water can produce other phenomena, whichcan be just as devastating. Of particular interest to us in this work, however, are the e�ectson submerged structure due to shock-free surface interaction, which predominates in the earlystages of an underwater explosion close to the free surface.Researchers have previously and extensively investigated the shock loading by an
underwater explosion. The work by Cole [1] is reckoned to be the pioneer in the study ofunderwater explosion. Besides experimental investigation, the early numerical work in this �eld
∗Correspondence to: B. C. Khoo, Department of Mechanical Engineering, National University of Singapore,10 Kent Ridge Crescent, Singapore 119260, Singapore.
†E-mail: [email protected]
Received 11 April 2001Revised 16 October 2002
Copyright ? 2003 John Wiley & Sons, Ltd. Accepted 19 November 2002
610 T. G. LIU ET AL.
is based on theoretically simpli�ed model like that carried out by Chen and Collins [2], whocalculated the shock loading using a plane shock re�ection theory on a submerged cylindricalrigid structure. With the appearance of powerful workstation and the availability of commercialsoftware, simulations of more complicated �ow and complex structural geometry becomepossible. The more recent works by Brett [3], Aanhold et al. [4] and Wood [5] are all imple-mented using commercial software such as USA and DYNA, where �ow-deformable structureinteraction can be coupled. It is always expedient to use currently available commercial soft-ware. On the other hand, it is important that numerical accuracy of computation is maintainedand the code is viable against known experimental or theoretical results. In Brett [3], althoughthe shock wave and bubble pulsation behaviour of an underwater explosion can be capturedusing DYNA, obvious discrepancy to the experimental results can be observed in the magni-tude of peak pressure and the subsequent bubble pulse period. The numerical dispersion onthe shock using existing commercial software such as DYNA is a problem as pointed outby Aanhold et al. [4]. Another major problem for the current commercial software is, as faras we are aware, the inaccuracy in the treatment of wave interaction at moving interfacessuch as free surface and explosion bubble surface. This may indirectly be the major reasonfor the appearance of spurious cavitation as discussed in Aanhold et al. [4] and numericallyless energy loss inside the explosion bubble as found in Brett [3]. For �ow �eld involvingshock in the presence of moving material interfaces like free surface and bubble surface,numerical oscillation and inaccuracy always occur in the region of the interface even whenone employs the very successful high resolution schemes like TVD and ENO, which have beenshown to perform very well in shock capturing. Additional techniques like those developedby Cocchi and Saurel [6] and Abgrall and Karni [7] have to be employed to overcome thesedi�culties. Even the fairly recent technique of ghost �uid method [8], which may suppressthe numerical oscillation for a not very strong shock–interface interaction, su�ers from seri-ous numerical inaccuracy in the presence of a strong shock at the material interface due toinaccurate treatment of the shock–interface interaction [9]. In general, to accurately evaluatethe in�uence of free surface, the numerical scheme used must be capable of capturing thewave interaction at a moving interface. The motivation of this work is, therefore, to developa technique to handle the shock wave free surface interaction and thus accurately evaluatethe in�uence of free surface. In the present work, the structure is assumed rigid and �xed.As a result, some physics as observed in an underwater explosion, such as the precursorywave occurring over the structure surface and hull cavitation occurring nearby the structure,do not occur in the present computation. For accurate capturing of such phenomena, besidesthe employment of accurate numerical solvers for both �uid and structure, the �ow-structurenon-linear interaction, which is also not very well treated in current commercial software, hasto be taken into consideration. This study focuses on developing an accurate solver for �ow�eld, which can handle the wave-moving interface interaction well and can be subsequentlycoupled to well-developed non-linear structural software to take into account the physicalnon-linear �ow (deformable) structure interaction for future work.It may be noted, though, that the impingement of the shock wave on the free surface may
result in bulk cavitation. The mass exchange inside the cavitation region has to be introducedand a proper model has yet to be developed [10]. Although the cavitation zone may be simplytreated by assuming a constant-pressure zone [4, 11], this may result in inaccurate �ow physicssince subsequent wave cannot propagate through the said region and furthermore conservationlaws are not maintained. In the present work, the simulation is carried out until the �ow
Copyright ? 2003 John Wiley & Sons, Ltd. Int. J. Numer. Meth. Engng 2003; 58:609–630
UNDERWATER SHOCK-FREE SURFACE–STRUCTURE INTERACTION 611
exhibits and sustains a pressure �eld slightly below the critical pressure (SVP of water),which indicates the likely presence of a cavitating region. It is also the intent to address thefull issue of cavitation simulation in our future work.The text is arranged as follows. In Section 2 the methodology presented in Liu et al. [12]
is brie�y stated and extended to a more general equation of state. In this work, the meshis rectangular and �xed, and the structure can be arbitrarily placed inside the computationaldomain. Thus, irregular mesh points, which do not necessarily coincide with the structuralboundaries, appear in the computational domain. A recently developed technique is applied tohandle such a situation. In Section 3, the numerical simulation for a cylindrical underwaterexplosion near both a free surface and cylindrical rigid structure is carried out and analysed.The pressure loading on the structure is discussed with the consideration of e�ect from freesurface and explosion bubble. A brief conclusion is summarised in Section 4.
2. METHODOLOGY
2.1. The numerical scheme for the �ow
Firstly, the numerical method employed in this work is described. The said method is ahigh-resolution shock capturing method in which the interaction of the shock with the mov-ing interface is specially taken into consideration. It has a two-region structure: a localsolver to solve for the �ow region near the moving interfaces and a well established high-resolution method to solve for the �ow regions away from the interfaces. The moving in-terfaces such as the free surface and the expanding explosion bubble surface are capturedusing the Level–Set technique [13] in which numerical smearing of the captured interfaceis avoided in order to precisely simulate the wave interaction with the moving interface.In the present work, the numerical scheme applied in the region away from the movinginterfaces is the MUSCL method [14]. Since the MUSCL and the Level–Set methods arefairly standard numerical techniques, the interested reader may refer to above-mentionedreferences for details. We shall brie�y describe the local solver here using the 1D Eulerequation.The 1D conservative equations for inviscid and non-heat-conducting gas or water compress-
ible �ow can be written as@U@t+@F(U )@x
=0 (1)
where U =[�; �u; E]T, F(U )= [�u; �u2 + p; (E + p)u]T, � is the density, u is the velocity,p is the pressure and E is the total energy. For closure of system, the equation of state (EOS)is required. We assume that the EOS has the form of
�e=f(�)p+ g(�) (2)
Here, e is the internal energy; f and g are functions of density and some constants associatedwith heat conductivity (for example, for perfect gas, f=1=(� − 1) and g=0:0). The EOSencountered in engineering applications can generally be expressed in this form. In this work,we shall focus on two types of EOS. The �rst one is the �-law for perfect gas; the otheris the Tait’s EOS for water, where f=1=(N − 1) and g=NB=(N − 1) with N and B beingconstants and set to 7.0 and 3310 bar, respectively.
Copyright ? 2003 John Wiley & Sons, Ltd. Int. J. Numer. Meth. Engng 2003; 58:609–630
612 T. G. LIU ET AL.
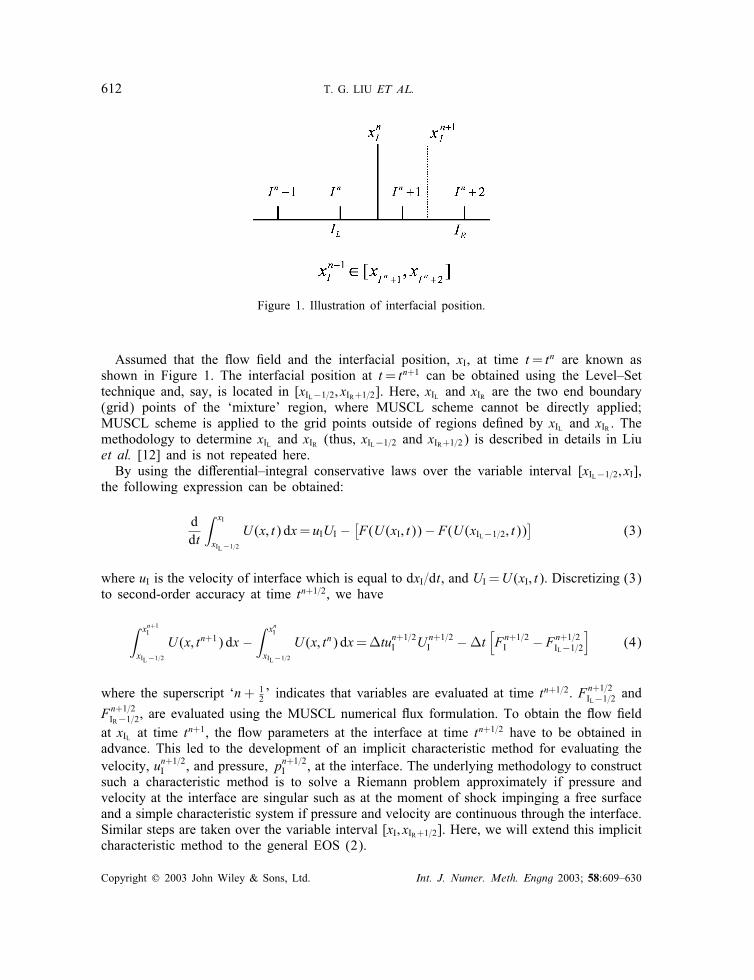
Figure 1. Illustration of interfacial position.
Assumed that the �ow �eld and the interfacial position, xI, at time t= tn are known asshown in Figure 1. The interfacial position at t= tn+1 can be obtained using the Level–Settechnique and, say, is located in [xIL−1=2; xIR+1=2]. Here, xIL and xIR are the two end boundary(grid) points of the ‘mixture’ region, where MUSCL scheme cannot be directly applied;MUSCL scheme is applied to the grid points outside of regions de�ned by xIL and xIR . Themethodology to determine xIL and xIR (thus, xIL−1=2 and xIR+1=2) is described in details in Liuet al. [12] and is not repeated here.By using the di�erential–integral conservative laws over the variable interval [xIL−1=2; xI],
the following expression can be obtained:
ddt
∫ xI
xIL−1=2
U (x; t) dx= uIUI −[F(U (xI; t))− F(U (xIL−1=2; t))
](3)
where uI is the velocity of interface which is equal to dxI=dt, and UI =U (xI; t). Discretizing (3)to second-order accuracy at time tn+1=2, we have
∫ xn+1I
xIL−1=2
U (x; tn+1) dx −∫ xnI
xIL−1=2
U (x; tn) dx=�tun+1=2I Un+1=2I −�t
[Fn+1=2I − Fn+1=2IL−1=2
](4)
where the superscript ‘n+ 12’ indicates that variables are evaluated at time t
n+1=2. Fn+1=2IL−1=2 and
Fn+1=2IR−1=2, are evaluated using the MUSCL numerical �ux formulation. To obtain the �ow �eldat xIL at time t
n+1, the �ow parameters at the interface at time tn+1=2 have to be obtained inadvance. This led to the development of an implicit characteristic method for evaluating thevelocity, un+1=2I , and pressure, pn+1=2I , at the interface. The underlying methodology to constructsuch a characteristic method is to solve a Riemann problem approximately if pressure andvelocity at the interface are singular such as at the moment of shock impinging a free surfaceand a simple characteristic system if pressure and velocity are continuous through the interface.Similar steps are taken over the variable interval [xI; xIR+1=2]. Here, we will extend this implicitcharacteristic method to the general EOS (2).
Copyright ? 2003 John Wiley & Sons, Ltd. Int. J. Numer. Meth. Engng 2003; 58:609–630

UNDERWATER SHOCK-FREE SURFACE–STRUCTURE INTERACTION 613
The two non-linear characteristics intersecting at the interface for system (1) are given as
dpIdt+ �ILcIL
duIdt=0 along
dxdt= uI + cIL (5a)
dpIdt
− �IRcIR duIdt =0 alongdxdt= uI − cIR (5b)
where �IL (�IR) and cIL (cIR) are the density and speed of sound to the left (right) of interface;uI and pI are the velocity and pressure at the interface. The speed of sound which is relatedto EOS (2) can be written as
c2 =−f′p+ g′
f+(f + 1)p+ g
f�(6)
where ‘′’ indicates derivative with respect to density.Discretising (5a) and (5b) at the interface, we obtain
pI − pIL�ILcIL
+ (uI − uIL) = 0 (7a)
pI − pIR�IR cIR
− (uI − uIR) = 0 (7b)
where �ILcIL and �IR cIR are the respective approximation of �ILcIL and �IRcIR. uIL (uIR) andpIL (pIR) are evaluated along the characteristic line of dx=dt= uI + cIL (dx=dt= uI − cIR). Toapply (7a) and (7b) to a shock impacting on an moving interface such as free surface, �ILcILand �IR cIR are specially approximated to take into account the shock–interface interactionas follows.
(�ILcIL)2 = �LI �IL
pI − pIL�LI − �IL
(7c)
(�ILcIL)2 = �RI �IR
pI − pIR�RI − �IR (7d)
Here, �LI and �RI are the densities at the left and right sides of the interface. System (7) is
closed using the respective medium EOS and is solved by iteration.Since the method is constructed in the two-region form, any well-developed shock-capturing
method can be coupled with the local solver to solve for multi-medium compressible �ow. Anexample is the use of modi�ed Harten’s TVD scheme as in Liu et al. [15, 16] and extensivetests using MUSCL scheme can be found in Liu et al. [12]. The extension of the methodto multi-dimensions with operator splitting scheme and several applications with comparisonsmade to previous works and experiments can be found in Liu et al. [17].
Copyright ? 2003 John Wiley & Sons, Ltd. Int. J. Numer. Meth. Engng 2003; 58:609–630
614 T. G. LIU ET AL.
2.2. The treatment of internal boundary cells
The 2D Euler equation in the Cartesian (x; y) co-ordinate system can be written as
@U@t+@F(U )@x
+@G(U )@y
=0 (8a)
where
U =
��u�vE
; F(U )=
�u
�u2 + p�uv
(E + p)u
; G(U )=
�v�uv
�v2 + p(E + p)v
(8b)
Here, u and v are the velocity components in the respective x and y directions.Let us suppose that �x and �y are the grid sizes in the respective x and y directions, M and
N grid nodes are uniformly distributed in the two directions with xi= xA+i�x, yj=yA+j�y,i=1; 2; : : : ; M , j=1; 2; : : : ; N . The regular Cartesian grid cell Cij is then given by
Cij=[xi−1=2; xi+1=2]× [yj−1=2; yj+1=2] (9)
The numerical solution at time tn is approximated by the average of the exact solutionU (x; y; tn) over the grid cells:
Unij ≈
1�x�y
∫CijU (x; y; tn) dx dy (10)
In this work, the mesh is rectangular and �xed. Structures, of any shape, are placedon the meshed computational domain, which is also rectangular. Irregular mesh points orcells, where structure boundaries do not coincide with mesh, can and do appear. Thus,special treatment to these irregular cells intersected by the structural boundaries is neces-sary. The main issue is to avoid instability arising from extremely small boundary cellsand to achieve a high order of accuracy for calculation of the regions next to the bound-ary. In this section, a second-order accurate method introduced by Forrer and Jeltsch [18] isimplemented for the irregular cells in the region of structural boundaries. This method treatsboundary cells as whole cells and hence is stable, and is easy to extend to multi-dimensionalcalculations.It has been known that a straight re�ecting wall boundary behaves like a line of symmetry
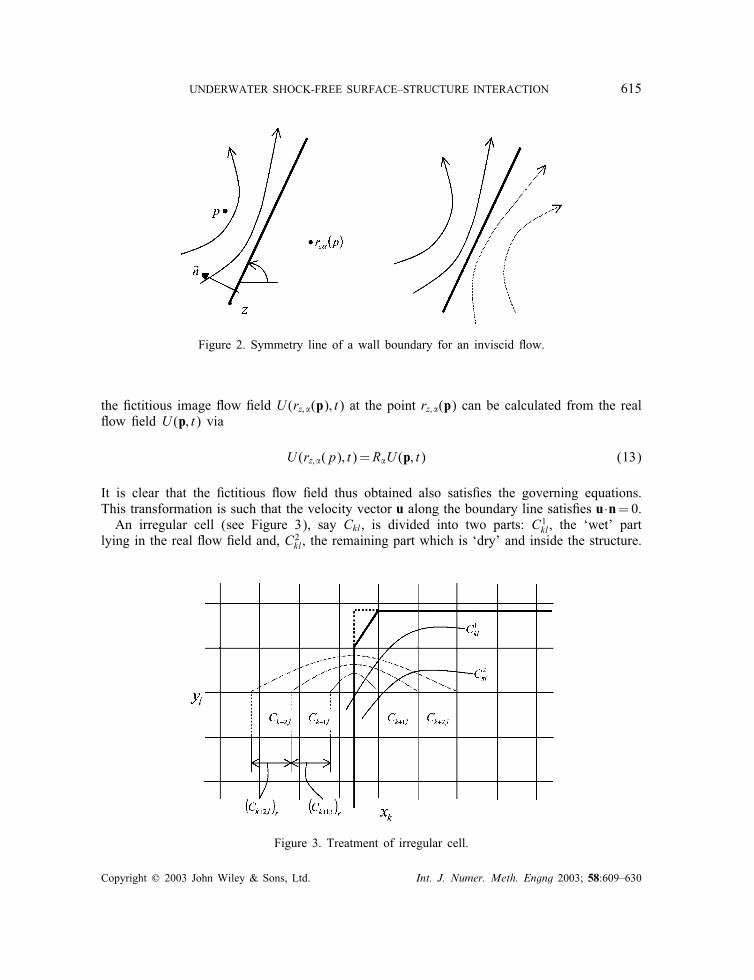
for an inviscid �ow. Suppose the straight line goes through a point z and has a normal vectorn=(− sin �; cos �)T pointing into the �ow �eld (see Figure 2). A point p=(x; y)T in thephysical region has its mirror image across the wall boundary as rz; �(p) given by
rz; �(p)= p− 2n[(p− z) · n] (11)
Introducing the ‘re�ecting’ matrix
R�=
1 0 0 00 cos(2�) sin(2�) 00 sin(2�) − cos(2�) 00 0 0 1
(12)
Copyright ? 2003 John Wiley & Sons, Ltd. Int. J. Numer. Meth. Engng 2003; 58:609–630
UNDERWATER SHOCK-FREE SURFACE–STRUCTURE INTERACTION 615
Figure 2. Symmetry line of a wall boundary for an inviscid �ow.
the �ctitious image �ow �eld U (rz; �(p); t) at the point rz; �(p) can be calculated from the real�ow �eld U (p; t) via
U (rz; �(p); t)=R�U (p; t) (13)
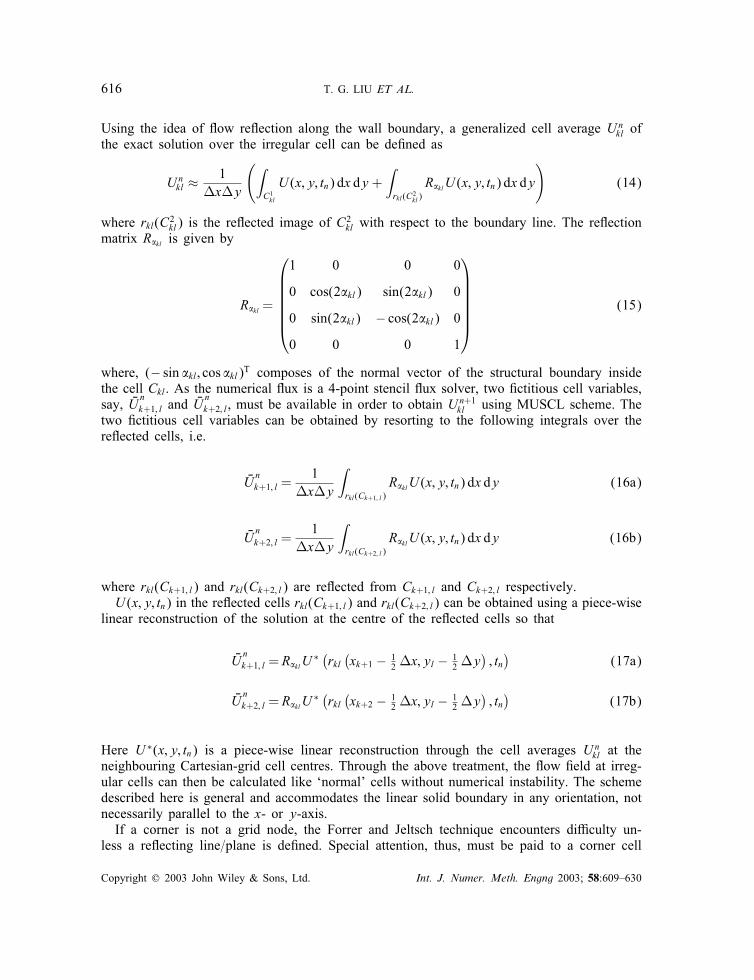
It is clear that the �ctitious �ow �eld thus obtained also satis�es the governing equations.This transformation is such that the velocity vector u along the boundary line satis�es u ·n=0.An irregular cell (see Figure 3), say Ckl, is divided into two parts: C1kl, the ‘wet’ part
lying in the real �ow �eld and, C2kl, the remaining part which is ‘dry’ and inside the structure.
Figure 3. Treatment of irregular cell.
Copyright ? 2003 John Wiley & Sons, Ltd. Int. J. Numer. Meth. Engng 2003; 58:609–630
616 T. G. LIU ET AL.
Using the idea of �ow re�ection along the wall boundary, a generalized cell average Unkl of
the exact solution over the irregular cell can be de�ned as
Unkl ≈
1�x�y
(∫C1kl
U (x; y; tn) dx dy +∫rkl(C2kl)
R�klU (x; y; tn) dx dy
)(14)
where rkl(C2kl) is the re�ected image of C2kl with respect to the boundary line. The re�ection
matrix R�kl is given by
R�kl =
1 0 0 0
0 cos(2�kl) sin(2�kl) 0
0 sin(2�kl) − cos(2�kl) 0
0 0 0 1
(15)
where, (− sin �kl; cos �kl)T composes of the normal vector of the structural boundary insidethe cell Ckl. As the numerical �ux is a 4-point stencil �ux solver, two �ctitious cell variables,say, �U
nk+1; l and �U
nk+2; l, must be available in order to obtain U
n+1kl using MUSCL scheme. The
two �ctitious cell variables can be obtained by resorting to the following integrals over there�ected cells, i.e.
�Unk+1; l =
1�x�y
∫rkl(Ck+1; l)
R�klU (x; y; tn) dx dy (16a)
�Unk+2; l =
1�x�y
∫rkl(Ck+2; l)
R�klU (x; y; tn) dx dy (16b)
where rkl(Ck+1; l) and rkl(Ck+2; l) are re�ected from Ck+1; l and Ck+2; l respectively.U (x; y; tn) in the re�ected cells rkl(Ck+1; l) and rkl(Ck+2; l) can be obtained using a piece-wise
linear reconstruction of the solution at the centre of the re�ected cells so that
�Unk+1; l = R�klU
∗ (rkl (xk+1 − 12 �x; yl − 1
2 �y); tn)
(17a)
�Unk+2; l = R�klU
∗ (rkl (xk+2 − 12 �x; yl − 1
2 �y); tn)
(17b)
Here U ∗(x; y; tn) is a piece-wise linear reconstruction through the cell averages Unkl at the
neighbouring Cartesian-grid cell centres. Through the above treatment, the �ow �eld at irreg-ular cells can then be calculated like ‘normal’ cells without numerical instability. The schemedescribed here is general and accommodates the linear solid boundary in any orientation, notnecessarily parallel to the x- or y-axis.If a corner is not a grid node, the Forrer and Jeltsch technique encounters di�culty un-
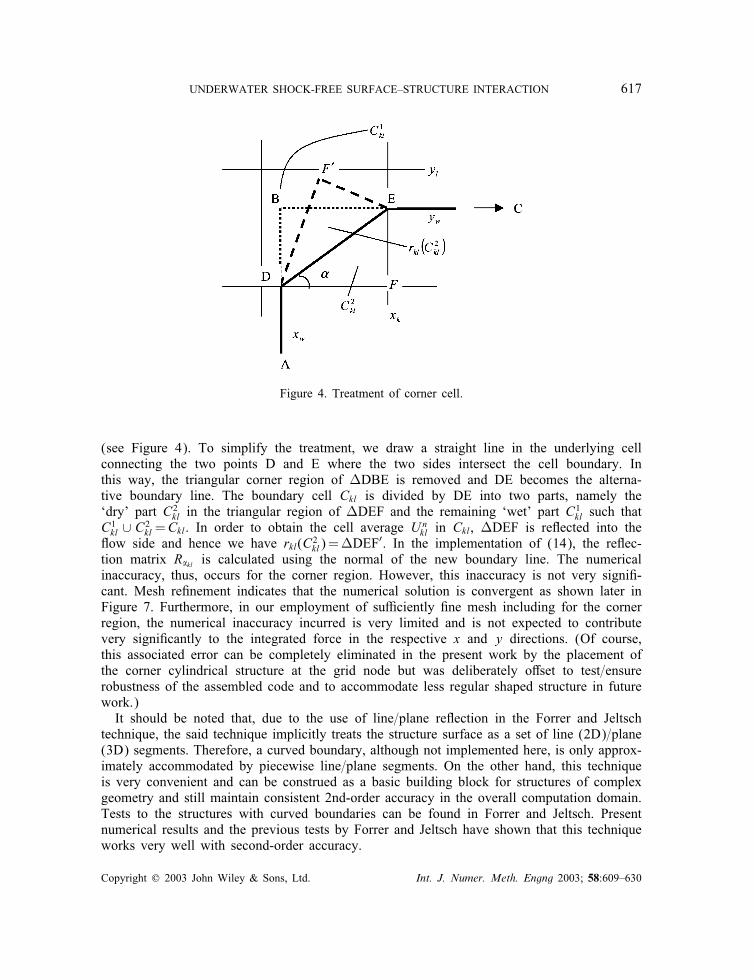
less a re�ecting line=plane is de�ned. Special attention, thus, must be paid to a corner cell
Copyright ? 2003 John Wiley & Sons, Ltd. Int. J. Numer. Meth. Engng 2003; 58:609–630
UNDERWATER SHOCK-FREE SURFACE–STRUCTURE INTERACTION 617
Figure 4. Treatment of corner cell.
(see Figure 4). To simplify the treatment, we draw a straight line in the underlying cellconnecting the two points D and E where the two sides intersect the cell boundary. Inthis way, the triangular corner region of �DBE is removed and DE becomes the alterna-tive boundary line. The boundary cell Ckl is divided by DE into two parts, namely the‘dry’ part C2kl in the triangular region of �DEF and the remaining ‘wet’ part C
1kl such that
C1kl ∪ C2kl=Ckl. In order to obtain the cell average Unkl in Ckl, �DEF is re�ected into the
�ow side and hence we have rkl(C2kl)=�DEF′. In the implementation of (14), the re�ec-
tion matrix R�kl is calculated using the normal of the new boundary line. The numericalinaccuracy, thus, occurs for the corner region. However, this inaccuracy is not very signi�-cant. Mesh re�nement indicates that the numerical solution is convergent as shown later inFigure 7. Furthermore, in our employment of su�ciently �ne mesh including for the cornerregion, the numerical inaccuracy incurred is very limited and is not expected to contributevery signi�cantly to the integrated force in the respective x and y directions. (Of course,this associated error can be completely eliminated in the present work by the placement ofthe corner cylindrical structure at the grid node but was deliberately o�set to test=ensurerobustness of the assembled code and to accommodate less regular shaped structure in futurework.)It should be noted that, due to the use of line=plane re�ection in the Forrer and Jeltsch
technique, the said technique implicitly treats the structure surface as a set of line (2D)=plane(3D) segments. Therefore, a curved boundary, although not implemented here, is only approx-imately accommodated by piecewise line=plane segments. On the other hand, this techniqueis very convenient and can be construed as a basic building block for structures of complexgeometry and still maintain consistent 2nd-order accuracy in the overall computation domain.Tests to the structures with curved boundaries can be found in Forrer and Jeltsch. Presentnumerical results and the previous tests by Forrer and Jeltsch have shown that this techniqueworks very well with second-order accuracy.
Copyright ? 2003 John Wiley & Sons, Ltd. Int. J. Numer. Meth. Engng 2003; 58:609–630
618 T. G. LIU ET AL.
3. RESULTS AND DISCUSSIONS
3.1. Preliminary test to the assembled code
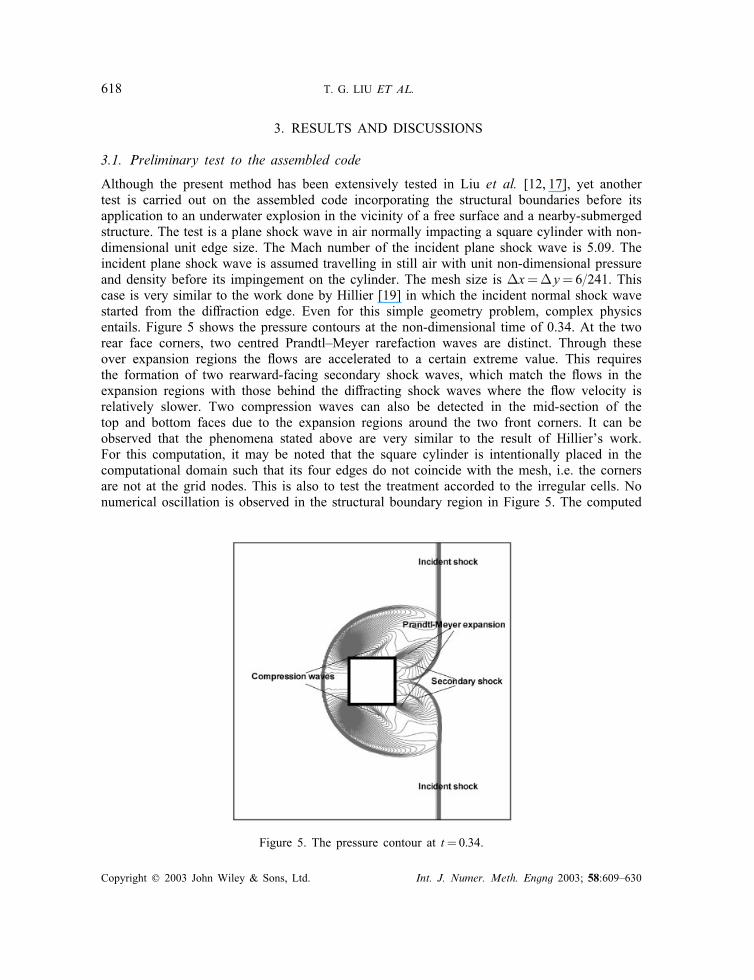
Although the present method has been extensively tested in Liu et al. [12, 17], yet anothertest is carried out on the assembled code incorporating the structural boundaries before itsapplication to an underwater explosion in the vicinity of a free surface and a nearby-submergedstructure. The test is a plane shock wave in air normally impacting a square cylinder with non-dimensional unit edge size. The Mach number of the incident plane shock wave is 5.09. Theincident plane shock wave is assumed travelling in still air with unit non-dimensional pressureand density before its impingement on the cylinder. The mesh size is �x=�y=6=241. Thiscase is very similar to the work done by Hillier [19] in which the incident normal shock wavestarted from the di�raction edge. Even for this simple geometry problem, complex physicsentails. Figure 5 shows the pressure contours at the non-dimensional time of 0.34. At the tworear face corners, two centred Prandtl–Meyer rarefaction waves are distinct. Through theseover expansion regions the �ows are accelerated to a certain extreme value. This requiresthe formation of two rearward-facing secondary shock waves, which match the �ows in theexpansion regions with those behind the di�racting shock waves where the �ow velocity isrelatively slower. Two compression waves can also be detected in the mid-section of thetop and bottom faces due to the expansion regions around the two front corners. It can beobserved that the phenomena stated above are very similar to the result of Hillier’s work.For this computation, it may be noted that the square cylinder is intentionally placed in thecomputational domain such that its four edges do not coincide with the mesh, i.e. the cornersare not at the grid nodes. This is also to test the treatment accorded to the irregular cells. Nonumerical oscillation is observed in the structural boundary region in Figure 5. The computed
Figure 5. The pressure contour at t=0:34.
Copyright ? 2003 John Wiley & Sons, Ltd. Int. J. Numer. Meth. Engng 2003; 58:609–630
UNDERWATER SHOCK-FREE SURFACE–STRUCTURE INTERACTION 619
results indicate that the numerical accuracy in the boundary region is consistent with that inthe regular cell region.
3.2. Application to an explosion near the free surface and submerged structure
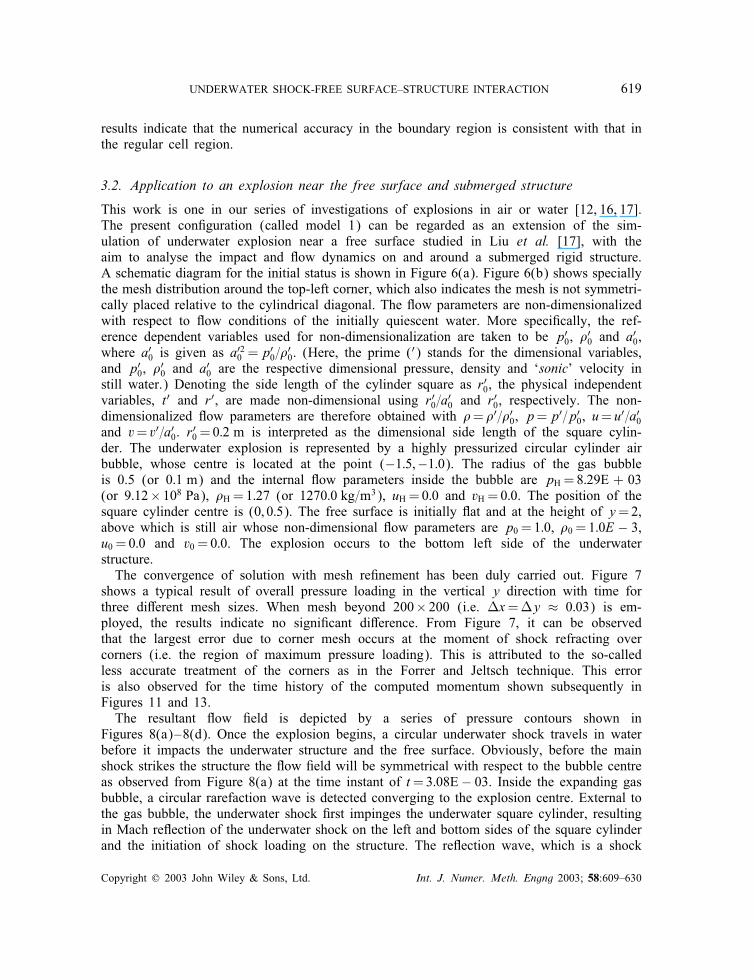
This work is one in our series of investigations of explosions in air or water [12, 16, 17].The present con�guration (called model 1) can be regarded as an extension of the sim-ulation of underwater explosion near a free surface studied in Liu et al. [17], with theaim to analyse the impact and �ow dynamics on and around a submerged rigid structure.A schematic diagram for the initial status is shown in Figure 6(a). Figure 6(b) shows speciallythe mesh distribution around the top-left corner, which also indicates the mesh is not symmetri-cally placed relative to the cylindrical diagonal. The �ow parameters are non-dimensionalizedwith respect to �ow conditions of the initially quiescent water. More speci�cally, the ref-erence dependent variables used for non-dimensionalization are taken to be p′
0, �′0 and a
′0,
where a′0 is given as a′20 =p
′0=�
′0. (Here, the prime (
′) stands for the dimensional variables,and p′
0, �′0 and a
′0 are the respective dimensional pressure, density and ‘sonic’ velocity in
still water.) Denoting the side length of the cylinder square as r′0, the physical independentvariables, t′ and r′, are made non-dimensional using r′0=a
′0 and r
′0, respectively. The non-
dimensionalized �ow parameters are therefore obtained with �=�′=�′0, p=p′=p′
0, u= u′=a′0
and v= v′=a′0. r′0 = 0:2 m is interpreted as the dimensional side length of the square cylin-
der. The underwater explosion is represented by a highly pressurized circular cylinder airbubble, whose centre is located at the point (−1:5;−1:0). The radius of the gas bubbleis 0.5 (or 0:1 m) and the internal �ow parameters inside the bubble are pH =8:29E + 03(or 9:12× 108 Pa), �H =1:27 (or 1270:0 kg=m3), uH =0:0 and vH =0:0. The position of thesquare cylinder centre is (0; 0:5). The free surface is initially �at and at the height of y=2,above which is still air whose non-dimensional �ow parameters are p0 = 1:0, �0 = 1:0E − 3,u0 = 0:0 and v0 = 0:0. The explosion occurs to the bottom left side of the underwaterstructure.The convergence of solution with mesh re�nement has been duly carried out. Figure 7
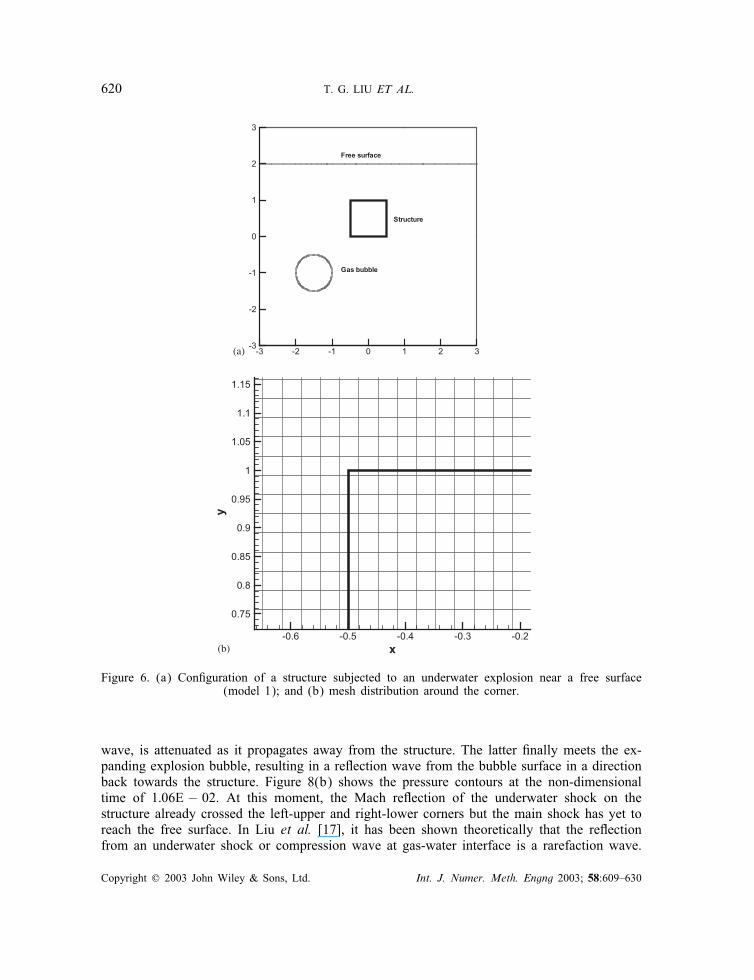
shows a typical result of overall pressure loading in the vertical y direction with time forthree di�erent mesh sizes. When mesh beyond 200× 200 (i.e. �x=�y ≈ 0:03) is em-ployed, the results indicate no signi�cant di�erence. From Figure 7, it can be observedthat the largest error due to corner mesh occurs at the moment of shock refracting overcorners (i.e. the region of maximum pressure loading). This is attributed to the so-calledless accurate treatment of the corners as in the Forrer and Jeltsch technique. This erroris also observed for the time history of the computed momentum shown subsequently inFigures 11 and 13.The resultant �ow �eld is depicted by a series of pressure contours shown in
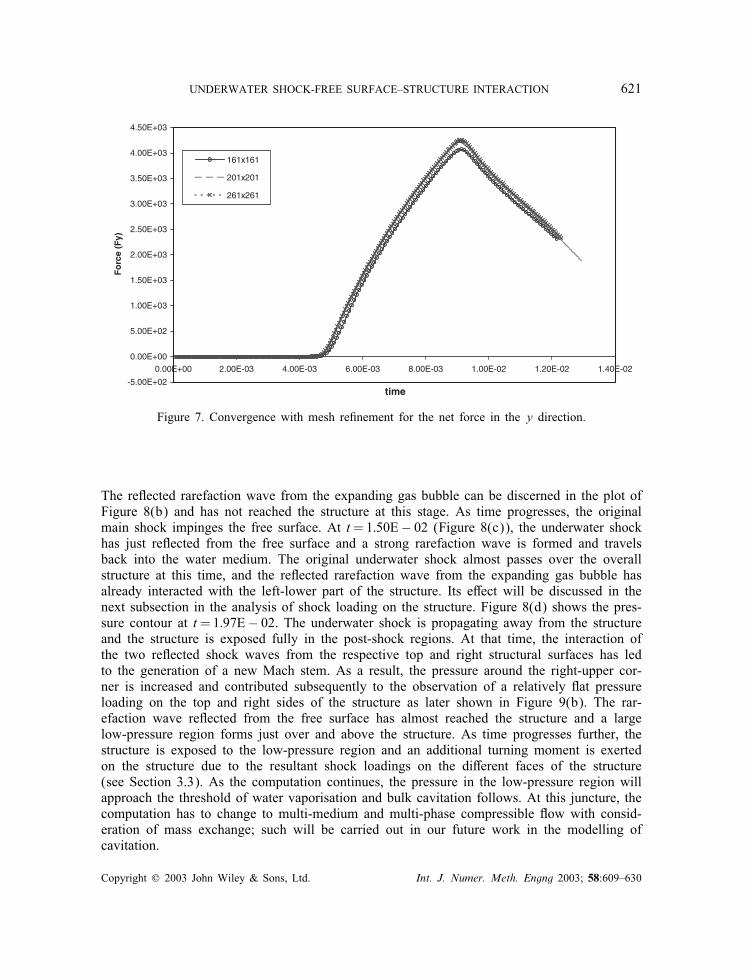
Figures 8(a)–8(d). Once the explosion begins, a circular underwater shock travels in waterbefore it impacts the underwater structure and the free surface. Obviously, before the mainshock strikes the structure the �ow �eld will be symmetrical with respect to the bubble centreas observed from Figure 8(a) at the time instant of t=3:08E− 03. Inside the expanding gasbubble, a circular rarefaction wave is detected converging to the explosion centre. External tothe gas bubble, the underwater shock �rst impinges the underwater square cylinder, resultingin Mach re�ection of the underwater shock on the left and bottom sides of the square cylinderand the initiation of shock loading on the structure. The re�ection wave, which is a shock
Copyright ? 2003 John Wiley & Sons, Ltd. Int. J. Numer. Meth. Engng 2003; 58:609–630
620 T. G. LIU ET AL.
-3 -2 -1 0 1 2 3-3
-2
-1
0
1
2
3
Free surface
Structure
Gas bubble
x
y
-0.6 -0.5 -0.4 -0.3 -0.2
0.75
0.8
0.85
0.9
0.95
1
1.05
1.1
1.15
(a)
(b)
Figure 6. (a) Con�guration of a structure subjected to an underwater explosion near a free surface(model 1); and (b) mesh distribution around the corner.
wave, is attenuated as it propagates away from the structure. The latter �nally meets the ex-panding explosion bubble, resulting in a re�ection wave from the bubble surface in a directionback towards the structure. Figure 8(b) shows the pressure contours at the non-dimensionaltime of 1:06E − 02. At this moment, the Mach re�ection of the underwater shock on thestructure already crossed the left-upper and right-lower corners but the main shock has yet toreach the free surface. In Liu et al. [17], it has been shown theoretically that the re�ectionfrom an underwater shock or compression wave at gas-water interface is a rarefaction wave.
Copyright ? 2003 John Wiley & Sons, Ltd. Int. J. Numer. Meth. Engng 2003; 58:609–630
UNDERWATER SHOCK-FREE SURFACE–STRUCTURE INTERACTION 621
-5.00E+02
0.00E+00
5.00E+02
1.00E+03
1.50E+03
2.00E+03
2.50E+03
3.00E+03
3.50E+03
4.00E+03
4.50E+03
0.00E+00 2.00E-03 4.00E-03 6.00E-03 8.00E-03 1.00E-02 1.20E-02 1.40E-02
Fo
rce
(Fy)
161x161
201x201
261x261
time
Figure 7. Convergence with mesh re�nement for the net force in the y direction.
The re�ected rarefaction wave from the expanding gas bubble can be discerned in the plot ofFigure 8(b) and has not reached the structure at this stage. As time progresses, the originalmain shock impinges the free surface. At t=1:50E− 02 (Figure 8(c)), the underwater shockhas just re�ected from the free surface and a strong rarefaction wave is formed and travelsback into the water medium. The original underwater shock almost passes over the overallstructure at this time, and the re�ected rarefaction wave from the expanding gas bubble hasalready interacted with the left-lower part of the structure. Its e�ect will be discussed in thenext subsection in the analysis of shock loading on the structure. Figure 8(d) shows the pres-sure contour at t=1:97E− 02. The underwater shock is propagating away from the structureand the structure is exposed fully in the post-shock regions. At that time, the interaction ofthe two re�ected shock waves from the respective top and right structural surfaces has ledto the generation of a new Mach stem. As a result, the pressure around the right-upper cor-ner is increased and contributed subsequently to the observation of a relatively �at pressureloading on the top and right sides of the structure as later shown in Figure 9(b). The rar-efaction wave re�ected from the free surface has almost reached the structure and a largelow-pressure region forms just over and above the structure. As time progresses further, thestructure is exposed to the low-pressure region and an additional turning moment is exertedon the structure due to the resultant shock loadings on the di�erent faces of the structure(see Section 3.3). As the computation continues, the pressure in the low-pressure region willapproach the threshold of water vaporisation and bulk cavitation follows. At this juncture, thecomputation has to change to multi-medium and multi-phase compressible �ow with consid-eration of mass exchange; such will be carried out in our future work in the modelling ofcavitation.
Copyright ? 2003 John Wiley & Sons, Ltd. Int. J. Numer. Meth. Engng 2003; 58:609–630
622 T. G. LIU ET AL.
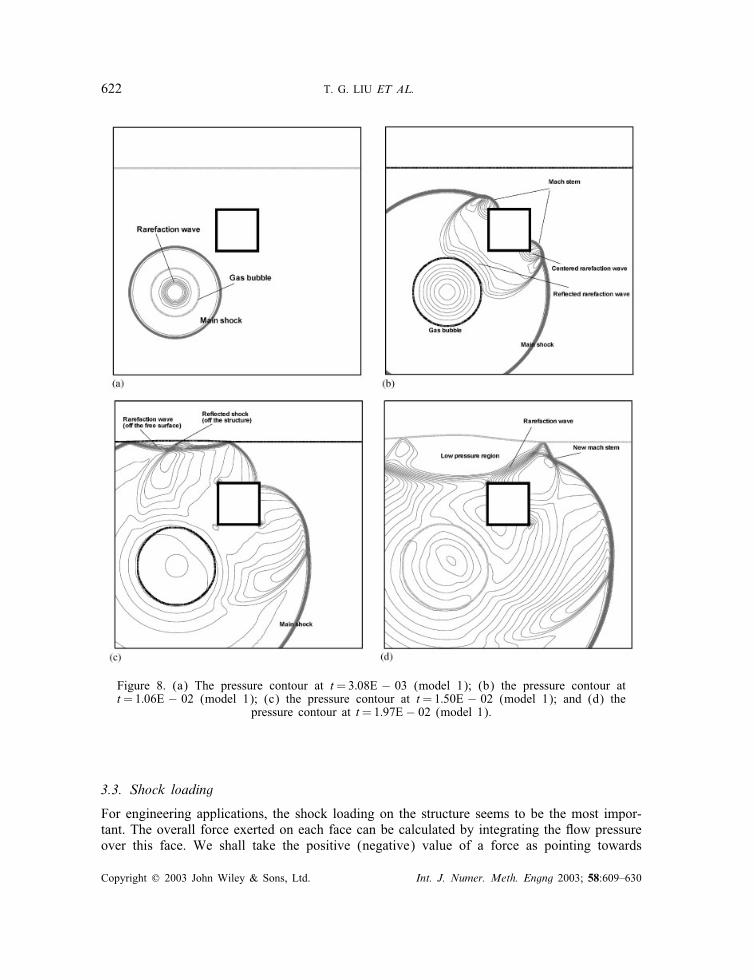
Figure 8. (a) The pressure contour at t=3:08E − 03 (model 1); (b) the pressure contour att=1:06E − 02 (model 1); (c) the pressure contour at t=1:50E − 02 (model 1); and (d) the
pressure contour at t=1:97E− 02 (model 1).
3.3. Shock loading
For engineering applications, the shock loading on the structure seems to be the most impor-tant. The overall force exerted on each face can be calculated by integrating the �ow pressureover this face. We shall take the positive (negative) value of a force as pointing towards
Copyright ? 2003 John Wiley & Sons, Ltd. Int. J. Numer. Meth. Engng 2003; 58:609–630
UNDERWATER SHOCK-FREE SURFACE–STRUCTURE INTERACTION 623
-5.00E+02
0.00E+00
5.00E+02
1.00E+03
1.50E+03
2.00E+03
2.50E+03
3.00E+03
3.50E+03
4.00E+03
4.50E+03
0.00E+00 5.00E-03 1.00E-02 1.50E-02 2.00E-02 2.50E-02
Time
Force
left face (positive)
bottom face (positive)
t1
t 2
t3
t2a
t5
-2.00E+02
0.00E+00
2.00E+02
4.00E+02
6.00E+02
8.00E+02
1.00E+03
1.20E+03
1.40E+03
1.60E+03
0.00E+00 5.00E-03 1.00E-02 1.50E-02 2.00E-02 2.50E-02
Time
Force
right face (negative)
top face (negative)t 3 t4 t5
t2
(a)
(b)
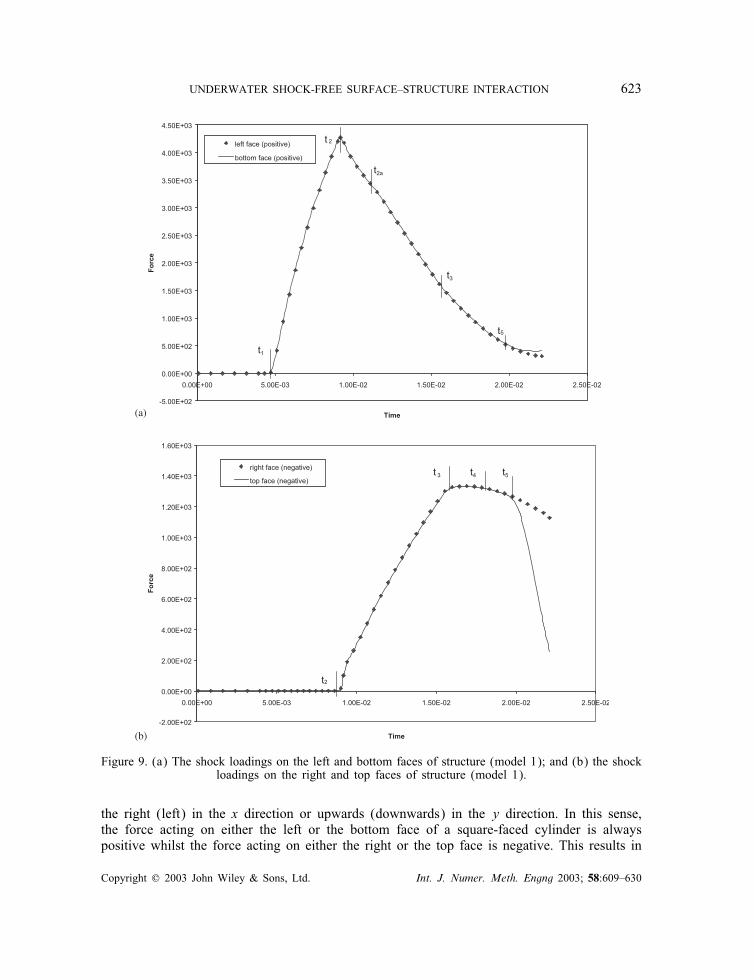
Figure 9. (a) The shock loadings on the left and bottom faces of structure (model 1); and (b) the shockloadings on the right and top faces of structure (model 1).
the right (left) in the x direction or upwards (downwards) in the y direction. In this sense,the force acting on either the left or the bottom face of a square-faced cylinder is alwayspositive whilst the force acting on either the right or the top face is negative. This results in
Copyright ? 2003 John Wiley & Sons, Ltd. Int. J. Numer. Meth. Engng 2003; 58:609–630
624 T. G. LIU ET AL.
the following formulation for calculating the forces:
FxL =∫SLp dS (18a)
FxR =∫SR−p dS (18b)
FyB =∫SBp dS (18c)
FyT =∫ST−p dS (18d)
where FxL, FxR, FyB and FyT are the overall forces (shock loadings) on the left, right, bottomand top faces, respectively, and SL, SR, SB, ST represent the spatial integral regions on thesefour faces. The term, p, is the �ow pressure over an in�nitesimal section, dS, of the respectiveintegral regions. The net forces in the x and y direction are then de�ned respectively as
Fxnet = FxL + FxR (19a)
Fynet = FyB + FyT (19b)
The rotation e�ect of the shock loading is measured by the overall moment (torque) of thedistributed forces on the structure with respect to the structure centre (xC; yC). De�ning theanti-clockwise moment as positive, we obtain
M =∫SLp · (yC − y) dS+
∫STp · (xC − x)dS+
∫SRp · (y − yC)dS+
∫SBp · (x − xC)dS (20)
where M is the overall moment exerted on a structure and (x; y) is the co-ordinate of thecentre of dS. Since the pressure, length, and area variables in the formulations from (18) to(20) are non-dimensionalized, the forces and moment calculated are also non-dimensional.Considering the geometric symmetry, the temporal evolution of the shock loading (inte-
gral pressure) over the left and bottom structure faces is depicted in Figure 9(a) while thetemporal evolution of the shock loading over the right and top structure faces is given inFigure 9(b).At the time instant t1 = 4:70E− 03, the shock front generated by the underwater explosion
reaches the left-lower corner of the structure. The shock loadings exerted on the left andbottom structure faces, namely FxL and FyB, rise rapidly as the post-shock region expands.The peak loading appears at the time instant of t2 = 9:20E− 03 (Figure 9(a)) when the shockfronts have traveled to the ends of the left and bottom faces. After that, with the drop ofthe pressure in the post-shock �ow, the shock loadings on the left and bottom faces beginto decrease rapidly till the time of about t2a = 1:10E − 03 when the re�ected wave from theexplosion bubble reaches the structure. The in�uence of the re�ection wave from the explosion
Copyright ? 2003 John Wiley & Sons, Ltd. Int. J. Numer. Meth. Engng 2003; 58:609–630
UNDERWATER SHOCK-FREE SURFACE–STRUCTURE INTERACTION 625
-1.50E+03
-5.00E+02
5.00E+02
1.50E+03
2.50E+03
3.50E+03
4.50E+03
0.00E+00 5.00E-03 1.00E-02 1.50E-02 2.00E-02 2.50E-02
Time
Fo
rce
net force in x direction
net force in y direction
t1
t2
t3
t6
t5
t2a
t7
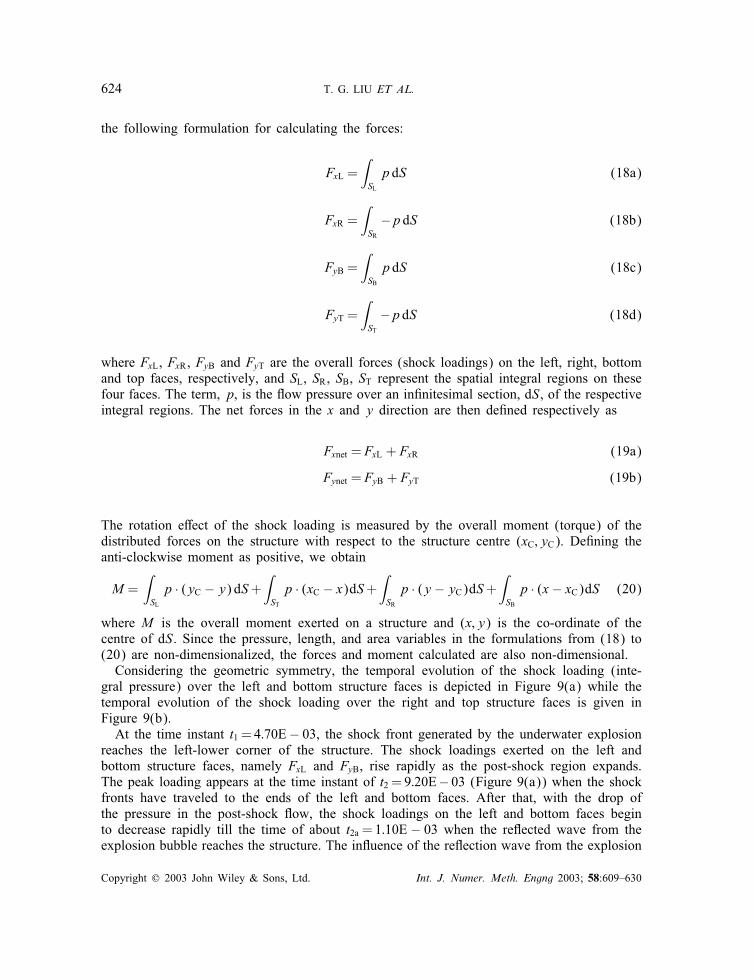
Figure 10. The net force on the structure (model 1).
bubble on loading is small and limited but observable in Figure 9(a) (and Figure 10). Thisresults in the slight deviation from its original trend of rapid drop from t2 to t2a till the timeof t3 = 1:57E − 02 when the square cylinder is then fully immersed in the post-shock �ows(Figure 8(c)). After t3, the shock loading on the left and bottom faces goes into a phase ofrelatively more moderate decrease; this is because the Mach re�ection, which occurs after theoriginal shock passes over the whole square cylinder, increases the pressure in the post-shockregion. This stage continues till the time of t5 = 1:98E − 02 when the in�uence of the freesurface reaches the structure and then the two curves associated with the respective facesbegin to diverge (Figure 9(a)). As for the shock loading on the right and top faces shown inFigure 9(b), it begins at t2 and then increases rapidly since the shock fronts begin to travelalong these two faces. The shock fronts on these two faces di�ract over the right-upper cornerat the time instant of t3 = 1:57E− 02 (Figure 8(c)). One may observe that the increase of theshock loading on both the top and right sides stop almost abruptly after t3. Before the distinct(but still not very sharp) decrease of the loading which begins at t4 = 1:75E−02, there existsa relatively �at section on each of the loading pro�les between t3 and t4. Such a feature isconsistent with the dynamics of the shock waves during this time interval: on one hand, thepressure of the post-shock �ow near the right (top) face continues to decrease as the mainshock front moves away; on the other hand, the Mach stem di�racted around the right-uppercorner from the top (right) face will augment the pressure in this region. Therefore, the �atsection suggests that these two e�ects should be about equal in in�uence for this particularcase thereby leading to the relatively steady shock loading during this period. The loading onthe top face decreases very abruptly after the time instant of t5 = 1:98E−02 while the decreasein the loading on the right face is much slower. This is because the rarefaction wave re�ected
Copyright ? 2003 John Wiley & Sons, Ltd. Int. J. Numer. Meth. Engng 2003; 58:609–630
626 T. G. LIU ET AL.
-1.00E+02
-8.00E+01
-6.00E+01
-4.00E+01
-2.00E+01
0.00E+00
2.00E+01
4.00E+01
6.00E+01
8.00E+01
1.00E+02
0.00E+00 5.00E-03 1.00E-02 1.50E-02 2.00E-02 2.50E-02Mo
men
t
Time
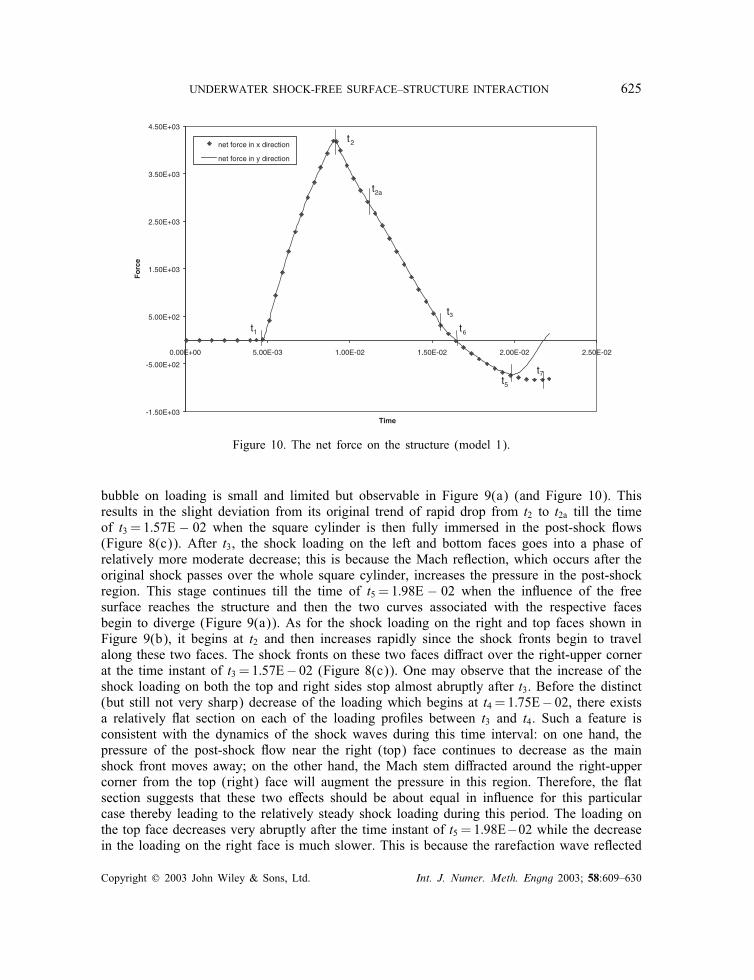
Figure 11. The moment on the structure (model 1).
from the free surface has come in contact with the top face of the structure (Figure 8(d)). Itis observed that the in�uence of free surface causes the magnitude of shock loading on thetop face to drop rapidly. Before the in�uence of the rarefaction wave from the free surface,the temporal evolution of the shock loads on the left and bottom faces agree fairly well witheach other and so do the shock loadings on right and top faces. This implies that the �owsymmetry is maintained very well up to this point in time.Figure 10 shows the net force history until the bulk cavitation appears. The rotational
moment is plotted in Figure 11 for further investigation. From Figure 10, the impingementof the underwater shock causes the pressure loading on the structure to increase rapidly untilthe time of t2 = 9:20E − 03, where the pressure loading on the whole structure reaches itsmaximum. Owing to the centre of explosion being placed symmetrically with respect to thebottom left corner of the structure, the net forces in the x and y directions are equal. Afterthe time of t2 = 9:20E− 03, the pressure loading drops rapidly till the e�ect of the re�ectionwave from the explosion bubble reaches the structure at t2a and then decreases in a slightlyweakened rate until the time of about t3 = 1:57E−02. The overall e�ect of the re�ection wavefrom the explosion bubble is to induce a relatively lower pressure region in the vicinity ofthe bottom-left corner of the structure compared to the con�guration without the bubble. Thistranslates into a net shock loading which continues to decrease in both the x and y directions.However, the arrival of the re�ected rarefaction wave o� the free surface and its interactionwith the top face of the structure at t5 results in arresting a further decrease of the net forcein the y direction. In fact, it causes the said net force to increase which eventually gives riseto a positive vertical loading again. Therefore, for the y direction, the e�ect of free surfacecauses a reverse direction loading with respect to the (initial) shock loading without the freesurface. This maximum reverse vertical loading has a magnitude which is about one sixthof the maximum shock loading, and may initiate a structural dislodge or movement. On theother hand, for the x direction, the re�ected rarefaction wave from the free surface reaches
Copyright ? 2003 John Wiley & Sons, Ltd. Int. J. Numer. Meth. Engng 2003; 58:609–630
UNDERWATER SHOCK-FREE SURFACE–STRUCTURE INTERACTION 627
-1.50E+03
-5.00E+02
5.00E+02
1.50E+03
2.50E+03
3.50E+03
4.50E+03
0.00E+00 5.00E-03 1.00E-02 1.50E-02 2.00E-02 2.50E-02
time
force
model 1
model 1b
model 1a
t8
t6
t5
t2
t 2a
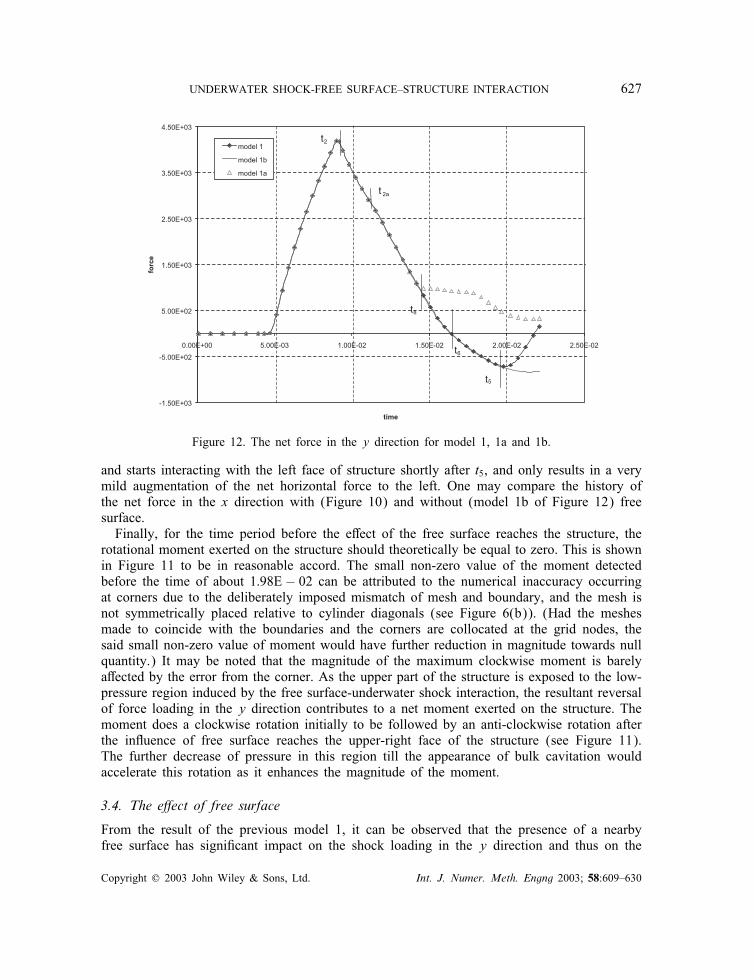
Figure 12. The net force in the y direction for model 1, 1a and 1b.
and starts interacting with the left face of structure shortly after t5, and only results in a verymild augmentation of the net horizontal force to the left. One may compare the history ofthe net force in the x direction with (Figure 10) and without (model 1b of Figure 12) freesurface.Finally, for the time period before the e�ect of the free surface reaches the structure, the
rotational moment exerted on the structure should theoretically be equal to zero. This is shownin Figure 11 to be in reasonable accord. The small non-zero value of the moment detectedbefore the time of about 1:98E − 02 can be attributed to the numerical inaccuracy occurringat corners due to the deliberately imposed mismatch of mesh and boundary, and the mesh isnot symmetrically placed relative to cylinder diagonals (see Figure 6(b)). (Had the meshesmade to coincide with the boundaries and the corners are collocated at the grid nodes, thesaid small non-zero value of moment would have further reduction in magnitude towards nullquantity.) It may be noted that the magnitude of the maximum clockwise moment is barelya�ected by the error from the corner. As the upper part of the structure is exposed to the low-pressure region induced by the free surface-underwater shock interaction, the resultant reversalof force loading in the y direction contributes to a net moment exerted on the structure. Themoment does a clockwise rotation initially to be followed by an anti-clockwise rotation afterthe in�uence of free surface reaches the upper-right face of the structure (see Figure 11).The further decrease of pressure in this region till the appearance of bulk cavitation wouldaccelerate this rotation as it enhances the magnitude of the moment.
3.4. The e�ect of free surface
From the result of the previous model 1, it can be observed that the presence of a nearbyfree surface has signi�cant impact on the shock loading in the y direction and thus on the
Copyright ? 2003 John Wiley & Sons, Ltd. Int. J. Numer. Meth. Engng 2003; 58:609–630
628 T. G. LIU ET AL.
0.000 0.005 0.010 0.015 0.020 0.025-120
-100
-80
-60
-40
-20
0
20
40
60
80
100
120
140
160
180
Model 1aM
omen
t
Time
Model 1
Figure 13. Comparison of the moment for model 1 and model 1a.
total shock loading. For the purpose of further comparison, in addition to the above model 1,computations of two more models were carried out to evaluate the e�ect of di�erent depthbeneath the free surface for a structure subject to an underwater explosion. In model 1a, thefree surface is set at 0:1m (i.e. half of square side length) above the top face of the structure;in model 1b, there is no free surface. The initial �ow conditions and the position of the centreof explosion relative to the structure in model 1, 1a and 1b remain unchanged. In anotherword, the con�guration of model 1a is identical to model 1 except that the free surface ishalf a square side length shallower for the former.The net forces in the y direction exerted on the structure are shown in Figure 12. One may
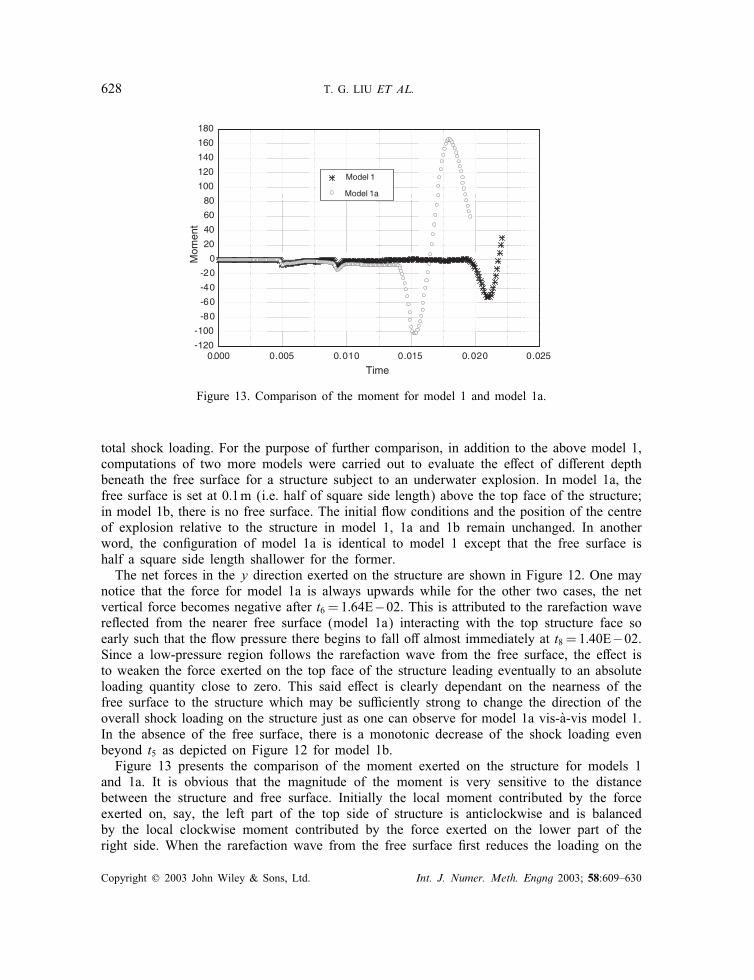
notice that the force for model 1a is always upwards while for the other two cases, the netvertical force becomes negative after t6 = 1:64E−02. This is attributed to the rarefaction wavere�ected from the nearer free surface (model 1a) interacting with the top structure face soearly such that the �ow pressure there begins to fall o� almost immediately at t8 = 1:40E−02.Since a low-pressure region follows the rarefaction wave from the free surface, the e�ect isto weaken the force exerted on the top face of the structure leading eventually to an absoluteloading quantity close to zero. This said e�ect is clearly dependant on the nearness of thefree surface to the structure which may be su�ciently strong to change the direction of theoverall shock loading on the structure just as one can observe for model 1a vis-�a-vis model 1.In the absence of the free surface, there is a monotonic decrease of the shock loading evenbeyond t5 as depicted on Figure 12 for model 1b.Figure 13 presents the comparison of the moment exerted on the structure for models 1
and 1a. It is obvious that the magnitude of the moment is very sensitive to the distancebetween the structure and free surface. Initially the local moment contributed by the forceexerted on, say, the left part of the top side of structure is anticlockwise and is balancedby the local clockwise moment contributed by the force exerted on the lower part of theright side. When the rarefaction wave from the free surface �rst reduces the loading on the
Copyright ? 2003 John Wiley & Sons, Ltd. Int. J. Numer. Meth. Engng 2003; 58:609–630

UNDERWATER SHOCK-FREE SURFACE–STRUCTURE INTERACTION 629
former, the latter prevails and the resultant moment is clockwise (negative). In the two saidmodels, the in�uence of the rarefaction wave occurs earlier in model 1a, and the intensity ofthe re�ected rarefaction wave o� the free surface is stronger which leads to an overall largermagnitude of clockwise moment compared to model 1. Subsequently, with the progress oftime, the re�ected rarefaction wave also reaches the upper part of the left face and right partof the top face of the structure. This has the consequence of decreasing the rate of negativemoment and results in a positive rate of increase. Further evolution sees another turning pointfor the moment plot with a negative rate of decrease and this corresponds to the �ow physicsof the re�ected rarefaction wave from the free surface exerting its in�uence on the upper partof the right face and lower part of the left face of structure.
4. CONCLUSION
The problem of underwater explosion near a free surface and an underwater structure (squarecylinder) has been studied. The numerical results showed that the presence of a free surfacegives rise to an additional rotational moment exerted on the submerged structure, whichpossibly can result in the easier dislodge of the said structure from its original position.Physically, this is attributed to the creation of a very low-pressure region caused by the shock-free surface interaction. Other e�ect of the low-pressure region is manifested as a reversal ofthe vertical force loading on the structure. Our present study further shows that the closer thestructure is to the free surface, the larger is the magnitude of the rotational moment. Finally,in the same realm, it may be mentioned that the presence of an explosion bubble near thesubmerged structure can mitigate to a small extent the shock loading due solely to the originalincident shock. Once again, this is attributed to the low pressure associated with the re�ectedwave from the explosion bubble.
REFERENCES
1. Cole RH. Underwater Explosions. Princeton University Press: Princeton, 1948.2. Chen MH, Collins R. Shock loading on a submerged structure. Physics of Fluids 1974; 17(1):83–91.3. Brett JM. Numerical modelling of shock wave and pressure pulse generation by underwater explosions. DSTOReport, 1998, Melbourne, Victoria, 3001 Australia.
4. Aanhold JE, Meijer GJ, Lemmen PPM. Underwater shock response analysis on a �oating vessel. Shock andVibration 1998; 5:53–59.
5. Wood SL. Cavitation e�ects on a ship-like box structure subjected to an underwater explosion. Master’s Thesis,Naval Postgraduate School, Monterey, CA, 1998.
6. Cocchi J-P, Saurel R. A Riemann problem based method for the resolution of compressible multimaterial �ows.Journal of Computational Physics 1997; 137:265–298.
7. Abgrall R, Karni S. Computations of compressible multi�uids. Journal of Computational Physics 2001; 169:594–623.
8. Fedkiw RP, Marquina A, Merriman B. A non-oscillatory Eulerian approach to interfaces in multimaterial �ows(the ghost �uid method). Journal of Computational Physics 1999; 152:457–492.
9. Liu TG, Khoo BC, Yeo KS. Ghost �uid method for strong shock impacting on material interface. Journal ofComputational Physics 2003, accepted for publication.
10. Saurel R, Abgrall R. A multiphase Godunov method for compressible multi�uid and multiphase �ows. Journalof Computational Physics 1999; 150:425–467.
11. Wardlaw AB, Luton JA. Fluid–structure interaction mechanisms for close-in explosions. Shock and Vibration2000; 7:265–275.
12. Liu TG, Khoo BC, Yeo KS. The simulation of compressible multi-medium �ow. Part I: A new methodologywith applications to 1D gas-gas and gas-water cases. Computers and Fluids 2001a; 30(3):291–314.
Copyright ? 2003 John Wiley & Sons, Ltd. Int. J. Numer. Meth. Engng 2003; 58:609–630
630 T. G. LIU ET AL.
13. Osher S, Sethian A. Fronts propagating with curvature-dependent speed: algorithms based on Hamilton–Jacobiformulation. Journal of Computational Physics 1988; 79:12–49.
14. van Leer B. Towards the ultimate conservative di�erence scheme V. A second-order sequel to Godunov’smethod. Journal of Computational Physics 1979; 32:101–136.
15. Liu TG, Khoo BC, Yeo KS. The simulation of underwater explosion near a free surface. In Proceedings of theHigh Performance Computing Conference, Singapore, 1998; 812–820.
16. Liu TG, Khoo BC, Yeo KS. The numerical simulations of explosion and implosion in air: use of a modi�edHarten’s TVD scheme. International Journal for Numerical Methods in Fluids 1999; 31:661–680.
17. Liu TG, Khoo BC, Yeo KS. The simulation of compressible multi-medium �ow. Part II: Applications to 2Dunderwater shock refraction. Computers and Fluids 2001b; 30(3):315–337.
18. Forrer H, Jeltsch R. A higher-order boundary treatment for cartesian-grid methods. Journal of ComputationalPhysics 1998; 140:259–277.
19. Hillier R. Numerical prediction of shock wave di�raction. In Proceedings of the 16th International Symposiumon Shock Tubes and Waves, 1987, Aachen, West Germany, 1987; 677–683.
Copyright ? 2003 John Wiley & Sons, Ltd. Int. J. Numer. Meth. Engng 2003; 58:609–630
Copyright © 2022 FDOKUMEN