Understanding relationships between conflicting human uses and coastal ecosystems status: A...
11
Please cite this article in press as: Parravicini, V., et al., Understanding relationships between conflicting human uses and coastal ecosystems status: A geospatial modeling approach. Ecol. Indicat. (2011), doi:10.1016/j.ecolind.2011.07.027 ARTICLE IN PRESS G Model ECOIND-948; No. of Pages 11 Ecological Indicators xxx (2011) xxx–xxx Contents lists available at ScienceDirect Ecological Indicators jo ur nal homep age: www.elsevier.com/locate/ecolind Understanding relationships between conflicting human uses and coastal ecosystems status: A geospatial modeling approach V. Parravicini a,b,∗ , A. Rovere a,b , P. Vassallo a , F. Micheli c , M. Montefalcone a , C. Morri a , C. Paoli a , G. Albertelli a , M. Fabiano a , C.N. Bianchi a a DipTeRis, Dipartimento per lo studio del Territorio e delle sue Risorse, Genoa University, Italy b SEAMap srl, Seascape Evaluation Assessment and Mapping, Genoa, Italy c Hopkins Marine Station, Stanford University, Pacific Grove, CA, USA a r t i c l e i n f o Article history: Received 13 April 2011 Received in revised form 27 July 2011 Accepted 29 July 2011 Keywords: Ecosystem status Marine spatial planning Ecosystem-based management Cartography Random forests Multiple stressors Mediterranean Sea a b s t r a c t Human use of ecosystem resources and services is increasing worldwide, generating pressures that alter ecosystem structure, functioning and provision of services. Unexpected ecosystem change is becoming frequent, and the complex ways through which multiple human pressures may interact leave con- servation practitioners and natural resource managers faced with high uncertainty. We developed a geospatial approach for modeling the complex relationships between multiple human pressures and coastal ecosystems status. This framework was then used to produce maps of the expected status of marine coastal ecosystems resulting from variation in the cumulative human pressure. The geospatial modeling approach we developed was tested on an emblematic study case requiring marine spatial plan- ning, i.e. a recently established marine protected area (MPA) that will have to coexist with the expansion of a close commercial harbor. In the study case presented, our modeling approach was used to predict the status of coastal ecosystems resulting from different management alternatives. Results showed that should Port Authority support MPA in reducing human pressures in the area, coastal ecosystems would not be expected to further deteriorate as a consequence of harbor expansion. Our approach proved effec- tive in modeling complex interaction among multiple pressures (e.g. synergisms) and predicting potential future scenarios. The implementation of this approach into geographical information systems (GIS) allows managers to represent the expected outcomes of their planned conservation efforts, thereby represent- ing an important decision-support tool for finding efficient management solutions in the face of complex interactions and high uncertainty. © 2011 Elsevier Ltd. All rights reserved. 1. Introduction Marine ecosystems are challenged worldwide by a vast set of potentially interacting human uses. The human ‘footprint’ on the oceans is so pervasive that many scientists have proposed that no ocean region can still be considered pristine (Jackson and Sala, 2001; Stachowitsch, 2003; Halpern et al., 2008b). Human influence is particularly profound in coastal ecosystems (Vitousek et al., 1997; Halpern et al., 2008b). Here, conflicting human uses generate multi- ple pressures that act simultaneously often producing unexpected ecosystem responses (Crain et al., 2008; Darling and Côté, 2008; Doak et al., 2008; Halpern et al., 2008a). The recognition of the necessity for increased marine conserva- tion has motivated a worldwide establishment of marine protected areas (hereafter MPAs). Despite playing a pivotal role in marine ∗ Corresponding author. E-mail address: [email protected] (V. Parravicini). ecosystem protection, MPAs may not be sufficient alone (Agardy, 1994; Montefalcone et al., 2009). Globally, MPAs rarely cover an adequate extent and representation of different ecosystems and in most cases are too small to protect adequate portions of habitats and populations (Mora et al., 2006). Moreover, MPAs do not address the multiplicity of human pressures along coastal zones and can- not prevent the impacts of coastal pollution or the expansion of invasive species (Agardy, 1994; Halpern, 2003). For these rea- sons, recent conservation literature calls for the implementation of ecosystem-based-management (hereafter EBM) emphasizing that multiple pressures have to be explicitly accounted and addressed in comprehensive, spatially explicit management plan (Ruckelshaus et al., 2008; Thrush and Dayton, 2010). Human pressures and coastal ecosystems have, by definition, a spatial component. This is why cartography is traditionally considered essential for the analysis and management of natu- ral environments (White et al., 1992; Bock et al., 2005). In the marine environment, however, cartography is less developed and less frequently applied compared to the land because of the 1470-160X/$ – see front matter © 2011 Elsevier Ltd. All rights reserved. doi:10.1016/j.ecolind.2011.07.027
-
Upload
independent -
Category
Documents
-
view
4 -
download
0
Transcript of Understanding relationships between conflicting human uses and coastal ecosystems status: A...
E
Ue
VGa
b
c
a
ARRA
KEMECRMM
1
pon2iHpeD
ta
1d
ARTICLE IN PRESSG ModelCOIND-948; No. of Pages 11
Ecological Indicators xxx (2011) xxx–xxx
Contents lists available at ScienceDirect
Ecological Indicators
jo ur nal homep age: www.elsev ier .com/ locate /eco l ind
nderstanding relationships between conflicting human uses and coastalcosystems status: A geospatial modeling approach
. Parravicinia,b,∗, A. Roverea,b, P. Vassalloa, F. Micheli c, M. Montefalconea, C. Morria, C. Paoli a,
. Albertelli a, M. Fabianoa, C.N. Bianchia
DipTeRis, Dipartimento per lo studio del Territorio e delle sue Risorse, Genoa University, ItalySEAMap srl, Seascape Evaluation Assessment and Mapping, Genoa, ItalyHopkins Marine Station, Stanford University, Pacific Grove, CA, USA
r t i c l e i n f o
rticle history:eceived 13 April 2011eceived in revised form 27 July 2011ccepted 29 July 2011
eywords:cosystem statusarine spatial planning
cosystem-based managementartographyandom forestsultiple stressorsediterranean Sea
a b s t r a c t
Human use of ecosystem resources and services is increasing worldwide, generating pressures that alterecosystem structure, functioning and provision of services. Unexpected ecosystem change is becomingfrequent, and the complex ways through which multiple human pressures may interact leave con-servation practitioners and natural resource managers faced with high uncertainty. We developed ageospatial approach for modeling the complex relationships between multiple human pressures andcoastal ecosystems status. This framework was then used to produce maps of the expected status ofmarine coastal ecosystems resulting from variation in the cumulative human pressure. The geospatialmodeling approach we developed was tested on an emblematic study case requiring marine spatial plan-ning, i.e. a recently established marine protected area (MPA) that will have to coexist with the expansionof a close commercial harbor. In the study case presented, our modeling approach was used to predictthe status of coastal ecosystems resulting from different management alternatives. Results showed thatshould Port Authority support MPA in reducing human pressures in the area, coastal ecosystems would
not be expected to further deteriorate as a consequence of harbor expansion. Our approach proved effec-tive in modeling complex interaction among multiple pressures (e.g. synergisms) and predicting potentialfuture scenarios. The implementation of this approach into geographical information systems (GIS) allowsmanagers to represent the expected outcomes of their planned conservation efforts, thereby represent-ing an important decision-support tool for finding efficient management solutions in the face of complexinteractions and high uncertainty.. Introduction
Marine ecosystems are challenged worldwide by a vast set ofotentially interacting human uses. The human ‘footprint’ on theceans is so pervasive that many scientists have proposed thato ocean region can still be considered pristine (Jackson and Sala,001; Stachowitsch, 2003; Halpern et al., 2008b). Human influence
s particularly profound in coastal ecosystems (Vitousek et al., 1997;alpern et al., 2008b). Here, conflicting human uses generate multi-le pressures that act simultaneously often producing unexpectedcosystem responses (Crain et al., 2008; Darling and Côté, 2008;oak et al., 2008; Halpern et al., 2008a).
Please cite this article in press as: Parravicini, V., et al., Understandecosystems status: A geospatial modeling approach. Ecol. Indicat. (20
The recognition of the necessity for increased marine conserva-ion has motivated a worldwide establishment of marine protectedreas (hereafter MPAs). Despite playing a pivotal role in marine
∗ Corresponding author.E-mail address: [email protected] (V. Parravicini).
470-160X/$ – see front matter © 2011 Elsevier Ltd. All rights reserved.oi:10.1016/j.ecolind.2011.07.027
© 2011 Elsevier Ltd. All rights reserved.
ecosystem protection, MPAs may not be sufficient alone (Agardy,1994; Montefalcone et al., 2009). Globally, MPAs rarely cover anadequate extent and representation of different ecosystems and inmost cases are too small to protect adequate portions of habitatsand populations (Mora et al., 2006). Moreover, MPAs do not addressthe multiplicity of human pressures along coastal zones and can-not prevent the impacts of coastal pollution or the expansion ofinvasive species (Agardy, 1994; Halpern, 2003). For these rea-sons, recent conservation literature calls for the implementation ofecosystem-based-management (hereafter EBM) emphasizing thatmultiple pressures have to be explicitly accounted and addressed incomprehensive, spatially explicit management plan (Ruckelshauset al., 2008; Thrush and Dayton, 2010).
Human pressures and coastal ecosystems have, by definition,a spatial component. This is why cartography is traditionally
ing relationships between conflicting human uses and coastal11), doi:10.1016/j.ecolind.2011.07.027
considered essential for the analysis and management of natu-ral environments (White et al., 1992; Bock et al., 2005). In themarine environment, however, cartography is less developed andless frequently applied compared to the land because of the
ING ModelE
2 cal Ind
raee1lmEbcv(
asmb(
sfirdi(sicaasst
tptpatlnDati2
ibewnctc
2
2
ee
ARTICLECOIND-948; No. of Pages 11
V. Parravicini et al. / Ecologi
eluctance to consider the sea as a ‘territory’ and the evident oper-tional difficulties involved (Bianchi et al., 2004). Early approachesmphasized the need to integrate ‘naturalistic’ maps with ‘socio-conomic’ maps for coastal zone management (Bianchi and Zattera,986). Modern tools for spatially-explicit planning stem from the
ong-standing cartographic tradition and use in environmentalanagement and are viewed as fundamental for implementing
BM (Stelzenmuller et al., 2010a). Understanding the relationshipsetween multiple human pressures and the status of ecosystems isrucial to develop spatial plans whose main goal is the cartographicisualization of the results of different management alternativesDouvere, 2008).
Yet, understanding the relationships between multiple humanctivities and the status of ecosystems is difficult for two main rea-ons: (1) multiple pressures may interact in complex non-additiveanners (Shears and Ross, 2010) and (2) spatial information on
oth ecosystem status and potential sources of impact is scarceHalpern et al., 2008a; Fraschetti et al., 2009).
While disentangling complex interactions among multiple pres-ures (e.g. non-additive behaviors) can be effectively done inactorial experiments manipulating stressors both separately andn combination (Crain et al., 2008), this remains challenging in theeal world, where pressures are typically more than two and theirirect manipulation is often unfeasible. However, such information
s needed and represents the base-knowledge to implement EBMThrush et al., 2008). In the real world, scientists are faced with auite of information gaps and statistical challenges, including miss-ng data, lack of normally distributed variables and with spatialorrelation among different human pressures. Flexible approachesnd modeling tools capable to highlight multiple stressors inter-ction and to cope with uncertainty are necessary to implementpatial plans; waiting for the ideal conditions to understand pres-ures/status relationships is a luxury that marine ecosystems andheir managers can hardly afford (Parravicini et al., 2010).
In spite of the objective difficulties mentioned above, informa-ion on human pressures distribution by means of surrogates (e.g.resence/absence of relevant human activities or weighted dis-ance from these activities) have been successfully used to mappingotential risks of human impact (Eastwood et al., 2007; Petrosillo etl., 2010; Stelzenmuller et al., 2010b; Mensa et al., 2011). In addi-ion, gaps of knowledge of coastal ecosystem status are being, ateast in part, filled by the huge amount of data made available byational and international initiatives (e.g. the Water Frameworkirective and the Marine Strategy Directive of the European Union,nd the Clean Water Act in the USA). All these instruments requirehe adoption of appropriate monitoring plans aimed at assess-ng ecosystems status through ecological indicators (Olsson et al.,008; Hering et al., 2010).
We developed and tested a spatially-explicit and flexible model-ng approach to quantifying and visually representing interactionsetween a suite of human pressures and the status of differentcosystem types across intensely-utilized coastal seascapes. Here,e use this approach to visualize the expected outcomes of alter-ative management scenarios for an emblematic case study fromoastal Italy: a coastal zone where a newly established marine pro-ected area will have to coexist with the planned extension of alose commercial harbor.
. Methods
.1. Conceptual framework
Please cite this article in press as: Parravicini, V., et al., Understandecosystems status: A geospatial modeling approach. Ecol. Indicat. (20
The primary goal of marine spatial planning is assessing theffects of different management alternatives on the state of coastalcosystems (Douvere, 2008). Most techniques developed in this
PRESSicators xxx (2011) xxx–xxx
field are based on expert-judgment surveys or literature reviews.Both methods are used to assess the vulnerability of different habi-tats to selected human pressures (Selkoe et al., 2009; De Lange et al.,2010). If the spatial distribution of both marine habitats and humanpressures is known, then a measure representing the potential riskof impact can be computed and represented on maps, therebyhelping identify the most efficient management solution, i.e. theone capable to minimize the risk of impact (Halpern et al., 2009;Stelzenmuller et al., 2010b). These approaches have the invalu-able advantage that spatial plans can be implemented when dataon ecosystem status are missing or scarce, e.g. over large scalesallowing a synoptic view of the territory to be managed (Bianchi,2008). The main drawback of such approaches, however, is thatmultiple pressures are generally assumed arbitrarily to play addi-tively (Halpern et al., 2009). This is a limitation when consideringthat almost three-quarters of studies on multiple pressures effectsdetected significant non-additive interactions (Crain et al., 2008;Darling and Côté, 2008). Without using data on ecosystem status,in fact, expert- or literature-based techniques can hardly detect andunderstand the complex interactions that may exist among pres-sures (e.g. synergisms or antagonisms). In addition, these behaviorsare spatially variable and extremely site-specific, making it difficult,if not impossible, to extrapolate general rules to be used a priori overvast spatial scales (Crain et al., 2008).
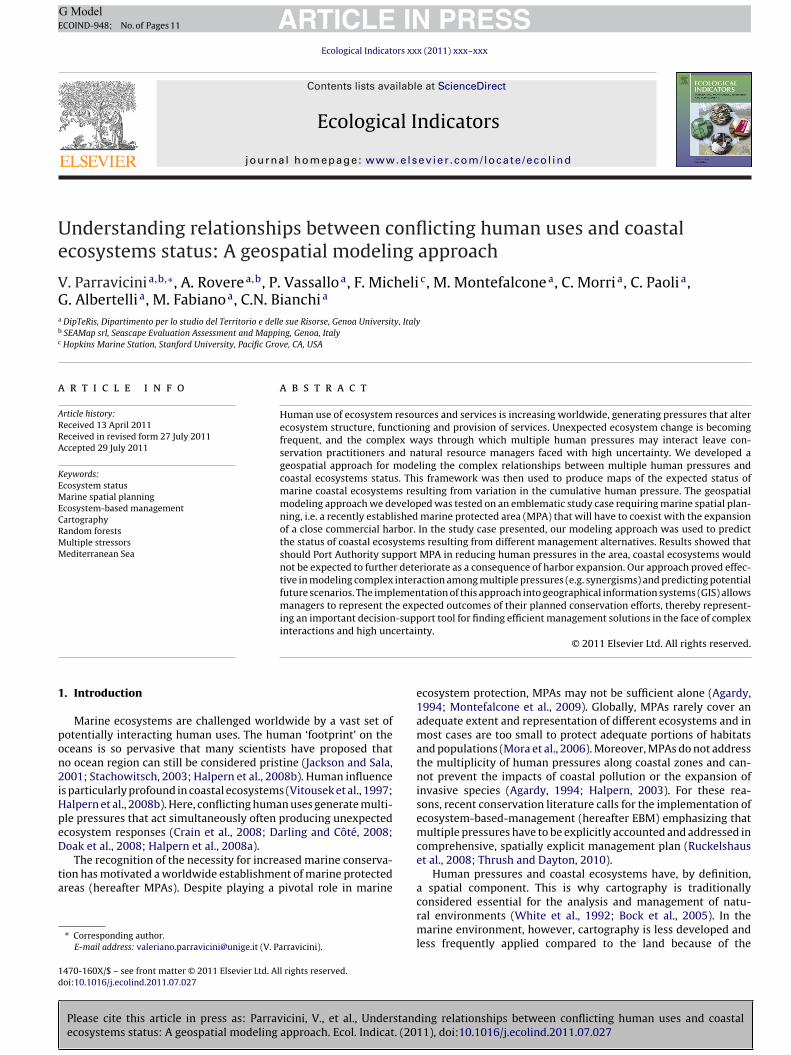
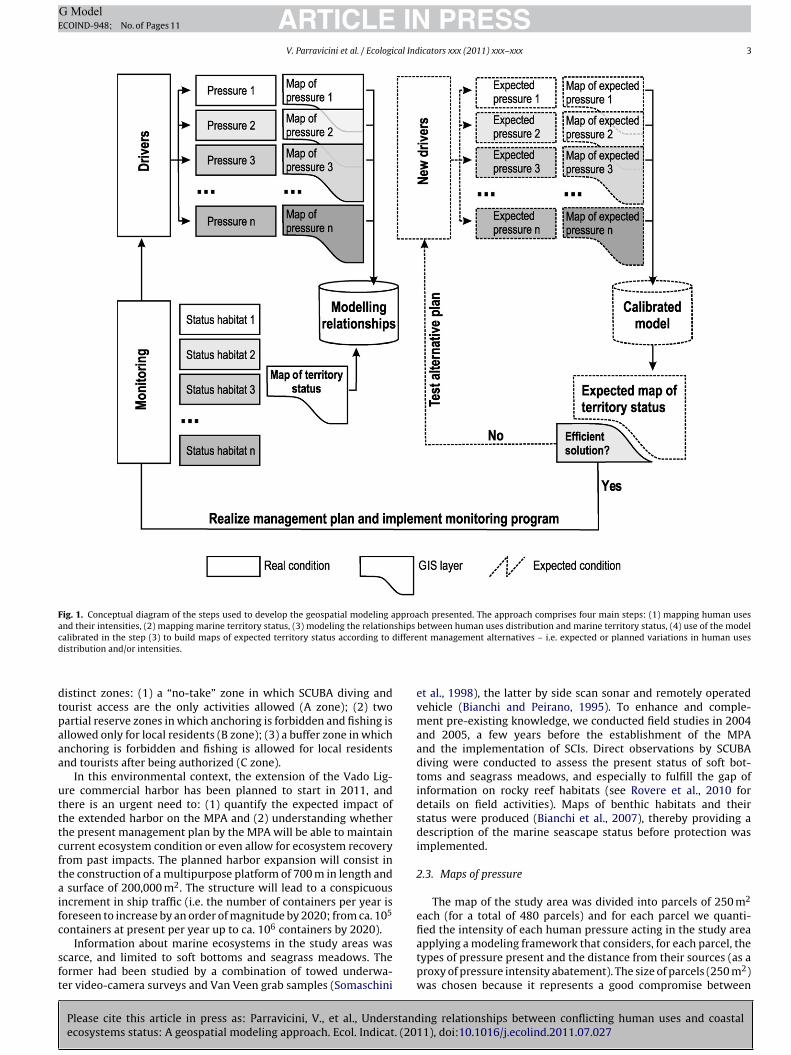
Considering field data, our approach enables the modeling ofthe relationships between multiple pressures and ecosystem sta-tus and to use such information to predict the results of differentmanagement alternatives. The geospatial modeling tool presentedcomprises four main steps: (1) the GIS (geographical informationsystem) mapping of human pressures and their intensities, (2) theGIS mapping of marine ecosystem status, (3) the modeling of therelationships between human pressures distribution and marineecosystem status, (4) the use of the model calibrated in the step (3)to build maps of expected ecosystem status according to differentmanagement alternatives – i.e. expected or planned variations inhuman pressures distribution and intensities (Fig. 1). Within theframework of this geospatial approach, once a efficient solution isfound, appropriate monitoring plans must be implemented to allowfor future more accurate calibration of the model.
2.2. Study area and field data
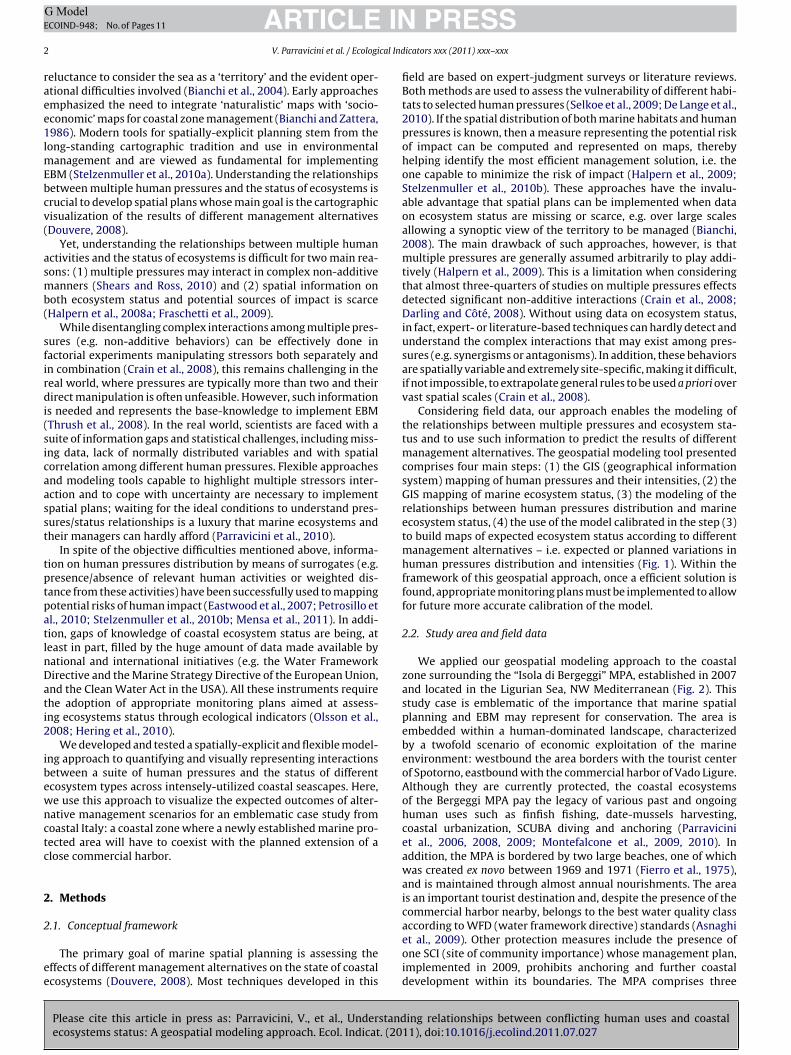
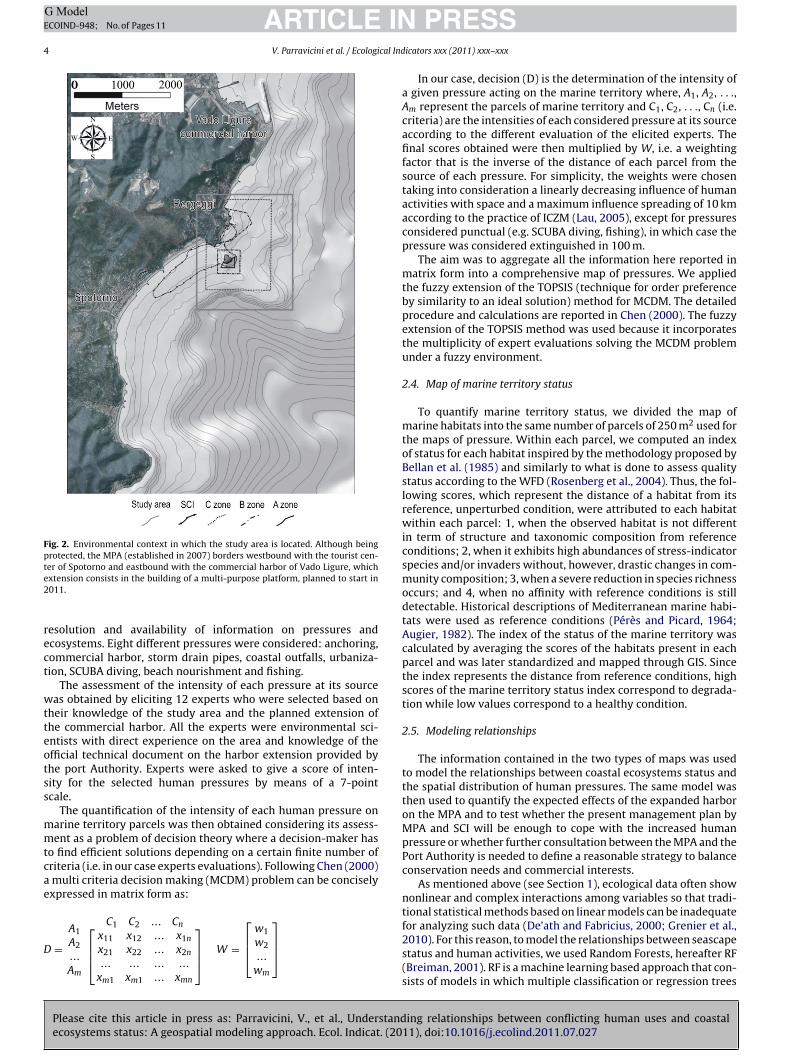
We applied our geospatial modeling approach to the coastalzone surrounding the “Isola di Bergeggi” MPA, established in 2007and located in the Ligurian Sea, NW Mediterranean (Fig. 2). Thisstudy case is emblematic of the importance that marine spatialplanning and EBM may represent for conservation. The area isembedded within a human-dominated landscape, characterizedby a twofold scenario of economic exploitation of the marineenvironment: westbound the area borders with the tourist centerof Spotorno, eastbound with the commercial harbor of Vado Ligure.Although they are currently protected, the coastal ecosystemsof the Bergeggi MPA pay the legacy of various past and ongoinghuman uses such as finfish fishing, date-mussels harvesting,coastal urbanization, SCUBA diving and anchoring (Parraviciniet al., 2006, 2008, 2009; Montefalcone et al., 2009, 2010). Inaddition, the MPA is bordered by two large beaches, one of whichwas created ex novo between 1969 and 1971 (Fierro et al., 1975),and is maintained through almost annual nourishments. The areais an important tourist destination and, despite the presence of thecommercial harbor nearby, belongs to the best water quality classaccording to WFD (water framework directive) standards (Asnaghi
ing relationships between conflicting human uses and coastal11), doi:10.1016/j.ecolind.2011.07.027
et al., 2009). Other protection measures include the presence ofone SCI (site of community importance) whose management plan,implemented in 2009, prohibits anchoring and further coastaldevelopment within its boundaries. The MPA comprises three
ARTICLE IN PRESSG ModelECOIND-948; No. of Pages 11
V. Parravicini et al. / Ecological Indicators xxx (2011) xxx–xxx 3
Fig. 1. Conceptual diagram of the steps used to develop the geospatial modeling approach presented. The approach comprises four main steps: (1) mapping human usesand their intensities, (2) mapping marine territory status, (3) modeling the relationships between human uses distribution and marine territory status, (4) use of the modelc iffered
dtpaaa
utttcftaifc
sft
alibrated in the step (3) to build maps of expected territory status according to distribution and/or intensities.
istinct zones: (1) a “no-take” zone in which SCUBA diving andourist access are the only activities allowed (A zone); (2) twoartial reserve zones in which anchoring is forbidden and fishing isllowed only for local residents (B zone); (3) a buffer zone in whichnchoring is forbidden and fishing is allowed for local residentsnd tourists after being authorized (C zone).
In this environmental context, the extension of the Vado Lig-re commercial harbor has been planned to start in 2011, andhere is an urgent need to: (1) quantify the expected impact ofhe extended harbor on the MPA and (2) understanding whetherhe present management plan by the MPA will be able to maintainurrent ecosystem condition or even allow for ecosystem recoveryrom past impacts. The planned harbor expansion will consist inhe construction of a multipurpose platform of 700 m in length and
surface of 200,000 m2. The structure will lead to a conspicuousncrement in ship traffic (i.e. the number of containers per year isoreseen to increase by an order of magnitude by 2020; from ca. 105
ontainers at present per year up to ca. 106 containers by 2020).Information about marine ecosystems in the study areas was
Please cite this article in press as: Parravicini, V., et al., Understandecosystems status: A geospatial modeling approach. Ecol. Indicat. (20
carce, and limited to soft bottoms and seagrass meadows. Theormer had been studied by a combination of towed underwa-er video-camera surveys and Van Veen grab samples (Somaschini
nt management alternatives – i.e. expected or planned variations in human uses
et al., 1998), the latter by side scan sonar and remotely operatedvehicle (Bianchi and Peirano, 1995). To enhance and comple-ment pre-existing knowledge, we conducted field studies in 2004and 2005, a few years before the establishment of the MPAand the implementation of SCIs. Direct observations by SCUBAdiving were conducted to assess the present status of soft bot-toms and seagrass meadows, and especially to fulfill the gap ofinformation on rocky reef habitats (see Rovere et al., 2010 fordetails on field activities). Maps of benthic habitats and theirstatus were produced (Bianchi et al., 2007), thereby providing adescription of the marine seascape status before protection wasimplemented.
2.3. Maps of pressure
The map of the study area was divided into parcels of 250 m2
each (for a total of 480 parcels) and for each parcel we quanti-fied the intensity of each human pressure acting in the study areaapplying a modeling framework that considers, for each parcel, the
ing relationships between conflicting human uses and coastal11), doi:10.1016/j.ecolind.2011.07.027
types of pressure present and the distance from their sources (as aproxy of pressure intensity abatement). The size of parcels (250 m2)was chosen because it represents a good compromise between
ARTICLE ING ModelECOIND-948; No. of Pages 11
4 V. Parravicini et al. / Ecological Ind
Fig. 2. Environmental context in which the study area is located. Although beingprotected, the MPA (established in 2007) borders westbound with the tourist cen-ter of Spotorno and eastbound with the commercial harbor of Vado Ligure, whiche2
rect
wtteotss
mmtcae
D2010). For this reason, to model the relationships between seascape
xtension consists in the building of a multi-purpose platform, planned to start in011.
esolution and availability of information on pressures andcosystems. Eight different pressures were considered: anchoring,ommercial harbor, storm drain pipes, coastal outfalls, urbaniza-ion, SCUBA diving, beach nourishment and fishing.
The assessment of the intensity of each pressure at its sourceas obtained by eliciting 12 experts who were selected based on
heir knowledge of the study area and the planned extension ofhe commercial harbor. All the experts were environmental sci-ntists with direct experience on the area and knowledge of thefficial technical document on the harbor extension provided byhe port Authority. Experts were asked to give a score of inten-ity for the selected human pressures by means of a 7-pointcale.
The quantification of the intensity of each human pressure onarine territory parcels was then obtained considering its assess-ent as a problem of decision theory where a decision-maker has
o find efficient solutions depending on a certain finite number ofriteria (i.e. in our case experts evaluations). Following Chen (2000)
multi criteria decision making (MCDM) problem can be conciselyxpressed in matrix form as:
A1A
C1 C2 ... Cn⎡x11 x12 ... x1n
⎤ ⎡⎢
w1w
⎤⎥
Please cite this article in press as: Parravicini, V., et al., Understandecosystems status: A geospatial modeling approach. Ecol. Indicat. (20
= 2...Am
⎢⎣ x21 x22 ... x2n
... ... ... ...xm1 xm1 ... xmn
⎥⎦ W = ⎣ 2...
wm
⎦
PRESSicators xxx (2011) xxx–xxx
In our case, decision (D) is the determination of the intensity ofa given pressure acting on the marine territory where, A1, A2, . . .,Am represent the parcels of marine territory and C1, C2, . . ., Cn (i.e.criteria) are the intensities of each considered pressure at its sourceaccording to the different evaluation of the elicited experts. Thefinal scores obtained were then multiplied by W, i.e. a weightingfactor that is the inverse of the distance of each parcel from thesource of each pressure. For simplicity, the weights were chosentaking into consideration a linearly decreasing influence of humanactivities with space and a maximum influence spreading of 10 kmaccording to the practice of ICZM (Lau, 2005), except for pressuresconsidered punctual (e.g. SCUBA diving, fishing), in which case thepressure was considered extinguished in 100 m.
The aim was to aggregate all the information here reported inmatrix form into a comprehensive map of pressures. We appliedthe fuzzy extension of the TOPSIS (technique for order preferenceby similarity to an ideal solution) method for MCDM. The detailedprocedure and calculations are reported in Chen (2000). The fuzzyextension of the TOPSIS method was used because it incorporatesthe multiplicity of expert evaluations solving the MCDM problemunder a fuzzy environment.
2.4. Map of marine territory status
To quantify marine territory status, we divided the map ofmarine habitats into the same number of parcels of 250 m2 used forthe maps of pressure. Within each parcel, we computed an indexof status for each habitat inspired by the methodology proposed byBellan et al. (1985) and similarly to what is done to assess qualitystatus according to the WFD (Rosenberg et al., 2004). Thus, the fol-lowing scores, which represent the distance of a habitat from itsreference, unperturbed condition, were attributed to each habitatwithin each parcel: 1, when the observed habitat is not differentin term of structure and taxonomic composition from referenceconditions; 2, when it exhibits high abundances of stress-indicatorspecies and/or invaders without, however, drastic changes in com-munity composition; 3, when a severe reduction in species richnessoccurs; and 4, when no affinity with reference conditions is stilldetectable. Historical descriptions of Mediterranean marine habi-tats were used as reference conditions (Pérès and Picard, 1964;Augier, 1982). The index of the status of the marine territory wascalculated by averaging the scores of the habitats present in eachparcel and was later standardized and mapped through GIS. Sincethe index represents the distance from reference conditions, highscores of the marine territory status index correspond to degrada-tion while low values correspond to a healthy condition.
2.5. Modeling relationships
The information contained in the two types of maps was usedto model the relationships between coastal ecosystems status andthe spatial distribution of human pressures. The same model wasthen used to quantify the expected effects of the expanded harboron the MPA and to test whether the present management plan byMPA and SCI will be enough to cope with the increased humanpressure or whether further consultation between the MPA and thePort Authority is needed to define a reasonable strategy to balanceconservation needs and commercial interests.
As mentioned above (see Section 1), ecological data often shownonlinear and complex interactions among variables so that tradi-tional statistical methods based on linear models can be inadequatefor analyzing such data (De’ath and Fabricius, 2000; Grenier et al.,
ing relationships between conflicting human uses and coastal11), doi:10.1016/j.ecolind.2011.07.027
status and human activities, we used Random Forests, hereafter RF(Breiman, 2001). RF is a machine learning based approach that con-sists of models in which multiple classification or regression trees
ING ModelE
cal Ind
art(ia
tscemgwctepvbsTvpt
2
f
hrassinfabp
eotq
e
•
•
•
•
ARTICLECOIND-948; No. of Pages 11
V. Parravicini et al. / Ecologi
re fitted to the data and their predictions are combined in a finalesult. RF has been shown more effective in building predictionshan other commonly used techniques such as regression modelsCutler et al., 2007). In addition, RF is capable to highlight complexnteractions and to handle non parametric data, collinear predictorsnd missing values (Siroky, 2009).
In the present paper, RF was built using 120 regression treeso model the relationships between the marine territory statuscore and the scores of each human use. The number of trees washosen after testing the number required to minimize predictionrrors expressed as “out of the bag” errors (Siroky, 2009). RF wasade spatially-explicit by appropriate weighting obtained by a
eospatial variogram (Bel et al., 2009). The accuracy of the modelas then evaluated by calculating the Pearson correlation coeffi-
ient between the observed status scores and those predicted byhe model. To rank the priorities for protection, the importance ofach human use in altering the marine territory status was com-uted (Cutler et al., 2007). In RF, the importance of a predictorariable is measured by comparing the accuracy of the predictionsy the model using the original variable with the accuracy of theame model using a randomly permuted variable (Siroky, 2009).he effect of each human use on marine territory status was thenisualized through univariate partial dependence plots, whereasotential interactions were visually assessed through bivariate par-ial dependence plots (Liaw and Wiener, 2002).
.6. Scenarios building and representation
In order to visualize the effects of harbor expansion on the MPA,our scenarios were developed by eliciting experts’ judgment.
Experts were asked to quantify: (1) expected intensity of thearbor pressure after its expansion; (2) intensity of the pressuresegulated by the present management plan of the MPA and SCI (i.e.nchoring, fishing, SCUBA diving); (3) expected intensity of pres-ures in the event that the Port Authority will solve conflicts withtakeholders allowing MPA manager to minimize human pressuresn the area. The latter effort was defined as follow: (1) beach re-ourishments are no longer performed; (2) fishing is completely
orbidden within the no-take zone and the partial reserve zonend allowed only to residents within the buffer zone; (3) the SCIoundaries are extended to the whole area, implying the completerohibition of anchoring.
In the case of the expected impact of the harbor after itsxpansion, both the maximum and the minimum values of impactbtained via experts elicitation were considered in order to verifyhe model sensitivity to potential errors made by experts in theuantification of the expected influence of this particular pressure.
Then, the following four scenarios and the relative maps of thexpected status of the marine territory were built:
Scenario O-ME: the optimistic condition (O) in which the influ-ence of the extended harbor will be the minimum expected bythe experts, and the Port Authority will do its maximum effort(ME) in sustaining MPA to reduce human pressure in the areaScenario O-DN: the optimistic condition (O) in which the influ-ence of the extended harbor will be the minimum expected by theexperts, and MPA will maintain the present management plan (donothing, DN)Scenario P-ME: the pessimistic condition (P) in which the influ-ence of the extended harbor will be the maximum expected bythe experts, and the Port Authority will do its maximum effort(ME) in sustaining MPA to reduce human pressure in the area
Please cite this article in press as: Parravicini, V., et al., Understandecosystems status: A geospatial modeling approach. Ecol. Indicat. (20
Scenario P-DN: the pessimistic condition (P) in which the influ-ence of the extended harbor will be the maximum expected bythe experts, and MPA will maintain the present management plan(do nothing, DN)
PRESSicators xxx (2011) xxx–xxx 5
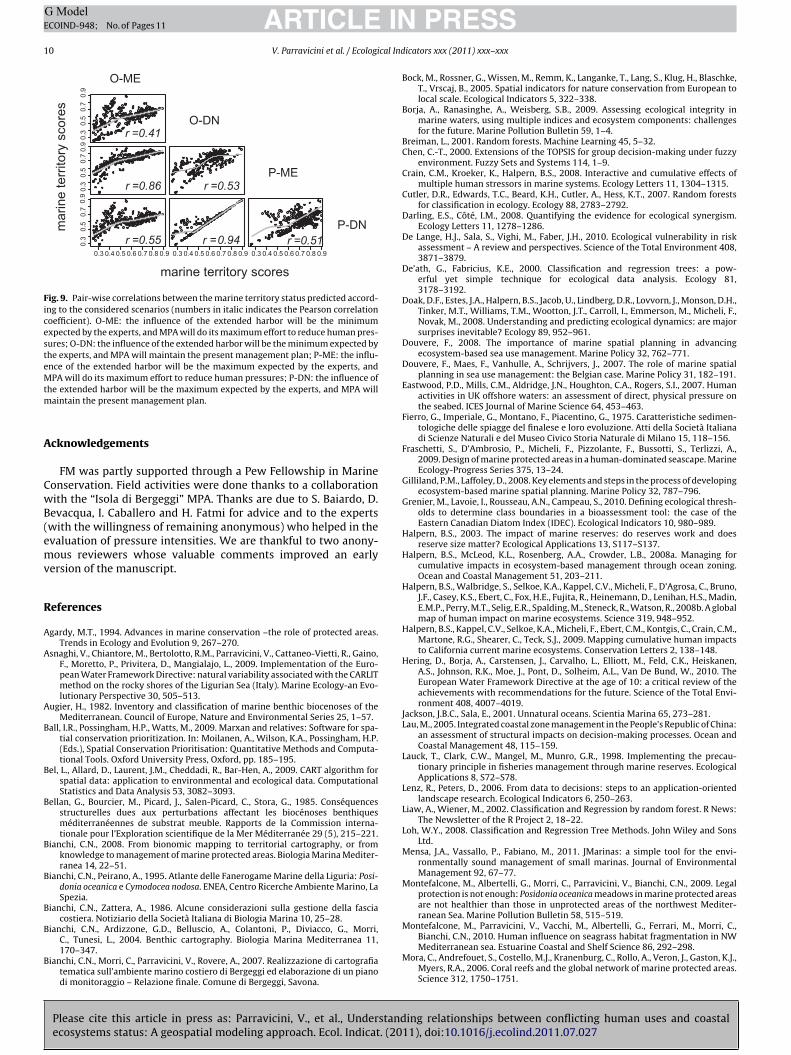
The relationships between the seascape status predicted by themodel under the four scenarios were assessed by computing thePearson correlation coefficient.
3. Results
3.1. Map of pressures
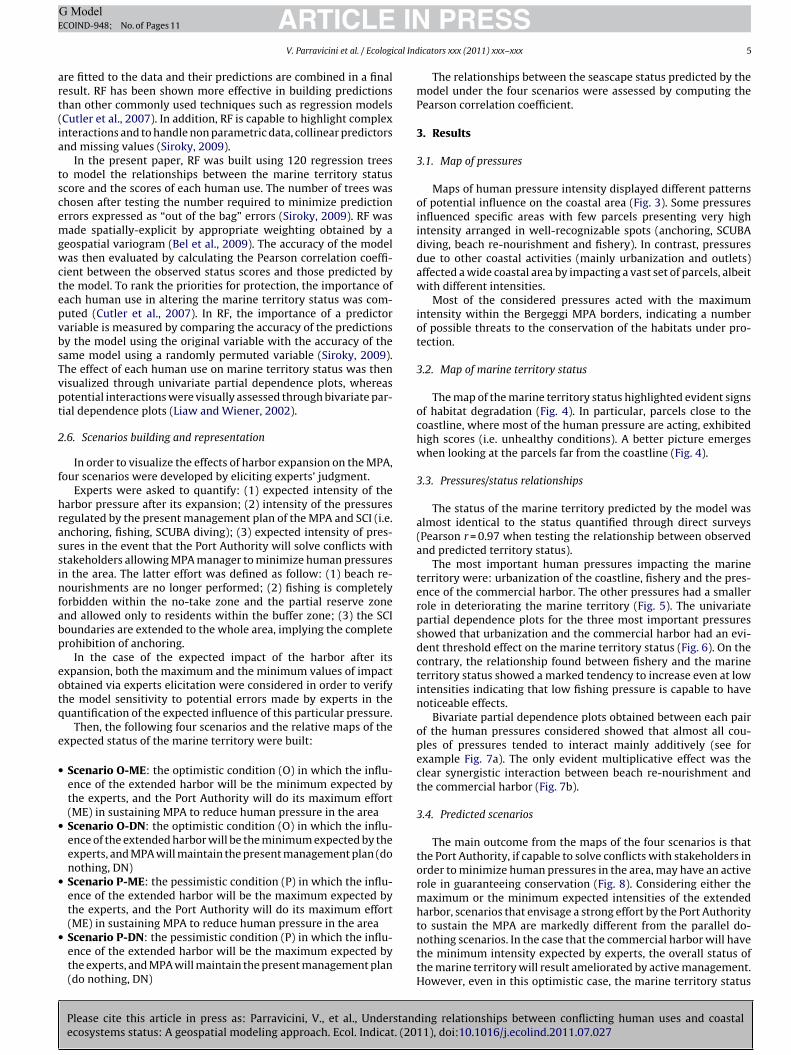
Maps of human pressure intensity displayed different patternsof potential influence on the coastal area (Fig. 3). Some pressuresinfluenced specific areas with few parcels presenting very highintensity arranged in well-recognizable spots (anchoring, SCUBAdiving, beach re-nourishment and fishery). In contrast, pressuresdue to other coastal activities (mainly urbanization and outlets)affected a wide coastal area by impacting a vast set of parcels, albeitwith different intensities.
Most of the considered pressures acted with the maximumintensity within the Bergeggi MPA borders, indicating a numberof possible threats to the conservation of the habitats under pro-tection.
3.2. Map of marine territory status
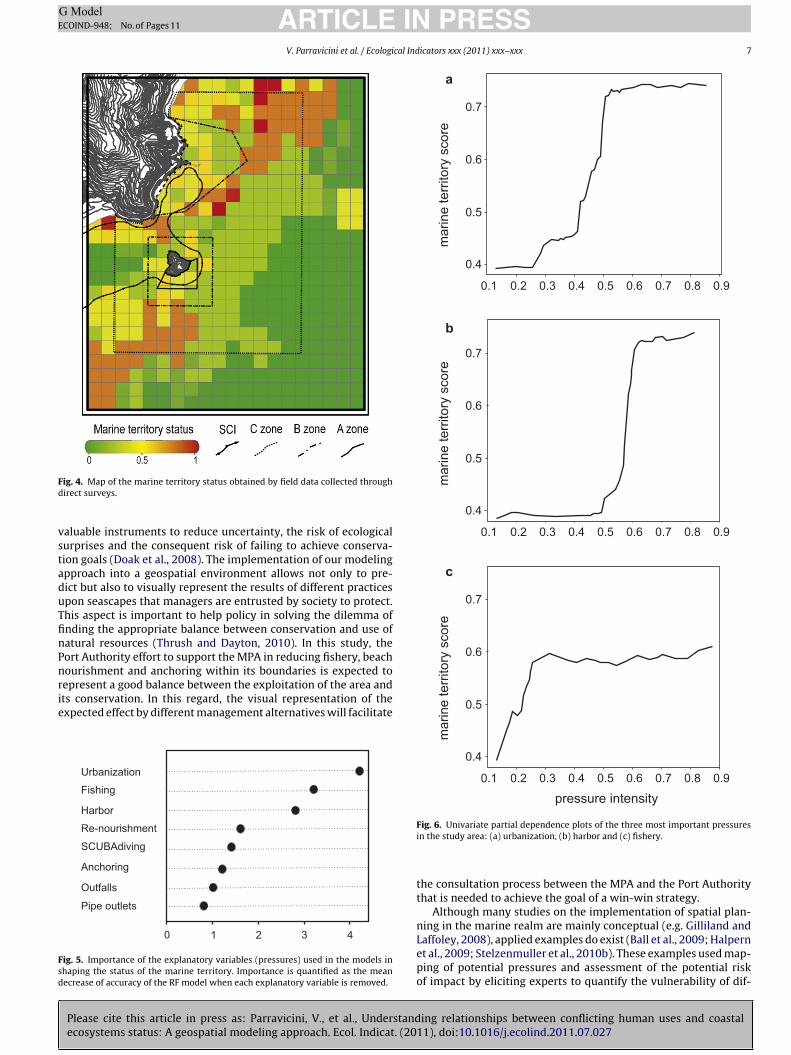
The map of the marine territory status highlighted evident signsof habitat degradation (Fig. 4). In particular, parcels close to thecoastline, where most of the human pressure are acting, exhibitedhigh scores (i.e. unhealthy conditions). A better picture emergeswhen looking at the parcels far from the coastline (Fig. 4).
3.3. Pressures/status relationships
The status of the marine territory predicted by the model wasalmost identical to the status quantified through direct surveys(Pearson r = 0.97 when testing the relationship between observedand predicted territory status).
The most important human pressures impacting the marineterritory were: urbanization of the coastline, fishery and the pres-ence of the commercial harbor. The other pressures had a smallerrole in deteriorating the marine territory (Fig. 5). The univariatepartial dependence plots for the three most important pressuresshowed that urbanization and the commercial harbor had an evi-dent threshold effect on the marine territory status (Fig. 6). On thecontrary, the relationship found between fishery and the marineterritory status showed a marked tendency to increase even at lowintensities indicating that low fishing pressure is capable to havenoticeable effects.
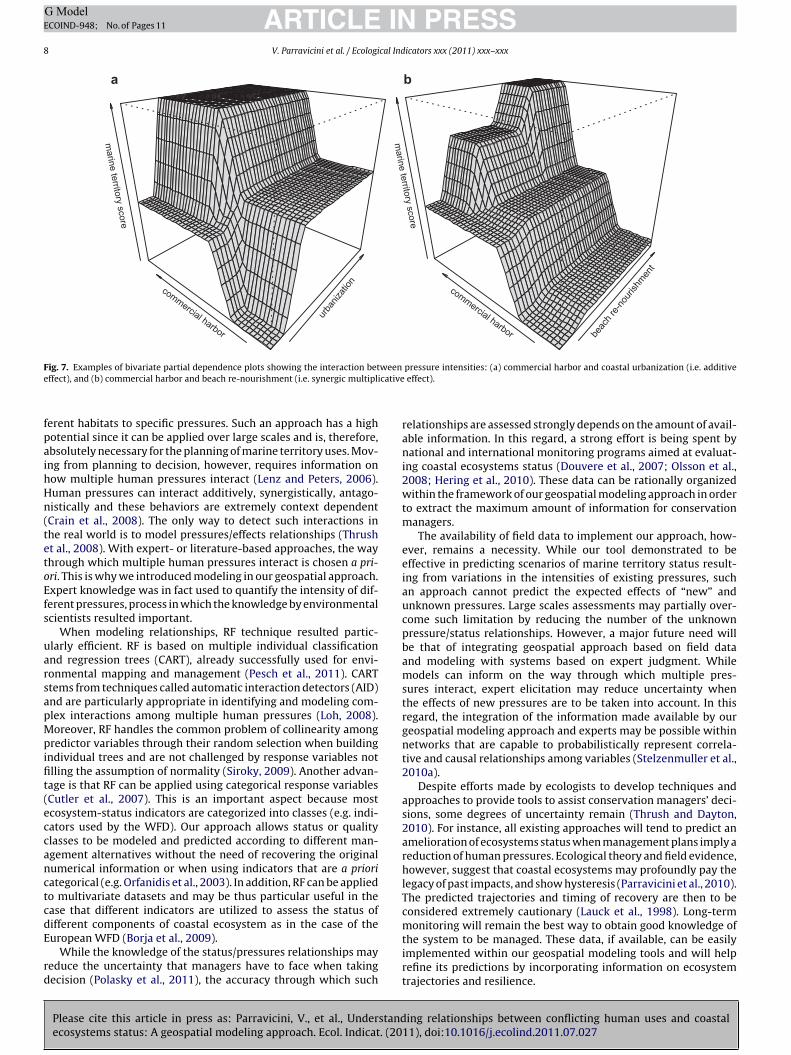
Bivariate partial dependence plots obtained between each pairof the human pressures considered showed that almost all cou-ples of pressures tended to interact mainly additively (see forexample Fig. 7a). The only evident multiplicative effect was theclear synergistic interaction between beach re-nourishment andthe commercial harbor (Fig. 7b).
3.4. Predicted scenarios
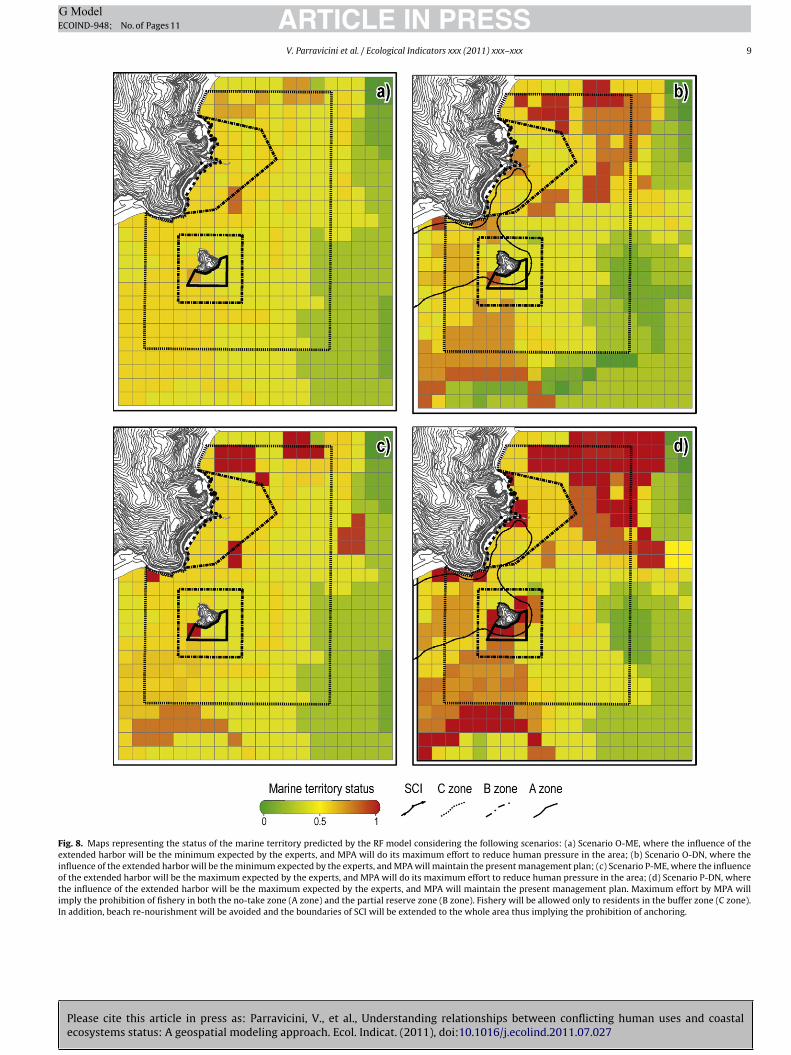
The main outcome from the maps of the four scenarios is thatthe Port Authority, if capable to solve conflicts with stakeholders inorder to minimize human pressures in the area, may have an activerole in guaranteeing conservation (Fig. 8). Considering either themaximum or the minimum expected intensities of the extendedharbor, scenarios that envisage a strong effort by the Port Authorityto sustain the MPA are markedly different from the parallel do-
ing relationships between conflicting human uses and coastal11), doi:10.1016/j.ecolind.2011.07.027
nothing scenarios. In the case that the commercial harbor will havethe minimum intensity expected by experts, the overall status ofthe marine territory will result ameliorated by active management.However, even in this optimistic case, the marine territory status
ARTICLE IN PRESSG ModelECOIND-948; No. of Pages 11
6 V. Parravicini et al. / Ecological Indicators xxx (2011) xxx–xxx
F a) anc(
wrtcmt
ig. 3. Maps of human use intensity obtained for the following selected pressures: (f) SCUBA diving activity, (g) beach re-nourishment, (h) fishery.
ill show extensive portions with high scores (i.e. no affinities witheference conditions), especially along the coastline. Using either
Please cite this article in press as: Parravicini, V., et al., Understandecosystems status: A geospatial modeling approach. Ecol. Indicat. (20
he minimum or the maximum expected intensity of the extendedommercial harbor did not profoundly affect the outcomes of theodel, thus highlighting that territory status predictions are robust
o possible errors made by the elicited experts (Fig. 9).
horing, (b) commercial harbor, (c) pipe outlets; (d) coastal outfalls, (e) urbanization,
4. Discussion
ing relationships between conflicting human uses and coastal11), doi:10.1016/j.ecolind.2011.07.027
This study aimed to develop a standardized framework allowingscientists and managers to compare the results of different man-agement alternatives on marine ecosystems status. This is crucialfor implementing EBM that is expected to provide managers with
ARTICLE IN PRESSG ModelECOIND-948; No. of Pages 11
V. Parravicini et al. / Ecological Indicators xxx (2011) xxx–xxx 7
Fd
vstaduTfinPnrie
Fsd
a
b
c
0.4
0.5
0.6
0.7
mar
ine
terr
itory
sco
rem
arin
e te
rrito
ry s
core
rrito
ry s
core
0.1 0.2 0.3 0.4 0.5 0.6 0.7 0.8 0.9
0.4
0.5
0.6
0.7
0.1 0.2 0.3 0.4 0.5 0.6 0.7 0.8 0.9
0.6
0.7
ig. 4. Map of the marine territory status obtained by field data collected throughirect surveys.
aluable instruments to reduce uncertainty, the risk of ecologicalurprises and the consequent risk of failing to achieve conserva-ion goals (Doak et al., 2008). The implementation of our modelingpproach into a geospatial environment allows not only to pre-ict but also to visually represent the results of different practicespon seascapes that managers are entrusted by society to protect.his aspect is important to help policy in solving the dilemma ofnding the appropriate balance between conservation and use ofatural resources (Thrush and Dayton, 2010). In this study, theort Authority effort to support the MPA in reducing fishery, beachourishment and anchoring within its boundaries is expected to
Please cite this article in press as: Parravicini, V., et al., Understandecosystems status: A geospatial modeling approach. Ecol. Indicat. (20
epresent a good balance between the exploitation of the area andts conservation. In this regard, the visual representation of thexpected effect by different management alternatives will facilitate
Urbanization
Fishing
Harbor
Re-nourishment
SCUBAdiving
Anchoring
Outfalls
0 21 3 4
Pipe outlets
ig. 5. Importance of the explanatory variables (pressures) used in the models inhaping the status of the marine territory. Importance is quantified as the meanecrease of accuracy of the RF model when each explanatory variable is removed.
pressure intensity
mar
ine
te
0.4
0.5
0.1 0.2 0.3 0.4 0.5 0.6 0.7 0.8 0.9
Fig. 6. Univariate partial dependence plots of the three most important pressures
in the study area: (a) urbanization, (b) harbor and (c) fishery.the consultation process between the MPA and the Port Authoritythat is needed to achieve the goal of a win-win strategy.
Although many studies on the implementation of spatial plan-ning in the marine realm are mainly conceptual (e.g. Gilliland and
ing relationships between conflicting human uses and coastal11), doi:10.1016/j.ecolind.2011.07.027
Laffoley, 2008), applied examples do exist (Ball et al., 2009; Halpernet al., 2009; Stelzenmuller et al., 2010b). These examples used map-ping of potential pressures and assessment of the potential riskof impact by eliciting experts to quantify the vulnerability of dif-
ARTICLE IN PRESSG ModelECOIND-948; No. of Pages 11
8 V. Parravicini et al. / Ecological Indicators xxx (2011) xxx–xxx
urba
nizati
oncommercial harbor
marine
territoryscore
a b
beac
h re-n
ouris
hmen
t
marine
territoryscore
commercial harbor
F weene icative
fpaihHn(tetoEfs
uarsapMpifit(eccanctcdE
rd
ig. 7. Examples of bivariate partial dependence plots showing the interaction betffect), and (b) commercial harbor and beach re-nourishment (i.e. synergic multipl
erent habitats to specific pressures. Such an approach has a highotential since it can be applied over large scales and is, therefore,bsolutely necessary for the planning of marine territory uses. Mov-ng from planning to decision, however, requires information onow multiple human pressures interact (Lenz and Peters, 2006).uman pressures can interact additively, synergistically, antago-istically and these behaviors are extremely context dependentCrain et al., 2008). The only way to detect such interactions inhe real world is to model pressures/effects relationships (Thrusht al., 2008). With expert- or literature-based approaches, the wayhrough which multiple human pressures interact is chosen a pri-ri. This is why we introduced modeling in our geospatial approach.xpert knowledge was in fact used to quantify the intensity of dif-erent pressures, process in which the knowledge by environmentalcientists resulted important.
When modeling relationships, RF technique resulted partic-larly efficient. RF is based on multiple individual classificationnd regression trees (CART), already successfully used for envi-onmental mapping and management (Pesch et al., 2011). CARTtems from techniques called automatic interaction detectors (AID)nd are particularly appropriate in identifying and modeling com-lex interactions among multiple human pressures (Loh, 2008).oreover, RF handles the common problem of collinearity among
redictor variables through their random selection when buildingndividual trees and are not challenged by response variables notlling the assumption of normality (Siroky, 2009). Another advan-age is that RF can be applied using categorical response variablesCutler et al., 2007). This is an important aspect because mostcosystem-status indicators are categorized into classes (e.g. indi-ators used by the WFD). Our approach allows status or qualitylasses to be modeled and predicted according to different man-gement alternatives without the need of recovering the originalumerical information or when using indicators that are a prioriategorical (e.g. Orfanidis et al., 2003). In addition, RF can be appliedo multivariate datasets and may be thus particular useful in thease that different indicators are utilized to assess the status ofifferent components of coastal ecosystem as in the case of the
Please cite this article in press as: Parravicini, V., et al., Understandecosystems status: A geospatial modeling approach. Ecol. Indicat. (20
uropean WFD (Borja et al., 2009).While the knowledge of the status/pressures relationships may
educe the uncertainty that managers have to face when takingecision (Polasky et al., 2011), the accuracy through which such
pressure intensities: (a) commercial harbor and coastal urbanization (i.e. additive effect).
relationships are assessed strongly depends on the amount of avail-able information. In this regard, a strong effort is being spent bynational and international monitoring programs aimed at evaluat-ing coastal ecosystems status (Douvere et al., 2007; Olsson et al.,2008; Hering et al., 2010). These data can be rationally organizedwithin the framework of our geospatial modeling approach in orderto extract the maximum amount of information for conservationmanagers.
The availability of field data to implement our approach, how-ever, remains a necessity. While our tool demonstrated to beeffective in predicting scenarios of marine territory status result-ing from variations in the intensities of existing pressures, suchan approach cannot predict the expected effects of “new” andunknown pressures. Large scales assessments may partially over-come such limitation by reducing the number of the unknownpressure/status relationships. However, a major future need willbe that of integrating geospatial approach based on field dataand modeling with systems based on expert judgment. Whilemodels can inform on the way through which multiple pres-sures interact, expert elicitation may reduce uncertainty whenthe effects of new pressures are to be taken into account. In thisregard, the integration of the information made available by ourgeospatial modeling approach and experts may be possible withinnetworks that are capable to probabilistically represent correla-tive and causal relationships among variables (Stelzenmuller et al.,2010a).
Despite efforts made by ecologists to develop techniques andapproaches to provide tools to assist conservation managers’ deci-sions, some degrees of uncertainty remain (Thrush and Dayton,2010). For instance, all existing approaches will tend to predict anamelioration of ecosystems status when management plans imply areduction of human pressures. Ecological theory and field evidence,however, suggest that coastal ecosystems may profoundly pay thelegacy of past impacts, and show hysteresis (Parravicini et al., 2010).The predicted trajectories and timing of recovery are then to beconsidered extremely cautionary (Lauck et al., 1998). Long-termmonitoring will remain the best way to obtain good knowledge ofthe system to be managed. These data, if available, can be easilyimplemented within our geospatial modeling tools and will help
ing relationships between conflicting human uses and coastal11), doi:10.1016/j.ecolind.2011.07.027
refine its predictions by incorporating information on ecosystemtrajectories and resilience.
Please cite this article in press as: Parravicini, V., et al., Understanding relationships between conflicting human uses and coastalecosystems status: A geospatial modeling approach. Ecol. Indicat. (2011), doi:10.1016/j.ecolind.2011.07.027
ARTICLE IN PRESSG ModelECOIND-948; No. of Pages 11
V. Parravicini et al. / Ecological Indicators xxx (2011) xxx–xxx 9
Fig. 8. Maps representing the status of the marine territory predicted by the RF model considering the following scenarios: (a) Scenario O-ME, where the influence of theextended harbor will be the minimum expected by the experts, and MPA will do its maximum effort to reduce human pressure in the area; (b) Scenario O-DN, where theinfluence of the extended harbor will be the minimum expected by the experts, and MPA will maintain the present management plan; (c) Scenario P-ME, where the influenceof the extended harbor will be the maximum expected by the experts, and MPA will do its maximum effort to reduce human pressure in the area; (d) Scenario P-DN, wherethe influence of the extended harbor will be the maximum expected by the experts, and MPA will maintain the present management plan. Maximum effort by MPA willimply the prohibition of fishery in both the no-take zone (A zone) and the partial reserve zone (B zone). Fishery will be allowed only to residents in the buffer zone (C zone).In addition, beach re-nourishment will be avoided and the boundaries of SCI will be extended to the whole area thus implying the prohibition of anchoring.
ARTICLE ING ModelECOIND-948; No. of Pages 11
10 V. Parravicini et al. / Ecological Ind
0.3 0.4 0. 5 0.6 0. 7 0.8 0.9
0.3
0.5
0.7
0.9
0.3
0.5
0.7
0.9
P-DN
P-ME
O-DN
O-ME
0.3 0.4 0. 5 0.6 0. 7 0.8 0.90.3 0.4 0. 5 0.6 0. 7 0.8 0.9
0.3
0.5
0.7
0.9
=0.41r
=0.86r =0.53r
r =0.94 =0.51r=0.55r
marine territory scores
mar
ine
terr
itory
sco
res
Fig. 9. Pair-wise correlations between the marine territory status predicted accord-ing to the considered scenarios (numbers in italic indicates the Pearson correlationcoefficient). O-ME: the influence of the extended harbor will be the minimumexpected by the experts, and MPA will do its maximum effort to reduce human pres-sures; O-DN: the influence of the extended harbor will be the minimum expected bythe experts, and MPA will maintain the present management plan; P-ME: the influ-ence of the extended harbor will be the maximum expected by the experts, andMPA will do its maximum effort to reduce human pressures; P-DN: the influence oftm
A
CwB(emv
R
A
A
A
B
B
B
B
B
B
B
B
Bianchi, C.N., 2010. Human influence on seagrass habitat fragmentation in NW
he extended harbor will be the maximum expected by the experts, and MPA willaintain the present management plan.
cknowledgements
FM was partly supported through a Pew Fellowship in Marineonservation. Field activities were done thanks to a collaborationith the “Isola di Bergeggi” MPA. Thanks are due to S. Baiardo, D.evacqua, I. Caballero and H. Fatmi for advice and to the expertswith the willingness of remaining anonymous) who helped in thevaluation of pressure intensities. We are thankful to two anony-ous reviewers whose valuable comments improved an early
ersion of the manuscript.
eferences
gardy, M.T., 1994. Advances in marine conservation –the role of protected areas.Trends in Ecology and Evolution 9, 267–270.
snaghi, V., Chiantore, M., Bertolotto, R.M., Parravicini, V., Cattaneo-Vietti, R., Gaino,F., Moretto, P., Privitera, D., Mangialajo, L., 2009. Implementation of the Euro-pean Water Framework Directive: natural variability associated with the CARLITmethod on the rocky shores of the Ligurian Sea (Italy). Marine Ecology-an Evo-lutionary Perspective 30, 505–513.
ugier, H., 1982. Inventory and classification of marine benthic biocenoses of theMediterranean. Council of Europe, Nature and Environmental Series 25, 1–57.
all, I.R., Possingham, H.P., Watts, M., 2009. Marxan and relatives: Software for spa-tial conservation prioritization. In: Moilanen, A., Wilson, K.A., Possingham, H.P.(Eds.), Spatial Conservation Prioritisation: Quantitative Methods and Computa-tional Tools. Oxford University Press, Oxford, pp. 185–195.
el, L., Allard, D., Laurent, J.M., Cheddadi, R., Bar-Hen, A., 2009. CART algorithm forspatial data: application to environmental and ecological data. ComputationalStatistics and Data Analysis 53, 3082–3093.
ellan, G., Bourcier, M., Picard, J., Salen-Picard, C., Stora, G., 1985. Conséquencesstructurelles dues aux perturbations affectant les biocénoses benthiquesméditerranéennes de substrat meuble. Rapports de la Commission interna-tionale pour l’Exploration scientifique de la Mer Méditerranée 29 (5), 215–221.
ianchi, C.N., 2008. From bionomic mapping to territorial cartography, or fromknowledge to management of marine protected areas. Biologia Marina Mediter-ranea 14, 22–51.
ianchi, C.N., Peirano, A., 1995. Atlante delle Fanerogame Marine della Liguria: Posi-donia oceanica e Cymodocea nodosa. ENEA, Centro Ricerche Ambiente Marino, LaSpezia.
ianchi, C.N., Zattera, A., 1986. Alcune considerazioni sulla gestione della fasciacostiera. Notiziario della Società Italiana di Biologia Marina 10, 25–28.
ianchi, C.N., Ardizzone, G.D., Belluscio, A., Colantoni, P., Diviacco, G., Morri,C., Tunesi, L., 2004. Benthic cartography. Biologia Marina Mediterranea 11,
Please cite this article in press as: Parravicini, V., et al., Understandecosystems status: A geospatial modeling approach. Ecol. Indicat. (20
170–347.ianchi, C.N., Morri, C., Parravicini, V., Rovere, A., 2007. Realizzazione di cartografia
tematica sull’ambiente marino costiero di Bergeggi ed elaborazione di un pianodi monitoraggio – Relazione finale. Comune di Bergeggi, Savona.
PRESSicators xxx (2011) xxx–xxx
Bock, M., Rossner, G., Wissen, M., Remm, K., Langanke, T., Lang, S., Klug, H., Blaschke,T., Vrscaj, B., 2005. Spatial indicators for nature conservation from European tolocal scale. Ecological Indicators 5, 322–338.
Borja, A., Ranasinghe, A., Weisberg, S.B., 2009. Assessing ecological integrity inmarine waters, using multiple indices and ecosystem components: challengesfor the future. Marine Pollution Bulletin 59, 1–4.
Breiman, L., 2001. Random forests. Machine Learning 45, 5–32.Chen, C.-T., 2000. Extensions of the TOPSIS for group decision-making under fuzzy
environment. Fuzzy Sets and Systems 114, 1–9.Crain, C.M., Kroeker, K., Halpern, B.S., 2008. Interactive and cumulative effects of
multiple human stressors in marine systems. Ecology Letters 11, 1304–1315.Cutler, D.R., Edwards, T.C., Beard, K.H., Cutler, A., Hess, K.T., 2007. Random forests
for classification in ecology. Ecology 88, 2783–2792.Darling, E.S., Côté, I.M., 2008. Quantifying the evidence for ecological synergism.
Ecology Letters 11, 1278–1286.De Lange, H.J., Sala, S., Vighi, M., Faber, J.H., 2010. Ecological vulnerability in risk
assessment – A review and perspectives. Science of the Total Environment 408,3871–3879.
De’ath, G., Fabricius, K.E., 2000. Classification and regression trees: a pow-erful yet simple technique for ecological data analysis. Ecology 81,3178–3192.
Doak, D.F., Estes, J.A., Halpern, B.S., Jacob, U., Lindberg, D.R., Lovvorn, J., Monson, D.H.,Tinker, M.T., Williams, T.M., Wootton, J.T., Carroll, I., Emmerson, M., Micheli, F.,Novak, M., 2008. Understanding and predicting ecological dynamics: are majorsurprises inevitable? Ecology 89, 952–961.
Douvere, F., 2008. The importance of marine spatial planning in advancingecosystem-based sea use management. Marine Policy 32, 762–771.
Douvere, F., Maes, F., Vanhulle, A., Schrijvers, J., 2007. The role of marine spatialplanning in sea use management: the Belgian case. Marine Policy 31, 182–191.
Eastwood, P.D., Mills, C.M., Aldridge, J.N., Houghton, C.A., Rogers, S.I., 2007. Humanactivities in UK offshore waters: an assessment of direct, physical pressure onthe seabed. ICES Journal of Marine Science 64, 453–463.
Fierro, G., Imperiale, G., Montano, F., Piacentino, G., 1975. Caratteristiche sedimen-tologiche delle spiagge del finalese e loro evoluzione. Atti della Società Italianadi Scienze Naturali e del Museo Civico Storia Naturale di Milano 15, 118–156.
Fraschetti, S., D’Ambrosio, P., Micheli, F., Pizzolante, F., Bussotti, S., Terlizzi, A.,2009. Design of marine protected areas in a human-dominated seascape. MarineEcology-Progress Series 375, 13–24.
Gilliland, P.M., Laffoley, D., 2008. Key elements and steps in the process of developingecosystem-based marine spatial planning. Marine Policy 32, 787–796.
Grenier, M., Lavoie, I., Rousseau, A.N., Campeau, S., 2010. Defining ecological thresh-olds to determine class boundaries in a bioassessment tool: the case of theEastern Canadian Diatom Index (IDEC). Ecological Indicators 10, 980–989.
Halpern, B.S., 2003. The impact of marine reserves: do reserves work and doesreserve size matter? Ecological Applications 13, S117–S137.
Halpern, B.S., McLeod, K.L., Rosenberg, A.A., Crowder, L.B., 2008a. Managing forcumulative impacts in ecosystem-based management through ocean zoning.Ocean and Coastal Management 51, 203–211.
Halpern, B.S., Walbridge, S., Selkoe, K.A., Kappel, C.V., Micheli, F., D’Agrosa, C., Bruno,J.F., Casey, K.S., Ebert, C., Fox, H.E., Fujita, R., Heinemann, D., Lenihan, H.S., Madin,E.M.P., Perry, M.T., Selig, E.R., Spalding, M., Steneck, R., Watson, R., 2008b. A globalmap of human impact on marine ecosystems. Science 319, 948–952.
Halpern, B.S., Kappel, C.V., Selkoe, K.A., Micheli, F., Ebert, C.M., Kontgis, C., Crain, C.M.,Martone, R.G., Shearer, C., Teck, S.J., 2009. Mapping cumulative human impactsto California current marine ecosystems. Conservation Letters 2, 138–148.
Hering, D., Borja, A., Carstensen, J., Carvalho, L., Elliott, M., Feld, C.K., Heiskanen,A.S., Johnson, R.K., Moe, J., Pont, D., Solheim, A.L., Van De Bund, W., 2010. TheEuropean Water Framework Directive at the age of 10: a critical review of theachievements with recommendations for the future. Science of the Total Envi-ronment 408, 4007–4019.
Jackson, J.B.C., Sala, E., 2001. Unnatural oceans. Scientia Marina 65, 273–281.Lau, M., 2005. Integrated coastal zone management in the People’s Republic of China:
an assessment of structural impacts on decision-making processes. Ocean andCoastal Management 48, 115–159.
Lauck, T., Clark, C.W., Mangel, M., Munro, G.R., 1998. Implementing the precau-tionary principle in fisheries management through marine reserves. EcologicalApplications 8, S72–S78.
Lenz, R., Peters, D., 2006. From data to decisions: steps to an application-orientedlandscape research. Ecological Indicators 6, 250–263.
Liaw, A., Wiener, M., 2002. Classification and Regression by random forest. R News:The Newsletter of the R Project 2, 18–22.
Loh, W.Y., 2008. Classification and Regression Tree Methods. John Wiley and SonsLtd.
Mensa, J.A., Vassallo, P., Fabiano, M., 2011. JMarinas: a simple tool for the envi-ronmentally sound management of small marinas. Journal of EnvironmentalManagement 92, 67–77.
Montefalcone, M., Albertelli, G., Morri, C., Parravicini, V., Bianchi, C.N., 2009. Legalprotection is not enough: Posidonia oceanica meadows in marine protected areasare not healthier than those in unprotected areas of the northwest Mediter-ranean Sea. Marine Pollution Bulletin 58, 515–519.
Montefalcone, M., Parravicini, V., Vacchi, M., Albertelli, G., Ferrari, M., Morri, C.,
ing relationships between conflicting human uses and coastal11), doi:10.1016/j.ecolind.2011.07.027
Mediterranean sea. Estuarine Coastal and Shelf Science 86, 292–298.Mora, C., Andrefouet, S., Costello, M.J., Kranenburg, C., Rollo, A., Veron, J., Gaston, K.J.,
Myers, R.A., 2006. Coral reefs and the global network of marine protected areas.Science 312, 1750–1751.
ING ModelE
cal Ind
O
O
P
P
P
P
P
P
P
P
R
R
Vitousek, P.M., Mooney, H.A., Lubchenco, J., Melillo, J.M., 1997. Human dominationof Earth’s ecosystems. Science 277, 494–499.
ARTICLECOIND-948; No. of Pages 11
V. Parravicini et al. / Ecologi
lsson, P., Folke, C., Hughes, T.P., 2008. Navigating the transition to ecosystem-basedmanagement of the Great Barrier Reef, Australia. Proceedings of the NationalAcademy of Sciences of the United States of America 105, 9489–9494.
rfanidis, S., Panayotidis, P., Stamatis, N., 2003. An insight to the ecological evalua-tion index (EEI). Ecological Indicators 3, 27–33.
arravicini, V., Rovere, A., Donato, M., Morri, C., Bianchi, C.N., 2006. A method to mea-sure three-dimensional substratum rugosity for ecological studies: an examplefrom the date-mussel fishery desertification in the north-western Mediter-ranean. Journal of the Marine Biological Association of the United Kingdom 86,689–690.
arravicini, V., Donato, M., Morri, C., Villa, E., Bianchi, C.N., 2008. Date mussel har-vesting favours some blennioids. Journal of Fish Biology 73, 2371–2379.
arravicini, V., Morri, C., Ciribilli, G., Montefalcone, M., Albertelli, G., Bianchi, C.N.,2009. Size matters more than method: visual quadrats vs photography in mea-suring human impact on Mediterranean rocky reef communities. EstuarineCoastal and Shelf Science 81, 359–367.
arravicini, V., Thrush, S.F., Chiantore, M., Morri, C., Croci, C., Bianchi, C.N., 2010.The legacy of past disturbance: chronic angling impairs long-term recovery ofmarine epibenthic communities from acute date-mussel harvesting. BiologicalConservation 143, 2435–2440.
érès, J.M., Picard, J., 1964. Nouveau manuel de bionomie benthique de la MerMéditerranée. Recueil des Travaux de la Station Marine d’Endoume 32, 1–247.
esch, R., Schmidt, G., Schroeder, W., Weustermann, I., 2011. Application of CARTin ecological landscape mapping: two case studies. Ecological Indicators 11,115–122.
etrosillo, I., Vassallo, P., Valente, D., Mensa, J.A., Fabiano, M., Zurlini, G., 2010.Mapping the environmental risk of a tourist harbor in order to foster environ-mental security: objective vs subjective assessments. Marine Pollution Bulletin60, 1051–1058.
olasky, S., Carpenter, S.R., Folke, C., Keeler, B., 2011. Decision-making under greatuncertainty: environmental management in an era of global change. Trends inEcology and Evolution 26, 398–404.
osenberg, R., Blomqvist, M., Nilsson, H.C., Cederwall, H., Dimming, A., 2004. Marine
Please cite this article in press as: Parravicini, V., et al., Understandecosystems status: A geospatial modeling approach. Ecol. Indicat. (20
quality assessment by use of benthic species-abundance distributions: a pro-posed new protocol within the European Union Water Framework Directive.Marine Pollution Bulletin 49, 728–739.
overe, A., Parravicini, V., Vacchi, M., Montefalcone, M., Morri, C., Bianchi, C.N.,Firpo, M., 2010. Geo-environmental cartography of the Marine Protected
PRESSicators xxx (2011) xxx–xxx 11
Area Isola di Bergeggi (Liguria, NW Mediterranean Sea). Journal of Maps,505–519.
Ruckelshaus, M., Klinger, T., Knowlton, N., Demaster, D.R., 2008. Marineecosystem-based management in practice: scientific, and governance chal-lenges. Bioscience 58, 53–63.
Selkoe, K.A., Halpern, B.S., Ebert, C.M., Franklin, E.C., Selig, E.R., Casey, K.S., Bruno,J., Toonen, R.J., 2009. A map of human impacts to a pristine coral reef ecosys-tem, the PapahAnaumokuAkea Marine National Monument. Coral Reefs 28,635–650.
Shears, N.T., Ross, P.M., 2010. Toxic cascades: multiple anthropogenic stressors havecomplex and unanticipated interactive effects on temperate reefs. Ecology Let-ters 13, 1149–1159.
Siroky, D.S., 2009. Navigating random forests and related advances in algorithmicmodeling. Statistics Surveys 3, 147–163.
Somaschini, A., Martini, N., Gravina, M.F., Belluscio, A., Corsi, F., Ardizzone, G.D., 1998.Characterization and cartography of some Mediterranean soft-bottom benthiccommunities (Ligurian Sea, Italy). Scientia Marina 62, 27–36.
Stachowitsch, M., 2003. Research on intact marine ecosystems: a lost era. MarinePollution Bulletin 46, 801–805.
Stelzenmuller, V., Lee, J., Garnacho, E., Rogers, S.I., 2010a. Assessment of a BayesianBelief Network-GIS framework as a practical tool to support marine planning.Marine Pollution Bulletin 60, 1743–1754.
Stelzenmuller, V., Lee, J., South, A., Rogers, S.I., 2010b. Quantifying cumulativeimpacts of human pressures on the marine environment: a geospatial modellingframework. Marine Ecology-Progress Series 398, 19–32.
Thrush, S.F., Dayton, P.K., 2010. What can ecology contribute to ecosystem-basedmanagement? Annual Review of Marine Science 2, 419–441.
Thrush, S.F., Hewitt, J.E., Hickey, C.W., Kelly, S., 2008. Multiple stressor effectsidentified from species abundance distributions: Interactions between urbancontaminants and species habitat relationships. Journal of Experimental MarineBiology and Ecology 366, 160–168.
ing relationships between conflicting human uses and coastal11), doi:10.1016/j.ecolind.2011.07.027
White, D., Kimerling, A.J., Overton, W.S., 1992. Cartographic and geometric compo-nents of a global sampling design for environmental monitoring. Cartographyand Geographic Information Systems 19, 5–22.