Understanding Syntax Understanding Language 3rd Edition 1444112058
Upload
khangminh22Category
view
1download
0
Understanding drivers behind the implementation and
adaptation of improved climbing bean (Phaseolus Vulgaris L.)
technologies by smallholder farmers in Kapchorwa district,
Eastern Uganda
Laurie van Reemst
MSc Thesis
Plant Production Systems – N2Africa
January 2016

ii
iii
Understanding drivers behind the implementation and adaptation of improved climbing
bean (Phaseolus Vulgaris L.) technologies by smallholder farmers in Kapchorwa district,
Eastern Uganda
Laurie van Reemst
MSc thesis, PPS 80436
Plant Production Systems – N2Africa
January 2016
Supervisors:
ir. E. Ronner
dr.ir. J. van Heerwaarden
Examiners:
prof. dr. K.E. Giller
ir. E. Ronner

iv

v
Table of contents
Summary ................................................................................................................................................................ vii
Acknowledgements ............................................................................................................................................... viii
1 Introduction .................................................................................................................................................... 1
2 Methodology .................................................................................................................................................. 5
2.1 General characteristics of the research area ......................................................................................... 5
2.2 The N2Africa project in Kapchorwa district ........................................................................................... 7
2.3 Demonstration trials .............................................................................................................................. 8
2.4 Best management practices for climbing bean cultivation ................................................................... 9
2.5 Adaptation trials .................................................................................................................................... 9
2.6 Sampling of farmers............................................................................................................................... 9
2.7 Participation in demonstration trials in previous seasons .................................................................. 10
2.8 Data collection ..................................................................................................................................... 11
2.9 Data analysis ........................................................................................................................................ 11
2.9.1 Analysis of quantitative data ...................................................................................................... 11
2.9.2 Analysis of qualitative data ......................................................................................................... 11
2.10 Construction of Farm types ................................................................................................................. 12
3 Results .......................................................................................................................................................... 13
3.1 Implementation and adaptation of the N2Africa technology packages .............................................. 13
3.2 Implementation and adaptation of the demonstrated practices ........................................................ 14
3.3 Implementation of pest control .......................................................................................................... 18
3.4 Determinants of implementation and adaptation .............................................................................. 18
3.4.1 Farm types .................................................................................................................................. 19
3.4.2 Geographical location ................................................................................................................. 21
3.4.3 Distribution of farm types over sub-counties ............................................................................. 23
3.4.4 Determinants for implementation or adaptation of best management practices ..................... 23
3.5 Yield of adaptation trials...................................................................................................................... 28
4 Discussion ..................................................................................................................................................... 31
4.1 Implementation, adaptation and their determinants ......................................................................... 31
4.1.1 The technology package ............................................................................................................. 31
4.1.2 Intercropping and row planting .................................................................................................. 32
4.1.3 Mineral and organic fertilizer ..................................................................................................... 32
4.1.4 Staking......................................................................................................................................... 33
4.1.5 Project practicalities ................................................................................................................... 34
4.2 Lessons learned and future research................................................................................................... 35
5 Conclusions ................................................................................................................................................... 37
5.1 Project set-up ...................................................................................................................................... 37
5.2 Possible research and advice on best management practices ............................................................ 37
5.3 Research set-up ................................................................................................................................... 37
References ............................................................................................................................................................ 39
Appendix I Demonstration of climbing bean technology options in Kapchora ..................................................... 43
Appendix II Instructions for planting and harvesting ............................................................................................ 49
Appendix III Fieldbook for focal adaptation trails ................................................................................................. 51

vi

vii
Summary In Uganda, increasing pressure on arable soils demands for options that improve food security and enhance its
fertility. One way to achieve this is by exploiting legume technologies. In this study we look at improved
climbing bean technologies like the application of phosphorus fertilizers or the use of improved climbing bean
varieties to enhance soil fertility and increase food security. Getting farmers to make more use of these
technologies is however not an easy task. Within the evolution of a technology, making sense of the evaluation
of the technology is an important part of the evolution but has thus far been relatively poorly described. To
achieve adoption of a technology it is important to understand what farmers drives in adopting new
technologies, and also what caused the farmers to adapt the technology to finally lead to an adoption most fit
for local conditions. A project that aims to bring this iterative process into practice is the N2Africa project. The
project monitors if and how farmers implement demonstrated practices and if they make any adaptations to
them. The project therefore provided smallholder farmers with a package consisting of improved climbing bean
seeds, phosphate-fertiliser, and planting guidelines, which they could implement and adapt to their own needs.
This gave the farmers the opportunity to use and manage the improved varieties in the way best suitable for
their household conditions, resource endowments and production orientation.
In this study, we focused on implementation and adaptation of improved climbing bean-technologies by
farmers who received a package. Therefore 88 smallholder farmers were interviewed, who were situated in
four different sub-counties in Kapchorwa district, Uganda. Firstly, we found that seeds should be disseminated
in time for the project for the farmers to be able to plant them, and farmers should not be restricted in the way
they are to plant the beans. Secondly, most farmers planted the climbing beans in intercropping with mostly
banana and coffee instead of in sole cropping and poorer farmers planted more in random planting, which
saves labour during planting compared to row planting. Thirdly, a trend is found that farmers with small farm
sizes apply more often manure than farmers with larger farm sizes, and additionally, staking availability is still
poor in the area. To optimize (the use of) climbing bean technologies in this area, more research could be done
on the intercropping of banana and coffee with climbing beans. Furthermore, low-cost alternatives for manure
or mineral fertilizer could be promoted, like compost or crop residues. Furthermore, extension officers could
be better monitored in order to give farmers in different locations demonstrations as similar as possible and to
make sure the demonstration plots are managed and treated similarly.

viii
Acknowledgements First of all, I would like to thank all the farmers from the Kapchorwa district (truly a place of ‘the friendly
people’) who offered me their time, tea and thoughts on their households and climbing bean cultivation. I will
never forget their generosity, with only so little to share.
Communication with the farmers would have been almost impossible without the efforts and assistance of
both my translators Musau Mumin and Gertrude Cherop K, who stood by me in dry and in wet times. I am also
very grateful to the local extension officers, who showed me around in the research area, connected me to
adaptation farmers and taught me a lot more about growing climbing beans: Patrick (Kaptanya), Francis
(Kapchesombe), Patrick (Tegeres Lower), Joseph (Tegeres Upper), Mozes (Chema Lower) Steven (Chema Upper)
and Fred (Chema and Tegeres). Special thanks to John Ssekamwa, the projects local field liaison; he managed
the demonstration trials and was responsible for the rainfall data and some good rides on a dirt bike!
In Kampala, Peter Ebanyat (N2Africa country coordinator) and Piet van Asten (Uganda’s IITA representative)
helped me a lot by making me feel welcome in Kampala and by having stimulating discussions with me on the
content of my fieldwork.
More than many thanks go to my supervisors Esther Ronner and Joost van Heerwaarden. I would like to
express my gratitude for the scientific support and guidance they offered me and for all their devoted time and
effort.
I am very grateful for the financial support I received from the N2Africa project, a project I am very proud to
have been part of, because of their very scientific approach and their focus on a best-fit impact. I believe all
people engaged within this project are very devoted to it, which is encouraging and inspiring!
Finally, I would like to thank all the people who supported me throughout the past year and especially Lotte
Woittiez, for being so generous and letting me stay in her cottage in the forest.

1
1 Introduction In Uganda, 72.4% of the labour force works in the agricultural sector, of which the largest share is subsistence
farming (FAOSTAT, 2014). The population has been growing exponentially since 1961 (Expansión, 2014) and
prevalence of malnutrition has increased from 27% in 2000 to 35% in 2012 (FAO, 2014). Although Uganda has
long been regarded as a country which has fertile soils, land degradation is now a serious problem, mostly
resulting in loss of productivity (Andersson, 2014). This productivity loss increases the chances of food
insecurity, especially when facing an annual population growth of 3.24% in 2015 (CIA, 2014).
The increasing pressure on arable soils demands options that improve food security and do not further deplete
the soil, but enhance its fertility. One way to achieve this is by exploiting legume technologies. Legumes are
able to fix atmospheric nitrogen in a symbiotic relationship with rhizobia (soil bacteria). Rhizobia can infect the
root of a legume, where after the legume forms nodules around the bacteria. Within these nodules, rhizobia fix
N2 from the atmosphere to form ammonium (NH4+), which the plant uses for growth. In return, the plant feeds
the rhizobia with assimilates.
For legumes, the genotype of the legume and the rhizobia nodulating the legume are of importance. The grain
and biomass production of a certain legume therefore depends on the formula:
(GL x GR) x E x M
where GL is the genotype of the legume, GR the genotype(s) of the rhizobia nodulating the legume, E the
environment and M the management (Giller et al., 2014). Therefore, environmental constraints (like nutrient
deficiencies in soils, drought or waterlogging) and also management practices (like use of mineral fertilizer,
sowing dates, plant density and weeding) influence the total grain yield of the legume. The only treatment that
shows consistent responses in N-fixation and grain yield is the application of P (Giller, 2001). Therefore, adding
extra P to the system is necessary to increase legume productivity.
An important staple crop in Uganda is the common bean (Phaseolus vulgaris L.). Common beans can be either
bush beans or climbing beans. The yield potential of climbing beans is higher than that of bush beans: 3.5 to 5
ton/ha, which is threefold the yield of bush beans (Musoni et al., 2014; Ramaekers et al., 2013). Although
farmers in Uganda cultivate common bean, most of them plant bush beans, or local varieties of climbing beans,
which do not have the yield potential and nutrient benefits that improved climbing bean varieties have
(Sperling & Muyaneza, 1995). Improved climbing bean technologies like the application of phosphorus
fertilizers or the use of improved climbing bean varieties are therefore an option available to farmers to
increase their productivity and at the same time enhance their soil fertility. However, getting farmers to make
more use of these technologies is not an easy task.
In the past, improved agricultural technologies were often offered as ‘top-down’ blanket recommendations.
The adoption of these recommendations was generally poor (Kiptot et al., 2007), mainly because such
recommendations do not take into account the large heterogeneity of farming systems and farm types. This
heterogeneity can be related to soil fertility (Tittonell et al., 2005) but also to resource endowments (Amrouk
et al., 2013), household characteristics (Vanlauwe et al., 2014) and production orientation of farmers (Tittonell
et al., 2005).
The need to develop technologies that reflect the realities of farmers’ fields is therefore generally accepted
(Ojiem et al., 2006). However, the fact that still many technologies have not been adopted despite attempt to
respect farmers’ preferences shows that this endeavor is faced with difficulties (Aker, 2011). For example,
participatory experiments can capture farmers’ preferences, but do not directly reflect if, why and especially

2
how farmers actually implement or adapt the technology that will eventually lead to adoption (Pircher et al.,
2013).
Therefore, technological development should go through an iterative process to eventually develop
technologies that best fit the local resources and preferences of farmers (Giller et al, 2008; Giller, 2013; Jakku &
Thorburn, 2010). This iterative process is described by Douthwaite et al., (2002) who provide a framework that
is used to explain farmers’ adoption and rejection of agricultural technologies. Evolution of technologies has to
go through repetitive phases of participatory evaluation of technologies, to create options that fit best in the
local environment. These phases are 1) experience, 2) making sense, 3) drawing conclusions, 4) actions, and
then again 1) experience. Within this evolution of a technology, the evaluation of the implementation and
adaptation of the technology, the ‘making sense’, plays an important role. However, this evaluation has thus
far been relatively poorly described (Douthwaite et al., 2002). To achieve adoption of a technology it is
therefore important to understand what farmers drives in adopting new technologies, and also what caused
the farmers to adapt the technology to finally lead to an adoption most fit for local conditions.
A project that aims to bring this iterative process into practice is the N2Africa project. N2Africa is a
development-to-research project that is focused on enhancing the use of nitrogen fixing grain legumes by
smallholder farmers in SSA. Beginning with the right legume crop for a specific region, determined by using the
socio-ecological nice concept developed by Ojiem et al., (2006), a ‘basket of options’ of improved legume
technologies is introduced in the target area. This ‘basket of options’ is introduced through a demonstration
trial in which different treatments are shown, originally based on existing best management practices. Best
practices that are adapted to take local resources into account are offered in the demonstration trial as well. In
so-called ‘adaptation trials’, farmers can test these best management practices on their own field. The project
monitors if and how farmers implement these practices and if they make any adaptations to them. For the
adaptation trials in the Eastern highlands of Uganda, farmers receive a package consisting of improved climbing
bean seeds, phosphate-fertiliser, and planting guidelines, which they could implement and adapt to their own
needs. This gives the farmers the opportunity to use and manage the improved varieties in the way best
suitable for their household conditions, resource endowments and production orientation.
In this study, we focus on implementation and adaptation of the improved climbing bean-technologies. We
avoid using the term adoption, as this is often defined as the use of a certain technology for several seasons
(Kamanga et al., 2014; Kiptot et al., 2007). In this research we only monitored the implementation of
technologies during one season. Moreover, farmers were given the package, so we cannot speak of
independent adoption. Adaptation, in this context, is defined as ‘the modification of a climbing bean-
technology that makes it more suitable for application under local conditions’. This adaptation is a continuous
process, and can occur in many phases in the progress towards adoption. Because the environment is expected
to change over time and farmers are seen as ‘moving targets’ (Giller et al., 2011), the introduced technologies
are constantly adapted to these new environments. This happens in both the process of implementation, as
well as during the more ‘final’ stage of adoption of the technology.
Adaptations that farmers make in the adaptation trials can be taken into account when re-designing
demonstration trials for new seasons. Farmers have reasons to use or not to use new technologies, and
researchers can work together with farmers to create practices that are tailored to specific regions and farm
types, creating options that best fit their local context. Therefore, it is necessary to monitor and evaluate these
adaptation trials by first looking at the degree of implementation and adaptation of demonstrated
technologies, and secondly at the determinants for this implementation or adaptation to be able to target the
right groups with the right adjustments to improved technologies. Finally, to see if phosphate-fertilizer
application, biophysical factors or farmers from different wealth groups also translate into differences in
production, yields need to be compared.

3
The first objective of this research is therefore to assess to what extent farmers implement and adapt any of
the demonstrated climbing bean technologies in the Eastern highlands of Uganda. The second objective is to
find determinants for the implementation and adaptation of the demonstrated climbing bean technologies.
The third objective is to find factors that could be related to differences in yield. To answer these objectives,
the following research questions and hypotheses were defined:
1. To what extent did farmers implement or adapt the N2Africa technology package and any of the
practices that were demonstrated in the N2Africa demonstration trial?
2. What determines the implementation or adaptation of the technology package and the demonstrated
practices?
Hypothesis: The degree of implementation of technologies is often positively correlated to
resource endowment (Sietz & Van Dijk, 2015; Tittonell et al., 2010). Therefore farmers with
fewer resources are less likely to have implemented any of the demonstrated practices.
3. What are differences in yield between:
a. Plots with and without phosphate-fertilizer
Hypothesis: Plots where phosphate-fertilizer is applied yield higher, because
phosphate fertilizer increases grain yield of legumes (Giller, 2001).
b. Sub-counties
Hypothesis: Biophysical factors like temperature and rainfall influence yield
performances. Therefore farmers in higher altitude sub-counties have higher yields
than farmers from sub-counties in lower altitudes.
c. Farm types
Hypothesis: Differences in production orientation and resource endowment
influence soil fertility. Therefore yields are different between different farm types
(Tittonell et al., 2005).
The results of these research questions will be used to reflect on which practices are (not) implemented, and
how they are adapted, to formulate what researchers can learn from farmers’ implementation and adaptation
of the demonstrated practices and how this could influence future demonstration trials, and/or research
questions.

4

5
2 Methodology
2.1 General characteristics of the research area This research was conducted in Kapchorwa district in Eastern Uganda, close to the Kenyan border (Figure 1).
Kapchorwa is situated on the slopes of Mount Elgon (Figure 2) at altitude levels between 1500-2200m above
sea level (asl), in one of the main areas in Uganda with good potential for growing climbing beans due to its
favourable biophysical conditions: climbing beans grow well in a long growing season (up to 200 days), a long
seed filling period (nearly 50 days), when there is sufficient rainfall (evaporation losses are compensated) and
when temperatures are moderate (around 17-22°C) (Graham & Ranalli, 1997; Gross & Kigel, 1994).
The research area consists of four sub-counties: Kapchesombe, Kaptanya, Chema and Tegeres. These sub-
counties are further divided into parishes. Next to administrative boundaries, the study area can also be
divided according to altitude in an upper and lower belt, with a tarmac road serving as a rough separation.
Therefore, in each sub-county, we made a distinction between parishes/farmers situated in the lower and
upper belt; the contour line of 1900m asl provides this geographical division (). Kapchesombe and Kaptanya
sub-counties are located on the eastern side of Kapchorwa town. Kapchesombe is situated in the upper belt,
while Kaptanya is situated in the lower belt of the district. The paved road from Mbale to Kapchorwa stops just
beyond this town, which made Kaptanya and Kapchesombe only reachable by dirt roads and more difficult to
reach during rainy days. Chema and Tegeres are oblong sub-counties, which stretch from 1200m up to 3300m
asl while the slopes are gentle, averaging less than 4° (Sassen & Sheil, 2013). At the narrowest points, the
borders of the sub-counties are only 2km apart, as the crow flies. Chema and Tegeres consist of both an upper
and a lower part. The upper parts of these sub-counties were only reachable by very steep dirt roads, which
made them hard to reach during heavy rainfall. Because larger differences were expected between the lower
and upper parts of these sub-counties than between Chema and Tegeres sub-counties itself, the upper and
lower parishes of Chema and Tegeres were grouped together.
Figure 1. Uganda and neighbouring countries. The area marked in red indicates the study area
Figure 2. The area marked in red indicates Kapchorwa district on the slopes of Mount Elgon. The green area is a national park.

6
Figure 3. Map of the sub-counties in Kapchorwa district, where interviews were held in the homestead (orange) and in the field (green). The blue line shows the contour line for 1900meter asl. The green area is part of the national park.
The average altitude of the homesteads of the lower parishes is 1802m asl and for the upper parishes 2020m
asl. Farmers who planted the beans in the lower parishes did this at lower altitudes than their homestead, with
an average of 1783m asl. The farmers in the upper parishes planted their beans at the same average altitude as
their homestead: 2020m asl.
Soils in the research area are of volcanic origin, and are mainly luvisols, but phaeozems and kastanozems are
also found in the lower regions, as well as andosols in the higher altitudes (ISRIC-World Soil Information,
2014).The farming system most present in the research area is a Montane system, which is found at higher
elevations: above 1500m asl. The major staple crop grown throughout the year is plantain (cooking banana,
local Musa varieties), but sweet potatoes (Ipomoea batatas), cassava (Manihot esculenta) and Irish potatoes
(Solanum tuberosum L.) are also cultivated. At higher altitudes, coffee (Coffea arabica) and more temperate
crops like wheat (Triticum spp. L.) and barley (Hordeum vulgare L.) can also be found (FAO/GIEWS, 2014a).
Kapchorwa has a bimodal cropping season. The first season for beans starts halfway March and ends in June,
while the second season starts in September and ends in January. The first season is the main cropping season.
This research was conducted in the second season of 2014 (season 2014B).
Average annual rainfall in Kapchorwa District between 2007 and 2013 was 1078mm (FAO/GIEWS, 2014b). July-
August and December-February are relatively dry, although rain falls in all months (Sassen & Sheil, 2013).
Rainfall data for the four sub-counties was collected during the time of study (2014B) with rainfall gauges,
which were read daily by extension officers (local farmers who work for the project). There was no rainfall data
available for Kapchesombe sub-county. Compared with the 2007-2013 average, rainfall was moderate in

7
Kaptanya with an annual rainfall of 1283mm in 2014, while in Chema upper the rainfall was heavy, with over
1900mm with three months of data missing (January, February and March) (Figure 4).
Temperatures in Kapchorwa district average around 18.5 °C, with minimum temperatures around 12.0 °C and
maximum temperatures around 25.1°C. On average, February is the warmest month, while July is the coldest
(Climate-Data, 2015).
Figure 4. Rainfall in Kaptanya and the upper and lower parishes of Chema and Tegeres in Kapchorwa district (collected rainfall data, 2014) compared with the average monthly rainfall in Kapchorwa between 2007-2013 (FAO/GIEWS, 2014b). Rainfall data for the first three months from Chema and Tegeres are missing.
The population density of Kapchorwa district is around 169 people per km2, which is just below the national
average of 174 people per km2. The population density for Tegeres is slightly lower than the district average
with 123 people per km2, Chema has about 227 people per km
2, and Kaptanya around 203 people per km
2
(which is more than the national average). Kapchesombe is seen as a parish from Kaptanya, so the same
population density holds for Kaptanya and Kapchesombe (UBoS, 2006a, 2006b).
2.2 The N2Africa project in Kapchorwa district Climbing beans have been grown for several decades in Eastern Uganda (Wortmann et al., 1998), but the
number of farmers growing climbing bean on Mt Elgon is still very low (UBoS, 2010). The N2Africa project first
started in Kapchesombe and Kaptanya sub-counties in 2013, the two sub-counties with the smallest percentage
of farmers that cultivated climbing beans in Kapchorwa district at that time. After two seasons the project
expanded to new areas to reach more farmers and the sub-counties Chema and Tegeres were selected. The
first introduction of climbing beans in these sub-counties had happened prior to the project – farmers form
these districts have actually been growing climbing beans for a longer time than those in Kaptanya and
Kapchesombe. But although famers already grow climbing beans, they use local varieties with few inputs
(Wortmann et al., 1998), so there is potential for intensification of climbing bean cultivation by introducing new
varieties, the use of phosphate fertilizer, and use of other improved practices like optimal planting densities or
row planting.
0
5
10
15
20
25
30
0
50
100
150
200
250
300
350
400
450
500
J F M A M J J A S O N D
Tem
per
atu
re (°
C)
Rai
nfa
ll (m
m)
Kaptanya (2014)
Chema/Tegeres Lower (2014)
Chema/Tegeres Upper (2014)
Average rainfall (2007-2013)
Average temperature
Average temperature (min)
Average temperature (max)

8
2.3 Demonstration trials Within the N2Africa project, demonstration trials are used to show farmers a basket of options of improved
climbing bean technologies. Kapchorwa district had 15 demonstration trials in season 2014B. These
demonstration trials were established on-farm and collaboratively managed by researchers and farmers.
Planting was done according to the protocol for climbing bean demonstrations in Kapchorwa district (Appendix
I). The objectives of the demonstration trials were: 1. To demonstrate a range of climbing bean technology
options, focusing on different varieties, inputs and staking methods; 2. To compare the performances of
technology options in terms of biomass and grain yield; 3. To evaluate the impact of biophysical conditions on
the performance of the technology options.
Each demonstration trial contained 11 treatments (Table 1). Treatments consisted of two varieties of climbing
beans, planted with different (combinations of) inputs and best management practices. These best
management practices were mainly based on the leaflet “Growing improved climbing bean varieties for higher
productivity”, developed and distributed by NaCRRI et al. (2013). The treatment combining the improved
variety NABE 12C with cattle manure, Triple Super Phosphate (TSP) and single stakes was considered the ‘
researcher best-bet’. All demonstrations used bamboo as staking material for the single stakes. Next to this
an alternative low cost staking method was provided, because farmers mentioned staking to be the major
constraint in the area. In this treatment the bamboo stakes from the researcher best-bet treatment were
replaced by poles of eucalyptus with half sisal strings and half banana fibre. Furthermore, tripods were another
alternative option, aimed at enhancing yields as stakes would not easily fall over. In Chema and Tegeres, four of
the demonstrations also included maize stalks as staking material. Maize was planted in the first season and
their stalks were used for staking, which is a method that was adapted from local practices found in farmers’
fields. Each treatment was planted with 2 seeds per hole and 4 plants per stake. The leaflet from NaCRRI
prescribes one seed per hole, but as this did not reflect the farmers’ reality in the field, 2 seeds per hole were
advised.
Table 1.Lay-out of treatments found at demonstration sites in Kapchorwa. Dark highlighted cells are recommended best management practices that enhance climbing bean productivity; light highlighted cells are alternative staking methods. The encircled row (Treatment 8) shows the treatment consisting of only best management practices and is seen as the ’researcher best-bet’.
Treatment Variety Cattle manure TSP Staking method
1 Local Kabale - - Single stakes
2 NABE 12C - - Single stakes
3 Local Kabale + - Single stakes
4 NABE 12C + - Single stakes
5 Local Kabale - + Single stakes
6 NABE 12C - + Single stakes
7 Local Kabale + + Single stakes
8 NABE 12C + + Single stakes
9 Local Kabale + + Tripods
10 NABE 12C + + Tripods
11 NABE 12C + + Half sisal/ half banana fibre

9
2.4 Best management practices for climbing bean cultivation For the analyses in this research, nine best management practices were selected that were offered in the
demonstration trials, and which are considered to increase farmers’ production. These best management
practices are mainly based on the leaflet “Growing improved climbing bean varieties for higher productivity”,
developed and distributed by NaCRRI et al. (2013). These practices are:
1. Sole cropping;
2. Row planting (to ease field operations);
3. Phosphate fertilizer (TSP);
4. Manure application;
5. Weeding twice during the season;
6. 2 seeds per hole;
7. Sowing density of 160.000 plants ha-1
(80.000 holes with both 2 seeds);
8. Staking density of 40.000 stakes ha-1
(4 plants per stake);
9. Stakes longer than 1.75m
The degree of implementation and adaptation of these nine best management practices in farmers’
adaptation trials are analysed in this research, together with the implementation of the alternative staking
methods (tripods, sisal strings and banana fibres). Determinants for the implementation or adaptation of these
nine best management practices were also analysed.
2.5 Adaptation trials For the adaptation trials, farmers were provided with a package from N2Africa, including seeds of the improved
climbing bean variety (NABE 12C) and phosphate fertilizer (TSP). Farmers who received such a package are
hereafter referred to as ‘adaptation farmers’. Together with this package, farmers received an instruction
leaflet (Appendix II). They were asked to plant two separate plots of 5X5m: one with the improved variety
without TSP, the other plot with the improved variety with TSP. Farmers themselves could decide to implement
one of the other demonstrated practices: plant density, manure application, staking, weeding and pest and
disease control, which they were informed about during planting of the demonstration trials.
2.6 Sampling of farmers
Of the 271 adaptation farmers who received a technology-package at the start of season 2014B, initially 80
farmers were randomly selected to do surveys with. Farmers who were interviewed are hereafter referred to
as ‘focal farmers’. Because climbing beans were expected to grow better in higher altitudes, the two different
altitude levels were sampled with an equal amount of farmers. Therefore 40 farmers were selected from both
the lower and higher altitudes (Table 2). At least two parishes were selected per sub-county, and at least 5
farmers per parish, to ensure stratified random sampling.

10
Table 2. Initial sampling framework used to select farmers in the different sub-counties.
Number of farmers
Lower Upper Total
Chema 10 10 20
Tegeres 10 10 20
Kaptanya 20 NA 20
Kapchesombe NA 20 20
Total 40 40 80
The selection of farmers was done by randomly selecting farmers from a random selection of parishes within
each sub-county. However, not enough farmers were available to get a total of 20 farmers on the upper part of
Chema and Tegeres together, since there were not more farmers available than the farmers that were already
selected. Therefore in the end, 19 farmers from the upper parishes in Chema (n=7) and Tegeres (n=12) were
selected, alongside 26 from the lower parishes of Chema (n=18) and Tegeres (n=8). From Kapchesombe 21
farmers were selected; from Kaptanya there were 22.
Although farmers were asked to plant two clearly distinguishable plots, one with and one without inputs, only
16 farmers planted in two plots. Originally, 40 farmers who planted two distinguishable plots should have been
selected from the 80 farmers to provide yield data. However, because not enough farmers planted in two
different plots, researchers attempted to find farmers who planted two distinguishable plots among the other
191 farmers who initially received a package. Most farmers did not plant in two plots, so only an additional 8
farmers were found. Out of the total 88 interviewed farmers, 24 farmers planted in two plots.
For harvest measurements, farmers who planted two plots were selected first, so that harvest measurements
between the control plot and the plot with TSP could be compared. Of the 24 farmers who planted in two
plots, 19 were selected for harvest measurements: because only three farmers from Chema/Tegeres Upper
planted two plots, the sample size for this area became too small for meaningful statistical analyses. Therefore
none of the farmers who planted beans in Chema/Tegeres Upper (n=16) were selected for harvest
measurements. Two other farmers with two plots planted different varieties of beans. An additional number of
farmers with only one plot was selected, to collect enough harvest data to be able to do statistical analyses.
From Chema/Tegeres Lower, 7 farmers were selected who planted in two plots and 5 who planted in one plot.
From Kaptanya, too, 7 farmers were selected who planted in two plots and 3 who planted in one plot. From
Kapchesombe, 5 farmers were selected who planted in two plots, and 7 who planted in one plot. A total of 19
farmers with two plots were selected, and 15 with one plot. There were no more farmers available that
matched the requirements for harvest measurements.
2.7 Participation in demonstration trials in previous seasons The degree of participation differs between Chema and Tegeres, and Kapchesombe and Kaptanya: previous
participation in Chema and Tegeres means that farmers visited and evaluated a demonstration trial a couple of
times during the first season of 2014 (2014A). This demonstration had similar treatments as demonstration
trials in 2014B, and farmers could have observed row planting, sole cropping, the use of inputs and alternative
staking methods (sisal string, banana fibre and tripods). Focal farmers who participated in a previous season in
Kapchesombe and Kaptanya may have participated in the same way (visiting and evaluating a demonstration
trial in season 2014A). However, a number of farmers also already participated in season 2013A or 2013B,
when the N2Africa project worked with small demonstrations of four treatments on farmers’ fields. Farmers in

11
Kapchesombe and Kaptanya may therefore have tested some of the technologies on their own field before, in a
more intensive way than a visit to a demonstration trial.
2.8 Data collection For data collection, the N2Africa field book for adaptation trials was used (appendix III). This field book
consisted of two parts: one part describing data collection that could be conducted at the homestead, and
another part that was focused on the field. In both parts, additional questions were added, focused on this
research and climbing beans specifically.
Answers to the questions in the field books were noted down on a tablet. The first part, conducted at the
homestead, had questions focused on farmers’ resource endowment, production orientation and other
household and farm characteristics. The second part was conducted in the field and only with the farmers who
planted the beans. Questions were asked about the practices they had used and their reasoning for applying
these practices. Agronomic measurements were done in the adaptation trial plot and in the control plot, if this
was available. Stake length, stake density, distance between rows and plants and plot size were all measured
with a tape measure of 30m. Soil depth was measured using a soil probe of just over a meter in length, and
depths were measured op to 0.5m. A local interpreter was present at these interviews when necessary.
After harvest, farmers were visited again to measure the yield, where possible of two different plots. Farmers
were asked to keep their harvest separate twice: first when the interview was conducted and once again at a
later stage, when the farmers selected for harvest measurements were called and instructions were repeated.
The harvest was measured using a small kitchen scale.
2.9 Data analysis
2.9.1 Analysis of quantitative data
Quantitative data analysis was done in the (statistical) software package R (3.2.2). Additional packages that
needed to be installed and that were used for this analysis were: the package “xlsx” (Read, write, format Excel
2007 and Excel 97/2000/XP/2003 files), to read data from Excel, the package “agricolae” (Statistical Procedures
for Agricultural Research), to do further analyses on Anova’s, the package “MASS” (Support Functions and
Datasets for Venables and Ripley’s MASS), to be able to do analyses on ordered factors, and the package
“predictmeans” (Calculate Predicted Means for Linear Models), to visualise means for linear models.
Analysis of Variance (ANOVA) was used to detect statistically significant differences between determinants of
(non) implementation or adaptation of demonstrated practices, and between resource endowments,
household characteristics, production orientation or location properties. Ordered factors such as farm types
were taken into account by making use of a generalized linear model (glm) instead of a linear model (lm),
because these groups are based on a range (e.g. form poor to wealthy). When differences between two
ordered factors were to be detected, a proportional odds logistic regression (polr) was used to be able to do
the right analyses. Fischer’s exact test was used to establish the significance of the association between two
kinds of classifications, like row planting and if they participated in an earlier season or not, because it tests for
independence, and because the expected frequency in any cell in the contingency table was less than 5.
2.9.2 Analysis of qualitative data
The motivation behind (non-)implementation and adaptation of best management practices was analyzed by
grouping and labelling the answers given by the farmers. The reasons behind (non-)implementation and
adaptation are described in percentages. These percentages were derived by dividing the number of farmers
mentioning a certain category of reasons over the total number of farmers in the specific sub-group that was
analysed (e.g. number of farmers who did intercropping). Farmers were allowed to give more than one answer.

12
2.10 Construction of Farm types Farms and their households were divided into four farm types. An estimate of the farmers’ wealth class was
made in the field, based on a number of observations and surveyed household characteristics. This estimated
wealth gave a first rough classification into four farm types, ranging from very poor to wealthy. Secondly, to
decrease observer bias and to make the groups more homogeneous, each farmer was evaluated separately on
a few different factors, based on the factors Marinus (2015) used for farm typology. These factors were the size
of the farm, the total number of livestock of each farmer, expressed in tropical livestock units (TLUs) (Jahnke,
1983), the number of cattle they owned, valuable goods owned, production orientation, and the most
important source of income, which were all estimated values given by the farmers. Furthermore the type of
housing was also taken into account: poorer farmers stayed in houses constructed of semi-permanent walls
with a thatched roof, while wealthy farmers stayed in houses constructed of permanent walls and an iron sheet
roof, which was observed at the homestead. Add one or two sentences on how this changed your first rough
typology.

13
3 Results The first section of this chapter describes to what extent the focal farmers planted the N2Africa technology
packages (improved beans and phosphate fertilizer), and implemented and adapted any of the practices from
the demonstration trials. The second section focuses on the determinants of this implementation and
adaptation, and uses the nine best management practices from the researcher best-bet that were described in
paragraph 2.5 as a basis. In the third section, climbing bean yields are compared between the two plots, and
between different groups of farmers.
3.1 Implementation and adaptation of the N2Africa technology packages From the 88 farmers that were interviewed, six farmers planted only part of the beans and stored the other
part, while 20 other farmers did not plant at all (Table 3). The 26 farmers who did not plant (part of) the beans
had several reasons for not doing this. Half of these farmers mentioned that they received the seeds too late to
be planted ‘right’. In addition, a lack of space (15%) was mentioned, which was indirectly caused by the late
distribution of the beans, since it meant other crops already occupied the farmers’ fields. The second reason
was more related to weather conditions: 38% of the farmers delayed their planting due to too much rain,
waterlogging or drought. The third most frequently mentioned reason was illness or pregnancy (31%). Other
reasons were the presence of free-range chickens which could eat the beans (n=1), and lack of knowledge
about what to do with the beans (n=1). Finally, 12% of the farmers kept the beans, because they were planning
to plant the beans in the dry season by making use of irrigation. By irrigating the beans, the farmers could sell
fresh beans when not many farmers would be selling beans, which means they could sell them at a higher
price.
From the 68 farmers who did plant, eight farmers had problems with the beans soon after planting. Four of
these eight farmers mentioned that chickens and donkeys ate all the emerging beans. Three others mentioned
waterlogging, too much rain or drought as the main problem for their losses. These eight farmers are therefore
not included in the analysis on management practices, although they had initially planted.
Table 3. Total farmers interviewed, farmers who planted in two different plots and farmers from whom harvest data from two different plots was collected, per sub-county.
Sub county Total farmers Planted
Planted in
two plots
Measured
harvest
Measured
harvest from
two plots
Kapchesombe 21 15 (71%*) 6 (40%**) 7 3
Kaptanya 22 11 (50%*) 7 (64%**) 5 1
Chema/Tegeres
Upper 19 16 (84%*) 3 (19%**) 0 0
Chema/Tegeres
Lower 26 18 (69%*) 8 (44%**) 9 4
Total 88 60 (68%*) 24 (40%**) 21 8
*Percentage of total farmers
** Percentage of farmers that planted

14
Of the 60 farmers who planted, 24 planted in two plots as indicated in the instruction leaflet (Appendix II).
Several farmers planted two plots to see potential yield differences between the two plots. However, most
farmers ran out of fertilizer, and continued planting the beans without fertilizer and without clearly indicating
when mineral fertilizer application had stopped. The reasons given by farmers to explain why they planted
only one plot were mainly that they did not know they were asked to plant in two plots (19%), that they did not
receive enough seeds to plant in two plots or lacked the time and space to do so (17%), or that they had
enough fertilizer for the whole plot (n=2). Other farmers did not receive TSP (n=1), received two varieties of
beans (n=1), wanted overall good yields (n=1) or planted two plots without knowing where each started (n=1).
For harvest measurements, 19 farmers with two plots were selected. From eight farmers harvest was
measured in the end. Four others harvested only one plot and the resulting seven had nothing to harvest: three
farmers had their beans eaten by chickens and goats, two were not encountered at their house and did not
pick up their phone, and two had no yield due to late planting and drought. From the 15 farmers who were
selected with only one plot, the harvest of nine farmers was measured. Three could not be reached, and the
other three had either eaten the beans fresh and weighted part of the beans with pods (n=1), or had their
beans eaten by livestock before harvest (n=1) (Table 3).
All focal farmers who planted and applied the TSP (n=53) applied it in the planting hole, together with the
beans. About 51% stated that the beans grow better and give higher yields with mineral fertilizer, and 40%
applied the TSP because they were told to do so. Only 8% of the farmers mentioned to have applied the
fertilizer in order to see the difference between the two plots.
Of the seven farmers who did not apply TSP, three did not receive TSP from the project staff and did not have
enough money to buy TSP. Other reasons mentioned were having too little to plant with the beans (n=1), it
being the first time cultivating the beans (n=1), rains making fertilizer useless (n=1) or being told to plant
without TSP (n=1).
While farmers were instructed to plant in two plots of 25m2, farmers planted in plot sizes ranging between
7.26m2 and 544.00m
2 with an average of 88.49m
2 per plot.
3.2 Implementation and adaptation of the demonstrated practices
For the analyses in this section only the data gathered from farmers who planted the beans are used (n=60).
Any variations are explicitly mentioned. Farmers who planted in two plots applied the same management
practices on both plots, apart from TSP application. Therefore only the fields with TSP are analysed.
In the demonstration trials, practices were demonstrated that are a better alternative to increase yield or offer
an alternative to high costs or low availability of stakes (Table 4). There were no practices that were used by all
farmers. Furthermore, none of the farmers used all best management practices from the researcher best-bet.

15
Table 4. Demonstrated practices and the percentage of focal farmers implementing these practice (n=60). For the implementation of TSP n=56, because only 56 farmers received TSP in their package. If farmers adapted a practice, a description is given about this adaptation.
Demonstrated practice
Implemented
by farmers Adaptation description
Sole cropping 27% Most farmers intercropped with banana and coffee (73%).
Row planting 58% Planted in grids; similar distance between rows and plants. The rest was planted randomly (42%).
Phosphate fertilizer use (n=56)
93% Mostly on the whole field, not in separate plots (68%).
Manure application 13%
Weeding twice during the season
13% Weeding done mostly once (57%), never thrice.
2 seeds per hole 32% Mostly 3 or more seeds (58%).
25cm plant spacing 3% Plant spacing was more similar to row spacing, 54cm average.
50cm row spacing 29%
Sowing density (320-480 in 5x5m)
13% Plant density was lower than the density in the demonstration trials. An average of 290 plants per 5x5m emerged.
Staking density (100 per 5x5m)
17% Average: 57 stakes per 5x5m.
Stake length (>1.75m) 42% 42% of the farmers also selected on stake length, but there was no correlation between stake length and the farmers selecting based on stake length.
4 plants per stake 21% Low staking density resulted in a slightly smaller number of plants per stake. Average: 3.7 plants per stake.
Staking method (single) 85% Normal practice for climbing beans.
Staking method (tripods) 7% Single stakes supported by smaller stakes, forming a ‘tripod’ (n=4).
Staking method (sisal strings or banana fibre)
0% Wooden construction with wooden/bamboo stakes leaning against it, instead of sisal strings or banana fibre (n=1).
Even though climbing beans were planted as a sole crop in the demonstration trials, most farmers planted in an
intercropping system. Farmers planted in sole cropping because they were told to by the project (38%), or to
attain good yields (19%). Other farmers mentioned this was the only land available (n=2) or to protect the
beans from competition with other crops (n=1).

16
Of the farmers who did intercropping, 75% planted the beans with banana (Plantain, Musa), 45% with coffee
(Coffea arabica), and 23% with cassava (Manihot esculenta). Small percentages were intercropped with
Eucalyptus (Eucalyptus) or food crops like cabbage (Brassica oleracea), cocoyam (Colocasia esculenta) or
potatoes (Solanum tuberosum L.). Reasons to do intercropping with beans were mainly: a shortage of land
(57%), the other crop already growing there (34%) or that particular field having more available space
compared to other fields (14%). Two farmers wanted to provide shade for the beans and two others
intercropped with maize (Zea mays) and cassava, which were simultaneously used as stakes for the beans.
Manure was used by 13% of all farmers. Only one farmer applied the manure because he saw it in the
demonstration trial, four farmers mentioned they added manure to strengthen the soil and one other
mentioned manure is a normal practice. Reasons for farmers not to apply manure (n=47) were mainly that they
either could not afford it or did not have access to it (53%), or they had already applied mineral fertilizer, which
made adding extra manure unnecessary (15%). Two farmers applied the manure on a different field or crop
and four farmers mentioned to have fertile soils already. Other reasons mentioned were: that manure causes
blight (n=1), mineral fertilizer was cheaper (n=1), that the plot was not theirs (n=1), and illness (n=1).
Weeding was done by a majority of the farmers (70%); however, 81% only weeded once. A small portion of the
farmers weeded a second time (19% of the farmers who weeded), and none of the farmers weeded a third
time. Farmers were only asked for dates of weeding, so no reasons for the number of times of weeding were
recorded.
On average, farmers planted 2.98 seeds per hole. 10% planted 1 seed, 32% planted 2 seeds, and 58% planted 3
or more seeds. The farmers’ who planted two seeds did this mainly because they saw it in the demo or were
told to plant two seeds (37%). Also, by planting more seeds, at least some would remain if others died (21%).
Other reasons heard were that it was a normal practice (n=2), to get higher yields (n=2), that they already
planted less seeds than normal (n=2), that they did not have enough stakes (n=1), or that they were trying to
give the beans enough space (n=1).
From the farmers who planted 1 seed, five mentioned that they were told to plant like that and saw it in the
demo, and one other farmer wanted to give the beans enough space. Reasons for farmers to plant 3 or more
seeds per hole were mainly because if others died, some would still remain (30%), that more beans per hole
are a normal practice (21%), that they did not have enough stakes (15%), and that what they planted was
already less than what they normally plant (n=3). The latter was influenced by the lower sowing densities,
which they had observed in the demonstration trial. By planting 3 or more seeds the farmers were also
expecting higher yields (n=3), and the space for planting the beans or fertilizer to apply with the beans was
limited (n=3).
Reasons for farmers to plant in rows were mainly to get easier access to their beans - for easier staking,
weeding, spraying and planting (47%). Others stated that they did it because they observed this practice at the
demonstration trials (37%), or that they were trying to give the beans enough space to grow (22%). Reasons to
not plant in rows and instead use random planting were primarily that it is a normal practice (42%), that the
farmers had no time to plant using a different method (21%), or that there were other crops (maize or banana)
already in the field (17%) which made random planting the easiest option.
Most farmers used single staking in their adaptation trials. Half of the farmers used single stakes because these
were available, or because they said to “have no other option”. Another 14% were not familiar with any other
method. Other farmers mentioned that single staking needs less stakes than other methods (n=4), it is a
normal practice (n=3), it is an easy way of staking (n=3), or that single stakes give good yields (n=2).

17
Four farmers used a mix of single stakes and tripods. Tripods were made in all cases to strengthen or support
the single stakes. None of the farmers used the alternative low-cost sisal strings or banana fibre. However, one
farmer made a construction similar to the wooden construction for the sisal strings in the demonstration trials,
but with a height of about 1 meter. Instead of the strings he used wooden sticks or maize stalks. He used this
construction to give more support to the wooden sticks and maize stalks (Figure 5).
Figure 5. On the left a tripod is created to support the single stake. On the right a wooden construction supports wooden sticks and maize stalks.
Most farmers used a mix of different staking materials like Eucalyptus (Eucalyptus), Coffee (Coffea arabica),
Bamboo (Bambusoideae), Maize (Zea mays), and local trees (35%). Some farmers used only local trees (30%) or
maize (17%). Four farmers used only Cassava (Manihot esculenta), Eucalyptus or Bamboo. One farmer
mentioned that his beans were now staked with maize stalks since the eucalyptus poles he initially used were
stolen by people who use it for firewood.
Of the farmers who staked, 52% grew less than 3.5 plants per stake. Around 21% grew between 3.5 and 4.5
plants per stake and 27% grew more than 4.5 plants per stake. Staking densities were lower than in the
demonstrations trials, because still many beans in the field were left unstaked.
Four farmers did not stake because of illness and hospital visits (n=3). One farmer did not stake because at the
time of staking, no money was available and yield was not promising, so the farmer lost hope (n=1).
Stake length varied between 130cm and 235cm in the farmers' fields. The average stake length was 175cm, and
58% of the farmers used stakes that were on average smaller than 175cm. Therefore, 42% of the farmers had
stakes of 175cm or longer. Also 42% of the farmers selected stakes based on their length. These farmers,
however, did not overlap: there was no significant difference in average stake length between farmers who did
select on stake length (177.6 m) and the ones who did not select on stake length (171.6m) (p=0.636).

18
3.3 Implementation of pest control Another important management practice that influences yields for climbing beans is the control of pests and
diseases. Although no practices to control these were demonstrated in the trials, farmers do experience
problems with pests and diseases and use different methods to control them. Out of all the farmers, 65%
experienced problems with pests. Of the farmers experiencing pests, 59% sprayed with pesticides, and they
only started using pesticides when the beans were already infested with pests. Of the farmers who had pest
problems, 74% had problems with aphids, 28% with caterpillars and 21% with bean flies. Other small occurring
pests were termites, moles, (wild) birds and goats. Of the farmers who did not spray any pesticides (n=37), 41%
said not to have enough money to buy pesticides, 32% had no problems with pests, and other farmers gave up
on their beans (8%), or had no time for spraying pesticides (5%). Some of the farmers protected their beans by
creating scarecrows to keep away wild birds or chickens. They attached plastic bags to strong wooden poles,
trees or bushes that were present around the bean plot. To overcome problems with chickens during and
shortly after planting, farmers tied their chickens (Figure 6).
Figure 6. A chicken tied to a wooden bench
3.4 Determinants of implementation and adaptation To find determinants for implementation and adaptation, we focused on the nine best management practices
that were shown in the researcher best-bet (see section 2.4).
Differences between farmers such as their resource endowment (farm size, housing, etc.), household
characteristics (number of household members, education, etc.), and production orientation are expected to
influence the implementation or adaptation of these best management practices. To deal with these
differences, we grouped farmers into farm types. Furthermore, where possible, specific indicators like farm size
or ownership of cattle were also viewed in relation to implemented practices.
Biophysical and geographical differences were expected to influence the implementation or adaptation of the
best management practices as well. We expected differences in implementation between sub-counties, related
to differences in biophysical factors that are influenced by altitude and previous participation in the project

19
(Kapchesombe and Kaptanya where the project started one year earlier, versus Chema and Tegeres). Again,
specific indicators like altitude, earlier use of climbing beans and whether or not the farmers visited the
demonstration site or not were also analysed in relation with implementation of the practices. Whether farmer
visited the demonstration trials or not, could be influenced by geographical location because extension officers
who distributed the technology package worked in different sub-counties.
We first describe the different farm types and geographical locations, followed by an analysis of how these
characteristics determine the implementation of the demonstrated technologies.
3.4.1 Farm types
Farmers were categorized into four farm types, ranging from very poor (farm type 1 (FT1)) to wealthy (farm
type 4 (FT4)). Most farmers belonged to farm type 2 (FT2) and the smallest amount of farmers belonged to FT4
(Figure 7).
Figure 7. Distribution of focal farmers over the four farm types for all farmers (n=88) and the farmers who planted (n=60).
0%
5%
10%
15%
20%
25%
30%
35%
40%
45%
FT1 FT2 FT3 FT4
Per
cen
tage
of
foca
l far
mer
s
All farmers
Farmers thatplanted

20
Table 5. Characteristics of the four farm types found in Kapchorwa district. Values between brackets show minimum and maximum values (n=88)
Characteristics Farm type 1 Farm type 2 Farm Type 3 Farm type 4
n p-value 19 34 24 11
Resource endowment
Average farm size (ha) * - 0.3 (0.1-0.5)
0.9 (0.2-1.6)
1.3 (0.4-2.8)
2.8 (0.2-8.1)
Tropical Livestock Unit (TLU) *
- 0.78 (0.00-2.15)
1.66 (0.01-5.33)
2.96 (1.46-5.70)
5.31 (1.41-14.95)
Cattle * - 0.84 (0-3)
1.94 (0-7)
3.67 (1-7)
6.18 (2-18)
Type of housing * - Part semi-permanent walls with a thatched roof, part semi-permanent walls with an iron sheet roof
Mostly semi-permanent walls with an iron sheet roof, some with a thatched roof
Mostly semi-permanent walls with an iron sheet roof, some permanent walls with an iron sheet roof
Mostly permanent walls with an iron sheet roof, part semi-permanent walls with an iron sheet roof, some permanent walls with a tiled roof
Households hiring labour during the season
<0.001 5%
25%
38%
61%
Household characteristics
Average age head of the household
0.415 42 (24-75) 47 (24-87) 46 (30-76) 48 (32-60)
Average number of household members
0.077 8 (2-11) 8 (4-12) 7 (2-13) 6 (1-17)
Level of education head of the household
- Most (post) secondary, part primary, some no education
Most (post) secondary, part primary, some no education
Most (post) secondary, part primary, some no education, some university
Most (post) secondary, part primary, part university
Product orientation
Production orientation * - Most consumed at home, part sold
Part consumed at home, part sold
Part sold, part consumed at home
Most sold
Most important source of income *
- Labour in agriculture, produce from crops or some produce from livestock
Most produce from crops, some produce from livestock, some other sources of income (0-20%)
Most produce from crops, some from livestock, part off farm income (0-40%)
Most produce from crops, part off farm income (0-40%)
Seasons planted climbing beans before
0.451 4.74 (0-20) 3.94 (0-20) 2.96 (0-20) 2.09 (0-10)
Previous participation in the N2Africa project
0.062 11% 24% 46% 36%
* Characteristics used for creating farm types. Therefore no p-value is given.

21
Farmers of FT1 had smaller farm sizes than the other farm types, less Tropical Livestock Units (TLU) and cattle,
poorer housing and a production orientation mainly focused on feeding the household. FT1 was the only farm
type where farmers worked as labourers on other farmers’ fields (Table 5). Farmers belonging to FT2 were still
poor farmers, but had, on average, larger farm sizes and TLU, and an income mostly coming from crops or
livestock. Farmers from farm type 3 (FT3) had even bigger farm sizes and higher TLU’s, and were mostly
focused on crop or livestock production for sale. Their housing was better and they hired more labourers. FT4
represents the better-off farmers, who mostly focused on selling farm produce, had the best housing, the
biggest farm sizes, the highest TLU’s, and hired the most labourers.
3.4.2 Geographical location
Differences in geographical location were expected to influence the implementation or adaptation of
management practices as well. The sub-counties Kapchesombe and Chema/Tegeres Upper were positioned
above the altitude level of 1900m, Kaptanya and Chema/Tegeres Lower sub-counties below. Each sub-county
had different field officers. Accessibility of the area also differed. Furthermore, sub-counties differed in the
amount of TLU they possessed, the degree of labour they hired and the number of seasons they planted
climbing beans before (Table 6). Although the project was first implemented in Kapchesombe and Kaptanya,
and only later in Chema and Tegeres, focal farmers from Kapchesombe (33%) and Chema/Tegeres Upper (42%)
participated in an earlier season within the project. Furthermore, climbing beans were cultivated for a longer
period in Chema and Tegeres, because they were introduced earlier.

22
Table 6. Characteristics of the four sub-counties in Kapchorwa district. Values between brackets show minimum and maximum values (n=88).
Characteristics Kapchesombe Kaptanya Chema/Tegeres Upper Chema/Tegeres Lower
n p-value 21 22 19 26
Resource endowment
Average farm size (ha) 0.061 1.4 (0.2-4.6) 1.4 (0.2-8.1) 0.6 (0.1-1.6) 1.0 (0.2-2.8)
Tropical Livestock Unit (TLU)
0.044 3.37 (0.14-14.55) 2.56 (0.02-14.95) 1.46 (0.01-4.40) 1.77 (0.00-5.70)
Cattle 0.052 4.05 (0-17) 2.96 (0-18) 1.79 (0-6) 2.08 (0-7)
Type of housing - Mostly semi-permanent walls with an iron sheet roof, part permanent walls with an iron sheet roof, some semi-permanent walls with a thatched roof
Mostly semi-permanent walls with an iron sheet roof, part with a thatched roof, part permanent walls with an iron sheet roof, some with a tiled roof
Mostly semi-permanent walls with an iron sheet roof some with a thatched roof
Mostly semi-permanent walls with an iron sheet roof, some with a thatched roof, some permanent walls with a tiled roof
Households hiring labour during the season
0.004 41%
38%
11%
24%
Production orientation
Production orientation - Most sold, part consumed at home
Part sold, part consumed at home
Part consumed at home, part sold
Part consumed at home, part sold
Most important source of income
- Mostly produce from crops, some other sources of income (0-10%)
Mostly produce from crops, some labour in agriculture, some off farm income (0-40%)
Most produce from crops, part from livestock, some labour in agriculture, some off farm income (0-20%)
Mostly produce from crops, some off farm income (0-20%)
Seasons planted climbing beans before
<0.001 1.95 (0-10)
0.55 (0-3)
8.94 (0-20)
3.89 (0-14)
Location properties
Previous participation (% of farmers in sub-county)
0.340 33% 23% 42% 19%
Visited demonstration trial 0.513 67% 91% 79% 70%
Altitude level (meters above sea level)
- 2039 (2004-2104)
1810 (1715-1882)
2000 (1906-2025)
1796 (1721-1870)

23
3.4.3 Distribution of farm types over sub-counties
The distribution of farm types over the different sub-counties shows that Kapchesombe sub-county is
the sub-county where more than 50% of the farmers are better off (FT3 and FT4), while in
Chema/Tegeres Upper sub-county almost 80% of the farmers are poor (FT1 and FT2) (Figure 8). This is
mainly determined by differences in farm size, TLU and how often farmers hired labour.
Figure 8. Distribution of farm types (FT1-FT4) within each sub county (n=88)
3.4.4 Determinants for implementation or adaptation of best management practices
Due to the differences in characteristics between farm types, we expected differences in the degree
of implementation and adaptation of the best management practices. The percentage of farmers
implementing certain practices differed between farm types, but none of these differences was
significant (Table 7).
Table 7. Percentage of farmers implementing best management practices per farm type (n=60). For the
implementation of TSP n=56, because only 56 farmers received TSP in their package. P-values are given for the
mean differences of implementation over farm types.
Best management practice from researcher best-bet
p-values
FT 1 n=17
FT 2 n=22
FT 3 n=14
FT 4 n=7
1 Sole cropping 0.502 18% 23% 36% 43%
2 Row planting 0.056 41% 73% 71% 29%
3 Phosphate fertilizer use (n=56) 0.676 94% 82% 86% 100%
4 Manure application 0.435 12% 14% 21% 0%
5 2 Weeding’s 0.802 12% 18% 7% 14%
6 2 Seeds per hole 0.782 35% 36% 21% 29%
7 Sowing density (320-480 plants per 5x5m) 0.236 6% 14% 29% 0%
8 Stake density (80-120 stakes per 5x5m) 0.397 24% 23% 7% 0%
9 Stakes longer than 1.75m 0.073 47% 41% 36% 43%
Similarly, also differences were expected in the degree of implementation and adaptation of best
management practices between the sub-counties. From the demonstrated practices, only the
0%
20%
40%
60%
80%
100%
Per
cen
tage
wit
hin
eac
h
sub
co
un
ty (
%)
FT4
FT3
FT2
FT1

24
percentage of farmers implementing sole cropping differed significantly between the sub-counties
(Table 8).
Table 8. Percentage of farmers that implemented best management practices per sub-county (n=60). For the implementation of TSP n=56, because only 56 farmers received TSP in their package. Letters indicate significant differences. P-values are given for the mean differences in implementation between de sub-counties. T/C = Tegeres and Chema sub-county.
Best management practice from researcher best-bet p-values
Kapchesombe
(n=15) Kaptanya
(n=11) T/C Upper
(n=14) T/C Lower
(n=20)
1 Sole cropping 0.033 53% (a) 18% (ab) 7% (b) 25% (ab)
2 Row planting 0.905 53% 55% 57% 65%
3 Phosphate fertilizer use (n=56) 0.532 80% 100% 93% 85%
4 Manure application 0.220 27% 0% 7% 15%
5 2 Weeding’s 0.326 7% 9% 7% 25%
6 2 Seeds per hole 0.111 13% 45% 43% 30%
7 Sowing density (320-480 plants per 5x5m)
0.080 20% 0% 0% 25%
8 Stake density (80-120 stakes per 5x5m)
0.843 13% 9% 21% 20%
9 Stakes longer than 1.75m 0.237 33% 27% 36% 60%
In the remainder of this section we explore the determinants for the nine best management practice
in more detail.
Sole cropping (1)
Farmers from Kapchesombe made significantly more use of sole cropping than farmers from T/C
Upper (Table 8). Of the farmers who practiced intercropping, 25% participated in the project during a
previous season, and of the farmers who did sole cropping, 63% did. This difference was also
significant (p=0.031). When the two altitude levels are taken (the first level being below 1900m, the
second level being 1900m or higher) an almost significant difference is found (p=0.082), showing that
in the lower region, 17% of the farmers practiced sole cropping whereas in the higher region, this
amounted to 37%.
The number of seasons farmers had already planted climbing beans before did not influence the
choice between sole cropping or intercropping (p=0.800). Although farmers from FT1 mostly planted
climbing beans in intercropping, and farmers from FT4 mostly in sole cropping (Table 7), there is no
significant difference between farm types. Furthermore, we tested the relation between sole
cropping and farm size. Farmers who planted in sole cropping had an average of 2.6 ha and farmers
who planted in intercropping an average of 2.1 ha. However, this difference was not significant
(P=0.275). Sole cropping is therefore only determined by sub-county and previous participation in the
project.
Row planting (2)
Farmers planted the beans either in rows or randomly (i.e. without a fixed distance between plants).
Differences between farm types were almost significant (p=0.056): farmers from FT1 and FT4 more
often planted beans randomly (Table 7). Differences in percentage of row planting implemented by
farmers who hired labour permanently, regularly, sometimes or never, were not significant (p=0.795).
From the farmers who planted in rows, 71% visited the demonstration trials. Among the farmers who
planted randomly this was 80%. This difference was not significant (p=0.552). Furthermore, there was
no difference in the number of seasons that farmers already planted climbing beans before when

25
they planted in rows (5.49) or randomly (4.64) (p=0.683). Lastly, 62% of the farmers who participated
in the project during a previous season planted in rows, as well as 56% of the farmers who had never
joined this project before, which also did not present a significant difference (p=0.687). For row
planting, only farm types were found to be possible determinants.
Phosphate fertilizer use (3)
Four farmers received a package without TSP. Two of them visited the demonstrations (4% of the
total number of farmers who visited the demonstration trial), and two of them did not (13% of the
total number of farmers who did not visit the demonstrations trial). Of the farmers who did not visit
the demonstration and received TSP (n=13), 77% planted with the TSP, while from the farmers who
were present in the demonstration trials and received TSP (n=43), 98% planted with TSP. This
difference was significant (p=0.035).
Of the farmers who previously participated in this project and received TSP, 100% planted with
fertilizer, compared to 89% of the farmers who participated for the first time. This difference was not
significant (p=0.285). There was furthermore no significant difference in TSP application between
farm types (Table 7), or between sub-counties (Table 8), probably because TSP was part of the
distributed package and did not have to be bought.
Manure application (4)
The percentage of farmers who applied manure was not significantly different between the different
farm types (Table 7). Still, a relation was expected between cattle ownership and the application of
manure on the adaptation trial plot. However, the number of farmers who owned cattle and applied
manure (16%) did not significantly differ from farmers who did not own cattle and still applied
manure (7%) (p=0.666).
Farmers with more cattle have significantly more land (p <0.001, R2 = 0.305, Figure 9). This relation
could be an indication of wealth in general, and therefore the relation between manure application
and farm size was also tested. Farmers who applied manure have an average farm size of 0.68
hectares, and farmers who did not apply manure have an average farm size of 1.18 hectares, but this
difference was not significant (p=0.299). This outcome is nonetheless not what was expected and
counterintuitive in relation to wealth.
Another possible reason for applying manure less often could be land ownership. Farmers who do not
own the land where the beans are planted also have less incentive to invest in the land. However,
farmers who rented or borrowed the land applied manure more often (21%) than farmers who
owned the land (11%), and this difference was also not significant (p=0.374).
Farmers from Kapchesombe own more livestock and more cattle than farmers from other sub
counties (Table 6). Farmers from Kapchesombe also implemented manure more often than farmers
from other sub-counties; but differences between sub-counties were not significant (Table 8).

26
Figure 9. Farm size (ha) as related to number of cattle possessed by the farmers (n=57, p<0.001, R2 = 0.305).
White and black marks indicate manure and no-manure application, respectively.
Weeding (5)
The demonstration trials were weeded twice, but farmers were told to follow common practices
regarding weeding. A negative trend can be found between the number of seasons that farmers
already planted climbing beans before and the number of times farmers weeded their plots, but the
difference is not significant (Figure 10).
Furthermore, there was no significant difference between sub-counties and the percentage of
farmers that weeded twice (Table 8), nor was there any significant difference in the average times
farmers weeded (p=0.488). The number of weedings was not related to farm type either (p=0.885),
nor was there a significant difference between farm types and the percentage of farmers that
weeded twice (Table 7). The hiring of labourers also did not seem to influence the amount of
weedings: those that hired labour permanently (n=3) weeded 0.67 times, those who did so regularly
(n=9) weeded 0.67 times, those who did so sometimes (n=19) weeded 0.79 times, and those who
never hired labourers (n=29) weeded 0.93 times (p=0.652).
y = 1.802x + 0.5715 R² = 0.3053
0
1
2
3
4
5
6
7
8
9
0.0 0.5 1.0 1.5 2.0 2.5 3.0
Am
ou
nt
of
catt
le
Farm size (ha)
0.61.2
Manure No manure

27
Figure 10. Frequency of weeding versus the average number of seasons that farmers planted climbing beans before (p=0.308).
Seeds planted per hole (6) and sowing densities (7)
Farmers with less financial resilience are more risk-averse and need to be sure they produce food
crops every season to be self-sufficient (Nyende & Delve, 2004). Farmers from poorer farm types
were therefore expected to have a production orientation focused on home consumption.
Furthermore, because they also have smaller farm sizes, they were expected to plant a larger number
of seeds per hole, to account for potential losses related with seed quality or poor emergence.
However, differences between farm types concerning the number of seeds planted are not significant
(p=0.301). There was no significant difference between sowing densities used either (p=0.236).
Visiting the demo also did not influence the difference between the number of seeds planted per hole
in any significant way, because whether farmers visited the demo or not, they planted an average of
3.06 seeds per hole (p=1.000). Farmers who had visited the demo had a sowing density of 287 seeds
per 25m2; those who did not visited sowed 306 seeds per 25m
2 on average – a difference which was,
once again, not significant (p=0.787).
Stake density (8)
Farmers were asked to score the availability of stakes on a scale from 1 to 4, with 1 being very poor
and 4 being good. On average, farmers from Kaptanya gave a higher score to the availability of stakes
than farmers from the other sub-counties (Figure 11A). However, while farmers from Kaptanya gave
the highest score for staking availability, they had, on average, the lowest staking density (Figure
11B). Nonetheless, the differences between staking densities were not significant. Stake densities
between the subcounties in the higher altitudes (64 stakes per 5x5m) and the subcounties in the
lower altitudes (56 stakes per 5x5m) is also not significantly different (p=0.341).
0
1
2
3
4
5
6
7
Zero timesweeded
One timeweeded
Two timesweeded
Ave
rage
nu
mb
er o
f se
aso
ns
pla
nte
d
clim
bin
g b
ean
s b
efo
re

28
Figure 11 A. Average score for staking availability per sub county (n=60). 1=very poor, 2=poor, 3=average, 4=good, 5=very good. B. The average staking density in an area of 5x5 meters seen per sub-county, for farmers who staked (n=56) (p=0.170). T/C = Tegeres and Chema sub-county.).
Stake length (9)
Farmers from sub-counties located above 1900m asl live closer to the forest and were expected to
have better access to staking material. With an average stake length of 187 cm in the sub-counties
below 1900m asl and 163 cm in the sub-counties above 1900m asl, differences in average staking
length are almost significant (p=0.056). This is remarkable, since the average stake length of the sub-
counties in the higher altitudes was expected to be higher than the average stake length of the lower
sub-counties. Finally, if farmers participated in the project during an earlier season they had, on
average, stakes of 177cm; if not, the average stake length was 173cm, which was not a significant
difference (p=0.752).
In summary, we only found a few determinants and possible determinants (with p-values lower than
0.1) for the implementation of the nine best management practices. (Table 9).
Table 9. Summary of (possible) determinants for the nine best management practices.
Best management practice from researcher best-bet Determinant (p<0.05) Possible determinant (p<0.1)
1 Sole cropping
Farm size, earlier participation in project Altitude
2 Row planting - Farm types
3 Phosphate fertilizer use Did not visit demonstration -
4 Manure application - -
5 Weeding’s - -
6 Number of seeds per hole - -
7 Sowing density - -
8 Stake density - -
9 Stake length - Altitude
3.5 Yield of adaptation trials Climbing bean yields for farmers that planted in two plots and from which harvest was measured
from both plots (n=8) showed no significant differences in yields with and without TSP (p=0.651)
0.00
0.50
1.00
1.50
2.00
2.50
Ave
rage
sta
kin
g sc
ore
01020304050607080
Stak
ing
den
sity
(5
x5m
)
A B

29
(Error! Not a valid bookmark self-reference.). Yields also did not differ significantly between different
sub-counties (p=0.511), or farm types (p=0.125).
Table 10. Average climbing bean yield (kg ha-1
) for farmers with two plots, all farmers that planted, farmers from different sub counties and farmers from different farm types.
n
Average yield
(kg/hectare)
Farmers with two plots Plot with TSP 8 224.0
Control plot 8 206.4
All farmers Plot with TSP 19 292.9
Sub counties
Kapchesombe 6 379.4
Kaptanya 4 143.6
Chema/Tegeres Lower 9 284.9
Farm types
FT1 6 216.8
FT2 5 170.3
FT3 5 540.1
FT4 3 209.4
Demonstration Instructions - -
Although farmers received the same amount of TSP, farmers had planted different plot sizes and
therefore applied different amounts of TSP per hectare. When the amount of TSP (kg) that was
applied per hectare is related to yield (kg) per hectare, no trend can be observed (Figure 12). So, the
same yields are achieved, while seemingly larger amounts of TSP are applied. Or when the same
amount of TSP is applied, different yields are found (e.g. 60kg TSP ha-1
). These differences cannot be
further explored, however, due to the low sample size of yields.
Figure 12. The amount of TSP applied per hectare as related to the yield per hectare (n=16, two farmers had missing data). The white data point is not used for the trend line.
y = 0.8863x + 204.23 R² = 0.0262
0
200
400
600
800
1000
1200
1400
0 50 100 150
Yiel
d p
er h
ecta
re
kg TSP ha-1

30

31
4 Discussion The main goals of this study were first to investigate to what extent focal farmers implemented or
adapted the technology package and any of the practices demonstrated at the demonstration trials,
and secondly what the determinants are for this implementation or adaptation. A third goal was to
relate differences in implementation of the management practices with climbing bean yields. Below
the main results are discussed, where after the last goal, what lessons researchers can obtain from
farmers’ adaptations and how this should influence future demonstration trials and/or research
questions, is answered.
4.1 Implementation, adaptation and their determinants Implementation and adaptation in this analysis were found to be hard to disentangle. Two different
examples stress this. First, if farmers did not plant the seeds, this was most of the time because they
adapted to the emerged situation. Farmers received the seeds late and decided to wait with planting
the seeds, because weather conditions changed and became more unpredictable or their fields were
already occupied with other crops. The second example is because sole cropping is a best
management practice shown in the demonstration trial, but most farmers planted in intercropping,
making it an adaptation to sole cropping. Therefore, implementation and adaptation are discussed
together, because they are two sides of the same coin.
4.1.1 The technology package
Farmers had several reasons to decide not to plant, and to explain the low yields they obtained: pests
and diseases, changing weather conditions, lack of space, and the late distribution of seeds. Despite
the fact that pests, diseases and changing weather conditions are difficult to tackle due to their
unpredictability (Karanja et al., 2011; Wortmann et al., 1998), they can be better dealt with when
seeds are disseminated in time. For all stakeholders within the project, early dissemination of seeds is
therefore very important. Furthermore, in this way problems with loose chickens damaging the
emerging beans can also be overcome, because farmers tie their chickens when they are collectively
planting.
Only a small part of the farmers who planted the beans ended up having yield. Moreover, measured
yields were much lower than potential yields. All yields measured were below 600kg per hectare:
farmers who planted their beans with TSP had an average yield of less than 300kg per hectare. This is
far below the potential yield of 3.5 to 5.0 ton per hectare (Musoni et al., 2014). Although lower yields
are to be expected on-farm, compared to yields realized in research stations (Dusabumuremyi et al.,
2014), the exact reason for low on-farm yield compared to potential yield is difficult to pinpoint
(Douthwaite et al., 2002). The low yields and differences in yields in this research are likely to be
influenced by weather conditions, variability in initial soil fertility, or management practices like
sowing densities or weeding. Next to this, the final sample size of yields that are measured was too
small for doing the right analyses.
Furthermore, only a small part of the farmers planted in two plots, and even those who did so often
did not do this deliberately. Since farmers also did not clearly mark their two plots and had very
diverse reasons for not planting two plots, analysis of yields between the control plot and the plot
with TSP became more difficult and unreliable. Recommendations from Douthwaite et al. (2002)
suggest that placing restrictions on adaptation trials to measure the yields from two different plots,
can constrain farmers’ learning cycles, and farmers need to be provided with technologies that are
straight forward: easy to understand and easy to modify. In the first season of 2015, farmers were
therefore provided with a package with seeds and fertilizer, without further restricting them with a
‘standard fixed control’, as proposed in the Agronomy Master plan (Vanlauwe et al., 2014). As an

32
alternative for the control plot of the focal farmers, the project now uses the farmers’ current
climbing bean practice as a control.
4.1.2 Intercropping and row planting
Farmers who participated in an earlier season in the project planted more often in sole cropping than
in intercropping, which might be a continuous implementation of the previous season. However, this
can only be verified if these farmers are followed for more seasons. Still, most farmers planted in
intercropping. Sole cropping of climbing beans can give higher yields when management conditions
are right (Fujita et al., 1992; Graham & Ranalli, 1997), but is according to literature not specifically the
option more preferred by farmers (Van Damme et al., 2014). Advantages associated with
intercropping include more efficient use of the growing season, risk avoidance, diversity in products,
protecting the soil from erosion and control pests and diseases and control weeds through shading
effects (Giller et al., 2015; Karanja et al., 2011; Ojiem et al., 2006). Most farmers in Kapchorwa
intercropped the beans with banana and coffee, of which coffee is only used in the Eastern part of
Uganda to intercrop with beans (Farrow, 2014). Therefore, not much quantitative research is done on
the intercropping of beans with coffee or banana. Because many farmers in Kapchorwa intercrop the
beans with coffee or banana, this is something that could be examined more in future research.
Random planting is less labour demanding at planting and poor farmers normally choose for options
that lower the amount of labour that is needed (Vandeplas et al., 2010). This might explain why
poorer farmers plant less in rows, although it can work counter-productive in the end, when it gets
harder to weed and stake if the beans are planted randomly. Furthermore, the more wealthier
farmers also planted less in rows. A possible reason for this might be the lack of interest of these
farmers in crops that have no good perspective for sale, because of the low quantities that can be
produced with the distributed seeds or because of the poor market access for sale. Furthermore, if
farmers planted in rows, this was not influenced by de amount of labour farmers hired.
Nonetheless, narrow row planting is associated with higher yields and less pests (Adipala et al., 2000;
Dusabumuremyi et al., 2014). An option for the project could be to show the difference between
wide and narrow row planting for the farmers to see the effect of different row distances on yield and
pest control.
4.1.3 Mineral and organic fertilizer
A smaller percentage of farmers who were not present at the demonstrations trials planted with TSP
than farmers who did visit the demonstration trials. Although this was the only practice that was
determined by a visit to the demonstration, good extension services are necessary for a project to
work well. Extension officers provide different information and controlling for these differences in
information, is only possible if the technology is very narrowly defined (Aker, 2011). Because the
extension officers were not systemically monitored, they could influence the outcome of the
implementation and adaptation of the best management practices, because they work in different
geographical locations, at different moments and with different incentives. The performance of a
project in different locations is therefore even more difficult to compare. Differences between
extension officers should therefore be part of the monitoring of the project.
Although not significant, farmers with cattle applied more often manure on their beans, than farmers
who did not own cattle, which was also the case in Kapchesombe, where the most cattle was
available and the most often manure was applied. Therefore, a trend can be seen between farmers
who own cattle and the farmers who apply manure: farmers with cattle apply more often manure,
something which is also seen in other research (Okoboi & Barungi, 2012; Tittonell et al., 2005).
However, farmers who applied manure had smaller farm sizes than farmers who did not apply

33
manure. Farmers with smaller farm sizes can perhaps more easily use manure on the small (number
of) fields that they have, whereas farmers with larger farms may only apply manure on a small portion
of their farm close to the homestead. Because applying manure is labour intensive (Okoboi & Barungi,
2012) and even more when the fields are further away from where the manure is, this might also
explain why farmers with larger farm sizes apply less manure. In general, the use of manure was very
low. Farmers do not only use manure to increase yield or improve soil fertility, but use it also as
construction material for their houses or fuel (Karanja et al., 2011). This further limits the availability
of manure as organic fertilizer.
The few farmers who did not use TSP because they did not receive fertilizers from the project gave
the reason they had no means to buy fertilizers. This gives a small insight in what might happen when
there is no project that supplies fertilizers; farmers are likely to plant the beans without fertilizer.
Other studies give several reasons why the application of fertilizers by smallholder farmers is limited:
unaffordable prices, low quality of mineral fertilizers or a lack of local infrastructure (Karanja et al.,
2011; Pircher et al., 2013). If farmers use manure or mineral fertilizers, this is most often applied on
high-value crops like maize or bananas.
Because farmers use manure for different purposes and because the use of mineral fertilizers is
limited, the project could focus on the more efficient use of manure and mineral fertilizers in
intercropping systems of beans with high-value crops or focus on other low-cost external inputs like
crop residues of coffee and banana or stimulate to incorporate climbing bean biomass into the soil.
4.1.4 Staking
Farmers mostly used single staking: the method they also used for their local climbing beans and
which yields most (Descheemaeker et al., n.d.). Some of the farmers also used tripods to stake their
beans, but this was only to strengthen or support their single stakes. Tripods were intended to
enhance yields as stakes would not easily fall over, but were also expected to be more labour
intensive and therefore to be used mostly by wealthier farmers. However, tripods were not
necessarily used by wealthier farmers, and were only used to support weaker stakes for those who
did not have enough stakes. Sisal strings were intended to provide a low-cost alternative for single
stakes in an area like Kapchorwa where farmers mention staking as a major constraint for climbing
bean cultivation. Still, in the adaptation trials none of the farmers used this option. The explanation is
probably three-fold. First, labour and material costs: single stakes seemed to be easier to find and to
plant than the eucalyptus poles that could hold the strings. In addition, attaching the strings and
fibres to the poles took a lot time and effort. Second, the robustness of the strings: when placed in an
open area or field, the wind could get hold of the strings and the beans could be moving from one
side to the other. This most probably will result in damage to the beans, either during growth or
during maturing stage, when flowers are vulnerable. Thirdly, not only were the beans of the farmers
staked late, beans in the demonstration fields were also supported very late and not at the same
time. Midway October, most sisal strings and banana fibres were not yet attached to the poles on all
the demonstration sites. Focal farmers were already staking before the beans were staked in the
demonstration trials. This influenced the outcome of the implementation, because the only staking
methods farmers were already familiar with and which they mostly implemented, was single staking.
Therefore there was never an equal race between the displayed methods of staking. During planting,
farmers were told to stake early after three leaves emerged. However, this was not done in time in
the demo plot, which did not give a good example. This reflects however also the difficulty in a
project like N2Africa of getting the right materials together to be implemented in the field.
In the demonstration trials mostly bamboo was used as staking material. The focal farmers, however,
never used bamboo to stake the beans. Farmers used local trees and shrubs for staking, that were

34
also used as firewood or as construction material and which caused problems with theft and
shortness of firewood. This reflects on a problem for both the farmers as well as for the project. While
the project aims to show different staking methods in a uniform way, it does not reflect the staking
materials used in farmers’ fields. Because the availability of staking material is still a problem for
many farmers, the N2Africa project intended to collaborate with the Ugandan agricultural
organisations NARO and VECO, to create nursing beds for local and fast growing trees for staking.
These beds were however never implemented in this region. Since nursing beds are still much needed
in the region, collaboration with these organisations should be renewed or other stakeholders should
be engaged in the project. Especially since although farmers mentioned they got stakes from around
their farm, this might be a cover-up story for them getting their staking material from the national
forest, which is protected and therefore illegal to enter for fetching wood (Ramaekers et al., 2013).
Therefore, the real source of their stakes stays uncertain and could imply hidden labour costs like the
transport of stakes (NaCRRI et al., 2012).
During the season (2014b), maize stalks from an earlier season were also used as staking material in
the demonstration trials. This is a solution used more often in the past (Niringiye et al., 2005; Odendo
et al., 2011), but feedback from the focal farmers on this technology was not systemically recorded,
which gives an important gap that can be filled by future monitoring.
Stake density was lower in the adaptation trials compared to the demonstration trials and many
plants in the field were still not staked at all. This together resulted in low amounts of plants per
stake. The sub-counties in the higher altitudes were expected to have higher staking densities and
longer stakes due to the proximity to the forest. Although not significant: stake densities were indeed
slightly higher. Average stake length, however, was almost significantly lower. There is no obvious
reason for this relation.
And although not significantly different, the lowest staking density was found in Kaptanya, while
farmers in this sub-county gave the highest score for staking availability. This suggest the availability
of bushes or other materials for staking is relatively good, but farmers are less willing to stake in
higher densities. Lower yields are expected due to unstaked climbing beans, although they can still
perform better than some of the best performing bush beans (Musoni et al., 2014), which might
makes it a yield loss for farmers in Kaptanya.
4.1.5 Project practicalities
From the beginning it was unclear, which farmers were present during planting of the demonstration
trials, when instructions were given. Lists of farmers who were present at the demonstration trial
were available, but many of the farmers on the list never received a package or were even not
present at the demonstration trials. Therefore, from the lists it was impossible to exactly say which
knowledge the farmers really received, or if they even received the package and what part of the
package they received. Therefore, by keeping records of which farmers received the package, which
farmers were present during the demonstrations, and which practices are demonstrated, the analyses
on adaptation and implementation can be better related to the demonstrated practices. In this way
best management practices can be better adjusted to the local realities of farmers.
Farmers in the upper part of Chema/Tegeres were provided less with packages with seeds, fertilizers
and a leaflet compared to the farmers in the lower areas of these sub-counties. The extension officer
explained this by attributing it to the low interest from farmers in the upper areas and the farmers
being busier with drinking alcohol than with farming. However, it was also part of the lack of interest
of the extension officer himself. When he had seeds left after the demonstrations, he disseminated
them to farmers close to the main road in the lower areas, close to his own house. This again pleads
for better monitoring of extension officers.

35
Initially the same amount of farmers per sub-county was selected for conducting the surveys. By
doing so, the amount of farmers in each farm type was uneven and therefore statistical analyses on
farm types became hard. For future research to be able to say more about farm types being
responsible for the implementation or adaptation of best management practices, sampling should
also be stratified according to farm types. This could be done by a quick farm typology of farmers in
the area, focused only on the factors that are used for grouping farmers in different farm types. After
this a more balanced sample could be taken for further analyses with farm types as determinant.
4.2 Lessons learned and future research From the results of this study, we can draw a number of lessons that could inform the future
implementation of the N2Africa project, as well as future research:
Seeds should be disseminated in time for the project to be able to have impact. Adaptation
trial farmers should not be restricted in the way they are to plant the beans.
Adaptation trial farmers might implement sole cropping more in the future, because farmers
who participated before in the project planted more in sole cropping. However, most
farmers in Kapchorwa district planted the climbing beans in intercropping with mostly
banana and coffee and therefore more research could be done on the intercropping of these
particular crops with climbing beans.
Poorer and wealthier farmers planted more in random planting, which saves labour during
planting. Future research could further explore if these two groups of farmers always choose
the short-term orientated labour saving option. By knowing this, these specific groups can be
targeted with management practices that fit better to their needs. Furthermore, the effect of
row and random planting could be shown in the demonstration trials for farmers to
experience the impact this has on crop performance.
Differences between extension officers could be monitored better, to allow an improved
comparison of the performance of the project in different locations.
Farmers with cattle have manure available and farmers with small farm sizes apply more
often manure than farmers with larger farm sizes. If future research shows this is true,
farmers with larger farm sizes (most often the wealthier ones) can be targeted with other
soil improving measurements.
If the project leaves the area, farmers are also less likely to use mineral fertilizer. Therefore
the use of mineral fertilizers in intercropping systems could be promoted more, to make
more efficient use of the applied mineral fertilizer on high-value crops. Furthermore, other
low-cost alternatives such as the implementation of compost or incorporation of crop
residues of banana or coffee in the soil could be promoted.
The beans in the demonstration trials were not all staked at the same moment and the
alternative staking method was not implemented in time. This not only influenced the
performance of the beans, but also the implementation of these alternative-staking methods
by the focal farmers.
Staking availability is still poor in the area and the need for nursing beds for new staking
materials is present. Furthermore, the option to use maize stalks from the previous season
could be better monitored, since also focal farmers used this method and during this
research it was not enough explored.
Better records could be kept of the farmers who received a package and who were present
during demonstrations. In this way implementation and adaptation of (best) management
practices could be better related to demonstrated practices.

36

37
5 Conclusions From the discussion of the content of this study, and the way the study was executed, we can draw a
number of final conclusions on the project set-up, possible future research and advices on best
management practices and finally on the research set-up.
5.1 Project set-up Extension workers in different locations do not perform the same; by giving different instructions,
different varieties of seeds or giving only part of the package to adaptation farmers, adaptation
farmers are beginning from a different starting point . During instructions at the demonstration trials,
farmers have to be monitored and registered better, for extensions workers and researchers to know
better if farmers were present during the instructions, and which practices were discussed and
demonstrated.
To give farmers the opportunity to plant the beans in their preferred fields, at the time that they
consider to be best, seeds should be distributed in time. This means before farmers start planting
other crops and vast in time before the season starts. Furthermore, the project could give farmers a
technology package, but without instructing them to plant in two plots or give them any other
planting restrictions in general.
5.2 Possible research and advice on best management practices To translate ‘best-bet’ management practices into more locally relevant options, more research could
be done on the intercropping of beans with coffee and/or banana. This intercropping system is often
used in Kapchorwa district, but not much research is done on the benefits and trade-offs of the
system.
Poor staking availability is an issue in the research area. The use of maize stalks in the demonstration
trials and in the focal farmers field should be monitored better in the future, because this might be a
good alternative to wooden stakes. Furthermore, nursing beds for local and fast growing trees for
staking should be created in the area, to meet the local demand of staking materials.
Few farmers used manure in the adaptation trials. Farmers with cattle have manure available, but
they are likely to also use it for different purposes. The small number of farmers that bought
(additional) mineral fertilizer, of which none was TSP, indicates that if the project leaves the area,
farmers are also less likely to use mineral fertilizer. Therefore, the project could focus on the more
efficient use of manure and mineral fertilizers in intercropping systems of beans with high-value crops
or focus on other low-cost external inputs like crop residues of coffee, banana and climbing bean.
5.3 Research set-up The relatively small sample size in this study, limited many of the analyses. To be able to draw more
meaningful conclusions (on e.g. farm types and yields), a larger sample size is needed.

38

39
References
Adipala, E., Nampala, P., Karungi, J., & Isubikalu, P. (2000). A Review on Options for Management of
Cowpea Pests: Experiences From Uganda. Integrated Pest Management Reviews, 5(3), 185–196.
Aker, J. C. (2011). Dial “A” for agriculture: A review of information and communication technologies
for agricultural extension in developing countries. Agricultural Economics, 42(6), 631–647.
Amrouk, E. mamoun, Poole, N., Mudungwe, N., & Muzvondiwa, E. (2013). The impact of commodity
development projects on smallholders’ market access in developing countries.
Andersson, E. (2014). Fertile grounds ? Collective strategies and the political ecology of soil
management in Uganda. Doctorial dissertation June 5, 2014, Lund University
CIA. (2014). The World Factbook: Uganda. (Vol. 2014). Central Intelligence Agency.
Climate Data. (2015). Retrieved September 1, 2015, from http://en.climate-
data.org/location/780530/
Descheemaeker, K., Ronner, E., Ollenburger, M., Franke, A. C., Klapwijk, C. J., Falconnier, G. N.,
Wichern, J., Giller, K. E. (n.d.). Which options fit best? Operationalizing the socio-ecological
niche concept. Submitted to Experimental Agriculture.
Douthwaite, B., Manyong, V. M., Keatinge, J. D. H., & Chianu, J. (2002). The adoption of alley farming
and Mucuna : lessons for research, development and extension. Agroforesty Systems, 56, 193–
202.
Dusabumuremyi, P., Niyibigira, C., & Mashingaidze, a. B. (2014). Narrow row planting increases yield
and suppresses weeds in common bean (Phaseolus vulgaris L.) in a semi-arid agro-ecology of
Nyagatare, Rwanda. Crop Protection, 64, 13–18.
FAO. (2014). Country profile Uganda, economic indicators, 1–9. Retrieved online on September 1,
2015 from http://www.fao.org/countryprofiles/index/en/?iso3=UGA
FAO/GIEWS. (2014a). Country Briefs - Uganda. 10-February-2014. Food and Agriculture Organization
of the United Nations, Rome.
FAO/GIEWS. (2014b). Interpolated Estimated Dekadal Rainfall 2007-2013. Food and Agriculture
Organization of the United Nations, Rome.
Farrow, A. (2014). Managing factors that affect the adoption of grain legumes in Uganda in the
N2Africa project. Retrieved from www.n2africa.org
Fujita, K., Ofosu-Budu, K. G., & Ogata, S. (1992). Biological nitrogen fixation in mixed legume-cereal
cropping systems. Plant and Soil, 141(1-2), 155–175.
Giller, K. E. (2001). Nitrogen Fixation in Tropical Cropping Systems 2nd Edition. CABI publishing. Oxon,
United Kingdom
Giller, K. E., Andersson, J. A., Corbeels, M., Kirkegaard, J., Erenstein, O., & Vanlauwe, B. (2015).
Beyond Conservation Agriculture. Frontiers in Plant Sciences, 6:870.
Giller, K. E., Franke, A. C., Abaidoo, R., Baijukya, F., Bala, A., Boahen, S., Dashiell, K., Kantengwa, S.,
Sanginga, J-M., Sanginga, N., Simmons, A., Turner, A., de Wolf, J., Woomer, P., Vanlauwe, B.
(2014). N2Africa Putting nitrogen fixation to work for smallholder farmers in Africa. In B.

40
Vanlauwe, P. Van Asten, & G. Blomme (Eds.), Agro-ecological Intensification of Agricultural
Systems in the African Highlands (pp. 156–174). Routledge, London.
Giller, K. E., Tittonell, P., Rufino, M. C., van Wijk, M. T., Zingore, S., Mapfumo, P., Adjei-Nsiah, S.,
Herrero, M., Chikowo, R., Corbeels, M., Rowe, E.C., Baijukva, F., Mwijage, A., Smith, J., Yeboah,
E., van der Burg, W.J., Sanogo, O.M., Misiko, M., de Ridder, N., Karanja, S., Kaizzi, C., K'ungu, J.,
Mwale, M., Nwaga, D., Pacini, C., Vanlauwe, B. (2011). Communicating complexity: Integrated
assessment of trade-offs concerning soil fertility management within African farming systems to
support innovation and development. Agricultural Systems, 104(2), 191–203.
Graham, P. H., & Ranalli, P. (1997). Common bean (Phaseolus vulgaris L.). Field Crops Research, 53(1-
3), 131–146.
Gross, Y., & Kigel, J. (1994). Differential sensitivity to high temperature of stages in the reproductive
development of common bean (Phaseolus vulgaris L.). Field Crops Research, 36, 201–212.
ISRIC-World Soil Information. (2014). SoilGrids: an automated system for global soil mapping.
Retrieved September 3, 2015, from www.soilgrids.org
Jahnke, H. E. (1983). Livestock Production Systems and Livestock Development in Tropical Africa.
American Journal of Agricultural Economics (Vol. 65).
Jakku, E., & Thorburn, P. J. (2010). A conceptual framework for guiding the participatory development
of agricultural decision support systems. Agricultural Systems, 103(9), 675–682.
Kamanga, B. C. G., Kanyama-Phiri, G. Y., Waddington, S. R., Almekinders, C. J. M., & Giller, K. E. (2014).
The evaluation and adoption of annual legumes by smallholder maize farmers for soil fertility
maintenance and food diversity in central Malawi. Food Security, 6, 45–59.
Karanja, N. K., Kimenju, J. M., Esilaba, a O., Jefwa, J., & Ayuke, F. (2011). Legume Based Cropping and
Soil Biodiversity Dynamics in Fighting Poverty in Sub-Saharan Africa: The Multiple Roles of
Legumes in Integrated Soil Fertility Management. Springer Science and Business Media B.V.
Kiptot, E., Hebinck, P., Franzel, S., & Richards, P. (2007). Adopters, testers or pseudo-adopters?
Dynamics of the use of improved tree fallows by farmers in western Kenya. Agricultural
Systems, 94(2), 509–519.
Musoni, A., Kayumba, J., Butare, L., Mukamuhirwa, F., & Murwanashyaka, E. (2014). Innovations to
Overcome Staking Challenges to Growing Climbing Beans by Smallholders in Rwanda. In
Challenges and Opportunities for Agricultural Intensification of the Humid Highland Systems of
Sub-Saharan Africa (pp. 129–136).
NaCRRI, NARO, & ASARECA. (2012). Characterization of Household Farm Level Knowledge, Use and
Satisfaction with Bean Technologies, Products and Markets and Establishment of Gaps,
Opportunities, and Knowledge for Establishing Sustainable Bean Platforms in Uganda.
NaCRRI, PABRA, NARO, ASARECA, & Alliance. (2013). Growing improved climbing bean varieties for
higher productivity (NABE 12C, NABE 26C and NABE 29C).
Niringiye, C. S., Ssekabembe, C. S., & Kyamanywa, S. (2005). Effect of plant population on yield of
maize and climbing beans growns in an intercropping system. African Crop Science Journal,
13(1), 83–93.
Odendo, M., Bationo, A., & Kimani, S. (2011). Socio-Economic Contribution of Legumes to Livelihoods
in Sub-Saharan Africa. In A. Bationo (Ed.), Fighting Poverty in Sub-Saharan Africa: The Multiple

41
Roles of Legumes in Integrated Soil Fertility Management (pp. 27–46). Springer
Science+Business Media B.V.
Ojiem, J. O., De Ridder, N., Vanaluwe, B., & Giller, K. E. (2006). Socio-ecological niche : a conceptual
framework for integration of legumes in smallholder farming systems. International Journal of
Agricultural Sustainability, 4(1), 79–93.
Okoboi, G., & Barungi, M. (2012). Constraints to Fertilizer Use in Uganda: Insights from Uganda
Census of Agriculture 2008/9. Journal of Sustainable Development, 5(10), 99–113.
Pircher, T., Almekinders, C. J. M., & Kamanga, B. C. G. (2013). Participatory trials and farmers’ social
realities: understanding the adoption of legume technologies in a Malawian farmer community.
International Journal of Agricultural Sustainability, 11(3), 252–263.
Ramaekers, L., Micheni, A., Mbogo, P., Vanderleyden, J., & Maertens, M. (2013). Adoption of climbing
beans in the central highlands of Kenya: An empirical analysis of farmers’ adoption decisions.
African Journal of Agricultural Research, 8(1), 1–19.
Sassen, M., & Sheil, D. (2013). Human impacts on forest structure and species richness on the edges
of a protected mountain forest in Uganda. Forest Ecology and Management, 307, 206–218.
Sietz, D., & Van Dijk, H. (2015). Land-based adaptation to global change: What drives soil and water
conservation in western Africa? Global Environmental Change, 33, 131–141.
Sperling, L., & Muyaneza, S. (1995). Intensifying production among smallholder farmers: the impact of
improved climbing beans in Rwanda.pdf. African Crop Science Journal, 3(1), 117–125.
Tittonell, P., Muriuki, a., Shepherd, K. D., Mugendi, D., Kaizzi, K. C., Okeyo, J., Verchot, L., Coe, R.,
Vanlauwe, B. (2010). The diversity of rural livelihoods and their influence on soil fertility in
agricultural systems of East Africa - A typology of smallholder farms. Agricultural Systems,
103(2), 83–97.
Tittonell, P., Vanlauwe, B., Leffelaar, P. a., Rowe, E. C., & Giller, K. E. (2005). Exploring diversity in soil
fertility management of smallholder farms in western Kenya. Agriculture, Ecosystems &
Environment, 110(3-4), 149–165.
UBoS. (2006a). Uganda Population and Housing Census Annex 3. Table C1: Total population by Sub-
county, Sex, Number of Households, and Average Household Size. Retrieved September 1, 2015,
from http://www.ubos.org/onlinefiles/uploads/ubos/census_tabulations/centableC1.pdf
UBoS. (2006b). Uganda Population and Housing Census. Analytical Report Abridged Version. Retrieved
September 1, 2015, from www.ubos.org
UBoS. (2010). Uganda census of agriculture 2008/2009, Volume IV: Crop Area and Production Report
(Vol. IV). Retrieved Juli 15, 2015 from www.ubos.org
Van Damme, J., Ansoms, A., & Baret, P. V. (2014). Agricultural innovation from above and from below:
Confrontation and integration on Rwanda’s Hills. African Affairs, 113(450), 108–127.
Vandeplas, I., Vanlauwe, B., Driessens, L., Merckx, R., & Deckers, J. (2010). Reducing labour and input
costs in soybean production by smallholder farmers in south-western Kenya. Field Crops
Research, 117(1), 70–80.
Vanlauwe, B., Coyne, D., Gockowski, J., Hauser, S., Huising, J., Masso, C., Nziguheba, G., Schut, M., Van
Asten, P. (2014). Sustainable intensification and the African smallholder farmer. Current Opinion

42
in Environmental Sustainability, 8, 15–22.
Vanlauwe, B., Giller, K., & van Heerwaarden, J. (2014). Agronomy Master Plan N2Africa version 1.1.
www.n2africa.org
Wortmann, C. S., Kirkby, R. A., Eledu, C. A., & Allen, D. J. (1998). Atlas of common bean (Phaseolus
vulgaris L.) production in Africa. Cali, Colombia : Centro Internacional de Agricultura Tropical

43
Appendix I Demonstration of climbing bean technology options in Kapchora
Demonstration of climbing bean technology options in
Kapchorwa, Kabale and Kanungu Districts
Objectives
1. To demonstrate a range of climbing bean technology options, focusing on different
varieties, inputs and staking methods.
2. To compare the performance of the technology options in terms of biomass and
grain yield.
3. To evaluate the impact of biophysical conditions on the performance of the
technology options.
Sites
The demonstrations will be established Kapchesombe, Kaptanya, Chema and
Tegeres sub-counties in Kapchorwa district, in … sub-county in Kabale District and in
Mpungu sub-county in Kanungu District. Demonstrations will be established at parish
level, with a total of 15 demonstrations in Kapchorwa District, … in Kabale District
and … in Kanungu District. The demonstrations will be established on-farm and will
be jointly implemented and managed by researchers and farmers. The
demonstrations will be hosted by a farmer who is willing to lend a sufficient amount of
land for this purpose. All farmers of the parish should be invited to be present at
important phases of the crop cycle (planting, staking, flowering, harvest) to receive
training on agronomic aspects (NaCCRI) and marketing/ post-harvest handling
(VECO/ A2N).

44
Treatment structures
Treatment
Crop Variety Cattle
manure TSP
Staking
method
No of
seeds per
hole
No of
plants per
stake
1 Climbing
bean
Local
Kabale - - Single stakes 2 2
2 Climbing
bean NABE 12C - - Single stakes 2 2
3 Climbing
bean
Local
Kabale + - Single stakes 2 2
4 Climbing
bean NABE 12C + - Single stakes 2 2
5 Climbing
bean
Local
Kabale - + Single stakes 2 2
6 Climbing
bean NABE 12C - + Single stakes 2 2
7 Climbing
bean
Local
Kabale + + Single stakes 2 2
8 Climbing
bean NABE 12C + + Single stakes 2 2
9 Climbing
bean
Local
Kabale + + Tripods 2 2
10 Climbing
bean Nabe 12C + + Tripods 2 2
11 Climbing
bean NABE 12C + +
Half sisal/
half banana
fibre
2 2
IN KAPCHORWA: Four demonstration sites in Chema and Tegeres sub-counties
include a 10th treatment of maize stalks (planted in season 2014A) used as stakes. In
this treatment: plant the beans when maize is reaching physiological maturity (black
layer), or a few weeks before. Plant on the base of the maize, a few cm off, and plant
alternating the rows: plant between row 1 and 2, right and left of the maize plants
respectively, skip one row as alley, plant again between row 3 and 4, in the middle.
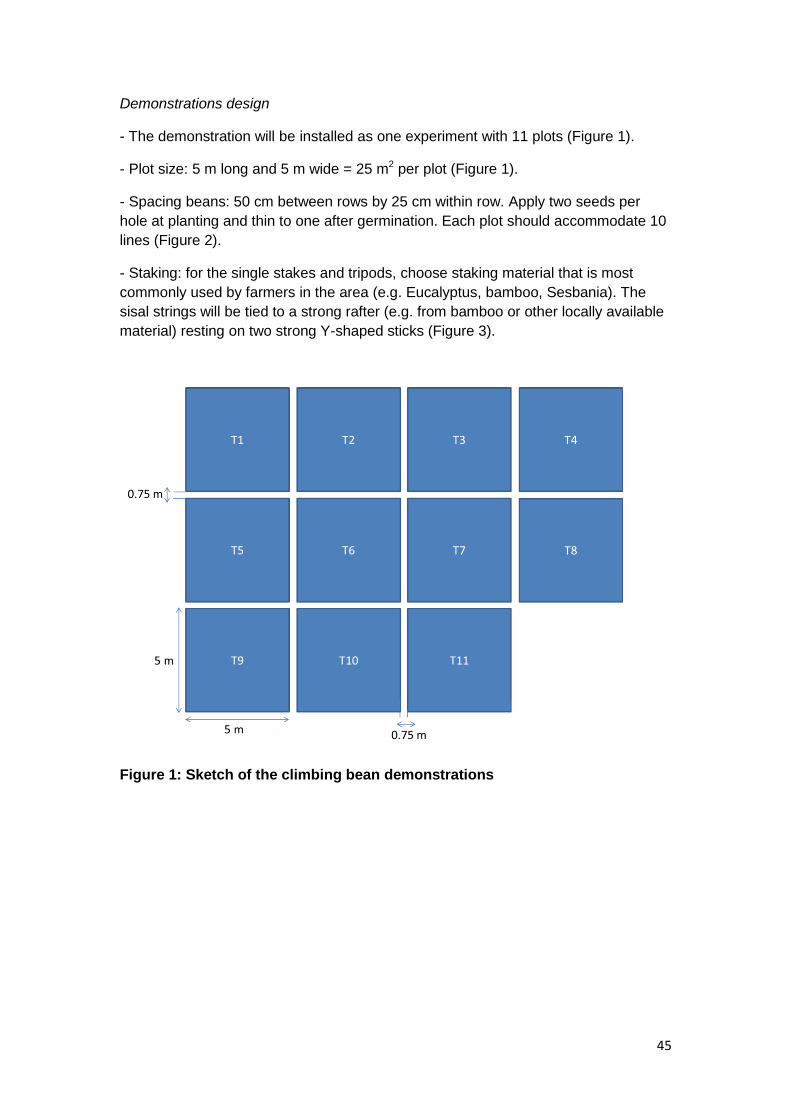
45
Demonstrations design
- The demonstration will be installed as one experiment with 11 plots (Figure 1).
- Plot size: 5 m long and 5 m wide = 25 m2 per plot (Figure 1).
- Spacing beans: 50 cm between rows by 25 cm within row. Apply two seeds per
hole at planting and thin to one after germination. Each plot should accommodate 10
lines (Figure 2).
- Staking: for the single stakes and tripods, choose staking material that is most
commonly used by farmers in the area (e.g. Eucalyptus, bamboo, Sesbania). The
sisal strings will be tied to a strong rafter (e.g. from bamboo or other locally available
material) resting on two strong Y-shaped sticks (Figure 3).
Figure 1: Sketch of the climbing bean demonstrations

46
Figure 2: Sketch of row and plant spacing per plot
Figure 3: Sketch of banana fibre and sisal string staking method. Grey dotted
lines represent the strings. The strings should be placed in between two plants within
each row, so that each string holds two plants.

47
Site selection:
- The demonstration sites should be chosen in a strategic location, which is visible
and accessible for as many people as possible (e.g. a prominent roadside location,
next to a school, etc. But not too close to dusty areas).
- The trial should be laid out on an N-deficient site that is homogenous, does not
have a very steep slope and no indicators for soil degradation (e.g. lots of gravel in
the topsoil).
- We should also avoid areas in inland valleys with potential for water-logging.
- The approximate area needed per demonstration site is approximately 400 m2 (23 *
17 m or 35 * 11 m).
Application of inputs
- Fertilizer rates: TSP will be applied using a rate of 15 kg P per hectare; cattle
manure at a moderate rate of 2 t/ha.
- Fertilizer application: The mineral fertilizers will be banded, 10 cm away from the
planting line, in a 2-cm deep trench and covered after application. Cattle manure will
be broadcasted followed by shallow tillage before planting.
- Weeding: weed the demonstration according to recommended practice.
- Retain some seed to fill gaps as necessary.
Inputs needed per 25 m2 plot
Type of input Amount needed per 25 m2
plot
Seed (var. NABE
12C)
0.25 kg
Seed (var. Kabale
local)
0.20 kg
TSP 0.190 kg
Manure 5 kg

48
Farmer learning:
Farmer learning from the demos at relevant stages during the season should be
facilitated by NARO and VECO designated staff in each area with backstopping
support by a research assistant from Makerere University. A Field Day should be
held to enable all farmers in the area to learn from the demonstrations.
NARO will use its training approach to ensure farmers’ capacity is built to handle
agronomy issues (planting, nutrient input application, weeding, disease and pest
control).
VECO will use its training approach to ensure farmers’ capacity is built to handle
pre- and post-harvest handling (harvesting, storage management and value
addition), and marketing and market linkages i.e. issues along the value chains.
Observations
A separate Field book for demonstration trials will be supplied where the following
information should be registered during the season:
At the front page of the data collection sheet for the demonstrations, include the name of the demonstration and the site in a unique code, for example Bean-Ug-Kan-01. Use this code also for any other observations and measurements. Each demonstration has to have a unique code!
GPS position of the demonstration (decimal degrees)
Initial soil sampling
Rainfall
Planting dates and dates of management practices
Emergence %
Physiological dates (days to flowering, podding, maturity)
Pest and disease scoring
Occurrence of severe drought, flooding or other catastrophic events
Measurements at harvest
Harvesting should be done by NARO staff. It is very important to ask farmers not to
harvest anything during the season. All legumes will be shelled on site at harvest,
with the exception of groundnut. Store (shelled) grain, husks and stover in separate
yield bags that are labelled with the corresponding plot numbers and treatments.
Fresh weight of grain, husks and stover will measured with a precision of two
decimals with a digital hanging scale (to be provided).

49
Appendix II Instructions for planting and harvesting
Instructions for planting and harvesting 1. Selecting the land
Select land big enough to accommodate two plots of 5 by 5 meters.
Make sure the land is even. This means that there are no trees (shade), big rocks, ant/
termite hills or other things on the plot which may influence yield.
2. Preparing the land Prepare the land in the way that you are used to.
3. Laying out two plots
Measure two plots of 5 by 5 meters: 5 meter is approximately 17 feet, so measure 17 feet in
each direction.
Mark the four corners of each plot with a peg so that you can easily recognize the plots.
4. Manure application If you want to apply manure, do this in equal amounts on each of the plots. 5. Sowing the plots

50
You have received two different packs, one for each plot. Keep the packs separate, do not mix the packs!
6. Fertilizer application
Apply the fertilizer at planting.
Place fertilizer in the planting holes/furrows and cover with 2-3 cm soil.
Use the amounts indicated in this table:
Fertilizer
type
Rate
(kg/acre)
In each planting hole, apply
Local spacing (75x75 cm) Spacing 25x50 cm
DAP or TSP
30 1.5 soda bottle-cap
1/3 of a soda bottle-cap
7. Staking and managing the plots
Stake the beans in the way that you prefer or according to the treatment that you have chosen.
Manage the beans in the way that you are used to. 8. Harvesting the plots
Harvest the two plots separately, do not mix the yield!
Harvest the first plot and note down the yield in e.g. kilograms, bags, bowls, or anything that is convenient for you.
Harvest the second plot and not down the yield in the same unit.
Keep the information until someone from the project has come to collect it.

51
Appendix III Fieldbook for focal adaptation trails Field book for focal adaptation trials
Meta-data, farm typology and agronomy questions (Part 1, homestead)
A.1 Name of the person filling the form: _____________________________________________________
A.2 Date when form filled (DD/MM/YYYY): ________ / ________ / ________
A.3 Action site
Country: _________________________________________________________
State / District: _________________________________________________________
LGA / Sector / Ward/ Parish: _________________________________________________________
Village: _________________________________________________________
A.4 GPS coordinates of the homestead (measured at front door) in decimal degrees:
Latitude (North/South):______________________ Longitude (East/West):
__________________________
Altitude:_________________ (meters)
Please provide information on the rainfall data corresponding to this trial
A.17 Has rainfall data been collected? Y _____ N______
Location of closest rain gauge: __________________
collected
y/n
rain gauge identifier
A.17 Rainfall data
collected
Closest
rain
gauge:
Introduce yourself and N2Africa project. Explain purpose of survey and assure the interviewee
of the confidentiality. Make sure to check if the farmer has any questions at this time. Please note that
'you' always refers to the farmer unless indicated otherwise.
A.5 Name of the N2Africa farmer: ___________________________ Name of partner:
____________________
Sex of farmer (tick): Male ___ / Female ___ Age: _______________ years
Phone number of farmer or contact person:________________________________________________

52
Farm ID: ___________________________________________________________ (please assign a unique
ID)
A.6 Did farmer participate in N2Africa demonstrations in previous season(s)?: Yes ___ / No ___
Did farmer fill the Field Book in previous season(s)? Yes___ / No____
If yes, in which season(s)? ________________________ Old Farm ID (look up later)
_____________________
A.8 Is farmer head of the household: Yes ___ / No ___
A.9 If no, head of household is Male ___ / Female ___ and A.10 Age: _______________
years
A.11. Total number of people in the household (i.e. people currently living in the homestead).
Age No. of
females
No. of
males
0 – 16 years
17 – 35
years
35 – 60
years
Over 60
years
A.12. What is the education level of the person with the highest education in the household, and the
education level of the household head? Specify the number of years this education was attended.
(specify number of years, write 0 for none)?
Schooling level Within
household
Household
head

53
1. Primary
2. Secondary
3. Post-secondary
4. University
5. A.15.11 Other,
specify:________________________
C.1 How much arable land do you have available for crop farming (incl. fallow land)?
Area: _____________ Unit: _____________
C.2 Number of valuable livestock species owned by the household
Cattle (no.):_________ Sheep (no.):_________ Goats (no.):__________
Pigs (no.):__________ Poultry (chickens, turkey, etc.) (no.): ___________
Other valuable livestock, type: _________________________ no: _________
type: _________________________ no: _________

54
B.1 Do you hire labour from outside the household to work in your fields? Tick what best
describes your situation:
Tick
1. Yes, permanently (i.e. every year, throughout the cropping season)
2. Yes, regularly (e.g. at peak periods during the cropping season)
3. Yes, sometimes (e.g. not every season or peak period, only if money allows)
4. No, never
B.2 What proportion of your total farm produce (cash and edible crops) is used for home
consumption and what proportion for sale? Tick what best describes your situation:
Tick
1. All produce used for home consumption
2. Most produce used for home consumption, small part used for sale
3. Half of produce used for home consumption, half of produce used for sale
4. Small part used for home consumption, most produce used for sale
5. No produce used for home consumption, all produce used for sale
E.1 In a normal year (not a drought year for instance), which months of the year (if any) do you struggle to
find sufficient food? Please tick the months with food scarcity.
J
a
n
F
e
b
M
a
r
A
p
r
i
l
M
a
y
J
u
n
e
J
u
l
y
A
u
g
S
e
p
O
c
t
N
o
v
D
e
c
Tick the

55
months when you struggle
In months in which you struggle to find sufficient food, are you able to buy sufficient food, or do you
reduce the quantity of food/ number of meals? Tick: buy ______ / reduce quantity/ meals: ______

56
B.3 Importance of agriculture in the household. Please provide an estimate
of the relative importance of different sources of income by dividing the total income
into different portions. Write 0 if type of income does not apply.
Estimated proportion of total
income (in %, make sure the total
equals 100%)
Cropping
Livestock
Casual labour in agriculture
Casual labour off-farm
Trade
Other business
Salaried job
Pension
Remittances
Other_______________________
B.4 Does your household possess any of the items below? Please tick owned items.
tick
tick

57
Bicycle
Tractor
Motorbike
Plough
Car
Ox cart/ donkey cart
Cell phone
Tap (piped) water
Radio
Private well
Television
Electricity
Fridge
Solar Power
Sofa
Generator
House with
tiled roof
and/or
cement/ brick
walls
Any other valuable items not
listed?________________________
Iron sheet
roof
Any other valuable items not
listed?________________________
B.5
Estimated wealth category of household, based on interviewer’s perception, not asked to respondent
(tick)
Very poor: _____ Poor: _____ Medium: _____ Wealthy: _____

58
5.3.1 Questions on agronomy
C.3 How many fields did you crop last season: _____________________
For the fields mentioned above in C.3 (or for the 3 most important ones), please provide the following information related to the previous cropping season. If legumes are grown on another field than these 3, please fill in data on the legume field under field 4. Please pay attention to units.
field 1 field 2 field 3 field 4
D.1 Size (specify unit)
D.2 Walking distance of field from homestead. (in minutes)
D.3 1st most important crop in field
Other crops in field
D.6 Amount of mineral fertilizer applied (0 for none, specify unit!)
D.7 Type of mineral fertilizer
D.8 Organic inputs applied Y/N
D.9 Rhizobium inoculant applied?
Y/N
D.10 Fertility of the field
(good/ moderate/poor)
C.4 For your 3 most important crops, how much do you harvest (per area of land) in a normal year?
crop 1:______________ amount:______ unit: _________ area of land:______ unit: _________
crop 2:______________ amount:______ unit: _________area of land:______ unit: _________
crop 3:______________ amount:______ unit: _________ area of land:______ unit:_________

59
5.3.2 Information on the N2Africa package received by the farmer and on the field where the package
was planted.
D.27 Which legume package did you receive? _____________________________________________
Did you plant the legume that you received? Yes___ No____
Did you use all the provided inputs for this legume? Yes___ No____
In case you did not plant the legume or did not use the inputs, what did you do?
________________________________________________________________________________________
________________________________________________________________________________________
____ What was the reason for not planting the legume or using the inputs?
________________________________________________________________________________________
___________________________________________________________________________________
D.28 We would like to know if the technologies offered in the N2Africa package were new to you, or if you
already used some of these technologies before. Please tick the items in the table which were new to you.
Part of package Tick if this was
new
Legume species
Legume variety
Use of mineral fertilizer in this legume
Inoculant
Other ___________
Other ___________
5.3.3 Inoculation
I.3 Did you inoculate any legume in your N2Africa field ? Yes ___ /No ___
If yes, please answer the following questions:
I.4 Was the inoculant stored at the farm before applying? (Y/N) ___
If yes, how was it stored? _______________________________________________
If yes, for how long (days/weeks/months) was it stored before use? _____ days _____ weeks ______
months
I.5 How many minutes/hours/days passed between mixing seed with inoculants and planting the seed?
_________ minutes _________ days _________ hours

60
A.14 If the field with the N2Africa trial was described in part 1, please provide the field number ______
Please record the crops that were cultivated previously in the field where the N2Africa trial is now planted.
Also record the inputs that were used. Do this for the previous season (1 season ago) and the season before
the previous season (2 seasons ago).
Previous season Season before previous season
D.18 Crop(s)
grown in
N2Africa plot
(in order of
importance)
Crop 1: Crop 1:
Crop 2: Crop 2:
Crop 3: Crop 3:
D.19 Mineral
fertilizers
used
(put "none" if
none was
used)
Type: Type:
D.20 Organic
inputs used
(put "none" if
none was
used)
Type: Type:
D.21
Inoculants
used
(put "none" if
none was
used)
Type: Type:
5.3.4 Problems experienced during the growing season on the N2Africa field
D.23 Please tick whether the problems listed in the table were absent / mild / moderate / severe. Also
record any other problems that occurred.
Problem absent mild moderate severe
drought
water logging
storm/hail
pests
weeds
disease
Other_______

61
Other_______
D.24 If weed/pest/disease problems were reported, provide the following information (if known):
Type of pest ______________________
Type of disease ____________________
Type of weeds _____________________
5.3.5 Observations during the growing season - Cropping calendar of N2Africa field
Please fill in the dates at which the following events occurred (if applicable)
D.22 Activity Date
1. Date of land
preparation
2. Date of organic
manure application
3. Date of planting
4. Date of mineral
fertiliser application
5. Date of 1st weeding
6. Date of 2nd weeding
7. Date of 3rd weeding
8. Drought period/dry
spell (from-to) From: To:
9. Start water
logging/flooding
10. Storm damage
11. Frost
12. Start pest/disease
13. 50% flowering
14. 50% maturity
15. Date of (final) harvest

62
Field book for focal adaptation trials
Information and observations on N2Africa experiment (Part 2, field)
With this part of the survey we aim to gain in depth knowledge on the adaptation
trials. This part of the survey requires two visits: one field visit to check the plots before harvest and one
visit to measure the grain yield after the farmer has harvested the plots. Instruct the farmer to harvest the
two entire plots and to keep the harvest of the two plots separate. The harvest should be stored in two
separate bags/ bowls/ etc. with clear labels until you (the technician) come back to measure the harvest.
Stress the importance of not mixing harvest from the two plots and not consuming or selling it before it
has been measured!
Some sections of this survey need to be filled in by you, the researcher or technician, rather than being
asked to the farmer. This is always indicated with ‘by researcher/technician’. In other parts of the survey,
‘you’ refers to the farmer.
General - By researcher/technician
A.13 Kindly record the name of the researcher/ technician responsible for this part of the Field Book
(contact person)
Date Name Organisation Phone number
5.3.6 Description of N2Africa adaptation experiment - By researcher/technician
Please provide an informative experiment ID for this adaptation trial (for example:
Nig_cowpea_input_001):
I.1 _Ug_CB_Kap________________________________________________________________
Please write down the names of the two treatments provided with the package and give a brief description
of each treatment. We will use the treatment names to identify the two plots throughout the field book.
I.2 Treatment name* Brief description**
Treatment
1 (Control) Nabe 12C Climbing beans, variety Nabe 12C (250 grams)
Treatment
2 Nabe 12C + TSP Climbing beans, variety Nabe 12C (250 grams)
with TSP fertilizer (190 grams)
5.3.7 *Provide a name for the treatments in the package. For example: soybean+inoc,
cowpea_local+SSP or cowpea_improved+SSP, **For example: soybean TGX 1448-2E with SSP
and inoculant
Information on the N2Africa experimental field 1 - To be measured and filled in by researcher/technician
A.15 GPS coordinates N2Africa field (recorded in the middle of the field in decimal degrees):
Latitude (North/South):______________________ Longitude (East/West):
__________________________
Altitude:_________________ (meters)

63
D.29 Did the farmer plant two clearly distinguishable plots with two different treatments? Yes___ No____
I.8 Please measure the width, length and number of rows of the two treatment plots
Treatment name Width of harvested plot (m)
Length of harvested
plot
(m)
Number of rows in plot
(if applicable)
Treatment 1*
_________________
Treatment 2*
_________________
D.11 Slope of the field (tick): 1) flat ___ 2) Moderate ___ 3) steep___
D.12 Position of field in the landscape (tick): 1) plains ___ 2) valley bottom ___
3) foot slope ___ 4) slope ___ 5) plateau ___
Please measure soil depth at three points in the field. You can measure soil depth with a thin metal stick: a
soil probe. Please measure how deep you can push the soil probe into the soil until hitting a hard pan.
Record the measured depths (up to 0.5m).
D.13 Soil depth (in cm, up to 0.5 m): point 1_______ point 2_______ point 3_______ cm
Information on the N2Africa experimental field 2 – To be answered by the farmer
D.14 Ownership of N2Africa field (tick): 1) Family land ______ 2) Hired land ______ 3) Other ______
(specify other):________________________________________________
D.15 Farmer Perception of soil fertility in N2Africa field (tick):
1) Poor ____ 3) Moderate ____ 4) Fertile _____
D.16 Compared to most other fields of the farm the soil fertility in the N2Africa field is (tick):
1) Poorer ____ 2) The same ____ 3) Better ____
D.17 The drainage of the N2Africa field is (tick):
1) Good ___ 2) Moderate ___ 3) Poor___

64
5.3.8 Description of treatments as laid out in the fields - To be answered by the farmer
I.12 Please indicate for both treatments which inputs you used. In case you installed only one treatment (and planted one plot), fill in the tables for treatment 1 only.
Mineral fertilizer
Inocula
nt
Organi
c
fertilize
r
(manur
e,
compo
st, crop
residue
s)
Herbici
de
Pestici
de
Othe
r
input
Appli
ed
(y/n)
Ty
pe
Amou
nt
(kg/pl
ot)
Used
(y/n)
(y/n) (y/n) (y/n) Pleas
e
speci
fy
Treatment 1*
______________
___
Reason you used
this input?
Treatment 2*
______________
__

65
Reason you used
this input?**
*Please write down the treatment name as specified above
**When the farmer used the same input in both treatments, you don’t have to ask for the reason twice.

66
I.13 Please indicate how you planted the two treatments.
No. of
plants
per stake
Stake
density
Staking
method
Staking
material
Measure
the
length of
10 stakes
Count
no. of
stakes in
2 rows
or on
2x2 m
(in case
of
broadc.)
Single,
tripods,
strings or
other
(describe
&
picture!)
Treatment 1*
__________________
Measured
and
according
to farmer
Reason you did this?
Which
means
to get
stakes,
stake in
time?
Why
delays?
Ever seen
or tried
other
method,
why
(not)?
Why this
material? Where from? Costs
per bundle of … stakes
Do you
ever
select
stakes on
their
length?
Treatment 2*

67
__________________
Reason you did this?**
*Please write down the treatment name as specified above
**When the farmer used the same input in both treatments, you don’t have to ask for the reason twice.

68
Farmer assessment of N2Africa experimental treatments
In this part we would like to get your (the farmer’s) opinion on the two treatments. We would like you to give a score for each treatment. This score is represented by circles, which can be coloured to indicate the score (alternatively, the farmer could get 10 stones or coffee beans to score). 10 circles represent the best score.
What is your score for Treatment 1?:
Please explain why you give this score:
___________________________________________________________________________________
___________________________________________________________________________________
___________________________________________________________________________________
_____________________
What is your score for Treatment 2?:
Please explain why you give this score:
___________________________________________________________________________________
___________________________________________________________________________________
___________________________________________________________________________________
_____________________
We would also like to know how the two treatments compare to your previous experiences in case you cultivated this legume before. Please score your previous experience from 1 to 10, with 10 being the best score.
What is your score for your previous experiences with this legume?
Please explain why you give this score:
___________________________________________________________________________________
___________________________________________________________________________________
___________________________________________________________________________________
_____________________

69
We would also like to get your opinion on the two treatments on a few specific criteria: yield, labour, costs, weeds and pests/diseases. Again, we would also like you to score your previous experience with growing this legume in case you have cultivated this legume before. Please use the following scale:
1. Very bad 2. Bad 3. Average 4. Good 5. Very good
I.14
Treatment 1
________________
Treatment 2
________________
Own practice
Yield
Labour demand
Costs of inputs
Weeds
Pests/ diseases
Other, specify:
D.25 Are there any elements (e.g. varieties, inputs, practices) of the trial you would like to use yourself next season? If yes, please describe them: _________________________________________________________________________________________________________________________________________________________________________________________________________________________________
Is there anything from the trial that you would like to improve? If yes, please describe what:
___________________________________________________________________________________
___________________________________________________________________________________
___________________________________________________________
Do you have any other comments or suggestions?
___________________________________________________________________________________
___________________________________________________________________________________
___________________________________________________________________________________
___

70
5.3.9 Harvest estimation by farmer
I.15 Please record the farmers’s own estimate of yield before measuring the harvest. Ask the
farmer if he/she already consumed or sold part of the harvest, and record the amount in case he/she
did.
Treatment name Yield
as
estima
ted by
the
farmer
(in
units
of
prefer
ence)
Please specify
the unit used
Amount of crop consumed/sold
(if applica
ble)
Treatment 1*
______________
____
Treatment 2*
______________
____
D.30 What is the farmer’s explanation for the observed difference or lack of difference in yield?
___________________________________________________________________________________
___________________________________________________________________________________
___________________________________________________________

71
5.3.10 Harvest measurement- By researcher/technician
A.18Please fill in the name of the technician(s)/researchers responsible for measuring the harvest
Date Name Organisation
I.8 Please measure the harvest of the two plots and record the weights with a precision of 10g (two
decimals on a digital scale). In case of intercropping, record the legume yield only.
Treatment name Grain weight (Kg) in case of
shelled grain
Pod weight
(Kg) in case of
unshelled grain
Treatment 1*
__________________
Treatment 2*
__________________
D.26. Observations during/after harvest (please provide any relevant information on the trial that you
(researcher/ technician) would like to add)
___________________________________________________________________________________
___________________________________________________________________________________
___________________________________________________________________________________
___________________________________________________

72
Copyright © 2022 FDOKUMEN