
Understanding fire patterns and fire drivers for setting a sustainable management policy of the...
46
Curt et al. | Fires and management in New Caledonia 1 Understanding fire patterns and fire drivers for setting a sustainable 1 management policy of the New-Caledonian biodiversity hotspot 2 3 4 5 Thomas Curt 1 , Laurent Borgniet 1 , Thomas Ibanez 2,3 , Vincent Moron 4,5 , Christelle Hély 6 6 7 1 Irstea, UR EMAX, 3275 route Cézanne, F13182 Aix-en-Provence, France 8 2 Cerege - Centre Européen de Recherche et d‘Enseignement des Géosciences de l‘Environnement , 9 Europôle Méditerranéen de l‘Arbois, 13545 Aix en Provence, France 10 3 Current address IAC – Institut Agronomique néo-Calédonien (IAC), Diversité biologique et 11 fonctionnelle des écosystèmes terrestres, BPA5, 98848 Nouméa, New Caledonia. 12 4 Aix-Marseille Université, Aix en Provence, France 13 5 IRI, Columbia University, Palisades 10964, USA 14 6 Paléoenvironnements et Chronoécologie (PALECO- EPHE) - UMR 5059, Centre de Bio- 15 Archéologie et d‘Ecologie, Institut de botanique - 163, rue Auguste Broussonet - 34090 Montpellier, 16 France 17 18 19 20 Corresponding Author: [email protected] 21 22 23 24 *Manuscript Click here to view linked References
-
Upload
independent -
Category
Documents
-
view
7 -
download
0
Transcript of Understanding fire patterns and fire drivers for setting a sustainable management policy of the...
Curt et al. | Fires and management in New Caledonia
1
Understanding fire patterns and fire drivers for setting a sustainable 1
management policy of the New-Caledonian biodiversity hotspot 2
3
4
5
Thomas Curt 1, Laurent Borgniet
1, Thomas Ibanez
2,3, Vincent Moron
4,5, Christelle Hély
6 6
7
1 Irstea, UR EMAX, 3275 route Cézanne, F13182 Aix-en-Provence, France 8
2 Cerege - Centre Européen de Recherche et d‘Enseignement des Géosciences de l‘Environnement, 9
Europôle Méditerranéen de l‘Arbois, 13545 Aix en Provence, France 10
3 Current address IAC – Institut Agronomique néo-Calédonien (IAC), Diversité biologique et 11
fonctionnelle des écosystèmes terrestres, BPA5, 98848 Nouméa, New Caledonia. 12
4 Aix-Marseille Université, Aix en Provence, France 13
5 IRI, Columbia University, Palisades 10964, USA 14
6 Paléoenvironnements et Chronoécologie (PALECO- EPHE) - UMR 5059, Centre de Bio-15
Archéologie et d‘Ecologie, Institut de botanique - 163, rue Auguste Broussonet - 34090 Montpellier, 16
France 17
18
19
20
Corresponding Author: [email protected] 21
22
23
24
*ManuscriptClick here to view linked References

Curt et al. | Fires and management in New Caledonia
2
ABSTRACT 25
New Caledonia (NC) is a biodiversity hotspot sheltering terrestrial ecosystems of high 26
ecological and conservation value including tropical dry forests, rainforests, and maquis. 27
However, uncontrolled bushfires threaten this exceptional biodiversity. A science-based fire 28
management policy could reduce the impact of unwanted fires and help facing climate 29
change. However, to date, data on the location, extent, causal factors and spatial patterns of 30
fires had not been collected. We compiled a 12-year-long (1999-2011) spatially-explicit fire 31
database for NC using MODIS and Landsat data. Using boosted regression trees we 32
disentangled the role of anthropogenic factors, physiography, weather and vegetation on fire 33
activity. We also characterized the location of fires and the vegetation composition at the fire 34
edges, in order to determine which ecosystems were especially vulnerable. Fire size 35
distribution was typically asymmetric with many small fires (< 10 ha) and very few large fires 36
(> 500 ha). Ignitions were preferentially located close to villages, cities or roads, at low 37
elevation and linked to high values of fire weather index. Fires were larger at the end of the 38
dry season and during El Niño events. Most fires were bushfires burning in savannas, thickets 39
and maquis, while rainforests were rather ‗avoided‘ by fire. However, bushfires generally 40
propagated towards forests of high-conservation value, thus increasing the potential for forest 41
edge erosion. As savanna-forest and maquis-forest mosaics are dominant in the landscape, we 42
discuss the extent to which NC could become a ‗fire trap‘ where fire cannot be easily 43
extirpated. Based on our spatially-explicit information on fire activity, we make 44
recommendations for a sustainable forest and fire management policy which would balance 45
the traditional use of fire and the conservation of the most valuable ecosystems. In particular, 46
it may help by reducing the damages of large and destructive bushfires ignited during drought 47
peaks. 48
Keywords: New Caledonia, dry forest, rainforest, savanna, maquis, fire hazard, forest 49
management policy, biodiversity conservation 50
Curt et al. | Fires and management in New Caledonia
3
51
Introduction 52
53
New Caledonia (NC, southwest Pacific, -21°S, 165°E) has long been recognized as a 54
remarkable biodiversity hotspot (Myers, 1988; Myers et al., 2000; Mittermeier et al., 2004) 55
harboring terrestrial ecosystems of high ecological and conservation value (Jaffré et al., 56
1998), encompassing tropical dry forests, rainforests, and maquis (shrublands). About 75% of 57
the 3,371 plant species of NC are endemic (Morat et al., 2012). However, fires and other 58
disturbances have destroyed more than 50% of the original vegetation existing before the 59
Melanesian settlement (ca. 3000 BP). Original rainforest, dry forest and maquis have been 60
partly converted into secondary vegetation, mainly savannas, secondary thickets and maquis 61
(Jaffré et al., 1998). Nowadays, a major concern is to what extent the present fire regime may 62
threaten this exceptional flora (Jaffré et al., 1998; Pascal et al., 2008) because 25% of the 63
species are estimated to be at risk (IUCN, 2011). It is acknowledged worldwide that science-64
based fire management policies can reduce the impact of unwanted fires and help facing 65
climate change and uncertainties (e.g. FAO 2007; van Wilgen et al., 2014). However, to date, 66
no georeferenced database exists in NC and fire distribution, drivers and impacts on 67
ecosystems are poorly known. 68
69
Fire has driven vegetation dynamics for millennia in NC as in many tropical countries 70
(Cochrane 2003; Bond 2005) because it is both a natural disturbance and a management tool. 71
Palaeoecological records suggest that fires occurred long before the human settlement of NC 72
(ca. 3000 BP, Hope and Paske, 1998; Stevenson, 2004), with alternating periods of drought 73
with more frequent fires promoting the expansion of shrubland (so-called maquis) on 74
ultramafic rocks, and wetter periods with few fires characterized by rainforest expansion and 75
Curt et al. | Fires and management in New Caledonia
4
the establishment of secondary forest (McCoy et al., 1999). The increase of fires since 76
settlement of humans had major implications for the landscape of NC. First, it coincided with 77
the sudden expansion of savannas (McCoy et al., 1999; Stevenson, 2004). Savannas, probably 78
maintained by fire and grazing, currently cover 30% of NC and have replaced large areas of 79
dry forest and rainforest (Gillespie and Jaffré, 2003; Ibanez et al. 2013). Second, on the 80
ultramafic substratum, wildfires combined with forest explotation and mining has led to the 81
replacement of most original forests by secondary forests (Jaffre et al., 2010) and shrubby 82
vegetation in recent decades. Presently, fires threaten some endemic conifer species (Perry 83
and Enright, 2002; Jaffre et al., 2010) but also species typical of the dry forest (Bocquet et al., 84
2007). In this context, bushfires (i.e. fires originating in grasses, maquis, thickets or secondary 85
forests) constitute one of the main threats to NC biodiversity in the future (Jaffré et al., 1998; 86
Pascal et al. 2008). Indeed, large and uncontrolled bushfires such at the Montagne des Sources 87
(December, 2005) can burn thousands of hectares of maquis and forests. This has dramatically 88
increased the concerns of decision-makers about biodiversity conservation, as the ongoing 89
climate change could also increase fire activity (Leblon, 2005). 90
91
In this context, it was increasingly urgent to collect accurate and extensive data on 92
recent fires in NC to focus fire management efforts on the most valuable ecosystems that are 93
at risk. Until now, the exact boundaries of most fires were unknown and limited information 94
about fires has come from time-consuming studies of fire scars on trees (e.g. McCoy et al., 95
1999) and contemporary newspaper reports (e.g. Chevalier, 1996). Burned areas and fire 96
hotspot datasets now available from satellite observations (such as MODIS; Roy et al., 2008) 97
and Landsat provide information at short time intervals and offer data to characterize fire 98
patterns. Characterizing the major causes and locations of fire ignitions, as well as the extent, 99
pattern and location of burned areas are key issues for the long-term management and 100
Curt et al. | Fires and management in New Caledonia
5
conservation of many types of ecosystems throughout the world (e.g. Bergeron et al., 2002; 101
Keeley, 2002; Andersen et al., 2005; Bond, 2005). Actually, the spatial pattern of fires in the 102
landscape results from interactions between several top-down and bottom-up factors which 103
drive fire ignition and fire spread (Falk et al., 2007). They include anthropogenic drivers 104
(ignitions, fire prevention and fire suppression) and biophysical factors such as fire weather, 105
vegetation, and topography (e.g. Rothermel, 1983; Badia-Perpinya and Pallares-Barbera, 106
2006; Moreira et al., 2011). In NC fire ignition is predominant due to human activity (Perry 107
and Enright, 2002), and lightning fires are rare as in many tropical areas (Stott, 2000; 108
Cochrane, 2003). Anthropogenic fires are started for a variety of reasons including range 109
management, land clearance for cultivation, hunting and combating wild pigs, controlling 110
weeds, limiting the populations of the invasive little fire ant Wasmannia auropunctata, and as 111
a result of social conflicts (Udo, 2011; Dumas et al., 2013). It is likely that large fires may 112
result from ignitions by livestock breeders in grasslands to eliminate invading shrubs and 113
trees, while most small fires in mountainous areas may be lit for cultivation purpose. Some 114
fires may get out of control and become very large particularly when lit during prolonged or 115
intense dry spells, on steep slopes, in areas difficult to access, or when firefighting resources 116
are overwhelmed. Many studies worldwide have shown the ‗preference‘ or the ‗avoidance‘ of 117
fires for certain types of vegetation or certain topographic features (Viedma et al. 2009; 118
synthesis In Moreira et al. 2011). This selectivity results from the non-random location of 119
anthropogenic ignitions and from the local variations of physiography, fire weather, and 120
vegetation‘s composition and moisture content (Verbesselt et al. 2002; Leblon, 2005). 121
Assessing the drivers of and the spatial pattern of ignitions is crucial for fire prevention and 122
pre-positioning of firefighters, while assessing the drivers of burned areas has implications for 123
fire suppression and adapting land management practices. 124
125
Curt et al. | Fires and management in New Caledonia
6
In this study we constructed the first georeferenced fire database for NC (1999-2011) 126
using several remote sensing sources (MODIS, Landsat). We also collected georeferenced 127
information on anthropogenic and environmental drivers, and on fire weather. Using these 128
databases, we characterized the spatial and seasonal pattern of fires and we identified which 129
factors explained the ignitions versus the extent of burned areas. We finally sought to 130
determine the extent to which NC forests of high ecological and conservation value were 131
affected by bushfires ignited in flammable secondary vegetation (savannas, maquis and 132
thickets) by analyzing the contacts between those vegetation types along the fire edges. Our 133
final goal is to help improve the present fire management policy for biodiversity conservation. 134
135
136
137
Materials and Methods 138
139
Study area 140
141
New Caledonia is an archipelago of ca 18,500 km2 located in the southwest Pacific (21°30 S, 142
165°30 E); it has a subtropical oceanic climate with a mean air temperature of 23°C 143
(Caudmont and Maitrepierre, 2006). Mean annual rainfall ranges from 850 to 4500 mm, with 144
considerable spatial variation: the windward east coast is much wetter than the leeward west 145
coast. Temperatures and rainfall also vary seasonally, with a dry season from mid-August to 146
mid-December, which corresponds to the main period for bushfires (Barbero et al., 2011), and 147
a cool season from June to September. NC is under the influence of the El Niño Southern 148
Oscillation (ENSO) phenomenon (Ropelewski and Halpert, 1987; Nicet and Delcroix, 2000), 149
which has a strong impact on spatial and interannual climate variability: rainfall decreases to 150
Curt et al. | Fires and management in New Caledonia
7
less than 50% of its usual value during El Niño episodes, especially ―Central Pacific‖ events, 151
when anomalous positive sea surface temperature anomalies (SSTA) peak around the 152
dateline, while humid La Niña episodes reduce fire occurrence (Barbero et al., 2011). Trade 153
winds from south-east are predominant, and strong winds (> 8 m.s-1
) occur frequently and 154
favour the spread of fire (Caudmont and Maitrepierre, 2006). 155
156
The main island of New Caledonia (The Grande Terre) has an elongated central 157
mountain range with peaks at 700-1100 m a.s.l. (Fig. 1C) including two peaks higher than 158
1600 m, located close to the windward eastern coast. A major contrast exists with respect to 159
the soils, which are ultramafic or volcano-sedimentary. Ultramafic soils are nutrient-poor and 160
contain nickel at toxic concentration, with local iron crusts (McCoy et al., 1999) and they are 161
covered by the rainforest and the ultramafic maquis. Volcano-sedimentary soils are generally 162
richer in nutrients and more suitable for plant growth; they are covered with thickets, 163
savannas and rainforests (Fig. 1A). 164
165
Savannas, ultramafic maquis and secondary thickets represent the predominant 166
vegetation types, covering ca. 67% of the main NC island (source: Land Cover map of New 167
Caledonia, DTSI 2008; Table 1). The NC dry forests ecoregion contains only 240 small forest 168
fragments with 337 native plant species and it covers less than 10,000 ha in 2010 (ca. 1% of 169
the original forest area ; Jaffre et al., 1998; Gillespie and Jaffre, 2003). This dramatic 170
contraction has been attributed for the most part to uncontrolled fires ignited for range 171
management. Dry forest is the most vulnerable ecosystem of NC and should be the focus of 172
the greatest conservation efforts (Jaffré et al., 1998; Gillespie et al., 2014) because it is often 173
used as private rangelands. Rainforests cover about 400,000 ha and are especially species-rich 174
(2106 vascular species with 83.2% of them endemic) but they are progressively being 175
Curt et al. | Fires and management in New Caledonia
8
replaced by anthropogenic systems such as savannas at low and middle elevations. Rainforest 176
has increasingly become restricted to high elevation or inaccessible areas (Jaffré et al. 1994; 177
Jaffré et al. 1998; Ibanez et al., 2013). It is mainly located at high elevation along the central 178
main mountain ridge, and at lower elevation in wet talwegs (i.e. valley bottoms). Maquis is 179
the most common native vegetation type, covering about 600,000 ha (Jaffré et al., 1998) on 180
ultramafic substratum; the vegetation is dominated by sclerophyllous, slow-growing and 181
small-stature plants (Jaffré et al., 1998). The maquis may be replaced by a para-forested 182
vegetation dominated by the flammable species Gymnostoma deplancheanum (McCoy et al., 183
1999). Savannas and thickets constitute the other main vegetation type (about 800,000 ha) but 184
they have lower conservation value (i.e. 366 vascular species with only 15% endemic). 185
Savannas are often used for cattle, game or cultivation. This vegetation type is mostly 186
dominated by exotic grasses and shrubs (e.g. Melinis, Ocimum, Guava, Lantana, Leucaena) 187
and the native fire-resistant tree Melaleuca quinquenervia. In total, the edges (or ecotones) 188
between savannas, thickets and maquis, and the high-conservation value forests (i.e. rainforest 189
and dry forest) represent 54% of the whole area of contact between different vegetation types 190
in NC. 191
192
193
Fire data and fire contours 194
195
The contemporary fire history of NC is poorly known. In the 1870s, fire frequency increased 196
in association with vegetation clearance, prospecting, mining and logging of forest trees 197
(Chevalier, 1996). More recently, fire peaks have been reported between 1910-1960 and in 198
1971, due to wood-burning steam trains and extensive fires (Chevalier, 1996; McCoy et al., 199
1999). Because of the short duration of the period studied (12 years) imposed by the MODIS 200
Curt et al. | Fires and management in New Caledonia
9
sensor (Giglio et al., 2006) we focused here on the spatial patterns of fires rather than on the 201
temporal variations in the fire regime, which require multidecadal data (Curt et al., 2013). We 202
surveyed fires extensively from 1999 to 2011 using a set of satellite images embedded at 203
several spatial scales. Three products were available for the whole period: 204
205
(i) Active fire data based on the Terra-Aqua Moderate Resolution Imaging 206
Spectroradiometer (MODIS, resolution 250 m) (i.e. Giglio et al., 2006; Roy et al., 2008), 207
which reports active fires during the satellite overpass. MODIS achieves complete global 208
coverage twice a day. It allowed us to detect 1387 hotspots during the 1999-2011 period, this 209
number being partially biased by artifacts such as cities, mines or clouds. A filtering 210
algorithm was used to remove double counts of the same fire, defined as covering an area 211
larger than one pixel (1 km2) and also appearing on two successive images. This algorithm 212
allowed us to identify distinct fires and to determine their duration; 213
(ii) NDII (Normalized Difference Infrared Index) time series (see Dasgupta et al., 214
2007) based on MODIS data at a resolution of 250 m (the MOD13Q1 product) in which the 215
extent of burned areas was characterized using the 16-day MODIS product (250 m 216
resolution). Indeed, NDII combines near-infrared and short wave near-infrared bands and 217
their sum relates to the canopy water content (Hunt et al., 2011); this has been used to map 218
fire scars in a number of ecosystem types (e.g. Numata et al., 2011); 219
(iii) A Landsat time series was used to detect the smallest fires and to cross-check fire 220
boundaries at a 30-m spatial resolution. For this, we used 39 Landsat 7 ETM images from 221
1999 to 2010 to which geometric and radiometric corrections were applied. Among the 1387 222
active fire hotspots, 583 were confirmed as wildfires based on an analysis of the NDVI 223
extracted from Landsat. Finally, we created a map of 583 fires allowing us to determine the 224
fire size and spatial patterns such as shape. Only fires larger than ca 2 ha were detected and 225
Curt et al. | Fires and management in New Caledonia
10
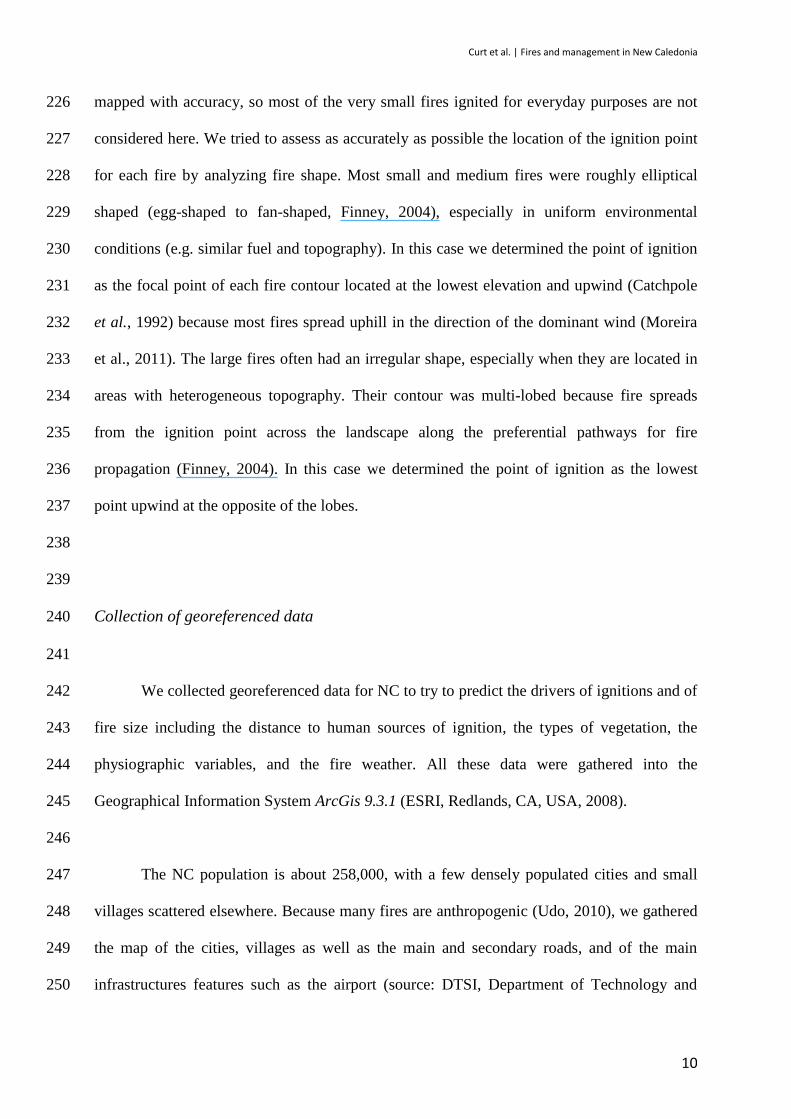
mapped with accuracy, so most of the very small fires ignited for everyday purposes are not 226
considered here. We tried to assess as accurately as possible the location of the ignition point 227
for each fire by analyzing fire shape. Most small and medium fires were roughly elliptical 228
shaped (egg-shaped to fan-shaped, Finney, 2004), especially in uniform environmental 229
conditions (e.g. similar fuel and topography). In this case we determined the point of ignition 230
as the focal point of each fire contour located at the lowest elevation and upwind (Catchpole 231
et al., 1992) because most fires spread uphill in the direction of the dominant wind (Moreira 232
et al., 2011). The large fires often had an irregular shape, especially when they are located in 233
areas with heterogeneous topography. Their contour was multi-lobed because fire spreads 234
from the ignition point across the landscape along the preferential pathways for fire 235
propagation (Finney, 2004). In this case we determined the point of ignition as the lowest 236
point upwind at the opposite of the lobes. 237
238
239
Collection of georeferenced data 240
241
We collected georeferenced data for NC to try to predict the drivers of ignitions and of 242
fire size including the distance to human sources of ignition, the types of vegetation, the 243
physiographic variables, and the fire weather. All these data were gathered into the 244
Geographical Information System ArcGis 9.3.1 (ESRI, Redlands, CA, USA, 2008). 245
246
The NC population is about 258,000, with a few densely populated cities and small 247
villages scattered elsewhere. Because many fires are anthropogenic (Udo, 2010), we gathered 248
the map of the cities, villages as well as the main and secondary roads, and of the main 249
infrastructures features such as the airport (source: DTSI, Department of Technology and 250
Curt et al. | Fires and management in New Caledonia
11
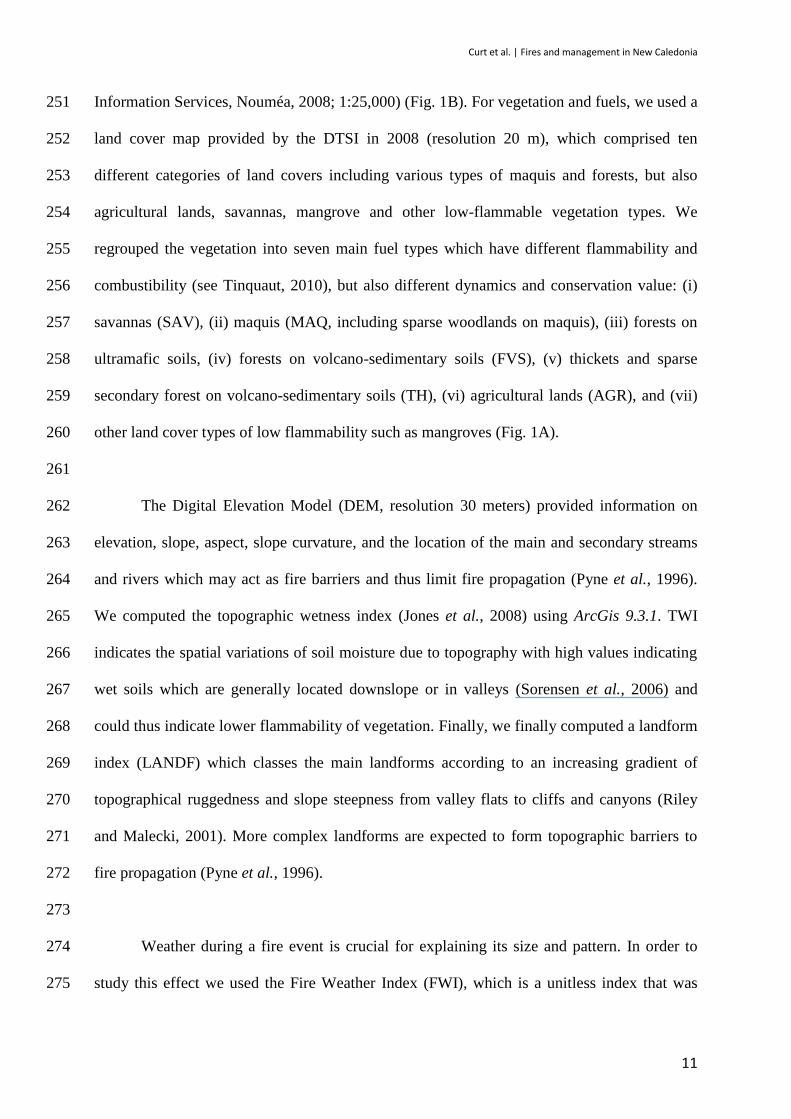
Information Services, Nouméa, 2008; 1:25,000) (Fig. 1B). For vegetation and fuels, we used a 251
land cover map provided by the DTSI in 2008 (resolution 20 m), which comprised ten 252
different categories of land covers including various types of maquis and forests, but also 253
agricultural lands, savannas, mangrove and other low-flammable vegetation types. We 254
regrouped the vegetation into seven main fuel types which have different flammability and 255
combustibility (see Tinquaut, 2010), but also different dynamics and conservation value: (i) 256
savannas (SAV), (ii) maquis (MAQ, including sparse woodlands on maquis), (iii) forests on 257
ultramafic soils, (iv) forests on volcano-sedimentary soils (FVS), (v) thickets and sparse 258
secondary forest on volcano-sedimentary soils (TH), (vi) agricultural lands (AGR), and (vii) 259
other land cover types of low flammability such as mangroves (Fig. 1A). 260
261
The Digital Elevation Model (DEM, resolution 30 meters) provided information on 262
elevation, slope, aspect, slope curvature, and the location of the main and secondary streams 263
and rivers which may act as fire barriers and thus limit fire propagation (Pyne et al., 1996). 264
We computed the topographic wetness index (Jones et al., 2008) using ArcGis 9.3.1. TWI 265
indicates the spatial variations of soil moisture due to topography with high values indicating 266
wet soils which are generally located downslope or in valleys (Sorensen et al., 2006) and 267
could thus indicate lower flammability of vegetation. Finally, we finally computed a landform 268
index (LANDF) which classes the main landforms according to an increasing gradient of 269
topographical ruggedness and slope steepness from valley flats to cliffs and canyons (Riley 270
and Malecki, 2001). More complex landforms are expected to form topographic barriers to 271
fire propagation (Pyne et al., 1996). 272
273
Weather during a fire event is crucial for explaining its size and pattern. In order to 274
study this effect we used the Fire Weather Index (FWI), which is a unitless index that was 275
Curt et al. | Fires and management in New Caledonia
12
designed originally to forecast fire risk in Canada on the basis of past and current weather 276
conditions (van Wagner, 1987) including air temperature and relative humidity, surface wind 277
speed, and rainfall in the past 24 hours. It provides a uniform, numeric method of rating fire 278
danger throughout an area and has been used in the tropics (e.g. in Malaysia and Indonesia, 279
Dymond et al., 2004; Groot et al., 2007). The FWI aims to predict the probability and ease of 280
ignition and propagation of a fire on the forest floor, taking into account the weather 281
conditions. High FWI values indicate high fire danger (maximal value is ca. 100). In this 282
study FWI was computed daily for 14 weather stations in NC from which all necessary 283
weather variables were available (see Barbero et al., 2011), in order to test the effect of 284
weather on fire extent. Each fire was assigned the corresponding daily FWI value computed 285
for the nearest station. For fires that burned during several days (5% of the database) the FWI 286
value was computed as the mean of the daily values. The mean FWI value (± standard error) 287
for the days with fire activity was 13.6 ± 13. A considerable variation existed between the dry 288
western coast (20 ± 11) and the wet eastern coast and the central mountain chain (7 ± 4). 289
290
291
Analysis of fire and landscape patterning 292
293
We calculated the area and the length-perimeter ratio for each fire contour, using the Fragstats 294
software (McGarigal et al., 2002). Comparisons between fires frequency or fire size and the 295
different vegetation types were undertaken using analysis of variance (ANOVA) with the 296
Fisher Least Significant Difference (LSD) test when there was variance homogeneity, and the 297
non-parametric Kruskal-Wallis test when variances were unequal. 298
299
Curt et al. | Fires and management in New Caledonia
13
The distribution of the fire sizes was analyzed using the Lorenz curve and the Gini 300
index calculated as follows (Gini, 1936): 301
)+)((1= 1+
1=
1+ kk
nk
k
kk YYXXG ∑- eq. 1 302
where n is the number of fires, X is the cumulated fraction of the number of fires, and Y is the 303
cumulated fraction of the extent of fires. G ranges from 0 (variable distributed equally) to 1 304
(distribution of fires fully asymmetric). 305
306
To test whether, and to what degree, the fires were spatially aggregated together and to 307
potential ignitions sources (cities and villages) across NC, we used the pair correlation 308
function g(r) that provides a formal measure of the fire density at a given distance (r): 309
)2/()]([)( rrKdr
drg eq. 2 310
Where K(r) is the Ripley‘s K function (Ripley, 1981), and r is the distance to an arbitrary 311
point. g(r) > 1 indicates clustering while g(r) < 1 indicates regularity. 312
This function is related to the Ripley L function (Ripley, 1981), which has been used 313
previously for detecting spatial autocorrelation in ignition points or in burnt areas (e.g. Podur 314
et al., 2003; Vadrevu et al., 2008). The calculation of the pair correlation functions was 315
conducted using the Spatstat package with the R software (R Development Core Team, 2011), 316
which integrates edge effect corrections (Goreaud and Pelissier, 1999). We also computed the 317
distance between the ignition points for each fire and the nearest road, city, and village. 318
319
We acknowledge that our 12-years fire database was insufficient to characterize 320
temporal patterns of fires, but we calculated the fire cycle which is a simple index that 321
determines the time necessary to burn an area equivalent to the whole study area (Johnson et 322
al., 1999). Fire cycle was calculated for the whole NC and for the main vegetation types, 323
Curt et al. | Fires and management in New Caledonia
14
which allowed a rough comparison of the likelihood of reburning between all vegetation 324
types. The fire cycle is computed as: 325
SA
NFC
/ eq. 3 326
Where N is the number of years of the period studied, A is the total area burned, and S is the 327
total study area. 328
329
330
Comparing the drivers of ignition and burned areas with boosted regression trees 331
332
Boosting regression tree (BRT) analysis is a machine learning method which is well-suited for 333
exploring ecological variables and patchy data without the restrictive assumptions of 334
parametric statistics (e.g. Viedma et al., 2012; Aertsen et al., 2010), to optimize predictive 335
performance (De'ath, 2007), and it is considered to be flexible and easy to interpret (Elith et 336
al., 2008). Additionally, BRTs account for collinearity (i.e. linear regression between two 337
variables) which is likely to occur in such analyses using many anthropogenic and ecological 338
factors. It computes multiple regression trees on training data and sequentially fits the 339
residuals of the previous trees to provide a final ensemble tree – a process named ‗boosting‘ 340
(De'ath, 2007). BRT models were computed using the ‗gbm‘ R package (Ridgeway, 2013) 341
with a Bernoulli (logistic) error structure. Half of the data were used for building the model 342
(i.e. training dataset), and half to evaluate the accuracy of the classification (i.e. validation 343
dataset). Using the recommendation of Elith et al. (2008) the number of trees in each BRT 344
was set automatically to 20-folds cross-validation, we selected a bag fraction (training data 345
randomly selected for computing each tree) of 0.5, a shrinkage or learning rate of 0.005 which 346
controls the learning speed of the algorithm, and a tree complexity (or tree size) of 5. This 347
generated up to 2300 trees. We evaluated the quality of the models and their predictive 348
Curt et al. | Fires and management in New Caledonia
15
performance by using the area under the receiving operator curve (AUC; Pearce and Ferrier, 349
2000). The predictive performance was considered excellent when AUC > 0.9, and very poor 350
when AUC < 0.6. The BRT procedure comprised two main steps. In a first step, all 351
explanative variables were kept in order to get a complete model and a hierarchy of all 352
variables. The output is a figure with partial dependence functions (see Fig. 5 and 6): it 353
indicates the effect of each variable on the response after accounting for the average effect of 354
all variables in the model (Elith et al., 2008 Appendix S2). In a second step, the procedure 355
allows simplifying the model (the ‗drop-off‘ step) using methods analogous to backward 356
selection in regression (Elith et al., 2008). Only the most significant variables are thus kept 357
for the final explanation. 358
359
360
Detection and analysis of fire edges 361
362
Under a given set of weather conditions, fires may spread through a landscape and stop when 363
they reach natural obstacles such as abrupt changes in fuel type (e.g. when reaching a less 364
flammable fuel), or physiographic obstacles such as ridges or rivers (Viedma et al., 2009; 365
Moreira et al., 2011). Fires may also be stopped by fire suppression or rapid change of 366
meteorological conditions, irrespective of the natural obstacles. However, as most NC fires 367
propagate freely without active fire-fighting, we assumed that most fire edges would be 368
located at natural barriers, especially at interfaces between fuel types with different abilities to 369
ignite and to propagate fire because of large differences in fuel biomass or fuel moisture. For 370
large fires burning for more than one day, variations in meteorological conditions (e.g. 371
veering and/or speed of wind) could also affect the fire behavior but it was not possible to 372
obtain accurate information about this. Analyzing fuel discontinuities at fire edges was, 373
Curt et al. | Fires and management in New Caledonia
16
therefore, of particular importance for determining whether fires spread from savannas and 374
maquis to the endangered dry forests or rainforests. For each fire, we first defined a 30-m 375
wide buffer on the GIS inside the limit of the fire. We selected 50 random points within each 376
buffer (i.e. inside the burnt area versus outside the burnt area). Each point within the fire 377
contour was paired with the closest point outside it. For each point, we assessed the 378
predominant vegetation type. We calculated the proportion of a certain assemblage of 379
vegetation (e.g. savanna inside the fire contour and maquis outside) versus the reverse 380
(maquis inside the fire contour and savanna outside) for all the fires under study. The mean 381
difference of proportion between one case and its reverse indicated the extent to which the 382
former case was preferred to the other. We compared the values observed to those obtained 383
with 10,000 Monte Carlo random replicates to test the level of preference, which is indicated 384
by the p-value. We tested the effect of buffers of varying widths (30, 60 and 90 m) and found 385
that the 30-m buffer more accurate and stable information than wider buffers. 386
387
388
Results 389
390
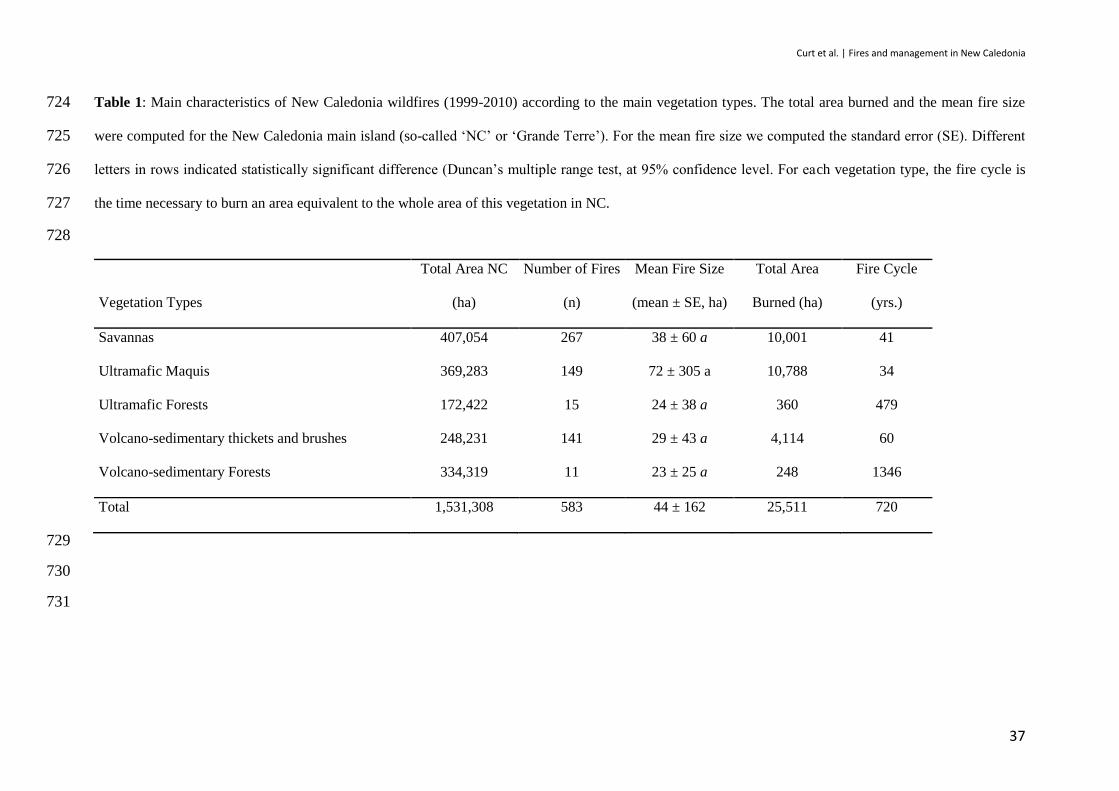
During the 1999-2011 period, 583 fires recorded both on MODIS hotspots and Landsat 391
images were validated as having been wildfires (Table 1; Fig. 2). The total monitored burned 392
area was 25,511 ha (ca. 255 km2), i.e. about 2 % of the area of the main island of NC. The 393
mean fire size was 44 ± 162 ha with considerable intra- (p = 0.0065) and inter-annual 394
variations (p < 0.0001). The global fire cycle of NC was 720 years but it was much shorter for 395
ultramafic maquis, savannas, and thickets on volcano-sedimentary rocks, (i.e. 34, 41 and 60 396
years, respectively) than for forests (479 and 1346 years on ultramafic and volcano-397
sedimentary substrates, respectively). 398
Curt et al. | Fires and management in New Caledonia
17
399
The area burned per fire ranged from 2 to 3641 ha, with a highly asymmetric 400
distribution and a clear predominance of small fires (standardized coefficient of asymmetry = 401
188; Gini index = 0.74). Small fires (< 10 ha) represented 40% of the total number of fires 402
although they accounted for less than 4% of the total area burned. Large fires (> 200 ha) 403
represented only 3% of the total number of fires but they accounted for 43% of the total area 404
burned. The largest fire occurred in December 2005 at the Montagne des Sources (3641 ha) 405
and accounted for 13% of the whole burned area during the entire 1999-2011 period. The 406
mean area of fires did not differ significantly among the vegetation types (Table 1). 407
408
At interannual time scales, fires were significantly more numerous (86% of the total) 409
during the Central Pacific El Niño events associated with severe drought in September-410
December (2002, 2004, 2009), and less common (14%) during the La Niña wet years (1999, 411
2000, 2007, and 2008) or unclassified years (p < 0.0001; Fig. 3). Most fires, as would be 412
expected, occurred during the main dry season (August to December), when seasonal dry 413
conditions are combined with increasing temperatures, and then during the dry inter-season 414
(April and May). The seasonal distribution of the burned areas roughly followed the 415
distribution of the number of fires. However, the mean fire size decreased during the two peak 416
months of fire frequency (November and April). The figure 3 showed that burned areas were 417
larger when FWI was high, i.e. during the dry season and El Niño years. FWI was 418
significantly higher during El Niño years than during La Niña years (7.2 ± 0.3 versus 3.6 ± 419
0.6, respectively; F = 29.8, P < 0.0001), and during the austral summer (September to 420
February) than during the rest of the year (7.9 ± 5.0 versus 3.4 ± 3.4, respectively; F = 73.6, P 421
< 0.0001). 422
423
Curt et al. | Fires and management in New Caledonia
18
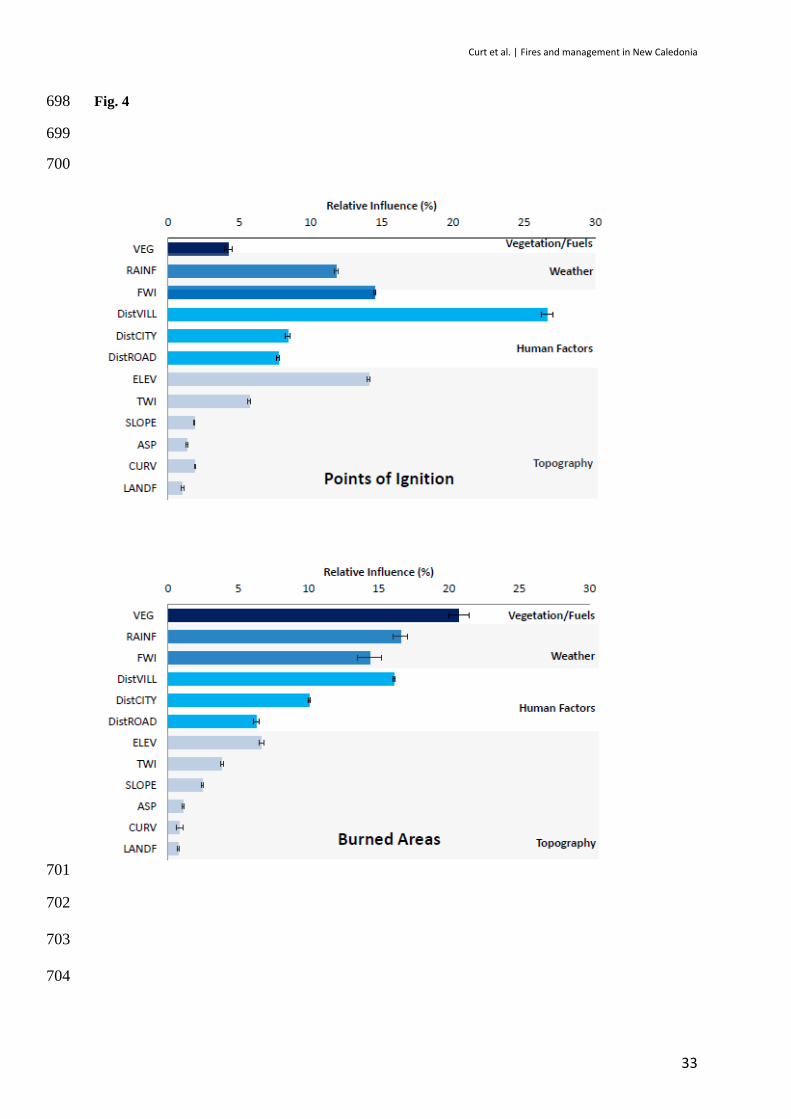
The BRTs indicated that ignitions were explained by human factors, fire weather and 424
topography while the burned areas were explained by vegetation fuels, fire weather and 425
human factors (Fig. 4). All models are considered as highly informative as AUC is 0.894 ± 426
0.005 and 0.919 ± 0.005 for ignitions and burned areas, respectively. Specifically, the BRT 427
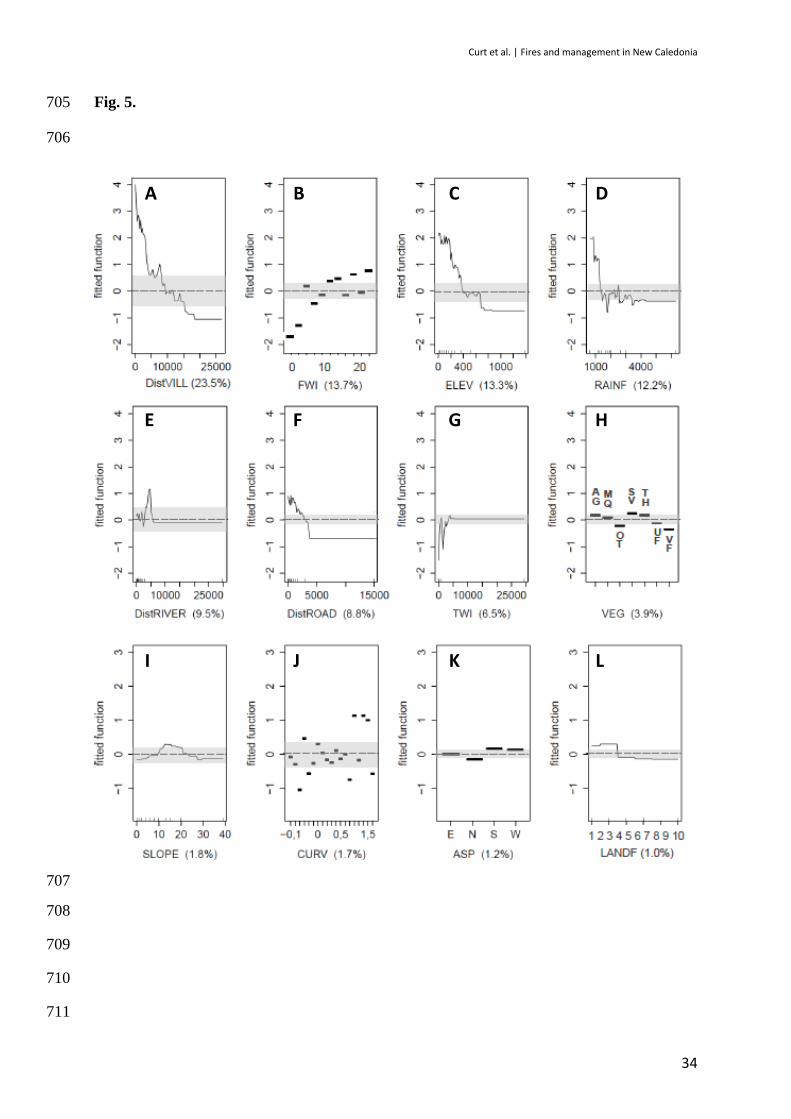
drop-off procedure indicated the chief drivers for ignitions and burned areas. Ignitions were 428
preferentially located close to villages (< 10 km), rivers (< 5 km) or roads (< 3 km), they 429
preferentially occurred during days with a FWI > 10-15, at elevation lower than 350 m and in 430
areas with mean annual rainfall below 1200 mm (Fig. 5). Vegetation type weakly explained 431
ignitions. However, they were more likely in savannas, maquis, thickets and agricultural lands 432
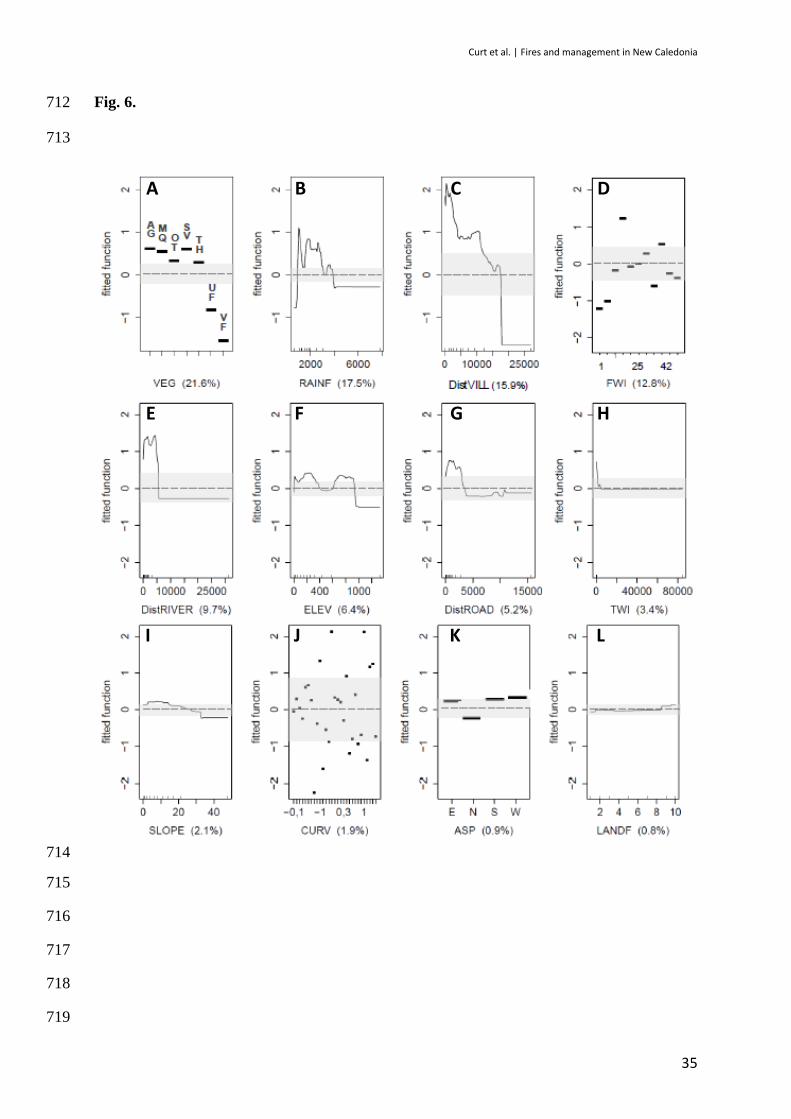
whereas they were unlikely in forests and other vegetation types (Fig. 5). The burned areas 433
were mostly located preferentially in savannas, maquis and agricultural lands, and to a lesser 434
degree in thickets and in other vegetation types (Fig. 5). Forests burned much less, especially 435
those on volcano-sedimentary substrates. Burned areas were more likely at low to medium 436
rainfall (< 3000 mm/year) and unlikely for FWI < 10. Topographic variables were poor 437
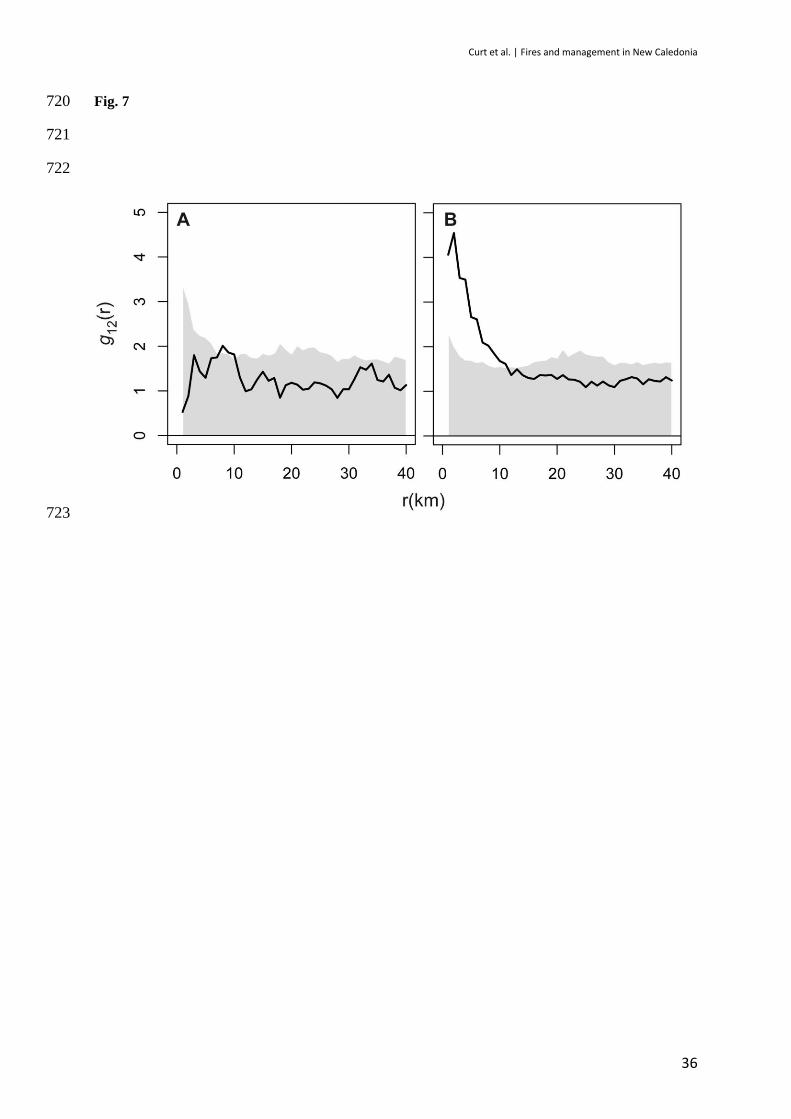
predictors of the burned areas. These results were confirmed by the spatial analysis of fires. 438
They were spatially aggregated at the scale of the whole NC, with a significantly positive 439
Ripley‘s L(r) index from 1 to 20 km (Fig. 7). They were also significantly aggregated at 440
distances less than 10 km from villages. 441
442
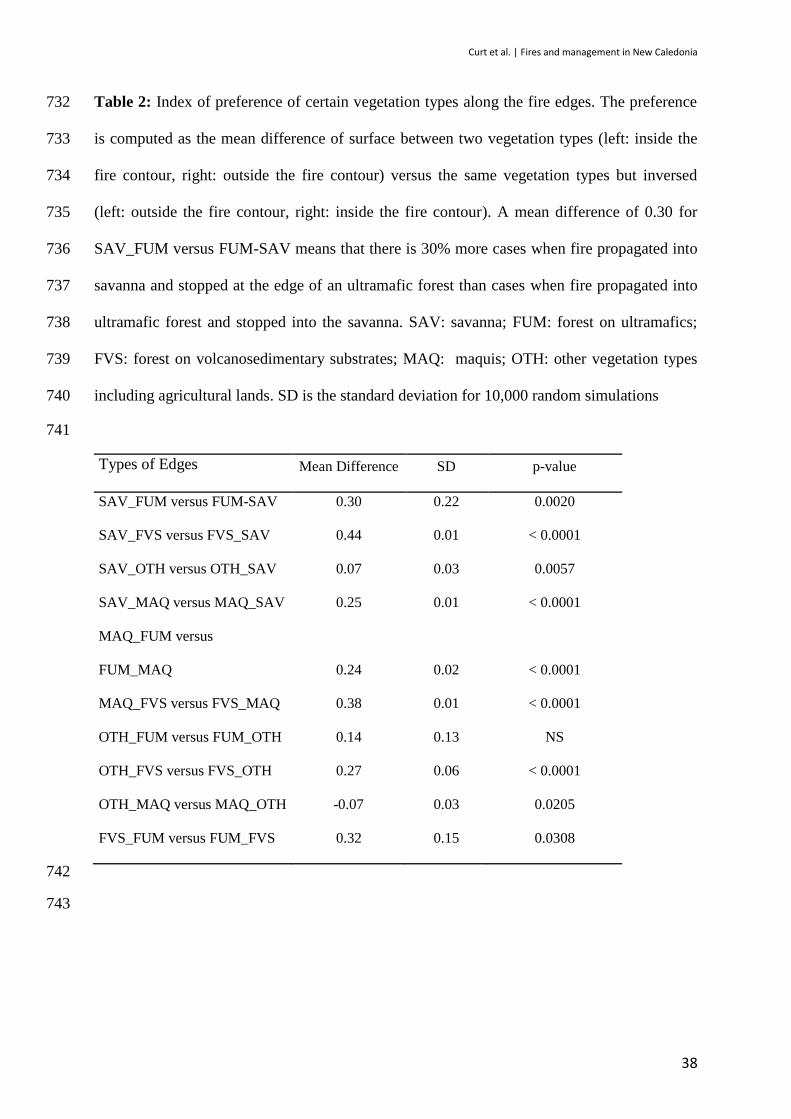
The analysis of fire edges indicated that 60% of fires were stopped at a forest edge. 443
Bushfires ignited in savannas, maquis and thickets preferentially stopped in forests, while the 444
inverse (i.e. fires ignited in forest and stopping in the bush) was much less frequent (Table 2). 445
In example, 77% of fires that stopped at the ultramafic forest edge originated from ultramafic 446
maquis, while 46% of fires that stopped at the edge of volcano-sedimentary forests originated 447
from thickets and brushes on volcano-sedimentary substrates, and 41% from savannas. 448
Curt et al. | Fires and management in New Caledonia
19
Meanwhile, less than 4% of fires were ignited in forests and spread to other vegetation types. 449
It is noteworthy that fires ignited in savannas and stopping in maquis were much frequent than 450
the inverse. The total area of forest edges burned in NC during the 1999-2011 period 451
corresponded to 0.15% of the total area of forests on volcano-sedimentary soils, and 0.14% of 452
the total area of forest on ultramafic soils. 453
454
455
Discussion 456
457
Anthropogenic and environmental determinants of fire activity in NC 458
459
The anthropogenic influence on fire activity is acknowledged worldwide: humans 460
make landscapes more or less flammable through the modification of land covers, they ignite 461
fires, and they also extinguish them (Krawchuk et al., 2009; Bowman et al., 2011). In NC, the 462
causes of fires are poorly known and literature suggested that most are human-made (Udo, 463
2010; Dumas et al., 2013). In this study we have shown that most ignitions are likely 464
anthropogenic. Indeed, they are located near villages and roads where most population 465
inhabits, and they occurred preferentially in agricultural lands and savannas burned by 466
humans for agriculture or range management. Favorable fire weather (FWI > 10) is also 467
necessary for ignitions to occur. Natural ignitions by lightning strikes are possible but likely 468
rare (Chevalier 1996). In contrast, burned areas mainly depend on fuels and weather because 469
they preferentially occur in flammable fuel types (savannas, maquis and pastures) and in areas 470
with low to moderate rainfall and FWI > 10, which allow fire to better propagate into dry 471
fuels. 472
473

Curt et al. | Fires and management in New Caledonia
20
Climate exerts a superordinate top-down control worldwide over the resources to burn 474
(i.e. the distribution and quantity of flammable vegetation) and the fire weather (Krawchuk et 475
al., 2009; Meyn et al., 2007). Although the human role on ignition is undisputed in NC, we 476
have shown that weather and climate exert a forcing role on fire activity and fire size. First, 477
fires were more frequent or larger during dry El Niño events, which correspond to negative 478
rainfall anomalies, especially in austral spring (Barbero et al., 2011). Second, fires were more 479
frequent at the end of the dry season (September to December) and during the inter-season 480
(April-May) when high air temperatures are associated with dry topsoil and fuels (Barbero et 481
al., 2011) as in many tropical areas (Van der Werf et al., 2008; Aragão et al., 2007). Third, 482
fire activity is higher during periods with high FWI values, and in low-elevation areas with 483
low mean rainfall. Fire activity can thus be predicted from weather at two spatial and 484
temporal scales: (i) a rough estimation of the seasonal fire activity can be inferred from local 485
negative rainfall anomalies and the sea surface temperature in July over the Niño 4 box during 486
at least the previous 3 months (Moron et al., 2013); (ii) a local estimation can base on the 487
daily FWI values above 10 which is sufficient to promote ignitions and fire propagation in 488
NC. This low FWI threshold is low in comparison to Mediterranean areas (generally 20-90, 489
Moriondo et al. 2006). However, it is coherent with those of Dymond et al. (2004) or De 490
Groot et al. (2007) for Indonesia or Malaysia where fires ignite when FWI > 7. This fits with 491
the statement that fires can ignite and creep in moist litter and understory fuels in the Tropics 492
(Cochrane 2003). 493
Savannas, secondary thickets, grasslands and maquis are the most flammable and fire-494
prone vegetation types in NC. First, these grassy and shrubby fuels have fine particles, low 495
moisture content, and rapid curing during the dry season (Williams et al., 2002; de Groot et 496
al., 2005). Second, they exhibit rapid post fire fuel build-up as vegetation recovers rapidly by 497
auto-succession (Bond 2005). Indeed, grassland can reburn a single year after a previous fire, 498
Curt et al. | Fires and management in New Caledonia
21
and maquis can reburn after 50 (Jaffré 1997; McCoy et al., 1999). As a consequence, grass 499
and shrub communities (including secondary thickets) of NC have short fire cycle, similar to 500
that of fire-prone South African grasslands (2-10 yrs., Archibald et al., 2011) or fynbos (10-13 501
yrs., van Wilgen et al., 2010), shrublands of south-western Australia (47 yrs., O'Donnell et 502
al., 2011; 60 years, Bradstock et al., 2002a), and southern Californian chaparral (33-42 yrs., 503
Moritz et al., 2004). In contrast, NC forests on both substrates have long to very long fire 504
cycles typical of most rainforests such as those in Amazonia (Aragão and Shimabukuro, 505
2010) and Australia (Bowman, 2003), confirming that they are not very flammable per se. 506
507
We acknowledge that the 12-years-long fire sequence limits the scope of our results 508
because several decades are usually necessary to characterize accurately the spatial and 509
temporal patterns of fires in a region (Moritz et al. 2004). However, we found clear 510
differences of spatial patterns and drivers between ignitions and burned areas. This suggests 511
that our georeferenced database is sufficient for a first characterization of the spatial patterns 512
of fires in NC. 513
514
515
Fire-landscape interactions 516
517
Fire and vegetation strongly interact in NC. The present landscape results from strong 518
changes in vegetation since the Melanesian settlement ca. 3000 BP due to fire and other 519
disturbances (Jaffré et al., 1998). Two major vegetation mosaics cohabit nowadays: the 520
savanna-forest mosaic (Jaffré et al., 1998) which is frequent in the north-west and the maquis-521
forest mosaic which is frequent in the center and the south-east (Ibanez et al., 2013). This 522
feature influences the present fire regime but it will also likely drive the landscape changes in 523

Curt et al. | Fires and management in New Caledonia
22
the future. Indeed, we have shown that bushfires predominate. They originate from savannas, 524
thickets, grasslands and maquis, and then propagate until reaching forest edges. 525
Therefore, we suggest that bushfires constitute a high fire hazard with respect to 526
forests. Undoubtedly, the dry sclerophyllous forests of NC are top-threatened because they are 527
highly fire-sensitive and reduced to small remnants due to fires and grazing (Jaffré et al., 528
1998). These remnants should be especially protected against fires when located near 529
flammable vegetation. Rainforests are thought to be of low flammability due to the scarcity of 530
fuel and the high fuel moisture content of the understory fuel bed and the litter (Stott, 2000). 531
These characteristics typically generate slow and low-intensity surface fires creeping through 532
the leaf litter (Cochrane 2003). In addition, understory fuels and tree canopies are not 533
connected vertically, which limits the probability of fire crowning. However, concerns have 534
been raised recently for rainforests worldwide: recurrent surface fires promoted by a micro-535
climatic edge effect during the dry season (e.g. Didham and Lawton, 1999; Hennenberg et al., 536
2008) may increase the intensity of new fires and facilitate burning (Goldammer, 1999; 537
Barlow and Peres, 2008). While rainforest usually act as a barrier preventing the spread of 538
fire, unusually strong El Niño years have contributed to massive fires in forest areas of 539
Amazonia (Alencar et al., 2011) or Borneo (Wooster et al., 2012). Repeated bushfires have 540
thus significantly affected rainforest boundaries, limited the recruitment of rainforest species, 541
and finally restricted forests to ‗fire-proof‘ locations such as gullies in Amazonia (Aragão and 542
Shimabukuro, 2010), Colombia (Armenteras-Pascual et al., 2011) or Australia (Bowman, 543
2003). A similar trend has been observed using remote sensing in maquis-forests mosaics of 544
central NC (Ibanez et al., 2012). Such fires that reach forest edges may also cause serious 545
damage to the base of tree stems because most rainforest tree species lack efficient traits for 546
resisting fire (Ibanez et al., 2013). Forest contraction can be especially rapid in maquis- or 547
Curt et al. | Fires and management in New Caledonia
23
savanna-forest mosaics when massive residues from forest exploitation and logs are left on 548
the ground and burn intensively (e.g. Wooster et al., 2012 in Borneo). 549
The conservation of dry forests and rainforests are undoubtedly important issues 550
worldwide (Myers et al., 2000; Olson and Dinerstein, 2002) as the global rate of forest habitat 551
destruction is alarmingly high (FAO, 2010). A major concern is that the present vegetation 552
mosaics of NC may become ‗fire traps‘ where fire cannot be easily extirpated (see 553
Lindenmayer et al., 2011 for Australian ash wet forests). Indeed, both the savanna-forest 554
mosaic and the maquis-forest mosaic are considered as alternative stable states (Perry and 555
Enright, 2002; Ibanez et al., 2013) which associate a flammable vegetation (savanna and 556
maquis) to fire-sensitive forests with a high conservation value. Simulation exercises have 557
shown that fire could maintain for centuries in such ‗fire landscapes‘ (Perry and Enright, 558
2002) and finally degrade a part of forests. 559
560
Keys for a sustainable fire management policy: challenges and opportunities in New-561
Caledonia 562
563
We provided the first georeferenced fire database and analysis of spatial patterns of 564
ignitions and burned areas for the New-Caledonian biodiversity hotspot. A major implication 565
of this study is to improve the fire policy that was put in place a few years ago in order to 566
protect people and the ecological assets. Indeed, literature shows that a comprehensive and 567
coherent policy can greatly reduce the activity and impact of fires, while an inadequate one 568
can be totally ineffective (FAO, 2007). We argue that an efficient and sustainable fire policy 569
should be realistic (in particular from a cost-benefit point of view), accepted by the 570
population, focused on the main stakes to protect, and comprehensive (i.e. including the chain 571
Curt et al. | Fires and management in New Caledonia
24
from prevention to suppression). In addition, it should account for the possible increase of fire 572
activity due to climate change. New-Caledonia faces fire issues like many similar tropical 573
biomes worldwide, (Cary and Banks, 2000; Bradstock et al., 2002b; Hughes, 2003; Aragão et 574
al., 2007). However, it has some opportunities that can help controlling fire impacts: this 575
rather prosperous territory of France is well-regulated in contrast with many regions where 576
massive deforestation and land clearing are poorly regulated (e.g. Indonesia: Herawati and 577
Santoso, 2011). 578
579
Based on this study, we suggest two main directions for a sustainable fire policy in 580
NC. In the one hand, we hypothesize that a zero-burn policy is unrealistic because: (i) fire is 581
used for multiple purposes including land management as in many tropical areas (Bowman et 582
al., 2011) and it has cultural significance, in particular for the kanak population (Udo 2011), 583
thus total fire exclusion is unlikely to be accepted by the population; (ii) low severity 584
infrequent fires are compatible with the maintenance of maquis and savannas (Martin and 585
Sapsis, 1992); and (iii) firefighting is often hard due to a complex topography, a poor road 586
network, and the scarcity of fire suppression forces on the ground and aerial. On the other 587
hand, this study provided information useful to improve the present policy towards 588
biodiversity conservation and reduce the social and ecological damages of unplanned fires. 589
This is especially true for bushfires ignited during fire danger peaks, which often overwhelm 590
the firefighting capacity, escape and become large and devastative. In contrast, small fires 591
ignited by experimented people for cultivation or range management during periods of low 592
fire danger are tolerable. Conserving the traditional firewise use of fire is of interest 593
(Carmenta et al., 2011). 594
595
Curt et al. | Fires and management in New Caledonia
25
In order to improve the current fire policy we first strongly advocate for the gathering 596
of georeferenced fire data over the longest time period possible. This database should collect 597
and map all information on fires including the points of ignitions, the fire contours, and the 598
causes of ignition. Such a database exists for the metropolitan France 599
(http://www.promethee.com/) where it is a vital piece of information for the planning of 600
sustainable management (e.g. Williams et al., 2002), calculating fire return intervals, 601
modeling fire ignition and fire risk, and pre-position the fire suppression crews. Burned areas 602
and fire hotspots datasets now available from satellite observations (e.g. MODIS; Roy et al., 603
2008) and precise fire mapping using Landsat images would bring together important 604
information for the conservation of the NC‘s ecosystem mosaic and biodiversity. Secondly, 605
this study indicated where the areas most frequently burned were, which is important for 606
protecting the high-conservation and vulnerable assets located near these fire-prone areas. 607
Their vegetation should be managed, and fire crew should be pre-positioned to speed up the 608
intervention. We support the strategy of preferentially managing the contact areas between 609
fire-prone vegetation and forests, in order to protect and conserve the latter from fire. 610
Extending the protected areas and forest reserves with fire exclusion would also be effective 611
(Adeney et al., 2009; Armenteras et al., 2013). Thirdly, we have shown that ignitions are 612
more likely during El Niño years and especially when FWI is higher than 10. During these 613
periods, fire use should be restricted. A new fire danger scale based on FWI computation 614
(Prévifeu) has been set up by MeteoFrance in NC in order to predict daily fire risk, inform the 615
population, and prepare the adequate fire suppression crews. 616
617
In conclusion, this study provided spatially-explicit information to keep under 618
surveillance and manage the areas where most ignitions occur, and the most frequently burned 619
areas. It supports the idea that improving fire prevention targeted towards the areas at risk and 620
Curt et al. | Fires and management in New Caledonia
26
a firewise management strategy are efficient ways to prevent the postulated effects of climate 621
change and their ecological consequences. Research perspectives are numerous, including a 622
better assessment of fire impact on forest edges, and fire-vegetation simulations at the scale of 623
NC to assess which forests are especially vulnerable to future fires. 624
625
Acknowledgments 626
We acknowledge the New Caledonian Government (DTSI) for providing us with the land 627
cover maps, and MétéoFrance Nouméa (Yves Bidet) for meteorological data. This study was 628
funded by the Agence Nationale pour la Recherche (France) in the frame of the ANR-INC 629
Project ―Incendies et Biodiversité en Nouvelle Calédonie‖ (ANR-07-BDIV-008-01). 630
631
Curt et al. | Fires and management in New Caledonia
27
Figure captions 632
633
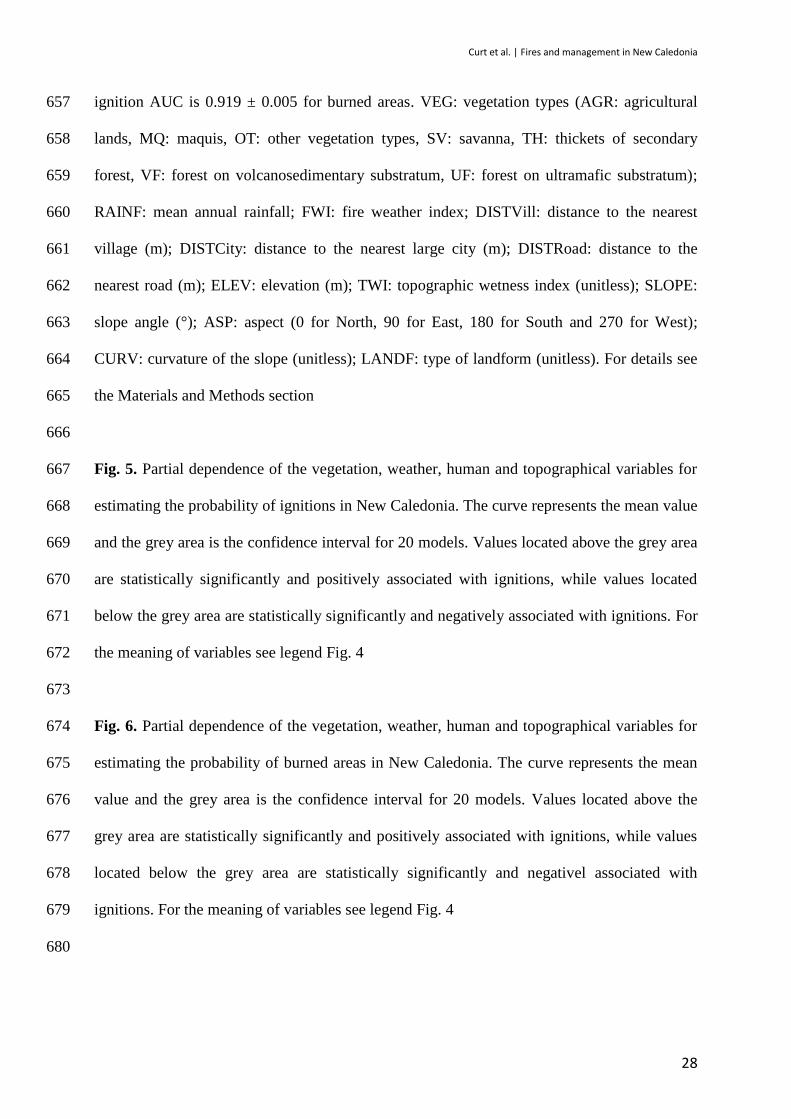
Fig. 1: Maps of New Caledonia. Left: Main vegetation types (Savannas are in yellow, 634
rainforest is in green, maquis are in red, and thickets on volcano-sedimentary substrates are in 635
grey). Note that dry sclerophyllous forests are restricted to small remnants on the western 636
coast (< 100 ha). Center: Location of the main cities, villages, and roads. Right: Elevation. 637
The stars represent the capitals of the New Caledonian provinces. 638
639
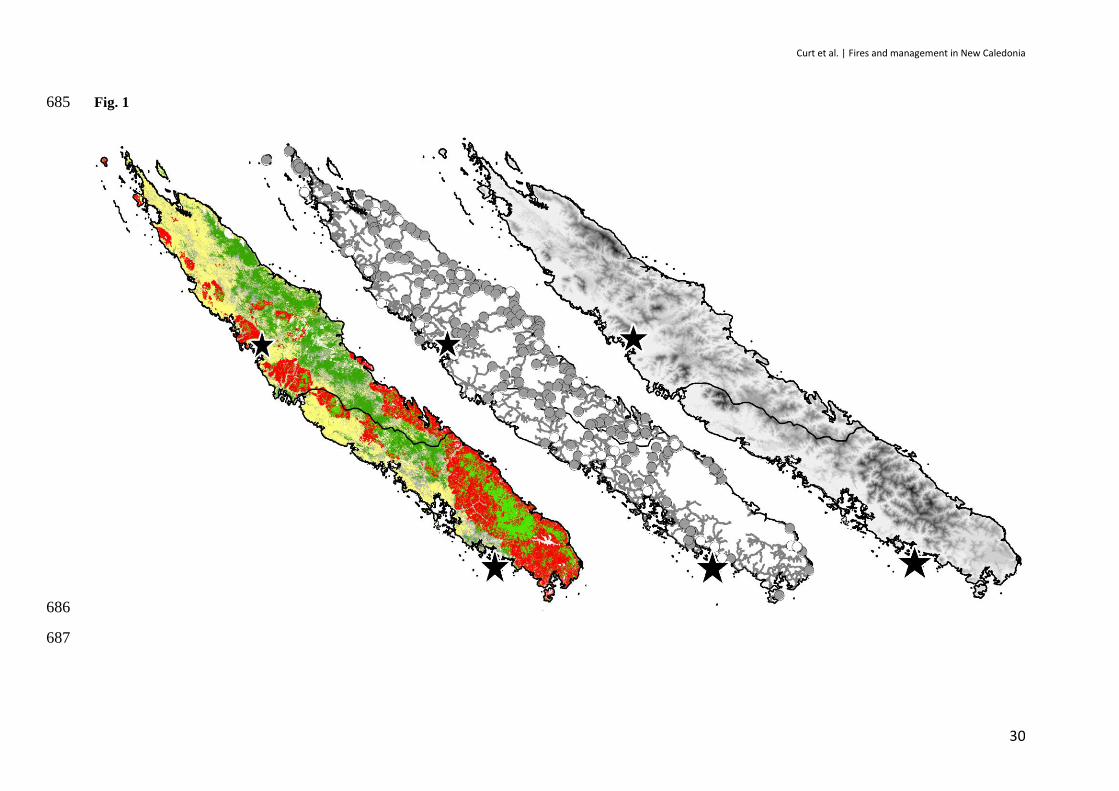
Fig. 2: Maps of the fire contours in New Caledonia (1999-2010). Fires larger than 2 hectares 640
have been drawn in red. Forests are in grey, and other vegetation types and land covers are in 641
white. The two zooms into the framed small areas illustrate the main fire patterns existing 642
(fires are hatched in red). A: Zoom into the Eastern coast with small fires. B: Zoom into the 643
large Montagne des Sources fire (3,641 ha). Both figures show that most fires start in non-644
forest vegetation (bushfires) and stop at the forest edge (in grey). 645
646
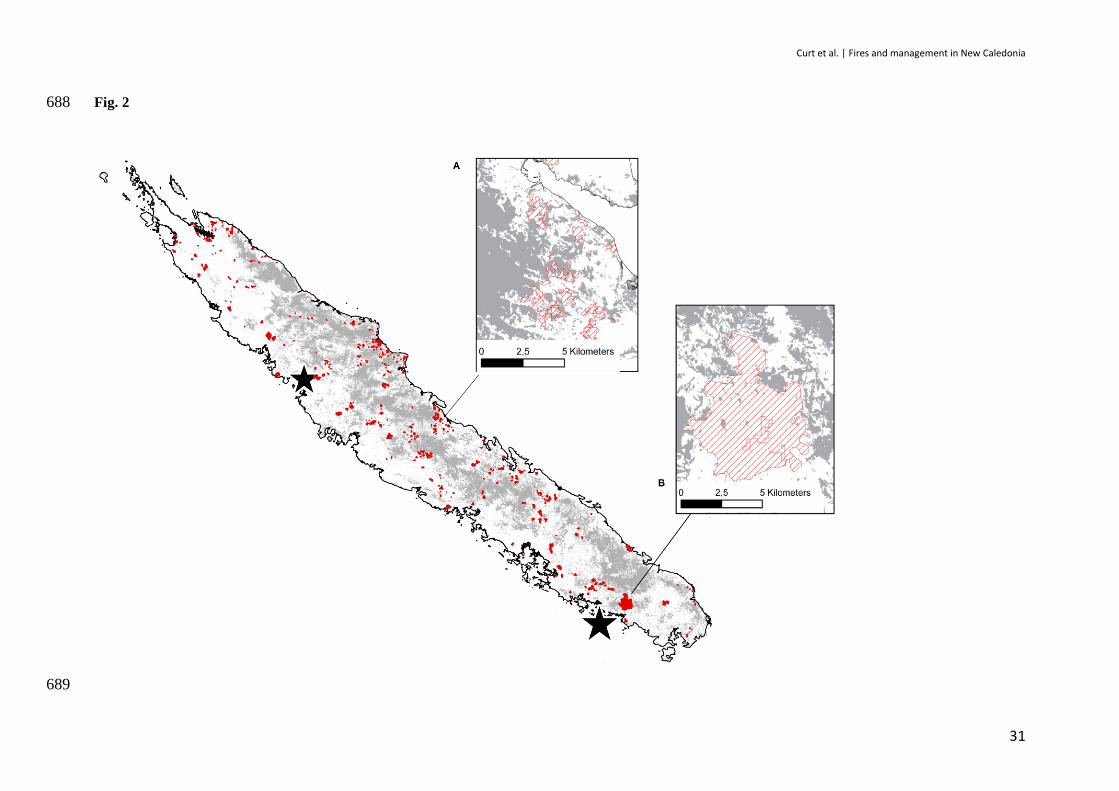
Fig. 3: Annual (A) and monthly (B) burned area (black points and full lines) and number of 647
fires (white points and dotted lines) in the New Caledonia main island between 1999 and 648
2010. Light grey areas indicate La Niña ENSO years (wet weather, presumably unfavourable 649
to fires) in A and the secondary dry inter-season in B, dark grey areas indicate El Niño ENSO 650
years (dry weather, presumably favorable to fires) in A and the main dry season in B. 651
652
Fig. 4. Relative contribution of the vegetation, weather, human and topographical variables in 653
the boosted regression trees (BRTs) predicting the fire ignition and the burned areas in New 654
Caledonia. Large bars are means and small bars are the standard deviation for an ensemble of 655
20 BRT models. All models are considered as highly informative as AUC is 0.894 ± 0.005 for 656
Curt et al. | Fires and management in New Caledonia
28
ignition AUC is 0.919 ± 0.005 for burned areas. VEG: vegetation types (AGR: agricultural 657
lands, MQ: maquis, OT: other vegetation types, SV: savanna, TH: thickets of secondary 658
forest, VF: forest on volcanosedimentary substratum, UF: forest on ultramafic substratum); 659
RAINF: mean annual rainfall; FWI: fire weather index; DISTVill: distance to the nearest 660
village (m); DISTCity: distance to the nearest large city (m); DISTRoad: distance to the 661
nearest road (m); ELEV: elevation (m); TWI: topographic wetness index (unitless); SLOPE: 662
slope angle (°); ASP: aspect (0 for North, 90 for East, 180 for South and 270 for West); 663
CURV: curvature of the slope (unitless); LANDF: type of landform (unitless). For details see 664
the Materials and Methods section 665
666
Fig. 5. Partial dependence of the vegetation, weather, human and topographical variables for 667
estimating the probability of ignitions in New Caledonia. The curve represents the mean value 668
and the grey area is the confidence interval for 20 models. Values located above the grey area 669
are statistically significantly and positively associated with ignitions, while values located 670
below the grey area are statistically significantly and negatively associated with ignitions. For 671
the meaning of variables see legend Fig. 4 672
673
Fig. 6. Partial dependence of the vegetation, weather, human and topographical variables for 674
estimating the probability of burned areas in New Caledonia. The curve represents the mean 675
value and the grey area is the confidence interval for 20 models. Values located above the 676
grey area are statistically significantly and positively associated with ignitions, while values 677
located below the grey area are statistically significantly and negativel associated with 678
ignitions. For the meaning of variables see legend Fig. 4 679
680

Curt et al. | Fires and management in New Caledonia
29
Fig. 7: Pair correlation function (Ripley L) between fires and cities (A) and fires and villages 681
(B). The full lines represent the observed patterns and the grey areas represent the complete 682
spatial randomness pattern (95 % confident intervals for 500 random simulations). Clustering 683
of fires around cities or villages is significant when the full line is above the grey area. 684
Curt et al. | Fires and management in New Caledonia
30
Fig. 1 685
686
687
Curt et al. | Fires and management in New Caledonia
31
Fig. 2 688
689
Curt et al. | Fires and management in New Caledonia
32
Fig. 3 690
691
692
693
694
695
696
697
Curt et al. | Fires and management in New Caledonia
33
Fig. 4 698
699
700
701
702
703
704
Curt et al. | Fires and management in New Caledonia
34
Fig. 5. 705
706
A B C D
E F G H
I J K L
707
708
709
710
711
Curt et al. | Fires and management in New Caledonia
35
Fig. 6. 712
713
A B C D
E F G H
I J K L
714
715
716
717
718
719
Curt et al. | Fires and management in New Caledonia
36
Fig. 7 720
721
722
723
Curt et al. | Fires and management in New Caledonia
37
Table 1: Main characteristics of New Caledonia wildfires (1999-2010) according to the main vegetation types. The total area burned and the mean fire size 724
were computed for the New Caledonia main island (so-called ‗NC‘ or ‗Grande Terre‘). For the mean fire size we computed the standard error (SE). Different 725
letters in rows indicated statistically significant difference (Duncan‘s multiple range test, at 95% confidence level. For each vegetation type, the fire cycle is 726
the time necessary to burn an area equivalent to the whole area of this vegetation in NC. 727
728
Vegetation Types
Total Area NC
(ha)
Number of Fires
(n)
Mean Fire Size
(mean ± SE, ha)
Total Area
Burned (ha)
Fire Cycle
(yrs.)
Savannas 407,054 267 38 ± 60 a 10,001 41
Ultramafic Maquis 369,283 149 72 ± 305 a 10,788 34
Ultramafic Forests 172,422 15 24 ± 38 a 360 479
Volcano-sedimentary thickets and brushes 248,231 141 29 ± 43 a 4,114 60
Volcano-sedimentary Forests 334,319 11 23 ± 25 a 248 1346
Total 1,531,308 583 44 ± 162 25,511 720
729
730
731
Curt et al. | Fires and management in New Caledonia
38
Table 2: Index of preference of certain vegetation types along the fire edges. The preference 732
is computed as the mean difference of surface between two vegetation types (left: inside the 733
fire contour, right: outside the fire contour) versus the same vegetation types but inversed 734
(left: outside the fire contour, right: inside the fire contour). A mean difference of 0.30 for 735
SAV_FUM versus FUM-SAV means that there is 30% more cases when fire propagated into 736
savanna and stopped at the edge of an ultramafic forest than cases when fire propagated into 737
ultramafic forest and stopped into the savanna. SAV: savanna; FUM: forest on ultramafics; 738
FVS: forest on volcanosedimentary substrates; MAQ: maquis; OTH: other vegetation types 739
including agricultural lands. SD is the standard deviation for 10,000 random simulations 740
741
Types of Edges Mean Difference SD p-value
SAV_FUM versus FUM-SAV 0.30 0.22 0.0020
SAV_FVS versus FVS_SAV 0.44 0.01 < 0.0001
SAV_OTH versus OTH_SAV 0.07 0.03 0.0057
SAV_MAQ versus MAQ_SAV 0.25 0.01 < 0.0001
MAQ_FUM versus
FUM_MAQ 0.24 0.02 < 0.0001
MAQ_FVS versus FVS_MAQ 0.38 0.01 < 0.0001
OTH_FUM versus FUM_OTH 0.14 0.13 NS
OTH_FVS versus FVS_OTH 0.27 0.06 < 0.0001
OTH_MAQ versus MAQ_OTH -0.07 0.03 0.0205
FVS_FUM versus FUM_FVS 0.32 0.15 0.0308
742
743
Curt et al. | Fires and management in New Caledonia
39
References 744
745
Adeney, J.M., Christensen, N.L., Pimm, S.L., 2009. Reserves Protect against Deforestation Fires in the Amazon. 746
Plos One 4. 747
Aertsen, W., Kint, V., van Orshoven, J., Özkan, K., Muys, B., 2010. Comparison and ranking of different 748
modelling techniques for prediction of site index in Mediterranean mountain forests. Ecological 749
Modelling 221, 1119-1130. 750
Alencar, A., Asner, G.P., Knapp, D., Zarin, D., 2011. Temporal variability of forest fires in eastern Amazonia. 751
Ecological Applications 21, 2397-2412. 752
Andersen, A.N., Cook, G.D., Corbett, L.K., Douglas, M.M., Eager, R.W., Russell-Smith, J., Setterfield, S.A., 753
Williams, R.J., Woinarski, J.C.Z., 2005. Fire frequency and biodiversity conservation in Australian 754
tropical savannas: implications from the Kapalga fire experiment. Austral Ecology 30, 155-167. 755
Aragão, L., Shimabukuro, Y.E., 2010. The Incidence of Fire in Amazonian Forests with Implications for REDD. 756
Science 328, 1275-1278. 757
Aragão, L.E.O.C., Malhi, Y., Roman-Cuesta, R.M., Saatchi, S., Anderson, L.O., Shimabukuro, Y.E., 2007. 758
Spatial patterns and fire response of recent Amazonian droughts. Geophys. Res. Lett. 34, L07701. 759
Archibald, S., Scholes, R., Roy, D., Roberts, G., Boschetti, L., 2011. Southern African fire regimes as revealed 760
by remote sensing International Journal of Wildland Fire 19, 861-878. 761
Armenteras-Pascual, D., Retana-Alumbreros, J., Molowny-Horas, R., Maria Roman-Cuesta, R., Gonzalez-762
Alonso, F., Morales-Rivas, M., 2011. Characterising fire spatial pattern interactions with climate and 763
vegetation in Colombia. Agricultural and Forest Meteorology 151, 279-289. 764
Badia-Perpinya, A., Pallares-Barbera, M., 2006. Spatial distribution of ignitions in Mediterranean periurban and 765
rural areas: the case of Catalonia. International Journal of Wildland Fire 15, 187-196. 766
Barbero, R., Moron, V., Mangeas, M., Despinoy, M., Hély, C., 2011. Relationships between MODIS and ATSR 767
fires and atmospheric variability in New Caledonia (SW Pacific). J. Geophysical Research 2011. 768
Barlow, J., Peres, C.A., 2008. Fire-mediated dieback and compositional cascade in an Amazonian forest. 769
Philosophical Transactions of the Royal Society B-Biological Sciences 363, 1787-1794. 770
Bergeron, Y., Leduc, A., Harvey, B.D., Gauthier, S., 2002. Natural fire regime: A guide for sustainable 771
management of the Canadian boreal forest. Silva Fennica 36, 81-95. 772
Curt et al. | Fires and management in New Caledonia
40
Bocquet, A., Chambrey, C., Derroire, G., Tassin, J., 2007. Modalities of colonization of woody savannah by dry 773
forest plants in New Caledonia. Revue D Ecologie-La Terre Et La Vie 62, 87-91. 774
Bond, W.J., 2005. Large parts of the world are brown or black: A different view on the 'Green World' 775
hypothesis. Journal of Vegetation Science 16, 261-266. 776
Bowman, D., 2003. Australian landscape burning: a continental and evolutionary perspective. Fire in 777
Ecosystems of South-West Western Australia: Impacts and Management, 107-118. 778
Bowman, D.M.J.S., Balch, J., Artaxo, P., Bond, W.J., Cochrane, M.A., D'Antonio, C.M., DeFries, R., Johnston, 779
F.H., Keeley, J.E., Krawchuk, M.A., Kull, C.A., Mack, M., Moritz, M.A., Pyne, S., Roos, C.I., Scott, 780
A.C., Sodhi, N.S., Swetnam, T.W., 2011. The human dimension of fire regimes on Earth. Journal of 781
Biogeography 38, 2223-2236. 782
Bradstock, R.A., Cohn, J.S., Bradstock, R.A., Williams, J.E., Gill, A.M., 2002a. Fire regimes and biodiversity in 783
semi-arid mallee ecosystems. Flammable Australia: the fire regimes and biodiversity of a continent., 238-784
258. 785
Bradstock, R.A., Williams, J.E., Gill, A.M., 2002b. Flammable Australia: the fire regimes and biodiversity of a 786
continent. Flammable Australia: the fire regimes and biodiversity of a continent, x + 462 pp. 787
Carmenta, R., Parry, L., Blackburn, A., Vermeylen, S., Barlow, J., 2011. Understanding human-fire interactions 788
in tropical forest regions: a case for interdisciplinary research across the natural and social sciences. 789
Ecology and Society 16, 53-63. 790
Cary, G.J., Banks, J.C.G., 2000. Fire regime sensitivity to global climate change: An Australian perspective. 791
Biomass Burning and Its Inter-Relationships with the Climate System 3, 233-246. 792
Catchpole, E.A., Alexander, M.E., Gill, A.M., 1992. Elliptical-fire perimeter- and area-intensity distributions. 793
Canadian Journal of Forest Research 22, 968-972. 794
Caudmont, S., Maitrepierre, L., 2006. Atlas climatique de la Nouvelle-Calédonie. . Direction interrégionale de 795
Nouvelle-Calédonie, 50 pp. 796
Chevalier, L., 1996. Terre de fer et de jade: de la baie de Prony à l'ile Ouen. Editions du Kagou, Nouméa (New 797
Caledonia), 149 pp. 798
Cochrane, M., 2003. Fire science for rainforests. Nature 421, 913-919. 799
Curt, T., Borgniet, L., Bouillon, C., 2013. Wildfire frequency varies with the size and shape of fuel types in 800
southeastern France: Implications for environmental management. Journal of Environmental Management 801
117, 150-161. 802
Curt et al. | Fires and management in New Caledonia
41
Dasgupta, S., Qu, J.J., Hao, X.J., Bhoi, S., 2007. Evaluating remotely sensed live fuel moisture estimations for 803
fire behavior predictions in Georgia, USA. Remote Sensing of Environment 108, 138-150. 804
De'ath, G., 2007. Boosted trees for ecological modeling and prediction. Ecology 88, 243-251. 805
de Groot, W.J., Wardati, Wang, Y.H., 2005. Calibrating the fine fuel moisture code for grass ignition potential in 806
Sumatra, Indonesia. International Journal of Wildland Fire 14, 161-168. 807
Didham, R.K., Lawton, J.H., 1999. Edge structure determines the magnitude of changes in microclimate and 808
vegetation structure in tropical forest fragments. Biotropica 31, 17-30. 809
Dumas, P., Toussaint, M., Herrenschmidt, J., Conte, A., Mangeas, M., 2013. Le risque de feux de brousse sur la 810
Grande Terre de Nouvelle-Calédonie : l‘Homme responsable, mais pas coupable. Revue Geographique de 811
l'Est (In French) 53, 1-20. 812
Dymond, C.C., Roswintiarti, O., Brady, M., 2004. Characterizing and mapping fuels for Malaysia and western 813
Indonesia. International Journal of Wildland Fire 13, 323-334. 814
Elith, J., Leathwick, J.R., Hastie, T., 2008. A working guide to boosted regression trees. Journal of Animal 815
Ecology 77, 802-813. 816
Falk, D.A., Miller, C., McKenzie, D., Black, A.E., 2007. Cross-scale analysis of fire regimes. Ecosystems 10, 817
809-823. 818
FAO, 2007. Fire management — global assessment 2006. A Thematic Study Prepared in the Framework of the 819
Global Forest Resource Assessment 2005. FAO, Rome. 820
FAO, 2010. Global forest resources assessment 2010. Food and Agriculture Organization of the United Nations 821
Rome, 80 pp. 822
Finney, M., 2004. FARSITE: Fire Area Simulator. Model Development and Evaluation. USDA Forest Service, 823
Research Paper RMRS-RP-4, 52 pp. 824
Giglio, L., Csiszar, I., Justice, C., 2006. Global distribution and seasonality of active fires as observed with the 825
Terra and Aqua Moderate Resolution Imaging Spectroradiometer (MODIS) sensors. Journal of 826
Geophysical Research 111, 1-12. 827
Gillespie, T.W., Jaffre, T., 2003. Tropical dry forests in New Caledonia. Biodiversity and Conservation 12, 828
1687-1697. 829
Gillespie, T.W., O'Neill, K., Keppel, G., Pau, S., Meyer, J.Y., Price, J.P., Jaffre, T., 2014. Prioritizing 830
conservation of tropical dry forests in the Pacific. Oryx 48, 337-344. 831
Curt et al. | Fires and management in New Caledonia
42
Gini, C., 1936. On the Measure of Concentration with Special Reference to Income and Statistics. Colorado 832
College Publication, General Series No. 208, 73-79. 833
Goldammer, J.G., 1999. Ecology - Forests on fire. Science 284, 1782-1783. 834
Goreaud, F., Pelissier, R., 1999. On explicit formulas of edge effect correction for Ripley's K-function. Journal 835
of Vegetation Science 10, 433-438. 836
Groot, W.J.d., Field, R.D., Brady, M.A., Roswintiarti, O., Mohamad, M., 2007. Development of the Indonesian 837
and Malaysian Fire Danger Rating Systems. Mitigation and Adaptation Strategies for Global Change 12, 838
165-180. 839
Hennenberg, K.J., Goetze, D., Szarzynski, J., Orthmann, B., Reineking, B., Steinke, I., Porembski, S., 2008. 840
Detection of seasonal variability in microclimatic borders and ecotones between forest and savanna. Basic 841
and Applied Ecology 9, 275-285. 842
Herawati, H., Santoso, H., 2011. Tropical forest susceptibility to and risk of fire under changing climate: A 843
review of fire nature, policy and institutions in Indonesia. Forest Policy and Economics 13, 227-233. 844
Hope, G., Paske, J., 1998. Pleistocene environmental upheaval in New Caledonia. Palaeogeogr. Palaeoclim. 845
Palaeoecol. 142, 1-21. 846
Hughes, L., 2003. Climate change and Australia: Trends, projections and impacts. Austral Ecology 28, 423-443. 847
Hunt, E.R., Li, L., Yilmaz, M.T., Jackson, T.J., 2011. Comparison of vegetation water contents derived from 848
shortwave-infrared and passive-microwave sensors over central Iowa. Remote Sensing of Environment 849
115, 2376-2383. 850
Ibanez, T., Borgniet, L., Mangeas, M., Gaucherel, C., GÉRaux, H., HÉLy, C., 2012. Rainforest and savanna 851
landscape dynamics in New Caledonia: Towards a mosaic of stable rainforest and savanna states? Austral 852
Ecology, no-no. 853
Ibanez, T., Curt, T., Hély, C., 2013. Low tolerance of New Caledonian secondary forest species to savanna fires. 854
Journal of Vegetation Science 24, 177-188. 855
IUCN, 2011. IUCN Red List of Threatened Species. International Union for Conservation of Nature and Natural 856
Resources (http://www.iucnredlist.org/). 857
Jaffré, T., Bouchet, P., Veillon, J., 1998. Threatened plants of New Caledonia: Is the system of protected areas 858
adequate? Biodiversity and Conservation 7, 109-135. 859
Jaffre, T., Bouchet, P., Veillon, J.M., 1998. Threatened plants of New Caledonia: Is the system of protected areas 860
adequate? Biodiversity and Conservation 7, 109-135. 861
Curt et al. | Fires and management in New Caledonia
43
Jaffre, T., Munzinger, J., Lowry, P.P., 2010. Threats to the conifer species found on New Caledonia's ultramafic 862
massifs and proposals for urgently needed measures to improve their protection. Biodiversity and 863
Conservation 19, 1485-1502. 864
Johnson, E.A., Miyanishi, K., O'Brien, N., 1999. Long-term reconstruction of the fire season in the mixedwood 865
boreal forest of Western Canada. Canadian Journal of Botany-Revue Canadienne De Botanique 77, 1185-866
1188. 867
Jones, G., Chew, J., Silverstein, R., Stalling, C., Sullivan, J., Troutwine, J., Weise, D., Garwood, D., 2008. 868
Spatial analysis of fuel treatment options for chaparral on the Angeles National Forest. General Technical 869
Report - Pacific Southwest Research Station, USDA Forest Service, 237-245. 870
Keeley, J.E., 2002. Fire management of California shrubland landscapes. Environmental Management 29, 395-871
408. 872
Krawchuk, M.A., Moritz, M.A., Parisien, M.-A., Van Dorn, J., Hayhoe, K., 2009. Global Pyrogeography: the 873
Current and Future Distribution of Wildfire. PLoS ONE 4, e5102. 874
Leblon, B., 2005. Monitoring forest fire danger with remote sensing. Natural Hazards 35, 343-359. 875
Lindenmayer, D.B., Hobbs, R.J., Likens, G.E., Krebs, C.J., Banks, S.C., 2011. Newly discovered landscape traps 876
produce regime shifts in wet forests. Proceedings of the National Academy of Sciences of the United 877
States of America 108, 15887-15891. 878
Martin, R., Sapsis, D., 1992. Fires as agents of biodiversity: Pyrodiversity promotes biodiversity. In: Proceedings 879
Symposium Biodiversity of Northern California, Univ. California, Berkeley, pp. 150-157. 880
McCoy, S., Jaffre, T., Rigault, F., Ash, J.E., 1999. Fire and succession in the ultramafic maquis of New 881
Caledonia. Journal of Biogeography 26, 579-594. 882
McGarigal, K., Cushman, S., Neel, M., Ene, E., 2002. FRAGSTATS: Spatial Pattern Analysis Program for 883
Categorical Maps. Computer software program produced by the authors at the University of 884
Massachusetts, Amherst. http://www.umass.edu/landeco/research/fragstats/fragstats.html. 885
Meyn, A., White, P.S., Buhk, C., Jentsch, A., 2007. Environmental drivers of large, infrequent wildfires: the 886
emerging conceptual model. Progress in Physical Geography 31, 287-312. 887
Mittermeier, R., Robles Gil, P., Hoffmann, M., Pilgrim, J., Brooks, T., Mittermeier, C., Lamoureux, J., da 888
Fonseca, G., 2004. Hospots Revisited. Chicago University Press, Chicago. 889

Curt et al. | Fires and management in New Caledonia
44
Morat, P., Jaffre, T., Tronchet, F., Munzinger, J., Pillon, Y., Veillon, J., Chalopin, M., 2012. The taxonomic 890
reference base "Florical" and characteristics of the native vascular flora of New Caledonia. In press., 243-891
254. 892
Moreira, F., Viedma, O., Arianoutsou, M., Curt, T., Koutsias, N., Rigolot, E., Barbati, A., Corona, P., Vaz, P., 893
Xanthopoulos, G., Mouillot, F., Bilgili, E., 2011. Landscape - wildfire interactions in southern Europe: 894
Implications for landscape management. Journal of Environmental Management 92, 2389-2402. 895
Moritz, M.A., Keeley, J.E., Johnson, E.A., Schaffner, A.A., 2004. Testing a basic assumption of shrubland fire 896
management: how important is fuel age? Frontiers in Ecology and the Environment 2, 67-72. 897
Moron, V., Barbero, R., Mangeas, M., Borgniet, L., Curt, T., Berti-Equille, L., 2013. Prediction of September-898
December Fire in New Caledonia (Southwestern Pacific) Using July Nino-4 Sea Surface Temperature 899
Index. Journal of Applied Meteorology and Climatology 52, 623-633. 900
Myers, N., 1988. Threatened biotas: "hot spots" in tropical forests. Environmentalist 8, 187-208. 901
Myers, N., Mittermeier, R.A., Mittermeier, C.G., da Fonseca, G.A.B., Kent, J., 2000. Biodiversity hotspots for 902
conservation priorities. Nature 403, 853-858. 903
Nicet, J., Delcroix, T., 2000. ENSO-Related Precipitation Changes in New Caledonia, Southwestern Tropical 904
Pacific: 1969–98. Mon. Weather Rev., 3001-3006. 905
Numata, I., Cochrane, M.A., Galvao, L.S., 2011. Analyzing the Impacts of Frequency and Severity of Forest Fire 906
on the Recovery of Disturbed Forest using Landsat Time Series and EO-1 Hyperion in the Southern 907
Brazilian Amazon. Earth Interactions 15. 908
O'Donnell, A.J., Boer, M.M., McCaw, W.L., Grierson, P.F., 2011. Vegetation and landscape connectivity control 909
wildfire intervals in unmanaged semi-arid shrublands and woodlands in Australia. Journal of 910
Biogeography 38, 112-124. 911
Olson, D., Dinerstein, E., 2002. The Global 200: Priority ecoregions for global conservation. Annals of the 912
Missouri Botanical Garden 89, 199-224. 913
Pascal, M., Richier de Forges, B., Le Guyader, H., Simberloff, D., 2008. Mining and other threats to the New 914
Caledonia biodiversity hotspot. Conservation Biology 22, 498-499. 915
Pearce, J., Ferrier, S., 2000. Evaluating the predictive performance of habitat models developed using logistic 916
regression. Ecological Modelling 133, 225-245. 917
Curt et al. | Fires and management in New Caledonia
45
Perry, G.L.W., Enright, N.J., 2002. Humans, fire and landscape pattern: understanding a maquis-forest complex, 918
Mont Do, New Caledonia, using a spatial 'state-and-transition' model. Journal of Biogeography 29, 1143-919
1158. 920
Podur, J., Martell, D.L., Csillag, F., 2003. Spatial patterns of lightning-caused forest fires in Ontario, 1976-1998. 921
Ecological Modelling 164, 1-20. 922
Pyne, S.J., Andrews, P.L., Laven, R.D., 1996. Introduction to wildland fire. 2nd ed. New York, NY: John Wiley 923
& Sons, 808 pp. 924
R Development Core Team, 2011. R: A language and environment for statistical computing, reference index 925
version v. 2.14.1. R Foundation for Statistical Computing, Vienna, Austria. 926
Ridgeway, G., 2013. Generalized Boosted Models: A guide to the gbm package. http://cran.r-project.org/, 34 pp. 927
Riley, S.J., Malecki, R.A., 2001. A landscape analysis of cougar distribution and abundance in Montana, USA. 928
Environmental Management 28, 317-323. 929
Ripley, B.D., 1981. Spatial Statistics. John Wiley and Sons, New York. 930
Ropelewski, C., Halpert, M., 1987. Global and regional scale precipitation patterns associated with the El 931
Niño/Southern Oscillation. Monthly Weather Review 115, 1606-1626. 932
Rothermel, R.C., 1983. How to predict the spread and intensity of forest and range fire. In. USDA Forest 933
Service, National Wildfire Coordinating Group, General Technical Report INT-143, pp. (Ogden, Utah). 934
Roy, D.P., Boschetti, L., Justice, C.O., Ju, J., 2008. The collection 5 MODIS burned area product - Global 935
evaluation by comparison with the MODIS active fire product. Remote Sensing of Environment 112, 936
3690-3707. 937
Sorensen, R., Zinko, U., Seibert, J., 2006. On the calculation of the topographic wetness index: evaluation of 938
different methods based on field observations. Hydrology and Earth System Sciences 10, 101-112. 939
Stevenson, J., 2004. A late-Holocene record of human impact from the southwest coast of New Caledonia. 940
Holocene, 888-898. 941
Stott, P., 2000. Combustion in tropical biomass fires: a critical review. Progress in Physical Geography 24, 355-942
377. 943
Tinquaut, F., 2010. Analyse des combustibles et modélisation du comportement du feu dans les principaux 944
écosystèmes de Nouvelle Calédonie. Master Thesis Univ. Clermont-Ferrand (France), 42 pp. 945
Udo, N., 2011. Fire, natural resources and territories in New Caledonia: Perception, use and management of fire. 946
ANR-INC Report, 40 pp. 947
Curt et al. | Fires and management in New Caledonia
46
Vadrevu, K.P., Badarinath, K.V.S., Eaturu, A., 2008. Spatio-temporal analysis of fire events in India: 948
implications for environmental conservation. Journal of Environmental Planning and Management 51, 949
817-832. 950
Van der Werf, G., Randerson, J., Giglio, L., Gobron, N., Dolman, A., 2008. Climate controls on the variability of 951
fires in the tropics and subtropics. Global Biogeochemical Cycles 22, 13-20. 952
van Wagner, C., 1987. Development and structure of the Canadian Forest Fire Weather Index System. Forestry 953
Technical Report - Canadian Forestry Service, viii + 37 pp. 954
van Wilgen, B.W., Forsyth, G.G., de Klerk, H., Das, S., Khuluse, S., Schmitz, P., 2010. Fire management in 955
Mediterranean-climate shrublands: a case study from the Cape fynbos, South Africa. Journal of Applied 956
Ecology 47, 631-638. 957
van Wilgen, B.W., Govender, N., Smit, I.P.J., MacFadyen, S., 2014. The ongoing development of a pragmatic 958
and adaptive fire management policy in a large African savanna protected area. Journal of Environmental 959
Management 132, 358-368. 960
Viedma, O., Angeler, D.G., Moreno, J.M., 2009. Landscape structural features control fire size in a 961
Mediterranean forested area of central Spain. International Journal of Wildland Fire 18, 575-583. 962
Viedma, O., Torres, I., Perez, B., Moreno, J.M., 2012. Modeling plant species richness using reflectance and 963
texture data derived from QuickBird in a recently burned area of Central Spain. Remote Sensing of 964
Environment 119, 208-221. 965
Williams, R.J., Griffiths, A.D., Allan, G.E., Bradstock, R.A., Williams, J.E., Gill, A.M., 2002. Fire regimes and 966
biodiversity in the savannas of northern Australia. Flammable Australia: the fire regimes and biodiversity 967
of a continent., 281-304. 968
Wooster, M.J., Perry, G.L.W., Zoumas, A., 2012. Fire, drought and El Nino relationships on Borneo (Southeast 969
Asia) in the pre-MODIS era (1980-2000). Biogeosciences 9, 317-340. 970
971
972