
Understanding Complexometric Titrations of Metal - IRIS
17
World Journal of Chemical Education, 2015, Vol. 3, No. 1, 5-21 Available online at http://pubs.sciepub.com/wjce/3/1/2 © Science and Education Publishing DOI:10.12691/wjce-3-1-2 Understanding Complexometric Titrations of Metal Cations with Aminopolycarboxylic Acids (EDTA and Analogs) within the frame of the Notion of Reactions between Groups of Chemical Species Maria Michela SALVATORE * , Francesco SALVATORE Dipartimento di Scienze Chimiche, Università degli Studi di Napoli “Federico II”, Via Cintia, 21 - 80126 Napoli, Italy *Corresponding author: [email protected] Received December 15, 2014; Revised February 02, 2015; Accepted February 09, 2015 Abstract In spite of the apparent technical simplicity with which visual complexometric titrations of metal cations with aminopolycarboxylic acids titrants are performed, a complex chemistry takes place in the titrated solution during the titration, due to the chemical environment and to the insuppressible chemical properties of metal cations, aminopolycarboxylic acids and metallochromic indicators. This chemical complexity makes rigorous exposition and evaluations of complexometric titrations arduous. Nonetheless, by the introduction of the notions of groups of chemical species and reactions between groups of chemical species (with the connected concept of conditional formation constant), a frame is created within which complexometric titrations with aminopolycarboxylic acids can be collocated and which allows a reasonably simple presentation and evaluation of the analytically relevant aspects of this type of titrations. In a sense, the well known concept of conditional complex formation constant is updated in a way that facilitates understanding and use. Keywords: aminopolycarboxylic acids, complexometric titrations, conditional formation constant, EDTA, magnesium, Eriochrome Black T, water hardness Cite This Article: Maria Michela SALVATORE, and Francesco SALVATORE, “Understanding Complexometric Titrations of Metal Cations with Aminopolycarboxylic Acids (EDTA and Analogs) within the frame of the Notion of Reactions between Groups of Chemical Species.” World Journal of Chemical Education, vol. 3, no. 1 (2015): 5-21. doi: 10.12691/wjce-3-1-2. 1. Introduction Aminopolycarboxylic acids are a class of multidentate chelating ligands which are very effective in complexing metal cations through oxygen and nitrogen donor atoms. Because of this capability, they are employed in a variety of ways in chemistry and in other fields. A large number of aminopolycarboxylic acids have been synthesized and examined for their properties in complexing metal cations, but only a small number of them are in common use [1]. The most popular of all the aminopolycarboxylic acids is ethylendiaminetetraacetic acid (H 4 EDTA) which corresponds to the structure [2,3]: Diethylenetriaminepentaacetic acid (H 5 DPA) and diaminocyclohexanetetraacetic acid (H 4 DCTA), which correspond to the following structures, are also very common and in many aspects equivalent to EDTA: Probably, the most popular application of aminopolycarboxylic acids in chemistry is their use as titrants in complexometric titrations for the determination of a variety of metal cations [4]. Visual direct complexometric titrations are very rapid and convenient and are performed in a way that is
-
Upload
khangminh22 -
Category
Documents
-
view
0 -
download
0
Transcript of Understanding Complexometric Titrations of Metal - IRIS
World Journal of Chemical Education 2015 Vol 3 No 1 5-21 Available online at httppubssciepubcomwjce312 copy Science and Education Publishing DOI1012691wjce-3-1-2
Understanding Complexometric Titrations of Metal Cations with Aminopolycarboxylic Acids (EDTA and Analogs) within the frame of the Notion of Reactions
between Groups of Chemical Species
Maria Michela SALVATORE Francesco SALVATORE
Dipartimento di Scienze Chimiche Universitagrave degli Studi di Napoli ldquoFederico IIrdquo Via Cintia 21 - 80126 Napoli Italy Corresponding author frsalvatuninait
Received December 15 2014 Revised February 02 2015 Accepted February 09 2015
Abstract In spite of the apparent technical simplicity with which visual complexometric titrations of metal cations with aminopolycarboxylic acids titrants are performed a complex chemistry takes place in the titrated solution during the titration due to the chemical environment and to the insuppressible chemical properties of metal cations aminopolycarboxylic acids and metallochromic indicators This chemical complexity makes rigorous exposition and evaluations of complexometric titrations arduous Nonetheless by the introduction of the notions of groups of chemical species and reactions between groups of chemical species (with the connected concept of conditional formation constant) a frame is created within which complexometric titrations with aminopolycarboxylic acids can be collocated and which allows a reasonably simple presentation and evaluation of the analytically relevant aspects of this type of titrations In a sense the well known concept of conditional complex formation constant is updated in a way that facilitates understanding and use
Keywords aminopolycarboxylic acids complexometric titrations conditional formation constant EDTA magnesium Eriochrome Black T water hardness
Cite This Article Maria Michela SALVATORE and Francesco SALVATORE ldquoUnderstanding Complexometric Titrations of Metal Cations with Aminopolycarboxylic Acids (EDTA and Analogs) within the frame of the Notion of Reactions between Groups of Chemical Speciesrdquo World Journal of Chemical Education vol 3 no 1 (2015) 5-21 doi 1012691wjce-3-1-2
1 Introduction Aminopolycarboxylic acids are a class of multidentate
chelating ligands which are very effective in complexing metal cations through oxygen and nitrogen donor atoms
Because of this capability they are employed in a variety of ways in chemistry and in other fields
A large number of aminopolycarboxylic acids have been synthesized and examined for their properties in complexing metal cations but only a small number of them are in common use [1]
The most popular of all the aminopolycarboxylic acids is ethylendiaminetetraacetic acid (H4EDTA) which corresponds to the structure [23]
Diethylenetriaminepentaacetic acid (H5DPA) and diaminocyclohexanetetraacetic acid (H4DCTA) which correspond to the following structures are also very common and in many aspects equivalent to EDTA
Probably the most popular application of
aminopolycarboxylic acids in chemistry is their use as titrants in complexometric titrations for the determination of a variety of metal cations [4]
Visual direct complexometric titrations are very rapid and convenient and are performed in a way that is
6 World Journal of Chemical Education
technically very similar to other types of titrations (eg visual Acid-Base titrations) [23]
In a visual direct complexometric titration a volume 0lV
(l = litre) of a solution (buffered to a suitable pH by addition of a pH buffer) containing a concentration M
0C (M = Molar) of the target metal cation Mez+ is coloured by adding a small amount of a metallochromic indicator and then titrated by adding from a burette accurately measured volumes t
lV of the titrating MtC
aminopolycarboxylic acid standard solution The titration is continued until a sudden change in colour of the solution is observed at which point the total volume arr
lV of the aminopolycarboxylic acid standard solution consumed is read on the burette and used to evaluate the amount ( M
0 0middot lC V ) or concentration ( M0C ) of the metal
cation in the titrated solution For a direct complexometric titration as for any
titration an equivalent volume exists eqlV which is by
definition the point of the titration when the number of moles of the titrant aminopolycarboxylic acid added is equal to the number of moles of the target metal cation
Evaluations are performed by identifying arrlV
determined from the titration with eqlV on the basis of
relation (1) which holds at the equivalence point of the direct titration of a metal with an aminopolycarboxylic acid ligand
M Mt eq 0 0middot middotl lC V C V= (1)
Because the left side member of equation (1) can be calculated from the titration data either the number of moles of the target metal ( M
0 0middot lC V ) or its concentration (if
a measured volume 0lV of the metal cation solution has
been delivered to the titration vessel) can be readily obtained
Please note that in each point of the titration specified by the value of the variable t
lV a defined analytical
concentration MAPCAC of the aminopolycarboxylic acid
exists in the titrated solution This concentration can be calculated from relation (2)
M
M t tAPCA
t 0
middot l
l lC V
CV V
=+
(2)
Analogously in each point of the titration it exists a concentration of the target metal cation M
MeC which can be calculated from relation (3)
M
M 0 0Me
t 0
middot l
l lC V
CV V
=+
(3)
From equations (2) and (3) we see that while the variable t
lV is increased during the titration the analytical concentration of the aminopolycarboxylic acid (which is initially zero) increases while the analytical concentration of the metal cation decreases Since M
APCAC increases and
MMeC decreases during the titration there will be a point
when they become equal and relation (4) is verified
M MAPCA MeC C= (4)
This point is by definition the equivalence point The aim of any analytical complexometric titration is to identify the value of t
lV for which relation (4) holds in the titrated solution
Evidently condition (1) is derived by combining relations (2) (3) and (4) for t eq
l lV V= The above definition of the equivalence point is
justified from the fact that the fundamental reaction which takes place between the target metal cation Mez+ and an amino polycarboxylate anion APCAn- has a very simple 1 1 stoichiometry shown in (5)
( )zMe APCA MeAPCA n zn minus minus+ minus+ (5)
The equilibrium constant of reaction (5) is generally denoted by β1
( )
1 z
MeAPCA
Me APCA
n z
nβ
minus minus
+ minus
=
(6)
For instance if Mez+ = Zn2+ and APCAn- = EDTA4⁻ we have reaction (7) which would take place during the titration of a solution of Zn2+ with standard EDTA solution
2 4 2Zn EDTA ZnEDTA+ minus minus+ (7)
2165
1 2 4
ZnEDTA10
Zn EDTAβ
minus
+ minus
= =
(8)
Please note that the simple stoichiometry of complexes and the large values of the corresponding formation constants are at the basis of the usefulness of this class of ligands [45]
The metallochromic indicator Inn- which is responsible for the colour change of the titrated solution when the titration is stopped is itself a chelating agent which reacts with the target metal cation according to the simple reaction (9)
( )zMe In MeIn n zn minus minus+ minus+ (9)
( )In
1 z
MeIn
Me In
n z
nβ
minus minus
+ minus
=
(10)
However for the present purposes it is useful to note that Inn⁻ is a base which may exist as several protonated species HhIn
(n-h)⁻ which differ in the degree of protonation and that reaction (9) can be rewritten in the form
( ) ( )zMe H In MeIn Hn h n zh hminus minus minus minus+ ++ + (11)
The outstanding property of a metallochromic indicator is the fact that the free indicator HhIn
(n-h)⁻ has a colour which differs from the colour of the complex MeIn
(n-z)⁻
World Journal of Chemical Education 7
At the beginning of the complexometric titration because of the excess of Mez+ in the titrated solution we see the colour of the complex MeIn
(n-z)⁻ As the titration advances Mez+ progressively disappears from the solution because of reaction (5) until a point is reached when the MeIn
(n-z)⁻ complex is decomposed to the free indicator At this point the colour of the solution changes from that of MeIn
(n-z)⁻ to that of HhIn(n-h)⁻ As it happens the colour of the HhIn
(n-h)⁻ species depends on the number of bonded protons
As a consequence the colour observed when the MeIn
(n-z)⁻ complex is decomposed depends on the prevailing HhIn(n-h)⁻ species formed which in turn depends on the pH of the titrated solution In order to fix the colour of the solution after the equivalence point the pH of the titrated solution is buffered to a suitable value by adding a pH buffer [2-6] This is unavoidable because it often happens that one or more of the HhIn
(n-h)⁻ species have the same colour as the complex MeIn(n-z)⁻ Obviously if a HhIn
(n-h)⁻ species which has the same colour as MeIn
(n-z)⁻ is formed no change in colour will be observed
In other words a metallochromic indicator is such only in a restricted range of pH in which the prevailing form of the free indicator has a colour which differs from the colour of its complex with the target metal cation For instance one of the most popular metallochromic indicators is Eriochrome Black T (EBT) which corresponds to the structure
The full protonated species of EBT is H2EBT⁻ which has a red colour and is the prevailing species up to pH asymp 65 The dissociation of a proton from H2EBT⁻ produces HEBT2⁻ which has a blue colour and is the prevailing HhEBT(3-h)⁻ specie in the pH range ~ 7 lt pH lt ~ 11 The full deprotonated species EBT3⁻ has an orange colour and prevails at the highest pH Now since the MeEBT(3-z)⁻ complexes have a red colour (regardless of the nature of the metal) it is quite evident that Eriochrome Black T is not a metallochromic indicator at pH lower than about 7
From the above it may also be deduced that a metallochromic indicator is in primis an Acid-Base indicator so much so that a change in colour may be observed in the titrated solution because of an unintended pH change following the addition of the titrant even in a point which is far from the equivalence point of the complexometric titration This event is also prevented by pH buffering the titrated solution
2 The Chemical Complexity of Complexometric Titrations
In spite of the apparent operational simplicity of a direct complexometric titration a very complex chemistry unfolds in the titrated solution as the titration progresses
This chemistry is not of direct interest to the experimentalist but must be considered in detail in order to state the conditions which must be met if accurate results must be derived from a complexometric titration
To give an example consider the titration of a Zn2+ solution pH buffered with an NH3NH4
+ buffer with a standard solution of EDTA in presence of EBT as indicator
In abstract all the reactions listed in Table 1 take place in the titrated solution as the titration progresses
Table 1 List of reactions taking place in an aqueous ammoniacal solution containing Zinc2+ + EDTA + Eriochrome Black T [7] 1 Znsup2⁺+ EDTA⁴⁻ ZnEDTA2⁻ logβ = 16440 2 Znsup2⁺+ EBTsup3⁻ ZnEBT⁻ logβ = 1261 3 Znsup2⁺+ OH⁻ ZnO logβ = 5003 4 Znsup2⁺+ 2OH⁻ Zn(OH)₂ logβ = 11106 5 Znsup2⁺+ 3OH⁻ Zn(OH)₃⁻ logβ 13609 6 Znsup2⁺+ 4OH⁻ Zn(OH)₄ 2⁻ logβ = 14812 7 EDTA⁴⁻+ H⁺ HEDTA3⁻ logβ = 10170 8 EDTA⁴⁻+ 2H⁺ H₂EDTA2⁻ logβ = 16280 9 EDTA⁴⁻+ 3H⁺ H₃EDTA)⁻ logβ = 18960
10 EDTA⁴⁻+ 4H⁺ H₄EDTA logβ = 20960 11 EBTsup3⁻+ H⁺ HEBT2⁻ logβ = 11390 12 EBTsup3⁻+ 2H⁺ H₂EBT⁻ logβ = 18290 13 ZnEDTA2⁻+ H⁺ ZnHEDTA2⁻ logβ = 300 14 ZnEDTA2⁻+ OH⁻ Zn(OH)EDTA3⁻ logβ = 210 15 Znsup2⁺ + NH₃ Zn(NH₃)sup2⁺ logβ = 221 16 Znsup2⁺ + 2NH₃ Zn(NH₃)₂sup2⁺ logβ = 450 17 Znsup2⁺ + 3NH₃ Zn(NH₃)₃ logβ = 686 18 Znsup2⁺ + 4NH₃ Zn(NH₃)₄sup2⁺ logβ = 889 19 NH₃ + H⁺ NH₄⁺ logβ = 9290 20 H₂O H⁺ + OH⁻ logKw = -1400
Figure 1 Histogram representing the equilibrium concentrations of species present in a solution 001 M Zn2+ + 001 M EDTA4- + 025 M NH3 + 025 M NH4
+ + 10-6 M Eriochrome Black T The log of the equilibrium concentration of a selected species can be read in correspondence of the apex of each bar (the length of the bar increases as the concentration of the corresponding species)
This long list of reactions derives from the fact that a metal cation in water is a Broumlnsted acid which forms hydroxo complexes (see reactions from 3 to 6 in Table 1) and the amino carboxylate anion and the indicator are bases which can be protonated (see reactions from 7 to 10 and reactions 11 and 12 in Table 1) Furthermore the presence of the NH4
+NH3 pH buffer introduces an auxiliary ligand ie NH3 which competes with the primary ligand ie EDTA4⁻ for the metal cation (see
8 World Journal of Chemical Education
reactions from 15 to 18 in Table 1) Finally according to reaction 13 and 14 in Table 1 the primary complex ZnEDTA2⁻ may react with H+ to form the acid complex ZnHEDTA⁻ or with OH⁻ to form a basic complex Zn(OH)EDTA3⁻
Since in abstract any reaction taking place in the titrated solution produces a new species it follows that a large number of different species are generally present in the titrated solution during the titration
This point is stressed in Figure 1 for the particular case of a 001 M Zn2+ + 001 M EDTA4⁻ + 025 M NH3 + 025 M NH4
+ + 10-6 M Eriochrome Black T solution This state of affairs is replicated with obvious variations
which depend on the specific nature of the metal cation of the titrating aminopolycarboxylic acid of the auxiliary ligand and of the indicator in any complexometric titration [4589]
Mez+ + 119898119898OHminus Me(OH)119898119898(119898119898minus119911119911)minus rarr 120573120573119898119898OH
APCA119899119899minus + ℎH+ HℎAPCA(119899119899minusℎ)minus rarr 120573120573ℎAPCA
Mez+ + APCA119899119899minus MeAPCA(119899119899minus119911119911)minus
Mez+ + In119899119899minus MeIn(119899119899minus119911119911)minus
In119899119899minus + ℎH+ Hℎ In(119899119899minusℎ)minus rarr 120573120573ℎIn
Mez+ + 119902119902Q119899119899minus Me(Q)119902119902(119899119899minus119911119911)minus rarr 120573120573119902119902
Q
Type 1
Protonation of the primary ligand
Acid and Basic Complexes
Protonation of the indicator
Acid and Basic Complexes
MeAPCA(119899119899minus119911119911)minus + H+ MeHAPCA(119899119899minus119911119911minus1)minus rarr 120573120573HMeAPCA
MeAPCA(119899119899minus119911119911)minus + OHminus Me(OH)APCA(119899119899minus119911119911+1)minus rarr 120573120573OHMeAPCA
MeIn(119899119899minus119911119911)minus + H+ MeHIn(119899119899minus119911119911minus1)minus rarr 120573120573HMeIn
MeIn(119899119899minus119911119911)minus + OHminus Me(OH)In(119899119899minus119911119911+1)minus rarr 120573120573OHMeIn
Side Reactions of Mez+
Primary Reactions
Side Reactions of the primary ligand (APCAn-)
Side Reactions of the Primary Complex (MeAPCA(n-z)-)
Side Reactions of the indicator (Inn-)
Side Reactions of the Metal-Indicator Complex (MeIn(n-z)-)
Type 2Type 3
Type 4Type 5
Side Reactions
1205731205731
1205731205731In
Figure 2 Primary reactions and various types of side reactions typically observed during a complexometric titration Mez+ APCAn- Inn- Qn- represent respectively the target metal cation the amino polycarboxylate anion the indicator and the auxiliary ligand introduced as a component of the pH buffer See Table 1 for examples of each type of reaction
Figure 2 presents a general scheme of the reactions which typically occur during a complexometric titration
In Figure 2 the reactions which take place in the titrated solution are classified as primary reactions which are functional to the titration and side reactions which are unintended reactions due to insuppressible chemical properties of reactants and products of the primary reactions Side reactions are classified as hydrolysis reactions and complex formation reactions of the metal
cation with the auxiliary ligand (symbolized by Qn‒) Then there are in general side reactions of protonation of the primary ligand (APCAn‒) and of the indicator (Inn‒) Finally the reactions of the primary complexes MeAPCA (n-z)‒ and MeIn(n-z)‒ to form acid and basic complexes may occur
Please note that in Figure 2 a special symbol for the equilibrium constant of each type of reaction (which will be used in the following) is introduced Please refer to Table 1 for specific examples of the general reactions in Figure 2 and for typical values of the corresponding equilibrium constants
Evidently there it is a conspicuous number of reactions in the titrated solution that are unnecessary for the titration but which cannot be suppressed and must then be considered because they have an effect on the yield of the primary reactions and can dramatically change the outcome of the titration
21 Overcoming Side Reactions Side reactions which take place during a
complexometric titration enormously complicate evaluations and discussions concerning this type of titrations
By the way of example suppose that you want to translate the simple condition (4) ie M M
APCA MeC C= which defines the equivalence point of the titration via the equilibrium concentrations [] of the species present in the solution
To this end one may start by writing the mass balances for the metal and aminopolycarboxylic acid in the solution
The mass balance of the metal contains a long list of species
( )
middotmiddot middotmiddot2
middotmiddotmiddotmiddot middotmiddot2 3
middotmiddot middotmiddot middotmiddot
[ ( ) ]
[ ] [ ( ) ] ][
M zMeC Me Me OH
MeQ Me Q Me Q
MeAPCA MeHAPCA
Me
MeOHAP
O
C
H
A
+ = + + +
+ + +
+ +
(12)
The same happens for the mass balance of the aminopolycarboxylic acid ligand
middotmiddot middotmiddot middotmiddot
2
middotmiddot middotmiddot middotmiddot
[ ]MAPCAC APCA HAPCA H APCA
MeAPCA MeHAPCA MeOHAPCA
= + + + + +
(13)
Please note that many of the species bear a charge For brevity when appropriate two dots (ie ) will be used as placeholders respectively for the size and sign indicating the charge For instance APCA ≣ APCAn⁻ MeOH ≣ MeOH
(z-1)+ MeHAPCA ≣ MeHAPCA(z-n+1)⁻ etc
Using mass balances (12) and (13) condition (4) at the equivalence point becomes
( )
middotmiddot middotmiddot2
middotmiddotmiddotmiddot middotmiddot2 3
middotmiddot middotmiddot middotmiddot2
[ ( ) ]
[ ] [ ( ) ] [
[ ]
]
zMe MeOH Me OH
MeQ Me Q Me Q
APCA HAPCA H APCA
+ + + +
+ +
= + +
(14)
The mass balances (equation (12) and (13)) and the condition (14) at the equivalence point can be written in a
World Journal of Chemical Education 9
more compact and convenient form by introducing the notion of group of (chemical) species A group of species is simply a collection of species existing in the titrated solution
From equations (12) (13) and (14) we see that the most convenient choice is to define a first group of species which we shall indicate with Mersquo (ie Me prime) collecting all the species containing the metal cation Mez+ but which do not contain the aminopolycarboxylic acid That is we define
( )
( )
middotmiddotmiddotmiddot
middotmiddotmiddot2
middot2rsquo
middotmiddotmiddot middotmiddotmiddot
zMe Me MeOH Me OH
MeQ Me Q
+= + +
+ + + +
By definition the concentration of the Mersquo group [Mersquo] will be
[ ] middotmiddot middotmiddot
2
middotmiddot middotmiddot2
( )
[ ] [ ( ) ]
zMe Me MeOH Me OH
MeQ Me Q
+ = + + +hellip+
+ + +hellip (15)
Analogously it is convenient to define a second group of species indicated by APCArsquo (ie APCA prime) collecting all the species in the solution which contain the aminopolycarboxylic acid ligand but do not contain the metal cation That is
middotmiddot middotmiddot middotmiddot2APCA APCA HAPCA H APCA= + + +
By definition the concentration of the APCArsquo group is middotmiddot middotmiddot middotmiddot
2[ ] [ ]APCA APCA HAPCA H APCA = + + + (16)
Finally we define a complex group of species MeAPCArsquo containing the primary complex MeAPCA plus the basic and acid complexes We have
( )
middotmiddot middotmiddot
middotmiddot
MeAPCA MeAPCA MeHAPCA
Me OH APCA
= +
+
The concentration of the MeAPCArsquo group [MeAPCArsquo] is defined by equation (17)
[ ]
( )
middotmiddot middotmiddot
middotmiddot
MeAPCA MeAPC MeHAPCA
Me OH APCA
= + +
(17)
With definitions (15) (16) and (17) the mass balances of the metal cation and of the aminopolycarboxylic acid and the condition at the equivalence point assume the very compact form
[ ] [ ]MMeC Me MeAPCA = + (121)
[ ] [ ]MAPCA APCA MeAPCA C = + (131)
[ ] [ ]Me APCA = (141)
Thus the analytical concentration of the metal is given in each titration point by the sum of the concentrations of the Mersquo and MeAPCArsquo groups the analytical concentration of the aminopolycarboxylic acid is the sum of the concentrations of the APCArsquo and MeAPCArsquo groups of species finally the equivalence point of a complexometric titration is reached when the
concentrations of the Mersquo group is equal to that of the APCA group
If we now meditate briefly on the above description of the complexometric titration using groups of species and on equations (121) (131) and (141) we realize that this is precisely the same language we would use and relations we would write if in the titrated solution only the single hypothetical reaction (18) took place
Me APCA MeAPCA + (18)
Reaction (18) is a rather bizarre reaction which exposes as reactants and products groups of species rather than as usual real chemical species
Nevertheless we can attribute significance to this strange reaction by convening that it represents any reaction in which any of the species of the Mersquo group reacts with any of the species belonging to the APCArsquo group producing any of the species that make up the complex MeAPCArsquo group of species
In other words reaction (18) describes the overall degree of conversion of the metal cation to a complex which contains the aminopolycarboxylic ligand (regardless of the reactants from which this is accomplished and posing no restrictions on the formed complex except that it must contain the target metal cation and the amino polycarboxylate ligand) Reaction (18) will be called a reaction between groups of species
We can extend this vision to the reactions of the indicator by simply defining two additional groups of species Inrsquo and MeInrsquo
The group of species In- is defined in analogy with group APCA- as
middotmiddot middotmiddot middot2
middotrsquo In In HIn H In= + + +
and its concentration is given by equation (19)
middotmiddot middotmiddot middotmiddot2[In ] In HIn [H In ] = + + +hellip (19)
Group MeIn- is analogous to group MeAPCArsquo and includes beside the pure complex MeIn the acid MeHIn and basic Me(OH)In complexes if they are formed
We have
( )middotmiddot middotmiddot middotmiddotMeIn MeIn MeHIn Me OH In= + +
And
[ ]
( )
middotmiddot middotmiddot
middotmiddot
MeAPCA MeAPC MeHAPCA
Me OH APCA
= + +
(20)
These definitions of the groups Inrsquo and MeInrsquo allow us to define in a very simple way the transition point of the metallochromic indicator
In fact the indicator transition point coincides with the point of the titration when equal concentrations of Inrsquo and MeInrsquo groups are present in the titrated solution and it is then verified relation (21)
[In ] 1[MeIn ]
indicator transition point rarr = (21)
If we meditate about equation (21) which defines the transition point of the indicator we see that this is exactly
10 World Journal of Chemical Education
the expression we would have written if in the titrated solution the only reaction of the indicator was
Me In MeIn + (22)
Reaction (22) is a second reaction between groups of species which during a complexometric titration takes place simultaneously with reaction (18)
Finally we have now developed a formalism which allows a very simple but rigorous description of the chemistry behind a complexometric titration
During a complexometric titration only the two reactions between groups of species Mersquo + APCArsquo MeAPCArsquo and Mersquo + Inrsquo MeInrsquo take place which exposes five groups of species
The equivalence point is reached when [Mersquo] = [APCArsquo] while the metallochromic indicator reaches its transition point when [Inrsquo] = [MeInrsquo] at which point the solution starts changing colour
As a general guide for the accuracy of analytical results derived from the titration it is necessary that a point of the titration exists in which simultaneously [ ] [ ] Me APCAasymp
and [ ]In [MeIn ]asymp This is as to say that the change in colour of the indicator must take place as close as possible to the equivalence point
An indicator which changes colour much before the equivalence point (that is when [ ] [ ] Me APCA ) is said to have low sensitivity for the given titration (and will produce an error in defect on the amount of metal cation determined from the titration) Analogously it is understood that an indicator with too high sensitivity for the titration at hand changes colour much after the equivalence point (that is when [ ] [ ] Me APCA ) and it will produce an error in excess on the amount of metal cation determined from the titration
Although the sensitivity of the indicator is not the only factor which must be considered it follows that for accurate results at least an indicator of appropriate sensitivity for the planned titration must be at hand
22 Calculation of the Concentrations of Groups of Chemical Species
As we have shown in the previous paragraph one may think that during the titration of a metal cation with an aminopolycarboxylic ligand are formed invariably only five groups of species (ie Mersquo APCArsquo MeAPCArsquo Inrsquo and MeInrsquo) by two reactions between groups of species
On the contrary a variable and relatively large number of individual chemical species (which depends on the nature of the metal cation on the nature of the aminopolycarboxylic ligand and on the nature of the pH buffer and indicator) are present in the titrated solution
As it will become apparent in the following it is a worth undertaking to extend this picture by evaluating the concentrations of the five groups of species
In abstract there are at least two procedures by which the concentrations of the five groups of species in the titrated solution can be evaluated
Procedure 1 The first way of calculating group concentrations is almost trivial It consists in abstract in using suitable software for calculating the concentrations of the individual species in each point of the titration The
titration data and a long list of reactions with the corresponding equilibrium constants are entered and the software will output for any selected value of t
lV an array containing the equilibrium concentration [] of each of the species present in the titrated solution Concentrations in this array are then grouped according to the definitions (15) (16) (17) (19) and (20) and summed to obtain respectively [Mersquo] [APCArsquo] [MeAPCArsquo] [Inrsquo] [MeInrsquo]
Figure 3 represents the outcome of this procedure when applied to the solution presented in Figure 1
Each bar in Figure 3 (except bars with labels H+ OH⁻ NH3 and NH4
+) collects several bars of Figure 1 and this is the reason because Figure 3 is much simpler than Figure 1 Nevertheless Figure 3 gives a great deal of information on the fundamental chemical features of the represented solution
For instance we can easily deduce that the overall yield of the primary complex formation reaction is very high simply because the concentration of the complex group ZnEDTArsquo is several orders of magnitude larger than the Znrsquo group concentration Analogously we see that the free form of the indicator is largely prevailing on the zinc-indicator complexes so that the represented solution exposes the colour of the free indicator
Furthermore by confronting Figure 1 with Figure 3 one can get the intriguing idea that they represent respectively a high resolution and low resolution view of the chemistry in the considered solution
The key point is that the low resolution view of the titrated solution is perfectly adequate for practical purposes and most importantly can be achieved without employing great means and it is much easier to present
Procedure 2 The second way for calculating group concentrations only requires [Mez+] for calculating [Mersquo] [APCA] for calculating [APCArsquo] [MeAPCA] for calculating [MeAPCArsquo] [In] for calculating [Inrsquo] and [MeIn] for the calculation of [MeInrsquo]
Please remember that primed symbols represent groups of chemical species while symbols bearing double dot (indicating respectively size and sign of the charge) represent individual chemical species
Figure 3 Histogram representing the concentrations of the five groups of chemical species present in a solution 001 M Zn2+ + 001 M EDTA4- + 025 M NH3 + 025 M NH4
+ + 10-6 M Eriochrome Black T (the same solution presented in Figure 1) The log of the concentration of a selected group of chemical species can be read in correspondence of the apex of each bar
World Journal of Chemical Education 11
In fact this procedure is based on the use of conversion factors which convert [Mez+] to [Mersquo] [APCA] to [APCArsquo] and [MeAPCA] to [MeAPCArsquo] etc
If we indicate these conversion factors according to a common use [58] respectively by αMe αAPCA αMeAPCA we have
[ ] MeMe α middot Mez+ = (23)
middotmiddotAPCA[APCA ] α middot APCA = (24)
[ ] middotmiddotMeAPCAMeAPCA α middot MeAPCA = (25)
Analogously we have
middotmiddotIn[In ] α middot In = (26)
[ ] middotmiddotMeInMeIn α middot MeIn = (27)
Obviously at first sight this procedure does not appear convenient In fact from one side it requires that Procedure1 be executed in order to state the concentrations [Mez+] [APCA] [MeAPCA] [In] and [MeIn] and then in addition it requires that the alfa conversion factors be evaluated
Nevertheless although at present it may not appear clear as the five alfa conversion factors can be evaluated assume that for a described titration all the five alfa coefficients have a definite value which is the same for all the titration points in other words assume that each of the alfa coefficients is constant for a given titration
Then we can elaborate the equilibrium constants of reactions (5) and (9)
( )zMe APCA MeAPCA n zn minus minus+ minus+ (5)
( )zMe In MeIn n zn minus minus+ minus+ (9)
in the following way The equilibrium constant of reaction (5) is
( )
1 z
MeAPCA
Me APCA
n z
nβ
minus minus
+ minus
=
(6)
From equations (23) (24) and (25) we have
[ ]z
Me
Me Me
α+ = (231)
middotmiddot
APCA
[APCA ]APCAα
= (241)
[ ]middotmiddot
MeAPCA
MeAPCA MeAPCA
α = (251)
By substituting equations (231) (241) and (251) in the expression of the equilibrium constant (6) and rearranging we have relation (28)
[ ][ ]
MeAPCA1
Me APCA
MeAPCA middot Me [APCA ]
αβα α
= (28)
By assumption the alfa coefficients are constant for a given titration so that the left side member of equation (28) is constant during a particular titration
If we define the parameter β1rsquo (ie β1 prime) as in equation (29)
MeAPCA1 1
Me APCA
middotα
β βα α
= (29)
equation (28) can be written in the abridged form
[ ][ ]1
MeAPCA
Me [APCA ]β = (30)
When the expression of the β1rsquo parameter is confronted with the reaction between groups of species (18)
Me APCA MeAPCA + (18)
we see immediately that expression (30) is precisely what we would have written by applying the law of mass action to the reaction between groups (18)
Then the parameter β1rsquo defined by equation (29) may be understood simply as the equilibrium constant of the reaction between groups Mersquo + APCArsquo MeAPCArsquo
In order to avoid confusion we shall call β1 (which is an equilibrium constant in the usual sense) absolute equilibrium (or formation) constant while β1rsquo will be indicated (following a widespread usage [2358]) as conditional equilibrium (or formation) constant
Analogously by elaborating the equilibrium constant of reaction (9) on the basis of equations (26) and (27) we obtain
[ ][ ][ ]
In In MeIn1 1
Me In
MeIn
middot Me In α
β βα α
= = (31)
in which β1Inrsquo (ie β1
In prime) represents the equilibrium constant of the reaction between groups Me In MeIn + (that is the conditional formation constant of the metal-indicator complex)
The usefulness of the above elaborations depends on the fact that if for a given titration constant values for the conditional constants exist and if we are able to evaluate them then we can calculate the group concentrations precisely as if they were single species concentrations and treat the reactions between groups of species as if they were standard reactions between species
In fact if constants values of the conditional constants can be secured we can write as many relations between the groups of species in the titrated solution as the number of groups of species and solve the ensuing system of equations to obtain the concentrations of the groups
The system of equations for calculating the groups concentrations [Mersquo] [APCArsquo] and [MeAPCArsquo] is made up by the two mass balance equations (121) and (131) and by the expression (30) of the conditional formation constant of the reaction between groups Mersquo +APCArsquo MeAPCArsquo We have
[ ] [ ]M0 0
t 0
middotMe MeAPCA
l
l lC VV V
= ++
(122)
[ ] [ ]Mt t
t 0
middotAPCA MeAPCA
l
l lC VV V
= ++
(132)
12 World Journal of Chemical Education
[ ][ ]1
MeAPCA
Me [APCA ]β = (30)
The mass balances (122) and (132) have been derived from the mass balances (121) and (131) by using relations (2) for M
APCAC and relation (3) for MMeC
Although the above procedure for obtaining the system of equations (122) + (132) + (30) may appear tedious it must be understood that for any assumed value of t
lV we can obtain the concentrations of the three groups of species [Mersquo] [APCArsquo] and [MeAPCArsquo] in the solution by solving this system of three equations (whatever may be the complexometric titration and however large it can be the number of individual species in the titrated solution)
The form of this system is always the same for all titrations although of course the values of the various parameters and the symbols representing the metal and the aminopolycarboxylic acid ligand may change from titration to titration
In sect32 are presented directives on how a MS Excel sheet for solving the above system of equation can be developed
Please note that we have not considered the problem of calculating [Inrsquo] and [MeInrsquo] since this is in practice irrelevant
In fact in order to evaluate the sensitivity of the indicator it is only required the conditional constant for the reaction between groups Mersquo + Inrsquo MeInrsquo (ie β1
Inrsquo) In the next paragraph we face in detail the problem of
evaluating for a described titration the β1rsquo and β1Inrsquo
conditional formation constants
23 Evaluation of the Conditional Formation Constants β1rsquo and β1
Inrsquo The evaluation of the conditional formation constant
1 β which governs the reaction between groups of species Mersquo + APCArsquo MeAPCArsquo is based on the evaluation of the αMe αAPCA αMeAPCA coefficients whose values are then substituted into equation (29)
MeAPCA1 1
Me APCA
middotα
β βα α
= (29)
From this it should be clear that the absolute formation constant 1β must be known
As a matter of fact in order to evaluate the alfa coefficients all the reactions which take place in the titrated solution (and the corresponding equilibrium constants) must be known
For example for the titration of the Zn2+ cation with EDTA in an ammoniacal buffer a list of reactions and equilibrium constants as the one presented in Table 1 must be at hand
In order to develop general relations which allow the evaluation of the alfa coefficients it is useful to write the relevant side reactions in a general form (see Figure 2)
The ubiquitous hydroxo complexes of the metal cation are supposed to be formed according to the general reaction (32)
( )z OHMe OH Me(OH) m zm mm βminus minus+ minus+ rarr (32)
For specific examples of reaction (32) when Mez+ = Zn2+ see Table 1
From the expression of the equilibrium constant OHmβ
of reaction (32) we readily obtain relation (33) for the
concentaration ( )[Me(OH) ]m zm
minus minus of the general hydroxo complex
( )( OH zMe OH) [Me [OH ]m z mm mβ
minus minus + minus = (33)
If the auxiliary ligand is indicated by the symbol Q ≣ Qn⁻ (eg Q = NH3) the side reactions of zMe + with Q are of the general form (34)
middotmiddot middotmiddot( )z Qq qMe qQ Me Q β+ + rarr (34)
For specific examples of reaction (34) when Q = NH3 and Mez+ = Zn2+ see Table 1
From the expression of the equilibrium constant Qqβ
of reaction (34) we readily obtain relation (35) for the concentaration middotmiddot[Me(Q) ]q of the general middotmiddotMe(Q)q complex
middotmiddot middotmiddot[ ( ) ] [ [] ]Q z qq qMe Q Me Qβ += (35)
Furthermore the side reactions of protonation of the aminopolycarboxylic acid ligand APCAn⁻ ≣ APACA are described by the general reaction (36)
middotmiddot middotmiddot APCAAPCA H H APCAh hh β++ rarr (36)
See Table 1 for specific examples of reaction (36) when APCA = EDTA4⁻
From the expression of the protonation constants of the aminopolycarboxylic acid we readily obtain
middotmiddot middotmiddot[ ] [ ][ ]APCA hh hH APCA APCA Hβ += (37)
Finally acid and basic complexes are formed from the primary complex MeAPCA(n-z)⁻ ≣ MeAPCA according to reactions (38) and (39)
middotmiddot middotmiddot MeAPCAHMeAPCA H MeHAPCA β++ rarr (38)
middotmiddot middotmiddot MeAPCAOHMeAPCA OH Me(OH)APCA βminus+ rarr (39)
See Table 1 for specific examples of reactions (38) and (39) when MeAPCA = ZnEDTA2⁻
From the expressions of the equilibrium constants of reactions (38) and (39) we readily obtain
middotmiddot middotmiddot [ ]MeAPCAHMeHAPCA MeAPCA Hβ + = (40)
middotmiddot middotmiddot( ) [ ]MeAPCAOHMe OH APCA MeAPCA OHβ minus = (41)
By substituting expressions (33) and (35) into relation (15) which defines the Mersquo group concentration we have
[ ]middotmiddot
1 [ ]
[ ]
OH mmz
Q qq
OHMe Me
Q
β
β
minus+
+ = +
sumsum
(42)
World Journal of Chemical Education 13
Analogously by using expression (37) into equation (16) which defines the APCArsquo group concentration we have
[ ] ( )middotmiddot APCAAPCA APCA 1 [H ]hhβ
+ = + sum (43)
Finally we substitute expressions (40) and (41) for the concentration of the acid and basic complexes into relation (17) which defines the MeAPCArsquo group concentration and readily obtain relation (44)
[ ]MeAPCAHmiddotmiddot
MeAPCAOH
1 HMeAPCA MeAPCA
[OH ]
β
β
+
minus
+ = + (44)
If the above relations (42) (43) and (44) are confronted with relations (23) (24) and (25) which define the alfa coefficients we immediately see that
( )middotmiddot1 [ ] [ ]OH m Q qMe m qOH Qα β βminus = + + sum sum (45)
( )APCAAPCA 1 [H ]h
hα β += +sum (46)
( )MeAPCA MeAPCAMeAPCA H OH1 H [OH ]α β β+ minus = + + (47)
Relations (45) (46) and (47) are what it is needed for calculating the coefficients αMe αAPCA and αMeAPCA
In order to calculate the conditional constant for the formation of the metal-indicator complexes from relation (31) only the alfa coefficients αIn and αMeIn must be evaluated (since αMe is already expressed from equation (45))
αIn is very similar to αAPCA and depends on the protonation constants of the indicator according to relation (48)
( )InIn 1 [H ]h
hα β += +sum (48)
in which Inhβ represents the equilibrium constant for the
general reaction of protonation of the indicator
( ) InIn H H In n hnh hh βminus minusminus ++ rarr (49)
αMeIn is very similar to αMeAPCA and depends on the formation constants of acid or basic complexes MeHIn(n-z-
1)⁻ ≣ MeHIn and MeOHIn(n-z+1)⁻ ≣ MeOHIn (if they are described)We have
( )MeIn MeInMeIn H OHα 1 H [OH ]β β+ minus = + + (50)
MeInHβ and MeIn
OH [OH ]β minus are the equilibrium constants of reactions (51) and (52) respectively
middotmiddot middotmiddot MeInHMeIn H MeHIn β++ rarr (51)
middotmiddot middotmiddot MeInOHMeIn OH MeOHIn βminus+ rarr (52)
Although the above derivation may appear tedious all it is necessary to understand it is that the five alfa conversion factors are expressed by relations (45) (46) (47) (48) and (50) which are collected in Table 2 where are also rewritten the relations which connect the absolute formation constants β1 and β1
In to the corresponding
conditional constants β1rsquo and β1Inrsquo through the five alfa
conversion factors As a matter of fact Table 2 contains all the necessary
relations for understanding and using the notions of groups of species and reactions between groups of species which allow a simple but rigorous description of a complexometric titration
Table 2 General relations to be used for calculating alfa conversion factors and conditional formation constants β1rsquo and β1
Inrsquo
( )middotmiddot1 [ ] [ ]OH m Q qMe m qOH Qα β βminus = + + sum sum (45)
( )APCAAPCA 1 [H ]h
hα β += +sum (46)
( )MeAPCA MeAPCAMeAPCA H OH1 H [OH ]α β β+ minus = + + (47)
( )InIn 1 [H ]h
hα β += +sum (48)
( )MeIn MeInMeIn H OH1 H [OH ]α β β+ minus = + + (50)
MeAPCA1 1
Me APCA
middotα
β βα α
= (29)
In In MeIn1 1
Me In
middotα
β βα α
= (31)
Even a superficial inspection of Table 2 will show that the fundamental requirement for the alfa coefficients to be constant during a titration is that the pH of the titrated solution be constant throughout the titration However this does not represent an additional constraint for the execution of the complexometric titration since as we have anticipated in the introduction a constant pH of the titrated solution must be maintained in any case to control the behaviour of the metallochromic indicator
A further condition is that to keep constant αMe the equilibrium concentration of the auxiliary ligand [Q] also must not appreciably change during the titration This condition is generally not satisfied during a practical titration In fact the addition of the titrant will dilute the components of the pH buffer Although this in general has no effect on the pH of the titrated solution [Q] steadily decreases during the titration This implies that αMe decreases and the conditional formation constants increase somewhat during a practical titration (see relation (45) (29) and (31) in Table 1) This effect largely depends on the conditions of a particular titrations and will be neglected in the following since experience shows that it has in most practical cases minor effects on predictions In general the initial value of [Q] can be used for evaluations
Another important point to be stressed is the fact that all the alfa coefficients are ≧ 1
αMe invariably increases by increasing the pH and the concentration of the auxiliary ligand because this favours the side reactions of the metal cation This increase of αMe will produce a corresponding decrease of the conditional formation constants
14 World Journal of Chemical Education
On the contrary αAPCA and αIn will always increase by decreasing the pH and this effect will tend to decrease the value of the conditional constants as the pH of the titrated solution is decreased
αMeAPCA and αMeIn will be in general very close to one because acid and basic complexes are only formed at extreme pH while practical complexometric titrations are performed in the range ~ 4 lt pH lt ~ 12 This is necessary in order to avoid the unfavourable effects due to the drop of β1rsquo and of β1
Inrsquo that generally takes place at very low and very high pH
3 Use of Group Concentrations and Reactions between Groups of Species
After the elaborations in the previous paragraph we are now in a position to perform all the necessary evaluations concerning any complexometric titration by completely ignoring (after the alfa conversion factors and the values of the two conditional constants have been evaluated) the plethora of reactions and species that are present in the titrated solution
In fact in order to expose the analytically relevant aspects of the complexometric titration we only need to assume that in the titrated solution are present the five groups of species [Mersquo] [APCArsquo] [MeAPCArsquo] [Inrsquo] [MeInrsquo] that are formed by the two reactions between groups of species
1Me APCA MeAPCA β+ rarr (18)
In1Me In MeIn β+ rarr (22)
which are governed by the two conditional equilibrium constants β1rsquo and β1
Inrsquo (whose values have been evaluated as described in the previous paragraph)
31 Complexometric Titration Curves In the framework of the model of groups of species and
reactions between groups of species the titration curve for a complexometric titration is the plot representing log[Mersquo] as a function of t
lV or the plot of log[APCArsquo] as a
function of tlV or a plot which contains both the
log[Mersquo]rarr tlV and log[APCArsquo]rarr t
lV curves In abstract titration curves can be calculated by the
following procedure First from the titration parameters (ie M
tC M0C eq
lV β1rsquo and β1
Inrsquo) and from equation (1) we calculate the equivalent volume We have
M0 0
eq Mt
middot ll C V
VC
= (11)
Then we select an array of tlV values covering the
range 0 ≦ tlV ≦ ~ 2middot eq
lV (it is convenient to change from
tlV to Vt(ml) since volumes read on burettes are in
millilitres) For each of the selected Vt(ml) we obtain the
concentrations of the groups of species [Mersquo] [APCArsquo]
and [MeAPCArsquo] in the titrated solution by solving the system of three equations
[ ] [ ]M0 0
t 0
middotMe MeAPCA
l
l lC VV V
= ++
(122)
[ ] [ ]Mt t
t 0
middotAPCA MeAPCA
l
l lC VV V
= ++
(132)
[ ][ ]1
MeAPCA
Me [APCA ]β (30)
A matrix of numbers which we shall call ltMyTitrationMatrixgt is created by transferring in the order of increasing Vt(ml) each calculated array of values Vt(ml) log[Mersquo] log[APCArsquo] log[MeAPCArsquo] in a line of a spreadsheet (eg MS Excel)
ltMyTitrationMatrixgt has four columns (identified by symbols Vt(ml) log[Mersquo] log[APCArsquo] log[MeAPCArsquo]) and each line of the matrix (specified by the value of Vt(ml)) represents a point of the titration
After ltMyTitrationMatrixgt has been compiled it is a simple matter to draw a plot exposing curves log[Mersquo]rarrVt(ml) log[APCArsquo]rarrVt(ml) (and eventually log[MeAPCArsquo]rarrVt(ml))
Obviously at first sight this procedure appears rather tedious because one needs to solve the system of equations (122) (132) and (30) for each of the selected values of Vt(ml) However in the next paragraph it is shown how to develop an MS Excel file which will create ltMyTitrationMatrixgt in a matter of minutes
Aside from that in Figure 4 it is presented such a plot drawn assuming the following typical representative values for the titration data M
tC = 00200 M0C = 00100
ml0V = 500 β1rsquo = 108 and β1
Inrsquo = 104
Figure 4 Complexometric titration curves log[Mersquo]rarrVt(ml) and log[APCArsquo]rarrVt(ml) calculated with the following titration parameters
MtC = 00200 M
0C = 00100 ml0V = 500 β1rsquo = 108 Furthermore
horizontal lines of ordinate -log(β1Inrsquo) = -4 and -log(β1rsquo) = -8 (whose
significance is explained in the text) have been drawn
World Journal of Chemical Education 15
It must be realized that in the frame of the model of groups of species and reactions between groups of species the specific nature of the metal cation and of the aminopolycarboxylic acid ligand (and indicator) are completely immaterial the titration of 50 ml of a 001 M solution of whatsoever metal cation with a 002 M standard solution of any aminopolycarboxylic acid ligand under conditions that happen to produce a value of the conditional constant β1rsquo = 108 will be represented by Figure 4 (with obvious variations in the symbols representing the metal cation and the aminopolycarboxylic ligand)
From Figure 4 we can easily see that the equivalent volume is Veq = 2500 ml corresponding to the crossing point between curves representing APCArsquo and Mersquo (Veq can be read precisely from ltMyTitrationMatrixgt in correspondence of the line where the relation log[APCArsquo] = log[Mersquo] is verified) Moreover at the equivalence point log[Mersquo]eq = log[APCArsquo]eq = -51
In the plot two additional horizontal lines whose ordinates are -log(β1
Inrsquo) and -log(β1rsquo) respectively have been drawn Please note that in Figure 4 β1
Inrsquo ≣ β1rsquo(In) and β1rsquo ≣ β1rsquo(APCA)
Line labelled -logβ1rsquo(In) corresponds to the value of log[Mersquo] for which equal concentrations of MeInrsquo and Inrsquo are present in the solution
This is easily understood on the basis of the expression of the conditional constant for reaction Mersquo + Inrsquo MeInrsquo
[ ][ ][ ]
In1
MeIn
Me In β (31)
The logarithmic form of equation (31) is
[ ] [ ][ ]
In1
In log Me log log
MeIn βminus minus = (311)
From (311) it is quite apparent that when log[Mersquo] = -log(β1
Inrsquo) then [Inrsquo][MeInrsquo] = 1 That is the horizontal line labelled -logβ1rsquo(In) in Figure 4 represents the transition point of the indicator
Nevertheless in order to see the pure colour of Inrsquo it will be necessary to proceed somewhat further the transition point for instance to reach an [Mersquo] value for which [Inrsquo][MeInrsquo] asymp 10 From equation (311) we see that this will happen when log[Mersquo] asymp (-log(β1
Inrsquo) -1) In the case of Figure 4 this implies that the titration will
be stopped when log[Mersquo] asymp -4 -1 = -5 Evidently an indicator for which β1
Inrsquo = 104 is almost ideal for the titration of Figure 4
As can be judged from the value of β1rsquo = 108 (and from the position of the line labelled -logβ1rsquo(APCA) in Figure 4) the indicator appropriate for a given complexometric titration must have under the conditions of the titration β1
Inrsquo ltlt β1rsquo This is obvious since the aminopolycarboxylic ligand must be able to attack and decompose the MeInrsquo complex through the reaction between groups
1In
1
MeIn APCA MeAPCA In
K ββ
+ + rarr =
and this will happen only if β1rsquo ≫ β1Inrsquo
From Figure 4 we see that under typical conditions a metallochromic indicator for which log(β1
Inrsquo) asymp 12 log(β1rsquo)
has an appropriate sensitivity (ie it changes colour close to the equivalence point)
Please note that since both β1Inrsquo and β1rsquo will change
especially by changing the pH and the nature and concentration of the buffer in the titrated solution a metallochromic indicator which is suitable for a given titration under certain conditions can become completely unsatisfying if for instance the pH of the titrated solution is modified
The accuracy of results derived from a complexometric titration also fundamentally depends on the value of the conditional constant β1rsquo of the reaction between groups Mersquo + APCArsquo MeAPCArsquo
This is because hardly if ever it will be possible to select a metallochromic indicator which changes colour exactly at the equivalence point ie when [Mersquo] = [Mersquo]eq This implies that the volume Varr(ml) which we read on the burette when the titration is ended (and which is used instead of Veq(ml) in all evaluations) does as a matter of fact differ from Veq(ml) A reasonable standard of accuracy is to pretend that |Veq - Varr| ≦ 01 ml which is about the precision of volumes delivered by a burette
If we follow the curve representing Mersquo in Figure 4 and if we indicate with [Mersquo]-01 the value of [Mersquo] when a volume of titrant equal to Veq - 01 ml has been added we find log[Mersquo]-01 = -454 Analogously if we indicate with [Mersquo]+01 the value of [Mersquo] when a volume of titrant equal to Veq + 01 ml has been added we find log[Mersquo]+01 = -564 It follows that in the case presented in Figure 4 we can stop the titration anywhere in the range -564 lt log[Mersquo] lt -454 without the difference |Veq - Varr| exceeding 01 ml Then we can meet our standard of accuracy using whatever metallochromic indicator which has under the condition of the titration ~ 354 lt log(β1
Inrsquo) lt ~ 464
From this we deduce that around the equivalent point there is an interval which has the following property if the titration is stopped in this interval then the error on the volume measured from the titration does not exceed 01 ml The fact is that the amplitude of this interval depends on the value of β1rsquo
This interval is already somewhat narrow when as in Figure 4 β1rsquo = 108 (about one log unit) and becomes increasingly narrower as β1rsquo decreases As a consequence if the β1rsquo value drops under the threshold of about 108 it may be extremely difficult or impossible to find an appropriate indicator which allows the set standard of accuracy to be met This is especially true in view of the fact that the number of metallochromic indicators available is limited
For instance Figure 5 presents a complexometric titration performed with the same parameters as titration in Figure 4 except that β1rsquo = 106 has been assumed
This titration hardly will provide accurate results By following the Mersquo curve in Figure 5 we see that at
the equivalence point (at Vt = 250 ml) log[Mersquo]eq = -409 On the other side we have log[Mersquo]-01 = -402 and
log[Mersquo]+01 = -416 In order for this titration to meet our standard of accuracy the indicator must change colour in the narrow interval ~ -416 lt log[Mersquo] lt ~ -40
This may be impossible to realize in practice An additional practical inconvenient of this titration is
the slow decrease of [Mersquo] around the equivalence point which will cause a very gradual change in colour of the
16 World Journal of Chemical Education
indicator and by consequence uncertainty and irreproducibility in locating the moment at which the titration has to be ended
In any case from Figure 5 we can judge that an indicator having β1
Inrsquo = 104 is too sensitive for this titration (as can be seen in the blink of an eye from the position of the horizontal line representing -logβ1
Inrsquo) On the contrary Figure 6 presents titration curves for a
titration performed with the same parameters as titrations in Figure 4 and Figure 5 except that β1rsquo = 1010 has been assumed
This titration will give very easily accurate and reproducible results
Figure 5 Complexometric titration curves log[Mersquo]rarrVt(ml) and log[APCArsquo]rarr Vt(ml) calculated with the following titration parameters
MtC = 00200 M
0C = 00100 ml0V = 500 β1rsquo = 106 Furthermore
reference horizontal lines of ordinate -log(β1Inrsquo) = -4 and -log(β1rsquo) = -6
(whose significance is explained in the text) have been drawn
Figure 6 Complexometric titration curves log[Mersquo]rarrVt(ml) and log[APCArsquo]rarrVt(ml) calculated with the following titration parameters
MtC = 00200 M
0C = 00100 ml0V = 500 β1rsquo = 1010 Reference
horizontal lines of ordinate -log(β1Inrsquo) = -4 and -log(β1rsquo) = -10 (whose
significance is explained in the text) are also shown
By following the Mersquo curve in Figure 6 we see that at the equivalence point (at Vt = 250 ml) log[Mersquo]eq = -61 On the other side from the plot we read log[Mersquo]-01= -46 and log[Mersquo]+01 = -76 In order for this titration to meet our standard of accuracy it is only necessary an indicator which changes colour in the wide interval ~ -46 lt log[Mersquo] lt ~ -76
It will be relatively easy to find an indicator which has under the conditions of the titration a conditional constant higher than about 1036 and lower than about 1066
For instance the indicator specified in Figure 6 which has β1
Inrsquo = 104 has a convenient sensitivity for this titration (as can be judged from the position of line with label -logβ1rsquo(In))
Furthermore because of the rapid variation of [Mersquo] around the equivalence point the change in colour will be very abrupt making the location of the moment at which the titration has to be ended very simple and reproducible
It can be noted at this point that most of the metal cations complexes with aminopolycarboxylic acids have absolute formation constants which largely exceed 1010
However most of the complexometric titrations in practical use are performed with conditional formation constants which generally are under about 1010 because of the drop of the conditional formation constants due to the side reactions mainly of the amino polycarboxylate anion in acidic solutions and of the metal cation with auxiliary ligands which are introduced for a variety of reasons
32 Using MS Excel for Drawing Complexometric Titration Curves
The data necessary to draw complexometric titration curves (like the ones presented above) for specified values of the titration parameters (ie M
tC M0C eq
lV β1rsquo and β1
Inrsquo) can be generated in a matter of seconds after a MS Excel sheet which we shall call ltArrayGeneratorgt has been developed
Data produced by ltArrayGeneratorgt are then copied and pasted as values to a second empty MS Excel sheet which we shall call ltMyTitrationMatrixgt
ltMyTitrationMatrixgt sheet exposes a matrix of numbers with four column and 502 rows Each row (except the first row used for labels indicating the contents of each column) is an array with four elements (corresponding respectively to values of Vt(ml) log[Mersquo] log[APCArsquo] and log[MeAPCArsquo]) that represents one point of the titration In ltMyTitrationMatrixgt MS Excel sheet plots exposing log[Mersquo]rarrVt(ml) log[APCArsquo]rarrVt(ml) and eventually log[MeAPCArsquo]rarrVt(ml) curves are immediately drawn using standard MS Excel menus
In order to develop the ltArrayGeneratorgt sheet in a short time consider Figure 7 which represents the first 12 rows of the corresponding MS Excel sheet
Cells with a pale yellow background contain labels while cells with dashed background are left empty
As a first step enter the following labels ltmiddotmiddotmiddotgt in the indicated cells of ltArrayGeneratorgt sheet
ltBuretterarrVt(ml)gt cell A1 ltCAPCA (M)gt cell B1 ltCMe(M)gt cell C1 lt1+ β1middotCAPCA - β1middotCMegt cell D1
World Journal of Chemical Education 17
ltlog[Mersquo]gt cell E1 ltlog[APCArsquo]gt cell F1 ltlog[MeAPCArsquo]gt cell G1 ltCt(M)rarrgt cell I2 ltC0(M)rarrgt cell I3 ltV0(ml)rarrgt cell I4 lt β1(APCA)rarrgt cell I5 After this enter default values for the titration
parameters In cell J2 enter the default value for the molar
concentration of the standard aminopolycarboxylic acid solution (ie 002) in cell J3 enter the default value for the molar concentration of the metal cation in the titrated solution (ie 0010) in cell J4 enter the default value for the volume in ml of the titrated solution (ie 5000) finally in cell J5 enter the default value for the β1(APCA) (ie 108)
Column A of the ltArrayGeneratorgt sheet is labelled ltBuretterarrVt(ml)gt and must be intended as representing
the burette which delivers the titrant solution As a real burette it can deliver up to 50 ml of titrant and it is graduated each 01 ml Then using standard Excel tools generate in cells from A2 to A502 501 Vt(ml) values from zero up to 50 spaced 01 (see Figure 7)
In cells indicated in the following Table 3 enter the corresponding code (you can copy the code and paste it in the appropriate cell) After this extend with the usual Excel tools the code in cells B2 C2 D2 E2 F3 and G3 up to cells B502 C502 D502 E502 F502 and G502
This will fill columns of the ltArrayGeneratorgt sheet with numbers whose significance is specified in the label identifying each column
Finally cells are formatted as shown in Figure 7 Naturally the default titration parameters in cells J2 J3 J4 and J5 are modified to simulate any planned titration the contents of the ltArrayGeneratorgt sheet are automatically updated on changing the titration parameters
Figure 7 First twelve rows (out of 502 rows) of ltArrayGeneratorgt MS Excel sheet
Table 3 Code to be entered in MS Excel ltArrayGeneratorgt sheet Cell Code B2 =$J$2A2(A2+$J$4) C2 =$J$3$J$4(A2+$J$4) D2 =1+B2$J$5-C2$J$5 E2 =LOG10((-D2+(D2^2+4$J$5C2)^05)(2$J$5)) F3 =LOG10(B3(1+$J$510^E3)) G3 =LOG10($J$5)+E3+F3
Suppose now that you want to verify the performance of the well established direct titration of Zn2+ with a standard 00200 M EDTA solution in an ammoniacal environment in presence of Eriochrome Black T (EBT) as an indicator [46] Consequently according to the standard procedure take in abstract 100 ml of a solution of a Zn2+ salt containing an initial zinc concentration of 0005 M and add a few ml (say 5 ml) of the very popular NH3NH4
+ buffer of pH asymp 10 (this buffer is a concentrated solution which contains about 10 M NH3 and 13 M NH4Cl) Suppose that these operations produce 105 ml of a solution which contains 00048 M Zn2+ + 048 M NH3 + 0062 M NH4Cl and has a pH asymp 102 (calculated from the ratio [NH3[NH4
+] and the Henderson-Hasselbalch equation)
Thus enter 002 in cell J2 00048 in cell J3 and 105 in cell J4 of ltArrayGeneratorgt
In cell J5 of ltArrayGeneratorgt enter the value of the conditional equilibrium constant for reaction between groups Znrsquo + EDTArsquo ZnEDTArsquo From the list of reactions in Table 1 and expressions for the alfa coefficients in Table 2 we evaluate β1rsquo = 345middot108
(numerical details of this calculation can be seen in Table 4)
After this select and copy columns A E F and G of ltArrayGeneratorgt and paste them as values in an empty ltMyTitrationMatrixgt sheet
It is useful to update labels in row 1 by substituting [Znrsquo] [EDTArsquo] and [ZnEDTArsquo] in place of the generic labels [Mersquo] [APCArsquo] and [MeAPCArsquo]
Finally select columns A B and C of ltMyTitrationMatrixgt and insert a line graph with the standard Excel procedure
Optionally using standard Excel tools one can add to the plot lines corresponding to ndashlog(β1rsquo(EDTA)) = -85 and -log(β1rsquo(EBT)) = -38 (see below)
After formatting the plot should appear like the one in Figure 8
From Figure 8 one can see an equivalence point at 2520 ml which is reached when the [Mersquo] group concentration is 10-548 (actually these values are read from ltMyTitrationMatrixgt sheet)
In order to keep the difference |Veq - Varr| ≦ 01 ml an indicator is required which changes colour in the interval -48 lt log[Mersquo] lt -62 (these values can be read in ltMyTitrationMatrixgt sheet in correspondence of Vt = 251 ml and 253 ml respectively)
Is Eriochrome Black T (see sect1) such an indicator In order to answer the above question we need to
calculate the conditional constant for reaction between groups of species Znrsquo + EBTrsquo ZnEBTrsquo
18 World Journal of Chemical Education
This is easily done on the basis of the list of reactions in Table 1 and relations in Table 2 (see Table 4 for details) We calculate β1rsquo(EBT) = 59middot103
Table 4 Calculation of the alfa coefficients and conditional formation constants for the system Zn2+EDTAEBT in an ammoniacal buffer of pH = 102 and [NH3] = 048 M
[ ] [ ]
[ ] [ ]
2 3OH OH OH1 2 3
4 2NH NHOH 3 34 3 31 2
3 4NH NH3 33 33 4
500 38 1111 38 2 1361 38 3
1481 38 4 221 45 2
686 3
10 10 10 (10 ) 10 (10 )
10 (10 ) 10 (048) 10 (048)
10 (048) 10
Zn OH OH OH
OH NH NH
NH NH
α β β β
β β β
β β
minus minus minus
minus
minus minus minus
minus
= + +
+ + +
+ +
= + +
+ + +
+ + 889 4 7(048) 42 10= times
2EDTA EDTA1 2
3 4EDTA EDTA3 4
1017 102 1628 102 2
1896 102 3 2096 102 4
1
1 10 10 10 (10 )
10 (10 ) 10 (10 ) 19
EDTA H H
H H
α β β
β β
+ +
+ +
minus minus
minus minus
= + +
+ +
= + +
+ + =
ZnEDTA ZnEDTAH OH
30 102 21 38
1 H O
1 10 10 10 10 1
ZnEDTA Hα β β+ minus
minus minus
= + +
= + + =
1644 81 1 7
110 345 1042 10 19
ZnEDTA
Zn EDTA
αβ β
α α= = =
times times
2EBT EBT1 2
1139 102 183 102 2
1
1 10 10 10 (10 ) 165
EBT H Hα β β+ +
minus minus
= + +
+ + ==
Figure 8 Graphical presentation of the titration of 105 ml of a 00048 M Zn2+ with standard 002 M EDTA in an ammoniacal solution (048 M NH3 + 0062 M NH4Cl pH asymp 102) in presence of Eriochrome Black T as indicator Reference horizontal lines of ordinate -logβ1rsquo(EBT) = -38 and -logβ1rsquo(EDTA) = -85 are also shown
From this value we deduce that equal concentrations of the red ZnEBTrsquo complex and the blue EBTrsquo indicator are
present when during the titration log[Znrsquo] has dropped to -38 (= -log(β1rsquo(EBT)) The pure blue colour of EBTrsquo will appear somewhat further during the titration when log[Znrsquo] has fallen to about -48 (= -log(β1rsquo(EBT)) - 1)
From this it is clear that the titration will be stopped somewhat before the equivalence point (ie EBT sensitivity is a little low for this titration) but in any case the difference |Veq - Varr| does not exceed ~ 01 ml (which is the set standard of accuracy)
The horizontal line in Figure 8 representing the transition point of the indicator (log[Znrsquo] = -log(β1rsquo(EBT))) helps to understand the above considerations
33 The Special Meaning of the Complexometric Titration of Mg2+ Cation with EDTA
Table 5 presents a list of reactions and of the corresponding equilibrium constants which will be the basis of discussion in this paragraph
The complexometric titration of magnesium with EDTA in presence of Eriochrome Black T as indicator is obviously based on the reactions between groups
Mg1Mg EDTA MgEDTA (EDTA )β+ rarr (53)
Mg1Mg EBT MgEBT (EBT )β+ rarr (54)
Table 5 Primary and side reactions of Mg2+ and Ca2+ cations to be considered for evaluating their titration with EDTA in an ammoniacal buffer [7]
1 Mgsup2⁺+ EDTA⁴⁻ MgEDTAsup2⁻ logβ = 8830 2 Mgsup2⁺+ EBTsup3⁻ Mgsup2⁺EBT⁻ logβ = 7000 3 Mgsup2⁺+ OH⁻ MgOH⁺ logβ = 2583 4 Mgsup2⁺+ NH₃ Mg NH3sup2⁺ logβ = 0230 5 Mgsup2⁺+ 2NH₃ Mg(NH₃)₂sup2⁺ logβ = 0080 6 Mgsup2⁺+ 3NH₃ Mg(NH₃)₃sup2⁺ logβ = -0300 7 Mgsup2⁺ + H⁺+ EDTA⁴⁻ MgHEDTA⁻ logβ = 385 8 Casup2⁺+ EDTA⁴⁻ CaEDTAsup2⁻ logβ = 10610 9 Casup2⁺+ EBTsup3⁻ CaEBT⁻ logβ = 5400
10 Casup2⁺+ OH⁻ CaOH⁺ logβ = 1303 11 Casup2⁺+ NH₃ CaNH₃sup2⁺ logβ = -0200 12 Casup2⁺+ 2NH₃ Ca(NH₃)₂sup2⁺ logβ = -0800 13 Casup2⁺+ 3NH₃ Ca(NH₃)₃sup2⁺ logβ = -0300 14 NH₃ + H⁺ NH₄⁺ logβ = 9290 15 EDTA⁴⁻+ H⁺ HEDTAsup3⁻ logβ = 10170 16 EDTA⁴⁻+ 2H⁺ H₂EDTAsup2⁻ logβ = 16280 17 EDTA⁴⁻+3H⁺H₃EDTA⁻ logβ = 18960 18 EDTA⁴⁻+4H⁺H₄EDTA logβ = 20960 19 EBTsup3⁻+ H⁺HEBTsup2⁻ logβ = 11390 20 EBTsup3⁻+2H⁺H₂EBT⁻ logβ = 18290
Supposing that the sample contains several mgl of magnesium a 100 ml volume is transferred to a titration flask and according to a standard procedure [46] buffered by adding 10 ml of the pH asymp 10 ammoniacal buffer (10 M NH3 + 13 M NH4Cl) Then sufficient Eriochrome Back T indicator powder is added to obtain a clearly visible red colour Finally the solution is titrated with standard EDTA solution until a pure blue colour appears
A representative case of this titration is presented in Figure 9
As can be seen from Figure 9 under the described conditions β1rsquo(EDTAMg) = 83middot107 and β1rsquo(EBTMg) = 14middot105 are calculated from relations in Table 2 and reactions in Table 5
World Journal of Chemical Education 19
Figure 9 Graphical presentation of the titration of 110 ml of 0001 M Mg2+ with standard 002 M EDTA in an ammoniacal solution (091 M NH3 + 0012 M NH4Cl pH asymp 102) in presence of Eriochrome Black T as indicator Reference horizontal lines of ordinate -logβ1rsquo(EBTMg) = -514 and -logβ1rsquo(EDTAMg) = -791 are also shown
Figure 9 is readily generated using ltArrayGeneratorgt MS Excel sheet the given values of the conditional constants and other titrations data given in the legend of the figure
The equivalence point of this titration is Veq = 550 ml and log[Mgrsquo]eq = -547 (as can be read from ltMyTitrationMatrixgt Excel sheet for this titration) Furthermore we have log[Mgrsquo]-01 = -474 and log[Mgrsquo]+01 = -62
The full blue colour of the free Eriochrome Black T indicator is predicted to develop somewhat after the equivalence point (ie the sensitivity of Eriochrome Black T for magnesium is somewhat higher than required) at log[Mgrsquo] asymp (log(β1rsquo(EBT)) -1) = -614 However the titration is stopped within the interval -62 lt log[Mgrsquo] lt -474 which is necessary to keep the absolute accuracy within plusmn 01 ml
Calcium2+ ion is the most common interferent in the determination of magnesium In fact the presence of calcium during the determination of magnesium under the conditions described above introduces two additional reactions between groups From data in Table 5 and relations in Table 2 we have
( ) 101
10 10Ca
Ca EDTA CaEDTA
EDTAβ
+
rarr =
(55)
31
( ) 68 10Ca
Ca EBT CaEBT
EBTβ
+
rarr =
(56)
Figure 10 represents the complexometric titration of magnesium under the same conditions of Figure 9 except that an equal concentration of calcium has been supposed to be present in the titrated solution
As can be seen curve representing log[Carsquo] and line representing -log β1rsquo(EBTCa) have been added
Figure 10 Graphical presentation of the titration of 110 ml of 0001 M Mg2+ + 0001 M Ca2+ with standard 002 M EDTA in an ammoniacal solution (091 M NH3 + 0012 M NH4Cl pH asymp 102) in presence of Eriochrome Black T as indicator Reference horizontal lines of ordinate -logβ1rsquo(EBTCa) = -383 and -logβ1rsquo(EBTMg) = -514 are also shown Simulation has been performed with MS Windows Forms application attached to [9]
The red colour of the solution at the beginning of this titration is essentially due to the complexes of the group MgEBTrsquo This can be seen at the blink of an eye from Figure 10 since line representing -logβ1rsquo(EBTMg) lies much under line representing -logβ1rsquo(EBTCa) (which implies that MgEBTrsquo is much more stable than CaEBTrsquo) As a consequence in order for the indicator to change colour MgEBTrsquo must be decomposed As in Figure 9 this will happen when log[Mgrsquo] asymp (-log(β1rsquo(EBTMg)) -1) = -614
The volume of 002 M EDTA standard solution consumed that in abstract we read on the burette when log[Mgrsquo] asymp -614 is calculated to be Varr = 1108 ml
Evidently this volume is to a very good approximation twice the volume we would have determined if only magnesium was present This is because an equal volume of EDTA is consumed to produce the complex CaEDTArsquo from Carsquo whose concentration when the indicator changes colour has dropped to very low value (≲ 10-82 M as judged from Figure 10)
It is easy to see that the product Mt arrmiddot lC V (=
002middot001108 = 221middot10-4 moles) does not correspond to the number of moles of magnesium but within the accuracy of the titration it represents the sum of the number of moles of calcium and magnesium
Because of this in general the determination of magnesium according to the above procedure is best interpreted on the basis of relation (57)]
M 2 2t arrmiddot Mg CalC V moles moles+ += rarr + rarr (57)
Only in the case one can assure that no calcium is present in the titrated solution relation (57) will give the amount of magnesium in the titrated solution
It must be understood that titrations presented in Figure 9 and Figure 10 although they may appear at first sight
20 World Journal of Chemical Education
very different from each other are practically indistinguishable that is they appear to perform exactly in the same way
This is a demonstration of the fact that titrations with aminopolycarboxylic acids hardly if ever allow the determination of a single metal cation in presence of others (that is complexometric titrations with aminopolycarboxylic acids are not selective)
Although this lack of selectivity is in general considered as a limitation of the technique it is nonetheless useful from a practical point of view
In fact for instance total water hardness is obtained essentially by performing the above titration on a water sample
From equation (57) one gets the idea that if magnesium is absent from the titrated solution the above titration would allow the determination of calcium
In abstract this is true although the sensitivity of Eriochrome Black T for calcium is somewhat low
However in practice calcium cannot be determined by the above titration procedure because of the slowness of the reaction CaEBTrsquo + EDTArsquo CaEDTArsquo + EBTrsquo which is responsible for the change of colour of the titrated solution
In fact if magnesium is absent the initial red colour of the solution is obviously due to the complex CaEBTrsquo and (as a consequence of the slow decomposition of CaEBTrsquo by EDTArsquo) the solution will turn blue very slowly Since visual titrations are performed by continually adding the titrant until the colour change is observed it is easy to see that when the blue colour finally slowly appears in the solution and the titration is stopped the volume that we read on the burette is presumably much larger than the equivalence volume
This is what it is meant when we say that Ca2+ blocks Eriochrome Black T Then another indicator must be used for the complexometric titration of calcium
However there are a number of intriguing ways in which this obstacle can be overcome
The most used chemical device for determining calcium using exactly the same conditions described above for the determination of magnesium rests on the fact that the MgEDTA2⁻ complex can be prepared in a pure solid form as a sodium salt (ie Na2Mg(EDTA))
By adding to the calcium solution a controlled amount of the Na2Mg(EDTA) salt the titration of calcium will change into the titration of magnesium without altering the volume of EDTA consumed in the titration This is because the reaction MgEDTArsquo + Carsquo CaEDTArsquo + Mgrsquo takes place with a very high yield under the described conditions since the CaEDTArsquo complex (β1rsquo(EDTACa) = 10middot1010) is much more stable than the corresponding MgEDTArsquo complex (β1rsquo(EDTAMg) = 83middot107)
This type of titration is usually called a replacement titration
As a matter of fact for many metal cations replacement reactions of the type MgEDTArsquo + Mersquo MeEDTArsquo + Mgrsquo proceed with an high yield so that the complexometric titration of a variety of metals can be reduced to the determination of magnesium (ie Mg2+ can be substituted and titrated in place of the target Mez+ cation)
Even more intriguing is the fact that the titration of magnesium with EDTA in presence of EBT can be
inverted (that is EDTA can be titrated with a standard solution of Mg2+ still using EBT as an indicator) This inverted titration is usually called a back-titration
Figure 11 gives an example of the back-titration of an EDTA solution with a standard 002 M solution of MgSO4 It is supposed that the back-titration is performed under the same conditions as the direct titration (ie the EDTA solution is buffered with about 1 ml of pH asymp 10 ammoniacal buffer each 10 ml of titrated solution) so that the reactions between groups and the corresponding conditional constants are exactly the same as during the direct titration (as can be judged confronting Figure 11 with Figure 9)
Figure 11 Graphical presentation of the titration of 110 ml of 0002 M EDTA with standard 002 M Mg2+ in an ammoniacal solution (091 M NH3 + 0012 M NH4Cl pH asymp 102) in presence of Eriochrome Black T as indicator Reference horizontal lines of ordinate -logβ1rsquo(EBTMg) = -514 and -logβ1rsquo(EDTAMg) = -791 are also shown
As a matter of fact Figure 11 is generated with ltArrayGeneratorgt simply by entering the concentration of the magnesium standard solution in place of that of the EDTA standard solution and vice versa Then data are transferred as usually to ltMyTitrationMatrixgt sheet and labels for EDTArsquo and Mgrsquo are exchanged
By observing Figure 11 it is clear that Eriochrome Black T which is a suitable indicator for the direct titration is not appropriate for the back-titration
In fact obviously during the back-titration the change of colour is reversed and the titration is stopped when the initial blue colour turns to red
This will happen when log[Mgrsquo] asymp -log(β1rsquo(EBTMg)) +1 = -414 and then much after the equivalence point (producing an enormous error in excess on the amount or concentration of EDTA)
Then once again we should change Eriochrome Black T with an indicator of higher sensitivity
However we can circumvent this problem in a very ingenious way if a second burette containing the 002 M EDTA standard solution used for direct titrations is at hand
In this case once we have during the back-titration surpassed the equivalence point and the solution has
World Journal of Chemical Education 21
become red we continue briefly the titration with the EDTA standard solution until the red solution just reassumes the initial blue colour At this point log[Mgrsquo] asymp (-log(β1rsquo(EBTMg)) -1) = -614 as in the direct titration and we are reasonably close to the equivalence point
Obviously we still read on the burette with the magnesium standard solution a volume Varr gtgt Veq However we can correct Varr and evaluate a corrected
arrcorrV volume (to employ in calculations in place of the
erroneous Varr) using relation (58) (which makes use of the concentrations M
t MgC rarr and Mt EDTAC rarr of the magnesium
and EDTA titrating solutions and of the volume of EDTA standard solution ΔVEDTA necessary to re-establish the initial blue colour in the solution after it had become red because of the addition of the standard magnesium solution)
Mt EDTA
arr arr EDTAMt Mg
corr CV V V
Crarr
rarr
= minus ∆ (58)
Equation (58) is very simple in case M Mt EDTA t MgC Crarr rarr= because the correct volume of the
titrating standard magnesium solution is simply obtained by subtracting the small volume of EDTA standard solution just necessary to re-establish the initial blue colour
In abstract arrcorrV represents the volume of magnesium
which would be measured if we were able to stop the back-titration of EDTA with magnesium in the same point we arrest the direct titration of magnesium with EDTA ie when log[Mgrsquo] asymp -log(β1rsquo(EBTMg)) -1 = -614
It is evident that the above described back-titration of EDTA with magnesium has the same absolute accuracy than the direct titration but opposite in sign since actually it is stopped before the equivalence point at log[Mgrsquo]eq = -532
Please note that according to the above described procedure back-titrations end with a solution in the titration flask which has the same colour as the initial solution (which is a rather unusual feature for a visual titration)
Finally the determination of calcium in absence of magnesium can be performed using Eriochrome black T as indicator but two burettes filled respectively with a
Mt EDTAC rarr standard solution of EDTA and a M
t MgC rarr standard solution of magnesium sulphate are needed
First to the calcium solution in a titration flask a slight excess of EDTA is added from the corresponding burette and then the ensuing solution is treated as usual with a few ml of the pH = 10 ammoniacal buffer Finally sufficient Eriochrome Black T indicator is added to develop a distinct blue colour The blue solution is titrated with the magnesium sulphate standard solution until a red colour is developed Finally the initial blue colour is re-
established with the standard EDTA solution The number of moles of calcium can be calculated from the difference between the number of moles of EDTA and the number of moles of magnesium consumed in the titration (which in turn are calculated from the consumed volumes of the two standard solutions and from their concentrations)
Evidently this procedure avoids the formation of the inert CaEDTArsquo complex because the indicator is added after a controlled excess of EDTA (which effectively mask the calcium) has been added
Obviously it is an error to add the Eriochrome Black T powder before the addition of the EDTA excess
As in the case of the replacement titrations the determination of a variety of metals can be reduced using the above procedure to the back-titration of EDTA with a standard magnesium sulphate solution
From the above discussion the special significance of the titration of magnesium with EDTA and vice versa in the context of complexometric titrations with aminopolycarboxylic acid should be apparent
4 Conclusions The chemical origin of the complexity of
complexometric titrations of metal cations with aminopolycarboxylic acids is fully displayed and it is districated by introducing a chemical model based on the notions of groups of chemical species and reactions between groups of chemical species This should help undergraduates to get a better understanding of the old concept of conditional complex formation constant
References [1] Hart J R Ethylenediaminetetraacetic Acid and Related
Chelating Agents in Ullmanns Encyclopedia of Industrial Chemistry copy Wiley-VCH Weinheim 2005
[2] Hage D S Carr J D Analytical Chemistry and Quantitative Analysis copy Pearson Education Inc Prentice Hall N J 2011
[3] Skoog DA West D M Holler F J Fundamentals of Analytical Chemistry 7th ed Saunders College Publishing Philadelphia 1996
[4] Prĭbil R Applied Complexometry Pergamon Series in Analytical Chemistry Volume 5 copy Pergamon Press Ltd Oxford 1982
[5] Ringbom A Complexation Reactions Chapter 14 in Kolthoff IM Elving PJ and Sandell EB (eds) Treatise on analytical chemistry copy The Interscience Encyclopedia Inc New York 1959
[6] Wilson CM Wilson DW Comprehensive Analytical Chemistry Vol IB copy Elsevier Publishing Company Inc New York 1960
[7] Smith RM Martell AE Critical stability Constants Vol 1-4 copy Plenum Press New York 1976
[8] Burgot J L Ionic Equilibria in Analytical Chemistry copy Springer Science+Businiss Media New York 2012
[9] Salvatore F Introduzione allrsquoUso Analitico delle Reazioni di Formazione di Complessi copy CUES editrice srl Fisciano Italy 2011
- For instance one of the most popular metallochromic indicators is Eriochrome Black T (EBT) which corresponds to the structure
-
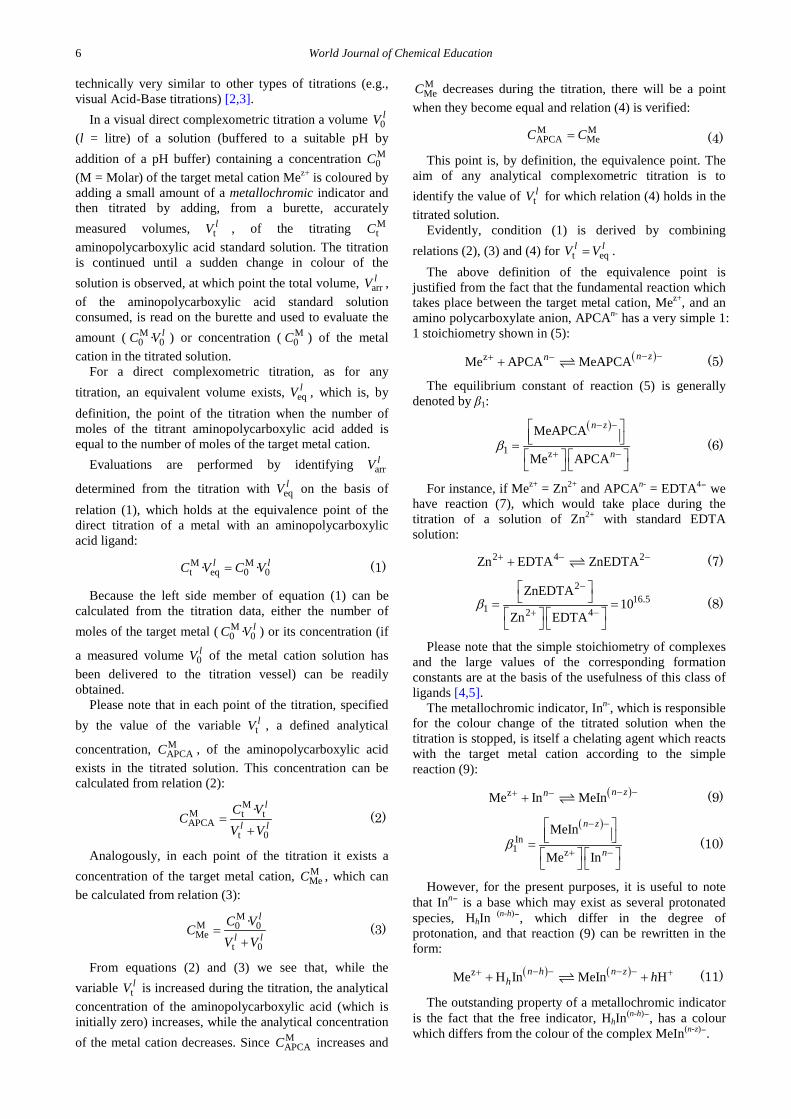
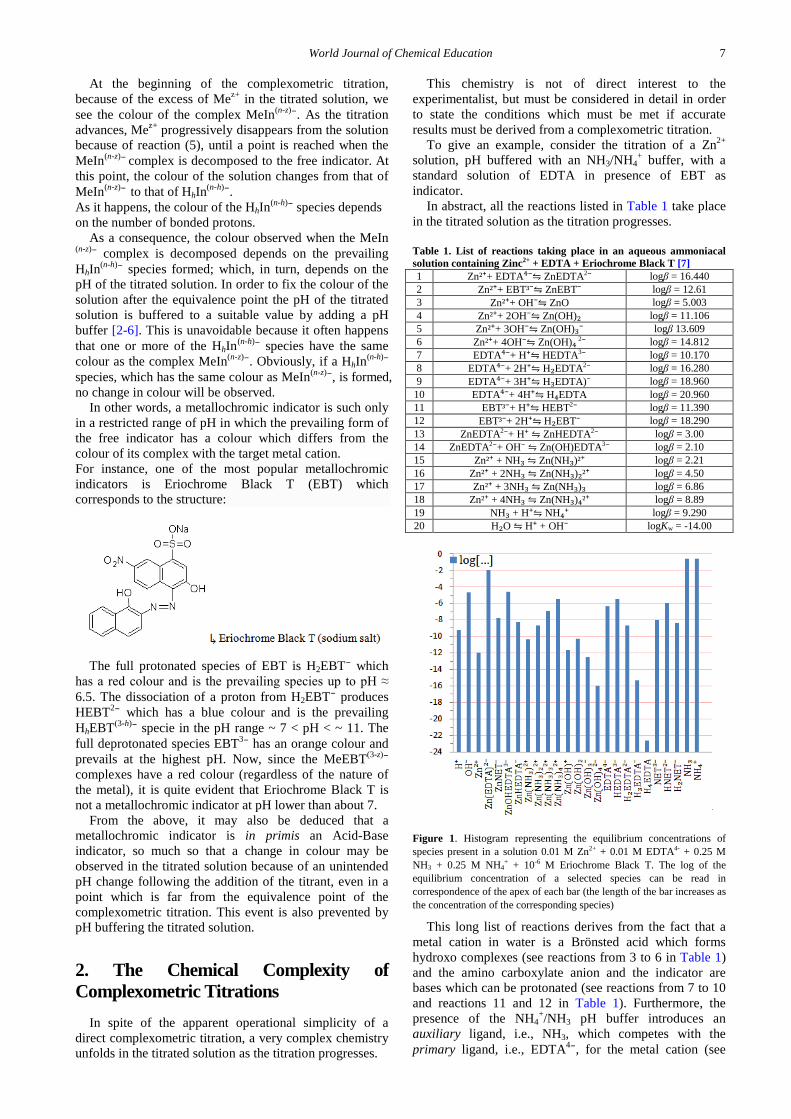
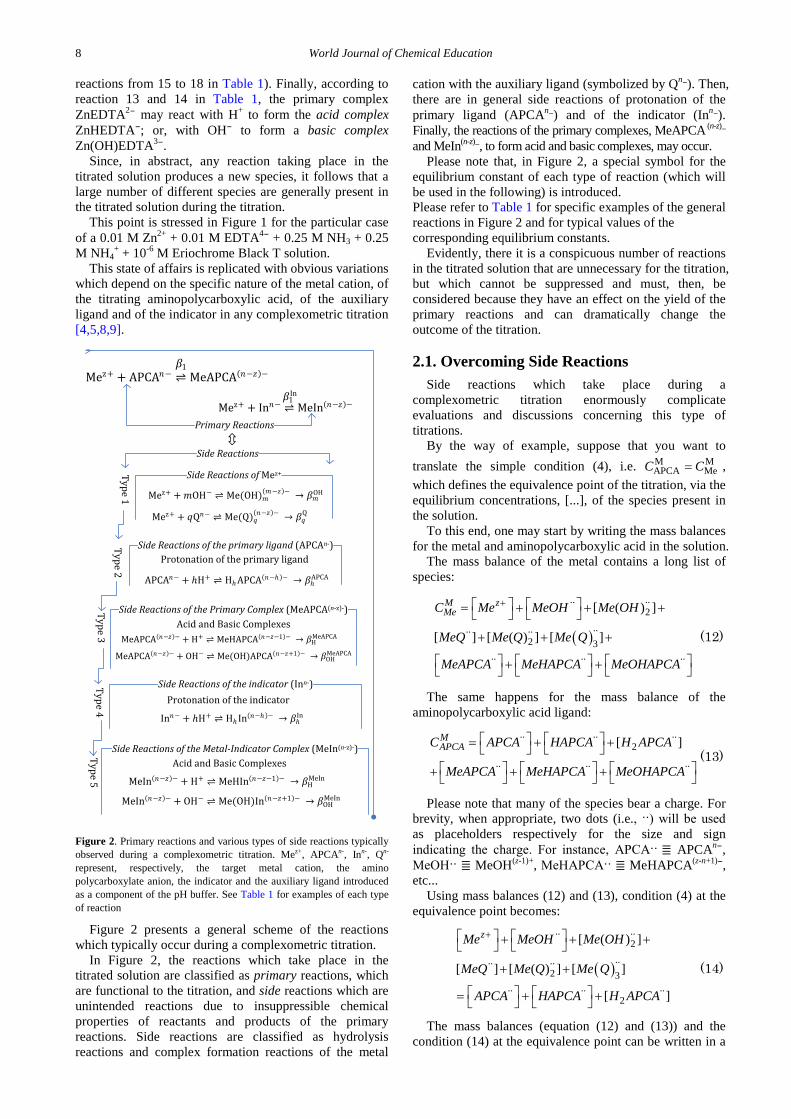
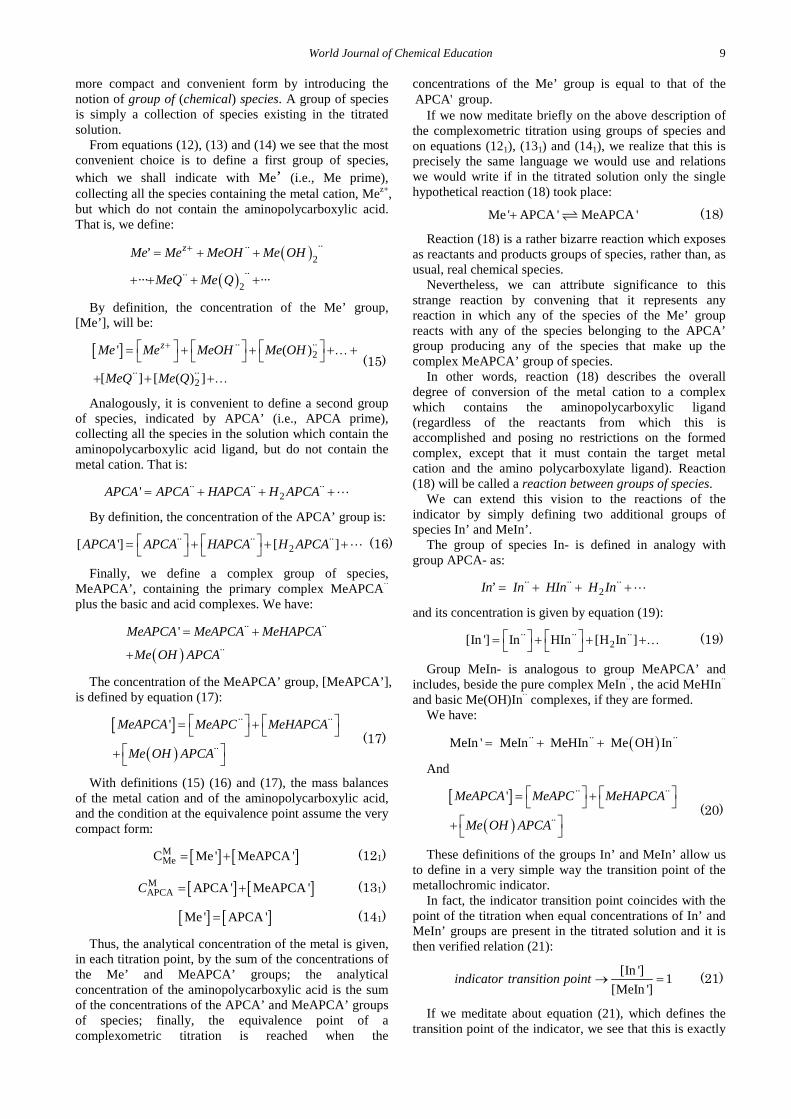
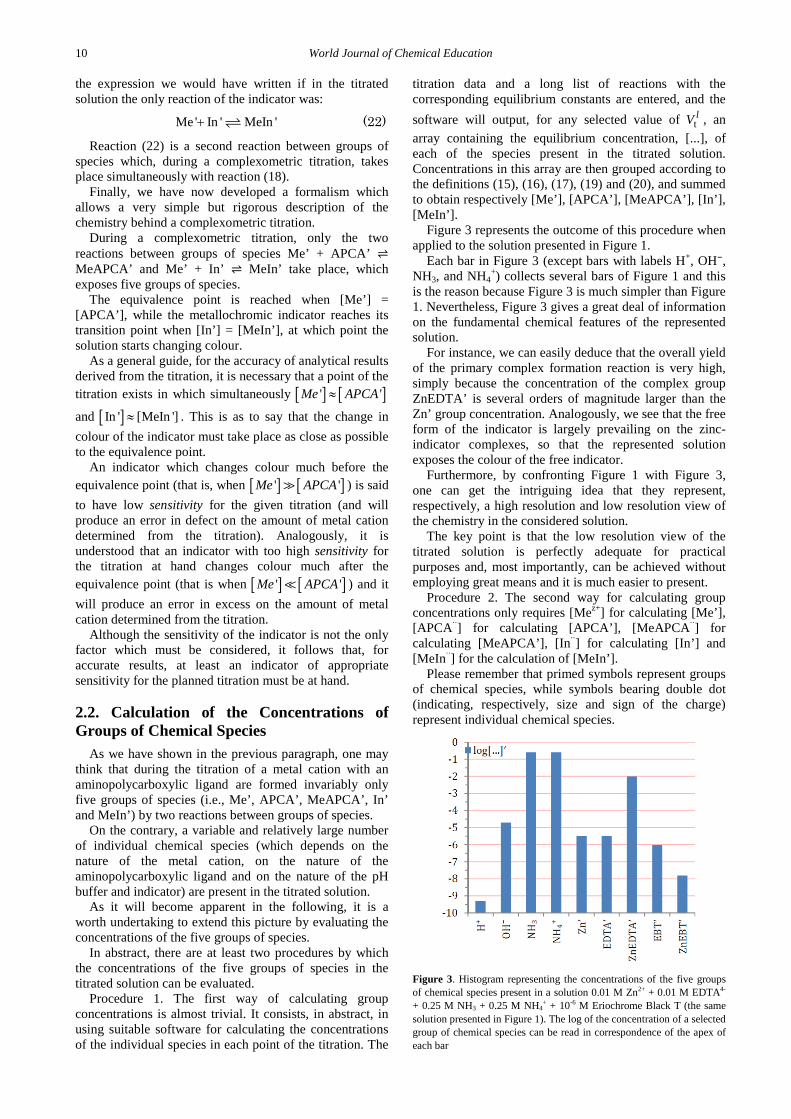
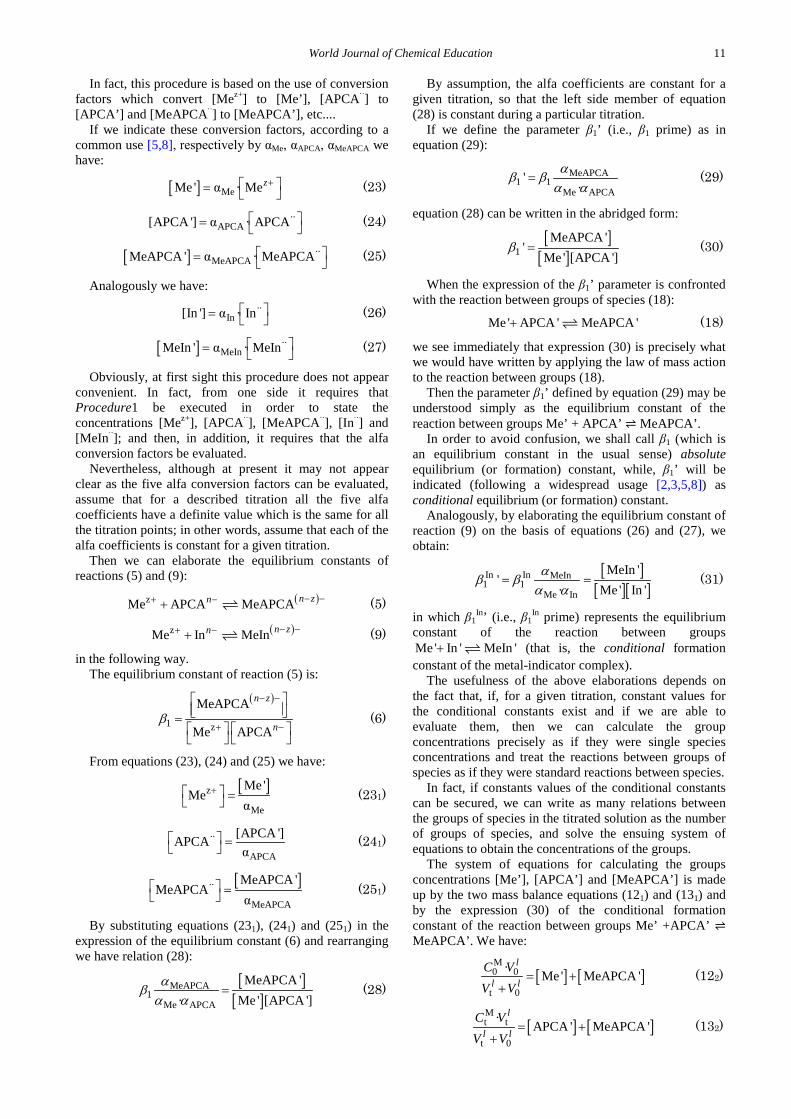
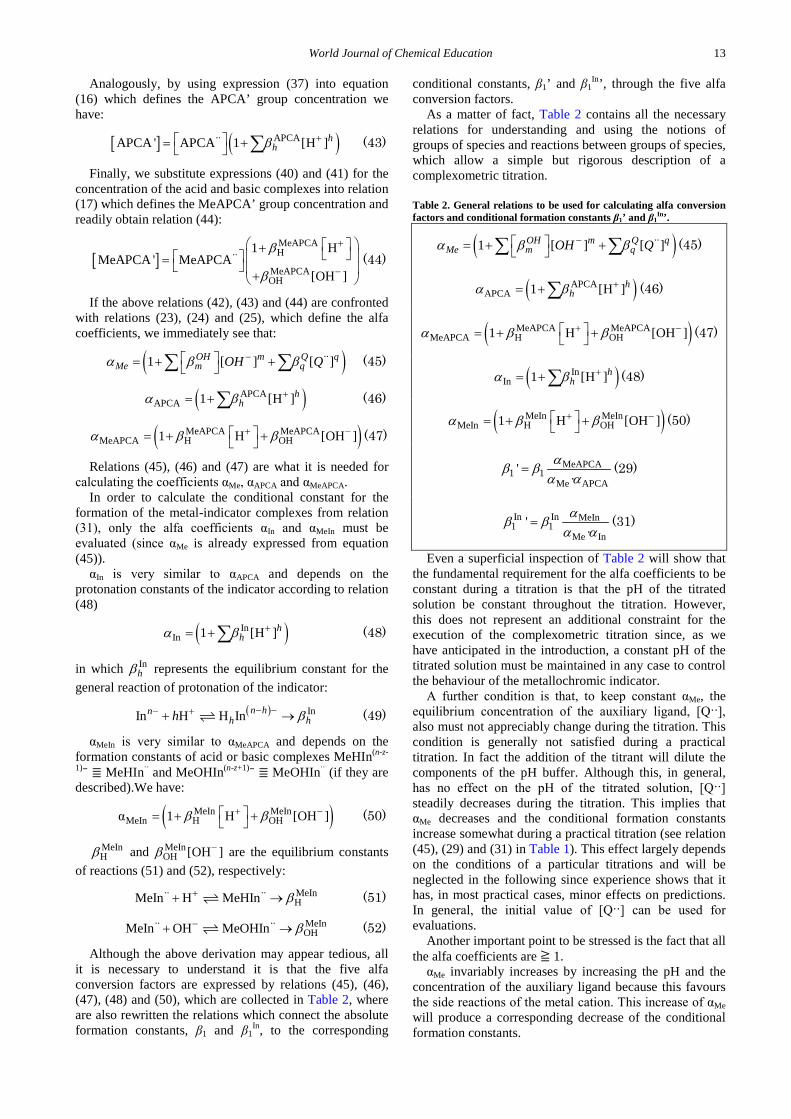
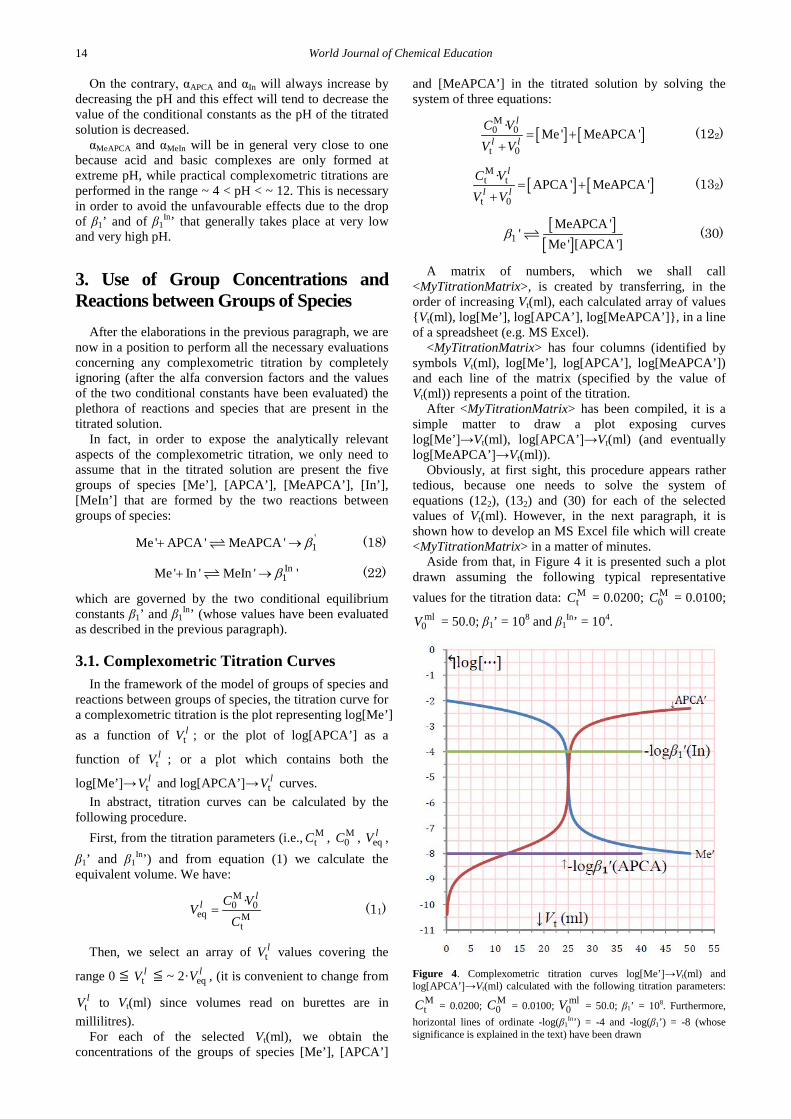
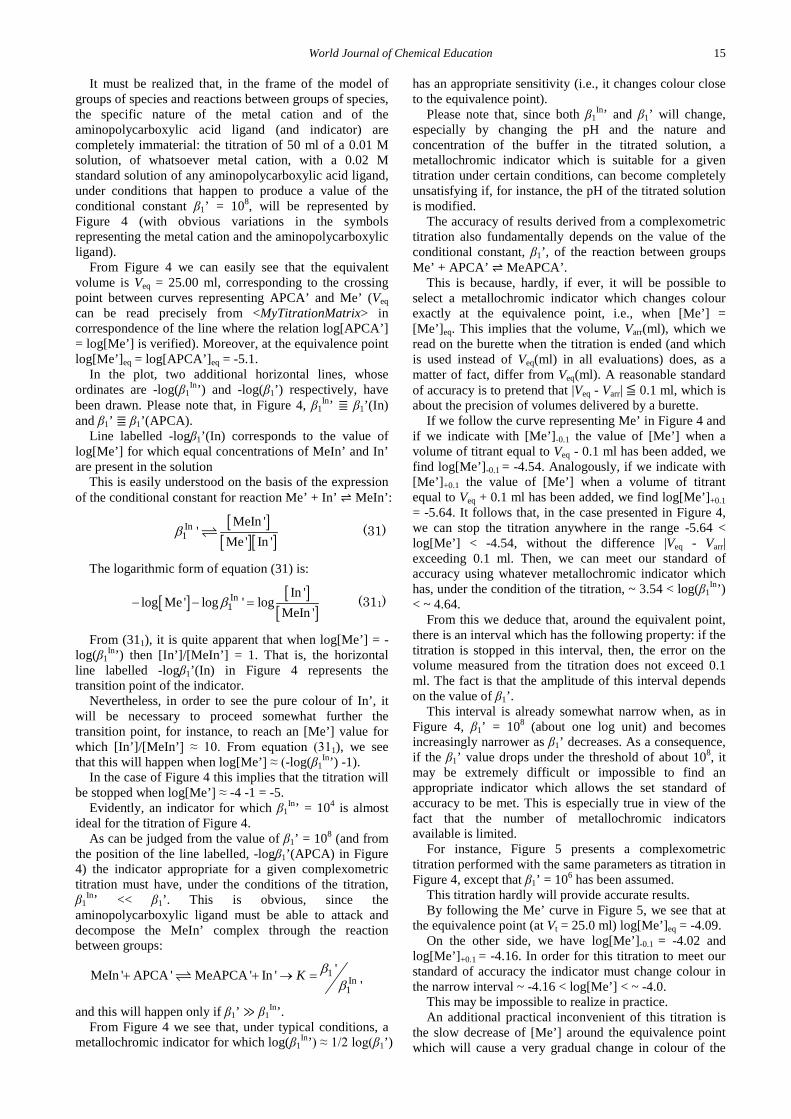
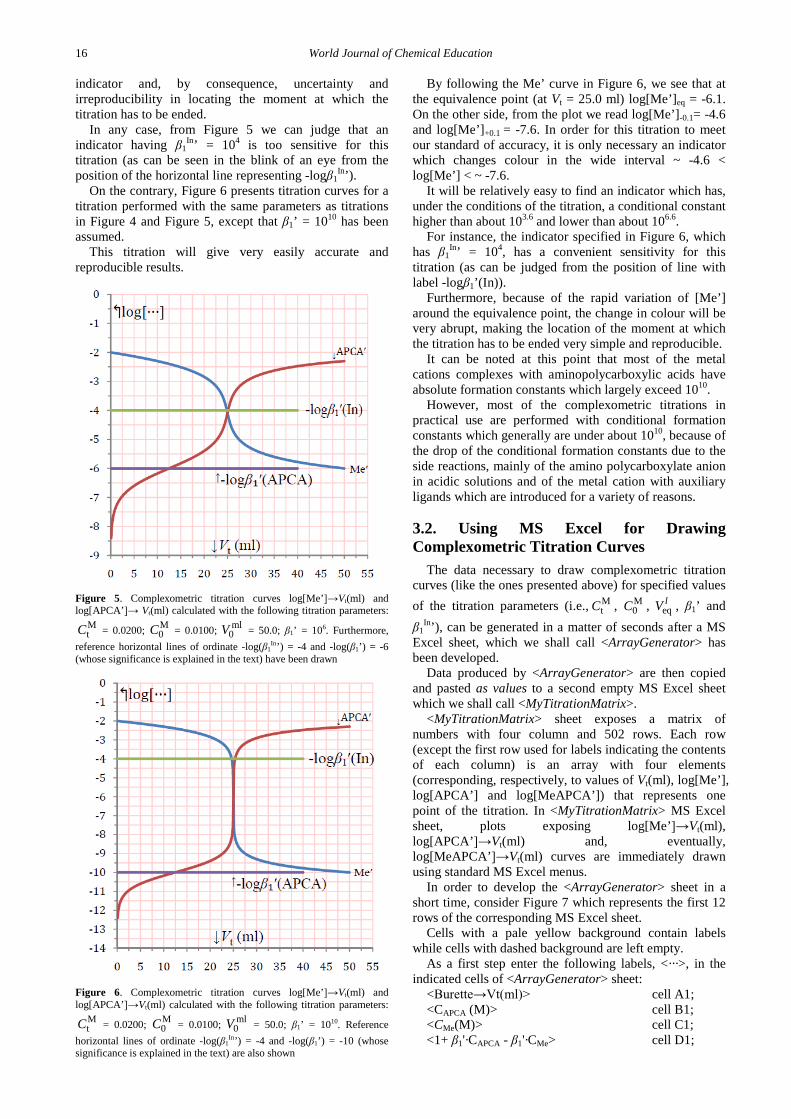
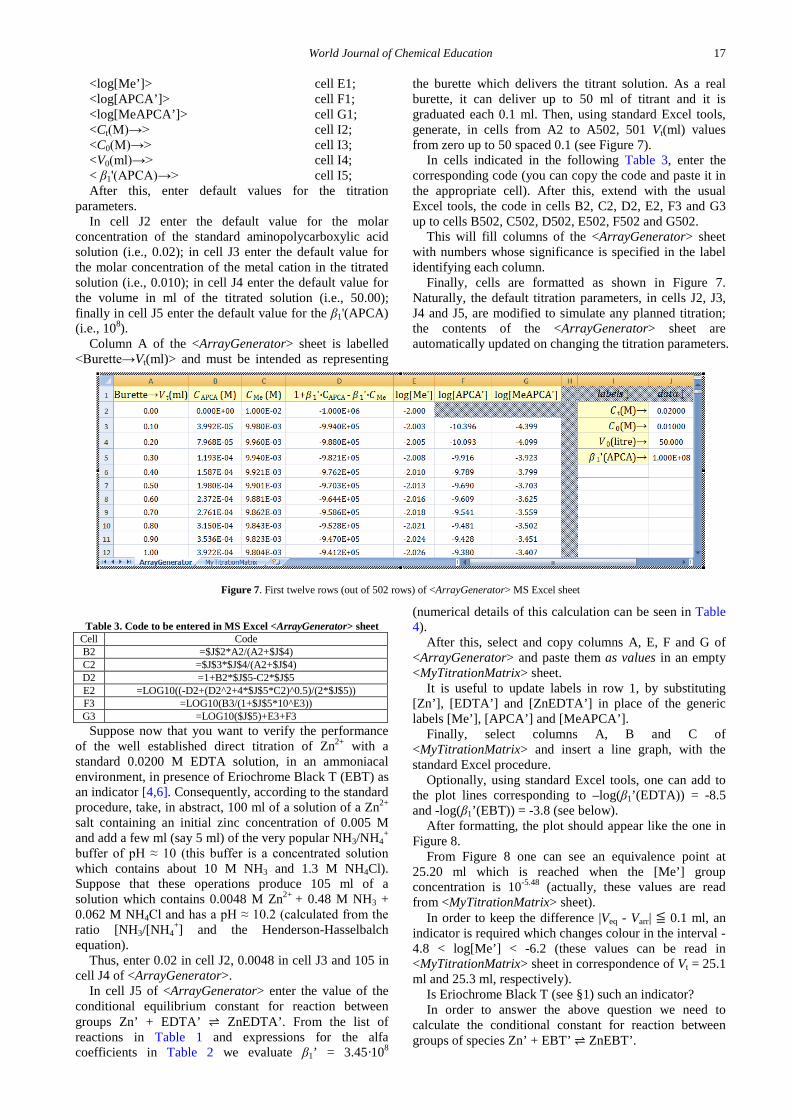
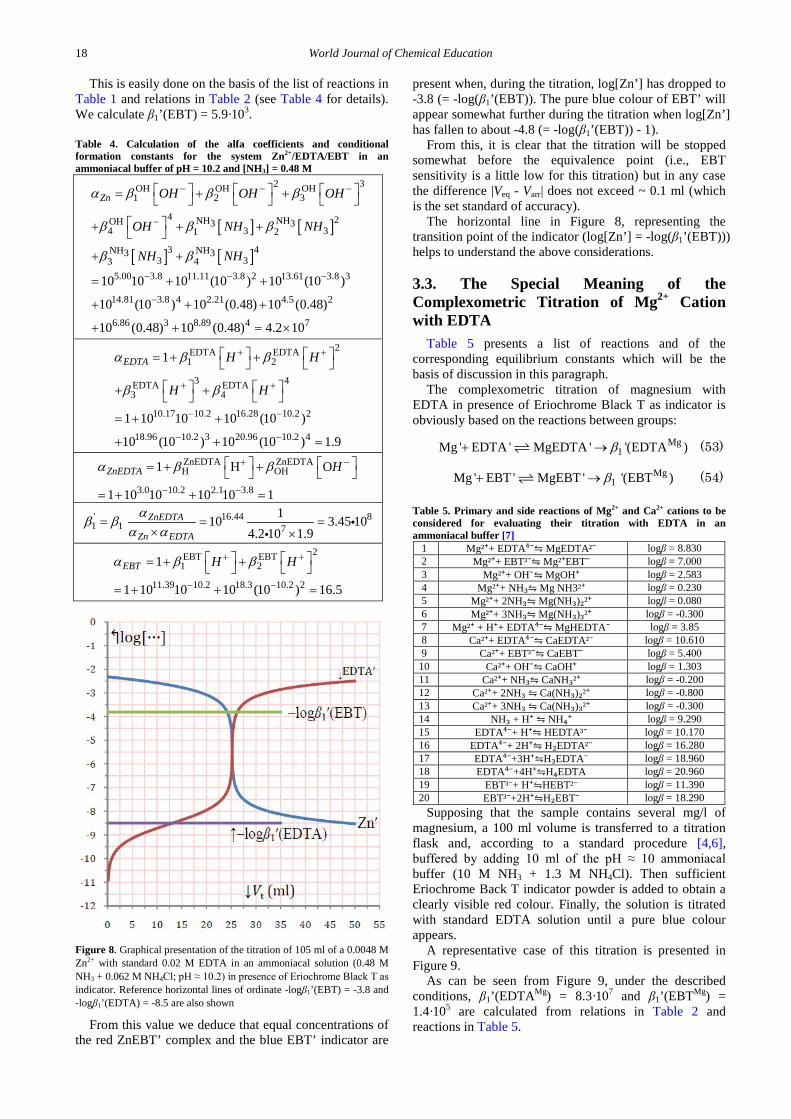
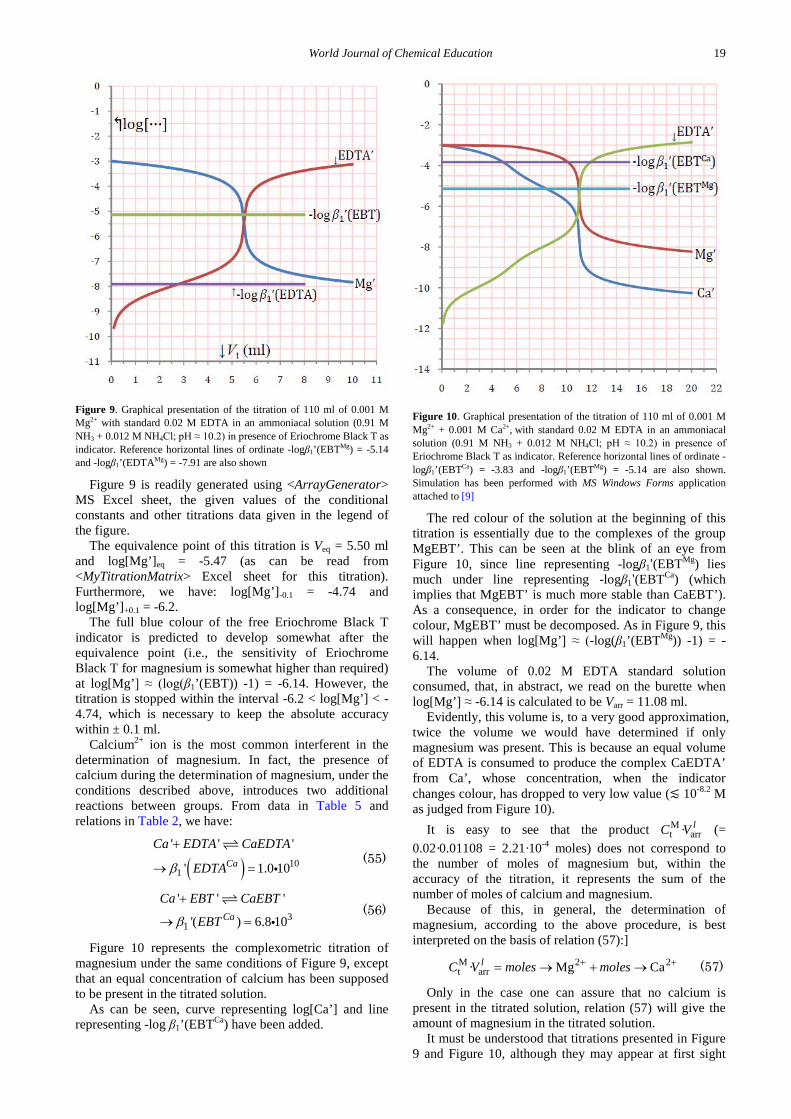
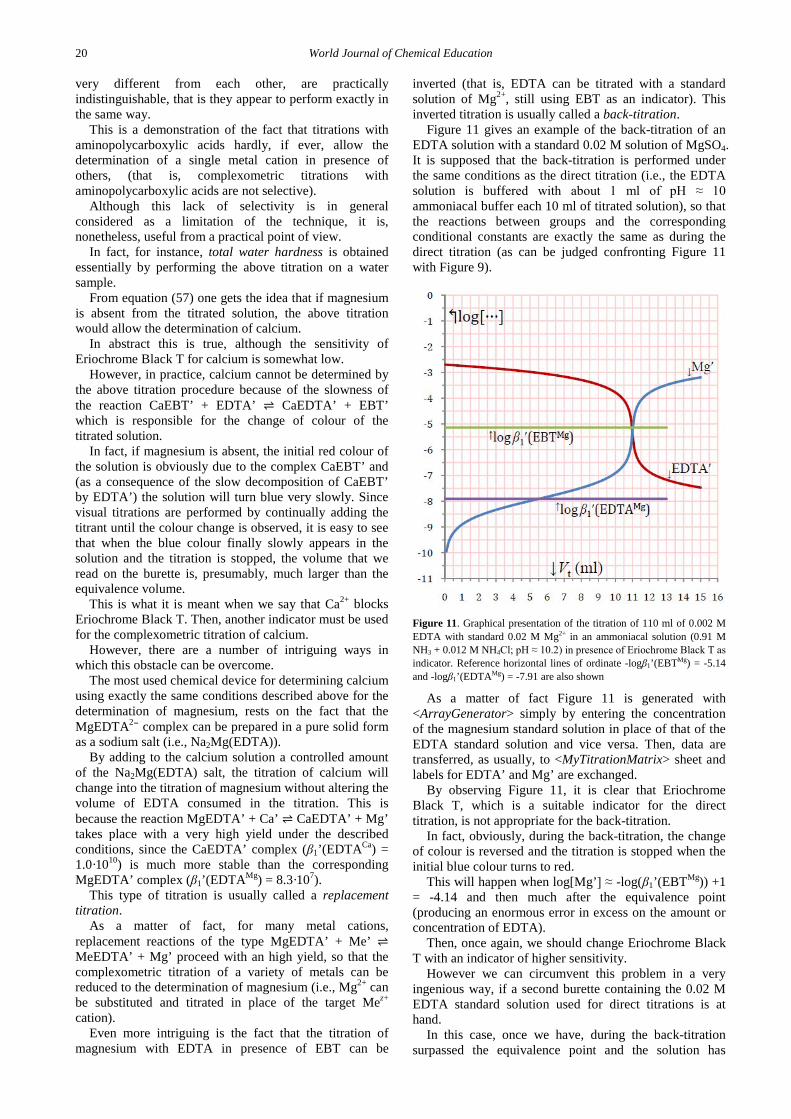