Ultrasharp and high aspect ratio carbon nanotube atomic force microscopy probes for enhanced surface...
7
IOP PUBLISHING NANOTECHNOLOGY Nanotechnology 19 (2008) 235704 (7pp) doi:10.1088/0957-4484/19/23/235704 Ultrasharp and high aspect ratio carbon nanotube atomic force microscopy probes for enhanced surface potential imaging Minhua Zhao 1,2 , Vaneet Sharma, Haoyan Wei, Robert R Birge, Jeffrey A Stuart, Fotios Papadimitrakopoulos and Bryan D Huey 2 Institute of Materials Science, University of Connecticut, Storrs, CT, USA E-mail: [email protected] and [email protected] Received 10 March 2008, in final form 1 April 2008 Published 7 May 2008 Online at stacks.iop.org/Nano/19/235704 Abstract The resolution of scanning surface potential microscopy (SSPM) is mainly limited by non-local electrostatic interactions due to the finite probe size. Here we present high resolution surface potential imaging with ultrasharp and high aspect ratio carbon nanotube (CNT) atomic force microscopy (AFM) probes fabricated via dielectrophoresis. Enhancement of surface potential contrast by several factors is reported for integrated circuit structures and purple membrane fragments for these CNT AFM probes as compared to conventional probes. In particular, ultrahigh lateral resolution (∼2 nm) surface potential images of self-assembled bacteriorhodopsin proteins are reported at ambient conditions, with the implication of label-free protein detection by SSPM techniques. S Supplementary data are available from stacks.iop.org/Nano/19/235704 With the shrinkage of semiconductor devices and development of nano-biotechnology, the study of potential distributions with nanoscale resolution becomes increasingly important. Scanning surface potential microscopy (SSPM) 3 [1–22] is one of the powerful tools for this purpose. Compared to other atomic force microscopy (AFM) techniques, however, SSPM’s lateral resolution is not as impressive, typically in the range of sub-micrometers to 10 nm [1, 4–6, 11–14, 16]. This is primarily because all three parts of an AFM probe (tip apex, tip pyramid or ‘cone’, and cantilever itself) can contribute to the long-range electrostatic forces that are central to SSPM operation. As a result, SSPM-measured potentials are a weighted average from a much larger effective area than the tip apex, degrading the voltage resolution for samples with inhomogeneous surface potentials [23–29]. One solution is to employ force gradient detection techniques such as frequency modulation [8, 15, 30–33], but this typically requires ultrahigh vacuum conditions that either are not available to many users 1 Present address: National Research Council, NIH/NIST joint Research Associateship Programs, USA. 2 Authors to whom any correspondence should be addressed. 3 SSPM is also referred as KFM (Kelvin probe force microscopy) in many literatures. or are impractical for many applications (e.g. biological structures). Another viable solution is to apply a long and narrow tip in order to reduce the non-local electrostatic interactions from the tip cone and cantilever [23–26]. In this context, carbon nanotubes (CNTs) are very promising due to their unique one-dimensional nanostructure, the possibility of electrical conductivity, and robust mechanical properties [34, 35]. In fact, multi-wall carbon nanotubes (MWNTs) have previously been mounted onto a tip apex and used for surface potential imaging [36–38]. Probes with MWNTs tens of nanometers in diameter and protruding hundreds of nanometers beyond the standard AFM tip apex were reported. However, little improvement in potential contrast was achieved compared to that by conventional AFM probes [36], either because the aspect ratio was not improved sufficiently for truly tip-apex-dominated imaging, or because of a non-ohmic contact at the interface between CNT and AFM tip. The lateral resolution for SSPM was also only marginally improved [36–38]. These challenges can be solved, however, with the development of higher aspect ratio probes with sharper ends and better electric contact. In this study we present high resolution surface potential imaging by ultrasharp and high aspect ratio CNT AFM probes 0957-4484/08/235704+07$30.00 © 2008 IOP Publishing Ltd Printed in the UK 1
-
Upload
learn-uconn -
Category
Documents
-
view
7 -
download
0
Transcript of Ultrasharp and high aspect ratio carbon nanotube atomic force microscopy probes for enhanced surface...

IOP PUBLISHING NANOTECHNOLOGY
Nanotechnology 19 (2008) 235704 (7pp) doi:10.1088/0957-4484/19/23/235704
Ultrasharp and high aspect ratio carbonnanotube atomic force microscopy probesfor enhanced surface potential imagingMinhua Zhao1,2, Vaneet Sharma, Haoyan Wei, Robert R Birge,Jeffrey A Stuart, Fotios Papadimitrakopoulos and Bryan D Huey2
Institute of Materials Science, University of Connecticut, Storrs, CT, USA
E-mail: [email protected] and [email protected]
Received 10 March 2008, in final form 1 April 2008Published 7 May 2008Online at stacks.iop.org/Nano/19/235704
AbstractThe resolution of scanning surface potential microscopy (SSPM) is mainly limited by non-localelectrostatic interactions due to the finite probe size. Here we present high resolution surfacepotential imaging with ultrasharp and high aspect ratio carbon nanotube (CNT) atomic forcemicroscopy (AFM) probes fabricated via dielectrophoresis. Enhancement of surface potentialcontrast by several factors is reported for integrated circuit structures and purple membranefragments for these CNT AFM probes as compared to conventional probes. In particular,ultrahigh lateral resolution (∼2 nm) surface potential images of self-assembledbacteriorhodopsin proteins are reported at ambient conditions, with the implication of label-freeprotein detection by SSPM techniques.
S Supplementary data are available from stacks.iop.org/Nano/19/235704
With the shrinkage of semiconductor devices and developmentof nano-biotechnology, the study of potential distributionswith nanoscale resolution becomes increasingly important.Scanning surface potential microscopy (SSPM)3 [1–22] isone of the powerful tools for this purpose. Compared toother atomic force microscopy (AFM) techniques, however,SSPM’s lateral resolution is not as impressive, typically inthe range of sub-micrometers to 10 nm [1, 4–6, 11–14, 16].This is primarily because all three parts of an AFM probe(tip apex, tip pyramid or ‘cone’, and cantilever itself) cancontribute to the long-range electrostatic forces that are centralto SSPM operation. As a result, SSPM-measured potentialsare a weighted average from a much larger effective area thanthe tip apex, degrading the voltage resolution for samples withinhomogeneous surface potentials [23–29]. One solution is toemploy force gradient detection techniques such as frequencymodulation [8, 15, 30–33], but this typically requires ultrahighvacuum conditions that either are not available to many users
1 Present address: National Research Council, NIH/NIST joint ResearchAssociateship Programs, USA.2 Authors to whom any correspondence should be addressed.3 SSPM is also referred as KFM (Kelvin probe force microscopy) in manyliteratures.
or are impractical for many applications (e.g. biologicalstructures). Another viable solution is to apply a longand narrow tip in order to reduce the non-local electrostaticinteractions from the tip cone and cantilever [23–26]. Inthis context, carbon nanotubes (CNTs) are very promisingdue to their unique one-dimensional nanostructure, thepossibility of electrical conductivity, and robust mechanicalproperties [34, 35]. In fact, multi-wall carbon nanotubes(MWNTs) have previously been mounted onto a tip apexand used for surface potential imaging [36–38]. Probeswith MWNTs tens of nanometers in diameter and protrudinghundreds of nanometers beyond the standard AFM tip apexwere reported. However, little improvement in potentialcontrast was achieved compared to that by conventional AFMprobes [36], either because the aspect ratio was not improvedsufficiently for truly tip-apex-dominated imaging, or becauseof a non-ohmic contact at the interface between CNT and AFMtip. The lateral resolution for SSPM was also only marginallyimproved [36–38]. These challenges can be solved, however,with the development of higher aspect ratio probes with sharperends and better electric contact.
In this study we present high resolution surface potentialimaging by ultrasharp and high aspect ratio CNT AFM probes
0957-4484/08/235704+07$30.00 © 2008 IOP Publishing Ltd Printed in the UK1

Nanotechnology 19 (2008) 235704 M Zhao et al
prepared via dielectrophoresis and coated with Au/Pd. TheCNT bundles on these probes are typically several micrometerslong and a few hundred nanometers in diameter along theshaft, tapering down to a 10 nm apex. With these tips, anenhancement of surface potential contrast by several factors isreported on integrated circuit structures and bacteriorhodopsin(BR) membrane fragments, achieving as high as 2 nmlateral resolution for SSPM images on BR proteins. Thisdemonstrates the possibility of identifying nanoscale featuressuch as individual proteins through high resolution surfacepotential imaging via ultrasharp and high aspect ratio CNTAFM probes.
The CNT AFM probes are prepared using an AC dielec-trophoresis technique (supplementary information available atstacks.iop.org/Nano/19/235704 figure S1) as described in de-tail elsewhere [39]. Briefly, laser ablated SWNTs purchasedfrom Tubes@Rice were first purified and shortened followingthe previously established protocol. Next, they were dispersedin deionized water (Millipore, resistivity larger than 18 M�) bysonication and further diluted to a colorless solution with con-centrations ∼0.003 mg ml−1. Commercial platinum coated SiAFM probes (Olympus AC240TM, spring constant ∼2 N m−1
and resonant frequency ∼70 kHz) were used as a working elec-trode for CNT pulling, while a small hollow metal tube (outerdiameter 600 μm, inner diameter 150 μm) holding a drop ofSWNT suspension was used as a counter electrode that wasconnected to an automated XYZ 3D stage. An AC voltage(2 MHz, 10 VPP) was applied between the two electrodes. Anoptical microscope equipped with 100× long working distanceobject lens and a charge-coupled device (CCD) camera moni-tors and records the CNT pulling process in situ. The orienta-tion, length, and diameter of SWNT bundles on the AFM tipapex were examined by a field emission SEM (JOEL 6335F).
Figure 1(a) shows a SEM image of a typical CNT AFMprobe prepared in this manner. The SWNT bundle is ∼5 μmin length and ∼150 nm in diameter. While the SWNTbundle is primarily aligned along the central axis of the AFMprobe, the end is distorted over the final several hundrednanometers. This is caused by capillary forces when theSWNT bundle is removed from the SWNT suspension. Itis worth mentioning that both the length and diameter of theCNT bundle are large compared to other reported CNT probesmade by dielectrophoresis [40]. The purpose of this longerCNT bundle is to reduce electrostatic interactions betweenthe sample and the original (non-CNT) micro-manufacturedprobe (i.e. the tip ‘cone’ and the cantilever itself). Formechanical stability, this longer CNT bundle also requiresa larger diameter to avoid buckling during scanning on thesample surface according to the buckling force Fbuckle ∝R4/L3, where R and L are the bundle radius and lengthrespectively. On the other hand, the large diameter of theCNT bundle will inevitably reduce the spatial resolution ofAFM imaging. To overcome this issue, SWNT bundles are‘sharpened’ to approximately ∼10 nm (figure 1(b)) near theapex by Au/Pd sputtering in a Polaron® Sputter depositionchamber. By coating the entire probe with Au/Pd (figure 1(b)),the distortion at the end of the CNT bundles is removed, anaxially aligned ultrasharp protrusion remains, and electrical
Figure 1. SEM image of SWNT bundles mounted onto the AFMprobe by dielectrophoresis. (a) Before Au/Pd sputtering and (b) afterAu/Pd sputtering, scale bars 10 μm. Inset images presentenlargements of oval areas, scale bars (a) 1 μm and (b) 100 nm.
conductivity is reliably insured without the issue of non-ohmiccontacts.
To demonstrate the capability of such ultrasharp and highaspect ratio CNT AFM probes for enhanced surface potentialimaging, integrated circuit structures (courtesy of Dr RobertGeer at SUNY-Albany) were imaged by these CNT AFMprobes and with standard commercial conducting-AFM probes(Olympus AC240TM). The sample features repeating patternsof copper lines several nanometers in height on SiO2 substrate,and the SSPM was performed at ambient conditions with anAsylum Research MFP-3D AFM using a two-pass technique.During the first pass, the topography was imaged with littlediscernable difference between the two probes (not shown).The second pass raises the probe above the sample by afixed distance (10 nm here) and rescans the surface, followingthe previous-recorded topography to maintain a constant tip–sample separation.
Figure 2 presents SSPM images acquired in this mannerfor the standard and enhanced CNT AFM probes. The darkpotential contrast areas correspond to the copper features,as expected due to the difference of work function betweencopper and silicon dioxide. The bright feature at lowerleft, with no corresponding topographic feature at the samelocation (not shown), is believed to be trapped charge. Forhigh and spatially large potential contrast features such asthese, the enhanced potential contrast by CNT AFM probes is∼50% as shown in figure 2(c) (acquired from cross-sections
2

Nanotechnology 19 (2008) 235704 M Zhao et al
Figure 2. Surface potential mapping of IC chips with total gray scale contrast of 800 mV via (a) conventional AFM probes (b) CNT AFMprobes. The dark and bright features are copper connections and SiO2 substrates, respectively with the exception of ultrabright feature at thelower left, which is trapped charge. (c) and (d) A comparison of potential profiles along the solid (c) and segmented (d) lines by both probes.Dark line is derived by conventional AFM probe while gray line is done by CNT AFM probe.
in figures 2(a) and (b) as sketched). For low and spatiallynarrow potential contrast features (dotted lines in figures 2(a)and (b)), the potential enhancement by CNT AFM probesis more than 300% on the silicon dioxide substrate (smallerfeature) and 100% on the copper lines. It is worth mentioningthat the potential measurement by the standard AFM probe(with decreased contrast) was implemented first, and thus theenhanced potential contrast by the CNT bundle probe is notrelated to dissipation of the trapped charge over time. Thefact that the surface potential resolution with these high aspectratio CNT AFM probes is more enhanced for small featureswith lower potential contrast has important implications formolecular and biological studies such as identifying proteinsor DNA by surface potential differences [41].
To verify this point, surface potential mapping of purplemembrane fragments on HOPG substrates was comparedfor the two types of AFM probes. Wild type BR witha concentration of 5 μg ml−1 was suspended in ultrapuredeionized water and centrifuged for one hour at 12 000 rpm.The above process was repeated for three times to removeaggregates and contaminations. The diluted suspension (10 μl)was applied onto the freshly cleaved HOPG substrate andallowed to sit for 15 min. Then the surface was againrinsed with ultrapure deionized water and dried inside adehumidified chamber. SSPM characterization was performedat ambient conditions (relative humidity ∼55%) with room
light illumination. To minimize contamination of the probesduring scanning, attractive AC-imaging was performed insteadof the more commonly employed repulsive tapping modes.This was achieved by tuning the cantilever at a frequencyseveral hundred hertz higher than its resonance frequency andkeeping the free vibration amplitude less than 10 nm [42].
As shown in figure 3, there are two main features onthe SSPM images (figures 3(a) and (b)). One is the large,oval shaped, 6 nm thick structures, easily identifiable asthe purple membrane fragments [43–45]. The dendritic-like features around the purple membrane fragment edges,on the other hand, exhibit a thickness of only 1–3 nm andhave not previously been reported (supplementary informationavailable at stacks.iop.org/Nano/19/235704 figures S2a andS2b). It is expected that these structures are bacteriorhodopsinproteins which self-assembled or clustered during membranefragmentation and sample preparation, though further workis needed to clearly identify these dendrite-like features.Regardless, when the potential difference between thesemembrane fragments and HOPG substrate is imaged forboth standard and CNT AFM probes, figures 3(c) and (d)demonstrate an improvement in potential contrast by CNTAFM probes of ∼400% at the membrane edge (32 mV versus8 mV potential change in a distance of 47 nm). A higherspatial resolution for potential mapping is also achieved bythese CNT AFM probes when comparing figures 3(a) and (b).
3
Nanotechnology 19 (2008) 235704 M Zhao et al
Figure 3. Surface potential mapping of purple membrane fragments with total gray scale contrast of 120 mV via (a) conventional AFMprobes and (b) high aspect ratio CNT AFM probes. (c) Potential profile along the segmented line by a conventional AFM probe; the potentialchange is ∼8 mV between the two arrows in a distance of 47 nm. (d) Potential profile along the segmented line by a CNT AFM probe. Thepotential change is ∼32 mV between the two arrows in a distance of 47 nm.
For instance, individual dots on the membrane patch arediscernable in figure 3(b), but not in figure 3(a). Thesedots are postulated as BR proteins embedded in the lipidmembrane matrix, which have a lower surface potential thanthe membrane matrix.
It is worth mentioning that the two surfaces of BRmembranes, the extracellular and cytoplasmic surfaces,have different surface morphologies and surface potentials.The extracellular surface appeared cracked whereas thecytoplasmic surface appeared pitted [45]. For the membranepatch displayed here, the surface of the BR membranepatch appears pitted (supplementary information availableat stacks.iop.org/Nano/19/235704 figures S2c and S2d) andtherefore presents the cytoplasmic surface. This should exhibita negative potential upon illumination [43], as revealed infigure 3(b) using the enhanced CNT probe. This negativepotential is not obvious when imaging with a standard probe,however (figure 3(a)), highlighting the benefit of the novelCNT AFM probes.
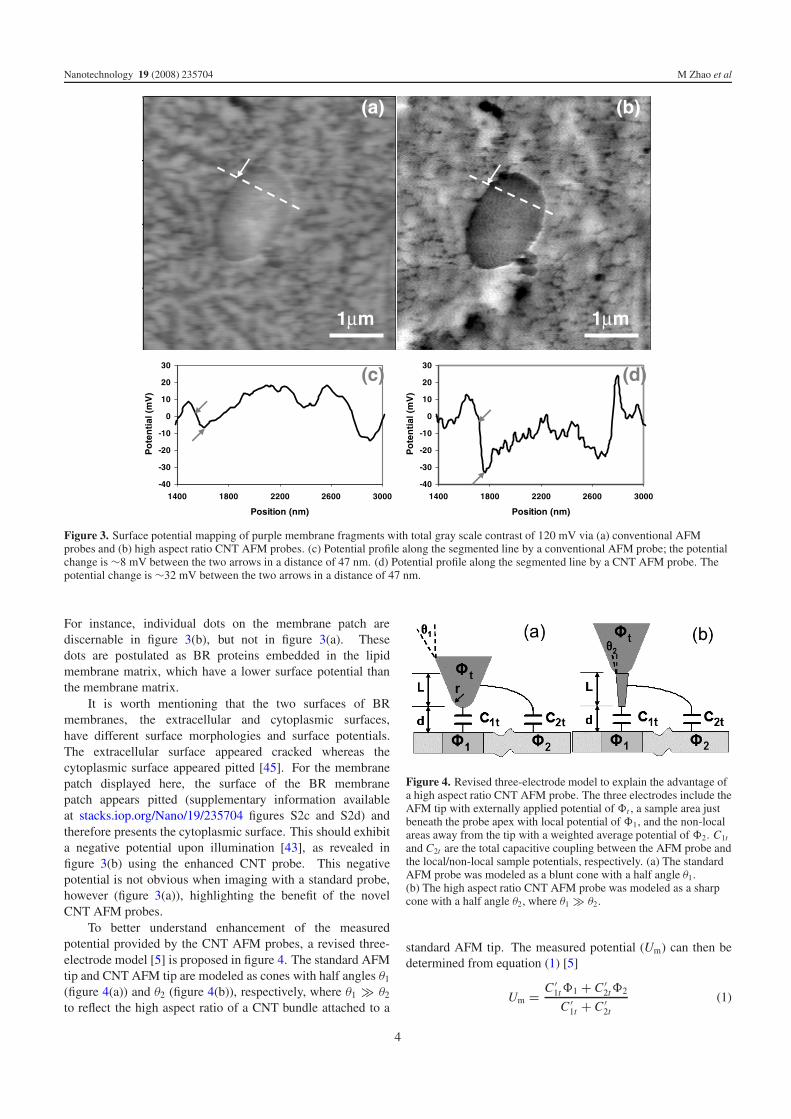
To better understand enhancement of the measuredpotential provided by the CNT AFM probes, a revised three-electrode model [5] is proposed in figure 4. The standard AFMtip and CNT AFM tip are modeled as cones with half angles θ1
(figure 4(a)) and θ2 (figure 4(b)), respectively, where θ1 � θ2
to reflect the high aspect ratio of a CNT bundle attached to a
Figure 4. Revised three-electrode model to explain the advantage ofa high aspect ratio CNT AFM probe. The three electrodes include theAFM tip with externally applied potential of �t , a sample area justbeneath the probe apex with local potential of �1, and the non-localareas away from the tip with a weighted average potential of �2. C1t
and C2t are the total capacitive coupling between the AFM probe andthe local/non-local sample potentials, respectively. (a) The standardAFM probe was modeled as a blunt cone with a half angle θ1.(b) The high aspect ratio CNT AFM probe was modeled as a sharpcone with a half angle θ2, where θ1 � θ2.
standard AFM tip. The measured potential (Um) can then bedetermined from equation (1) [5]
Um = C ′1t�1 + C ′
2t�2
C ′1t + C ′
2t
(1)
4

Nanotechnology 19 (2008) 235704 M Zhao et al
Figure 5. Influence of the remote to local surface potential ratio (��)and capacitance derivative ratio (�c) on SSPM potentialmeasurement accuracy (A). The size of the dark circles at �� = 1represents 100% accuracy, while smaller circles than dark onesindicate an underestimation of the local potential and larger circlesthan dark ones show an overestimation.
where C ′1t and C ′
2t are derivatives of the capacitive couplingbetween the AFM probes and the local and non-local surfacepotentials (�1 and �2), respectively. Under most conditions,the local contribution (C1t ) is dominated by the tip apex,whereas the non-local contribution (C2t ) is almost entirelyrelated to the tip cone [46]. The effect of the cantileveron the potential measurements is neglected due to its largeseparation (∼15 μm) from the sample relative to small distance(10 nm) between the tip apex and sample [46]. Since theSSPM-measured potential (Um) is a weighted average of localand non-local potentials instead of the real local potential�1, equation (1) is modified to equation (2) to represent theaccuracy (A) of SSPM measurements with the ratios �c =C ′
2t/C ′1t and �� = �2/�1.
A ≡ Um
�1= 1
1 + �c+ �c
1 + �c��. (2)
To better understand equation (2), a bubble graph isshown in figure 5 to illustrate the influence of these twoparameters �c versus �� on the measurement accuracy A,indicated by the size of each data point (circles). For a uniformpotential distribution (�� = 1), there is no error in potentialmeasurement (A = 1, dark circles) regardless of the magnitudeof �c. In other cases, however, these ratios (�c and ��) canstrongly influence the measurement accuracy A indicated bycircle size on figure 5. When �� < 1, as the ratio of remote tolocal capacitance derivative (�c) increases, the measured localpotential is strongly underestimated. Conversely, when �� >
1, the SSPM-measured potential is strongly overestimatedwith an increasing remote to local capacitance ratio (�c).Therefore, it is critical to determine �c in order to estimate themeasurement accuracy. We apply a plane surface model [46](equation (3)) to estimate the local capacitance derivative C ′
1tas the tip apex–sample distance d is small.
C ′1t = πε0r 2
d2(3)
where ε0 is permittivity constant (8.854 × 10⁻¹² C2 N−1m−2),r is the radius of tip apex (assumed to be 10 nm for both
standard and CNT AFM probes), and d is the distancebetween the tip apex and sample as shown in figure 4. Thenon-local capacitance derivative C ′
2t was estimated by theuniformly charged line model (equation (4)) where the tip–sample distance is in the ‘intermediate’ range [47].
c′2t = 8πε0 ln
(L
4d
) {ln
(1 + cos θ
1 − cos θ
)}−2
. (4)
In this case, L is the length of the cone, assigned tobe 5 μm for both standard and CNT AFM probes here, θ
is the cone half angle, assigned to 12◦ for standard AFMand 1◦ for high aspect ratio CNT AFM probes. Enteringthese parameters into equations (3) and (4) yields �c ≈0.43 for the high aspect ratio CNT AFM probe and �c ≈1.90 for the standard AFM probe. Consequently, for anydistant-to-local capacitive ratio the CNT AFM probe willprovide better accuracy of the measured potential accordingto figure 5. Specifically assuming �� = 0.01, according toequation (2) the measurement accuracy will be 70% for theCNT AFM probe compared to 35% for the standard AFMprobe. Furthermore, the effect of feature size on measurementaccuracy A can be considered by adjusting the ‘L’ parameterin equation (4). For a smaller feature under the tip apex,the longer part of a tip cone will interact with the non-localpotential features on the sample surface. Thus a larger ‘L’should be assigned in equation (4), which results in a largerC ′
2t , �c and smaller measurement accuracy A. Therefore, highaspect ratio probes provide enhanced surface potential imagingdue to the reduced remote versus local capacitance derivativeratio.
Furthermore, another unique feature of the prepared CNTAFM probes is their ultrasharpness at the end of CNT bundles.Under certain conditions, there is only one SWNT withdiameter smaller than 1nm protruding from the CNT bundles.Hence, high spatial resolution SSPM images are also possibleby these probes. As an example, snow-flake-like featureswith a height of 2–3 nm were occasionally observed nearbylarge purple membrane patches (supplementary informationavailable at stacks.iop.org/Nano/19/235704 figure S3). Sincethe surface potential contrast of these features (figure 6) iscomparable to that of the dendrite-like features of figure 3, theyare also assumed to be self-assembled BRs, only at a muchsmaller spatial scale. At the interface of HOPG and BRs, thepotential profile (figure 6(b)) evidences a voltage drop of 3 mV,larger than the potential noise level (1 mV) over a distance of2 nm (image pixel size = 1.95 nm). This highlights the superbspatial resolution (perhaps better than 2 nm with smaller imagepixel size) in surface potential imaging of nanometer scalefeatures (such as BRs) that can be achieved by ultrasharp andhigh aspect ratio CNT AFM probes. To our best knowledge,this is the highest lateral resolution achieved by SSPM usingforce detection techniques under ambient conditions. Suchhigh lateral resolution in potential imaging supports identifyingindividual proteins based on potential differences, with thepossibility of label-free protein detection by SSPM-basedtechniques. High resolution tip-induced oxidation lithographyis another possible application of these sharp and high aspectratio probes.
5

Nanotechnology 19 (2008) 235704 M Zhao et al
Figure 6. High resolution surface potential imaging ofself-assembled BRs on HOPG substrate via ultrasharp and highaspect ratio CNT AFM probes. Total gray scale contrast is 60 mV.(a) Snow-flake shaped features (b) potential profile along thesegmented line, revealing a ∼3 mV potential difference at the featureedge identified by the arrows across a distance of just 2 nm.
In summary, the potential measurement accuracy basedon force detection method is determined by the ratio ofremote to local capacitance derivative for a sample with anon-uniform potential distribution, which can be effectivelyimproved by employing high aspect ratio CNT AFM probes. Inthe meantime, ultrasharpness at the end of CNT bundles is thekey to high lateral resolution SSPM imaging. Such enhancedand high resolution surface potential imaging achieved byultrasharp and high aspect ratio CNT AFM probes is especiallycritical for nanoscale features of low potential contrast, withpromising applications in the semiconductor industry andbiotechnology such as dopant mapping, and label-free proteindetection.
Acknowledgments
M H Zhao acknowledges a fellowship from the NRCNIH/NIST joint associateship program. Jeremy Kosci-elecki is acknowledged for providing the BR membraneproteins. All experimental work was supported by ARO(DAAD19-1-0381).
References
[1] Nonnenmacher M, Oboyle M P and Wickramasinghe H K 1991Appl. Phys. Lett. 58 2921–3
[2] Stern J E, Terris B D, Mamin H J and Rugar D 1988 Appl.Phys. Lett. 53 2717–9
[3] Weaver J M R and Abraham D W 1991 J. Vac. Sci. Technol. B9 1559–61
[4] Kikukawa A, Hosaka S and Imura R 1996 Rev. Sci. Instrum.67 1463–7
[5] Jacobs H O, Knapp H F, Muller S and Stemmer A 1997Ultramicroscopy 69 39–49
[6] Nabhan W, Equer B, Broniatowski A and DeRosny G 1997Rev. Sci. Instrum. 68 3108–11
[7] Kitamura S, Suzuki K, Iwatsuki M and Mooney C B 2000Appl. Surf. Sci. 157 222–7
[8] Kitamura S and Iwatsuki M 1998 Appl. Phys. Lett.72 3154–6
[9] Jacobs H O, Knapp H F and Stemmer A 1999 Rev. Sci.Instrum. 70 1756–60
[10] Yasutake M, Aoki D and Fujihira M 1996 Thin Solid Films273 279–83
[11] Yasutake M 1995 Japan. J. Appl. Phys. 1 34 3403–5[12] Fujihira M 1999 Annu. Rev. Mater. Sci. 29 353–80[13] Lu J, Delamarche E, Eng L, Bennewitz R, Meyer E and
Guntherodt H J 1999 Langmuir 15 8184–8[14] Sugimura H, Saito N, Maeda N, Ikeda I, Ishida Y, Hayashi K,
Hong L and Takai O 2004 Nanotechnology 15 S69–75[15] Schwarzman A, Grunbaum E, Strassburg E, Lepkifker E,
Boag A, Rosenwaks Y, Glatzel T, Barkay Z, Mazzer M andBarnham K 2005 J. Appl. Phys. 98 4
[16] Ono S and Takahashi T 2005 Japan. J. Appl. Phys. 144 6213–7
[17] Chen L W, Ludeke R, Cui X D, Schrott A G, Kagan C R andBrus L E 2005 J. Phys. Chem. B 109 1834–8
[18] Palermo V, Palma M and Samori P 2006 Adv. Mater.18 145–64
[19] Puntambekar K, Dong J P, Haugstad G and Frisbie C D 2006Adv. Funct. Mater. 16 879–84
[20] Chen S H 2007 Microsc. Res. Tech. 70 325–8[21] Seemann L, Stemmer A and Naujoks N 2007 Microelectron.
Eng. 84 1423–6[22] Seemann L, Stemmer A and Naujoks N 2007 Nano Lett.
7 3007–12[23] Jacobs H O, Leuchtmann P, Homan O J and Stemmer A 1998
J. Appl. Phys. 84 1168–73[24] Ono S and Takahashi T 2004 Japan. J. Appl. Phys. 1
43 4639–42[25] Koley G, Spencer M G and Bhangale H R 2001 Appl. Phys.
Lett. 79 545–7[26] Zerweck U, Loppacher C, Otto T, Grafstrom S and Eng L M
2005 Phys. Rev. B 71 9[27] Huey B D and Bonnell D A 2000 Solid State Ion. 131 51–60[28] Huey B D and Bonnell D A 2000 Appl. Phys. Lett. 76 1012–4[29] Huey B D, Lisjak D and Bonnell D A 1999 J. Am. Ceram. Soc.
82 1941–4[30] Glatzel T, Sadewasser S and Lux-Steiner M C 2003 Appl. Surf.
Sci. 210 84–9[31] Gil A, Colchero J, Gomez-Herrero J and Baro A M 2003
Nanotechnology 14 332–40[32] Palacios-Lidon E and Colchero J 2006 Nanotechnology
17 5491–500[33] Zerweck U, Loppacher C, Otto T, Grafstrom S and Eng L M
2007 Nanotechnology 18 5[34] Nakayama Y 2002 Ultramicroscopy 91 49–56[35] Nakayama Y and Akita S 2003 New J. Phys. 5 128.1–128.23[36] Takahashi S, Kishida T, Akita S and Nakayama Y 2001 Japan.
J. Appl. Phys. 1 40 4314–6
6

Nanotechnology 19 (2008) 235704 M Zhao et al
[37] Maeda C, Ozeki N, Kishimoto S, Mizutani T, Sugai T andShinohara H 2002 Japan. J. Appl. Phys. 1 41 2615–9
[38] Maeda C, Kishimoto S, Mizutani T, Sugai T andShinohara H 2003 Japan. J. Appl. Phys. 1 42 2449–52
[39] Wei H Y, Kim S N, Zhao M H, Ju S-Y, Huey B D,Marcus H L and Papadimitrakopoulos F 2008 Chem. Mater.20 2793–801
[40] Tang J, Yang G, Zhang Q, Parhat A, Maynor B, Liu J,Qin L C and Zhou O 2005 Nano Lett. 5 11–4
[41] Sinensky A K and Belcher A M 2007 Nat. Nanotechnol.2 653–9
[42] Round A N and Miles M J 2004 Nanotechnology15 S176–83
[43] Hartley P, Matsumoto M and Mulvaney P 1998 Langmuir14 5203–9
[44] Knapp H F, Mesquida P and Stemmer A 2002 Surf. InterfaceAnal. 33 108–12
[45] Lee I, Greenbaum E, Budy S, Hillebrecht J R, Birge R R andStuart J A 2006 J. Phys. Chem. B 110 10982–90
[46] Belaidi S, Girard P and Leveque G 1997 J. Appl. Phys.81 1023–30
[47] Hao H W, Baro A M and Saenz J J 1991 Electrostatic andcontact forces in force microscopy Proc. of the 5th Int. Conf.Scanning Tunneling Microscopy/Spectroscopy (Baltimore,MD) (Baltimore, MD: AVS) pp 1323–8
7


![[Revised] Revisiting Verb Aspect in T'boli](https://static.fdokumen.com/doc/165x107/631ef9e50ff042c6110c9f71/revised-revisiting-verb-aspect-in-tboli.jpg)

