UKOPA Product Loss Incidents & Fault Report Mar 2019
32
UKOPA Pipeline Product Loss Incidents and Faults Report (1962 – 2017) March 2019 G D Goodfellow, Dr C J Lyons & Dr J V Haswell
-
Upload
khangminh22 -
Category
Documents
-
view
3 -
download
0
Transcript of UKOPA Product Loss Incidents & Fault Report Mar 2019
UKOPA Pipeline Product Loss Incidents and Faults Report (1962 – 2017)
March 2019
G D Goodfellow, Dr C J Lyons & Dr J V Haswell
Report Number: UKOPA/RP/18/002 Issue: 1.0
©UKOPA Ambergate UK Page ii
UKOPA PIPELINE FAULT DATABASE
Pipeline Product Loss Incidents and Faults Report
(1962 – 2017)
Report of the UKOPA Fault And Risk Work Group
Comprising data from: National Grid
Cadent Northern Gas Networks
Scotia Gas Networks Wales & West Utilities Gas Networks Ireland
BPA Essar Oil (UK) Limited
INEOS Ineos FPS
Sabic Shell
Uniper Wood
and supported by the Health and Safety Executive
Report prepared by G D Goodfellow, Dr C J Lyons & Dr J V Haswell for
FARWG
Report Reference: UKOPA/RP/18/002 March 2019
Report Number: UKOPA/RP/18/002 Issue: 1.0
©UKOPA Ambergate UK Page iii
Comments, questions and enquiries about this publication should be directed to the Chair of the UKOPA Pipeline Fault and Risk Work Group: United Kingdom Onshore Pipeline Operators’ Association Pipeline Maintenance Centre Ripley Road Ambergate Derbyshire DE56 2FZ e-mail: [email protected]
Disclaimer This document is protected by copyright and may not be reproduced in whole or in part by
any means without the prior approval in writing of UKOPA. The information contained in
this document is provided as guidance only and while every reasonable care has been taken
to ensure the accuracy of its contents, UKOPA cannot accept any responsibility for any
action taken, or not taken, on the basis of this information. UKOPA shall not be liable to
any person for any loss or damage which may arise from the use of any of the information
contained in any of its publications. The document must be read in its entirety and is subject
to any assumptions and qualifications expressed therein. UKOPA documents may contain
detailed technical data which is intended for analysis only by persons possessing requisite
expertise in its subject matter.
Report Number: UKOPA/RP/18/002 Issue: 1.0
©UKOPA Ambergate UK Page iv
Summary This report presents collaborative pipeline and product loss incident data from onshore Major Accident Hazard Pipelines (MAHPs) operated by National Grid, Cadent, Northern Gas Networks, Scotia Gas Networks, Wales & West Utilities, Gas Networks Ireland, BPA, Essar Oil (UK) Ltd., INEOS, Ineos FPS, Sabic, Shell, Uniper and Wood, covering operating experience up to the end of 2017. MAHPs are defined by the UK statutory legislation, The Pipelines Safety Regulations 1996 as amended (PSR96), for natural gas, the classification is above 8 bar absolute. The data presented here covers reported incidents where there was an unintentional loss of product from a pipeline within the public domain, and not within a compound or other operational area. The overall failure frequency over the period 1962 to 2017 is 0.212 incidents per 1000 km.year, the same as in the previous report covering the period from 1962 to 2016. The trend continues to show an ongoing reduction in overall failure frequency. The failure frequency over the last 20 years is 0.088 incidents per 1000 km.year whilst in the previous report this figure was 0.084 incidents per 1000 km.year (covering the 20 year period up to the end of 2016). For the last 5 years the failure frequency is 0.110 incidents per 1000 km.year, whilst in the previous report this figure was 0.087 incidents per 1000 km.year (covering the 5 year period up to the end of 2016). This report also presents data for part-wall damage and defects, known as fault data; and the statistical distributions derived for estimating pipeline failure probabilities due to external interference events.
Report Number: UKOPA/RP/18/002 Issue: 1.0
©UKOPA Ambergate UK Page v
Contents
1 Introduction .......................................................................................... 1
Background .................................................................................................. 1
Purpose of the Database .............................................................................. 1
Key Advantages ........................................................................................... 1
2 Pipeline System Data ........................................................................... 3
Exposure ...................................................................................................... 3
Transported Products ................................................................................... 4
3 Product Loss Incident Data ................................................................ 5
Differences between 2016 and 2017 product loss statistics.......................... 5
Incident Ignition ............................................................................................ 6
Incident Frequency ....................................................................................... 7 3.3.1 Trends over the Past 5, 20 and 55 Years .......................................................... 7 3.3.2 Confidence Intervals .......................................................................................... 9
Incident Frequency by Cause ..................................................................... 11
Girth Weld Defects ..................................................................................... 14
External Interference .................................................................................. 15 3.6.1 External Interference by Diameter Class ......................................................... 15 3.6.2 External Interference by Measured Wall Thickness Class .............................. 16 3.6.3 External Interference by Location or Area Classification ................................ 17
External Corrosion ...................................................................................... 18 3.7.1 External Corrosion by Wall Thickness ............................................................. 18 3.7.2 External Corrosion by Year of Construction .................................................... 19 3.7.3 External Corrosion by External Coating Type ................................................. 20
Pipeline Failures Classified as “Other” ........................................................ 21
Pipeline Failures Caused by Internal Cracking ........................................... 22
Detection of Pipeline Failures ..................................................................... 23
4 Fault Data ............................................................................................ 24
Pipeline Damage Data................................................................................ 24
Part-Wall Defect Data ................................................................................. 25
Statistical Distributions of Defect Dimensions ............................................. 26
5 References .......................................................................................... 27
Report Number: UKOPA/RP/18/002 Issue: 1.0
© UKOPA Ambergate UK Page 1 of 27
1 Introduction
Background One of the key objectives of UKOPA is to develop a comprehensive view on risk assessment and risk criteria as they affect Land Use Planning aspects adjacent to, and operational ALARP assessments on, major hazard pipelines. The main multiplier in pipeline risk assessments is the per unit length failure rate, which directly influences the extent of the risk zones adjacent to the pipelines. Historically, regulators and consultants who carry out risk assessments for UK pipelines relied on US and European data to provide the basis for deriving failure rates, due to the shortage of verified published data relating to UK pipelines. To counteract this lack of UK specific data, UKOPA published the first report in November 2000, presenting the first set of data for pipeline incidents resulting in the unintentional release of product up to the end of 1998.
Purpose of the Database The purpose of the database is to:
• Record leak and fault data for UK MAHPs;
• Estimate leak and pipeline rupture frequencies for UK pipelines, based directly on historical failure rate data for UK pipelines;
• Provide the means to estimate failure rates for UK pipelines for risk assessment purposes based on analysis of damage data for UK pipelines; and,
• Provide the means to test design intentions and determine the effect on failure of engineering changes (e.g. wall thickness of pipe, depth of burial, diameter, protection measures, inspection methods and frequencies, design factor etc.)
Key Advantages The database is designed to reflect the ways in which the UKOPA operators design, build, operate, inspect and maintain their pipeline systems. Although the pipeline population is extensive and the data covers over 50 years of operation, there are pipeline groups (e.g. large diameter, recently constructed pipelines) on which no faults or failures have occurred, or for which failure data is not statistically significant; however it is unreasonable to assume that the failure frequency for these pipelines is zero. This UKOPA database contains extensive data on pipeline failures and on part-wall damage known as fault data, allowing prediction of failure frequencies for pipelines for which insufficient failure data exist. Using Structural Reliability Analysis and fracture mechanics techniques it is possible to determine the range of defect dimensions that will cause a specific pipeline to fail; analysis of the statistical distributions of actual defect dimensions from the part-wall defect data allows the probability of a critical defect to be determined and failure
Report Number: UKOPA/RP/18/002 Issue: 1.0
© UKOPA Ambergate UK Page 2 of 27
frequencies for external interference failures to be calculated. This approach has been used extensively and successfully by contributing companies in pipeline uprating projects and quantified risk assessments.
Report Number: UKOPA/RP/18/002 Issue: 1.0
© UKOPA Ambergate UK Page 3 of 27
2 Pipeline System Data
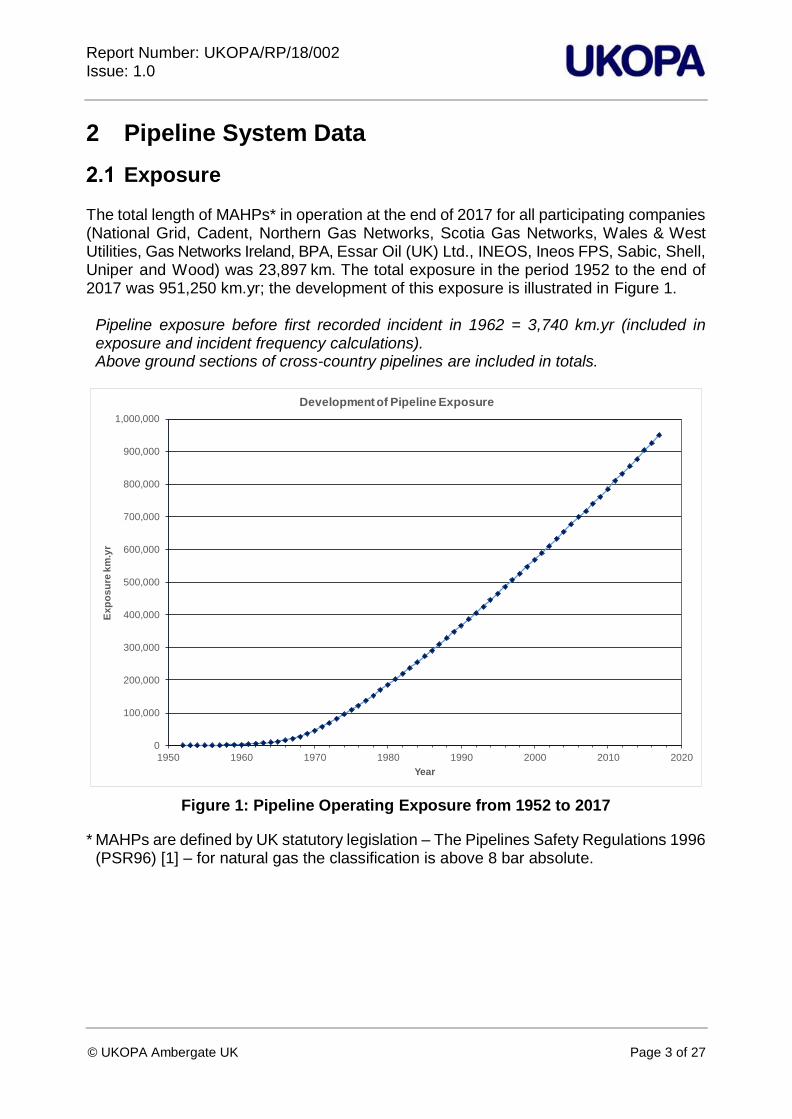
Exposure The total length of MAHPs* in operation at the end of 2017 for all participating companies (National Grid, Cadent, Northern Gas Networks, Scotia Gas Networks, Wales & West Utilities, Gas Networks Ireland, BPA, Essar Oil (UK) Ltd., INEOS, Ineos FPS, Sabic, Shell, Uniper and Wood) was 23,897 km. The total exposure in the period 1952 to the end of 2017 was 951,250 km.yr; the development of this exposure is illustrated in Figure 1.
Pipeline exposure before first recorded incident in 1962 = 3,740 km.yr (included in exposure and incident frequency calculations). Above ground sections of cross-country pipelines are included in totals.
Figure 1: Pipeline Operating Exposure from 1952 to 2017
* MAHPs are defined by UK statutory legislation – The Pipelines Safety Regulations 1996 (PSR96) [1] – for natural gas the classification is above 8 bar absolute.
0
100,000
200,000
300,000
400,000
500,000
600,000
700,000
800,000
900,000
1,000,000
1950 1960 1970 1980 1990 2000 2010 2020
Ex
po
su
re k
m.y
r
Year
Development of Pipeline Exposure
Report Number: UKOPA/RP/18/002 Issue: 1.0
© UKOPA Ambergate UK Page 4 of 27
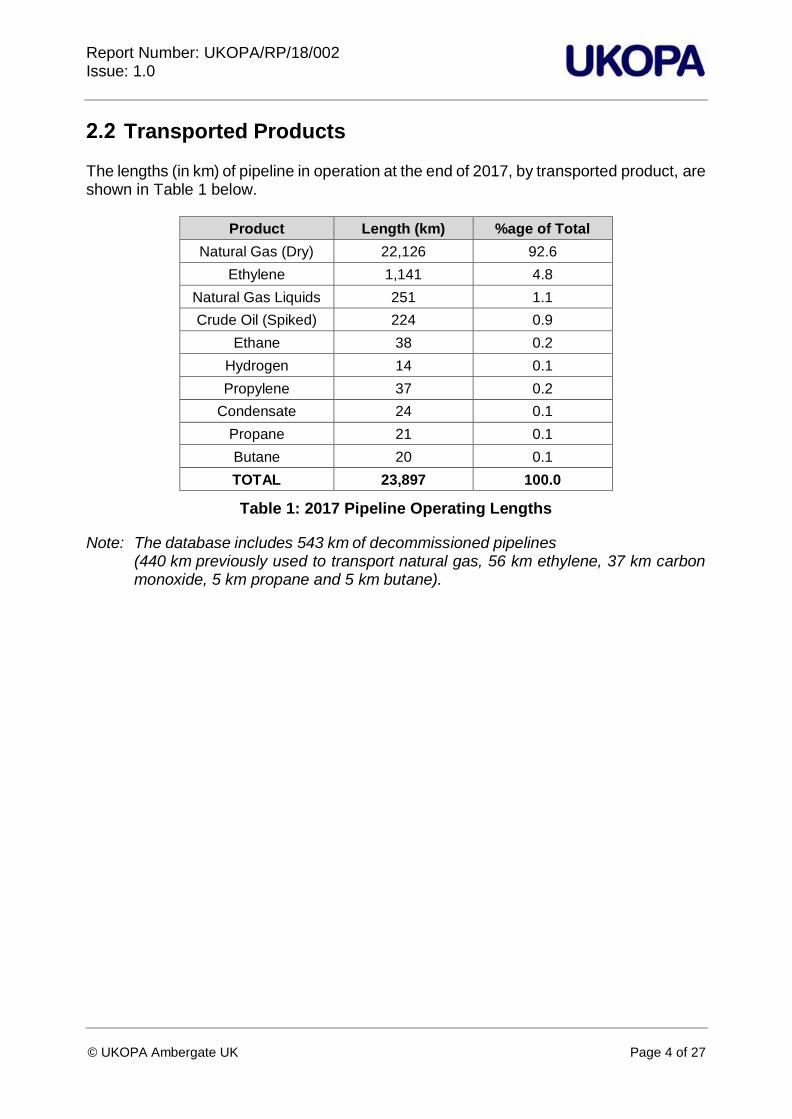
Transported Products The lengths (in km) of pipeline in operation at the end of 2017, by transported product, are shown in Table 1 below.
Product Length (km) %age of Total
Natural Gas (Dry) 22,126 92.6
Ethylene 1,141 4.8
Natural Gas Liquids 251 1.1
Crude Oil (Spiked) 224 0.9
Ethane 38 0.2
Hydrogen 14 0.1
Propylene 37 0.2
Condensate 24 0.1
Propane 21 0.1
Butane 20 0.1
TOTAL 23,897 100.0
Table 1: 2017 Pipeline Operating Lengths
Note: The database includes 543 km of decommissioned pipelines (440 km previously used to transport natural gas, 56 km ethylene, 37 km carbon monoxide, 5 km propane and 5 km butane).
Report Number: UKOPA/RP/18/002 Issue: 1.0
© UKOPA Ambergate UK Page 5 of 27
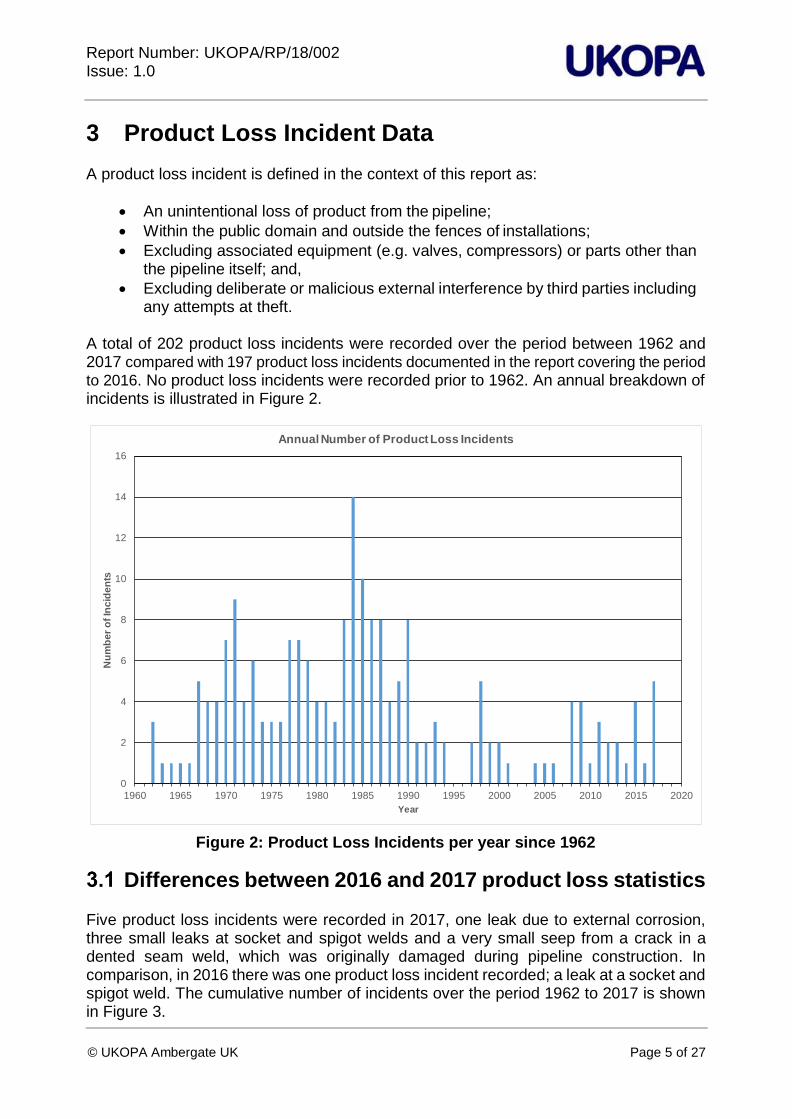
3 Product Loss Incident Data A product loss incident is defined in the context of this report as:
• An unintentional loss of product from the pipeline;
• Within the public domain and outside the fences of installations;
• Excluding associated equipment (e.g. valves, compressors) or parts other than the pipeline itself; and,
• Excluding deliberate or malicious external interference by third parties including any attempts at theft.
A total of 202 product loss incidents were recorded over the period between 1962 and 2017 compared with 197 product loss incidents documented in the report covering the period
to 2016. No product loss incidents were recorded prior to 1962. An annual breakdown of incidents is illustrated in Figure 2.
Figure 2: Product Loss Incidents per year since 1962
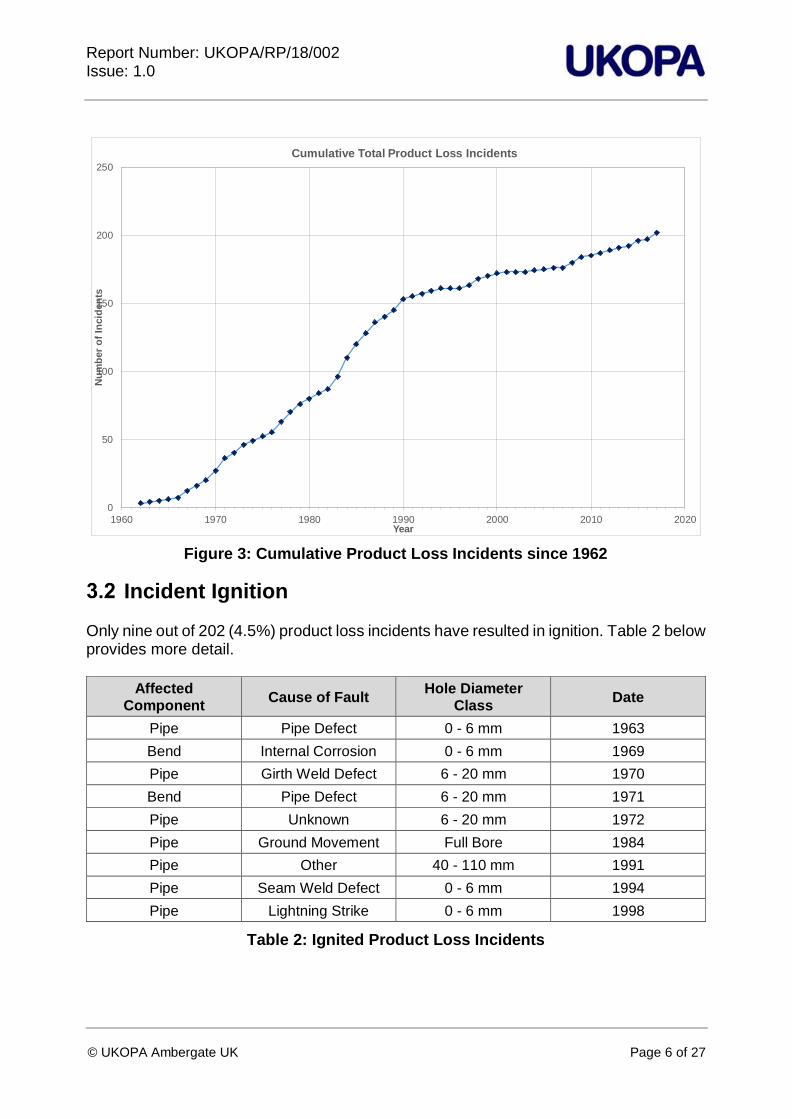
Differences between 2016 and 2017 product loss statistics Five product loss incidents were recorded in 2017, one leak due to external corrosion, three small leaks at socket and spigot welds and a very small seep from a crack in a dented seam weld, which was originally damaged during pipeline construction. In comparison, in 2016 there was one product loss incident recorded; a leak at a socket and spigot weld. The cumulative number of incidents over the period 1962 to 2017 is shown in Figure 3.
0
2
4
6
8
10
12
14
16
1960 1965 1970 1975 1980 1985 1990 1995 2000 2005 2010 2015 2020
Nu
mb
er
of
Inc
ide
nts
Year
Annual Number of Product Loss Incidents
Report Number: UKOPA/RP/18/002 Issue: 1.0
© UKOPA Ambergate UK Page 6 of 27
Figure 3: Cumulative Product Loss Incidents since 1962
Incident Ignition Only nine out of 202 (4.5%) product loss incidents have resulted in ignition. Table 2 below provides more detail.
Affected Component
Cause of Fault Hole Diameter
Class Date
Pipe Pipe Defect 0 - 6 mm 1963
Bend Internal Corrosion 0 - 6 mm 1969
Pipe Girth Weld Defect 6 - 20 mm 1970
Bend Pipe Defect 6 - 20 mm 1971
Pipe Unknown 6 - 20 mm 1972
Pipe Ground Movement Full Bore 1984
Pipe Other 40 - 110 mm 1991
Pipe Seam Weld Defect 0 - 6 mm 1994
Pipe Lightning Strike 0 - 6 mm 1998
Table 2: Ignited Product Loss Incidents
0
50
100
150
200
250
1960 1970 1980 1990 2000 2010 2020
Nu
mb
er
of
Incid
en
ts
Year
Cumulative Total Product Loss Incidents
Report Number: UKOPA/RP/18/002 Issue: 1.0
© UKOPA Ambergate UK Page 7 of 27
Incident Frequency
3.3.1 Trends over the Past 5, 20 and 55 Years
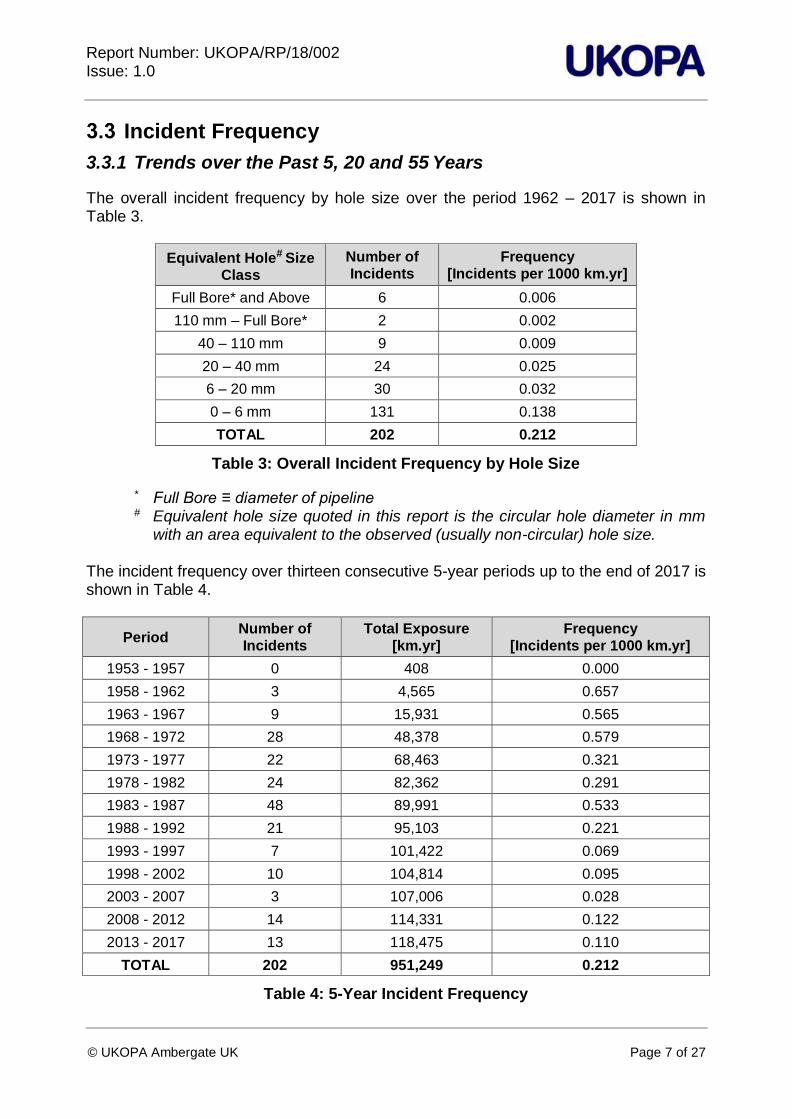
The overall incident frequency by hole size over the period 1962 – 2017 is shown in Table 3.
Equivalent Hole# Size Class
Number of Incidents
Frequency [Incidents per 1000 km.yr]
Full Bore* and Above 6 0.006
110 mm – Full Bore* 2 0.002
40 – 110 mm 9 0.009
20 – 40 mm 24 0.025
6 – 20 mm 30 0.032
0 – 6 mm 131 0.138
TOTAL 202 0.212
Table 3: Overall Incident Frequency by Hole Size
* Full Bore ≡ diameter of pipeline # Equivalent hole size quoted in this report is the circular hole diameter in mm
with an area equivalent to the observed (usually non-circular) hole size. The incident frequency over thirteen consecutive 5-year periods up to the end of 2017 is shown in Table 4.
Period Number of Incidents
Total Exposure [km.yr]
Frequency [Incidents per 1000 km.yr]
1953 - 1957 0 408 0.000
1958 - 1962 3 4,565 0.657
1963 - 1967 9 15,931 0.565
1968 - 1972 28 48,378 0.579
1973 - 1977 22 68,463 0.321
1978 - 1982 24 82,362 0.291
1983 - 1987 48 89,991 0.533
1988 - 1992 21 95,103 0.221
1993 - 1997 7 101,422 0.069
1998 - 2002 10 104,814 0.095
2003 - 2007 3 107,006 0.028
2008 - 2012 14 114,331 0.122
2013 - 2017 13 118,475 0.110
TOTAL 202 951,249 0.212
Table 4: 5-Year Incident Frequency
Report Number: UKOPA/RP/18/002 Issue: 1.0
© UKOPA Ambergate UK Page 8 of 27
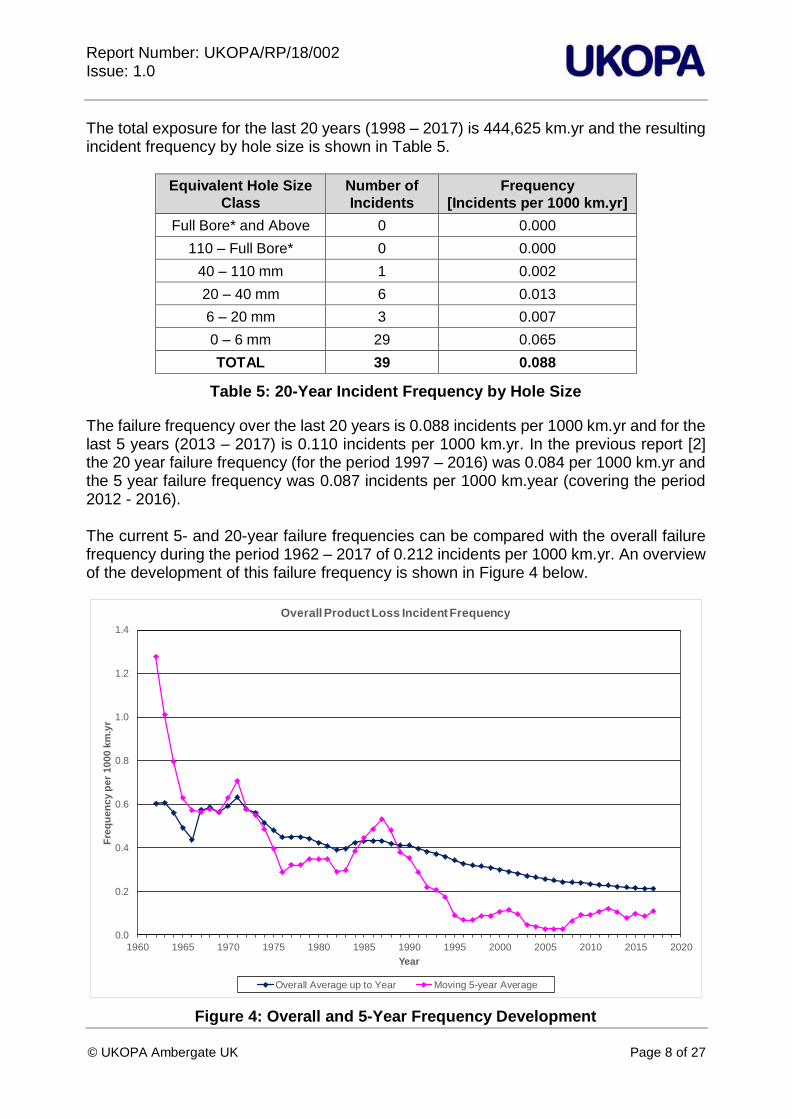
The total exposure for the last 20 years (1998 – 2017) is 444,625 km.yr and the resulting incident frequency by hole size is shown in Table 5.
Equivalent Hole Size
Class
Number of
Incidents
Frequency
[Incidents per 1000 km.yr]
Full Bore* and Above 0 0.000
110 – Full Bore* 0 0.000
40 – 110 mm 1 0.002
20 – 40 mm 6 0.013
6 – 20 mm 3 0.007
0 – 6 mm 29 0.065
TOTAL 39 0.088
Table 5: 20-Year Incident Frequency by Hole Size
The failure frequency over the last 20 years is 0.088 incidents per 1000 km.yr and for the last 5 years (2013 – 2017) is 0.110 incidents per 1000 km.yr. In the previous report [2] the 20 year failure frequency (for the period 1997 – 2016) was 0.084 per 1000 km.yr and the 5 year failure frequency was 0.087 incidents per 1000 km.year (covering the period 2012 - 2016). The current 5- and 20-year failure frequencies can be compared with the overall failure frequency during the period 1962 – 2017 of 0.212 incidents per 1000 km.yr. An overview of the development of this failure frequency is shown in Figure 4 below.
Figure 4: Overall and 5-Year Frequency Development
0.0
0.2
0.4
0.6
0.8
1.0
1.2
1.4
1960 1965 1970 1975 1980 1985 1990 1995 2000 2005 2010 2015 2020
Fre
qu
en
cy
pe
r 1
00
0 k
m.y
r
Year
Overall Product Loss Incident Frequency
Overall Average up to Year Moving 5-year Average
Report Number: UKOPA/RP/18/002 Issue: 1.0
© UKOPA Ambergate UK Page 9 of 27
In order to see the results over recent periods, the moving average for each year has been calculated with reference to the incidents from the previous 5 years (2013 – 2017, 2012 – 2016, 2011 – 2015 etc.).
3.3.2 Confidence Intervals
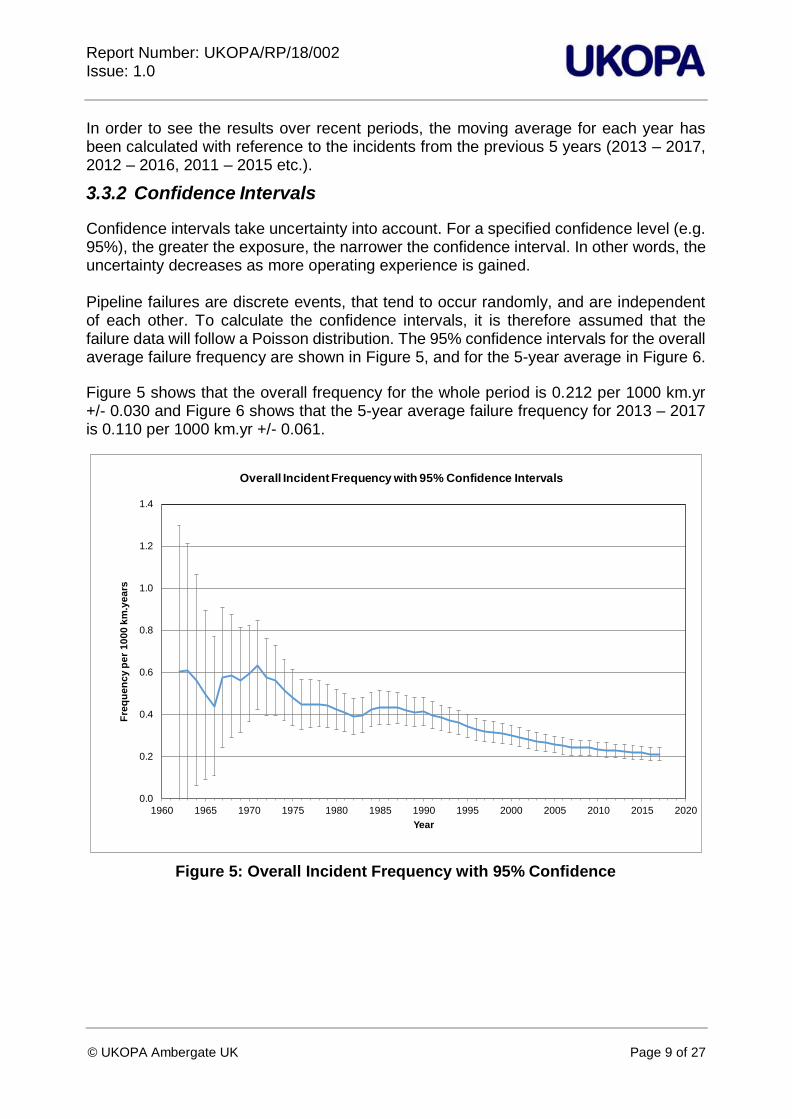
Confidence intervals take uncertainty into account. For a specified confidence level (e.g. 95%), the greater the exposure, the narrower the confidence interval. In other words, the uncertainty decreases as more operating experience is gained. Pipeline failures are discrete events, that tend to occur randomly, and are independent of each other. To calculate the confidence intervals, it is therefore assumed that the failure data will follow a Poisson distribution. The 95% confidence intervals for the overall average failure frequency are shown in Figure 5, and for the 5-year average in Figure 6.
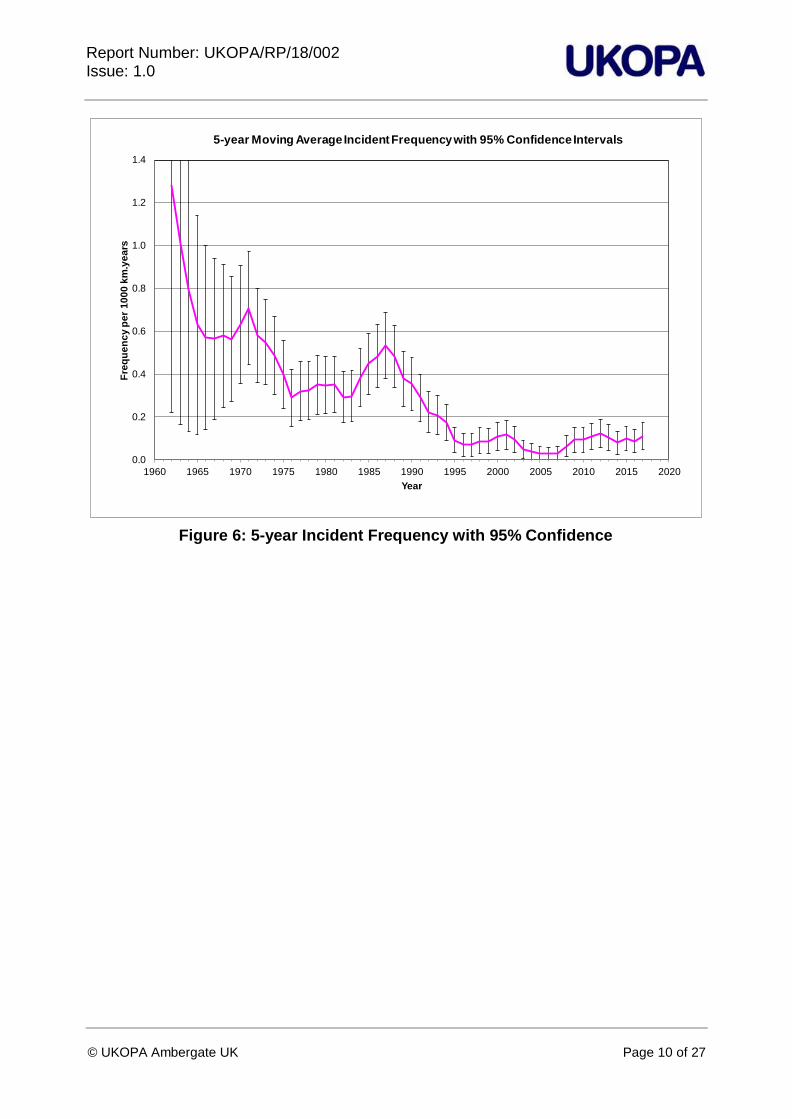
Figure 5 shows that the overall frequency for the whole period is 0.212 per 1000 km.yr +/- 0.030 and Figure 6 shows that the 5-year average failure frequency for 2013 – 2017 is 0.110 per 1000 km.yr +/- 0.061.
Figure 5: Overall Incident Frequency with 95% Confidence
0.0
0.2
0.4
0.6
0.8
1.0
1.2
1.4
1960 1965 1970 1975 1980 1985 1990 1995 2000 2005 2010 2015 2020
Fre
qu
en
cy
pe
r 1
00
0 k
m.y
ea
rs
Year
Overall Incident Frequency with 95% Confidence Intervals
Report Number: UKOPA/RP/18/002 Issue: 1.0
© UKOPA Ambergate UK Page 10 of 27
Figure 6: 5-year Incident Frequency with 95% Confidence
0.0
0.2
0.4
0.6
0.8
1.0
1.2
1.4
1960 1965 1970 1975 1980 1985 1990 1995 2000 2005 2010 2015 2020
Fre
qu
en
cy
pe
r 1
00
0 k
m.y
ea
rs
Year
5-year Moving Average Incident Frequency with 95% Confidence Intervals
Report Number: UKOPA/RP/18/002 Issue: 1.0
© UKOPA Ambergate UK Page 11 of 27
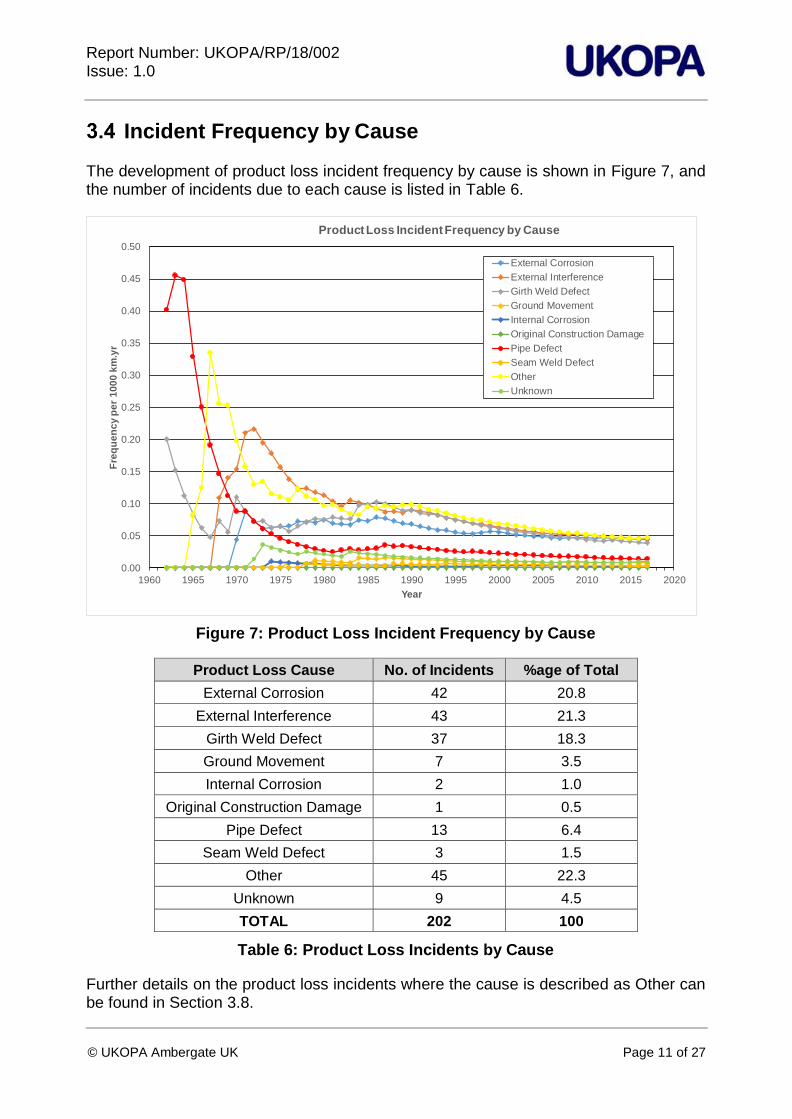
Incident Frequency by Cause The development of product loss incident frequency by cause is shown in Figure 7, and the number of incidents due to each cause is listed in Table 6.
Figure 7: Product Loss Incident Frequency by Cause
Product Loss Cause No. of Incidents %age of Total
External Corrosion 42 20.8
External Interference 43 21.3
Girth Weld Defect 37 18.3
Ground Movement 7 3.5
Internal Corrosion 2 1.0
Original Construction Damage 1 0.5
Pipe Defect 13 6.4
Seam Weld Defect 3 1.5
Other 45 22.3
Unknown 9 4.5
TOTAL 202 100
Table 6: Product Loss Incidents by Cause
Further details on the product loss incidents where the cause is described as Other can be found in Section 3.8.
0.00
0.05
0.10
0.15
0.20
0.25
0.30
0.35
0.40
0.45
0.50
1960 1965 1970 1975 1980 1985 1990 1995 2000 2005 2010 2015 2020
Fre
qu
en
cy
pe
r 1
00
0 k
m.y
r
Year
Product Loss Incident Frequency by Cause
External Corrosion
External Interference
Girth Weld Defect
Ground Movement
Internal Corrosion
Original Construction Damage
Pipe Defect
Seam Weld Defect
Other
Unknown
Report Number: UKOPA/RP/18/002 Issue: 1.0
© UKOPA Ambergate UK Page 12 of 27
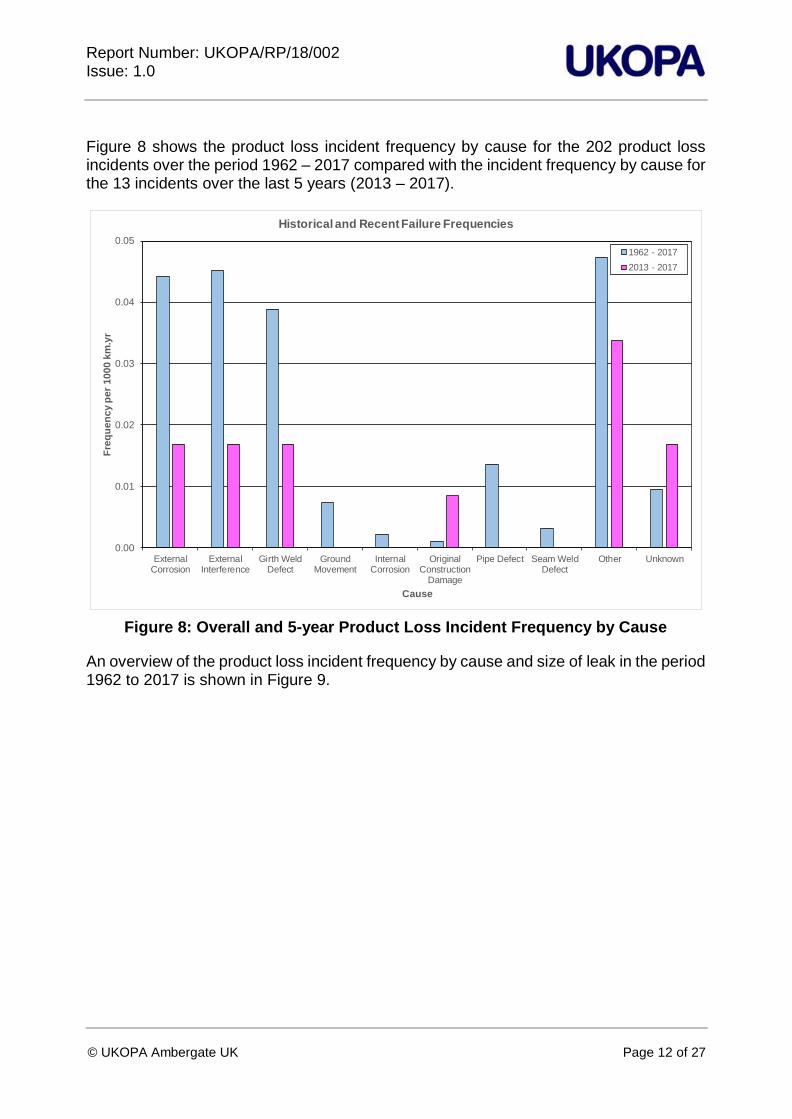
Figure 8 shows the product loss incident frequency by cause for the 202 product loss incidents over the period 1962 – 2017 compared with the incident frequency by cause for the 13 incidents over the last 5 years (2013 – 2017).
Figure 8: Overall and 5-year Product Loss Incident Frequency by Cause
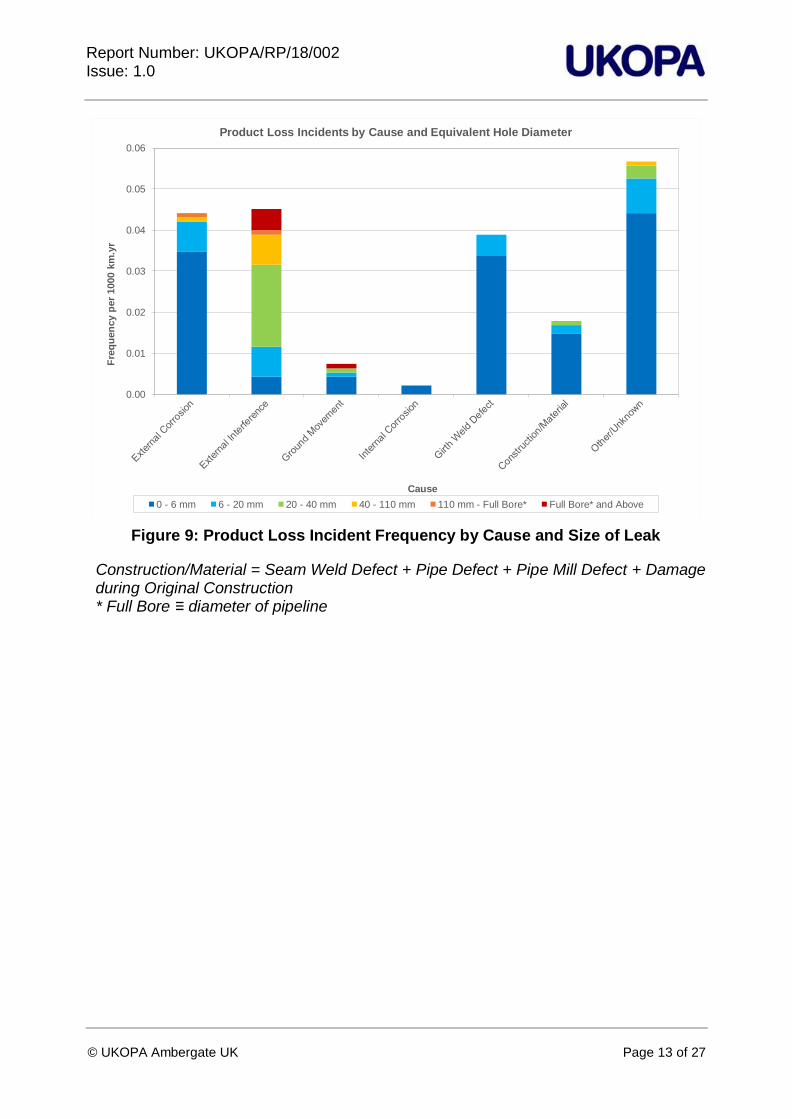
An overview of the product loss incident frequency by cause and size of leak in the period 1962 to 2017 is shown in Figure 9.
0.00
0.01
0.02
0.03
0.04
0.05
ExternalCorrosion
ExternalInterference
Girth WeldDefect
GroundMovement
InternalCorrosion
OriginalConstruction
Damage
Pipe Defect Seam WeldDefect
Other Unknown
Fre
qu
en
cy
pe
r 1
00
0 k
m.y
r
Cause
Historical and Recent Failure Frequencies
1962 - 2017
2013 - 2017
Report Number: UKOPA/RP/18/002 Issue: 1.0
© UKOPA Ambergate UK Page 13 of 27
Figure 9: Product Loss Incident Frequency by Cause and Size of Leak
Construction/Material = Seam Weld Defect + Pipe Defect + Pipe Mill Defect + Damage during Original Construction * Full Bore ≡ diameter of pipeline
0.00
0.01
0.02
0.03
0.04
0.05
0.06
Fre
qu
en
cy p
er
1000 k
m.y
r
Cause
Product Loss Incidents by Cause and Equivalent Hole Diameter
0 - 6 mm 6 - 20 mm 20 - 40 mm 40 - 110 mm 110 mm - Full Bore* Full Bore* and Above
Report Number: UKOPA/RP/18/002 Issue: 1.0
© UKOPA Ambergate UK Page 14 of 27
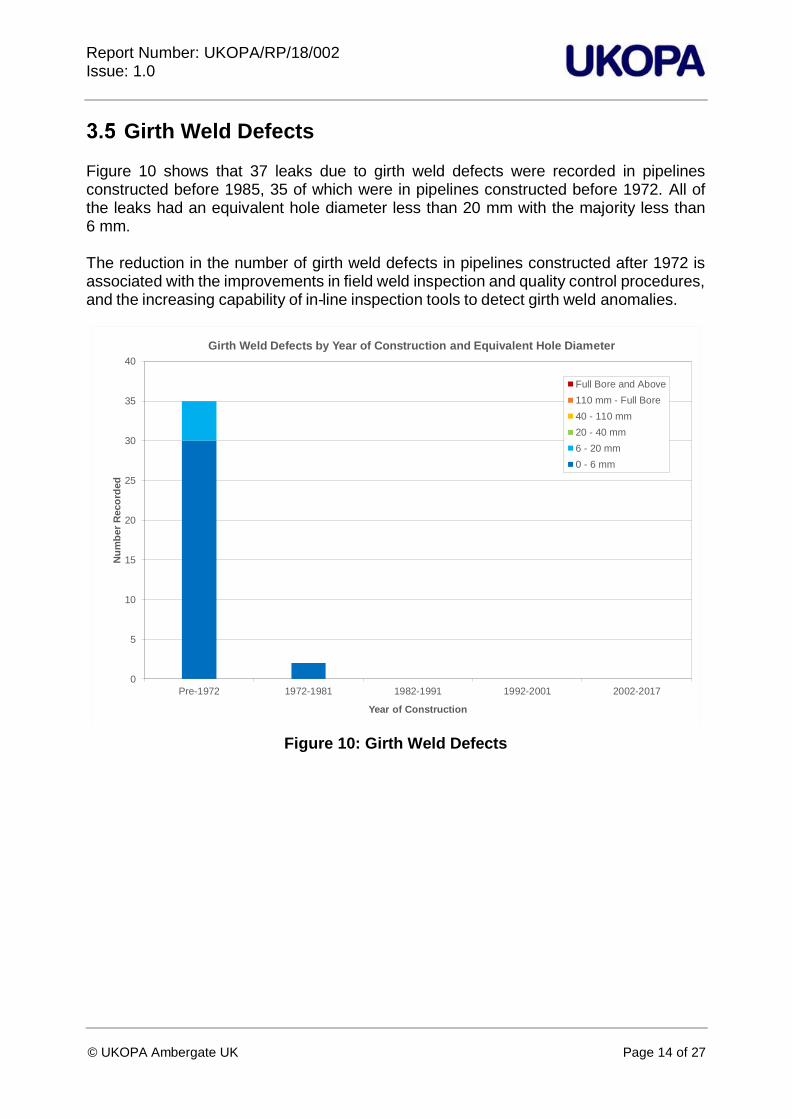
Girth Weld Defects Figure 10 shows that 37 leaks due to girth weld defects were recorded in pipelines constructed before 1985, 35 of which were in pipelines constructed before 1972. All of the leaks had an equivalent hole diameter less than 20 mm with the majority less than 6 mm. The reduction in the number of girth weld defects in pipelines constructed after 1972 is associated with the improvements in field weld inspection and quality control procedures, and the increasing capability of in-line inspection tools to detect girth weld anomalies.
Figure 10: Girth Weld Defects
0
5
10
15
20
25
30
35
40
Pre-1972 1972-1981 1982-1991 1992-2001 2002-2017
Nu
mb
er
Reco
rded
Year of Construction
Girth Weld Defects by Year of Construction and Equivalent Hole Diameter
Full Bore and Above
110 mm - Full Bore
40 - 110 mm
20 - 40 mm
6 - 20 mm
0 - 6 mm
Report Number: UKOPA/RP/18/002 Issue: 1.0
© UKOPA Ambergate UK Page 15 of 27
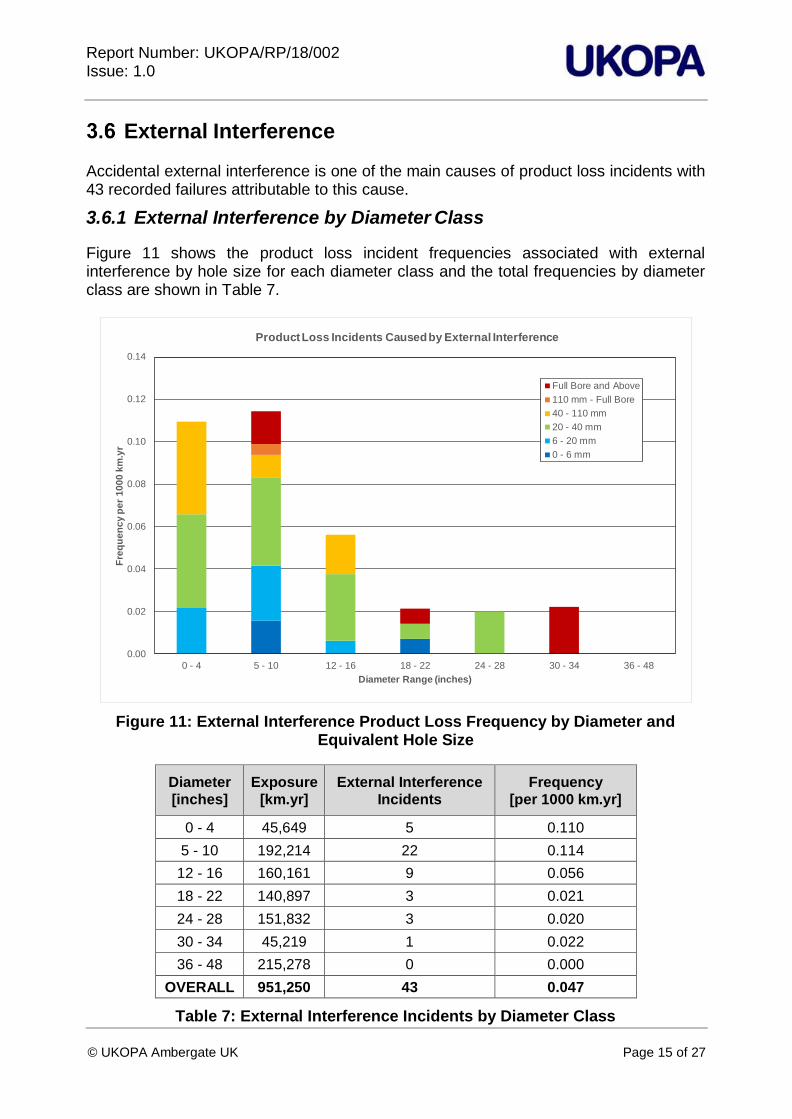
External Interference Accidental external interference is one of the main causes of product loss incidents with 43 recorded failures attributable to this cause.
3.6.1 External Interference by Diameter Class
Figure 11 shows the product loss incident frequencies associated with external interference by hole size for each diameter class and the total frequencies by diameter class are shown in Table 7.
Figure 11: External Interference Product Loss Frequency by Diameter and Equivalent Hole Size
Diameter
[inches]
Exposure
[km.yr]
External Interference
Incidents
Frequency
[per 1000 km.yr]
0 - 4 45,649 5 0.110
5 - 10 192,214 22 0.114
12 - 16 160,161 9 0.056
18 - 22 140,897 3 0.021
24 - 28 151,832 3 0.020
30 - 34 45,219 1 0.022
36 - 48 215,278 0 0.000
OVERALL 951,250 43 0.047
Table 7: External Interference Incidents by Diameter Class
0.00
0.02
0.04
0.06
0.08
0.10
0.12
0.14
0 - 4 5 - 10 12 - 16 18 - 22 24 - 28 30 - 34 36 - 48
Fre
qu
en
cy
pe
r 1
00
0 k
m.y
r
Diameter Range (inches)
Product Loss Incidents Caused by External Interference
Full Bore and Above
110 mm - Full Bore
40 - 110 mm
20 - 40 mm
6 - 20 mm
0 - 6 mm
Report Number: UKOPA/RP/18/002 Issue: 1.0
© UKOPA Ambergate UK Page 16 of 27
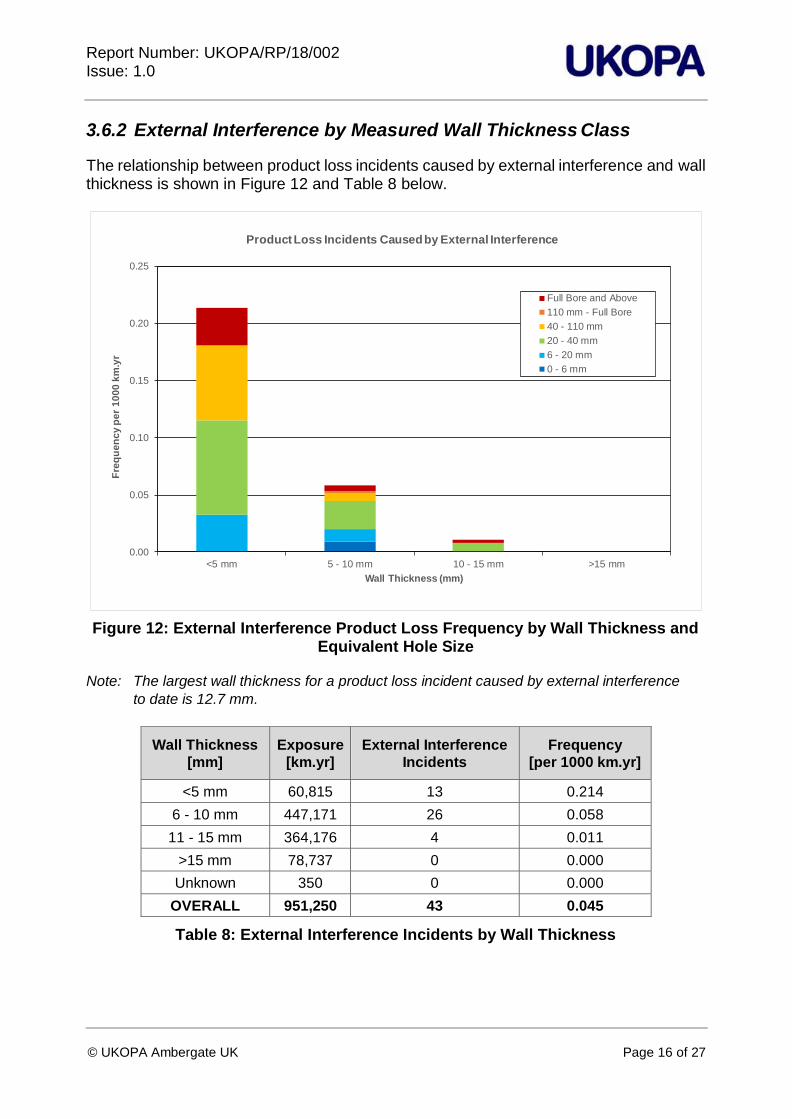
3.6.2 External Interference by Measured Wall Thickness Class
The relationship between product loss incidents caused by external interference and wall thickness is shown in Figure 12 and Table 8 below.
Figure 12: External Interference Product Loss Frequency by Wall Thickness and Equivalent Hole Size
Note: The largest wall thickness for a product loss incident caused by external interference
to date is 12.7 mm.
Wall Thickness
[mm]
Exposure
[km.yr]
External Interference
Incidents
Frequency
[per 1000 km.yr]
<5 mm 60,815 13 0.214
6 - 10 mm 447,171 26 0.058
11 - 15 mm 364,176 4 0.011
>15 mm 78,737 0 0.000
Unknown 350 0 0.000
OVERALL 951,250 43 0.045
Table 8: External Interference Incidents by Wall Thickness
0.00
0.05
0.10
0.15
0.20
0.25
<5 mm 5 - 10 mm 10 - 15 mm >15 mm
Fre
qu
en
cy
pe
r 1
00
0 k
m.y
r
Wall Thickness (mm)
Product Loss Incidents Caused by External Interference
Full Bore and Above
110 mm - Full Bore
40 - 110 mm
20 - 40 mm
6 - 20 mm
0 - 6 mm
Report Number: UKOPA/RP/18/002 Issue: 1.0
© UKOPA Ambergate UK Page 17 of 27
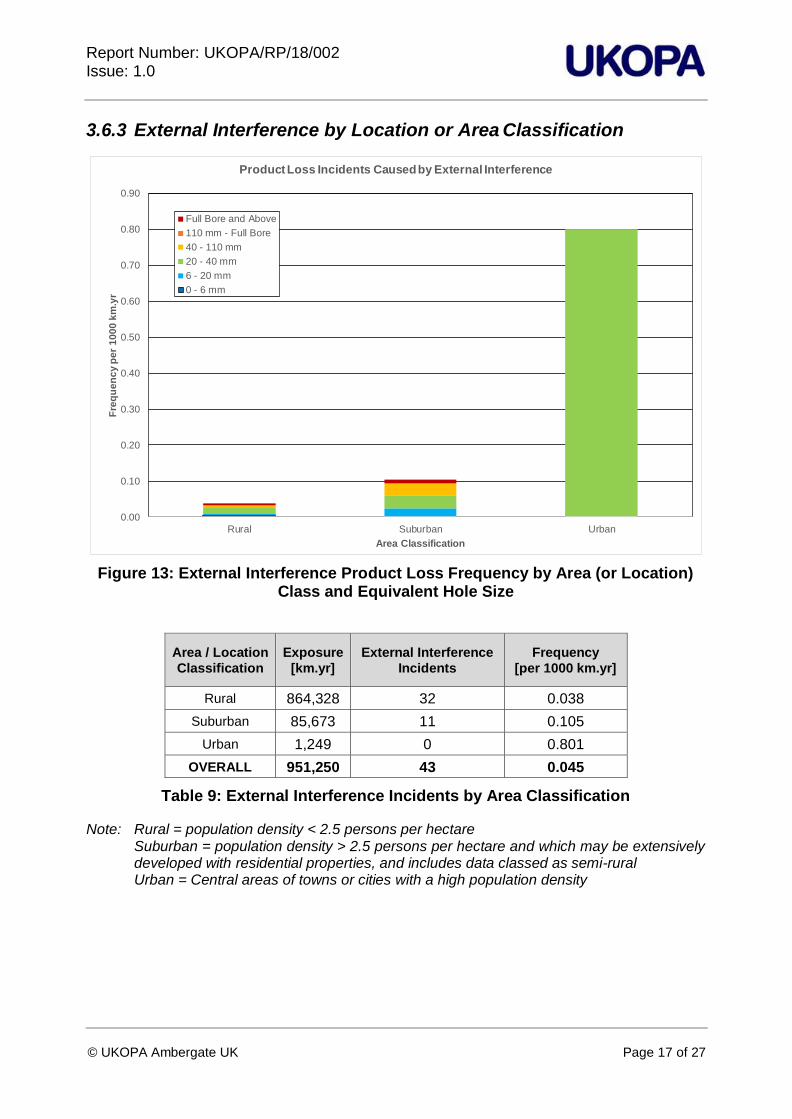
3.6.3 External Interference by Location or Area Classification
Figure 13: External Interference Product Loss Frequency by Area (or Location) Class and Equivalent Hole Size
Area / Location
Classification
Exposure
[km.yr]
External Interference
Incidents
Frequency
[per 1000 km.yr]
Rural 864,328 32 0.038
Suburban 85,673 11 0.105
Urban 1,249 0 0.801
OVERALL 951,250 43 0.045
Table 9: External Interference Incidents by Area Classification
Note: Rural = population density < 2.5 persons per hectare Suburban = population density > 2.5 persons per hectare and which may be extensively developed with residential properties, and includes data classed as semi-rural Urban = Central areas of towns or cities with a high population density
0.00
0.10
0.20
0.30
0.40
0.50
0.60
0.70
0.80
0.90
Rural Suburban Urban
Fre
qu
en
cy
pe
r 1
00
0 k
m.y
r
Area Classification
Product Loss Incidents Caused by External Interference
Full Bore and Above
110 mm - Full Bore
40 - 110 mm
20 - 40 mm
6 - 20 mm
0 - 6 mm
Report Number: UKOPA/RP/18/002 Issue: 1.0
© UKOPA Ambergate UK Page 18 of 27
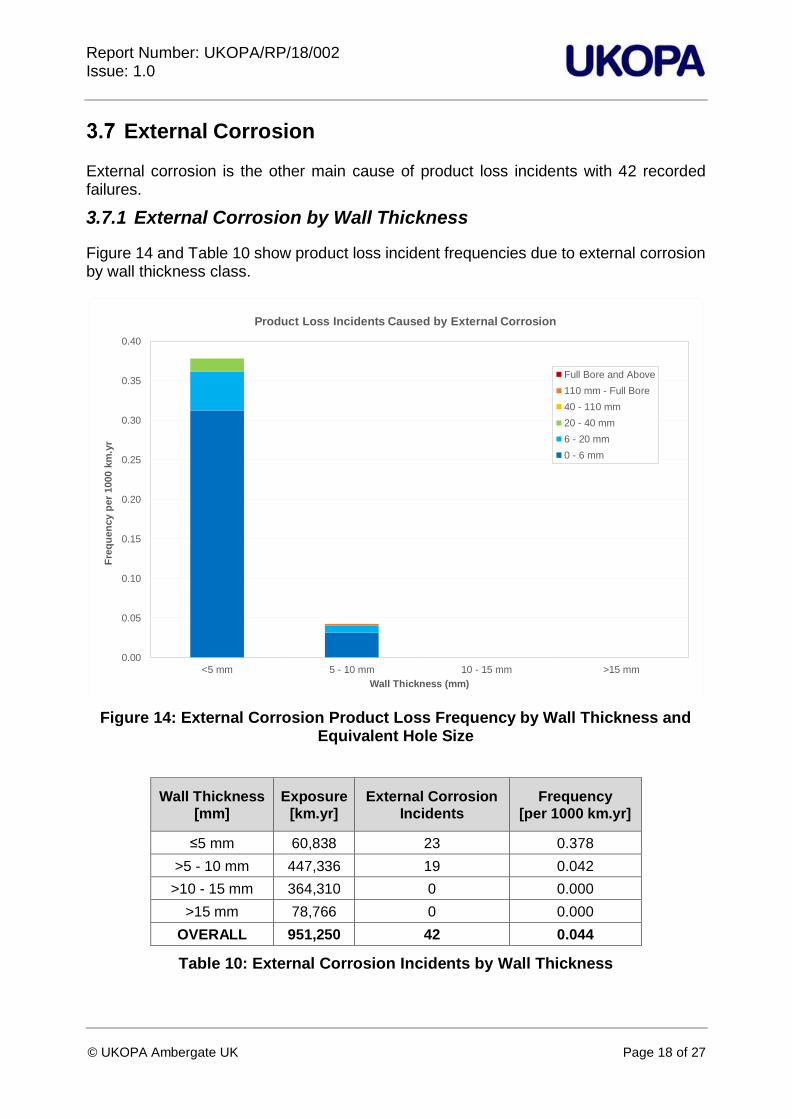
External Corrosion External corrosion is the other main cause of product loss incidents with 42 recorded failures.
3.7.1 External Corrosion by Wall Thickness
Figure 14 and Table 10 show product loss incident frequencies due to external corrosion by wall thickness class.
Figure 14: External Corrosion Product Loss Frequency by Wall Thickness and Equivalent Hole Size
Wall Thickness [mm]
Exposure [km.yr]
External Corrosion Incidents
Frequency [per 1000 km.yr]
≤5 mm 60,838 23 0.378
>5 - 10 mm 447,336 19 0.042
>10 - 15 mm 364,310 0 0.000
>15 mm 78,766 0 0.000
OVERALL 951,250 42 0.044
Table 10: External Corrosion Incidents by Wall Thickness
0.00
0.05
0.10
0.15
0.20
0.25
0.30
0.35
0.40
<5 mm 5 - 10 mm 10 - 15 mm >15 mm
Fre
qu
en
cy p
er
1000 k
m.y
r
Wall Thickness (mm)
Product Loss Incidents Caused by External Corrosion
Full Bore and Above
110 mm - Full Bore
40 - 110 mm
20 - 40 mm
6 - 20 mm
0 - 6 mm
Report Number: UKOPA/RP/18/002 Issue: 1.0
© UKOPA Ambergate UK Page 19 of 27
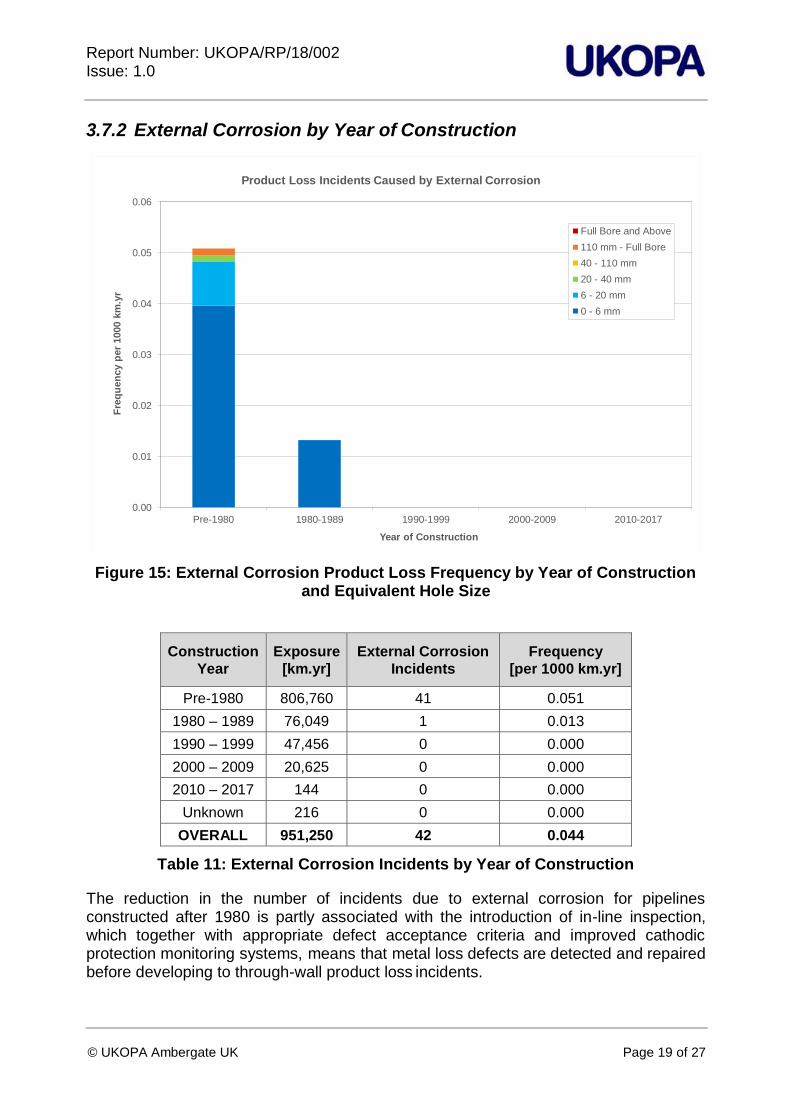
3.7.2 External Corrosion by Year of Construction
Figure 15: External Corrosion Product Loss Frequency by Year of Construction and Equivalent Hole Size
Construction
Year
Exposure
[km.yr]
External Corrosion
Incidents
Frequency
[per 1000 km.yr]
Pre-1980 806,760 41 0.051
1980 – 1989 76,049 1 0.013
1990 – 1999 47,456 0 0.000
2000 – 2009 20,625 0 0.000
2010 – 2017 144 0 0.000
Unknown 216 0 0.000
OVERALL 951,250 42 0.044
Table 11: External Corrosion Incidents by Year of Construction
The reduction in the number of incidents due to external corrosion for pipelines constructed after 1980 is partly associated with the introduction of in-line inspection, which together with appropriate defect acceptance criteria and improved cathodic protection monitoring systems, means that metal loss defects are detected and repaired before developing to through-wall product loss incidents.
0.00
0.01
0.02
0.03
0.04
0.05
0.06
Pre-1980 1980-1989 1990-1999 2000-2009 2010-2017
Fre
qu
en
cy p
er
1000 k
m.y
r
Year of Construction
Product Loss Incidents Caused by External Corrosion
Full Bore and Above
110 mm - Full Bore
40 - 110 mm
20 - 40 mm
6 - 20 mm
0 - 6 mm
Report Number: UKOPA/RP/18/002 Issue: 1.0
© UKOPA Ambergate UK Page 20 of 27
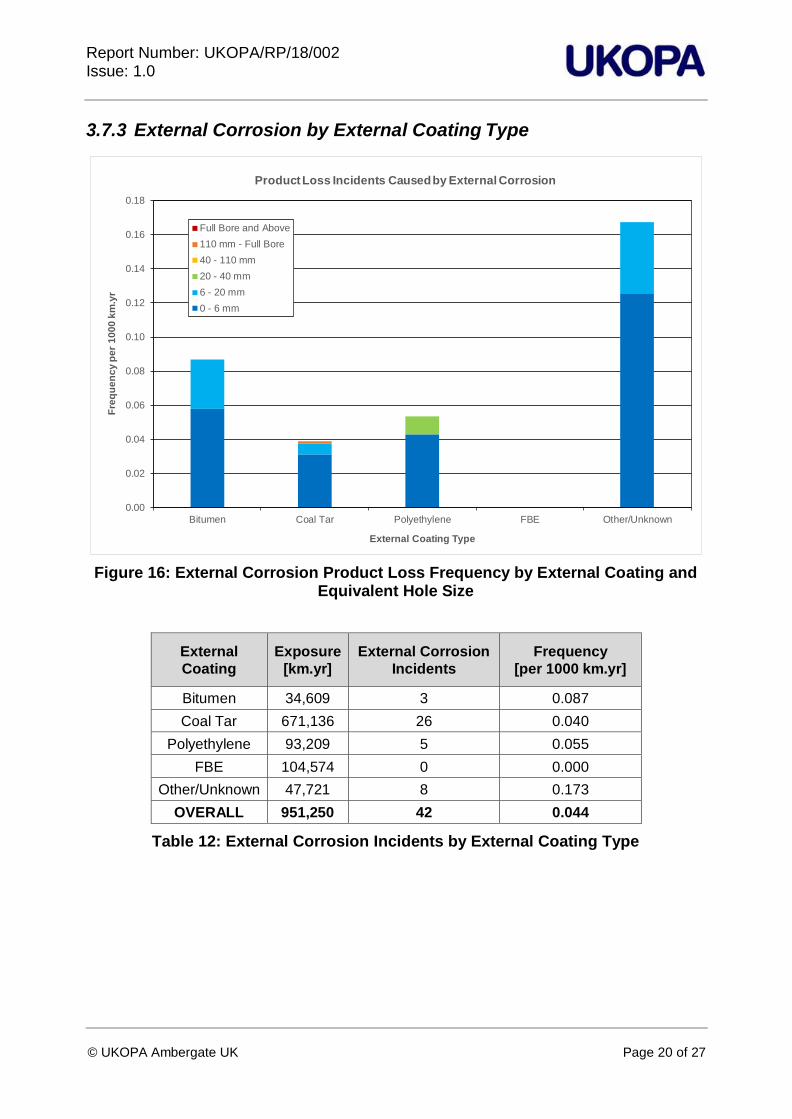
3.7.3 External Corrosion by External Coating Type
Figure 16: External Corrosion Product Loss Frequency by External Coating and Equivalent Hole Size
External
Coating
Exposure
[km.yr]
External Corrosion
Incidents
Frequency
[per 1000 km.yr]
Bitumen 34,609 3 0.087
Coal Tar 671,136 26 0.040
Polyethylene 93,209 5 0.055
FBE 104,574 0 0.000
Other/Unknown 47,721 8 0.173
OVERALL 951,250 42 0.044
Table 12: External Corrosion Incidents by External Coating Type
0.00
0.02
0.04
0.06
0.08
0.10
0.12
0.14
0.16
0.18
Bitumen Coal Tar Polyethylene FBE Other/Unknown
Fre
qu
en
cy
pe
r 1
00
0 k
m.y
r
External Coating Type
Product Loss Incidents Caused by External Corrosion
Full Bore and Above
110 mm - Full Bore
40 - 110 mm
20 - 40 mm
6 - 20 mm
0 - 6 mm
Report Number: UKOPA/RP/18/002 Issue: 1.0
© UKOPA Ambergate UK Page 21 of 27
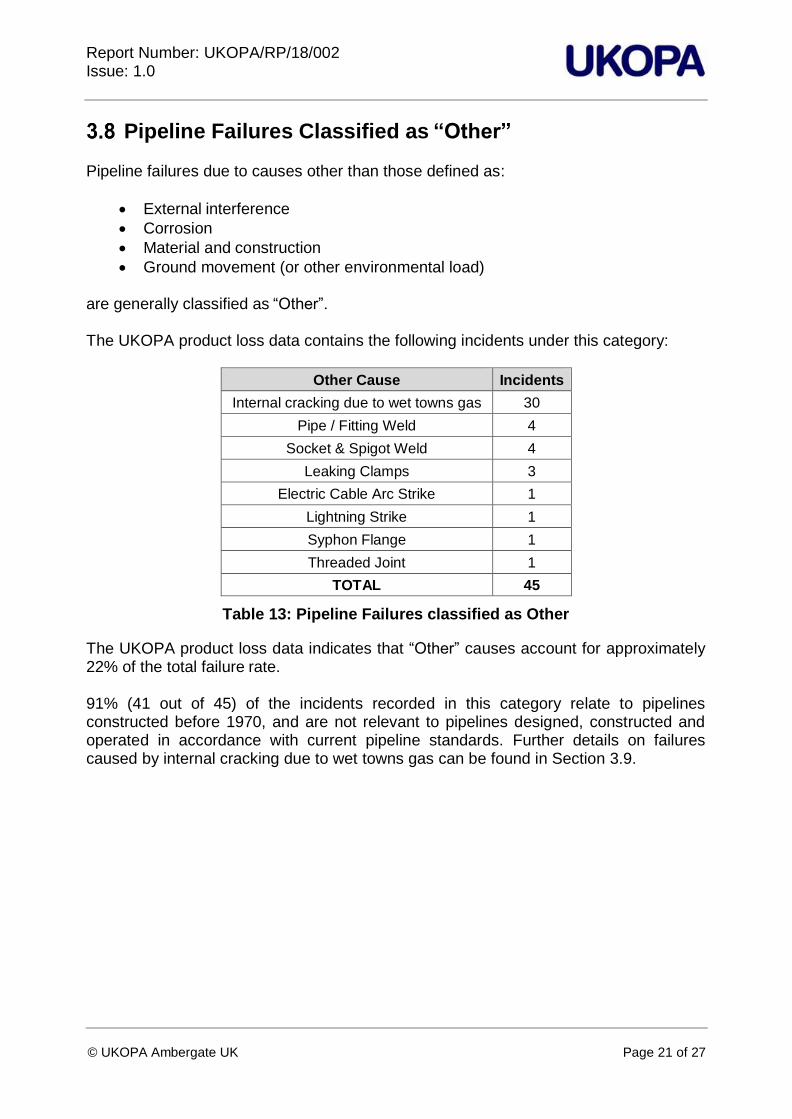
Pipeline Failures Classified as “Other” Pipeline failures due to causes other than those defined as:
• External interference
• Corrosion
• Material and construction
• Ground movement (or other environmental load) are generally classified as “Other”. The UKOPA product loss data contains the following incidents under this category:
Other Cause Incidents
Internal cracking due to wet towns gas 30
Pipe / Fitting Weld 4
Socket & Spigot Weld 4
Leaking Clamps 3
Electric Cable Arc Strike 1
Lightning Strike 1
Syphon Flange 1
Threaded Joint 1
TOTAL 45
Table 13: Pipeline Failures classified as Other
The UKOPA product loss data indicates that “Other” causes account for approximately 22% of the total failure rate. 91% (41 out of 45) of the incidents recorded in this category relate to pipelines constructed before 1970, and are not relevant to pipelines designed, constructed and operated in accordance with current pipeline standards. Further details on failures caused by internal cracking due to wet towns gas can be found in Section 3.9.
Report Number: UKOPA/RP/18/002 Issue: 1.0
© UKOPA Ambergate UK Page 22 of 27
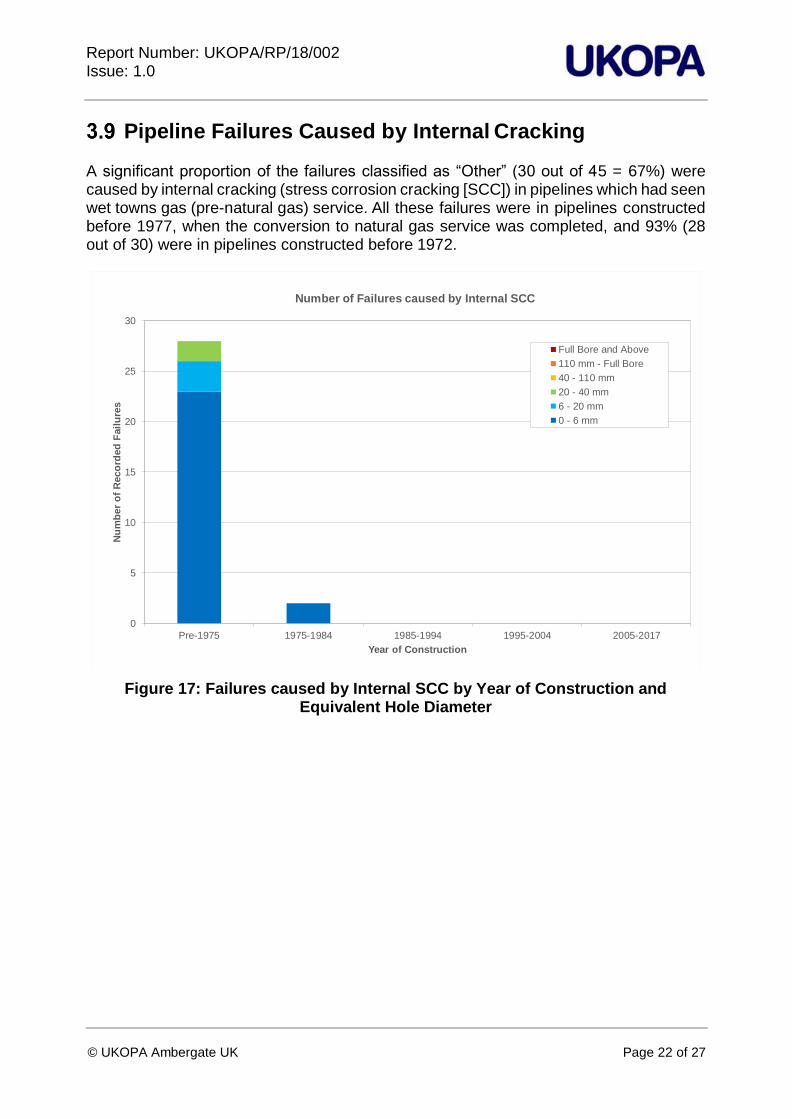
Pipeline Failures Caused by Internal Cracking A significant proportion of the failures classified as “Other” (30 out of 45 = 67%) were caused by internal cracking (stress corrosion cracking [SCC]) in pipelines which had seen wet towns gas (pre-natural gas) service. All these failures were in pipelines constructed before 1977, when the conversion to natural gas service was completed, and 93% (28 out of 30) were in pipelines constructed before 1972.
Figure 17: Failures caused by Internal SCC by Year of Construction and Equivalent Hole Diameter
0
5
10
15
20
25
30
Pre-1975 1975-1984 1985-1994 1995-2004 2005-2017
Nu
mb
er
of
Reco
rded
Fail
ure
s
Year of Construction
Number of Failures caused by Internal SCC
Full Bore and Above
110 mm - Full Bore
40 - 110 mm
20 - 40 mm
6 - 20 mm
0 - 6 mm
Report Number: UKOPA/RP/18/002 Issue: 1.0
© UKOPA Ambergate UK Page 23 of 27
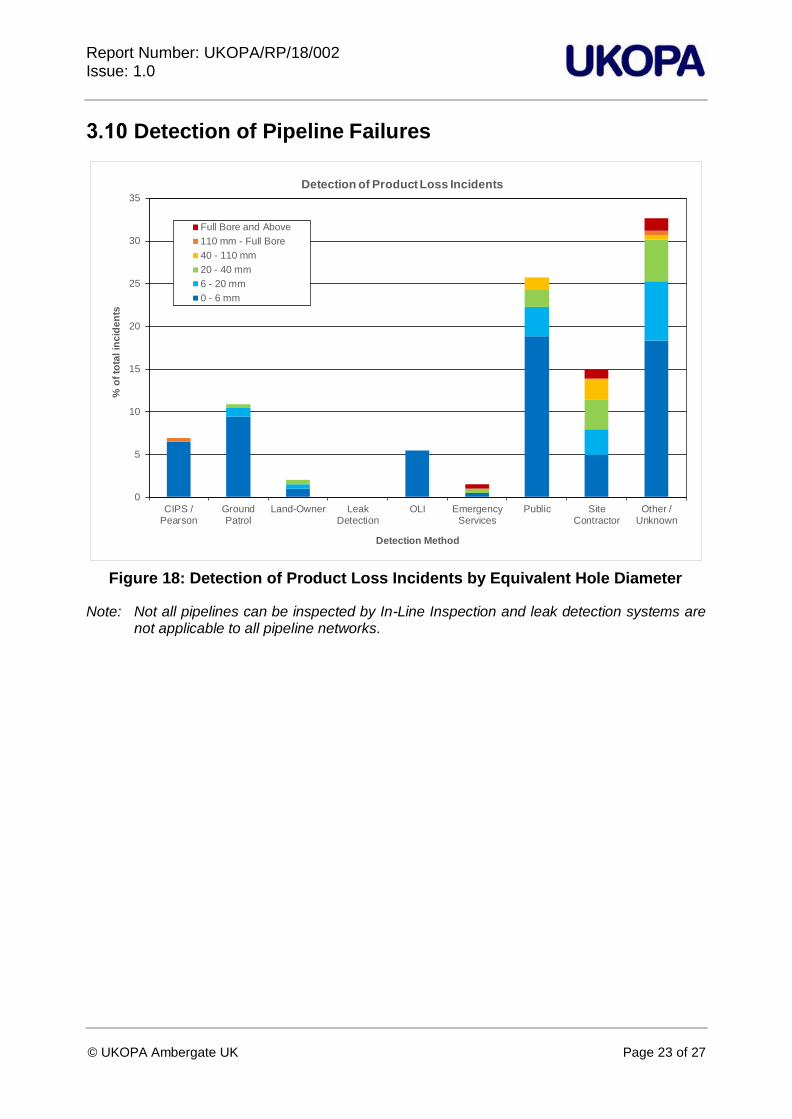
Detection of Pipeline Failures
Figure 18: Detection of Product Loss Incidents by Equivalent Hole Diameter
Note: Not all pipelines can be inspected by In-Line Inspection and leak detection systems are not applicable to all pipeline networks.
0
5
10
15
20
25
30
35
CIPS /Pearson
GroundPatrol
Land-Owner LeakDetection
OLI EmergencyServices
Public SiteContractor
Other /Unknown
% o
f to
tal
inc
ide
nts
Detection Method
Detection of Product Loss Incidents
Full Bore and Above
110 mm - Full Bore
40 - 110 mm
20 - 40 mm
6 - 20 mm
0 - 6 mm
Report Number: UKOPA/RP/18/002 Issue: 1.0
© UKOPA Ambergate UK Page 24 of 27
4 Fault Data
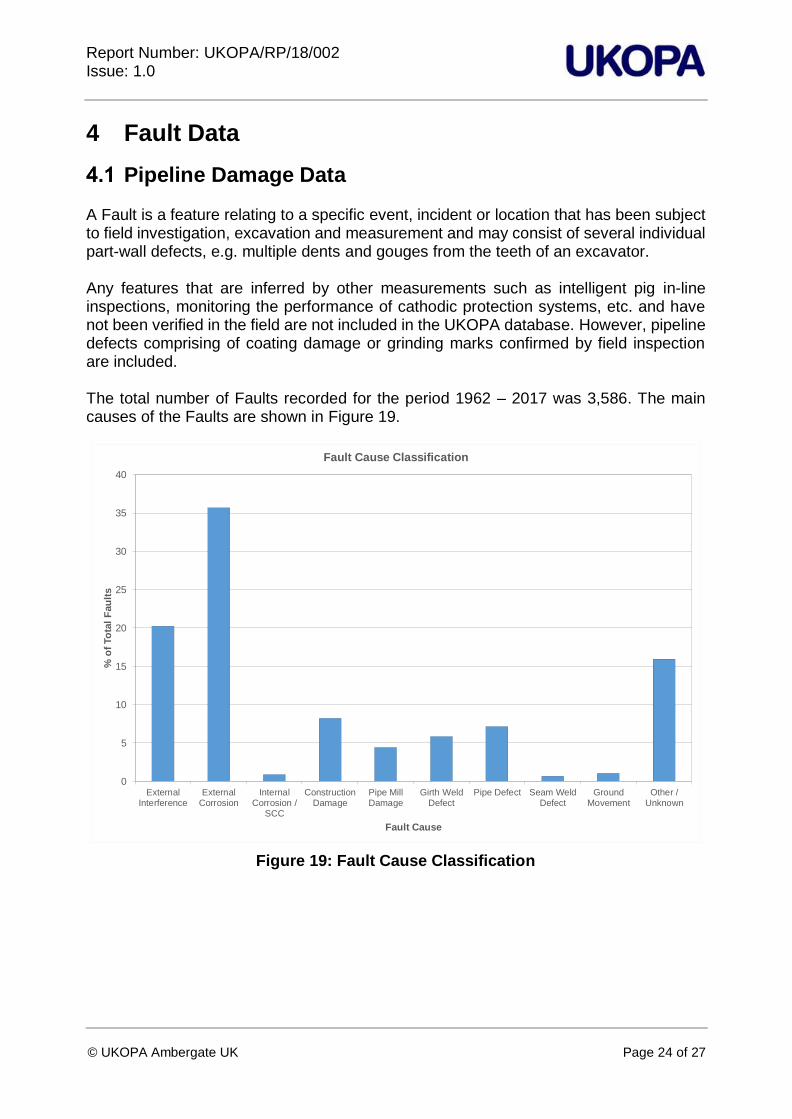
Pipeline Damage Data A Fault is a feature relating to a specific event, incident or location that has been subject to field investigation, excavation and measurement and may consist of several individual part-wall defects, e.g. multiple dents and gouges from the teeth of an excavator. Any features that are inferred by other measurements such as intelligent pig in-line inspections, monitoring the performance of cathodic protection systems, etc. and have not been verified in the field are not included in the UKOPA database. However, pipeline defects comprising of coating damage or grinding marks confirmed by field inspection are included. The total number of Faults recorded for the period 1962 – 2017 was 3,586. The main causes of the Faults are shown in Figure 19.
Figure 19: Fault Cause Classification
0
5
10
15
20
25
30
35
40
ExternalInterference
ExternalCorrosion
InternalCorrosion /
SCC
ConstructionDamage
Pipe MillDamage
Girth WeldDefect
Pipe Defect Seam WeldDefect
GroundMovement
Other /Unknown
% o
f To
tal
Fau
lts
Fault Cause
Fault Cause Classification
Report Number: UKOPA/RP/18/002 Issue: 1.0
© UKOPA Ambergate UK Page 25 of 27
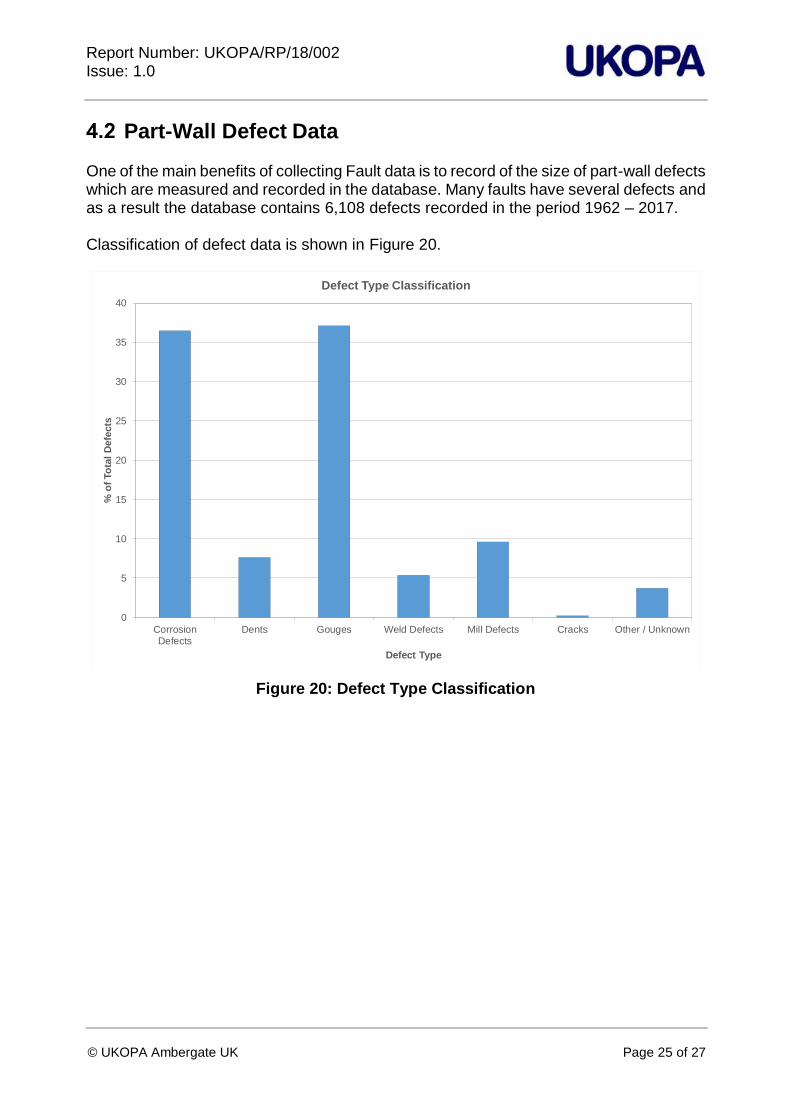
Part-Wall Defect Data One of the main benefits of collecting Fault data is to record of the size of part-wall defects which are measured and recorded in the database. Many faults have several defects and as a result the database contains 6,108 defects recorded in the period 1962 – 2017. Classification of defect data is shown in Figure 20.
Figure 20: Defect Type Classification
0
5
10
15
20
25
30
35
40
CorrosionDefects
Dents Gouges Weld Defects Mill Defects Cracks Other / Unknown
% o
f To
tal
Defe
cts
Defect Type
Defect Type Classification
Report Number: UKOPA/RP/18/002 Issue: 1.0
© UKOPA Ambergate UK Page 26 of 27
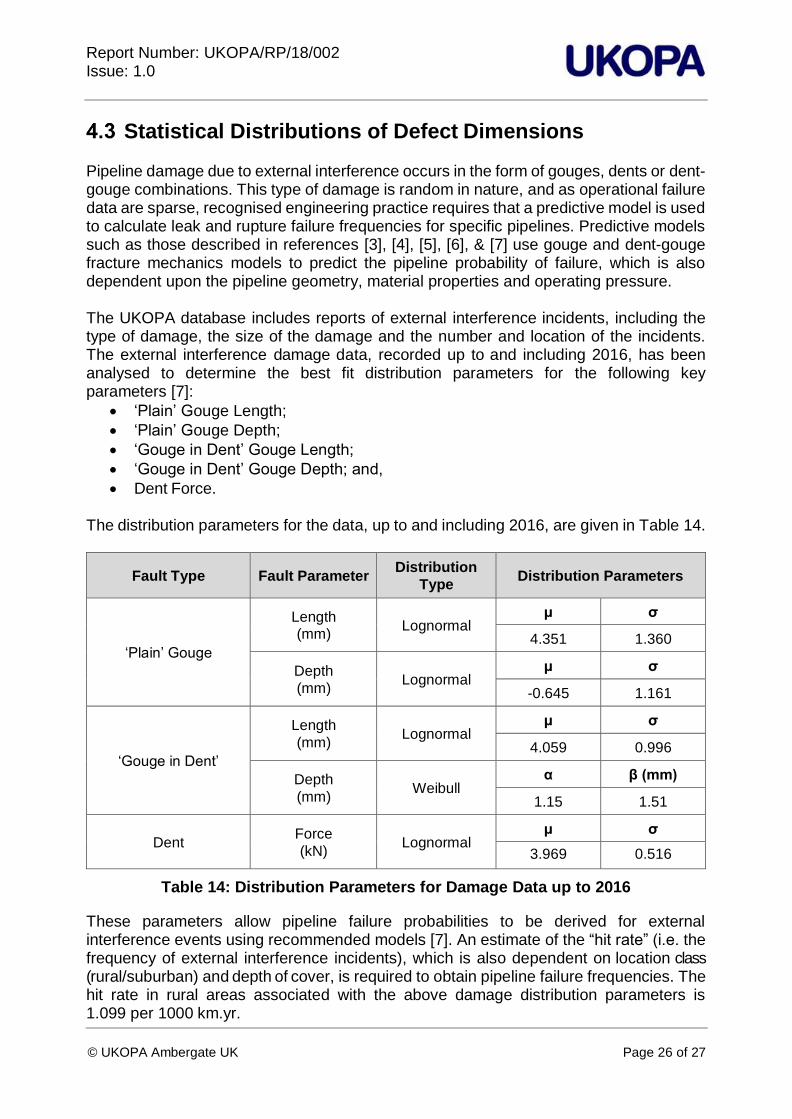
Statistical Distributions of Defect Dimensions Pipeline damage due to external interference occurs in the form of gouges, dents or dent-gouge combinations. This type of damage is random in nature, and as operational failure data are sparse, recognised engineering practice requires that a predictive model is used to calculate leak and rupture failure frequencies for specific pipelines. Predictive models such as those described in references [3], [4], [5], [6], & [7] use gouge and dent-gouge fracture mechanics models to predict the pipeline probability of failure, which is also dependent upon the pipeline geometry, material properties and operating pressure. The UKOPA database includes reports of external interference incidents, including the type of damage, the size of the damage and the number and location of the incidents. The external interference damage data, recorded up to and including 2016, has been analysed to determine the best fit distribution parameters for the following key parameters [7]:
• ‘Plain’ Gouge Length;
• ‘Plain’ Gouge Depth;
• ‘Gouge in Dent’ Gouge Length;
• ‘Gouge in Dent’ Gouge Depth; and,
• Dent Force. The distribution parameters for the data, up to and including 2016, are given in Table 14.
Fault Type Fault Parameter Distribution
Type Distribution Parameters
‘Plain’ Gouge
Length (mm)
Lognormal μ σ
4.351 1.360
Depth
(mm) Lognormal
μ σ
-0.645 1.161
‘Gouge in Dent’
Length
(mm) Lognormal
μ σ
4.059 0.996
Depth
(mm) Weibull
α β (mm)
1.15 1.51
Dent Force
(kN) Lognormal
μ σ
3.969 0.516
Table 14: Distribution Parameters for Damage Data up to 2016
These parameters allow pipeline failure probabilities to be derived for external interference events using recommended models [7]. An estimate of the “hit rate” (i.e. the frequency of external interference incidents), which is also dependent on location class (rural/suburban) and depth of cover, is required to obtain pipeline failure frequencies. The hit rate in rural areas associated with the above damage distribution parameters is 1.099 per 1000 km.yr.
Report Number: UKOPA/RP/18/002 Issue: 1.0
© UKOPA Ambergate UK Page 27 of 27
5 References
[1] SI 1996 No. 825, The Pipelines Safety Regulations 1996, as amended.
[2] G. D. Goodfellow, C. J. Lyons and J. V. Haswell, “UKOPA Pipeline Product Loss Incidents and Faults Reports (1962 - 2016),” UKOPA/17/002, Issue 1.1, February 2018.
[3] I Corder, “The Application of Risk Techniques to the Design and Operation of Pipelines,” in Proceedings of International Conference on Pressure Systems: Operation and Risk Management, Institution of Mechanical Engineers, London, UK, pp 113-125, 1995.
[4] C. Lyons, J. V. Haswell, P. Hopkins, R. Ellis and N. Jackson, “A Methodology for the Prediction of Pipeline Failure Frequency due to External Interference,” IPC2008-64375, Proceedings of IPC2008, 7th International Pipeline Conference, Calgary, 2008.
[5] A. Cosham, J. V. Haswell and N. Jackson, “Reduction Factors for the Probability of Fa ilure of Mechanical Damage due to External Interference,” IPC2008-64345, Proceedings of IPC2008, 7th International Pipeline Conference, Calgary, 2008.
[6] P. Seevam, C. Lyons, P. Hopkins and M. Toft, “Modelling of Dents and Gouges and the Effect on the Failure Probability of Pipelines,” IPC2008-64061, Proceedings of IPC2008, 7th International Pipeline Conference, Calgary, 2008.
[7] G. Goodfellow, C. Lyons, S. Turner, F. Gray and S. Joyce, “An Update to the Recommended UKOPA External Interference Frequency Prediction Model & Pipeline Damage Distributions,” IPC2018-78767, Proceedings of the 2018 12th International Pipeline Conference, IPC 2018, Calgary, 2018.