Tyrosine pathway regulation is host-mediated in the pea aphid symbiosis during late embryonic and...
17
RESEARCH ARTICLE Open Access Tyrosine pathway regulation is host-mediated in the pea aphid symbiosis during late embryonic and early larval development Andréane Rabatel 1,3 , Gérard Febvay 2,3 , Karen Gaget 2,3 , Gabrielle Duport 2,3 , Patrice Baa-Puyoulet 2,3 , Panagiotis Sapountzis 2,3 , Nadia Bendridi 1,3 , Marjolaine Rey 2,3 , Yvan Rahbé 2,3,4 , Hubert Charles 1,3,4 , Federica Calevro 1,3* and Stefano Colella 2,3* Abstract Background: Nutritional symbioses play a central role in insects’ adaptation to specialized diets and in their evolutionary success. The obligatory symbiosis between the pea aphid, Acyrthosiphon pisum, and the bacterium, Buchnera aphidicola, is no exception as it enables this important agricultural pest insect to develop on a diet exclusively based on plant phloem sap. The symbiotic bacteria provide the host with essential amino acids lacking in its diet but necessary for the rapid embryonic growth seen in the parthenogenetic viviparous reproduction of aphids. The aphid furnishes, in exchange, non-essential amino acids and other important metabolites. Understanding the regulations acting on this integrated metabolic system during the development of this insect is essential in elucidating aphid biology. Results: We used a microarray-based approach to analyse gene expression in the late embryonic and the early larval stages of the pea aphid, characterizing, for the first time, the transcriptional profiles in these developmental phases. Our analyses allowed us to identify key genes in the phenylalanine, tyrosine and dopamine pathways and we identified ACYPI004243, one of the four genes encoding for the aspartate transaminase (E.C. 2.6.1.1), as specifically regulated during development. Indeed, the tyrosine biosynthetic pathway is crucial for the symbiotic metabolism as it is shared between the two partners, all the precursors being produced by B. aphidicola. Our microarray data are supported by HPLC amino acid analyses demonstrating an accumulation of tyrosine at the same developmental stages, with an up-regulation of the tyrosine biosynthetic genes. Tyrosine is also essential for the synthesis of cuticular proteins and it is an important precursor for cuticle maturation: together with the up-regulation of tyrosine biosynthesis, we observed an up-regulation of cuticular genes expression. We were also able to identify some amino acid transporter genes which are essential for the switch over to the late embryonic stages in pea aphid development. Conclusions: Our data show that, in the development of A. pisum, a specific host gene set regulates the biosynthetic pathways of amino acids, demonstrating how the regulation of gene expression enables an insect to control the production of metabolites crucial for its own development and symbiotic metabolism. Keywords: Symbiosis, Pea aphid, Metabolism, Development, Viviparous parthenogenesis, Amino acids, Tyrosine pathway, Cuticle formation, Microarrays transcriptome analysis * Correspondence: [email protected]; [email protected] 1 Insa-Lyon, UMR203 BF2I, Biologie Fonctionnelle Insectes et Interactions, Villeurbanne F-69621, France 2 Inra, UMR203 BF2I, Biologie Fonctionnelle Insectes et Interactions, Villeurbanne F-69621, France Full list of author information is available at the end of the article © 2013 Rabatel et al.; licensee BioMed Central Ltd. This is an Open Access article distributed under the terms of the Creative Commons Attribution License (http://creativecommons.org/licenses/by/2.0), which permits unrestricted use, distribution, and reproduction in any medium, provided the original work is properly cited. Rabatel et al. BMC Genomics 2013, 14:235 http://www.biomedcentral.com/1471-2164/14/235
-
Upload
independent -
Category
Documents
-
view
4 -
download
0
Transcript of Tyrosine pathway regulation is host-mediated in the pea aphid symbiosis during late embryonic and...

Rabatel et al. BMC Genomics 2013, 14:235http://www.biomedcentral.com/1471-2164/14/235
RESEARCH ARTICLE Open Access
Tyrosine pathway regulation is host-mediated inthe pea aphid symbiosis during late embryonicand early larval developmentAndréane Rabatel1,3, Gérard Febvay2,3, Karen Gaget2,3, Gabrielle Duport2,3, Patrice Baa-Puyoulet2,3,Panagiotis Sapountzis2,3, Nadia Bendridi1,3, Marjolaine Rey2,3, Yvan Rahbé2,3,4, Hubert Charles1,3,4,Federica Calevro1,3* and Stefano Colella2,3*
Abstract
Background: Nutritional symbioses play a central role in insects’ adaptation to specialized diets and in theirevolutionary success. The obligatory symbiosis between the pea aphid, Acyrthosiphon pisum, and the bacterium,Buchnera aphidicola, is no exception as it enables this important agricultural pest insect to develop on a dietexclusively based on plant phloem sap. The symbiotic bacteria provide the host with essential amino acids lackingin its diet but necessary for the rapid embryonic growth seen in the parthenogenetic viviparous reproduction ofaphids. The aphid furnishes, in exchange, non-essential amino acids and other important metabolites.Understanding the regulations acting on this integrated metabolic system during the development of this insect isessential in elucidating aphid biology.
Results: We used a microarray-based approach to analyse gene expression in the late embryonic and the earlylarval stages of the pea aphid, characterizing, for the first time, the transcriptional profiles in these developmentalphases. Our analyses allowed us to identify key genes in the phenylalanine, tyrosine and dopamine pathways andwe identified ACYPI004243, one of the four genes encoding for the aspartate transaminase (E.C. 2.6.1.1), asspecifically regulated during development. Indeed, the tyrosine biosynthetic pathway is crucial for the symbioticmetabolism as it is shared between the two partners, all the precursors being produced by B. aphidicola. Ourmicroarray data are supported by HPLC amino acid analyses demonstrating an accumulation of tyrosine at thesame developmental stages, with an up-regulation of the tyrosine biosynthetic genes. Tyrosine is also essential forthe synthesis of cuticular proteins and it is an important precursor for cuticle maturation: together with theup-regulation of tyrosine biosynthesis, we observed an up-regulation of cuticular genes expression. We were alsoable to identify some amino acid transporter genes which are essential for the switch over to the late embryonicstages in pea aphid development.
Conclusions: Our data show that, in the development of A. pisum, a specific host gene set regulates thebiosynthetic pathways of amino acids, demonstrating how the regulation of gene expression enables an insect tocontrol the production of metabolites crucial for its own development and symbiotic metabolism.
Keywords: Symbiosis, Pea aphid, Metabolism, Development, Viviparous parthenogenesis, Amino acids, Tyrosinepathway, Cuticle formation, Microarrays transcriptome analysis
* Correspondence: [email protected]; [email protected], UMR203 BF2I, Biologie Fonctionnelle Insectes et Interactions,Villeurbanne F-69621, France2Inra, UMR203 BF2I, Biologie Fonctionnelle Insectes et Interactions,Villeurbanne F-69621, FranceFull list of author information is available at the end of the article
© 2013 Rabatel et al.; licensee BioMed CentralCommons Attribution License (http://creativecreproduction in any medium, provided the or
Ltd. This is an Open Access article distributed under the terms of the Creativeommons.org/licenses/by/2.0), which permits unrestricted use, distribution, andiginal work is properly cited.

Rabatel et al. BMC Genomics 2013, 14:235 Page 2 of 17http://www.biomedcentral.com/1471-2164/14/235
BackgroundSymbiosis plays a key role in the life of many insects thatlive on nutritionally unbalanced diets, such as plant sap,blood or grain [1,2]. The adaptation of these insects tosuch food sources is possible only in association with cer-tain microorganisms that are specialized in nutritionalcomplementation. Endosymbiosis is, thus, a central processin these animals and more than 10% of insect species de-pend on intracellular bacteria for their development andsurvival [3]. This is true for aphids that feed on phloem sap[4], a very unbalanced diet that is characterized by a highconcentration of sucrose and by very low levels of severalessential amino acids crucial to the development of thesemetazoans [5]. The obligate intracellular symbiotic bacteriain aphids belong to the Buchnera genus and they providethese important pest insects with the essential amino acidslacking in their diet [6-10]. Symbiotic bacteria are con-tained in specialized host cells, called bacteriocytes, thatare localised in the abdominal haemocoel, close to the ova-ries in sexual and asexual females [1]. In fact, aphids have alife cycle that alternates sexual and asexual reproduction[11] and the success of aphids as crop pests is enhanced bytheir phenomenal reproductive rates, through viviparousparthenogenesis, during spring and summer. Parthenogen-etic viviparous females have two ovaries, each containingseveral ovarioles. In the pea aphid, Acyrthosiphon pisum,embryos at different stages of development can be ob-served, at any given time, within six or seven ovarioles[12,13] and an adult asexual female reared in the laboratoryproduces an average of 130 embryos during her lifespan.The vertical transmission process of the symbionts is vitalfor the reproductive success of aphids and it takes place atthe end of blastoderm formation in the A. pisum embryonicdevelopment [13,14]. At this stage, approximately 1000Buchnera aphidicola bacteria are transmitted from mater-nal bacteriocytes to a single viviparous embryo, and theyincrease in number by 120 fold during the remaining em-bryonic development [1,13,15-17].The importance of B. aphidicola nutritional comple-
mentation was initially indicated by the observation thataposymbiotic aphids (in which the symbiotic bacteriahave been depleted using an antibiotic treatment) showsignificantly reduced growth and reproductive rates [18-22].A. pisum has been extensively used in laboratory studiesand its genome has been recently sequenced and annotated[23]. Several B. aphidicola genomes, from different aphidspecies [10,24-27] and from strains of pea aphid [28], havealso been sequenced. In fact, a comparison between thepea aphid genome and that of its symbiont [10,28] con-firmed the previously hypothesized integrated metabolismfor these two organisms, in particular for the amino acidpathways [23,29,30]. The symbiotic bacterial genome in-cludes genes for almost all enzymes involved in the essen-tial amino acid pathways, while the few missing genes in
the leucine, isoleucine, valine, methionine and phenylal-anine pathways are present in the host genome [10,29].A recent RNAseq transcriptome study of maternal bac-teriocytes, compared with other tissues, supports the inte-grated nature of the host-symbiont metabolic network: thisis demonstrated by specific gene expression regulations ofamino acid metabolism genes in the symbiotic compart-ment, compared with other aphid body compartments [31].The availability of the genome sequences for both part-
ners of this symbiosis opens up several new research per-spectives for this genomic model of symbiosis [32,33].Functional genomics will help to characterize the role ofdifferent genes, and their regulation, in different physio-logical processes that contribute to the reproductive andecological success of aphids. As seen in several other sym-biotic bacteria, the B. aphidicola genome is reduced in sizewhen compared to that of free-living bacteria [34] and itshows a clear reduction in the classic bacterial gene ex-pression regulatory networks (reviewed in [35]). Severalstudies have indicated the lack of a strong and specifictranscriptional response of this bacterium following astress applied to the aphid host [36-38]. Nevertheless, astructured link between the organization of genes on thechromosome and gene transcription levels is conserved inB. aphidicola, as compared to the phylogenetically relatedfree-living bacteria [39], and, more recently, a specifictranscriptional response of the pLeu plasmid to a leucinestress applied to the pea aphid host has been demon-strated [40]. The integrated metabolism of the two part-ners indicates that the B. aphidicola regulatory capabilityis connected to the host transcriptional responses to stressevents or to different physiological conditions. Certainstudies have analysed the pea aphid transcriptome in dif-ferent tissues and physiological conditions [38,41-47], butno global gene expression analysis of the aphids’ partheno-genetic embryonic development has yet been performed.Although the metabolic complementation between B.
aphidicola and aphids is important throughout their lifecycle, the symbiosis is thought to play a key role duringthe parthenogenetic embryo development (reviewed in[48]). For example, embryonic growth in aphids is highlydependent on bacterial-derived phenylalanine and tryp-tophan and, to a lesser extent, on methionine and lysine[49]. After microinjections of radioactively labelled aminoacids into the haemocoel of adult aphids, the selectiveuptake of phenylalanine and lysine by embryos confirmstheir specific metabolic needs [50]. It is difficult to deter-mine whether this requirement for a high level of aminoacids in pea aphid embryos is supported by the maternaltissues (maternal bacteriocytes and/or other tissues) or bythe embryonic complement of the symbiotic bacterialocalized in the embryonic bacteriocytes. It has beenestablished that late embryos can rely on their own com-plement of symbiotic bacteria for a supply of essential

Rabatel et al. BMC Genomics 2013, 14:235 Page 3 of 17http://www.biomedcentral.com/1471-2164/14/235
amino acids, particularly for the aromatic amino acids[51]. More recently, a study on the embryos of the blackbean aphid Aphis fabae, maintained in vitro with artificialdiets lacking amino acids, confirmed the importance ofcertain amino acid supplies, specifically phenylalanine andvaline, acquired exogenously from B. aphidicola in thematernal symbiosis, and tryptophan, acquired endogen-ously from symbiotic bacteria within the embryo [52].In all the early ex vivo studies of embryonic nutritional
needs, the ovaries were always analysed as a whole and,consequently, no data on the distinct embryonic develop-mental stages were available. More recently, a study onthe separate stages was performed to assess B. aphidicolatranscriptional changes during development [53]. Thiswork revealed that the number of B. aphidicola genes dif-ferentially expressed between embryos and maternal tis-sues varies significantly among the early, intermediate andlate embryos, indicating that the symbiotic interactionsbetween the developing host and its bacterial partner aredynamic, changing in response to the developmental ageof the host. The availability of the A. pisum genomeprompted us to complement this work with an analysis ofpea aphid transcription profiles during parthenogeneticdevelopment. Using a NimbleGen custom microarray, weanalysed the host transcriptome comparing different de-velopmental groups, thus generating a complete analysisof gene expression during viviparous parthenogenesis of asymbiotic insect. These transcriptomic data were coupledwith an analysis of amino acid metabolism, which enabledus to identify some key aspects of the contribution of thesymbiotic partners to the metabolic needs of developingparthenogenetic embryos.
ResultsGlobal analysis of gene expression during embryonicdevelopmentUsing the newly developed “INRA-BF2I_A.pisum_Nimblegen-ACYPI_4x72k_v1” microarray (ArrayExpress de-sign ID: A-MEXP-1999), built on the pea aphid genome
Table 1 Description of embryonic and larval stages used for t
Group Groupabbreviation
Developmentalstages
Embryos
Early embryos EE 0-15
Intermediate embryos IE 16-18
Late embryos LE 19-20
Larvae First instar larvae
L1
1st larvalL1 early
L1 late
Assignment of embryos to the three groups (EE, IE or LE) was based on size range and omicrophotographs). The developmental stages were defined according to Miura et al. [13
v1.0 assembly [23], we obtained gene expression profilesof aphid embryos belonging to three distinct groups,namely early (EE), intermediate (IE) and late (LE) em-bryos, collected according to their developmental stage(see Table 1 and Figure 1A), together with aphids at theirfirst larval stage (L1). Three biological replicates wereused for each experimental group (see Methods sectionfor further details).To check the overall quality of the data, after nor
malization, we performed an unsupervised cluster ana-lysis using the 50% of genes showing the highest SD inall the samples (i.e. 12,005 genes) and, with this ap-proach, we were able to classify the data in the original4 groups analyzed (Figure 1B), with all the biologicalreplicates clustering together. As this analysis confirmedthe reliability of our data following the dissection andisolation of the embryos, we then used all the data avail-able to perform the following pair-wise comparisons:(a) EE vs. IE, (b) IE vs. LE and (c) LE vs. L1, using a one-way between groups ANOVA. Among the 24,011 tran-scripts analyzed, 3,945 (16.4%) were considered as beingsignificantly differentially expressed during the develop-ment of the pea aphid using the following criteria: an ad-justed p-value lower than 0.05 and a two-fold change inthe considered contrast (see Methods for details of theanalysis). Using these criteria, we identified, respectively,1,264, 1,654 and 2,251 differentially expressed genes forthe comparisons EE-IE, IE-LE and LE-L1 (Figure 1C andAdditional file 1: Table S1). We observed an increase inthe total number of genes differentially expressed duringdevelopment, whereas the proportion of up-regulatedgenes decreased by 78.6%, 66.0% and 51.3%, respectively,in the three sequential comparisons EE-IE, IE-LE andLE-L1. This observation shows an activation of the ex-pression of many genes in the earlier stages (comparisonEE vs. IE), followed by a down-regulation of the genesimportant for development and not needed for the firstinstar larval stage aphids (L1). An analysis of the inter-section between stages allowed us to characterize the
he transcriptomic and amino acid content analyses
Size(length or weight)
External morphological features
≤ 400 μm *No visible eyes *Very slight body pigmentation
400-800 μm *Developing eye spots in many individuals*Pigmented bodies
> 800 μm *Developed eye spots in all individuals*Highly pigmented bodies
≤ 0.2 mg
0-24 hours old
≤ 6 hours old
≥ 15 hours old
n morphological criteria detailed in this table (see Figure 1A for exemplary]. Larval stages were determined according to the development time after laying.

Figure 1 Global expression analysis in pea aphid development. A) Micro-photographs of the four stages analysed in this work where thescale bar represents 200 μm in all photographs to allow for size comparison. The microphotographs show just one embryo stage among thosebelonging to the corresponding groups (see Table 1 for detail). The performed comparisons, early embryos (EE) versus intermediate embryos (IE),intermediate versus late embryos (LE) and late embryos versus first larval stage (L1) are labelled, respectively, in rose, violet and light blue.B) Unsupervised hierarchical clustering (generated by an average linkage method with euclidean distance and no leaf order optimization) of 50%of transcripts (12,005) showing the higher standard deviation among all the samples. The colour chart indicates expression intensities using abase 2 logarithmic scale: blue and red represent, respectively, lower (2.0) and upper (16.0) expression intensities (see bottom panel legend).C) The Venn diagram of the 3945 genes showing significantly differential expression in the three comparisons (comparison colour code as inFigure 1A). Numbers in red identify the genes increasing in expression during development; in dark blue, the genes decreasing in expressionduring development; and, in black, the genes found to be significant in two or more groups where the expression changes are not varying inthe same direction in the different comparisons.
Rabatel et al. BMC Genomics 2013, 14:235 Page 4 of 17http://www.biomedcentral.com/1471-2164/14/235
developmental switches and to identify significant ex-pression changes. For example, the highest number ofcommon genes is found at the intersection between theIE-LE and LE-L1 comparisons, with 604 genes (Additionalfile 1: Table S1D). It is worth noting that, out of these604 genes common to the IE-LE and LE-L1 comparisons,516 showed expression changes in opposite directionsin the two comparisons and, among those, 366 were up-regulated between IE and LE and down-regulated betweenLE and L1. These observations support the fact that nu-merous genes that are important in development are acti-vated in the early stages and they are gradually repressedin the more advanced stages, up to the L1 stage. On theother hand, between the EE-IE and IE-LE comparisons,we observed a continuity of expression in the majority ofcommon genes (340 out of 435 changed in the same di-rection, with 322 showing an up-regulation during devel-opment). Overall, our results show the expected higher
number of genes changing their expression at the transi-tion between the embryonic and larval stages.
Microarray data validation by quantitative RT-PCRTo validate the data obtained from the microarray analysisin our first experiment, we repeated the experiment forthe same four stages and quantified the expression ofeight A. pisum genes, belonging to four functional classes(3 developmental genes, 3 amino acid pathways genes,1 cuticular gene and 1 transporter gene), using quantita-tive reverse transcription-PCR (qRT-PCR). The whole ex-periment was performed again using three new biologicalreplicates for each stage group and for these samples totalRNA was not amplified (see Methods for details). Wecompared the data obtained from qRT-PCR with thatobtained in the independent microarray experiments andfound very good concordance, with a Pearson’s correlation

Rabatel et al. BMC Genomics 2013, 14:235 Page 5 of 17http://www.biomedcentral.com/1471-2164/14/235
coefficient of 0.87 (p < 0.0001) between these two datasets(Additional file 2: Table S2) [54].
Developmental genes expression analysisAmong the 387 pea aphid developmental genes annotatedby Shigenobu et al. [55], using homology with Drosophilamelanogaster, 368 were present in our microarrays andwere analysed. In our dataset, 118 genes (32%) showedsignificant differential expression in at least one of thethree comparisons we performed (Figure 2A). In the com-parisons EE-IE, IE-LE and LE-L1 we found, respectively,30, 67 and 44 significant variant genes (Figure 2B andAdditional file 3: Table S3). Twenty-one genes increasedtheir expression during development, while 80 genesshowed decreasing levels of expression. Among these 80genes, 45 were found only in the comparison IE-LE, i.e.the last of the embryonic developmental stages analyzedin this study. We performed a detailed analysis of twogene classes, as defined in the Shigenobu et al annotationpaper [55]: the homeobox-containing genes and thesignalling-pathway genes, which are involved in the estab-lishment of anatomical patterns and in the regulation ofdevelopmental processes in all the metazoans. Among the95 homeobox-containing genes annotated in the genomeof A. pisum, 27 were identified as differentially expressedin at least one of the three comparisons; the same was truefor 32 signalling pathway genes, among the 101 annotated,showing significant differential gene expression at differ-ent stages of development (Figure 2A and Additional file 3:Table S3D). We also performed a detailed manual analysisfor 80 genes belonging to the six main classes of develop-mental genes classified as being involved in body axisformation, in embryo segmentation, in germline specifica-tion, in neurogenesis and in eye development, togetherwith the Hox genes. Of these 80 genes, only 18 showeddifferential expression in at least one comparison. None ofthese genes were up-regulated in the EE-IE and IE-LEcomparisons and the majority were down-regulated dur-ing development, when comparing IE with LE. A fewgenes showed up-regulation in the LE to L1 transition, in-cluding homologs of the D. melanogaster Tslr, Knrl-1, ci,Hh, Ubx and so genes (Additional file 3: Table S3).
Gene ontology analysis of significant genesWe performed an unsupervised analysis of the genesshowing significant differential expression in the threecomparisons (EE-IE, IE-LE and LE-L1), using an enrich-ment analysis of the functional classes of genes based onthe Gene Ontology (GO) annotation. This analysis re-vealed 246, 274 and 94 enriched functional classes forthe comparisons EE-IE, IE-LE and LE-L1, respectively,thus showing a higher number of gene class changes inthe two embryonic development comparisons (Additionalfile 4: Table S4). We observed enrichment in transporter
activity genes both in the EE-IE and IE-LE comparisons,with the presence of amino acid transporters beingamongst the most significant. In the IE-LE comparison,the morphogenesis and appendage development genesshowed significant changes in expression levels. For theIE-LE and LE-L1 comparisons, the analysis revealed threeGO classes involved in the cuticle formation process.
Metabolism gene expression: the amino acid pathwaysTo explore the general metabolic changes that take placeduring the parthenogenetic development of the pea aphid,we analyzed the relevant genes (Additional file 1: Table S1)using the annotations available in the AcypiCyc database,which contains the global reconstruction of the metabolicnetwork of the pea aphid [56]. At least one enzyme-codinggene showed significant differential expression for 43, 74and 90 pathways in the EE-IE, IE-LE and LE-L1 compari-sons, respectively (Additional file 5: Table S5). We classi-fied all these pathways, in AcypiCyc, into five broadgroups of compounds: lipids, amino acids, sugars, nucleo-tides, and others. An analysis of the distribution of geneswithin these classes, compared with the total number ofgenes in the pea aphid genome, did not reveal any sig-nificant changes that would indicate a class of particularinterest. For example, 16.8% of the total number of differ-entially expressed enzyme-coding genes in our datasetforms part of the amino acid metabolism group and, in thepea aphid genome, the percentage of genes coding for thisclass is 16.4%. So, the number of detected genes is notsignificantly different from the number that would beexpected by chance. The same is true for the other classes,but we decided to carry out further gene-by-gene analysisfor those classes supposed, a priori, to play an importantrole in symbiosis or in developmental processes.In particular, we analyzed in more detail the gene ex-
pression profiles of the 135 genes involved in the aminoacid biosynthesis or degradation pathways [29], whichwere present in our overall analysis and which representone of the key functions in the physiology of pea aphid/B. aphidicola symbiosis. This analysis revealed that the ma-jority of the genes involved in these pathways are stronglyexpressed (Figure 3A): 78.5% of these genes are amongthe 25% of genes showing the strongest expression. Of the135 annotated genes, 23 showed significantly differentialexpression in our comparisons (with 17 genes increasingand four decreasing in expression and two variations of ex-pression in the opposite direction during development).Among the genes involved in amino acid biosynthesis, thesignificant ones can be classified into four groups: (1) theaspartate biosynthetic family (Asp, Asn, Met, Cys, Thr, Ile,Lys); (2) the phosphoenolpyruvate biosynthetic family(Phe, Tyr, Trp); (3) the glutamate biosynthetic family (Glu,Gln, Pro, Arg); and (4) the 3-phosphoglycerate biosyntheticfamily (Ser, Cys, Gly) (Additional file 6: Table S6).

Figure 2 Developmental gene expression analysis in pea aphid.A) Hierarchical clustering (generated by an average linkage methodwith euclidean distance and no leaf order optimization) on the 368developmental genes present on the microarrays (out of the 387annotated by Shigenobu et al. [55]). The colour chart indicatesexpression intensities using a base 2 logarithmic scale: blue and redrepresent, respectively, lower (2.0) and upper (16.0) expressionintensities (see bottom panel legend). On the right of the cluster,genes showing significant differential expression in at least one ofthe comparisons are indicated: in green, 27 homeobox-containinggenes; in red, 32 signalling pathways genes; and, in black, 59 otherdevelopmental genes. B) The Venn diagram, showing the 118developmental genes with significantly differential expression in thethree comparisons (comparison colour code as in Figure 1A) analysedin this study. Numbers in red identify the genes increasing inexpression during development; in dark blue, the genes decreasing inexpression during development; and, in black, the genes found to besignificant in two or more groups where the expression changes arenot varying in the same direction in the different comparisons.
Rabatel et al. BMC Genomics 2013, 14:235 Page 6 of 17http://www.biomedcentral.com/1471-2164/14/235
The tyrosine (Tyr) pathway appeared to be particularlyinteresting with two genes, encoding for the proteins withthe enzymatic activities EC 1.14.16.1 and EC 2.6.1.1, show-ing significantly increased levels of expression duringdevelopment (Figures 3B and 3C). In particular the ex-pression of the ACYPI007803 gene, which encodes for theenzyme phenylalanine 4-monooxygenase responsible forthe synthesis of Tyr in the pea aphid (EC 1.14.16.1), sig-nificantly increased in the IE-LE comparison (log2 differ-ence of 3.36 for the IE-LE comparison). Another threegenes were annotated as potentially coding for this en-zyme: for two of them (ACYPI000847 and ACYPI008168)other EC annotations were supported by the analysis inAcypiCyc (EC 4.2.1.96 and EC 1.14.16.2 respectively),while ACYPI000175 had a weak annotation score for theenzymatic activity EC 1.14.16.1 but it did not show signifi-cant changes in expression.Four genes in the pea aphid genome (ACYPI000044,
ACYPI006213, ACYPI004243, and ACYPI003009) encodefor the enzyme aspartate transaminase (EC 2.6.1.1), whichcatalyzes the synthesis of phenylalanine from phenylpy-ruvate (Figure 3B). Our gene expression analysis revealed3 distinct transcription profiles for these four genes(Figure 3C): ACYPI006213 and ACYPI000044 showed aconsistently high level of expression during development,ACYPI003009 gene expression was constant and verylow during development, while ACYPI004243 showed asignificant change in its expression level. The expressionof this gene was relatively low in the early (EE) and inter-mediate (IE) embryo stages, compared to other genes, butit increased significantly between IE and L1 (2.37 and 2.91log2 differences for the IE-LE and LE-L1 comparisons,respectively). The gene expression changes, detected usingthe microarrays for ACYPI007803 and ACYPI004243,were also confirmed by specific qRT-PCR experiments(Additional file 2: Table S2).
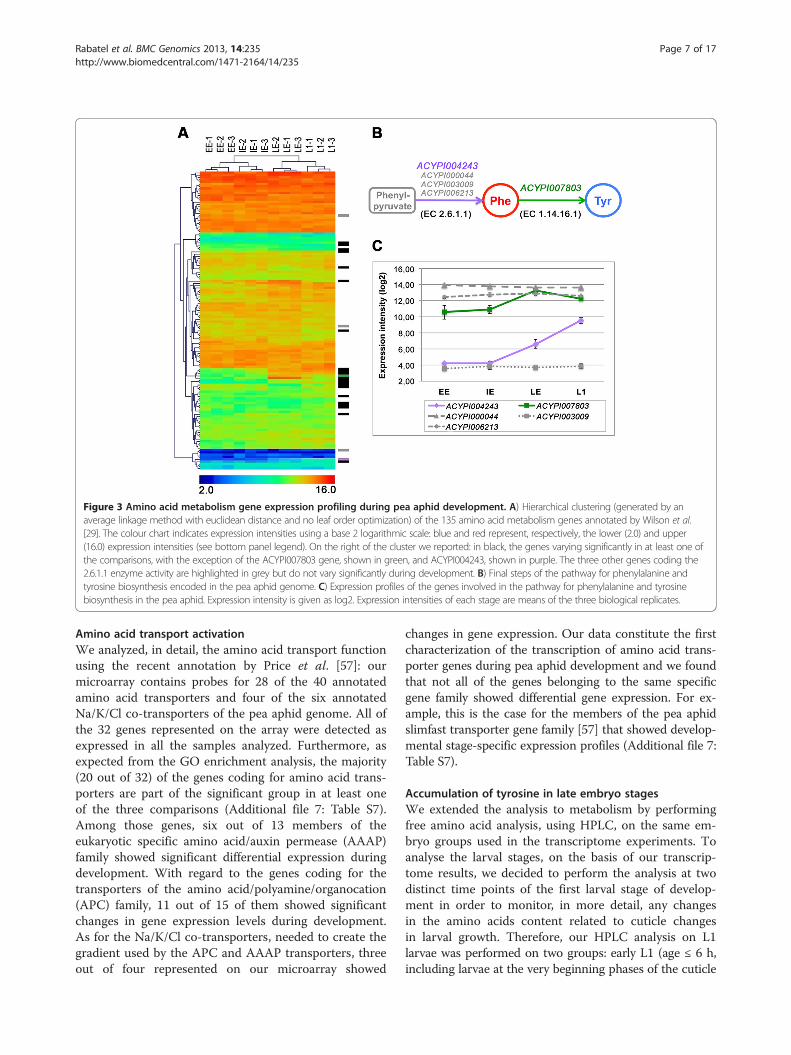
Figure 3 Amino acid metabolism gene expression profiling during pea aphid development. A) Hierarchical clustering (generated by anaverage linkage method with euclidean distance and no leaf order optimization) of the 135 amino acid metabolism genes annotated by Wilson et al.[29]. The colour chart indicates expression intensities using a base 2 logarithmic scale: blue and red represent, respectively, the lower (2.0) and upper(16.0) expression intensities (see bottom panel legend). On the right of the cluster we reported: in black, the genes varying significantly in at least one ofthe comparisons, with the exception of the ACYPI007803 gene, shown in green, and ACYPI004243, shown in purple. The three other genes coding the2.6.1.1 enzyme activity are highlighted in grey but do not vary significantly during development. B) Final steps of the pathway for phenylalanine andtyrosine biosynthesis encoded in the pea aphid genome. C) Expression profiles of the genes involved in the pathway for phenylalanine and tyrosinebiosynthesis in the pea aphid. Expression intensity is given as log2. Expression intensities of each stage are means of the three biological replicates.
Rabatel et al. BMC Genomics 2013, 14:235 Page 7 of 17http://www.biomedcentral.com/1471-2164/14/235
Amino acid transport activationWe analyzed, in detail, the amino acid transport functionusing the recent annotation by Price et al. [57]: ourmicroarray contains probes for 28 of the 40 annotatedamino acid transporters and four of the six annotatedNa/K/Cl co-transporters of the pea aphid genome. All ofthe 32 genes represented on the array were detected asexpressed in all the samples analyzed. Furthermore, asexpected from the GO enrichment analysis, the majority(20 out of 32) of the genes coding for amino acid trans-porters are part of the significant group in at least oneof the three comparisons (Additional file 7: Table S7).Among those genes, six out of 13 members of theeukaryotic specific amino acid/auxin permease (AAAP)family showed significant differential expression duringdevelopment. With regard to the genes coding for thetransporters of the amino acid/polyamine/organocation(APC) family, 11 out of 15 of them showed significantchanges in gene expression levels during development.As for the Na/K/Cl co-transporters, needed to create thegradient used by the APC and AAAP transporters, threeout of four represented on our microarray showed
changes in gene expression. Our data constitute the firstcharacterization of the transcription of amino acid trans-porter genes during pea aphid development and we foundthat not all of the genes belonging to the same specificgene family showed differential gene expression. For ex-ample, this is the case for the members of the pea aphidslimfast transporter gene family [57] that showed develop-mental stage-specific expression profiles (Additional file 7:Table S7).
Accumulation of tyrosine in late embryo stagesWe extended the analysis to metabolism by performingfree amino acid analysis, using HPLC, on the same em-bryo groups used in the transcriptome experiments. Toanalyse the larval stages, on the basis of our transcrip-tome results, we decided to perform the analysis at twodistinct time points of the first larval stage of develop-ment in order to monitor, in more detail, any changesin the amino acids content related to cuticle changesin larval growth. Therefore, our HPLC analysis on L1larvae was performed on two groups: early L1 (age ≤ 6 h,including larvae at the very beginning phases of the cuticle

Rabatel et al. BMC Genomics 2013, 14:235 Page 8 of 17http://www.biomedcentral.com/1471-2164/14/235
maturation after birth) and late L1 (age ≥ 15 h, preparingthe cuticle changes for the switch over to the L2 larvalstage). The results of this analysis were expressed as a frac-tion of the total free amino acid content (Additional file 2:Table S8). For histidine and methionine, the concentra-tions in the EE and IE stages were below the methoddetection limits. For two amino acids (asparagine and leu-cine) no significant variation in proportion was observedbetween any of the stages. The aspartic and glutamic acids(both p < 0.0001) showed a tendency to decrease theirrelative concentration during development (Figure 4).Threonine decreased during embryonic development andincreased in the larval stages. Four amino acids showed asignificant increased relative concentration during devel-opment (p < 0.0001): arginine, tyrosine, lysine and proline(Figure 4). Among these amino acids, the greatest differ-ence during development was observed for tyrosine in thelate embryo group (LE), showing a six-fold increase inconcentration compared with the early embryos (EE). Theproportion of free tyrosine decreased rapidly form early tolate larvae L1. However, phenylalanine, the precursor oftyrosine, did not show any significant change between anyof the stages (Figure 4).
Embryo development specific regulation of the geneACYPI004243The matching profiles of the enzyme-coding gene expres-sion for tyrosine synthesis and the accumulation of thisamino acid in the LE and L1 embryo groups prompted us
Figure 4 Proportion of free amino acids during pea aphiddevelopment. Free amino acid contents of early, intermediate andlate embryos, and in the first larval stage taken at two distinct timesof development (early L1 ≤ 6 hours and late L1 ≥ 13 hours). Values(n = 4) are expressed as a percentage of the total amount of aminoacids in the different samples. Among the 18 amino acids analysed,only those varying the most (P < 0.0001) and phenylalanine(P = 0.0015), the precursor of tyrosine, are represented. In particularamong the significant changes (see Table S8 for details) it is worthnoting: a decrease of aspartic acid from 16.3% in the early embryos(EE) to 0.7% in L1 larvae; a glutamic acid decrease from IE (35.2%) tothe L1 stages (around 17.4%); an accumulation of tyrosine duringdevelopment from 1.9% in early embryos (EE) to 12.1% in the lateembryo group (LE), accumulation that continues in early first larvalstage (17.6%) to decrease rapidly to 6.8% for the late larvae L1.
to perform a more detailed analysis of the genes involvedin this pathway (Figure 3B and 3C). To gain a better un-derstanding of the differences between the four genes(ACYPI000044, ACYPI003009, ACYPI004243, and ACYPI006213), annotated in the AcypiCyc database as codingfor the enzyme aspartate transaminase (EC 2.6.1.1), weperformed a detailed enzyme gene annotation using thededicated PRIAM tool [58]. This analysis revealed that,for all of the corresponding proteins, after the primaryannotation as enzymatic activity aspartate transaminase(EC 2.6.1.1), two other complementary annotations follow:the enzymatic activity tyrosine transaminase (EC 2.6.1.5)and the enzymatic activity aromatic amino acid trans-aminase (EC 2.6.1.57) (Additional file 2: Table S9). Thisadditional in silico analysis confirmed the hypothetical roleof these four genes in coding the enzymes catalyzing theaspartate, tyrosine and aromatic amino acids transami-nation reactions. The two more specific annotations ofPRIAM are not included in the AcypiCyc database as theydid not pass the cut-off point applied in the generationof the database using CycADS [56]. Finally, we analyzedthe gene structure and the genome organization of thefour genes encoding for the enzyme aspartate transami-nase (E.C. 2.6.1.1) in the pea aphid. Among these genes,ACYPI000044 shows a two-exon structure, with the cod-ing sequence restricted to exon 2, while all the other geneshave an 8-exon structure (with the coding sequencespread out between exon 1 and exon 8). It is worth notingthat the genes ACYPI004243 and ACYPI003009 mappedto the same contig in the pea aphid genome. An analysisof the protein sequences was performed and the align-ment of the four proteins revealed the expected conserva-tion, with the exception of the ACYPI000044-PA proteinsequence that has a unique N-terminal portion which isnot aligned to the other three proteins with the enzymaticactivity aspartate transaminase (EC 2.6.1.1) (Additionalfile 8: Figure S1). A detailed phylogenetic analysis ofthe four aspartate transaminases, expanding the proteininformation available in PhylomeDB [59] and using theUniProt database [60], was performed (Additional file 9:Figure S2). The evolution of the aspartate transaminases,also called aspartate amino transferases (AAT) family, re-vealed five major duplications separating bacterial AAT(TyrB and AspC) from mitochondrial AAT (AATM orGOT2) and cytoplasmic eukaryote AAT families (AATCor GOT1). ACYPI000044-PA clearly belongs to mitochon-drial AATM. ACYPI006213-PA, ACYPI004243-PA andACYPI003009-PA diverged more recently and seem to bespecific to aphids.The peculiarity of the ACYPI000044 gene structure,
the differences observed in its protein sequence, and itsphylogenetic position as regards the mitochondrial AATprompted us to carry out an additional analysis of theACYPI000044-PA unique N-terminal sequence. We can

Rabatel et al. BMC Genomics 2013, 14:235 Page 9 of 17http://www.biomedcentral.com/1471-2164/14/235
confirm that this corresponds to the mitochondrialtargeting signal peptide. As a result, the ACYPI000044-PAprotein has the highest score for potential export to mito-chondria, when compared to the other three genes encod-ing for this enzymatic activity (Additional file 2: Table S10).The gene structure of 23 of the 26 AATM proteins, in thesame clade as ACYPI000044-PA, was available (Additionalfile 9: Figure S2) and it is interesting to note that only twoother genes had a single exon encoding the protein: thesetwo genes are from the yeast Schizosaccharomyces pombeand the amoeba Dictyostelium discoideum.
The cuticle formation pathwayTyrosine is used to produce DOPA and dopamine, bothof which are needed for melanization and sclerotizationof the cuticle. Our observation of the increase in cuticlerelated gene expression between the LE and the L1 stages,coupled with the role of tyrosine as a precursor of cuticleformation processes, prompted us to analyse the DOPAand dopamine synthesis pathway in more detail. In effect,the gene coding for tyrosine 3-monooxygenase (ACYPI008168), the enzyme catalyzing the reaction convertingtyrosine to DOPA (EC 1.14.16.2), showed significant up-regulation in the comparison IE vs. LE and a reductionin expression in the passage from LE to L1 (Additionalfile 10: Table S11A). Multiple pea aphid proteins have beenannotated as having the enzymatic activity DOPA decarb-oxylase (EC 4.1.1.28) in AcypiCyc and, among them, thegene ACYPI009626 received the highest annotation score[56]. It was also seen to be significantly up-regulated in theLE embryo group, compared to IE, and down-regulated inthe transition from LE to L1 (Additional file 10: TableS11A). Another six proteins have been annotated as havingthe enzymatic activity aromatic-L-amino-acid decarboxylase(EC 4.1.1.28) but with a lower score [56]: five of them didnot show any change in gene expression during develop-ment, while one showed a reduction in expression in thecomparison LE vs. L1 (Additional file 10: Table S11A).We also analyzed the 74 genes annotated as cuticular
proteins by the GO annotation and, as expected fromour Gene Ontology analysis (GO:0042302), the majority(64 out of 74) showed significant up-regulation during atleast one stage in the late developmental phases (IE andLE samples), when the cuticle is being formed. Many ofthese genes (38 out of 64) showed a significantly lowerlevel of expression in L1, when compared to LE, butothers maintained a constant level of expression through-out the subsequent cuticular processes in larval develop-ment (Additional file 10: Table S11B).These data, taken together, demonstrate an up-regulation
of the metabolic pathways leading to the synthesis of cu-ticular proteins and of the key precursors for the process ofcuticle melanization and sclerotization, in the LE stage of
pea aphid development (Figure 5 and Additional file 10:Table S11).
DiscussionIn this study, the transcriptome analysis of parthenogen-etic development in embryonic pea aphids enabled us tocharacterize the gene expression profiles at key stages inthe development of this insect. A comprehensive tran-scriptome dataset, such as this, is important for the on-going genome annotation effort as gene expressionprofiles at specific steps of pea aphid development, or inspecific tissues, can lead to an initial characterization ofthe role of different genes in aphid physiology.After an unsupervised clustering analysis, that indi-
rectly demonstrated the good quality of our dataset, weidentified 3945 genes that showed significant changes inexpression level in the developmental groups analysedhere (Figure 1). We examined this high number of vari-ant genes, combining unsupervised and hypothesisdriven analyses.We identified the expression profiles of key developmen-
tal genes among the ones that had been annotated, insilico, during pea aphid genome analysis [23,55] (Figure 2).Using a global analysis based on gene ontology (GO), weidentified biological and cellular processes for which sig-nificant expression changes were apparent in the develop-mental stages under study. Between the IE and LE stages,several significant expression changes in the GO classesare linked, as expected, to the development of appendagesand morphogenesis. In both the EE vs. IE and IE vs. LEcomparisons a set of GO classes linked to amino acidtransport were identified as changing significantly duringdevelopment. To further investigate this observation, weanalysed the set of pea aphid amino acid transporters re-cently characterized [57] and we demonstrated a globalinduction of the majority of these annotated transportergenes during development (Additional file 7: Table S7).These observations represent the first characterization ofgene expression profiles of this family of genes involved inamino acid transport during the pea aphid’s parthenogen-etic development. An intriguing amplification of orthologgenes of the D. melanogaster slimfast gene (member of theAPC family) has been described in the pea aphid [57] andwe have analyzed the gene expression profiles of nine outof the 10 gene copies of this insect genome. Seven of theseslimfast orthologs showed increased expression duringdevelopment in the stages where embryonic growth isgreatest (Additional file 7: Table S7B): this observation isin agreement with the role of these genes as nutrient sen-sors during insect growth [61,62]. Among these slimfastgenes showing increasing expression during parthenogen-etic development, we find the three paralogs previouslyidentified as having an expression bias in male morphs(ACYPI003240, ACYPI005156 and ACYPI002633) [63].

Figure 5 Gene expression regulations acting on the integrated pathway for tyrosine and other precursors of the cuticular tanningbiosynthesis in a pea aphid embryo associated with B. aphidicola. A) Schematic representation of the pea aphid embryo (green rectangle)and its symbiotic bacteria (grey rectangle). A summarizing diagram of the Tyr/dopamine pathway during pea aphid development is represented.Black arrows represent reactions, grey arrows transport reactions; solid arrows are annotated events; dotted arrows are possible events; redcrosses indicate events not present in the annotation of the genome (see text for details). Only the pea aphid genes whose expression levelschange significantly during development are represented. The two B. aphidicola genes did not show significant expression changes during peaaphid development [53]. B) Expression profiles of the genes involved in the Tyr/dopamine pathway in the pea aphid. Expression intensity is givenas log2. Expression intensities of each stage are means of the three biological replicates.
Rabatel et al. BMC Genomics 2013, 14:235 Page 10 of 17http://www.biomedcentral.com/1471-2164/14/235
This observation does not contradict the male-biased ex-pression, but further characterization of these genes wouldbe interesting to gain a better understanding of their rolein the growth of the different morphs. We can speculatethat the expansion of this gene family in the pea aphid
genome, and the increased expression of several of thesegenes during embryonic development, might play a role inthe high growth rate observed for parthenogenetic vivipa-rous embryos in this insect. This hypothesis could be con-firmed by transcriptional analysis indicating either lower

Rabatel et al. BMC Genomics 2013, 14:235 Page 11 of 17http://www.biomedcentral.com/1471-2164/14/235
gene expression levels or different regulations for theslimfast genes in embryos produced by sexual reproductionand having a low growth rate.The recent pea aphid genome analysis showed how
the enzyme repertoires of the two partners of this meta-bolically obligatory symbiosis are complementary [23]. Acomprehensive analysis of the genes involved in metab-olism, performed using the AcypiCyc database annota-tions [56], did not reveal any significant global change ingene expression in the specific pathways. Nevertheless,the known central role of amino acid metabolism path-ways in this symbiotic relationship [29] and, in particu-lar, during pea aphid development [48], together withthe induction of expression of the amino acid trans-porter genes observed in our experiments, prompted usto analyse, in more detail, all the genes involved in theamino acid pathways [29]. Most genes coding for en-zymes involved in amino acid metabolism showed strongexpression levels (Figure 3), as expected given the cen-tral role of amino acids in embryonic development[49-52]. A significant induction of gene expression dur-ing pea aphid development, in the stages under study,affects several amino acid pathways (Additional file 6:Table S6). Among these, the pathway for the synthesisof phenylalanine and tyrosine showed significant geneexpression changes in both of the enzymatic activities(EC 2.6.1.1 and EC 1.14.16.1) encoded in the pea aphidgenome, for the steps complementary to those in B.aphidicola (Figure 5). To further investigate this pathway,which plays a key role in this symbiosis, we analysed thecontent of free amino acids in the same developmentalgroups studied in the transcriptome analysis. Our HPLCanalysis revealed an accumulation of tyrosine in the lateembryonic stages (Figure 4), coupled with a decrease inthe aspartate content. It is worth noting that this aminoacid is located upstream of the tyrosine pathway and is theamino group donor for phenylalanine synthesis (Figure 5).This observed biochemical phenotype corresponds to theinduction, during pea aphid development, of the expres-sion of specific genes coding for the enzymes of the finalsteps of the pathway. Our work demonstrates the exis-tence of an insect specific gene transcription regulation ofthis key amino acid synthesis and, thus, complements ourprevious observations of a lack of significant gene expres-sion regulation of the aromatic amino acid pathways inthe symbiotic bacteria during embryonic development[53]. The accumulation of tyrosine during pea aphid de-velopment is probably facilitated by a total lack of thegenes encoding for the tyrosine degradation pathway inthis insect genome [23,29], a pathway that is present in 18other arthropods (only one enzyme missing in Apismellifera) with a sequenced and annotated genome (http://arthropodacyc.cycadsys.org/; Baa-Puyoulet et al. manuscriptin preparation). Tyrosine has been previously identified as
the most abundant free amino acid in body fluids in an-other aphid species, Uroleucon ambrosiae (Strecker) [64].A recent RNAseq study on the pea aphid, by Hansen
and Moran [31], demonstrated that several genes, codingfor key enzymes complementary to the B. aphidicolametabolic repertoire, are highly expressed in the bac-teriocytes (the aphid symbiotic cells) when compared tothe rest of the body, excluding the embryonic compart-ment. In the present work, we identified two pea aphidgenes (ACYPI004243 and ACYPI007803) that are regu-lated during parthenogenetic and viviparous develop-ment to supply the growing embryos with tyrosine, a keyprecursor to the cuticle formation and sclerotizationprocess. In fact, two other genes, ACYPI008168 andACYPI009626, both important for cuticle formation, areup-regulated in the late phases of the pea aphid embry-onic development: they code, respectively, for the en-zymes catalyzing the reactions that produce DOPA (EC1.14.16.2) and dopamine (EC 4.1.1.28), starting from tyro-sine (Figure 5). DOPA and dopamine participate in themelanization (darkening) and the sclerotization (harden-ing) of the insects’ cuticle formed by cuticular proteinsand chitin [65,66]. The observed general increase in cu-ticular gene expression during the late phases of pea aphidembryo development (Additional file 10: Table S11) dem-onstrates that all components of this key developmentalprocess in insects are active in the late stages of pea aphidparthenogenetic development.Among all the transcriptionally regulated genes coding
for enzymes that we were able to identify, the most in-teresting example is aspartate transaminase (E.C. 2.6.1.1).Among the four genes coding for this enzyme, onlyACYPI004243 showed significant increases in expressionlevel during pea aphid development while the other threeshowed a constant expression, albeit at different levels foreach gene (Figure 3). However, ACYPI004243 showed alower expression level in adult bacteriocytes in the RNAseqstudy, when compared with the entire body (excluding theembryonic compartment) [31]. Among the four genes cod-ing for the enzyme aspartate transaminase (EC 2.6.1.1),ACYPI000044 had the highest level of expression in theadult pea aphid bacteriocytes [31]. In our study, we de-tected a relatively higher expression of ACYPI000044 inthe embryos and larvae, in comparison to the other 3genes, but the expression levels of this gene did not changeduring pea aphid development. The same absence ofchange in expression during development is true for theother two genes, ACYPI006213 and ACYPI003009, whichshow different levels of expression (Figure 3C) that areconsistent with the results of RNAseq experiments per-formed on adult bacteriocytes [31]. Although it is not pos-sible to define the role of each gene coding for theenzymes with aspartate transaminase activity (EC 2.6.1.1)our data demonstrate, for the first time, that among these

Rabatel et al. BMC Genomics 2013, 14:235 Page 12 of 17http://www.biomedcentral.com/1471-2164/14/235
four genes only ACYPI004243 expression levels increaseduring the parthenogenetic development of the pea aphid.This observation suggests that, in the pea aphid genome,ACYPI004243 is controlled by a specific transcriptionalregulation mechanism to respond to the need for phenyl-alanine and tyrosine synthesis during this important phaseof development, with a particular link to cuticle formation.
ConclusionsWe have characterized, for the first time, the transcrip-tional profiles underlying distinct developmental groupsin pea aphid parthenogenesis, thus providing new datafor gene function annotation and novel hypothesis gener-ation. Furthermore, as a result of the combination of tran-scriptional profile analysis with a biochemical approach, wewere able to show a correlation between gene transcrip-tional changes at the enzyme level and the accumulation/decrease of corresponding amino acids, demonstrating anembryo-specific gene regulation in the phenylalanine andtyrosine pathways. The integrated metabolism of the peaaphid and its symbiotic bacteria, B. aphidicola, is far frombeing completely understood, but our study elucidates, indetail, the role of specific genes in tyrosine metabolism forcuticle formation during the parthenogenetic developmentof this symbiotic insect.
MethodsAphid rearing and embryo isolationA long-established parthenogenetic clone (LL01) of A.pisum was maintained at 21°C, with a 16 hour photo-period, on Vicia faba (L. cv. Aquadulce). In order to havea supply of synchronised aphids and embryos, around onehundred mass-reared winged adults were maintained onyoung plants and removed after 24 h. The resulting apter-ous insects were maintained on Vicia faba plants for anine-day period, until they reached the adult stage.Embryos were dissected from synchronized partheno-
genetic viviparous adult aphids, removing the ovariolesheath in two distinct ice-cold buffers depending on thesubsequent analysis. For the total RNA extraction proced-ure, we used an RNase-free buffer composed of 35 mMTris-HCl (pH 7.5), 25 mM KCl, 10 mM MgCl2, 250 mMsucrose, in 0.1% diethyl pyrocarbonate water. For theHPLC experiments, the buffer contained 162.75 mM KCl,10 mM CaCl2, 25 mM MgCl2, 13.75 mM citric acid and38.75 mM NaOH.Following a stereoscopical analysis (Olympus IX-81,
Olympus, France), embryos were classified accordingto their length and morphological characteristics into3 groups: early embryos (EE) (≤ 0.4 mm), intermediateembryos (IE) (0.4 to 0.8 mm) and late embryos (LE)(> 0.8 mm) corresponding, respectively, to the develop-mental stages ≤ 15, 16-18 and 19-20 as described byMiura et al. [13] (Table 1). These groups were chosen
because it was easy to distinguish and separate them,during the dissection step, on the basis of well rec-ognizable external morphological criteria. These samedevelopmental stages were also chosen in a previouswork on B. aphidicola transcriptome analysis during peaaphid development [53], thus allowing us to make a dir-ect comparison of the transcriptomic data from both theinsect host and the symbiotic bacteria.To obtain synchronized early and late L1, viviparous
adults were maintained on young plants for 6 hours.The early L1 (aged from 0 to 6 h) were collected and,for the late L1 (aged from 13 to 19 h), after havingdiscarded the adults, larvae were maintained for a fur-ther 13 h on the plants prior to collection. For L1 agedfrom 0 to 24 h, viviparous adults were maintained onyoung plants for 24 hours and the resulting L1 were col-lected (Table 1).
RNA extractionTotal RNA was prepared using the RNeasy mini kit(Qiagen, Hilden, Germany). Three independent extrac-tions were prepared for each group starting from 60 em-bryos for the EE group, 30 embryos for both the IE andLE groups, and 30 larvae for the L1 group (0-24 h). It isworth noting that the RNA extractions for the micro-array and for the qRT-PCR experiments were performedindependently, thus the qRT-PCR data constitute a fullbiological experimental replicate of the microarray results.For the qRT-PCR, the extraction also included a step ofDNase treatment (RNase-Free DNase Set, Qiagen). TotalRNA concentration and quality were initially checked usingthe NanoDropW ND-1000 spectrophotometer (NanoDropTechnologies, Wilmington, DE, USA) and samples had tomeet the following quality parameters: A260/A280 ≥ 1.8and A260/A230 ≥ 1.8, in order to be used in the subse-quent analysis. The RNA samples were then run usingthe Agilent RNA 6000 Nano Kit on the Agilent 2100Bioanalyzer (Agilent Technologies, Palo Alto, CA) to checktheir integrity. Degraded samples appeared as significantlylower intensity traces, with the main peak area shifted tothe lower molecular weights, and they typically exhibitedmuch more noise on the trace. Only good quality sampleswere used for the subsequent analysis.
Amplification of mRNA and cDNA synthesisA limited amount of total RNA was available and weused a T7 RNA polymerase based linear amplificationmethod that has been shown to have no systematic influ-ence on microarray transcription profiles [67]. We usedthe MessageAmp™ II aRNA Amplification kit (Ambion,Austin, TX, USA) that preferentially amplifies eukaryoticmRNA. Following the manufacturer’s instructions, RNAamplification included five steps: (1) a reverse-transcriptionusing 1 μg of total RNA and 1 μl of T7-oligo(dT) primers

Rabatel et al. BMC Genomics 2013, 14:235 Page 13 of 17http://www.biomedcentral.com/1471-2164/14/235
(100 ng/μl), (2) a second strand cDNA synthesis, (3) acDNA purification on a DNA filter cartridge, (4) anin vitro transcription and (5) an amplified RNA purificationon an aRNA Filter Cartridge. Double strand cDNA wasprepared using the Superscript II kit (Invitrogen, Paisley,UK), as recommended by NimbleGen in the NimbleChip™
Arrays User’s Guide for gene expression analysis. Startingwith 10 μg of aRNA, the samples were processed accordingto the manufacturer’s instructions, including these foursteps: (1) an initial cDNA synthesis using random primers,(2) a second strand synthesis, (3) an RNase A clean-up,and (4) a cDNA precipitation. For each sample, the integ-rity of the aRNA and cDNA was checked using the AgilentRNA 6000 Nano Kit on the Agilent 2100 Bioanalyzer. Onlygood quality samples were retained for the microarrayexperiments.
Microarray experiments and data collectionThe “INRA-BF2I_A.pisum_Nimblegen-ACYPI_4x72k_v1”microarray for the pea aphid was developed in collabo-ration with NimbleGen using the pea aphid genome v1.0assembly [23]. This NimbleGen 385 K 4-plex (4 × 72,000probes) high-density array can accommodate four samplesthat are hybridized onto a section of the array containing72,000 60-mers oligonucleotide probes, representing 24,011pea aphid transcripts (corresponding to 23,855 genes). Themicroarray design is deposited in the ArrayExpress data-base (http://www.ebi.ac.uk/arrayexpress/) and the array isavailable to the International Aphid Genomics Consortiumcommunity. On the arrays, 185 probe sets recognise morethan one gene: these ACYPI probe sets are labelled with anasterisk (*) in all of the Results tables and they are listed infull in Table S1E. Labelling (using the NimbleGen One-Color DNA Labelling Kits and Cy3 Random Nonamers),hybridization on the arrays (at 42°C for 16-20 hours) andscanning (using MS 200 Microarray Scanner and the MS200 Data Collection Software) were carried out by RocheNimbleGen, as described in the NimbleGen arrays user’sguide for gene expression arrays, and they provided thefinal data files. All the transcriptomic data obtained areavailable in the ArrayExpress database (http://www.ebi.ac.uk/arrayexpress/).
Microarray data analysisMicroarray data were normalized, using the RMA method[68], and then transformed into log2. A one-way betweengroups ANOVA analysis was performed using the Limmapackage in the R software [69]: two by two comparisonswere performed to identify any differentially expressedgenes between the different stages of development (EE-IE;IE-LE; LE-L1). The non-parametric p-values were esti-mated using 1000 sample permutations and further ad-justed using the Benjamini and Hochberg method [70], tolimit the number of false positives by a control of the False
Discovery Rate (FDR). For this study we chose an FDRlower than 0.05. A gene was considered significant if itsadjusted p-value was lower than 0.05 and if it showed atwo-fold change in the considered contrast (see Additionalfile 1: Table S1 for a detailed list of significantly expressedgenes). All HCL (Hierarchical Clustering) analyses werecarried out using the TMeV software [71], applying theaverage linkage method with euclidean distance and noleaf order optimization. Gene Ontology analysis was car-ried out using the Blast2GO software [72] to perform theGOSSIP test ([73]; http://gossip.gene-groups.net).
Validation of microarray data by qRT-PCRTotal RNA was reverse-transcribed in cDNA using theSuperScript™ III First-Strand Synthesis System for RT-PCR(Invitrogen, Paisley, UK), with random primers, accordingto the manufacturer’s instructions. This protocol involvedthree principal steps: (1) an incubation for 5 min at 65°C,(2) a reverse transcription using 1 μg of total RNA andincluding three incubations (25°C, 50°C and 85°C), (3) anRNA matrix degradation using RNase H. Primers to targettranscripts (Additional file 2: Table S12) were designedwith the Oligo7 software [74], except those used for thegenes ACYPI009127 and ACYPI001858 which were takenfrom Brisson et al. [75]. Real-time PCR was performed in96-well plates with a LightCycler 480 instrument (Rochediagnostics, Meylan, France). Either 2.5 μl of cDNA (ataround 1 μg/μl), diluted at 1/5, or water (for negative con-trol reactions) were used in a total PCR reaction final vol-ume of 10 μl (reagents used from the LightCycler FastStartDNA Master SYBR green I kit by Roche). Amplificationconditions were as follows: 95°C for 5 min and then 45 cy-cles of 95°C for 15 s, 53°C for 15 s, and 72°C for 1 min10 s. An internal standard curve was generated for eachgene using serial dilutions (from 2000 to 0.0002 μg/μl) ofpurified PCR products amplified from a pool of cDNA.The PCR reaction, to prepare the control sample for thestandard curve, was carried out starting from 1 μl of re-verse transcription product using UptiTherm DNA Poly-merase (Interchim, Montluçon, France), according to thefollowing protocol: activation of Taq DNA polymerase at95°C for 5 min, followed by 34 three-step amplification cy-cles consisting of 30 s denaturation at 95°C, 45 s annealingat 53°C, and 45 s of extension at 72°C. For the datanormalization, two genes were tested in the different devel-opmental stage groups analysed here: actin (ACYPI000064)and rpl32 (ACYPI000074). Real-time RT-PCR data wereanalysed using the BestKeeper© software tool [76] and theactin gene was retained as the best candidate for datanormalization. An analysis of the quantitative RT-PCR datawas performed using the REST software ([54]; http://rest.gene-quantification.info/). The relative expression ratio ofeach target gene was calculated by comparing the testedcondition against the control condition, and also relative to

Rabatel et al. BMC Genomics 2013, 14:235 Page 14 of 17http://www.biomedcentral.com/1471-2164/14/235
the normalization gene. More precisely, this ratio (R) wascalculated taking into account the real-time PCR efficiencyof each gene (E) and the crossing point difference (ΔCP) ofa test condition (IE, LE or L1), as compared to the refer-ence condition (EE, IE or LE according to the comparison(EE-IE, IE-LE, LE-L1)), and expressed in comparison to thenormalization gene (actin) using the following model [77].
R ¼ Etarget� �ΔCPtarget control−sampleð Þ
Ereferenceð ÞΔCPreference control−sampleð Þ
Sample preparation for free amino acid analysisFor the quantification of free amino acids, we used 20embryos (Early or Intermediate groups), 15 embryos(Late group) or 15 L1 (0-6 h or 13-19 h) per replicateand the analyses were performed on at least four inde-pendent replicates. Samples were crushed in 320 μl ofultra-pure water with a known quantity of norvalineused as the internal standard. 200 μl of this crude ho-mogenate were used for free amino acid analyses. Freeamino acids were extracted from crude homogenate withtrichloroacetic acid (TCA, 5% w/v final concentration),maintained at room temperature for 2 h, vortexed every30 min, and then centrifuged (10,000 g for 10 min at 4°C).TCA was eliminated from the supernatant by chloroform/water partition (three successive extractions with 400 μl ofchloroform), and the final aqueous supernatant was driedunder vacuum. All samples were stored at -20°C, and thenmixed with 80 μl of HCl 0.1 N for amino acid analysis.
Amino acid analysis and quantificationAmino acid analysis was performed by HPLC (Agilent1100; Agilent Technologies, Massy, France) with a guardcartridge and a reverse phase C18 column (Zorbax Eclipse-AAA 3.5 μm, 150 × 4.6 mm, Agilent Technologies),according to the procedure specifically developed for thissystem [78]. Prior to injection, the sample was bufferedwith borate at pH 10.2, and primary or secondary aminoacids were derivatized with ortho-phthalaldehyde (OPA)or 9-fluorenylmethyl chloroformate (FMOC), respectively.The derivatization process, at room temperature, was auto-mated using the Agilent 1313A autosampler. Separationwas carried out at 40°C, with a flow rate of 2 ml/min, using40 mM NaH2PO4 (eluent A, pH 7.8, adjusted with NaOH)as the polar phase and an acetonitrile/methanol/water mix-ture (45/45/10, v/v/v) as the non-polar phase (eluent B).A gradient was applied during chromatography, startingwith 20% of B and increasing to 80% at the end. Detectionwas performed by a fluorescence detector set at 340 and450 nm of excitation and emission wavelengths, respec-tively (266/305 nm for proline). These conditions do notallow for the detection and quantification of cystine and
tryptophan, so only 18 amino acids were quantified. Forthis quantification, norvaline was used as the internalstandard and the response factor of each amino acid wasdetermined using a 250 pmol/μl standard mix of aminoacids. The software used was the ChemStation for LC 3DSystems (Agilent Technologies).The comparison of the relative concentrations of free
amino acids in the aphid at the various developmentalstages (expressed as % of total free amino acids) wasperformed, after angular transformation to normalizedata, using a one-way ANOVA followed by a two by twocomparison (Student-Newman-Keuls test).
Sequence analysesThe four protein sequences (ACYPI006213-PA, ACYPI003009-PA, ACYPI004243-PA and ACYPI000044-PA) forthe aspartate transaminase enzymatic activity (E.C. 2.6.1.1)were obtained from PhylomeDB [59], together with theircorresponding arthropod orthologs and paralogs. The dataset was completed with other homologous proteins, ex-tracted from the UniProt database [60], using a stringente-value (= 10-6) for the BlastP search. Amino acid se-quences were then aligned using the software MUSCLE[79] embedded in the phylogeny software SeaView 4.0[80]. A phylogenetic tree was drawn in order to removenon-homologous proteins and redundant sequences andto reduce the species number in some taxonomic groupsof the tree. The alignment was then recalculated andmanually corrected. Trees were calculated using Poissonand Kimura distances, with the BIONJ heuristic [81], andby applying maximum likelihood estimations. The tree wasrooted, by default, using the longest branch. The mito-chondrial target analysis was performed using MITOPROT,an analysis tool for the prediction of mitochondrial tar-geting sequences ([82]; http://ihg.gsf.de/ihg/mitoprot.html).
Additional files
Additional file 1: Table S1. List of genes differentially expressed in thethree comparisons. A summary of all significant genes identified in thisstudy, with their fold change differences, using a one-way betweengroups ANOVA for the three pair-wise comparisons: A) EE vs. IE, B) IE vs.LE, and C) LE vs. L1. D) Venn diagrams of gene lists of the two contrasts:panel (I) = list A vs. list B, panel (II) = list B vs. list C. E) List of genes withshared probes with other genes.
Additional file 2: Table S2, S8, S9, S10, S12. Table S2. Microarraydata validation by qRT-PCR. Table S8. Relative free amino acid contentsduring pea aphid development. Table S9. PRIAM analysis results summary.Table S10. MITOPROT analysis results summary. Table S12. Oligonucleotideprimers used for qRT-PCR.
Additional file 3: Table S3. List of developmental genes differentiallyexpressed in the three comparisons. A summary of all developmentalgenes showing significant differential expression for the three pair-wisecomparisons A) EE vs. IE, B) IE vs. LE and C) LE vs. L1. D) Developmentalgenes showing significant expression changes and belonging to specificfunctional classes (homeobox-containing genes and major components

Rabatel et al. BMC Genomics 2013, 14:235 Page 15 of 17http://www.biomedcentral.com/1471-2164/14/235
of signalling pathways): in red, increasing expression during developmentand, in blue, decreasing expression during development.
Additional file 4: Table S4. List of functional classes enriched insignificant variant genes for the three comparisons. Result of GOSSIP ([73];http://gossip.gene-groups.net) analysis performed using Blast2GO ([72]; http://www.blast2go.com/) on the gene showing significant differential expressionfor the three pair-wise comparisons A) EE vs. IE, B) IE vs. LE and C) LE vs. L1.
Additional file 5: Table S5. List of significant variant genes involved inmetabolism from AcypiCyc. Result of the metabolism analysis performedin the AcypiCyc database ([56]; http://acypicyc.cycadsys.org/) on the listof significant variant genes for the three pair-wise comparisons A) EE vs.IE, B) IE vs. LE and C) LE vs. L1.
Additional file 6: Table S6. List of significant variant genes involved in thebiosynthesis or the degradation of amino acids. Summary table of annotatedamino acids metabolism genes (modified from [29]) showing differential geneexpression in the three pair-wise comparisons EE vs. IE, IE vs. LE and LE vs. L1.
Additional file 7: Table S7. List of amino acid transporter genes andtheir gene expression data. A) Expressions of amino acid transportergenes (as annotated by Price et al. [57]) with, in bold, the genes showinga significant gene expression change during development. Data arepresented as log2 intensities for each replicate. B) Summary table oftransporter genes showing differential gene expression in the three pair-wise comparisons EE vs. IE, IE vs. LE and LE vs. L1.
Additional file 8: Figure S1. EC 2.6.1.1 enzymatic activity proteinsalignment. Alignment of the 4 proteins having the aspartate transaminaseenzymatic activity (EC 2.6.1.1) in the pea aphid, as performed using ClustalWmethod in MUSCLE [79], available online at the European BioinformaticsInstitute (http://www.ebi.ac.uk/Tools/msa/muscle/).
Additional file 9: Figure S2. Phylogenetic analysis of genes coding forthe proteins with EC 2.6.1.1 enzymatic activity. Red circles representduplication events and brown rectangles represent the correspondingparalogous families, named using consensual annotation. Accession numbersare those from the PhylomeDB (http://phylomedb.org/) or UniProtKB/Swiss-Prot (http://www.uniprot.org/), followed by species names (A. pisum paralogsare written in red). Bootstrap values over 50% are given at each node of thetree (1000 replicates). The tree (Poisson distance, BIONJ heuristic) was rootedby its longest branch (i.e., the bacterial branch). Scale 0.1 amino acidsubstitutions by position (257 informative sites). Although the three clades,named AATC2, AATC1 and AATC, are well supported by bootstrap values andalways conserved, their respective positioning is not clear, varying accordingto the tree-building methods used, as illustrated by the very short branchesseparating them. The number of coding exons for each gene (whenavailable) is given in square brackets after the AATM protein names.
Additional file 10: Table S11. Cuticle precursor and cuticular proteingenes. Expression levels of the mRNA (log2 intensities for each replicate)and fold-change differences (in log2) for mRNA showing differentialexpression in the three pair-wise comparisons EE vs. IE, IE vs. LE and LE vs.L1: in red, increasing expression during development and, in blue,decreasing expression during development. A) Genes coding for theenzymes involved in the synthesis of DOPA and dopamine starting fromtyrosine. B) Genes coding for cuticular proteins.
AbbreviationsEC: Enzyme commission (a numerical classification scheme for enzymes,based on the chemical reactions they catalyse); PCR: Polymerase chainreaction; HPLC: High-performance liquid chromatography.
Competing interestsThe authors declare that they have no competing interests.
Authors’ contributionsThe authors have made the following declarations concerning theircontributions. AR, GF, HC, FC and SC conceived and designed theexperiments. AR, KG, GD, NB and MR performed the experiments. AR, GF,PBP, HC, FC and SC analysed the data. PBP, PS and YR contributed reagents/materials/analysis tools. AR, GF, PBP, HC, FC and SC contributed to text,tables and figures in the paper. AR, FC and SC wrote the paper. All authorsread and approved the final manuscript.
AcknowledgementsFunding: This work was supported by the Agence National de la Recherche(ANR, France), the Biotechnology and Biological Sciences Research Council(BBSRC, UK) « MetNet4SysBio » project grant (2008-2010), and an INSA-LyonBQR program grant (2008-2009) to SC. AR was the recipient of a PhDfellowship from the French Ministry of Research (2008-2011). The authorswould like to thank Pierre Masselot, who worked on the data during hisstatistics training internship and contributed useful feedback. The authors aregrateful to Alain Clavel for plant production and to Valerie James for theEnglish language editing of the final manuscript.
Author details1Insa-Lyon, UMR203 BF2I, Biologie Fonctionnelle Insectes et Interactions,Villeurbanne F-69621, France. 2Inra, UMR203 BF2I, Biologie FonctionnelleInsectes et Interactions, Villeurbanne F-69621, France. 3Université de Lyon,Lyon F-69000, France. 4Inria Rhône-Alpes, Bamboo, Monbonnot Saint-MartinF-38330, France.
Received: 19 September 2012 Accepted: 14 March 2013Published: 10 April 2013
References1. Buchner P: Symbiosis in animals which suck plant juices. In Endosymbiosis
of Animals with Plant Microorganisms. Edited by Buchner P. New York:Interscience; 1965:210–432.
2. Douglas AE: The microbial dimension in insect nutritional ecology.Funct Ecol 2009, 23:38–47.
3. Baumann P, Moran NA, Baumann L, Dworkin M: Bacteriocyte-associatedendosymbionts of insects. In The Prokaryotes. Edited by Dworkin M.New York: Springer; 2000:1–55.
4. Baumann P: Biology of bacteriocyte-associated endosymbionts of plantsap-sucking Insects. Annu Rev Microbiol 2005, 59:155–189.
5. Ziegler H, Zimmermann DL, Milburn JA: Nature of Substances in Phloem:Nature of Transported Substances. In Transport in Plants I - PhloemTransport, Volume 1. Edited by Zimmermann DL, Milburn JA. Berlin:Springer-Verlag; 1975:59–100.
6. Liadouze I, Febvay G, Guillaud J, Bonnot G: Metabolic fate of energeticamino acids in the aposymbiotic pea aphid Acyrthosiphon pisum (Harris)(Homoptera: Aphididae). Symbiosis 1996, 21:115–127.
7. Douglas AE: Nutritional interactions in insect-microbial symbioses: aphidsand their symbiotic bacteria Buchnera. Annu Rev Entomol 1998, 43:17–37.
8. Febvay G, Rahbe Y, Rynkiewicz M, Guillaud J, Bonnot G: Fate of dietarysucrose and neosynthesis of amino acids in the pea aphid, Acyrthosiphonpisum, reared on different diets. J Exp Biol 1999, 202:2639–2652.
9. Moran NA, Baumann P: Bacterial endosymbionts in animals. Curr OpinMicrobiol 2000, 3:270–275.
10. Shigenobu S, Watanabe H, Hattori M, Sakaki Y, Ishikawa H: Genomesequence of the endocellular bacterial symbiont of aphids Buchnera sp.APS. Nature 2000, 407:81–86.
11. Le Trionnaire G, Hardie J, Jaubert-Possamai S, Simon J-C, Tagu D: Shiftingfrom clonal to sexual reproduction in aphids: physiological anddevelopmental aspects. Biol Cell 2008, 100:441–451.
12. Dixon AFG, Kundu R: Resource tracking in aphids: programmedreproductive strategies anticipate seasonal trends in habitat quality.Oecologia 1998, 114:73–78.
13. Miura T, Braendle C, Shingleton A, Sisk G, Kambhampati S, Stern DL: Acomparison of parthenogenetic and sexual embryogenesis of the peaaphid Acyrthosiphon pisum (Hemiptera: Aphidoidea). J Exp Zool B Mol DevEvol 2003, 295:59–81.
14. Koga R, Meng XY, Tsuchida T, Fukatsu T: Cellular mechanism for selectivevertical transmission of an obligate insect symbiont at thebacteriocyte-embryo interface. Proc Natl Acad Sci USA 2012, 109:E1230–1237.
15. Hinde R: The control of the mycetome symbiotes of the aphidBrevicoryne brassicae. Myzus persicae and Macrosiphum rosae. J InsectPhysiol 1971, 17:1791.
16. Blackman RL, Minks AK, Harrewijn P: Reproduction, cytogenetics anddevelopment. In Aphids: Their Biology, Natural Enemies and Control, Volume2A. Edited by Minks AK, Harrewijn P. Amsterdam: Elsevier; 1987:163–195.
17. Wilkinson TL, Fukatsu T, Ishikawa H: Transmission of symbiotic bacteriaBuchnera to parthenogenetic embryos in the aphid Acyrthosiphon pisum(Hemiptera: Aphidoidea). Arthropod Struct & Development 2003, 32:241–245.

Rabatel et al. BMC Genomics 2013, 14:235 Page 16 of 17http://www.biomedcentral.com/1471-2164/14/235
18. Jayaraj S, Ehrhardt P, Schmutterer H: The effect of certain antibiotics onreproduction of the black bean aphid, Aphis fabae scop. Ann Appl Biol1967, 59:13–21.
19. Mittler TE: Dietary amino acid requirements of the aphid Myzus persicaeaffected by antibiotic uptake. J Nutr 1971, 101:1023–1028.
20. Prosser WA, Douglas AE: The aposymbiotic aphid: An analysis ofchlortetracycline-treated pea aphid, Acyrthosiphon pisum. J Insect Physiol1991, 37:713–719.
21. Sasaki T, Hayashi H, Ishikawa H: Growth and reproduction of the symbioticand aposymbiotic pea aphids, Acyrthosiphon pisum maintained onartificial diets. J Insect Physiol 1991, 37:749–756.
22. Douglas AE: Requirement of pea aphids (Acyrthosiphon pisum) for theirsymbiotic bacteria. Entomol Exp Appl 1992, 65:195–198.
23. Consortium IAG: Genome sequence of the pea aphid Acyrthosiphonpisum. PLoS Biol 2010, 8(2):e1000313.
24. Tamas I, Klasson L, Canbäck B, Näslund AK, Eriksson A-S, Wernegreen JJ,Sandström JP, Moran NA, Andersson SGE: 50 million years of genomicstasis in endosymbiotic bacteria. Science 2002, 296:2376–2379.
25. van Ham RCHJ, Kamerbeek J, Palacios C, Rausell C, Abascal F, Bastolla U,Fernández JM, Jiménez L, Postigo M, Silva FJ, Tamames J, Viguera E, LatorreA, Valencia A, Morán F, Moya A: Reductive genome evolution in Buchneraaphidicola. Proc Natl Acad Sci USA 2003, 100:581–586.
26. Pérez-Brocal V, Gil R, Ramos S, Lamelas A, Postigo M, Michelena JM, Silva FJ,Moya A, Latorre A: A small microbial genome: the end of a longsymbiotic relationship? Science 2006, 314:312–313.
27. Lamelas A, Gosalbes MJ, Moya A, Latorre A: The genome of Buchneraaphidicola from the aphid Cinara tujafilina provides new clues about theevolutionary history of metabolic losses in bacterial endosymbionts. ApplEnviron Microbiol 2011, 13:4464–4454.
28. Moran NA, McLaughlin HJ, Sorek R: The dynamics and time scale ofongoing genomic erosion in symbiotic bacteria. Science 2009, 323:379–382.
29. Wilson ACC, Ashton PD, Calevro F, Charles H, Colella S, Febvay G, Jander G,Kushlan PF, Macdonald SJ, Schwartz JF, Thomas GH, Douglas AE: Genomicinsight into the amino acid relations of the pea aphid, Acyrthosiphonpisum, with its symbiotic bacterium Buchnera aphidicola. Insect Mol Biol2010, 19:249–258.
30. Shigenobu S, Wilson ACC: Genomic revelations of a mutualism: the pea aphidand its obligate bacterial symbiont. Cell Mol Life Sci 2011, 68:1297–1309.
31. Hansen AK, Moran NA: Aphid genome expression reveals host-symbiontcooperation in the production of amino acids. Proc Natl Acad Sci USA2011, 108:2849–2854.
32. Tagu D, Dugravot S, Outreman Y, Rispe C, Simon J-C, Colella S: Theanatomy of an aphid genome: from sequence to biology. C R Biol 2010,333:464–473.
33. Gerardo NM, Wilson ACC: The power of paired genomes. Mol Ecol 2011,20:2038–2040.
34. Gil R, Sabater-Munoz B, Latorre A, Silva FJ, Moya A: Extreme genomereduction in Buchnera spp.: toward the minimal genome needed forsymbiotic life. Proc Natl Acad Sci USA 2002, 99:4454–4458.
35. Brinza L, Viñuelas J, Cottret L, Calevro F, Rahbé Y, Febvay G, Duport G,Colella S, Rabatel A, Gautier C, Fayard J-M, Sagot M-F, Charles H: Systemicanalysis of the symbiotic function of Buchnera aphidicola, the primaryendosymbiont of the pea aphid Acyrthosiphon pisum. C R Biol 2009,332:1034–1049.
36. Moran NA, Dunbar HE, Wilcox JL: Regulation of transcription in a reducedbacterial genome: nutrient-provisioning genes of the obligate symbiontBuchnera aphidicola. J Bacteriol 2005, 187:4229–4237.
37. Reymond N, Calevro F, Viñuelas J, Morin N, Rahbé Y, Febvay G, Laugier C,Douglas A, Fayard J-M, Charles H: Different levels of transcriptionalregulation due to trophic constraints in the reduced genome ofBuchnera aphidicola APS. Appl Environ Microbiol 2006, 72:7760–7766.
38. Wilson ACC, Dunbar HE, Davis GK, Hunter WB, Stern DL, Moran NA: Adual-genome microarray for the pea aphid, Acyrthosiphon pisum, and itsobligate bacterial symbiont. Buchnera aphidicola. BMC Genomics 2006, 7:50.
39. Viñuelas J, Calevro F, Remond D, Bernillon J, Rahbé Y, Febvay G, Fayard J-M,Charles H: Conservation of the links between gene transcription andchromosomal organization in the highly reduced genome of Buchneraaphidicola. BMC Genomics 2007, 8:143.
40. Viñuelas J, Febvay G, Duport G, Colella S, Fayard J-M, Charles H, Rahbé Y,Calevro F: Multimodal dynamic response of the Buchnera aphidicola pLeu
plasmid to variations in leucine demand of its host, the pea aphidAcyrthosiphon pisum. Mol Microbiol 2011, 81:1271–1285.
41. Nakabachi A, Shigenobu S, Sakazume N, Shiraki T, Hayashizaki Y, Carninci P,Ishikawa H, Kudo T, Fukatsu T: Transcriptome analysis of the aphidbacteriocyte, the symbiotic host cell that harbors an endocellularmutualistic bacterium, Buchnera. Proc Natl Acad Sci USA 2005, 102:5477–5482.
42. Brisson JA, Davis GK, Stern DL: Common genome-wide patterns oftranscript accumulation underlying the wing polyphenism andpolymorphism in the pea aphid (Acyrthosiphon pisum). Evol Dev 2007,9:338–346.
43. Le Trionnaire G, Jaubert S, Sabater-Muñoz B, Benedetto A, Bonhomme J,Prunier-Leterme N, Martinez-Torres D, Simon J-C, Tagu D: Seasonalphotoperiodism regulates the expression of cuticular and signalling proteingenes in the pea aphid. Insect Biochem Mol Biol 2007, 37:1094–1102.
44. Le Trionnaire G, Francis F, Jaubert-Possamai S, Bonhomme J, De Pauw E,Gauthier J, Haubruge E, Legeai F, Prunier-Leterme N, Simon J, Tanguy S,Tagu D: Transcriptomic and proteomic analyses of seasonalphotoperiodism in the pea aphid. BMC Genomics 2009, 10:456.
45. Brault V, Tanguy S, Reinbold C, Le Trionnaire G, Arneodo J, Jaubert-PossamaiS, Guernec G, Tagu D: Transcriptomic analysis of intestinal genesfollowing acquisition of pea enation mosaic virus by the pea aphidAcyrthosiphon pisum. J Gen Virol 2010, 91:802–808.
46. Hunt BG, Brisson JA, Yi SV, Goodisman MAD: Functional conservation ofDNA methylation in the pea aphid and the honeybee. Genome Biol Evol2010, 2:719–728.
47. Gallot A, Shigenobu S, Hashiyama T, Jaubert-Possamai S, Tagu D: Sexualand asexual oogenesis require the expression of unique and shared setsof genes in the insect Acyrthosiphon pisum. BMC Genomics 2012, 13:76.
48. Bermingham J, Wilkinson T: Embryo nutrition in parthenogeneticviviparous aphids. Physiological Entomol 2009, 34:103–109.
49. Douglas A: Reproductive failure and the free amino acid pools in peaaphids (Acyrthosiphon pisum) lacking symbiotic bacteria. J Insect Physiol1996, 42:247–255.
50. Wilkinson T, Ishikawa H: The assimilation and allocation of nutrients bysymbiotic and aposymbiotic pea aphids, Acyrthosiphon pisum. EntomolExp Appl 1999, 91:195–201.
51. Wilkinson T, Ishikawa H: Injection of essential amino acids substitutes forbacterial supply in aposymbiotic pea aphids (Acyrthosiphon pisum).Entomol Exp Appl 2000, 94:85–91.
52. Bermingham J, Wilkinson TL: The role of intracellular symbiotic bacteria inthe amino acid nutrition of embryos from the black bean aphid.Aphis fabae. Entomologia Experimentalis et Applicata 2010, 134(3):272–279.
53. Bermingham J, Rabatel A, Calevro F, Vinuelas J, Febvay G, Charles H,Douglas A, Wilkinson T: Impact of host developmental age on thetranscriptome of the symbiotic bacterium Buchnera aphidicola in the peaaphid Acyrthosiphon pisum. Appl Environ Microbiol 2009, 22:7294–7297.
54. Pfaffl M, Horgan G, Dempfle L: Relative expression software tool (REST) forgroup-wise comparison and statistical analysis of relative expressionresults in real-time PCR. Nucleic Acids Res 2002, 30:e36.
55. Shigenobu S, Bickel RD, Brisson JA, Butts T, Chang C-C, Christiaens O, DavisGK, Duncan EJ, Ferrier DEK, Iga M, Janssen R, Lin G-W, Lu H-L, McGregor AP,Miura T, Smagghe G, Smith JM, van der Zee M, Velarde RA, Wilson MJ,Dearden PK, Stern DL: Comprehensive survey of developmental genes inthe pea aphid, Acyrthosiphon pisum: frequent lineage-specificduplications and losses of developmental genes. Insect Mol Biol 2010,19:47–62.
56. Vellozo AF, Véron AS, Baa-Puyoulet P, Huerta-Cepas J, Cottret L, Febvay G,Calevro F, Rahbé Y, Douglas AE, Gabaldón T, Sagot M-F, Charles H, Colella S:CycADS: an annotation database system to ease the development andupdate of BioCyc. Database 2011:bar008.
57. Price DRG, Duncan RP, Shigenobu S, Wilson ACC: Genome expansion anddifferential expression of amino acid transporters at the aphid/Buchnerasymbiotic interface. Molecular biology and evolution 2011.
58. Claudel-Renard C, Chevalet C, Faraut T, Kahn D: Enzyme-specific profilesfor genome annotation: PRIAM. Nucleic Acids Res 2003, 31:6633–6639.
59. Huerta-Cepas J, Capella-Gutierrez S, Pryszcz LP, Denisov I, Kormes D,Marcet-Houben M, Gabaldón T: PhylomeDB v3.0: an expandingrepository of genome-wide collections of trees, alignments andphylogeny-based orthology and paralogy predictions. Nucleic AcidsRes 2010, 36:D491–496.

Rabatel et al. BMC Genomics 2013, 14:235 Page 17 of 17http://www.biomedcentral.com/1471-2164/14/235
60. Bairoch A, Apweiler R, Wu CH, Barker WC, Boeckmann B, Ferro S, GasteigerE, Huang H, Lopez R, Magrane M, et al: The Universal Protein Resource(UniProt). Nucleic Acids Res 2005, 33:D154–159.
61. Colombani J, Raisin S, Pantalacci S, Radimerski T, Montagne J, Léopold P: Anutrient sensor mechanism controls Drosophila growth. Cell 2003, 114:739–749.
62. Attardo GM, Hansen IA, Shiao S-H, Raikhel AS: Identification of two cationicamino acid transporters required for nutritional signaling duringmosquito reproduction. J Exp Biol 2006, 209:3071–3078.
63. Duncan RP, Nathanson L, Wilson AC: Novel male-biased expression inparalogs of the aphid slimfast nutrient amino acid transporterexpansion. BMC Evol Biol 2011, 11:253.
64. Bernays EA, Klein BA: Quantifying the symbiont contribution to essentialamino acids in aphids: the importance of tryptophan for Uroleuconambrosiae. Physiol Entomol 2002, 27:275–284.
65. Hiruma K, Riddiford LM: The molecular mechanisms of cuticularmelanization: the ecdysone cascade leading to dopa decarboxylaseexpression in Manduca sexta. Insect Biochem Mol Biol 2009, 39:245–253.
66. Andersen SO: Insect cuticular sclerotization: a review. Insect Biochem MolBiol 2010, 40:166–178.
67. Schneider J, Buness A, Huber W, Volz J, Kioschis P, Hafner M, Poustka A,Sultmann H: Systematic analysis of T7 RNA polymerase based in vitrolinear RNA amplification for use in microarray experiments.BMC Genomics 2004, 5:29.
68. Irizarry RA, Hobbs B, Collin F, Beazer-Barclay YD, Antonellis KJ, Scherf U,Speed TP: Exploration, normalization, and summaries of high densityoligonucleotide array probe level data. Biostatistics 2003, 4:249–264.
69. Smyth G: Linear models and empirical bayes methods for assessingdifferential expression in microarray experiments. Stat Appl Genet Mol Biol2004, 3:Article3.
70. Dudoit S, Shaffer J, Boldrick C: Multiple hypothesis testing in microarrayexperiments. Stat Sci 2003, 18:71–103.
71. Saeed A, Sharov V, White J, Li J, Liang W, Bhagabati N, Braisted J, Klapa M,Currier T, Thiagarajan M, Sturn A, Snuffin M, Rezantsev A, Popov D, RyltsovA, Kostukovich E, Borisovsky I, Liu Z, Vinsavich A, Trush V, Quackenbush J:TM4: a free, open-source system for microarray data management andanalysis. Biotechniques 2003, 34:374–378.
72. Conesa A, Götz S, García-Gómez JM, Terol J, Talón M, Robles M: Blast2GO: auniversal tool for annotation, visualization and analysis in functionalgenomics research. Bioinformatics 2005, 21:3674–3676.
73. Blüthgen N, Brand K, Cajavec B, Swat M, Herzel H, Beule D: Biologicalprofiling of gene groups utilizing Gene Ontology. Genome Inform 2005,16:106–115.
74. Rychlik W: OLIGO 7 primer analysis software. Methods Mol Biol 2007,402:35–60.
75. Brisson JA, Ishikawa A, Miura T: Wing development genes of the peaaphid and differential gene expression between winged and unwingedmorphs. Insect Mol Biol 2010, 19:63–73.
76. Pfaffl M, Tichopad A, Prgomet C, Neuvians T: Determination of stablehousekeeping genes, differentially regulated target genes and sampleintegrity: BestKeeper–Excel-based tool using pair-wise correlations.Biotechnol Lett 2004, 26:509–515.
77. Pfaffl M: A new mathematical model for relative quantification inreal-time RT-PCR. Nucleic Acids Res 2001, 29:e45.
78. Henderson J, Ricker R, Bidlingmeyer B, Woodward C: Rapid, accurate,sensitive, and reproducible HPLC analysis of aminoacids. Amino acidanalysis using Zorbax Eclipse-AAA columns and the Agilent 1100 HPLC.Agilent Technologies Inc, Publication Number 5980-1193E 2000:1–10. http://www.chem.agilent.com/Library/chromatograms/59801193.pdf.
79. Edgar RC: MUSCLE: multiple sequence alignment with high accuracy andhigh throughput. Nucleic Acids Res 2004, 32:1792–1797.
80. Gouy M, Guindon S, Gascuel O: SeaView version 4: A multiplatformgraphical user interface for sequence alignment and phylogenetic treebuilding. Mol Biol Evol 2010, 27:221–224.
81. Gascuel O: BIONJ: an improved version of the NJ algorithm based on asimple model of sequence data. Mol Biol Evol 1997, 14:685–695.
82. Claros MG, Vincens P: Computational method to predict mitochondriallyimported proteins and their targeting sequences. Eur J Biochem 1996,241:779–786.
doi:10.1186/1471-2164-14-235Cite this article as: Rabatel et al.: Tyrosine pathway regulation ishost-mediated in the pea aphid symbiosis during late embryonicand early larval development. BMC Genomics 2013 14:235.
Submit your next manuscript to BioMed Centraland take full advantage of:
• Convenient online submission
• Thorough peer review
• No space constraints or color figure charges
• Immediate publication on acceptance
• Inclusion in PubMed, CAS, Scopus and Google Scholar
• Research which is freely available for redistribution
Submit your manuscript at www.biomedcentral.com/submit