TUIs vs. GUIs: comparing the learning potential with preschoolers
21
1 TUIs vs. GUIs: comparing the learning potential with preschoolers Cristina Sylla 1 , Pedro Branco 1,2 , Clara Coutinho 3 , Eduarda Coquet 3 engageLab 1 , Dep. of Information Systems 1,2 , Institute of Education 3 , University of Minho [email protected] , [email protected] , [email protected] , [email protected] Abstract: In an effort to better understand the learning potential of a tangible interface we conducted a comparison study between a tangible and a traditional graphical user interface for teaching preschoolers 1 about good oral hygiene. The study was carried with two groups of children aged four to five years. Questionnaires to parents, children’s drawings and interviews were used for data collection and analysis, and revealed important indicators about children’s change of attitude, involvement and preferences for the interfaces. The questionnaires showed a remarkable change of attitude towards tooth brushing in the children that interacted with the tangible interface; particularly children’s motivation increased significantly. Children’s drawings were used to assess their degree of involvement with the interfaces. The drawings from the children that interacted with the tangible interface were very complete and detailed suggesting that the children felt actively involved with the experience. The results suggest that the tangible interface was capable of promoting a stronger and long-lasting involvement having a greater potential to engage children, therefore potentially promoting learning. Evaluation through drawing seems to be a promising method to work with pre-literate children; however it is advisable to use it together with other methods. Keywords: Tangible Interfaces, Interaction Design, Children and Technology, Oral Hygiene, Learning, Education. 1 In Portugal, children enter preschool at the age of three and they attend it till entering school, normally at the age of six.
-
Upload
independent -
Category
Documents
-
view
0 -
download
0
Transcript of TUIs vs. GUIs: comparing the learning potential with preschoolers
1
TUIs vs. GUIs: comparing the learning
potential with preschoolers
Cristina Sylla1, Pedro Branco
1,2, Clara Coutinho
3, Eduarda Coquet
3
engageLab1, Dep. of Information Systems
1,2, Institute of Education
3,
University of Minho
[email protected], [email protected], [email protected], [email protected]
Abstract: In an effort to better understand the learning potential of a tangible
interface we conducted a comparison study between a tangible and a traditional
graphical user interface for teaching preschoolers1 about good oral hygiene. The
study was carried with two groups of children aged four to five years.
Questionnaires to parents, children’s drawings and interviews were used for data
collection and analysis, and revealed important indicators about children’s change
of attitude, involvement and preferences for the interfaces. The questionnaires
showed a remarkable change of attitude towards tooth brushing in the children
that interacted with the tangible interface; particularly children’s motivation
increased significantly. Children’s drawings were used to assess their degree of
involvement with the interfaces. The drawings from the children that interacted
with the tangible interface were very complete and detailed suggesting that the
children felt actively involved with the experience.
The results suggest that the tangible interface was capable of promoting a stronger
and long-lasting involvement having a greater potential to engage children,
therefore potentially promoting learning. Evaluation through drawing seems to be
a promising method to work with pre-literate children; however it is advisable to
use it together with other methods.
Keywords: Tangible Interfaces, Interaction Design, Children and Technology,
Oral Hygiene, Learning, Education.
1 In Portugal, children enter preschool at the age of three and they attend it till entering school,
normally at the age of six.
2
Introduction
Tangible interfaces allow users to interact with digital information through
physical objects, in contrast with traditional graphical user interfaces* where the
interaction is done through the keyboard, mouse and display. Tangible interfaces
are less machine-centered, more user and task-centered, offering new
opportunities for different types of public to interact with digital content. In the
field of education, tangible interfaces open a new opportunity for making abstract
contents graspable and perhaps more understandable to children [1]. A multitude
of technological developments, such as projection systems, cameras and
processing power at increasing lower prices will enable in a near future the
integration of tangible interfaces in the process of education.
Following this trend, numerous examples of tangible interfaces have been
developed in recent years targeting the educational domain, however their impact
on learning when compared to educational software employing traditional GUIs is
still not clear [2]. Most evaluation studies of the benefits of TUIs are rather
informal [2] and more empirical studies are needed [3]. This study aims to better
understand the learning potential of a TUI versus a traditional GUI. We have
compared children’s attitude, involvement and preferences relatively to both
interfaces, assuming that these are key elements in the process of learning, and
may positively influence children’s willingness to learn. Both interfaces address
the topic of the oral hygiene.
The research was conducted with two groups of four to five years old children, an
age group that poses some evaluation challenges given their limited ability of
verbal or written expression, making the majority of assessment methods more
appropriate to be used with older children. In order to outwit these difficulties and
to get reliable data as possible three evaluation methodologies were used to assess
children’s involvement and preferences with the interfaces: questionnaires - the
parents were asked to fulfill a questionnaire about their children’s attitude toward
tooth brushing before and after the interaction; interviews - the children were
asked about their preferences, and drawings - the children draw their experience
after interacting with the interfaces.
* Traditional graphical user interfaces is used to distinguish from other graphical interfaces that
still rely on a display but incorporate novel interactions such as voice, gestures, and so on.
3
Drawings have an historical tradition as a method of evaluating cognitive
development; recently they have been used to evaluate children’s approach to
technology [4,5,6,7]. In the process of comparing a TUI versus a GUI this study
investigated the reliability and the potential of drawings as an evaluation
methodology and whether it is a reliable tool to work with preschoolers.
Physical educational interfaces
The importance of using physical objects for the development of the child has
been extensively studied. Piaget [8] and the constructivism showed that learning is
a dynamic process whereby children actively construct knowledge from their
interaction and experiences with the word, people and things. Papert and the
constructionism added the idea that children need concrete materials to interact
with in order to construct knowledge, thus the vital importance of the learning
tools [9]. Interacting with the right materials originates a creative thinking spiral:
children imagine what they want to do, create a project based on their ideas, play
with their creations, share their ideas and creations with others, and reflect on
their experiences [10].
This pedagogical approach goes back to Friedrich Froebel who developed a
collection of gifts, 20 physical objects, such as balls, strings, sticks and blocks.
The gifts represented forms that can be found in nature and in daily life and were
used to help teaching arithmetic, geometry and reading [11]. Building on
Froebel’s gifts Maria Montessori developed materials for older children,
developing a pedagogical teaching method named Montessori Method [12]. The
method, where manipulatives play a central role, has inspired a network of
schools spread over the world.
Inspired by Froebel and Montessori, Zuckerman et al. [1] propose the following
classification for manipulatives: “Froebel-inspired Manipulatives” (FiMs),
manipulatives that enable modeling of objects and structures of the real world;
and “Montessori-inspired Manipulatives” (MiMs) manipulatives that enable
modeling of abstract concepts such as the representation of numerical proportions,
and relationships between quantities.
In the past two decades there has been a growing interest in developing digital
manipulatives [13] - also known as TUIs - to promote learning. Groups like the

4
Lifelong Kindergarten at MIT Media Laboratory or the MIT Tangible Media
Group, among others, have developed a series of TUIs that allow children to
explore, to simulate and to create knowledge through direct manipulation. These
digital manipulatives go back to the notion of Froebel´s gifts taking advantage of
the technology, allowing for richer experiences to be developed.
The challenges of evaluating technology for and
with preschoolers
In the last 12 years, in parallel with the development of new interfaces for
children, there has been a growing interest on the evaluation of interactive
technology for children. Special emphasis is given to the work of Hanna, Risden
and Alexander [14]. Despite the growing interest in this field most evaluation
studies of the benefits of tangible interfaces are rather informal [2] and there are
very few empirical studies comparing tangible and graphical interfaces. One of
these studies was carried by Fails et al. [15] with children aged four to six years
old comparing a tangible and a graphical version of a Hazard Room Game to
teach children about environmental health dangers. The results of the study
suggest that the physicality of the tangible interface has advantages over the
graphical interface in terms of learning outcomes.
One of the greatest difficulties in evaluating technology for/with young children
relies on the fact that most usability methods that are commonly used with
children - think aloud [16], talk aloud [17], peer tutoring [18], the fun toolkit [19] -
are more appropriate to be used with older children since younger children may
have difficulties in expressing themselves clearly through words. Additionally as
logical reasoning and abstract thinking are not yet fully developed children might
have difficulties doing multiple tasks and abstract task formulations [20]. Some
methods that can be used with younger children, where they can express their
opinions without using words, are the funometer [19], the sticky-ladder rating
scale [21], or the this-or-that method [22].
Drawing intervention
More recently, drawing intervention has been used as an evaluation method to rate
children’s approach to technology, particularly to measure the amount of fun that
children experience by interacting with different interfaces [4,5,6].
5
At about four years of age and until around seven children enter the Preschematic
Stage; a period that marks the beginning of graphic communication [23], children
make the first attempts to represent their environment, consciously creating forms
that have a relationship to the world around them. At this stage children are not
interested in realistic representations, since it would interfere with their
conception of the structure and characteristics of the objects [24:97]. They do not
see the same details as an adult; they see them only to the extent that they interest
them [23]. What does not matter for them is as if it would not exist; thus what
children draw had a preponderant weight in their mind.
Drawings allow children to represent their feelings, thoughts and preferences, and
may give important additional knowledge about children’s approach to
technology. In this work we employ drawing intervention as a method to capture
what caught children’s attention and their level of involvement with each
interface.
Comparing TUIs vs. GUIs
At the age of three, children begin to acquire the habit of brushing their teeth and
it is part of the Portuguese kindergarten’s educational program to promote this
practice. We chose this topic as the curricular subject to address and compared the
learning potential of a tangible versus a traditional graphical user interface. Our
research question was: how does the interaction with two different interfaces – a
TUI and a GUI - reflects on children’s attitude towards oral hygiene?
To answer this question we developed two similar interfaces differentiated by one
being a TUI and the other a traditional GUI.
Two interfaces for teaching oral hygiene
The GUI consists of a tooth with germs moving on its surface that children can
clean by moving the mouse - simulating a toothbrush - over the germs (fig. 1).
6
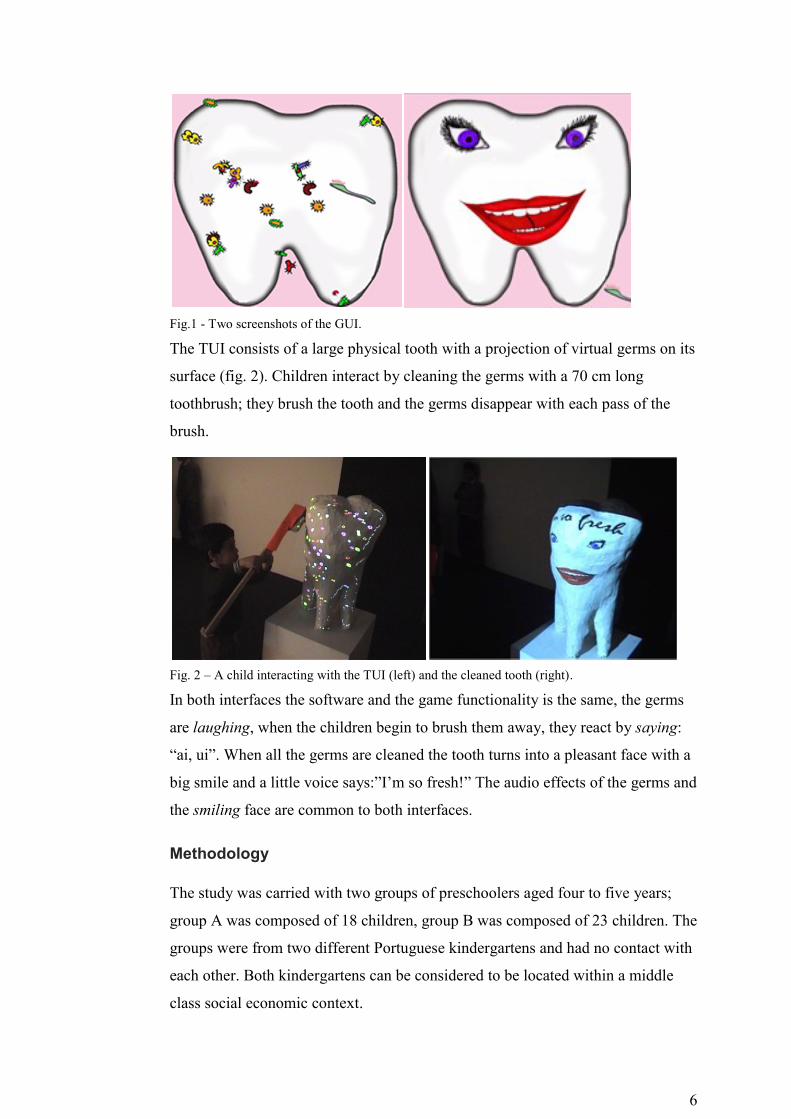
Fig.1 - Two screenshots of the GUI.
The TUI consists of a large physical tooth with a projection of virtual germs on its
surface (fig. 2). Children interact by cleaning the germs with a 70 cm long
toothbrush; they brush the tooth and the germs disappear with each pass of the
brush.
Fig. 2 – A child interacting with the TUI (left) and the cleaned tooth (right).
In both interfaces the software and the game functionality is the same, the germs
are laughing, when the children begin to brush them away, they react by saying:
“ai, ui”. When all the germs are cleaned the tooth turns into a pleasant face with a
big smile and a little voice says:”I’m so fresh!” The audio effects of the germs and
the smiling face are common to both interfaces.
Methodology
The study was carried with two groups of preschoolers aged four to five years;
group A was composed of 18 children, group B was composed of 23 children. The
groups were from two different Portuguese kindergartens and had no contact with
each other. Both kindergartens can be considered to be located within a middle
class social economic context.
7
Three different methodologies were used to access how the interaction with the
interfaces reflected in children’s attitude relatively to the topic addressed. First,
children’s attitude toward tooth brushing was assessed before and after being
exposed to the interfaces by asking their parents to answer a questionnaire.
Drawings were used after children’s interaction to assess their degree of
involvement with the interfaces. Finally, the children were interviewed about their
preferences and expressed their likes and dislikes about the interfaces.
The drawing evaluation was divided in two assessment phases: first group A
interacted with the TUI and group B interacted with the traditional GUI; five
months later there was a second interaction whereby the interfaces were changed,
group A interacted now with the traditional GUI, while group B interacted with
the TUI. After both tests the children were asked to draw their experience.
Collecting children’s attitudes towards oral hygiene
Before testing the interfaces the parents were asked to answer a questionnaire
about their children’s resistance to tooth brushing (table1). With those
questionnaires the researchers intended to ensure that both groups of children had
similar motivation for the oral hygiene and also to collect a baseline to assess
changes in children’s behavior.
The questionnaires were distributed by the kindergarten teachers in children’s
backpacks following the usual procedure for communication with parents. The
parents were informed that it was a long term study, and that the evaluation was
not about how good they teach their children about oral hygiene, but rather to
know their children’s attitudes towards it. The questionnaire was a Likert type
scale composed of four questions with punctuation from one to five, one being the
minimum and five the maximum score.
Table 1- Questions given to the parents.
a Motivation of their children for tooth brushing
b Children’s opposition to tooth brushing
c Children’s notion of the importance of tooth brushing
d Children’s knowledge of the consequences of a bad oral hygiene
In addition parents were asked to state the arguments that their children gave in
case they did not like to brush the teeth. 16 parents from group A and 17 parents
from group B returned the fulfilled questionnaire (table 2).
8
The comparison of the two groups showed that they were quite similar; in both
groups the children were motivated for tooth brushing, and knew its importance.
The Non-parametric Mann-Whitney U test, revealed that there were no statistical
significant differences between the two groups for the level of probability p <0.5,
which means that the groups were similar, necessary condition to infer the
differences later assigned to the experimental treatment [25].
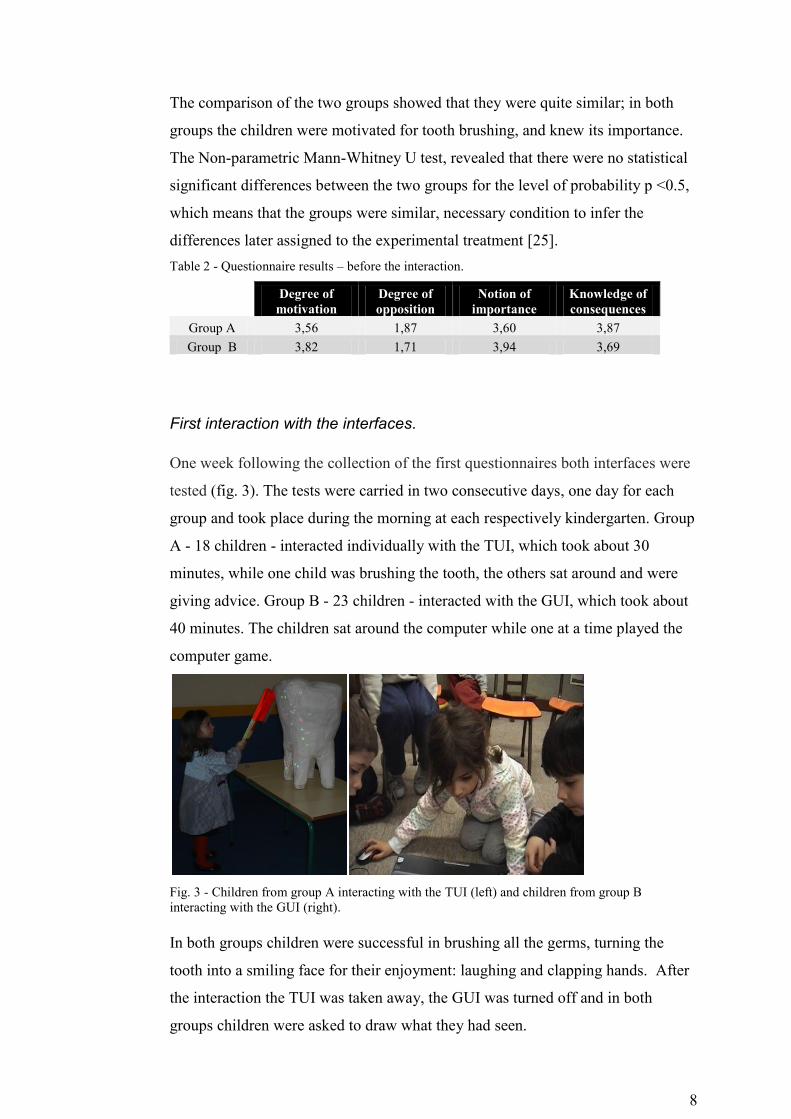
Table 2 - Questionnaire results – before the interaction.
Degree of
motivation Degree of
opposition Notion of
importance Knowledge of
consequences
Group A 3,56 1,87 3,60 3,87
Group B 3,82 1,71 3,94 3,69
First interaction with the interfaces.
One week following the collection of the first questionnaires both interfaces were
tested (fig. 3). The tests were carried in two consecutive days, one day for each
group and took place during the morning at each respectively kindergarten. Group
A - 18 children - interacted individually with the TUI, which took about 30
minutes, while one child was brushing the tooth, the others sat around and were
giving advice. Group B - 23 children - interacted with the GUI, which took about
40 minutes. The children sat around the computer while one at a time played the
computer game.
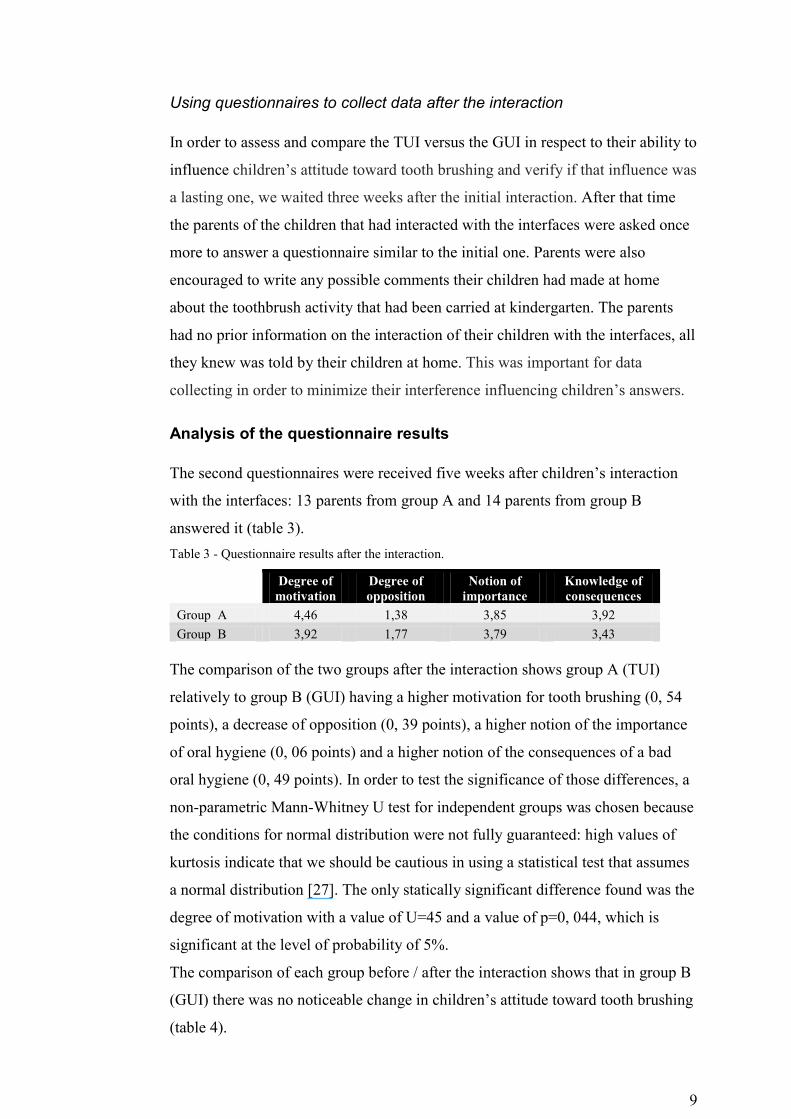
Fig. 3 - Children from group A interacting with the TUI (left) and children from group B
interacting with the GUI (right).
In both groups children were successful in brushing all the germs, turning the
tooth into a smiling face for their enjoyment: laughing and clapping hands. After
the interaction the TUI was taken away, the GUI was turned off and in both
groups children were asked to draw what they had seen.
9
Using questionnaires to collect data after the interaction
In order to assess and compare the TUI versus the GUI in respect to their ability to
influence children’s attitude toward tooth brushing and verify if that influence was
a lasting one, we waited three weeks after the initial interaction. After that time
the parents of the children that had interacted with the interfaces were asked once
more to answer a questionnaire similar to the initial one. Parents were also
encouraged to write any possible comments their children had made at home
about the toothbrush activity that had been carried at kindergarten. The parents
had no prior information on the interaction of their children with the interfaces, all
they knew was told by their children at home. This was important for data
collecting in order to minimize their interference influencing children’s answers.
Analysis of the questionnaire results
The second questionnaires were received five weeks after children’s interaction
with the interfaces: 13 parents from group A and 14 parents from group B
answered it (table 3).
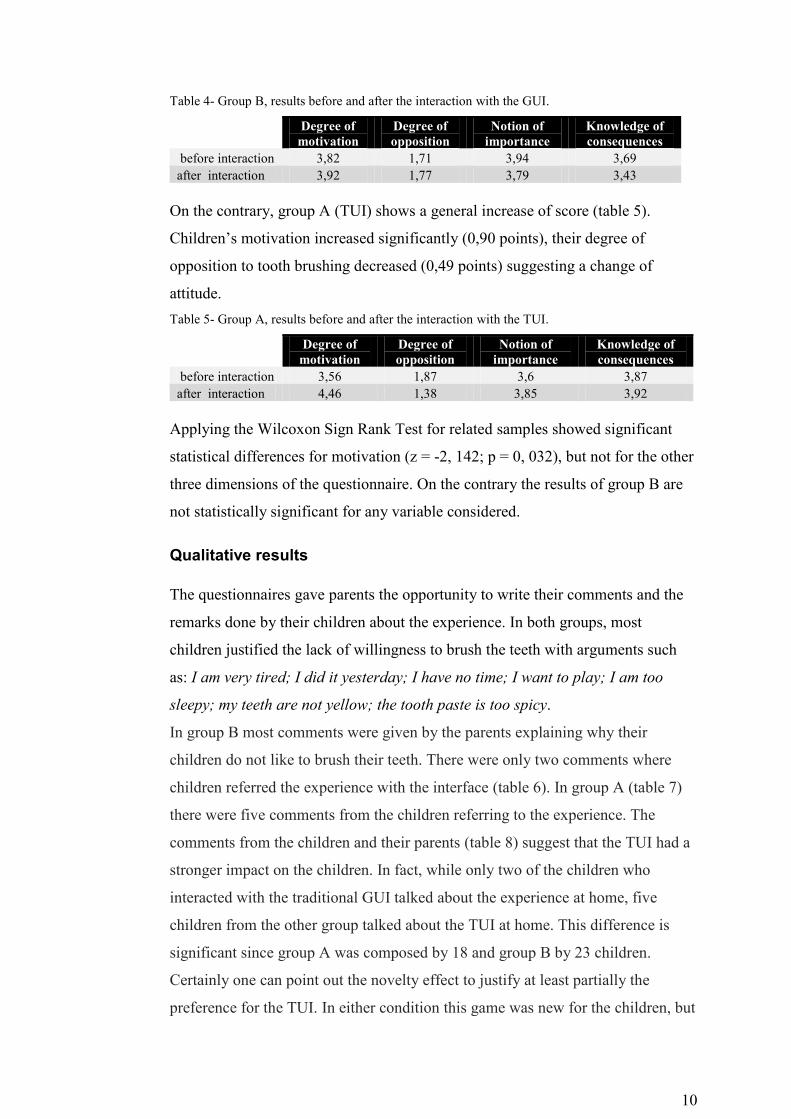
Table 3 - Questionnaire results after the interaction.
Degree of
motivation Degree of
opposition Notion of
importance Knowledge of
consequences
Group A 4,46 1,38 3,85 3,92
Group B 3,92 1,77 3,79 3,43
The comparison of the two groups after the interaction shows group A (TUI)
relatively to group B (GUI) having a higher motivation for tooth brushing (0, 54
points), a decrease of opposition (0, 39 points), a higher notion of the importance
of oral hygiene (0, 06 points) and a higher notion of the consequences of a bad
oral hygiene (0, 49 points). In order to test the significance of those differences, a
non-parametric Mann-Whitney U test for independent groups was chosen because
the conditions for normal distribution were not fully guaranteed: high values of
kurtosis indicate that we should be cautious in using a statistical test that assumes
a normal distribution [27]. The only statically significant difference found was the
degree of motivation with a value of U=45 and a value of p=0, 044, which is
significant at the level of probability of 5%.
The comparison of each group before / after the interaction shows that in group B
(GUI) there was no noticeable change in children’s attitude toward tooth brushing
(table 4).
10
Table 4- Group B, results before and after the interaction with the GUI.
Degree of
motivation
Degree of
opposition
Notion of
importance
Knowledge of
consequences
before interaction 3,82 1,71 3,94 3,69
after interaction 3,92 1,77 3,79 3,43
On the contrary, group A (TUI) shows a general increase of score (table 5).
Children’s motivation increased significantly (0,90 points), their degree of
opposition to tooth brushing decreased (0,49 points) suggesting a change of
attitude.
Table 5- Group A, results before and after the interaction with the TUI.
Degree of
motivation
Degree of
opposition
Notion of
importance
Knowledge of
consequences
before interaction 3,56 1,87 3,6 3,87
after interaction 4,46 1,38 3,85 3,92
Applying the Wilcoxon Sign Rank Test for related samples showed significant
statistical differences for motivation (z = -2, 142; p = 0, 032), but not for the other
three dimensions of the questionnaire. On the contrary the results of group B are
not statistically significant for any variable considered.
Qualitative results
The questionnaires gave parents the opportunity to write their comments and the
remarks done by their children about the experience. In both groups, most
children justified the lack of willingness to brush the teeth with arguments such
as: I am very tired; I did it yesterday; I have no time; I want to play; I am too
sleepy; my teeth are not yellow; the tooth paste is too spicy.
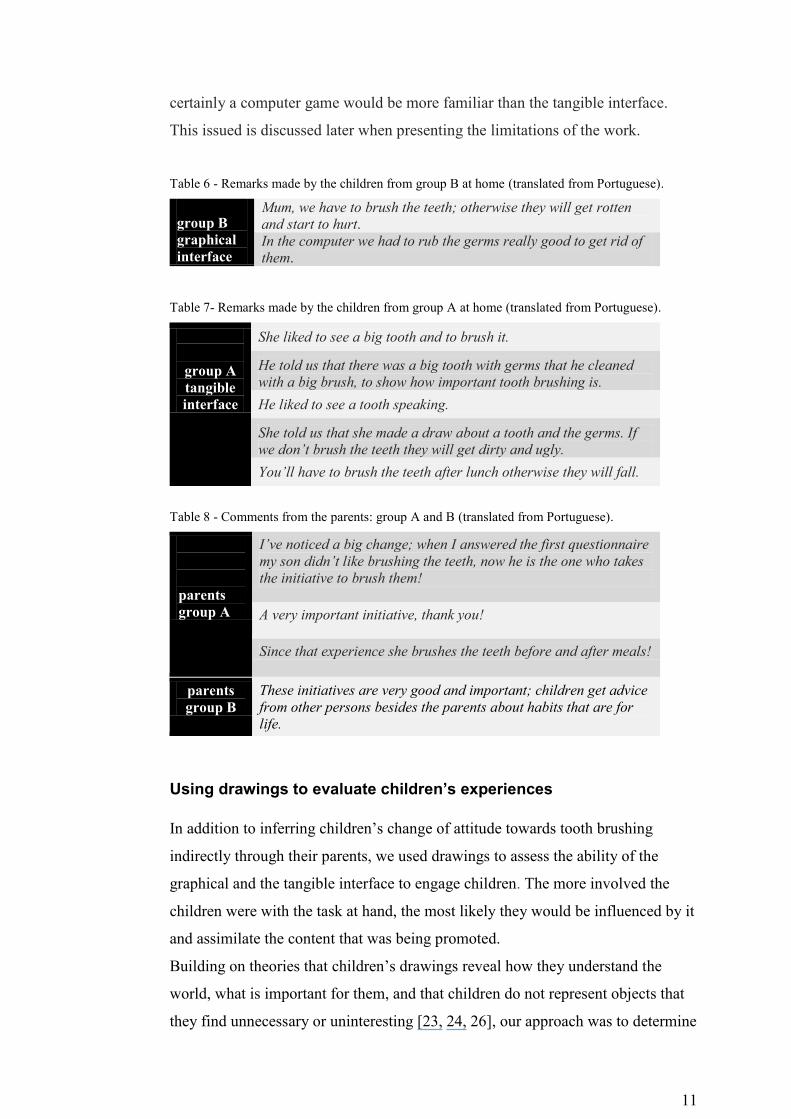
In group B most comments were given by the parents explaining why their
children do not like to brush their teeth. There were only two comments where
children referred the experience with the interface (table 6). In group A (table 7)
there were five comments from the children referring to the experience. The
comments from the children and their parents (table 8) suggest that the TUI had a
stronger impact on the children. In fact, while only two of the children who
interacted with the traditional GUI talked about the experience at home, five
children from the other group talked about the TUI at home. This difference is
significant since group A was composed by 18 and group B by 23 children.
Certainly one can point out the novelty effect to justify at least partially the
preference for the TUI. In either condition this game was new for the children, but
11
certainly a computer game would be more familiar than the tangible interface.
This issued is discussed later when presenting the limitations of the work.
Table 6 - Remarks made by the children from group B at home (translated from Portuguese).
group B graphical interface
Mum, we have to brush the teeth; otherwise they will get rotten
and start to hurt. In the computer we had to rub the germs really good to get rid of
them.
Table 7- Remarks made by the children from group A at home (translated from Portuguese).
group A
tangible interface
She liked to see a big tooth and to brush it.
He told us that there was a big tooth with germs that he cleaned
with a big brush, to show how important tooth brushing is.
He liked to see a tooth speaking.
She told us that she made a draw about a tooth and the germs. If
we don’t brush the teeth they will get dirty and ugly.
You’ll have to brush the teeth after lunch otherwise they will fall.
Table 8 - Comments from the parents: group A and B (translated from Portuguese).
parents
group A
I’ve noticed a big change; when I answered the first questionnaire
my son didn’t like brushing the teeth, now he is the one who takes
the initiative to brush them!
A very important initiative, thank you!
Since that experience she brushes the teeth before and after meals!
parents
group B
These initiatives are very good and important; children get advice
from other persons besides the parents about habits that are for
life.
Using drawings to evaluate children’s experiences
In addition to inferring children’s change of attitude towards tooth brushing
indirectly through their parents, we used drawings to assess the ability of the
graphical and the tangible interface to engage children. The more involved the
children were with the task at hand, the most likely they would be influenced by it
and assimilate the content that was being promoted.
Building on theories that children’s drawings reveal how they understand the
world, what is important for them, and that children do not represent objects that
they find unnecessary or uninteresting [23, 24, 26], our approach was to determine
12
the number and nature of the elements that children represented – assuming that
the more detailed and complete the drawings were, the more involving the
experience had been.
As previously mentioned, the data collection was divided in two assessment
moments: first group A interacted with the TUI and group B interacted with the
traditional GUI; five months later there was a second interaction whereby the
interfaces were changed: group A interacted with the traditional GUI and group B
interacted with the TUI. After both tests the children were asked to draw their
experience.
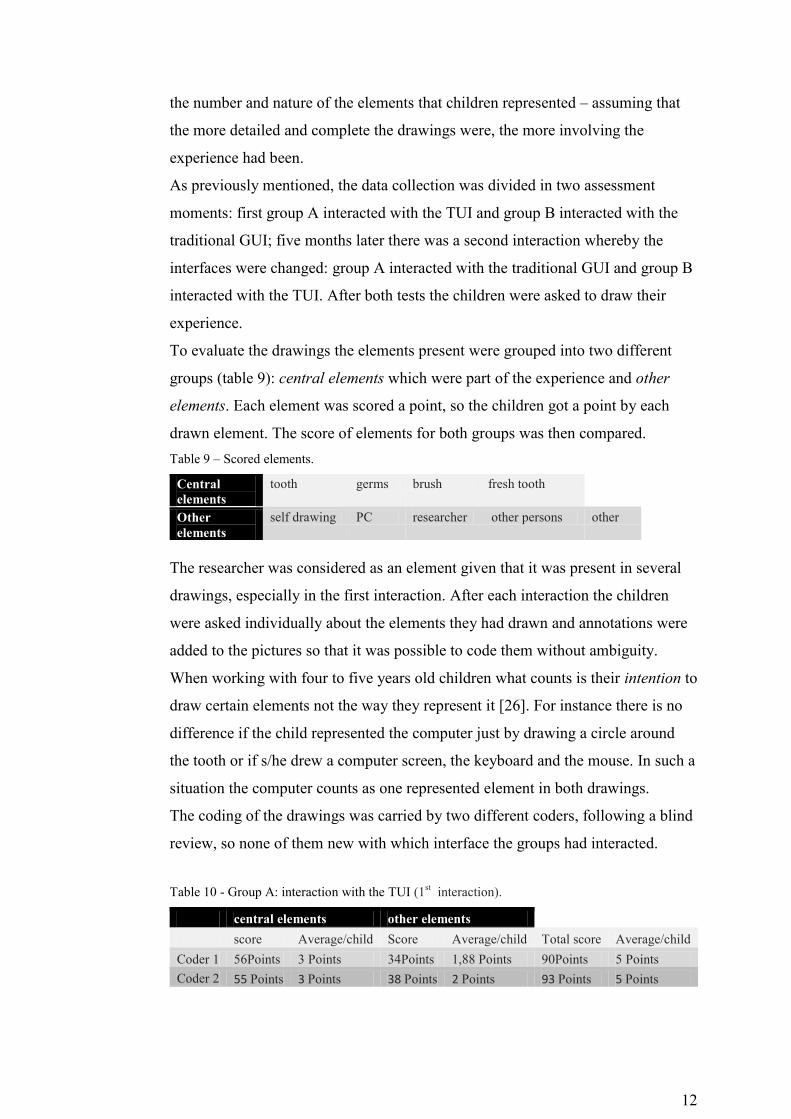
To evaluate the drawings the elements present were grouped into two different
groups (table 9): central elements which were part of the experience and other
elements. Each element was scored a point, so the children got a point by each
drawn element. The score of elements for both groups was then compared.
Table 9 – Scored elements.
Central
elements
tooth
germs brush fresh tooth
Other
elements
self drawing PC researcher other persons other
The researcher was considered as an element given that it was present in several
drawings, especially in the first interaction. After each interaction the children
were asked individually about the elements they had drawn and annotations were
added to the pictures so that it was possible to code them without ambiguity.
When working with four to five years old children what counts is their intention to
draw certain elements not the way they represent it [26]. For instance there is no
difference if the child represented the computer just by drawing a circle around
the tooth or if s/he drew a computer screen, the keyboard and the mouse. In such a
situation the computer counts as one represented element in both drawings.
The coding of the drawings was carried by two different coders, following a blind
review, so none of them new with which interface the groups had interacted.
Table 10 - Group A: interaction with the TUI (1st interaction).
central elements other elements
score Average/child Score Average/child Total score Average/child
Coder 1 56Points 3 Points 34Points 1,88 Points 90Points 5 Points
Coder 2 55 Points 3 Points 38 Points 2 Points 93 Points 5 Points
13
Table 11 - Group B: interaction with the GUI (1st interaction).
central elements other elements
score Average/child Score Average/child Total score Average/child
Coder 1 62Points 2,69 Points 10Points 0,43 Points 72Points 3 Points
Coder 2 63 Points 2,7 Points 9 Points 0,39 Points 72 Points 3 Points
The results (table 10,11)2 show that both groups drew the central elements to both
interfaces: group A scored an average of 3 points/child, group B scored 2, 69
points/child (coder 1) or 2,7 points/child (coder 2). Yet the significant differences
between the groups concern the other elements with an average total score of 5
drawn elements for group A against 3 drawn elements from group B. To confirm
if these differences were statistically relevant a non-parametric Mann-Whitney U
test for independent groups was applied to the results. This test was chosen
because the conditions for normal distribution of the high value of skewness were
not fully guaranteed [27]. The mean rank of each child in group A was 29, 89
against 14, 04 from group B, differences statistically significant for p<0.01.
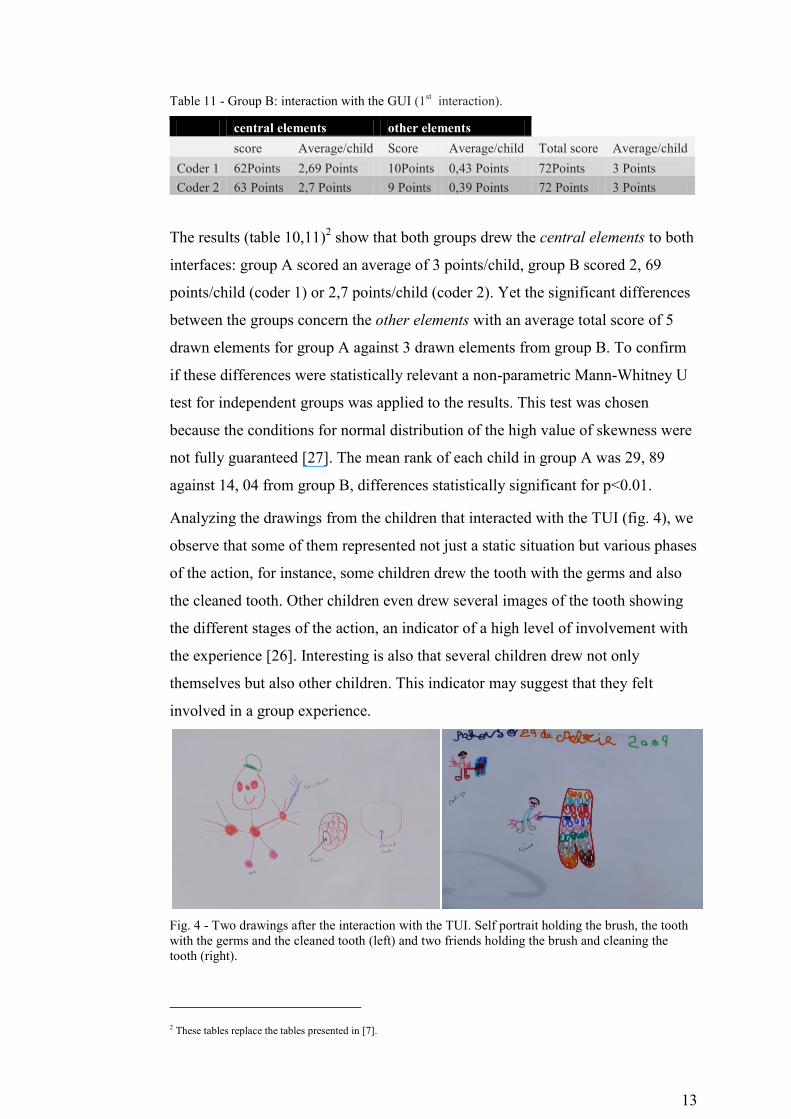
Analyzing the drawings from the children that interacted with the TUI (fig. 4), we
observe that some of them represented not just a static situation but various phases
of the action, for instance, some children drew the tooth with the germs and also
the cleaned tooth. Other children even drew several images of the tooth showing
the different stages of the action, an indicator of a high level of involvement with
the experience [26]. Interesting is also that several children drew not only
themselves but also other children. This indicator may suggest that they felt
involved in a group experience.
Fig. 4 - Two drawings after the interaction with the TUI. Self portrait holding the brush, the tooth
with the germs and the cleaned tooth (left) and two friends holding the brush and cleaning the
tooth (right).
2 These tables replace the tables presented in [7].
14
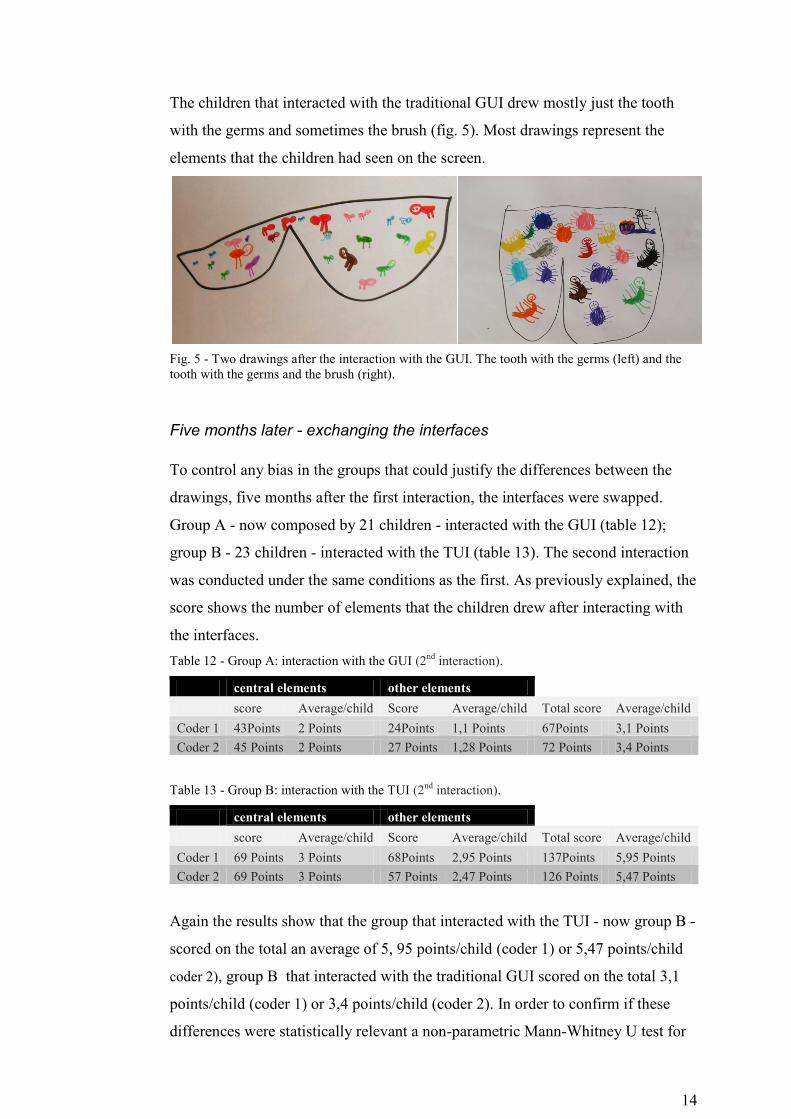
The children that interacted with the traditional GUI drew mostly just the tooth
with the germs and sometimes the brush (fig. 5). Most drawings represent the
elements that the children had seen on the screen.
Fig. 5 - Two drawings after the interaction with the GUI. The tooth with the germs (left) and the
tooth with the germs and the brush (right).
Five months later - exchanging the interfaces
To control any bias in the groups that could justify the differences between the
drawings, five months after the first interaction, the interfaces were swapped.
Group A - now composed by 21 children - interacted with the GUI (table 12);
group B - 23 children - interacted with the TUI (table 13). The second interaction
was conducted under the same conditions as the first. As previously explained, the
score shows the number of elements that the children drew after interacting with
the interfaces.
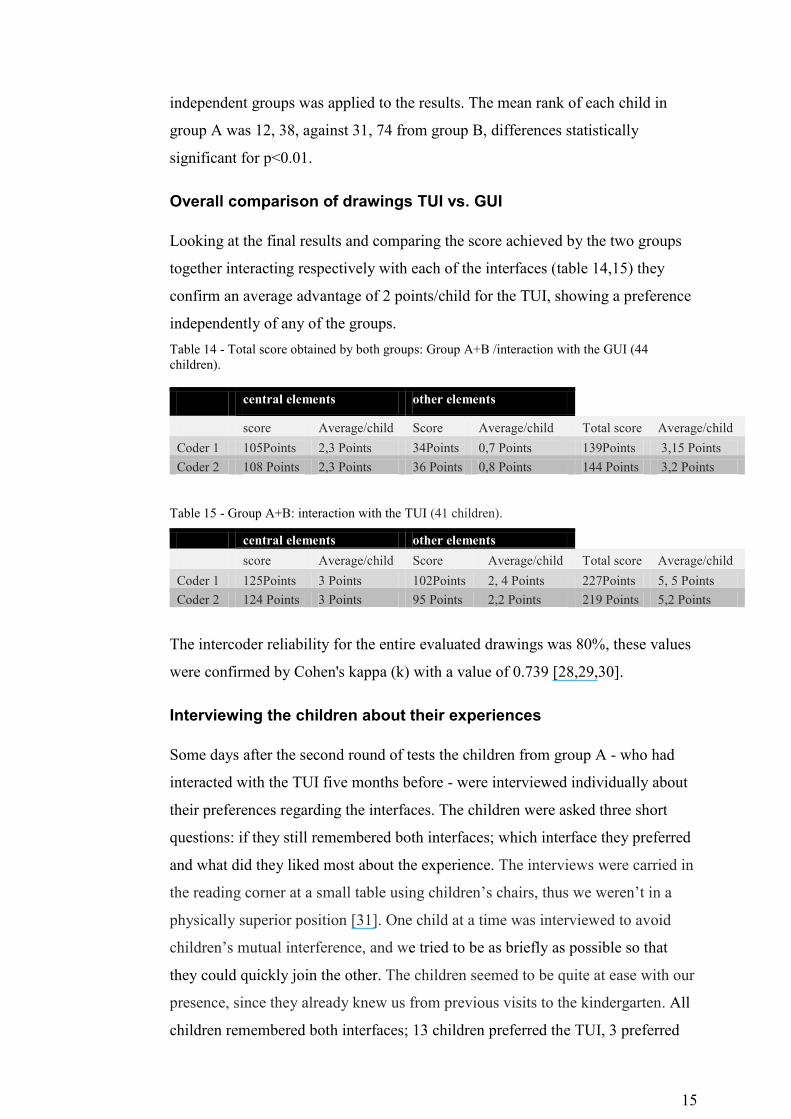
Table 12 - Group A: interaction with the GUI (2nd
interaction).
central elements other elements
score Average/child Score Average/child Total score Average/child
Coder 1 43Points 2 Points 24Points 1,1 Points 67Points 3,1 Points
Coder 2 45 Points 2 Points 27 Points 1,28 Points 72 Points 3,4 Points
Table 13 - Group B: interaction with the TUI (2nd
interaction).
central elements other elements
score Average/child Score Average/child Total score Average/child
Coder 1 69 Points 3 Points 68Points 2,95 Points 137Points 5,95 Points
Coder 2 69 Points 3 Points 57 Points 2,47 Points 126 Points 5,47 Points
Again the results show that the group that interacted with the TUI - now group B -
scored on the total an average of 5, 95 points/child (coder 1) or 5,47 points/child
coder 2), group B that interacted with the traditional GUI scored on the total 3,1
points/child (coder 1) or 3,4 points/child (coder 2). In order to confirm if these
differences were statistically relevant a non-parametric Mann-Whitney U test for
15
independent groups was applied to the results. The mean rank of each child in
group A was 12, 38, against 31, 74 from group B, differences statistically
significant for p<0.01.
Overall comparison of drawings TUI vs. GUI
Looking at the final results and comparing the score achieved by the two groups
together interacting respectively with each of the interfaces (table 14,15) they
confirm an average advantage of 2 points/child for the TUI, showing a preference
independently of any of the groups.
Table 14 - Total score obtained by both groups: Group A+B /interaction with the GUI (44
children).
central elements other elements
score Average/child Score Average/child Total score Average/child
Coder 1 105Points 2,3 Points 34Points 0,7 Points 139Points 3,15 Points
Coder 2 108 Points 2,3 Points 36 Points 0,8 Points 144 Points 3,2 Points
Table 15 - Group A+B: interaction with the TUI (41 children).
central elements other elements
score Average/child Score Average/child Total score Average/child
Coder 1 125Points 3 Points 102Points 2, 4 Points 227Points 5, 5 Points
Coder 2 124 Points 3 Points 95 Points 2,2 Points 219 Points 5,2 Points
The intercoder reliability for the entire evaluated drawings was 80%, these values
were confirmed by Cohen's kappa (k) with a value of 0.739 [28,29,30].
Interviewing the children about their experiences
Some days after the second round of tests the children from group A - who had
interacted with the TUI five months before - were interviewed individually about
their preferences regarding the interfaces. The children were asked three short
questions: if they still remembered both interfaces; which interface they preferred
and what did they liked most about the experience. The interviews were carried in
the reading corner at a small table using children’s chairs, thus we weren’t in a
physically superior position [31]. One child at a time was interviewed to avoid
children’s mutual interference, and we tried to be as briefly as possible so that
they could quickly join the other. The children seemed to be quite at ease with our
presence, since they already knew us from previous visits to the kindergarten. All
children remembered both interfaces; 13 children preferred the TUI, 3 preferred
16
the GUI and 2 liked both interfaces. What children liked most about the
experience was the big tooth with the moving germs on its surface and that they
had to hold a long brush to clean it.
Discussion
When children make a drawing of a story, they draw the main characters or the
scenery that most captured their attention. About 70% of children between four
and six years of age draw a single image. The concept of the single image
represents the most important moment of the graphic narrative, the children define
the moment or set of elements that they have retained, that most impressed them,
transmitting it through their drawings [26].
The group of children that interacted with the traditional GUI concentrated most
in drawing the elements represented on the computer screen. The majority of the
children that interacted with the TUI drew themselves holding the toothbrush.
They drew, besides the tangible objects, their friends or the other children. Indeed,
while one child was handling the brush, cleaning the tooth, going around,
examining it, trying to remove all the germs from its surface, the other children
were helping by giving advice and instructions. They just could not sit still and
watch, very often, the child that was cleaning looked around asking for help, thus
the children became involved in a group experience that encouraged
communication and exchange of experiences, important aspects that promote
learning [1].
The children were impressed by the physical tooth covered with unexpected
moving germs on its surface and the fact that they could interact with it; actually
the children even thought that the germs were alive. Most likely the “magic” that
tangible interfaces possess of taking the animation out from the screen into the
world plays a central role in that notion. Curious as children are, they could not
resist touching the germs - though initially with some anxiety - and were very
surprised when they found that the germs would not bite. They were also
delighted to clean them with an extra large tooth brush, a very sensory task, as
children had to move around the tooth and search for hidden germs. To experience
knowledge through their own body, with as many senses as possible, seems to
highly motivate children to perceive the world around them [23].
17
Both Froebel and Montessori already knew how important it is that children
experience the world through their senses. As a Froebel-inspired Manipulative
(FiM) the physical tooth enables modeling of a real world object acting
simultaneously as a Montessori-inspired Manipulative (MiM) making an abstract
concept - the importance of tooth brushing - concrete [1].
Limitations of the work
We could not finish without referring some limitations of the study. The
conclusions regarding the learning potential promoted by graphical versus
tangible interfaces have to take in account the nature of the content conveyed, a
physical, concrete activity. For this type of content and for the age group
addressed we can say that the results of the study suggest that the physicality of
the TUI has advantages over the GUI regarding its potential to provide more and
long lasting engagement, which are key elements to promote learning.
The novelty effect is certainly an important aspect to factor in the analysis.
Children as young as four to five years old in the social context where the study
was conducted have been previously exposed to computers. The TUI, on the other
hand, brought a new experience for the children leaving an impression on them.
Nevertheless the authors do not believe that the novelty is necessarily a problem
intrinsic to the study but might rather be a characteristic of the TUI itself. The fact
that in a TUI the experience occurs in a share space with the child allows more
amplitude for novelty to be introduced in the design of the experience where the
discovery with the objects and actions plays an important role. A good designed
TUI for learning should make use of that effect, which might not be as easily
accomplished in a traditional GUI,
The size of the interfaces was not accounted for in the comparison, and children
refer to the dimension of the tooth and the brush in their comments. The GUI
could eventually benefit from a larger display or projection system.
The evaluation through drawing was not conducted under ideal conditions. Due to
space limitations it was not possible to seat the children individually, thus it was
not possible to avoid potential influences of the partner. In any case, the same
conditions applied to the drawings with the TUI as well with the GUI.
18
Conclusions and future work
Holding a real brush in their hands and moving around the physical tooth to clean
it, provides children with a multiple sensory experience. Children are with all their
body and senses spatially situated inside of the experience itself, and that
immersion in the task is a key to learning [9]. Cleaning the virtual tooth with the
mouse, on the other hand, only provides a very limited kinesthetic interaction.
Traditional GUIs offer very limited communication channels, falling short of
embracing the richness of human senses and skills people have developed through
a lifetime of interaction with the physical world [32].
This ability to engage children is linked to the fact that TUIs meet children’s
conception of the word, which is still animistic at this age [8,33].
A child’s conception of his world may be so bound up with himself that he may
even confuse his own thoughts and feelings with those things around him. If a chair
falls over, he is concerned about the chair’s being hurt (Piaget, 1960). It is as almost
as though he were the chair. We can say, therefore, that the child at this stage is
emotionally involved in his spatial relationships [23: 163].
This ability of projecting life into objects and to interact with them is a key
component in learning and development, bringing empathy at the service of
intelligence [33], offering, like a good toy, the mental room for playful exploration
[33]: raising children’s interest, curiosity and willingness to try out and explore
new materials, through which they can experience the world in a new way.
Although it is not always clear in every learning situation that TUIs offer more
cognitive advantages for learning over traditional GUIs [2,3], the results of the
study suggest that the physicality of the TUI has advantages over the traditional
GUI since the former seems to have a stronger potential of engaging children in
the activity proposed ,sustaining the assumption that exploratory activities might
be particularly well supported by tangible interfaces [2].
Concerning the methodology used, the conjugation of different methods enabled
the verification or denial of drawing intervention. The drawings show a clear
tendency whether the children had used the TUI or the GUI, which corresponds to
the findings of the questionnaires and interviews. The combination of the three
methods: drawings, questionnaires and interviews seems to be rather convincing.
In future work we will continue to validate the use of drawing as a method for
evaluating technology with preschoolers.
19
Acknowledgements
We would like to thank Colégio Teresiano and Colégio D. Diogo in Braga, the
kindergarten teachers Andreia Oliveira e Rosália Henriques, the parents and all
the children for their willingness in helping us conducting this study. We thank
the anonymous reviewers for their valuable input in helping us improving the
original manuscript.
References
1. Zuckerman O, Arida S, Resnick M (2005) Extending Tangible Interfaces for Education: Digital
Montessori - Inspired Manipulatives. Proceedings of CHI’05. ACM Press, New York, pp 859-
868.
2. Marshall P (2007) Do tangible interfaces enhance learning? Proceedings of the 1st international
conference on Tangible and embedded interaction. ACM Press, New York, pp 163-170.
3. Zaman B, Abeele V, Markopoulos P, Marshall P (2009) Tangibles for children, the challenges.
Workshop abstract, CHI’09. ACM Press, New York.
4. Xu D, Mazzone E, MacFarlane S (2006) In search for evaluation methods for children's tangible
technology. Proceedings of IDC’06. ACM Press, New York, pp 171-172.
5. Xu D, Read JC, Sheehan R (2008) In Search of Tangible Magic. The 22nd BCS British- HCI.
Liverpool, UK.
6. Xu D, Read JC, Sim G, McManus B (2009) Experience it, draw it, rate it: capture children's
experiences with their drawings. Proceedings of the 8th International Conference on Interaction
Design and Children. ACM Press, New York, pp. 266-270.
7. Sylla C, Branco P, Coutinho C, Coquet ME (2009). Storytelling though drawings: Evaluating
Tangible Interfaces for Children. Proceedings of CHI’09. ACM Press, New York, pp 3461-3466.
8. Piaget J (1962) Play, Dreams and Imitation in Childhood. Norton, New York.
9. Papert S (1980) Mindstorms: Children, Computers, and Powerful Ideas. Basic Books, New
York.
10. Resnick M (2008) Sowing the Seeds for a more Creative Society. Learning & Leading with
Technology, December/January 2007-2008
11. Brosterman N (1997) Inventing Kindergarten. Harry N. Adams Inc., New York.
12. Montessori M (1912) The Montessori method: scientific pedagogy as applied to child
education in the "children's houses". R. Bentley, Cambridge MA.
13. Resnick M, Martin F, Berg R, Borovoy R, Colella V, Kramer K, Silverman B (1998) Digital
manipulatives: new toys to think with. Proceedings of CHI’98. ACM Press, New York, pp 281-
287.
14. Hanna L, Risden K, Alexander KJ (1997) Guidelines for usability testing with children.
Interactions, 1997(5), 9-14.
20
15. Fails JA, Druin A, Guha ML, Chipman G, Simms S, Churaman W (2005) Child’s play: a
comparison of desktop and physical interactive environments. Proceedings of IDC’05. ACM
Press, New York, pp 48-55.
16. Donker A, Markopoulos P (2002) A comparison of think-aloud, questionnaires and interviews
for testing usability with children. Proceedings of HCI’02. Faulkner X, Finlay J, Detienne F
(eds). Springer, London, pp 305-316.
17. Donker A, Reitsma P (2004) Usability testing with young children. Proceedings of IDC’04.
ACM Press, New York, pp 43-48.
18. Höysniemi J, Hamalainen P, Turkki L (2002) Using Peer Tutoring in Evaluating Usability of
Physically Interactive Computer Game with Children. Workshop proceedings of International
Workshop on Interaction Design and Children. Eindhoven, The Netherlands, pp. 144- 152.
19. Read JC, MacFarlane SJ, Casey C (2002) Endurability, engagement and expectations:
Measuring Children's Fun. Proceedings of IDC’02. Eindhoven: Shaker Publishing, pp. 189-
198.
20. Markopoulos P, Bekker MM (2002) How to compare usability testing methods with children
participants. Proceedings of IDC’02. ACM Press, New York, pp. 153-158.
21. Airey S, Plowman L, Connolly D, Luckin R (2002) Rating children's enjoyment of toys, games
and media. 3rd World Congress of the International Toy Research Association on Toys, Games
and Media, London.
22. Zaman B, Abeele V (2007) How to Measure the Likeability of Tangible Interaction with
Preschoolers. Proceddings of CHI’07, Infotec Nederland BV Woerden, Eindhoven , pp. 57–59.
23. Lowenfeld V, Brittain W (1975) Creative and Mental Growth. 6th
ed. Macmillan, New York.
24. Matthews J (2003) Drawing and Painting: Children and Visual Representation. 2nd
ed. Paul
Chapman, London.
25. Macmillan J, Schumacher S (1997) Research in Education: a Conceptual Introduction.
Longman, NewYork.
26. Coquet, ME (2000) A Narrativa Gráfica uma Estratégia de Comunicação de Crianças e de
Adultos. University of Minho, Braga.
27. Gibbons JD (1993) Nonparametric Statistics. Sage Publications, Newbury Park.
28. Cohen J (1960) A coefficient of agreement for nominal scales. Educational and Psychological
Measurement, 2, pp. 37-46.
29. Krippendorff K (1980) Content Analysis: An Introduction to Its Methodology. V. 5 The Sage
Series, SAGE Publications, Newbury Park.
30. Moore GW Developing and Evaluating Educational Research. HarperCollins Publishers, NY,
USA.
31. Keats DM (2000) Cross-cultural studies in child development in Asian contexts. CROSS-
CULTURES, 34(4): 339-350.
32. Ishii H, Ullmer B (1997) Tangible bits: Towards seamless interfaces between people, bits and
atoms. Proceddings of CHI’97. ACM Press, New York.
33. Ackermann E (2004) Constructing knowledge and transforming the world. A learning zone of
one's own: Sharing representations and flow in collaborative learning environments (M
21
Tokoro, L Steels Eds). DC. IOS Press, Amsterdam, Berlin, Oxford, Tokyo, Washington,
Part 1. Chapt 2. pp. 15-37.
List of figures
Fig. 1 - Two screenshots of the GUI. ................................................................................................ 6
Fig. 2 - A child interacting with the TUI (left) and the cleaned tooth (right). .................................. 6
Fig. 3 - Children from group A interacting with the TUI (left) and children from group B
interacting with the GUI (right). ....................................................................................................... 8
Fig. 4 - Two drawings after the interaction with the TUI. Self portrait holding the brush, the tooth
with the germs and the cleaned tooth (left) and two friends holding the brush and cleaning the
tooth (right) .................................................................................................................................. ...13
Fig. 5 - Two drawings after the interaction with the GUI. The tooth with the germs (left) and the
tooth with the germs and the brush (right)………...………………………………………………………… 14
List of tables
Table 1- Questions given to the parents. ........................................................................................... 7
Table 2 - Questionnaire results – before the interaction. .................................................................. 8
Table 3 - Questionnaire results after the interaction. ........................................................................ 9
Table 4- Group B, results before and after the interaction with the GUI. ....................................... 10
Table 5- Group A, results before and after the interaction with the TUI. ....................................... 10
Table 6 - Remarks made by the children from group B at home (translated from Portuguese). ... .11
Table 7- Remarks made by the children from group A at home (translated from Portuguese). ..... 11
Table 8 - Comments from the parents: group A and B (translated from Portuguese). ................... 11
Table 9 – Scored elements. ............................................................................................................. 12
Table 10 - Group A: interaction with the TUI (1st interaction). ..................................................... 12
Table 11 - Group B: interaction with the GUI (1st interaction). ..................................................... 13
Table 12 - Group A: interaction with the GUI (2nd
interaction). .................................................... 14
Table 13 - Group B: interaction with the TUI (2nd
interaction). ..................................................... 14
Table 14 - Total score obtained by both groups: Group A+B /interaction with the GUI (44
children). ......................................................................................................................................... 15
Table 15 - Group A+B: interaction with the TUI (41 children). ..................................................... 15