Impact of Noise and Light Pollution on Sleep in Preschoolers
36
Impact of Noise and Light Pollution on Sleep in Preschoolers Natalie Franz A thesis submitted in partial fulfillment of the requirements for the degree of Master of Public Health University of Washington 2020 Committee: Michelle Garrison Adam Szpiro Program Authorized to Offer Degree: Health Services
-
Upload
khangminh22 -
Category
Documents
-
view
1 -
download
0
Transcript of Impact of Noise and Light Pollution on Sleep in Preschoolers
Impact of Noise and Light Pollution on Sleep in Preschoolers
Natalie Franz
A thesis
submitted in partial fulfillment of the
requirements for the degree of
Master of Public Health
University of Washington
2020
Committee:
Michelle Garrison
Adam Szpiro
Program Authorized to Offer Degree:
Health Services

©Copyright 2020
Natalie Franz
University of Washington
Abstract
Impact of Noise and Light Pollution on Sleep in Preschoolers
Natalie Franz
Chair of the Supervisory Committee:
Michelle Garrison
School of Public Health, Department of Health Services
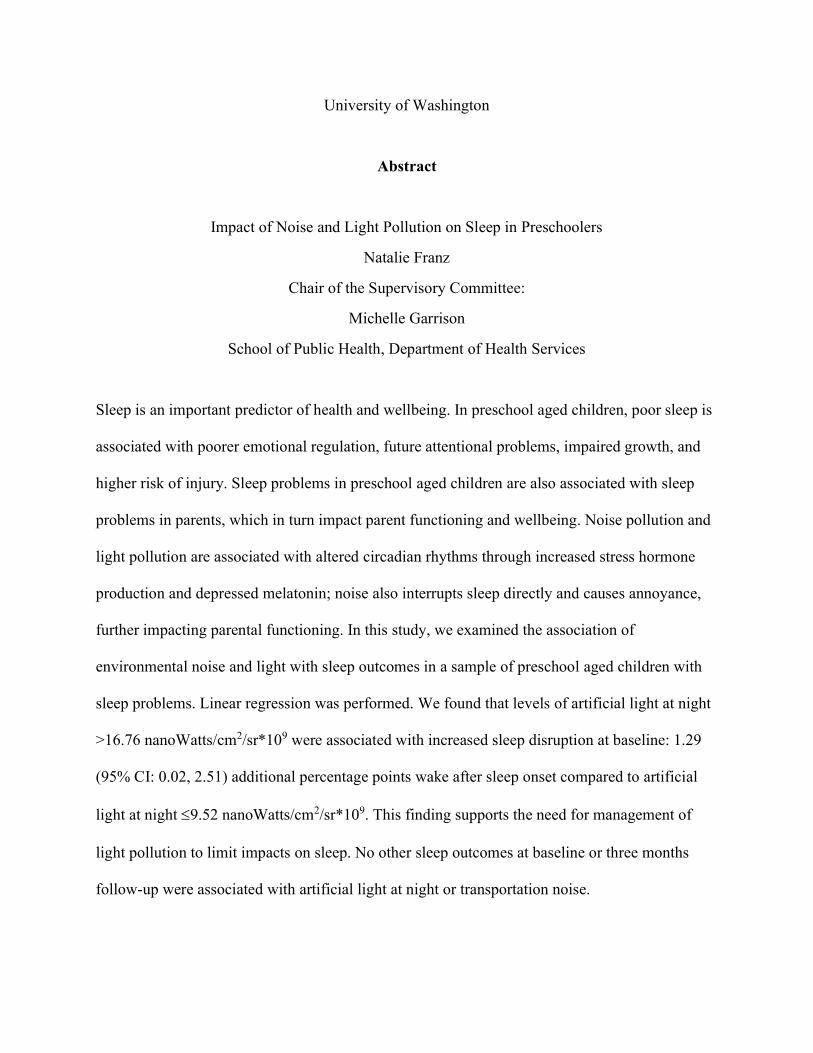
Sleep is an important predictor of health and wellbeing. In preschool aged children, poor sleep is
associated with poorer emotional regulation, future attentional problems, impaired growth, and
higher risk of injury. Sleep problems in preschool aged children are also associated with sleep
problems in parents, which in turn impact parent functioning and wellbeing. Noise pollution and
light pollution are associated with altered circadian rhythms through increased stress hormone
production and depressed melatonin; noise also interrupts sleep directly and causes annoyance,
further impacting parental functioning. In this study, we examined the association of
environmental noise and light with sleep outcomes in a sample of preschool aged children with
sleep problems. Linear regression was performed. We found that levels of artificial light at night
>16.76 nanoWatts/cm2/sr*109 were associated with increased sleep disruption at baseline: 1.29
(95% CI: 0.02, 2.51) additional percentage points wake after sleep onset compared to artificial
light at night 9.52 nanoWatts/cm2/sr*109. This finding supports the need for management of
light pollution to limit impacts on sleep. No other sleep outcomes at baseline or three months
follow-up were associated with artificial light at night or transportation noise.
Introduction
Importance of sleep
Sleep is vital to human health and wellbeing. Restricted or insufficient sleep leads to a host of
negative health consequences for adults, including neurobehavioral deficits, compromised
metabolic, immune, and hormone function, decreased cardiovascular health, increased risk of
depression, and increased mortality risk.(1-16)
Short sleep duration is associated with poorer emotional regulation, impaired growth, and higher
risk of injuries in children 0-4 years old.(17) Sleep-deprivation in both adults and children lowers
the psychological threshold for stress, and may elevate subjective stress, anxiety and anger.(18-
20) In preschool children, some elements of sleep (insomnia, sleep problems, and bedtime) are
associated with aggressiveness; in one study of children 48 months of age, those with sleep
duration <9.44 hours had 1.81 times greater odds of being frequently aggressive.(19, 20)
Internalizing problems are also linked to sleep: 24 month old children who slept less than 12.5
hours per day had 1.47 times greater odds of anxiety or depressive symptoms at age 3, when
compared to those who slept more than 13.5 hours.(19) Neurobehavioral and cognitive function
are impaired by sleep deprivation in both children and adults; sleep deprivation in children may
also impact healthy neurodevelopment.(21-23)
Sleep quality influences academic success: in school aged children, insufficient sleep manifests
in ADHD-like symptoms, such as poor attention and behavior regulation.(21, 23, 24) Daytime
sleepiness likewise impacts their ability to function in the classroom.(23) In a meta-analysis of
cross-sectional studies, sleep quality (r = 0.10), sleep duration (r = 0.07), and sleepiness (r = -
0.13) were associated with school performance, with larger effect sizes in younger
participants.(25) In one study where 4th and 6th grade students were randomly assigned to go to
sleep one hour earlier or later, this modest change in sleep duration led to substantially decreased
performance on various neurobehavioral functioning tests that correlate with classroom
behaviors and achievement test scores.(26) In experimental studies of children 6-16 years old,
sleep-deprived children fell asleep more easily during the day and were less attentive; in these
studies, there was also evidence of impaired higher level cognitive skills like creativity,
reasoning and executive function.(23) Bedtimes and sleep problems are positively but weakly (r
= 0.10) associated with attention problems in preschool aged children.(27) Evidence that sleep
problems have lasting attentional impacts is more worrisome, however: children with sleep
problems that occur “often” between the ages of 2 and 4 years had substantially elevated risk of
persistent attention problems at ages 5 and 14: 3.84 times greater odds for boys and 4.42 times
greater odds for girls.(19, 27) In short, sleep is important in the lives of children, with potentially
long-lasting health and academic impacts.
Sleep problems in children negatively impact the sleep, physical and mental health of
parents.(28-30) An Australian study of child sleep problems and parental wellbeing provides
weak evidence of association between sleep problems in preschoolers and paternal mental,
maternal mental and maternal general health (p = 0.06, 0.06 and 0.05, respectively). (29)A
Swedish study found that mothers of children with frequent night wakings had elevated rates of
sleep problems, while fathers had elevated rates of sleep problems when their children had sleep
disordered breathing or difficulty falling asleep.(31) Additional evidence suggests that the impact
of child sleep problems extends to parent functioning. One study found that parent daytime
sleepiness was associated with child sleep disorders, while another found that child sleep quality
predicted the quality of maternal sleep, which in turn predicted maternal mood, stress, and
fatigue.(32, 33) It is plausible that child sleep problems on parents may diminish parents’
capacity for positive parenting and behavioral intervention.
Environmental impacts
Environmental and neighborhood characteristics play a role in sleep problems, although the
majority of evidence for associations between sleep and environmental exposure to light and
noise is observational.(34)
Sleep is governed by the circadian system, which synchronizes sleep with the 24-hour day
through cycles of hormone secretion and blood pressure regulation.(22) The circadian rhythm is
driven by the zeitgebers—external cues for sleep and wakefulness—such as light. Artificial light
at night (ALAN) disrupts circadian rhythms, including secretion of melatonin, prolonging sleep
latency.(34) ALAN is associated with increased cancer risk and impacted metabolic
processes.(34, 35) Circadian rhythms are more strongly suppressed by higher temperature,
shorter wavelength (bluer) light; circadian disruption increases with the duration of light
exposure and exposure later in the evening.(35) Even exposure to the longest wavelengths of
light and intermittent light can induce circadian responses, as can exposure to low light levels (5-
10 lux) while sleeping.(36) However, recovery of melatonin after light exposure is rapid (within
15 minutes).(36) Living in areas with outdoor nighttime light is associated with delayed bedtime,
delayed waking, decreased sleep duration, increased reports of insufficient sleep, and increased
daytime sleepiness in adults, however, effect sizes are small.(37, 38) In one study using BRFSS
data, a 10-unit increase in nighttime light (in nW/[cm2 sr]) was associated with a 5.6 minute
decline in self-reported sleep duration and 13.8% higher odds of reporting insufficient sleep in
adults.(38) In a logistic regression of outdoor nighttime light (ONL), self-reported bedtime and
other factors, ONL explained 13.7% of variance in late bedtime (after midnight) (p<0.0001).(37)
Very little research has addressed the impact of light pollution on child sleep. In one field study,
light exposure in preschool aged children in the two hours preceding bedtime predicted 13.3% of
variance in circadian phase, while bedtime itself predicted 37.3% of variance.(39) The same lab
found that one hour of 1000 lux exposure before bedtime induced a 87% suppression of
melatonin, which remained attenuated 50 minutes after the bright light exposure, suggesting that
preschool aged children may be more sensitive to light exposure than adults.(40) This is
supported by another study which found 88% melatonin suppression in 9 year old children but
46% suppression in adults in response to moderately bright light (580 lux).(41)
Sleep is likewise vulnerable to noise, which disrupts and decreases sleep in a dose-response
fashion.(42, 43) Nighttime traffic noise, including aircraft and road, is associated with increased
sleep disturbance and insomnia symptom in adults: for a 10 db increase in night noise level
(Lnight), the odds ratios of percent highly sleep disturbed were 1.94, 2.13, and 3.06 for aircraft,
road and rail noise, respectively.(44, 45) Evidence for the effect of environmental noise in
children is sparse and slightly mixed. One study found a small, significant decrease in self-
reported sleep quality and an increase in daytime sleepiness associated with increased outdoor
noise among 9-12 year olds.(46) Actigraphy-measured sleep quality tended to decrease alongside
increasing noise; however, there was an indication of better sleep at the highest outdoor noise
levels (>64 dB LAeq,24h). Another found a significant association (OR=1.79) between Lnight at the
children’s home’s least exposed façade and problems falling asleep or sleeping through the night
among 10 year olds.(44) Among children 7-13, increases in maximum sound (Lmax) were
significantly associated with cortisol and other stress hormone excretion in the first half of the
night, causing disturbances in circadian rhythm.(47) These studies suggest that environmental
noise may negatively impact children’s sleep, however, no studies address the impact of
environmental noise on the sleep of preschool aged children. It is worth noting that noise,
particularly traffic noise, is spatially correlated with air pollutants such as nitrous oxide.(48)
Noise and air pollution are associated with many similar health outcomes and may even act
synergistically to cause them.(48) Air pollution may affect sleep through other pathways—
obstructive sleep apnea and asthma.(49-51) Few if any studies on traffic noise and sleep control
for air pollution.
Noise impacts children through pathways other than sleep disturbance. Noise exposure leads to
annoyance, including reactions such as irritation, dissatisfaction, or anger.(52, 53) Annoyance
substantially impacts mental and cognitive wellbeing in adults. It is associated with depression
and anxiety: prevalence ratios of depression and anxiety for moderate annoyance are 1.2 and 1.4,
for extreme annoyance, they are 1.97 and 2.14, compared to no annoyance. Noise exposure
reduces cognitive performance and short-term memory performance in adults; in children,
annoyance is related to impaired cognitive and executive function.(54, 55) The response to noise
is moderated by its features, including intermittentness, intensity and noise type, with
intermittent, intense noise being the most disturbing.(55) While the impact of environmental
noise on parenting has not been studied directly, depression and reduced executive function are
known to negatively impact parenting. Depression is associated with more hostile, negative, and
disengaged parenting; in contrast, greater inhibitory control (executive function) is associated
with responsive, positive and collaborative parenting behaviors.(56, 57) Therefore, we can
reasonably expect that a parent hampered by noise annoyance would have difficulty
implementing behavioral interventions. Likewise, the impact of parent sleep deprivation,
whether due to noise, light, or their children’s sleep, on decision making and cognitive ability is
likely to negatively impact the parent’s capacity to successfully implement behavioral
interventions.(6)
The majority of sleep problems in children are behavioral.(58) Accordingly, many evidence-
based interventions for sleep problems are behavioral, centering on sleep hygiene, including
routines and behavior management strategies.(22, 59) The provision of dark, quiet sleeping
environments is one feature of good sleep hygiene, as is limiting exposure to light and other
external stimulation preceding bedtime.(22) The vast majority of evidence concerning
interventions to decrease noise and/or light and improve sleep concern adults in inpatient
hospital settings, which are excessively noisy and disruptive.(60) These interventions typically
consist of eye mask and earplug provision, and/or measures to implement quiet hours in the ICU;
these interventions improve sleep across several dimensions, including night wakings, sleep
latency, and overall sleep quality.(60) Interventions that use white noise or music also improve
sleep for ICU patients, as well as colicky babies; however, white noise is not known to improve
sleep in healthy young adults.(60-62)
This Study
In this study, we investigate the association of environmental light and noise with sleep
outcomes including parent-reported and actigraphic sleep duration, sleep onset latency, and sleep
disturbance.
Sleep is an important predictor of health and wellbeing. In many populations, including adults
and school aged children, noise pollution is known to impact sleep, however little evidence exists
for children under the age of seven. Using a national transportation noise dataset, this study seeks
to determine whether noise pollution is associated with sleep outcomes in preschool aged
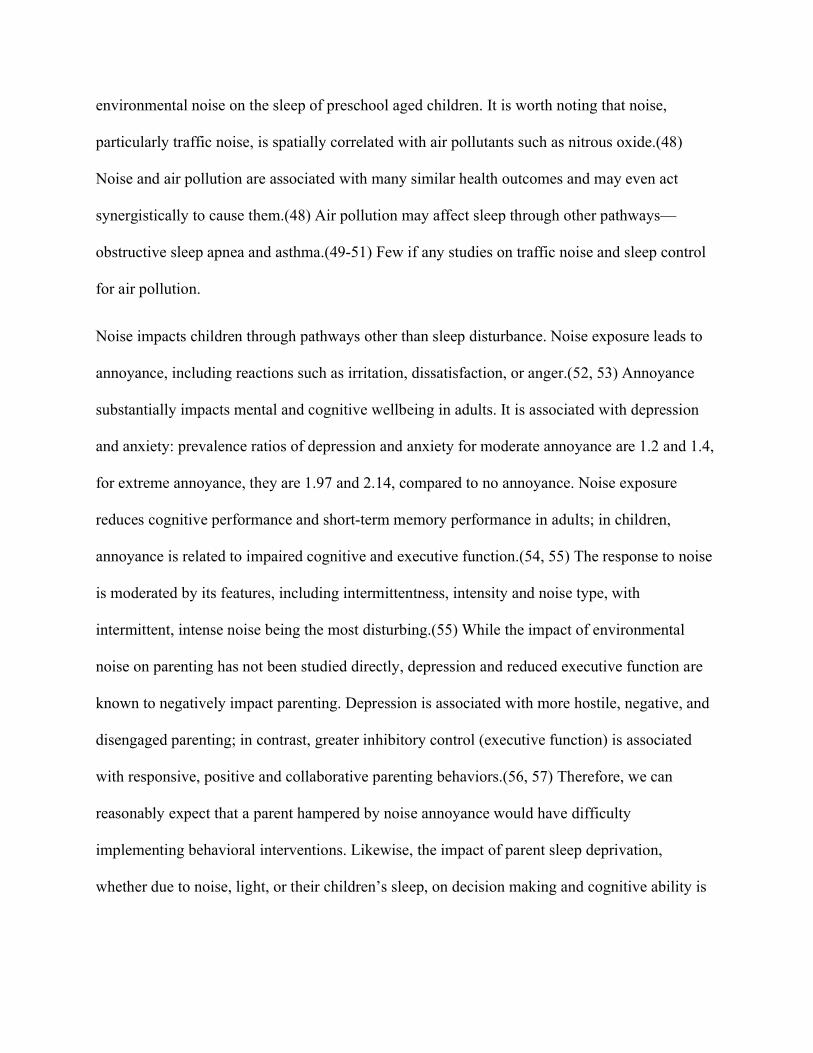
children. Noise may directly interrupt sleep, or it may decrease the quantity and quality of sleep
by increasing cortisol levels, thereby disrupting ciradian rhythms (see Figure 1). We hypothesize
that noise will be positively associated with sleep disruption and sleep latency, and negatively
associated with sleep duration at baseline. We predict the association will be strongest between
noise and sleep disruption.
ALAN is associated with poor sleep in adults and with altered circadian rhythms in both adults
and children. Existing evidence suggests that children are more sensitive to ALAN than adults,
however studies on children are limited to circadian rhythms and hormone levels, and do not
address sleep outcomes themselves. As with noise, ALAN impacts sleep through disrupted
circadian rhythms. This study aims to determine whether ALAN is associated with sleep
outcomes in this population. We hypothesize that ALAN will be positively associated with sleep
disruption, sleep latency, and negatively associated with sleep duration, the strongest association
being with sleep latency.
Another aim of this study is to understand how and if noise and ALAN impact the effectiveness
of behavioral parenting interventions. One effect of noise is annoyance. As shown in Figure 1,
parent functioning is affected by annoyance as well as through disruption of parent sleep. If
parents are able to substantially decrease the noise or ALAN a child is exposed to, higher levels
of noise or ALAN could represent an opportunity for improvement. The intervention group is
likely to take steps to decrease exposure. However, environmental noise may be difficult to
mitigate depending on the resources of the family, and thus prove to be a stumbling block. Very
high levels of noise may be impossible to mitigate and obviate any effect of an intervention. We
hypothesize that noise will interact negatively with the intervention; that is, higher noise levels
mediated through multiple pathways including through annoyance and parent functioning will
make the intervention less effective. As with noise, the impacts of ALAN on parent sleep may
subsequently impact parent wellbeing and parent capacity to implement an intervention. We
hypothesize that ALAN will interact negatively with the intervention.
Figure 1. Conceptual model.
Methods
Data Sources
Sleep outcome data and other co-variates are sourced from the Sleep Health in Preschoolers
(SHIP) study. SHIP is a randomized behavioral intervention that focuses on establishing routines
and boundaries to develop good sleep hygiene. SHIP study subjects are preschoolers (30 to 71
months of age at baseline) with sleep problems, as screened by the Children’s Sleep Habits
Questionnaire. Of the 343 subjects, 179 were randomized to the intervention arm, 164 to the
control arm. Subjects lived in the Puget Sound area of Western Washington state. They were
recruited over a period of years and began participation in the study between October 2014 and
October 2017.
VIIRS DNB data were used to estimate nighttime light at subjects’ residences.(63) The vcm-orn-
ntl data, which “contains cloud-free average radiance values that have undergone an outlier
removal process to filter out fires and other ephemeral lights with background (non-lights) set to
zero” were selected, to best approximate artificial light at night (ALAN). The average of annual
values for 2015 and 2016 were used, which coincides with majority of the time period under
study. These data provide average radiance values in nanoWatts/cm2/sr *109.
Noise data were sourced from the US Department of Transportation Noise Map.(64) The
USDOT Noise Map acoustically sums modeled aviation and road noise from the year 2014,
producing 24-hour average transportation noise values ranging from 35 to 125 dB.
Variables

Variable name
Definition Type
WASO(T0) Wake after sleep onset is the percent of total sleep duration the individual was awake in percentage points at baseline.
Continuous
WASO(T3) Wake after sleep onset is the percent of total sleep duration the individual was awake in percentage points at three months follow up.
Continuous
SOL(T0) Sleep onset latency is the time measured in minutes between going to bed and falling asleep at baseline.
Continuous
SOL(T3) Sleep onset latency in minutes at three months follow up. Continuous TST(T0) Total sleep time is the total sleep duration minus waking
minutes at baseline. Continuous
TST(T3) Total sleep time is the total sleep duration minus waking minutes at three months follow up.
Continuous
Noise < 40 dB Transportation noise level (A-weighted 24-hour equivalent) at study subject residence below 40 dB
Categorical
Noise 40 dB Transportation noise level (A-weighted 24-hour equivalent) at study subject residence equal to or greater than 40 dB
Categorical
Age Subject age in months Continuous Sex Subject sex at birth, male = 1, female = 0. Binary SES_1 Household annual income > $100,000 Categorical SES_2 Parent education at or beyond undergraduate degree and
household income $100,000 Categorical
SES_3 Parent education less than an undergraduate degree and household income $100,000
Categorical
CF Circadian fragility score Continuous Bedtime_1 Bedtime 7:45 PM or earlier Categorical Bedtime_2 Bedtime from 7:46 PM to 8:15 PM Categorical Bedtime_3 Bedtime 8:16 PM or later Categorical Bedtime_none No regular bedtime Categorical CSHS Child Sleep Hygiene Scale score Continuous Light_q1 Light radiance at night in the first quartile (9.52
nanoWatts/cm2/sr) Categorical
Light_q2 Light radiance at night in the second quartile (9.52 nanoWatts/cm2/sr <x16.76 nanoWatts/cm2/sr)
Categorical
Light_q34 Light radiance at night in the third and fourth quartiles (above the median) (>16.76 nanoWatts/cm2/sr)
Categorical
Arm Intervention arm, control = 0, intervention = 1. Binary Table 1. Variables and definitions.
Variables and their definitions are listed in Table 1. The primary outcomes of interest, wake after
sleep onset (WASO), sleep onset latency (SOL), and total sleep time (TST), were measured
using both actigraphy and sleep diaries. WASO is defined as the percent of total sleep duration
the individual was awake, as detected by actigraphy. SOL is the time in minutes between going
to bed as noted in the sleep diary and falling asleep. Total sleep time is the total sleep duration
minus waking minutes. These sleep outcomes were measured over the course of one week, at
baseline (T0) and at three months follow-up (T3). The nightly values were averaged to find T0
and T3 values. In their sleep diaries, most subjects have seven consecutive nights of recorded
data, although they recorded as few as five or as many as ten, sometimes inconsecutively.
Established methods for measuring sleep include polysomnography, videosomnography,
actigraphy, sleep diaries and questionnaires. While polysomnography may be considered the
gold standard for measuring sleep, including duration and night wakings, it is laboratory-based
and therefore limited for understanding sleep of children over long periods in their homes.(42) In
contrast, actigraphs, which are accelerometers that detect motion, can be worn for several days
and nights at a time unsupervised. In validation studies of actigraphy for pediatric sleep,
actigraphy has high sensitivity and low specificity compared to polysomnography, direct
observation, and videosomnography—that is, it has a low ability to detect night wakings and
may overestimate sleep duration and underestimate sleep fragmentation and sleep latency.(65,
66) Parent report of sleep onset time, end time, and sleep period correlates well with actigraphic
measurements in children, but consistently overestimates sleep duration and underestimates night
wakings compared to actigraphy.(66-69) It is likely that parent report of sleep in children
contains substantial wake time. However, parent report has unique value in that it provides
insight into the impact of child sleep problems on the family.
The primary predictors of interest are artificial light at night (ALAN) and transportation noise.
To obtain these values, subject addresses were geocoded using the US Census Geocoder.
Addresses that were not matched to a geolocation were inspected for errors (e.g., a zip code with
transposed digits inconsistent with the rest of the address) and re-entered to find a geolocation.
Remaining addresses were searched in Google Maps and the resulting geolocation was used. A
small number of addresses (n=5) were too vague to locate or otherwise impossible to geocode;
these were excluded. Light and noise values were assigned to subjects’ residence geolocations
using ESRI ArcGIS Desktop Suite (v10.4). Geolocations that did not return a noise value (as
they were <35 dB, the lower limit provided by the USDOT Noise Map) were assigned the value
√, as done by Sears et al. in a study using this dataset.(70) Noise was subsequently divided into
two categories: <40 dB, ≥40 dB. These cutoffs are based on WHO recommendations (no more
than 40 dB at night).(71) ALAN values were separated into first quartile, second quartile, and
above median, at 9.52, 9.52<x≤16.76, and >16.76 nanoWatts/cm2/sr *109. ALAN values were
divided as such as it is plausible that above some threshold of nighttime light, it is impossible to
sleep, and additional light has no additional impact.
Socioeconomic status was determined using both family income and completed parent education,
which were categorized into three groups: higher income (>$100,000), lower income/higher
education ($100,000 and at least an undergraduate degree), and finally lower income/lower
education ($100,000 and associate-level or less). The categories were defined based on their
distribution in this dataset and on income and education distributions in the region: in King
County, WA the median income is $95,000 and 53% of adults hold at least a Bachelor’s
degree.(72, 73) Socioeconomic status might be related to light and noise exposure as well as a
family’s ability to modify the child’s sleeping environment. The Child Sleep Hygiene Scale
(CSHS), a 23-item scale that measures sleep hygiene in six subscales: physiological, cognitive,
emotional, environmental, bedtime routine, and sleep stability, was also included.(74) CSHS
score, the presence of a regular bedtime and the bedtime itself were included to control for
behavioral sleep problems that might drown out the effects of noise and light on sleep.
Furthermore, exposure to light and noise pollution and subsequent disruption or decrease in sleep
may vary based on the child’s bedtime. Bedtimes were converted to 24-hour decimal values
(e.g., 8:30 PM became 20.50) for ease of use in statistical models. Obvious errors, such as
bedtimes recorded as AM, were corrected. Bedtimes were subsequently sorted into tertiles (7:45
pm or earlier, 7:46 PM to 8:15 PM, and 8:16 PM or later); a categorical bedtime variable was
created with four categories (the above tertiles and no bedtime). Circadian fragility (the degree to
which changes in sleep schedule disrupt functioning and to which the child is flexible in their
sleep schedule) was measured using a questionnaire created for this study (see Appendix). This
questionnaire used a 1-3 scale for each question; higher scores indicate greater fragility. Mean
response values were calculated for participants who completed the questionnaire with one or
zero nonresponses out of five.
Analysis
Linear regression was performed for three sleep outcome variables, WASO), SOL, and TST, as
measured over one week at baseline. The threshold for statistical significance was set at α < 0.05.
P values and confidence intervals were calculated using robust standard errors. See Table 2 for
regression equations. Light and noise were the predictors of interest. We controlled for child age,
sex at birth, socioeconomic status, circadian fragility, and in the case of SOL and TST, bedtime
and CSHS score. Regressions examining the interaction of the SHIP intervention and light/noise
pollution were performed for SOL and TST at three months, controlling for the sleep outcome at
baseline, child age, sex at birth, socioeconomic status, circadian fragility, bedtime and CSHS
score. These analyses were completed in R version 4.0.0.
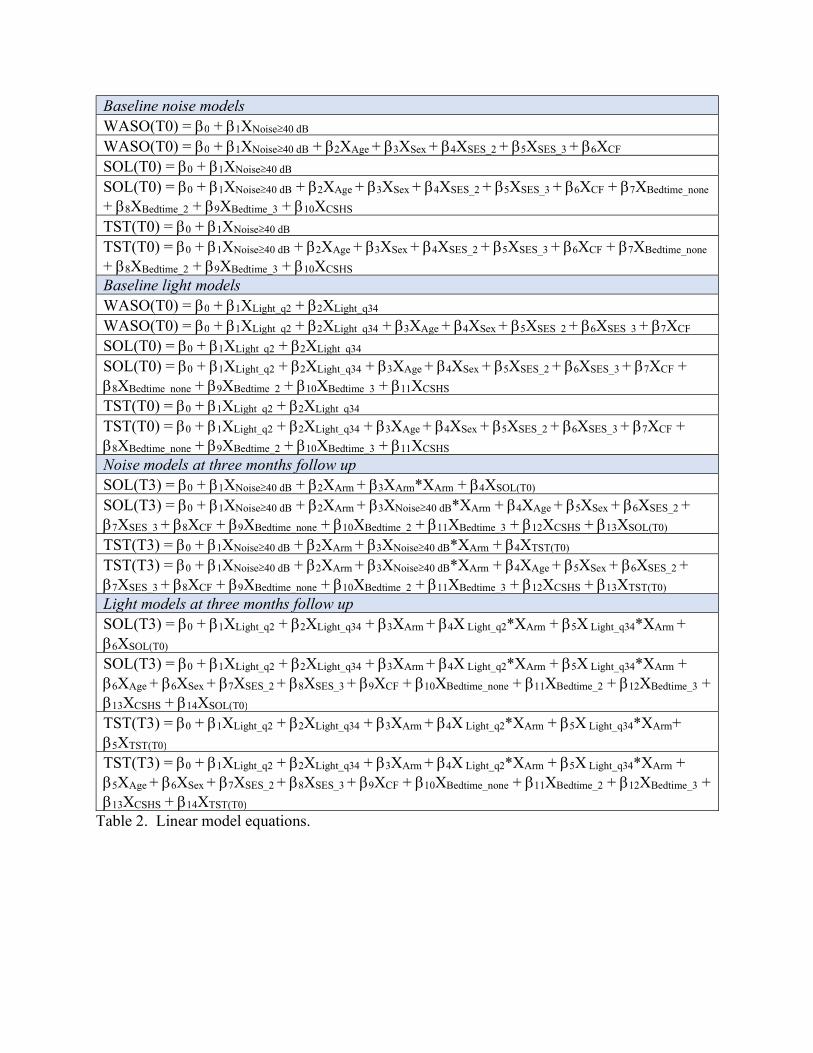
Baseline noise models WASO(T0) = 0 + 1XNoise40 dB WASO(T0) = 0 + 1XNoise40 dB + 2XAge + 3XSex + 4XSES_2 + 5XSES_3 + 6XCF SOL(T0) = 0 + 1XNoise40 dB SOL(T0) = 0 + 1XNoise40 dB + 2XAge + 3XSex + 4XSES_2 + 5XSES_3 + 6XCF + 7XBedtime_none + 8XBedtime_2 + 9XBedtime_3 + 10XCSHS TST(T0) = 0 + 1XNoise40 dB TST(T0) = 0 + 1XNoise40 dB + 2XAge + 3XSex + 4XSES_2 + 5XSES_3 + 6XCF + 7XBedtime_none + 8XBedtime_2 + 9XBedtime_3 + 10XCSHS
Baseline light models WASO(T0) = 0 + 1XLight_q2 + 2XLight_q34 WASO(T0) = 0 + 1XLight_q2 + 2XLight_q34 + 3XAge + 4XSex + 5XSES_2 + 6XSES_3 + 7XCF SOL(T0) = 0 + 1XLight_q2 + 2XLight_q34 SOL(T0) = 0 + 1XLight_q2 + 2XLight_q34 + 3XAge + 4XSex + 5XSES_2 + 6XSES_3 + 7XCF + 8XBedtime_none + 9XBedtime_2 + 10XBedtime_3 + 11XCSHS TST(T0) = 0 + 1XLight_q2 + 2XLight_q34 TST(T0) = 0 + 1XLight_q2 + 2XLight_q34 + 3XAge + 4XSex + 5XSES_2 + 6XSES_3 + 7XCF + 8XBedtime_none + 9XBedtime_2 + 10XBedtime_3 + 11XCSHS Noise models at three months follow up SOL(T3) = 0 + 1XNoise40 dB + 2XArm + 3XArm*XArm + 4XSOL(T0) SOL(T3) = 0 + 1XNoise40 dB + 2XArm + 3XNoise40 dB*XArm + 4XAge + 5XSex + 6XSES_2 + 7XSES_3 + 8XCF + 9XBedtime_none + 10XBedtime_2 + 11XBedtime_3 + 12XCSHS + 13XSOL(T0) TST(T3) = 0 + 1XNoise40 dB + 2XArm + 3XNoise40 dB*XArm + 4XTST(T0) TST(T3) = 0 + 1XNoise40 dB + 2XArm + 3XNoise40 dB*XArm + 4XAge + 5XSex + 6XSES_2 + 7XSES_3 + 8XCF + 9XBedtime_none + 10XBedtime_2 + 11XBedtime_3 + 12XCSHS + 13XTST(T0) Light models at three months follow up SOL(T3) = 0 + 1XLight_q2 + 2XLight_q34 + 3XArm + 4X Light_q2*XArm + 5X Light_q34*XArm + 6XSOL(T0) SOL(T3) = 0 + 1XLight_q2 + 2XLight_q34 + 3XArm + 4X Light_q2*XArm + 5X Light_q34*XArm + 6XAge + 6XSex + 7XSES_2 + 8XSES_3 + 9XCF + 10XBedtime_none + 11XBedtime_2 + 12XBedtime_3 + 13XCSHS + 14XSOL(T0) TST(T3) = 0 + 1XLight_q2 + 2XLight_q34 + 3XArm + 4X Light_q2*XArm + 5X Light_q34*XArm+ 5XTST(T0) TST(T3) = 0 + 1XLight_q2 + 2XLight_q34 + 3XArm + 4X Light_q2*XArm + 5X Light_q34*XArm + 5XAge + 6XSex + 7XSES_2 + 8XSES_3 + 9XCF + 10XBedtime_none + 11XBedtime_2 + 12XBedtime_3 + 13XCSHS + 14XTST(T0)
Table 2. Linear model equations.
Results
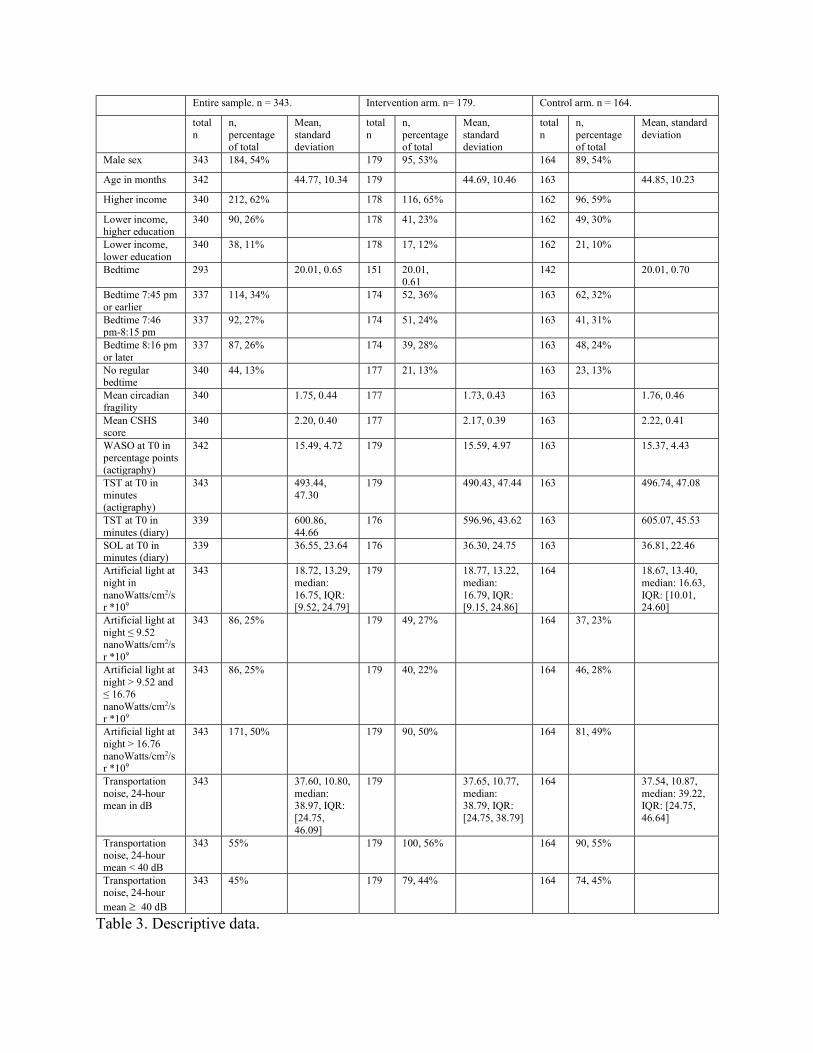
Characteristics of the study population are shown in Table 3. On average, this population
experienced 36.55 minutes of SOL and 15.49% WASO at baseline. Mean TST at baseline was
600.86 minutes (10.0 hours) measured by sleep diary, and 493.44 minutes (8.2 hours) measured
by actigraphy; it is typical for sleep diaries to overestimate TST compared to actigraphy.(68, 69)
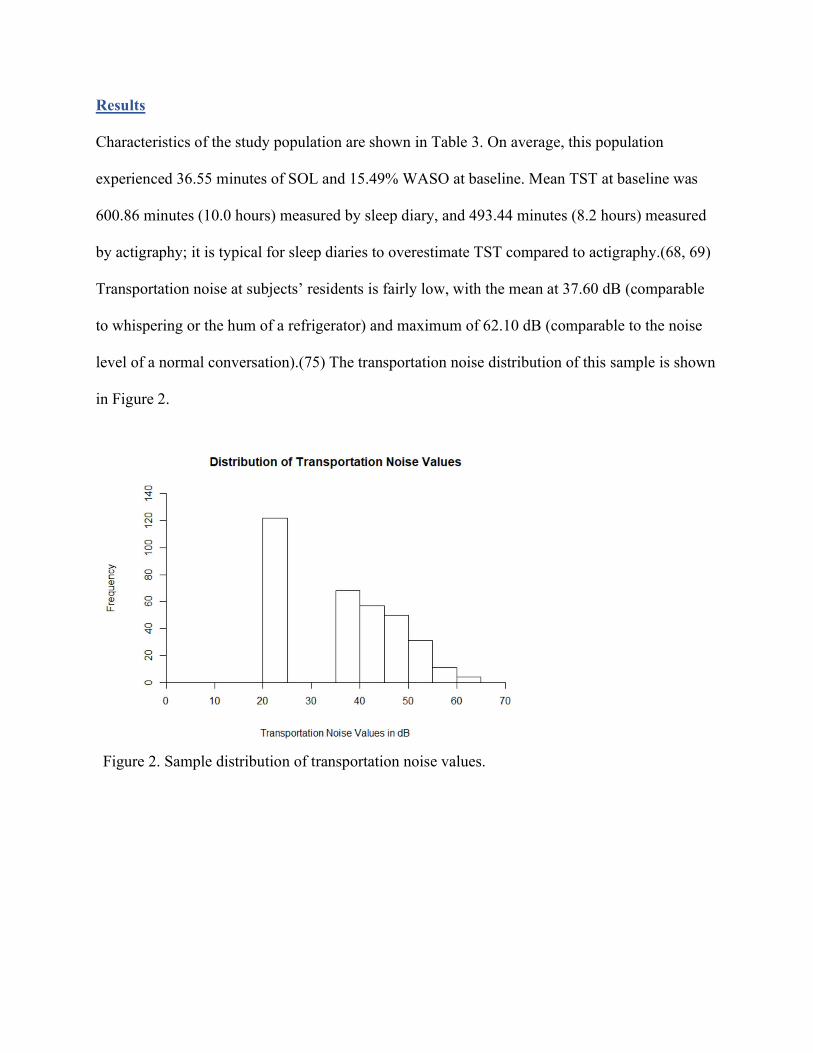
Transportation noise at subjects’ residents is fairly low, with the mean at 37.60 dB (comparable
to whispering or the hum of a refrigerator) and maximum of 62.10 dB (comparable to the noise
level of a normal conversation).(75) The transportation noise distribution of this sample is shown
in Figure 2.
Figure 2. Sample distribution of transportation noise values.
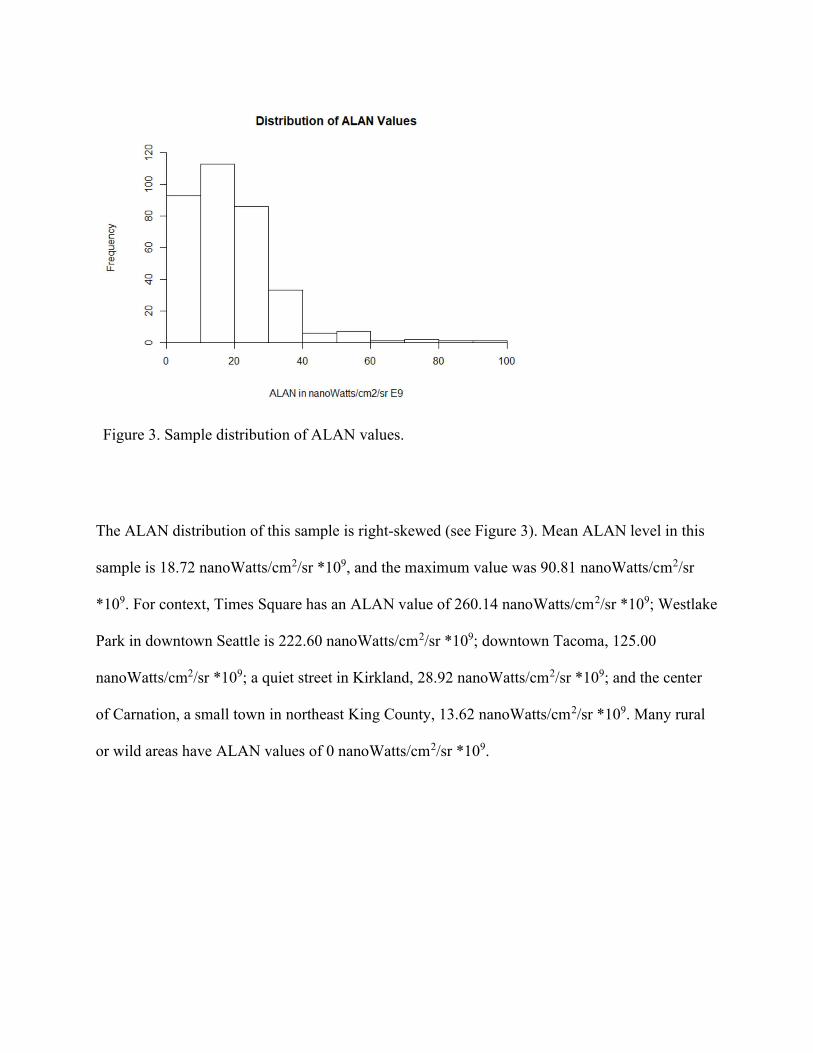
Figure 3. Sample distribution of ALAN values.
The ALAN distribution of this sample is right-skewed (see Figure 3). Mean ALAN level in this
sample is 18.72 nanoWatts/cm2/sr *109, and the maximum value was 90.81 nanoWatts/cm2/sr
*109. For context, Times Square has an ALAN value of 260.14 nanoWatts/cm2/sr *109; Westlake
Park in downtown Seattle is 222.60 nanoWatts/cm2/sr *109; downtown Tacoma, 125.00
nanoWatts/cm2/sr *109; a quiet street in Kirkland, 28.92 nanoWatts/cm2/sr *109; and the center
of Carnation, a small town in northeast King County, 13.62 nanoWatts/cm2/sr *109. Many rural
or wild areas have ALAN values of 0 nanoWatts/cm2/sr *109.
Entire sample. n = 343. Intervention arm. n= 179. Control arm. n = 164.
total n
n, percentage of total
Mean, standard deviation
total n
n, percentage of total
Mean, standard deviation
total n
n, percentage of total
Mean, standard deviation
Male sex 343 184, 54% 179 95, 53% 164 89, 54%
Age in months 342 44.77, 10.34 179 44.69, 10.46 163 44.85, 10.23
Higher income 340 212, 62% 178 116, 65% 162 96, 59%
Lower income, higher education
340 90, 26% 178 41, 23% 162 49, 30%
Lower income, lower education
340 38, 11% 178 17, 12% 162 21, 10%
Bedtime 293 20.01, 0.65 151 20.01, 0.61
142 20.01, 0.70
Bedtime 7:45 pm or earlier
337 114, 34% 174 52, 36% 163 62, 32%
Bedtime 7:46 pm-8:15 pm
337 92, 27% 174 51, 24% 163 41, 31%
Bedtime 8:16 pm or later
337 87, 26% 174 39, 28% 163 48, 24%
No regular bedtime
340 44, 13% 177 21, 13% 163 23, 13%
Mean circadian fragility
340 1.75, 0.44 177 1.73, 0.43 163 1.76, 0.46
Mean CSHS score
340 2.20, 0.40 177 2.17, 0.39 163 2.22, 0.41
WASO at T0 in percentage points (actigraphy)
342 15.49, 4.72 179 15.59, 4.97 163 15.37, 4.43
TST at T0 in minutes (actigraphy)
343 493.44, 47.30
179 490.43, 47.44 163 496.74, 47.08
TST at T0 in minutes (diary)
339 600.86, 44.66
176 596.96, 43.62 163 605.07, 45.53
SOL at T0 in minutes (diary)
339 36.55, 23.64 176 36.30, 24.75 163 36.81, 22.46
Artificial light at night in nanoWatts/cm2/sr *109
343 18.72, 13.29, median: 16.75, IQR: [9.52, 24.79]
179 18.77, 13.22, median: 16.79, IQR: [9.15, 24.86]
164 18.67, 13.40, median: 16.63, IQR: [10.01, 24.60]
Artificial light at night ≤ 9.52 nanoWatts/cm2/sr *109
343 86, 25% 179 49, 27% 164 37, 23%
Artificial light at night > 9.52 and ≤ 16.76 nanoWatts/cm2/sr *109
343 86, 25% 179 40, 22% 164 46, 28%
Artificial light at night > 16.76 nanoWatts/cm2/sr *109
343 171, 50% 179 90, 50% 164 81, 49%
Transportation noise, 24-hour mean in dB
343 37.60, 10.80, median: 38.97, IQR: [24.75, 46.09]
179 37.65, 10.77, median: 38.79, IQR: [24.75, 38.79]
164 37.54, 10.87, median: 39.22, IQR: [24.75, 46.64]
Transportation noise, 24-hour mean < 40 dB
343 55% 179 100, 56% 164 90, 55%
Transportation noise, 24-hour mean 40 dB
343 45% 179 79, 44% 164 74, 45%
Table 3. Descriptive data.
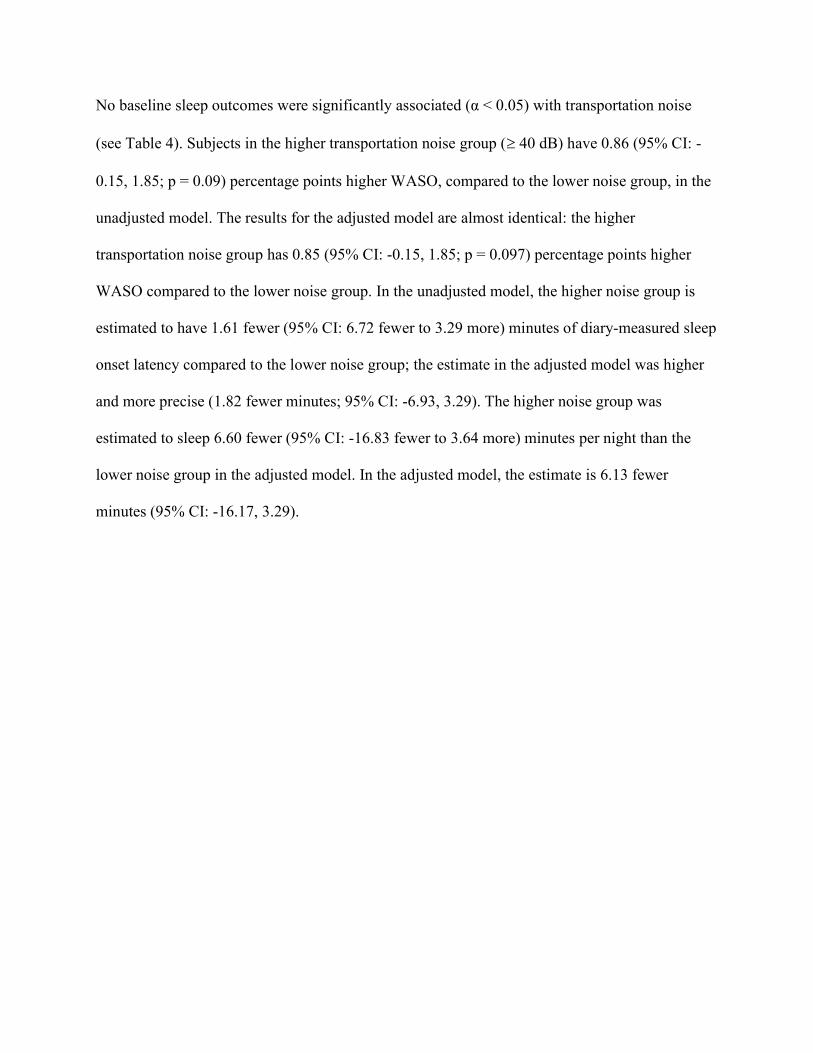
No baseline sleep outcomes were significantly associated (α < 0.05) with transportation noise
(see Table 4). Subjects in the higher transportation noise group ( 40 dB) have 0.86 (95% CI: -
0.15, 1.85; p = 0.09) percentage points higher WASO, compared to the lower noise group, in the
unadjusted model. The results for the adjusted model are almost identical: the higher
transportation noise group has 0.85 (95% CI: -0.15, 1.85; p = 0.097) percentage points higher
WASO compared to the lower noise group. In the unadjusted model, the higher noise group is
estimated to have 1.61 fewer (95% CI: 6.72 fewer to 3.29 more) minutes of diary-measured sleep
onset latency compared to the lower noise group; the estimate in the adjusted model was higher
and more precise (1.82 fewer minutes; 95% CI: -6.93, 3.29). The higher noise group was
estimated to sleep 6.60 fewer (95% CI: -16.83 fewer to 3.64 more) minutes per night than the
lower noise group in the adjusted model. In the adjusted model, the estimate is 6.13 fewer
minutes (95% CI: -16.17, 3.29).
Outcome WASO_act(T0) WASO_act(T0) SOL_diary(T0) SOL_diary(T0) TST_act(T0) TST_act(T0)
Coefficient† Estimate (95% CI)
Estimate (95% CI)
Estimate (95% CI)
Estimate (95% CI)
Estimate (95% CI)
Estimate (95% CI)
Noise < 40 dB REF REF REF REF REF REF
Noise 40 dB 0.86 (-0.14, 1.87) (p = 0.09)
0.85 (-0.15, 1.85) (p =
-1.61 (-6.72, 3.49)
-1.82 (-6.93, 3.29)
-6.60 (-16.83, 3.64)
-6.13 (-16.17, 3.90)
Age -0.10*** (-0.14, -0.05)
-0.26 (-0.54, 0.03) (p = 0.08)
1.21*** (0.77, 1.65)
Female sex REF REF REF
Male sex 0.62 (-0.38, 1.62)
-0.34 (-5.46, 4.77)
-16.73*** (-26.57, -6.89)
SES_1 REF REF REF
SES_2 -0.41 (-1.52, 0.70)
0.08 (-5.31, 5.46)
3.12 (-8.09, 14.32)
SES_3 0.31 (-1.48, 2.10)
1.78 (-9.20, 12.76)
-12.61 (-28.92, 3.70)
Circadian fragility
-0.09 (-1.36, 1.19)
7.42* (0.46, 14.39)
2.57 (-8.86, 13.99)
Bedtime_1 REF REF
Bedtime_2 -1.69 (-7.96, 4.58)
-7.89 (-19.74, 3.96)
Bedtime_3 -4.69 (-10.83, 1.45)
-22.38*** (-35.62, -9.14)
Bedtime_none -3.62 (-12.88, 5.65)
-13.28 (-31.69, 4.60)
CSHS 18.17*** (9.95, 26.39)
-3.91 (-17.23, 9.42)
Table 4. Sleep outcomes and transportation noise. These models use baseline (T0) outcomes. Variable definitions can be found in Table 1. Reference group is indicated by “REF”. † * p < 0.05, ** p < 0.01, *** p < 0.001. p < 0.1 indicated.
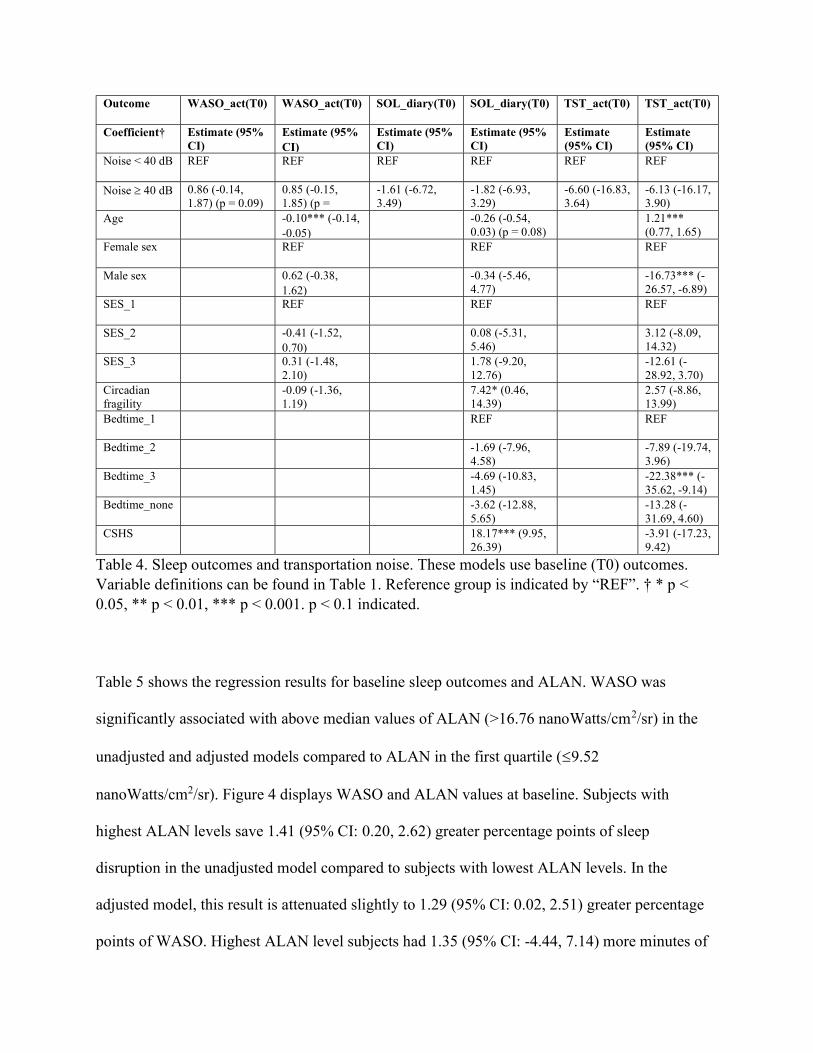
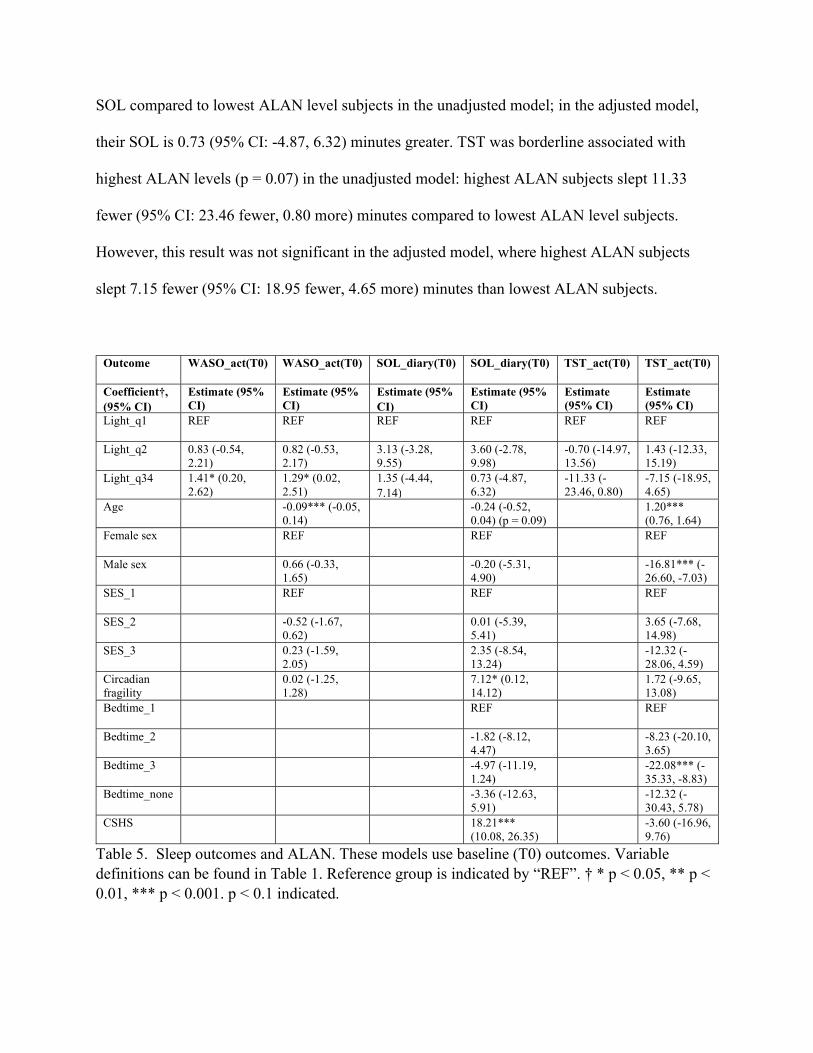
Table 5 shows the regression results for baseline sleep outcomes and ALAN. WASO was
significantly associated with above median values of ALAN (>16.76 nanoWatts/cm2/sr) in the
unadjusted and adjusted models compared to ALAN in the first quartile (9.52
nanoWatts/cm2/sr). Figure 4 displays WASO and ALAN values at baseline. Subjects with
highest ALAN levels save 1.41 (95% CI: 0.20, 2.62) greater percentage points of sleep
disruption in the unadjusted model compared to subjects with lowest ALAN levels. In the
adjusted model, this result is attenuated slightly to 1.29 (95% CI: 0.02, 2.51) greater percentage
points of WASO. Highest ALAN level subjects had 1.35 (95% CI: -4.44, 7.14) more minutes of
SOL compared to lowest ALAN level subjects in the unadjusted model; in the adjusted model,
their SOL is 0.73 (95% CI: -4.87, 6.32) minutes greater. TST was borderline associated with
highest ALAN levels (p = 0.07) in the unadjusted model: highest ALAN subjects slept 11.33
fewer (95% CI: 23.46 fewer, 0.80 more) minutes compared to lowest ALAN level subjects.
However, this result was not significant in the adjusted model, where highest ALAN subjects
slept 7.15 fewer (95% CI: 18.95 fewer, 4.65 more) minutes than lowest ALAN subjects.
Outcome WASO_act(T0) WASO_act(T0) SOL_diary(T0) SOL_diary(T0) TST_act(T0) TST_act(T0)
Coefficient†, (95% CI)
Estimate (95% CI)
Estimate (95% CI)
Estimate (95% CI)
Estimate (95% CI)
Estimate (95% CI)
Estimate (95% CI)
Light_q1 REF REF REF REF REF REF
Light_q2 0.83 (-0.54, 2.21)
0.82 (-0.53, 2.17)
3.13 (-3.28, 9.55)
3.60 (-2.78, 9.98)
-0.70 (-14.97, 13.56)
1.43 (-12.33, 15.19)
Light_q34 1.41* (0.20, 2.62)
1.29* (0.02, 2.51)
1.35 (-4.44, 7.14)
0.73 (-4.87, 6.32)
-11.33 (-23.46, 0.80)
-7.15 (-18.95, 4.65)
Age -0.09*** (-0.05, 0.14)
-0.24 (-0.52, 0.04) (p = 0.09)
1.20*** (0.76, 1.64)
Female sex REF REF REF
Male sex 0.66 (-0.33, 1.65)
-0.20 (-5.31, 4.90)
-16.81*** (-26.60, -7.03)
SES_1 REF REF REF
SES_2 -0.52 (-1.67, 0.62)
0.01 (-5.39, 5.41)
3.65 (-7.68, 14.98)
SES_3 0.23 (-1.59, 2.05)
2.35 (-8.54, 13.24)
-12.32 (-28.06, 4.59)
Circadian fragility
0.02 (-1.25, 1.28)
7.12* (0.12, 14.12)
1.72 (-9.65, 13.08)
Bedtime_1 REF REF
Bedtime_2 -1.82 (-8.12, 4.47)
-8.23 (-20.10, 3.65)
Bedtime_3 -4.97 (-11.19, 1.24)
-22.08*** (-35.33, -8.83)
Bedtime_none -3.36 (-12.63, 5.91)
-12.32 (-30.43, 5.78)
CSHS 18.21*** (10.08, 26.35)
-3.60 (-16.96, 9.76)
Table 5. Sleep outcomes and ALAN. These models use baseline (T0) outcomes. Variable definitions can be found in Table 1. Reference group is indicated by “REF”. † * p < 0.05, ** p < 0.01, *** p < 0.001. p < 0.1 indicated.
Figure 4. Plot of WASO(T0) and ALAN.
Transportation noise was not significantly associated with sleep outcomes at three months into
intervention, nor were there statistically significant interactions between noise and intervention
arm (see Table 6). Higher transportation noise appeared to hamper the effect of the intervention;
in any case, confidence intervals were broad and p values were high (above 0.3) for the
intervention term. Higher transportation noise appeared to decrease the beneficial impact of the
intervention on SOL by 2.70 (95% CI: -4.03, 9.43) minutes in the unadjusted model and by 1.86
(95% CI: -5.03, 8.75) minutes in the adjusted model. Higher transportation noise appeared to
decrease the beneficial impact of the intervention on TST by 5.64 (95% CI: -10.30, 21.58)
minutes TST in the unadjusted model and by 8.17 (95% CI: -8.54, 24.89) minutes TST in the
adjusted model.
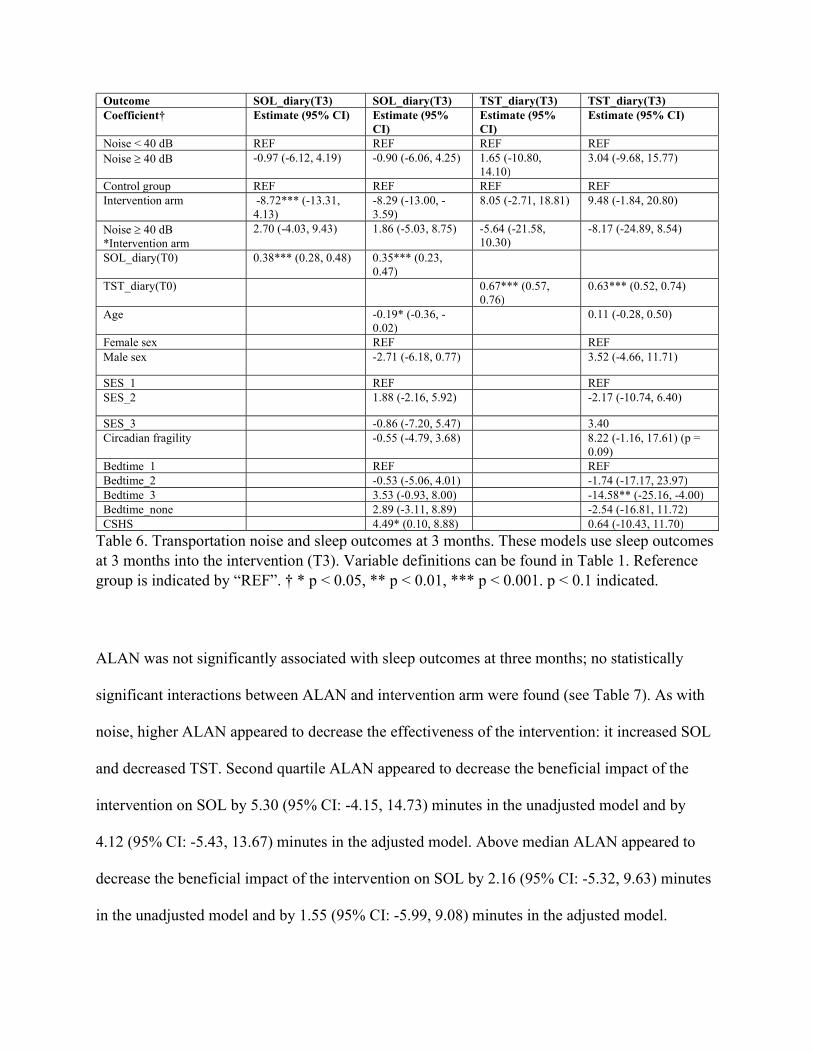
Table 6. Transportation noise and sleep outcomes at 3 months. These models use sleep outcomes at 3 months into the intervention (T3). Variable definitions can be found in Table 1. Reference group is indicated by “REF”. † * p < 0.05, ** p < 0.01, *** p < 0.001. p < 0.1 indicated.
ALAN was not significantly associated with sleep outcomes at three months; no statistically
significant interactions between ALAN and intervention arm were found (see Table 7). As with
noise, higher ALAN appeared to decrease the effectiveness of the intervention: it increased SOL
and decreased TST. Second quartile ALAN appeared to decrease the beneficial impact of the
intervention on SOL by 5.30 (95% CI: -4.15, 14.73) minutes in the unadjusted model and by
4.12 (95% CI: -5.43, 13.67) minutes in the adjusted model. Above median ALAN appeared to
decrease the beneficial impact of the intervention on SOL by 2.16 (95% CI: -5.32, 9.63) minutes
in the unadjusted model and by 1.55 (95% CI: -5.99, 9.08) minutes in the adjusted model.
Outcome SOL_diary(T3) SOL_diary(T3) TST_diary(T3) TST_diary(T3) Coefficient† Estimate (95% CI) Estimate (95%
CI) Estimate (95% CI)
Estimate (95% CI)
Noise < 40 dB REF REF REF REF Noise 40 dB -0.97 (-6.12, 4.19) -0.90 (-6.06, 4.25) 1.65 (-10.80,
14.10) 3.04 (-9.68, 15.77)
Control group REF REF REF REF Intervention arm -8.72*** (-13.31,
4.13) -8.29 (-13.00, -3.59)
8.05 (-2.71, 18.81) 9.48 (-1.84, 20.80)
Noise 40 dB *Intervention arm
2.70 (-4.03, 9.43) 1.86 (-5.03, 8.75) -5.64 (-21.58, 10.30)
-8.17 (-24.89, 8.54)
SOL_diary(T0) 0.38*** (0.28, 0.48) 0.35*** (0.23, 0.47)
TST_diary(T0) 0.67*** (0.57, 0.76)
0.63*** (0.52, 0.74)
Age -0.19* (-0.36, -0.02)
0.11 (-0.28, 0.50)
Female sex REF REF Male sex -2.71 (-6.18, 0.77) 3.52 (-4.66, 11.71)
SES_1 REF REF SES_2 1.88 (-2.16, 5.92) -2.17 (-10.74, 6.40)
SES_3 -0.86 (-7.20, 5.47) 3.40 Circadian fragility -0.55 (-4.79, 3.68) 8.22 (-1.16, 17.61) (p =
0.09) Bedtime_1 REF REF Bedtime_2 -0.53 (-5.06, 4.01) -1.74 (-17.17, 23.97) Bedtime_3 3.53 (-0.93, 8.00) -14.58** (-25.16, -4.00) Bedtime_none 2.89 (-3.11, 8.89) -2.54 (-16.81, 11.72) CSHS 4.49* (0.10, 8.88) 0.64 (-10.43, 11.70)
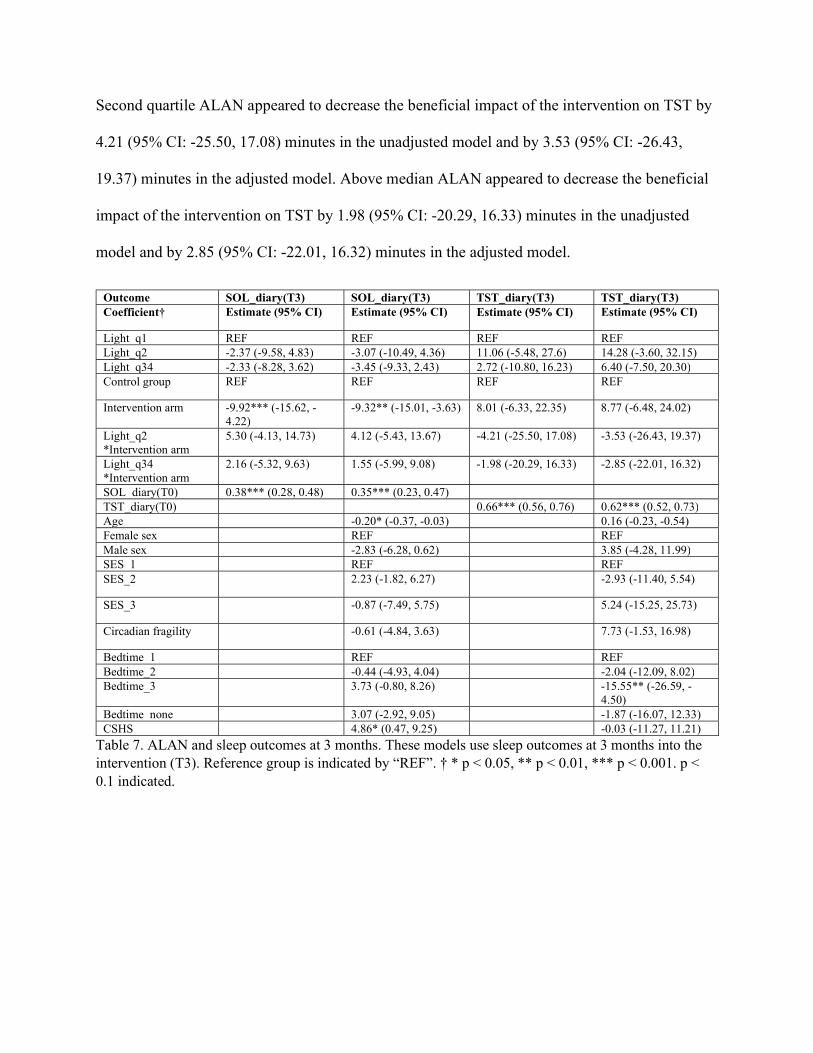
Second quartile ALAN appeared to decrease the beneficial impact of the intervention on TST by
4.21 (95% CI: -25.50, 17.08) minutes in the unadjusted model and by 3.53 (95% CI: -26.43,
19.37) minutes in the adjusted model. Above median ALAN appeared to decrease the beneficial
impact of the intervention on TST by 1.98 (95% CI: -20.29, 16.33) minutes in the unadjusted
model and by 2.85 (95% CI: -22.01, 16.32) minutes in the adjusted model.
Outcome SOL_diary(T3) SOL_diary(T3) TST_diary(T3) TST_diary(T3) Coefficient† Estimate (95% CI) Estimate (95% CI) Estimate (95% CI) Estimate (95% CI)
Light_q1 REF REF REF REF Light_q2 -2.37 (-9.58, 4.83) -3.07 (-10.49, 4.36) 11.06 (-5.48, 27.6) 14.28 (-3.60, 32.15) Light_q34 -2.33 (-8.28, 3.62) -3.45 (-9.33, 2.43) 2.72 (-10.80, 16.23) 6.40 (-7.50, 20.30) Control group REF REF REF REF
Intervention arm -9.92*** (-15.62, -4.22)
-9.32** (-15.01, -3.63) 8.01 (-6.33, 22.35) 8.77 (-6.48, 24.02)
Light_q2 *Intervention arm
5.30 (-4.13, 14.73) 4.12 (-5.43, 13.67) -4.21 (-25.50, 17.08) -3.53 (-26.43, 19.37)
Light_q34 *Intervention arm
2.16 (-5.32, 9.63) 1.55 (-5.99, 9.08) -1.98 (-20.29, 16.33) -2.85 (-22.01, 16.32)
SOL_diary(T0) 0.38*** (0.28, 0.48) 0.35*** (0.23, 0.47) TST_diary(T0) 0.66*** (0.56, 0.76) 0.62*** (0.52, 0.73) Age -0.20* (-0.37, -0.03) 0.16 (-0.23, -0.54) Female sex REF REF Male sex -2.83 (-6.28, 0.62) 3.85 (-4.28, 11.99) SES_1 REF REF SES_2 2.23 (-1.82, 6.27) -2.93 (-11.40, 5.54)
SES_3 -0.87 (-7.49, 5.75) 5.24 (-15.25, 25.73)
Circadian fragility -0.61 (-4.84, 3.63) 7.73 (-1.53, 16.98)
Bedtime_1 REF REF Bedtime_2 -0.44 (-4.93, 4.04) -2.04 (-12.09, 8.02) Bedtime_3 3.73 (-0.80, 8.26) -15.55** (-26.59, -
4.50) Bedtime_none 3.07 (-2.92, 9.05) -1.87 (-16.07, 12.33) CSHS 4.86* (0.47, 9.25) -0.03 (-11.27, 11.21)
Table 7. ALAN and sleep outcomes at 3 months. These models use sleep outcomes at 3 months into the intervention (T3). Reference group is indicated by “REF”. † * p < 0.05, ** p < 0.01, *** p < 0.001. p < 0.1 indicated.
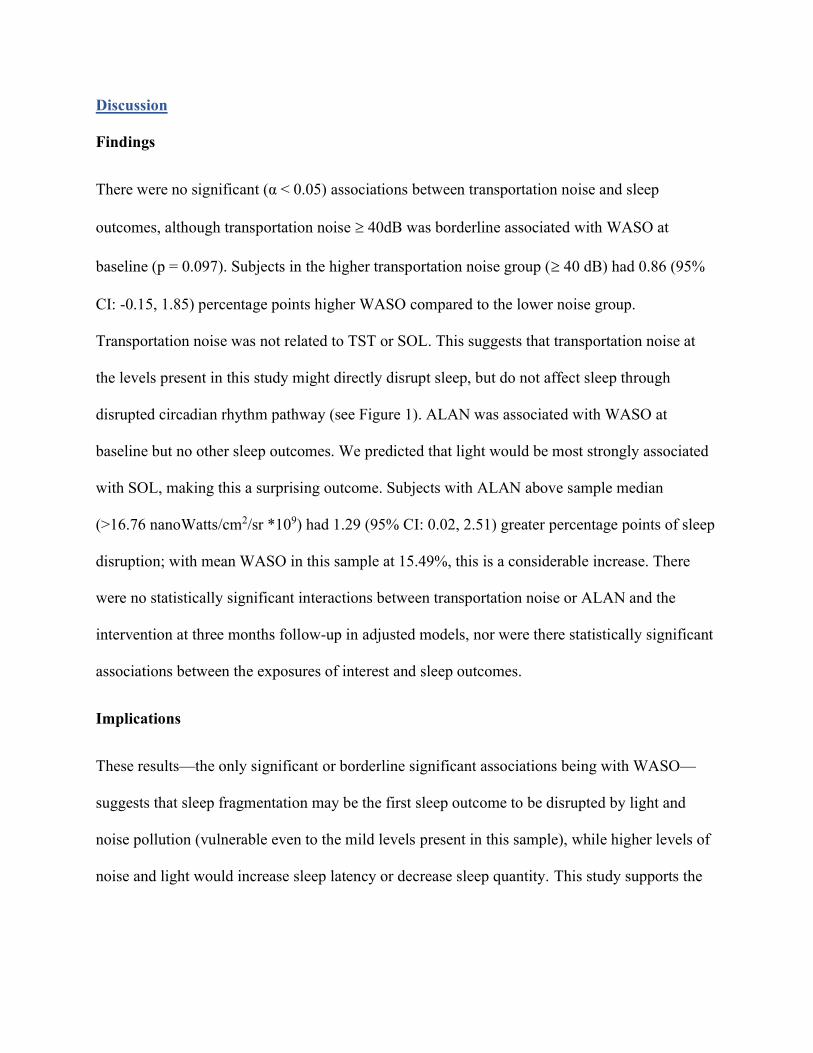
Discussion
Findings
There were no significant (α < 0.05) associations between transportation noise and sleep
outcomes, although transportation noise 40dB was borderline associated with WASO at
baseline (p = 0.097). Subjects in the higher transportation noise group ( 40 dB) had 0.86 (95%
CI: -0.15, 1.85) percentage points higher WASO compared to the lower noise group.
Transportation noise was not related to TST or SOL. This suggests that transportation noise at
the levels present in this study might directly disrupt sleep, but do not affect sleep through
disrupted circadian rhythm pathway (see Figure 1). ALAN was associated with WASO at
baseline but no other sleep outcomes. We predicted that light would be most strongly associated
with SOL, making this a surprising outcome. Subjects with ALAN above sample median
(>16.76 nanoWatts/cm2/sr *109) had 1.29 (95% CI: 0.02, 2.51) greater percentage points of sleep
disruption; with mean WASO in this sample at 15.49%, this is a considerable increase. There
were no statistically significant interactions between transportation noise or ALAN and the
intervention at three months follow-up in adjusted models, nor were there statistically significant
associations between the exposures of interest and sleep outcomes.
Implications
These results—the only significant or borderline significant associations being with WASO—
suggests that sleep fragmentation may be the first sleep outcome to be disrupted by light and
noise pollution (vulnerable even to the mild levels present in this sample), while higher levels of
noise and light would increase sleep latency or decrease sleep quantity. This study supports the
need for policies that limit ALAN (to 16 nanoWatts/cm2/sr *109) where children live to limit
sleep disruption and fragmentation induced by ALAN.
Limitations & Future Research
A major limitation of this study is that individual exposure to light and noise pollution is
unknown. While most noise pollution is likely from transportation, the data from the US DOT
Noise Map leaves many unknowns regarding noise exposure. A child might have noisy
neighbors or siblings, or live close to banging trash cans. We utilized addresses that families
provided for follow-up to find noise and ALAN values, but it is unknown how long they had
lived there, or whether they moved after the study began. ALAN values averaged over 2015 and
2016 were used, and therefore it is possible that variation (including seasonal variation) in
ALAN values and exposure occurred. Furthermore, many intervening variables might modify a
child’s individual exposure to light or transportation noise: presence, size, and proximity of
windows to street lights, proximity of the child’s bedroom to the building façade nearest the
road, how sound-insulated the residence is, and any measures the family may have taken to
decrease exposure. Future studies should elucidate the connections between ecological
ALAN/noise, individual exposure, and sleep outcomes. Furthermore, studies should collect
information regarding the quality of these exposures: light color, light and noise intermittentness,
timing of exposure to light and noise, and light and noise maximums.
This sample had very mild transportation noise and ALAN levels, which likely contributed to the
many null results. Of the 343 subjects, 122 live at locations with transportation noise < 35 dB,
while only 15 subjects live at locations with transportation noise > 55 dB. The maximum value is
62.10 dB, which is comparable to the noise level of a normal conversation. The mean ALAN
value in this sample was 18.72 nanoWatts/cm2/sr *109, which is comparable to ALAN levels in
suburban residential or rural center settings. Maximum ALAN was 90.81 nanoWatts/cm2/sr *109,
which is somewhat darker than small urban centers (downtown Tacoma, 125.00
nanoWatts/cm2/sr *109), but far darker than large urban centers (Westlake Park in downtown
Seattle is 222.60 nanoWatts/cm2/sr *109).Future studies should recruit a study sample with a
wide range of ecological ALAN and noise values.
Another major limitation of this study is generalizability. This study used a sample of preschool
aged children with sleep problems. The families enrolled in this study tended to be higher
income and more educated (62% with > $100,000 annual family income, 84% with at least a
bachelor’s degree) than the general US population. Future research should investigate
associations between noise/light and sleep outcomes using a more representative sample for
more generalizable results.
Conclusion
In this study, we found that higher levels of ALAN (> 16.76 nanoWatts/cm2/sr *109) were
associated with increased sleep disruption (1.29 (95% CI: 0.02, 2.51) additional percentage
points WASO). This finding supports the needs for limitations on ALAN to preserve sleep
quality and therefore health and wellbeing. Future studies on environmental noise and light
exposure and sleep in should recruit representative samples of young children with a wide range
of environmental noise and light levels; they should take individual exposure and the qualities of
noise and light into account.
References 1. Banks S, Dinges DF. Behavioral and physiological consequences of sleep restriction. Journal of clinical sleep medicine : JCSM : official publication of the American Academy of Sleep Medicine. 2007;3(5):519. 2. Watson NF, Badr MS, Belenky G, Bliwise DL, Buxton OM, Buysse D, Dinges DF, Gangwisch J, Grandner MA, Kushida C, Malhotra RK, Martin JL, Patel SR, Quan SF, Tasali E. Joint Consensus Statement of the American Academy of Sleep Medicine and Sleep Research Society on the Recommended Amount of Sleep for a Healthy Adult: Methodology and Discussion. Journal of clinical sleep medicine : JCSM : official publication of the American Academy of Sleep Medicine. 2015;11(8):931. doi: 10.5664/jcsm.4950. 3. Xie L, Kang H, Xu Q, Chen MJ, Liao Y, Thiyagarajan M, O'Donnell J, Christensen DJ, Nicholson C, Iliff JJ, Takano T, Deane R, Nedergaard M. Sleep drives metabolite clearance from the adult brain. Science (New York, NY). 2013;342(6156):373. doi: 10.1126/science.1241224. 4. Wang G, Grone B, Colas D, Appelbaum L, Mourrain P. Synaptic plasticity in sleep: learning, homeostasis and disease. Trends in Neurosciences. 2011:452. 5. Goel N, Rao H, Durmer J, Dinges D. Neurocognitive Consequences of Sleep Deprivation. Semin Neurol. 2009;29(4):320-39. doi: 10.1055/s-0029-1237117. 6. Harrison Y, Horne JA. The Impact of Sleep Deprivation on Decision Making: A Review. Journal of Experimental Psychology: Applied. 2000;6(3):236-49. doi: 10.1037/1076-898X.6.3.236. 7. Van Dongen HPA, Maislin G, Mullington JM, Dinges DF. The cumulative cost of additional wakefulness: dose-response effects on neurobehavioral functions and sleep physiology from chronic sleep restriction and total sleep deprivation. Sleep. 2003;26(2):117. doi: 10.1093/sleep/26.2.117. 8. Spiegel K, Leproult R, Van Cauter E. Impact of sleep debt on metabolic and endocrine function. The Lancet. 1999;354(9188):1435-9. doi: 10.1016/S0140-6736(99)01376-8. 9. Irwin MR, Olmstead R, Carroll JE. Sleep Disturbance, Sleep Duration, and Inflammation: A Systematic Review and Meta-Analysis of Cohort Studies and Experimental Sleep Deprivation. Biological Psychiatry. 2016;80(1):40-52. doi: 10.1016/j.biopsych.2015.05.014. 10. Kato M, Phillips BG, Sigurdsson G, Narkiewicz K, Pesek CA, Somers VK. Effects of sleep deprivation on neural circulatory control. Hypertension (Dallas, Tex : 1979). 2000;35(5):1173. doi: 10.1161/01.HYP.35.5.1173. 11. Tochikubo O, Ikeda A, Miyajima E, Ishii M. Effects of insufficient sleep on bled pressure monitored by a new multibiomedical recorder. Hypertension. 1996;27(6):1318-24. doi: 10.1161/01.HYP.27.6.1318. 12. Lange T, Perras B, Fehm HL, Born J. Sleep enhances the human antibody response to hepatitis A vaccination. Psychosomatic medicine. 2003;65(5):831. doi: 10.1097/01.PSY.0000091382.61178.F1. 13. Spiegel K, Sheridan JF, Van Cauter E. Effect of Sleep Deprivation on Response to Immunizaton. JAMA. 2002;288(12):1471-2. doi: 10.1001/jama.288.12.1469. 14. Lange T, Dimitrov S, Bollinger T, Diekelmann S, Born J. Sleep after vaccination boosts immunological memory. Journal of immunology (Baltimore, Md : 1950). 2011;187(1):283. doi: 10.4049/jimmunol.1100015.
15. Dew MA, Hoch CC, Buysse DJ, Monk TH, Begley AE, Houck PR, Hall M, Kupfer DJ, Reynolds CF. Healthy older adults' sleep predicts all-cause mortality at 4 to 19 years of follow-up. Psychosomatic medicine. 2003;65(1):63. doi: 10.1097/01.PSY.0000039756.23250.7C. 16. Gallicchio L, Kalesan B. Sleep duration and mortality: a systematic review and meta‐analysis. Journal of Sleep Research. 2009;18(2):148-58. doi: 10.1111/j.1365-2869.2008.00732.x. 17. Chaput JP, Gray CE, Poitras V, Carson V, Gruber R, Birken CS, Maclean J, Aubert S, Sampson M, Tremblay MS. Systematic review of the relationships between sleep duration and health indicators in the early years (0-4 years). BMC Public Health2017. 18. Minkel JD, Banks S, Htaik O, Moreta MC, Jones CW, McGlinchey EL, Simpson NS, Dinges DF. Sleep Deprivation and Stressors: Evidence for Elevated Negative Affect in Response to Mild Stressors When Sleep Deprived. Emotion. 2012;12(5):1015-20. doi: 10.1037/a0026871. 19. Reynaud E, Vecchierini M-F, Heude B, Charles M-A, Plancoulaine S. Sleep and its relation to cognition and behaviour in preschool-aged children of the general population: a systematic review. Journal of sleep research. 2018;27(3):e12636. doi: 10.1111/jsr.12636. 20. Scharf RJ, Demmer RT, Silver EJ, Stein REK. Nighttime sleep duration and externalizing behaviors of preschool children. Journal of developmental and behavioral pediatrics : JDBP. 2013;34(6):384. doi: 10.1097/DBP.0b013e31829a7a0d. 21. Dahl RE. The impact of inadequate sleep on children's daytime cognitive function. Seminars in Pediatric Neurology. 1996;3(1):44-50. doi: 10.1016/S1071-9091(96)80028-3. 22. Bathory E, Tomopoulos S. Sleep Regulation, Physiology and Development, Sleep Duration and Patterns, and Sleep Hygiene in Infants, Toddlers, and Preschool-Age Children. Current Problems in Pediatric and Adolescent Health Care. 2017;47(2):29-42. doi: 10.1016/j.cppeds.2016.12.001. 23. Beebe DW. Cognitive, Behavioral, and Functional Consequences of Inadequate Sleep in Children and Adolescents. The Pediatric Clinics of North America. 2011;58(3):649-65. doi: 10.1016/j.pcl.2011.03.002. 24. Paavonen EJ, Räikkönen K, Lahti J, Komsi N, Heinonen K, Pesonen A-K, Järvenpää A-L, Strandberg T, Kajantie E, Porkka-Heiskanen T. Short sleep duration and behavioral symptoms of attention-deficit/hyperactivity disorder in healthy 7- to 8-year-old children. Pediatrics. 2009;123(5):e857. doi: 10.1542/peds.2008-2164. 25. Dewald JF, Meijer AM, Oort FJ, Kerkhof GA, Bögels SM. The influence of sleep quality, sleep duration and sleepiness on school performance in children and adolescents: A meta-analytic review. Sleep Medicine Reviews. 2010;14(3):179-89. doi: 10.1016/j.smrv.2009.10.004. 26. Sadeh A. The Effects of Sleep Restriction and Extension on School-Age Children: What a Difference an Hour Makes. Child development. 2004;74(2):444-55. 27. O'Callaghan FV, Al Mamun A, O'Callaghan M, Clavarino A, Williams GM, Bor W, Heussler H, Najman JM. The link between sleep problems in infancy and early childhood and attention problems at 5 and 14years: Evidence from a birth cohort study. Early Human Development. 2010;86(7):419-24. doi: 10.1016/j.earlhumdev.2010.05.020. 28. Lam P, Hiscock H, Wake M. Outcomes of infant sleep problems: a longitudinal study of sleep, behavior, and maternal well-being. Pediatrics. 2003;111(3):e203-7. doi: 10.1542/peds.111.3.e203. 29. Martin J, Hiscock H, Hardy P, Davey B, Wake M. Adverse associations of infant and child sleep problems and parent health: An Australian population study. Pediatrics. 2007;119(5):947-55. doi: 10.1542/peds.2006-2569.
30. Meltzer LJ, Montgomery-Downs HE. Sleep in the Family. The Pediatric Clinics of North America. 2011;58(3):765-74. doi: 10.1016/j.pcl.2011.03.010. 31. Smedje H, Broman J-E, Hetta J. Sleep disturbances in Swedish pre-school children and their parents. Nordic journal of psychiatry. 1998;52:59-67. 32. Boergers J, Hart C, Owens JA, Streisand R, Spirito A. Child Sleep Disorders: Associations With Parental Sleep Duration and Daytime Sleepiness. Journal of Family Psychology. 2007;21(1):88-94. doi: 10.1037/0893-3200.21.1.88. 33. Meltzer LJ, Mindell JA. Relationship Between Child Sleep Disturbances and Maternal Sleep, Mood, and Parenting Stress: A Pilot Study. Journal of Family Psychology. 2007;21(1):67-73. doi: 10.1037/0893-3200.21.1.67. 34. Johnson D, Billings M, Hale L. Environmental Determinants of Insufficient Sleep and Sleep Disorders: Implications for Population Health. Current Epidemiology Reports. 2018;5(2):61-9. doi: 10.1007/s40471-018-0139-y. 35. Cho Y, Ryu S-H, Lee BR, Kim KH, Lee E, Choi J. Effects of artificial light at night on human health: A literature review of observational and experimental studies applied to exposure assessment. Chronobiology International. 2015;32(9):1294-310. doi: 10.3109/07420528.2015.1073158. 36. Tähkämö L, Partonen T, Pesonen A-K. Systematic review of light exposure impact on human circadian rhythm. Chronobiology international. 2019;36(2):151-70. doi: 10.1080/07420528.2018.1527773. 37. Ohayon MM, Milesi C. Artificial Outdoor Nighttime Lights Associate with Altered Sleep Behavior in the American General Population. Sleep. 2016;39(6):1311-20. doi: 10.5665/sleep.5860. 38. Patel PC. Light pollution and insufficient sleep: Evidence from the United States. American Journal of Human Biology. 2019. doi: 10.1002/ajhb.23300. 39. Akacem LD, Wright KP, Lebourgeois MK. Bedtime and evening light exposure influence circadian timing in preschool-age children: A field study. Neurobiology of Sleep and Circadian Rhythms. 2016;1(2):27-31. doi: 10.1016/j.nbscr.2016.11.002. 40. Akacem LD, Wright KP, Lebourgeois MK. Sensitivity of the circadian system to evening bright light in preschool‐age children. Physiological Reports. 2018;6(5):n/a-n/a. doi: 10.14814/phy2.13617. 41. Higuchi S, Nagafuchi Y, Lee S-I, Harada T. Influence of light at night on melatonin suppression in children. The Journal of clinical endocrinology and metabolism. 2014;99(9):3298. doi: 10.1210/jc.2014-1629. 42. Basner M, Brink M, Elmenhorst E-M. Critical appraisal of methods for the assessment of noise effects on sleep. Noise & Health. 2012;14(61):321-9. doi: 10.4103/1463-1741.104902. 43. Perron S, Plante C, Ragettli MS, Kaiser DJ, Goudreau S, Smargiassi A. Sleep disturbance from road traffic, railways, airplanes and from total environmental noise levels in montreal. International Journal of Environmental Research and Public Health. 2016;13(8). doi: 10.3390/ijerph13080809. 44. Basner M, McGuire S. WHO Environmental Noise Guidelines for the European Region: A Systematic Review on Environmental Noise and Effects on Sleep. Int J Environ Res Public Health. 2018;15(3). doi: 10.3390/ijerph15030519. 45. Halonen JI, Vahtera J, Stansfeld S, Yli-Tuomi T, Salo P, Pentti J, Kivimäki M, Lanki T. Associations between nighttime traffic noise and sleep: The Finnish public sector study. Environmental Health Perspectives. 2012;120(10):1391-6. doi: 10.1289/ehp.1205026.
46. Öhrström E, Hadzibajramovic E, Holmes M, Svensson H. Effects of road traffic noise on sleep: Studies on children and adults. Journal of Environmental Psychology. 2006;26(2):116-26. doi: 10.1016/j.jenvp.2006.06.004. 47. Ising H, Ising M. Chronic cortisol increases in the first half of the night caused by road traffic noise. Noise and Health. 2002;4(16):13-21. 48. Davies HW, Vlaanderen JJ, Henderson SB, Brauer M. Correlation between co-exposures to noise and air pollution from traffic sources. Occupational and Environmental Medicine. 2009;66(5):347. doi: 10.1136/oem.2008.041764. 49. Billings ME, Gold D, Szpiro A, Aaron CP, Jorgensen N, Gassett A, Leary PJ, Kaufman JD, Redline SR. The Association of Ambient Air Pollution with Sleep Apnea: The Multi-Ethnic Study of Atherosclerosis. Annals of the American Thoracic Society. 2019;16(3):363. doi: 10.1513/AnnalsATS.201804-248OC. 50. Cukic V, Lovre V, Dragisic D. Sleep Disorders in Patients with Bronchial Asthma. Materia Socio-Medica. 2011;23(4):235-7. doi: 10.5455/msm.2011.23.235-237. 51. Hansel NN, Romero KM, Pollard SL, Bose S, Psoter KJ, Underhill L, Johnson C, Williams DA, Curriero FC, Breysse P, Koehler K, Checkley W. Ambient Air Pollution Adversely Impacts Various Domains of Asthma Morbidity among Peruvian Children. Annals of the American Thoracic Society. 2018;16(3):448OC. doi: 10.1513/AnnalsATS.201807-448OC. 52. Berglund B, Lindvall T, Schwela DH, World Health Organization Occupational and Environmental Health Team. Guidelines for community noise. 1999. doi: https://apps.who.int/iris/handle/10665/66217. 53. Basner M, Babisch W, Davis A, Brink M, Clark C, Janssen S, Stansfeld S. Auditory and non-auditory effects of noise on health. The Lancet. 2014;383(9925):1325-32. doi: 10.1016/S0140-6736(13)61613-X. 54. van Kempen EEMM, van Kamp I, Stellato RK, Lopez-Barrio I, Haines MM, Nilsson ME, Clark C, Houthuijs D, Brunekreef B, Berglund B, Stansfeld SA. Children's annoyance reactions to aircraft and road traffic noise. The Journal of the Acoustical Society of America. 2009;125(2):895-904. doi: 10.1121/1.3058635. 55. Szalma JL, Hancock PA. Noise Effects on Human Performance: A Meta-Analytic Synthesis. Psychological Bulletin. 2011;137(4):682-707. doi: 10.1037/a0023987. 56. National Research Council (US) and Institute of Medicine (US) Committee on Depression, Parenting Practices, and the Healthy Development of Children. Depression in parents, parenting, and children : opportunities to improve identification, treatment, and prevention. Washington, DC: Washington, DC : National Academies Press; 2009. 57. Shaffer A, Obradović J. Unique Contributions of Emotion Regulation and Executive Functions in Predicting the Quality of Parent–Child Interaction Behaviors. Journal of Family Psychology. 2017;31(2):150-9. doi: 10.1037/fam0000269. 58. Owens JA, Spirito A, McGuinn M, Nobile C. Sleep habits and sleep disturbance in elementary school-aged children. Journal of developmental and behavioral pediatrics : JDBP. 2000;21(1):27. doi: 10.1097/00004703-200002000-00005. 59. Hannan K, Hiscock H. Sleep problems in children. Australian family physician. 2015;44(12):880. 60. Bion V, Lowe AS, Puthucheary Z, Montgomery H. Reducing sound and light exposure to improve sleep on the adult intensive care unit: An inclusive narrative review. Journal of the Intensive Care Society. 2018;19(2):138-46. doi: 10.1177/1751143717740803.
61. Alkahtani M, Alshathri N, Aldraiweesh N, Aljurf L, Aldaej L, Olaish A, Nashwan S, Almeneessier A, BaHammam A. The effect of air conditioner sound on sleep latency, duration, and efficiency in young adults. Annals of Thoracic Medicine. 2019;14(1):69-74. doi: 10.4103/atm.ATM_195_18. 62. Sezici E, Yigit D. Comparison between swinging and playing of white noise among colicky babies: A paired randomised controlled trial. Journal of Clinical Nursing. 2018;27(3-4):593-600. doi: 10.1111/jocn.13928. 63. Earth Observation Group, NOAA National Centers for Environmental Information (NCEI). Version 1 VIIRS Day/Night Band Nighttime Lights. Available from: https://ngdc.noaa.gov/eog/viirs/download_dnb_composites.html. 64. Bureau of Transportation Statistics (BTS), US Department of Transportation. National Transportation Noise Map. Available from https://maps.bts.dot.gov/services/rest/services/Noise/CONUS_ROAD_AND_AVIATION_NOISE_IS_Apr_2018/ImageServer . 65. Meltzer LJ, Montgomery-Downs HE, Insana SP, Walsh CM. Use of actigraphy for assessment in pediatric sleep research. Sleep Medicine Reviews. 2012;16(5):463-75. doi: 10.1016/j.smrv.2011.10.002. 66. Sadeh A. The role and validity of actigraphy in sleep medicine: An update. Sleep Medicine Reviews. 2011;15(4):259-67. doi: 10.1016/j.smrv.2010.10.001. 67. Iwasaki M, Iwata S, Iemura A, Yamashita N, Tomino Y, Anme T, Yamagata Z, Iwata O, Matsuishi T. Utility of Subjective Sleep Assessment Tools for Healthy Preschool Children: A Comparative Study Between Sleep Logs, Questionnaires, and Actigraphy. Journal of Epidemiology. 2010;20(2):143-9. doi: 10.2188/jea.JE20090054. 68. Werner H, Molinari L, Guyer C, Jenni OG. Agreement Rates Between Actigraphy, Diary, and Questionnaire for Children's Sleep Patterns. Archives of Pediatrics & Adolescent Medicine. 2008;162(4):350-8. doi: 10.1001/archpedi.162.4.350. 69. Nelson TD, Lundahl A, Molfese DL, Waford RN, Roman A, Gozal D, Molfese VJ, Ferguson MC. Estimating Child Sleep From Parent Report of Time in Bed: Development and Evaluation of Adjustment Approaches. Journal of Pediatric Psychology. 2014;39(6):624-32. doi: 10.1093/jpepsy/jsu020. 70. Sears CG, Braun JM, Ryan PH, Xu Y, Werner EF, Lanphear BP, Wellenius GA. The association of traffic-related air and noise pollution with maternal blood pressure and hypertensive disorders of pregnancy in the HOME study cohort. Environment International. 2018;121(Pt 1):574-81. doi: 10.1016/j.envint.2018.09.049. 71. Hurtley C, World Health Organization. Regional Office for E. Night noise guidelines for Europe. Copenhagen, Denmark: Copenhagen, Denmark : World Health Organization Europe; 2009. 72. The Office of Economic and Financial Analysis. King County Educational Attainment 2018 [cited 2020]. Available from: https://www.kingcounty.gov/independent/forecasting/King%20County%20Economic%20Indicators/KC%20Educational%20Attainment.aspx. 73. The Office of Economic and Financial Analysis. Household Income in King County 2017 [cited 2020]. Available from: https://www.kingcounty.gov/independent/forecasting/King%20County%20Economic%20Indicators/Household%20Income.aspx.
74. Harsh, Jr., Easley A, Lebourgeois M. A measure of children's sleep hygiene. Sleep. 2002;25:A316-A7. 75. National Center for Environmental Health, CDC. What Noises Cause Hearing Loss? 2019. Available from: https://www.cdc.gov/nceh/hearing_loss/what_noises_cause_hearing_loss.html#.
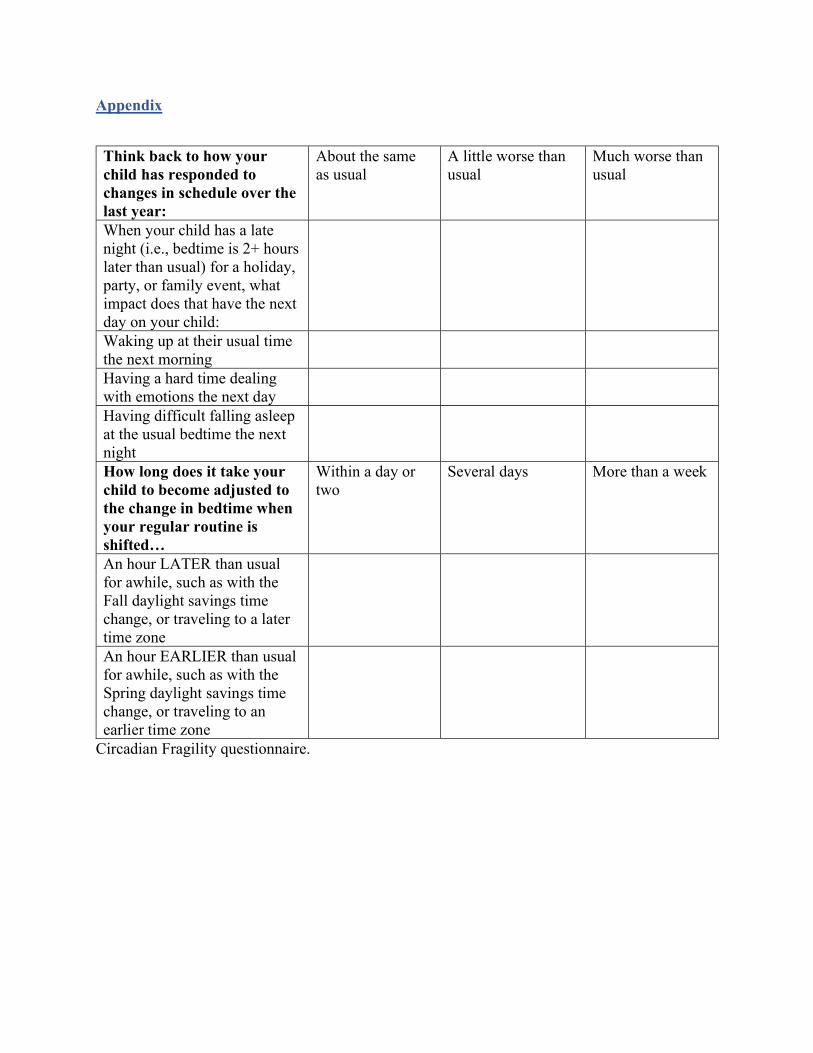
Appendix
Think back to how your child has responded to changes in schedule over the last year:
About the same as usual
A little worse than usual
Much worse than usual
When your child has a late night (i.e., bedtime is 2+ hours later than usual) for a holiday, party, or family event, what impact does that have the next day on your child:
Waking up at their usual time the next morning
Having a hard time dealing with emotions the next day
Having difficult falling asleep at the usual bedtime the next night
How long does it take your child to become adjusted to the change in bedtime when your regular routine is shifted…
Within a day or two
Several days More than a week
An hour LATER than usual for awhile, such as with the Fall daylight savings time change, or traveling to a later time zone
An hour EARLIER than usual for awhile, such as with the Spring daylight savings time change, or traveling to an earlier time zone
Circadian Fragility questionnaire.