Eucalyptus: intelligent infrastructure enabled participatory design studio
Upload
khangminh22Category
view
0download
0
University of Wollongong University of Wollongong
Research Online Research Online
Faculty of Engineering and Information Sciences - Papers: Part B
Faculty of Engineering and Information Sciences
2018
Sensor-enabled Activity Class Recognition in Preschoolers: Hip Sensor-enabled Activity Class Recognition in Preschoolers: Hip
versus Wrist Data versus Wrist Data
Stewart Trost Queensland University of Technology, [email protected]
Dylan P. Cliff University of Wollongong, [email protected]
Matthew Ahmadi Queensland University of Technology
Tuc Nguyen University of Wollongong, [email protected]
M. Hagenbuchner University of Wollongong, [email protected]
Follow this and additional works at: https://ro.uow.edu.au/eispapers1
Part of the Engineering Commons, and the Science and Technology Studies Commons
Recommended Citation Recommended Citation Trost, Stewart; Cliff, Dylan P.; Ahmadi, Matthew; Nguyen, Tuc; and Hagenbuchner, M., "Sensor-enabled Activity Class Recognition in Preschoolers: Hip versus Wrist Data" (2018). Faculty of Engineering and Information Sciences - Papers: Part B. 1276. https://ro.uow.edu.au/eispapers1/1276
Research Online is the open access institutional repository for the University of Wollongong. For further information contact the UOW Library: [email protected]

Sensor-enabled Activity Class Recognition in Preschoolers: Hip versus Wrist Data Sensor-enabled Activity Class Recognition in Preschoolers: Hip versus Wrist Data
Disciplines Disciplines Engineering | Science and Technology Studies
Publication Details Publication Details Trost, S. G., Cliff, D. P., Ahmadi, M. N., Tuc, N. Van. & Hagenbuchner, M. (2018). Sensor-enabled Activity Class Recognition in Preschoolers: Hip versus Wrist Data. Medicine And Science In Sports And Exercise, 50 (3), 634-641.
This journal article is available at Research Online: https://ro.uow.edu.au/eispapers1/1276

Sensor-enabled activity class recognition in preschoolers: Hip versus wrist data 1
Stewart Trost, PhD 1 2
Dylan Cliff, PhD2 3
Matthew Ahmadi, MS1 4
Nguyen Van Tuc, BSc3 5
Markus Hagenbuchner, PhD3 6
7
1. Institute of Health and Biomedical Innovation at QLD Centre for Children’s Health 8
Research, School of Exercise and Nutrition Sciences, Queensland University of 9
Technology, Brisbane, Australia 10
2. Faculty of Social Sciences, Early Start Research Institute, University of Wollongong, 11
Australia 12
3. Faculty of Engineering and Information Science, University of Wollongong, Australia 13
14
Corresponding Author: 15
Professor Stewart Trost, PhD 16
Institute of Health and Biomedical Innovation at QLD Centre for Children’s Health Research 17
Level 6, 62 Graham Street 18
South Brisbane, QLD 4101 19
Australia 20
Phone: +61 7 3069 7301 21
Fax: +61 7 3138 3980 22
Email: [email protected] 23
Manuscript (include title page, abstract, text, references)

Abstract 24
Purpose: Pattern recognition approaches to accelerometer data processing have emerged as 25
viable alternatives to cut-point methods. However, few studies have explored the validity of 26
pattern recognition approaches in pre-schoolers; and none have compared supervised learning 27
algorithms trained on hip and wrist data. To develop, test, and compare activity class 28
recognition algorithms trained on hip, wrist, and combined hip and wrist accelerometer data in 29
pre-schoolers. Methods: 11 children aged 3 - 6 y (mean age 4.8 ± 0.9 y) completed 12 30
developmentally appropriate PA trials while wearing an ActiGraph GT3X+ accelerometer on 31
the right hip and non-dominant wrist. PA trials were categorised as sedentary (SED), light 32
activity games (LG), moderate-to-vigorous games (MVG), walking (WA), and running (RU). 33
Random forest (RF) and support vector machine (SVM) classifiers were trained using time 34
and frequency domain features from the vector magnitude of the raw signal. Features were 35
extracted from 15 s non-overlapping windows. Classifier performance was evaluated using 36
leave-one-out-cross-validation. Results: Cross-validation accuracy for the hip, wrist, and 37
combine hip and wrist RF models was 0.80 (95% CI:0.79 - 0.82), 0.78 (95% CI:0.77-0.80), 38
0.82 (95% CI:0.80 - 0.83), respectively. Accuracy for Hact, Wact, and HWact SVM models 39
was 0.81 (95% CI:0.80 - 0.83), 0.80 (95% CI:0.79-0.80), 0.85 (95% CI:0.84 - 0.86), 40
respectively. Recognition accuracy was consistently excellent for SED (> 90%), moderate for 41
LG, MVG, and RU (69-79%), and modest for WA (61-71%). Conclusions: Machine learning 42
algorithms such as RF and SVM are useful for predicting PA class from accelerometer data 43
collected in preschool children. While classifiers trained on hip or wrist data provided 44
acceptable recognition accuracy, the combination of hip and wrist accelerometer delivered 45
better performance. 46
Key Words: Objective measurement, Physical activity, Accelerometer, Machine Learning 47

Introduction 48
Accelerometer-based motion sensors are viewed as best practice methodology for 49
measuring physical activity in children aged 0 to 5 years (1, 2). However, to date, the research 50
potential of wearable motion sensors has been under-utilized, with data analysis restricted to 51
the use of intensity-based “cut-points” or regression-based prediction models with significant 52
measurement error (3–5). Pattern recognition methodologies, such as machine learning 53
approaches, provide an opportunity to substantially improve accelerometer-based assessments 54
of physical activity in children under five. However, the adoption of machine learning methods 55
by movement scientists has been slow because they are not as easily implemented as cut-point 56
methods. 57
To date, only three studies have developed and tested machine learning activity 58
recognition models for children under five. Zhao et al. (6) evaluated a series of logistic 59
regression and support vector machine classifiers for recognition of five activity classes in 60
preschool-aged children (rest, quiet play, low active play, moderately active play, and very 61
active play). Using proprietary outputs (60 s epoch) from a hip-mounted ActiGraph GT3X+ 62
accelerometer as features, the best performing model achieved an overall 10-fold cross-63
validation accuracy of 79.8%. Nam and Park (7) developed a prototype activity recognition 64
system for infants and toddlers using data from a single waist-mounted accelerometer. A range 65
of time and frequency domain features were inputted into seven different learning algorithms, 66
including naïve Bayes classifier, Bayesian Network, support vector machines, decision tree, k-67
nearest neighbour, multi-layer perceptron, and logistic regression. Ten-fold cross-validation 68
accuracy for 11 different activities, including crawling, climbing up, climbing down, and 69
walking, ranged from 73.0% to 88.3%. Most recently, Hagenbucher and colleagues (8) 70
developed and tested a Deep Learning Ensemble Network (DLEN) for recognition of five basic 71
activities classes in preschool-aged children (sedentary, light activities and games, moderate-72

to-vigorous intensity activities and games, walking, and running). Using simple statistical 73
features in ActiGraph (hip-mounted) proprietary counts as inputs (10th, 25th, 50th, 75th, and 90th 74
percentiles and lag-one autocorrelation), the DLEN achieved an overall classification accuracy 75
of 82.6%. In comparison, a standard feed-forward multi-layer perceptron achieved an overall 76
accuracy of 69.7%. 77
Although the aforementioned studies support the utility of activity recognition using 78
machine learning methods in young children, it is important to note that the classifiers 79
developed in all three studies were trained using features from a single accelerometer worn on 80
the hip or waist. No previous study involving preschool-aged children has developed and tested 81
activity recognition algorithms for wrist-worn accelerometer data. Validated activity 82
recognition algorithms for the wrist are needed because wrist-mounted accelerometers are more 83
convenient to wear, thus reducing the likelihood of missing data due to non-wear (9). More 84
importantly, the wrist placement allows researchers and clinicians to monitor all movement 85
behaviours (sleep, sedentary behaviours, light activity, and MVPA) over a complete 24-h cycle 86
(10). Additionally, studies conducted in school-aged children (11) as well as adults (12–14), 87
suggest that activity recognition algorithms trained on accelerometer data from multiple body 88
locations (e.g., the combination of wrist and ankle) achieve greater accuracy than those based 89
on a single accelerometer. However, to date, the performance of activity classifiers based on 90
multiple sensing locations has not been investigated in preschool-aged children. 91
To address these gaps in the research literature, the purpose of this study was to develop, 92
test, and compare activity class recognition algorithms trained on raw accelerometer signal 93
from the wrist, hip, and the combination of wrist and hip in preschool-aged children. To 94
examine the utility of machine learning approaches relative to conventional cut-point 95
methods, we derived count cut-points for the classification of physical activity intensity 96

(sedentary, light, and MVPA) and compared their performance to the newly developed 97
activity class recognition models. 98
Methods 99
Participants 100
Eleven children aged 3 to 6 years (mean age = 4.8 ± 0.87 y; 55% girls; mean BMI = 101
15.9 ± 1.0 kg/m2; 9.1% overweight) participated in the study. Parent consent was obtained 102
prior to participation. The study was approved by the University Research Ethics Committee. 103
Experimental procedures 104
Participants completed 12 semi-structured activity trials over two laboratory visits 105
scheduled within a 3-week period. Participants undertook the following six trials at visit 1: 106
watching television sitting on floor being read to, standing making a collage on a wall, walking 107
(walking), playing an active game against an instructor, and completing an obstacle course. 108
The remaining six trials were completed at visit 2: sitting on a chair playing a computer tablet 109
game, sitting on floor playing quietly with toys, treasure hunt, cleaning up toys, bicycle riding, 110
and running. Each trial was completed for 4–5 min. A detailed description of the activity trials 111
can be found elsewhere (8). Based on energy cost and movement pattern (8,15), activity trials 112
were categorised into five distinct physical activity classes – sedentary activities (TV, reading, 113
tablet, and quiet play), light activities and games (art, treasure hunt, and clean-up), moderate to 114
vigorous activities (active game, obstacle course, and bicycle), walking, and running. The five 115
activity classes and the average MET level of the 11 activity trials are displayed in Table 1. 116
--Table 1 near here-- 117
During each trial, participants wore an ActiGraph GT3X+ (ActiGraph Corporation, 118
Pensacola FL) on the right hip and non-dominant wrist. Data were collected at 100 Hz. ActiLife 119
software (Version 6.8.1) was used to construct date-time stamped files comprising raw 120
acceleration signal in the vertical (axis 1), medial-lateral (axis 2), and anterior-posterior (axis 121

3) planes. Research comparing accelerometer output from the dominant and non-dominant 122
wrist has shown that the choice to wear the accelerometer on the non-dominant or dominant 123
wrist has no impact on results (16). The current study adopted the non-dominant wrist location 124
to be consistent with the approach used by sleep researchers who use accelerometers placed on 125
the non-dominant wrist to monitor sleep duration and quality (17). 126
Data processing and feature extraction 127
For each sensor location, accelerometer signal from each axis was transformed into a 128
single dimension vector magnitude (VM) using the equation [√(𝑥2 + 𝑦2 + 𝑧2)]. VM instances 129
recorded during minutes 2 to 4 were parsed and segmented into non-overlapping 15 sec 130
windows. For each window, 18 time and frequency domain features were extracted. Features 131
were selected on the basis of previous studies (18, 19) and included mean, standard deviation, 132
minimum, maximum, inter-quartile range, percentiles (10th, 25th, 50th, 75th, 95th), coefficient of 133
variation, signal sum, signal power, peak-to-peak amplitude, median crossings, dominant 134
frequency between 0.25 and 5.0 Hz, magnitude of dominant frequency between 0.25 and 5.0 135
Hz, and signal entropy between 0.25 and 5.0 Hz. 136
Model training and evaluation 137
Two widely implemented supervised learning algorithms were used to construct the 138
classifiers – random forest (RF) and support vector machines (SVM). A random forest is an 139
ensemble of decision tree models. Each tree is learned on a bootstrap sample of training data 140
and each node in the tree is split using the best among a randomly selected sample of features. 141
The decisions from each tree are aggregated and a final model prediction is based on majority 142
vote. Support vector machines perform classification tasks by mapping training instances to 143
points in a multidimensional space of features and constructing decision boundaries, called 144
hyperplanes, which maximise the distance or margin between instances of different classes. 145
New observations are mapped to the multidimensional feature space and assigned a class 146

prediction based on which side of the hyperplane it lies. For each supervised learning approach, 147
classification models were trained using features from accelerometer signal collected at the hip, 148
wrist, and combined hip and wrist, thus providing a total of 6 classifiers for evaluation. We 149
chose to implement RF and SVM classifiers because these algorithms have been shown to 150
perform well in activity recognition studies involving other study populations (20–22) and are 151
readily implemented using open source platforms such as R and WEKA. 152
Classification models were trained, tuned, and cross-validated using the “kernlab”, 153
“randomForest” and “caret” packages within R (Version 3.2.2) (23). The R code and data, 154
which includes final trained models, are available on request. The train function within 155
“caret” was used to implement the SVM and random forest algorithms, optimise tuning 156
parameters, and evaluate performance using leave-one-subject-out (LOSO) cross-validation. 157
In LOSO cross-validation, the classification model is trained on data from all of the participants 158
except one, which is “held out” and used as the test dataset. The process is repeated until all 159
participants have served as the test data, and the performance evaluation results are averaged. 160
In the RF models, the number of trees was set at 500. Based on the training data, the 161
number of features randomly sampled at each split was optimised at three. SVM models were 162
configured using a radial basis kernel function, automatic sigma estimation, with the soft 163
margin or cost parameter optimised at 4.0. The cost parameter is a regularisation parameter 164
that adjusts the width of the hyperplane margin and controls the trade-off between over-fitting 165
and under-fitting the data. 166
Model performance was evaluated in terms of overall recognition accuracy, calculated 167
as the percentage of 15-s time windows correctly classified. Agreement between predicted and 168
observed class labels was evaluated by calculating weighted Kappa coefficients. Kappa is a 169
more robust measure than simple percent agreement, since it takes into account the possibility 170
of the agreement occurring by chance. Weighted Kappa also has the advantage of being 171

applicable to multi-class classification scenarios (24). For the interpretation of the Kappa 172
coefficients, we followed the ratings suggested by Landis and Koch (25): poor (0 – 0.2), fair 173
(0.2 – 0.4), moderate (0.4 – 0.6), substantial (0.6 – 0.8), and almost perfect (0.8 – 1.0). 174
Additionally, for each classification model, confusion matrices were generated to summarise 175
classification accuracy in each activity class. 176
Comparison to cut-point methods 177
To compare the performance of the machine learning classifiers to traditional cut-178
point methods, receiver operating characteristic (ROC) curves were used to identify the 179
ActiGraph proprietary count thresholds (vertical axis and vector magnitude) providing 180
the highest sensitivity and specificity for differentiating: 1) SED from LPA and MVPA; 181
and 2) MVPA from SED and LPA. Replicating the methods used to evaluate the machine 182
learning classifiers, performance was evaluated using LOSO cross-validation. One 183
participant was iteratively excluded from each ROC curve analysis. The resultant cut-184
point was then applied to the hold out participant’s data. The process was repeated until 185
all participants had served as hold outs, and the results were aggregated. 186
For direct comparison, the five activity classes predicted by the SVM and RF 187
classifiers during LOSO cross-validation were mapped onto the traditional three 188
intensity categories (SED, LPA, and MVPA). The moderate-to vigorous games, walking, 189
and running activity classes were collapsed into a single MVPA category. The sedentary 190
and light activities and games activity classes were mapped to the SED and LPA 191
categories, respectively. Performance differences between the two methods were 192
evaluated by comparing weighted Kappa coefficients achieved in the respective hold out 193
samples. 194
For these analyses, the intensity level assigned to each activity trial was based on 195
two criteria: 1) the measured average energy cost of the activities as reported by Groβek 196
et al. (15); and 2) an activity rating based on the Children’s Activity Rating Scale (CARS) 197
(26). There is currently a lack of agreement on the definitions of SED, LPA and MVPA 198
in preschool-aged children (27). Therefore, activity trials were classified as SED, LPA, or 199
MVPA based on the preschool-specific metabolic equivalents (MET) thresholds reported 200
by Butte and colleagues (28) (SED/LPA = 1.5 METs, LPA/MPA = 2.8 METs, MPA/VPA 201
3.5 METs) and/or previously reported methods for classifying CARS direct observation 202
scores (1-2 = SED, 3= LPA, 4-5 = MVPA) (27) (see Table 1). 203
Results 204
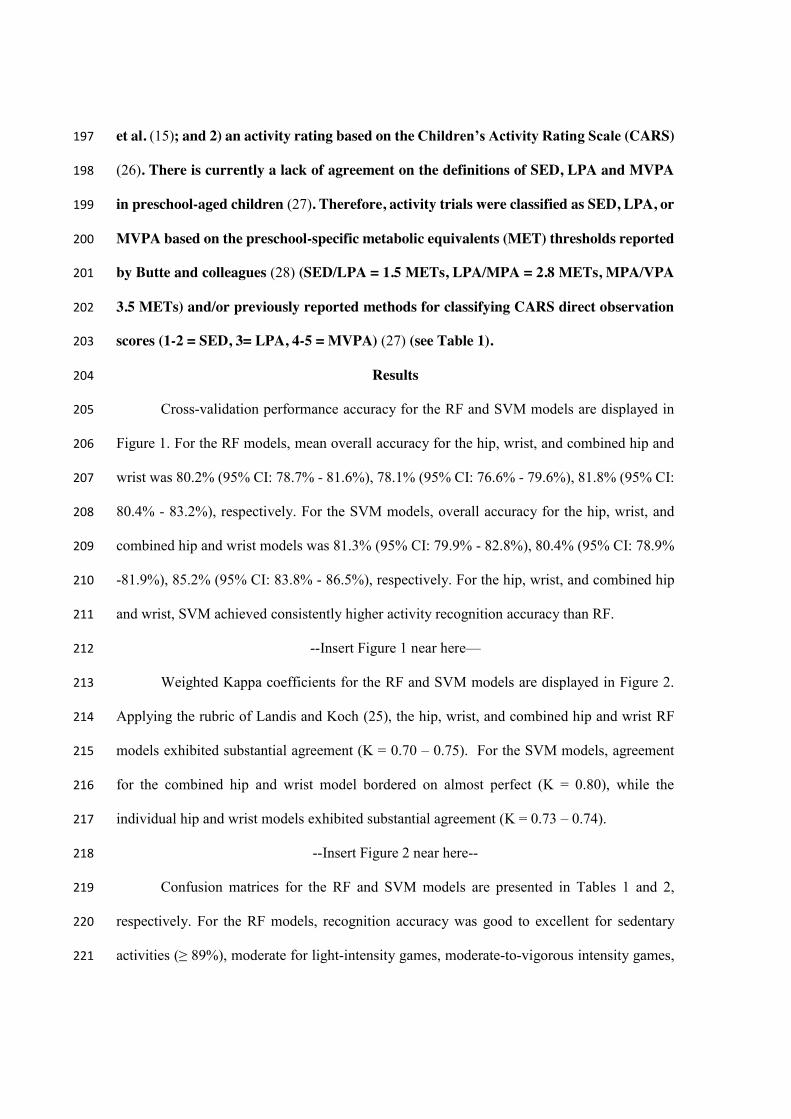
Cross-validation performance accuracy for the RF and SVM models are displayed in 205
Figure 1. For the RF models, mean overall accuracy for the hip, wrist, and combined hip and 206
wrist was 80.2% (95% CI: 78.7% - 81.6%), 78.1% (95% CI: 76.6% - 79.6%), 81.8% (95% CI: 207
80.4% - 83.2%), respectively. For the SVM models, overall accuracy for the hip, wrist, and 208
combined hip and wrist models was 81.3% (95% CI: 79.9% - 82.8%), 80.4% (95% CI: 78.9% 209
-81.9%), 85.2% (95% CI: 83.8% - 86.5%), respectively. For the hip, wrist, and combined hip 210
and wrist, SVM achieved consistently higher activity recognition accuracy than RF. 211
--Insert Figure 1 near here— 212
Weighted Kappa coefficients for the RF and SVM models are displayed in Figure 2. 213
Applying the rubric of Landis and Koch (25), the hip, wrist, and combined hip and wrist RF 214
models exhibited substantial agreement (K = 0.70 – 0.75). For the SVM models, agreement 215
for the combined hip and wrist model bordered on almost perfect (K = 0.80), while the 216
individual hip and wrist models exhibited substantial agreement (K = 0.73 – 0.74). 217
--Insert Figure 2 near here-- 218
Confusion matrices for the RF and SVM models are presented in Tables 1 and 2, 219
respectively. For the RF models, recognition accuracy was good to excellent for sedentary 220
activities (≥ 89%), moderate for light-intensity games, moderate-to-vigorous intensity games, 221
and running (69% - 81%), and modest for walking (61% - 63%). A similar pattern of results 222
emerged for the SVM models. Recognition accuracy was excellent for sedentary activities (≥ 223
90%), moderate to high for light-intensity games, moderate-to-vigorous games, and running 224
(70% - 82%), and modest for walking (64% - 71%). For both RF and SVM, walking was 225
consistently misclassified as light-intensity games, while running was consistently 226
misclassified as moderate-to-vigorous games. Across the five activity classes, the combined 227
hip and wrist model provided higher recognition accuracy than the single location hip and wrist 228
models. This increase was most notable for running, which the combined hip and wrist SVM 229
model increased recognition accuracy by just over 10%. 230
--Insert Tables 2 and 3 near here-- 231
For vertical axis counts recorded at the hip, the optimal cut-points for 232
differentiating SED and MVPA from other intensity levels were 27 and 350 counts per 15 233
s, respectively. ROC area under the curve (ROC-AUC) ranged from 0.93 – 0.94. 234
Sensitivity (Se) ranged from 88.4 – 89.4. Specificity (Sp) ranged from 85.1 – 85.8. For the 235
vector magnitude of counts recorded at the hip, the optimal cut-points for differentiating 236
SED and MVPA from other intensity levels were 263 and 674 counts per 15 s, respectively. 237
ROC-AUC ranged from 0.95 – 0.96. Se ranged from 88.1 – 90.9. Sp ranged from 85.1 – 238
86.2. 239
For vertical axis counts recorded at the wrist, the optimal cut-points for 240
differentiating SED and MVPA from other intensity levels were 349 and 1,284 counts per 241
15 s, respectively. ROC-AUC ranged from 0.85 – 0.95. Se ranged from 61.3 – 80.2. Sp 242
ranged from 90.1 – 93.9. For the vector magnitude of counts recorded at the wrist, the 243
optimal cut-points for differentiating SED and MVPA from other intensity levels were 244
625 and 2,103 counts per 15 s, respectively. ROC-AUC ranged from 0.84 – 0.93. Se ranged 245
from 60.3 – 77.0. Sp ranged from 91.2 – 93.5. 246

Figure 3 displays weighted Kappa coefficients for the RF and SVM models and the 247
newly derived count cut-points for this sample. For classification of physical activity 248
intensity, the RF and SVM models for the hip and the combined hip and wrist exhibited almost 249
perfect agreement (0.81 – 0.84), while the RF and SVM models for the wrist exhibited 250
substantial agreement (0.76 – 0.78). In comparison, the count cut-points derived for this 251
sample exhibited only moderate to substantial agreement, with weighted Kappa statistics 252
ranging from 0.49 to 0.65. 253
--Insert Figure 3 near here-- 254
Discussion 255
The current study developed and tested new machine learning models for the automatic 256
identification of physical activity class in preschool-aged children. RF and SVM activity 257
classifiers trained on acceleration signal from the hip, non-dominant wrist, and the combination 258
of the hip and wrist, achieved acceptable recognition accuracy for a range of physical activity 259
classes routinely performed by young children at home and early childhood education and care 260
settings. Importantly, our classifiers, trained on time and frequency domain features extracted 261
from the raw signal VM over 15 s sliding windows, provided comparable or higher 262
classification accuracy than previously published pre-schooler activity recognition algorithms 263
trained on ActiGraph proprietary counts over 60 s (6, 8). Moreover, when the activity classes 264
were mapped onto traditional physical activity intensity categories, our machine learning 265
models exhibited significantly higher classification accuracy than traditional cut-point 266
methods. 267
Classifiers trained on hip accelerometer data exhibited marginally higher but 268
comparable overall recognition accuracy than those trained on wrist data. This finding is 269
consistent with the results of previous investigations comparing the performance of activity 270
classifiers trained on hip and wrist accelerometer data. Trost et al. (19) compared the activity 271
recognition rates achieved by hip and wrist logistic regression classifiers among children and 272
adolescents aged 7 to 17 years. Overall classification accuracy for the hip (91.0%) was only 273
marginally higher than that achieved by the wrist (88.4%). Among healthy and overweight 274
middle-aged women, RF classifiers trained on hip accelerometer data provided higher overall 275
activity recognition than those trained on wrist-worn data (29). However, the magnitude of the 276
differences was small (< 5%) and unlikely to be of practical significance in field-based studies. 277
That machine-learning classifiers for wrist-worn accelerometer data consistently exhibit 278
comparable performance to classifiers trained on hip data strongly supports the use of wrist-279
mounted accelerometers in epidemiological and intervention studies, where compliance with 280
the monitoring protocol is critical. Moreover, in light of recent public health recommendations 281
addressing movement behaviours, including sleep, over a complete 24 hour cycle (30) the 282
utility of the wrist placement has added significance. 283
The combined hip and wrist classifiers provided higher recognition accuracy than the 284
single sensor models. This finding is consistent with the results of Ruch and colleagues (11) 285
who developed and tested a custom ensemble model (k-nearest neighbour, normal density 286
discriminant function, customized decision tree) for identifying children’s physical activity 287
type from ActiGraph proprietary counts (GT1M). In that study, the addition of wrist activity 288
counts to a model trained on hip accelerometer data, improved the classification accuracy by 289
23 percentage points from 44% to 67%. Our results are also consistent with adult studies in 290
which small but statistically significant improvements in recognition accuracy were achieved 291
when accelerometer features from multiple body locations were fused (13). In the current 292
study, the increase in accuracy achieved by the combined hip and wrist classifier was 293
comparatively modest (2 to 5%). However, when examined at a class level, it was notable that 294
the fusion of features from the hip and wrist locations improved the recognition of running by 295
10 to 12 percentage points. Inspection of the confusion matrices indicated that the improvement 296
in performance was achieved through: 1) a reduction in the misclassification of running as a 297
sedentary activity, as was the case for the wrist classifiers; and 2) a reduction in the 298
misclassification of running as moderate-to-vigorous activities and games, as was the case for 299
the hip classifiers. In light of such findings, the extent to which multiple sensing locations 300
improves physical activity recognition in preschool-aged children warrant further 301
investigation. 302
The newly developed RF and SVM classifiers significantly outperformed traditional 303
cut-points methods for classifying physical activity intensity. After mapping the five activity 304
classes to standard physical activity intensity categories, agreement for the machine learning 305
algorithms ranged from 0.76 to 0.84. In contrast, agreement for cut-points developed for 306
this sample ranged from 0.49 to 0.65. The poorer performance of the cut-points was 307
primarily attributable to the misclassification of light intensity PA as sedentary activity 308
or MVPA, and/or the misclassification of MVPA as light-intensity PA. Confusion 309
matrices for the classification of PA intensity can be found in Supplemental Digital 310
Content 1. Cut-point methods continue to be widely used because they are easy to implement 311
and the results are readily interpretable. However, studies evaluating the performance of 312
previously derived cut-points in independent samples of preschool-aged children indicate that 313
the true intensity of physical activity is misclassified 35% to 45% of the time (3). In the 314
current study, cut-points developed for this sample misclassified the intensity of physical 315
29.8% to 38.5% of the time. This is because the relationship between activity counts and 316
physical activity intensity varies considerably from activity to activity and between individuals 317
completing the same activity (31). Moreover, the cut-points are highly dependent on the 318
activities included in the calibration study, the analytical methods used to determine thresholds, 319
and the physical characteristics of the participant completing the calibration study (2, 32). 320
Accordingly, the development of user-friendly software tools to apply machine learning 321

approaches should be prioritized to support the translation of these approaches into 322
measurement practice. 323
For both the RF and SVM classifiers, recognition accuracy for walking was lower than 324
the other activity modes, ranging from 61% to 71%. This result was largely a function of 325
walking being misclassified as light activities and games. Reassuringly, only a very small 326
proportion of walking instances were misclassified as running. This finding is consistent with 327
the results from our previous study involving pre-schoolers in which a Deep Learning 328
Ensemble Network, trained on ActiGraph proprietary counts over a 60 s window, achieved 329
72.7% recognition accuracy for walking (8). Similar to the pattern observed in the current 330
study, just over 18% of the walking instances were misclassified as light activities and games. 331
That walking was repeatedly confused with light activities and games in both studies was 332
perhaps not overly surprising, considering that the light activities and games class consisted of 333
activities featuring significant periods of walking (cleaning up toys and treasure hunt). In the 334
future, it may be more useful to develop classifiers that only recognize the postures and basic 335
movements that are foundational to the daily activities and play behaviours of young children 336
– lying down, sitting, standing, walking and running. An alternative approach would be to 337
apply clustering methods to identify natural groupings of physical activities performed by 338
young children and develop classifiers to recognize these groupings (6). While the activity 339
targets for prediction will always depend on end user’s needs, more research is needed to 340
identify the physical activity metrics that are most relevant to healthy development in children 341
aged 0 to 5 years. 342
The current study had several strengths. It is the first study to develop and test machine 343
learning activity classifiers for pre-schoolers using features in the raw acceleration signal 344
collected at the wrist, hip, and the combined hip and wrist. Second, classification accuracy was 345
evaluated using a wide variety of free play and daily activity classes performed by preschool-346

aged children. Third, the classifiers were trained using a relatively small feature set which 347
enhanced practicality and reduced processing time. Fourth, the performance of our classifiers 348
was evaluated using leave-one-subject-out cross-validation, which more closely simulates 349
model performance when deployed as an “off the shelf” classifier in independent samples of 350
pre-schoolers. 351
There were, however, several limitations that warrant consideration. First, the activity 352
classifiers were trained and tested using data from controlled activity trials, which may not 353
fully replicate the activity performances of young children in free-living contexts. 354
Consequently, additional research is needed to evaluate performance of our classifiers under 355
free-living conditions. The uptake of machine methods by movement scientists and public 356
health researchers will continue to be low in the absence of empirical research demonstrating 357
that such methods perform well in independent samples performing activity under real-world 358
conditions. Second, features were extracted from sliding windows of 15 s, which may not 359
provide sufficient resolution to capture the sporadic and pulsatile activity patterns of preschool-360
aged children. Accordingly, future studies should explore the utility of simplified activity 361
recognition algorithms that accurately identify a small number of activity classes over shorter 362
time windows (i.e., 5 s windows). Third, to assess the performance of the machine learning 363
classifiers relative to traditional cut-point methods, each activity class was assigned a physical 364
activity intensity rating based the average energy expenditure measured for each activity trial. 365
It is acknowledged that, for some children, the energy cost of performing the individual 366
activities included in each class may have differed from the average level. We are currently 367
undertaking studies to develop and test machine learning models for prediction of energy 368
expenditure in preschool-aged children. Fourth, although our dataset of greater than 2800 fully 369
annotated observations was sufficient to evaluate and compare different machine learning 370
models, the relatively small sample (N=11) may influence the generalisability of the findings. 371

In summary, RF and SVM classifiers trained on accelerometer features from the hip, 372
non-dominant wrist, and combined hip and wrist, can be used to predict physical activity class 373
in preschool-aged children. Although classifiers trained on hip or wrist data provided 374
comparable recognition accuracy, the combination of hip and wrist accelerometer features 375
yielded marginally better performance, particularly for recognition of running. Compared to 376
sample specific cut-points for the hip or wrist, the machine learning algorithms provided 377
higher classification accuracy for absolute physical activity intensity. Our findings add to a 378
growing evidence base supporting the feasibility and accuracy of machine learning activity 379
recognition algorithms in young children. 380

Acknowledgements
Funding for this project was provided by a Australian Research Council Discovery Project
Grant: DP150100116 - Modelling active play in preschool children using machine learning.
Stewart Trost is a member of the ActiGraph Scientific Advisory Board. The authors declare
no conflict of interest. The results of the study are presented clearly, honestly, and without
fabrication, falsification, or inappropriate data manipulation. The results from the present
study do not constitute endorsement by the American College of Sports Medicine

References
1. Cliff DP, Reilly JJ, Okely AD. Methodological considerations in using accelerometers
to assess habitual physical activity in children aged 0-5 years. J Sci Med Sport
2009;12(5):557–67.
2. Trost SG. Measurement of physical activity in children and adolescents. Am J Lifestyle
Med 2007;1(4):299–314.
3. Janssen X, Cliff DP, Reilly JJ, et al. Predictive validity and classification accuracy of
actigraph energy expenditure equations and cut-points in young children. PLoS One
2013;8(11)
4. Trost SG, Way R, Okely AD. Predictive validity of three ActiGraph energy
expenditure equations for children. Med Sci Sports Exerc 2006;38(2):380–7.
5. Trost SG, Loprinzi PD, Moore R, Pfeiffer KA. Comparison of accelerometer cut points
for predicting activity intensity in youth. Med Sci Sports Exerc 2011;43(7):1360–8.
6. Zhao W, Adolph AL, Puyau MR, Vohra FA, Butte NF, Zakeri IF. Support vector
machines classifiers of physical activities in preschoolers. Physiol Rep 2013;1(1):1–12.
7. Nam Y, Park JW. Child activity recognition based on cooperative fusion model of a
triaxial accelerometer and a barometric pressure sensor. Ieee J Biomed Heal
Informatics 2013;17(2):420–6.
8. Hagenbuchner M, Cliff DP, Trost SG, Van Tuc N, Peoples GE. Prediction of activity
type in preschool children using machine learning techniques. J Sci Med Sport
2015;18(4):426–31.
9. Fairclough SJ, Noonan R, Rowlands A V., Van Hees V, Knowles Z, Boddy LM. Wear
compliance and activity in children wearing wrist- and hip-mounted accelerometers.
Med Sci Sports Exerc 2016;48(2):245–53.
10. Freedson PS, John D. Comment on “Estimating Activity and Sedentary Behavior from
an Accelerometer on the Hip and Wrist.” Med Sci Sport Exerc 2013;45(5):962–3.
11. Ruch N, Rumo M, Mäder U. Recognition of activities in children by two uniaxial
accelerometers in free-living conditions. Eur J Appl Physiol 2011;111(8):1917–27.
12. Ellis K, Kerr J, Godbole S, Lanckriet G, Wing D, Marshall S. A random forest
classifier for the prediction of energy expenditure and type of physical activity from

wrist and hip accelerometers. Physiol Meas 2014;35(11):2191–203.
13. Cleland I, Kikhia B, Nugent C, et al. Optimal placement of accelerometers for the
detection of everyday activities. Sensors 2013;13(7):9183–200.
14. Strath SJ, Kate RJ, Keenan KG, Welch WA, Swartz AM. Ngram time series model to
predict activity type and energy cost from wrist, hip and ankle accelerometers:
implications of age. Physiol Meas 2015;36(11):2335–51.
15. Groβek A, van Loo C, Peoples GE, Hagenbuchner M, Jones R, Cliff DP. Energy Cost
of Physical Activities and Sedentary Behaviors in Young Children. J Phys Act Heal
2016;13(6 Suppl 1):S7–10.
16. Dieu O, Mikulovic J, Fardy PS, Bui-Xuan G, Béghin L, Vanhelst J. Physical activity
using wrist-worn accelerometers: Comparison of dominant and non-dominant wrist.
Clin Physiol Funct Imaging 2016;
17. Ancoli-Israel S, Cole R, Alessi C, Chambers M, Moorcroft W, Pollak CP. The role of
actigraphy in the study of sleep and circadian rhythms. Am Acad Sleep Med Rev Pap
SLEEP 2003;26(3):342–92.
18. Liu S, Gao RX, Freedson PS. Computational methods for estimating energy
expenditure in human physical activities. Med Sci Sports Exerc 2012;44(11):2138–46.
19. Trost SG, Zheng Y, Wong W-K. Machine learning for activity recognition: hip versus
wrist data. Physiol Meas 2014;35(11):2183–9.
20. Mannini A, Intille SS, Rosenberger M, Sabatini AM, Haskell W. Activity recognition
using a single accelerometer placed at the wrist or ankle. Med Sci Sports Exerc
2013;45:2193–203.
21. Kerr J, Patterson RE, Ellis K, et al. Objective assessment of physical activity:
Classifiers for public health. Med Sci Sports Exerc 2016;48(5):951–7.
22. Pavey TG, Gilson ND, Gomersall SR, Clark B, Trost SG. Field evaluation of a random
forest activity classifier for wrist-worn accelerometer data. J Sci Med Sport
2017;20(1):75–80.
23. Kuhn M. Building predictive models in R using the Caret package. J Stat Softw
2008;28(5):1–26.
24. Cohen J. Weighted kappa: Nominal scale agreement provision for scaled disagreement

or partial credit. Psychol Bull 1968;70(4):213–20.
25. Landis JR, Koch GG. The measurement of observer agreement for categorical data.
Biometrics 1977;33(1):159–74.
26. Puhl J, Greaves K, Hoyt M, Baranowski T. Children’s Activity Rating Scale (CARS):
Description and Calibration. Res Q Exerc Sport 1990;61(1):26–36.
27. Hislop J, Bulley C, Mercer T, Reilly JJ. Comparison of Accelerometry Cut Points for
Physical Activity and Sedentary Behavior in Preschool Children: A Validation Study.
PediatrExercSci 2012;24(4):563–76.
28. Butte NF, Wong WW, Lee JS, Adolph AL, Puyau MR, Zakeri I. Prediction of energy
expenditure and physical activity in preschoolers. 2014;46(6):1216–26.
29. Ellis K, Kerr J, Godbole S, Staudenmayer J, Lanckriet G. Hip and wrist accelerometer
algorithms for free-living behavior classification. Med Sci Sports Exerc
2016;48(5):933–40.
30. Tremblay MS, Carson V, Chaput J, et al. Canadian 24-hour movement guidelines for
children and youth : An integration of physical activity , sedentary behaviour , and
sleep. Appl Physiol Nutr Metab 2016;41(6 (Suppl. 3)):S311–27.
31. Trost SG, O’Neil M. Clinical use of objective measures of physical activity. Br J
Sports Med 2014;48(3):178–81.
32. Lyden K, Kozey SL, Staudenmeyer JW, Freedson PS. A comprehensive evaluation of
commonly used accelerometer energy expenditure and MET prediction equations. Eur
J Appl Physiol 2011;111(2):187–201.

Figure Captions
Figure 1. Leave-one-out performance accuracy for hip, wrist, and combined hip and wrist
activity classifiers
Figure 2. Weighted kappa coefficients for hip, wrist, and combined hip and wrist activity
classifiers
Figure 3. Physical activity intensity classification for RF and SVM models compared to the
hip and wrist cut-points derived from this sample.
Copyright © 2022 FDOKUMEN