Tuesday, July 31, 2018
20
70 th AACC Annual Scientific Meeting Abstracts, 2018 S79 Factors Affecting Test Results Tuesday, July 31, 9:30 am – 5:00 pm Tuesday, July 31, 2018 Poster Session: 9:30 AM - 5:00 PM Factors Affecting Test Results A-232 Serial sample dilutions as an initial and rapid means of evaluation for biotin interference in immunoassays: an example using the Roche high-sensitivity troponin T assay M. J. Brune, W. R. Korn, M. D. Stone, J. M. Toohey, D. F. Stickle. Jefferson University Hospitals, Philadelphia, PA BACKGROUND: Many immunoassays utilizing biotin-streptavadin interaction are subject to interference in patients having overtly high biotin subsequent to self-admin- istration or prescription. Potential for biotin interference with troponin measurements to mislead evaluations of acute coronary syndrome is of particular concern. Whereas stripping of biotin from patient samples using pretreatment with streptavadin is one certain way of demonstrating interference, we examined the premise that dilution se- ries of affected patient samples was likely to be non-linear, which would be useful as an initial rapid means of assessment for biotin interference. METHODS: Biotin was purchased from Sigma to produce a stock solution (1000 ng/uL) used for spiking of patient samples. Pooled plasma samples (P) with elevated high-sensitivity troponin T (TnT, Roche assay) were produced by mixing of patient samples. Dilution series using Roche universal diluent were compared between control P samples and biotin- spiked P samples. A successive 2-fold dilution series produced TnT concentrations of 1, 0.5, 0.25 and 0.125 relative to P. RESULTS: In dilution series experiments, a wide range of initial conditions for TnT and biotin concentrations showed results for biotin-spiked samples that were highly non-linear and distinct from control series. A representative example of results for a dilution series experiment is shown in Figure, for initial conditions of TnT = 174 ng/L, spiked biotin = 200 ng/mL. Slopes between any successive points for spiked samples were distinguishable from all parts of the control curve, especially including the first sequence in which dilution produced an increase in measured TnT. CONCLUSIONS: Non-linearity of dilution series results for TnT can be an indication of whether biotin interference is operative in TnT mea- surements. As the TnT assay is of 9 min duration, dilutions may be useful as a rapid initial means of evaluation for interference relative to a procedure involving biotin- stripping sample pre-treatment. A-233 Reagents and Methods for Clearing Interfering Biotin and Lipemia A. L. Albert, R. Nguyen, J. H. Contois. Sun Diagnostics, LLC, New Gloucester, ME Background: The presence of lipemia (elevated triglyceride-rich lipoproteins, TRL) and biotin in clinical specimens is problematic. Lipemia is a common cause of inter- ference with routine chemistry tests. LipoClear® is available to clear lipemic samples; however, there may be loss of proteins and other analytes. We feel that an immunologi- cal approach will provide greater specificity in removing triglyceride-rich lipoproteins without affecting non-lipid analytes. Recently, the FDA has received several reports of adverse events due to biotin interference and released a communication in November 2017 warning of the potential dangers. Given these challenges, we have developed reagents and procedures to specifically deplete clinical samples of these interferents. Methods: Lipemia clearing reagent uses goat anti-human apo B to immunoprecipitate apo B-containing lipoproteins. Delipidated serum was spiked with TRL (INT-01T, Sun Diagnostics) at concentrations of 50, 100, 250, 500, 1000, and 1500 mg/dL tri- glycerides. Each sample (200 µL) was transferred into a a 0.45 µm microcentrifuge filter unit, 200 µL of reagent was added, and the samples were vortexed. The samples were incubated for five minutes at room temperature, then centrifuged at 12000 rpm for five minutes in an Eppendorf microcentrifuge. The filtrates were visually inspected for turbidity/lipemia. In the biotin clearance study, one mL of defibrinated serum (with no measurable biotin) were spiked with biotin (B0381, Sigma-Aldrich) at levels of 50, 100, 250, 500, 1000, 1250, and 2000 ng/mL. Samples were split into two aliquots: one with added 0.9% normal saline (100 µL, control), the other with 100 µL high capacity biotin binding resin. The samples were vortexed, incubated at room temperature for five minutes, and centrifuged at 12000 rpm in an Eppendorf microcentrifuge. The fil- trates were assayed for biotin using an in-house biotin ELISA with a limit of detection of ~2 ng/mL. Results: Lipemia clearing treatment resulted in the complete clearance of turbidity at all triglyceride concentrations. Biotin clearing treatment demonstrated complete removal of biotin up to at least 2000 ng/ml. Conclusions: There is a need in the clinical laboratory community for simple and robust methods of eliminating assay interference to reduce the potential for erroneous test results. Our feasibility experi- ments show that lipemia and biotin clearance procedures are simple and efficient, and may be used routinely in clinical labs to increase the quality of patient test results. A-234 BiochemicalParameters not affected by Pneumatic Tube Delivery C. Yeo, J. Ong, J. E. C. Su, W. Ng. Singapore General Hospital, Singapore, Singapore Background: Transport of clinical laboratory specimens via a pneumatic tube system (PTS) is a ubiquitous feature in any major hospital on a large campus. Some PTS pipelines can extend many kilometers and with travel speeds of 3 - 6m/s; specimens thus subjected to rapid movement, pressurization and even light exposure. Studies have cautioned the effects of PTS contributory pre-analytical factors to some labora- tory test results. In this study, we considered our institution’s PTS (Telecom, NL) on arterial blood gas (ABG) analyses and common biochemical parameters. Methods: Blood specimens sent via PTS for two in-house Point-of-Care-Testing (POCT) quality assurance exercises 6-months apart (EQA-1, EQA-2) were evaluated by comparison to central laboratory results. A later exercise was asked of POCT users to send paired ABG specimens to the central laboratory - one via PTS and one hand-carried. A data- logger (collecting data on speed, acceleration and deceleration, pressure, lighting and temperature) was placed in the PTS alongside the specimens to elucidate journey con- ditions. Results: 11 of 17 (EQA-1) and 16 of 20 (EQA-2) ABG specimens registered pO2 results within +/-10% of the central laboratory results, the remainder gave pO2 results in the range of +11.7 to +36.2% of the central laboratory results. All specimens recorded full successes for pH, pCO2 and ionic calcium. On repeat ABG testing, af- ter taking extra care with pre-analytical factors; especially ensuring expulsion of air bubbles and airtight ABG syringes in addition to prompt dispatch of specimen on ice, all aberrant pO2 results were redeemed. 3 of 7-PTS and 5 of 7-hand specimens in the paired-specimen study yielded pO2 within +/-10% difference; difference between PTS and hand specimens was not statistically significant (p=0.29; Fisher’s Exact test). 4 of 5 ABG specimens sent separately by hand (unpaired) had successful pO2 returns. All specimens again demonstrated acceptable comparability for pH, pCO2, ionic cal- cium, sodium and potassium. Datalogger records for the PTS journeys indicated the same motion, pressure, lighting and temperature parameters; inferring that the speci- mens encountered consistent PTS travel conditions. Conclusion: Our study showed that common biochemical analytes are unaffected by delivery via the PTS mode. PTS travel can exacerbate the inaccuracy of pO2 results if air bubbles have not methodi-
-
Upload
khangminh22 -
Category
Documents
-
view
2 -
download
0
Transcript of Tuesday, July 31, 2018
70th AACC Annual Scientific Meeting Abstracts, 2018 S79
Factors Affecting Test Results Tuesday, July 31, 9:30 am – 5:00 pm
Tuesday, July 31, 2018
Poster Session: 9:30 AM - 5:00 PM
Factors Affecting Test Results
A-232Serial sample dilutions as an initial and rapid means of evaluation for biotin interference in immunoassays: an example using the Roche high-sensitivity troponin T assay
M. J. Brune, W. R. Korn, M. D. Stone, J. M. Toohey, D. F. Stickle. Jefferson University Hospitals, Philadelphia, PA
BACKGROUND: Many immunoassays utilizing biotin-streptavadin interaction are subject to interference in patients having overtly high biotin subsequent to self-admin-istration or prescription. Potential for biotin interference with troponin measurements to mislead evaluations of acute coronary syndrome is of particular concern. Whereas stripping of biotin from patient samples using pretreatment with streptavadin is one certain way of demonstrating interference, we examined the premise that dilution se-ries of affected patient samples was likely to be non-linear, which would be useful as an initial rapid means of assessment for biotin interference. METHODS: Biotin was purchased from Sigma to produce a stock solution (1000 ng/uL) used for spiking of patient samples. Pooled plasma samples (P) with elevated high-sensitivity troponin T (TnT, Roche assay) were produced by mixing of patient samples. Dilution series using Roche universal diluent were compared between control P samples and biotin-spiked P samples. A successive 2-fold dilution series produced TnT concentrations of 1, 0.5, 0.25 and 0.125 relative to P. RESULTS: In dilution series experiments, a wide range of initial conditions for TnT and biotin concentrations showed results for biotin-spiked samples that were highly non-linear and distinct from control series. A representative example of results for a dilution series experiment is shown in Figure, for initial conditions of TnT = 174 ng/L, spiked biotin = 200 ng/mL. Slopes between any successive points for spiked samples were distinguishable from all parts of the control curve, especially including the first sequence in which dilution produced an increase in measured TnT. CONCLUSIONS: Non-linearity of dilution series results for TnT can be an indication of whether biotin interference is operative in TnT mea-surements. As the TnT assay is of 9 min duration, dilutions may be useful as a rapid initial means of evaluation for interference relative to a procedure involving biotin-stripping sample pre-treatment.
A-233Reagents and Methods for Clearing Interfering Biotin and Lipemia
A. L. Albert, R. Nguyen, J. H. Contois. Sun Diagnostics, LLC, New Gloucester, ME
Background: The presence of lipemia (elevated triglyceride-rich lipoproteins, TRL) and biotin in clinical specimens is problematic. Lipemia is a common cause of inter-ference with routine chemistry tests. LipoClear® is available to clear lipemic samples; however, there may be loss of proteins and other analytes. We feel that an immunologi-cal approach will provide greater specificity in removing triglyceride-rich lipoproteins without affecting non-lipid analytes. Recently, the FDA has received several reports of adverse events due to biotin interference and released a communication in November 2017 warning of the potential dangers. Given these challenges, we have developed reagents and procedures to specifically deplete clinical samples of these interferents. Methods: Lipemia clearing reagent uses goat anti-human apo B to immunoprecipitate apo B-containing lipoproteins. Delipidated serum was spiked with TRL (INT-01T, Sun Diagnostics) at concentrations of 50, 100, 250, 500, 1000, and 1500 mg/dL tri-glycerides. Each sample (200 µL) was transferred into a a 0.45 µm microcentrifuge filter unit, 200 µL of reagent was added, and the samples were vortexed. The samples were incubated for five minutes at room temperature, then centrifuged at 12000 rpm for five minutes in an Eppendorf microcentrifuge. The filtrates were visually inspected for turbidity/lipemia. In the biotin clearance study, one mL of defibrinated serum (with no measurable biotin) were spiked with biotin (B0381, Sigma-Aldrich) at levels of 50, 100, 250, 500, 1000, 1250, and 2000 ng/mL. Samples were split into two aliquots: one with added 0.9% normal saline (100 µL, control), the other with 100 µL high capacity biotin binding resin. The samples were vortexed, incubated at room temperature for five minutes, and centrifuged at 12000 rpm in an Eppendorf microcentrifuge. The fil-trates were assayed for biotin using an in-house biotin ELISA with a limit of detection of ~2 ng/mL. Results: Lipemia clearing treatment resulted in the complete clearance of turbidity at all triglyceride concentrations. Biotin clearing treatment demonstrated complete removal of biotin up to at least 2000 ng/ml. Conclusions: There is a need in the clinical laboratory community for simple and robust methods of eliminating assay interference to reduce the potential for erroneous test results. Our feasibility experi-ments show that lipemia and biotin clearance procedures are simple and efficient, and may be used routinely in clinical labs to increase the quality of patient test results.
A-234BiochemicalParameters not affected by Pneumatic Tube Delivery
C. Yeo, J. Ong, J. E. C. Su, W. Ng. Singapore General Hospital, Singapore, Singapore
Background: Transport of clinical laboratory specimens via a pneumatic tube system (PTS) is a ubiquitous feature in any major hospital on a large campus. Some PTS pipelines can extend many kilometers and with travel speeds of 3 - 6m/s; specimens thus subjected to rapid movement, pressurization and even light exposure. Studies have cautioned the effects of PTS contributory pre-analytical factors to some labora-tory test results. In this study, we considered our institution’s PTS (Telecom, NL) on arterial blood gas (ABG) analyses and common biochemical parameters. Methods: Blood specimens sent via PTS for two in-house Point-of-Care-Testing (POCT) quality assurance exercises 6-months apart (EQA-1, EQA-2) were evaluated by comparison to central laboratory results. A later exercise was asked of POCT users to send paired ABG specimens to the central laboratory - one via PTS and one hand-carried. A data-logger (collecting data on speed, acceleration and deceleration, pressure, lighting and temperature) was placed in the PTS alongside the specimens to elucidate journey con-ditions. Results: 11 of 17 (EQA-1) and 16 of 20 (EQA-2) ABG specimens registered pO2 results within +/-10% of the central laboratory results, the remainder gave pO2 results in the range of +11.7 to +36.2% of the central laboratory results. All specimens recorded full successes for pH, pCO2 and ionic calcium. On repeat ABG testing, af-ter taking extra care with pre-analytical factors; especially ensuring expulsion of air bubbles and airtight ABG syringes in addition to prompt dispatch of specimen on ice, all aberrant pO2 results were redeemed. 3 of 7-PTS and 5 of 7-hand specimens in the paired-specimen study yielded pO2 within +/-10% difference; difference between PTS and hand specimens was not statistically significant (p=0.29; Fisher’s Exact test). 4 of 5 ABG specimens sent separately by hand (unpaired) had successful pO2 returns. All specimens again demonstrated acceptable comparability for pH, pCO2, ionic cal-cium, sodium and potassium. Datalogger records for the PTS journeys indicated the same motion, pressure, lighting and temperature parameters; inferring that the speci-mens encountered consistent PTS travel conditions. Conclusion: Our study showed that common biochemical analytes are unaffected by delivery via the PTS mode. PTS travel can exacerbate the inaccuracy of pO2 results if air bubbles have not methodi-
S80 70th AACC Annual Scientific Meeting Abstracts, 2018
Tuesday, July 31, 9:30 am – 5:00 pm Factors Affecting Test Results
cally been removed, as evident by the redemption of pO2 results after care was taken to eliminate air bubbles and ensure airtight syringes. Notwithstanding, occurrence of deviant pO2 results in the hand-carried specimens imply that regardless of delivery mode, time-tested practices to expel air bubbles and ensure airtight ABG syringes, alongside attention to other important pre-analytical factors such as prompt dispatch and transportation on ice, should be universally employed to optimize pO2 results.
A-235Two high dose hook effect cases be found on alpha-fetoprotein assay in clinical practice measured by UniCel® DxI in 2017
Y. An, L. Li, L. Zhang, Q. Miao. West China Hospital of Sichuan Univer-sity, Chengdu, China
Background: Chemiluminescence immunoassay as a non-radioactive labeled im-munoassay because of its short measurement time and no radioactive contamina-tion, nowadays widely used in clinical laboratory analysis. Because immunoassay method based on antigen-antibody reactions, there is a certain risk of hook effect. Sandwich-type immunoassays limited by the high-dose hook effect, which will cause falsely low results when analytes are present at very high concentrations. Although manufacturers already done a comprehensive inspection and evaluation of commercial reagents in order to avoid the hook effect or to minimize the prob-ability of occurrence of such events, and notify the risk to users in the instruction with reagent pack. Actually, such incidents still cannot find out or avoid just base on the results of the experiment or the state of the instrument. This study reviewed and analyzed 704 cases of quantitative AFP data from January to December 2017 exploring whether there is a risk of high dose hook effect in clinical practice. Methods: All the patients who enrolled are monitoring for treatment after the diagno-sis of hepatocellular carcinoma. AFP concentration were measured in routine clinical practice on Beckman Coulter UniCel® DxI 800 Immunoassay System (BECKMAN COULTER, USA) using two different items supplying by the immunoassay system named AFP and d-AFP. The two test items have different Analytical Measurement Range (AMR). The AFP item is range from 0ng/ml to 3000ng/ml, and the d-AFP item is range from 2550ng/ml to 303,000ng/ml, which based on the AFP item di-luted using UniCel® DxI Access Immunoassay Wash Buffer II(REF:A79784, BECK-MAN COULTER, USA) by 101 fold. All sample data greater than 303,000ng/ml will manually dilute by Wash Buffer II(REF:A16793, BECKMAN COULTER, USA) 10-fold and measured by the d-AFP item. We collected 704 cases on both AFP and d-AFP two items test data from January to December 2017 for retrospective analysis. Results: 704 cases are reviewed included a range of concentrations ranging from 0.97ng/ml to 1734592ng/ml with a mean of 72692.77ng/ml, a median of 12805ng/ml and an interquartile range (IQR) of 52483.75ng/ml. All case data are ordered in ascending sequences from 1-704. The number of samples less than 3000ng/ml is 87 cases (12.4%), the number of samples from 3000ng/ml to 303,000ng/ml is 575 (81.7%) and the number of samples over 303,000ng/ml is 42(5.9%). No hook effect exist below 303,000ng/ml. Therefore, we focus on this part of the cases, which is over 303,000ng/ml. 39 cases in 303,000 to 1,000,000ng/ml range and no hook effect existed. Two of three cases over 1,000,000ng/ml got hook ef-fect. Data 703 resulted in AFP item is 2672.77ng/ml and d-AFP is greater than 303,000ng/ml. After 10-fold manual dilution, d-AFP analysis data is 15,16050ng/ml. Data 704 resulted in AFP item is 1295.757ng/ml and d-AFP is greater than 303,000ng/ml. After 10-fold manual dilution, d-AFP analysis data is 1734592ng/ml. Conclusion: For patients who following up the therapy diagnosed with hepatocellular carcinoma, especially those with past results over 500,000ng/ml. Two items both AFP and d-AFP are high recommend in order to avoid erroneous results due to high-dose hook effect which will ultimately misleading patient’s assessment of treatment.
A-236Commutability of reference materials for HbA1c measurements: A cross-platform study
T. Zhang, J. Zeng, W. Chen, D. Wang, J. Zhang, W. Zhou, Y. Yan, C. Zhang. National Center for Clinical Laboratories, Beijing, China
Background:The significance of HbA1c as an important indicator for assessment of glyce-mic control and prediction of risk for diabetes-associated complications has been widely recognized. Comparability of results over time and across assays is essential for ensuring appropriate diagnosis and management of diseases. For this to be realized, it is necessary to have the higher order methods and certi-fied reference materials for establishing traceability of the testing results. To se-lect the suitable reference material formats that are commutable for routine HbA1c
methods based on a variety of analytical principles, a cross-platform commut-ability assessment study for HbA1c measurements was carried out in accordance with Clinical and Laboratory Standards Institute (CLSI) Guidelines EP30-A. Methods:A specialized central laboratory was established for HbA1c commutability validation. 50 of fresh EDTA whole blood samples with the HbA1c concentration range of 0 to 130 mmol/mol were used as the individual native clinical sample. Fresh patient samples, pooled frozen blood samples, pooled and individual human hemolysate buffer with dif-ferent HbA1c levels were measured with 13 different analytical systems simultaneous-ly at the central laboratory. A modified IFCC reference measurement procedure based on LC-MS/MS was served as the comparative method. The analysis was based on lin-ear regression using ordinary least squares and the calculation of the 95% prediction intervals (PIs). Measurement results of the processed materials were compared with the limits of the PIs, and materials with results within the PIs were considered com-mutable. For the estimation of commutability-related biases for non-commutable ma-terials, relative differences of measured values from predicted values were calculated. Results:Pooled frozen whole blood samples were commutable for almost all method comparisons, except for the Arkray HA-8180. It is evident that pooled and in-dividual human hemolysate buffer were commutable for all analytical systems based on ion exchange HPLC (Arkray HA-8180, Bio-Rad D-10, Bio-Rad Vari-ent II Turbo, Mindray H50, Runda MQ-2000PT, Runda MQ-6000 and Tosoh G8) and the methods based on Boronate affinity (Premier Hb 9210) as well as Capillary electrophoresis (Sebia Capillarys 2 Flex Piercing). On the other hand, it showed considerable lack of commutability for most routine methods with bio-chemical analyzer (Hitachi 7180 automatic biochemical analyzer combined with Mindray, Sekisui and Maccura), except Roche Cobas 501. It appears that com-mutability of reference material were probably correlative with concentrations. Conclusions:The frozen whole blood sample was commutable for 12 of 13 method comparisons, only one comparison more than expected given the 95% PI acceptance limit. The reference materials for glycated hemoglobin in human hemolysate buffer were vali-dated commutable for the routine measurement procedure based on chromatographic method including ion exchange HPLC, boronate affinity and capillary electrophoresis. However, for methods based on enzymatic assay or immunoassay, the commutability of the hemolysate is method-dependent and associated with the concentration. Thus, it is highly suggested to identify the commutability when these formats of reference materials are used to provide traceability and evaluating the accuracy of HbA1c mea-surements based on different methodologies.
A-237Pneumatic Tube System Validation for Sample Hemolysis using a Smart Phone Application at Tertiary Medical Care Institute
S. Alabsi, R. Bedair, S. Khudari, A. Borai. King Saud Bin Abdulaziz Uni-versity for Health Sciences, King Abdullah International Medical Research Center, King Abdulaziz Medical City,, Jeddah, Saudi Arabia
Background: Pneumatic tube system (PTS) is used for speed blood transpor-tation inside the main hospitals. It was thought that the increase in parameters of acceleration and distance of the PTS is directly associated with the increase in blood hemolysis. Therefore, in this study a smartphone application was used for monitoring such parameters to validate PTS for hemolysis at tertiary medi-cal care institute of King Abdulaziz Medical City Hospital-Jeddah, Saudi Arabia. Methods: A smartphone was sent (in triplicate) through the PTS from 10 different wards to the main laboratory reception. Five wards with high rates of hemolysis and five wards with low rates. Rate of hemolysis were obtained retrospectively from the number of hemolyzed samples received between Jan 2015 to Dec 2016. While the smartphone application is on the linear accelerator sensor records the three dimensions of acceleration (parameters X, Y and Z (m/s2)) against the variable of time in second. Results: The minimum and maximum values for variables of acceleration in wards with high rates of hemolysis [X (0.13 to 0.46 m/s2 ), Y(-0.10 to 0.08 m/s2) and Z (-0.23 to 0.53 m/s2)] were not changed significantly from the same vari-ables in wards with low rates of hemolysis [X (-0.09 to 0.26 m/s2), Y (-0.11 to 0.24 m/s2), Z (0.02 to 0.48 m/s2)]; p values for X= 0.50, Y= 0.34 and Z= 0.08 respectively. There was no significant correlation between the time required for transportation and the number of hemolyzed samples (r2 = 0.19, p = 0.32). Conclusions: It seems that the reason for sample hemolysis at the institute of King Abdulaziz Medical City-Jeddah is not due to sample acceleration in the PTS but it could be due to other preanalytical or analytical factors.
70th AACC Annual Scientific Meeting Abstracts, 2018 S81
Factors Affecting Test Results Tuesday, July 31, 9:30 am – 5:00 pm
A-239Influence of a Chilean standardized breakfast on routine hematological tests
M. E. Arredondo*1, E. Aranda*2, R. Astorga1, M. D. R. Campelo3, G. C. Guidi*4, C. Medel1, I. A. M. Munoz5, P. Ochoa*6, C. Vega Salinas5, S. Flores Toledo*7, B. Varela*8, G. Lima-Oliveira*4, .. * authors on behalf COLABIOCLI WG-PRE-LATAM9. 1BIONET SA, Santiago, Chile, 2School of Medicine, Pontificia Universidad Catolica de Chile, Santiago, Chile, 3Clinical Laboratory Bioanalise, Teresina, Brazil, 4University of Verona, Verona, Italy, 5Clínica Dávila y Servicios Médicos S.A., Santiago, Chile, 6Medicine School Universidad Católica de Cuenca, Cuenca, Ecuador, 7Universidad Peruana Cayetano Heredia, Lima, Peru, 8LAC, Montevideo, Uruguay, 9Latin American Confederation of Clinical Biochemistry (COLA-BIOCLI), Montevideo, Uruguay
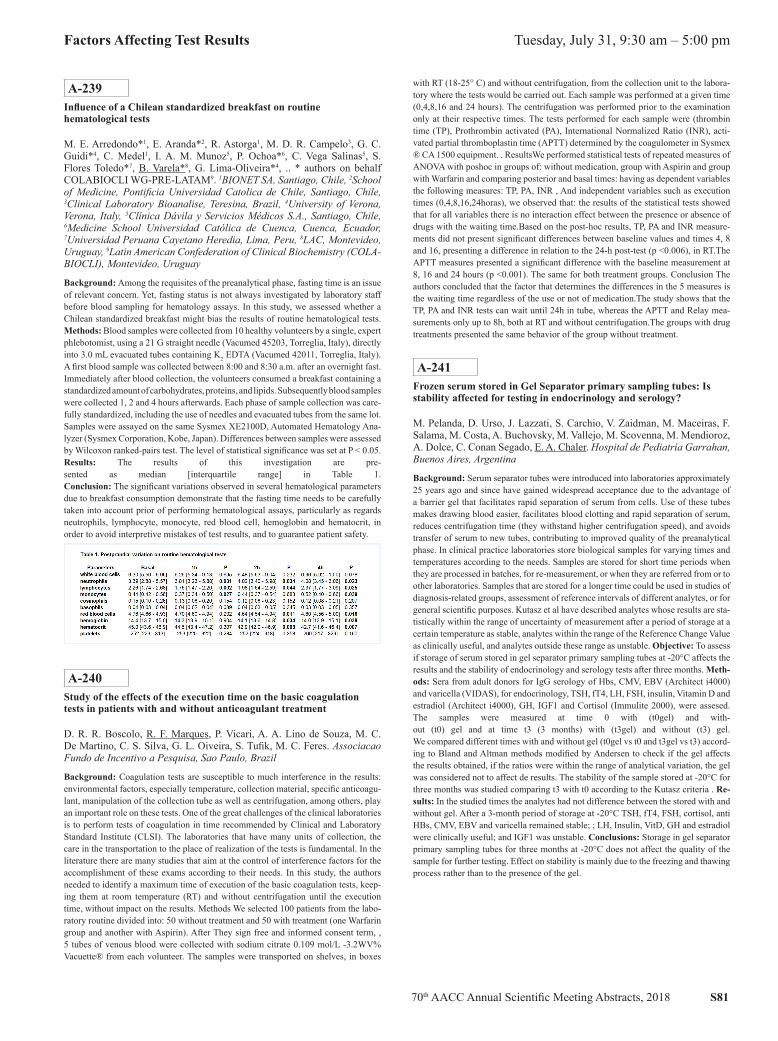
Background: Among the requisites of the preanalytical phase, fasting time is an issue of relevant concern. Yet, fasting status is not always investigated by laboratory staff before blood sampling for hematology assays. In this study, we assessed whether a Chilean standardized breakfast might bias the results of routine hematological tests. Methods: Blood samples were collected from 10 healthy volunteers by a single, expert phlebotomist, using a 21 G straight needle (Vacumed 45203, Torreglia, Italy), directly into 3.0 mL evacuated tubes containing K2 EDTA (Vacumed 42011, Torreglia, Italy). A first blood sample was collected between 8:00 and 8:30 a.m. after an overnight fast. Immediately after blood collection, the volunteers consumed a breakfast containing a standardized amount of carbohydrates, proteins, and lipids. Subsequently blood samples were collected 1, 2 and 4 hours afterwards. Each phase of sample collection was care-fully standardized, including the use of needles and evacuated tubes from the same lot. Samples were assayed on the same Sysmex XE2100D, Automated Hematology Ana-lyzer (Sysmex Corporation, Kobe, Japan). Differences between samples were assessed by Wilcoxon ranked-pairs test. The level of statistical significance was set at P < 0.05. Results: The results of this investigation are pre-sented as median [interquartile range] in Table 1. Conclusion: The significant variations observed in several hematological parameters due to breakfast consumption demonstrate that the fasting time needs to be carefully taken into account prior of performing hematological assays, particularly as regards neutrophils, lymphocyte, monocyte, red blood cell, hemoglobin and hematocrit, in order to avoid interpretive mistakes of test results, and to guarantee patient safety.
A-240Study of the effects of the execution time on the basic coagulation tests in patients with and without anticoagulant treatment
D. R. R. Boscolo, R. F. Marques, P. Vicari, A. A. Lino de Souza, M. C. De Martino, C. S. Silva, G. L. Oiveira, S. Tufik, M. C. Feres. Associacao Fundo de Incentivo a Pesquisa, Sao Paulo, Brazil
Background: Coagulation tests are susceptible to much interference in the results: environmental factors, especially temperature, collection material, specific anticoagu-lant, manipulation of the collection tube as well as centrifugation, among others, play an important role on these tests. One of the great challenges of the clinical laboratories is to perform tests of coagulation in time recommended by Clinical and Laboratory Standard Institute (CLSI). The laboratories that have many units of collection, the care in the transportation to the place of realization of the tests is fundamental. In the literature there are many studies that aim at the control of interference factors for the accomplishment of these exams according to their needs. In this study, the authors needed to identify a maximum time of execution of the basic coagulation tests, keep-ing them at room temperature (RT) and without centrifugation until the execution time, without impact on the results. Methods We selected 100 patients from the labo-ratory routine divided into: 50 without treatment and 50 with treatment (one Warfarin group and another with Aspirin). After They sign free and informed consent term, , 5 tubes of venous blood were collected with sodium citrate 0.109 mol/L -3.2WV% Vacuette® from each volunteer. The samples were transported on shelves, in boxes
with RT (18-25° C) and without centrifugation, from the collection unit to the labora-tory where the tests would be carried out. Each sample was performed at a given time (0,4,8,16 and 24 hours). The centrifugation was performed prior to the examination only at their respective times. The tests performed for each sample were (thrombin time (TP), Prothrombin activated (PA), International Normalized Ratio (INR), acti-vated partial thromboplastin time (APTT) determined by the coagulometer in Sysmex ® CA 1500 equipment. . ResultsWe performed statistical tests of repeated measures of ANOVA with poshoc in groups of: without medication, group with Aspirin and group with Warfarin and comparing posterior and basal times: having as dependent variables the following measures: TP, PA, INR , And independent variables such as execution times (0,4,8,16,24horas), we observed that: the results of the statistical tests showed that for all variables there is no interaction effect between the presence or absence of drugs with the waiting time.Based on the post-hoc results, TP, PA and INR measure-ments did not present significant differences between baseline values and times 4, 8 and 16, presenting a difference in relation to the 24-h post-test (p <0.006), in RT.The APTT measures presented a significant difference with the baseline measurement at 8, 16 and 24 hours (p <0.001). The same for both treatment groups. Conclusion The authors concluded that the factor that determines the differences in the 5 measures is the waiting time regardless of the use or not of medication.The study shows that the TP, PA and INR tests can wait until 24h in tube, whereas the APTT and Relay mea-surements only up to 8h, both at RT and without centrifugation.The groups with drug treatments presented the same behavior of the group without treatment.
A-241Frozen serum stored in Gel Separator primary sampling tubes: Is stability affected for testing in endocrinology and serology?
M. Pelanda, D. Urso, J. Lazzati, S. Carchio, V. Zaidman, M. Maceiras, F. Salama, M. Costa, A. Buchovsky, M. Vallejo, M. Scovenna, M. Mendioroz, A. Dolce, C. Conan Segado, E. A. Chaler. Hospital de Pediatría Garrahan, Buenos Aires, Argentina
Background: Serum separator tubes were introduced into laboratories approximately 25 years ago and since have gained widespread acceptance due to the advantage of a barrier gel that facilitates rapid separation of serum from cells. Use of these tubes makes drawing blood easier, facilitates blood clotting and rapid separation of serum, reduces centrifugation time (they withstand higher centrifugation speed), and avoids transfer of serum to new tubes, contributing to improved quality of the preanalytical phase. In clinical practice laboratories store biological samples for varying times and temperatures according to the needs. Samples are stored for short time periods when they are processed in batches, for re-measurement, or when they are referred from or to other laboratories. Samples that are stored for a longer time could be used in studies of diagnosis-related groups, assessment of reference intervals of different analytes, or for general scientific purposes. Kutasz et al have described analytes whose results are sta-tistically within the range of uncertainty of measurement after a period of storage at a certain temperature as stable, analytes within the range of the Reference Change Value as clinically useful, and analytes outside these range as unstable. Objective: To assess if storage of serum stored in gel separator primary sampling tubes at -20°C affects the results and the stability of endocrinology and serology tests after three months. Meth-ods: Sera from adult donors for IgG serology of Hbs, CMV, EBV (Architect i4000) and varicella (VIDAS), for endocrinology, TSH, fT4, LH, FSH, insulin, Vitamin D and estradiol (Architect i4000), GH, IGF1 and Cortisol (Immulite 2000), were assesed. The samples were measured at time 0 with (t0gel) and with-out (t0) gel and at time t3 (3 months) with (t3gel) and without (t3) gel. We compared different times with and without gel (t0gel vs t0 and t3gel vs t3) accord-ing to Bland and Altman methods modified by Andersen to check if the gel affects the results obtained, if the ratios were within the range of analytical variation, the gel was considered not to affect de results. The stability of the sample stored at -20°C for three months was studied comparing t3 with t0 according to the Kutasz criteria . Re-sults: In the studied times the analytes had not difference between the stored with and without gel. After a 3-month period of storage at -20°C TSH, fT4, FSH, cortisol, anti HBs, CMV, EBV and varicella remained stable; ; LH, Insulin, VitD, GH and estradiol were clinically useful; and IGF1 was unstable. Conclusions: Storage in gel separator primary sampling tubes for three months at -20°C does not affect the quality of the sample for further testing. Effect on stability is mainly due to the freezing and thawing process rather than to the presence of the gel.
S82 70th AACC Annual Scientific Meeting Abstracts, 2018
Tuesday, July 31, 9:30 am – 5:00 pm Factors Affecting Test Results
A-242Pneumatic Tube Delivery of Whole Blood Specimens Affects the Measurement of Lactate Dehydrogenase, Total CO2 and Anion Gap
F. Wu1, A. W. Lyon1, A. A. Kakadekar2, K. St. Germaine1, M. E. Lyon1. 1Saskatchewan Health Authority, Saskatoon, SK, Canada, 2Medical Uni-versity of Lublin, Lublin, Poland, Lublin, Poland
Background: Pneumatic tubes (P-tube) have been widely used to transport speci-mens in medical centres to improve turnaround times. In this study, we evaluate the impact of transporting whole blood specimens through a P-tube on the mea-surement of electrolytes, total CO2, anion gap and lactate dehydrogenase (LD). Methods: Two whole blood specimens of equal volume were collected into lithium heparin Vacutainer® tubes from 40 ambulatory patients. The P-tube was used to transport one tube from each patient while the second tube was delivered by walking. Sodium, potassium, chloride, Total CO2, LD and an-ion gap were measured using the Roche Cobas® 6000 chemistry analyzers. Results: The following Passing Bablok regression equations describe the relation-ship between the specimens sent by P-tube and the hand delivered specimens: So-dium: y = 1.0x - 1.0, R2= 0.650; Potassium: y = 1.0x + 0, R2 = 0.762; Chloride: y = 1.0x + 0, R2 = 0.709; Total CO2: y = 1.0x - 1.0, R2 = 0.667; Anion Gap: y = 1.0x + 2.0, R2 = 0.436; LD y = 1.07x - 1.33, R2 = 0.679. Bland Altman analysis indicated the following mean bias and (95% confidence intervals). Sodium: mean bias: - 0.4 mmol/L (-3.0 to 2.2); Potassium mean bias: 0.01 mmol/L (-0.29 to 0.32); Chloride mean bias -0.5 mmol/L (-3.0 to 2.0); Total CO2 mean bias -1.5 mmol/L (-3.7 to 0.7); Anion gap mean bias 1.6 mmol/L (-1.4 to 4.5); LD mean bias 17.1 U/L (-26.5 to 60.7). Paired t-tests were used to evaluate statistical differences between specimens sent through the P-tube versus walked to the laboratory: Potassium p< 0.54; Sodium p< 0.051; Chloride p<0.016 ; Total CO2 p<0.001; Anion Gap p<0.0001; LD p <0.0001. Conclusions: Transport of whole blood specimens obtained from ambulatory patients through the P-tube caused statistically significant differences in Sodium, Chloride, LD, Total CO2 and Anion gap. Further studies need to be conducted to understand the extent of clinical impact of the P-tube transport on these tests.
A-243Validation of CSF Gentamycin Measurement by VITROS®5600
Z. Liu1, L. Wang2. 1University of Toronto, Toronto, ON, Canada, 2Univer-sity of British Columbia, Vancouver, BC, Canada
Background: A newborn with a ventriculo-peritoneal (VP) shunt for hydrocephalus due to a tectal glioma developed bacterial ventriculitis. CSF culture grew multi-drug resistant enterobacter aerogenes while blood culture was negative. The pediatric team decided to treat this newborn with intrathecal Gentamycin. The dosage of the intrathe-cal Gentamycin as well as the protocol for CSF sample collections for the trough and peak CSF Gentamycin levels, were based on the guidelines for the management of in-tra-cranial infections in children and adults from Oxford Radcliffe Hospitals. The ob-jective of this study is to validate CSF Gentamycin measurement by VITROS 5600 to help pediatricians manage this newborn with frequent CSF Gentamycin monitoring. Methods: A linearity experiment was performed with the 100mg/L Gentamy-cin in normal saline obtained from our hospital pharmacy. This Gentamycin stock was mixed with pooled CSF fluid samples from other patients (zero pool) from the laboratory to make a 10mg/L high pool, which was then mixed with the zero pool CSF fluid at different ratios to create the final Gentamycin concentrations at 0 mg/L, 1 mg/L, 1.25 mg/L, 2.5 mg/L, 5 mg/L, 7.5 mg/L and 10 mg/L. Each level was tested in triplicate. Accuracy was assessed by comparing each CSF Gentamy-cin sample from this newborn obtained by VITROS 5600 to those measured by Siemens VISTA. Within-day precision was tested 10 times at the Gentamycin con-centrations of 2 mg/L and 9 mg/L and between-day precision was tested in tripli-cates for 5 days at the same levels. Interference study was tested with spiking the pooled CSF samples with hemolysates at the Gentamycin concentration of 5 mg/L. Results: The linearity of CSF Gentamycin was perfect (R2= 0.9991). At the Gentamycin concentrations of 2 mg/L and 9 mg/L, both the within-day and be-tween-day precisions were less than 6%. In comparison with the CSF Gentamycin measured by VISTA, the average percentage difference of Gentamycin measure-ments by VITROS 5600 was less than 5%. At the Gentamycin concentrations of 5 mg/L, there was no hemolysis interferences with hemoglobin up to 5 g/L. Conclusion: Linearity, precision, accuracy and hemolysis interference studies all sug-gested the CSF gentamycin measured by VITROS 56OO was validated for clinical reporting.
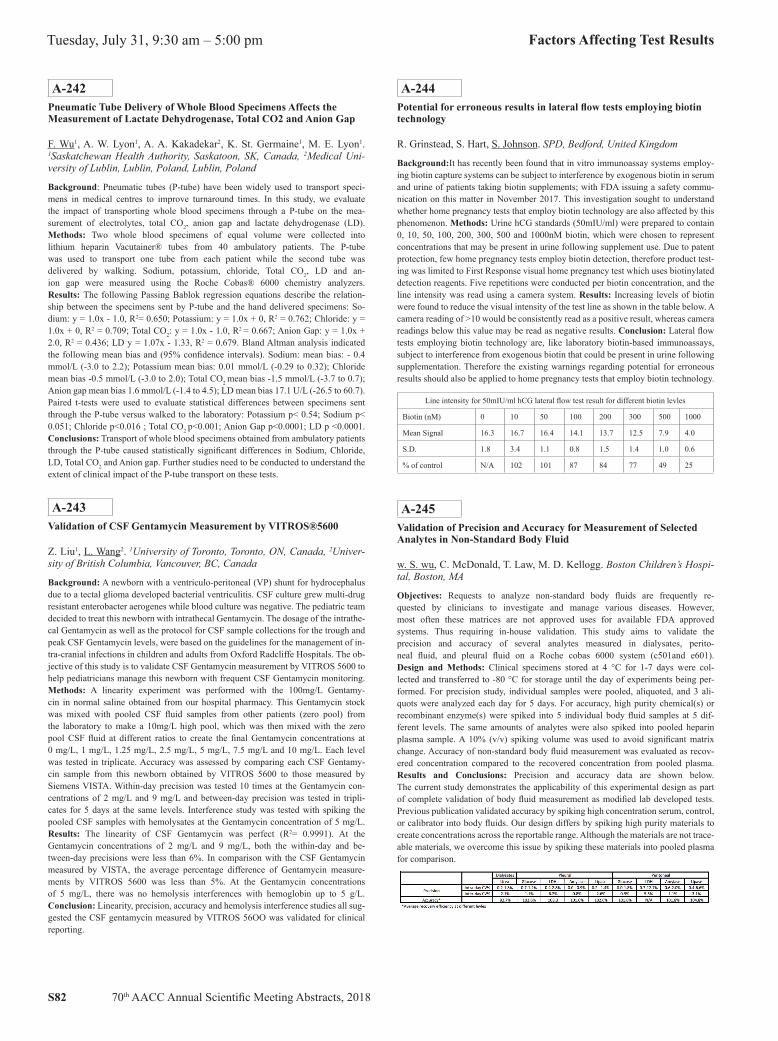
A-244Potential for erroneous results in lateral flow tests employing biotin technology
R. Grinstead, S. Hart, S. Johnson. SPD, Bedford, United Kingdom
Background:It has recently been found that in vitro immunoassay systems employ-ing biotin capture systems can be subject to interference by exogenous biotin in serum and urine of patients taking biotin supplements; with FDA issuing a safety commu-nication on this matter in November 2017. This investigation sought to understand whether home pregnancy tests that employ biotin technology are also affected by this phenomenon. Methods: Urine hCG standards (50mIU/ml) were prepared to contain 0, 10, 50, 100, 200, 300, 500 and 1000nM biotin, which were chosen to represent concentrations that may be present in urine following supplement use. Due to patent protection, few home pregnancy tests employ biotin detection, therefore product test-ing was limited to First Response visual home pregnancy test which uses biotinylated detection reagents. Five repetitions were conducted per biotin concentration, and the line intensity was read using a camera system. Results: Increasing levels of biotin were found to reduce the visual intensity of the test line as shown in the table below. A camera reading of >10 would be consistently read as a positive result, whereas camera readings below this value may be read as negative results. Conclusion: Lateral flow tests employing biotin technology are, like laboratory biotin-based immunoassays, subject to interference from exogenous biotin that could be present in urine following supplementation. Therefore the existing warnings regarding potential for erroneous results should also be applied to home pregnancy tests that employ biotin technology.
Line intensity for 50mIU/ml hCG lateral flow test result for different biotin levles
Biotin (nM) 0 10 50 100 200 300 500 1000
Mean Signal 16.3 16.7 16.4 14.1 13.7 12.5 7.9 4.0
S.D. 1.8 3.4 1.1 0.8 1.5 1.4 1.0 0.6
% of control N/A 102 101 87 84 77 49 25
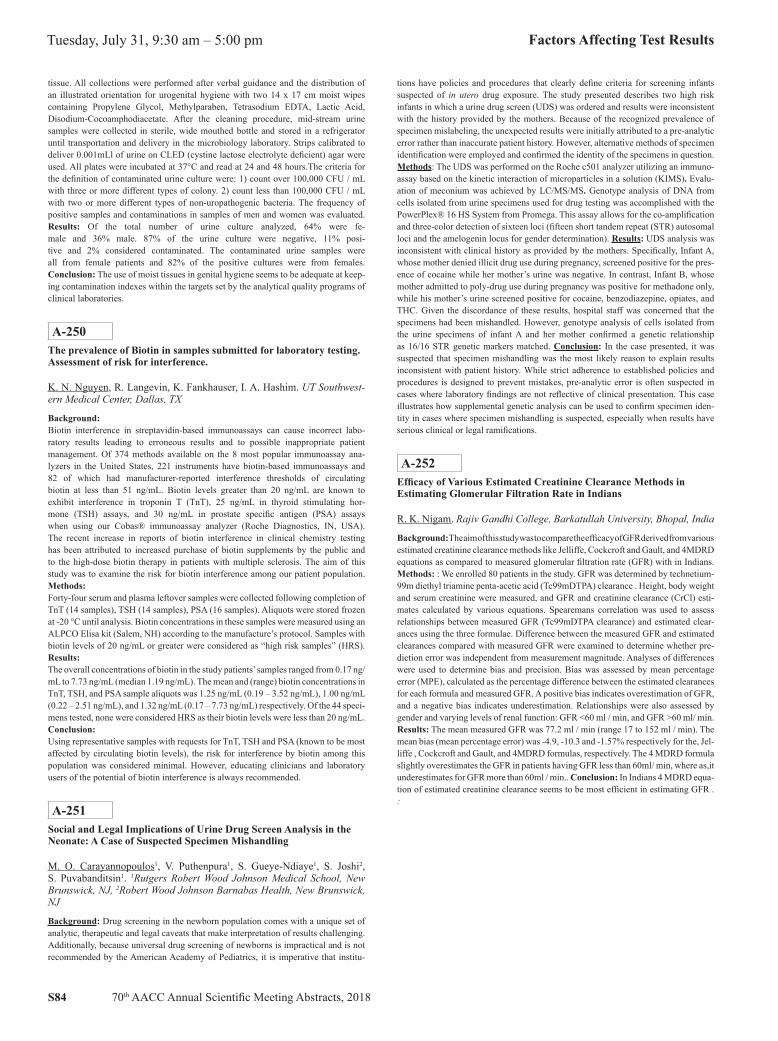
A-245Validation of Precision and Accuracy for Measurement of Selected Analytes in Non-Standard Body Fluid
w. S. wu, C. McDonald, T. Law, M. D. Kellogg. Boston Children’s Hospi-tal, Boston, MA
Objectives: Requests to analyze non-standard body fluids are frequently re-quested by clinicians to investigate and manage various diseases. However, most often these matrices are not approved uses for available FDA approved systems. Thus requiring in-house validation. This study aims to validate the precision and accuracy of several analytes measured in dialysates, perito-neal fluid, and pleural fluid on a Roche cobas 6000 system (c501and e601). Design and Methods: Clinical specimens stored at 4 °C for 1-7 days were col-lected and transferred to -80 °C for storage until the day of experiments being per-formed. For precision study, individual samples were pooled, aliquoted, and 3 ali-quots were analyzed each day for 5 days. For accuracy, high purity chemical(s) or recombinant enzyme(s) were spiked into 5 individual body fluid samples at 5 dif-ferent levels. The same amounts of analytes were also spiked into pooled heparin plasma sample. A 10% (v/v) spiking volume was used to avoid significant matrix change. Accuracy of non-standard body fluid measurement was evaluated as recov-ered concentration compared to the recovered concentration from pooled plasma. Results and Conclusions: Precision and accuracy data are shown below. The current study demonstrates the applicability of this experimental design as part of complete validation of body fluid measurement as modified lab developed tests. Previous publication validated accuracy by spiking high concentration serum, control, or calibrator into body fluids. Our design differs by spiking high purity materials to create concentrations across the reportable range. Although the materials are not trace-able materials, we overcome this issue by spiking these materials into pooled plasma for comparison.

70th AACC Annual Scientific Meeting Abstracts, 2018 S83
Factors Affecting Test Results Tuesday, July 31, 9:30 am – 5:00 pm
A-246Effect of Hemolysis and Icterus on Chemistry Tests and Association between the Amount of Interfering Substances and H-index and I-index
N. Akbas, B. Eppert, J. Miller, C. Schulten, C. Wallace, T. Turner. Medpace Reference Laboratories, Cincinnati, OH
Background: Interference from endogenous substances is one of the leading source of errors that clinical laboratories frequently encounter at the pre-analytical phase of test-ing. Automated chemistry platforms allow accurate measurement of interferences due to endogenous substances such as hemolysis and icterus utilizing semi-quantitative testing with indices. We evaluated the effect of hemolysis and icterus on chemistry as-says and further assessed the association between the amount of interfering substances and ordinal values reported by the automated chemistry analyzer as H- and I- indices. Methods: Three normal serum pools were prepared and supplemented with six in-creasing concentrations of hemolysate and bilirubin. These samples were then tested for 40 chemistry analytes for hemolysis and 38 chemistry analytes for icterus inter-ferences on a Beckman Coulter AU5800 series analyzer. Results were compared to baseline values and acceptability of results were determined based on the total al-lowable error limits according to CAP and CLIA guidelines. The amount of hemo-lysis and icterus were measured using a semi-quantitative photometric test on the same instrument using the Beckman Coulter LIH reagent system. These values were assigned by the instrument on an ordinal scale as qualitative flag levels (“N”, “+”, “++”, “+++”, “++++” and “+++++”) to reflect the degree of hemolysis and icterus in a specimen. Visual detection of the hemolysis and icterus was also performed in-dependently on each aliquot in a blinded manner by three experienced technologists. Results: Interference from hemolysis was detected for 20 of 40 tested analytes. Half of these twenty analytes were affected by gross hemolysis at hemoglobin con-centrations of 798 mg/dL with ordinal values of “+++++” flag level. Only three analytes (aspartate aminotransferase, direct bilirubin and lactate dehydrogenase) were affected by slight hemolysis at hemoglobin concentrations of 76 mg/dL with ordinal values of “+” flag level. Aldolase was the only analyte that was affected at hemoglobin concentrations of 25 mg/dL. Interference from icterus was detected for 9 of 38 tested analytes. Three of these nine analytes were affected by gross ic-terus at bilirubin concentrations of 60 mg/dL with ordinal values of “+++++” flag level. Free glycerol was the only analyte that was affected by bilirubin concentra-tions of 3.7 mg/dL with ordinal values of “+” flag level. Visual inspection results for hemolysis showed good agreement between three technologists and were con-sistent with the corresponding ordinal values. Visual inspection results for icterus showed more variations between technologists and compared to ordinal values. Conclusions: We have demonstrated that some of the chemistry analytes were af-fected by hemolysis and icterus interferences. Generally, our results were consistent with manufacturer’s claims. Our laboratory applied the results to determine the cut-off indices for hemolysis and icterus on tested chemistry analytes using the robust mea-surement of the interferent provided by the automated chemistry analyzer. The imple-mentation of the indices allows us to effectively determine the specimen integrity and prevent erroneous test results due to hemolysis and icterus.
A-247Implementing Kleihauer-Betke test external quality assessment scheme (EQAS), a French experience.
M. R. VAUBOURDOLLE. ASQUALAB, PARIS, France
BACKGROUND: The Kleihauer-Betke test (KBT) is a laboratory examination used to quantify foetomaternal hemorrhage. Although this method has proved to be useful clinically, this test is often criticized. It is a manual test with a high level of variability, difficult to standardize and requiring technical expertise. Even if the flow cytometry is used to replace the KBT, it is not widely used, unsuitable for emergency and displays limitations such as F-cells interferences. METHODS: Taking into account the manda-tory accreditation for French Laboratories the need for an external quality assessment scheme (EQAS) raised. The CNRHP and ASQUALAB implemented an EQAS in-cluding a stained smear, a whole blood sample (a calibrated mix of fetal and maternal cells with a target value) and a clinical case study. Five surveys were conducted since 2015 gathering increasing number of participants from 57 to 146 laboratories in 2018. RESULTS: The interlaboratory variability ranges from 25% to 30%. The average of the laboratories is higher than the target val-ue, mostly probably due to underestimation of adult erythrocytes count. CONCLUSION:This evaluation demonstrates the difficulties to standardize the KBT and the need for EQAS for competency improvement.
A-248The Effect of 37°C Temperature on the Stability of Routine Chemistry Analytes in Serum
T. R. Kennedy, K. Simkowksi, E. Sykes, R. Carey-Ballough, C. Kern. Wm Beaumont Health System, Royal Oak, MI
Introduction: Thousands of blood samples are transported daily by couriers from outpatient providers’ offices to the Automated Chemistry laboratory. In the summer, samples stored in lock-boxes can be subjected to prolonged elevated temperatures pri-or to courier pick up, potentially affecting test results (highest recorded lock box tem-perature = 31° C). We hypothesize that such elevated temperatures may be detrimental to the stability of various chemistry analytes (particularly enzymes) in serum samples. Study Design: Ten remnant serum pools were prepared (no separator gel pres-ent, 24 to 72 hours old) – one normal pool and nine others representing a variety of abnormal clinical states (elevations of: creatinine, alkaline phosphatase, ALT/AST, creatine kinase (CK), PSA, and TSH). Each pool was divided into 4 ali-quots. Four gold-top Vacutainer® tubes were also obtained from each of fourteen healthy volunteers (12 non-pregnant females & 2 males); these were processed immediately after collection and remained capped until testing was performed. One aliquot from each pool and each volunteer represented time zero (baseline). The remaining tubes were incubated at 37°C for 8, 12 and 24 hours, respectively, prior to testing. Pooled samples were also capped during the incubation periods. Test results were obtained for sodium, potassium, chloride, CO2, BUN, creatinine, calcium, phosphate, magnesium, total protein, albumin, CK, GGT, amylase, lipase, total and direct bilirubin, total & HDL cholesterol, triglycerides, alkaline phosphatase, CRP, ALT, AST, free T4, TSH, folate, PSA, and vitamin B12.The Siemens Advia® 1800 and Siemens Centaur® XP chemistry analyzers were used for testing. Differenc-es (residual and % residual) between zero time and 37°C storage times were calculat-ed. Total Analytical Error (TAE) was employed to determine significant differences. Results: Of the 31 tests performed on the pooled remnants, significant decreases were noted after 8 hours for CK (average decrease at 8 hours = 55.4%, TAE 30% ) and ALT (average decrease at 8 hours = 23.51%, TAE 20%) and after 12 hours for lipase (aver-age decrease at 12 hours = 32.45%, TAE 20%), calcium (average decrease at 12 hours = 10.40%, TAE 6%), & phosphorus (average decrease at 12 hours = 13.60%, TAE 11%). Of the 31 tests performed on 14 volunteer samples (separa-tor gel left in place in the tube), no appreciable pattern or clini-cally significant increases or decreases of results were identified. Conclusion: There was a significant decrease in CK and ALT activity when pooled serum samples were subjected to 37°C temperature for as short a period of time as 8 hours; lipase, calcium and phosphorus results were affected after 12 hours. However, no particular pattern of change was detected in the volunteer samples even after 24 hours at 37°C. The difference in results between pools and volunteer samples may in part be due to the pools already being 24-72 hours old. The effect of disease states (or sample exposure to air of the pools prior to preparation) could also have contributed to the differences encountered, although the normal pool also yielded decreases in CK and ALT.
A-249Evaluation of the contamination index in the urine culture after urogenital region hygiene with moist toilet tissue
C. B. Maluf1, M. S. Feitosa2, D. C. C. Iwashima2, L. S. Vasconcellos1, C. M. V. Miguel2, R. F. L. Pires2, A. B. Rodrigues2, T. Castro2, A. Andrade1, S. M. Liu2. 1School of medicine. Universidade Federal de Minas Gerais, Belo Horizonte, Brazil, 2Hospital das Clínicas. Universidade Federal de Minas Gerais, Belo Horizonte, Brazil
Background: Culture of a urine sample is one of the most requested exams in the microbiology laboratory. Contamination of the urine culture can lead to false posi-tive results and, inadequate collection techniques of urine samples are considered the main reason for contamination. The urine culture contamination index is an important indicator of the quality of the laboratory’s pre-analytical phase. The con-tamination of the urine culture can be reduced by appropriate collection, transport and storage of the urine sample. The outcome of urine culture to provide relevant clinical information depends on careful sample collection, including performing hy-giene of the urogenital region. Genital hygiene with mild soap and rinse water is traditionally recommended, alternatively, the use of moist tissues in antisepsis of the urogenital region is recommended. The aim of this study is to evaluate the con-tamination index of urine culture with the use of moist tissues in genital hygiene. Methods: : We evaluated 100 urine culture of patients seen at the outpatient clinic of the University Hospital, where urogenital hygiene was performed with a moist
S84 70th AACC Annual Scientific Meeting Abstracts, 2018
Tuesday, July 31, 9:30 am – 5:00 pm Factors Affecting Test Results
tissue. All collections were performed after verbal guidance and the distribution of an illustrated orientation for urogenital hygiene with two 14 x 17 cm moist wipes containing Propylene Glycol, Methylparaben, Tetrasodium EDTA, Lactic Acid, Disodium-Cocoamphodiacetate. After the cleaning procedure, mid-stream urine samples were collected in sterile, wide mouthed bottle and stored in a refrigerator until transportation and delivery in the microbiology laboratory. Strips calibrated to deliver 0.001mLl of urine on CLED (cystine lactose electrolyte deficient) agar were used. All plates were incubated at 37°C and read at 24 and 48 hours.The criteria for the definition of contaminated urine culture were: 1) count over 100,000 CFU / mL with three or more different types of colony. 2) count less than 100,000 CFU / mL with two or more different types of non-uropathogenic bacteria. The frequency of positive samples and contaminations in samples of men and women was evaluated. Results: Of the total number of urine culture analyzed, 64% were fe-male and 36% male. 87% of the urine culture were negative, 11% posi-tive and 2% considered contaminated. The contaminated urine samples were all from female patients and 82% of the positive cultures were from females. Conclusion: The use of moist tissues in genital hygiene seems to be adequate at keep-ing contamination indexes within the targets set by the analytical quality programs of clinical laboratories.
A-250The prevalence of Biotin in samples submitted for laboratory testing. Assessment of risk for interference.
K. N. Nguyen, R. Langevin, K. Fankhauser, I. A. Hashim. UT Southwest-ern Medical Center, Dallas, TX
Background:Biotin interference in streptavidin-based immunoassays can cause incorrect labo-ratory results leading to erroneous results and to possible inappropriate patient management. Of 374 methods available on the 8 most popular immunoassay ana-lyzers in the United States, 221 instruments have biotin-based immunoassays and 82 of which had manufacturer-reported interference thresholds of circulating biotin at less than 51 ng/mL. Biotin levels greater than 20 ng/mL are known to exhibit interference in troponin T (TnT), 25 ng/mL in thyroid stimulating hor-mone (TSH) assays, and 30 ng/mL in prostate specific antigen (PSA) assays when using our Cobas® immunoassay analyzer (Roche Diagnostics, IN, USA). The recent increase in reports of biotin interference in clinical chemistry testing has been attributed to increased purchase of biotin supplements by the public and to the high-dose biotin therapy in patients with multiple sclerosis. The aim of this study was to examine the risk for biotin interference among our patient population. Methods:Forty-four serum and plasma leftover samples were collected following completion of TnT (14 samples), TSH (14 samples), PSA (16 samples). Aliquots were stored frozen at -20 °C until analysis. Biotin concentrations in these samples were measured using an ALPCO Elisa kit (Salem, NH) according to the manufacture’s protocol. Samples with biotin levels of 20 ng/mL or greater were considered as “high risk samples” (HRS). Results:The overall concentrations of biotin in the study patients’ samples ranged from 0.17 ng/mL to 7.73 ng/mL (median 1.19 ng/mL). The mean and (range) biotin concentrations in TnT, TSH, and PSA sample aliquots was 1.25 ng/mL (0.19 – 3.52 ng/mL), 1.00 ng/mL (0.22 – 2.51 ng/mL), and 1.32 ng/mL (0.17 – 7.73 ng/mL) respectively. Of the 44 speci-mens tested, none were considered HRS as their biotin levels were less than 20 ng/mL. Conclusion:Using representative samples with requests for TnT, TSH and PSA (known to be most affected by circulating biotin levels), the risk for interference by biotin among this population was considered minimal. However, educating clinicians and laboratory users of the potential of biotin interference is always recommended.
A-251Social and Legal Implications of Urine Drug Screen Analysis in the Neonate: A Case of Suspected Specimen Mishandling
M. O. Carayannopoulos1, V. Puthenpura1, S. Gueye-Ndiaye1, S. Joshi2, S. Puvabanditsin1. 1Rutgers Robert Wood Johnson Medical School, New Brunswick, NJ, 2Robert Wood Johnson Barnabas Health, New Brunswick, NJ
Background: Drug screening in the newborn population comes with a unique set of analytic, therapeutic and legal caveats that make interpretation of results challenging. Additionally, because universal drug screening of newborns is impractical and is not recommended by the American Academy of Pediatrics, it is imperative that institu-
tions have policies and procedures that clearly define criteria for screening infants suspected of in utero drug exposure. The study presented describes two high risk infants in which a urine drug screen (UDS) was ordered and results were inconsistent with the history provided by the mothers. Because of the recognized prevalence of specimen mislabeling, the unexpected results were initially attributed to a pre-analytic error rather than inaccurate patient history. However, alternative methods of specimen identification were employed and confirmed the identity of the specimens in question. Methods: The UDS was performed on the Roche c501 analyzer utilizing an immuno-assay based on the kinetic interaction of microparticles in a solution (KIMS). Evalu-ation of meconium was achieved by LC/MS/MS. Genotype analysis of DNA from cells isolated from urine specimens used for drug testing was accomplished with the PowerPlex® 16 HS System from Promega. This assay allows for the co-amplification and three-color detection of sixteen loci (fifteen short tandem repeat (STR) autosomal loci and the amelogenin locus for gender determination). Results: UDS analysis was inconsistent with clinical history as provided by the mothers. Specifically, Infant A, whose mother denied illicit drug use during pregnancy, screened positive for the pres-ence of cocaine while her mother’s urine was negative. In contrast, Infant B, whose mother admitted to poly-drug use during pregnancy was positive for methadone only, while his mother’s urine screened positive for cocaine, benzodiazepine, opiates, and THC. Given the discordance of these results, hospital staff was concerned that the specimens had been mishandled. However, genotype analysis of cells isolated from the urine specimens of infant A and her mother confirmed a genetic relationship as 16/16 STR genetic markers matched. Conclusion: In the case presented, it was suspected that specimen mishandling was the most likely reason to explain results inconsistent with patient history. While strict adherence to established policies and procedures is designed to prevent mistakes, pre-analytic error is often suspected in cases where laboratory findings are not reflective of clinical presentation. This case illustrates how supplemental genetic analysis can be used to confirm specimen iden-tity in cases where specimen mishandling is suspected, especially when results have serious clinical or legal ramifications.
A-252Efficacy of Various Estimated Creatinine Clearance Methods in Estimating Glomerular Filtration Rate in Indians
R. K. Nigam. Rajiv Gandhi College, Barkatullah University, Bhopal, India
Background: The aim of this study was to compare the efficacy of GFR derived from various estimated creatinine clearance methods like Jelliffe, Cockcroft and Gault, and 4MDRD equations as compared to measured glomerular filtration rate (GFR) with in Indians. Methods: : We enrolled 80 patients in the study. GFR was determined by technetium-99m diethyl triamine penta-acetic acid (Tc99mDTPA) clearance . Height, body weight and serum creatinine were measured, and GFR and creatinine clearance (CrCl) esti-mates calculated by various equations. Spearemans correlation was used to assess relationships between measured GFR (Tc99mDTPA clearance) and estimated clear-ances using the three formulae. Difference between the measured GFR and estimated clearances compared with measured GFR were examined to determine whether pre-diction error was independent from measurement magnitude. Analyses of differences were used to determine bias and precision. Bias was assessed by mean percentage error (MPE), calculated as the percentage difference between the estimated clearances for each formula and measured GFR. A positive bias indicates overestimation of GFR, and a negative bias indicates underestimation. Relationships were also assessed by gender and varying levels of renal function: GFR <60 ml / min, and GFR >60 ml/ min. Results: The mean measured GFR was 77.2 ml / min (range 17 to 152 ml / min). The mean bias (mean percentage error) was -4.9, -10.3 and -1.57% respectively for the, Jel-liffe , Cockcroft and Gault, and 4MDRD formulas, respectively. The 4 MDRD formula slightly overestimates the GFR in patients having GFR less than 60ml/ min, where as,it underestimates for GFR more than 60ml / min.. Conclusion: In Indians 4 MDRD equa-tion of estimated creatinine clearance seems to be most efficient in estimating GFR . :
70th AACC Annual Scientific Meeting Abstracts, 2018 S85
Factors Affecting Test Results Tuesday, July 31, 9:30 am – 5:00 pm
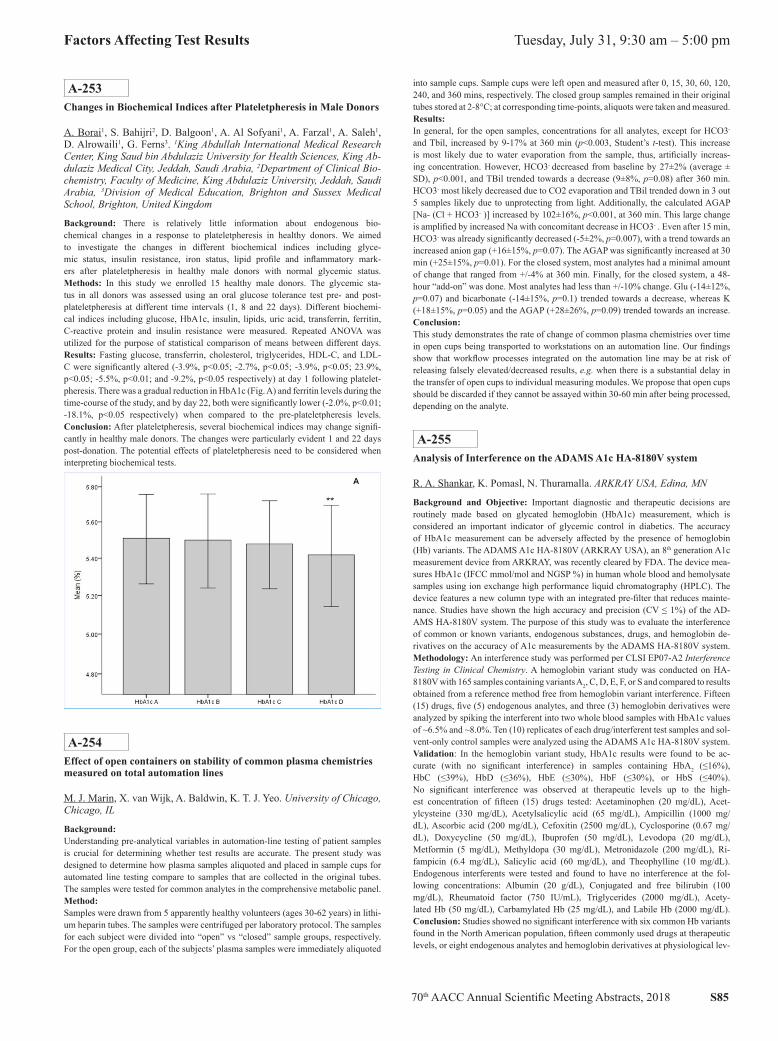
A-253Changes in Biochemical Indices after Plateletpheresis in Male Donors
A. Borai1, S. Bahijri2, D. Balgoon1, A. Al Sofyani1, A. Farzal1, A. Saleh1, D. Alrowaili1, G. Ferns3. 1King Abdullah International Medical Research Center, King Saud bin Abdulaziz University for Health Sciences, King Ab-dulaziz Medical City, Jeddah, Saudi Arabia, 2Department of Clinical Bio-chemistry, Faculty of Medicine, King Abdulaziz University, Jeddah, Saudi Arabia, 3Division of Medical Education, Brighton and Sussex Medical School, Brighton, United Kingdom
Background: There is relatively little information about endogenous bio-chemical changes in a response to plateletpheresis in healthy donors. We aimed to investigate the changes in different biochemical indices including glyce-mic status, insulin resistance, iron status, lipid profile and inflammatory mark-ers after plateletpheresis in healthy male donors with normal glycemic status. Methods: In this study we enrolled 15 healthy male donors. The glycemic sta-tus in all donors was assessed using an oral glucose tolerance test pre- and post-plateletpheresis at different time intervals (1, 8 and 22 days). Different biochemi-cal indices including glucose, HbA1c, insulin, lipids, uric acid, transferrin, ferritin, C-reactive protein and insulin resistance were measured. Repeated ANOVA was utilized for the purpose of statistical comparison of means between different days. Results: Fasting glucose, transferrin, cholesterol, triglycerides, HDL-C, and LDL-C were significantly altered (-3.9%, p<0.05; -2.7%, p<0.05; -3.9%, p<0.05; 23.9%, p<0.05; -5.5%, p<0.01; and -9.2%, p<0.05 respectively) at day 1 following platelet-pheresis. There was a gradual reduction in HbA1c (Fig. A) and ferritin levels during the time-course of the study, and by day 22, both were significantly lower (-2.0%, p<0.01; -18.1%, p<0.05 respectively) when compared to the pre-plateletpheresis levels. Conclusion: After plateletpheresis, several biochemical indices may change signifi-cantly in healthy male donors. The changes were particularly evident 1 and 22 days post-donation. The potential effects of plateletpheresis need to be considered when interpreting biochemical tests.
A-254Effect of open containers on stability of common plasma chemistries measured on total automation lines
M. J. Marin, X. van Wijk, A. Baldwin, K. T. J. Yeo. University of Chicago, Chicago, IL
Background:Understanding pre-analytical variables in automation-line testing of patient samples is crucial for determining whether test results are accurate. The present study was designed to determine how plasma samples aliquoted and placed in sample cups for automated line testing compare to samples that are collected in the original tubes. The samples were tested for common analytes in the comprehensive metabolic panel. Method:Samples were drawn from 5 apparently healthy volunteers (ages 30-62 years) in lithi-um heparin tubes. The samples were centrifuged per laboratory protocol. The samples for each subject were divided into “open” vs “closed” sample groups, respectively. For the open group, each of the subjects’ plasma samples were immediately aliquoted
into sample cups. Sample cups were left open and measured after 0, 15, 30, 60, 120, 240, and 360 mins, respectively. The closed group samples remained in their original tubes stored at 2-8°C; at corresponding time-points, aliquots were taken and measured. Results:In general, for the open samples, concentrations for all analytes, except for HCO3- and Tbil, increased by 9-17% at 360 min (p<0.003, Student’s t-test). This increase is most likely due to water evaporation from the sample, thus, artificially increas-ing concentration. However, HCO3- decreased from baseline by 27±2% (average ± SD), p<0.001, and TBil trended towards a decrease (9±8%, p=0.08) after 360 min. HCO3- most likely decreased due to CO2 evaporation and TBil trended down in 3 out 5 samples likely due to unprotecting from light. Additionally, the calculated AGAP [Na- (Cl + HCO3- )] increased by 102±16%, p<0.001, at 360 min. This large change is amplified by increased Na with concomitant decrease in HCO3- . Even after 15 min, HCO3- was already significantly decreased (-5±2%, p=0.007), with a trend towards an increased anion gap (+16±15%, p=0.07). The AGAP was significantly increased at 30 min (+25±15%, p=0.01). For the closed system, most analytes had a minimal amount of change that ranged from +/-4% at 360 min. Finally, for the closed system, a 48-hour “add-on” was done. Most analytes had less than +/-10% change. Glu (-14±12%, p=0.07) and bicarbonate (-14±15%, p=0.1) trended towards a decrease, whereas K (+18±15%, p=0.05) and the AGAP (+28±26%, p=0.09) trended towards an increase. Conclusion:This study demonstrates the rate of change of common plasma chemistries over time in open cups being transported to workstations on an automation line. Our findings show that workflow processes integrated on the automation line may be at risk of releasing falsely elevated/decreased results, e.g. when there is a substantial delay in the transfer of open cups to individual measuring modules. We propose that open cups should be discarded if they cannot be assayed within 30-60 min after being processed, depending on the analyte.
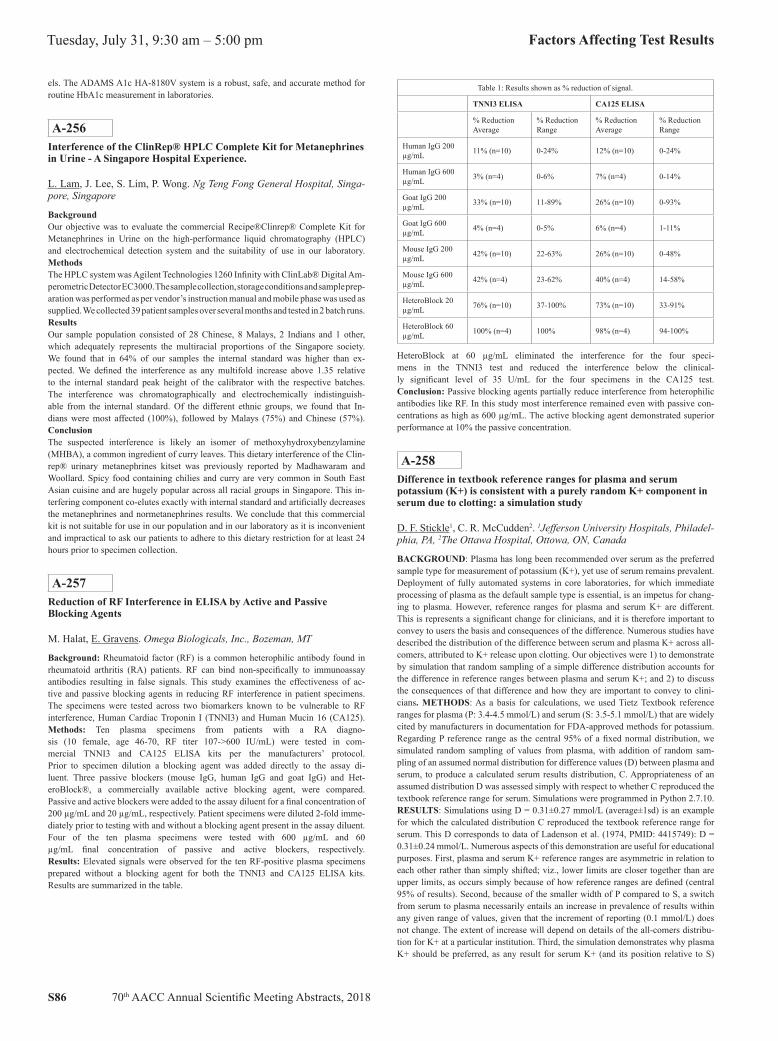
A-255Analysis of Interference on the ADAMS A1c HA-8180V system
R. A. Shankar, K. Pomasl, N. Thuramalla. ARKRAY USA, Edina, MN
Background and Objective: Important diagnostic and therapeutic decisions are routinely made based on glycated hemoglobin (HbA1c) measurement, which is considered an important indicator of glycemic control in diabetics. The accuracy of HbA1c measurement can be adversely affected by the presence of hemoglobin (Hb) variants. The ADAMS A1c HA-8180V (ARKRAY USA), an 8th generation A1c measurement device from ARKRAY, was recently cleared by FDA. The device mea-sures HbA1c (IFCC mmol/mol and NGSP %) in human whole blood and hemolysate samples using ion exchange high performance liquid chromatography (HPLC). The device features a new column type with an integrated pre-filter that reduces mainte-nance. Studies have shown the high accuracy and precision (CV ≤ 1%) of the AD-AMS HA-8180V system. The purpose of this study was to evaluate the interference of common or known variants, endogenous substances, drugs, and hemoglobin de-rivatives on the accuracy of A1c measurements by the ADAMS HA-8180V system. Methodology: An interference study was performed per CLSI EP07-A2 Interference Testing in Clinical Chemistry. A hemoglobin variant study was conducted on HA-8180V with 165 samples containing variants A2, C, D, E, F, or S and compared to results obtained from a reference method free from hemoglobin variant interference. Fifteen (15) drugs, five (5) endogenous analytes, and three (3) hemoglobin derivatives were analyzed by spiking the interferent into two whole blood samples with HbA1c values of ~6.5% and ~8.0%. Ten (10) replicates of each drug/interferent test samples and sol-vent-only control samples were analyzed using the ADAMS A1c HA-8180V system. Validation: In the hemoglobin variant study, HbA1c results were found to be ac-curate (with no significant interference) in samples containing HbA2 (≤16%), HbC (≤39%), HbD (≤36%), HbE (≤30%), HbF (≤30%), or HbS (≤40%). No significant interference was observed at therapeutic levels up to the high-est concentration of fifteen (15) drugs tested: Acetaminophen (20 mg/dL), Acet-ylcysteine (330 mg/dL), Acetylsalicylic acid (65 mg/dL), Ampicillin (1000 mg/dL), Ascorbic acid (200 mg/dL), Cefoxitin (2500 mg/dL), Cyclosporine (0.67 mg/dL), Doxycycline (50 mg/dL), Ibuprofen (50 mg/dL), Levodopa (20 mg/dL), Metformin (5 mg/dL), Methyldopa (30 mg/dL), Metronidazole (200 mg/dL), Ri-fampicin (6.4 mg/dL), Salicylic acid (60 mg/dL), and Theophylline (10 mg/dL). Endogenous interferents were tested and found to have no interference at the fol-lowing concentrations: Albumin (20 g/dL), Conjugated and free bilirubin (100 mg/dL), Rheumatoid factor (750 IU/mL), Triglycerides (2000 mg/dL), Acety-lated Hb (50 mg/dL), Carbamylated Hb (25 mg/dL), and Labile Hb (2000 mg/dL). Conclusion: Studies showed no significant interference with six common Hb variants found in the North American population, fifteen commonly used drugs at therapeutic levels, or eight endogenous analytes and hemoglobin derivatives at physiological lev-
S86 70th AACC Annual Scientific Meeting Abstracts, 2018
Tuesday, July 31, 9:30 am – 5:00 pm Factors Affecting Test Results
els. The ADAMS A1c HA-8180V system is a robust, safe, and accurate method for routine HbA1c measurement in laboratories.
A-256Interference of the ClinRep® HPLC Complete Kit for Metanephrines in Urine - A Singapore Hospital Experience.
L. Lam, J. Lee, S. Lim, P. Wong. Ng Teng Fong General Hospital, Singa-pore, Singapore
BackgroundOur objective was to evaluate the commercial Recipe®Clinrep® Complete Kit for Metanephrines in Urine on the high-performance liquid chromatography (HPLC) and electrochemical detection system and the suitability of use in our laboratory. MethodsThe HPLC system was Agilent Technologies 1260 Infinity with ClinLab® Digital Am-perometric Detector EC3000. The sample collection, storage conditions and sample prep-aration was performed as per vendor’s instruction manual and mobile phase was used as supplied. We collected 39 patient samples over several months and tested in 2 batch runs. ResultsOur sample population consisted of 28 Chinese, 8 Malays, 2 Indians and 1 other, which adequately represents the multiracial proportions of the Singapore society. We found that in 64% of our samples the internal standard was higher than ex-pected. We defined the interference as any multifold increase above 1.35 relative to the internal standard peak height of the calibrator with the respective batches. The interference was chromatographically and electrochemically indistinguish-able from the internal standard. Of the different ethnic groups, we found that In-dians were most affected (100%), followed by Malays (75%) and Chinese (57%). ConclusionThe suspected interference is likely an isomer of methoxyhydroxybenzylamine (MHBA), a common ingredient of curry leaves. This dietary interference of the Clin-rep® urinary metanephrines kitset was previously reported by Madhawaram and Woollard. Spicy food containing chilies and curry are very common in South East Asian cuisine and are hugely popular across all racial groups in Singapore. This in-terfering component co-elutes exactly with internal standard and artificially decreases the metanephrines and normetanephrines results. We conclude that this commercial kit is not suitable for use in our population and in our laboratory as it is inconvenient and impractical to ask our patients to adhere to this dietary restriction for at least 24 hours prior to specimen collection.
A-257Reduction of RF Interference in ELISA by Active and Passive Blocking Agents
M. Halat, E. Gravens. Omega Biologicals, Inc., Bozeman, MT
Background: Rheumatoid factor (RF) is a common heterophilic antibody found in rheumatoid arthritis (RA) patients. RF can bind non-specifically to immunoassay antibodies resulting in false signals. This study examines the effectiveness of ac-tive and passive blocking agents in reducing RF interference in patient specimens. The specimens were tested across two biomarkers known to be vulnerable to RF interference, Human Cardiac Troponin I (TNNI3) and Human Mucin 16 (CA125). Methods: Ten plasma specimens from patients with a RA diagno-sis (10 female, age 46-70, RF titer 107->600 IU/mL) were tested in com-mercial TNNI3 and CA125 ELISA kits per the manufacturers’ protocol. Prior to specimen dilution a blocking agent was added directly to the assay di-luent. Three passive blockers (mouse IgG, human IgG and goat IgG) and Het-eroBlock®, a commercially available active blocking agent, were compared. Passive and active blockers were added to the assay diluent for a final concentration of 200 µg/mL and 20 µg/mL, respectively. Patient specimens were diluted 2-fold imme-diately prior to testing with and without a blocking agent present in the assay diluent. Four of the ten plasma specimens were tested with 600 µg/mL and 60 µg/mL final concentration of passive and active blockers, respectively. Results: Elevated signals were observed for the ten RF-positive plasma specimens prepared without a blocking agent for both the TNNI3 and CA125 ELISA kits. Results are summarized in the table.
Table 1: Results shown as % reduction of signal.
TNNI3 ELISA CA125 ELISA
% Reduction Average
% Reduction Range
% Reduction Average
% Reduction Range
Human IgG 200 µg/mL 11% (n=10) 0-24% 12% (n=10) 0-24%
Human IgG 600 µg/mL 3% (n=4) 0-6% 7% (n=4) 0-14%
Goat IgG 200 µg/mL 33% (n=10) 11-89% 26% (n=10) 0-93%
Goat IgG 600 µg/mL 4% (n=4) 0-5% 6% (n=4) 1-11%
Mouse IgG 200 µg/mL 42% (n=10) 22-63% 26% (n=10) 0-48%
Mouse IgG 600 µg/mL 42% (n=4) 23-62% 40% (n=4) 14-58%
HeteroBlock 20 µg/mL 76% (n=10) 37-100% 73% (n=10) 33-91%
HeteroBlock 60 µg/mL 100% (n=4) 100% 98% (n=4) 94-100%
HeteroBlock at 60 µg/mL eliminated the interference for the four speci-mens in the TNNI3 test and reduced the interference below the clinical-ly significant level of 35 U/mL for the four specimens in the CA125 test. Conclusion: Passive blocking agents partially reduce interference from heterophilic antibodies like RF. In this study most interference remained even with passive con-centrations as high as 600 µg/mL. The active blocking agent demonstrated superior performance at 10% the passive concentration.
A-258Difference in textbook reference ranges for plasma and serum potassium (K+) is consistent with a purely random K+ component in serum due to clotting: a simulation study
D. F. Stickle1, C. R. McCudden2. 1Jefferson University Hospitals, Philadel-phia, PA, 2The Ottawa Hospital, Ottowa, ON, Canada
BACKGROUND: Plasma has long been recommended over serum as the preferred sample type for measurement of potassium (K+), yet use of serum remains prevalent. Deployment of fully automated systems in core laboratories, for which immediate processing of plasma as the default sample type is essential, is an impetus for chang-ing to plasma. However, reference ranges for plasma and serum K+ are different. This is represents a significant change for clinicians, and it is therefore important to convey to users the basis and consequences of the difference. Numerous studies have described the distribution of the difference between serum and plasma K+ across all-comers, attributed to K+ release upon clotting. Our objectives were 1) to demonstrate by simulation that random sampling of a simple difference distribution accounts for the difference in reference ranges between plasma and serum K+; and 2) to discuss the consequences of that difference and how they are important to convey to clini-cians. METHODS: As a basis for calculations, we used Tietz Textbook reference ranges for plasma (P: 3.4-4.5 mmol/L) and serum (S: 3.5-5.1 mmol/L) that are widely cited by manufacturers in documentation for FDA-approved methods for potassium. Regarding P reference range as the central 95% of a fixed normal distribution, we simulated random sampling of values from plasma, with addition of random sam-pling of an assumed normal distribution for difference values (D) between plasma and serum, to produce a calculated serum results distribution, C. Appropriateness of an assumed distribution D was assessed simply with respect to whether C reproduced the textbook reference range for serum. Simulations were programmed in Python 2.7.10. RESULTS: Simulations using D = 0.31±0.27 mmol/L (average±1sd) is an example for which the calculated distribution C reproduced the textbook reference range for serum. This D corresponds to data of Ladenson et al. (1974, PMID: 4415749): D = 0.31±0.24 mmol/L. Numerous aspects of this demonstration are useful for educational purposes. First, plasma and serum K+ reference ranges are asymmetric in relation to each other rather than simply shifted; viz., lower limits are closer together than are upper limits, as occurs simply because of how reference ranges are defined (central 95% of results). Second, because of the smaller width of P compared to S, a switch from serum to plasma necessarily entails an increase in prevalence of results within any given range of values, given that the increment of reporting (0.1 mmol/L) does not change. The extent of increase will depend on details of the all-comers distribu-tion for K+ at a particular institution. Third, the simulation demonstrates why plasma K+ should be preferred, as any result for serum K+ (and its position relative to S)
70th AACC Annual Scientific Meeting Abstracts, 2018 S87
Factors Affecting Test Results Tuesday, July 31, 9:30 am – 5:00 pm
is highly imprecise with respect to values for plasma K+ that may have produced it (and their positions relative to P). CONCLUSIONS: Simulations demonstrate that textbook plasma and serum K+ reference ranges are consistent with a purely random component of serum K+. The basis and consequences of this relationship, and the advantages of plasma, are important to convey to clinicians when change from serum to plasma is contemplated.
A-259Quality Control Materials With Extended Availability
S. B. Reichberg, R. T. Aniceto. Northwell/Hofstra School of Medicine, Lake Success, NY
INTRODUCTION:A foremost advantage of laboratory networks is the harmoniza-tion of patient test results. Network laboratory analytical qual-ity control (QC) results can be leveraged to help achieve this goal. To that effect, our healthcare laboratory network, consisting of a Core and of 17 hospital lab-oratories, uses the same lot of control materials throughout. During monthly QC reviews, this allows detection of significant result clustering that requires further investigation. Bias detection relies on the long-term availability of QC materials of the same lot. Switching from one lot to another is expensive and demanding, even for individual laboratories, and the complexity of a simultaneous switch in several laboratories multiplies this challenge. Here, we describe the vali-dation of chemistry QC materials from a vendor that ensures extended (3 year) lots availability and consolidates six different QC materials into two. MATERIAL AND METHODS:Results from Bio-Rad™ (Bio-Rad Laboratories, Hercules, California) QC materials in routine use at the time, were compared with results from QC materials provided by Tech-noPath Clinical Diagnostics™ (Tipperary, Ireland). Roche Diagnostics Cobas™ chem-istry and immunoassay testing systems in routine use at the Core laboratory were utilized. Two levels of the same QC material were analyzed for 26 routine chemistry tests 15 times over 13 days using the Bio-Rad materials Multiqual™ Chem-istry, Liquichek Immunology™, and Liquicheck IA Plus.™ The results were compared to corresponding results obtained during the same analytical run us-ing two levels of the single TechnoPath Multichem S Plus™ QC material. 31 - 34 sets of results of two or three levels were obtained for each of 24 differ-ent immunoassay tests across 13 days using the Bio-Rad Liquichek IA Plus™, Liquichek Cardiac Marker™, Liquichek Tumor Marker™ and the Liquichek Specialty IA Plus™ materials. They were compared with corresponding re-sults obtained with the single TechnoPath IA Plus™ QC product. In the case of immunoassays, control materials from both manufacturers were tested next to each other, using the same reagent pack and instrument measuring cell. Calculations:Imprecision was estimated with the coefficient of variation (CV). The ra-tios of the TechnoPath CV over BioRad CV were assessed. A ratio of less than 1.0 indicates that the imprecision estimate using the Techno-Path products was lower than that of the corresponding BioRad material. RESULTS:Out of the 52 (26 tests x 2 levels) CV ratios obtained from the chemistry controls, and out of 40 CV ratios obtained using two or three levels of immunoassay controls, 28 and 20 were less than 0.9, respectively. Few of these ratios achieved statistical significance in the F-test. Thus, test result imprecision estimates using TechnoPath QC mate-rials were at least equivalent to those using BioRad control results. DISCUSSION:The validation was repeated with similar results by each of the participant laboratories using the lot scheduled for routine use. Then, both TechnoPath chemistry and im-munoassay QC materials were placed into production. The laboratory network staff is looking forward to a lot change three years from that date, compared with thirteen lot changes in the previous three years.
A-260Evaluation of the Atellica CH Assays Sigma Metrics
J. T. Snyder, K. Estock, J. Pierson-Perry, J. Cheek. Siemens Healthcare Diagnostics Inc, Newark, DE
Background: The purpose of the investigation was to evaluate the performance qual-ity of several Atellica® CH Assays using the Six Sigma philosophy. Six Sigma is a process that uses techniques to identify, quantify, and reduce sources of variability in a product or process. The Sigma metric evaluates the bias between a quality speci-fication and what was observed for that process. This value is expressed in terms
of standard deviation (SD). Generally, a Sigma metric of 3 is the minimum quality threshold for a process, and a Sigma metric of 6 or greater is considered to be superior quality. Allowable total error (ATE) is often the quality specification used to evalu-ate assay performance, as it reflects the maximum error in an assay result that will not change the associated medical decision. Typically, within-lab precision data from quality control (QC) or patient samples—obtained from the assay’s instructions for use or historical QC measurements from the laboratory—are used in the evaluation of assay performance. It is common to use a single analyte value, such as a medical decision level, for the calculation. ATE values can be difficult to obtain, as they vary from source to source and may not be available for all assays. For some laboratories, the source of the ATE value is mandated by a regulatory agency, such as CLIA in the U.S. Other sources include the regulatory agencies RiliBÄK (Germany) and RCPA (Australia), a representative clinician consensus, or the biological variable of the ana-lyte. Method: There are four inputs required for the calculation of the Sigma metric: analyte concentration, ATE value, estimated bias, and estimated precision at the speci-fied concentration. For the Atellica CH Assays, precision and bias input values were obtained from the respective Atellica CH Assays IFUs. Precision was determined in accordance with CLSI document EP05-A3, where samples were assayed on the Atel-lica CH Analyzer in duplicate for 20 days. Bias at the selected analyte concentration was calculated using the assay’s method comparison data, which was determined in accordance with CLSI document EP09-A3. The CLIA table was the primary source for an assay’s ATE. However, if a value did not exist in the CLIA table, other sources that were used included the RiliBÄK table, RCPA table, Ricos Biological Variability, DGKL proficiency survey-acceptance criteria, or CAP proficiency survey-assessment criteria. Results: Of the 72 Atellica CH Assays analyzed, 52 assays obtained a Sigma level of >6.0, 20 assays obtained a level between 3.0 and 6.0, and 0 assays obtained a level of <3.0. Conclusions: Using the Six Sigma philosophy, all Atellica CH Assays that were analyzed obtained the minimum quality threshold of 3.0 or greater on the Sigma scale, and therefore demonstrateclinically acceptable performance.
A-261Performance Evaluation of the Serum Indices Feature on the Atellica CH Analyzer
J. T. Snyder, K. Estock, J. Davis, J. Cheek. Siemens Healthcare Diagnostics Inc, Newark, DE
Background: The Atellica® Chemistry (CH) Analyzer includes an HIL alert feature to notify the operator of potential interference from hemolysis (H), icterus (I), and lipemia (L) in serum and plasma samples. The system automatically displays the rec-ommended HIL alert indices in an assay-test definition if HIL can potentially affect a test result. These indices specify the lowest concentration of hemoglobin, bilirubin, and lipemia that can affect the result. HIL indices are reported with the ALT, AST, LDLP, and UN_c assays as well as a stand-alone HIL test. The objective of this study was to evaluate the analytical performance of the HIL feature. Method: Samples were prepared by adding hemoglobin, bilirubin, and INTRALIPID® to normal serum pools. The H and L indices were assigned based on the expected concentrations. The I indi-ces were assigned using the Atellica CH TBil_2 Assay. Seven hemoglobin levels, six bilirubin levels, and nine lipemia levels were prepared and tested for HIL index output using the ALT, AST, LDLP, and UN_c assays and the stand-alone HIL test. Resultant index values were compared to the expected index values. Results: For hemolysis, the Atellica CH Analyzer correctly matched the expected values 35 out of 35 times. For icterus, the Atellica CH Analyzer correctly matched the expected values 25 out of 30 times. The 30.0 mg/dL bilirubin sample straddled the third and fourth index buckets, producing the following mean Atellica CH Analyzer results: ALT = 28.8 mg/dL, ALT = 29.1 mg/dL, ALT = 28.7 mg/dL, ALT = 29.2 mg/dL, and ALT = 28.7 mg/dL. For lipemia, the Atellica CH Analzyer correctly matched the expected values 44 out of 45 times. The 2800 mg/dL INTRALIPID sample produced the following mean Atellica CH Analyzer results: ALT = 3014 mg/dL, ALT = 3011 mg/dL, ALT = 3018 mg/dL, ALT = 3003 mg/dL, and ALT = 2980 mg/dL. Conclusions: The Atellica CH Analyzer HIL output produced by the stand-alone HIL test and ALT, AST, LDLP, and UN_c assays agrees with the expected values within ±1 index unit.
S88 70th AACC Annual Scientific Meeting Abstracts, 2018
Tuesday, July 31, 9:30 am – 5:00 pm Factors Affecting Test Results
A-262Comparison of Results from Paired Specimens Collected in BD Vacutainer Barricor Plasma Collection Tubes and BD Vacutainer PST Tubes
S. L. La’ulu1, K. Warner2, K. C. Fisher2, J. R. Genzen3. 1ARUP Institute for Clinical and Experimental Pathology, Salt Lake City, UT, 2ARUP Labora-tories, Salt Lake City, UT, 3Department of Pathology, University of Utah, Salt Lake City, UT
Background: Conventional plasma separator tubes use a thixotropic gel to isolate plas-ma from cellular components after centrifugation. Recently, a plasma collection tube which uses a mechanical separator has been marketed for use in the U.S. (Vacutainer Barricor Plasma Collection Tube; BD Diagnostics, Franklin Lakes, NJ). The objective of this study was to conduct a comparison of analytical results obtained from paired spec-imens collected using Barricor tubes and BD Vacutainer PST tubes, in order to verify whether Barricor tubes are acceptable for the assays investigated in the present report. Methods: Using an IRB-approved protocol, healthy volunteer donors (10 female, 10 male; 22-63 years of age) were recruited. Both a PST and Barricor tube were drawn from each volunteer. Collection tubes were processed according to manufacturer in-structions. After separation of plasma from cells, testing was performed using fresh samples for a variety of immunoassay and chemistry assays available in our labora-tory for which lithium-heparin plasma specimens are acceptable: cobas c502 & c702 (Roche Diagnostics; Indianapolis, IN): alanine aminotransferase, albumin, alkaline phosphatase, alpha-1 antitrypsin, amylase, aspartate aminotransferase, beta-2 micro-globulin, direct bilirubin, total bilirubin, blood urea nitrogen, calcium, carbon dioxide, chloride, cholesterol, complement component 4, c-reactive protein, creatine kinase, creatinine, fructosamine, gamma-glutamyl transferase, glucose, haptoglobin, high density lipoprotein, high sensitivity c-reactive protein, homocysteine, iron, lactate de-hydrogenase, lipase, lipoprotein (a), direct low density lipoprotein, magnesium, pan-creatic amylase isoenzyme, phosphate, potassium, prealbumin, rheumatoid factor, so-dium, soluble transferrin receptor, total protein, transferrin, triglycerides, unsaturated iron binding capacity, uric acid; cobas e602 (Roche): cancer antigen 125, cancer an-tigen 15-3, cancer-antigen 19-9, carcinoembryonic antigen, dehydroepiandrosterone sulfate, follicle stimulating hormone, free prostate specific antigen, free thyroxine, free triiodothyronine, human chorionic gonadotropin, luteinizing hormone, myoglo-bin, parathyroid hormone, PSA, sex hormone binding globulin, testosterone, thyroid stimulating hormone, thyroxine, triiodothyronine, t-uptake; UniCel DxI (Beckman Coulter Diagnostics, Brea, CA): bone-specific alkaline phosphatase, estradiol, folate, thyroglobulin, thyroglobulin antibodies, thyroid peroxidase antibodies, vitamin B12; and Integra (Roche Diagnostics): ceruloplasmin. Prism (GraphPad Software; La Jolla, CA) and Excel 2010 (Microsoft; Redmond, WA) were used for statistical analysis. Results: Direct bilirubin and human chorionic gonadotropin were excluded from analysis due to low analyte concentration in donors. Clinically significant differences (based on desired specification for inaccuracy as listed in the Westgard Desirable Biological Variation Database and/or package inserts) were not observed between Barricor and PST tubes for any of the analytes investigated. Small (but statistically significant, p<0.05) differences were observed for several analytes (alanine amino-transferase, alkaline phosphatase, amylase, total bilirubin, calcium, fructosamine, glucose, high density lipoprotein, homocysteine, iron, potassium, unsaturated iron binding capacity, carcinoembryonic antigen, testosterone, and triiodothyro-nine) although none of these differences would be considered clinically relevant. Conclusion: Barricor tubes were verified as acceptable collection tube types for the analyte / instrument combinations investigated in the present report. Future studies should be conducted to verify performance with analyte concentrations encountered in pathologic states.
A-263Assessment of Panhematin interference in commonly ordered chemistry tests
G. R. Williams, M. A. Cervinski. Dartmouth-Hitchcock Medical Center, Lebanon, NH
Background: Acute intermittent porphyria is estimated to affect about 1 in 20,000 individuals. The porphyrias are a group of eight metabolic disorders, mainly inherited, which result in the accumulation of heme precursors. This accumulation can lead to abdominal pain, an eczema-like rash, and psychiatric symptoms. Complications may include hyponatremia, peripheral neuropathy sometimes causing paralysis, seizures and psychiatric features (PMID: 27982422). Attacks of porphyria may progress to a point where irreversible neuronal damage has occurred (PMID: 200860) and in severe cases liver transplant may be required. Treatment of acute porphyria crises is largely
limited to supportive care but may include treatment with hemin (Panhematin), to provide negative feedback inhibition to the heme precursor generation loop. Treat-ment of the patient with panhematin results in a dark brownish colored plasma. For physicians and labortorians interested in the assessment of the patient’s basic me-tabolism and liver function, concern has arisen for panhematin induced colorimetric interference of spectrophotometric chemistry tests. Objective: To evaluate effect of hemin (panhematin) on commonly ordered spectrophotometric tests. Methods: To investigate the possibility of panhematin induced spectrophotometric interference of commonly ordered chemistry tests, remnant plasma or whole blood were combined to generate pools of samples spanning the analytical range for 25 colorimetric or im-munometric assays on a Cobas 6000 analyzer (Roche, Indianapolis, IN) tested in this study. To these pools, panhematin was added at increasing concentrations of 10, 30, and 100 mcg/mL. The effect of panhematin at 100 mcg/mL on blood gas analysis was also assess using the EG7+ cartridge on an iStat point-of-care (Abbott Diagnostics, Abbott Park, Illinois) analyzer. Results: The analyte values of the panhematin-altered samples were compared to the unaltered baseline values via ANOVA. The ANOVA analysis revealed no significant differences in analyte concentration attributable to panhematin. Panhematin similarly had no significant effect on the blood gas param-eters measured on the iSTAT analyzer. Conclusion: Treatment of patients experienc-ing acute attacks of porphyria with panhematin does cause the patient’s plasma to change color but this color change does not significantly affect lab values produced by a Cobas 6000 analyzer or iSTAT EG7+ blood gas cartridge.
A-264Methodology Of Creatinine Measurement Can Affect Characteristics And Outcome Pattern In Hospitalized Patients With An Acute Kidney Injury
B. Betz, T. Buechner, S. Dietsch, H. Hoyer, M. Kiehntopf. University Hos-pital of Jena, Jena, Germany
Background: The diagnosis of acute kidney injury (AKI) in hospitalized patients is as-sociated with adverse outcomes. Blood creatinine, the main marker to define AKI, can be measured by the kinetic Jaffé reaction method or an enzyme-based assay. It is not known so far, whether the method for creatinine measurement can affect the diagnosis of AKI. Methods: In a prospective observational study creatinine was measured simultaneously by both assays in patients from a tertiary care hospital using Abbott Reagent KitsTM. AKI was diagnosed based on the Kidney Disease: Improving Global Outcomes guideline criteria. Results: From 4590 patients 850 (18.5%) met AKI-criteria by measurement of either assay. 514 (60.4%) were diagnosed by both assays while 168 (19.8%) were detected exclusively or earlier by the Jaffé or enzymatic method respectively. The mean age was significantly lower (66 [56-77] vs 74 [64-79] years) and renal function at admis-sion was significantly better (mean eGFR 83 [65-96] vs 50 [38-68] mL/min/1.73m2) of AKI patients diagnosed exclusively or earlier by the enzymatic method compared to the Jaffé assay. The AKI stages of patients detected by the Jaffe assay were signifi-cantly higher compared to the enzymatic method. The incidence of a composite end-point including in-hospital mortality and dialysis was similar between both methods (23%). After adjustment for age and renal function the area under the receiver operat-ing characteristic curve for the combined endpoint among AKI-patients detected by either assay was slightly but significantly higher for the enzymatic method in com-parison with the Jaffe method (0.665 [0.632-0.697] vs 0.636 [0.603-0.669], Figure). Conclusion: We demonstrate that the cohorts of patients with AKI detected by the respective assay not only differ systematically in basic demographics but also in the risk profile for adverse outcomes.
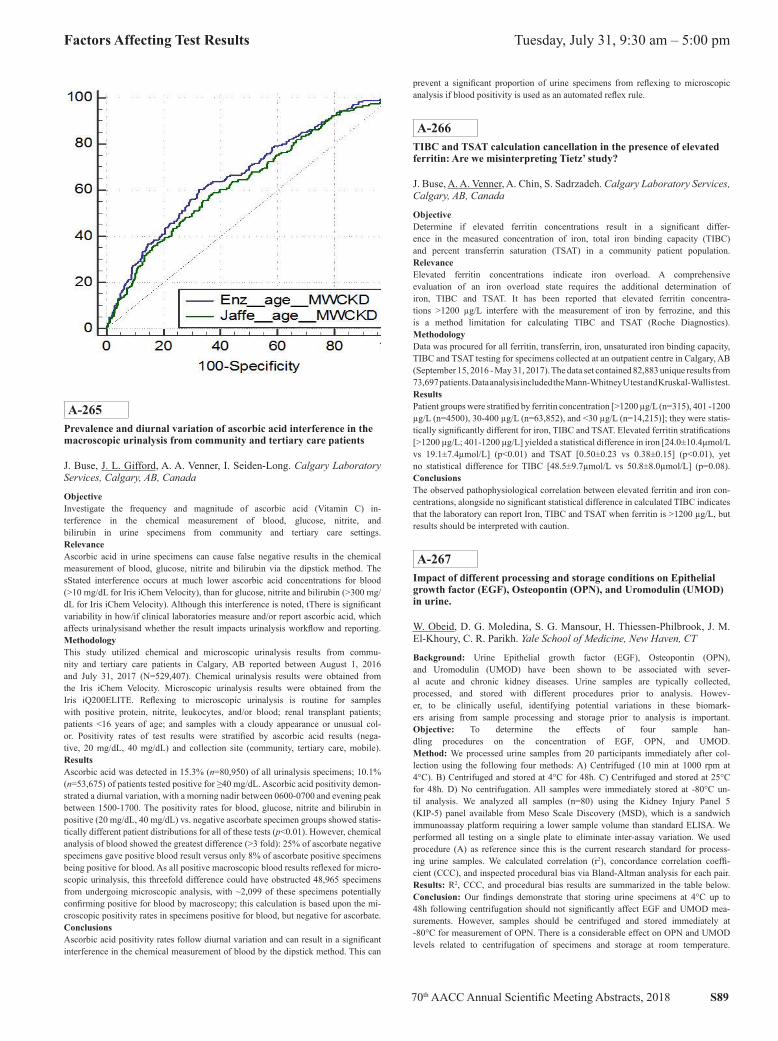
70th AACC Annual Scientific Meeting Abstracts, 2018 S89
Factors Affecting Test Results Tuesday, July 31, 9:30 am – 5:00 pm
A-265Prevalence and diurnal variation of ascorbic acid interference in the macroscopic urinalysis from community and tertiary care patients
J. Buse, J. L. Gifford, A. A. Venner, I. Seiden-Long. Calgary Laboratory Services, Calgary, AB, Canada
ObjectiveInvestigate the frequency and magnitude of ascorbic acid (Vitamin C) in-terference in the chemical measurement of blood, glucose, nitrite, and bilirubin in urine specimens from community and tertiary care settings. RelevanceAscorbic acid in urine specimens can cause false negative results in the chemical measurement of blood, glucose, nitrite and bilirubin via the dipstick method. The sStated interference occurs at much lower ascorbic acid concentrations for blood (>10 mg/dL for Iris iChem Velocity), than for glucose, nitrite and bilirubin (>300 mg/dL for Iris iChem Velocity). Although this interference is noted, tThere is significant variability in how/if clinical laboratories measure and/or report ascorbic acid, which affects urinalysisand whether the result impacts urinalysis workflow and reporting. MethodologyThis study utilized chemical and microscopic urinalysis results from commu-nity and tertiary care patients in Calgary, AB reported between August 1, 2016 and July 31, 2017 (N=529,407). Chemical urinalysis results were obtained from the Iris iChem Velocity. Microscopic urinalysis results were obtained from the Iris iQ200ELITE. Reflexing to microscopic urinalysis is routine for samples with positive protein, nitrite, leukocytes, and/or blood; renal transplant patients; patients <16 years of age; and samples with a cloudy appearance or unusual col-or. Positivity rates of test results were stratified by ascorbic acid results (nega-tive, 20 mg/dL, 40 mg/dL) and collection site (community, tertiary care, mobile). ResultsAscorbic acid was detected in 15.3% (n=80,950) of all urinalysis specimens; 10.1% (n=53,675) of patients tested positive for ≥40 mg/dL. Ascorbic acid positivity demon-strated a diurnal variation, with a morning nadir between 0600-0700 and evening peak between 1500-1700. The positivity rates for blood, glucose, nitrite and bilirubin in positive (20 mg/dL, 40 mg/dL) vs. negative ascorbate specimen groups showed statis-tically different patient distributions for all of these tests (p<0.01). However, chemical analysis of blood showed the greatest difference (>3 fold): 25% of ascorbate negative specimens gave positive blood result versus only 8% of ascorbate positive specimens being positive for blood. As all positive macroscopic blood results reflexed for micro-scopic urinalysis, this threefold difference could have obstructed 48,965 specimens from undergoing microscopic analysis, with ~2,099 of these specimens potentially confirming positive for blood by macroscopy; this calculation is based upon the mi-croscopic positivity rates in specimens positive for blood, but negative for ascorbate. ConclusionsAscorbic acid positivity rates follow diurnal variation and can result in a significant interference in the chemical measurement of blood by the dipstick method. This can
prevent a significant proportion of urine specimens from reflexing to microscopic analysis if blood positivity is used as an automated reflex rule.
A-266TIBC and TSAT calculation cancellation in the presence of elevated ferritin: Are we misinterpreting Tietz’ study?
J. Buse, A. A. Venner, A. Chin, S. Sadrzadeh. Calgary Laboratory Services, Calgary, AB, Canada
ObjectiveDetermine if elevated ferritin concentrations result in a significant differ-ence in the measured concentration of iron, total iron binding capacity (TIBC) and percent transferrin saturation (TSAT) in a community patient population. RelevanceElevated ferritin concentrations indicate iron overload. A comprehensive evaluation of an iron overload state requires the additional determination of iron, TIBC and TSAT. It has been reported that elevated ferritin concentra-tions >1200 µg/L interfere with the measurement of iron by ferrozine, and this is a method limitation for calculating TIBC and TSAT (Roche Diagnostics). MethodologyData was procured for all ferritin, transferrin, iron, unsaturated iron binding capacity, TIBC and TSAT testing for specimens collected at an outpatient centre in Calgary, AB (September 15, 2016 - May 31, 2017). The data set contained 82,883 unique results from 73,697 patients. Data analysis included the Mann-Whitney U test and Kruskal-Wallis test. ResultsPatient groups were stratified by ferritin concentration [>1200 µg/L (n=315), 401 -1200 µg/L (n=4500), 30-400 µg/L (n=63,852), and <30 µg/L (n=14,215)]; they were statis-tically significantly different for iron, TIBC and TSAT. Elevated ferritin stratifications [>1200 µg/L; 401-1200 µg/L] yielded a statistical difference in iron [24.0±10.4µmol/L vs 19.1±7.4µmol/L] (p<0.01) and TSAT [0.50±0.23 vs 0.38±0.15] (p<0.01), yet no statistical difference for TIBC [48.5±9.7µmol/L vs 50.8±8.0µmol/L] (p=0.08). ConclusionsThe observed pathophysiological correlation between elevated ferritin and iron con-centrations, alongside no significant statistical difference in calculated TIBC indicates that the laboratory can report Iron, TIBC and TSAT when ferritin is >1200 µg/L, but results should be interpreted with caution.
A-267Impact of different processing and storage conditions on Epithelial growth factor (EGF), Osteopontin (OPN), and Uromodulin (UMOD) in urine.
W. Obeid, D. G. Moledina, S. G. Mansour, H. Thiessen-Philbrook, J. M. El-Khoury, C. R. Parikh. Yale School of Medicine, New Haven, CT
Background: Urine Epithelial growth factor (EGF), Osteopontin (OPN), and Uromodulin (UMOD) have been shown to be associated with sever-al acute and chronic kidney diseases. Urine samples are typically collected, processed, and stored with different procedures prior to analysis. Howev-er, to be clinically useful, identifying potential variations in these biomark-ers arising from sample processing and storage prior to analysis is important. Objective: To determine the effects of four sample han-dling procedures on the concentration of EGF, OPN, and UMOD. Method: We processed urine samples from 20 participants immediately after col-lection using the following four methods: A) Centrifuged (10 min at 1000 rpm at 4°C). B) Centrifuged and stored at 4°C for 48h. C) Centrifuged and stored at 25°C for 48h. D) No centrifugation. All samples were immediately stored at -80°C un-til analysis. We analyzed all samples (n=80) using the Kidney Injury Panel 5 (KIP-5) panel available from Meso Scale Discovery (MSD), which is a sandwich immunoassay platform requiring a lower sample volume than standard ELISA. We performed all testing on a single plate to eliminate inter-assay variation. We used procedure (A) as reference since this is the current research standard for process-ing urine samples. We calculated correlation (r2), concordance correlation coeffi-cient (CCC), and inspected procedural bias via Bland-Altman analysis for each pair. Results: R2, CCC, and procedural bias results are summarized in the table below. Conclusion: Our findings demonstrate that storing urine specimens at 4°C up to 48h following centrifugation should not significantly affect EGF and UMOD mea-surements. However, samples should be centrifuged and stored immediately at -80°C for measurement of OPN. There is a considerable effect on OPN and UMOD levels related to centrifugation of specimens and storage at room temperature.

S90 70th AACC Annual Scientific Meeting Abstracts, 2018
Tuesday, July 31, 9:30 am – 5:00 pm Factors Affecting Test Results
Table. Description of study procedures, correlation, concordance, and mean bias for each procedure
Group A B C D
Centrifugation Yes Yes Yes No
Temporary storage None 4°C for 48h 25°C for 48h None
EGF Ref. 0.99, 0.99, -0.9% 0.99, 0.99, -8.6% 0.99, 0.99, -4.1%
OPN Ref. 0.99, 0.98, -15% 0.81, 0.69, -65% 0.86, 0.92, 0.21%
UMOD Ref. 0.98, 0.96, -4.7% 0.87, 0.83, -21% 0.79, 0.79, 31%
A-268US Laboratories Proficiency Testing Performances from 1994-2016: Results reported to the Centers for Medicare & Medicaid Services
L. Nguyen, G. Mitchell, J. Astles, L. Fan, Y. Xia. Centers for Disease Con-trol and Prevention, Atlanta, GA
Background:The Clinical Laboratory Improvement Amendments of 1988 (CLIA) regulations re-quire laboratories performing nonwaived patient testing to perform proficiency test-ing (PT) for specified analytes in Subpart I of CLIA regulations. For these analytes, laboratories participate in PT events three times annually. Typically, each event has five challenge samples, which are scored using acceptance criteria published in the CLIA regulations. Laboratories must achieve a score of at least 80% (4 of 5 accept-able results) for a “satisfactory” event score. This study aims to extend a previous PT performance evaluation from 1994-20061 with additional data from 2007-2016. Methods:We used CLIA data from the Centers for Medicare & Medicaid Services Qual-ity Information and Evaluation System database from 1994-2016. Using similar methodology,1 we categorized laboratories required to perform PT prior to imple-mentation of CLIA (i.e.hospital and independent) as HI, and laboratories previ-ously unregulated by CLIA (i.e. all other testing sites) as AOT. Approximately 12,000,000 PT events were analyzed overall, performed by an average of 33,531 laboratories each year (roughly 9,000 HI and 23,000 AOT laboratories annu-ally). We compared unsatisfactory PT event rates of HI and AOT laboratories for 15 analytes: alanine aminotransferase, amylase, bilirubin, cholesterol, digoxin, glucose, hemoglobin, leukocyte count, potassium, prothrombin time, theophylline, thyroxine, triglycerides, white blood cell differential, and uric acid. PT events as-sociated with reason codes (e.g. non-performance of PT, ungradable PT) were ex-cluded since scores would not reflect analytical performance of the testing sites. A Mantel-Haenszel test was used to calculate odds ratios for HI compared to AOT. Results:Unsatisfactory PT performance for fourteen analytes decreased from 1994-2016 for both HI and AOT laboratories. In 1994, unsatisfactory PT rates ranged 0.94%-4.07% and 4.82%-11.72% for HI and AOT laboratories, respectively. By 2006, HI rates ranged from 0.27%-1.98% and AOT rates ranged 0.67%-4.86%. By 2016, rates decreased to 0.26%-2.21% for HI and 0.49%-2.97% for AOT. Rates increased for only one analyte (white blood cell differential) among HI laboratories, by 1% from 1994-2016. The odds ratios of unsatisfactory rates between HI and AOT laboratories ranged from 2.57-11.2 in 1994, and decreased to 0.86-2.51 by 2016. Conclusions:Since CLIA implementation, improvements in PT performance were greater for AOT than HI. PT requirements for HI laboratories existed prior to CLIA and may explain the initial large differences from AOT. AOT laboratories made sub-stantial improvements in PT performance and are becoming comparable to HI laboratories. Improved PT performance for both laboratory categories are most likely multifactorial and may be attributable to CLIA regulations, improved technology, and staff experience performing PT; thus, the impact of these and other factors on PT performance should be explored further. The results pre-sented in this study is one way of evaluating the data. Future studies may evalu-ate the data set with different variables and analyses providing a new perspective. 1. Arch. Pathol. Lab. Med. 2010;134:751.
A-2695-day storage and sedimentation partially affect routine analyte stability for clinical studies and biobanking
N. Sédille, C. Schild, A. B. Leichtle. Inselspital - Bern University Hospital, Bern, Switzerland
Background: Specimen collection, processing, receiving, and retrieval are key processes for biobank sample quality, that have recently been imple-mented in the latest ISBER guidelines. While quality is always defined for a specific purpose, preanalytical efforts increase massively with speed and cooling levels. We investigated, whether high-throughput processing and in-termediate storage in a fully automated clinical chemistry lab is sufficient to maintain the quality of routine analytes for clinical studies and biobanking. Methods: We randomly collected 20 patients’ leftover sera after routine analysis. From each sample three layers from the top to the bottom were ex-tracted on day 1, 3, and 5. Following analytes were measured: potassium, so-dium, protein total, TSH, FT3, FT4, HDL cholesterol, triglycerides, lipase, and IgG. During these 5 days the samples were refrigerated at 4 °C. All analytes were determined on a Roche™ Cobas 8000 analyzer. We used generalized lin-ear mixed effects modeling with analyte levels as dependent, storage days and layers and their interaction as fixed and patient pseudo-ID as random effects. Results: We found small effects of measurement day for potas-sium and protein, lipase, HDL, and sodium. After multiple test-ing correction, only potassium and protein remained significant. Conclusion: Levels of the tested analytes with exception of potassium and protein are stable when automatically refrigerated for up to 5 days in clinical routine. Even for sedimentation-prone analytes (e.g. lipids, protein) no significant change or differences between layers could be observed. While the effect sizes are very small (e.g. <3% for potassium), the statistical significance does not reflect clinical relevance - neverthe-less, for large scale evaluations this minute effect should be kept in mind. We conclude that processing and up to 5 days intermediate storage on a total lab automation system (TLA) is sufficient to maintain the quality of the aforementioned routine analytes for clinical studies.
A-270Assessing the impact of biotin and simulating patient risk using the Elecsys Troponin T Gen 5 STAT assay
B. M. Katzman, C. L. Rosemark, A. M. Wockenfus, D. R. Block, L. J. Do-nato, B. S. Karon, A. S. Jaffe, N. A. Baumann. Mayo Clinic, Rochester, MN
Background: Recent attention has focused on erroneous immunoassay results due to biotin interference. We previously conducted a study measuring biotin concentrations in plasma samples from patients in the Emergency Department (ED) to assess the prevalence of potentially interfering biotin concentrations. One concern within the ED setting is biotin interference with critical tests such as Troponin T. In our pre-vious study, 1.7% of patient samples had biotin concentrations ≥20 ng/mL (range: 20-280 ng/mL) which is the manufacturer’s claim for biotin interference with the Elecsys Troponin T Gen 5 STAT immunoassay (Gen5 TnT, Roche Diagnostics, Inc.). In the current study, we verified the biotin interference threshold for the Gen5 TnT assay and used simulation based upon observed biotin concentrations in ED pa-tients to assess the risk of clinically significant interference for the Gen5 TnT assay. Methods: Biotin interference studies were performed by adding varying concentrations of biotin (Sigma-Aldrich) to plasma pools with three target TnT concentrations (low: 10-13 ng/L; medium: 40-42 ng/L; high: 177-194 ng/L). Plasma was mixed with biotin stock solution (9:1, high biotin pool) or saline (9:1, zero pool). The zero and high bio-tin plasma pools were mixed to create eleven samples (0-200 ng/mL biotin). Samples were analyzed on the Roche Cobas® e602 and e411. Clinically significant bias, defined as change in result of 4 ng/L or 10%, was used to determine biotin interference thresh-olds. Using biotin concentrations previously measured in specimens from ED patients and applying linear regression analysis equations from each biotin interference exper-iment on the e411 (STAT lab analyzer for ED specimens), the proportion of patients at risk for clinically significant decreases in hypothetical TnT results was simulated. Results: The biotin interference thresholds for the low, medium, and high TnT pools were 100 ng/mL, 20 ng/mL, and 40 ng/mL, respectively, for the e411 and 120 ng/mL, 40 ng/mL, and 20 ng/mL, respectively, for the e602. The simulation data revealed the percentage of patients (of 1442 total samples originally studied) who would have had clinically significant decreases in TnT results due to biotin interference (range of false decrease) at the following hypothetical TnT concentrations: 13 ng/L, 0.2% (4-9 ng/L decrease); 40 ng/L, 0.8% (4-34 ng/L decrease); 177 ng/L, 0.4% (20-169 ng/L decrease). Conclusions: The threshold for biotin interference on the Gen5 TnT assay varies de-
70th AACC Annual Scientific Meeting Abstracts, 2018 S91
Factors Affecting Test Results Tuesday, July 31, 9:30 am – 5:00 pm
pending on TnT concentration and analyzer model (e411 vs. e602). Based on our findings, up to 0.8% of ED patients would be at risk for clinically significant decreases in TnT values of at least 4 ng/L due to biotin interference. Importantly, in our patient population biotin was present at concentrations that would have caused elevated TnT values to erroneously fall within the sex-specific reference intervals. These findings illustrate the magnitude of biotin interference with the Gen5 TnT assay and highlight a patient population at risk for potential harm.
A-271Verification of Hemolysis Interference Claims for 31 Common Chemistry Analytes on the Beckman AU 5800
N. Albtoush1, J. Meyers2, L. Maurer2, A. Zimmerman2, C. Schmotzer2, J. Noguez2. 1Cleveland State University, Cleveland, OH, 2University Hospi-tals Cleveland Medical Center, Cleveland, OH
Background: Hemolysis is the most common reason for rejecting samples in clinical laboratories because it can be a significant source of measurement error. Since the inter-ference data provided by assay manufacturers is often instrument or reagent dependent, and the level of detail provided to the consumer may vary, it is important to verify the ef-fect of hemolysis on each laboratory test prior to implementation. The objective of this study was to evaluate the presence, direction, and degree of interference from hemoly-sis on 31 common chemistry assays on the Beckman AU5800 chemistry analyzer. The data obtained was used to establish appropriate specimen rejection criteria when clini-cally significant interferences were observed and to prevent unnecessary rejections. Methods: Hemolysate was purchased from Sun Diagnostics (New Gloucester, ME). An initial comparison study was performed between pooled patient specimens and matrix-matched Bio-Rad QC material with similar target concentrations to determine commutability for interference experiments. Two concentrations of commutable QC materials for each analyte were then spiked with varying amounts of hemoly-sate corresponding to the hemolysis indices on the AU5800. Deviation from the un-spiked QC results was assessed for each analyte using CLIA limits or a difference of 10% as recommended in the AU5800 IFU assay-specific interference criteria. Results: The results obtained for the pooled patient samples were in agree-ment with the matched QC material. 14 of 31 analytes tested in the low level QC demonstrated interference exceeding the defined acceptable lim-it for that analyte. However, only 6 of 31 analytes tested in the high lev-el QC exceeded the defined acceptable limit for the particular analyte. Conclusions: This study defined the degree and directionality of interference from sample hemolysis for 31 common chemistry analytes at various concentrations on the Beckman AU5800. For some assays, there was differential impact of hemolysis at low versus high analyte concentrations.
A-272Evaluation of the effect of non-fasting on the lipid levels
C. B. Maluf1, M. S. Feitosa2, D. C. C. Iwashima2, L. S. Vasconcellos1, A. Andrade1, P. Mourão2. 1School of medicine. Universidade Federal de Minas Gerais, Belo Horizonte, Brazil, 2Hospital das Clínicas. Universi-dade Federal de Minas Gerais, Belo Horizonte, Brazil
Background: The recommendation of fasting for the collection of laboratory tests is a common practice in health services and aims to reduce biological variability. However, since the patient spends most of the day fed, lipoprotein dosing without fasting could better portray the individual’s metabolic status. Studies have shown that the lipid profile without fasting is better or at least equivalent in predicting cardio-vascular risk. Objective: to evaluate the impact of fasting time in relation to the val-ues of the lipid profile of patients attended at a university hospital. Methods: Serum
samples from patients were obtained between September 2017 and February 2018 and processed in VITROS 5,1 FS and 5600 (Ortho Clinical Diagnostics, USA) for total cholesterol, HDL, LDL and triglyceride dosage. Next, the results were stratified by fasting time (hours). The SPSS Statistics 23 program (IBM, USA) was used to calculate the mean, confidence interval and statistical tests (Mann Whitney and Krus-kal Wallis). The significance level was set at 0.05. Results: 10,798 total cholesterol, 9,253 HDL, 9,109 LDL and 11,190 triglycerides were measured. Table 1 shows the results of the lipid profile by fasting time. Statistical difference in the comparison of the results by fasting time (p <0.05) was observed for all the analytes. However, no significant difference was observed between the confidence intervals of the mean values. Conclusion: The difference found between the means of the results in re-lation to the fasting time did not present clinical significance and was found to be smaller than the biological variability expected for the tests. Additionally, confidence intervals overlapped with one another. This study helps to reinforce the findings in the literature and the recommendation to flex the fasting to measure the lipid profile. Table 1. Lipid profile according to the fasting time
Fasting time (hours)
Total Cholesterol
HDL Cholesterol LDL Cholesterol Triglycerides
nmean (95% CI)
nmean (95% CI)
n mean (95% CI) n mean
(95% CI)
01 148176.0 (167.7-184.3)
12948.8 (45.4-52.2)
126 98.1 (90.6-105.7) 197
158.4 (132.1-184.7)
02 65172.8 (163.3-182.3)
5149.0 (44.5-53.5)
48 96.3 (86.4-106.1) 72
166.8 (137.4-196.2)
03 80177.3 (168.7-186.0)
7151.4 (48.1-54.8)
70 93.6 (86.2-101.0) 84
159.1 (135.5-182.7)
04 89177.6 (199.9-188.0)
8146.2 (52.9-48.5)
78103.0 (123.9-111.2)
97152.2 (213.3-161.1)
05 50179.3 (165.1-193.5)
4146.0 (40.0-51.9)
39 99.5 (85.6-113.4) 65
234.9 (90.7-379.1)
06 55177.0 (159.5-194.5)
5148.5 (42.6-54.4)
51104.4 (91.0-117.8)
66163.3 (127.1-199.6)
07 20169.4 (150.9-187.9)
1849.8 (44.2-55.4)
18 94.5 (76.9-112.1) 20
136.2 (108.0-164.4)
08 1766186.9 (184.6-189.1)
167953.2 (52.4-53.9)
1647105.0 (103.2-106.9)
1785141.6 (137.2-146.1)
09 1268182.9 (180.4-185.4)
106052.5 (51.5-53.6)
1048102.9 (100.6-105.2)
1306149.3 (134.1-164.5)
10 1554182.9 (180.8-185.0)
128952.4 (51.5-53.4)
1271103.6 (101.6-105.6)
1597142.2 (136.5-147.9)
11 1178182.6 (180.1-185.0)
103652.5 (51.5-53.4)
1025103.6 (101.4-105.8)
1205137.8 (132.5-143.1)
≥ 12 4525186.1 (184.7-187.5)
374751.1 (50.6-51.7)
3688105.1 (103.9-106.4)
4696152.2 (147.2-157.2)
CI: confidence interval for the mean.
A-273Acceptability Varies: Lipid Interference in the Siemens BNII Nephelometric Assays
K. M. Braun, M. C. Kohlhagen, M. D. Hetrick, D. L. Murray, M. R. Snyder, M. V. Willrich. Mayo Clinic, Rochester, MN
Background: Nephelometry is used to quantitate many different serum proteins by forming antigen/antibody complexes and measuring the light scatter produced by these complexes. Lipemia is a known interferent in nephelometry testing, causing erroneously high results. Package inserts indicate that lipemic samples should not be run, but exclusion criteria are not well defined. Visual detection of lipemia by labora-
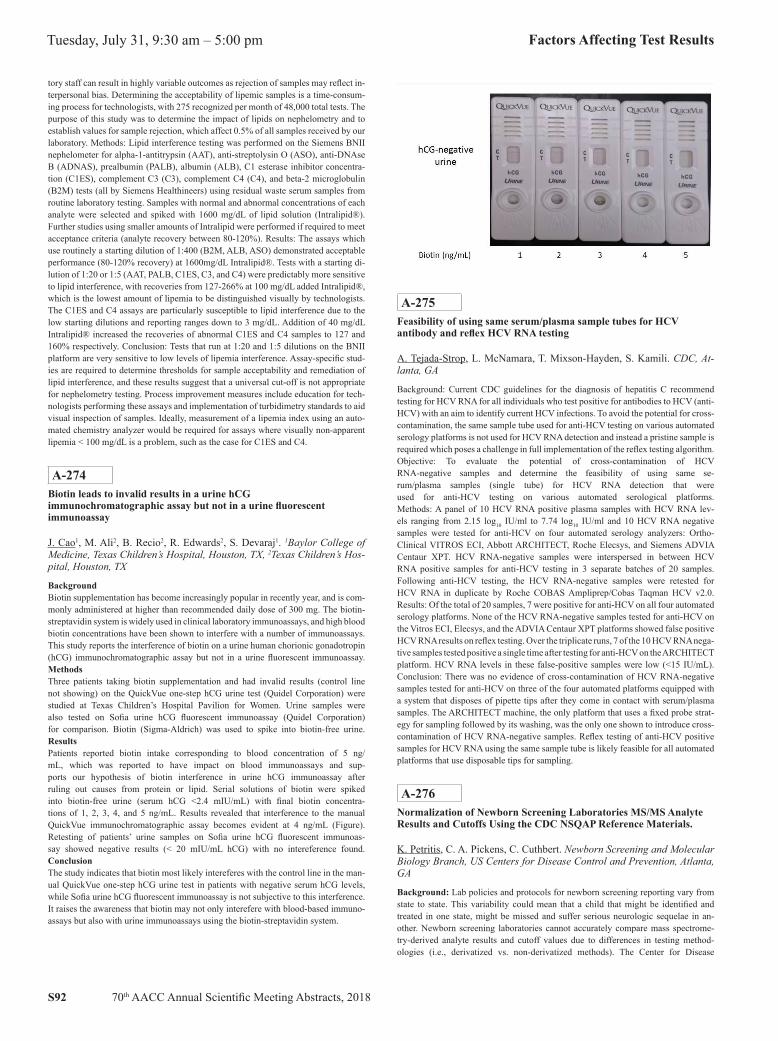
S92 70th AACC Annual Scientific Meeting Abstracts, 2018
Tuesday, July 31, 9:30 am – 5:00 pm Factors Affecting Test Results
tory staff can result in highly variable outcomes as rejection of samples may reflect in-terpersonal bias. Determining the acceptability of lipemic samples is a time-consum-ing process for technologists, with 275 recognized per month of 48,000 total tests. The purpose of this study was to determine the impact of lipids on nephelometry and to establish values for sample rejection, which affect 0.5% of all samples received by our laboratory. Methods: Lipid interference testing was performed on the Siemens BNII nephelometer for alpha-1-antitrypsin (AAT), anti-streptolysin O (ASO), anti-DNAse B (ADNAS), prealbumin (PALB), albumin (ALB), C1 esterase inhibitor concentra-tion (C1ES), complement C3 (C3), complement C4 (C4), and beta-2 microglobulin (B2M) tests (all by Siemens Healthineers) using residual waste serum samples from routine laboratory testing. Samples with normal and abnormal concentrations of each analyte were selected and spiked with 1600 mg/dL of lipid solution (Intralipid®). Further studies using smaller amounts of Intralipid were performed if required to meet acceptance criteria (analyte recovery between 80-120%). Results: The assays which use routinely a starting dilution of 1:400 (B2M, ALB, ASO) demonstrated acceptable performance (80-120% recovery) at 1600mg/dL Intralipid®. Tests with a starting di-lution of 1:20 or 1:5 (AAT, PALB, C1ES, C3, and C4) were predictably more sensitive to lipid interference, with recoveries from 127-266% at 100 mg/dL added Intralipid®, which is the lowest amount of lipemia to be distinguished visually by technologists. The C1ES and C4 assays are particularly susceptible to lipid interference due to the low starting dilutions and reporting ranges down to 3 mg/dL. Addition of 40 mg/dL Intralipid® increased the recoveries of abnormal C1ES and C4 samples to 127 and 160% respectively. Conclusion: Tests that run at 1:20 and 1:5 dilutions on the BNII platform are very sensitive to low levels of lipemia interference. Assay-specific stud-ies are required to determine thresholds for sample acceptability and remediation of lipid interference, and these results suggest that a universal cut-off is not appropriate for nephelometry testing. Process improvement measures include education for tech-nologists performing these assays and implementation of turbidimetry standards to aid visual inspection of samples. Ideally, measurement of a lipemia index using an auto-mated chemistry analyzer would be required for assays where visually non-apparent lipemia < 100 mg/dL is a problem, such as the case for C1ES and C4.
A-274Biotin leads to invalid results in a urine hCG immunochromatographic assay but not in a urine fluorescent immunoassay
J. Cao1, M. Ali2, B. Recio2, R. Edwards2, S. Devaraj1. 1Baylor College of Medicine, Texas Children’s Hospital, Houston, TX, 2Texas Children’s Hos-pital, Houston, TX
BackgroundBiotin supplementation has become increasingly popular in recently year, and is com-monly administered at higher than recommended daily dose of 300 mg. The biotin-streptavidin system is widely used in clinical laboratory immunoassays, and high blood biotin concentrations have been shown to interfere with a number of immunoassays. This study reports the interference of biotin on a urine human chorionic gonadotropin (hCG) immunochromatographic assay but not in a urine fluorescent immunoassay. MethodsThree patients taking biotin supplementation and had invalid results (control line not showing) on the QuickVue one-step hCG urine test (Quidel Corporation) were studied at Texas Children’s Hospital Pavilion for Women. Urine samples were also tested on Sofia urine hCG fluorescent immunoassay (Quidel Corporation) for comparison. Biotin (Sigma-Aldrich) was used to spike into biotin-free urine. ResultsPatients reported biotin intake corresponding to blood concentration of 5 ng/mL, which was reported to have impact on blood immunoassays and sup-ports our hypothesis of biotin interference in urine hCG immunoassay after ruling out causes from protein or lipid. Serial solutions of biotin were spiked into biotin-free urine (serum hCG <2.4 mIU/mL) with final biotin concentra-tions of 1, 2, 3, 4, and 5 ng/mL. Results revealed that interference to the manual QuickVue immunochromatographic assay becomes evident at 4 ng/mL (Figure). Retesting of patients’ urine samples on Sofia urine hCG fluorescent immunoas-say showed negative results (< 20 mIU/mL hCG) with no intereference found. ConclusionThe study indicates that biotin most likely intereferes with the control line in the man-ual QuickVue one-step hCG urine test in patients with negative serum hCG levels, while Sofia urine hCG fluorescent immunoassay is not subjective to this interference. It raises the awareness that biotin may not only interefere with blood-based immuno-assays but also with urine immunoassays using the biotin-streptavidin system.
A-275Feasibility of using same serum/plasma sample tubes for HCV antibody and reflex HCV RNA testing
A. Tejada-Strop, L. McNamara, T. Mixson-Hayden, S. Kamili. CDC, At-lanta, GA
Background: Current CDC guidelines for the diagnosis of hepatitis C recommend testing for HCV RNA for all individuals who test positive for antibodies to HCV (anti-HCV) with an aim to identify current HCV infections. To avoid the potential for cross-contamination, the same sample tube used for anti-HCV testing on various automated serology platforms is not used for HCV RNA detection and instead a pristine sample is required which poses a challenge in full implementation of the reflex testing algorithm. Objective: To evaluate the potential of cross-contamination of HCV RNA-negative samples and determine the feasibility of using same se-rum/plasma samples (single tube) for HCV RNA detection that were used for anti-HCV testing on various automated serological platforms. Methods: A panel of 10 HCV RNA positive plasma samples with HCV RNA lev-els ranging from 2.15 log10 IU/ml to 7.74 log10 IU/ml and 10 HCV RNA negative samples were tested for anti-HCV on four automated serology analyzers: Ortho-Clinical VITROS ECI, Abbott ARCHITECT, Roche Elecsys, and Siemens ADVIA Centaur XPT. HCV RNA-negative samples were interspersed in between HCV RNA positive samples for anti-HCV testing in 3 separate batches of 20 samples. Following anti-HCV testing, the HCV RNA-negative samples were retested for HCV RNA in duplicate by Roche COBAS Ampliprep/Cobas Taqman HCV v2.0. Results: Of the total of 20 samples, 7 were positive for anti-HCV on all four automated serology platforms. None of the HCV RNA-negative samples tested for anti-HCV on the Vitros ECI, Elecsys, and the ADVIA Centaur XPT platforms showed false positive HCV RNA results on reflex testing. Over the triplicate runs, 7 of the 10 HCV RNA nega-tive samples tested positive a single time after testing for anti-HCV on the ARCHITECT platform. HCV RNA levels in these false-positive samples were low (<15 IU/mL). Conclusion: There was no evidence of cross-contamination of HCV RNA-negative samples tested for anti-HCV on three of the four automated platforms equipped with a system that disposes of pipette tips after they come in contact with serum/plasma samples. The ARCHITECT machine, the only platform that uses a fixed probe strat-egy for sampling followed by its washing, was the only one shown to introduce cross-contamination of HCV RNA-negative samples. Reflex testing of anti-HCV positive samples for HCV RNA using the same sample tube is likely feasible for all automated platforms that use disposable tips for sampling.
A-276Normalization of Newborn Screening Laboratories MS/MS Analyte Results and Cutoffs Using the CDC NSQAP Reference Materials.
K. Petritis, C. A. Pickens, C. Cuthbert. Newborn Screening and Molecular Biology Branch, US Centers for Disease Control and Prevention, Atlanta, GA
Background: Lab policies and protocols for newborn screening reporting vary from state to state. This variability could mean that a child that might be identified and treated in one state, might be missed and suffer serious neurologic sequelae in an-other. Newborn screening laboratories cannot accurately compare mass spectrome-try-derived analyte results and cutoff values due to differences in testing method-ologies (i.e., derivatized vs. non-derivatized methods). The Center for Disease

70th AACC Annual Scientific Meeting Abstracts, 2018 S93
Factors Affecting Test Results Tuesday, July 31, 9:30 am – 5:00 pm
Control and Prevention’s (CDC) Newborn Screening Quality Assurance Program (NSQAP) provides newborn screening labs with quality control (QC) materials which contain endogenous and three enriched levels of amino acid and acylcarni-tines, as well as Proficiency testing (PT) materials that mimic analyte concentrations of newborns with metabolic disorders. The objective of this study was to normal-ize US and international newborn screening laboratory results and cutoffs using the NSQAP QC samples, and validate normalization using the PT specimen results. Methods: NSQAP QC and PT data reported from US and international laboratories in Q3-2016, Q1-2017 and Q3-2017 were used in this study. QC materials were provided as dried blood spot cards which included a base pool and the base pool spiked with specific concentrations of metabolites in a linear range. For each laboratory, the CDC NSAQP QC quantified metabolite values were regressed on each laboratory’s quantified QC metabolite values using Deming regressions. The regression parameters were used to normalize the values of all metabolites in PT materials and cut-offs from the different labs to the same scale based on CDC results and cutoffs. The %RSD was calculated for the raw and normalized PT data for comparison between and across metabolites. Results: Regression parameters were calculated for 17 acylcarnitines and 8 amino acids. Across the three quarters, all laboratory reported PT metabolite values had decreased %RSD after normalization using the NSQAP QC materials. In Q3-2016 results, overall the %RSD decreased from 0.3 up to 3.0-fold. The largest method associated decrease in %RSD for the US laboratories was malonylcarnitine, ci-trulline, glutarylcarnitine, and succinylacetone which had %RSD decreases from 56.7% to 18.7%, 15.8% to 6.63%, 31.7% to 14.6%, and 50.9% to 24.5%, respec-tively. Bias plots were created to visualize method differences between labora-tory results and cut-offs before and after normalization. Some analytes exhib-ited significant differences between raw PT values obtained by different MS/MS methods, but after normalization these PT values were homogeneous. The results of this study could assist newborn screening labs compare analytical re-sults, cutoffs, and healthy population range differences to facilitate uniformity. Conclusions: Inter-laboratory newborn screening analyte results and cutoffs can be normalized by using external QC materials.
A-277Frequency of hemolysis in potassium samples collected during cardiovascular surgery
K. Hartung, C. Wiese, A. Wockenfus, B. Katzman, L. Donato, B. Karon. Mayo Clinic, Rochester, MN
Background: Hemolysis is a common cause of pseduohyperkalemia. For this reason, serum and plasma samples with hemolysis greater than the manufacturer-defined H in-dex cut-off are recollected in our practice. Arterial blood gas specimens, collected intra-operatively and with requests for whole blood potassium measurement, are often visu-ally hemolyzed upon separation of plasma from whole blood. We studied whether the H index cut-off used for serum and plasma samples in our practice would be appropri-ate for determining acceptability of whole blood samples for potassium measurement. Methods: Arterial blood gas samples were collected in Portex syringes (Smith Medical) containing electrolyte-balanced lithium heparin by OR staff, mostly dur-ing cardiovascular surgery, and sent immediately to the laboratory for potassium measurement on a Radiometer ABL90 blood gas analyzer (Radiometer America). After separation of lithium heparin plasma in an Eppendorf Mini-Spin centrifuge (Eppendorf AG), samples that were visibly hemolyzed had H index measured on a Roche Cobas c501 analyzer (Roche Diagnostics). Primary analysis consisted of mean ± SD H index, number/percent of samples with H index below an H index of 125 (cut-off for serum/plasma specimens), and correlation between H index in visibly hemolyzed blood gas specimens and whole blood potassium concentration. Results: Approximately 1400 blood gas samples were collected intraoperatively, of which 36 samples were judged to have visible hemolysis. The mean (±SD) H in-dex was 244 ± 89. Only 2 of 36 blood gas samples had an H index less than 125, which is the defined cut-off for serum/plasma potassium on the Roche Cobas c501 analyzer (Roche Diagnostics). There was a weak relationship between H index and whole blood potassium among visibly hemolyzed blood gas samples. The slope of the relationship was 0.0026, with an r2 of 0.13. The Pearson correlation coefficient was 0.36. Biologic variability of an individual patient’s potassium values, as determined by comparing results from patients that had serial testing within the surgical proce-dure, was much greater than any effect that could be attributed to sample hemolysis. Conclusion: Blood gas samples collected intraoperatively in cardiovascular surgery are often visibly hemolyzed. Application of an H index cut-off derived for serum and plasma samples does not seem appropriate; as the relationship between H index and whole blood potassium is weak among visibly hemolyzed samples and biologic vari-ability in potassium is much higher than any effects of hemolysis. We speculate that free hemoglobin levels in samples collected during cardiovascular surgery are higher
due to elements of the procedure such as the bypass circuit, cell salvage devices, or cooling of the patient.
A-278Lack of Harmonization of IGF-1 Assays Calibrated with Materials Traceable to WHO International Reference Reagent 02/254
C. Ling1, R. J. Singh2, Z. Zhao3. 1National Institutes of Health, Bethesda, MD, 2Mayo Clinic, Rochester, MN, 3Weill Cornell Medicine, New York City, NY
Background: Measurement of insulin-like growth factor 1 (IGF-1) is crucial in the diagnosis of growth hormone (GH) related diseases. Failure to diagnose and treat GH deficiency in neonates and children leads to short stature, delayed development, and metabolic disorders later in life. Hence, it is critical to accurately measure IGF-1 levels and ensure the harmonization of IGF-1 test results across different methods and institutes. In an effort to harmonize IGF-1 assays, the WHO established IRR 02/254. We sought to assess the harmonization of assays calibrated with material traceable to IRR 02/254. Methods: After obtaining institutional review board approval and in-formed consent, we compared IGF-1 measurements in 111 patient samples between the Liaison (DiaSorin) and Immulite 2000 (Siemens) immunoassay methods. We also compared the results from the immunoassays to IGF-1 levels measured in 61 of the 111 samples using liquid chromatography/mass spectrometry (LC-MS). Comparisons were carried out using Deming regression analysis. No significant deviations from linearity were found using the Cusum test for linearity (P > 0.05). Results: Good overall agreement was observed in the comparison between IGF-1 measurements by LC-MS and the Liaison methods with a slope of 0.98 (95% CI 0.87, 1.09) and an intercept of -16.28 (95% CI -32.92, 0.37). IGF-1 concentrations measured using the Immulite 2000 method showed a proportional negative bias compared to both the Liaison and LC-MS methods with slopes of 0.75 (95% CI 0.68, 0.81) and 0.76 (95% CI 0.69, 0.83), respectively. We then prepared three levels of IRR 02/254 fol-lowing instructions in the package insert. We measured IGF-1 in the three levels of IRR 02/254 by the Liaison, Immulite, and LC-MS methods and compared the results against the patient comparisons. At the highest level of IRR 02/254 IGF-1 tested (772 ng/mL), the measured IGF-1 value fell outside of the 95% confidence interval for the patient comparison, suggesting that this level of IRR 02/254 may not be a commutable standard. Conclusion: Test harmonization depends on the commutability of reference materials (RM), which is the closeness of agreement of the mathematical relationship between the measurements of RMs and patient samples using multiple methods; a RM with good commutability will behave similarly to patient samples between different assays. Method calibration using non-commutable RMs leads to significant discrepan-cies between interassay test results. In sum, these data suggest a lack of harmonization in the IGF-1 assays tested here.
A-279Are patients adequately informed about procedures for 24-hour urine collection?
P. V. Bottini, C. R. Garlipp, P. R. M. Lima, I. T. Brito, L. M. G. Carvalho. State Univesity of Campinas, Campinas, SP, Brazil
Background: Traditionally, the quantification of several analytes requires a 24-hour collection of urine as their excretion may vary with posture, physical ac-tivity, protein intake and hemodynamic factors among others. This method has many inconveniences being frequently unreliable because of errors in collect-ing a complete 24-hour urine sample as it requires the direct participation of the patient. Any failure to complete the 24-hour urine collection can lead to incorrect tests results and possible diagnostic errors. The aim of this study was to evaluate the patients’ knowledge about the procedures to adequately collect 24-hour urine samples and the importance of following the guidelines provided by the laboratory. Methods: We interviewed 158 randomly chosen outpatients who attended the labo-ratory with collected 24-hour urine sample and agreed to respond to the proposed questionnaire. This questionnaire was anonymous and consisted of 18 questions that dealt with personal opinions on how to proceed with a 24-hour urine collection, where they get information about preparation for test, the best container, the volume neces-sary for testing, fluid intake and how to proceed if they need to subsequently col-lect a random urine sample. They were also asked if they would accept to repeat the collection if necessary and if they would warn the laboratory personal if they lost one or more micturition during the 24-hour period. After being compiled the frequencies of each response were calculated and expressed as a percentage basis. Results: Regarding the medical request, 25% of the patients stated that they did not know their physicians ordered a laboratory test that requires a 24-hour urine col-
S94 70th AACC Annual Scientific Meeting Abstracts, 2018
Tuesday, July 31, 9:30 am – 5:00 pm Factors Affecting Test Results
lection. The laboratory was the primary source of information on the procedures to be followed for the appropriate collection of urine samples (50% of the cases). It is noteworthy that 19% of the patients reported not receiving any kind of profes-sional information. Thirty percent of the patients were not able to correctly inform the collection procedures or the types of containers that could be used as an alterna-tive to the ones provided by the laboratory. Concerning the importance of not los-ing any micturition during the collection period 35% of the patients were unaware of this matter and more than 50% of the subjects did not know what to do if the urine volume exceeded the containers delivered by the laboratory. It is remarkable that 10% of the patients stated that they would not inform the laboratory if they lost one or more micturitions. Another critical finding is the fact that more than 80% of patients said they had not been informed about the fluid intake during the col-lection period. When asked how to proceed in case they needed to collect a subse-quent random urine sample, only 75% of the patients reported the correct procedure. Conclusion: This study allowed us to identify information gaps for the adequate 24-hour urine collection which will permit to elaborate an educational planning in order to improve this procedure aiming to reduce laboratory errors in the preanalytical phase
A-280Clinical significance of discrepant ELISA and IFA results for anti-PLA2R antibody testing
C. D. Giesen, H. Fang, J. C. Lieske. Mayo Clinic, Rochester, MN
Background: Recently, phospholipase A-2 receptor 1 (PLA2R) was identified as a major target antigen in the pathogenesis of idiopathic membranous nephropathy (MN). Detection and quantification of anti-PLA2R autoantibodies (aPLA2R) is critical for the diagnosis and management of MN as primary forms require immu-nosuppressive treatments while secondary forms may not. Indirect immunofluores-cence (IFA) and enzyme-linked immunosorbent assay (ELISA) kits for aPLA2R measurement in serum/plasma are commercially available and quite sensitive and specific for initial diagnosis but performance characteristics of these kits are not established for patients receiving therapy. Nevertheless many aPLA2R tests are ordered for monitoring response to therapy. While our initial observations sug-gest that the ELISA titers typically fall with effective treatment, the IFA often re-mains positive, at least initially, causing confusion. This study investigated the clinical significance of discrepant IFA and ELISA results. The aim of our study was to determine the clinical utility of concurrent IFA and ELISA aPLA2R testing. Methods: This study was reviewed and approved by the Mayo Clinic Institutional Review Board. Results (n=538) from Mayo Clinic patients with clinically ordered aPLA2R testing from July 2015 through December 2016 were reviewed. IFA and ELI-SA testing were performed per manufacturer’s instructions on all orders. IFA reactions were recorded as positive, negative or indeterminate (if background staining obscured technicians’ judgement); indeterminate results were considered negative. ELISA results ≥14 RU/mL were considered positive as per the package insert. Patients with at least one set of conflicting assay results) were identified and their clinical record reviewed. Results: Observed agreement between the IFA and ELISA was 92% with discor-dant results noted in 24 unique patients. ELISA was positive in 13 samples with a negative IFA result and IFA was positive in 28 samples with a negative ELISA. Of the 41 discrepant results, 37 (90%) were from patients with biopsy-proven MN, two (5%) were duplicate orders from a patient with membranous lupus nephritis (further repeat testing yielded negative results), one (2.5%) was from an IgA nephropathy patient, and one had no biopsy performed. In biopsy-proven MN cases, 33/37 (89%) of dissimilar results came from patients (n=19 unique) who were currently receiv-ing therapy (n=27) or in clinical remission (n=6). One instance of an indeterminate IFA and positive ELISA was observed. ROC analysis of the entire cohort demon-strated excellent ability of the ELISA to predict a positive IFA result (AUC = 0.97). SE+SP was maximized (0.94 and 0.92, respectively) at an ELISA result of 6 RU/mL. Conclusion: Good agreement was observed between assays, with the majority of in-congruent results occurring in patients with biopsy-proven MN. In the vast majority of discrepant cases (80%) the patient was receiving immunosuppressive therapy, and the trends in the antibody titer by ELISA might be most revealing. It is unlikely a positive IFA result adds much value in this circumstance. The clinical significance of a posi-tive IFA and negative or equivocal ELSA in newly diagnosed patients, or whether a positive IFA might predict early relapse in a treated patient when the ELISA result is equivocal, remains to be seen.
A-281Comparison of Multiple Analytical Approaches for Determining Reference Intervals
D. R. Bunch, J. M. El-Khoury, R. Harb. Yale-New Haven Hospital, New Haven, CT
BACKGROUND: Reference intervals are essential interpretative information for clinical assays. CLSI guidelines recommend both a non-parametric method as well as statistically more complex procedures such as bootstrap-based, parametric or specific robust methods for establishing reference intervals dependent on a laboratory’s refer-ence population sample size and access to sophisticated statistics. The non-parametric method which ranks values and drops the top and bottom 2.5th percentiles to deter-mine the central 95% is widely used in clinical laboratories and appears to be ideally suited for a priori approaches that utilize “healthy” populations with at least 120 refer-ence subjects. The goal of this study was to compare different statistical methodolo-gies for determining reference intervals of 29 chemistry analytes from patient data extracted from our electronic health record system. METHODS: IRB approval was obtained for three datasets consisting of outpatient visits to our institution between 2012 and 2017 as follows: 1) All unique encounters with a strict qualifying encounter diagnosis code for general adult examination without abnormal findings, 2) All unique encounters with a more expansive qualifying encounter diagnosis codes for screening purposes, and 3) all encounters with at least 3 results per analyte per patient which were then averaged. Statistical methods used were EP Evaluator non-parametric anal-ysis with outlier detection, Python non-parametric analysis, Prism 7 parametric analy-sis with outlier detection, R parametric analysis based on the Hoffman method, and R parametric analysis based on the maximum likelihood method from the mixtools package. Each statistical method was compared to the proposed reference interval in package inserts, an external reference laboratory, and our current reference interval for accuracy. Percent bias from the current reference interval was calculated. The num-ber of samples was analyte dependent but ranged from 128-23713. RESULTS: The Hoffman and maximum likelihood methods had the tightest clustering among the five methods and most closely recapitulated the ranges in the package insert and external reference laboratory across all three datasets. The averaged dataset had greater effect on clustering in non-parametric methods, likely because it contained more unhealthy individuals. In comparison, the parametric Hoffman and maximum likelihood meth-ods were less likely to be influenced by outlier values. Bias analysis for lower limit revealed <±25% bias for 86% of the analytes using non-parametric methods as com-pared to <±50% bias for 85% using parametric methods. Bias analysis for the upper limit showed >±50% bias for all analytes using non-parametric methods as compared to <±50% bias for 97% of analytes using parametric methods. CONCLUSION: For a posteriori approaches, which rely on populations likely containing unhealthy indi-viduals, a non-parametric approach does not distinguish between the sub-populations while Hoffman and maximum likelihood methods do. Unlike the Hoffman method, the maximum likelihood method does not depend on subjective visual discrimination and thus is more advantageous.
A-282Calprotectin Antibodies with Different Binding Specificities Can Be Used as Tools to Detect Multiple Calprotectin Forms
L. Kiiskinen, S. Tiitinen. Medix Biochemica, Espoo, Finland
Background: Calprotectin is a calcium-binding protein secreted by neutrophils at a site of inflammation. In clinical diagnostics, analysis of fecal calprotectin is com-monly used to diagnose intestinal inflammations, especially inflammatory bowel dis-ease (IBD). Calprotectin is a complex protein composed of two subunits, S100A8 and S100A9. The two subunits associate together as heterodimers, and the dimers often pair to form tetramers. This multimerization tendency has been suggested to be a major reason for the observed substantial differences between the numerical values reported across commercial calprotectin assays. Depending on the specificity of the antibodies used in each assay, different multimer forms may be detected in patients’ samples. Methods: We have developed five mouse monoclonal antibodies against human cal-protectin. The binding specificities of these antibodies, designated as Anti-h Calpro-tectin 3403, 3404, 3405, 3406, or 3407, were studied in fluorescence-based immu-noassays (FIA) with purified calprotectin subunits S100A8 and S100A9, as well as with the S100A8/A9 heterocomplex (i.e. calprotectin). Purified recombinant antigens were coated onto microtiter plate wells, 50 ng/well. A dilution series of antibodies was added into the wells at concentrations ranging from 0.031 to 10 ng/mL. The antibodies bound to the antigens were detected using an europium-labeled rabbit anti-mouse IgG antibody. Selected antibody pairs were used in sandwich fluoroimmunoassays to study the effects of antibody specificity differences on calprotectin assay results. The amount

70th AACC Annual Scientific Meeting Abstracts, 2018 S95
Factors Affecting Test Results Tuesday, July 31, 9:30 am – 5:00 pm
of capture antibody was 150 ng/well. A dilution series of S100A8/A9 complex was added into the wells, at concentrations ranging from 0.15 to 1,000 ng/mL. Biotin-con-jugated antibodies and Eu-labeled streptavidin were used to detect the bound antigens. A widely studied calprotectin antibody 27E10 was included in the study as a reference. Results: Direct FIA results with purified recombinant S100A8, S100A9, and S100A8/A9 complex proteins indicated that the antibodies were clustered in three groups: 1) antibody 3403 which bound to subunit S100A9, 2) antibodies 3404-3406 which recognized the subunit S100A8, and 3) antibody 3407 which did not bind to either of the isolated calprotectin subunits. All antibodies recognized the S100A8/A9 complex. Sandwich FIA results varied significantly between differ-ent antibody pairs. Antibody 3407 yielded similar results as the reference anti-body 27E10 when used as a pair with itself. Significantly higher signal-to-noise ratios were obtained across the concentration range tested when 3407 was com-bined with an antibody recognizing a specific subunit, such as antibody 3406. Conclusion: These results demonstrate that calprotectin antibodies have different specificities towards calprotectin subunits and that the choice of antibodies for a cal-protectin immunoassay have a significant effect on the detection results. Scientific interest towards the use of calprotectin as a biomarker for several diseases linked to subclinical or clinical inflammation has increased substantially during the past years. The correlation of S100A8/A9 tetramer, dimer, or monomer levels with the patients’ disease status remains to be elucidated. Antibodies described in this study can be used as a tool to develop new diagnostic assays for distinct calprotectin forms.
A-283Biotin interference in 21 immunoassays performed on the Vitros5600
H. Stieglitz, N. Korpi-Steiner. University of North Carolina Hospital, Cha-pel Hill, NC
Background: Biotin (vitamin B7) is a carboxylase co-factor involved in amino acid, fatty acid, and glucose metabolism. Select immunoassays are susceptible to biotin inter-ference at supraphysiological concentrations. Cases involving administration of biotin supplements that exceed the recommended daily intake have been reported by physi-cians at our institution with concern for potential biotin interference with patient testing. This study aimed to characterize biotin interference with 21 immunoassays performed using the Vitros5600 (Ortho Clinical Diagnostics, Raritan, NJ), and evaluate the ef-fectiveness of streptavidin-microparticle-mediated biotin depletion in serum samples. Methods: Increasing concentrations of biotin (0, 50, 100, 500 ng/mL; Sigma Aldrich, St. Louis, MO) were added into serum containing low or high analyte concentrations followed by testing for 21 analytes via immunoassays on the Vit-ros5600. Relative bias was calculated (%bias=([biotin-treated analyte]-[untreated analyte])/[untreated analyte]). Biotin depletion was evaluated by comparing se-rum with and without biotin (1000 ng/mL) and streptavidin-microparticle pretreat-ment (Thermo Fisher Scientific, Waltham, MA). Analyte recovery was calculated (%recovery=[biotin+streptavidin-microparticle treated analyte]/(untreated analyte]). Results: Biotin (50 ng/mL) caused negative biases in 15 immunometric as-says, ranging from -2.9% for ferritin to -94.7% for cTnI. Biotin (50 ng/mL) elic-ited positive biases in 6 competitive immunoassays, ranging from 0% for cor-tisol to 2,270% for estradiol. Recovery of expected values following biotin and streptavidin-microparticle pretreatment was 99% to 115% for all immunoassays. Conclusion: The magnitude of analytical bias due to biotin interference is highly variable among immunoassays. Immunometric assays exhibit negative proportional biases that are dependent on biotin concentration, although appear independent of analyte concentration. Competitive immunoassays exhibit positive biases that are de-pendent on both biotin and analyte concentrations. Biotin depletion using streptavi-din-microparticles is an effective method to recover expected analyte concentrations. Understanding patterns of biotin interference and implementing biotin depletion stud-ies can aid in the investigation of biotin interference in clinical practice.
Test Method Analyte concentration
% Bias with added biotin (ng/mL)
0 50 100 500
PTH IM 50.9 pg/mL 0 -73.9 -84.8 -91.6
2115 pg/mL 0 -67.7 -80.1 -91.5
cTnI IM 0.161 ng/mL 0 < AMR < AMR < AMR
8.75 ng/mL 0 -94.7 -97.1 -99.1
TSH IM 2.45 mIU/mL 0 -93.1 -95.9 -98.0
59.36 mIU/mL 0 -89.4 -93.7 -96.6
Cortisol Comp IA 1.33 mcg/mL 0 8.3 547 > AMR
5.56 mcg/mL 0 0 414 > AMR
Estradiol Comp IA 21.3 pg/mL 0 2270 8676 > AMR
225.3 pg/mL 0 960 > AMR > AMR
Testosterone Comp IA 7.79 mg/dL 0 746 2467 14021
86 mg/dL 0 269 745 > AMR
AMR, analytical measuring range; Comp IA, competitive immunoassay; IM, immunometric assay. Data not shown for AFP, bhCG, CA 19-9, CA 125, CEA, CK-MB, ferritin, folate, FSH, LH, NT-pBNP, progesterone, prolactin, PSA, or vitamin B12.
A-284Remediation of IgG4 Cross Reaction from The Binding Site Optilite® IgG1 and IgG2 Assays
M. D. Coley, K. L. Sharp, A. D. Kay, P. D. Stubbs, S. J. Harding. The Bind-ing Site, Birmingham, United Kingdom
IntroductionHistorically, IgG subclass (IgGSC) measurements to aid the diagnosis of primary immunodeficiency and hypergammaglobulinemia were performed using radial im-munodiffusion (RID). This technology was superseded by fully automated and quan-titative nephelometric and turbidimetric assays. The use of mass spectrometry for the identification of immunoglobulin subclasses has also been investigated. Whilst good agreement between the immunoassay techniques and mass spectrometry has been observed, discordance between the methods may exist for IgG1 and IgG2 measurements in patients with IgG4-related disorders (IgG4-RD). Elevated IgG4 levels are present in IgG4-RD, which has an estimated prevalence of only 0.28–1.08/100,000 of the adult population. As the clinical presentation and age of onset for immunodeficiency and IgG4-RD are distinct, the clinical utility of the IgGSC assays will be unaffected. However, over-estimation in the presence of an interfer-ing substance is an undesirable characteristic. Here we assess IgG4 cross reaction in the Optilite IgG1 and IgG2 assays and describe its removal from the assay antisera. MethodPolyclonal IgG4 was purified from a pool of human sera from healthy adult donors using standard chromatography techniques. Interference was established follow-ing CLSI guideline EP07-A2 at the lower limit of adult reference ranges for IgG1 (3.8g/L) and IgG2 (2.5g/L) using IgGSC assays (The Binding Site Group Ltd., UK) performed on the Optilite® (The Binding Site Group Ltd., UK). Base pools were spiked with either saline or an equivalent volume of purified IgG4 to give an IgG4 concentration of either 2g/L or 4g/L. Absorption chromatography was used to re-move cross reacting antibodies to IgG4 and the antisera was then concentrated. In-terference was reassessed as above, reference ranges were validated (n=51) and a comparison was made between the absorbed and unabsorbed assays using a panel of processed samples (IgG1 n=22; IgG2 n=23) spanning the analytical measur-ing range. Linear regression and Altman-Bland were performed using Analyse-it®. ResultsPrior to IgG4 adsorption, the IgG1 base pool sample spiked with 2g/L of purified IgG4 showed a 21% increase in reported concentration; when spiked with 4g/L, an increase of 38% was seen. This resolved to an increase of just 4% when spiked with either 2g/L or 4g/L IgG4 after adsorption. For the IgG2 assay, a 57% and 98% increase in result was observed when spiked with 2g/L and 4g/L IgG4, respec-tively. This resolved to just 3% (2g/L) and 10% (4g/L) post adsorption. IgG1 and IgG2 reference ranges were validated with a bias of -2.5% and 1.9% respectively. Processed panel sample results using absorbed and unabsorbed assays compared well (IgG1: Y=1.016x-232.17, R2=0.9919; IgG2: Y=1.0341x-123.34, R2=0.996). ConclusionsIgG4-RD is a rare group of disorders and the over-production of IgG4 represents a new interference consideration for in-vitro diagnostic manufacturers. Purified poly-clonal IgG4 can be used to assess antibody specificity following CLSI guideline
S96 70th AACC Annual Scientific Meeting Abstracts, 2018
Tuesday, July 31, 9:30 am – 5:00 pm Factors Affecting Test Results
EP07-A2 and absorption chromatography used to remove undesirable IgG4 recogni-tion; both will be incorporated into future Optilite subclass assays. Removal of IgG4 cross reacting antibodies did not alter the normal reference range for IgG1 and IgG2 nor did it negatively impact the standard QC panel.
A-285Evaluation of L-Index Interference Limits on Roche cobas c502 and c702 Immunoturbidimetric Assays using Endogenously Lipemic Specimens
J. J. H. Hunsaker1, S. P. Wyness1, J. R. Genzen2. 1ARUP Institute for Clini-cal and Experimental Pathology, Salt Lake City, UT, 2Department of Pa-thology, University of Utah, Salt Lake City, UT
Background: Specimen lipemia is a primary concern with turbidimetric and nephelo-metric assays due the potential interference caused by light scattering or absorption. Lipemic index (L-index) and/or triglyceride (TRIG) concentration thresholds are fre-quently determined by manufacturers and provided in corresponding package inserts. Lipemic interference studies are typically conducted using soy-based lipid emulsions (e.g. Intralipid), which simulate endogenous lipemia. Intralipid, however, may not fully represent interference caused by endogenous lipemia due to the complexity and diversity of human lipoproteins. The purpose of this study was to evaluate lipemic interference thresholds across eleven FDA-cleared assays using patient specimens with varying degrees of endogenous lipemia pre- and post-ultracentrifugation (UC). Methods: Residual human serum specimens (n = 42) were obtained from frozen storage (-20°C) and de-identified according to an IRB-approved protocol. Speci-mens were retrieved based on prior L-index and/or TRIG measurements. Samples were tested untreated as well as after treatment by UC (AirFuge; Beckman Coul-ter; Brea, CA). Baseline and post treatment testing was conducted on two Roche instruments - cobas c502 [α1-antitrypsin (AAT), complement C3c (C3), C-reactive protein (CRP), haptoglobin (HAPTO), soluble transferrin receptor (STFR)] and cobas c702 [β2-microglobulin (B2M), complement C4 (C4), ceruloplasmin (CERU), high sensitive C-reactive protein (hsCRP), prealbumin (PREA), and transferrin (TRSF)]. Serum indices and TRIG concentrations were also measured pre- and post-UC. Assay results which fell outside the analytical measurement range were excluded due to the confounding effect of manual or auto-dilution on baseline lipemia. Percent difference of assay results pre- and post-UC - calculated as [((post-pre)/pre)*100)] - were determined for each result pair and used to establish L-index interference thresholds (≥10%) using non-linear regression in SigmaPlot 13 (Systat; San Jose, CA). Results: Specimens had serum indices pre-UC spanning the non-lipemic to li-pemic range (L-indices, 1-1769) with minimal hemolysis (H-index ≤85) or ic-terus (I-index ≤2). UC did not adversely impact results in non-lipemic specimens (n=11, L-index ≤50). UC was effective at clearing lipemia (post-UC L-index: 16 ± 8), although persistence of residual TRIG without corresponding L-index eleva-tion was often observed. Increasing lipemia caused a negative interference in AAT, HAPTO, TRSF, and PREA assays, a positive interference in CRP, CERU, and hsCRP assays, and negligible effect in B2M, C3, C4, and STFR assays across the L-index range evaluated. Several assays showed L-index thresholds that were be-low previously defined limits from the package inserts [new (prior)]: AAT 300 (500); CRP 230 (1000); hsCRP 300 (600); HAPTO 440 (600); TRSF 225 (500). Conclusions: This study provides an analysis of L-index thresholds for eleven im-munoturbidimetric assays. Due to the variety of human lipoproteins, limits defined using endogenously lipemic patient specimens may be different from those derived from spiking studies using Intralipid.
A-286Correlation of the Hemolysis Index on the Vitros® 5600 Analyzer with HemoCue® Photometer Plasma Hemoglobin Values
A. M. Ferguson, A. Wiebold, U. Garg. Children’s Mercy Hospital, Kansas Ctiy, MO
Background: Multiple analytes measured in the clinical laboratory are affected by he-molysis. Most automated chemistry analyzers provide a hemolysis index (H index) on each specimen that can be used to monitor the degree of hemolysis, but this does not di-rectly measure the concentration of hemoglobin present. It is the responsibility of each laboratory to determine the H index to be used in the decision to either report a result, report the result with an interpretive comment, or cancel the test due to hemoglobin interference. There are some instances, such as the monitoring of in vivo hemolysis in patients on extracorporeal membrane oxygenation (ECMO) when the direct measure-ment of hemoglobin concentration in plasma is clinically indicated. In our laboratory, in ECMO patients, plasma hemoglobin is measured by the HemoCue photometer. We
ran into a situation when reagents/cuvettes were unavailable for the HemoCue. We investigated the possibility if the H index could be used to give an approximation of the plasma hemoglobin concentration. In the present study, we compared the H index reading given by the Vitros 5600 to the measured hemoglobin in plasma specimens by the HemoCue photometer. We also investigated the use of a regression equation to calculate plasma hemoglobin concentrations using the H value from the Vitros. Methods: 29 scavenged specimens were spiked with a washed red cell hemoly-sate. They then had plasma hemoglobin measured by the HemoCue photometer and the H index measured on two Vitros 5600 analyzers in use in the clinical labora-tory. Based on hemoglobin values from the HemoCue, the Vitros H index values were divided into the following groups: no hemolysis; slight, moderate, and gross hemolysis; and reject. A regression equation was derived that could be used to cal-culate approximate plasma hemoglobin values based on the Vitros H index value. Results: H index values from the Vitros were divided into the following catego-ries after comparison with HemoCue hemoglobin measurements: 1-100 H index, no hemolysis; 100-200 slight hemolysis; 200-300 moderate hemolysis; 300-500 gross hemolysis; >500 reject. The following regression equation was determined that could approximate hemoglobin concentration for specimens with slight he-molysis (y=0.73X + 10, where y= the H index and X= hemoglobin in mg/dL). Conclusion: After comparing the Vitros H index results with the HemoCue hemoglo-bin measurement, we were able to more accurately designate specimens into varying categories of hemolysis. This allows a more precise determination of when to can-cel tests whose results are affected by hemolysis. The regression equation will allow plasma hemoglobin values to be reported without a disruption in clinical care if a reagent shortage would occur.
A-287Ensuring Assay Consistency through the Prediction of Lot to Lot Variation, Using Regression Analysis- Derived Theoretical Concentrations for Ferritin
E. Hain, N. Baumann, B. Katzman, D. Block. Mayo Clinic, Rochester, MN
Background: Ensuring assay consistency over time is an important part of the laboratory’s quality program. Variation between reagent lots over time can cause changes in the proportion of abnormal results. Our current lab practice is to as-sess each new lot of reagent by performing sample comparisons between the cur-rent and new lot and use Passing-Bablok regression analysis to compare results. Long-term impact of lot-to-lot variation at relevant medical decision points is fur-ther assessed by applying the regression analysis equation to a theoretical low, nor-mal, and high test value and monitoring changes in the theoretical value over time. Objective: The aim of this study was to use Ferritin as a model analyte to deter-mine whether lot-to-lot variation observed using sample comparisons and regression analysis-derived theoretical values is predictive of variation in reported patient results. Methods: Ferritin was measured using the DxI 800 (Beckman Coulter, Inc., Brea, CA). Reported patient results (n=188,087) were captured from the laboratory in-formation system from 08/2011-05/2017. Reagent lots were compared using resid-ual serum samples (n=20). Passing-Bablok regression analysis was performed and equations were applied to theoretical values at clinical decision limits (10, 336, 500 mcg/L) to monitor variation. Median patient results, interquartile range (IQR), and percent above and below reference intervals were calculated for reagent lots consid-ered either stable or changing. The stable period had slope evenly distributed around 1.0 over at least three lots. The changing period had slope >or<1.0 over multiple consecutive lots. Comparisons between the median patient values in the stable and changing time periods were performed using Wilcoxon Rank Sums test for statisti-cal significance. Comparison of the percentage of samples flagged low or high in the stable and changing data sets were calculated using a pooled estimate 2-sample test of proportions. Statistical calculations were performed using JMP Pro version 13.0.0 (SAS Institute Inc., Cary, NC) where p<0.05 was statistically significant. Results: The stable period consisted of 3 reagent lots (08/2011–12/2012) hav-ing a mean(range) slope=1.0(0.97-1.02). The changing period consisted of 8 re-agent lots (01/2013-05/2017) having mean(range) slope=1.05(1.01-1.11). The average(maximum) difference in the 10 mcg/L theoretical concentration was stable=1.8(3.2) and changing=-7.5(-20.7). The average(maximum) percent differ-ence in the 336 mcg/L theoretical concentration was stable=4.8(5.2) and chang-ing=19.4(25.6). The average(maximum) percent difference in the 500 mcg/L theo-retical concentration was stable=3.7(5.0) and changing=19.4(25.6). The median patient values(IQR) were 47(20-140) for the stable period and 47(20-133) for the changing period (p=0.12). The percent(SD) of samples flagging low was 17.3(1.7) during the stable period and 16.5(0.9) during the changing period (p<0.0002), and percent of samples flagging high was 12.7(1.4) for the stable period and 12.2(0.7) for the changing period (p<0.0093). Though the percent of samples flag-ging low and high were statistically significant, likely due to large sample size,
70th AACC Annual Scientific Meeting Abstracts, 2018 S97
Factors Affecting Test Results Tuesday, July 31, 9:30 am – 5:00 pm
they were deemed clinically insignificant due to overlap of IQR of the data sets. Conclusion: These data suggest that use of theoretical values derived from lot check-out data falsely alerted the lab of assay drift. Patient medians in conjunction with % of results flagging low or high better reflect assay stability over time.
A-288HbA1c platforms are variably affected by increasing lipemia
M. L. Parker, P. M. Yip. University of Toronto, Toronto, ON, Canada
Background: Hemoglobin A1c (HbA1c) testing is central in the diagnosis and moni-toring of diabetes mellitus. Several analytical approaches for measuring HbA1c are available including those routinely used in clinical laboratories: high performance liquid chromatography (HPLC), capillary electrophoresis (CE), enzymatic, and im-munoassay (IA). Considerable attention has been paid to interference from hemoglo-bin variants in HbA1c methods, with less investigation of matrix-related interferences such as lipemia. Interference from clinical lipemia in HbA1c measurements is par-ticularly relevant as non-fasting specimens are accepted and dyslipidemia is common in diabetic patients. Objectives: (1) To investigate the concentration of Intralipid®-sourced triglycerides that may cause significant interference on four platforms rep-resenting common analytical methods for HbA1c. (2) To assess the performance of nine routine HbA1c platforms using clinically lipemic specimens. Methods: Four specimens with 7.1 to 7.5% HbA1c were aliquoted and spiked with saline and/or Intralipid to generate triglyceride levels of 0, 5, and 20 g/L. Specimens were measured on the Bio-Rad VARIANTTM II (VII) TURBO 2.0 (HPLC), Sebia CAPILLARYSTM Hb A1c (CE), Abbott ARCHITECTTM Hemoglobin A1c (enzymatic), and Roche CO-BAS® c501 Tina-quant® HbA1c Gen. 3 (IA). Remnants of whole blood specimens (n=40) visually identified as lipemic and ranging from 3.8 to 14.5% HbA1c were tested on nine HbA1c platforms, including the four listed above and the Bio-Rad D-100TM HbA1c (HPLC), Bio-Rad VII HbA2/HbA1c Dual Program (HPLC), Beckman Coulter AU® HbA1c (IA), Ortho VITROS® HbA1c (IA), and Siemens Dimension Vista® HbA1c (IA). Paired plasma specimens were assayed for triglycerides on the ARCHITECT. Data were processed in Microsoft® Excel. A significant difference was defined as >6% change from baseline (0 g/L Intralipid) or >10% change from the average value reported by platforms with claimed resistance to clinical lipemia interference (VII TURBO and HbA2/HbA1c). Results: The VII TURBO and CAPIL-LARYS reported HbA1c values without significant change from baseline in the pres-ence of up to 20 g/L Intralipid-sourced triglycerides. However, the ARCHITECT and COBAS HbA1c values were negatively biased by 10% and 25% at 5 g/L and 20 g/L triglycerides, respectively. For clinically lipemic samples, the all-methods coefficient of variation correlated with increasing concentration of triglycerides (R2=0.59). The Bio-Rad D-100, CAPILLARYS and Dimension Vista HbA1c results did not show significant bias up to 65 mmol/L (57 g/L) triglycerides for 100%, 95% and 81% of specimens, respectively. The ARCHITECT and VITROS HbA1c values were signifi-cantly depressed above a 10 mmol/L triglyceride threshold (-16% and -19% average bias, respectively), with bias in proportion to the degree of lipemia. The AU and CO-BAS also showed significant bias above 10 mmol/L triglycerides (-12% for both). Conclusion: This study revealed that most immunoassays and the enzymatic method for HbA1c are susceptible to negative interference from elevated triglycerides, while HPLC and CE methods are resistant. To avoid reporting falsely low HbA1c measure-ments, laboratories should consider evaluating their assay performance for significant interference from clinical lipemia. Although further investigations are needed, our data suggest that a serum triglyceride threshold of ~10 mmol/L may warrant a caution-ary note when reporting HbA1c or reflexive testing to a lipemia-resistant platform.
A-289Interference of acetone with the alkaline-picrate method for blood creatinine measurement on the Abbott Architect
N. J. Rutherford, C. E. Hughes, J. H. Nichols, Z. Shajani-Yi. Vanderbilt University Medical Center, Nashville, TN
Background: Acetone is known to cause a positive interference when measuring creatinine using the alkaline-picrate method (Jaffe reaction). However, this phenom-enon has not been reported for the assay performed on the Abbott Architect, nor is it recorded as a known interference in the package insert for this assay. This interference was brought to our attention when a 33-year old male presented to the emergency department at our institution following consumption of rubbing alcohol (isopropanol). Isopropanol is metabolized to acetone in the body, resulting in an elevated creati-nine level when measured using this method. This can lead to the inaccurate diag-nosis of acute kidney injury and, subsequently, inappropriate treatment. A member of the patient’s care team was suspicious of the elevated creatinine and contacted
the laboratory. We were able to test the patient’s blood by an alternate method, re-vealing a creatinine concentration within normal limits. The objective of this study is to investigate the effect of isopropanol and acetone on the measurement of cre-atinine using the alkaline-picrate based method on the Abbott Architect c system. Methods: We performed interference studies using two levels of BioRad Mul-tiqual quality control (QC) reagents (mean creatinine concentrations of lev-els 1 and 3 = 0.65 mg/dL and 6.16 mg/dL, respectively) supplemented with either isopropanol or acetone to a target final concentration of 0 - 400 mg/dL. Samples were divided and assayed for creatinine on the Abbott Architect c system, and also underwent gas chromatography with flame ionization detec-tion for the quantification of volatile compounds (i.e. isopropanol and acetone). Results: The presence of isopropanol did not affect the measurement of cre-atinine however, acetone displayed a positive interference that increased with acetone concentration. The highest concentration of acetone tested (mean 330.3 mg/dL) resulted in a 0.18 mg/dL (27%) and a 0.20 mg/dL (3%) increase in creatinine concentration at level 1 and level 3 QC material, respectively. Conclusion: This study demonstrates that acetone can falsely elevate creatinine mea-surement performed on the Abbott Architect. This has important implications for pa-tients following isopropanol ingestion, as spurious results may lead to unnecessary treatment of renal failure. In these patients, creatinine measurements determined using this platform should be interpreted with caution, and an alternate creatinine methodol-ogy should be considered.
A-290Protein Gel Formation Caused the Interference of the Total Bilirubin Assay on the Roche Cobas 8000
C. D. Chin, K. Tong, L. Song. UCLA, Los Angeles, CA
Objective: Monoclonal immunoglobulin paraproteins (M-protein) present in serum or plasma samples in patients with multiple myeloma, Waldenstrom’s macroglobulin-emia, plasmacytoma, amyloidosis, and monoclonal gammopathy of undetermined sig-nificance (MGUS) can interfere with a wide range of chemistry or immunochemistry tests. M-protein precipitation and aggregation under an assay condition are the most important causes of the interference. Irreproducible results or fluctuation of results upon repeat is the characteristic pattern of M-protein interference caused by protein precipitation. In order to add to our understanding of the mechanisms of M-protein interference, we present an unusual case of interference due to protein gel formation on the total bilirubin assay. Case Presentation: A patient with recurrent multiple my-eloma characterized by multiple high-risk cytogenetic and molecular abnormalities was seen at our institution and an elevated total bilirubin result of 7.2 mg/dL (refer-ence interval (RI), 0.0 - 1.2 mg/dL) was obtained on the Roche Cobas 8000 automated chemistry analyzer (Roche Diagnostics, Indianapolis, IN). Other abnormal laboratory findings included elevated IgG of 10,400 mg/dL, lambda free light chains of 199.5 mg/dL with a kappa/lambda ratio < 0.01, beta-2 microglobulin of 6.2 mg/L (RI, 1.0-2.1), and total protein of 13.8 g/dL (RI, 6.1-8.2). Given the lack of clinical indications for liver disease, the clinical team questioned our total bilirubin result. Method and Results: Our investigation included three experiments: repeat testing in triplicate to conform the result, serial dilution to determine the presence of any interference, and mixing study to observe the reaction. The repeat results were 7.3 mg/dL, 7.3 mg/dL, and 7.2 mg/dL, indicative of consistent readings that did not fluctuate. The dilution experiment obtained total bilirubin results of 0.9 mg/dL, 0.3 mg/dL, and 0.1 mg/dL on two, three, and five times diluted samples, respectively, indicating poor recovery and lack of parallelism. Following the same sample to reagent ratio of 1:72 as that per-formed on the Cobas 702 instrument and mixing 20 µL of the sample with 1200 µL of the R1 reagent (containing 26 mmol/L phosphate, detergent, and solubilizers, pH 1.0) and 240 µL of the R2 reagent (containing 3,5-dichlorophenyl diazonium) of the Cobas total bilirubin (Gen.3) assay in a test tube, we observed the formation of a soft opaque gel. When the ratio of sample to R1 reagent was increased to 1:1, the entire solution turned into a single transparent gel in the tube. Discussion: Assay conditions, espe-cially pH and ionic strength, can induce protein conformational change. The previous studies explained that the precipitates or aggregates of M-protein caused a fluctuating pattern of repeated results due to random movement of protein aggregates/precipitates altering optical measurements. This case illustrated a non-fluctuating pattern upon repeat. This particular M-protein cross linked and formed a gel when changing its conformation at low pH of the total bilirubin assay. The M-protein formed a station-ary opaque gel which led to reproducible but incorrect absorbance measurement. This case study adds to our understanding of the mechanisms of M-protein interference with optical measurements of chemistry and immunochemistry assays.

S98 70th AACC Annual Scientific Meeting Abstracts, 2018
Tuesday, July 31, 9:30 am – 5:00 pm Factors Affecting Test Results
A-291Plasma Lactate Samples Collected in Fluoride/Oxalate Tubes Do Not Require Transport on Ice
S. M. Truscott1, T. Kampfrath2. 1Beaumont Health, Royal Oak, MI, 2Santa Clara Valley Medical Center, San Jose, CA
Background. Consensus guidelines for the management of sepsis and septic shock recommend baseline and follow-up lactate measurements (Surviving Sepsis Cam-paign, 2016). Lactate concentrations in whole blood samples can rapidly increase due to anaerobic glycolysis in erythrocytes. If testing is delayed, or if samples are not collected and transported appropriately, falsely elevated lactate results could lead to misdiagnosis and unnecessary treatment. Lactate production in vitro may be slowed by chilling the whole blood on ice and/or by collecting the blood in tubes containing glycolytic inhibitors, such as fluoride/oxalate tubes. Almost all diag-nostic test manufacturers and most laboratories measuring plasma lactate currently recommend collection in gray fluoride/oxalate tubes on ice, transport on ice, and minimizing delays in testing. However, not all laboratories require that fluoride/oxalate lactate specimens be transported on ice or kept refrigerated. The objective of this study was to determine stability of plasma lactate measurements in whole blood samples stored at room temperature after collection in fluoride/oxalate tubes. Methods. Whole blood was collected in green-top lithium heparin (n=4) or gray-top sodium fluoride / potassium oxalate (n=42) BD Vacutainer® plastic tubes and sent to the laboratory on wet ice. The whole blood was resuspend-ed, and de-identified aliquots were made. The primary tubes were centrifuged and tested immediately to obtain initial values for plasma lactate. After stor-age at room temperature or 4°C for various lengths of time, the whole blood aliquots were centrifuged to obtain plasma. Lactate measurements were made using either Beckman Coulter DxC800 or Roche Cobas automated methods. Results. Plasma lactate concentrations steadily increased in lithium heparin samples, as expected for whole blood at room temperature. Whole blood aliquots from fluoride/oxalate samples maintained plasma lactate concentrations within al-lowable error limits of ±0.4 mmol/L or 10%. Fluoride/oxalate samples had start-ing lactate concentrations ranging from 0.7 to 7.2 mmol/L. Samples stored for up to 3 days at room temperature (n= 29) had a mean increase of 0.1 mmol/L and maximum increase in 3 samples of 0.2 mmol/L. Samples stored for up to 11 days at 4°C (n = 13) had a mean increase of 0.2 mmol/L and maximum lactate in-crease in one sample of 0.5 mmol/L or +7% from an initial value of 7.2 mmol/L. Conclusions. It is widely believed that fluoride/oxalate tubes must be transported on ice and stored at refrigerated temperatures. While this is needed for glucose analysis, these data suggest that low temperature storage and transport are not necessary for lactate samples collected in fluoride/oxalate tubes. And if testing is delayed, the lactate may still be measured and reported from fluoride/oxalate tubes stored up to 3 days at room temperature. Removing the requirement for low temperature transport and stor-age may simplify and expedite testing for patients with sepsis.
A-292Accuracy of prediction of ovulation by digital home ovulation tests
D. Broomhead, L. Marriott, S. Johnson. SPD, Bedford, United Kingdom
Background: Home ovulation tests are a useful home diagnostic that enables women to time intercourse in order to maximise their chances of conception, if accurate. Ovu-lation tests rely on daily measurement of urinary lutenising hormone (LH) by lateral flow, with a surge in levels occurring approximately 1 day prior to ovulation. Digital tests offer the advantage of removing ambiguity of interpretation and employ optical signal recognition and algorithms to determine day of surge. This study aimed to ex-amine the accuracy of currently available digital tests. Methods: This study focused on 3 main digital home ovulation tests found in US retailers during 2017. Well at Walgreens consisted of 7 test sticks and a reader which deactivated after all tests were conducted or following LH surge detection; testing instructions were to test daily from day 8 of the cycle. First Response had 20 tests and a reader that deactivated once LH surge had been detected or all tests conducted; instructions were to test daily from day 5 of the cycle. Clearblue Advanced digital ovulation test tracks estrone-3-glucuronide as well as LH in order to identify the days of high fertility that precede the LH surge. It consisted of 20 test sticks and a holder, which did not deactivate, but reset after surge detected or non-usage; day on which to start testing was dependent on cycle length (with a look-up table to identify the start day), and users should continue testing until surge is detected. Daily urine samples from 33 women, with day of ovulation deter-mined by transvaginal ultrasonography and an LH surge detectable in urine (level ≥40mIU/ml, AutoDELFIA) were tested with 3 batches of each test, according to their instructions for use. Agreement of ovulation test result with true day of ovulation
was determined. Results: Well at Walgreens detected ovulation to within 1 day in 46.9% of cycles (95% CI: 36.6-57.3), with no increase in detection when considering to within 2 days. Ovulation was missed either, because testing began after LH surge had occurred, or because all tests were used and holder deactivated before reaching the surge day. First Response detected ovulation to within 1 day in 54.5% of cycles (95% CI: 44.2-64.6), and 65.7% (95% CI: 55.4-74.9) within 2 days with surges usu-ally missed due to reader not detecting the surge, despite testing on the surge day. Clearblue detected 94.9% (95% CI: 88.6-98.3) within 1 day and 98.0% (95% CI: 92.9-99.8) within 2 days. Conclusion: Although digital ovulation tests are much easier to read and so have the potential for high accuracy as demonstrated by the Clearblue test, other parameters can reduce accuracy. Of key importance are; having a testing strategy that helps ensure a test is conducted on the surge day and having an optical detection system and algorithm that correctly identifies surge.
A-293Prevalence of Biotin Interference in Samples Received for Routine Thyroid Function Testing
J. M. Stubblefield, D. N. Greene. University of Washington, Seattle, WA
Background: The increased use of biotin supplementation, and the subsequent influ-ence this can have on laboratory testing, has become a hot topic. On the Beckman DxI platform, Total T3 (TT3), Free T3 (fT3), and Free T4 (fT4) are subject to biotin in-terference, which can falsely elevate results. TSH and Total T4 (TT4) are unaffected. The purpose of this study was to first, use historical data to estimate the prevalence of biotin interference, assuming that retrospective results showing a pattern of normal or elevated TSH with concurrent elevated thyroid hormone concentrations were likely candidates for biotin interference. Second, we sought to develop a protocol to detect biotin interference in these assays and to validate the method using samples with the suggested result pattern. Combined, these data provide us with quality assessment criteria to prospectively detect and evaluate samples received for routine thyroid func-tion testing before erroneous results are reported. Methods: Paired TSH, TT3, fT3, TT4, and fT4 results were extracted from the LIS over a 12-month period. Results were filtered to exclude low TSH results (<0.4 mIL/L) and high TT4 results (>10.8 mcg/dL). Pooled serum samples adulterated with biotin (biotin concentration range 0 - 1,500 ng/mL) were tested on the DxI to evaluate interference in the thyroid hor-mone assays. Pooled serum samples and samples adulterated with 500 ng/mL biotin were incubated with various concentrations of streptavidin coated magnetic beads to establish endogenous thyroid hormone concentration recovery. Results: During the 12-month period ending 12/31/2017, we performed 72,843 TSH tests. After excluding paired results with low TSH and high T4, the remaining 67,628 results were then ana-lyzed to identify result patterns suggestive of biotin interference, including elevated TT3, fT3, and/or fT4 in samples with high/normal TSH and normal TT4. These data estimated that 4.6% of all samples submitted for routine thyroid function analysis may have erroneous results due to biotin interference. Interference in TT3, fT3, and fT4 assays was confirmed by spiking biotin into pooled serum samples at concentrations ranging from 50 -1,500 ng/mL. The addition of biotin elevated previously normal levels to levels above the upper limit of normal for T3, fT3, and T4 at all concentra-tions tested. An assay using streptavidin coated magnetic beads was developed that identified biotin interference by detecting >75% recovery of TT3, fT3, and fT4, with a <10% change in TT4. Conclusions: The thyroid function tests for Total T3, Free T3, and Free T4 can be falsely elevated on the DxI platform as a result of biotin interfer-ence. This study estimates the prevalence of biotin interference in historical results, and details the development of pre-selection criteria, a sample testing method, and an evaluation protocol to identify biotin interference in these assays.