Progressive development of the rat osteoblast phenotype in vitro: reciprocal …

Tsc2 Is a Molecular Checkpoint Controlling Osteoblast Developmentand Glucose Homeostasis
Ryan C. Riddle,a,b Julie L. Frey,a Ryan E. Tomlinson,a Mathieu Ferron,c,d Yuanyuan Li,e Douglas J. DiGirolamo,a
Marie-Claude Faugere,f Mehboob A. Hussain,e Gerard Karsenty,g Thomas L. Clemensa,b
Department of Orthopaedic Surgery, Johns Hopkins University School of Medicine, Baltimore, Maryland, USAa; Baltimore Veterans Administration Medical Center,Baltimore, Maryland, USAb; Institut de recherches cliniques de Montréal, Montréal, Québec, Canadac; Département de Médecine, Université de Montréal, Montréal,Québec, Canadad; Departments of Pediatrics, Medicine, and Biological Chemistry, Metabolism Division, Johns Hopkins University, Baltimore, Maryland, USAe; Division ofNephrology, University of Kentucky, Lexington, Kentucky, USAf; Department of Genetics and Development, College of Physicians and Surgeons, Columbia University, NewYork, New York, USAg
Insulin signaling in osteoblasts regulates global energy balance by stimulating the production of osteocalcin, a bone-derived pro-tein that promotes insulin production and action. To identify the signaling pathways in osteoblasts that mediate insulin’s effectson bone and energy metabolism, we examined the function of the tuberous sclerosis 2 (Tsc2) protein, a key target important incoordinating nutrient signaling. Here, we show that loss of Tsc2 in osteoblasts constitutively activates mTOR and destabilizesIrs1, causing osteoblasts to differentiate poorly and become resistant to insulin. Young Tsc2 mutant mice demonstrate hypogly-cemia with increased levels of insulin and undercarboxylated osteocalcin. However, with age, Tsc2 mutants develop metabolicfeatures similar to mice lacking the insulin receptor in the osteoblast, including peripheral adiposity, hyperglycemia, and de-creased pancreatic � cell mass. These metabolic abnormalities appear to result from chronic elevations in undercarboxylatedosteocalcin that lead to downregulation of the osteocalcin receptor and desensitization of the � cell to this hormone. Removal ofa single mTOR allele from the Tsc2 mutant mice largely normalizes the bone and metabolic abnormalities. Together, these find-ings suggest that Tsc2 serves as a key checkpoint in the osteoblast that is required for proper insulin signaling and acts to ensurenormal bone acquisition and energy homeostasis.
The formation, remodeling, and repair of the skeleton are per-formed by osteoblasts, osteoclasts, and osteocytes through a
process that is increasingly recognized as energetically expensive(1). To coordinate bone formation and remodeling, bone cell ac-tivity is regulated by intricate networks of local factors and sys-temic hormones. In turn, bone cells secrete factors that commu-nicate with other tissues to ensure homeostatic regulation ofglobal energy utilization (2, 3). For example, the adipocyte-de-rived hormone leptin influences appetite and energy expenditure(4) and also regulates postnatal bone acquisition (5, 6). In addi-tion, osteoblasts and osteocytes produce and secrete hormones,including osteocalcin, which enhances insulin secretion and pe-ripheral insulin sensitivity (7).
Recent studies (8, 9) have demonstrated that insulin signalingin osteoblasts is required for normal bone acquisition and thecoordination of whole-body glucose metabolism. Osteoblastslacking the insulin receptor fail to differentiate normally, whichresults in reduced postnatal bone acquisition. In addition, loss ofinsulin signaling in osteoblasts inhibits osteocalcin production viaincreased activity of FoxO1, a suppressor of osteocalcin gene tran-scription (10, 11). Thus, the metabolic abnormalities in mice lack-ing the insulin receptor in osteoblasts can be partially reversed byinfusing mice with undercarboxylated osteocalcin (ucOCN) (8),strongly suggesting the existence of an osteoblast-pancreas endo-crine loop in which bone production of ucOCN ensures appro-priate insulin production in a feed-forward loop.
Many of the physiological responses induced by insulin aremediated by phosphatidylinositol 3-kinase (PI3K) signaling viaAkt (12), including the activation of the conserved Ser/Thr kinasemTOR, known to regulate cell growth and nutrient metabolism(13). Akt indirectly activates mTOR by targeting a heterodimer
complex composed of Tsc1 and Tsc2. The Tsc2 protein contains aGTPase-activating protein (GAP) domain that has GAP activitytoward the small G protein Rheb (Ras homolog enriched in brain)(14, 15). Phosphorylation of Tsc2 by Akt diminishes its inhibitoryactivity (16, 17) and allows the GTP-bound form of Rheb to acti-vate mTOR and its downstream targets, such as the ribosomal S6kinase and eukaryotic initiation factor 4E-binding protein (eIF-4BP). Therefore, the Tsc complex represents a key control point inthe conduction of insulin-generated signals in target cells.
In this study, we used a genetic approach in mice to examinethe role of Tsc2 in the performance and metabolic actions of os-teoblasts. We found that loss of Tsc2 in osteoblasts results in con-stitutive mTOR activity, which causes the accumulation of disor-ganized bone produced by excessive numbers of osteoblasts.Young Tsc2 mutant mice demonstrate hypoglycemia with ele-vated serum insulin levels and have elevated levels of undercar-boxylated osteocalcin, a metabolic profile opposite that of micelacking the insulin receptor (IR) in osteoblasts. With age, micelacking Tsc2 in osteoblasts develop glucose intolerance, with in-
Received 20 January 2014 Returned for modification 24 February 2014Accepted 25 February 2014
Published ahead of print 3 March 2014
Address correspondence to Ryan C. Riddle, [email protected], or Thomas L.Clemens, [email protected].
Supplemental material for this article may be found at http://dx.doi.org/10.1128/MCB.00075-14.
Copyright © 2014, American Society for Microbiology. All Rights Reserved.
doi:10.1128/MCB.00075-14
1850 mcb.asm.org Molecular and Cellular Biology p. 1850 –1862 May 2014 Volume 34 Number 10
on July 30, 2015 by WE
LCH
ME
DIC
AL LIB
RA
RY
- John Hopkins U
http://mcb.asm
.org/D
ownloaded from

creased peripheral adiposity and other metabolic disturbancesthat appear to result from desensitization to chronic elevations inserum osteocalcin. Our findings suggest a model in which the Tsc2signaling complex serves as a checkpoint that restrains insulinsignaling to mTOR in an attempt to control normal osteoblastdevelopment and glucose homeostasis.
MATERIALS AND METHODSAnimal models. The Institutional Animal Care and Use Committee ofthe Johns Hopkins University approved all procedures involving mice.Tsc2 and mTOR were disrupted in the osteoblast by crossing Tsc2flox/flox
mice (18) or mTORflox/flox mice (19) with osteocalcin-Cre (OC-Cre)transgenic mice (20). Tsc2flox/flox mice were backcrossed on to a C57BL/6background for 8 generations prior to use. The background of bothmTORflox/flox and OC-Cre mice is C57BL/6. Genotyping primers areshown in Table S1 in the supplemental material. Specificity of recombi-nation was assessed using a PCR-based strategy and primer pairs thatflanked the floxed allele.
Imaging and histomorphometry. Male control and transgenic micewere sacrificed at the age indicated below, and bone volume was assessedusing a desktop micro-tomographic imaging system (Skyscan 1172; Sky-scan). Histological analyses using a semiautomatic method (Osteoplan II;Kontron) were carried out on 6-week-old mice injected with 1% (wt/vol)calcein 5 and 3 days prior to sacrifice (20). All analyses of bone structurewere completed in accordance with the recommendations of the Ameri-can Society for Bone and Mineral Research (21–23). Pancreata were fixedand stained, and islet morphometry was assessed as previously described(24). Immunostaining of skeletal tissue was carried out according to stan-dard techniques using antibodies specific for p70 S6K (Cell Signaling;2708), Runx2 (Santa Cruz; sc-10758), and Osterix (Santa Cruz; sc-133871), as well as appropriate secondary antibodies from Life Technol-ogies.
Cell culture studies. Osteoblasts were isolated from calvaria of new-born mice by serial digestion in 1.8 mg/ml of collagenase. For in vitro genedeletion, osteoblasts containing floxed alleles were infected with adenovi-rus encoding Cre recombinase or green fluorescent protein (Vector Bio-labs) as previously described (25). Infection with a multiplicity of infec-tion (MOI) of 100 was used in all experiments, with gene deletion beingconfirmed by PCR and immunoblotting. Osteoblast proliferation was as-sessed by flow cytometry after staining bromodeoxyuridine (BrdU)-la-beled cells (10 �M; BD Biosciences) with anti-BrdU-allophycocyanin(APC) and 7-amino-actinomycin D. Protein synthesis (Click-iT AHAProtein Synthesis; Life Technologies) and caspase activity (Promega) wereassessed using commercially available kits according to the manufactur-ers’ recommendations. Osteoblast differentiation was induced by supple-menting minimal essential medium, alpha modification (�MEM), with10% serum, 10 mM �-glycerol phosphate, and 50 �g/ml of ascorbic acid.Alkaline phosphatase and alizarin red S staining were carried out accord-ing to standard techniques. Min6 cells were cultured according to stan-dard techniques. Primary � cells were isolated by collagenase digestionand gradient centrifugation (24).
Gene expression studies. Total RNA was extracted using TRIzol (LifeTechnologies), reverse transcribed using an iScript cDNA synthesis kit(Bio-Rad), and amplified by real-time PCR using SYBR green PCR mastermix (Bio-Rad). Reactions were normalized to actin levels. Primer se-quences are shown in Table S1 in the supplemental material and wereobtained from PrimerBank (http://pga.mgh.harvard.edu/primerbank/index.html). Antibodies used in immunoblotting studies were obtainedfrom Cell Signaling Technologies or Abcam. Osteoblasts were treated withinsulin after being starved of serum overnight. SP600125 and rapamycin(Sigma-Aldrich) were replaced with medium changes during differentia-tion studies. Chromatin immunoprecipitation (ChIP) assays were per-formed using a commercially available kit (Pierce) and a FoxO1 antibodyfrom Santa Cruz Biotechnology, Inc. (H-128) (10). Precipitated DNA was
amplified using SYBR green PCR master mix and normalized to reactionsusing input DNA as a template.
Metabolic studies and bioassays. Serum calcium was assessed usingcalcium-arsenazo methods (Alfa Wasserman), while serum phosphorusmeasurements were performed using the phosphomolybdate-malachitegreen method (Biovision). Blood glucose was measured using a One-Touch Ultra handheld glucose monitor (LifeScan), while serum insulinlevels were determined by enzyme-linked immunosorbent assay (ELISA)(Alpco). For glucose tolerance tests (GTTs), glucose (2 g/kg of bodyweight [BW]) was injected intraperitoneally (i.p.) after an overnight fast.For insulin tolerance tests (ITTs), mice were fasted for 4 h and then in-jected i.p. with insulin (0.2 U/kg of BW). Serum C-telopeptide (CTX;Immunodiagnostik) and serum osteoprotegerin (OPG; R&D Systems)levels were determined by ELISA. A previously described triple ELISA-based system was used to determine the concentrations of carboxylatedand undercarboxylated osteocalcin in serum (26).
Statistics. All results are presented as means � standard errors of themeans. Analyses of area under the curve were performed using Prism(GraphPad). Statistical analyses were performed using unpaired, two-tailed Student’s t tests. A P value of less than 0.05 was considered signifi-cant.
RESULTSTsc2-deficient osteoblasts produce disorganized bone. Insulinreceptor activation in target cells converges on the Tsc-mTORsignaling complex, which serves to coordinate many of the hor-mone’s biological responses. To begin to characterize the role ofthis pathway in regulating bone formation and energy metabo-lism, we generated mice in which Tsc2 was selectively disrupted inthe osteoblast. Male progeny from matings between OC-CreTG/�
Tsc2flox/flox and Tsc2flox/flox mice (18) with the genotype OC-CreTG/� Tsc2flox/flox (hereafter referred to as �Tsc2 mice) wereselected for detailed analysis. Male Tsc2flox/flox littermates servedas controls. �Tsc2 mice were born at the expected Mendelianfrequency and had a 55% reduction in Tsc2 mRNA levels in bonetissue relative to controls (data not shown), and allele-specificPCR confirmed that recombination of Tsc2 alleles occurred onlyin skeletal tissue (i.e., calvaria and femur) (Fig. 1A). Immunohis-tochemical staining revealed an increase in the phosphorylationlevels of S6 kinase (S6K1), indicating that mTOR activity was in-deed increased by this genetic manipulation (Fig. 1B).
�Tsc2 mice exhibited a progressive increase in postnatal boneacquisition. While trabecular bone volume peaked at 12 weeks ofage in the femur of controls, �Tsc2 mice continued to accumulatetrabecular bone with bone volume/tissue volume (BV/TV) ex-ceeding 75% at 24 weeks of age (Fig. 1C to G). Similar increases inbone volume were evident in the cortical bone envelope (Fig. 1H)and calvarial bones of the skull (Fig. 1I), without effects on serumcalcium or phosphate levels (Table 1). Female �Tsc2 mice alsoexhibited an increase in measures of trabecular and cortical bonearchitecture (data not shown).
To define the cellular basis for this phenotype, static and dy-namic histomorphometric analyses were performed in the trabec-ular bone compartment of 6-week-old mice (Table 1). Dramaticincreases in osteoblast numbers per bone perimeter (Ob.N/BPM)and mineralizing surface per bone surface (MS/BS) in the mutantmice relative to controls led to an overall increase in the boneformation rate (BFR/BS). However, the increased osteoid surface(OS/BS) in the mutant mice together with a mineral appositionrate (MAR) that was similar to that of control mice suggests thatthe performance of individual osteoblasts in the mutant mice isimpaired. In support of this idea, histological examination of de-
Tsc-mTOR Signaling in Bone
May 2014 Volume 34 Number 10 mcb.asm.org 1851
on July 30, 2015 by WE
LCH
ME
DIC
AL LIB
RA
RY
- John Hopkins U
http://mcb.asm
.org/D
ownloaded from
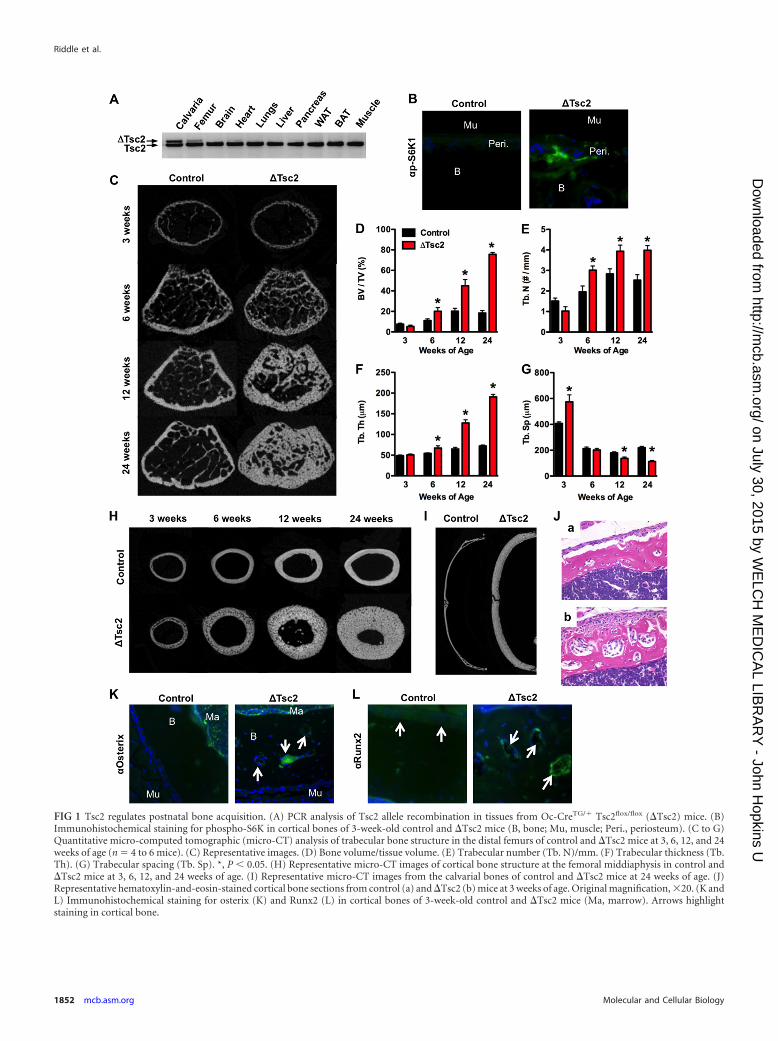
FIG 1 Tsc2 regulates postnatal bone acquisition. (A) PCR analysis of Tsc2 allele recombination in tissues from Oc-CreTG/� Tsc2flox/flox (�Tsc2) mice. (B)Immunohistochemical staining for phospho-S6K in cortical bones of 3-week-old control and �Tsc2 mice (B, bone; Mu, muscle; Peri., periosteum). (C to G)Quantitative micro-computed tomographic (micro-CT) analysis of trabecular bone structure in the distal femurs of control and �Tsc2 mice at 3, 6, 12, and 24weeks of age (n � 4 to 6 mice). (C) Representative images. (D) Bone volume/tissue volume. (E) Trabecular number (Tb. N)/mm. (F) Trabecular thickness (Tb.Th). (G) Trabecular spacing (Tb. Sp). *, P 0.05. (H) Representative micro-CT images of cortical bone structure at the femoral middiaphysis in control and�Tsc2 mice at 3, 6, 12, and 24 weeks of age. (I) Representative micro-CT images from the calvarial bones of control and �Tsc2 mice at 24 weeks of age. (J)Representative hematoxylin-and-eosin-stained cortical bone sections from control (a) and �Tsc2 (b) mice at 3 weeks of age. Original magnification, 20. (K andL) Immunohistochemical staining for osterix (K) and Runx2 (L) in cortical bones of 3-week-old control and �Tsc2 mice (Ma, marrow). Arrows highlightstaining in cortical bone.
Riddle et al.
1852 mcb.asm.org Molecular and Cellular Biology
on July 30, 2015 by WE
LCH
ME
DIC
AL LIB
RA
RY
- John Hopkins U
http://mcb.asm
.org/D
ownloaded from

calcified samples from cortical bone revealed layers of mesenchy-mal cells lining the periosteal surface and embedded within thebone matrix of the mutant mice (Fig. 1J). These cells stained pos-itively for osterix and Runx2, indicating their position along theosteoblast lineage (Fig. 1K and L).
Osteoclast numbers per bone perimeter (Table 1) tended to bedecreased in the mutant mice but did not reach statistical signifi-cance. However, the levels of serum CTX, a marker of matrixdegradation, revealed a modest impairment in bone resorption,perhaps as a result of increased levels of serum OPG. Taken to-gether, these results indicate that loss of Tsc2 in osteoblasts resultsin the formation of sclerotic bone populated by excessive numbersof osteoblasts and a reduction in bone resorption.
Tsc2 is required for normal osteoblast differentiation. Tomore closely examine the impact of Tsc2 loss of function on os-teoblast differentiation, we used primary calvarial osteoblast cul-tures in which Tsc2 was eliminated just prior to the induction ofosteoblast differentiation by infection with adeno-Cre expressionvectors (8, 25). Osteoblasts lacking Tsc2 exhibited the expectedactivation of mTOR as indicated by increased phosphorylation ofS6K1 (Fig. 2A) and enhanced protein synthesis (Fig. 2B). Prolif-eration was found to be impaired in Tsc2-deficient osteoblastswhen assessed by BrdU incorporation (Fig. 2C), but the mutantcells exhibited lower levels of both basal and staurosporine-in-duced apoptosis (Fig. 2D). Established measures of osteoblast dif-
ferentiation, including staining for alkaline phosphatase and cal-cium deposition, and the expression of genetic markers ofdifferentiated osteoblasts, including Runx2, osterix, and collagenI, were uniformly reduced in �Tsc2 osteoblasts compared to con-trols (Fig. 2E and F). RankL levels were normal, but consistentwith the reduction in osteoclast activity and increased serum OPGin vivo, expression of OPG mRNA levels were increased in themutant osteoblasts compared to controls (Fig. 2G).
Impaired osteoblast differentiation coupled with increased ex-pression of the Runx2 transcriptional inhibitors Twist1 andTwist2 (27) (Fig. 2F) was reminiscent of the phenotype observedin osteoblasts lacking the insulin receptor (8). Indeed, insulin-stimulated Akt phosphorylation was markedly reduced in osteo-blasts rendered deficient for Tsc2 and was associated with a reduc-tion in Irs1 protein abundance (Fig. 2H). The diminished Irs1levels were due not to a decrease in mRNA expression (Fig. 2I) butrather to an acceleration of protein turnover (Fig. 2J). Consistentwith other models of Tsc1 and Tsc2 deficiency (28–30), �Tsc2osteoblasts displayed features of an endoplasmic reticulum (ER)stress response, including marked increases in the phosphoryla-tion of eIF-2�, Perk, and Jnk (Fig. 2K) and expression of Chop andBiP (Fig. 2L). Application of SP600125, a synthetic inhibitor of Jnkand also of S6K1 (31), to inhibit this pathway and prevent thetargeting of Irs1 for degradation (32, 33) normalized Irs-1 proteinlevels (Fig. 2M), restored insulin sensitivity as determined by thephosphorylation of Akt, and dramatically improved the ability ofTsc2-deficient osteoblasts to differentiate in vitro (Fig. 2N). Sim-ilarly, treating cultures of �Tsc2 osteoblasts with low doses ofrapamycin (0.01 nM and 0.1 nM) improved matrix mineraliza-tion (Fig. 2O), even though higher concentrations (10 nM) im-paired mineralization of control osteoblasts (Fig. 2P). Overall,these data suggest that detrimentally high levels of mTOR signal-ing in Tsc2-deficient osteoblasts lead to the downregulation ofIrs1, causing osteoblasts to become resistant to insulin, differen-tiate poorly, and produce disorganized bone.
Loss of Tsc2 in osteoblasts impairs glucose metabolism. Asreviewed above, mice lacking insulin receptors in osteoblasts de-velop hyperglycemia, insulin resistance, and peripheral adiposity(8, 9). In this study, the loss of Tsc2 function in osteoblasts re-sulted in similar changes in metabolism. �Tsc2 mice exhibited aprogressive increase in total body weight relative to controls thatwas first evident at 5 weeks of age (Fig. 3A). While this increase inbody weight may partially result from the dramatic increases inbone volume, gonadal fat pad weights were increased 26% in Tsc2mutants at 6 weeks of age and were enlarged further at 12 weeks ofage (Fig. 3B). We suspected that like in osteoblast-specific insulinreceptor mutants, this increase in peripheral adiposity was sec-ondary to altered glucose metabolism. Indeed, �Tsc2 mice werehyperglycemic in both the fed and fasted states (Fig. 3C and D),and this phenotype was accompanied by a decrease in serum in-sulin levels (Fig. 3E).
This phenotype appeared to result from an impairment in glu-cose-stimulated insulin secretion, as the mutant mice exhibited areduction in glucose tolerance (Fig. 3F and H) that further dete-riorated with age (12 weeks [Fig. 3I and K]), while peripheralinsulin action, assessed by ITT, was enhanced in young mice (6weeks [Fig. 3G]) and later normalized (12 weeks [Fig. 3J]). Inaccordance with this idea, the �Tsc2 mice showed blunted glu-cose-stimulated insulin secretion compared to that in controls(Fig. 3L) and reductions in � cell area (Fig. 3M and N), � cell mass
TABLE 1 Histomorphometry and serum measurementsa
Parameter
Value for mice
Control �Tsc2
Bone structureBone length (mm) 13.56 � 0.19 13.89 � 0.27Growth plate thickness (�m) 85.73 � 4.35 85.87 � 4.58
Bone formationOsteoid vol/bone vol (%) 2.22 � 0.46 4.61 � 1.53Osteoid surface/bone surface (%) 12.38 � 1.74 22.88 � 4.84*Osteoid thickness (�m) 2.26 � 0.16 2.98 � 0.57Osteoblast surface/bone surface (%) 6.04 � 1.01 16.27 � 3.77*Osteoblast no./bone perimeter
(no./100 mm)618 � 102 1,355 � 263*
Bone erosionErosion surface/bone surface (%) 5.51 � 0.96 4.06 � 0.67Erosion depth (�m) 6.38 � 0.36 6.29 � 0.86Osteoclast surface (%) 4.75 � 0.83 3.67 � 0.63Osteoclast no./bone perimeter
(no./100 mm)203 � 32 156 � 27
Bone dynamicsMineral apposition rate (�m/day) 2.36 � 0.32 2.91 � 0.42Mineralizing surface/bone surface (%) 11.57 � 1.75 20.99 � 4.68*Bone formation rate/bone surface
(mm3/cm2/yr)11.35 � 2.88 29.45 � 10.92*
Mineralization lag time (days) 1.74 � 0.39 1.41 � 0.23
SerologyCalcium (mg/dl) 9.74 � 0.25 9.68 � 0.09Phosphorus (mg/dl) 10.13 � 1.52 10.18 � 0.33CTX (ng/ml) 41.08 � 1.43 32.84 � 1.42*OPG (pg/ml) 2,789 � 132 3,749 � 240*
a Values are shown as means � standard errors. *, P 0.05.
Tsc-mTOR Signaling in Bone
May 2014 Volume 34 Number 10 mcb.asm.org 1853
on July 30, 2015 by WE
LCH
ME
DIC
AL LIB
RA
RY
- John Hopkins U
http://mcb.asm
.org/D
ownloaded from

FIG 2 Tsc2 deficiency impairs osteoblast differentiation. (A) Western blot analysis of Tsc2 expression in primary osteoblasts isolated from Tsc2flox/flox mice afterinfection with adenovirus expressing Cre (�Tsc2) or green fluorescent protein (GFP) (Con) as a control. S6K1 phosphorylation was used as a marker of mTORactivation. (B) Quantification of protein synthesis in control and �Tsc2 osteoblasts. Results are expressed as percentage of control osteoblasts. (C) Quantificationof osteoblast proliferation by BrdU incorporation in control and �Tsc2 osteoblasts. (D) Quantification of osteoblast apoptosis via caspase-3 activity in controland �Tsc2 osteoblasts treated with vehicle (NT) or 8 ng/ml of staurosporine. Results are expressed as percentage of vehicle-treated control osteoblasts. (E to G)
Riddle et al.
1854 mcb.asm.org Molecular and Cellular Biology
on July 30, 2015 by WE
LCH
ME
DIC
AL LIB
RA
RY
- John Hopkins U
http://mcb.asm
.org/D
ownloaded from

(Fig. 3O), and pancreatic expression of Ins1 and Ins2 (Fig. 3P).Moreover, markers of insulin signaling in white adipose (Pparg),brown adipose (Ucp1), and liver were altered in the mutant mice(Fig. 3Q and R). Most notably, expression of Pck1, an insulintarget gene involved in gluconeogenesis (34), was increased in theliver of �Tsc2 mice relative to controls, while the expression ofPdk4 and Gck, insulin targets involved in glycolysis (35, 36), werereduced (Fig. 3R). Thus, loss of Tsc2 in osteoblasts leads to in-creased peripheral adiposity in association with glucose intoler-ance and reduced insulin production.
Tsc2 modulates osteocalcin production. Because insulin sig-naling in osteoblasts enhances both the production and bioavail-ability of the bone-derived hormone osteocalcin (8, 9), we initiallybelieved that the metabolic deficiencies evident in Tsc2 mutantswere the result of reductions in serum ucOCN. However, serumosteocalcin levels were actually increased in Tsc2 mutant mice(Fig. 4A). Furthermore, levels of uncarboxylated OCN were in-creased 4.5-fold (Fig. 4B), while the levels of osteocalcin lackingcarboxylation at Glu13 were increased more than 10-fold in�Tsc2 mice compared to controls (Fig. 4C). The increased ratio ofGlu13-OCN to total serum osteocalcin (data not shown) and de-creased osteoclastic bone resorption (Table 1) suggest a directeffect of Tsc2 loss of function on production of undercarboxylatedosteocalcin. Consistent with the increase in serum osteocalcin,Tsc2-deficient osteoblasts exhibited significantly higher levels ofosteocalcin mRNA (Fig. 4D), although the expression of the os-teocalcin gene was no longer responsive to insulin.
We next examined the mechanism responsible for the in-creased osteocalcin levels. Because Runx2 mRNA levels (Fig. 2F)were suppressed and both the mRNA (Fig. 2F) and protein (Fig.4E) levels of Atf4 appeared normal in �Tsc2 osteoblasts, we fo-cused our attention on FoxO1, a transcriptional repressor of os-teocalcin expression (10). Mutant osteoblasts had increased levelsof FoxO1 phosphorylation (Fig. 4F) and a 33% reduction in thenuclear abundance (Fig. 4G) of this transcription factor. The re-duction in the occupancy of FoxO1 at two consensus binding siteson the osteocalcin promoter in the mutant cells revealed by ChIPanalysis (Fig. 4H) suggests the existence of a molecular link be-tween Tsc-mTOR and FoxO1 activities and osteocalcin produc-tion.
To begin to explore possible explanations for the apparent dis-crepancy between ucOCN levels and metabolic parameters, weexamined glucose metabolism in younger mice. Surprisingly,1-week-old mutant mice exhibited signs of improved glucose han-dling, including reduced blood glucose levels (Fig. 5A), increasedserum insulin (Fig. 5B), and increased expression of Ins1 and Ins2in the pancreas (Fig. 5C). Additionally, levels of uncarboxylatedosteocalcin in serum were increased by 21% (Fig. 5D and E). Thissuggested the possibility that chronic exposure to high levels of
this hormone leads to a resistance of pancreatic � cells to respondto further stimulation by osteocalcin.
To test this idea, we cultured Min6 � cells in media condi-tioned with �Tsc2 or control osteoblasts. Consistent with the in-creased expression of osteocalcin by the mutant osteoblasts (Fig.4D), medium conditioned with �Tsc2 osteoblasts contained a2.8-fold-higher concentration of osteocalcin than medium condi-tioned with wild-type osteoblasts (Fig. 5F). Min6 cells cultured inthe medium conditioned by the mutant cells exhibited a 37% re-duction in the abundance of Gpcr6a, a putative osteocalcin recep-tor (37, 38), relative to those cultured in medium conditioned bycontrol osteoblasts (Fig. 5G). Additionally, while the addition ofexogenous undercarboxylated osteocalcin increased Ins1 and Ins2mRNA expression in � cells cultured in control medium, no re-sponse was observed in cells cultured in �Tsc2 conditioned me-dium (Fig. 5H and I). Finally, to determine if this downregulationof Gpcr6a expression also occurred in vivo, we collected islets fromthe pancreata of 6-week-old control and �Tsc2 mice. Similar tothe effect observed in vitro, Gpcr6a abundance was reduced bymore than 60% in extracts prepared from the mutant mice (Fig. 5Jand K). Collectively, these results are compatible with the notionthat chronic exposure to high levels of OCN both in vitro and invivo desensitizes the � cell by way of G protein-coupled receptordownregulation. Such a mechanism might therefore account, atleast in part, for the loss of pancreatic responsivity and insulinproduction in Tsc2 mutant mice.
Removal of one mTOR allele normalizes bone and metabolicabnormalities in �Tsc2 mice. The results from the Tsc2 loss offunction model described above imply that Tsc2 exerts its effecton bone and energy metabolism by regulating mTOR. In order tomore firmly establish the linkage between Tsc2 and mTOR inthese phenotypes, we created compound mutant mice in whichone allele of mTOR was disrupted in the �Tsc2 mice. As expected,trabecular bone architecture was partially normalized by this ma-nipulation (Fig. 6A). Likewise, measures of body weight (Fig. 6B)and glucose metabolism, including glucose levels from randomlyfed and starved mice (Fig. 6C), and glucose tolerance (Fig. 6D) inthe compound mutants were nearly indistinguishable from thoseof wild-type littermates. Disruption of a single mTOR allele alonehad no impact on bone volume (Fig. 6A) or glucose metabolism(data not shown), but homozygous deletion of mTOR in the os-teoblasts (Fig. 6E) impaired postnatal bone acquisition in vivo(Fig. 6G to I) and osteoblast differentiation in vitro (Fig. 6J and K),without affecting body weight (Fig. 6F). These data support thenotion that Tsc2 lies upstream of the mTOR pathway in osteo-blasts and participates in insulin-mediated regulation of bone ac-quisition and insulin responses through the osteoblast.
Examination of osteoblast differentiation after the deletion of Tsc2. (E) Alkaline phosphatase (ALP) and alizarin red (ARS) staining after 14 days of differenti-ation. (F) Quantitative PCR (qPCR) analysis of Runx2, osterix (Osx), Atf4, type I collagen (ColI), Twist1, and Twist2 expression after 14 days of differentiation.(G) qPCR analysis of RankL and Opg expression after 14 days of differentiation. (H) Western blot analysis of insulin-stimulated (10 nM for 15 min) Aktphosphorylation and Irs1 levels in control and �Tsc2 osteoblasts. (I) qPCR analysis of Irs1 expression in control and �Tsc2 osteoblasts. (J) Irs1 protein levels incontrol and �Tsc2 osteoblasts cultured in the presence of cycloheximide (100 �g/ml). (K) Western blot analysis of eIF-2�, Perk, and Jnk phosphorylation statusin control and �Tsc2 osteoblasts. (L) qPCR analysis of Chop and BiP expression in control and �Tsc2 osteoblasts. (M) Western blot analysis of Irs1 proteinexpression and insulin-stimulated Akt phosphorylation in control and �Tsc2 cells and �Tsc2 cells treated with SP600125 (Jnk inhibitor; 10 �M) for 24 h. (N)qPCR analysis of Tsc2, Runx2, and osterix (Osx) expression after 14 days of differentiation in control and �Tsc2 cells and �Tsc2 osteoblasts treated withSP600125. (O) Alizarin red staining of cultures of control and �Tsc2 osteoblasts after 14 days of differentiation in the presence of the indicated concentration ofrapamycin. (P) Alizarin red staining of cultures of control osteoblasts differentiated for 7 days in the presence of 0 or 10 nM rapamycin. *, P 0.05.
Tsc-mTOR Signaling in Bone
May 2014 Volume 34 Number 10 mcb.asm.org 1855
on July 30, 2015 by WE
LCH
ME
DIC
AL LIB
RA
RY
- John Hopkins U
http://mcb.asm
.org/D
ownloaded from

FIG 3 �Tsc2 mice have increased peripheral adiposity and altered glucose metabolism. (A) Body weight of control and �Tsc2 mice (n � 8 to 11). (B) Gonadalfat pad mass at 6 and 12 weeks of age (n � 4 to 6 mice). (C) Measurements of random fed glucose at 6 and 12 weeks of age (n � 5 to 8 mice). (D) Measurementsof fasting glucose at 6 and 12 weeks of age (n � 5 to 8 mice). (E) Serum insulin levels at 6 and 12 weeks of age (n � 4 to 6 mice). (F) Glucose tolerance test afterfasting overnight at 6 weeks (n � 5 to 8 mice). (G) Insulin tolerance testing after fasting 4 h at 6 weeks (n � 5 or 6 mice). (H) Analysis of area under the curve forGTT and ITT at 6 weeks of age. (I) Glucose tolerance testing after fasting overnight at 12 weeks (n � 5 to 8 mice). (J) Insulin tolerance testing after fasting for 4h at 12 weeks (n � 5 or 6 mice). (K) Analysis of area under the curve for GTT and ITT at 12 weeks of age. (L) Glucose-stimulated insulin secretion test after fastingovernight at 12 weeks of age (n � 4 or 5 mice). (M to O) Histomorphometric analysis of pancreatic � cells in control and �Tsc2 mice (n � 5 mice). (M)Representative images of islets stained for insulin and with 4=,6-diamidino-2-phenylindole (DAPI). (N) � cell area (percentage of tissue area). (O) � cell mass.(P) qPCR analysis of Ins1 and Ins2 expression in pancreas (n � 4 mice). (Q) qPCR analysis of Pparg and Ucp1 expression in white adipose (WAT) and brownadipose (BAT) tissue (n � 5 mice). (R) qPCR analysis of Pck1, Pdk4, and Gck expression in liver (n � 5 mice). *, P 0.05.
1856 mcb.asm.org Molecular and Cellular Biology
on July 30, 2015 by WE
LCH
ME
DIC
AL LIB
RA
RY
- John Hopkins U
http://mcb.asm
.org/D
ownloaded from

DISCUSSION
In this study, we used a genetic approach in mice to define criticalsignaling pathways downstream of the insulin receptor that regu-late osteoblast development and metabolic function. We focusedon Tsc2 because of its well-established role as a central controlpoint for the integration of signals important for growth and nu-trient utilization (39–41). In addition, we reasoned that manipu-lating Tsc2 would afford a less complicated approach than target-ing the more intricate, multisubunit mTOR complexes (42).Using this strategy, we were able to uncover the first insights intothe role of Tsc-mTOR signaling in osteoblasts in vivo (Fig. 7). Inparticular, we provide evidence that Tsc2 serves to modulateinsulin-generated signals to control osteoblast developmentand simultaneously regulates the production of the hormoneosteocalcin.
As described above, Tsc2 is a GAP protein that restrains theactivity of mTOR via the small GTPase Rheb (14, 15). Thus, on asuperficial level, the increased number of osteoblasts in �Tsc2mice might seem predictable owing to the release of the brake onthe proliferation and survival actions normally exerted by mTOR.Indeed, increased numbers of osteoblasts are also observed inbones from other mouse models designed to constitutively acti-vate PI3K/Akt signaling (43). Moreover, Tsc2 acts to suppress onearm of the intracellular signaling network that is activated by in-sulin. Humans and animal models with defective insulin signalingfrequently exhibit abnormalities in skeletal formation and repair(44–46), including a deficiency in the number of osteoblasts (8).Therefore, our data suggest that insulin uses Tsc-mTOR signalingto promote osteoblast proliferation and survival, and the dramaticincrease in bone volume in �Tsc2 mice could be viewed as a coun-
terpoint for the failure of mice lacking the insulin receptor inosteoblasts to achieve peak bone mass (8).
Although the number of osteoblasts and the bone formationrate were increased in the �Tsc2 mice, the function of individualosteoblasts was impaired. In the mutant mice, the mineral appo-sition rate was comparable to that of control mice and osteoidmeasures were increased, suggestive of an overall impairment inthe ability of mutant osteoblasts to properly mineralize bone.While we cannot rule out potential differences in phenotype dueto the onset of Cre-mediated gene deletion in vivo and our adeno-Cre based approach in vitro, our in vitro differentiation assays alsorevealed impaired expression of genetic markers of osteoblast dif-ferentiation and reduced mineralization. These findings togetherwith the reduction in osteoblast apoptosis observed in vitro mayhelp to explain the accumulation of immature osteoblastic cells inthe mutant mice.
Further, the presence of immature osteoblasts, particularlythose in the cortical bone compartment, may help to explain theskeletal manifestations of the tuberous sclerosis disorder in hu-mans. While patients are diagnosed based upon a clinical triad offacial adenoma sebaceum, mental deficiencies, and convulsions,skeletal abnormalities are a common finding (47). Though gener-ally benign, these include sclerotic bone changes that are commonin the calvarium, pelvis, and long bones; periosteal new bone for-mation; and cyst-like lesions (48, 49). Moreover, there are strikingsimilarities between lesions in tuberous sclerosis and fibrous dys-plasia, another disorder associated with the accumulation of im-mature osteoblastic cells (50, 51).
Our studies suggest that the mechanism responsible for thefailure of Tsc2-deficient osteoblasts to fully differentiate is due, at
FIG 4 Osteocalcin production is dramatically increased after Tsc2 ablation. (A) Total serum osteocalcin in 12-week-old control and �Tsc2 mice (n � 5 to 7mice). (B) Levels of uncarboxylated osteocalcin at 12 weeks of age (n � 5 to 7 mice). (C) Levels of undercarboxylated (Glu13) osteocalcin at 12 weeks of age (n �5 to 7 mice). (D) qPCR analysis of osteocalcin mRNA levels after 0 or 4 days of differentiation in control and �Tsc2 osteoblasts treated with insulin (INS) orvehicle (NT) for 6 h. (E) Western blot analysis of Atf4 expression in control and �Tsc2 osteoblasts after 4 days of differentiation. (F) Western blot analysis ofFoxO1 phosphorylation status in control and �Tsc2 osteoblasts after 4 days of differentiation. (G) Western blot analysis of FoxO1 abundance in nuclear (Nuc)and cytoplasmic (Cyto) extracts isolated from control and �Tsc2 osteoblasts after 4 days of differentiation. Ratios are derived from two independent experiments.(H) Quantitative chromatin immunoprecipitation analysis of FoxO1 binding to the osteocalcin gene in control and �Tsc2 osteoblasts after 4 days of differen-tiation (n � 3 or 4). N.D., not detected. *, P 0.05.
Tsc-mTOR Signaling in Bone
May 2014 Volume 34 Number 10 mcb.asm.org 1857
on July 30, 2015 by WE
LCH
ME
DIC
AL LIB
RA
RY
- John Hopkins U
http://mcb.asm
.org/D
ownloaded from

least in part, to the overactivation of mTOR and impaired insulinsignaling that occurs indirectly via the engagement of a negative-feedback loop previously described for other cell types (28–30). Inthis process, unrestrained mTOR signaling initiates a cascade ofevents involving an increase in protein synthesis and the develop-ment of an ER stress response with increases in PERK, eIF-2� andJnk phosphorylation. The increased activity of Jnk, in turn, im-pacts insulin signaling via inhibitory phosphorylation of Irs1 andtargeting of the protein for proteasomal degradation (33, 52). Asimilar phenomenon appears to occur in �Tsc2 osteoblasts andmay explain the accumulation of immature osteoblasts in �Tsc2mice, particularly since pharmacological inhibition of this path-way via SP600125 or rapamycin treatment was able to restoreinsulin sensitivity and rescue the differentiation defect of Tsc2-deficient osteoblasts. These data together with the reduction inbone mass evident in �mTOR mice imply that Tsc2 represents acritical regulator of anabolic signaling necessary for osteoblasts toattain a fully mature phenotype.
The similarity of the metabolic disturbances in the �Tsc2 mice
to those observed previously in mice lacking the insulin receptorin osteoblasts (8, 9) strongly suggested the involvement of a com-mon factor as a causative agent. The most obvious candidate wasosteocalcin, which has been identified as a bone-derived hormonethat functions to communicate metabolic information betweenthe osteoblast and other metabolically active tissues. Evidence forsuch a physiological role is supported by the fact that osteocalcin-null mice exhibit severe impairments in glucose metabolism (7),and infusion or daily injections of osteocalcin ameliorate the det-rimental effects of a high-fat diet on glucose metabolism (53, 54).Undercarboxylated osteocalcin, which binds poorly to bone hy-droxyapatite, escapes the local bone matrix or is released via oste-oclastic resorption and acts as a circulating hormone to increaseinsulin production by � cells and insulin sensitivity in other targettissues (7). More recent studies suggest that this hormone can alsoinfluence male fertility by acting on the Leydig cells of the testes(38), but testis size was not affected in our study and we did notobserve an effect of Tsc2 loss of function on fertility (data notshown).
FIG 5 Osteocalcin overproduction leads to desensitization. (A) Measurements of glucose in randomly fed control and �Tsc2 mice at 1 week of age (n � 8 to 14mice). (B) Serum insulin levels at 1 week of age (n � 8 to 14 mice). (C) qPCR analysis of Ins1 and Ins2 expression in pancreata of 1-week-old control and �Tsc2mice (n � 3 to 5 mice). (D) Total serum osteocalcin in 1-week-old control and �Tsc2 mice (n � 8 or 9 mice). (E) Levels of uncarboxylated osteocalcin at 1 weekof age (n � 8 or 9 mice). (F) Osteocalcin levels in media conditioned for 48 h with control or �Tsc2 osteoblasts after 14 days of differentiation. (G) Western blotanalysis of Gpcr6a abundance in Min6 cells cultured in media conditioned with control or �Tsc2 osteoblasts for 24 h. (H and I) qPCR analysis of Ins1 and Ins2mRNA levels in Min6 cells treated with osteocalcin (0 to 100 ng/ml) for 6 h after culture in media conditioned with control or �Tsc2 osteoblasts. (J) Western blotanalysis of Gpcr6a abundance in primary � cells extracted from 6-week-old control and �Tsc2 mice. (K) Densitometry analysis of Gpcr6a Western blot analysis(n � 2 or 3 mice). *, P 0.05.
Riddle et al.
1858 mcb.asm.org Molecular and Cellular Biology
on July 30, 2015 by WE
LCH
ME
DIC
AL LIB
RA
RY
- John Hopkins U
http://mcb.asm
.org/D
ownloaded from
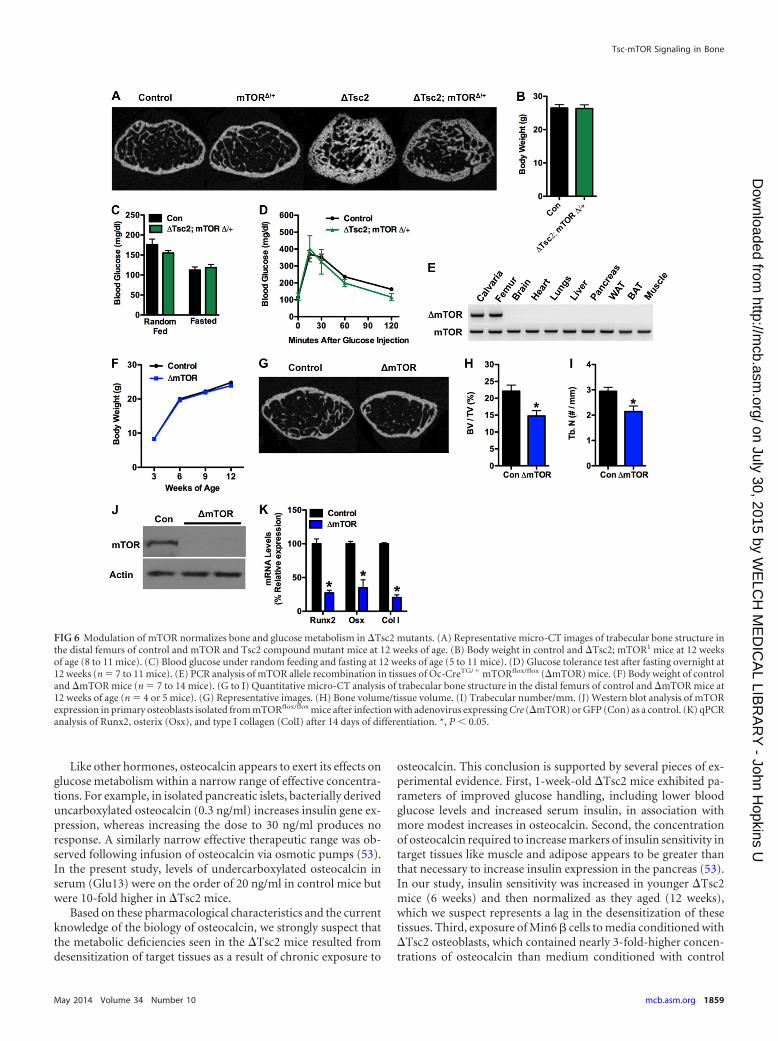
Like other hormones, osteocalcin appears to exert its effects onglucose metabolism within a narrow range of effective concentra-tions. For example, in isolated pancreatic islets, bacterially deriveduncarboxylated osteocalcin (0.3 ng/ml) increases insulin gene ex-pression, whereas increasing the dose to 30 ng/ml produces noresponse. A similarly narrow effective therapeutic range was ob-served following infusion of osteocalcin via osmotic pumps (53).In the present study, levels of undercarboxylated osteocalcin inserum (Glu13) were on the order of 20 ng/ml in control mice butwere 10-fold higher in �Tsc2 mice.
Based on these pharmacological characteristics and the currentknowledge of the biology of osteocalcin, we strongly suspect thatthe metabolic deficiencies seen in the �Tsc2 mice resulted fromdesensitization of target tissues as a result of chronic exposure to
osteocalcin. This conclusion is supported by several pieces of ex-perimental evidence. First, 1-week-old �Tsc2 mice exhibited pa-rameters of improved glucose handling, including lower bloodglucose levels and increased serum insulin, in association withmore modest increases in osteocalcin. Second, the concentrationof osteocalcin required to increase markers of insulin sensitivity intarget tissues like muscle and adipose appears to be greater thanthat necessary to increase insulin expression in the pancreas (53).In our study, insulin sensitivity was increased in younger �Tsc2mice (6 weeks) and then normalized as they aged (12 weeks),which we suspect represents a lag in the desensitization of thesetissues. Third, exposure of Min6 � cells to media conditioned with�Tsc2 osteoblasts, which contained nearly 3-fold-higher concen-trations of osteocalcin than medium conditioned with control
FIG 6 Modulation of mTOR normalizes bone and glucose metabolism in �Tsc2 mutants. (A) Representative micro-CT images of trabecular bone structure inthe distal femurs of control and mTOR and Tsc2 compound mutant mice at 12 weeks of age. (B) Body weight in control and �Tsc2; mTOR1 mice at 12 weeksof age (8 to 11 mice). (C) Blood glucose under random feeding and fasting at 12 weeks of age (5 to 11 mice). (D) Glucose tolerance test after fasting overnight at12 weeks (n � 7 to 11 mice). (E) PCR analysis of mTOR allele recombination in tissues of Oc-CreTG/� mTORflox/flox (�mTOR) mice. (F) Body weight of controland �mTOR mice (n � 7 to 14 mice). (G to I) Quantitative micro-CT analysis of trabecular bone structure in the distal femurs of control and �mTOR mice at12 weeks of age (n � 4 or 5 mice). (G) Representative images. (H) Bone volume/tissue volume. (I) Trabecular number/mm. (J) Western blot analysis of mTORexpression in primary osteoblasts isolated from mTORflox/flox mice after infection with adenovirus expressing Cre (�mTOR) or GFP (Con) as a control. (K) qPCRanalysis of Runx2, osterix (Osx), and type I collagen (ColI) after 14 days of differentiation. *, P 0.05.
Tsc-mTOR Signaling in Bone
May 2014 Volume 34 Number 10 mcb.asm.org 1859
on July 30, 2015 by WE
LCH
ME
DIC
AL LIB
RA
RY
- John Hopkins U
http://mcb.asm
.org/D
ownloaded from

osteoblasts, led to a downregulation of Gpcr6a, a putative osteo-calcin receptor (37, 38), and rendered them resistant to furtherstimulation with osteocalcin. Finally, the abundance of Gpcr6awas reduced in � cells isolated from �Tsc2 mice relative to controllittermates.
At the transcriptional level, a reduction in the activity of FoxO1, arepressor of osteocalcin promoter activity (10, 11), likely explains theincrease in osteocalcin expression, since the nuclear localization andosteocalcin promoter binding of FoxO1 were reduced in �Tsc2 os-teoblasts. This finding was somewhat unexpected considering thatFoxO has been reported to remain in the nuclei in some tissues lack-ing Tsc2 (29, 55), and the Tsc2-deficient osteoblasts were unrespon-sive to insulin and had reduced Akt activity. It is possible that themTOR target SGK, which is known to have activity similar to Akt,including the ability to phosphorylate FoxO (56, 57), is responsiblefor this effect. However, the precise mechanistic link between in-creased mTOR activity and FoxO1 phosphorylation remains unclearand is under investigation.
How Tsc-mTOR signaling influences osteocalcin�-carboxylationis also unknown at present. It has been proposed that osteocalcin isdecarboxylated and liberated from the bone matrix during osteoclas-tic bone resorption (9), but osteoclastic activity was reduced in �Tsc2mice. An alternative possibility is that ER stress associated with Tsc2deficiency interferes with the activity of the vitamin K-dependent�-carboxylase necessary for osteocalcin carboxylation. Additionally,the increased expression of osteocalcin may simply lead to a greaterproduction of undercarboxylated osteocalcin by the osteoblast. In-deed, our previous work demonstrated that significant levels of
ucOCN could be measured in cultures of calvarial osteoblasts (8).Nonetheless, the dramatic increases in osteocalcin production evi-dent in this model may be beneficial in further dissecting the factorsthat regulate osteocalcin bioavailability.
In summary, these studies identify Tsc2 as a critical insulin-responsive target protein, which moderates signals controlling os-teoblast differentiation and glucose metabolism. Additionally, ourresults suggest mechanisms whereby the biological actions of os-teocalcin in pancreatic � cells are tempered by classical downregu-lation of its G protein-coupled receptor. Finally, these findingsrepresent further support for the emerging model, which linksosteoblast functions to energy homeostasis.
ACKNOWLEDGMENTS
We thank M. Gambello and C. Lynch for providing the Tsc2flox/flox andmTORflox/flox mice, respectively.
Support was provided by a Merit Review Grant (T.L.C.) and CareerDevelopment Award (R.C.R.) from the Veterans Administration and bygrants from the NIH (M.A.H., DK081472; R.C.R., DK099134) and theBaltimore Diabetes Research and Training Center (M.A.H., DK079637).T.L.C. is also the recipient of a Research Career Scientist Award from theVeterans Administration.
REFERENCES1. Karsenty G. 2006. Convergence between bone and energy homeostases:
leptin regulation of bone mass. Cell Metab. 4:341–348. http://dx.doi.org/10.1016/j.cmet.2006.10.008.
2. Fukumoto S, Martin TJ. 2009. Bone as an endocrine organ. TrendsEndocrinol. Metab. 20:230 –236. http://dx.doi.org/10.1016/j.tem.2009.02.001.
3. Karsenty G, Oury F. 2012. Biology without walls: the novel endocrinol-ogy of bone. Annu. Rev. Physiol. 74:87–105. http://dx.doi.org/10.1146/annurev-physiol-020911-153233.
4. Spiegelman BM, Flier JS. 2001. Obesity and the regulation of energy balance.Cell 104:531–543. http://dx.doi.org/10.1016/S0092-8674(01)00240-9.
5. Ducy P, Amling M, Takeda S, Priemel M, Schilling AF, Beil FT, ShenJ, Vinson C, Rueger JM, Karsenty G. 2000. Leptin inhibits bone forma-tion through a hypothalamic relay: a central control of bone mass. Cell100:197–207. http://dx.doi.org/10.1016/S0092-8674(00)81558-5.
6. Takeda S, Elefteriou F, Levasseur R, Liu X, Zhao L, Parker KL, Arm-strong D, Ducy P, Karsenty G. 2002. Leptin regulates bone formation viathe sympathetic nervous system. Cell 111:305–317. http://dx.doi.org/10.1016/S0092-8674(02)01049-8.
7. Lee NK, Sowa H, Hinoi E, Ferron M, Ahn JD, Confavreux C, DacquinR, Mee PJ, McKee MD, Jung DY, Zhang Z, Kim JK, Mauvais-Jarvis F,Ducy P, Karsenty G. 2007. Endocrine regulation of energy metabolism bythe skeleton. Cell 130:456 – 469. http://dx.doi.org/10.1016/j.cell.2007.05.047.
8. Fulzele K, Riddle RC, DiGirolamo DJ, Cao X, Wan C, Chen D, FaugereMC, Aja S, Hussain MA, Bruning JC, Clemens TL. 2010. Insulin recep-tor signaling in osteoblasts regulates postnatal bone acquisition and bodycomposition. Cell 142:309 –319. http://dx.doi.org/10.1016/j.cell.2010.06.002.
9. Ferron M, Wei J, Yoshizawa T, Del Fattore A, DePinho RA, Teti A,Ducy P, Karsenty G. 2010. Insulin signaling in osteoblasts integrates boneremodeling and energy metabolism. Cell 142:296 –308. http://dx.doi.org/10.1016/j.cell.2010.06.003.
10. Rached MT, Kode A, Silva BC, Jung DY, Gray S, Ong H, Paik JH,DePinho RA, Kim JK, Karsenty G, Kousteni S. 2010. FoxO1 expressionin osteoblasts regulates glucose homeostasis through regulation of osteo-calcin in mice. J. Clin. Invest. 120:357–368. http://dx.doi.org/10.1172/JCI39901.
11. Kode A, Mosialou I, Silva BC, Joshi S, Ferron M, Rached MT, KousteniS. 2012. FoxO1 protein cooperates with ATF4 protein in osteoblasts tocontrol glucose homeostasis. J. Biol. Chem. 287:8757– 8768. http://dx.doi.org/10.1074/jbc.M111.282897.
12. Whiteman EL, Cho H, Birnbaum MJ. 2002. Role of Akt/protein kinase Bin metabolism. Trends Endocrinol. Metab. 13:444 – 451. http://dx.doi.org/10.1016/S1043-2760(02)00662-8.
FIG 7 Proposed model for skeletal and metabolic phenotypes of �Tsc2 mice.Genetic ablation of Tsc2 in osteoblasts results in unchecked mTOR signaling,which increases osteoblast survival and protein synthesis. Increased protein syn-thesis results in an ER stress response that downregulates Irs1 protein levels, re-duces osteoblast sensitivity to insulin, and impairs osteoblast differentiation. At thesame time, mTOR signaling inactivates the transcription factor FoxO1, whichnormally inhibits osteocalcin production. Dramatic increases in osteocalcin resultin the pancreatic � cell becoming desensitized to the hormone.
Riddle et al.
1860 mcb.asm.org Molecular and Cellular Biology
on July 30, 2015 by WE
LCH
ME
DIC
AL LIB
RA
RY
- John Hopkins U
http://mcb.asm
.org/D
ownloaded from

13. Wullschleger S, Loewith R, Hall MN. 2006. TOR signaling in growth andmetabolism. Cell 124:471– 484. http://dx.doi.org/10.1016/j.cell.2006.01.016.
14. Garami A, Zwartkruis FJ, Nobukuni T, Joaquin M, Roccio M, Stocker H,Kozma SC, Hafen E, Bos JL, Thomas G. 2003. Insulin activation of Rheb, amediator of mTOR/S6K/4E-BP signaling, is inhibited by TSC1 and 2. Mol.Cell 11:1457–1466. http://dx.doi.org/10.1016/S1097-2765(03)00220-X.
15. Tee AR, Manning BD, Roux PP, Cantley LC, Blenis J. 2003. Tuberoussclerosis complex gene products, Tuberin and Hamartin, control mTOR sig-naling by acting as a GTPase-activating protein complex toward Rheb. Curr.Biol. 13:1259–1268. http://dx.doi.org/10.1016/S0960-9822(03)00506-2.
16. Manning BD, Tee AR, Logsdon MN, Blenis J, Cantley LC. 2002. Identifi-cation of the tuberous sclerosis complex-2 tumor suppressor gene producttuberin as a target of the phosphoinositide 3-kinase/akt pathway. Mol. Cell10:151–162. http://dx.doi.org/10.1016/S1097-2765(02)00568-3.
17. Inoki K, Li Y, Zhu T, Wu J, Guan KL. 2002. TSC2 is phosphorylated andinhibited by Akt and suppresses mTOR signalling. Nat. Cell Biol. 4:648 –657. http://dx.doi.org/10.1038/ncb839.
18. Hernandez O, Way S, McKenna J, III, Gambello MJ. 2007. Generationof a conditional disruption of the Tsc2 gene. Genesis 45:101–106. http://dx.doi.org/10.1002/dvg.20271.
19. Lang CH, Frost RA, Bronson SK, Lynch CJ, Vary TC. 2010. Skeletalmuscle protein balance in mTOR heterozygous mice in response to in-flammation and leucine. Am. J. Physiol. Endocrinol. Metab. 298:E1283–E1294. http://dx.doi.org/10.1152/ajpendo.00676.2009.
20. Zhang M, Xuan S, Bouxsein ML, von Stechow D, Akeno N, FaugereMC, Malluche H, Zhao G, Rosen CJ, Efstratiadis A, Clemens TL. 2002.Osteoblast-specific knockout of the insulin-like growth factor (IGF) re-ceptor gene reveals an essential role of IGF signaling in bone matrix min-eralization. J. Biol. Chem. 277:44005– 44012. http://dx.doi.org/10.1074/jbc.M208265200.
21. Parfitt AM, Drezner MK, Glorieux FH, Kanis JA, Malluche H, MeunierPJ, Ott SM, Recker RR. 1987. Bone histomorphometry: standardizationof nomenclature, symbols, and units. Report of the ASBMR Histomor-phometry Nomenclature Committee. J. Bone Miner. Res. 2:595– 610.
22. Bouxsein ML, Boyd SK, Christiansen BA, Guldberg RE, Jepsen KJ,Muller R. 2010. Guidelines for assessment of bone microstructure inrodents using micro-computed tomography. J. Bone Miner. Res. 25:1468 –1486. http://dx.doi.org/10.1002/jbmr.141.
23. Dempster DW, Compston JE, Drezner MK, Glorieux FH, Kanis JA,Malluche H, Meunier PJ, Ott SM, Recker RR, Parfitt AM. 2013. Stan-dardized nomenclature, symbols, and units for bone histomorphometry: a2012 update of the report of the ASBMR Histomorphometry Nomencla-ture Committee. J. Bone Miner. Res. 28:2–17. http://dx.doi.org/10.1002/jbmr.1805.
24. Hussain MA, Porras DL, Rowe MH, West JR, Song WJ, Schreiber WE,Wondisford FE. 2006. Increased pancreatic beta-cell proliferation medi-ated by CREB binding protein gene activation. Mol. Cell. Biol. 26:7747–7759. http://dx.doi.org/10.1128/MCB.02353-05.
25. Fulzele K, DiGirolamo DJ, Liu Z, Xu J, Messina JL, Clemens TL. 2007.Disruption of the insulin-like growth factor type 1 receptor in osteoblastsenhances insulin signaling and action. J. Biol. Chem. 282:25649 –25658.http://dx.doi.org/10.1074/jbc.M700651200.
26. Ferron M, Wei J, Yoshizawa T, Ducy P, Karsenty G. 2010. An ELISA-based method to quantify osteocalcin carboxylation in mice. Biochem.Biophys. Res. Commun. 397:691– 696. http://dx.doi.org/10.1016/j.bbrc.2010.06.008.
27. Bialek P, Kern B, Yang X, Schrock M, Sosic D, Hong N, Wu H, Yu K,Ornitz DM, Olson EN, Justice MJ, Karsenty G. 2004. A twist codedetermines the onset of osteoblast differentiation. Dev. Cell 6:423– 435.http://dx.doi.org/10.1016/S1534-5807(04)00058-9.
28. Harrington LS, Findlay GM, Gray A, Tolkacheva T, Wigfield S, RebholzH, Barnett J, Leslie NR, Cheng S, Shepherd PR, Gout I, Downes CP,Lamb RF. 2004. The TSC1-2 tumor suppressor controls insulin-PI3Ksignaling via regulation of IRS proteins. J. Cell Biol. 166:213–223. http://dx.doi.org/10.1083/jcb.200403069.
29. Shah OJ, Wang Z, Hunter T. 2004. Inappropriate activation of theTSC/Rheb/mTOR/S6K cassette induces IRS1/2 depletion, insulin resis-tance, and cell survival deficiencies. Curr. Biol. 14:1650 –1656. http://dx.doi.org/10.1016/j.cub.2004.08.026.
30. Ozcan U, Ozcan L, Yilmaz E, Duvel K, Sahin M, Manning BD, Hota-misligil GS. 2008. Loss of the tuberous sclerosis complex tumor suppres-sors triggers the unfolded protein response to regulate insulin signaling
and apoptosis. Mol. Cell 29:541–551. http://dx.doi.org/10.1016/j.molcel.2007.12.023.
31. Bain J, McLauchlan H, Elliott M, Cohen P. 2003. The specificities ofprotein kinase inhibitors: an update. Biochem. J. 371:199 –204. http://dx.doi.org/10.1042/BJ20021535.
32. Ozcan U, Cao Q, Yilmaz E, Lee AH, Iwakoshi NN, Ozdelen E, TuncmanG, Gorgun C, Glimcher LH, Hotamisligil GS. 2004. Endoplasmic retic-ulum stress links obesity, insulin action, and type 2 diabetes. Science 306:457– 461. http://dx.doi.org/10.1126/science.1103160.
33. Aguirre V, Uchida T, Yenush L, Davis R, White MF. 2000. The c-JunNH(2)-terminal kinase promotes insulin resistance during associationwith insulin receptor substrate-1 and phosphorylation of Ser(307). J. Biol.Chem. 275:9047–9054. http://dx.doi.org/10.1074/jbc.275.12.9047.
34. Granner D, Andreone T, Sasaki K, Beale E. 1983. Inhibition of tran-scription of the phosphoenolpyruvate carboxykinase gene by insulin. Na-ture 305:549 –551. http://dx.doi.org/10.1038/305549a0.
35. Iynedjian PB, Pilot PR, Nouspikel T, Milburn JL, Quaade C, Hughes S,Ucla C, Newgard CB. 1989. Differential expression and regulation of theglucokinase gene in liver and islets of Langerhans. Proc. Natl. Acad. Sci.U. S. A. 86:7838 –7842. http://dx.doi.org/10.1073/pnas.86.20.7838.
36. Huang B, Wu P, Bowker-Kinley MM, Harris RA. 2002. Regulation ofpyruvate dehydrogenase kinase expression by peroxisome proliferator-activated receptor-alpha ligands, glucocorticoids, and insulin. Diabetes51:276 –283. http://dx.doi.org/10.2337/diabetes.51.2.276.
37. Pi M, Wu Y, Quarles LD. 2011. GPRC6A mediates responses to osteo-calcin in beta-cells in vitro and pancreas in vivo. J. Bone Miner. Res.26:1680 –1683. http://dx.doi.org/10.1002/jbmr.390.
38. Oury F, Sumara G, Sumara O, Ferron M, Chang H, Smith CE, HermoL, Suarez S, Roth BL, Ducy P, Karsenty G. 2011. Endocrine regulationof male fertility by the skeleton. Cell 144:796 – 809. http://dx.doi.org/10.1016/j.cell.2011.02.004.
39. Inoki K, Ouyang H, Zhu T, Lindvall C, Wang Y, Zhang X, Yang Q, BennettC, Harada Y, Stankunas K, Wang CY, He X, MacDougald OA, You M,Williams BO, Guan KL. 2006. TSC2 integrates Wnt and energy signals via acoordinated phosphorylation by AMPK and GSK3 to regulate cell growth.Cell 126:955–968. http://dx.doi.org/10.1016/j.cell.2006.06.055.
40. Inoki K, Zhu T, Guan KL. 2003. TSC2 mediates cellular energy responseto control cell growth and survival. Cell 115:577–590. http://dx.doi.org/10.1016/S0092-8674(03)00929-2.
41. Kumar A, Harris TE, Keller SR, Choi KM, Magnuson MA, Lawrence JC,Jr. 2008. Muscle-specific deletion of rictor impairs insulin-stimulated glu-cose transport and enhances basal glycogen synthase activity. Mol. Cell.Biol. 28:61–70. http://dx.doi.org/10.1128/MCB.01405-07.
42. Huang J, Manning BD. 2008. The TSC1-TSC2 complex: a molecularswitchboard controlling cell growth. Biochem. J. 412:179 –190. http://dx.doi.org/10.1042/BJ20080281.
43. Liu X, Bruxvoort KJ, Zylstra CR, Liu J, Cichowski R, Faugere MC,Bouxsein ML, Wan C, Williams BO, Clemens TL. 2007. Lifelong accu-mulation of bone in mice lacking Pten in osteoblasts. Proc. Natl. Acad. Sci.U. S. A. 104:2259 –2264. http://dx.doi.org/10.1073/pnas.0604153104.
44. Cornish J, Callon KE, Reid IR. 1996. Insulin increases histomorphomet-ric indices of bone formation in vivo. Calcif. Tissue Int. 59:492– 495. http://dx.doi.org/10.1007/BF00369216.
45. Kemink SA, Hermus AR, Swinkels LM, Lutterman JA, Smals AG. 2000.Osteopenia in insulin-dependent diabetes mellitus; prevalence and as-pects of pathophysiology. J. Endocrinol. Invest. 23:295–303.
46. Thrailkill KM. 2000. Insulin-like growth factor-I in diabetes mellitus: itsphysiology, metabolic effects, and potential clinical utility. Diabetes Tech-nol. Ther. 2:69 – 80. http://dx.doi.org/10.1089/152091599316775.
47. Osborne JP. 1988. Diagnosis of tuberous sclerosis. Arch. Dis. Child. 63:1423–1425. http://dx.doi.org/10.1136/adc.63.12.1423.
48. Bernauer TA, Mirowski GW, Caldemeyer KS. 2001. Tuberous sclerosis.Part II. Musculoskeletal and visceral findings. J. Am. Acad. Dermatol.45:450 – 452. http://dx.doi.org/10.1067/mjd.2001.111626.
49. Smith TK, Gregersen GG, Samilson RL. 1969. Orthopaedic problemsassociated with tuberous sclerosis. J. Bone Joint Surg. Am. 51:97–102.
50. Gasparetto EL, de Carvalho Neto A, Bruck I, Antoniuk S. 2003. Tuber-ous sclerosis and fibrous dysplasia. Am. J. Neuroradiol. 24:835– 837.
51. Breningstall GN, Faerber EN, Kolanu R. 1988. Fibrous dysplasia in apatient with tuberous sclerosis. J. Child Neurol. 3:131–134. http://dx.doi.org/10.1177/088307388800300211.
52. Hirosumi J, Tuncman G, Chang L, Gorgun CZ, Uysal KT, Maeda K,Karin M, Hotamisligil GS. 2002. A central role for JNK in obesity and
Tsc-mTOR Signaling in Bone
May 2014 Volume 34 Number 10 mcb.asm.org 1861
on July 30, 2015 by WE
LCH
ME
DIC
AL LIB
RA
RY
- John Hopkins U
http://mcb.asm
.org/D
ownloaded from

insulin resistance. Nature 420:333–336. http://dx.doi.org/10.1038/nature01137.
53. Ferron M, Hinoi E, Karsenty G, Ducy P. 2008. Osteocalcin differentiallyregulates beta cell and adipocyte gene expression and affects the develop-ment of metabolic diseases in wild-type mice. Proc. Natl. Acad. Sci. U. S. A.105:5266 –5270. http://dx.doi.org/10.1073/pnas.0711119105.
54. Ferron M, McKee MD, Levine RL, Ducy P, Karsenty G. 2012. Intermit-tent injections of osteocalcin improve glucose metabolism and preventtype 2 diabetes in mice. Bone 50:568 –575. http://dx.doi.org/10.1016/j.bone.2011.04.017.
55. Zhang HH, Lipovsky AI, Dibble CC, Sahin M, Manning BD. 2006. S6K1
regulates GSK3 under conditions of mTOR-dependent feedback inhibi-tion of Akt. Mol. Cell 24:185–197. http://dx.doi.org/10.1016/j.molcel.2006.09.019.
56. Hong F, Larrea MD, Doughty C, Kwiatkowski DJ, Squillace R, Sling-erland JM. 2008. mTOR-raptor binds and activates SGK1 to regulate p27phosphorylation. Mol. Cell 30:701–711. http://dx.doi.org/10.1016/j.molcel.2008.04.027.
57. Brunet A, Park J, Tran H, Hu LS, Hemmings BA, Greenberg ME. 2001.Protein kinase SGK mediates survival signals by phosphorylating the fork-head transcription factor FKHRL1 (FOXO3a). Mol. Cell. Biol. 21:952–965. http://dx.doi.org/10.1128/MCB.21.3.952-965.2001.
Riddle et al.
1862 mcb.asm.org Molecular and Cellular Biology
on July 30, 2015 by WE
LCH
ME
DIC
AL LIB
RA
RY
- John Hopkins U
http://mcb.asm
.org/D
ownloaded from
Copyright © 2022 FDOKUMEN