TRIKONOMIKA - Universitas Pasundan Bandung
60
TRIKONOMIKA Economic Journal Volume 15, No. 1, June 2016 EDITOR IN CHIEF Ellen Rusliati MANAGING EDITOR Mulyaningrum EDITORIAL BOARDS Atang Hermawan, University of Pasundan Juanim, University of Pasundan Horas Djulius, University of Pasundan Ina Ratnamiasih, University of Pasundan Atty Tri Juniarti, University of Pasundan LAYOUTER Diki Achmad Cahya Novriyanti WEBSITE/IT Irvan Fansuri Rafi Alfian PUBLISHER Books and Journals Publishers Faculty of Economics, University of Pasundan in Cooperation with ISEI Bandung Trikonomika published first in 2000, an economic journal articles presenting research results and the latest conceptual ideas that include Economics, Accounting and Management. Trikonomika published twice a year that is June and December. Start from Volume 14, No. 2, December 2015 published in English. ISSN 2355-7737 (online) Editorial Address: Jl. Tamansari No. 6-8 Bandung - 40116. Tel. 022-4233646, Fax. 022-4208363 Website: jurnal.fe.unpas.ac.id, E-mail: [email protected] Printing: Books and Journals Publisher Faculty of Economics, University of Pasundan For subscription and purchase information can contact the editors.
-
Upload
khangminh22 -
Category
Documents
-
view
0 -
download
0
Transcript of TRIKONOMIKA - Universitas Pasundan Bandung

TRIKONOMIKAEconomic Journal
Volume 15, No. 1, June 2016
EDITOR IN CHIEFEllen Rusliati
MANAGING EDITORMulyaningrum
EDITORIAL BOARDSAtang Hermawan, University of Pasundan
Juanim, University of PasundanHoras Djulius, University of Pasundan
Ina Ratnamiasih, University of PasundanAtty Tri Juniarti, University of Pasundan
LAYOUTERDiki Achmad
Cahya Novriyanti
WEBSITE/ITIrvan FansuriRafi Alfian
PUBLISHERBooks and Journals Publishers
Faculty of Economics, University of Pasundanin Cooperation with ISEI Bandung
Trikonomika published first in 2000, an economic journal articles presenting research results and the latest conceptual ideas that include Economics, Accounting and Management. Trikonomika published twice a year that is June and December. Start from Volume 14, No. 2, December
2015 published in English.
ISSN 2355-7737 (online)
Editorial Address: Jl. Tamansari No. 6-8 Bandung - 40116. Tel. 022-4233646, Fax. 022-4208363 Website: jurnal.fe.unpas.ac.id, E-mail: [email protected]
Printing: Books and Journals Publisher Faculty of Economics, University of Pasundan For subscription and purchase information can contact the editors.

ii
ISSN 2355-7737 (online)
REVIEWERS ACKNOWLEDGEMENT
Thanks and appreciation to the experts who have been reviews Trikonomika Journal Volume 15, No. 1 June 2016. The following is a list of names participating partners:• Dian Indiyati, Jenderal Achmad Yani University, Faculty of Economics, Indonesia, Scopus ID:
57188970429• Jaja Suteja, Faculty of Economics, Universitas Pasundan, Bandung, Indonesia, Scopus ID:
57190028247• Azhar Affandi, Universitas Pasundan, Bandung, Indonesia, Scopus ID: 57189332798• Sidik Priadana, Pasundan University, Bandung, Indonesia, Scopus ID: 57189323821• Horas Djulius, Faculty of Economics, University of Pasundan, Scopus ID: 57193535048

iii
ISSN 2355-7737 (online)
Table of ContentTrikonomika, Volume 15, No. 1, June 2016
Agricultural Sector Investment on Gross Domestic Regional Product (GDRP) in West Java 2007-2012Ratni Heliati, Yovino Dwiputra
The Community Empowerment Program to Reduction Poverty in BanjarTete Saepudin, Acuviarta
Strategy of Agro Potential Management as an Effort in Achieveing Agroecotourism in Ciburial VillageDedeh Ekawati, Yusuf Arifin
Tax Holiday and Investment in IndonesiaRukmi Juwita, Riani Tanjung, Edwin Karim
Product Attributes and Price on Purchase Decision of Xiaomi SmartphoneAdithama Satyanegara, Cut Irna Setiawati
Service Quality, Interest Rate, and Deposit On Call On Profitability (Study in Bank Mandiri Branch Office in PT. X)Renny Sunarny, Ellen Rusliati
............................................................................................................ 1-7
...................................................................................................................... 8-13
................................................................................................................. 14-27
........................................................................................ 28-39
......................................................................................... 40-47
............................................................................................................. 48-57
1
TrikonomikaVolume 15, No. 1, June 2016, Page. 1-7ISSN 1411-514X (print) / ISSN 2355-7737 (online)
Agricultural Sector Investment on Gross Domestic Regional Product (GDRP)in West Java 2007-2012
Ratni HeliatiUniversitas [email protected]
Yovino DwiputraUniversitas Padjadjaran
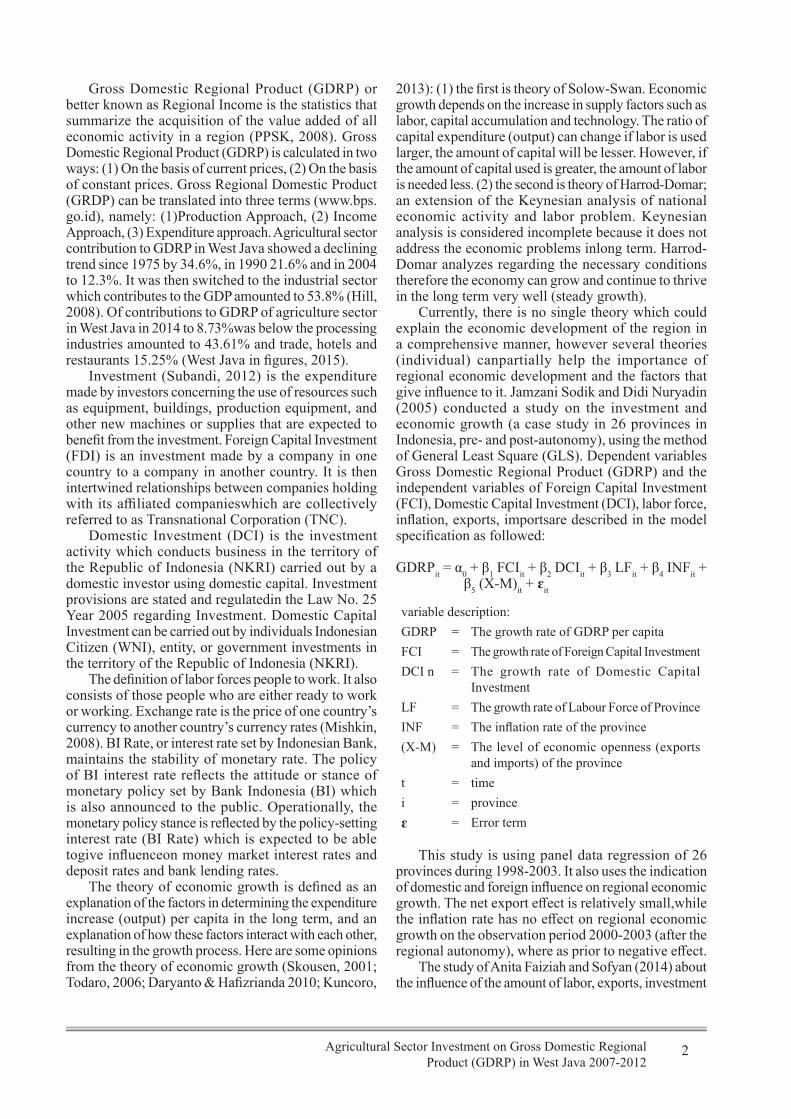
AbstractThis study aims to determined the impact of investments in the agricultural sector to the Gross Domestic Regional Products (GDRP) of agriculture in West Java. The sample was taken from 26 regions in West Java.The results showed that Foreign Capital Investment (FCI) and Exchange rate have positive and significant impact to GDRP. Domestic Capital Investment (DCI) has positive effect of labor but not significantly to GDRP. BI Rate has significant negative effect on GDRP.Fixed effect model allows the analysis of individual securities to be interpreted as the position of the relative potency of a districts / cities. There are nine districts/cities that have a significant positive intercept. These districts are categorized as areas which contribute highly to agricultural sector. The highest sector is in Indramayu district, the second is in Sukabumi, Banjar, Subang and so on. Cimahi has the lowest score of intercept. Negative intercept is an area of low agricultural contribution, generally those which are categorized as industrial areas, such as Bandung, Cirebon, Bogor, Bekasi, Karawang. These areas are classified as industrial area which have negative contribution of agricultural sector to the GDRP.
Keywords: GDRP, Foreign Capital Investment, Domestic Capital Investment, Exchange Rate, BI rate.
INTRODUCTION
Indonesia is one of the agricultural countries which have greater potential in the agricultural sector. In the Medium Term Development Plan of the Ministry of Agriculture phase-3 (2015 - 2019), the agricultural sector is still an important sector in national economic development. The strategic role of agriculture depicted in its contribution in providing food and industrial raw materials, contributor to Gross Domestic Products (GDP), Foreign exchange earnings, the main employer, the main source of income for rural households, providers of feed ingredients and bioenergy, play an important role in efforts to reduce greenhouse gas emissions. Realization of national investment per sector in 2007-2011 is described as contained in Table 1.
Agricultural investment sent by the major capital owners are considered less beneficial for domestic and foreign investors. This happens because agricultural sector has a high risk of uncertainty which includes water availability, climate variability and the nature of policy. These responds to mitigate greenhouse emission and adapt to change that will intensify the traditional risks by farmers in managing and fluctuations in commodity
markets (Mallawaarachchi , et.al.). The agricultural sector in West Java has contributed to increase foreign exchange earnings and is expected to encourage investors to invest in it. Contribution on national investment needed in 2007-2012 is describedas contained in Table 2.
Based on Central Statistics Agency (BPS) in 2006, the agricultural sector is a sector which absorbs highest labor for equally to 44.6%. Their contribution to Gross Domestic Products (GDP) is only 13.3%. The unbalance of GDP contribution and the amount of labor absorbed means that the level of labor productivity in the agricultural sector is the lowest. The industrial sector contributes 28.9% of national GDP with 12.1% labor absorption. As a result, the welfare of households working in agriculture is lower than those who are employed in industry (www.bappenas.go.id).
The agricultural sector is considered asa static sector and has a negative role in the economic growth for a country that plays an active role. Since 1980s, there was a significant change in thinking in public policy that sees the agricultural sector more positively. The sector is believed to play a role as a leader in the sector of economic development (Tambunan, 2010; Setiono 2010; Syafrizal, 2012; Refi, 2014).
Gross Domestic Regional Product (GDRP) or better known as Regional Income is the statistics that summarize the acquisition of the value added of all economic activity in a region (PPSK, 2008). Gross Domestic Regional Product (GDRP) is calculated in two ways: (1) On the basis of current prices, (2) On the basis of constant prices. Gross Regional Domestic Product (GRDP) can be translated into three terms (www.bps.go.id), namely: (1)Production Approach, (2) Income Approach, (3) Expenditure approach. Agricultural sector contribution to GDRP in West Java showed a declining trend since 1975 by 34.6%, in 1990 21.6% and in 2004 to 12.3%. It was then switched to the industrial sector which contributes to the GDP amounted to 53.8% (Hill, 2008). Of contributions to GDRP of agriculture sector in West Java in 2014 to 8.73%was below the processing industries amounted to 43.61% and trade, hotels and restaurants 15.25% (West Java in figures, 2015).
Investment (Subandi, 2012) is the expenditure made by investors concerning the use of resources such as equipment, buildings, production equipment, and other new machines or supplies that are expected to benefit from the investment. Foreign Capital Investment (FDI) is an investment made by a company in one country to a company in another country. It is then intertwined relationships between companies holding with its affiliated companieswhich are collectively referred to as Transnational Corporation (TNC).
Domestic Investment (DCI) is the investment activity which conducts business in the territory of the Republic of Indonesia (NKRI) carried out by a domestic investor using domestic capital. Investment provisions are stated and regulatedin the Law No. 25 Year 2005 regarding Investment. Domestic Capital Investment can be carried out by individuals Indonesian Citizen (WNI), entity, or government investments in the territory of the Republic of Indonesia (NKRI).
The definition of labor forces people to work. It also consists of those people who are either ready to work or working. Exchange rate is the price of one country’s currency to another country’s currency rates (Mishkin, 2008). BI Rate, or interest rate set by Indonesian Bank, maintains the stability of monetary rate. The policy of BI interest rate reflects the attitude or stance of monetary policy set by Bank Indonesia (BI) which is also announced to the public. Operationally, the monetary policy stance is reflected by the policy-setting interest rate (BI Rate) which is expected to be able togive influenceon money market interest rates and deposit rates and bank lending rates.
The theory of economic growth is defined as an explanation of the factors in determining the expenditure increase (output) per capita in the long term, and an explanation of how these factors interact with each other, resulting in the growth process. Here are some opinions from the theory of economic growth (Skousen, 2001; Todaro, 2006; Daryanto & Hafizrianda 2010; Kuncoro,
2013): (1) the first is theory of Solow-Swan. Economic growth depends on the increase in supply factors such as labor, capital accumulation and technology. The ratio of capital expenditure (output) can change if labor is used larger, the amount of capital will be lesser. However, if the amount of capital used is greater, the amount of labor is needed less. (2) the second is theory of Harrod-Domar; an extension of the Keynesian analysis of national economic activity and labor problem. Keynesian analysis is considered incomplete because it does not address the economic problems inlong term. Harrod-Domar analyzes regarding the necessary conditions therefore the economy can grow and continue to thrive in the long term very well (steady growth).
Currently, there is no single theory which could explain the economic development of the region in a comprehensive manner, however several theories (individual) canpartially help the importance of regional economic development and the factors that give influence to it. Jamzani Sodik and Didi Nuryadin (2005) conducted a study on the investment and economic growth (a case study in 26 provinces in Indonesia, pre- and post-autonomy), using the method of General Least Square (GLS). Dependent variables Gross Domestic Regional Product (GDRP) and the independent variables of Foreign Capital Investment (FCI), Domestic Capital Investment (DCI), labor force, inflation, exports, importsare described in the model specification as followed:
GDRPit = α0 + β1 FCIit + β2 DCIit + β3 LFit + β4 INFit + β5 (X-M)it + ɛit
variable description:GDRP = The growth rate of GDRP per capitaFCI = The growth rate of Foreign Capital InvestmentDCI n = The growth rate of Domestic Capital
InvestmentLF = The growth rate of Labour Force of ProvinceINF = The inflation rate of the province(X-M) = The level of economic openness (exports
and imports) of the provincet = timei = provinceɛ = Error term
This study is using panel data regression of 26 provinces during 1998-2003. It also uses the indication of domestic and foreign influence on regional economic growth. The net export effect is relatively small,while the inflation rate has no effect on regional economic growth on the observation period 2000-2003 (after the regional autonomy), where as prior to negative effect.
The study of Anita Faiziah and Sofyan (2014) about the influence of the amount of labor, exports, investment
2Agricultural Sector Investment on Gross Domestic Regional Product (GDRP) in West Java 2007-2012
and bank credit to the agricultural sector GDRP Aceh province is described with the model specification as follows:
GDRPp = α + β1Am + β2Xa + β3 Ai + β4 Ca + ɛ
The study of multiple linear regression of time series datain1999-2012 gave the result that labor had significant negative effect on exports and significant effect and investment. Meanwhile, bank credit gave positive and significant impact to GDRP.
This study describes the relationship of how GDRP influenced by investment, foreign and domestic, labor, exchange rate and interest rate in West Java (Figure 1). Hypothesisis describedas followed:1. Foreign Capital Investment (FCI), Domestic Capital
Investment (DCI), Labor, and rupiah exchange rate have positive influence on Gross Regional Domestic Regional Product (GDRP) in West Java.
2. BI Rate has negative effect on the Gross Domestic Regional Product (GDRP) in West Java.
METHOD
Method used in this study is descriptive and quantitative analysis. It aims to find out the investments allocated and the influence of the agricultural sector to GRDP investment in West Java in 2007-2012. Secondary data sources in 2007-2012 were taken based on the types of panel data. Data was obtained from Promotion Coordination Board (BKPM) West Java Province, the National Socio-economic Survey (Susenas), the Central Statistics Agency (BPS), the Asian Development Bank (ADB), and Bank Indonesia (BI), with linear regression multiple use Ordinary Least Square (OLS) software Stata version 12 (Apriliawan, 2013).
Based on studies conducted Jamzani Nuryadin Sodik & Didi (2005), and Anita Faiziah & Sofyan (2014), the authors apply the model to make modifications to the model. This study uses panel data from the years 2007-2012 with the research model as followed:
LnGDRPit = β0 + β1 LnFCIit + β2 LnDCIit + β3 LnLit + β4 LnERit + β5 BIRit + ɛit
Method test of panel data estimation is using Chow
Description of variables:GDRPp = Gross Domestic Regional Product agricultural
sector AcehAm = The number of agricultural manpower AcehXa = The export value of agricultural sectorAi = Agricultural investmentCa = Total bank credit agricultural sectorα = constantsβ1, 2, 3, 4 = regresion coefficientɛ = error
Description of variables:GDRP = Gross Domestic Regional Product agricultural
sectorFCI = Foreign Capital Investment agricultural sectorDCI = Domestic Capital Investment agricultural sectorMP = Manpower agricultureER = rupiah exchange rateBIR = BI Ratei = Regionsstudiedt = Years studiedβ0 = Intercept
β1, 2, 3, 4= Parameter Variable
ɛ = Error Term
Test, Lagrangian Multiplier (LM) Test, Hausman Test and classical assumption test using Multicollinearity, Heteroskidastity test, autocorrelation test. Statistics test includes t-statistical test, z-statistic test, the coefficient of determination (R2), and Sensitivity test (Enders, 2010).
RESULT
Chow Test (Table 3) aimed to see the results of F probability of Fixed Effect (FE). It is the probability value where Alpha is less than 0.05 or 5% on significant level and H0 is rejected.The results of F probability of Fixed Effect (FE) on Chow Test is at 0.0000, hence Chow test states that the best model is the model Fixed Effect (FE).
Lagrangian Multiplier (LM) (Table 4) Test is done by looking at the probability of Alpha chibar2 with a significance level of 5%, while H0 is rejected. The results showed that the probability chibar2 Lagrangian Multiplier (LM) Test is at 0.0005, while Hausman Test states that the best model is Fixed Effect(FE).
Hausman Test (Table 5) is performed by seeing the results of the probability of Alpha chi2 with a significance level of 5%, while H0 is rejected. The results showed that the probability of Hausman Test is at 0.0105, while the test itself showed the best model is the model of Fixed Effect (FE).
Multi-collinearity test (Coefficient of Correlation Between Independent Variables) is performed with a partial correlation matrix (people) among regressors (Correlation Coefficient Matrix). In Table 6, it can be seen the relationship between independent variables. Based on the rule of thumb (0.80), there is no multicollinearity in the model because all the independent variables were below 0.80.
In Table 7, it shows that in hetero-scedasticities, the test conducted by Wald by looking at the results of the probabilityis bigger than chi2 with Alpha significance level of 5%, while H0 is rejected. The results probability is also bigger than chi2 of the Wald test which the result was 0,000, hence the test of hetero-scedasticity states
3 TrikonomikaVol. 15, No. 1, June 2016
Ratni HeliatiYovino Dwiputra

4Agricultural Sector Investment on Gross Domestic Regional Product (GDRP) in West Java 2007-2012
thatit has problems heteroscedasticities.In Table 8, it shows that the auto-correlation
conducted by Wooldrige Test by looking at the results of Probis bigger than Alpha F with a significance level of 5%,while H0 is rejected. The results Probis bigger than F from Wooldridge test which the result is at 0.0000, hence the auto-correlation test states that it has a problem of autocorrelation.
BLUE assumption collision that occurred on Fixed Effect method is done in a way to treatment Fixed Effect using GLS (Generalized Least Square). According to Gujarati (2009), it is stated that GLS is an estimate of the BLUE for the model estimation method with GLS which has fulfilled the conditions ideal. As for the method of Random Effect, it does not do treatment because ofthe GLS method assumes that the individual errors are not correlated, as well as a combination therefore the estimation error will be more efficient and better generated model (Baltagi, 2005). The results of treatment using the GLS is described as contained in Table 9. It can be seen that the results of the regression using GLS prove that the factors which violates the assumption BLUE (Best Linear Unbiased Estimate) has been eliminated. By using GLS in this study, the absence of hetero-scedasticity or homo-scedasticity, and the absence of autocorrelation (no autocorrelation)are perfectly shown up.
T-statistic (Table 10) is used to determine whether there is influence of the independent variables individually (partial) fixed to variable. This test is performed by comparing the value of the t-stat with tables using a t-test one direction. The results of the t-statistic for the model showed (Table 11) that (1) there is positive and significant effect on Foreign Capital Investment in agricultural sector, (2) Domestic Capital Investment in agricultural sector does not significantly give effect on agricultural laborers. It also had no significant effect, (3) there is positive and significant impact on foreign exchange (4) BI Rate gives significant negative effect on GDRP of agriculture in West Java. Test of F-statistic (Table 11) is also used to determine whether there is influence of the independent variables as a whole (global) fixed to variable. This test is performed by comparing the value of Prob > chi2 the F-table. Based on the test results calculations, the F-statistics generated by Probis bigger than> chi2 (Table 12), while the obtained results isat 0.0000. Therefore, as a test of the overall variable Foreign Capital Investment (FCI), Domestic Capital Investment (DCI) in agriculture, agricultural laborers, exchange rate, and the BI Rate have simultaneously a significant effect on the variable Gross Domestic Regional Product (GDRP) of agriculture in West Java.
This test conducted to measure the variation of the value of the dependent variable can be explained by variations in the value of the independent variable. The coefficient of result determination (R2) of the selection
panel models has been determined. It is the coefficient of determination of the test Fixed Effect (FE) which was also within the amount of 0.9500. This shows that every additional independent variable, hence variation of the independent variables in the model is able to explain the variation in the dependent variable by 95%, while the remaining 5% is explained by other variables outside the model (Table 14).
Interpretation and analysis of the results of estimationare described as followed:(1) Foreign Capital Investment (FCI) has positive and
significant effect on GDRP amounted to 0,1229657(2) Domestic Capital Investment (DCI) has positive
and insignificant effect on GDRP amounted to 0.0434732.
(3) Labor have positive and insignificant effect on GDRP amounted to 0.152439.
(4) Exchange Rate has positive and significant influence on GDRP amounted to 4.413201.
(5) BI rate has negative and significant effect GDRP amounted to 1.550976.
The study by Sodik and Nuryadin (2005)stated that Foreign and Domestic Investment gives affects to the regional economic growth. Izuchukwu (2011) finding reveals that there is a positive relationship between Gross Domestic Product (GDP) and three independent variables (Domestic Saving, Government Expenditure on Agriculture and Foreign Direct investment in Agriculture).The study of Faiziah and Sofyan (2014)indicated that the investment give effect on GDRP. Results from Maqin (2011) showed that the electric infrastructure, manpower and development expenditure have positive and significant impact to GDRP. The study of Utomo, et. al. (2015) showed that investment in the agricultural sector will be able to enlarge and expand its production capacity in East Java, including raising the economy impact on the formation of income/ salaries for workers. The study of Novita et. al. (2009) showed that the impact of agricultural investment is happening to the formation of the output, income, and the creation of employment. Meanwhile, the study of Lenggogeni (2012) showed that the exchange rate significantly gave influences to the agricultural sector investment.
There is a difference between this study and the previous ones. The difference is that domestic capital investment and manpower has no significant effect on GDRP. This can happen because GDRP of West Java is dominated by the manufacturing / processing. The low-increasing contribution of agriculture to GDRP in West Java occur based on the phenomenon of high-ranked poverty in Indonesia related to the agricultural sector (Suryahadi and Gracia, 2011). Domestic investors and manpower are not interested in investing or working in the agricultural sector, due to the perception of poverty and risk.
Fixed effect model allows the analysis of the individual effect of each district/city to be interpreted as the position of the relative potency of a district/town area of the district/city. Interceptof each district/city means that if there is no influence of all independent variables, the GDRP in each district/city was respectively in accordance with the value of intercept (Table 15). There are nine districts/cities that have a positive intercept and remain negative.
Positive intercept indicates that districts/cities have higher GDRP than the other. Highest intercept value was in Indramayu (1.438182). It meant that the heterogeneity compared to other districts/cities can encourage higher GDRP. Positive intercepts indicate that the pointed areas highly contributed to farm. Lowest intercept value was in Cimahi (-3.931598). Negative intercept is an area of low agricultural contribution, generally those which are categorized as industrialer services areas, such as Bandung, Cirebon, Bogor, Bekasi, Karawang. Therefore, these are areas of industrial/service which give negative contribution in agricultural sector to GDRP.
CONCLUSION
The study uses panel data from 26 regencies/cities in West Java from 2007-2012. The conclusions are:1. Foreign Capital Investment (FCI) has a positive
and significant effect in improving the agricultural sector GDRP in West Java.
2. Domestic Capital Investment (DCI) is positive but not significant effect in improving the agricultural sector GDRP in West Java
3. Labor have not significant positive effect but improving the agricultural sector GDRP.
4. Exchange rate have positive and significant effect in improving the agricultural sector GDRP in West Java.
5. BI Rate have negative and significant effect on GDRP.
In improving the agricultural sector in West Java. Advice to authors based on the results of this research to:1. Central Government:
a. Foreign Capital Investment (FCI) is enhanced to boost regional economic growth by facilitating the investors to invest in the agricultural sector in particular.
b. Domestic Capital Investment (DCI) is suppposedto compensate foreign investment, especially in agriculture by always doing RnD (Research and Development) in order to create improved clones or processed products. Therefore, domestic/local investors will be interested in investing to the agricultural sector.
2. Bank Indonesia:a. Setting a BI policy in accordance with the safe
limit to investors interested in investing.b. Stabilization of the exchange rate for the purposes
of agricultural inputs.3. It is necessary to increased productivity and quality
of labor, in order to increase investment opportunities in the agricultural sector.
REFERENCES
Apriliawan, Dody, dkk. 2013. Permodelan Laju Inflasi Di Provinsi Jawa Tengah Menggunakan Regresi Data Panel. Jurnal Gaussian, Vol. 2, No. 4.
Baltagi, B. H., Bratberg, E., & Holmås, T. H. 2005. A panel data study of physicians’ labor supply: the case of Norway. Health Economics, 14(10), 1035-1045.
Daryanto, Arief. & Hafizrianda, Yundy. 2010. Model-Model Kuantitatif Untuk Perencanaan Pembangunan Ekonomi Daerah: Konsep Dan Aplikasinya. Bogor: IPB Press.
Enders, Walter. 2010. Applied Econometric Time Series.United State: John Wiley & Sons, Inc.
Faiziah, Anita, & Sofyan. 2014. Retrieved from Agrisep, Vol. 15, No.2: http://www.jurnal.unsyiah.ac.id/agrisep/article/view/2097.
Gujarati, D.N., 2003. Basic Econometrics. 4th. New York: McGraw-Hill.
Gujarati, Damodar, N., & Porter, Dawn, C. 2009. Basic Econometrics. New York: McGraw-Hill.
Izuchukwu, Oji-Okoro. 2011. Analysis of the Contribution of Agricultural Sector on the Nigerian Economic Development. World Reiew of Business Research. Vol. 1 No. 1 March. Pp 191 – 200.
Jawa Barat dalam Angka 2015. Pusdalisbang.jabarprov.go.id.
Kementerian PPN/Bappenas. 2013. Perkembangan Ekonomi Indonesia.Laporan Perkembangan Perekonomian Indonesia Edisi Triwulan I Tahun 2013.
Kuncoro, Mudrajad. 2013. Mudah Memahami Dan Menganalisis Indikator Ekonomi. Yogyakarta: UPP STIM YKPN.
Lenggogeni, Susi. 2012. Retrieved from Jurnal Ekonomi, Vol. 20, No. 4:http://download.portalgaruda.org/article.php?article=106662&val=2268.
Mallawaarachchi, Thilak; James Walcott; Neal Hughes; Peter Gooday; Lee Georgeson; Adam Foster. 2009. Promoting Productivity in the Agriculture and Food Sector Value Chain: Issues for R & D Investment. Australian Government Bureau of Roral Science. Abare.go.au. December.
Maqin, R. Abdul. 2011. Pengaruh Kondisi Infrastruktur terhadap Pertumbuhan Ekonomi di Jawa Barat. Trikonomika. Volume 10, No. 1 Juni 2011. Hal 10–18.
Mishkin, Frederic, S. 2008. The Economic of Money, Banking, and Financial Markets. New Jersey: Pearson Education, Inc.
Novita, Desi; Rahmanta; Kasyful Mahalli. 2009.
5 TrikonomikaVol. 15, No. 1, June 2016
Ratni HeliatiYovino Dwiputra

Dampak Investasi Sektor Pertanian terhadp Perekonomian Sumatera Utara. Pendekatan Analisis Input-Output. Wahana Hijau. Jurnal Perencanaan dan Pengembangan Wilayah, Vol. 4 No. 3, April.
PPSK BI-LP3E FE-UNPAD.2008. Profil Dan Pemetaan Daya Saing Ekonomi Daerah Kabupaten/Kota Di Indonesia. Jakarta: Raja Grafindo Persada.
Refi, Wahyuni. & Falahi, Ziyad. 2014. Desa Cosmopolitan Globalisasi dan Masa Depan Kekayaan Alam Indonesia. Jakarta: Change Publication.
Setiono, Dedi, N., S. 2010. Ekonomi Pengembangan Wilayah (Teori Dan Analisis). Jakarta: Fakultas Ekonomi Universitas Indonesia.
Sjafrizal.2012. Ekonomi Wilayah Dan Perkotaan. Jakarta: Rajawali Pres.
Skousen, Mark. 2001. Sang Maestro “Teori-Teori Ekonomi Modern”: Sejarah Pemikiran Ekonomi. Jakarta: Prenada Media Group.
Sodik, Jamzani. & Nuryadin, Didi. 2005. Retrieved
from Jurnal Ekonomi Pembangunan,Vol. 10, No. 2:http://journal.uii.ac.id/index.php/JEP/article/viewFile/599/525.
Subandi.2012. Ekonomi Pembangunan. Bandung: Alfabeta.
Suryahadi, Asep dan Hadiwijaya, Gracia. 2011. The Role of Agriculture in Poverty Reduction in Indonesia. SMERU Research Institute. Jakarta Indonesia.
Tambunan, Tulus.2010. Pembangunan Pertanian Dan Ketahanan Pangan. Jakarta: Universitas Indonesia (UI-Press).
Todaro, Michael, P. & Smith, Stephen, C. 2006. Economic Development. United Kingdom: Pearson Education, Ltd.
Utomo, Yohanna Kristanti, Badjuri, Teguh Hadi P. 2015. Dampak Investasi Sektor Pertanian terhadap Perekonomian Provinsi Jawa Timur. Pendekatan Analisis Input Output. Artikel Ilmiah Mahasiswa. Universitas Jember.
www.bappenas.go.idwww.bps.go.idwww.pertanian.go.id. Renstra Kementan Tahun 2015–2019
APPENDIX
Table 1. National Investment Realization Per sector (Billion Rupiah)
YearFCI DCI
Primary Secondary Tertiary Primary Secondary Tertiary2007 5,478.20 42,935.28 46,117.26 4,377.40 26,289.80 4,211.502008 3,254.97 43,792.74 97,188.43 1,757.70 15,914.80 2,690.802009 4,806.37 39,804.75 67,754.62 4,415.90 19,434.40 13,949.502010 27,394.92 27,956.71 89,482.56 12,327.40 25,485.30 22,813.602011 42,714.63 59,459.13 68,627.74 16,306.90 39,048.00 20,645.70
Source: Capital Investment Coordination Board (BKPM)
Table 2. National Agricultural Sector Investment Requirements (Billions of Rupiah)
YearEconomy
Growth (%)Agricultural Sector Investment Needs
FCI DCI Total2007 5,67 5,478.20 4,377.40 9,855.60
2008 5,74 3,254.97 1,757.70 5,012.67
2009 4,77 4,806.37 4,415.90 9,222.27
2010 6,14 27,394.92 12,327.40 39,722.32
2011 6,35 42,714.63 16,306.90 59,021.53
2012 6,28 55,691.81 20,369.10 76,060.91
Table 3. Chow Test Data ProcessingChow Test Result
Probability value F Prob>F = 0,0000Decision Fixed Effect
Source: Data Processing Results
Table 4. The Lagrangian Multiplier Data Processing (LM) TestLagrangian Multiplier
(LM) TestResult
Probability value Chibar2 Prob> chibar2 = 0,0005Decision Fixed Effect
Source: Data Processing Results
Tabel 5. The Hausman Test Data ProcessingHausmanTest Result
Probability valueChi2 Prob> chi2 = 0,0105Decision Fixed Effect
Source: Data Processing Results
Table 6. Testing Results Correlation Inter Independent VariablesLog(FCI) Log(DCI) Log(L) Log(Kurs) BI Rate
Log(FCI) 1,0000Log(DCI) 0,2135 1,0000
Log(L) 0,0896 0,0328 1,0000Log(ER) -0,0542 -0,0438 -0,0836 1,0000BI Rate -0,3713 0,0578 0,1113 0,2114 1,0000
Source: Data Processing Results
6Agricultural Sector Investment on Gross Domestic Regional Product (GDRP) in West Java 2007-2012

Table 7. Wald Test ResultWaldTest Result
Probability value Chi2 Prob> chi2 = 0,0000Decision Hetero-scedasticity
Source: Data Processing Results
Table 8. Wooldridge Test ResultWooldridgeTest Result
Probability valueF Prob> F = 0,0000Decision autocorrelation
Source: Data Processing Results
Table 9. Treatment Result with GLS (General Least Square)
VariableGeneral Least Square (GLS)
Coefficient P-ValueLog(FCI) 0,1229657 0,000Log(DCI) 0,0434732 0,210Log(L) 0,152439 0,502Log(ER) 5,43849 0,000BI Rate -1,425778 0,000Cons -20,28129 0,034Prob F 0,0000R-squared 0,9500
Source: Data Processing Results
Table 10. Critical Limit Value Test t-statisticDegrees of
Freedom (df)*α (one side)
α = 0,1 α = 0,05 α = 0,0120 2,528 1,725 1,325
*df = n-k (26-6 = 20)n = observes amount (26)k = Amount of parameter which used including constants (6)Source: Gujarati (2003)
Table 11. T-statistic Test ResultVariable t-statistic H0 NoteLog(FCI) 8,49 Reject Significant on α= 5%Log(DCI) 1,25 Accept NotSignificant on α= 5%
Log(L) 0,67 Accept Not Significant on α= 5%Log(ER) 5,25 Rejected Significant on α= 5%BI Rate -26,09 Accept Significant on α= 5%
Source: Data Processing Results
Table 12. F-statistic Critical Boundary Value
N2(k-1)
N1(n-k)
F-tableα = 0,1 α = 0,05 α = 0,01
5 20 3,21 4,56 9,55N1 = df numerator (k-1; 6-1 = 5)N2 = dfdenumerator (n-k; 26-6 = 20)Source: Gujarati (2003)
Table 13. F-statistic Test ResultProb> chi2 H0 Notes
0,0000 Rejected Significant on α= 5%Source: Data Processing Results
Table 14. Result coefficient Determinant (R2)Model Panel coefficient Determinant (R2)
Pooled Least Square (between) 0,3933Fixed Effect (within) 0,9500Random Effect (overall) 0,6528
Source: Data Processing Results
Tabel 15. Intercept value in each district/city in West Java ProvinceNo District or city Coefficient1 Bandung District 0,07513252 Bekasi District -0,7101963 Bogor District -0,14497524 Cianjur District 0,27421275 Cirebon District 0,51022756 Indramayu District 1,4381827 Karawang District -0,08657668 Purwakarta District -0,75826129 Subang Distric 0,600263610 Sukabumi District 1,08471111 Sumedang District 0,539925512 Bandung City -2,63223813 Banjar City 0,915989814 Bekasi City -1,6183215 Bogor City -3,62280616 Cimahi City -3,93159817 Cirebon City -2,76214618 Depok City -1,839146
Foreign CapitalInvestment
Domestic CapitalInvestment
Labor
Exchange rate
BI Rate
Gross DomesticRegional Products
Figure 1. Framework
7 TrikonomikaVol. 15, No. 1, June 2016
Ratni HeliatiYovino Dwiputra

8
TrikonomikaVolume 15, No. 1, June 2016, Page. 8-13ISSN 1411-514X (print) / ISSN 2355-7737 (online)
The Community Empowerment Programto Reduction Poverty in Banjar
Tete SaepudinFaculty of Economics, University of Pasundan
Faculty of Economics, University of Pasundan
AbstractThis study aims to generate key strategies of sector development community empowerment to reduction poverty in Banjar. The analysis uses SWOT presented in three parts: SAP (Strategic Advantages Profile), ETOP (Environmental Threats and Opportunity Profile), and SWOT Matrix. The analysis showed the government’s attention to the program that was launched (district development program and the urban poverty program) where is by provision of Counterpart Funds from APBD has been increasing steadily every year. The mechanism has been implemented according to some regulations. The urban empowerment program should further focus and involve on the interests and needs of urban communities. The obstacles faced on the research to determine the program are, the execution (based onmain interest), the lack of human resources who understand and the plan ownership in preparing programs of community development and the lack of human resources with reliability in manufacturing reporting on the program implementation.
Keywords: strategy, community empowerment, development SWOT analysis
INTRODUCTION
The desired economic development community leads to the reinforcement of some economic elements, whether it was based on commodities reinforcement (goods and services), sectoral reinforcement or territorial reinforcement. Synergy of economic development based on the strength of commodities in turn is expected to increase incomes. On the other hand, with the regional forms of economic base that has their own characteristics of community economic development, it should also receive specific attention. Characteristics of the economy of the region combined with a primer based rural economic activity and tertiary sector based urban economic activity is an important element which in turn is expected to synergize. A benchmark of economic progress which is based on the achievement of economic indicators, both the macro and micro, is the form of expected performance, so it has a multiplier effect on the progress of economic development of society, particularly with regard to poverty reduction, jobs absorption, and increase of local revenues.
Poverty reduction programs and community empowerment running has been initiated since the Orde Baru government. The programs were about: 1) Presidential Instruction of Under developed Villages
(IDT) Program which is intended to improve the quality of the poor communities welfare through the development of human resources, capital and productive business as well as the development of institutional; 2) District Development Program (PPK) implemented by the Ministry of Home Affairs; 3) Urban Poverty Reduction Program (P2PK) implemented by the Department of Public Works; 4) Project of Income Generation for Minor Farmers and Fishermen implemented by the Department of Agriculture; 5) Coastal Community Economic Empowerment implemented by the Ministry of Marine Affairs and Fisheries; and 6) Joint Business Group held by the Department of Social and others. The Program shave continuously run according to the correspondence of department policy, unintegrated, partial and sectoral.
METHOD
Various studies evaluating the implementation of programs of poverty reduction and empowerment of the community have already reported both the success and the failures of these programs. According to Muktasam (2011), cited from Chambers (2013), Harrison (2015), Burkey (2013), Esman and Uphoff (1984), Maqin (2011) based on the experience of these experts in the process
9 TrikonomikaVol. 15, No. 1, June 2016
Tete SaepudinAcuviarta
of rural development and poverty reduction programs in the countries of Asia and Africa, it is concluded that the factors causing the failure of poverty reduction programs are: (1) The instability of the ‘target’ and ‘top-down’ approach; (2) The abandonment of local values and ‘outsiders’ bias; (3) The lack of participation; (4) The incomplete approach; and (5) Investment illusion.
Despite growing evidence of the failure of poverty reduction programs in many developing countries, there is a little known fact about the success of the fight against poverty in developing countries such as Asia and Africa. Experiences around the success of the poverty reduction program show that the participation factor becomes important and dominant factor. Participation in terms of the involvement of the poor in the whole process of poverty reduction is necessarily needed to identify the problems and utilize the development process. Other factors that determine the success of poverty reduction programs are: (1) Awareness of local values; (2) An integrated and comprehensive approach; and (3) Development of human resources.
Thus, the meaning of community empowerment can be concluded that: a) community empowerment should not make people become dependent on donation programs (charity); b) however, the product must be produced on one’s own account; and c) the final results are the creation of an independent community and skill building to develop better life for them in a sustainable manner. Development in the field of community empowerment is seen as a continuous process of real improvement per capita income by increasing the number and productivity of resources (Solihin, D : 2007). Based on the opinion, the concept of empowerment is the concept of economic development which summarizes the social values. The concept of empowerment also represents a new paradigm in development, namely these are “people-centered, participatory, empowering, and sustainable” (Chambers, 2011). Efforts to strengthen the potential or the power possessed by the people are expected to construct the community empowerment which is able to create stable conditions in the environment in a sustainable society.
RESULT
In various empowerment programs conducted in Banjar seemed in a less favorable condition, for example misdirected, generates community dependency on outside help, creates the seeds of social fragmentation, and weakens social capital in the community (mutual cooperation, deliberation, self-reliance, and others). Weak social capital in turn also encourages a shift change on people’s behavior that is increasingly distant from the spirit of independence, solidarity and concern in solving the problem together. Independence of the community is needed in order to build public institutions which are truly capable of being a container of the
struggle of economic community which is independent and sustainable to express the aspirations and needs and is able to affect the decision-making process related to public policy at the local level to be more focused on poor community (pro-poor) and to obtain good governance, both in terms of social, economic and environmental, including housing and settlement. Under these conditions, it is necessary to analyze the development of community empowerment policy which has been implemented by the government. The analysis is an effort to generate further on public policies aboutpro-poor and marginalize segments of society. Therefore, it can affect other development policies such as infrastructure and physical facilities in the fields of transportation, communications, housing, which are more geared to underdeveloped districts and villages or physical development that is geared to enhance and accelerate the acquisition impact to the regional economic development. In the study, there are some models that could be a reference to strengthen the study results and be used as a model for community empowerment in Banjar. This is an opportunity and potential that can be developed seriously, as long as all parties have a strong commitment to be bonded on community empowerment programs in Banjar. The following are some models of community development in Banjar using the approach of potential and opportunities. The developmental process of industrialization in Banjar has a direct impact on the changes of physio-biography environmental conditions of the villages. The factors are: village internal factors, inter-village relations and relationships between villages to the industrial area. Indications of visible changes include: a) The waning of Homogeneity of village life; b) The shift of livelihood from agriculture to industry and services; c) The function change of agricultural land into industrial zones; d) he changing of lifestyle and social system.
The changes that occurred above have the impact on all aspects of community life environment, therefore people pursue a strategy of adaptation to the changes. Therefore, these conditions require the handling and management of urban/rural environmental resources comprehensively and sustainably. After identifying the social capital and other resources through social mapping, it was then performing SWOT analysis that is an important basis for pursuing a strategy of community development that is integrated with the development of a people centered development model. This approach shows the capacity of communities to improve independence and strength, through the ability to exercise control over the material and non-material resources that are important. David Korten (in Adimihardja, 2011) stated that there are three basic steps to make structural changes and normative in a people centered development, namely: a) Focusing on the mind and actions of government policy on creating conditions that encourage and support the
10The Community Empowerment Programto Reduction Poverty in the City of Banjar
efforts of the people to meet their own needs and to solve their own problems at the individual, family and community level; b) Developing structures and processes of organizations that function according to the principles of self-organization; c) Developing systems of production-consumption territorially organized based on the principles of ownership and local control.
Therefore, the community empowerment program becomes something that is important to be developed in accordance with the socio-cultural society, based on strategies and adaptation patterns developed by the local community. Social planning model is also valid as a whole, so there is a chain of synergistic activity of various parties. As noted by Isbandi Rukminto Adi (2010) that the model of community development is primarily aimed at developing self-reliance. The expected form of participation is able to define the community and try to meet their own needs through the creative process and cooperative methods and the formation of self-sufficiency groups.
SWOT Analysis (Strengths, Weaknesses, Opportunities, and Threats) is a useful tool in a form of decision-making. The management process using SWOT approach requires an internal survey of strengths and weaknesses of program, as well as an external survey of opportunities (chances/opportunities) and threats. Internal and external examinations are structured into something unique in the world of planning and development of a program. A description of the SWOT analysis is technically presented in three parts:(1) SAP (Strategic Advantages Profile), (2) ETOP (Environmental Threats and Opportunity Profile), (3) SWOT Matrix.
SAP or Strategic Advantage Profile contains result formulationsof the analysis of internal factors such as the strength and weakness. Analysis of the internal factors include activities of:1. Evaluation on the performance of an organization/
business/industry to each measure of success.2. Analysis on the factors that support and hinder the
achievement of performance for each measure of success.
3. Identification on the factors which strengthen and weaken the organization/business/industry.
ETOP or Environmental Threats and Opportunity Profilecontains formulation of analysis results of External Environment including the analysis on the condition of factors outside of the organization/business/industry which has implications in the form of opportunity and threats, either factors of microenvironment (industry), macroenvironment or international environment.
Analysis of external factors include the following activities:1. Recognition of the key power of external factors
affecting the performance of the Government of Banjar.
2. Collection of data and information relating to these factors.
3. Assessment of the effects of these conditions on the government of Banjar.
4. Identification on the factors that constitute opportunities and threats.
By compiling the analysis results of internal factors through Strategic Advantages Profile (SAP) approach and external factors through Environmental Threats and Opportunity Profile (ETOP) approach, SWOT is graphically described by a matrix mapping the position of Banjar’s governmemt in the environment. Compilation of the results of the analysis of both external and internal factors is mapped in the following General Strategy Matrix.
Table 1. General Strategy Matrix
SAPETOP
Strenghts Weaknesses
Opportunities
Alternative strategies that use strength factors to take advantage of the opportunities
Alternative strategies to take advantage of the opportunity to reduce the weakness
Threats
Alternative strategies that use the strength factors to avoid the threat
Alternative strategies to minimize weaknesses and avoid threats.
In this study, SWOT analysis illustrates the strengths, weaknesses, opportunities and threats in the Poor People’s Empowerment Program. SWOT analysis is technically focused on the analysis of internal factors that turn into strengths and weaknesses as well as an analysis of external factors that became opportunities and threats. Analysis of internal factors, both the strength and weakness, illustrate the potential and the problems faced. The potential and problems of implementing community empowerment programs are also described in the condition of infrastructure, human resources and institutions. Meanwhile, to describe external factors that describe the opportunities and threats,we will use the following variables: microenvironment that describe the condition of Banjar’s citizens and economic growth which can also be an opportunity or a threat to the implementation of community development programs to reduce poverty. Macro environment provides opportunities or threats from the implementation of community development programs while the environment turns into an opportunity or a threat on implementing community empowerment programs.
Based on the results of studies related to the potential and problems of society in Banjar, it formulates several strategies and policy development in the community
11 TrikonomikaVol. 15, No. 1, June 2016
Tete SaepudinAcuviarta
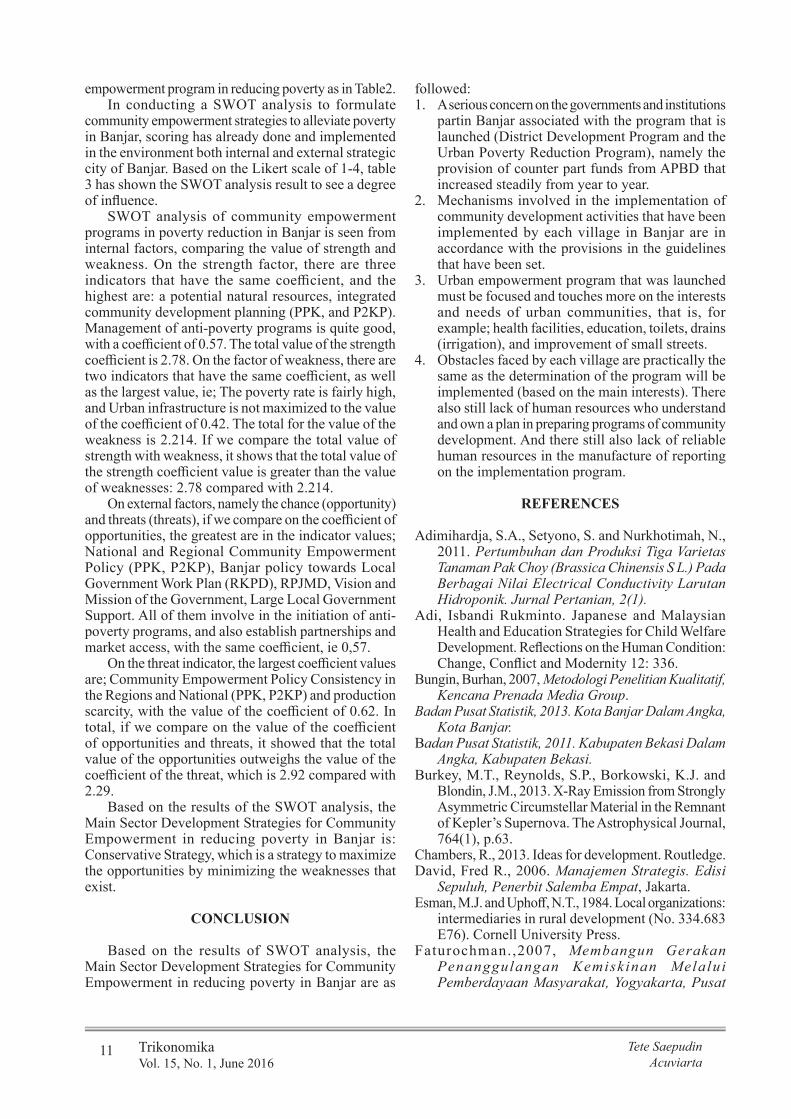
empowerment program in reducing poverty as in Table2.In conducting a SWOT analysis to formulate
community empowerment strategies to alleviate poverty in Banjar, scoring has already done and implemented in the environment both internal and external strategic city of Banjar. Based on the Likert scale of 1-4, table 3 has shown the SWOT analysis result to see a degree of influence.
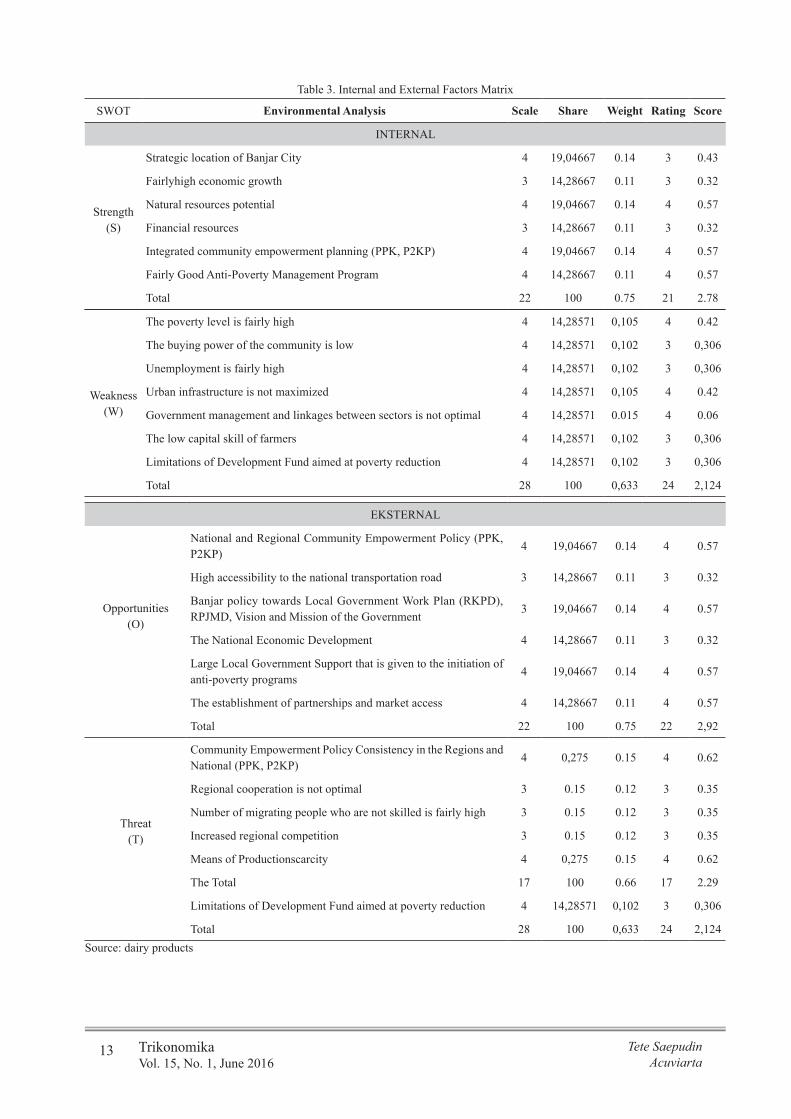
SWOT analysis of community empowerment programs in poverty reduction in Banjar is seen from internal factors, comparing the value of strength and weakness. On the strength factor, there are three indicators that have the same coefficient, and the highest are: a potential natural resources, integrated community development planning (PPK, and P2KP). Management of anti-poverty programs is quite good, with a coefficient of 0.57. The total value of the strength coefficient is 2.78. On the factor of weakness, there are two indicators that have the same coefficient, as well as the largest value, ie; The poverty rate is fairly high, and Urban infrastructure is not maximized to the value of the coefficient of 0.42. The total for the value of the weakness is 2.214. If we compare the total value of strength with weakness, it shows that the total value of the strength coefficient value is greater than the value of weaknesses: 2.78 compared with 2.214.
On external factors, namely the chance (opportunity) and threats (threats), if we compare on the coefficient of opportunities, the greatest are in the indicator values; National and Regional Community Empowerment Policy (PPK, P2KP), Banjar policy towards Local Government Work Plan (RKPD), RPJMD, Vision and Mission of the Government, Large Local Government Support. All of them involve in the initiation of anti-poverty programs, and also establish partnerships and market access, with the same coefficient, ie 0,57.
On the threat indicator, the largest coefficient values are; Community Empowerment Policy Consistency in the Regions and National (PPK, P2KP) and production scarcity, with the value of the coefficient of 0.62. In total, if we compare on the value of the coefficient of opportunities and threats, it showed that the total value of the opportunities outweighs the value of the coefficient of the threat, which is 2.92 compared with 2.29.
Based on the results of the SWOT analysis, the Main Sector Development Strategies for Community Empowerment in reducing poverty in Banjar is: Conservative Strategy, which is a strategy to maximize the opportunities by minimizing the weaknesses that exist.
CONCLUSION
Based on the results of SWOT analysis, the Main Sector Development Strategies for Community Empowerment in reducing poverty in Banjar are as
followed:1. A serious concern on the governments and institutions
partin Banjar associated with the program that is launched (District Development Program and the Urban Poverty Reduction Program), namely the provision of counter part funds from APBD that increased steadily from year to year.
2. Mechanisms involved in the implementation of community development activities that have been implemented by each village in Banjar are in accordance with the provisions in the guidelines that have been set.
3. Urban empowerment program that was launched must be focused and touches more on the interests and needs of urban communities, that is, for example; health facilities, education, toilets, drains (irrigation), and improvement of small streets.
4. Obstacles faced by each village are practically the same as the determination of the program will be implemented (based on the main interests). There also still lack of human resources who understand and own a plan in preparing programs of community development. And there still also lack of reliable human resources in the manufacture of reporting on the implementation program.
REFERENCES
Adimihardja, S.A., Setyono, S. and Nurkhotimah, N., 2011. Pertumbuhan dan Produksi Tiga Varietas Tanaman Pak Choy (Brassica Chinensis S L.) Pada Berbagai Nilai Electrical Conductivity Larutan Hidroponik. Jurnal Pertanian, 2(1).
Adi, Isbandi Rukminto. Japanese and Malaysian Health and Education Strategies for Child Welfare Development. Reflections on the Human Condition: Change, Conflict and Modernity 12: 336.
Bungin, Burhan, 2007, Metodologi Penelitian Kualitatif, Kencana Prenada Media Group.
Badan Pusat Statistik, 2013. Kota Banjar Dalam Angka, Kota Banjar.
Badan Pusat Statistik, 2011. Kabupaten Bekasi Dalam Angka, Kabupaten Bekasi.
Burkey, M.T., Reynolds, S.P., Borkowski, K.J. and Blondin, J.M., 2013. X-Ray Emission from Strongly Asymmetric Circumstellar Material in the Remnant of Kepler’s Supernova. The Astrophysical Journal, 764(1), p.63.
Chambers, R., 2013. Ideas for development. Routledge.David, Fred R., 2006. Manajemen Strategis. Edisi
Sepuluh, Penerbit Salemba Empat, Jakarta.Esman, M.J. and Uphoff, N.T., 1984. Local organizations:
intermediaries in rural development (No. 334.683 E76). Cornell University Press.
Faturochman.,2007, Membangun Gerakan Penanggulangan Kemiskinan Melalui Pemberdayaan Masyarakat, Yogyakarta, Pusat

12The Community Empowerment Programto Reduction Poverty in the City of Banjar
Studi Kependudukan dan Kebijakan, Universitas Gadjah Mada.
Harrison, I., García, N., Freyhof, J., Neubert, E., Amr, Z., Van Damme, D. and Cumberlidge, N., 2015. . Background. The Status and Distribution of Freshwater Biodiversity in the Arabian Peninsula, p.1.
Maqin, R, Abdul., 2011. Pengaruh Kondisi Infrastruktur terhadap Pertumbuhan Ekonomi di Jawa Barat. Trikonomika Volume 10, No.1. Juni 2011. Hal 10-18 ISSN 1411-514X
Muktasam, I., 2011. Technical Report I-2012.Permendagri RI Nomor 7 Tahhun 2007 tentang Kader
Pemberdayaan Masyarakat, Bandung : Fokus Media.
Rangkuti, Freddy. 2006. Analisis SWOT Teknik Membedah Kasus Bisnis. PT. Gramedia Pustaka
Utama, Jakarta.R. Abdul Maqin., dkk., 2015, Perencanaan
Pengembangan Ekonomi Masyarakat Kota Banjar (Penelitian, Kerjasama Prodi Ekonomi Pembangunan FE. Unpas dengan Bappeda Kota Banjar).
Solihin, D., 2007. Perencanaan Pembangunan Daerah: Konsep, Strategi, Tahapan, dan Proses, diunduh dari http://www. slideshare. net. D adangSolihin/perencanaanpembangunan-daerahkonsep-strategi-tahapandan-proses.
Tete Saepudin., dkk., 2012 “Studi Evaluasi Program Pemberdayaan Desa Di Kabupaten Bekasi” (Penelitian, Kerjasama FE. Unpas dengan Bappeda Kabupaten Bekasi).
Tukiran .2007, Sumber Daya Manusia Tantangan Masa Depan,Yogyakarta, Pusat Studi Kependudukan dan Kebijakan, Universitas Gadjah Mada.
Table 2. SWOT IndicatorsSTRENGTHS WEAKNESS OPPORTUNITIES THREATSa. Strategic Location of
Banjar City b. Fairly High Economic
Growthc. Natural Resources
Potentiald. Financial Resourcese. Integrated Community
E m p o w e r m e n t Planning (PPK, P2KP)
f. Fairly Good Anti-Poverty Management Program
a. The poverty level is fairly high
b. The buying power of the community is low
c. Unemployment is fairly high
d. Urban infrastructure is not maximized
e. Government management and linkages between sectors is not optimal
f. The low capital skill of farmers
g. Limitations of Development Fund aimed at poverty reduction
a. National and Regional Community Empowerment Policy (PPK, P2KP)
b. High accessibility to the national road transfortasi
c. Banjar policy towards Local Government Work Plan (RKPD), RPJMD , Vision and Mission of the Government
d. The Nat iona l Economic Development
e. Large Local Government Support that is given to the initiation of anti-poverty programs
f. The formation of partnerships and market access
a. C o m m u n i t y Empowerment Policy konsistency in the Regions and National (PPK, P2KP)
b. Regional cooperation is not optimal
c. Number of migrating people who are not skilled is fairly high
d. Increased regional competition
e. Means of Production scarcity
Source : Processed Results
APPENDIX
13 TrikonomikaVol. 15, No. 1, June 2016
Tete SaepudinAcuviarta
Weakness(W)
The poverty level is fairly high 4 14,28571 0,105 4 0.42
The buying power of the community is low 4 14,28571 0,102 3 0,306
Unemployment is fairly high 4 14,28571 0,102 3 0,306
Urban infrastructure is not maximized 4 14,28571 0,105 4 0.42
Government management and linkages between sectors is not optimal 4 14,28571 0.015 4 0.06
The low capital skill of farmers 4 14,28571 0,102 3 0,306
Limitations of Development Fund aimed at poverty reduction 4 14,28571 0,102 3 0,306
Total 28 100 0,633 24 2,124
EKSTERNAL
Opportunities(O)
National and Regional Community Empowerment Policy (PPK, P2KP)
4 19,04667 0.14 4 0.57
High accessibility to the national transportation road 3 14,28667 0.11 3 0.32
Banjar policy towards Local Government Work Plan (RKPD), RPJMD, Vision and Mission of the Government
3 19,04667 0.14 4 0.57
The National Economic Development 4 14,28667 0.11 3 0.32
Large Local Government Support that is given to the initiation of anti-poverty programs
4 19,04667 0.14 4 0.57
The establishment of partnerships and market access 4 14,28667 0.11 4 0.57
Total 22 100 0.75 22 2,92
Threat(T)
Community Empowerment Policy Consistency in the Regions and National (PPK, P2KP)
4 0,275 0.15 4 0.62
Regional cooperation is not optimal 3 0.15 0.12 3 0.35
Number of migrating people who are not skilled is fairly high 3 0.15 0.12 3 0.35
Increased regional competition 3 0.15 0.12 3 0.35
Means of Productionscarcity 4 0,275 0.15 4 0.62
The Total 17 100 0.66 17 2.29
Limitations of Development Fund aimed at poverty reduction 4 14,28571 0,102 3 0,306
Total 28 100 0,633 24 2,124Source: dairy products
Table 3. Internal and External Factors Matrix
SWOT Environmental Analysis Scale Share Weight Rating Score
INTERNAL
Strength(S)
Strategic location of Banjar City 4 19,04667 0.14 3 0.43
Fairlyhigh economic growth 3 14,28667 0.11 3 0.32
Natural resources potential 4 19,04667 0.14 4 0.57
Financial resources 3 14,28667 0.11 3 0.32
Integrated community empowerment planning (PPK, P2KP) 4 19,04667 0.14 4 0.57
Fairly Good Anti-Poverty Management Program 4 14,28667 0.11 4 0.57
Total 22 100 0.75 21 2.78

14
TrikonomikaVolume 15, No. 1, June 2016, Page. 14-27ISSN 1411-514X (print) / ISSN 2355-7737 (online)
Strategy of Agro Potential Management as an Effortin Achieveing Agroecotourism in Ciburial Village
Dedeh EkawatiPT. Sigma Bhinneka Konsulindo
Yusuf ArifinMaster of Management, University of Pasundan
AbstractThis study aims to identify and analyze the external and internal environment, opportunities, threats, strengths, and weaknesses of the management potential of agro, agro potential strategic management priorities, along with appropriate management programs that can be implemented by the manager. The results are expected to contribute in the development of tourism management, especially management. The study was conducted in Ciburial Village, Cimenyan District of Bandung Regency. The research method used was survey with descriptive and qualitative approach. Method analysis used were IE (Internal-External) analysis, SWOT (Strengths, Weaknesses, Opportunities, Threats) Analysis, and AHP (Analytical Hierarchy Process). The results showed that the management of agro potential in the growth stage requires the manager of the Ciburial Village to cooperate with the various stakeholders involved in the management of agro potential mainly through increased community participation.
Keywords: agro potential, agroecotourism, community based tourism
INTRODUCTION
Tourism takes an important role in the economic development of nations in the world, and particularly in the last two decades when the level of economic welfare of nations in the world have grown. According to the opinion of Oka A. Yoeti, (2008: 1), in the context of tourism development, the tourism industry is said to be the Agents of Development; one that is the driving catalyst of the economy of the country and one to support sustainable development.
In fact, the tourism sector have recently not been able to resolve the problem of poverty population, even though the area of those population has tourist attraction, either in the form panorama and authenticity of nature, social and cultural life of their communities that are attractive as well as other uniqueness. Efforts in development of tourism in West Java is demonstrated by the Department of Cultures and Tourism of West Java by creating a program of “Visit West Java” in 2011, aiming to attract tourists by introducing to the world that West Java, especially Bandung Regency, is an area with lots of agricultural products and beautiful sceneries, where the condition is very supportive to the development of agro eco-tourism.
Determination of strategic planning policies contained in the plan of tourism development for Bandung Regency with agro-based activities became guidelines and directions for the development of agro-tourism in Bandung Regency (Table 1). Meanwhile, the tourism sector is able to alleviate poverty and benefit to the people at large. These are the development of rural tourism. Thus, one approach to the development of alternative tourism is the rural tourism (Oka A.Yoeti, 2008:228).
The Decree of Bandung Regency No. 556.42/Kop.71-Dispopar/2011 regarding to the Village Tourism in Ciburial Village, Bandung Regency set as one of the ten villages that are included as a tourist village with specified types of tours that is agro eco-tourism, namely the agricultural activities or environment-based agrotourism (Table 2).
Besides the agro eco-tourism potential, Ciburial Village has various potential types of tourism including natural tourism, panorama tourism, culinary, arts and cultural tourism, historical tours, and more. These potential tourisms become complementary in supporting the development of agro eco-tourism activities and raise the attractiveness of the tourist attractions that have added value in a diversity of travel destinations.
15 TrikonomikaVol. 15, No. 1, June 2016
Dedeh EkawatiYusuf Arifin
The facts are inversely proportional with all the potential that exists in the Ciburial Village. According to village officials, we obtained information that Ciburial Village, despite being designated as potential agro-tourist village, had not been managed well; the village government did not even gain revenue from tourism. Ciburial Village has a wide variety of potential that becomes the internal strength of the village including its location (in which is geographically located in the highlands of North Bandung) and beautiful scenery. There are also natural and cultural tourism including a friendly community of villager.
Some of the weaknesses in the development of tourism activities in the Ciburial Village include the lack of awareness on the environment from the society, environment degradation due to the land conversion (from agricultural/ plantation into residential land), undeveloped agro potential, and the absence of synergistic management between the district government, the village government and the local community. In terms of opportunities, Ciburial Village has an adjacent geographical location to Bandung as the central government of West Java, conducive to investment climate, as well as supports from the government. However, there are also threats appearing in this process; such as product similarity with the other tourist villages and the decrease of traditional culture, influenced by tourists who bring modern culture as well as the location of the Ciburial village bordering Bandung. This condition is believed to be one of the factors causing undeveloped agro-tourism in Ciburial Village and making it unable to improve the community’s economic income (Table 3).
Ciburial Village has a variety of potential that can be turn into strength. Therefore, the observation of external and internal environment to determine the strengths, weaknesses, opportunities and threats are needed and further shown in Table 4.
Based on the research background, the formulation of the problem is as followed:1. How the potential of agro in Ciburial Village is.2. What strengths and weaknesses in the achievement
of agrotourism in Ciburial Village are.3. What opportunities and obstacles faced in the
achievement of agrotourism in Ciburial Village are.4. How the objectives and management strategies as
an effort to realize the potential of agro agro eco-tourism in Ciburial Village are.
METHOD
The framework of management strategies as an effort to realize the agro potential of agro eco-tourism in Ciburial Village (Asyari, 2011; Main, 2012; Weber Damanikdan 2006, Ramly, 2007, Hadiwijoyo, 2012) is shown in Figure 1. Proposition presented are as followed:
1. That the potential of agro in the Ciburial Village is very important to be managed.
2. That the strengths and weaknesses of the agrotourism are very important to be realized and anticipated with the aim to improve the welfare of society.
3. That the opportunities and obstacles to realizing this agro-tourism need to be analyzed and minimized.
4. That this agro potential can realize the agro eco-tourism in Ciburial Village.
Locus research is in Ciburial Village area, located in Cimenyan District of Bandung Regency with the research study on agro potential management strategies to implement agro eco-tourism. Sources of data and information is obtained from primary survey, including interviews with the person doing tourism activities, among others visitors/tourists, tourist attraction managers, tourism agencies’ staffs, local communities, tourism experts or specialist and other related parties.
Methods of descriptive qualitative analysis is needed to uncover the facts, circumstances, phenomena and circumstances that occurred while running the research and presenting what it is. SWOT (Strengths, Weaknesses, Opportunities, and Threats) Analysis (David, translated by Dono Sunardi, 2009: 327; Hashemi, et. al.; Valentin, 2005; Ommani, 2011; Fine, 2009) is used to analyze the data that will be obtained in the alternative strategies in managing Ciburial tourist village in the future.
Furthermore, the method used is Analytical Hierarchycal Process (AHP) Analysis (Amer, 2013; Kumar 2009; Vaidya, 2006; Saaty, 2008). This analysis is used to determine the key strategies or options strategies that must be developed in an effort to realize the agro potential management of agroecotourism in Ciburial Village.
RESULT
Results of weighting in the method of SWOT analysis showed that there were ample of factors that became the strength of management of agro potential. It could be concluded that the existing agro resources have a lot of potential to be developed. So it was for the external environment with a number of factors that have more opportunities than threats. Based on the strengths and opportunities that exist above, it is very supportive to agro potential management activities.
Results from EFAS (External Factors Analysis System) Matrix (David, translated by Dono Sunardi, 2009: 160) showed that the results of the analysis of external environmental factors produced a total score of 3.191 (Table 6), with the greatest opportunities supporting the management of agro potential as efforts to realize agro eco-tourism in Ciburial Village. The efforts are “back to nature” travel and policy support of Tourism Act No. 10 of 2009 with the greatest threat factors including the socio-political conditions of the

16Strategy of Agro Potential Management as an Effortin Achieveing Agroecotourism in Ciburial Village
national economy, the presence of competitors with agro eco-tourism brand image that travelers are already known in advance and the lack of legal rigor associated with legal permit on building construction (IMB/Izin Mendirikan Bangunan). Therefore, there are no misuse on land. Various factors that fell into the category of those opportunities should be utilized and managed as well as possible. The factor that was included in the threat should also be addressed with priority strategies generated.
The result of IFAS matrix weighting (David, translated by Dono Sunardi, 2009: 231) stated that SWOT element showed the total score of the weighting result was 3.029 (Table 7). With the strength factor that had the highest accessible average value, it showed that Ciburial Village is very accessible to visit within easy route either from Bandung as the capital of West Java or from Jakarta as the capital of the country. Meanwhile, the factors that become the biggest weakness were the activities of the irresponsible parties damaging the land allotment into non-agricultural, mostly converted into land settlements, as well as the lack of community’s venture capital. These give impacts associated to the lack of agro attractions or the unsustainable management of agricultural land.
Based on the analysis results of internal factors using IFAS matrix and external factors using EFAS matrix, it can be known that the total score for the IFE matrix on the x-axis is 3.029 and the total score for the EFE matrix on the y-axis is 3.191 (Figure 2). Thus the results of Internal External (IE) matrix showed that the position of management activities in agro potential of Ciburial Village located in Zone I are considered as a growth strategy. Thus, the strategy used is the vertical integration strategy, which is to integrate the activities of the upstream and downstream activities. In addition, there are various types of intensification strategies, such as market penetration, market development and product development.
Composition of alternative strategies based on the order of priority obtained from the weighting matrix interactions SWOT is described on the Table 9 and summarized on the Table 10.
From the results of the weighting through the SWOT analysis, it can be arranged based on a combination of strategic priorities strategies that have the highest value to the lowest. The result of the interaction of IFAS-EFAS that generate alternative strategies that get the highest weight value is Strength-Opportunity (SO), which can be translated as a strategy to use strength to take advantage of opportunities that exist (Table 11).
Based on the analysis of AHP (Figure 3), the results showed that in order to manage agro potential as an effort to realize agro eco-tourism in Ciburial Village, target persons who have the required contributions are the government who has a function as a regulator, private sector as the donor funding, as well as the public
as the manager who actively participate in it.Utilization of natural resources often do not
optimally perform and is exploitative as it tends to happen in Ciburial Village, which is a lot of abuse for conversion of land use with a variety of agricultural land into residential land as well as for service activities. This trend needs to be immediately addressed, one of which is through the empowerment of agricultural land that has economic and social benefits.
One form of manifestation that can be done is through the management of agro potential; in the context of this study is an attempt to realize agro eco-tourism. The potential of agro-tourism in Ciburial Village cannot be relied upon because they lack appropriate management strategies. Management and development of agro-tourism will have a large and significant impact in the economic development of rural communities and support efforts to conserve natural resources and the environment.
Management of agro potential towards agro eco-tourism should be able to protect natural resources and wealth, cultural values and local history. Management in efforts to realize the agro potential of agro eco-tourism in the Ciburial Village should be done in integrated with related sectors, such as agriculture, plantations, farms, cultivation, hospitality, travel agencies, industry, arts and culture, and so on. Therefore, there is also an accordance occuring in various agro eco-tourism supporting sectors. The development of tourist facilities and services are able to provide comfort for visitors while providing benefits to the local community. The giving added value to local products is expected to increase revenue in agro sector, and indirectly support the growth of investment in agro-tourism activities in order to create new jobs for people, which can eventually raise the local economy.
On the factors which belong to the opportunities, threats, strengths and weaknesses in the management of agro potential as an effort to realize agro eco-tourism in Ciburial Village, we analyzed by scanning the external and internal environment to the EFAS and IFAS matrix. Based on the interview, agro potential management has a variety of opportunities and threats. The biggest opportunity that must be captured and developed is the travel trend back to nature.
Based on the SWOT matrix, six alternative strategies of management of agro potential were obtained including optimizing natural and artificial resources, developing destination components, increasing community participation, improving the quality of human resources, improving the implementation of the role of institutions, and intensifying promotion. Based on the analysis of the AHP method, strategies on making highest priority and development is needed to improve human resources. The next priority for the strategy is to increase public participation, to optimalize both natural and artificial resources, to develop destination
17 TrikonomikaVol. 15, No. 1, June 2016
Dedeh EkawatiYusuf Arifin
components, to improve the implementation of the institutional role and the last is to intensify promotions.
After going through various stages of analysis, the program management of agro potential as an effort to realize agro eco-tourism in Ciburial Village in Cimenyan District of Bandung Regency with Community-based Tourism study approach made up for the short term is valid for only one year, medium-term for the period of 5 years, and long-term for a period of 10 years. In this case, the recommended program is needed in accordance with the conditions of external and internal environment as outlined in the SWOT matrix and Internal-External (IE) matrix. Based on the programs that belong to the agro potential management strategy as an effort to realize agro eco-tourism, it is known that the program for improving the quality of human resources is through education and training activities and socialization of the contents of the various insights and knowledge about managing agro eco-tourism.
Community empowerment programs directly engage in agro management activities, resource optimization program through the application of processing technologically and environmentally friendly cultivation, destination component development program with the provision of homestay, restaurants, souvenir stalls, and so on. Furthermore, the program with the improved implementation of institutional by structuring and development activities of handicraft centers of food and crafts is also needed. Kompepar role also needs to be activated, as well as increased promotion programs in cooperation with various parties and improving the quality of agricultural products.
CONCLUSION
Agro potential that exists in Ciburial Village consists of the agricultural potential of both wet and dry land, plantations and farms. Dry land farming such as organic vegetables located in Jalan Cibeungang has the potential to be developed as an effort to support agro eco-tourism.
Strength owned by Ciburial Village is in terms of accessibility and the greatest weakness is environmental degradation. Overall, the condition of the internal environment of agro management of Ciburial Village support the efforts to realize of agro potential to be agro eco-tourism.
Opportunity in management of agro potential in Ciburial Village is a travel trend back to nature, and threats that must be faced are the sociopolitical and economic conditions at national level that are often less conducive to influence the decision of the people/tourists in tourism activities.
Internal-External Matrix shows that the management of agro potential in Ciburial Village is at growth stage with a vertical integration strategy. Priority strategies based on analysis of AHP (Analytical Hierarchal Process) are a strategy to increase human resources and then a
strategy to increase community participation, optimize human and natural resources, develop destination components, improve the implementation of the role of institutions, and the last is intensify promotional strategy. For priority strategies to improve the quality of human resources, the short-term program that can be done is education and training that supports agro management activities. Medium-term program in the form of community development of tourism awareness, and a long-term program of increased cooperation in education in terms of mastery of agricultural technology.
REFERENCES
Alireza Amer. 2013. Application of the Analytic Hiwrarchy Process (AHP) for Prioritize of Concrete Pavement. Global Journal of Human Social Science Interdisciplinary. Vol. 13 Issue 3 Version 1.0.
Asyari, Hasbullah. 2011. Buku Pegangan Desa Wisata, Materi Bimbingan Teknis untuk Membangun Desa wisata, Pusat Informasi Desa Wisata DIY Tourista Anindya Guna, Yogyakarta.
Damanik, Janianton and Helmut F. Weber. 2006. Perencanaan Ekowisata Dari Teori ke Aplikasi, Pusat Studi Pariwisata (PUSPAR UGM) dan Andi Yogyakarta.
David R, Fred. 2009. Manajemen Strategis, Buku 1, ed.12, Alih Bahasa : Dono Sunardi, Salemba Empat, Jakarta.
Decree of Bandung Regency No. 556.42/Kop.71-Dispopar/2011 regarding to the Village Tourism in Ciburial Village, Bandung Regency set as one of the ten villages that are included as a tourist village (Surat Keputusan Bupati Bandung Nomor 556.42/Kop.71-Dispopar/2011 tentang Penetapan Desa Wisata di Wilayah Kabupaten Bandung menetapkan Desa Ciburial sebagai salah satu dari sepuluh desa yang termasuk sebagai desa wisata).
Fine, Lawrence G. 2009. The SWOT Analysis. Using your Strength to overcome Weaknesses, Using Opportunities to overcome Threats.
Hadiwijoyo, Suryo Sakti. 2012. Perencanaan Pariwisata Perdesaan Berbasis Masyarakat, Graha Ilmu,Yogyakarta.
Hashemi, Nima Fakhim; Mohammad Mahdavi Mazdeh; Ashkan Rahimian. Formulating and Choosing Strategies Using SWOT Analysis and QSPM Matrix: A Case Study of Hamdan Glass Company. Proceedings of the 41st International Conference on Computers & Industrial Engineering.
Kumar, Sanjay; Neeraj Parashar; Abid Haleem. 2009. Analytical Hierarchy Process Applied to Vendor Selection Problem: Small Scale, Medium Scale and Large Industries. Business Intelligence Journal.August.355 -362.
Oka A.Yoeti. 2008.Perencanaan dan Pengembangan Pariwisata, PT. Pradnya Paramita, Jakarta.

18Strategy of Agro Potential Management as an Effortin Achieveing Agroecotourism in Ciburial Village
Ommani, Reza Ahmad. 2011. Strength, Weaknesses, Opportunities and Threats (SWOT) analysis for farming system businesses management: Case of wheat farmers of Shadervan District, Shoushtar Townshop, Iran. African Journal of Business Management Vol. 5 (22). Pp. 9448-9454. 30 September 2011.
Ramly, Nadjamuddin. 2007, Pariwisata Berwawasan Lingkungan, Gravindo Khazanah Ilmu, Jakarta.
Saaty, Thomas L. 2008. Decision Making with Analytical Hierarchy Process. International Journal Sciences, University of Pitsburgh, Pitsburgh.
Suryo Sakti Hadiwijoyo, (2012), Perencanaan Vol. 1.No. 1
Utama, I Gusti Bagus Rai. 2012. Agrowisata Sebagai Pariwisata Alternatif Indonesia, Denpasar, Bali
Vaidya, Omkarprasad S; Sushil Kumar. 2006. Analytic hierarchy process: An overview applications. European Journal of Operational Research 169, 1 – 29.
Valentin, Erhard K. 2005. Away With SWOT Analysis: Use defensive/Offensive Analysis Instead. The Journal of Applied Business Research. Volume 21. Number 2.
APPENDIX
Table 1. Long Term Tourism Development Strategy Bandung Regency2012-2016 2017-2021 2022-2026
Developing Bandung Regency as a national leading agrotourism destination through:• Development of areas with typical agro appeal
of Bandung Regency as a strategic area of, West Java Province tourism.
• Development of areas with the fascination of a typical geotourism of Bandung Regency as a strategic area in the Regency tourism.
• Synergistic planning between the areas of natural mountain agrotourism, geotourism, cultural attractions, and recreation of Bandung Regency.
• Synergistic planning between agrotourism areas of Bandung Regency, West Java leading agrotourism areas and other national agrotourism areas.
• Synergistic planning between tourism of Bandung Regency, West Java and National.
Developing Bandung Regency as a national geotourism destination through:• Development of geotourism area of Bandung
Regency as the national leading tourism destinations.
• Synergistic planning between geotourism featured areas with leading agrotourism areas and other tourism areas in the vicinity.
• Synergistic planning between geotourism areas of Bandung regency, West Java province and other national geotourism area.
• Planning mitigation and adaptation as well as the impact of tourism of Bandung Regency.
• Planning monitoring system and control the development of Bandung Regency as a national tourism destination.
Developing Bandung Regency as an international tourism destination through:• The implementation of national
and international standards in the field of environment and management of all tourism businesses located in Bandung Regency.
• The implementation of national and international certification to human resources in tourism, both in the government and private sectors.
• Enforcement of international standard security and safety for tourists.
Table 2. Name and Type of Village Tourism in Bandung RegencyNo Village Name District Type of Tourism Featured Product1 Desa Alam Endah Rancabali Agroecotourism Various strawberry processed food, handicraft, agriculture and plantation2 Desa Gambung Pasirjambu Agroecotourism Various strawberry processed food, handicraft, agriculture and plantations3 Desa Panundaan Ciwidey Agroecotourism Handicraft, agriculture, education tourism, homestay and cultural arts4 Desa Lebak muncang Ciwidey Agroecotourism Handicraft, rabbit, agriculture and fisheries5 Desa Lamajang Pangalengan Agroecotourism Handicraft, homestay, culinary, agriculture, livestock, arts and culture, rafting6 Kelurahan Jelekong Baleendah Arts and Culture Handicraft, arts and culture, agriculture, plantation, painting, traditional
culinary7 Desa Ciburial Cimenyan Agroecotourism Arts and culture, animal husbandry, agriculture8 Kampung Ciborelang
Desa CinunukCileunyi Art and Tourism
VillageArts and culture, traditional cuisine and handicrafts
9 Desa Laksana Ibun Agroecotourism Kamojang crater, and traditional culinary culture, animal husbandry, agriculture and plantations
10 Desa Rawabogo Ciwidey Agroecotourism Cultural arts, handicrafts, traditional cuisine, Pete makan, agriculture and plantations.
Source : Appendix Decree of Bandung Regency No. 556.42/Kop. 71-Dispopar/2011
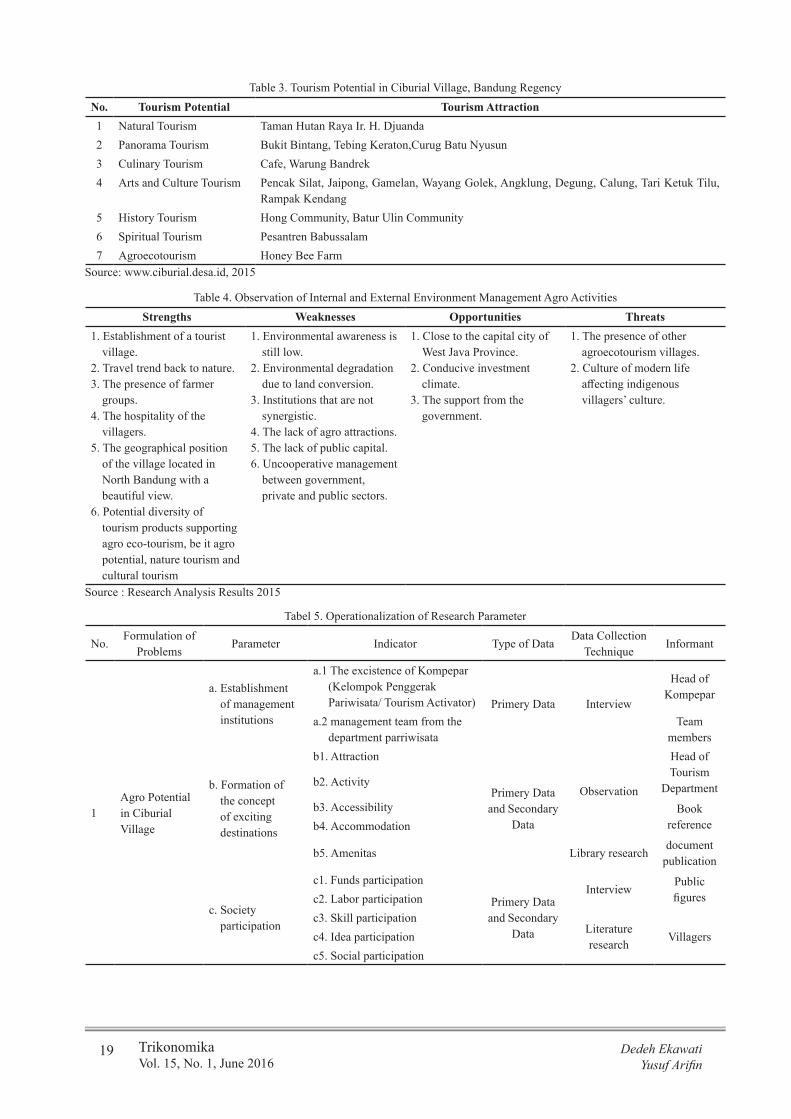
19 TrikonomikaVol. 15, No. 1, June 2016
Dedeh EkawatiYusuf Arifin
Table 3. Tourism Potential in Ciburial Village, Bandung RegencyNo. Tourism Potential Tourism Attraction1 Natural Tourism Taman Hutan Raya Ir. H. Djuanda2 Panorama Tourism Bukit Bintang, Tebing Keraton,Curug Batu Nyusun3 Culinary Tourism Cafe, Warung Bandrek4 Arts and Culture Tourism Pencak Silat, Jaipong, Gamelan, Wayang Golek, Angklung, Degung, Calung, Tari Ketuk Tilu,
Rampak Kendang5 History Tourism Hong Community, Batur Ulin Community6 Spiritual Tourism Pesantren Babussalam7 Agroecotourism Honey Bee Farm
Source: www.ciburial.desa.id, 2015
Table 4. Observation of Internal and External Environment Management Agro Activities Strengths Weaknesses Opportunities Threats
1. Establishment of a tourist village.
2. Travel trend back to nature.3. The presence of farmer
groups.4. The hospitality of the
villagers.5. The geographical position
of the village located in North Bandung with a beautiful view.
6. Potential diversity of tourism products supporting agro eco-tourism, be it agro potential, nature tourism and cultural tourism
1. Environmental awareness is still low.
2. Environmental degradation due to land conversion.
3. Institutions that are not synergistic.
4. The lack of agro attractions.5. The lack of public capital.6. Uncooperative management
between government, private and public sectors.
1. Close to the capital city of West Java Province.
2. Conducive investment climate.
3. The support from the government.
1. The presence of other agroecotourism villages.
2. Culture of modern life affecting indigenous villagers’ culture.
Source : Research Analysis Results 2015
Tabel 5. Operationalization of Research Parameter
No.Formulation of
ProblemsParameter Indicator Type of Data
Data Collection Technique
Informant
1Agro Potential in Ciburial Village
a. Establishment of management institutions
a.1 The excistence of Kompepar (Kelompok Penggerak Pariwisata/ Tourism Activator) Primery Data Interview
Head of Kompepar
a.2 management team from the department parriwisata
Team members
b. Formation of the concept of exciting destinations
b1. Attraction
Primery Data and Secondary
Data
Observation
Head of Tourism
Departmentb2. Activity
b3. Accessibility Book referenceb4. Accommodation
b5. Amenitas Library researchdocument
publication
c. Society participation
c1. Funds participation
Primery Data and Secondary
Data
InterviewPublic figuresc2. Labor participation
c3. Skill participationLiterature research
Villagersc4. Idea participationc5. Social participation
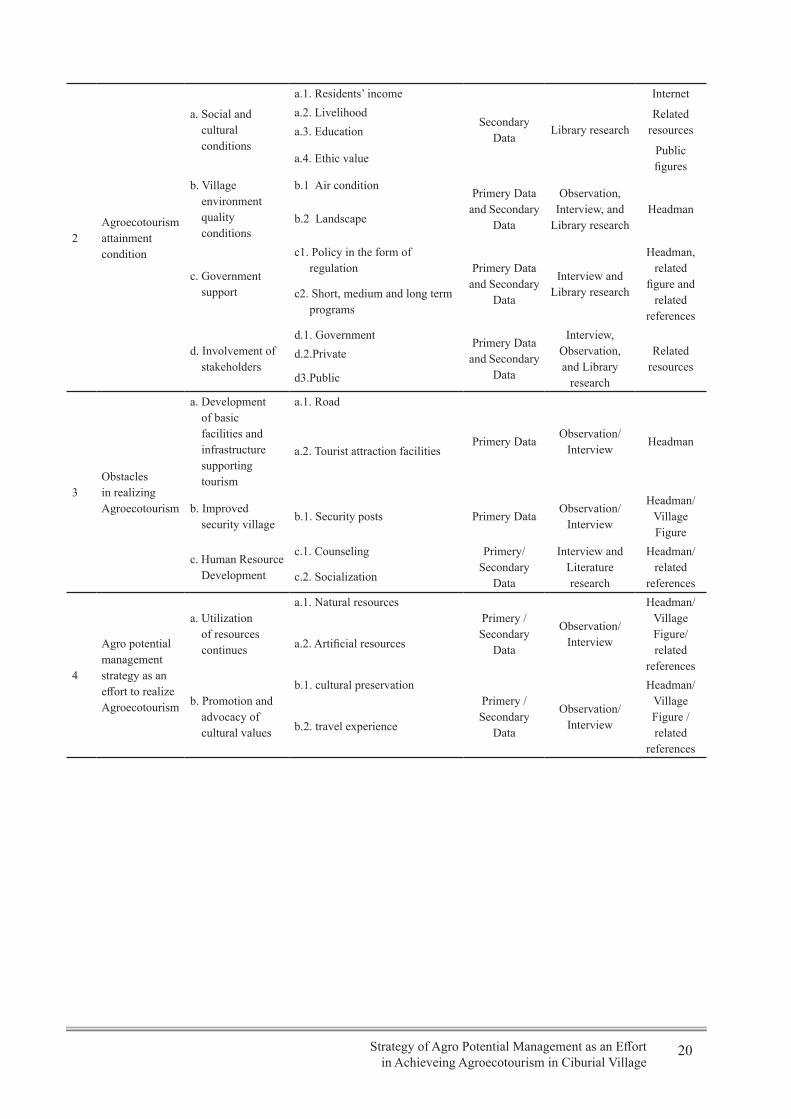
20Strategy of Agro Potential Management as an Effortin Achieveing Agroecotourism in Ciburial Village
2Agroecotourism attainment condition
a. Social and cultural conditions
a.1. Residents’ income
Secondary Data
Library research
Internet a.2. Livelihood Related
resourcesa.3. Education
a.4. Ethic valuePublic figures
b. Village environment quality conditions
b.1 Air conditionPrimery Data
and Secondary Data
Observation, Interview, and
Library researchHeadman
b.2 Landscape
c. Government support
c1. Policy in the form of regulation Primery Data
and Secondary Data
Interview and Library research
Headman, related
figure and related
references
c2. Short, medium and long term programs
d. Involvement of stakeholders
d.1. GovernmentPrimery Data
and Secondary Data
Interview, Observation, and Library
research
Related resources
d.2.Private
d3.Public
3Obstacles in realizing Agroecotourism
a. Development of basic facilities and infrastructure supporting tourism
a.1. Road
Primery DataObservation/
InterviewHeadman
a.2. Tourist attraction facilities
b. Improved security village
b.1. Security posts Primery DataObservation/
Interview
Headman/ Village Figure
c. Human Resource Development
c.1. Counseling Primery/Secondary
Data
Interview and Literature research
Headman/ related
referencesc.2. Socialization
4
Agro potential management strategy as an effort to realize Agroecotourism
a. Utilization of resources continues
a.1. Natural resourcesPrimery /Secondary
Data
Observation/ Interview
Headman/Village Figure/ related
references
a.2. Artificial resources
b. Promotion and advocacy of cultural values
b.1. cultural preservationPrimery /Secondary
Data
Observation/ Interview
Headman/ Village Figure / related
references
b.2. travel experience
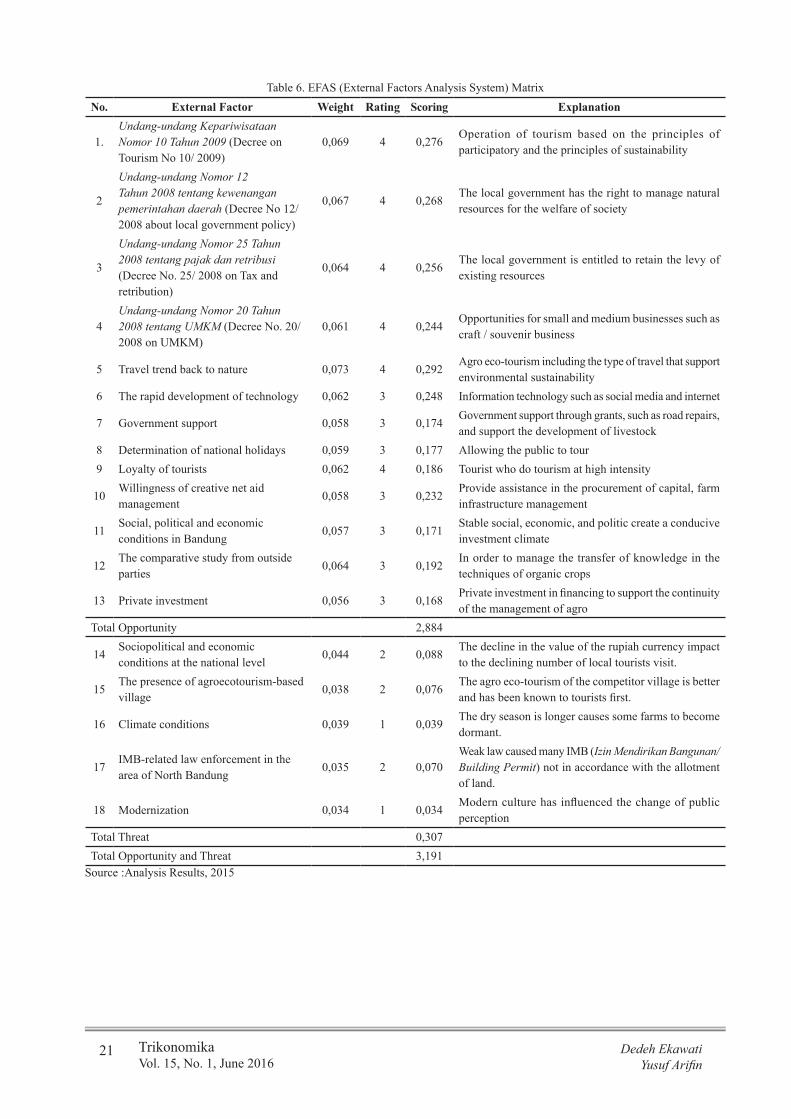
21 TrikonomikaVol. 15, No. 1, June 2016
Dedeh EkawatiYusuf Arifin
Table 6. EFAS (External Factors Analysis System) MatrixNo. External Factor Weight Rating Scoring Explanation
1.Undang-undang Kepariwisataan Nomor 10 Tahun 2009 (Decree on Tourism No 10/ 2009)
0,069 4 0,276Operation of tourism based on the principles of participatory and the principles of sustainability
2
Undang-undang Nomor 12 Tahun 2008 tentang kewenangan pemerintahan daerah (Decree No 12/ 2008 about local government policy)
0,067 4 0,268The local government has the right to manage natural resources for the welfare of society
3
Undang-undang Nomor 25 Tahun 2008 tentang pajak dan retribusi (Decree No. 25/ 2008 on Tax and retribution)
0,064 4 0,256The local government is entitled to retain the levy of existing resources
4Undang-undang Nomor 20 Tahun 2008 tentang UMKM (Decree No. 20/ 2008 on UMKM)
0,061 4 0,244Opportunities for small and medium businesses such as craft / souvenir business
5 Travel trend back to nature 0,073 4 0,292Agro eco-tourism including the type of travel that support environmental sustainability
6 The rapid development of technology 0,062 3 0,248 Information technology such as social media and internet
7 Government support 0,058 3 0,174Government support through grants, such as road repairs, and support the development of livestock
8 Determination of national holidays 0,059 3 0,177 Allowing the public to tour9 Loyalty of tourists 0,062 4 0,186 Tourist who do tourism at high intensity
10Willingness of creative net aid management
0,058 3 0,232Provide assistance in the procurement of capital, farm infrastructure management
11Social, political and economic conditions in Bandung
0,057 3 0,171Stable social, economic, and politic create a conducive investment climate
12The comparative study from outside parties
0,064 3 0,192In order to manage the transfer of knowledge in the techniques of organic crops
13 Private investment 0,056 3 0,168Private investment in financing to support the continuity of the management of agro
Total Opportunity 2,884
14Sociopolitical and economic conditions at the national level
0,044 2 0,088The decline in the value of the rupiah currency impact to the declining number of local tourists visit.
15The presence of agroecotourism-based village
0,038 2 0,076The agro eco-tourism of the competitor village is better and has been known to tourists first.
16 Climate conditions 0,039 1 0,039The dry season is longer causes some farms to become dormant.
17IMB-related law enforcement in the area of North Bandung
0,035 2 0,070Weak law caused many IMB (Izin Mendirikan Bangunan/Building Permit) not in accordance with the allotment of land.
18 Modernization 0,034 1 0,034Modern culture has influenced the change of public perception
Total Threat 0,307Total Opportunity and Threat 3,191
Source :Analysis Results, 2015
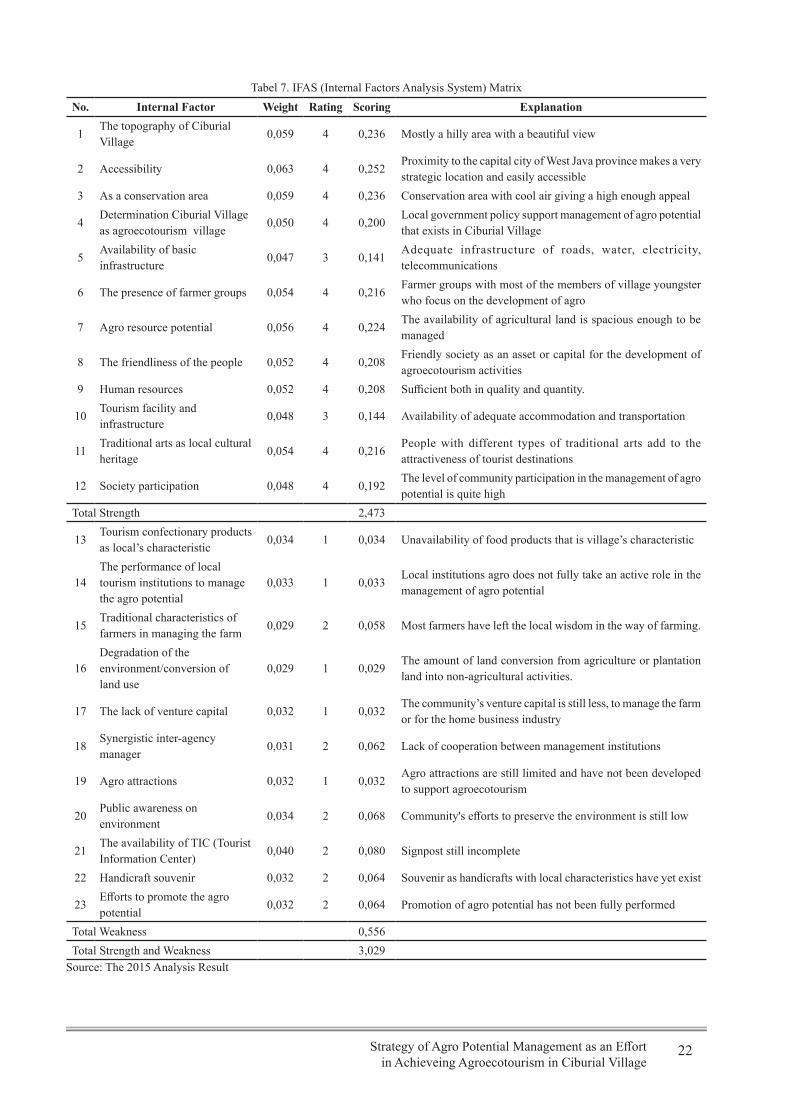
22Strategy of Agro Potential Management as an Effortin Achieveing Agroecotourism in Ciburial Village
Tabel 7. IFAS (Internal Factors Analysis System) MatrixNo. Internal Factor Weight Rating Scoring Explanation
1The topography of Ciburial Village
0,059 4 0,236 Mostly a hilly area with a beautiful view
2 Accessibility 0,063 4 0,252Proximity to the capital city of West Java province makes a very strategic location and easily accessible
3 As a conservation area 0,059 4 0,236 Conservation area with cool air giving a high enough appeal
4Determination Ciburial Village as agroecotourism village
0,050 4 0,200Local government policy support management of agro potential that exists in Ciburial Village
5Availability of basic infrastructure
0,047 3 0,141Adequate infrastructure of roads, water, electricity, telecommunications
6 The presence of farmer groups 0,054 4 0,216Farmer groups with most of the members of village youngster who focus on the development of agro
7 Agro resource potential 0,056 4 0,224The availability of agricultural land is spacious enough to be managed
8 The friendliness of the people 0,052 4 0,208Friendly society as an asset or capital for the development of agroecotourism activities
9 Human resources 0,052 4 0,208 Sufficient both in quality and quantity.
10Tourism facility and infrastructure
0,048 3 0,144 Availability of adequate accommodation and transportation
11Traditional arts as local cultural heritage
0,054 4 0,216People with different types of traditional arts add to the attractiveness of tourist destinations
12 Society participation 0,048 4 0,192The level of community participation in the management of agro potential is quite high
Total Strength 2,473
13Tourism confectionary products as local’s characteristic
0,034 1 0,034 Unavailability of food products that is village’s characteristic
14The performance of local tourism institutions to manage the agro potential
0,033 1 0,033Local institutions agro does not fully take an active role in the management of agro potential
15Traditional characteristics of farmers in managing the farm
0,029 2 0,058 Most farmers have left the local wisdom in the way of farming.
16Degradation of the environment/conversion of land use
0,029 1 0,029The amount of land conversion from agriculture or plantation land into non-agricultural activities.
17 The lack of venture capital 0,032 1 0,032The community’s venture capital is still less, to manage the farm or for the home business industry
18Synergistic inter-agency manager
0,031 2 0,062 Lack of cooperation between management institutions
19 Agro attractions 0,032 1 0,032Agro attractions are still limited and have not been developed to support agroecotourism
20 Public awareness on environment
0,034 2 0,068 Community's efforts to preserve the environment is still low
21The availability of TIC (Tourist Information Center)
0,040 2 0,080 Signpost still incomplete
22 Handicraft souvenir 0,032 2 0,064 Souvenir as handicrafts with local characteristics have yet exist
23Efforts to promote the agro potential
0,032 2 0,064 Promotion of agro potential has not been fully performed
Total Weakness 0,556Total Strength and Weakness 3,029
Source: The 2015 Analysis Result
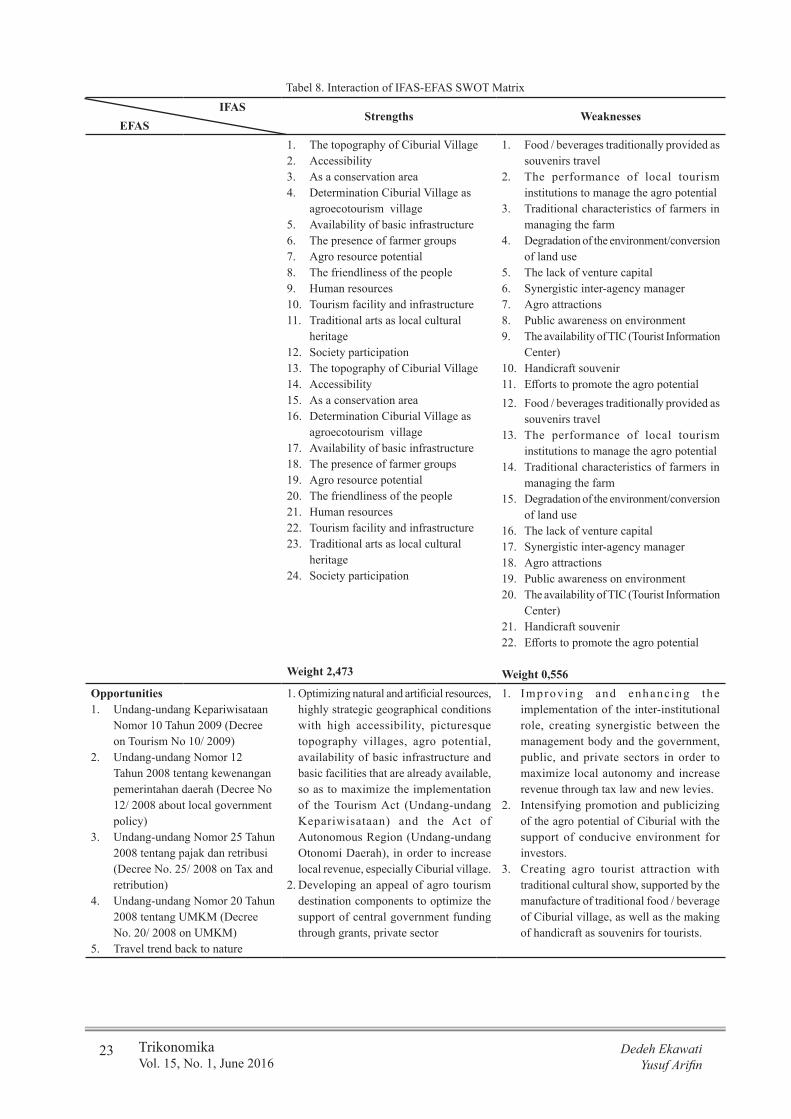
23 TrikonomikaVol. 15, No. 1, June 2016
Dedeh EkawatiYusuf Arifin
Tabel 8. Interaction of IFAS-EFAS SWOT MatrixIFAS
Strengths WeaknessesEFAS
1. The topography of Ciburial Village 2. Accessibility3. As a conservation area4. Determination Ciburial Village as
agroecotourism village5. Availability of basic infrastructure6. The presence of farmer groups7. Agro resource potential 8. The friendliness of the people9. Human resources10. Tourism facility and infrastructure11. Traditional arts as local cultural
heritage12. Society participation13. The topography of Ciburial Village 14. Accessibility15. As a conservation area16. Determination Ciburial Village as
agroecotourism village17. Availability of basic infrastructure18. The presence of farmer groups19. Agro resource potential 20. The friendliness of the people21. Human resources22. Tourism facility and infrastructure23. Traditional arts as local cultural
heritage24. Society participation
Weight 2,473
1. Food / beverages traditionally provided as souvenirs travel
2. The performance of local tourism institutions to manage the agro potential
3. Traditional characteristics of farmers in managing the farm
4. Degradation of the environment/conversion of land use
5. The lack of venture capital6. Synergistic inter-agency manager7. Agro attractions 8. Public awareness on environment9. The availability of TIC (Tourist Information
Center)10. Handicraft souvenir11. Efforts to promote the agro potential12. Food / beverages traditionally provided as
souvenirs travel13. The performance of local tourism
institutions to manage the agro potential 14. Traditional characteristics of farmers in
managing the farm15. Degradation of the environment/conversion
of land use16. The lack of venture capital17. Synergistic inter-agency manager18. Agro attractions 19. Public awareness on environment20. The availability of TIC (Tourist Information
Center)21. Handicraft souvenir22. Efforts to promote the agro potential
Weight 0,556Opportunities1. Undang-undang Kepariwisataan
Nomor 10 Tahun 2009 (Decree on Tourism No 10/ 2009)
2. Undang-undang Nomor 12 Tahun 2008 tentang kewenangan pemerintahan daerah (Decree No 12/ 2008 about local government policy)
3. Undang-undang Nomor 25 Tahun 2008 tentang pajak dan retribusi (Decree No. 25/ 2008 on Tax and retribution)
4. Undang-undang Nomor 20 Tahun 2008 tentang UMKM (Decree No. 20/ 2008 on UMKM)
5. Travel trend back to nature
1. Optimizing natural and artificial resources, highly strategic geographical conditions with high accessibility, picturesque topography villages, agro potential, availability of basic infrastructure and basic facilities that are already available, so as to maximize the implementation of the Tourism Act (Undang-undang Kepariwisataan) and the Act of Autonomous Region (Undang-undang Otonomi Daerah), in order to increase local revenue, especially Ciburial village.
2. Developing an appeal of agro tourism destination components to optimize the support of central government funding through grants, private sector
1. Improving and enhanc ing the implementation of the inter-institutional role, creating synergistic between the management body and the government, public, and private sectors in order to maximize local autonomy and increase revenue through tax law and new levies.
2. Intensifying promotion and publicizing of the agro potential of Ciburial with the support of conducive environment for investors.
3. Creating agro tourist attraction with traditional cultural show, supported by the manufacture of traditional food / beverage of Ciburial village, as well as the making of handicraft as souvenirs for tourists.

24Strategy of Agro Potential Management as an Effortin Achieveing Agroecotourism in Ciburial Village
6. The rapid development of technology
7. Government support8. Determination of national
holidays9. Loyalty of tourists10. Willingness of creative net aid
management11. Social, political and economic
conditions in Bandung12. The comparative study from
outside parties13. Private investment
Weight 2,884
investment, supported by the cultural event such as a traditional art that is fostered through existing studios thereby increasing the cultural feel in the implementation of agroecotourism as a tourism trends back to nature.
3. Developing a community participation to be involved in the formulation, planning, excecution, and implementation of agro potential management activities in an effort to realize agroecotourism, with the support of conducive social and political conditions to make the Ciburial village as a agroecotourism destination that is able to increase the income of local communities.
4. Improving the quality of human resources by training, agricultural education, socialization of agricultural technology that is environmentally friendly, to increase knowledge and understanding of the community in managing agro potential.
Weight 5,357
4. Overcoming the shortage of public capital through government aid and help investors to support people in managing agricultural land as well as to open a craft center, so as to encourage the development of agro industry and improve the community economy through SMEs.
Weight 3,440Threats1. Sociopolitical and economic
conditions at the national level2. The presence of agroecotourism-
based village3. Climate conditions4. IMB-related law enforcement in
the area of North Bandung5. Modernization
Weight 0,307
1. Improving the empowerment of communities or farmers’ groups to create competitive agroecotourism with unique and interesting agro attractions so it can be more superior than agroecotourism contained in other areas.
2. Intensifying environmental conservation activities by involving the community and other public and private investors that are expected to restore Ciburial village as a conservation area and to overcome the effects of drought associated with the availability of water resources.
3. Fostering a love of the Ciburial villagers towards the customs, culture, local wisdom in order to remain sustainable and able to stem the flow of modern culture to create a genuine tourist village, unique and understated but contains the high life philosophical values that will form a tour that has good quality of ecotourism education.
Weight 2,780
1. Reinforcing the law enforcer of government in the provision of Building Permit (IMB/Izin Mendirikan Bangunan), so as to reduce the more uncontrolled land use conversion. It must be overcome immediately because it threatens the existence of agricultural land that would affect the sustainability of agro potential management to realize agroecotourism
2. Developing entrepreneurial spirit of village community so as to make characteristic food / beverages products as well as souvenirs of handicraft as a complementary agroecotourism attraction by highlighting the local culture so that it can be maintained its existence.
3. To socialize the potential of agro owned in order to increase investment in the Ciburial Village.
Weight 0,863Source : IFAS-EFAS Interaction, 2015
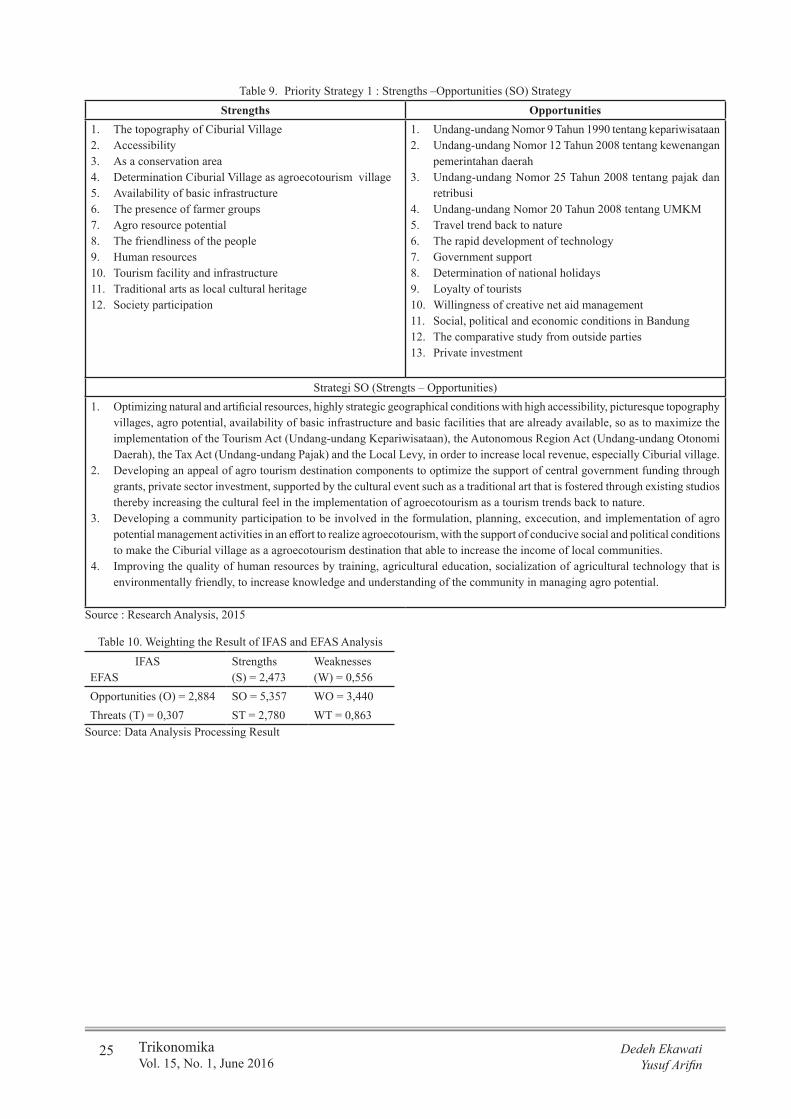
25 TrikonomikaVol. 15, No. 1, June 2016
Dedeh EkawatiYusuf Arifin
Table 9. Priority Strategy 1 : Strengths –Opportunities (SO) StrategyStrengths Opportunities
1. The topography of Ciburial Village 2. Accessibility3. As a conservation area4. Determination Ciburial Village as agroecotourism village5. Availability of basic infrastructure6. The presence of farmer groups7. Agro resource potential 8. The friendliness of the people9. Human resources10. Tourism facility and infrastructure11. Traditional arts as local cultural heritage12. Society participation
1. Undang-undang Nomor 9 Tahun 1990 tentang kepariwisataan2. Undang-undang Nomor 12 Tahun 2008 tentang kewenangan
pemerintahan daerah3. Undang-undang Nomor 25 Tahun 2008 tentang pajak dan
retribusi4. Undang-undang Nomor 20 Tahun 2008 tentang UMKM5. Travel trend back to nature6. The rapid development of technology7. Government support8. Determination of national holidays9. Loyalty of tourists10. Willingness of creative net aid management11. Social, political and economic conditions in Bandung12. The comparative study from outside parties13. Private investment
Strategi SO (Strengts – Opportunities)1. Optimizing natural and artificial resources, highly strategic geographical conditions with high accessibility, picturesque topography
villages, agro potential, availability of basic infrastructure and basic facilities that are already available, so as to maximize the implementation of the Tourism Act (Undang-undang Kepariwisataan), the Autonomous Region Act (Undang-undang Otonomi Daerah), the Tax Act (Undang-undang Pajak) and the Local Levy, in order to increase local revenue, especially Ciburial village.
2. Developing an appeal of agro tourism destination components to optimize the support of central government funding through grants, private sector investment, supported by the cultural event such as a traditional art that is fostered through existing studios thereby increasing the cultural feel in the implementation of agroecotourism as a tourism trends back to nature.
3. Developing a community participation to be involved in the formulation, planning, excecution, and implementation of agro potential management activities in an effort to realize agroecotourism, with the support of conducive social and political conditions to make the Ciburial village as a agroecotourism destination that able to increase the income of local communities.
4. Improving the quality of human resources by training, agricultural education, socialization of agricultural technology that is environmentally friendly, to increase knowledge and understanding of the community in managing agro potential.
Source : Research Analysis, 2015
Table 10. Weighting the Result of IFAS and EFAS Analysis IFASEFAS
Strengths(S) = 2,473
Weaknesses(W) = 0,556
Opportunities (O) = 2,884 SO = 5,357 WO = 3,440Threats (T) = 0,307 ST = 2,780 WT = 0,863
Source: Data Analysis Processing Result
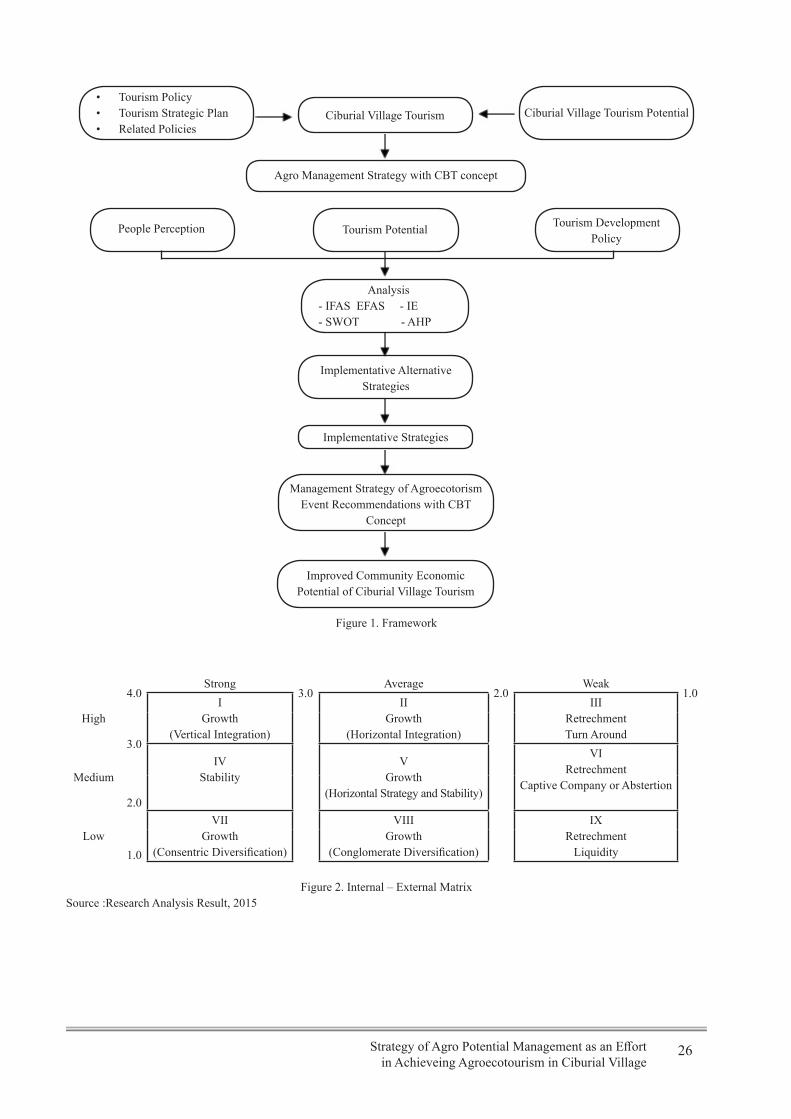
26Strategy of Agro Potential Management as an Effortin Achieveing Agroecotourism in Ciburial Village
• Tourism Policy• Tourism Strategic Plan• Related Policies
Ciburial Village Tourism Ciburial Village Tourism Potential
Agro Management Strategy with CBT concept
People Perception Tourism Potential Tourism Development Policy
Analysis- IFAS EFAS - IE- SWOT - AHP
Implementative Alternative Strategies
Implementative Strategies
Management Strategy of Agroecotorism Event Recommendations with CBT
Concept
Improved Community Economic Potential of Ciburial Village Tourism
Figure 1. Framework
4.0Strong
3.0Average
2.0Weak
1.0
HighI
Growth(Vertical Integration)
IIGrowth
(Horizontal Integration)
IIIRetrechmentTurn Around
3.0
MediumIV
StabilityV
Growth(Horizontal Strategy and Stability)
VIRetrechment
Captive Company or Abstertion2.0
LowVII
Growth(Consentric Diversification)
VIIIGrowth
(Conglomerate Diversification)
IXRetrechment
Liquidity1.0
Figure 2. Internal – External MatrixSource :Research Analysis Result, 2015
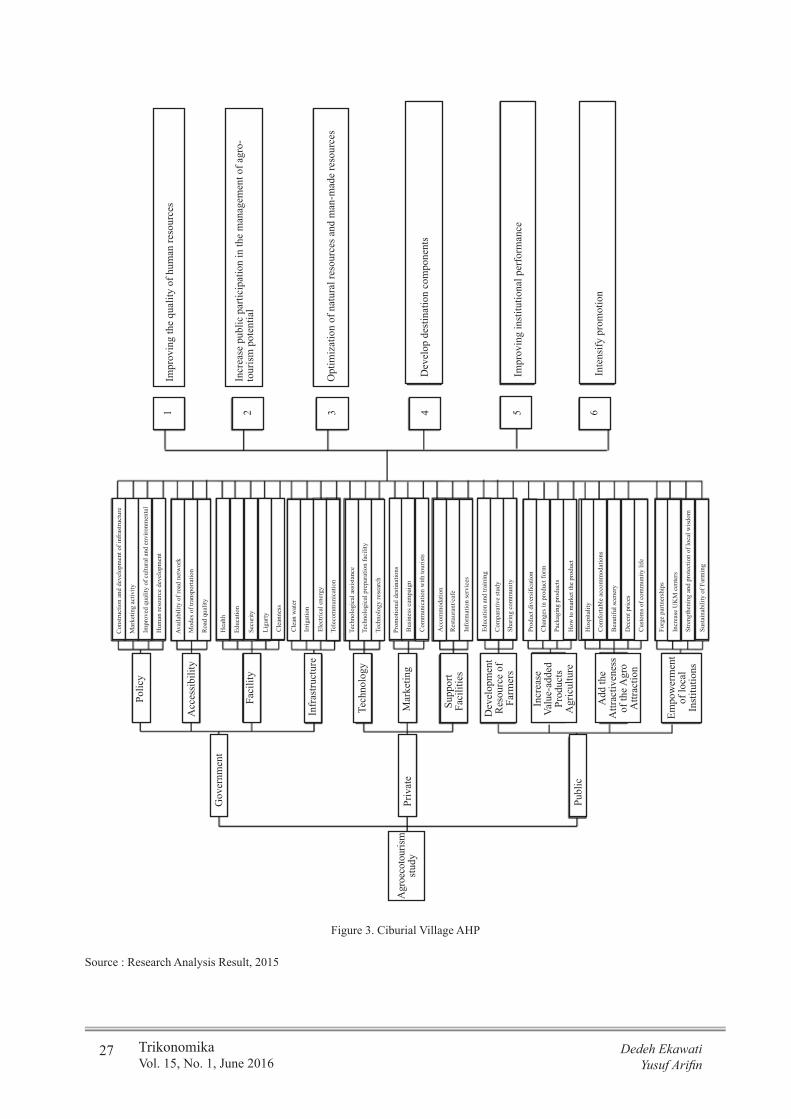
27 TrikonomikaVol. 15, No. 1, June 2016
Dedeh EkawatiYusuf Arifin
Figure 3. Ciburial Village AHP
Source : Research Analysis Result, 2015
Agr
oeco
tour
ism
stud
y
Gov
ernm
ent
Priv
ate
Publ
ic
Polic
y
Acc
essi
bilit
y
Faci
lity
Infr
astru
ctur
e
Tech
nolo
gy
Mar
ketin
g
Supp
ort
Faci
litie
s
Dev
elop
men
t R
esou
rce
of
Farm
ers
Incr
ease
Valu
e-ad
ded
Prod
ucts
Agr
icul
ture
Add
the
Attr
activ
enes
s of
the A
gro
Attr
actio
n
Empo
wer
men
t of
loca
l In
stitu
tions
Con
stru
ctio
n an
d de
velo
pmen
t of i
nfra
stru
ctur
e
Mar
ketin
g ac
tivity
Impr
oved
qua
lity
of c
ultu
ral a
nd e
nviro
nmen
tal
Avai
labi
lity
of ro
ad n
etw
ork
Hum
an re
sour
ce d
evel
opm
ent
Mod
es o
f tra
nspo
rtatio
n
Roa
d qu
ality
Hea
lth
Educ
atio
n
Secu
rity
Ligu
rty
Cle
anne
ss
Cle
an w
ater
Irrig
atio
n
Elec
trica
l ene
rgy
Tele
com
mun
icat
ion
Tech
nolo
gica
l ass
ista
nce
Tech
nolo
gica
l pre
para
tion
faci
lity
Tech
nolo
gy re
sear
ch
Prom
otio
nal d
estin
atio
ns
Bus
ines
s cam
paig
n
Com
mun
icat
ion
with
tour
ists
Acc
omm
odat
ion
Res
taur
ant/c
afe
Info
rmat
ion
serv
ices
Educ
atio
n an
d tra
inin
g
Com
para
tive
stud
y
Shar
ing
com
mun
ity
Prod
uct d
iver
sific
atio
n
Cha
nges
in p
rodu
ct fo
rm
Pack
agin
g pr
oduc
ts
How
to m
arke
t the
pro
duct
Hos
pita
lity
Com
forta
ble
acco
mm
odat
ions
Bea
utifu
l sce
nery
Dec
ent p
rices
Cus
tom
s of c
omm
unity
life
Forg
e pa
rtner
ship
s
Incr
ease
UK
M c
ente
rs
Stre
ngth
enin
g an
d pr
otec
tion
of lo
cal w
isdo
m
Sust
aina
bilit
y of
Far
min
g
1 2 3 4 5 6
Impr
ovin
g th
e qu
ality
of h
uman
reso
urce
s
Incr
ease
pub
lic p
artic
ipat
ion
in th
e m
anag
emen
t of a
gro-
tour
ism
pot
entia
l
Opt
imiz
atio
n of
nat
ural
reso
urce
s and
man
-mad
e re
sour
ces
Dev
elop
des
tinat
ion
com
pone
nts
Impr
ovin
g in
stitu
tiona
l per
form
ance
Inte
nsify
pro
mot
ion
28
TrikonomikaVolume 15, No. 1, June 2016, Page. 28-39ISSN 1411-514X (print) / ISSN 2355-7737 (online)
Tax Holiday and Investment in Indonesia
Rukmi Juwita [email protected]
Riani TanjungPoliteknik Pos Indonesia
Edwin KarimSTIE Gema Widya Bangsa
AbstractTax holiday is a facility given by the government to investors in Indonesia to attract foreign and local investors in Indonesia, especially in the industrial sector as well as to improve national economic growth. Purpose of this research is to analyze the tax holiday policy and how the impact on the investment in Indonesia. Data consists of primary and secondary data which are collected through interview, questionnaire and literature study. Respondents are Honam Petrochemical Corp, PT. Asahimas Chemical, PT. Nippon Shokubai, PT Petrokimia Butadiene Indonesia and PT. Ebel Industries. The results showed that all companies meet the criteria to obtain the facility of tax holiday. Giving tax holiday facility is very influential against the growth of industry in Indonesia especially for petrochemical industries that has an important role in the economic growth.
Keywords : Tax holiday, investment, petrochemical industries
INTRODUCTION
The vision of the national industry development as listed in the Peraturan Presiden Nomor 28 Tahun 2008 about National Industry Policy stated that Indonesia has become Strong Industrial Country on 2025, with the vision between on 2020 as a new advanced industrial country, because in accordance to the declaration of Bogor 1995 between the heads of the APEC countries on the year when liberalization in APEC countries should have been realized.
As a new advanced industrial country, Indonesian industry sector must be able to meet some basic criterias among others (www.kemenperin.go.id): 1) Obtaining the role and high contribution to the national economy, 2) Small and Medium Enterprises (SMEs) has the ability to balance with the large industries, 3) Obtaining a strong industry structure (a complete and detailed Industry Tree ), 4) Obtaining an advanced technology which has been at the forefront of the development and the creation of the market, 5) Obtaining a tough industry service supporting the international competitive power industry, 6) Obtaining the competitiveness which is able to deal with the full liberalisation with APEC countries.
It is expected that 2020, non-oil and gas industry contribution to the GDP will be able to reach 30%, where small industries (SI) plus medium industries (MI)
will contribute as well as or close to the large industries (LI) contribution. During the period of 2010 – 2020, industres must grow to the average of 9,43% with the growth of SI, MI, and LI each at least 10,00%, 17.47%, and 6,34%. (www.kemenperin.go.id)
To realize the targets, it is required structured and measured efforts which must be elaborated into a strategy map to accommodate the desire of stakeholders in the form of strategic outcomes consist of: 1) increasing added value of the industry, 2) increasing control of domestic and foreign market, 3) increasing stronger factors on supporting industry development, 4) increasing innovation capabilities and mastering technology industry which is energy efficient and environmental friendly, 5) increasing stronger and more complete industry structure, 6) increasing distribution of the industry development, and 7) increasing the role of small and medium industry against the GDP.
To achieve the targets above, it is needed to increase domestic or foreign investment. Foreign Investment is a capital investment activities to operate business in the territory of Republic of Indonesia that is done by foreign investors, both using foreign capital entirely or teaming up with investors (Anna & Suratman, 2009).
The terms of Capital Investment is regulated in the Undang-undang No. 25 tahun 2005 about foreign investments. Foreign Investments can be done by a
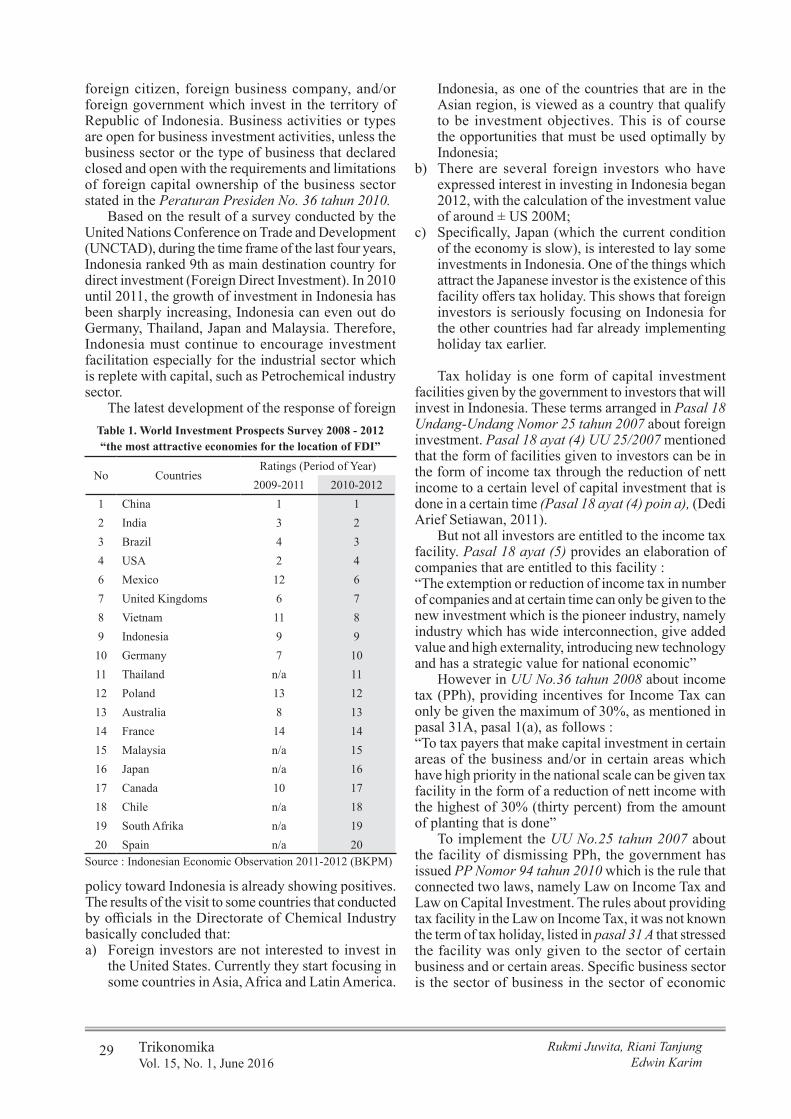
29 TrikonomikaVol. 15, No. 1, June 2016
Rukmi Juwita, Riani TanjungEdwin Karim
foreign citizen, foreign business company, and/or foreign government which invest in the territory of Republic of Indonesia. Business activities or types are open for business investment activities, unless the business sector or the type of business that declared closed and open with the requirements and limitations of foreign capital ownership of the business sector stated in the Peraturan Presiden No. 36 tahun 2010.
Based on the result of a survey conducted by the United Nations Conference on Trade and Development (UNCTAD), during the time frame of the last four years, Indonesia ranked 9th as main destination country for direct investment (Foreign Direct Investment). In 2010 until 2011, the growth of investment in Indonesia has been sharply increasing, Indonesia can even out do Germany, Thailand, Japan and Malaysia. Therefore, Indonesia must continue to encourage investment facilitation especially for the industrial sector which is replete with capital, such as Petrochemical industry sector.
The latest development of the response of foreign Table 1. World Investment Prospects Survey 2008 - 2012“the most attractive economies for the location of FDI”
No CountriesRatings (Period of Year)
2009-2011 2010-20121 China 1 12 India 3 23 Brazil 4 34 USA 2 46 Mexico 12 67 United Kingdoms 6 78 Vietnam 11 89 Indonesia 9 910 Germany 7 1011 Thailand n/a 1112 Poland 13 1213 Australia 8 1314 France 14 1415 Malaysia n/a 1516 Japan n/a 1617 Canada 10 1718 Chile n/a 1819 South Afrika n/a 1920 Spain n/a 20
Source : Indonesian Economic Observation 2011-2012 (BKPM)
policy toward Indonesia is already showing positives. The results of the visit to some countries that conducted by officials in the Directorate of Chemical Industry basically concluded that:a) Foreign investors are not interested to invest in
the United States. Currently they start focusing in some countries in Asia, Africa and Latin America.
Indonesia, as one of the countries that are in the Asian region, is viewed as a country that qualify to be investment objectives. This is of course the opportunities that must be used optimally by Indonesia;
b) There are several foreign investors who have expressed interest in investing in Indonesia began 2012, with the calculation of the investment value of around ± US 200M;
c) Specifically, Japan (which the current condition of the economy is slow), is interested to lay some investments in Indonesia. One of the things which attract the Japanese investor is the existence of this facility offers tax holiday. This shows that foreign investors is seriously focusing on Indonesia for the other countries had far already implementing holiday tax earlier.
Tax holiday is one form of capital investment facilities given by the government to investors that will invest in Indonesia. These terms arranged in Pasal 18 Undang-Undang Nomor 25 tahun 2007 about foreign investment. Pasal 18 ayat (4) UU 25/2007 mentioned that the form of facilities given to investors can be in the form of income tax through the reduction of nett income to a certain level of capital investment that is done in a certain time (Pasal 18 ayat (4) poin a), (Dedi Arief Setiawan, 2011).
But not all investors are entitled to the income tax facility. Pasal 18 ayat (5) provides an elaboration of companies that are entitled to this facility :“The extemption or reduction of income tax in number of companies and at certain time can only be given to the new investment which is the pioneer industry, namely industry which has wide interconnection, give added value and high externality, introducing new technology and has a strategic value for national economic”
However in UU No.36 tahun 2008 about income tax (PPh), providing incentives for Income Tax can only be given the maximum of 30%, as mentioned in pasal 31A, pasal 1(a), as follows :“To tax payers that make capital investment in certain areas of the business and/or in certain areas which have high priority in the national scale can be given tax facility in the form of a reduction of nett income with the highest of 30% (thirty percent) from the amount of planting that is done”
To implement the UU No.25 tahun 2007 about the facility of dismissing PPh, the government has issued PP Nomor 94 tahun 2010 which is the rule that connected two laws, namely Law on Income Tax and Law on Capital Investment. The rules about providing tax facility in the Law on Income Tax, it was not known the term of tax holiday, listed in pasal 31 A that stressed the facility was only given to the sector of certain business and or certain areas. Specific business sector is the sector of business in the sector of economic
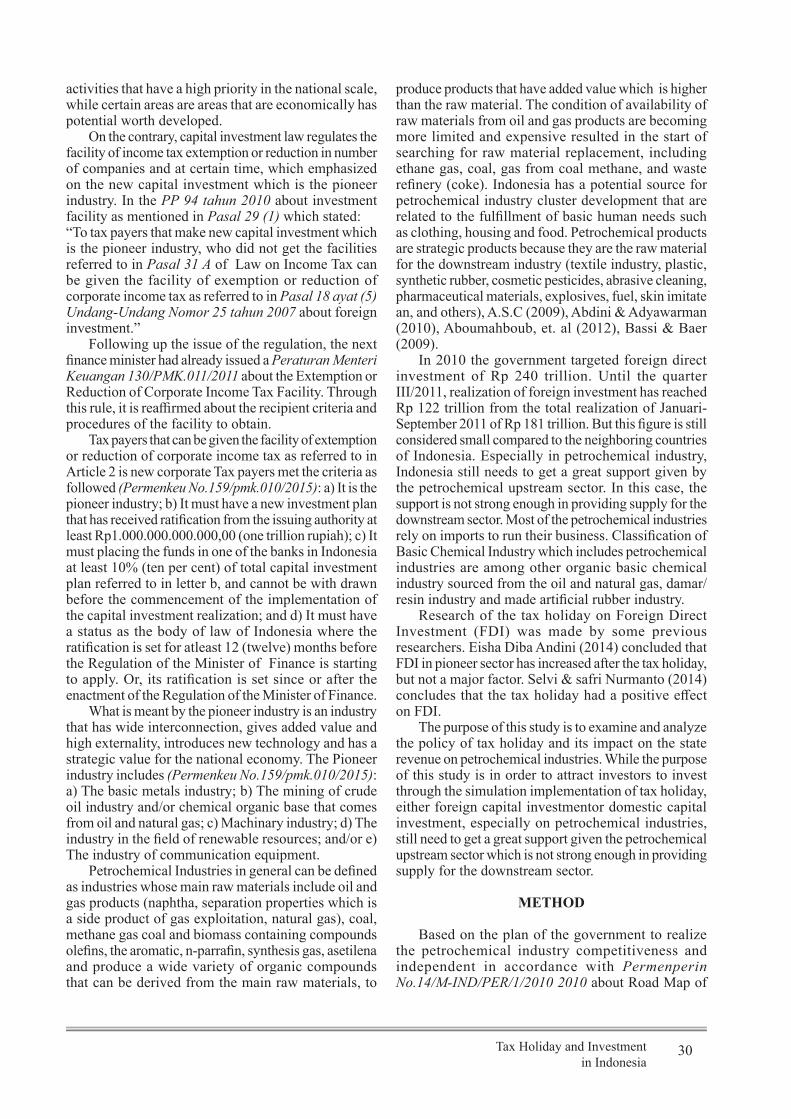
30Tax Holiday and Investmentin Indonesia
activities that have a high priority in the national scale, while certain areas are areas that are economically has potential worth developed.
On the contrary, capital investment law regulates the facility of income tax extemption or reduction in number of companies and at certain time, which emphasized on the new capital investment which is the pioneer industry. In the PP 94 tahun 2010 about investment facility as mentioned in Pasal 29 (1) which stated: “To tax payers that make new capital investment which is the pioneer industry, who did not get the facilities referred to in Pasal 31 A of Law on Income Tax can be given the facility of exemption or reduction of corporate income tax as referred to in Pasal 18 ayat (5) Undang-Undang Nomor 25 tahun 2007 about foreign investment.”
Following up the issue of the regulation, the next finance minister had already issued a Peraturan Menteri Keuangan 130/PMK.011/2011 about the Extemption or Reduction of Corporate Income Tax Facility. Through this rule, it is reaffirmed about the recipient criteria and procedures of the facility to obtain.
Tax payers that can be given the facility of extemption or reduction of corporate income tax as referred to in Article 2 is new corporate Tax payers met the criteria as followed (Permenkeu No.159/pmk.010/2015): a) It is the pioneer industry; b) It must have a new investment plan that has received ratification from the issuing authority at least Rp1.000.000.000.000,00 (one trillion rupiah); c) It must placing the funds in one of the banks in Indonesia at least 10% (ten per cent) of total capital investment plan referred to in letter b, and cannot be with drawn before the commencement of the implementation of the capital investment realization; and d) It must have a status as the body of law of Indonesia where the ratification is set for atleast 12 (twelve) months before the Regulation of the Minister of Finance is starting to apply. Or, its ratification is set since or after the enactment of the Regulation of the Minister of Finance.
What is meant by the pioneer industry is an industry that has wide interconnection, gives added value and high externality, introduces new technology and has a strategic value for the national economy. The Pioneer industry includes (Permenkeu No.159/pmk.010/2015): a) The basic metals industry; b) The mining of crude oil industry and/or chemical organic base that comes from oil and natural gas; c) Machinary industry; d) The industry in the field of renewable resources; and/or e) The industry of communication equipment.
Petrochemical Industries in general can be defined as industries whose main raw materials include oil and gas products (naphtha, separation properties which is a side product of gas exploitation, natural gas), coal, methane gas coal and biomass containing compounds olefins, the aromatic, n-parrafin, synthesis gas, asetilena and produce a wide variety of organic compounds that can be derived from the main raw materials, to
produce products that have added value which is higher than the raw material. The condition of availability of raw materials from oil and gas products are becoming more limited and expensive resulted in the start of searching for raw material replacement, including ethane gas, coal, gas from coal methane, and waste refinery (coke). Indonesia has a potential source for petrochemical industry cluster development that are related to the fulfillment of basic human needs such as clothing, housing and food. Petrochemical products are strategic products because they are the raw material for the downstream industry (textile industry, plastic, synthetic rubber, cosmetic pesticides, abrasive cleaning, pharmaceutical materials, explosives, fuel, skin imitate an, and others), A.S.C (2009), Abdini & Adyawarman (2010), Aboumahboub, et. al (2012), Bassi & Baer (2009).
In 2010 the government targeted foreign direct investment of Rp 240 trillion. Until the quarter III/2011, realization of foreign investment has reached Rp 122 trillion from the total realization of Januari-September 2011 of Rp 181 trillion. But this figure is still considered small compared to the neighboring countries of Indonesia. Especially in petrochemical industry, Indonesia still needs to get a great support given by the petrochemical upstream sector. In this case, the support is not strong enough in providing supply for the downstream sector. Most of the petrochemical industries rely on imports to run their business. Classification of Basic Chemical Industry which includes petrochemical industries are among other organic basic chemical industry sourced from the oil and natural gas, damar/resin industry and made artificial rubber industry.
Research of the tax holiday on Foreign Direct Investment (FDI) was made by some previous researchers. Eisha Diba Andini (2014) concluded that FDI in pioneer sector has increased after the tax holiday, but not a major factor. Selvi & safri Nurmanto (2014) concludes that the tax holiday had a positive effect on FDI.
The purpose of this study is to examine and analyze the policy of tax holiday and its impact on the state revenue on petrochemical industries. While the purpose of this study is in order to attract investors to invest through the simulation implementation of tax holiday, either foreign capital investmentor domestic capital investment, especially on petrochemical industries, still need to get a great support given the petrochemical upstream sector which is not strong enough in providing supply for the downstream sector.
METHOD
Based on the plan of the government to realize the petrochemical industry competitiveness and independent in accordance with Permenperin No.14/M-IND/PER/1/2010 2010 about Road Map of
31 TrikonomikaVol. 15, No. 1, June 2016
Rukmi Juwita, Riani TanjungEdwin Karim
No. of Respondents
Question score1 2 ... J ... P
1 X11 X12 ... X1j ... X1p2 X21 X22 ... X2j ... X2p... ... ... ... ... ... ...I Xi1 Xi2 ... Xij ... Xip... ... ... ... ... ... ...N Xn1 Xn2 ... Xnj ... Xnp
∑=
=n
iijj x
nx
1
1
∑∑= =
=n
i
p
jijx
npx
1 1
1
2. Calculation on the average score for each question with the formula:
Cluster Development of Petrochemical Industries, the government action is to create a policy that can support the plan by issuing the policy of tax holiday in accordance with Permenkeu No. 130/PMK.011/2011 about the Extemption or Reduction of Corporate Income Tax Facility. The types of data collected to analyzed consists of primary data and secondary data. Primary data obtained from the results of the interview comes directly with the respondents who use the questionnaires and make field observation. The source of secondary data obtained from the results of the library study, documentary review, Ministry, institutions, companies and agencies are related to each other.
Table 2. RespondentsNO Company1 Honam Petrochemical Corp.
• Sector: Petrochemical Industry• Status: Foreign Investment
2 PT. Asahimas Chemical • Sector: Inorganic Petrochemical Industry• Status: Foreign Investment
3 PT. Nippon Shokubai• Sector: Chemical Industry• Status: PMA
4 PT. PetrokimiaButadiene Indonesia • Sector: Petrochemical Industry• Status: PMA
5 PT. Ebel Industries• Sector: Anodizing Industry• Status: PMA
Towards respondents’ answers,data regarding expectations on tax holiday are processed as followed:
1. The data tabulation (score) of respondents’ answers
3. Count on the average overall score with the formula:
4. Count on the percentage of the average scores of each question and the overall average on maximum score (5). This percentage value can be made by the size of the importance level (hope) against each question and of the entire;
5. Do the interpretation or analysis or discussion of the information.
RESULT
Respondents are 5 petrochemical industries in Indonesia, are presented on Table 2.
Metode
Pengumpulan Data
Data Primer
Data Sekunder
SurveyInterviewObservasi
Picture 2.1. Data Collection Method illustration Figure 1. Data Collection Method Illustration
Data Collection Method
Observation Interview Survey
PrimaryData
SecondaryData
Tax holiday is one of the forms of capital investment facilities given by the government to investors that will invest in Indonesia. These terms arranged in Undang-Undang Nomor 25 Tahun 2007 about foreign investments. Pasal 18 ayat (4) poin a) mentioned that the form of facility given to investors can be:“Income tax through the reduction of nett income until a certain level of capital investment that is done in a certain time (Pasal 18 ayat (4) poin a)”.
But not all investors are entitled to the income tax facility. Pasal 18 ayat (5) provides an elaboration of companies entitled to this facility: “Income tax extemption or reduction in number of companies and at certain time can only be given to the new investment which is an pioneer industry, namely industry which has wide interconnection, has added value and high externality, introduces new technology and has a strategic value for national economic”
However, in UU No.36 Tahun 2008 about income tax (PPh), providing incentives for Income Tax can only be given at the maximum of 30%, as mentioned in pasal 31A, pasal 1(a), as followed: “To Tax payers that make capital investment in certain areas of business and/or in certain areas which have high priority in the national scale can be given tax facility in the form of a reduction of income neto most high 30% (thirty percent) from the amount of planting is done”
To implement UU No.25 tahun 2007 about the facility of dismissing PPh, the government has issued PP Nomor 94 Tahun 2010 which rules two laws, namely Law on Income Tax and Law on Capital Investment. The rules about providing tax facility in the Law on Income Tax is not known as tax holiday, listed in pasal 31 A
32Tax Holiday and Investmentin Indonesia
that stressed the facility was only given to the field of certain business and or certain areas. Specific business field is the field of business in the sector of economic activities that has a high priority in the national scale, while certain areas are areas that are economically has potential worth developed.
On the contrary, Capital Investment Law has a regulation on the facility of income tax extemption or reductionin number of companies and at certain time, emphasizing on the new capital investment which is the pioneer industry. In the PP 94 Tahun 2010, it stated about the investment facility as mentioned in Pasal 29 (1): “To Tax payers making new capital investment which is the pioneer industry who did not get the facility referred to in Pasal 31A of Law on Income Tax, it can be given the facilityof extemption or reduction of corporate income tax as referred to in Pasal 18 ayat (5) Undang-Undang Nomor 25 Tahun 2007 about foreign investments.”
Following up the issuance of the regulation, the next finance minister has already issued a Peraturan Menteri Keuangan130/PMK.011/2011 about the Extemption or Reduction of Corporate Income Tax Facility. Through this rule, it is reaffirmed about the recipient criteria and procedures of the facility to obtain. Form of exemption or reduction of corporate income tax provided for in Pasal 2, as followed:a. Corporate Income Tax Exemption referred to in
paragraph (1) may be granted for a maximum period of 10 (ten) years of tax and at least 5 (five) years of tax, starting from the tax year of commercial production.
b. After the expiration of the provision of the Corporate Income Tax exemption facility referred to in paragraph (2), the tax payer is given the reduction of corporate income tax as referred to in paragraph (1) by 50% (fifty percent) of the Income Tax payable for 2 (two) tax year.
Tax payers that can be given the facility of exemption or reduction of corporate income tax as referred to in Pasal 2 is new corporate Taxpayers met the criteria as followed:a. It is the pioneer industry;b. It must have a new investment plan that has received
ratification from the issuing authority at least Rp1.000.000.000.000,00 (one trillion rupiah);
c. It must place the funds in one of banks in Indonesia at least 10% (ten per cent) of total capital investment plan referred to in letter b, and cannot be with drawn before the commencement of the implementation of the capital investment realization; and
d. It must have a status as the body of law of Indonesia where the ratification is set for atleast 12 (twelve) months before the Regulation of the Minister of Finance is starting to apply. Or, its ratification
was already set since or after the enactment of the Regulation of the Minister of Finance.
What is meant by the pioneer industry is an industry that has already had wide interconnection, has given added value and high externality, has introduced new technology and has already had a strategic value for the national economy. The Industry Pioneer includes:a. The basic metals industry;b. The mining of crude oil industry and/or chemical
organic base that comes from oil and natural gas;c. Machinary industry;d. The industry in the field of renewable resources;
and/ore. The industry in communication equipment
The facility of extemption or reduction of corporate income tax can be used by Tax payers throughout these following requirements:a. It has already set the entire planting invest; andb. It has already been producing commercially (when
the commencement of commercial production is specified by the Director General of Taxation, which the procedureis arranged by the Regulation of the Director General of Taxation).
To obtain the exemption or reduction of corporate income tax facility, tax payers delivers the petition to the Minister of Industry or the head of the Capital Investment Coordinating Board. As a technical guide to obtain the exemption or reduction of corporate income tax facility, Minister of Industry and the Head of the Capital Investment Coordinating Board has each issued a regulation as followed:a. The Regulation of Head of the Capital Investment
Coordinating Board of the Republic of Indonesia Number 12 Year 2011 about Guidelines and Procedures for the Submission of Application for Exemption or Reduction of Corporate Income Tax Facility;
b. The Regulation of the Minister of Industry of the Republic of Indonesia Number 93/M-IND/PER/11/2011 on Guidelines and Procedures for the Submission of Application for Exemption or Reduction of Corporate Income Tax Facility in the Industrial Sector.
The tax exemption or relief is a break-through methods for foreign investors to invest in the real sector. With this facility, the government has been trying to catch the flow of foreign capital to be a direct investment. The decision of the government launching tax holiday seems to get momentum at a time when the economic condition in Europe and the United States are indefensible. Prospective investors are expected to move the funds to a potential market, especially in developing countries.
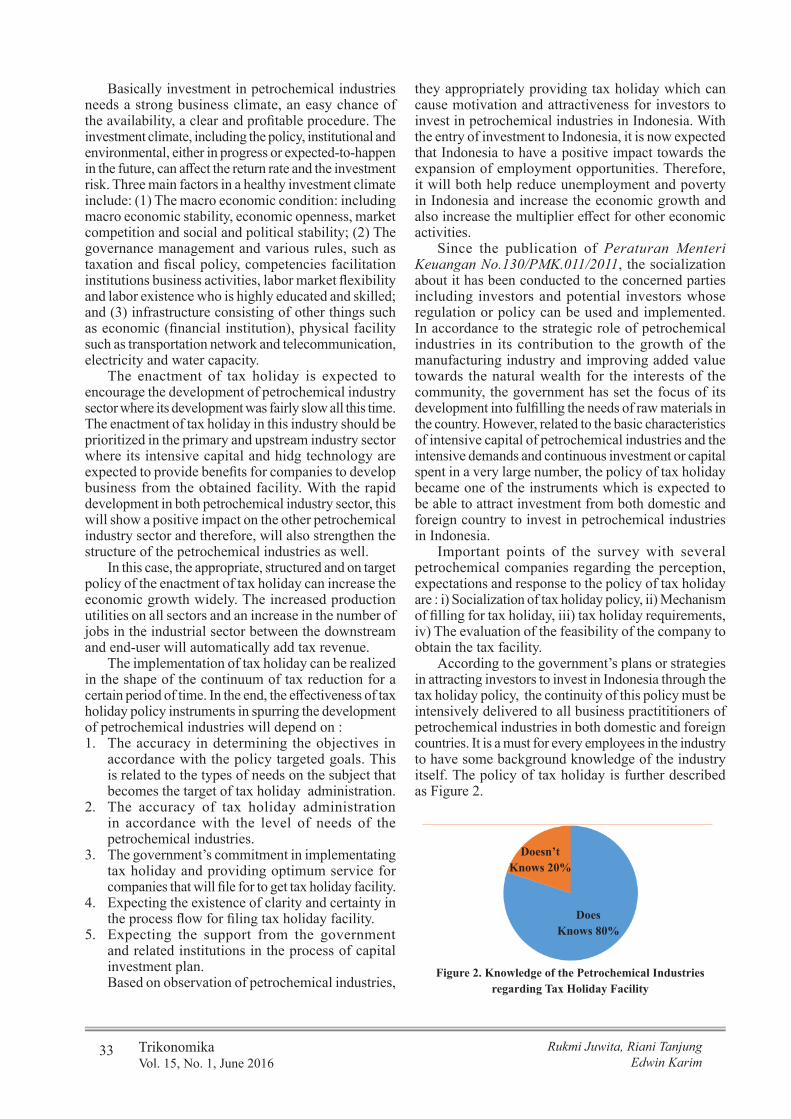
33 TrikonomikaVol. 15, No. 1, June 2016
Rukmi Juwita, Riani TanjungEdwin Karim
Basically investment in petrochemical industries needs a strong business climate, an easy chance of the availability, a clear and profitable procedure. The investment climate, including the policy, institutional and environmental, either in progress or expected-to-happen in the future, can affect the return rate and the investment risk. Three main factors in a healthy investment climate include: (1) The macro economic condition: including macro economic stability, economic openness, market competition and social and political stability; (2) The governance management and various rules, such as taxation and fiscal policy, competencies facilitation institutions business activities, labor market flexibility and labor existence who is highly educated and skilled; and (3) infrastructure consisting of other things such as economic (financial institution), physical facility such as transportation network and telecommunication, electricity and water capacity.
The enactment of tax holiday is expected to encourage the development of petrochemical industry sector where its development was fairly slow all this time. The enactment of tax holiday in this industry should be prioritized in the primary and upstream industry sector where its intensive capital and hidg technology are expected to provide benefits for companies to develop business from the obtained facility. With the rapid development in both petrochemical industry sector, this will show a positive impact on the other petrochemical industry sector and therefore, will also strengthen the structure of the petrochemical industries as well.
In this case, the appropriate, structured and on target policy of the enactment of tax holiday can increase the economic growth widely. The increased production utilities on all sectors and an increase in the number of jobs in the industrial sector between the downstream and end-user will automatically add tax revenue.
The implementation of tax holiday can be realized in the shape of the continuum of tax reduction for a certain period of time. In the end, the effectiveness of tax holiday policy instruments in spurring the development of petrochemical industries will depend on : 1. The accuracy in determining the objectives in
accordance with the policy targeted goals. This is related to the types of needs on the subject that becomes the target of tax holiday administration.
2. The accuracy of tax holiday administration in accordance with the level of needs of the petrochemical industries.
3. The government’s commitment in implementating tax holiday and providing optimum service for companies that will file for to get tax holiday facility.
4. Expecting the existence of clarity and certainty in the process flow for filing tax holiday facility.
5. Expecting the support from the government and related institutions in the process of capital investment plan.Based on observation of petrochemical industries,
they appropriately providing tax holiday which can cause motivation and attractiveness for investors to invest in petrochemical industries in Indonesia. With the entry of investment to Indonesia, it is now expected that Indonesia to have a positive impact towards the expansion of employment opportunities. Therefore, it will both help reduce unemployment and poverty in Indonesia and increase the economic growth and also increase the multiplier effect for other economic activities.
Since the publication of Peraturan Menteri Keuangan No.130/PMK.011/2011, the socialization about it has been conducted to the concerned parties including investors and potential investors whose regulation or policy can be used and implemented.In accordance to the strategic role of petrochemical industries in its contribution to the growth of the manufacturing industry and improving added value towards the natural wealth for the interests of the community, the government has set the focus of its development into fulfilling the needs of raw materials in the country. However, related to the basic characteristics of intensive capital of petrochemical industries and the intensive demands and continuous investment or capital spent in a very large number, the policy of tax holiday became one of the instruments which is expected to be able to attract investment from both domestic and foreign country to invest in petrochemical industries in Indonesia.
Important points of the survey with several petrochemical companies regarding the perception, expectations and response to the policy of tax holiday are : i) Socialization of tax holiday policy, ii) Mechanism of filling for tax holiday, iii) tax holiday requirements, iv) The evaluation of the feasibility of the company to obtain the tax facility.
According to the government’s plans or strategies in attracting investors to invest in Indonesia through the tax holiday policy, the continuity of this policy must be intensively delivered to all business practititioners of petrochemical industries in both domestic and foreign countries. It is a must for every employees in the industry to have some background knowledge of the industry itself. The policy of tax holiday is further described as Figure 2.
Figure 2. Knowledge of the Petrochemical Industriesregarding Tax Holiday Facility
Doesn’tKnows 20%
DoesKnows 80%
34Tax Holiday and Investmentin Indonesia
Based on the data in Figure 2, about 80% of the respondents were aware of the existence of the enactment of the tax holiday facility policy in Indonesia, but there is still a 20% of respondents who did not know of the existence of the policy. The level of respondents’expectancy towards the socialization of this policy illustrates the need for more intensive efforts from the government in delivering the policy information. Therefore, the information/socialization can be fully received by businessmen/women in the petrochemical industries.
They also respond to the explanation and reply that the government will be able to provide a clear definition that this policy information can be easily understood and understood.
The socialization of a policy including the policy of tax holiday is the first step that must be done by stakeholders. Socialization is intended to convey the full information about a policy that has been made to the targets, therefore the policy will be noticed, understood and implemented at the same time.
Socialization needs to be done intensively and repeatedly. It will be shown until there is an adoption process, or until there is process of acceptance and behavior changes of the target,either in the form of knowledge (cognitively intact), attitude (affective), or individual skills (psychomotoric) after knowing and receiving “the policy” conveyed by the government. Here, acceptance does not only about “knowing” and “noticing”, but also about “applying” and “appreciating” it in supporting supporting the business. Acceptance usually can be directly or indirectly observed by the others, as a reflection of the existence of the changes: attitudes, knowledge and/ or skills.
Basically, the process of policy acceptance will be implemented through some stages before the perpetrators of the petrochemical industries are willing to receive/apply it based on its confidence on doing these stages. However, the time lapse between stage one to another is not always the same: depending on the nature of policy, target characteristics, environmental state, and activities carried out by the officers who have been doing the socialization. These stages are further explained as followed:1) Awareness: the perpetrators of the petrochemical
industries start to notice that there is a policy offered by the government of Indonesia.
2) Interest: the growing interest often marked as a desire to ask or to know more/far about all things related to the policy of the Government of Indonesia.
3) Evalution or assessment of good/bad benefits of the policies that have been fully known to the information. In this assessment, the industry employess are assesing not only the technical aspects, but also the economic, social, cultural aspects, or even more political aspect or global policy.
4) Trial to calculate the advantages and benefits for more conclusive assessment, before they propose to apply to obtain tax holiday facility.
5) Adoption or receivement/ appliant based on their own assessment and calculation.The success of socialization that has been done can
be easily seen and measured based on some standards. By applying the study of communication, it can be seen that the target has already given a response to a form of behaviour changes. On the other hand, oppositely, by using the study of science, policy acceptance can be seen from the behaviour and attitude change, knowledge and skills observed directly or indirectly. Dusseldorf stated that the measurment of acceptance level of sosialization results is able to be viewed by the levels of participation indicated by the target. In conducting these socializations, some requirements are needed in order to obtain the effective and efficient communication. The communication process is determined by four elements consisting of: source, message, channels, and its recipients. In the opposite side, socialization process is determined by qualitiy, policy attribution, communication channels, target characteristics which include social-economic status, and their perception on the executive officer as well as activities of industry development programs in general.
The stimulus response theory proposed the acceptiance process of policy which is a form of response to the stimuli received depends on the benefits or reward as expected before, while the speed and its amount of respons depend on: a) The large or the number of benefits; the larger or
the more benefits accepted, the faster and more positive the response will be
b) The speed of time; the more benefits and responses received, the faster arrival of the benefits will be. The faster and more positive the response will be.
c) The frequency of the acceptance of the benefits; the more often the benefits accepted, the faster and more positivethe response will be
d) The amount of energy spent; many sacrifices spent (time, energy, money, etc), the slower and more negative the response will be.Based on definitions above, it can further show and
explain some fundamental ideas about the socialization of tax holiday policy, as followed:1) The socialization process requires the process of
communication continuously to introduce, explain, educate and help the perpetrators of the industry. It is needed in order to make them know, will, and be able to take advantage of the tax holiday facility.
2) The socialization process is a process to influence the target in the process of decision making. Which is sustainable and hardworking. These are needed in order to make them notice, receive, understand, ponder, and utilize tax holiday facility.
3) The socialization process of policy requires enough

35 TrikonomikaVol. 15, No. 1, June 2016
Rukmi Juwita, Riani TanjungEdwin Karim
preparation either from the party which distributes the socialization (appliance, ingredients, Media etc) or from the target. Therefore, the socialization process will be effectively and efficiently running. The Mechanism of Filing for tax holiday. Through
both rules, it is set about the procedures for filing the extemption or reduction of corporate income tax facility and also the evaluation of the facility that has been given. Steps in applying for tax holiday are as followed:1. The Applicant (the Company) filed a form request
of document applicationof exemption or reduction of Corporate Income Tax facility to the Minister of Industry. Each documents must be copied, sent to the Director General of Industrial Supervision through the Secretariat Team of Director General of Industrial Supervision. The copies must include:
a. Copy of the Tax Registration Number Card;b. New Capital Investment Approval Letter issued by
the Head of the Capital Investment Coordinating Board, equipped with details;
c. Statement of Capability to pay the tuition for placing the funds in one of banks in Indonesia when the requestis approved by the Minister of Finance;
d. The legalized document of Corporate Law Firm from the Ministry of Law and Human Rights;
e. Statement of the terms of Tax Sparing from the original country where the company reside, equipped with supporting documents,
f. The form filled with explanation of research must include:
i. Information on the availability of infrastructure in investment locations;
ii. Employment of domestic labor;iii. The study of the fulfillment of the criteria
as a Pioneer Industry; andiv. Stage planfor technology transfer
2. After the application document has been filed up, Minister of Industry commissioned the documents to the General Director of Industrial Supervision and send them to the team to verify and review the application documents.
3. The Aplicant (the Company) needs to do a presentation to the team, with the complete application documents. If there are some missing documents/ data, they still have 7 working-day to complete the details. All documents must be submitted to the Minister of Industry.
4. The results of the document verification and examination from the applicant must be further submitted to the Director General of Industrial Supervision and sent them to the Minister of Industry.
5. Based on the results of the verification and review, Minister of Industry commissioned Head of BPKIMI to coordinate with the Capital Investment Coordinating Board (BKPM) and related institutions (by no later than 3 working days) and convey the
results in a format of proposal. The result of the study must also be submitted to the Minister of Industry at least in 1 working day.
6. The Minister of Industry will give some decisions about the proposal and the result of requested study. If it is approved, the Minister of Industry commissioned Head of BPKIMI to prepare the proposed request of the exemption or reduction of Corporate Income Tax to the Minister of Finance, by no longer than 1 working day.
If it is approved, the Minister of Industry commissioned Head of BPKIMI to prepare the proposed request of the exemption or reduction of Corporate Income Tax to the Minister of Finance, by no longer than 1 working day; If it is rejected, the Minister of Industry commissioned Head of BPKIMI to prepare the detailed written notification of the rejection to the Applicant at the latest 1 working day.
The mechanism and the process flow for filing request of tax holiday can be seen in the Figure 3 (appendix). In the process of filing tax holiday, stages of time and the process flow are still not clear and definite, therefore the impact will also be less good to all employees of this industry.
Information about the mechanism of tax holiday proposition have not been completely heard and understood by respondents. By 20% of respondents does not really know how the procedures and process flow for filing this policy. The major expectation of respondents is clarity and certainty on the mechanism of tax holiday proposition, therefore there will be no doubt for prospective investors to apply this facility. Data statistics of the survey results on mechanism of tax holiday proposition can be seen in the Figure 4.
There is a notion of industrial businessmen that the government still doubts in establising this policy, so that
Figure 4. Percentage of respondents knowing the mechanism proposed tax holiday
Doesn’tKnows 20%
DoesKnows 80%
the mechanism proposal is not appropriate and seems to have obstacles. Responding to this, governments should act more decisively, open and transparent to potential investors in every stage of the process of filing tax holiday facility . Broadly speaking, the implementation of the mechanism of tax holiday proposition still must be delivered clearly, definitely and transparently to the business players of petrochemical industries, in

36Tax Holiday and Investmentin Indonesia
accordance with the stages of the process and the time that has been determined.
The Requirements of tax holiday. The determination of tax holiday policy requirements is an important factor
interconnection, has given added value and high externality, has introduced new technology and has applied a strategic value for the national economy. Some respondents still have not fully understood how the pioneer industry that referred to by the government, so that they are still reluctant to apply this facility. In the petrochemical industries, it appears to be the government prioritizing on the upstream industry sector, such as industry of ethylene, propylene, butadiene, benzene & paraxylene that integrates with naphtha crackers. The determination of the industry priority has made and disappointed a number of companies in other petrochemical industries. This will increase a new hope that the government could expand the industry sector farther.
2. The Legal Entity Status after August 15, 2010, this requirement is a constraint requirement for a number of companies of petrochemical industry in Indonesia. The government also appear to be prioritizing the new investors more than the old companies which want to develop the business. In accordance to the strategy and government’s policy, a new investment is expected to be a joint partnership between foreign companies and local companies.
3. The Investment plan at least Rp 1 trillion, Based on the priority of petrochemical industries upstream with the intensive capital, the large investment can be concluded as worth and fair. However, a number of the opinion conclude that the large investment will make it harder for local companies to apply for this facility. According to their reconsideration,the determination of the minimal value scale of this investment can truly given the impact for the industry that are worthy to obtain this facility, which in the end will be useful also for the government.
4. Tax Sparing agreement with Indonesia. This appears to be also difficult requirements to fulfill by several companies asking for facility of tax holiday. According to some potential investors, based on the information from the Indonesian Embassy in some countries, many countries do not have Tax sparing agreement with Indonesia. Tax sparing is the recognition of the facility of
45%
40%
35%
30%
25%
20%
15%
10%
5%
0%Very
UnimportantUnimportant Quite Important Very
Important
Figure 5. Level of Respondents’ Expectation towards the Clarity and Certainty of the Mechanism of tax holiday Application
Figure 6. Percentage of Number of Respondents who know the Requirements for filing tax holiday
Doesn’tKnows 20%
DoesKnows 80%
Table 3. Difficulty Level of the Requirements of tax holiday
No MeaningScore
Interval
Answer Score
PercentageAverage
ScoreMeaning
1Very difficult
met1.00 - 1.80 20%
2.45Difficult to Fulfill
2 Difficult met 1.81 - 2.60 20%
3 Enough 2,61 - 3.40 40%
4 Easy met 3.41 - 4,20 20%
5Very easy to
met4.21 - 5.00 0%
in improving competitiveness for the potential investors to invest in Indonesia. The easier the requirements submitted by the government, the higher the interest will be, and vise versa. The government must also be completely accurate in determining who is eligible for this facility therefore the benefits can be obtained by both parties and in accordance to the expected goals.
Information regarding the requirements for filing for tax holiday should be presented clearly and focused, therefore it can be easily understood by businessmen of petrochemical industries. Illustration of the facility providing to certain sectors of the industry should at least be clear and focused. It should also provide strong reasons and be easy to understand in order to avoid gaps to other industries.
Data statistics of the survey results regarding to the requirements of tax holiday Figure 6.
Along with less intensive socialization of the tax holiday policy distributed to businessmen of
petrochemical industries, it make them fully understand the terms given in proposing the facility of tax holiday.
Expectations and response to the requirements of filing the facility of tax holiday from some of the respondents are as followed :1. The pioneer industry is an industry that has wide
37 TrikonomikaVol. 15, No. 1, June 2016
Rukmi Juwita, Riani TanjungEdwin Karim
exemption and reduction of corporate income tax from the Indonesian government located in the domicile country of the tax insentive receiver. And thus the inclusion of tax sparing agreement should be reconsidered for specific cases.Apart from the above requirements, a number
of potential investors also said that the provision of infrastructure and utilities charged to them would be a burden in the stage of project development. The value of their investment feasibility with the burden become a problem for them, especially new potential investor who would build a plant in the upstream sector. According to them, the availability of infrastructure and utilities is one of the attractiveness of investment in a country, so that the provision of infrastructure and utility should be supported by the local state government.
The opinions and suggestions from the perpetrators of the petrochemical industries regarding the holiday taxare as followed:1. The criteria of the type of product/industry that
needs to be expanded,2. The certainty will get holiday tax be known before
the investment started; and when the document is complete and correct to SKMK for tax holiday to be immediately published;
3. Considering the same policies in other countries, itis advised that the type of industry and the provisions regarding to the establishment of company needs to be broaden and expanded.
4. The tax holiday Facility should be given not only to the new company, but also to the companies that already exists to do business expansion;
5. Socialization of tax holiday explained to businessmen is less sufficient so there are many companies that did not know the indepth technical assistance;
6. The requirements of the Tax Sparing is to be eliminated, because based on the information at the Indonesian Embassy in some countries, many countries do not have the Tax Sparing agreement with Indonesia;
7. The government should have the same perception about understanding the capital investment, because the criteria for investment between the Directorate General of Taxation and the BKPM is different with each other (Fixed Capital and Working Capital);
8. The bureaucracy should not be convoluted;9. Speed up the legal protection and validation for
those who already fulfilled a completed and correct document.
The Evaluation of the Feasibility of the Company to obtain the tax holiday fasility. There are five sectors that are considered important to be developed in Indonesia. These are also ensured to obtain the exemption of taxes or special tax incentives previously mentioned above. Potential investors who deserve special facility are those who intends to invest in large number and absorb
manpower significantly. The five sectors are the basic metal industry, the mining of oil and/or chemical organic base-industry that comes from oil and natural gas; renewable resources industry, machinery industry and telecommunications industry. It is the capital investment that will be prioritized to obtain the tax holiday facility .
Based on the terms or criteria that must be met by companies that deserve the tax holiday facility, there should be some criterias determined on how to get the tax holiday facility, as followed:A. Main Conditions
1. The industry is a high priority in the national scale.
2. The status of the legal entity in Indonesia that was approved after August 15, 2010.
3. The status of ownership of a minimum investment value of Rp 1.000.000.000.000,00 (one trillion rupiah).
4. Period of Foreign Investor to invest Tax Sparing agreement with Indonesia.
B. Supporting requirementsFor supporting conditions, one of these following
requirements should be fulfilled, namely:1. The location of the factory that will be built
already have the infrastructure (road, energy, water, ports, and others);
2. Labor that will be used in the investment phase is derived from Indonesian citizens (Indonesian native);
3. Product that will be produced is a product of the upstream of petrochemical industry;
4. Raw materials that will be used is derived from the local communities (Indonesia);
5. The domestic market become the target of marketing product that will be produced;
6. The technology that will be used is new technology;
7. The using of capital goods or machine or equipment are produced in the lands of Indonesia;
8. The company will partner with micro, small, medium businesses or co-operatives;
9. The company will conduct research, development and innovation.
Based on the Regulation of the Minister of Finance No.130/PMK.011/2011 and the Regulation of the Minister of Industry No.93/M-IND/PER/11/2011, companies that deserve the tax holiday Facility is the company that meets both all the main requirements and at least one of the various supporting requirements as added value for potential investors in proposing.
Based on the criteria of the requirements of filing the facility of tax holiday and the analysis results, the determination has been successfully done by obtaining this facility. The other conclusion is that PT Honam Petrochemical Corp and PT Petrokimia Butadiene
38Tax Holiday and Investmentin Indonesia
Indonesia are considered worthy to obtain the tax holiday facility.
CONCLUSION
Based on the results of research, it showed that petrochemical industries have already met the requirements set out to obtain the tax holiday facility given by the government of Indonesia. The giving of holiday tax facility to petrochemical industries is because this industry is the upstream industry which have high priority and national scale which is able to absorb manpower in large number.
The dissemination of granting the tax holiday required by other industries due to government’s role did not maximize many high-priority industries who do not know in detail about the facility. The number of large industries who want to invest in Indonesia is looking forward to the tax holiday. The entry of holiday tax will have a direct impact on the growth of investment and industry in Indonesia.
REFERENCES
Anna Rokmatussah Dyah & Suratman. 2009. Hukum Investasi dan Pasar Modal, Sinar Grafika, Jakarta.
Ã, S. C. 2009. State renewable energy electricity policies : An empirical evaluation of effectiveness (. Energy Policy, 37, 3071-3081.
Abdini, C., & Adyawarman. 2010. Perubahan Iklim dan Paradigma Ekonomi Hijau. Retrieved from http://www.setneg.go.id/index.php?option=com_content&task=view&id=5030&Itemid=29
Aboumahboub, T., Schaber, K., Wagner, U, & Hamacher, T. 2012. On the CO 2 emissions of the global electricity supply sector and the influence of renewable power of modeling and optimization. Energy Policy, 42, 297-314.
Bassi, A. M., & Baer, A. E. 2009. According Quantifying crosssectoral of investments in climate change mitigation in Ecuador. Energy for Sustainable Development, 13, 116-123. BPS. 2011. Economic growth in Indonesia. Jakarta: The Central Bureau
of Statistics.Dedi Arief Setiawan. 2011. Penentuan Harga Transfer
atas Transaksi Internasional dari Perspektif Perpajakan Indonesia. Media Riset Akuntansi, Audit dan Informasi. Vol.1 No.1 April.
Eisha Diba Andini. 2014. Analisis Tax Holiday untuk menarik Foreign Direct Investment di Indonesia. Jurnal Ilmiah Universitas Bakri, Vol.2 No.4
Indonesia Economic Observation 2011-2012 (BKPM).Ministry of Finance, its ties General of taxs of Republic
Indonesia (Jakarta, various documents). Available via the Internet: http://www.pajak.go.id/eng/.
Peraturan Menteri Keuangan No. 130/PMK.011/2011 tentang pemberian fasilitas pembebasan atau pengurangan pajak penghasilan badan.
Permenkeu No. 159/PMK.010/2015 tentang pemberian pengurangan pajak penghasilan badan.
Peraturan Menteri Perindustrian No.93/M_Ind/PER/11/2011 tentang pedoman dan tata cara pengajuan permohonan fasilitas pembebasan atau pengurangan pajak penghasilan badan disektor industri.
Peraturan Presiden No.36 tahun 2010 tentang daftar bidang usaha yang tertutup dan bidang usaha yang terbuka dengan persyaratan di bidang penanaman modal.
Peraturan Presiden No. 94 tahun 2010 tentang penghitungan penghasilan kena pajak dan pelunasan pajak penghasilan dalam tahun berjalan.
Selvi & Safri Nurmanto. 2014. Pengaruh Tax Holiday terhadap Foreign Direct Investment di Indonesia tahun 2009-2012. Jurnal Transparansi PPIA STIAMI Vol.1 No.1 Maret.
UU No.25 Tahun 2007 tentang Pemberian Fasilitas Pembebasan PPh. Jakarta.
UU No. 25 Tahun 2005 tentang Penanaman Modal AsingUU No.36 Tahun 2008 tentang perubahan keempat
atas undang undang nomor 7 tahun 1983 tentang pajak penghasilan
UU No. 7 Tahun 1983 tentang pajak penghasilanwww.kemenperin.go.id

39 TrikonomikaVol. 15, No. 1, June 2016
Rukmi Juwita, Riani TanjungEdwin Karim
APPENDIX
TAXPAYER MINISTRY OF INDUSTRY OR HEAD OF BPKPM
MINISTRY OF FINANCE
VERIFICATION COMITTEE
Submit FacilityRequest
FacilityRequest
• Facility Request• Study Result
• Facility Request• Study Result
• Is a pioneer industry.• Have received approval of
capital investment.• Have placed 10% fund
of the investment plan in Indonesia banking.
1. Performing studies on:a. Infrastructure availability;b. Domestic employment;c. Pioneer industry criteria
fulfillment;d. Technology transfer plan;e. Tax sparing fulfillment in
domicile country.2. Coordinating with related
Minstry.
Commissioned Verification Committee to perform
verification and examination, as weel as study on
Taxpayer’s strategic impact on nasional economic.
1. Perform verification and examination, and strategic impact study
2. Consultating with Minstry of Economic Affairs
3. Make recommendation
Ministry Of Finance Decree
Fulfillment of Criteria
Yes
NoLetter of Notification
Ministry Of Finance Decree
Figure 3. The Mechanism and Process Flow for Tax Holiday Request Filing
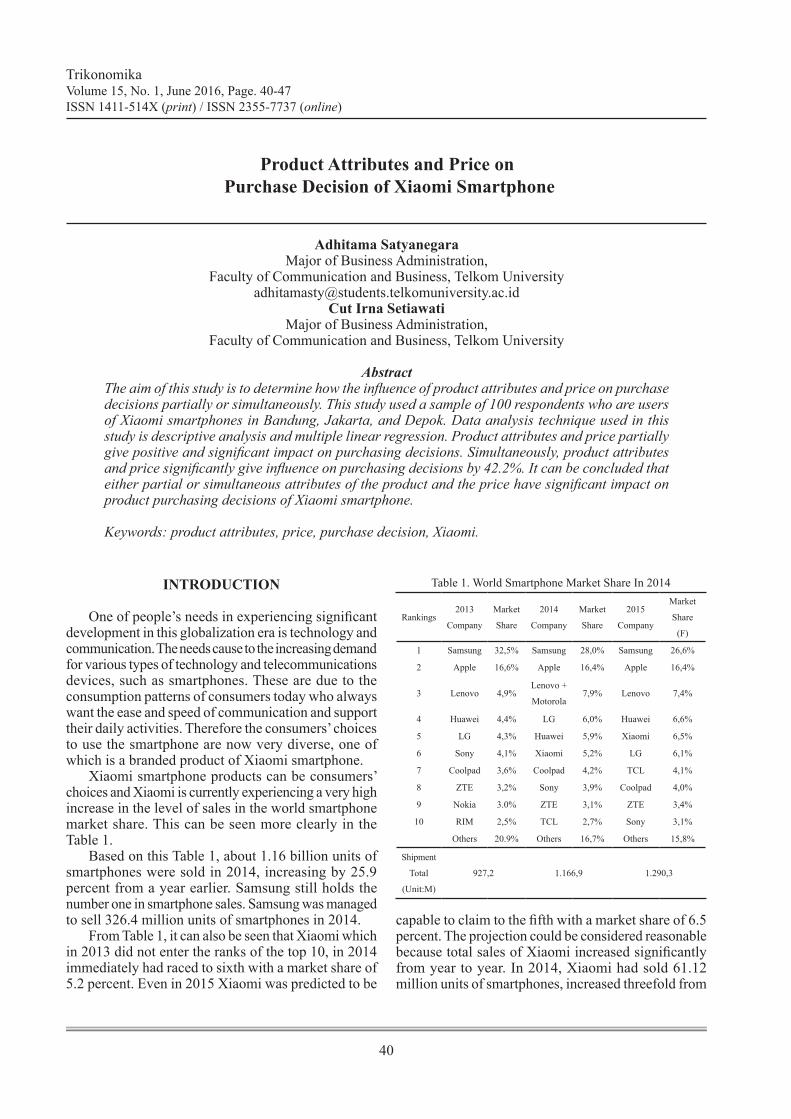
40
TrikonomikaVolume 15, No. 1, June 2016, Page. 40-47ISSN 1411-514X (print) / ISSN 2355-7737 (online)
Product Attributes and Price on Purchase Decision of Xiaomi Smartphone
Adhitama SatyanegaraMajor of Business Administration,
Faculty of Communication and Business, Telkom [email protected]
Cut Irna SetiawatiMajor of Business Administration,
Faculty of Communication and Business, Telkom University
AbstractThe aim of this study is to determine how the influence of product attributes and price on purchase decisions partially or simultaneously. This study used a sample of 100 respondents who are users of Xiaomi smartphones in Bandung, Jakarta, and Depok. Data analysis technique used in this study is descriptive analysis and multiple linear regression. Product attributes and price partially give positive and significant impact on purchasing decisions. Simultaneously, product attributes and price significantly give influence on purchasing decisions by 42.2%. It can be concluded that either partial or simultaneous attributes of the product and the price have significant impact on product purchasing decisions of Xiaomi smartphone.
Keywords: product attributes, price, purchase decision, Xiaomi.
INTRODUCTION
One of people’s needs in experiencing significant development in this globalization era is technology and communication. The needs cause to the increasing demand for various types of technology and telecommunications devices, such as smartphones. These are due to the consumption patterns of consumers today who always want the ease and speed of communication and support their daily activities. Therefore the consumers’ choices to use the smartphone are now very diverse, one of which is a branded product of Xiaomi smartphone.
Xiaomi smartphone products can be consumers’ choices and Xiaomi is currently experiencing a very high increase in the level of sales in the world smartphone market share. This can be seen more clearly in the Table 1.
Based on this Table 1, about 1.16 billion units of smartphones were sold in 2014, increasing by 25.9 percent from a year earlier. Samsung still holds the number one in smartphone sales. Samsung was managed to sell 326.4 million units of smartphones in 2014.
From Table 1, it can also be seen that Xiaomi which in 2013 did not enter the ranks of the top 10, in 2014 immediately had raced to sixth with a market share of 5.2 percent. Even in 2015 Xiaomi was predicted to be
Table 1. World Smartphone Market Share In 2014
Rankings2013
Company
Market
Share
2014
Company
Market
Share
2015
Company
Market
Share
(F)
1 Samsung 32,5% Samsung 28,0% Samsung 26,6%
2 Apple 16,6% Apple 16,4% Apple 16,4%
3 Lenovo 4,9%Lenovo +
Motorola7,9% Lenovo 7,4%
4 Huawei 4,4% LG 6,0% Huawei 6,6%
5 LG 4,3% Huawei 5,9% Xiaomi 6,5%
6 Sony 4,1% Xiaomi 5,2% LG 6,1%
7 Coolpad 3,6% Coolpad 4,2% TCL 4,1%
8 ZTE 3,2% Sony 3,9% Coolpad 4,0%
9 Nokia 3.0% ZTE 3,1% ZTE 3,4%
10 RIM 2,5% TCL 2,7% Sony 3,1%
Others 20.9% Others 16,7% Others 15,8%
Shipment
Total
(Unit:M)
927,2 1.166,9 1.290,3
capable to claim to the fifth with a market share of 6.5 percent. The projection could be considered reasonable because total sales of Xiaomi increased significantly from year to year. In 2014, Xiaomi had sold 61.12 million units of smartphones, increased threefold from
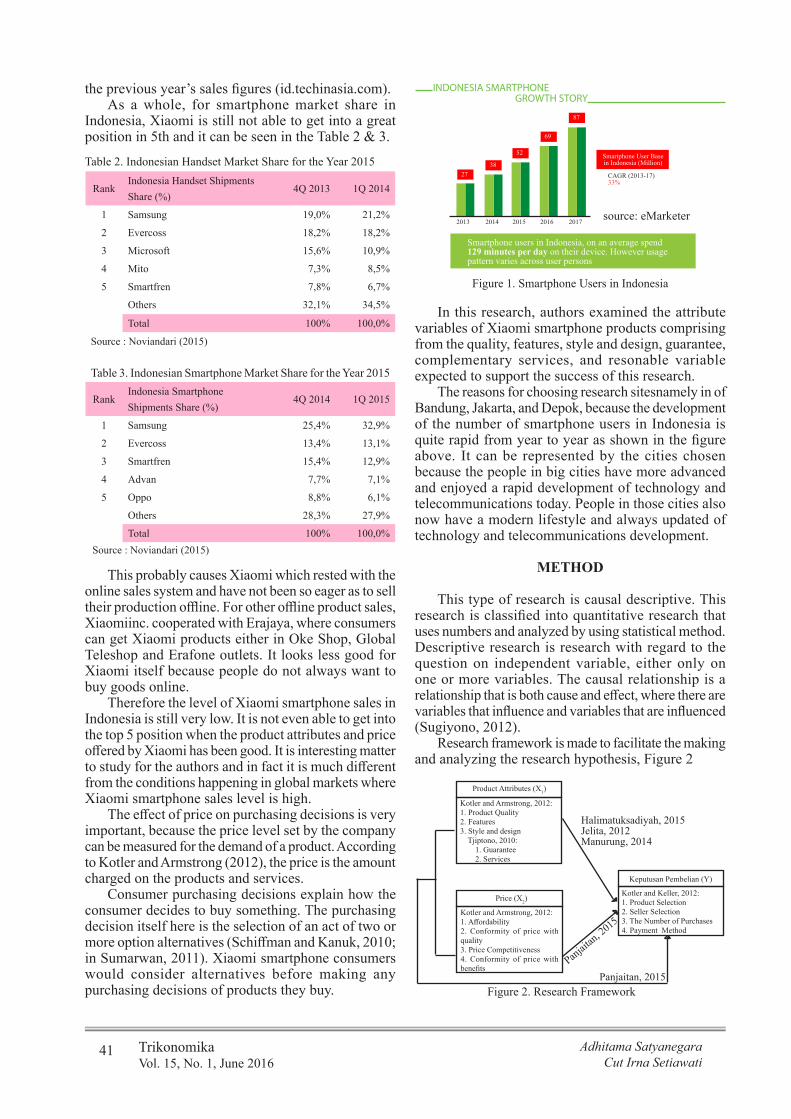
41 TrikonomikaVol. 15, No. 1, June 2016
Adhitama SatyanegaraCut Irna Setiawati
Figure 1. Smartphone Users in Indonesia
Smartphone User Basein Indonesia (Million)
CAGR (2013-17)33%
INDONESIA SMARTPHONEGROWTH STORY
Smartphone users in Indonesia, on an average spend129 minutes per day on their device. However usagepattern varies across user persons
27
2013 2014 2015 2016 2017
38
52
69
87
source: eMarketer
the previous year’s sales figures (id.techinasia.com).As a whole, for smartphone market share in
Indonesia, Xiaomi is still not able to get into a great position in 5th and it can be seen in the Table 2 & 3.
In this research, authors examined the attribute variables of Xiaomi smartphone products comprising from the quality, features, style and design, guarantee, complementary services, and resonable variable expected to support the success of this research.
The reasons for choosing research sitesnamely in of Bandung, Jakarta, and Depok, because the development of the number of smartphone users in Indonesia is quite rapid from year to year as shown in the figure above. It can be represented by the cities chosen because the people in big cities have more advanced and enjoyed a rapid development of technology and telecommunications today. People in those cities also now have a modern lifestyle and always updated of technology and telecommunications development.
METHOD
This type of research is causal descriptive. This research is classified into quantitative research that uses numbers and analyzed by using statistical method. Descriptive research is research with regard to the question on independent variable, either only on one or more variables. The causal relationship is a relationship that is both cause and effect, where there are variables that influence and variables that are influenced (Sugiyono, 2012).
Research framework is made to facilitate the making and analyzing the research hypothesis, Figure 2
Table 2. Indonesian Handset Market Share for the Year 2015
RankIndonesia Handset Shipments Share (%)
4Q 2013 1Q 2014
1 Samsung 19,0% 21,2%
2 Evercoss 18,2% 18,2%
3 Microsoft 15,6% 10,9%
4 Mito 7,3% 8,5%
5 Smartfren 7,8% 6,7%
Others 32,1% 34,5%
Total 100% 100,0%
Source : Noviandari (2015)
Table 3. Indonesian Smartphone Market Share for the Year 2015
RankIndonesia Smartphone Shipments Share (%)
4Q 2014 1Q 2015
1 Samsung 25,4% 32,9%
2 Evercoss 13,4% 13,1%
3 Smartfren 15,4% 12,9%
4 Advan 7,7% 7,1%
5 Oppo 8,8% 6,1%
Others 28,3% 27,9%
Total 100% 100,0%Source : Noviandari (2015)
This probably causes Xiaomi which rested with the online sales system and have not been so eager as to sell their production offline. For other offline product sales, Xiaomiinc. cooperated with Erajaya, where consumers can get Xiaomi products either in Oke Shop, Global Teleshop and Erafone outlets. It looks less good for Xiaomi itself because people do not always want to buy goods online.
Therefore the level of Xiaomi smartphone sales in Indonesia is still very low. It is not even able to get into the top 5 position when the product attributes and price offered by Xiaomi has been good. It is interesting matter to study for the authors and in fact it is much different from the conditions happening in global markets where Xiaomi smartphone sales level is high.
The effect of price on purchasing decisions is very important, because the price level set by the company can be measured for the demand of a product. According to Kotler and Armstrong (2012), the price is the amount charged on the products and services.
Consumer purchasing decisions explain how the consumer decides to buy something. The purchasing decision itself here is the selection of an act of two or more option alternatives (Schiffman and Kanuk, 2010; in Sumarwan, 2011). Xiaomi smartphone consumers would consider alternatives before making any purchasing decisions of products they buy.
Kotler and Armstrong, 2012:1. Affordability2. Conformity of price with quality3. Price Competitiveness4. Conformity of price with benefits
Kotler and Armstrong, 2012:1. Product Quality2. Features3. Style and design
Tjiptono, 2010:1. Guarantee2. Services
Kotler and Keller, 2012:1. Product Selection2. Seller Selection3. The Number of Purchases4. Payment Method
Price (X2)
Product Attributes (X1)
Keputusan Pembelian (Y)
Figure 2. Research FrameworkPanjaitan, 2015
Panjaitan, 2015
Halimatuksadiyah, 2015Jelita, 2012Manurung, 2014

42Analysis Effect of Product Attribute and Price on Purchase Decision of Xiaomi Smartphone
The hypothesis proposed in this research is product attributes and price influence on purchase decisions of Xiaomi Smartphone products,” simultaneously and partially. Samples are 100 respondents with purposive sampling technique, that is the user of Xiaomi Smartphone located in Bandung (32) respondent, Jakarta (45) respondent, and Depok (23) respondent.
The validity and reliability of collected data will be further tested with a significance level of 0.05. Validity test can be done by comparing the value of r count with r table. If rcount > rtable and has positive value, then the statement is said to be valid (Sugiyono, 2008). Reliability test used Cronbach Alpha statistical test, namely a variable is said to be reliable if > 0.70 (Ghozali, 2011).
Descriptive statistics are used to analyze data without intending to apply to general conclusions or generalizations (Sugiyono, 2012).
Multiple linear regression analysis is used to measure effect between two or more independent variables to predict dependent variable. Multiple regression models are shown as follows.
Y = a + b1 X1 + b2 X2 + e Description: Y : the purchasing decision a : constant b1 : multiple regression co-efficient between x1 and y b2 : multiple regression co-efficient between x2 and y e : error X1 : product attributes X2 : price
1. T test (Partial), T statistical test shows how far the effect of the independent variable on the dependent variable (Ghozali, 2011). In this case applies, t < t table, then H0 is accepted (H1 is rejected), and if t > t table, then H0 is rejected (H1 is accepted) on = 0.05.
2. F Test (Simultaneous), F statistical test basically indicates whether all the independent variables included in the model have effect together to the dependent variable (Ghozali, 2011). In this case applies, if F count < F table, then H0 is accepted (H1 is rejected), and if F count < F table, then H0 is rejected (H1 is accepted).
3. Determination coefficient (R2) essentially measures how far the ability of the model to explain variations in the dependent variable. If R2 value is small, it means that the ability of the independent variables in explaining the dependent variable is very limited.
RESULT
Based on the validity test results, of such distribution showed that all statements are valid, because r count >
r table (Sugiyono, 2012). Likewise, the reliability test results showed that all statements are reliable because the coefficient is > 0.70 (Ghozali, 2011).
76.925%
Very Bad BadEnough Good
GoodVery Good
20% 36% 52% 68% 84% 100%Figure 5. Respondent Responses to Product Attributes (X1)
87.85%
Very Bad BadEnough Good
Good Very Good
20% 36% 52% 68% 84% 100%Figure 6. Respondent Response on Price (X2)
85.05%Very Bad
BadEnough Good
GoodVery Good
20% 36% 52% 68% 84% 100%Figure 7. Respondent Response to the Purchase Decision (Y)
a. Product Attribute Variable (X1)Average score for total of 12 items from the product
attribute variables (X1) generates a figure of 76 925%, which means that the score is in good category. This shows Xiaomi product attribute variables (X1) with sub variables of quality, features, style and design, guarantee/warranty, as well as complementary services can be received by the respondents well.
b. Price Variable (X2)Average score for total of four items from the
price variable (X2) generate a figure of 87.85%, which means that the scores are in very good category. This indicates that the price variable (X2) with sub variables of affordability, conformity price with quality, price competitiveness, as well as conformity of price with benefits, can be obtained by respondents very well.
c. Purchasing Decision Variable (Y) Average score for total of 4 items from purchase
decision variable (Y) generates a figure of 85.05%, which means that the scores are in very good category. This suggests consumers to make purchasing decisions very well with the existing consideration and alternatives or options.
Based on the result data of regression, a regression equation can be obtained as followed:
Y = 0.642 + 0.370 X1 + 0.501 X2 + e
a. Constant of 0.642 means that if two independent variables (X1, X2) are zero and there is no change, then the purchase decision is valued of 0.642.
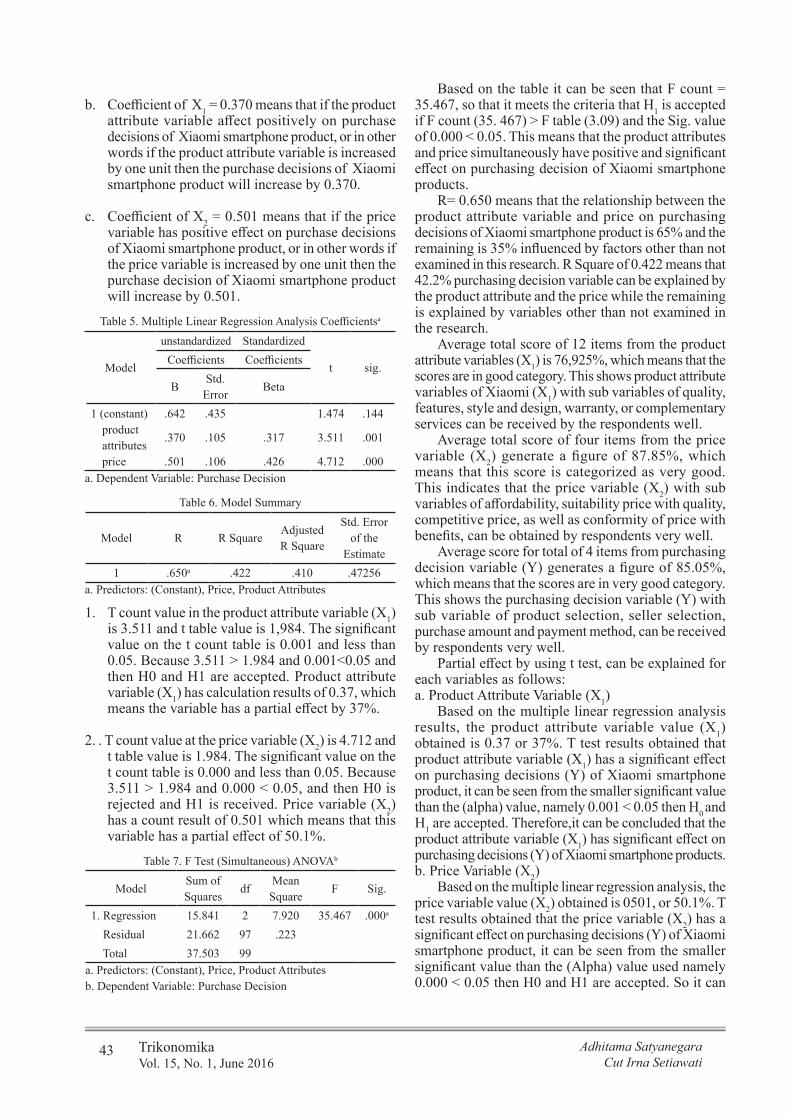
43 TrikonomikaVol. 15, No. 1, June 2016
Adhitama SatyanegaraCut Irna Setiawati
Table 5. Multiple Linear Regression Analysis Coefficientsa
Model
unstandardized Standardized
t sig.Coefficients Coefficients
BStd.
ErrorBeta
1 (constant)product attributesprice
.642
.370
.501
.435
.105
.106
.317
.426
1.474
3.511
4.712
.144
.001
.000a. Dependent Variable: Purchase Decision
Table 6. Model Summary
Model R R SquareAdjusted R Square
Std. Error of the
Estimate1 .650a .422 .410 .47256
a. Predictors: (Constant), Price, Product Attributes
Table 7. F Test (Simultaneous) ANOVAb
ModelSum of Squares
dfMean Square
F Sig.
1. Regression 15.841 2 7.920 35.467 .000a
Residual 21.662 97 .223 Total 37.503 99
a. Predictors: (Constant), Price, Product Attributesb. Dependent Variable: Purchase Decision
b. Coefficient of X1 = 0.370 means that if the product attribute variable affect positively on purchase decisions of Xiaomi smartphone product, or in other words if the product attribute variable is increased by one unit then the purchase decisions of Xiaomi smartphone product will increase by 0.370.
c. Coefficient of X2 = 0.501 means that if the price variable has positive effect on purchase decisions of Xiaomi smartphone product, or in other words if the price variable is increased by one unit then the purchase decision of Xiaomi smartphone product will increase by 0.501.
1. T count value in the product attribute variable (X1) is 3.511 and t table value is 1,984. The significant value on the t count table is 0.001 and less than 0.05. Because 3.511 > 1.984 and 0.001<0.05 and then H0 and H1 are accepted. Product attribute variable (X1) has calculation results of 0.37, which means the variable has a partial effect by 37%.
2. . T count value at the price variable (X2) is 4.712 and t table value is 1.984. The significant value on the t count table is 0.000 and less than 0.05. Because 3.511 > 1.984 and 0.000 < 0.05, and then H0 is rejected and H1 is received. Price variable (X2) has a count result of 0.501 which means that this variable has a partial effect of 50.1%.
Based on the table it can be seen that F count = 35.467, so that it meets the criteria that H1 is accepted if F count (35. 467) > F table (3.09) and the Sig. value of 0.000 < 0.05. This means that the product attributes and price simultaneously have positive and significant effect on purchasing decision of Xiaomi smartphone products.
R= 0.650 means that the relationship between the product attribute variable and price on purchasing decisions of Xiaomi smartphone product is 65% and the remaining is 35% influenced by factors other than not examined in this research. R Square of 0.422 means that 42.2% purchasing decision variable can be explained by the product attribute and the price while the remaining is explained by variables other than not examined in the research.
Average total score of 12 items from the product attribute variables (X1) is 76,925%, which means that the scores are in good category. This shows product attribute variables of Xiaomi (X1) with sub variables of quality, features, style and design, warranty, or complementary services can be received by the respondents well.
Average total score of four items from the price variable (X2) generate a figure of 87.85%, which means that this score is categorized as very good. This indicates that the price variable (X2) with sub variables of affordability, suitability price with quality, competitive price, as well as conformity of price with benefits, can be obtained by respondents very well.
Average score for total of 4 items from purchasing decision variable (Y) generates a figure of 85.05%, which means that the scores are in very good category. This shows the purchasing decision variable (Y) with sub variable of product selection, seller selection, purchase amount and payment method, can be received by respondents very well.
Partial effect by using t test, can be explained for each variables as follows:a. Product Attribute Variable (X1)
Based on the multiple linear regression analysis results, the product attribute variable value (X1) obtained is 0.37 or 37%. T test results obtained that product attribute variable (X1) has a significant effect on purchasing decisions (Y) of Xiaomi smartphone product, it can be seen from the smaller significant value than the (alpha) value, namely 0.001 < 0.05 then H0 and H1 are accepted. Therefore,it can be concluded that the product attribute variable (X1) has significant effect on purchasing decisions (Y) of Xiaomi smartphone products.b. Price Variable (X2)
Based on the multiple linear regression analysis, the price variable value (X2) obtained is 0501, or 50.1%. T test results obtained that the price variable (X2) has a significant effect on purchasing decisions (Y) of Xiaomi smartphone product, it can be seen from the smaller significant value than the (Alpha) value used namely 0.000 < 0.05 then H0 and H1 are accepted. So it can

44Analysis Effect of Product Attribute and Price on Purchase Decision of Xiaomi Smartphone
be concluded that the product attribute variable (X1) has significant effect on purchasing decisions (Y) of Xiaomi smartphone products.
The conclusion from these results is that partially, product attributes (X1) has a significant efffect on purchasing decisions of Xiaomi smartphone product (Y) and the price (X2) also has a significant effect on purchasing decisions of Xiaomi smartphone product (Y).
Research that have been carried out also proved that there is a positive relationship between product attributes and price with the purchasing decision. In the study conducted by (Manurung, 2014) who examined the Effect of Product Attribute on Purchasing Decision of Blackberry Smartphone at Faculty of Economics, University of North Sumatera, she indicated that there is a positive and significant relationship between product attributes with purchasing decision. The study made by Jelita (2012) with the title of The Effect of Consumer Perception regarding Product Attributes on Purchasing Decision of Blackberry Smartphone in Hasanuddin University, Makassar, proved that the product attributes has positive relationship with purchasing decisions.
In this research, the independent variable used is product attribute variable (X1) and the price (X2) and the dependent variable used is the purchasing decision (Y). Based on the calculation, the determination coefficient (R2) indicates the value of r = 0.650, which means the relationship between independent variables (product attribute and price) on the dependent variable (purchasing decisions) is 65% positive and closely (Situmorang and Lutfi, in Panjaitan, 2015).
R Square = 0.422 means that 42.2% of purchasing decisions may be influenced by the independent variable (product attributes and prices) while the remaining 57.8% is influenced by other variables which arenot examined in this research. To determine the simultaneous relationship with product attribute variables (X1) and the price (X2) on purchasing decisions (Y) it can be shown at the F-test value, namely F significance value (Sig.) of the study results is 0.000 while the (Alpha) value is 0.05, 0.000 < 0.05 and F count value = 35 467, therefore it meets the criteria that H1 is accepted if F count (35.467) > F table (3.09) and the Sig. 0.000<0.05. Product attributes and price have simultaneously positive and significant effect on purchasing decisions of Xiaomi smartphone products.
This is supported by research conducted by Panjaitan (2015) he concluded that test product attributes, prices, and brand image simultaneously have positive and significantly effects the purchasing decisions of consumers on I-phone Apple Store of Sun Plaza Medan. Hypothesis test result simultaneously proved that if attribute and price offered by a product has been running well, consumers will get the benefit from a product to the maximum and the price imposition invoiced to a product in this case Xiaomi smartphone has
been appropriate to do (Kotler and Armstrong, 2012). Consumers will consider the product attributes and the price offered as an alternative in making a purchasing decision (Kotler and Keller, 2012).
CONCLUSION
Based on the research that has been observed, the authors conclude as follows:1. Average total score of 12 items from product
attribute variable generates a figure of 76.925% is in good category. This indicates that the product attributes of Xiaomi smartphone can be received by the respondents well.
2. Average total score of 4 items from price variables generates a figure of 87.85% is in the very good category. This indicates that the price of Xiaomi smartphones can be received by the respondents very well in keeping with the wishes of consumers.
3. Average total score of 4 items from purchasing decision variable generates a figure of 85.05%, is in the very good category. This shows that consumers are taking purchasing decisions very well and considering various options or alternatives.
4. Product attributes partially has a positive and significant effect on purchasing decisions of Xiaomi smartphone product. The price also partially has positive and significant effect on purchasing decisions of Xiaomi smartphone product.
5. Product attributes and price simultaneously has positive and significant effect on purchasing decisions of Xiaomi smartphone product of 42.2% while the remaining 57.8% is influenced by other variables which are not examined in this research.
REFERENCE
Ghozali, Imam. 2011. Aplikasi Analisis Multivariate dengan program IBM SPSS 19.Semarang: Universitas Diponegoro.
Halimatuksadiyah. 2015. Analisis Pengaruh Atribut Produk dan Sikap Konsumen terhadap Keputusan Pembelian Produk Luwak White Coffe pada Mahasiswa Fakultas Teknik Universitas Sumatera Utara. Medan: Universitas Sumatera Utara. http://repository.usu.ac.id
Jelita, Putri,Charly.2012.Pengaruh Persepsi Atribut Produk terhadap Keputusan Pembelian Handphone Merek Blackberry di Universitas Hasanuddin. Skripsi. Makassar: Universitas Hasanuddin.
Kotler, Philip & Armstrong, Gary. 2012. Principles of Marketing. England: Pearson Education Limited.
Kotler, Philip & Keller, Kevin Lane. 2012. Marketing Management. England: Pearson Education Limited.
Manurung, Handayanti, Kristina. 2014. Analisis Pengaruh Atribut Produk terhadap Keputusan
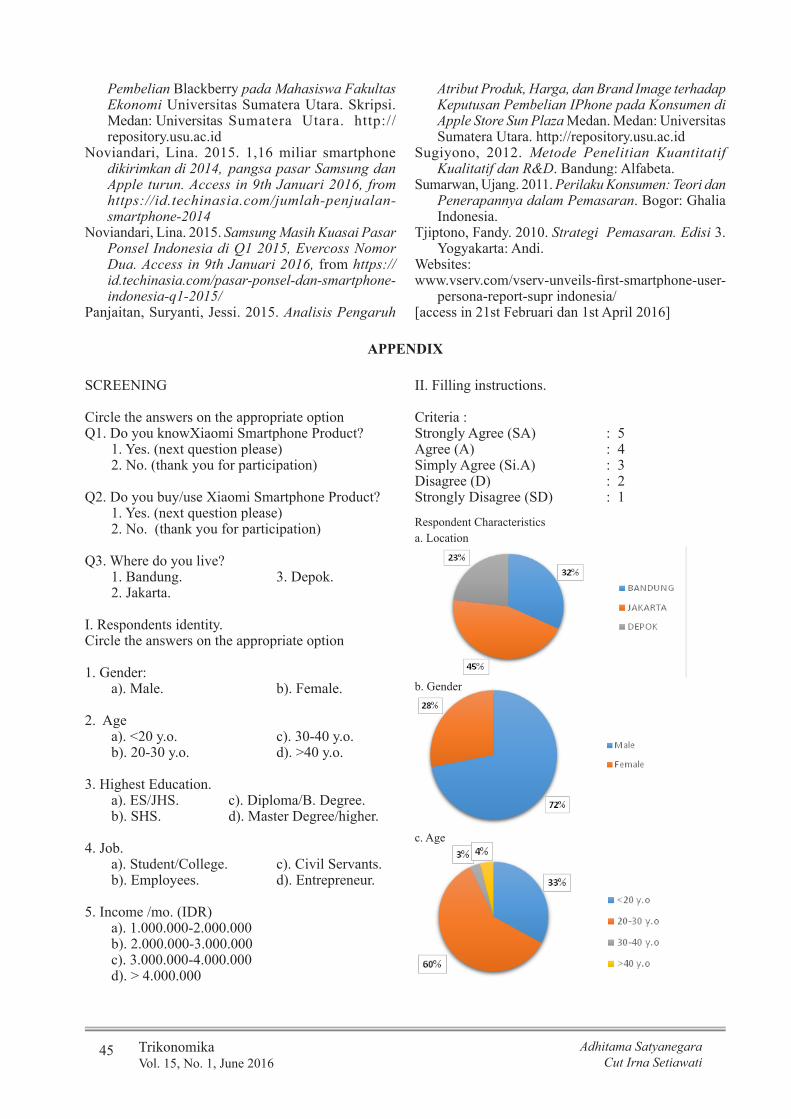
45 TrikonomikaVol. 15, No. 1, June 2016
Adhitama SatyanegaraCut Irna Setiawati
Pembelian Blackberry pada Mahasiswa Fakultas Ekonomi Universitas Sumatera Utara. Skripsi. Medan: Universitas Sumatera Utara. http://repository.usu.ac.id
Noviandari, Lina. 2015. 1,16 miliar smartphone dikirimkan di 2014, pangsa pasar Samsung dan Apple turun. Access in 9th Januari 2016, from https://id.techinasia.com/jumlah-penjualan-smartphone-2014
Noviandari, Lina. 2015. Samsung Masih Kuasai Pasar Ponsel Indonesia di Q1 2015, Evercoss Nomor Dua. Access in 9th Januari 2016, from https://id.techinasia.com/pasar-ponsel-dan-smartphone-indonesia-q1-2015/
Panjaitan, Suryanti, Jessi. 2015. Analisis Pengaruh
Atribut Produk, Harga, dan Brand Image terhadap Keputusan Pembelian IPhone pada Konsumen di Apple Store Sun Plaza Medan. Medan: Universitas Sumatera Utara. http://repository.usu.ac.id
Sugiyono, 2012. Metode Penelitian Kuantitatif Kualitatif dan R&D. Bandung: Alfabeta.
Sumarwan, Ujang. 2011. Perilaku Konsumen: Teori dan Penerapannya dalam Pemasaran. Bogor: Ghalia Indonesia.
Tjiptono, Fandy. 2010. Strategi Pemasaran. Edisi 3. Yogyakarta: Andi.
Websites:www.vserv.com/vserv-unveils-first-smartphone-user-
persona-report-supr indonesia/[access in 21st Februari dan 1st April 2016]
APPENDIX
SCREENING
Circle the answers on the appropriate optionQ1. Do you knowXiaomi Smartphone Product?
1. Yes. (next question please)2. No. (thank you for participation)
Q2. Do you buy/use Xiaomi Smartphone Product?1. Yes. (next question please)2. No. (thank you for participation)
Q3. Where do you live?1. Bandung. 3. Depok.2. Jakarta.
I. Respondents identity.Circle the answers on the appropriate option
1. Gender: a). Male. b). Female.
2. Agea). <20 y.o. c). 30-40 y.o. b). 20-30 y.o. d). >40 y.o.
3. Highest Education.a). ES/JHS. c). Diploma/B. Degree.b). SHS. d). Master Degree/higher.
4. Job.a). Student/College. c). Civil Servants.b). Employees. d). Entrepreneur.
5. Income /mo. (IDR)a). 1.000.000-2.000.000b). 2.000.000-3.000.000c). 3.000.000-4.000.000d). > 4.000.000
II. Filling instructions.
Criteria : Strongly Agree (SA) : 5 Agree (A) : 4 Simply Agree (Si.A) : 3 Disagree (D) : 2 Strongly Disagree (SD) : 1
Respondent Characteristicsa. Location
c. Age
b. Gender

46Analysis Effect of Product Attribute and Price on Purchase Decision of Xiaomi Smartphone
d. Highest Education
e. Job
f. Income
Descriptive Responden Analysist Respondents Against Product Attributes Variables (X1)
No ItemsRespondents
SumTotal Score
Ideal ScoreSA A Si.A D SD
1Xiaomi smartphone product has the durability and good quality
27 53 20 0 0 100 407 50027% 53% 20% 0 0 100% 81.4%
2Xiaomi smartphone product has excellent product performance (not often hang and fast heat)
33 51 15 1 0 100 416 50033% 51% 15% 1% 0 100% 83.2%
3Xiaomi smartphone product easy to repair in case of damage(availability of spareparts, etc.)
17 37 31 15 0 100 326 50017% 37% 31% 15% 0 100% 62.5%
4Xiaomi smartphone product features M1UI system interface (see menu) interesting
48 43 8 1 0 100 438 50048% 43% 8% 1% 0 100% 87.6%
5Xiaomi smartphone product has a characteristic that is different from competitors
44 34 18 3 1 100 417 50044% 34% 18% 3% 1% 100% 83.4%
6 Xiaomi smartphone product has a slim model34 46 15 2 3 100 406 500
34% 46% 15% 2% 3% 100% 81.2%
7 Xiaomi smartphone product has a shape that fits the hand29 46 22 2 1 100 400 500
29% 46% 22% 2% 1% 100% 80%
8Xiaomi smartphone product comfortable to grip so easy to use
28 50 19 3 0 100 403 50028% 50% 19% 3% 0 100% 80.6%
9Xiaomi smartphone products have a warranty/guarantee that reliable
22 36 30 10 2 100 366 50022% 36% 30% 10% 2% 100% 73.2%
10Easy claims guarantee/warranty products of Xiaomi smartphone
12 39 37 10 2 100 349 50012% 39% 37% 10% 2% 100% 69.8%
11Xiaomi smartphone products provide complementary services such as call center for customer complaints
16 41 29 10 4 100 355 50016% 41% 29% 10% 4% 100% 71%
12 Ease of access phone numbers for customer complaints13 43 24 17 3 100 346 500
13% 43% 24% 17% 3% 100% 69.2%Total Score 4629Average Total Score (%) 76.925%
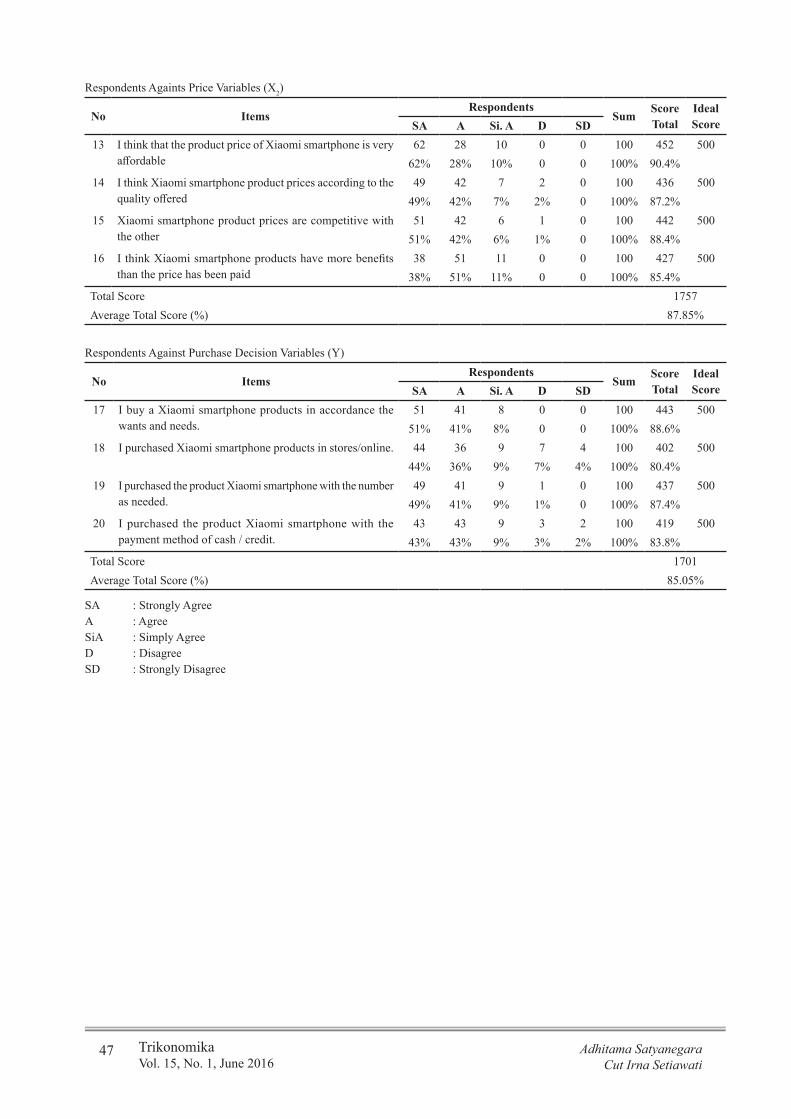
47 TrikonomikaVol. 15, No. 1, June 2016
Adhitama SatyanegaraCut Irna Setiawati
Respondents Againts Price Variables (X2)
No ItemsRespondents
SumScore Total
Ideal ScoreSA A Si. A D SD
13 I think that the product price of Xiaomi smartphone is very affordable
62 28 10 0 0 100 452 50062% 28% 10% 0 0 100% 90.4%
14 I think Xiaomi smartphone product prices according to the quality offered
49 42 7 2 0 100 436 50049% 42% 7% 2% 0 100% 87.2%
15 Xiaomi smartphone product prices are competitive with the other
51 42 6 1 0 100 442 50051% 42% 6% 1% 0 100% 88.4%
16 I think Xiaomi smartphone products have more benefits than the price has been paid
38 51 11 0 0 100 427 50038% 51% 11% 0 0 100% 85.4%
Total Score 1757Average Total Score (%) 87.85%
Respondents Against Purchase Decision Variables (Y)
No ItemsRespondents
SumScore Total
Ideal ScoreSA A Si. A D SD
17 I buy a Xiaomi smartphone products in accordance the wants and needs.
51 41 8 0 0 100 443 50051% 41% 8% 0 0 100% 88.6%
18 I purchased Xiaomi smartphone products in stores/online. 44 36 9 7 4 100 402 50044% 36% 9% 7% 4% 100% 80.4%
19 I purchased the product Xiaomi smartphone with the number as needed.
49 41 9 1 0 100 437 50049% 41% 9% 1% 0 100% 87.4%
20 I purchased the product Xiaomi smartphone with the payment method of cash / credit.
43 43 9 3 2 100 419 50043% 43% 9% 3% 2% 100% 83.8%
Total Score 1701Average Total Score (%) 85.05%
SA : Strongly AgreeA : AgreeSiA : Simply AgreeD : DisagreeSD : Strongly Disagree
48
TrikonomikaVolume 15, No. 1, June 2016, Page. 48-57ISSN 1411-514X (print) / ISSN 2355-7737 (online)
Service Quality, Interest Rate, and Deposit On Call On Profitability(Study in Bank Mandiri Branch Office in PT. X)
Renny [email protected]
PT. Bank Mandiri Tbk. (Persero)Ellen Rusliati
Master of Management, University of Pasundan
AbstractThe aim of this research is to measure the influence of service quality and interest rate on deposit on call, and the influence of service quality, interest rate, and deposit on call on profitability. Hopefully, the result could give contributions for the development of management study, especially financial management. It also could hopefully provide valuable information about the importance of service quality, interest rate, and deposit on call in order to increase bank profitability. The location of this research was in Bank Mandiri, Bandung Branch Office in PT. X. The methodology used was quantitative research using descriptive and verificative analysis. Research data horizon was cross sectional using path analysis method. The results showed that there were significant influence between the interest rate on deposit on call, and service quality, interest rate, and deposit on call to profitability. It was found also that the influence of straight interest rate on profitability was weaker than interest rate on profitability via deposit on call.
Keywords: service quality, interest rate, deposit on call, profitability
INTRODUCTION
Indonesia and the nations of Southeast Asia (ASEAN) are facing Free Trade era with the enactment of ASEAN Economic Community (AEC). Banks are trying to establish their power so they can compete and operate smoothly on Free Market Economy zone. The profile of Bank Mandiri can be seen in Table 1, so does the profile of Bank Mandiri of Bandung Branch Office in PT. X. PT. X is a customer of Bank Mandiri in Bandung in which it was necessary to open Branch Office in the Main Office Building of PT. X Bandung. The big state-owned companies, such as PT. X, Tbk., are not free from banking services, i.e. for the payments of operational partnership either in domestic or overseas. The payments are transferred via banks, including foreign loan payments.
At first, there was only one bank that set up a branch office in the Main Office Building of PT. X that was Bank Mandiri. However, there had been branches of competing banks appearing, namely Bank Muamalat, Bank Rakyat Indonesia, Bank Negara Indonesia and Bank Syariah Mandiri for the last few years. The problems faced by Bank Mandiri Branch Office in PT. X are the decrease in the level of performance presented in Table 2, as measured by the ratio of Return on Assets (here in after written as ROA) from August
to October 2014, and were under the overall ROA of Bank Mandiri from 2010 to 2014 (Table 3).
The quality of service is very important in the banking business, as a factor that influences customer satisfaction (Cronin et al, 2000:224) to the primary motivator that binds customer loyalty (Zafar et al 2012:128). Best service value can make the customer satisfied and eventually become loyal. A bank can differentiate itself from competitors by providing high quality services (Kumar et.al, 2010:32), which in turn affect the profitability.
Data from Bank Mandiri’s website states that in early 2015, there had been 2,103 branches and 12,542 ATMs spread across Indonesia. Until 2014, the Bank was awarded the Best Bank Service Excellence as many as seven (7) consecutive times from 2008. As quoted from 387 Edition of Mandiri magazine (2014:10), the journey of Bank Mandiri following Bank Service Excellence Monitoring (BSEM) entered its 15th (fifteenth) year.
Table 4 shows that there are some aspects that have not been achieved to the fullest even though the bank has become the overall champion. Values obtained in each category surveyed indicate that there is a gap in the value of teller services.
Bank functions as a Financial Intermediary Institution basically are to mobilize public funds for

49 TrikonomikaVol. 15, No. 1, June 2016
Renny SunarnyEllen Rusliati
further distribution to individuals or institutions that in need in the form of loans for investment purposes. Individuals or institutions that have excess funds need institutions that can manage funds effectively and profitably. Customers entrust the management of these funds to banks in the form of savings, deposits, and giros.
Placement of Third Party Funds mainly Deposit On Call (here in after written as DOC) in Bank Mandiri Branch Office in PT. X is affected by the amount of payment will be made. Unspent funds are saved in DOC. The fact that happened today is Bank Mandiri Branch Office in PT. X had a decrease of DOC owned by PT. X, occurred from the period of August 2014 through October 2014 which can be seen in Table 5. The facts show that PT. X is placing its funds not only in Bank Mandiri but also distributed in some state banks. The funds saved will be moved in order to reach targets of interest income.
Competition to seize DOC funds of PT. X caused the state-owned banks offer different interest rates as shown in Table 6. Under the Indonesian Banking Statistics (Statistik Perbankan Indonesia/SPI), the trend of interest rates on third party funds up to the position in July 2014 is still increasing and is above the benchmark interest rate of Bank Indonesia (7, 50% per year) and LPS (Lembaga Penjamin Simpanan) (7.75% per year). Credit rates continued to increase as the impact of rising interest rates in deposits.
The funds owners wished their funds could grow. Banking fund that consist of clearing accounts, deposits, and savings during certain periods are heavily influenced by interest rates. Deposits are expensive funds because they must provide a high remuneration for customers. Placement of these deposits consist of deposits of 1 (one) month, three (3) months, six (6) months, and twelve (12) months. In addition to deposits, the bank provides DOC product that is a placement of funds in few days with minimum funds.
The government issued fund management policy and bank credit, which aim to complement and enhance the development of banking sector. The interest rate is constantly adjusted realistic and affects the high-low interest rates that are set by banks. Interest rates are influenced by Bank Indonesia Regulation Number 14/26/PBI/2012 Section 2.2 on Business Activities Bank Regulation.
Based on core capital owned, the Banks classified into 4 (four) business group as follows: (1) BUKU 1: Bank Umum Kelompok Usaha 1 is Banks with core capital of less than Rp. 1 trillion; (2) BUKU 2: Banks with core capital of Rp. 1 Trillion up to less than Rp. 5 Trillion; (3) BUKU 3: Banks with core capital of Rp. 5 Trillion up to less than Rp. 30 Trillion; and (4) BUKU 4: Banks with core capital above Rp. 30 Trillion.
Based on discussions and input of banks of BUKU 3 and 4, and considering the negative impact of interest
rate competition on economic growth and credit performance, particularly on micro-credit customers who are the largest population of credit debtors, the maximum interest rate of third party funds was set as follows:1. The maximum rate is 200 bps above the BI rate
or the current maximum of 9.50% for the BUKU 4 group, including all incentives given directly to depositors;
2. Giving the maximum deposit rate for LPS interest rate which is currently at 7.75% for nominal deposits up to Rp. 2 billion and has taken into account all of the incentives given to depositors;
3. The maximum interest rate is 225 bps above the BI rate or the current maximum of 9.75% for the BUKU 3 group: including all incentives given directly to depositors; and
4. To optimize the application of the maximum interest rate, then the supervisor will also conduct monitoring and supervisory action on BUKU 1 and 2 banks to participate and support the decline in interest rates in deposits. Supervision of maximum interest rate is applicable throughout the bank.
According to the commitment to implement this policy, banks are required to carry out the following things:1. Getting a decrease in credit interest rates as soon
as possible after the imposition of the third party fund maximum interest rate provision and report the realization to OJK (Otoritas Jasa Keuangan) at the first opportunity.
2. Incorporating the commitment reduction in credit rates in the Business Plan 2015 submitted to no later than the end of November 2014 as well as the calculation of the impact on financial performance.
3. Conducting appropriate credit expansion targets for business plan 2015 by considering the availability of funds and the precautionary principle.
High inflation rate could have an impact on the banking sector, therefore Bank Indonesia also establish an appropriate interest rate as a benchmark for public and private banks to determine interest rates in order to remain liquid and profitable. The worrying thing is the interest rate given to the owners of large funds (core depositors) up to the position in August 2014; that there had been above 11% in almost all banks, especially in BUKU 3 and 4 banks. The OJK assesses that banking funds rate has been at out of the ordinary, because the impact on the high cost economy is slowing of growth and declining in economic activity, decreasing in credit portfolio expansion, and increasing of credit risk.
The average trend of interest rate of fund on the industry from early 2014 until July 2014 show that the rupiah deposits have increased by around 70 bps, from 7.97% in January 2014 to 8.67% in August 2014. While
50Service Quality, Interest Rate, andDeposit on Call on Profitability
the provision of interest rates on core depositors have generally been in the range of 11% especially in the bank group of BUKU 3 and 4. As for comparison, the average interest rate of funds in Malaysia, Singapore, and Thailand revolve around the 2% - 4% with credit interest rates in the range of 3 % -7%.
The problems of this study are as followed:1. How the Quality of Service, the interest rate, DOC,
and Profitability in Bank Mandiri Branch Office in PT. X are.
2. How the effect of the Quality of Service and the interest rate on DOC in Bank Mandiri Branch Office in PT. X are.
3. How the effect of the Quality of Service and the interest rate on Profitability in Bank Mandiri Branch Office in PT. X are.
4. How the effect of DOC on Profitability in Bank Mandiri Branch Office in PT. X is.
METHOD
Efriandy (2013) suggested a link between Quality of Service and DOC. Zafar, et.al. (2012) stated that there is a relationship between the construction of service quality and customer satisfaction, as well as satisfaction with customer loyalty. Becser (2007) suggested a link to the quality of the organization’s performance. Heybati et.al (2011) stated that five (5) dimensions of Quality of Service are Tangibles, Reliability, Responsiveness, Assurance, and Empathy effect on profitability.
Martini (2010) stated that the interest rate, exchange rate, and the Gross Domestic Product give effects on the number of third-party funds while inflation has no effect on the amount of third-party funds.
Shao-Bin Lin and Yi-Fang Hsieh (2010) stated that the interest rate is the second most influential factor on ROA after net assets (net worth). Lesmaya (2013) stated that the exchange rate, inflation, and SBI (Sertifikat Bank Indonesia) have no effect on profitability, while third party funds, interest rates, and CAR have positive effect on profitability. Khan and Sattar (2007) stated that there is a strong and positive relationship between the interest rate and the bank’s profitability.
Lesmaya’s Research (2013) is used as the basis for determining the DOC relationship with profitability. Relationships between variables shaping the research paradigm, as seen in Figure 1, with the hypothesis that (1) Quality of Service, has positive effect on DOC; (2) Quality of Service has positive effect on profitability; (3) Interest Rate has positive effect on DOC; (4) Interest Rates has positive effect on profitability; (5) DOC has positive effect on profitability.
This research is a quantitative research, using descriptive and verification method with primary and secondary data. Operationalization of variables can be seen in Table 7. The population of this study is 58 (fifty-eight) days of placing DOC of PT. X and Yakes
of PT. X in July 1st, 2015, to September 30th, 2015. The data collection technique used to measure the quality of service is a questionnaire with a sample and the unit of analysis as much as 58 customers of Bank Mandiri Branch Office in PT. X. The questionnaire was first tested for validity and reliability. The verification method used path analysis.
RESULT The performance of Bank Mandiri Branch Office of
PT. X has achieved good quality care on the dimension of Tangibles, Responsiveness and Empathy, but still it was less on the dimensions of Reliability and Assurance (Table 8). Bank Mandiri assigned four (4) types of interest rate of DOC: (1) the level of interest rate for 1-4 days, (2) 5-12 days, (3) 13-20 days, and (4) 21-28 days. The calculation of the number of classes, with the Sturgess rules (Ridwan, 2009: 54), obtained the number of classes for the data as much as 58 (fifty-eight) is equal to 7 (seven) or 8 (eight) class. Calculation of upper and lower limits for each DOC period are described and presented in Table 9.
Descriptive analysis of the level of interest rate indicates that Bank Mandiri tend to set low interest rates for all DOC periods (Tables 10-12), although the interest rate currently set is higher than in October 2014.
The interest rate was set by the Bank Mandiri Central policy and all applied to all branches. The impact of Bank Mandiri Branch Office of PT. X is that it cannot adjust the interest rates offered on PT. X if the interest rate of bank competitors were higher on the day when the Treasury of PT. X or Yakes of PT. X had to decide the bank and how long they had to deposit the money.
Bank Mandiri Branch Office in PT. X only had two DOC customers, namely PT. X and Yakes of PT. X. To compete to state-owned bank to obtain DOC of PT. X, PT. X need to make some regulations on SOE Synergy (obligation to make cooperation between SOEs), so that PT. X’s DOC could only be placed in state-owned banks. Different conditions to obtain DOC of Yakes Telkom are to having to deal with the entire Bank in Bandung, because it is not bound by government regulations regarding SOE Synergy.
DOC is based on a consideration of the funding requirements of two agencies. If within a period the two agencies funding requirement is high, then the amount of deposited DOC will be low. Treasury department of both PT. X and Yakes of PT. X will then determine which bank they will store the deposits in the next step. Consideration of the placement will depend on the interest rate offered by banks.
The majority (93.10%) of the amount of DOC of PT. X in Bank Mandiri Branch Office in PT. X is located at a class of less than Rp 643 billion, and the majority (93.10%) of the amount of DOC of Yakes of PT. X is in a class of less than Rp 106 billion. The average of
51 TrikonomikaVol. 15, No. 1, June 2016
Renny SunarnyEllen Rusliati
ROA of Bank Mandiri Branch Office in PT. X currently reached 2.15%, lower than the overall ROA of Bank Mandiri during the 2010-2014 period. This is due to Bank Mandiri Branch Office in PT. X is basically a branch that is focused on PT. X and do not serve the large public as other branches. As a result, ROA non DOC services are lower because the existing customers are only the employees of PT. X.
ROA Bank Mandiri Branch Office in PT. X currently averaged 2:15 ROA% lower than the Bank as a whole during the 2010-2014 period. This is due, Bank Mandiri Branch Office in PT. X is basically a branch that is focused on PT. X and not serve the public at large as well as other branches. As a result, ROA non DOC lower services for existing customers only employees of PT. X only.
Based on the test of the hypothesis obtained as follows (Table 13):1. The effect of Quality of Service on Profitability is
significant and positive.2. The effect of Quality of Service on DOC is not
significant.3. The effect of Interest Rate on DOC is significant
and positive.4. The effect of Interest Rate on profitability is
significant and positive.5. The effect of DOC on Profitability is significant
and positive.
The indirect effect of Interest Rate on Profitability is 0.989 x 1.520 or 1.503. It means that the higher the interest rates, the higher the profitability if DOC is high. The indirect effect coefficient of Interest Rate on Profitability through DOC is greater than the coefficient of direct effect of Interest Rate on Profitability, which means Interest Rate has more influence on Profitability through DOC than direct influence on Profitability.
The better the Quality of Service will increase customer trust, satisfaction and loyalty therefore DOC increased (Efriandy, 2013; Zafar, et.al, 2011). The hypothesis test showed that the Quality of Service has no significant effect on DOC. This result is contrary to the hypothesis. There are three logical explanations for the causes:1. Quality of Service measured by customers of Bank
Mandiri Branch Office in PT. X is not a decision maker in the amount of allocated funds in DOC. Respondents are employees of PT. X and Telkom Group that have office in the Central Building PT. X, which requires non-DOC services, such as account opening, handling credit card bills and loan repayments. This hypothesis may be proven if used benchmarks of deposits of individuals, not DOC.
2. The main consideration about how much money is allocated to DOC is the amount of unused funds for a certain period. After that the Treasury of PT. X
or Yakes of PT. X look for info on bank that offers the highest interest rate. Thus, however good the Quality of Services provided by Bank Mandiri Branch Office in PT. X cannot increase or decrease DOC, both the amount of nominal and period.
3. The study did not observe differences in the Quality of Services provided as well as the interest rate offered by Bank Mandiri compared to competitors. Hypothesis of the relationship between Quality of Service and DOC may be evident if a comparison with competitors using the hypothesis that banks that give better quality services will gain greater DOC.
This study supports Becser’s research (2007); Heybati et.al (2011) that the relationship Quality of Service and Profitability is directly proportional. The level of Quality of Services of Bank Mandiri Branch Office in PT. X has exceeded customer expectations in Tangibles, Responsiveness, and Empathy indicator, while at the Reliability and Assurance indicator is still below expectations. This shows that Bank Mandiri Branch Office in PT. X still have to improve performance, especially in the field of Reliability and Assurance to obtain higher profitability, through the various services offered outside the DOC services.
The results of the research support the statement of Martini (2010) that the relationship between interest rate and DOC is directly proportional. Practical implications arising from the evidence of this hypothesis are that Bank Mandiri Branch Office in PT. X has difficulties in increasing the amount of DOC. This is evident in the amount of funds deposited by PT. X and Yakes in their DOC with the majority (93.10%) located in the lowest class.
The interest rate does affect the DOC, but Bank Mandiri Branch Office in PT. X cannot immediately adjust interest rates to be offered to PT. X and Yakes of PT. X. Special interest rate is set by Bank Mandiri Central that must be obeyed by all branches. In fact, the Treasury department of PT. X and Yakes of PT. X constantly monitor movements in interest rates. PT. X is still bound by government regulations regarding synergy to simply transfer funds to the state banks, but Yakes PT. X is not bound by the rules of synergy and Bank Mandiri Branch Office in PT. X is facing more competitors to obtain DOC fund. The Treasury is bound by the rules of the company and afraid to be audited that the primary decision of DOC fund placements based on interest rate they run strictly. At this point the difference in behavior between corporate customers with a personal show up, so that led to the hypothesis of quality of service determines the amount of DOC in Bank Mandiri Branch Office in PT. X is not proven.
Lin and Hsieh (2008), Lesmaya (2013), and Khan and Sattar (2014) stated that the interest rate effect on profitability. Their research stated that customers tend
52Service Quality, Interest Rate, andDeposit on Call on Profitability
to put money in the bank that provides a greater rate, therefore banks that provide greater interest rate have reserved of more public funds to be distributed, and eventually increase profitability.
There are two lines that express the influence of interest rates on profitability in this study:a. The direct effect of interest rate on the profitability
of the influence index of 0.441; andb. Effect of Indirect Interest Rates on profitability
through DOC with indirect influence index of 1.503.
The influence of interest rates on profitability indirectly through DOC is greater than the direct effect of interest rates on profitability. That is, the higher the interest rate, the higher the profitability if the value of DOC is high. The findings of this study support Hsieh and Lin (2008), where the interest rate effect on profitability.
The results of verification data processing shows that an increase in interest rates would encourage increased DOC that will improve ROA. Practical impact on the above findings is Bank Mandiri Branch Office in PT. X needs to provide input on Bank Mandiri Central on competitive interest rates so that the amount of DOC of PT. X and Yakes of PT. X increased.
Practically an increase in interest rates to boost profitability cannot be freely done. Banking interest rate in Indonesia is regulated by Bank Indonesia regulation and OJK, which is responsible for monitoring the security of third-party funds that are stored in banks in Indonesia. Bank Mandiri can only offer interest rates at a limited level, in accordance with the range set by the government. Thus, the steps that can be taken by the Bank Mandiri Branch Office in PT. X is to provide input to Bank Mandiri Central on the interest rate offered by bank competitor or request the authority to set interest rates more competitive in a range that is allowed.
The results support the Lesmaya’s research (2013) which stated that the Third Party Funds have a significant effect on Profitability. Higher DOC allows banks to channel greater public funds in banking activities that generate profit. If we compare the effect Quality of Service on Profitability (influence coefficient 0.387), the effect of Interest Rate on Profitability (influence coefficient 0.441), and the effect of DOC on Profitability (influence coefficient of 1.52), the most influential is DOC on Profitability.
The level of profitability of Bank Mandiri Branch Office in PT. X reach the average of 2.15%, with the highest frequency ROA is in a class of 2,336% - 3,456%, 1,214% - 2,335% and 2,336% - 3,456%. Achieved ROA is still very high considering that this achievement is daily calculated. Nonetheless, ROA is achieved by the high quality of service on individual customer of employees of PT. X. ROA can be increased again by given the role of DOC which is greater in the formation
of ROA than the quality of service.Practical implications of this research are that Bank
Mandiri Branch Office in PT. X needs to provide input regarding the interest rate set by competitors or request the authority to set interest rates to be more competitive (decentralization) in the range that is allowed to drive profitability.
CONCLUSION
The conclusion of this study can be stated as followed:1. The condition of Bank Mandiri Branch Office in
PT. X at this point are as followed:a. Quality of Service exceeds customer
expectations in the dimension of Tangibles, Empathy and Responsiveness, but they still have to improve the performance on the Reliability and Assurance dimension to match the customer’s expectation. Among others:• The attractiveness of the printed material and
promotional display (Tangibles dimension).• The pertinence of the appointment within
the completion of the work, sincere interest in solving the problem of customers, the precision work procedures since the beginning (Reliability dimension).
• The pertinence of the appointment in time to start the work (Responsiveness dimensions).
• The consistency of hospitality towards customers, knowledge of employees in answering customer questions (Assurance dimension).
• The personal attention given to the bank’s clients (Empathy dimension).
b. Interest rate of DOC of Bank Mandiri tends to be lower than the average interest rates.
c. DOC of PT. X and Yakes of PT. X majority (93.10%) were in the lowest category or class.
d. ROA of Bank Mandiri Branch Office in PT. X is overall under the average of Bank Mandiri during the 2010-2014 period.
2. Quality of service has a positive but not significant effect on DOC in Bank Mandiri Branch Office in PT. X, so the improvement of the quality of service was not proven to increase DOC. Interest Rate has a positive and significant effect on DOC of Bank Mandiri Branch Office in PT. X. Meanwhile, the higher the interest rate offered, DOC tends to increase.
3. Quality of service and interest rate have positive and significant effect on the profitability of Bank Mandiri Branch Office in PT. X. The higher the quality of the service and the interest rate on Bank Mandiri Branch Office in PT. X, profitability increased.
4. The amount of DOC in Bank Mandiri Branch
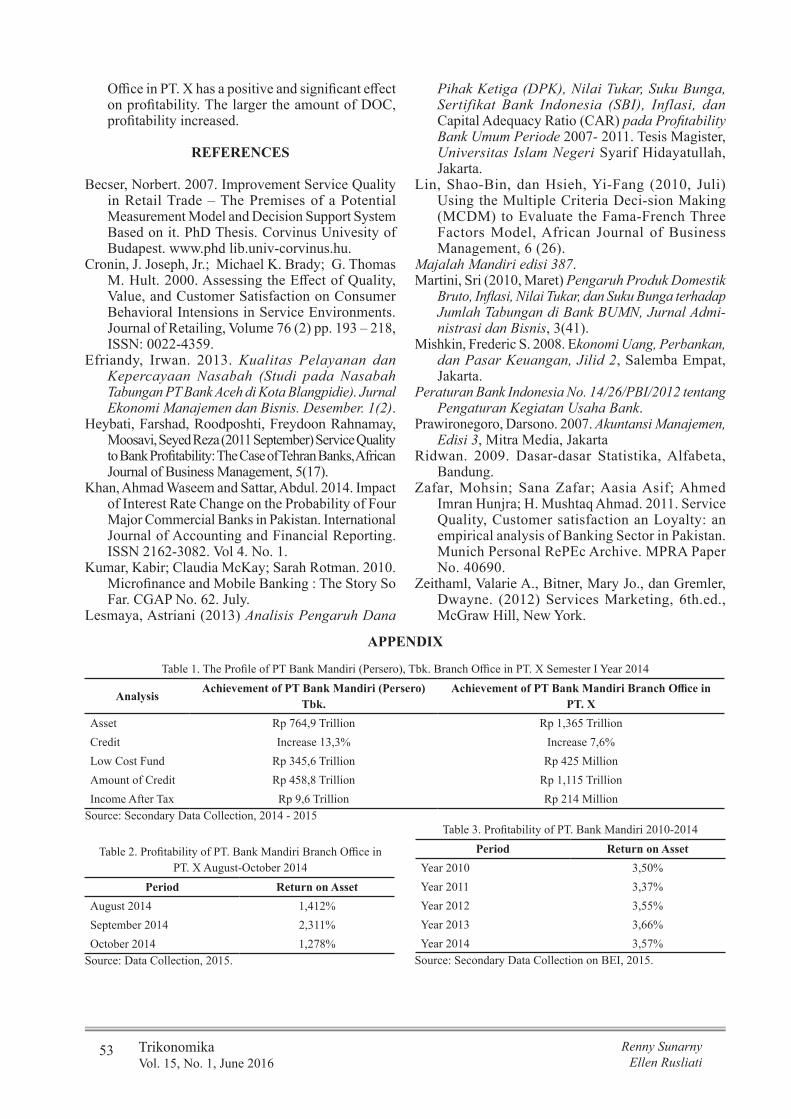
53 TrikonomikaVol. 15, No. 1, June 2016
Renny SunarnyEllen Rusliati
Office in PT. X has a positive and significant effect on profitability. The larger the amount of DOC, profitability increased.
REFERENCES
Becser, Norbert. 2007. Improvement Service Quality in Retail Trade – The Premises of a Potential Measurement Model and Decision Support System Based on it. PhD Thesis. Corvinus Univesity of Budapest. www.phd lib.univ-corvinus.hu.
Cronin, J. Joseph, Jr.; Michael K. Brady; G. Thomas M. Hult. 2000. Assessing the Effect of Quality, Value, and Customer Satisfaction on Consumer Behavioral Intensions in Service Environments. Journal of Retailing, Volume 76 (2) pp. 193 – 218, ISSN: 0022-4359.
Efriandy, Irwan. 2013. Kualitas Pelayanan dan Kepercayaan Nasabah (Studi pada Nasabah Tabungan PT Bank Aceh di Kota Blangpidie). Jurnal Ekonomi Manajemen dan Bisnis. Desember. 1(2).
Heybati, Farshad, Roodposhti, Freydoon Rahnamay, Moosavi, Seyed Reza (2011 September) Service Quality to Bank Profitability: The Case of Tehran Banks, African Journal of Business Management, 5(17).
Khan, Ahmad Waseem and Sattar, Abdul. 2014. Impact of Interest Rate Change on the Probability of Four Major Commercial Banks in Pakistan. International Journal of Accounting and Financial Reporting. ISSN 2162-3082. Vol 4. No. 1.
Kumar, Kabir; Claudia McKay; Sarah Rotman. 2010. Microfinance and Mobile Banking : The Story So Far. CGAP No. 62. July.
Lesmaya, Astriani (2013) Analisis Pengaruh Dana
Pihak Ketiga (DPK), Nilai Tukar, Suku Bunga, Sertifikat Bank Indonesia (SBI), Inflasi, dan Capital Adequacy Ratio (CAR) pada Profitability Bank Umum Periode 2007- 2011. Tesis Magister, Universitas Islam Negeri Syarif Hidayatullah, Jakarta.
Lin, Shao-Bin, dan Hsieh, Yi-Fang (2010, Juli) Using the Multiple Criteria Deci-sion Making (MCDM) to Evaluate the Fama-French Three Factors Model, African Journal of Business Management, 6 (26).
Majalah Mandiri edisi 387.Martini, Sri (2010, Maret) Pengaruh Produk Domestik
Bruto, Inflasi, Nilai Tukar, dan Suku Bunga terhadap Jumlah Tabungan di Bank BUMN, Jurnal Admi-nistrasi dan Bisnis, 3(41).
Mishkin, Frederic S. 2008. Ekonomi Uang, Perbankan, dan Pasar Keuangan, Jilid 2, Salemba Empat, Jakarta.
Peraturan Bank Indonesia No. 14/26/PBI/2012 tentang Pengaturan Kegiatan Usaha Bank.
Prawironegoro, Darsono. 2007. Akuntansi Manajemen, Edisi 3, Mitra Media, Jakarta
Ridwan. 2009. Dasar-dasar Statistika, Alfabeta, Bandung.
Zafar, Mohsin; Sana Zafar; Aasia Asif; Ahmed Imran Hunjra; H. Mushtaq Ahmad. 2011. Service Quality, Customer satisfaction an Loyalty: an empirical analysis of Banking Sector in Pakistan. Munich Personal RePEc Archive. MPRA Paper No. 40690.
Zeithaml, Valarie A., Bitner, Mary Jo., dan Gremler, Dwayne. (2012) Services Marketing, 6th.ed., McGraw Hill, New York.
Table 1. The Profile of PT Bank Mandiri (Persero), Tbk. Branch Office in PT. X Semester I Year 2014
AnalysisAchievement of PT Bank Mandiri (Persero)
Tbk.Achievement of PT Bank Mandiri Branch Office in
PT. XAsset Rp 764,9 Trillion Rp 1,365 TrillionCredit Increase 13,3% Increase 7,6%Low Cost Fund Rp 345,6 Trillion Rp 425 MillionAmount of Credit Rp 458,8 Trillion Rp 1,115 TrillionIncome After Tax Rp 9,6 Trillion Rp 214 Million
Source: Secondary Data Collection, 2014 - 2015
APPENDIX
Table 2. Profitability of PT. Bank Mandiri Branch Office inPT. X August-October 2014
Period Return on AssetAugust 2014 1,412%September 2014 2,311%October 2014 1,278%
Source: Data Collection, 2015.
Table 3. Profitability of PT. Bank Mandiri 2010-2014Period Return on Asset
Year 2010 3,50%Year 2011 3,37%Year 2012 3,55%Year 2013 3,66%Year 2014 3,57%
Source: Secondary Data Collection on BEI, 2015.

54Service Quality, Interest Rate, andDeposit on Call on Profitability
Table 4. Ranking of Service Excellence of PT. Bank Mandiri Compared to Other BanksCATEGORY Bank Mandiri Rank Other Banks Rank
Best overall performance 1 BNI (2)Customer service 1 BNI (2)Teller 2 Danamon (1)Security 1 BNI (2)Phone Banking Officer 1 Permata (2)Overall E-Banking 1 BRI (2)Internet Banking 1 BCA (2)
Source: Mandiri Magazine 387th Edition, 2014, pg. 10.
Table 5. Deposit on Call of PT. X in Bank Mandiri BranchPeriod Amount of DOC of PT Telkom
August 2014 Rp. 4.442.486.000,00September 2014 Rp. 2.975.500.000,00October 2014 Rp. 918.000.000,00
Source: Secondary Data Collection, 2015
Table 6. Interest Rate of Deposit on Call of SOE Bank, October, Year 2014
Bank Name
1 - 4 days
5 - 12 days
13 - 20 days
21 - 28 days
BRI - 7,00% - -BTN - 5,50% 5,50% -BNI 5,00% 5,10% 5,30% 5,60%Mandiri 4,90% 5,50% 5,90% 6,20%
Source: Treasury Dept. of Yakes of PT. X 2014.
Table 7. Operationalization of VariableVariable Dimension Indicator Scale No Item
Quality Of Service (X1)The performance level of the company to meet customer expectations (Zeithamlet .al, 2012:214)
Tangibles (X11)Appearance of physical facilities, equipment, employees, and communication material
The equipment used has modern look Ordinal 1The attractiveness of the physical facilities of bank 2Neat appearance of employee 3The attractiveness of the printed material and promotional display;
4
Pertinence of appointment in terms of time of completion of the work;
5
Reliability (X12)Ability to perform the promised service independently and accurately
Sincere interest in solving customer problems; 6The accuracy of the work execution procedure from the beginning;
7
Pertinence of appointment in terms of time of execution of work;
8
Persistence to provide defect-free services; 9Responsiveness (X13)Willingness to help customers and provide prompt service
Pertinence of appointment time to start the work; 10The fast paced services to clients; 11Consistency in terms of willingness to serve customers; 12The willingness to leave the bustle to serve customer demand; 13
Assurance (X14)Knowledge, politeness, as well as the proficiency of employees in maintaining customer trust
Ability to foster customers trust; 14Customers feeling safe in dealing with bank; 15Consistence hospitality to customers; 16Knowledge of employees in answering customer questions; 17
Empathy (X15)The personal attention and care shown by Bank Mandiri Branch Office in PT. X
The personal attention given to the bank customer; 18Leisure bank operating hours for customers; 19The willingness of employees providing personal attention to the customer;
20
The willingness of banks to prioritize to the best interests of customers;
21
The willingness of employees to understand the special needs of customers.
22

55 TrikonomikaVol. 15, No. 1, June 2016
Renny SunarnyEllen Rusliati
Interest Rate (X2)The compensations granted by banks to customers who buy or sell products(Mishkin, 2007:4)
Interest Rate of Deposit on Call (X21)The returns on services rendered by the bank to depositors of Deposit on Call in accordance with the period of the savings
Interest Rate 1 – 4 Days IntervalInterest Rate 5 – 12 DaysInterest Rate 13 – 20 DaysInterest Rate 21 – 28 Days
Deposit on Call (Y1)Deposits with a maturity of at least 1 Day and a maximum of less than 1 month
Deposit on Call (Y1)Deposits with a maturity of at least 1 Day and a maximum of less than 1 month
Interval
Profitability (Y2)Corporate size in gaining profit (Prawironegoro,2010:58)
Return on Asset (Y2)Financial ratios express how much profit is generated divided by total assets
(Profit before tax according to Daily Trial Balance)(Total Assets according to Daily Trial Balance)
Interval
Table 8. Summary of Quality of Service (X1) Variable Descriptive Analysis
Expectation PerformanceQuality Of
Service
X11 Tangibles
Equipments 4,024
4,070
4,228
4,234
-0,203
0,165
Tangible Facility 4,007 4,414 -0,407Employee’s Neatness 3,997 4,366 -0,369Promotion Materials 4,252 3,931 0,321On time work completion 4,055 3,993 0,062Sincere interest 4,097 3,931 0,166
X12 Reliability
Prosedure precision 4,431
4,286
4,290
4,232
0,141
-0,054On time work execution 4,410 4,462 -0,052Defec-free service 4,434 4,483 -0,048Starting to work on time 3,990 3,872 0,117
X13 Responsiveness Fast paced service 4,159
4,075
4,366
4,197
-0,207
0,122Consistent in serving 4,007 4,276 -0,269Willingness to leave the bustle 4,145 4,272 -0,128Foster trust 4,117 4,390 -0,272
X14 Assurance
Sense of security 4,162
4,220
4,321
4,172
-0,159
-0,048Friendliness 4,307 3,952 0,355Knowledge 4,293 4,024 0,269Bank’s attention 4,397 3,917 0,479Comfort 4,107 4,300 -0,193
X15 EmpathyEmployee’s attention 4,186
4,1464,466
4,213-0,279
0,067Prioritize customer 4,007 4,338 -0,331Special need 4,034 4,045 -0,010
Source: Data Processing, 2015.
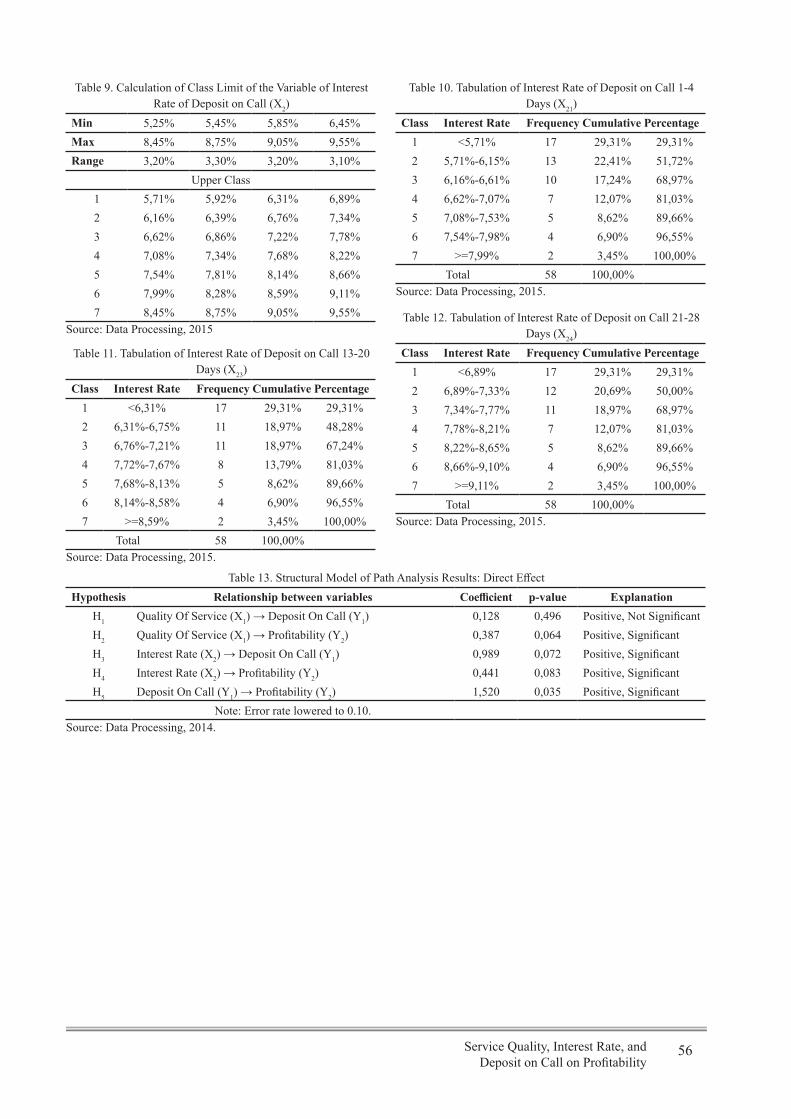
56Service Quality, Interest Rate, andDeposit on Call on Profitability
Table 9. Calculation of Class Limit of the Variable of Interest Rate of Deposit on Call (X2)
Min 5,25% 5,45% 5,85% 6,45%Max 8,45% 8,75% 9,05% 9,55%Range 3,20% 3,30% 3,20% 3,10%
Upper Class1 5,71% 5,92% 6,31% 6,89%2 6,16% 6,39% 6,76% 7,34%3 6,62% 6,86% 7,22% 7,78%4 7,08% 7,34% 7,68% 8,22%5 7,54% 7,81% 8,14% 8,66%6 7,99% 8,28% 8,59% 9,11%7 8,45% 8,75% 9,05% 9,55%
Source: Data Processing, 2015
Table 10. Tabulation of Interest Rate of Deposit on Call 1-4 Days (X21)
Class Interest Rate Frequency Cumulative Percentage1 <5,71% 17 29,31% 29,31%2 5,71%-6,15% 13 22,41% 51,72%3 6,16%-6,61% 10 17,24% 68,97%4 6,62%-7,07% 7 12,07% 81,03%5 7,08%-7,53% 5 8,62% 89,66%6 7,54%-7,98% 4 6,90% 96,55%7 >=7,99% 2 3,45% 100,00%
Total 58 100,00%Source: Data Processing, 2015.
Table 11. Tabulation of Interest Rate of Deposit on Call 13-20 Days (X23)
Class Interest Rate Frequency Cumulative Percentage1 <6,31% 17 29,31% 29,31%2 6,31%-6,75% 11 18,97% 48,28%3 6,76%-7,21% 11 18,97% 67,24%4 7,72%-7,67% 8 13,79% 81,03%5 7,68%-8,13% 5 8,62% 89,66%6 8,14%-8,58% 4 6,90% 96,55%7 >=8,59% 2 3,45% 100,00%
Total 58 100,00%Source: Data Processing, 2015.
Table 12. Tabulation of Interest Rate of Deposit on Call 21-28 Days (X24)
Class Interest Rate Frequency Cumulative Percentage1 <6,89% 17 29,31% 29,31%2 6,89%-7,33% 12 20,69% 50,00%3 7,34%-7,77% 11 18,97% 68,97%4 7,78%-8,21% 7 12,07% 81,03%5 8,22%-8,65% 5 8,62% 89,66%6 8,66%-9,10% 4 6,90% 96,55%7 >=9,11% 2 3,45% 100,00%
Total 58 100,00%Source: Data Processing, 2015.
Table 13. Structural Model of Path Analysis Results: Direct EffectHypothesis Relationship between variables Coefficient p-value Explanation
H1 Quality Of Service (X1) → Deposit On Call (Y1) 0,128 0,496 Positive, Not SignificantH2 Quality Of Service (X1) → Profitability (Y2) 0,387 0,064 Positive, SignificantH3 Interest Rate (X2) → Deposit On Call (Y1) 0,989 0,072 Positive, SignificantH4 Interest Rate (X2) → Profitability (Y2) 0,441 0,083 Positive, SignificantH5 Deposit On Call (Y1) → Profitability (Y2) 1,520 0,035 Positive, Significant
Note: Error rate lowered to 0.10.Source: Data Processing, 2014.

57 TrikonomikaVol. 15, No. 1, June 2016
Renny SunarnyEllen Rusliati
Figure 1. Research Paradigm
Quality of Service
Deposit on Call
Interest Rate
Profitability
Efriandy (2013), Zafar, et. al. (2011)
Becser, 2007Heybati, et.al.2011
Martini (2010)
Lesmaya (2013)
Hsieh dan Lin (2010)Lesmaya (2013)Khan and Sattar (2014)
Source: Previous Research Synthesis, 2015.
Quality of Service(X1)
Deposit on Call(Y1)
Interest Rate(X2)
ProfitabilityReturn on Asset
(Y2)
X11
X12
X13
X14
X15
X21
X22
X23
X24
Y11
Y12
Y21
.387
.441
1.52
.989
.128
Source: Data Processing, 2015.
Figure 2. Path Analysis Result