Tribology of newly developed EAL versus water in ... - DIVA
47
Tribology of newly developed EAL versus water in hydropower turbine bearings Nayan Dhakal Mechanical Engineering, master's level (120 credits) 2019 Luleå University of Technology Department of Engineering Sciences and Mathematics
-
Upload
khangminh22 -
Category
Documents
-
view
3 -
download
0
Transcript of Tribology of newly developed EAL versus water in ... - DIVA

Tribology of newly developed EAL versus
water in hydropower turbine bearings
Nayan Dhakal
Mechanical Engineering, master's level (120 credits)
2019
Luleå University of Technology
Department of Engineering Sciences and Mathematics

i
Acknowledgment
The work presented in this thesis is carried out at the Division of Machine Elements at the Luleå
University of Technology, Sweden as a part of the Erasmus Mundus Joint European Master in Tribology
of Surfaces and Interfaces – TRIBOS programme. I would like to thank Education, Audiovisual &
Culture Executive Agency (EACEA) and Erasmus+ programme of the European Union for funding this
programme. I would also like to express my appreciation to the TRIBOS consortium for providing me
with this opportunity.
I would like to express my sincerest gratitude to my supervisors, Professor Nazanin Emami and Associate
Professor Yijun Shi for their valuable suggestions, motivations, and encouragement. Finally, I am always
grateful to my colleagues, staff and laboratory technicians at the TRIBOLAB, Luleå University of
Technology, Sweden for their assistance during this project.
Nayan Dhakal
Luleå, August 2019

ii
Abstract
The increasing demand for more readily bio-degradable, renewable and non-toxic environmentally
adaptive lubricants with a lower degree of bioaccumulation has escalated the investigation of water-based
lubricants as the potential alternatives for conventional mineral-based oils. Water is an excellent
environmentally adapted lubricant; however, it is a low viscous fluid and holds downsides of having
corrosive nature and extremely low pressure-viscosity coefficient leading to insufficient load-carrying
capacity. These shortcomings make pure water a poor choice for operations involving high load and low
speed, for instance, within hydropower applications. Therefore, the choice of appropriate modifiers and
additives is crucial to improve the viscosity, friction-reducing performance and anti-wear properties of
water as a base lubricant. Appropriate selection and combination of bearing materials also significantly
improve the tribological performance of the lubricants. In the presented work, tribological behavior of
polyvinylpyrrolidone (PVP) and poly(sodium 4-styrenesulfonate) (PSS) thickening agents with water as
a base fluid in the lubrication of pure UHMWPE and SCF reinforced UHMWPE bearing materials has
been investigated individually under reciprocating tribometer. The results showed that both PVP and
PSS are excellent viscosity modifiers. PVP exhibited excellent friction-reducing and anti-wear
performance, while PSS revealed increased wear rates with an insignificant reduction of friction
coefficients. This study aims to explore the potential for using newly developed water-based lubricants
in the replacement of traditional mineral-based lubricants for hydropower turbine bearings.

iii

iv
Table of Contents
Acknowledgment ........................................................................................................................... i
Abstract ........................................................................................................................................ ii
List of Figures .............................................................................................................................. vi
List of Tables ............................................................................................................................... vi
1 Introduction .......................................................................................................................... 1
1.1 Hydropower ....................................................................................................................... 1
1.2 Hydrodynamic Sliding Bearings .......................................................................................... 1
1.3 Wear Mechanisms .............................................................................................................. 3
1.3.1 Abrasive Wear ................................................................................................................ 3
1.3.2 Adhesive Wear ............................................................................................................... 3
1.4 Environmentally Adaptive Lubricants (EALs) ...................................................................... 4
1.5 Water Lubrication .............................................................................................................. 5
1.6 Materials ............................................................................................................................. 7
Polyvinylpyrrolidones (PVP) ........................................................................................... 7
Poly(sodium 4-styrenesulfonate) (PSS) ............................................................................ 8
UHMWPE ..................................................................................................................... 9
Short Carbon Fiber (SCF) ............................................................................................... 9
1.7 Research Gap ................................................................................................................... 10
1.8 Research Objectives ......................................................................................................... 11
2 Experimental Methodology ................................................................................................... 12
2.1 Preparation of modified water-based lubricants ................................................................. 12
2.2 Viscosity measurements .................................................................................................... 12
2.3 Measurement of tribological properties ............................................................................. 13
2.4 Scanning Electron Microscope (SEM) ............................................................................... 15
2.5 Wettability ....................................................................................................................... 16
3 Results and Discussion .......................................................................................................... 17
3.1 Enhancement of Viscosity ................................................................................................. 17
3.2 Tribological Characterization ............................................................................................ 19
3.2.1 Friction and wear performance ...................................................................................... 19
3.2.2 SEM Analysis ................................................................................................................ 27
3.3 Contact angle measurements ............................................................................................. 31
4 Conclusion .......................................................................................................................... 32
5 Recommendations ............................................................................................................... 33
References .................................................................................................................................. 34

v

vi
List of Figures
Figure 1 Tilting pad thrust bearing (Kingsbury Bearing Inc.) .............................................................................. 2 Figure 2 Dynamic viscosity of water versus temperature ..................................................................................... 5 Figure 3 Chemical Structure of PVP ................................................................................................................. 7 Figure 4 Brookfield viscosity of PVP at various % w/w concentrations ............................................................... 8 Figure 5 Chemical Structure of PSS .................................................................................................................. 8 Figure 6 Experimental workflow ..................................................................................................................... 12 Figure 7 Bohlin Rheometer & schematic diagram of Cylinder on Cup ............................................................. 13 Figure 8 Cameron Plint TE77 Tribometer ...................................................................................................... 13 Figure 9 Schematic diagram of test configuration & wear scar on SS countersurface .......................................... 14 Figure 10 JEOL JSM-IT300 SEM ................................................................................................................... 15 Figure 11 Attension Theta optical tensiometer ................................................................................................. 16 Figure 12 Enhancement of viscosity with different concentrations of PVP and PSS ........................................... 17 Figure 13 Variation of viscosity with time for aqueous solutions of PVP and PSS ............................................. 17 Figure 14 Variation of the viscosity for aqueous solutions of a) PVP and b) PSS ................................................ 18 Figure 15 Dependence of friction coefficient of UHMWPE on the concentration of PVP ................................ 19 Figure 16 Variation of friction coefficient of UHMWPE on friction time for 20% PVP .................................... 20 Figure 17 Dependence of specific wear rates of UHMWPE pins on the concentration of PVP.......................... 20 Figure 18 Dependence of friction coefficient of UHMWPE on the concentration of PSS ................................. 22 Figure 19 Dependence of specific wear rates of UHMWPE pins on the concentration of PSS........................... 22 Figure 20 Variation of friction coefficient of UHMWPE on friction time for 20% PSS ..................................... 23 Figure 21 Dependence of friction coefficient of SCF reinforced UHMWPE on the concentration of PVP ........ 24 Figure 22 Dependence of specific wear rates of SCF reinforced UHMWPE on the concentration of PVP ......... 25 Figure 23 Dependence of friction coefficient of SCF reinforced UHMWPE on the concentration of PSS ......... 25 Figure 24 Dependence of specific wear rates of SCF reinforced UHMWPE on the concentration of PSS .......... 26 Figure 25 Worn UHMWPE pin surfaces (20% PVP, 20 MPa, 2 hours) ............................................................ 27 Figure 26 Worn UHMWPE pin surfaces (20% PVP, 20 MPa, 20 hours) .......................................................... 27 Figure 27 Worn UHMWPE pin surfaces (20% PSS, 20 MPa, 2 hours) ............................................................. 28 Figure 28 Worn UHMWPE pin surfaces (20% PSS, 20 MPa, 20 hours) ........................................................... 28 Figure 29 Worn SCF reinforced UHMWPE pin surfaces (20% PVP, 20 MPa, 2 hours) .................................... 29 Figure 30 Worn SCF reinforced UHMWPE pin surfaces (20% PSS, 20 MPa, 2 hours) ..................................... 29 Figure 31 SS counter surface plate after sliding lubricated with A) 20% PVP and B) 20% PSS ........................... 30 Figure 32 Dependence of contact angles on the concentration of PVP ............................................................. 31
List of Tables
Table 1 Properties of PVP40 ............................................................................................................................. 7 Table 2 Properties of PSS .................................................................................................................................. 8 Table 3 Characteristics of UHMWPE ............................................................................................................... 9 Table 4 Experimental conditions for Cameron Plint TE77 ............................................................................... 14 Table 5 Test sequence 1 PSS (20 MPa contact pressure) ................................................................................... 21

vii

1
1 Introduction
1.1 Hydropower
Energy generation from the water with hydropower plants is the preferred form of renewable energy.
Swedish Energy Agency (2019) stated that over 40% (64.6 TWh) of total electricity produced in 2017
(160.2 TWh) was from the hydroelectric power plants in Sweden, while 96% of Norway’s electricity is
from hydropower [1]. Increasing demand and positive perspective towards renewable energy are
continuously attracting researchers to find the aspects which will increase the efficiency of hydropower
generation and reduce energy loss during production as well as supply.
Hydropower turbines frequently operate at low speed and extremely high load conditions. In such conditions, friction behavior due to contact between the opposing surfaces and lubrication plays a vital role in the improvement of efficiency. Friction between mating surfaces results in the generation of localized heat and stress leading to a rise in temperature and generation of wear particles, ultimately causing early material damage and unexpected plant failure. In addition, during peak electricity demand, for instance, during the evenings or when electric heaters are used during the sudden temperature drop, power plants are being started and stopped frequently to meet these power demands. These rapid changes and extra load placed on the power generation system increases the mechanical strain [2]. All these factors result in increased maintenance costs and reduced operating efficiency of the whole system.
Conventional mineral oils have been used as the lubricating fluid for turbine bearings for long. However,
the environmental effects of mineral-based oils due to the spillage, leakage, or even after the disposal
have raised concerns about the safety of the earth, plants, and animal life. The demand for more readily
bio-degradable, renewable, non-toxic environmentally adaptive lubricants has increased the investigation
and search of potential alternatives for mineral-based oils. Improving the performance of hydropower
from the tribological perspective can be concerned with friction improvement and lubrication
performance. It has been established that the reduction in friction can be achieved by improving the
lubrication performance. Increasing the load-carrying capacity of the bearings within the existing
dimensional constraints, the influence of rapid changes in load and speed, reduced wear with an increased
life of lubricants using environmentally adaptive alternatives can be the prime focal points leading to the
reduced energy loss and increased efficiency.
1.2 Hydrodynamic Sliding Bearings
Hydrodynamic sliding bearings are the type of bearings where two conformal surfaces slide relative to
one another with the distributed load across the interface, for instance, journal bearings, thrust bearings,
and shaft bushings. The choice of lubricant in such bearings can be a key to reducing the friction between
contacts and the formation of a stable lubricant film. Sliding bearings are supposed to have a long service
life and operate for their lifespan if the employed lubrication method generates fluid film thickness
enough to separate the contacting surfaces. This, however, becomes challenging when high electricity
demand is placed on the system and such bearings become susceptible to damage during start-up.
During the normal running phase, the bearing face is separated from the shafts by a hydrodynamically
generated lubricant film. At start-up, due to the inevitable high load and low speed, the lubricant film
breaks down, and the surfaces come in contact. Figure 1 [3] shows the tilting pad thrust bearing with a
converging gap. During steady-state operating conditions, lubricant flows in this converging wedge due
to the relative motion of contacting surfaces and the available volume is reduced. This tilting pad helps
to the pressure build-up in the lubricating film. The resulting pressure distribution by such pressurized
film provides maximum load-carrying capacity, as it is operating under the hydrodynamic lubrication
domain.

2
On the contrary, during transient state conditions, the system is dragged under the boundary/mixed
lubrication domain due to high load and low speed, whilst the load is primarily transferred through the
surface asperities in contact. This lubrication regime is associated with high friction and wear conditions
relative to the hydrodynamic lubrication. Thereby, sliding bearings are susceptible to damage due to the
rapid changes in operating parameters like load and speed during the start-up [2]. Thus, the appropriate
employment of lubricants can overcome such threats by reduction of friction with the formation of an
adequate film. Simultaneously, the choice of appropriate materials for the turbine bearings can also be
crucial for eliminating such damages as well.
Figure 1 Tilting pad thrust bearing (Kingsbury Bearing Inc.)
The most common choice of turbine bearing materials in hydropower applications for a long time was
Babbitt or white metal, a soft metal alloy coating along with tin, lead, copper, aluminum and bronze
base alloys. However, weaknesses such as thermal ratcheting, prone to corrosion, poor fatigue strength,
poor thermal and elastic properties had negative impacts over the efficiency of the system. The need to
improve the bearing performance by overcoming the drawbacks of babbitt faced bearing materials led to
the research on polymer composite materials [2]. Over the past 2 decades, polymer composite bearings
have been tested and used to be a suitable replacement for babbitted bearings improving the effectiveness
and overall machine efficiency.
The study for polymer-based materials, for instance, ultra-high molecular weight polyethylene
(UHMWPE) as hydropower bearing materials, has provided a significant amount of tribological
improvements in friction reduction and increased wear resistance [4]. Earlier, polyetheretherketone
(PEEK) and polyphenylene sulfide (PPS) in water-lubricated sliding contacts have been reported to yield
lower friction and wear behavior, attributed to the superior wear resistance of PPS to its chemical reaction
with steel countersurface [5]. Some polymers, however, such as polytetrafluoroethylene (PTFE) in water-
lubricated sliding contacts are known to decrease the wear-resistant properties of the polymer [6]. PTFE
alone has also been associated with high wear rates despite its low friction properties [7] in dry and wet
sliding conditions. The use of fillers and reinforcements are well known to increase the wear-resistant
behavior of PTFE [8-10]. In addition, it was concluded that the use of PTFE/glass-fiber composite faced
pad in hydro turbine bearings is capable of thicker lubricant film formation along with the reduction of
contact temperature leading to the increased load-carrying capacity [11].
Recently, high-performance bulk polymers were reviewed by Nunez (2019) [12] and demonstrated that
different blends of polymers, including PTFE and PEEK, show excellent friction and wear reduction
compared to unfilled polymers. Jean-Fulcrand A. et al. (2019) [13] observed that certain blends of
polymers, PEEK-PBI (polyetheretherketone-polybenzimidazole) in contact with steel ball can drastically
reduce the friction even at an elevated temperature of 280°C. Among the commercially available bearing
materials, Thordon Thorplas, homogeneous thermoplastic polymer bearing materials capable of
operating under high pressure of over 45 MPa and up to 90 MPa, are widely investigated for material
characterization [14] and applications in hydro turbines due to their low friction and wear rates under
wet conditions [15, 16].

3
1.3 Wear Mechanisms
Wear can be defined as a progressive loss of material due to the damage of a solid surface resulting from
the relative motion with another contacting surface. It can also sometimes be the degradation of the
surface material without any loss of material whilst changing the surface topography leading to damaging
of the surface [17]. Within hydropower applications, wear of the bearing surfaces and shaft increases the
clearance in between, which has adverse effects on bearing performance and efficiency of the overall
system.
Wear may be due to the various mechanical and chemical effects involving plastic deformation,
ploughing action, micro-cutting, cracking, fracture, chemical interaction, delamination and such. Wear
of polymers can be defined by mechanisms like abrasive wear, adhesive wear, fatigue wear, fatigue-
related delamination wear, and chemical wear. The discussion on polymer wear mechanisms in this
section will be constrained within abrasive and adhesive wear.
1.3.1 Abrasive Wear
Abrasive wear is caused by the abrasion action of harder material over softer surface interacting in physical
contact. Softer material wears out by the penetration of relatively hard asperities generating wear particles.
Primary modes of abrasive wear are cutting and ploughing. Sharp particle or hard asperity cuts the softer
surface and material removal occurs as wear debris, leading to the formation of wear tracks. Such micro-
chipping/cutting results in severe wear but at a shallow depth. Ploughing action, however, does not
remove the material from the surface but the material is shifted to the sides of wear tracks. Brittle materials
experience micro-fracture due to the merging of a few smaller cracks. Relatively ductile material, on the
other hand, is abraded by a blunt asperity and results in fatigue due to ploughing. Wear particles, in this
case, are not created immediately, but later get peeled off as the worn surface is repeatedly loaded and
unloaded and consequently, leads to the delamination wear.
The wear between two surfaces in contact is called two-body abrasion, where the particles are firmly
clamped and there is continuity of movement. It causes deep scratches and a high wear rate. The abrasion
caused by hard loose particles trapped in between two mating surfaces is termed as three-body abrasion.
Such particles are free to roll, slide and slip between the rubbing surfaces since they are not held rigidly.
Wear rate is lower in three body abrasion and generates shallow scratches.
In theory, lubricated contacts experience normal operation and minimal wear, however, in practice,
contact surfaces under lubrication also experience surface damage and degradation if hard particle/grit
gets ingested due to contamination and/or from wear debris. Such wear debris and contaminants trapped
in between the mating surfaces act as abrasive particles which leads to enhanced damage and accelerated
wear of surfaces resulting in premature failure of the bearings [18]. If abrasive particles stay suspended in
between the surfaces, it acts as three-body abrasion, while, it will behave as two-body abrasion if the
particles get wedged in-between with any of the surfaces [19].
1.3.2 Adhesive Wear
Adhesive wear occurs when two surfaces are pressed together and are joined by the action of cold welding
at the contact interface. The bonding between the asperities of surfaces in contact results in junction
growth. Due to the high load and continued motion, asperities get deformed and adhere to counter
surface forming adhesion bonds, ultimately leading to the rupture of micro-junctions. Hardening of the
adhered particles due to repeated load cycles may result in abrasion as well. That is why abrasion and
adhesion often occur simultaneously.
4
On the other hand, the transfer of material by the rupture of bonded polymer asperities onto the counter
bodies forms a transfer film. The formation of polymer transfer film is governed by interfacial energy
between polymer-metal surfaces (adhesive work) and polymer surface energy (cohesive work). After the
polymer transfer film is generated, the polymer surface is rubbing against the same polymer film
preventing the contact between polymer-metal. The lower surface energy of polymer-polymer than
polymer-metal also aids in the reduction of friction and wear. It is believed that the formation of transfer
films results in steady-state wear from transient wear phenomena [20] and thus, the ability to transfer film
formation of a polymer composite is often attributed to its wear-resistant behavior.
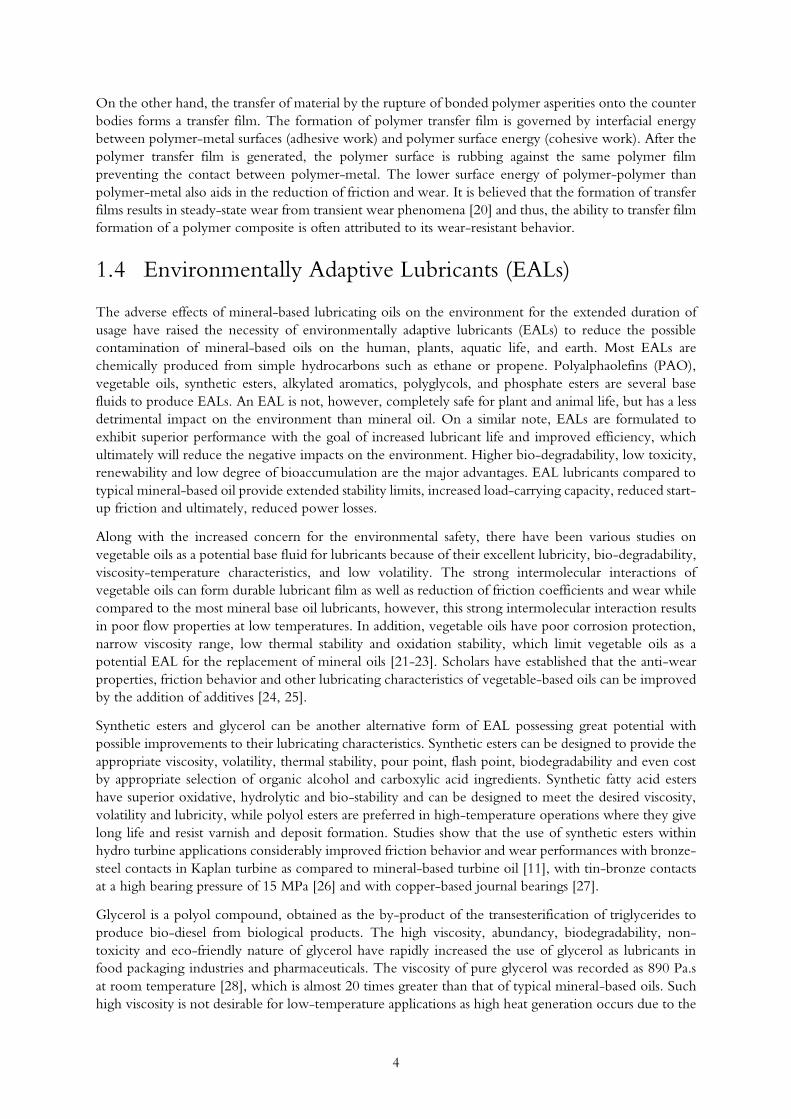
1.4 Environmentally Adaptive Lubricants (EALs)
The adverse effects of mineral-based lubricating oils on the environment for the extended duration of
usage have raised the necessity of environmentally adaptive lubricants (EALs) to reduce the possible
contamination of mineral-based oils on the human, plants, aquatic life, and earth. Most EALs are
chemically produced from simple hydrocarbons such as ethane or propene. Polyalphaolefins (PAO),
vegetable oils, synthetic esters, alkylated aromatics, polyglycols, and phosphate esters are several base
fluids to produce EALs. An EAL is not, however, completely safe for plant and animal life, but has a less
detrimental impact on the environment than mineral oil. On a similar note, EALs are formulated to
exhibit superior performance with the goal of increased lubricant life and improved efficiency, which
ultimately will reduce the negative impacts on the environment. Higher bio-degradability, low toxicity,
renewability and low degree of bioaccumulation are the major advantages. EAL lubricants compared to
typical mineral-based oil provide extended stability limits, increased load-carrying capacity, reduced start-
up friction and ultimately, reduced power losses.
Along with the increased concern for the environmental safety, there have been various studies on
vegetable oils as a potential base fluid for lubricants because of their excellent lubricity, bio-degradability,
viscosity-temperature characteristics, and low volatility. The strong intermolecular interactions of
vegetable oils can form durable lubricant film as well as reduction of friction coefficients and wear while
compared to the most mineral base oil lubricants, however, this strong intermolecular interaction results
in poor flow properties at low temperatures. In addition, vegetable oils have poor corrosion protection,
narrow viscosity range, low thermal stability and oxidation stability, which limit vegetable oils as a
potential EAL for the replacement of mineral oils [21-23]. Scholars have established that the anti-wear
properties, friction behavior and other lubricating characteristics of vegetable-based oils can be improved
by the addition of additives [24, 25].
Synthetic esters and glycerol can be another alternative form of EAL possessing great potential with
possible improvements to their lubricating characteristics. Synthetic esters can be designed to provide the
appropriate viscosity, volatility, thermal stability, pour point, flash point, biodegradability and even cost
by appropriate selection of organic alcohol and carboxylic acid ingredients. Synthetic fatty acid esters
have superior oxidative, hydrolytic and bio-stability and can be designed to meet the desired viscosity,
volatility and lubricity, while polyol esters are preferred in high-temperature operations where they give
long life and resist varnish and deposit formation. Studies show that the use of synthetic esters within
hydro turbine applications considerably improved friction behavior and wear performances with bronze-
steel contacts in Kaplan turbine as compared to mineral-based turbine oil [11], with tin-bronze contacts
at a high bearing pressure of 15 MPa [26] and with copper-based journal bearings [27].
Glycerol is a polyol compound, obtained as the by-product of the transesterification of triglycerides to
produce bio-diesel from biological products. The high viscosity, abundancy, biodegradability, non-
toxicity and eco-friendly nature of glycerol have rapidly increased the use of glycerol as lubricants in
food packaging industries and pharmaceuticals. The viscosity of pure glycerol was recorded as 890 Pa.s
at room temperature [28], which is almost 20 times greater than that of typical mineral-based oils. Such
high viscosity is not desirable for low-temperature applications as high heat generation occurs due to the

5
extra energy required to shear the thick lubricating film, resulting in lubrication decomposition and
possibly early failure. The works of literature show that the freezing point and film thickness of glycerol
can be reduced by adding an appropriate amount of water in pure glycerol producing a very low
coefficient of friction in boundary and elastohydrodynamic lubrication domain [29, 30]. Shi et al. [30]
studied the effects of addition of water in pure glycerol and observed that the addition of 10% w/w of
water can reduce the viscosity of pure glycerol by one fifth and up to 200 times lower when the water
content was increased to 50% w/w. On the contrary, higher water content (>20% w/w) could not
provide enough viscosity for full separation and increasing friction coefficient was observed at decreasing
slide-to-roll ratio (SRR). Almost 12 times higher wear rate with 50% w/w of water content was noted
as compared to the pure glycerol. This was attributed to the highly corrosive nature of water leading to
increased wear. Similar results were generated by Tortora et al. [31] with the aqueous solutions of
glycerol. It was evident that the friction and wear increased with an increasing amount of water after a
certain level of water content, thus an optimum concentration of water should be established.
Moreover, Zheng et al. (2018) [32] studied ricinoleic acid-based ionic liquid [Cho][ricinoleic] as an
additive for glycerol solution with different concentrations and observed a significant reduction in friction
coefficients and wear volumes with increasing loads at light load conditions (25N-50N), and it was
attributed to the formation of compact fluid films by strong adsorption onto the metal surface due to the
presence of carboxylate group, unsaturation and hydroxyl group. The optimal concentration of IL was
observed to be at 6% w/w. On the contrary, the increasing pattern of wear volumes at the higher load
range greater than 100N is worth to be noted. In recent years, bio-based ionic liquids (ILs) have been
an interest in the exploration of its performance on tribological applications as a green lubricant because
of its biodegradability and non-toxic properties [33-37]. As the conventional ionic liquids are associated
with drawbacks such as; imidazolium-based ILs showing lower oxidative stability at higher temperatures,
the corrosive nature of pyridinium-based ILs, phosphonium-based ILs not being environmentally
adaptive and halogen-containing ILs enhancing corrosion, the focus is shifted towards the bio-based ILs
[38-40]. It has been established that bio-based ILs are capable of improving lubricating properties of fully
green lubricants reducing friction and wear for various surface contacts [32, 34, 35, 41-46].
1.5 Water Lubrication
Water alone has been used for lubrication for a long time because it is non-inflammable, cheap, readily
available, non-toxic, biodegradable and relatively incompressible. Its low viscous nature, on the other
hand, holds disadvantages for applications like hydro turbines where high contact load and low speed are
frequent and thus water is not an ideal choice as a lubricant due to its low load-carrying capacity [47].
Figure 2 Dynamic viscosity of water versus temperature
6
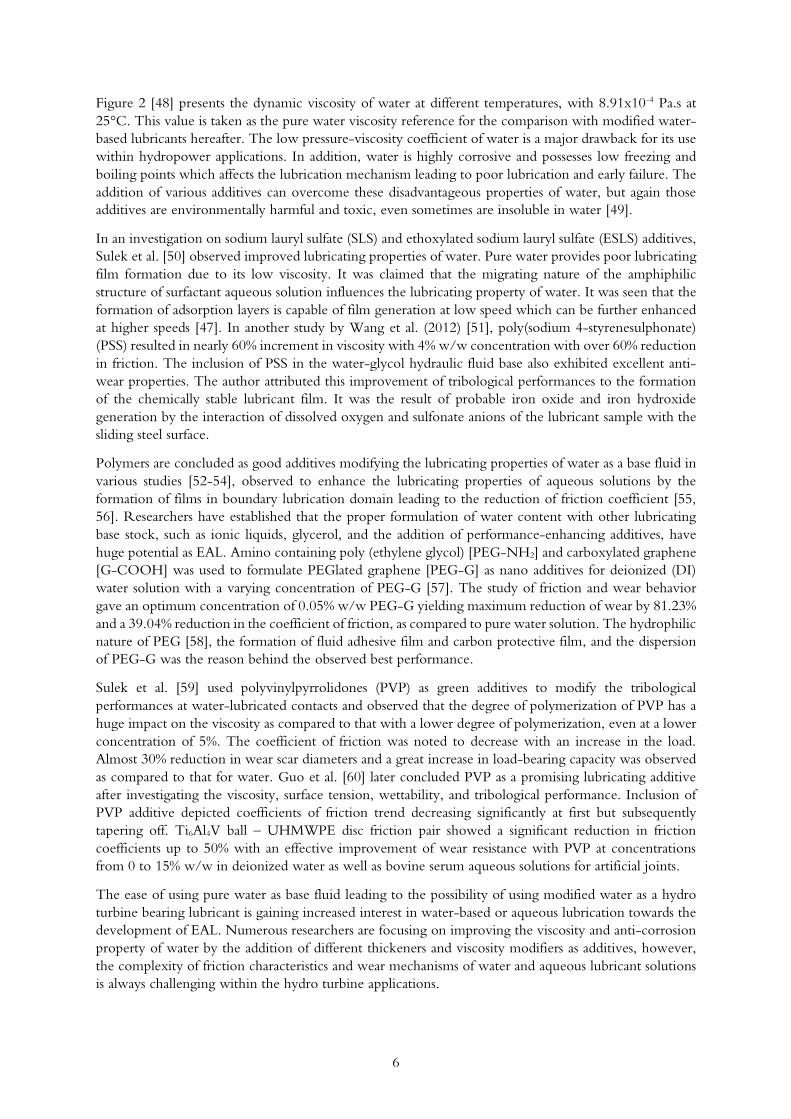
Figure 2 [48] presents the dynamic viscosity of water at different temperatures, with 8.91x10⁻⁴ Pa.s at
25°C. This value is taken as the pure water viscosity reference for the comparison with modified water-
based lubricants hereafter. The low pressure-viscosity coefficient of water is a major drawback for its use
within hydropower applications. In addition, water is highly corrosive and possesses low freezing and
boiling points which affects the lubrication mechanism leading to poor lubrication and early failure. The
addition of various additives can overcome these disadvantageous properties of water, but again those
additives are environmentally harmful and toxic, even sometimes are insoluble in water [49].
In an investigation on sodium lauryl sulfate (SLS) and ethoxylated sodium lauryl sulfate (ESLS) additives,
Sulek et al. [50] observed improved lubricating properties of water. Pure water provides poor lubricating
film formation due to its low viscosity. It was claimed that the migrating nature of the amphiphilic
structure of surfactant aqueous solution influences the lubricating property of water. It was seen that the
formation of adsorption layers is capable of film generation at low speed which can be further enhanced
at higher speeds [47]. In another study by Wang et al. (2012) [51], poly(sodium 4-styrenesulphonate)
(PSS) resulted in nearly 60% increment in viscosity with 4% w/w concentration with over 60% reduction
in friction. The inclusion of PSS in the water-glycol hydraulic fluid base also exhibited excellent anti-
wear properties. The author attributed this improvement of tribological performances to the formation
of the chemically stable lubricant film. It was the result of probable iron oxide and iron hydroxide
generation by the interaction of dissolved oxygen and sulfonate anions of the lubricant sample with the
sliding steel surface.
Polymers are concluded as good additives modifying the lubricating properties of water as a base fluid in
various studies [52-54], observed to enhance the lubricating properties of aqueous solutions by the
formation of films in boundary lubrication domain leading to the reduction of friction coefficient [55,
56]. Researchers have established that the proper formulation of water content with other lubricating
base stock, such as ionic liquids, glycerol, and the addition of performance-enhancing additives, have
huge potential as EAL. Amino containing poly (ethylene glycol) [PEG-NH2] and carboxylated graphene
[G-COOH] was used to formulate PEGlated graphene [PEG-G] as nano additives for deionized (DI)
water solution with a varying concentration of PEG-G [57]. The study of friction and wear behavior
gave an optimum concentration of 0.05% w/w PEG-G yielding maximum reduction of wear by 81.23%
and a 39.04% reduction in the coefficient of friction, as compared to pure water solution. The hydrophilic
nature of PEG [58], the formation of fluid adhesive film and carbon protective film, and the dispersion
of PEG-G was the reason behind the observed best performance.
Sulek et al. [59] used polyvinylpyrrolidones (PVP) as green additives to modify the tribological
performances at water-lubricated contacts and observed that the degree of polymerization of PVP has a
huge impact on the viscosity as compared to that with a lower degree of polymerization, even at a lower
concentration of 5%. The coefficient of friction was noted to decrease with an increase in the load.
Almost 30% reduction in wear scar diameters and a great increase in load-bearing capacity was observed
as compared to that for water. Guo et al. [60] later concluded PVP as a promising lubricating additive
after investigating the viscosity, surface tension, wettability, and tribological performance. Inclusion of
PVP additive depicted coefficients of friction trend decreasing significantly at first but subsequently
tapering off. Ti6Al4V ball – UHMWPE disc friction pair showed a significant reduction in friction
coefficients up to 50% with an effective improvement of wear resistance with PVP at concentrations
from 0 to 15% w/w in deionized water as well as bovine serum aqueous solutions for artificial joints.
The ease of using pure water as base fluid leading to the possibility of using modified water as a hydro
turbine bearing lubricant is gaining increased interest in water-based or aqueous lubrication towards the
development of EAL. Numerous researchers are focusing on improving the viscosity and anti-corrosion
property of water by the addition of different thickeners and viscosity modifiers as additives, however,
the complexity of friction characteristics and wear mechanisms of water and aqueous lubricant solutions
is always challenging within the hydro turbine applications.

7
1.6 Materials
This section comprises of the specific materials studied in this work. Two commercially available
polymeric thickening agents for water-based lubrication and polymer bearing materials for hydropower
applications were investigated.
Polyvinylpyrrolidones (PVP)
Polyvinylpyrrolidone (PVP), also termed as Polyvidone or Povidone, is a hygroscopic amorphous
powder consisting of polar amide groups and non-polar ethylene groups which can be obtained from
vinylpyrrolidone [61]. Figure 3 [62] represents the chemical structure of PVP. Initially used as a blood
plasma substitute in World War II, PVP now finds its use as a serum albumin substitute, artificial tears
for irritation and drying of eyes, disinfectants, dispersants, and binders. Polyvinylpyrrolidone is a highly
biodegradable, non-toxic, biocompatible water-soluble polymer additive [63, 64]. It also has a very low
degree of bioaccumulation as it does not decompose due to the action of microorganisms and thus,
provides stability as a lubricating component.
Figure 3 Chemical Structure of PVP
PVP has also been widely used in pharmaceutical, medical devices, food, paints, cosmetic and detergent
industries [65-67]. It also finds its use in multiple technical applications like membranes, hydrogels, hot-
melt adhesives, and glue sticks. The research works on PVP have been somewhat limited to the
experimental study on surface tension, density, viscosity, clinical effects and such applications [68-74]
while the study focusing on the tribological performance of PVP are very little [59, 60, 66].
Owing to its versatile features such as water solubility, toxicological harmlessness, good adhesion and
film formation, PVP is selected with an expectation that its aqueous solution with pure water can be
studied as a potential EAL.
Table 1 [62] lists the typical properties of the PVP40.
Table 1 Properties of PVP40
Form Powder
Linear Formula (C6H9NO)n
Molecular weight average Mw ~40,000 Viscosity 20-30 mPa.s, 20% (25°C, Brookfield)
Melting Point 150°C
Solubility water and lower glycols: soluble
Density 1.2 g/mL at 25 °C
Figure 4 represents the standard measurement of Brookfield viscosity for polyvinylpyrrolidone at different
temperatures, provided by Ashland Polymers [75]. Brookfield viscosity can be referenced for the
validation of viscosity measurements for the aqueous solutions of PVP at different % w/w concentrations,
reported later in this study.

8
Figure 4 Brookfield viscosity of PVP at various % w/w concentrations
Poly(sodium 4-styrenesulfonate) (PSS)
Poly(sodium 4-styrenesulfonate) (PSS) is an anionic polyelectrolyte derived from the polymerization of
polystyrene by the addition of sulfonate functional groups. PSS is extremely low toxic with high water
solubility compared to other homogeneous compounds of sulfonate, as a result, it has been widely used
in wastewater treatment, adhesives, chemical and pharmaceutical industry [76]. Sulfonates are used as
detergent, anti-rust additives and are known as excellent dispersants. There are studies concerned with
synthetic sulfonates as extreme pressure and wear-resistant additives for lubricating oils, however, there
are very little investigations on PSS as water-soluble additives [50, 51]. Figure 5 [77] represents the
chemical structure of the PSS.
Figure 5 Chemical Structure of PSS
Most water-soluble high molecular polymers are found to significantly increase the viscosity of pure
water and PSS are also known for its excellent water solubility and extremely low toxicity. Thus, PSS is
expected to exhibit good tribological performances as a water-based lubricant additive. Table 2 [77] lists
the typical properties of the PSS.
Table 2 Properties of PSS
Form Powder
Linear Formula (C8H7NaO3S)n Molecular weight average Mw ~70,000 Viscosity 15-55 mPa.s, 20% (25°C, Brookfield)
Melting Point 460°C
Solubility water and lower glycols: soluble
Density 0.801 g/mL at 25°C
9
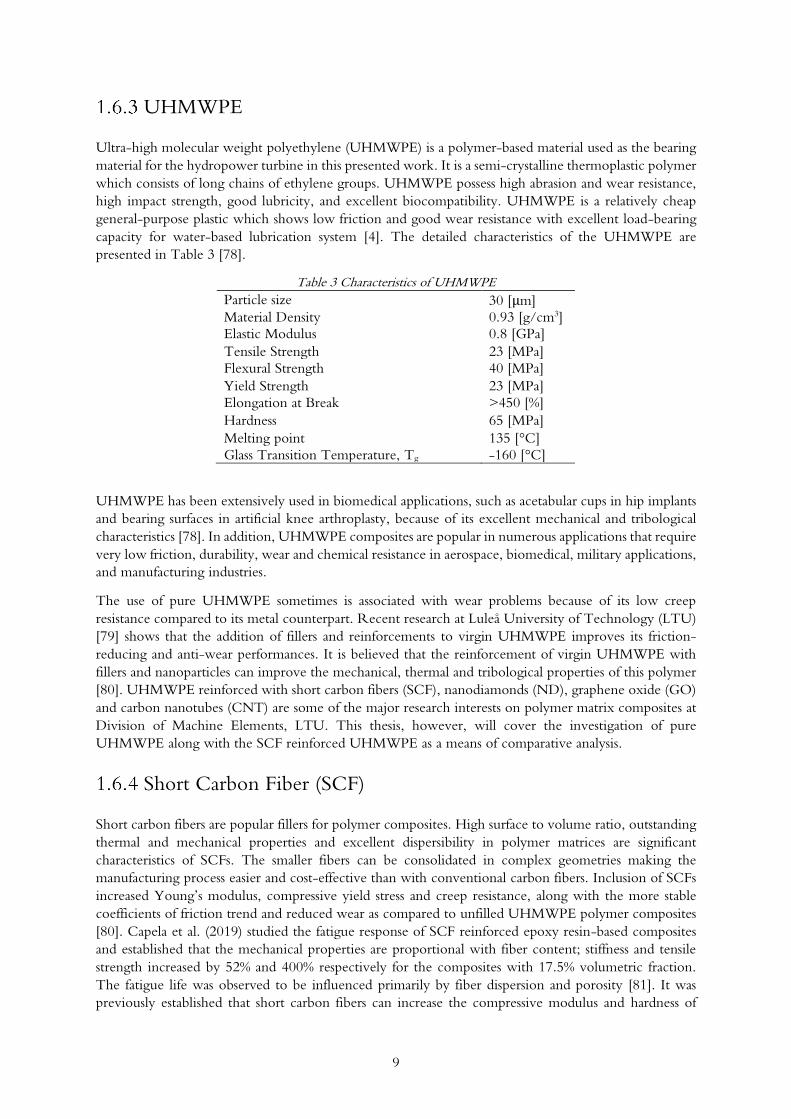
UHMWPE
Ultra-high molecular weight polyethylene (UHMWPE) is a polymer-based material used as the bearing
material for the hydropower turbine in this presented work. It is a semi-crystalline thermoplastic polymer
which consists of long chains of ethylene groups. UHMWPE possess high abrasion and wear resistance,
high impact strength, good lubricity, and excellent biocompatibility. UHMWPE is a relatively cheap
general-purpose plastic which shows low friction and good wear resistance with excellent load-bearing
capacity for water-based lubrication system [4]. The detailed characteristics of the UHMWPE are
presented in Table 3 [78].
Table 3 Characteristics of UHMWPE
Particle size 30 [μm] Material Density 0.93 [g/cm3]
Elastic Modulus 0.8 [GPa]
Tensile Strength 23 [MPa]
Flexural Strength 40 [MPa]
Yield Strength 23 [MPa]
Elongation at Break >450 [%]
Hardness 65 [MPa]
Melting point 135 [°C]
Glass Transition Temperature, Tg -160 [°C]
UHMWPE has been extensively used in biomedical applications, such as acetabular cups in hip implants
and bearing surfaces in artificial knee arthroplasty, because of its excellent mechanical and tribological
characteristics [78]. In addition, UHMWPE composites are popular in numerous applications that require
very low friction, durability, wear and chemical resistance in aerospace, biomedical, military applications,
and manufacturing industries.
The use of pure UHMWPE sometimes is associated with wear problems because of its low creep
resistance compared to its metal counterpart. Recent research at Luleå University of Technology (LTU)
[79] shows that the addition of fillers and reinforcements to virgin UHMWPE improves its friction-
reducing and anti-wear performances. It is believed that the reinforcement of virgin UHMWPE with
fillers and nanoparticles can improve the mechanical, thermal and tribological properties of this polymer
[80]. UHMWPE reinforced with short carbon fibers (SCF), nanodiamonds (ND), graphene oxide (GO)
and carbon nanotubes (CNT) are some of the major research interests on polymer matrix composites at
Division of Machine Elements, LTU. This thesis, however, will cover the investigation of pure
UHMWPE along with the SCF reinforced UHMWPE as a means of comparative analysis.
Short Carbon Fiber (SCF)
Short carbon fibers are popular fillers for polymer composites. High surface to volume ratio, outstanding
thermal and mechanical properties and excellent dispersibility in polymer matrices are significant
characteristics of SCFs. The smaller fibers can be consolidated in complex geometries making the
manufacturing process easier and cost-effective than with conventional carbon fibers. Inclusion of SCFs
increased Young’s modulus, compressive yield stress and creep resistance, along with the more stable
coefficients of friction trend and reduced wear as compared to unfilled UHMWPE polymer composites
[80]. Capela et al. (2019) studied the fatigue response of SCF reinforced epoxy resin-based composites
and established that the mechanical properties are proportional with fiber content; stiffness and tensile
strength increased by 52% and 400% respectively for the composites with 17.5% volumetric fraction.
The fatigue life was observed to be influenced primarily by fiber dispersion and porosity [81]. It was
previously established that short carbon fibers can increase the compressive modulus and hardness of
10
UHMWPE along with the significant reduction of friction and wear. The main load between the surfaces
in contact is carried by the exposed SCFs preventing the polymer matrix from severe wear leading to
improved tribological performance of the polymer matrices [82].
The selection of turbine bearing materials was based on commercial applications, availability, and earlier
studies with water-based lubricated contacts. MIPELONTM UHMWPE XM-220 (Mitsui Chemicals,
Japan) with an average size of 30 μm and a molecular weight of 2x10⁶ g/mol was used as the base
polymer. Short carbon fibers (Tenax-A HT M100 100mu) with a bulk density of 1.82 g/cm3, an average
length of 100 μm and 7 μm diameter were used as reinforcements for virgin UHMWPE [79]. SCF at a
concentration of 10% w/w with pure UHMWPE is selected based on the earlier studies. The polymer
specimens used in this work were manufactured using direct compression molding (DCM) technique at
TRIBOLAB, Division of Machine Elements, LTU, Sweden.
1.7 Research Gap
As mentioned earlier, there has been extensive research on environmentally accepted solutions to prevent
the problems associated with environmental safety and lubrication issues. Tribological properties of
polymers for hydro turbine bearings are mostly studied for dry sliding conditions and/or pure water-
lubricated conditions. The prime problem of using water lubrication being the poor lubricity of water,
researchers are focused on improving the tribological properties of water as a base. Friction and wear
behavior of polymer composites for turbine bearings vary widely during dry and water-lubricated
conditions. On a similar note, transfer film formation behavior, hydrodynamic effects, and
adsorption/absorption mechanisms of lubricant molecules on bearing surfaces also have different effects
on the friction pairs under lubricated conditions.
Recently, the search for a potential environmentally adaptive lubricant for hydropower turbine bearings
is widely revolving around ionic liquids (ILs), synthetic esters, glycerol-based lubricants, polyhydric
alcohol-based lubricants, surfactant-water solutions, and such. The studies on improving lubrication of
general-purpose bearing materials for industrial applications have been widely explored from an
environmental perspective, but only a limited number of studies have been undertaken in view of
modified water lubricating the hydropower turbine bearings. While most studies to enhance the lubricity
of water are directed towards changing the type of base fluid, little research has been performed on the
study of the modification of water properties by the addition of thickeners alone.
Earlier studies on polyvinylpyrrolidone [59] and poly(sodium 4-styrenesulfonate) [51] have shown
promising results at low contact pressure conditions, however, its performance during high load and
low-speed conditions, typical to hydropower applications, is not explored till date. Furthermore, the
bearing material, UHMWPE, has been widely investigated for biomedical applications. Very little is
known about the tribological performance of UHMWPE in the presence of modified water for
hydropower applications involving high contact pressure and low-speed conditions. The presented work
is an attempt to further evaluate the effects of PVP and PSS as water modifiers during transient operating
conditions and to understand the friction and wear mechanisms of UHMWPE and SCF reinforced
UHMWPE polymer composites.

11
1.8 Research Objectives
The aim of this work is primarily focused on improving the tribological performance of pure water by
the addition of certain polymeric thickeners/modifiers in the lubrication of hydropower turbine bearings.
The main objectives of the presented thesis can be listed as:
• The search for potential EALs in water-based lubrication for hydropower turbine bearings.
• Investigation of viscosity and tribological performances of modified water lubrication using
polymeric thickeners within hydropower applications.
• Comparative study of friction behavior and wear performances with modified water versus pure
water.
The preparation of new water-based lubricants, experimental analysis methodology and characterization
techniques carried out to achieve these objectives will be discussed in greater detail in the following
sections.

12
2 Experimental Methodology
Figure 6 depicts a simple experimental workflow executed in this thesis.
2.1 Preparation of modified water-based lubricants
Polyvinylpyrrolidone (PVP40, CAS Number 9003-39-8, Sigma-Aldrich Sweden AB) was obtained in
powder form with an average molecular weight Mn ~40,000 and a density of 1.2 g/mL at 25°C.
Poly(sodium 4-styrenesulfonate) (PSS, CAS Number 25704-18-1, Sigma-Aldrich Sweden AB) was
obtained in powder form with average molecular weight Mn ~70,000 and density 0.801 g/mL at 25°C.
PVP and PSS were used without further purification to prepare their aqueous solutions.
Aqueous solutions of both PVP and PSS at different concentrations of 3, 6, 9, 15 and 20% w/w were
prepared at room temperature by mixing with distilled water and shaking manually for 60 seconds. The
solutions were kept for an hour and manually shaken again for 60 seconds duration. The process was
repeated twice, and the lubricant solution was left for at least 24 hours and used for further analysis after
the lubricants were manually shaken thoroughly. Both PVP and PSS easily dissolved in distilled water
and formed fully transparent sample solutions. The appearance of the solutions changed from
colorlessness to light amber to brownish with an increase in concentration. PSS aqueous solutions were
observed to be darker than the PVP solutions. Note that mechanical (magnetic) stirrer was not used for
mixing purposes, as the thickening agents possess excellent solubility with distilled water.
2.2 Viscosity measurements
Viscosity is the measure of the resistance of a lubricating fluid to deformation due to shear. It is also
described as the internal friction of a moving fluid resulting from molecular interaction. A fluid with
higher viscosity has higher internal friction between the molecules which resists the motion. Viscosity
measurement is one of the most reliable and accurate flow behavior characterization techniques that helps
to understand the flow performance towards the development of a new lubricant. The viscosity of a
lubricant is significantly dependent on temperature, meaning viscosity of a lubricating fluid decreases
with increased operating temperature due to frictional heating. Applied pressure also can affect the
viscosity and is subsequently associated with its load-carrying capacity.
A higher value of viscosity can maintain better film separation of moving contact surfaces and helps to
reduce wear and fatigue, resulting in the extended service life of the bearings. Low viscous fluids have
minimum resistance to flow and low load-carrying capacity, while higher viscosity results in less leakage
and thus improving the volumetric efficiency.
>24 hours
Thickening agent + Distilled water
(Aqueous Solution)
SEM Analysis
Viscosity Analysis
Wettability
Pin-on-plate
Friction & Wear test
Figure 6 Experimental workflow

13
The dynamic viscosity of a lubricant is determined by directly measuring shear stress and shear rate.
Dynamic viscosities of the aqueous solutions of PVP and PSS at different concentrations were measured
directly by Bohlin Rheometer at 25°C using Cylinder-on-Cup (C25 DIN 53019) setup, Figure 7.
Figure 7 Bohlin Rheometer & schematic diagram of Cylinder on Cup
Initially, viscosities were recorded for every hour during the friction test in order to study if it was
necessary to add an additional amount of water to the lubricant sample to accommodate the loss of water
content by the action of evaporation. In general, the analysis was carried out before and after the sample
lubricants have been used in tribological tests. The amount of lubricant used was ~11 ml for all tests as
recommended for Bohlin C25. Each sample solution was tested at least 5 times within shear rates of 1-
200 [1/s] taking 15 number of data points and averaged.
2.3 Measurement of tribological properties
Cameron Plint TE77 High-Frequency Reciprocating (HFR) Tribometer (Plint & Partners, Berkshire,
England), Figure 8, was used to perform tribological tests using the pin-on-flat configuration lubricated
with newly developed sample lubricants. The counter surface plates were fixed in a bath, while the
polymer pins were held by a reciprocating arm. Pin-on-flat configuration was chosen to ensure the
consistency of applied contact pressure over one test cycle which helps to eliminate the converging gap
and resulting wedge action of typical hydrodynamic sliding bearings.
Figure 8 Cameron Plint TE77 Tribometer
The polymer pin samples were reciprocated in a horizontal plane with a pure sinusoidal motion provided
by a scotch yoke mechanism driven by a variable speed motor. The frictional force was measured

14
continuously by a piezoelectric transducer, and the coefficients of friction were recorded directly by a
data-acquiring software linked with the TE77 tribometer. The coefficient of friction gives the measure
of resistance to motion. A spring balance and beam were used to apply the normal load directly to the
moving specimen. The load varies by approximately 2% of the total load value (~ 5-7 N) over one test
cycle. The friction is highest at the end of the stroke with zero sliding velocity due to boundary
lubrication and lowest at mid-stroke with maximum sliding velocity where mixed lubrication occurs.
The friction coefficients recorded during the beginning of the sliding process were higher than during
the running-in phase. The reported friction data are the average coefficients of friction measured after
reaching the steady-state, excluding the running-in phase. The tribometer was calibrated before starting
the test series and the same calibration setup was used for all the friction tests. The schematic diagram of
the test configuration and wear scar generated on the counter surface is shown in Figure 9.
Figure 9 Schematic diagram of test configuration & wear scar on SS countersurface
Polymer test specimens of bearing materials were used with a size of 4 x 4 x 4 mm3 cubes. Stainless steel
plates, SS2333 grades were used as counter surfaces as a typical shaft material used in hydropower
applications. The plates were laser cut from a rolling sheet and had a dimension of 60 x 30 x 3 mm3
(length x width x height), measured surface roughness Sa of 0.31 ± 0.02 μm and with 205 ± 5 HV100
hardness. Polymer test specimens and counter surface plates were cleaned thoroughly with ethanol prior
to each test in order to remove potential contaminations.
Friction tests were performed in two different test sequences with two different normal loads, 320 N and
160 N. The first test sequence was performed at room temperature under an applied load of 320 N
producing an initial apparent contact pressure of 20 MPa which accounts for the results presented under
high load conditions. The second test sequence, low load condition under 160 N equivalent to 10 MPa
contact pressure, was then performed for comparative analysis with the high load conditions. These
contact pressures were chosen to imitate the maximum apparent contact pressure at highly loaded
condition during start/stop operations of hydropower turbine applications. All tests were carried out at
a constant sliding velocity (20 mm/s) provided by 2 Hz indicated rotor frequency with 5 mm stroke
length. A full description of the experimental parameters can be found in Table 4.
Table 4 Experimental conditions for Cameron Plint TE77
Contact pressure 20 MPa, 10 MPa Load 320 N, 160 N
Indicated rotor frequency 2 Hz
Stroke length 5 mm
Sliding velocity 20 mm/s
Test duration 2 hours *
Total sliding distance 144 m *
Polymer specimen 4 x 4 x 4 mm3
Stainless steel plate, SS2333 grade 0.31 ± 0.02 μm
Temperature RT (23-25°C)
* Except for SEM analysis which was performed on the specimens after 20 hours of pin-on-plate friction test resulting for a total sliding distance of 1440 m

15
These conditions were chosen to accelerate testing of the materials and to increase the interaction of
friction surfaces during sliding to allow high load and low speed at the boundary/mixed lubrication
regime. Selected contact pressures and sliding speed, are typical for hydropower applications in reference
to the Swedish hydropower industry. All tests were performed at room temperature and each friction
test was repeated three times.
Linear potentiometer or LVDT (linear variable differential transformer) sensor attached to the tribometer
was used to continuously measure the vertical displacement experienced by the polymer pin face in
contact with the counter surface to study the wear. The linear displacement in microns gives the measure
of linear dimensional change due to pin wear and is further used to calculate the total wear volume of
the polymer pins lubricated with aqueous solutions of PVP and PSS at different concentrations. The
specific wear rate coefficients were calculated after the recorded linear wear depths were plotted as a
function of applied normal load and total sliding distance using Equation 1 [56]. The measured data
points were selected after the steady-state was achieved, excluding the running-in phase in all tests and a
specific wear rate coefficient was calculated by linear fitting a line to the plotted data points based on
Equation 1.
𝑊𝑒𝑎𝑟 𝑟𝑎𝑡𝑒 =𝑇𝑜𝑡𝑎𝑙 𝑣𝑜𝑙𝑢𝑚𝑒 𝑙𝑜𝑠𝑠
𝐴𝑝𝑝𝑙𝑖𝑒𝑑 𝐿𝑜𝑎𝑑 𝑥 𝑆𝑙𝑖𝑑𝑖𝑛𝑔 𝑑𝑖𝑠𝑡𝑎𝑛𝑐𝑒 (𝑚𝑚³)
(𝑁.𝑚) Equation (1)
2.4 Scanning Electron Microscope (SEM)
Scanning Electron Microscope (SEM) works by creating images of the sample surface due to the action
of high-energy electron beams directed on the surface producing various signals. Various types of signals
are generated mainly by the detection of secondary electrons and backscattered electrons. Electrons
emitted by the atoms of the specimen are secondary electrons, while those reflected from the sample
surface by elastic scattering are backscattered electrons. Backscattered electrons emerge from deeper
locations within the surface, thus the resolution of images produced by backscattered electrons is less
than the resolution of images from secondary electrons. SEM utilizes an electron beam with a wavelength
shorter than that of light and therefore detailed information on the structure and wear behavior can be
obtained visualizing the wear scar in the nanometer scale.
The wear mechanisms explained earlier are expected to be more pronounced while the specimens are
analyzed under SEM. Both the polymer pins and stainless-steel counter surface plates were analyzed using
a JEOL JSM-IT300 Environmental Scanning Electron Microscope (JEOL, Peabody, MA, USA), Figure
10.
Figure 10 JEOL JSM-IT300 SEM

16
2.5 Wettability
Wetting can be explained as the phenomena of how a liquid deposited on a surface spread out. The
wetting ability of a liquid to a surface is determined by the contact angle measurements. Attension Theta
optical tensiometer (Biolin Scientific, Sweden) was used for the contact angle measurements, shown in
Figure 11.
Figure 11 Attension Theta optical tensiometer
The contact angle is governed by the interaction and repulsion forces between the liquid and solid
surface. The molecules of liquid tend to interact more with solid molecules than with each other if the
cohesive forces are weaker than adhesive forces. This results in a smaller contact angle between the liquid
and solid surfaces. The contact angle will be larger when cohesive forces are stronger than adhesive forces
leading to the interaction of liquid molecules with each other than with the solid surface. This also helps
to explain the hydrophilicity and hydrophobicity of the polymer surfaces along with the philicity and
phobicity of other liquids [83].
The ability to wetting of newly developed water-based lubricants was analyzed by executing contact
angle measurements on the unmodified polymer surfaces and stainless steel countersurface. Aqueous
solutions of PVP and PSS were deposited on UHMWPE and SCF reinforced UHMWPE polymer
surfaces using the Sessile drop method with a droplet size of 4 µl. The angle made by the lubricant with
the surface was then recorded and compared against distilled water. The measurements for wettability
were repeated eight times to obtain the average and standard deviation error value, as the contact angle
may vary from place to place.
17
3 Results and Discussion
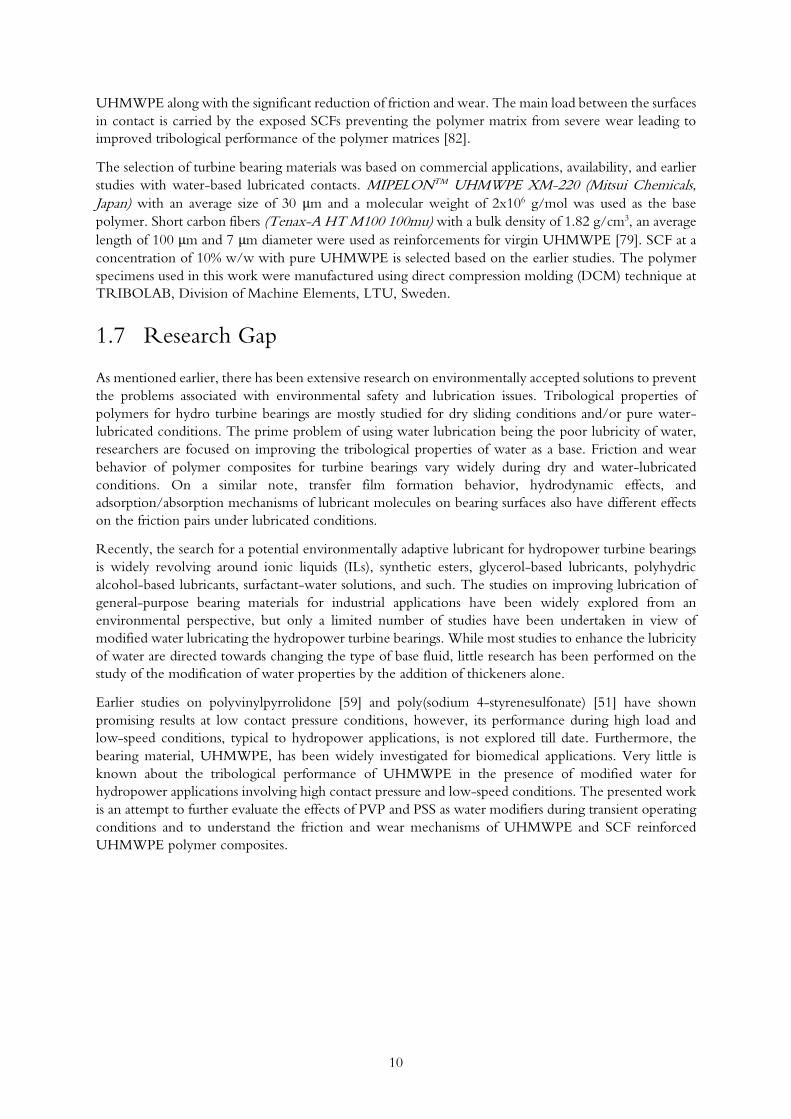
3.1 Enhancement of Viscosity
It can be clearly seen from Figure 12 that both PVP and PSS were observed to effectively increase the
viscosity of water with an increase in concentration [% w/w]. The dynamic viscosity of 0.891 mPa.s for
pure water is taken as the reference [48] and at the concentration of 3%, the viscosities for both PVP and
PSS aqueous solutions are more than two times higher than the value for pure water. The viscosity of a
slightly higher than 2 mPa.s at 3% wt. concentrations for both PVP and PSS have gradually increased to
nearly 20 mPa.s for PVP and 16 mPa.s for PSS at 20% w/w concentration. The viscosity enhancement
is recorded 8 to 10 times higher when the concentration was increased from 3% to 20% w/w. This shows
the excellent ability of the thickeners to viscosity enhancement when used with water as base fluid. The
increased viscosity is expected to increase the load-carrying capacity and lubricating performance of the
modified water.
0 3 6 9 12 15 18 21
0
2
4
6
8
10
12
14
16
18
20
22
Vis
cosity [m
Pa.s
]
Concentration [% w/w]
PVP
PSS
Figure 12 Enhancement of viscosity with different concentrations of PVP and PSS
compared with the reference viscosity of pure water at 25°C
0 2 4 6 81.8
2.0
2.2
2.4
2.6
2.8
3.0
3.2
3.4
3.6
Vis
cosity [m
Pa.s
]
Time [hours]
PVP
PSS
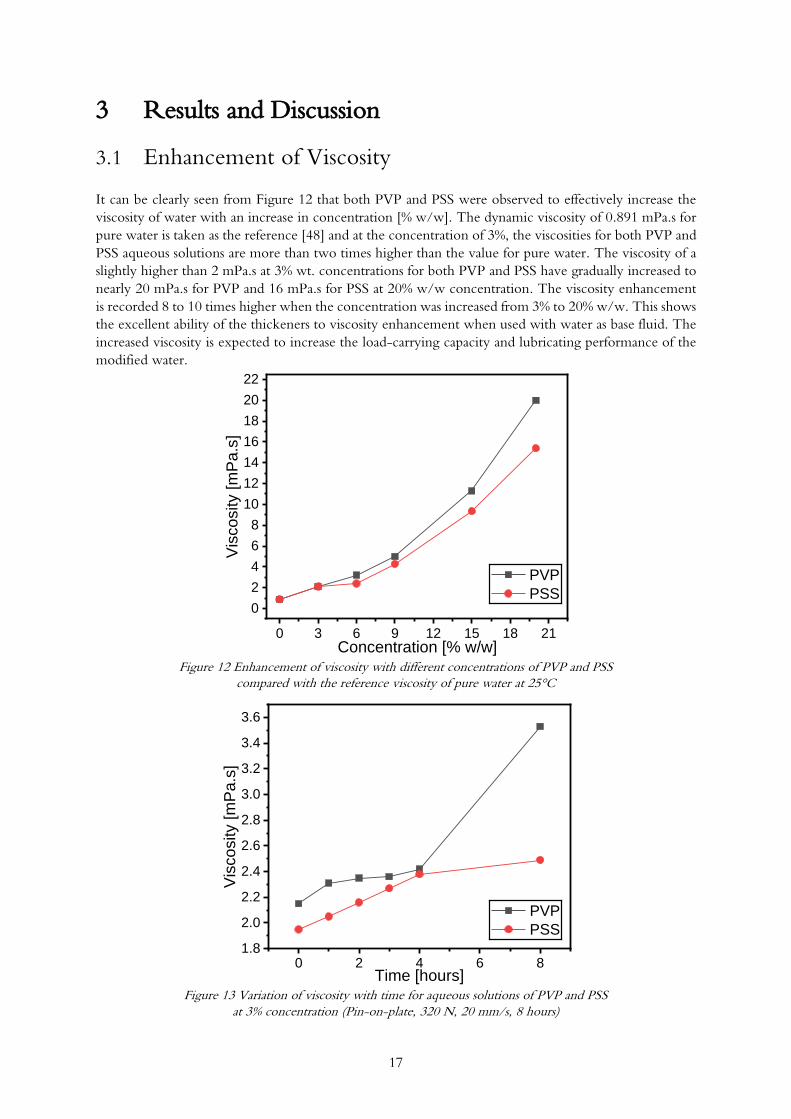
Figure 13 Variation of viscosity with time for aqueous solutions of PVP and PSS
at 3% concentration (Pin-on-plate, 320 N, 20 mm/s, 8 hours)

18
A separate analysis was carried out by taking viscosity measurements of aqueous solutions with both
thickeners at 3% w/w concentration. The measurements were recorded at every two-hour interval of
test duration on the lubricant samples after friction test. The logic behind this process was to observe the
loss of water content by the action of evaporation from the lubricating sample during friction analysis.
Figure 13 depicts the variation of viscosity with time for the aqueous solutions of PVP and PSS at 3%
concentration under reciprocating tribometer pin-on-plate test at 20 MPa contact pressure up to 8 hours
sliding at 20 mm/s constant speed. It can be noted that 2.15 mPa.s viscosity of 3% PVP aqueous solution
at 0 hours before the friction test changed to 3.53 mPa.s after 8 hours of test duration, which can be
considered as a negligible difference. Similarly, the aqueous solution of PSS at 3% concentration also
showed a trivial difference and thereby the effect of evaporation of water is not taken into consideration
for the friction tests in this study.
Figures 14 presents the overall change in viscosity of the sample solutions lubricating pure UHMWPE
after the test duration of 2 hours, with different concentrations of PVP and PSS, respectively. The rate
of change in viscosity increases with concentration. The negligible change in the recorded data further
makes it evident that the change in viscosity with time does not play a significant role in lubricant flow
behavior over a short test duration of 2 hours. However, it should be noted that the tests carried out for
a longer duration, for instance, more than 24 hours will have a higher rate of viscosity change, as
observed. This increment in the rate of change of viscosity will play important significance over the
friction behavior for both PVP and PSS solutions, and thus appropriate means needs to be employed to
accommodate the loss of water by evaporation during the tribo tests. The preferred method is to use an
IV drip lubricating system to ensure uniform lubrication between the friction pairs.
3.21
11.3
20
3.4
12.7
23
3.34
15.1
23.5
6 15 200
5
10
15
20
25
Vis
cosity [m
Pa.s
]
Concentration [% w/w]
0 hour
2 hour @ 10 MPa
2 hour @ 20 MPa
a) PVP
4.28
9.36
15.4
4.63
10
16.8
4.39
10.7
18.2
6 15 200
5
10
15
20
25
Vis
co
sity [
mP
a.s
]
Concentration [% w/w]
0 hour
2 hour @ 10 MPa
2 hour @ 20 MPa
b) PSS
Figure 14 Variation of the viscosity for aqueous solutions of a) PVP and b) PSS
at different concentrations [% w/w] with pure UHMWPE at 20 mm/s
Furthermore, the change in viscosity is seen to be higher under high contact pressure of 20 MPa
(equivalent to 320 N applied normal load) for both PVP and PSS aqueous solutions with higher
concentrations. This is due to the generation of higher frictional heat with a high load which increases
the operating temperature and thereby increasing the evaporation of base water. A similar and parallel
trend in viscosity change was observed with both PVP and PSS aqueous solutions lubricating both pure
UHMWPE and SCF reinforced UHMWPE bearing materials. This can also be further explained by the
results obtained from friction performances, discussed later.
19
3.2 Tribological Characterization
3.2.1 Friction and wear performance
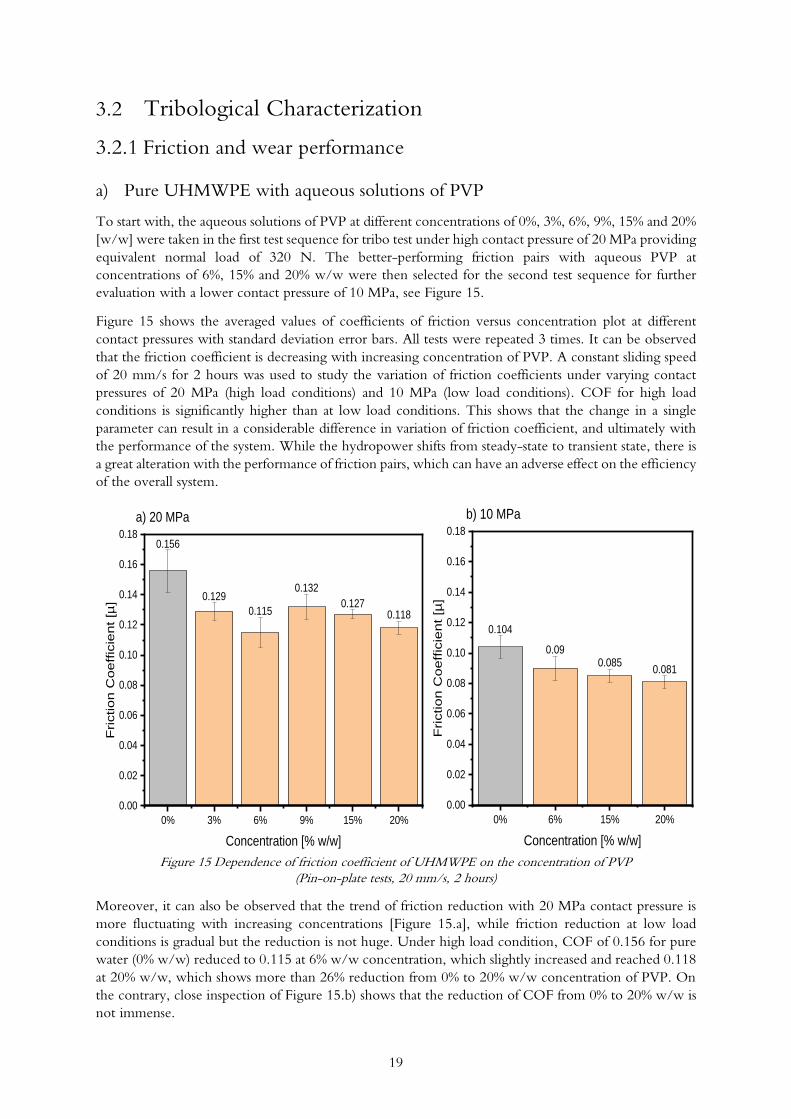
a) Pure UHMWPE with aqueous solutions of PVP
To start with, the aqueous solutions of PVP at different concentrations of 0%, 3%, 6%, 9%, 15% and 20%
[w/w] were taken in the first test sequence for tribo test under high contact pressure of 20 MPa providing
equivalent normal load of 320 N. The better-performing friction pairs with aqueous PVP at
concentrations of 6%, 15% and 20% w/w were then selected for the second test sequence for further
evaluation with a lower contact pressure of 10 MPa, see Figure 15.
Figure 15 shows the averaged values of coefficients of friction versus concentration plot at different
contact pressures with standard deviation error bars. All tests were repeated 3 times. It can be observed
that the friction coefficient is decreasing with increasing concentration of PVP. A constant sliding speed
of 20 mm/s for 2 hours was used to study the variation of friction coefficients under varying contact
pressures of 20 MPa (high load conditions) and 10 MPa (low load conditions). COF for high load
conditions is significantly higher than at low load conditions. This shows that the change in a single
parameter can result in a considerable difference in variation of friction coefficient, and ultimately with
the performance of the system. While the hydropower shifts from steady-state to transient state, there is
a great alteration with the performance of friction pairs, which can have an adverse effect on the efficiency
of the overall system.
0.156
0.129
0.115
0.132
0.1270.118
0% 3% 6% 9% 15% 20%
0.00
0.02
0.04
0.06
0.08
0.10
0.12
0.14
0.16
0.18
Friction C
oeffic
ient [µ
]
Concentration [% w/w]
a) 20 MPa
0.104
0.090.085
0.081
0% 6% 15% 20%
0.00
0.02
0.04
0.06
0.08
0.10
0.12
0.14
0.16
0.18
Friction C
oeffic
ient [µ
]
Concentration [% w/w]
b) 10 MPa
Figure 15 Dependence of friction coefficient of UHMWPE on the concentration of PVP
(Pin-on-plate tests, 20 mm/s, 2 hours)
Moreover, it can also be observed that the trend of friction reduction with 20 MPa contact pressure is
more fluctuating with increasing concentrations [Figure 15.a], while friction reduction at low load
conditions is gradual but the reduction is not huge. Under high load condition, COF of 0.156 for pure
water (0% w/w) reduced to 0.115 at 6% w/w concentration, which slightly increased and reached 0.118
at 20% w/w, which shows more than 26% reduction from 0% to 20% w/w concentration of PVP. On
the contrary, close inspection of Figure 15.b) shows that the reduction of COF from 0% to 20% w/w is
not immense.

20
Variation of friction coefficient on friction time for pure UHMWPE lubricated with an aqueous solution
of PVP at 20% concentration compared with pure water for both high and low load conditions is
presented in Figure 16. The friction coefficient as a function of time increases in the presence of pure
water, however, the friction curve tends to stabilize after running-in phase during operation in the
presence of PVP solutions. The friction-time curve for pure water is fluctuating and many peaks can be
observed throughout the curve, while the curves with PVP solutions are smoother and stable. The stable
plateau for an aqueous solution of PVP is more prominent with low load conditions as compared to a
higher load in the friction-time curve.
Figure 16 Variation of friction coefficient of UHMWPE on friction time for 20% PVP
(Pin-on-plate tests, 20 mm/s, 2 hours)
7.34
6.26
5.54 5.49
0% 6% 15% 20%
0
2
4
6
8
10
Sp
ecific
wea
r ra
te [1
0-5
mm
3/N
.m]
Concentration [% w/w]
a) 20 MPa
7.29
5.875.73
5.63
0% 6% 15% 20%
0
2
4
6
8
10
Specific
wear
rate
[10
-5 m
m3/N
.m]
Concentration [% w/w]
b) 10 MPa
Figure 17 Dependence of specific wear rates of UHMWPE pins on the concentration of PVP
(Pin-on-plate tests, 20 mm/s, 2 hours)
1000 2000 3000 4000 5000 6000 7000 8000
0.00
0.05
0.10
0.15
0.20
Frictio
n C
oe
ffic
ien
t [µ
]
Friction time [s]
Pure water @20 MPa
Pure water @10 MPa
20% PVP @20 MPa
20% PVP @10 MPa
21
The specific wear rates of the pure UHMWPE measured after friction test in lubrication with aqueous
solutions of PVP at 0%, 6%, 15% and 20% w/w concentrations can be found in Figure 17. The
corresponding specific wear rates for aqueous PVP solutions are analogous with the friction trend. The
wear rate is observed to reduce with the increasing concentration, the lowest wear rate value attained is
at 20% w/w PVP at both high and low load conditions.
The inclusion of PVP molecules in the lubricant sample shows a significant reduction in wear at 6% w/w
concentration as compared to pure water. Further increase in concentration exhibited slightly reduced
wear, however, it should be noted that the rate of reduction is relatively smaller from 6% reaching up to
20% w/w PVP concentration with large standard deviations. Approximately, 15% wear reduction is
observed with 6% w/w PVP solution compared to pure water with 20 MPa contact pressure, while only
about 6% wear reduction is recorded when the concentration is increased from 15% to 20% w/w. An
identical trend can be seen with 10 MPa contact pressure although the reduction of wear is more
prominent with a high load condition at 20 MPa. This suggests that the inclusion of PVP molecules in
pure base water significantly increased the wear-reducing properties of pure water, while a further
increase to higher concentrations of PVP might not facilitate the wear reduction in the same manner.
It is interesting to notice that the overall tendency for both friction and wear behavior with aqueous
solutions of PVP is found to have a drastically decreasing pattern with increasing concentrations. The
rate of reduction is then subsequently reduced and both friction and wear plots almost taper off. The
reason for such behavior is due to the adherence of PVP molecules at the SS counter plate which accounts
for the reduction of friction and successively wear, up to a certain concentration. Theoretically, once the
amount of PVP molecules on the surface reaches saturation, the increased concentration would not aid
in friction reduction or influence the friction and wear properties whatsoever, as there would be much
lesser space available for additional PVP molecules [60].
b) Pure UHMWPE with aqueous solutions of PSS
The aqueous solutions of PSS at different concentrations of 0%, 3%, 6% and 9% [w/w] were taken for
the first test sequence at high load conditions under TE77 pin-on-plate tribometer for the lubrication of
pure UHMWPE and SS counter plate friction pair. The inclusion of 3% w/w PSS concentration revealed
a huge increase in the coefficient of friction, which was not expected.
Table 5 Test sequence 1 PSS (20 MPa contact pressure)
PSS Concentration [w/w] Coefficient of friction [µ]
0% 0.156
3% 0.262
6% 0.239
9% 0.179
The average coefficient of friction of 0.156 with pure water increased to 0.262 at 3% w/w concentration,
only to decrease gradually with further increase in concentration. However, the friction coefficients at
3%, 6%, and 9%, all showed higher values than with pure water, Table 6. To further examine the
probable reason for this rise in COF, other solutions of PSS at 15% and 20% w/w concentrations were
prepared. The second test sequence was carried out with 9%, 15%, and 20% PSS to perform comparative
analysis at both high and low load conditions and the averaged friction coefficients are presented with
standard deviation error.
Figure 18 depicts the dependence of coefficients of friction on the concentrations of PSS at 20 MPa and
10 MPa, keeping other operating parameters constant. A parallel trend of friction coefficient can be
clearly seen at both high and low load conditions. Aqueous PSS solutions at 9% concentration showed a
higher friction coefficient, which was seen decreasing with further increase in concentrations with 20%
w/w yielding the lowest friction coefficient in the test sequence. This was true for both high and low
load conditions.

22
0.156
0.179
0.152
0.128
0% 9% 15% 20%
0.00
0.02
0.04
0.06
0.08
0.10
0.12
0.14
0.16
0.18
0.20F
riction C
oeffic
ient [µ
]
Concentration [% w/w]
a) 20 MPa
0.104
0.152
0.103
0.087
0% 9% 15% 20%
0.00
0.02
0.04
0.06
0.08
0.10
0.12
0.14
0.16
0.18
0.20
Friction C
oeffic
ient [µ
]Concentration [% w/w]
b) 10 MPa
Figure 18 Dependence of friction coefficient of UHMWPE on the concentration of PSS
(Pin-on-plate tests, 20 mm/s, 2 hours)
7.34
11.9
8.188.41
0% 9% 15% 20%
0
2
4
6
8
10
12
14
Spe
cific
wea
r ra
te [1
0-5
mm
3/N
.m]
Concentration [% w/w]
a) 20 MPa
7.29
8.83
6.15.28
0% 9% 15% 20%
0
2
4
6
8
10
12
14
Specific
wear
rate
[10
-5 m
m3/N
.m]
Concentration [% w/w]
b) 10 MPa
Figure 19 Dependence of specific wear rates of UHMWPE pins on the concentration of PSS
(Pin-on-plate tests, 20 mm/s, 2 hours)
The specific wear rates of the pure UHMWPE with aqueous solutions of PSS at 0%, 9%, 15%, and 20%
w/w concentrations can be found in Figure 19. The wear rates showed an increasing pattern with the
inclusion of PSS up to 9% w/w concentration, identical to the friction behavior. Under high load
conditions, UHMWPE pins experienced over 50% increased wear rates as compared to pure water when
the PSS concentration was 9%. The wear rates decreased with further increment of PSS concentration
but remained higher than with pure water. These results suggest that the inclusion of PSS with pure
water as a base does not necessarily improve the tribological performances. In a study performed by
Wang et al. [51] on PSS as an additive for water-glycol hydraulic fluid as base, improved friction and
wear performances were reported, however, PSS with pure water as base studied in this work resulted
in higher wear rates than with pure water with high contact pressure of 20 MPa.

23
This shows that although the friction coefficient reduced at higher PSS concentrations, wear resistance
did not achieve any improvement. PSS concentration at 20% under 20 MPa contact pressure showed
the lowest friction coefficient among all, however, the pin wear was enhanced with the presence of PSS
molecules in the lubricant sample. On the other hand, friction pair under low load conditions exhibited
lower wear rates at 15% and 20% w/w concentrations of PSS. The friction coefficients, as well as specific
wear rates, can be observed to be lowest with 20% w/w PSS concentration, with significant wear
reduction by over 25% as compared to pure water, 0.087 COF corresponding to specific wear rate of
5.28e-05 mm3/Nm under 10 MPa contact pressure.
Figure 20 depicts the variation of friction coefficient as a function of friction time for pure UHMWPE
lubricated with aqueous solutions of PSS at 20% concentration compared with pure water for both high
and low load conditions. The friction curves achieved stabilization after a short time in the presence of
PSS solutions. Friction coefficients corresponding to the time for PSS solutions show a trend alike to
that with PVP solutions, as seen from Figures 16 and 20.
Figure 20 Variation of friction coefficient of UHMWPE on friction time for 20% PSS
(Pin-on-plate tests, 20 mm/s, 2 hours)
All the lubricant samples at different concentrations of PVP and PSS generated similar friction-time
curves with a tendency to steadily decline during the running-in phase and stabilizing over the test time.
Pure water exhibited an increasing friction-time curve with fluctuating peaks whilst modified water
solutions generated smoother and stable curves. This indicates that the base water is not capable of
forming a stable boundary lubrication film. The limited friction reduction from higher load to lower
load with pure water can be attributed to the friction-reducing properties of the pure UHMWPE bearing
material being more significant under low load conditions owing to its good mechanical and impact
strength, highly wear-resistant and self-lubricating behavior.
The trend of the friction-time curve was identical for lower concentrations of PSS as well, however, the
average COF values were higher than with pure water. It can be further noted from Figure 19 that the
wear rates are also higher with most of the PSS sample solutions. This suggests that even though the
aqueous solutions of PSS could form a stable lubrication film as compared to pure water, the wear
mechanisms might get enhanced due to the adsorption of PSS molecules to the friction surfaces and thus
lead to increased friction and consequently wear rates.
1000 2000 3000 4000 5000 6000 7000 8000
0.00
0.05
0.10
0.15
0.20
Friction C
oeffic
ient [µ
]
Friction time [s]
Pure water @20 MPa
Pure water @10 MPa
20% PSS @20 MPa
20% PSS @10 MPa

24
c) SCF reinforced UHMWPE with aqueous solutions of PVP
The second phase of this study was carried out with the short carbon fiber reinforced UHMWPE. 10%
SCF reinforced UHMWPE was chosen as the bearing material in contact with the SS2333 grade stainless
steel counter plate during the tribo test. All other operating parameters were kept constant, with two
load conditions corresponding to 20 MPa and 10 MPa contact pressures.
Figure 21 presents the plot of coefficients of friction acquired with the SCF reinforced UHMWPE versus
concentrations of PVP. The aqueous solutions of PVP showed reducing friction coefficients between
the SCF reinforced UHMWPE pin and SS countersurface friction pair under a contact pressure of 20
MPa. The observed average coefficients of friction exhibit the trend within the region of standard
deviation. The reduction is gradual and slow, COF of 0.116 with pure water reaching 0.105 at 20%
w/w PVP concentration. The lower load conditions, on the other hand, showed slightly increased
friction at first which further decreased on the increment of PVP concentrations. PVP solutions at 15%
w/w concentration under lower load conditions showed a reduction in friction by 25% as compared to
pure water.
0.116
0.1130.11 0.105
0% 6% 15% 20%0.00
0.02
0.04
0.06
0.08
0.10
0.12
0.14
Friction C
oeffic
ient [µ
]
Concentration [% w/w]
a) 20 MPa
0.1 0.106
0.075
0.092
0% 6% 15% 20%0.00
0.02
0.04
0.06
0.08
0.10
0.12
0.14F
riction C
oeffic
ient [µ
]
Concentration [% w/w]
b) 10 MPa
Figure 21 Dependence of friction coefficient of SCF reinforced UHMWPE on the concentration of PVP
(Pin-on-plate tests, 20 mm/s, 2 hours)
SCF reinforced UHMWPE also showed reduced specific wear rates in the presence of PVP molecules,
analogous to that of pure UHMWPE. The specific wear rates of SCF reinforced UHMWPE bearing
materials with increasing PVP concentrations can be found in Figure 22. In comparison with pure water,
20% w/w PVP concentration showed an almost 25% reduction in wear when loaded with 20 MPa
contact pressure. The lower load conditions at 10 MPa experienced lowest wear rates with PVP solutions
at 15% w/w concentration, with a reduction up to 46% as compared with pure water.
It can be observed from friction and wear performances with 10% SCF reinforced UHMWPE bearing
materials that the optimum concentration of PVP for high load applications is at 20% w/w, while that
for lower loads, is at 15% w/w concentration. When the load is increasing, the inclusion amount of PVP
should also be further increased. Furthermore, it is also evident from Figures 15 and 17 compared with
Figures 21 and 22, that SCF reinforced UHMWPE exhibited considerably lower friction coefficients
and improved wear resistance than the virgin UHMWPE. This clearly shows that the inclusion of SCFs
with pure UHMWPE significantly improves the tribological properties of bearing materials, as expected.

25
6.79
6.22
6.72
5.12
0% 6% 15% 20%
0
2
4
6
8
Sp
ecific
we
ar
rate
[1
0-5
mm
3/N
.m]
Concentration [% w/w]
a) 20 MPa
5.44
4.48
2.92
4.26
0% 6% 15% 20%0
2
4
6
8
Sp
ecific
we
ar
rate
[1
0-5
mm
3/N
.m]
Concentration [% w/w]
b) 10 MPa
Figure 22 Dependence of specific wear rates of SCF reinforced UHMWPE on the concentration of PVP
(Pin-on-plate tests, 20 mm/s, 2 hours)
d) SCF reinforced UHMWPE with aqueous solutions of PSS
The aqueous solutions of PSS exhibited a decreasing coefficient of friction trend with the inclusion of
PSS. SCF reinforced UHMWPE pins experienced the lowest friction with aqueous solutions of PSS at
15% w/w concentrations during both high and low load conditions. The average coefficient of friction
of 0.116 for pure water reached 0.084 under 20 MPa contact pressure, see Figure 23.a), and COF 0.10
reduced to 0.057 under 10 MPa, Figure 23.b). When the PSS concentration was further increased to
20%, the solution resulted in friction higher than with pure water.
0.116
0.094
0.084
0.136
0% 9% 15% 20%0.00
0.02
0.04
0.06
0.08
0.10
0.12
0.14
0.16
Frictio
n C
oe
ffic
ien
t [µ
]
Concentration [% w/w]
a) 20 MPa
0.1
0.0650.057
0.121
0% 9% 15% 20%0.00
0.02
0.04
0.06
0.08
0.10
0.12
0.14
0.16
Frictio
n C
oe
ffic
ien
t [µ
]
Concentration [% w/w]
b) 10 MPa
Figure 23 Dependence of friction coefficient of SCF reinforced UHMWPE on the concentration of PSS
(Pin-on-plate tests, 20 mm/s, 2 hours)

26
The specific wear rates obtained for SCF reinforced UHMWPE pins showed fluctuating patterns under
both higher and lower contact pressures, see Figure 24. The wear rates first increased up to 9% w/w PSS
concentration, which slightly reduced at 15% concentration, and subsequently increasing again with
concentration reaching 20%. This phenomenon stands true for both high and low load conditions,
exhibiting higher wear rates of SCF reinforced UHMWPE in the presence of PSS molecules with pure
water. On a similar note to friction behavior, lowest wear rates obtained were with 15% w/w
concentration among the PSS aqueous solutions studied, however, exhibited poor wear resistant behavior
as compared to the pure water lubrication. In addition, the friction-time curves with SCF reinforced
UHMWPE also exhibited patterns alike pure UHMWPE lubricated with both PVP and PSS aqueous
solutions, analogous to Figures 16 and 20.
6.79
10.8
6.43
8.81
0% 9% 15% 20%0
2
4
6
8
10
12
Sp
ecific
we
ar
rate
[1
0-5
mm
3/N
.m]
Concentration [% w/w]
a) 20 MPa
5.446.22
5.84
7.28
0% 9% 15% 20%0
2
4
6
8
10
12
Spe
cific
wea
r ra
te [10
-5 m
m3/N
.m]
Concentration [% w/w]
b) 10 MPa
Figure 24 Dependence of specific wear rates of SCF reinforced UHMWPE on the concentration of PSS
(Pin-on-plate tests, 20 mm/s, 2 hours)

27
3.2.2 SEM Analysis
Polymer pins and SS countersurface were analyzed under a scanning electron microscope (SEM) after
the friction and wear tests. SEM images aided to understand the friction pair interaction and probable
wear mechanisms. All the tests were carried out on the polymer pins under high load conditions of 20
MPa contact pressures and 20 mm/s constant sliding speed. The red-colored double arrowed line shows
the direction of polymer pin sliding over the SS counter surface.
Figure 25 presents the images generated with SEM on the UHMWPE pins lubricated with an aqueous
solution of PVP at 20% w/w concentration after testing for 2 hours. The worn pin surface shows wear
tracks scratched along the sliding direction. As the pin was repetitively loaded and unloaded with a high
contact pressure for 2 hours, the surface also experienced deformation, as seen in Figure 25.B).
Figure 25 Worn UHMWPE pin surfaces (20% PVP, 20 MPa, 2 hours)
A) Wear tracks, Scale 100 µm B) Deformation, Scale 20 µm
Figure 26 Worn UHMWPE pin surfaces (20% PVP, 20 MPa, 20 hours)
A) Scale 100 µm B) Worn-out flakes, Scale 50 µm
Separate wear tests for a longer test duration of 20 hours were carried out for better representation of
wear behavior and compare with 2 hours, keeping all the operating parameters constant. Figure 26 shows
the images obtained from pure UHMWPE pins tested for 20 hours. On the contrary to pins loaded for
A B
A B
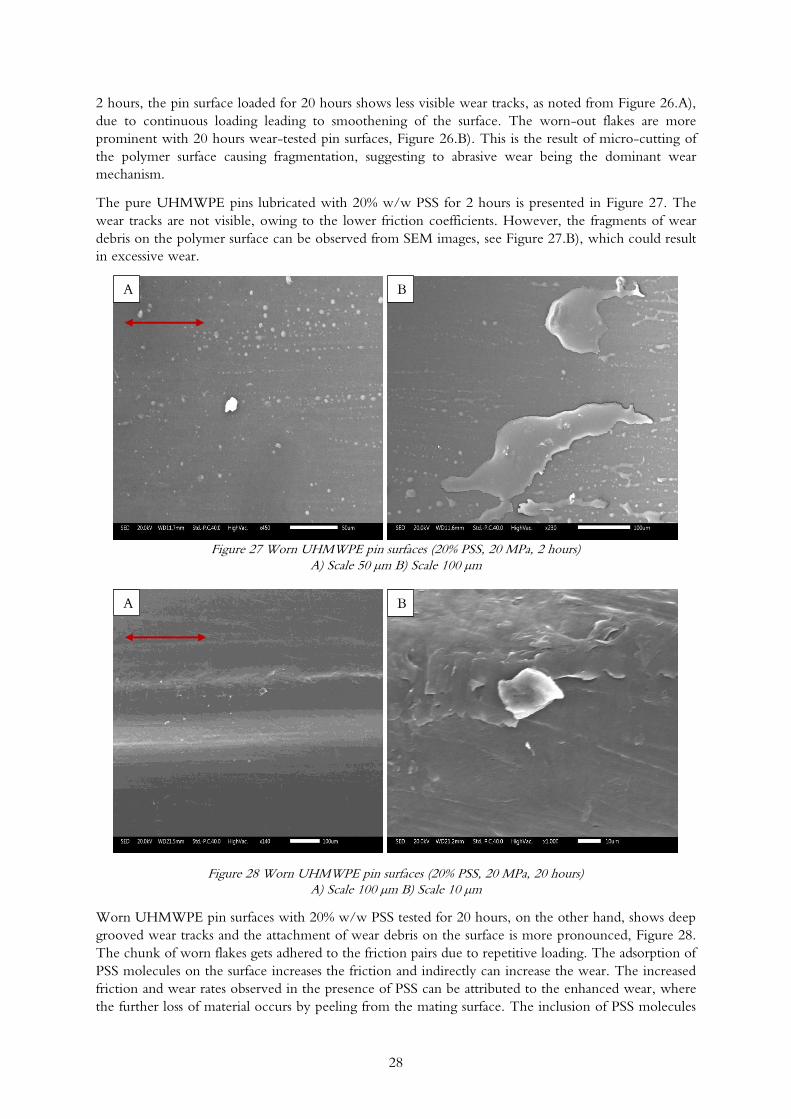
28
2 hours, the pin surface loaded for 20 hours shows less visible wear tracks, as noted from Figure 26.A),
due to continuous loading leading to smoothening of the surface. The worn-out flakes are more
prominent with 20 hours wear-tested pin surfaces, Figure 26.B). This is the result of micro-cutting of
the polymer surface causing fragmentation, suggesting to abrasive wear being the dominant wear
mechanism.
The pure UHMWPE pins lubricated with 20% w/w PSS for 2 hours is presented in Figure 27. The
wear tracks are not visible, owing to the lower friction coefficients. However, the fragments of wear
debris on the polymer surface can be observed from SEM images, see Figure 27.B), which could result
in excessive wear.
Figure 27 Worn UHMWPE pin surfaces (20% PSS, 20 MPa, 2 hours)
A) Scale 50 µm B) Scale 100 µm
Figure 28 Worn UHMWPE pin surfaces (20% PSS, 20 MPa, 20 hours)
A) Scale 100 µm B) Scale 10 µm
Worn UHMWPE pin surfaces with 20% w/w PSS tested for 20 hours, on the other hand, shows deep
grooved wear tracks and the attachment of wear debris on the surface is more pronounced, Figure 28.
The chunk of worn flakes gets adhered to the friction pairs due to repetitive loading. The adsorption of
PSS molecules on the surface increases the friction and indirectly can increase the wear. The increased
friction and wear rates observed in the presence of PSS can be attributed to the enhanced wear, where
the further loss of material occurs by peeling from the mating surface. The inclusion of PSS molecules
A
A
B
B

29
on the base water results in higher wear, as the wear is primarily governed by the adhesion mechanism
in the long run.
SEM images of the SCF reinforced UHMWPE pin surfaces lubricated under 320 N load, 20 mm/s
sliding speed and 2 hours test duration with PVP and PSS aqueous solutions were analyzed. Figure 29
depicts the images of pin surface lubricated with 20% w/w PVP. The degrading carbon fibers due to
continuous loading is distinguishable. The fibers are starting to wear out, but the polymer surface is
comparatively less affected than the pure UHMWPE pin surfaces.
Figure 29 Worn SCF reinforced UHMWPE pin surfaces (20% PVP, 20 MPa, 2 hours)
A) Scale 100 µm B) Scale 50 µm
Figure 30 Worn SCF reinforced UHMWPE pin surfaces (20% PSS, 20 MPa, 2 hours)
A) Scale 100 µm B) Scale 50 µm
As the major load is carried by the exposed short carbon fibers, they will wear out first due to continuous
rubbing before the polymer matrix experiences wear. The wear particles adhered to the pin surface in
the presence of PSS with water can be identified while looking at Figure 30. This further supports the
lower friction and wear results obtained earlier on SCF reinforced UHMWPE bearing materials
lubricated with PVP aqueous solutions as compared to the PSS solutions.
A
A
B
B
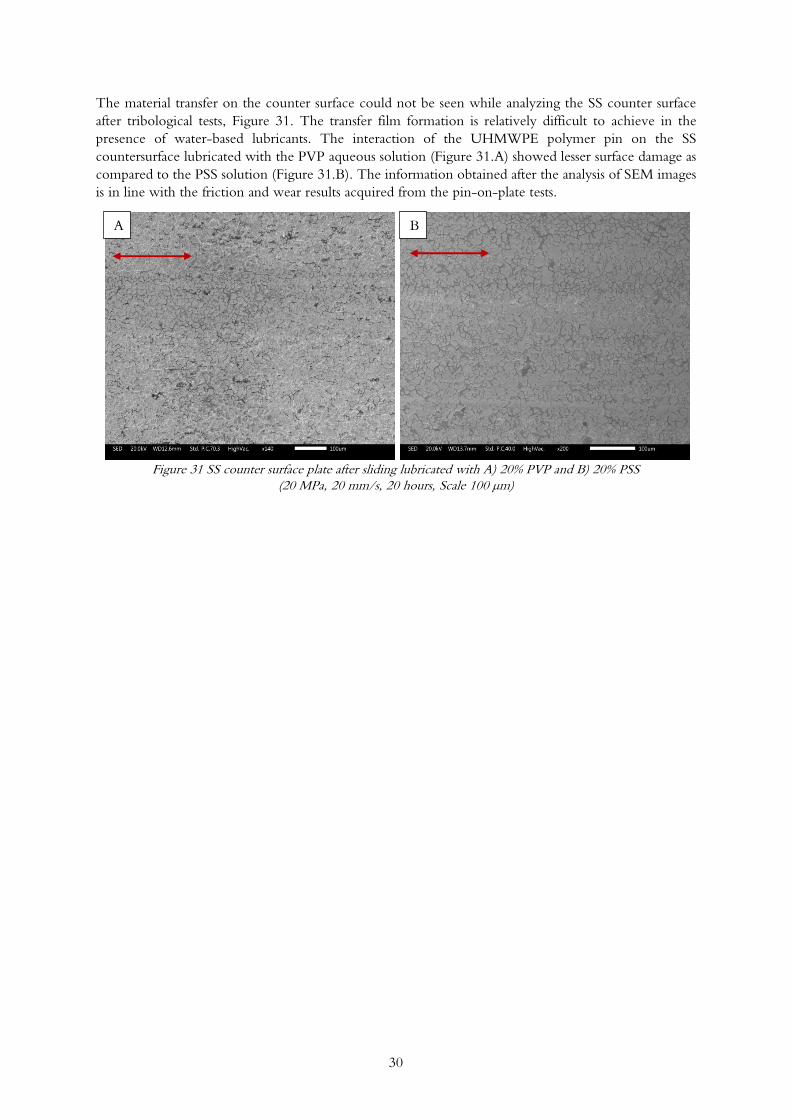
30
The material transfer on the counter surface could not be seen while analyzing the SS counter surface
after tribological tests, Figure 31. The transfer film formation is relatively difficult to achieve in the
presence of water-based lubricants. The interaction of the UHMWPE polymer pin on the SS
countersurface lubricated with the PVP aqueous solution (Figure 31.A) showed lesser surface damage as
compared to the PSS solution (Figure 31.B). The information obtained after the analysis of SEM images
is in line with the friction and wear results acquired from the pin-on-plate tests.
Figure 31 SS counter surface plate after sliding lubricated with A) 20% PVP and B) 20% PSS
(20 MPa, 20 mm/s, 20 hours, Scale 100 µm)
B A

31
3.3 Contact angle measurements
From the tribological characterization of newly developed modified water lubricants, sample lubricants
with only polyvinylpyrrolidone (PVP) exhibited satisfying friction and wear results which were further
confirmed by the SEM analysis, as seen from the previous sections. To further validate the newly
developed modified water-based lubricant sample, a surface analysis could provide some supporting
information. To investigate the effect of wettability on friction and wear behavior, the wetting ability of
the lubricant sample with PVP was evaluated by the contact angle measurements. Figure 32 shows the
contact angles made by the lubricant samples at different concentrations on the unmodified surface of
pure UHMWPE, SCF reinforced UHMWPE bearing materials, and SS countersurface.
0% 3% 6% 9% 15% 20%50
55
60
65
70
75
80
85
90
95
100
105
Co
nta
ct ang
le [degre
e]
PVP Concentration [% w/w]
SS
UHMWPE
10%SCF+UHMWPE
Figure 32 Dependence of contact angles on the concentration of PVP
Pure base water showed more hydrophobic nature with SS countersurface than with the polymer
surfaces. The inclusion of PVP with base water, however, changed the scenario with larger contact angles
on polymer surfaces than on the SS countersurface. Overall, lower wetting angles on all surfaces were
observed with PVP lubricants relative to distilled water. In addition, the differences in contact angles
made by the lubricant on the pure UHMWPE and SCF reinforced UHMWPE are small. The increment
on PVP concentration increases the phobic nature of the sample lubricants, and thereby reduced wetting
ability. This can be correlated with the results from tribological tests where improved friction and wear
behavior were recorded with the increasing concentrations of PVP molecules on the base water for virgin
UHMWPE as well as SCF reinforced UHMWPE. Reduced wetting ability of the lubricant with the
increasing concentrations of PVP corresponds to the stronger cohesive forces between the lubricant
molecules with each other than with the bearing surfaces suggesting to the ability to lubricant film
formation.

32
4 Conclusion
The presented work is a tribological study of newly developed environmentally adaptive lubricants
(EALs) for hydropower turbine applications with polymer bearing materials. Two thickening agents,
poly(sodium 4-styrenesulfonate) (PSS) and polyvinylpyrrolidone (PVP), with pure water as a base fluid
were investigated. The following conclusions can be drawn after investigating the generated results.
• It is clear from the results that both PVP and PSS effectively increase the viscosity of pure water
used as a lubricant base and was observed to easily dissolve in water to form transparent solutions.
Thus, both thickeners can be used as an effective viscosity modifier.
• PVP exhibited excellent friction-reducing and anti-wear performances versus pure water.
Approximately, 25% reduction on both friction coefficients and specific wear rates for pure
UHMWPE bearing specimen was observed.
• SCF (10%) reinforced UHMWPE showed a significant improvement in friction reduction and
exhibited excellent wear resistance, over 25% wear reduction under high load conditions, and
over 45% wear reduction under lower load conditions with PVP aqueous solutions.
• PSS showed a slightly reduced friction coefficient but increased wear rates of polymer pins by
10% to over 50% at high contact pressure. SEM analysis on worn pin surfaces further revealed
induced adhesion wear in the presence of PSS molecules. Wear enhancement, as observed from
the presented study, makes PSS a poor choice as a thickener for pure water under high load
conditions.
• PSS at the lower load of 10 MPa, however, exhibited a significant reduction in friction and wear
rates at 15% concentration and higher. Thus, PSS can be further studied as a potential additive
for low load applications.
• PVP is recommended as a suitable candidate due to its excellent viscosity enhancing, friction and
wear-reducing properties for further investigation at both higher and lower contact pressure
conditions towards the development of ‘green lubricant’.

33
5 Recommendations
In reference to the concluding remarks made in the previous section, it is important to state that the
presented work still has some limitations. Some recommendations can be made to further improve the
work and strengthen the conclusions presented in this study.
• The friction tests carried out were for 2 hours, further investigation with longer test durations
can be performed to study the aging and life expectancy of lubricants.
• Further analysis of the surface activity of lubricant with PVP molecules will shed more light on
the surface properties of the lubricant.
• An extensive study on UHMWPE with additional fillers and nano reinforcements as bearing
materials lubricated with aqueous PVP can be performed.
• The tests were carried out at laboratory conditions, study with real-life conditions prone to
contamination is recommended to evaluate the performance of lubricants in extreme conditions
and to achieve more understanding over the lubricant performance.
• Poly(sodium 4-styrenesulfonate) (PSS) showed a significant reduction in friction and wear at
lower load conditions, a detailed study on PSS, specifically for low load applications is suggested
to further evaluate the influence of PSS on water-based lubrication under low load conditions.

34
References
1. Energy in Sweden: An Overview. Swedish Energy Agency, 2019. 2. Glavatskih, S., Tilting Pad Thrust Bearings. Tribological Research and Design for Engineering
Systems, 2003: p. 379-390. 3. A general guide to the principles, operation and troubleshooting of hydrodynamic bearings.
Kingsbury Bearing Inc., 1997. 4. Golchin, A., et al., Tribological behaviour of polymeric materials in water-lubricated contacts.
Proceedings of the Institution of Mechanical Engineers, Part J: Journal of Engineering Tribology, 2013. 227(8): p. 811-825.
5. Yamamoto, Y. and T. Takashima, Friction and wear of water lubricated PEEK and PPS sliding contacts. Wear, 2002. 253(7): p. 820-826.
6. Jintang, G., Tribochemical effects in formation of polymer transfer film. Wear, 2000. 245(1-2): p. 100–106.
7. Ünlü, B.S., Atik, E., and Köksal, S., Tribological properties of polymer-based journal bearings. Materials & Design, 2009. 30(7): p. 2618-2622.
8. Bahadur, S., and Tabor, D., The wear of filled polytetrafluoroethylene. Wear, 1984. 98: p. 1-13. 9. Xue, Q., Zhang, Z., Liu, W., and Shen, W., Friction and wear characteristics of fiber- and
whisker-reinforced PTFE composites under oil lubricated conditions. Journal of applied polymer science, 1998. 69(7): p. 1393-1402.
10. Friedrich, K., Zhang, Z., and Schlarb, A.K., Effects of various fillers on the sliding wear of polymer composites. Composites Science and Technology, 2005. 65(15): p. 2329-2343.
11. McCarthy, D., Lubrication of sliding bearings for hydropower applications, 2005, Luleå tekniska universitet.
12. Nunez, E.E., R. Gheisari, and A.A. Polycarpou, Tribology review of blended bulk polymers and their coatings for high-load bearing applications. Tribology International, 2019. 129: p. 92-111.
13. Jean-Fulcrand, A., et al., Effect of temperature on tribological performance of polyetheretherketone-polybenzimidazole blend. Tribology International, 2019. 129: p. 5-15.
14. ThorPlas Bearings Engineering Manual. Thordon Bearings Inc. Version: TP2019.1. 15. Ukonsaari, J., and Prakash, B., Journal bearing test with Thordon ThorPlas using increasing
load. Lulea University of Technology & Duwel Techno AB, 2009. 16. Ren, G., and Feng, J., Friction and Wear Characteristics of ThorPlas Bearings and Their
Application in Hydro Turbines. Proc. HydroVision International 2011, Sacramento, CA USA, 2011.
17. ASTM, A., Standard Terminology Relating to Wear and Erosion. G40, 2013. 18. Ginzburg, B., et al., Polymeric materials for water-lubricated plain bearings. Russian journal of
applied chemistry, 2006. 79(5): p. 695-706. 19. Williams, J. and A. Hyncica, Mechanisms of abrasive wear in lubricated contacts. Wear, 1992.
152(1): p. 57-74. 20. Bahadur, S., The development of transfer layers and their role in polymer tribology. Wear,
2000. 245(1-2): p. 92-99. 21. Fox, N. and G. Stachowiak, Vegetable oil-based lubricants—a review of oxidation. Tribology
International, 2007. 40(7): p. 1035-1046. 22. Ohkawa, S., et al., Oxidation and corrosion characteristics of vegetable-base biodegradable
hydraulic oils. SAE transactions, 1995: p. 737-745. 23. Sharma, B.K., K.M. Doll, and S.Z. Erhan, Ester hydroxy derivatives of methyl oleate: tribological,
oxidation and low temperature properties. Bioresource technology, 2008. 99(15): p. 7333-7340.
24. Gong, Q.-Y., L.-G. Yu, and C.-F. Ye, Study of the tribological behaviors of [S-(2H-thiophen-2-yl)]-methyl-alkyl xanthates as additives in rapeseed oil. Wear, 2002. 253(5-6): p. 558-562.

35
25. Cao, Y., L. Yu, and W. Liu, Study of the tribological behavior of sulfurized fatty acids as additives in rapeseed oil. Wear, 2000. 244(1-2): p. 126-131.
26. Ukonsaari, J. and E. Kassfeldt. Tribological studies on oscillating bronze bearings lubricated with environmentally adapted lubricants (EALs). in ASME/STLE 2004 International Joint Tribology Conference. 2004. American Society of Mechanical Engineers.
27. Ukonsaari, J., Tribology of journal bearings under environmentally adapted lubrication with shaft oscillation, 2004, Luleå tekniska universitet.
28. Nalam, P., Clasohm, JN., Mashaghi, A., Spencer, ND., Macrotribological Studies of Poly(L-lysine)-graft-Poly(ethylene glycol) in Aqueous Glycerol Mixtures. Tribology Letters, 2010. 37(3): p. 541-552.
29. Habchi, W., et al., Full film, boundary lubrication and tribochemistry in steel circular contacts lubricated with glycerol. Tribology letters, 2011. 42(3): p. 351.
30. Shi, Y., et al., Boundary and elastohydrodynamic lubrication studies of glycerol aqueous solutions as green lubricants. Tribology International, 2014. 69: p. 39-45.
31. Tortora, A.M., and Veeregowda, D.H., True stability of lubricants determined using the ball-on-disk test. Advances in Tribology, 2016.
32. Zheng, D., et al., Anticorrosion and lubricating properties of a fully green lubricant. Tribology International, 2018.
33. Mu, L., et al., Non-corrosive green lubricants: strengthened lignin–[choline][amino acid] ionic liquids interaction via reciprocal hydrogen bonding. RSC Advances, 2015. 5(81): p. 66067-66072.
34. Zhang, Y., et al., Environmental friendly polyisobutylene-based ionic liquid containing chelated orthoborate as lubricant additive: Synthesis, tribological properties and synergistic interactions with ZDDP in hydrocarbon oils. Tribology International, 2017. 115: p. 297-306.
35. Nagendramma, P., et al., Lubrication capabilities of amino acid based ionic liquids as green bio-lubricant additives. Journal of Molecular Liquids, 2017. 244: p. 219-225.
36. Bapat, A.P., et al., Lipophilic Polymethacrylate Ionic Liquids as Lubricant Additives. European Polymer Journal, 2018.
37. Khemchandani, B., et al., A biocompatible ionic liquid as an antiwear additive for biodegradable lubricants. Tribology International, 2014. 77: p. 171-177.
38. Villanueva, M., et al., Thermal Stability of Ionic Liquids for Their Application as New Absorbents. Industrial & Engineering Chemistry Research, 2013. 52(45): p. 15718-15727.
39. Jiménez, A.E., et al., Room temperature ionic liquids as lubricant additives in steel-aluminium contacts: Influence of sliding velocity, normal load and temperature. Vol. 261. 2006. 347-359.
40. Pisarova, L., et al., Thermo-oxidative stability and corrosion properties of ammonium based ionic liquids. Tribology International, 2012. 46(1): p. 73-83.
41. Pejaković, V., et al., Influence of concentration and anion alkyl chain length on tribological properties of imidazolium sulfate ionic liquids as additives to glycerol in steel–steel contact lubrication. Tribology International, 2016. 97: p. 234-243.
42. Wu, J., et al., High load capacity with ionic liquid-lubricated tribological system. Tribology International, 2016. 94: p. 315-322.
43. Wu, J., et al., Halogen-free ionic liquids as excellent lubricants for PEEK-stainless steel contacts at elevated temperatures. Tribology International, 2016. 104: p. 1-9.
44. Song, Z., et al., Ionic liquids from amino acids: fully green fluid lubricants for various surface contacts. RSC Advances, 2014. 4(37): p. 19396-19402.
45. Zhang, S., et al., The ecotoxicity and tribological properties of choline amino acid ionic liquid lubricants. Tribology International, 2018. 121: p. 435-441.
46. M.S, A., P.K. Khatri, and S.L. Jain, Synthesis and evaluation of bio-compatible cholinium amino acid ionic liquids for lubrication applications. Journal of Industrial and Engineering Chemistry, 2018. 64: p. 420-429.

36
47. Ratoi, M. and H.A. Spikes, Lubricating Properties of Aqueous Surfactant Solutions. Tribology Transactions, 1999. 42(3): p. 479-486.
48. Edge, E., Dynamic Viscosity. Engineers Edge, LLC, 2019. 49. Sulek, M.W. and T. Wasilewski, Tribological properties of aqueous solutions of alkyl
polyglucosides. Wear, 2006. 260(1): p. 193-204. 50. Sulek, M.W., T. Wasilewski, and K.J. Kurzydłowski, The Effect of Concentration on Lubricating
Properties of Aqueous Solutions of Sodium Lauryl Sulfate and Ethoxylated Sodium Lauryl Sulfate. Tribology letters, 2010. 40(3): p. 337-345.
51. Wang, J., et al., Tribological performance of poly (sodium 4‐styrenesulphonate) as additive in water–glycol hydraulic fluid. Lubrication Science, 2012. 24(3): p. 140-151.
52. Hartung, W., et al., Aqueous lubrication of SiC and Si 3 N 4 ceramics aided by a brush-like copolymer additive, poly (l-lysine)-graft-poly (ethylene glycol). Tribology letters, 2009. 34(3): p. 201-210.
53. Spencer, N.D., Aqueous lubrication with poly (ethylene glycol) brushes. Tribology Online, 2014. 9(4): p. 143-153.
54. Hartung, W., et al., The influence of anchoring-group structure on the lubricating properties of brush-forming graft copolymers in an aqueous medium. Tribology letters, 2008. 31(2): p. 119-128.
55. Stokes, J.R., et al., Lubrication, adsorption, and rheology of aqueous polysaccharide solutions. Langmuir, 2011. 27(7): p. 3474-3484.
56. A. El-Sayed, A., et al., Friction and wear properties of polymeric composite materials for bearing applications. Vol. 184. 1995. 45-53.
57. Hu, Y., et al., PEGlated graphene as nanoadditive for enhancing the tribological properties of water-based lubricants. Carbon, 2018. 137: p. 41-48.
58. Brady, J., et al., Chapter 7 - Polymer Properties and Characterization, in Developing Solid Oral Dosage Forms (Second Edition), Y. Qiu, et al., Editors. 2017, Academic Press: Boston. p. 181-223.
59. Sulek, M.W., et al., Polymers (Polyvinylpyrrolidones) As Active Additives Modifying the Lubricating Properties of Water. Industrial & Engineering Chemistry Research, 2012. 51(45): p. 14700-14707.
60. Guo, Y., Z. Hao, and C. Wan, Tribological characteristics of polyvinylpyrrolidone (PVP) as a lubrication additive for artificial knee joint. Tribology International, 2016. 93: p. 214-219.
61. Haaf, F., A. Sanner, and F. Straub, Polymers of N-vinylpyrrolidone: synthesis, characterization and uses. Polymer Journal, 1985. 17(1): p. 143.
62. Sigma-Aldrich, Polyvinylpyrrolidone, 2019. 63. El-Mohdy, H.A. and S. Ghanem, Biodegradability, antimicrobial activity and properties of
PVA/PVP hydrogels prepared by γ-irradiation. Journal of Polymer Research, 2009. 16(1): p. 1.
64. Fischer, F. and S. Bauer, An all rounder in the chemistry polyvinylpyrrolidone. Chemie in unserer Zeit, 2009. 43(6): p. 376-383.
65. Knappe, P., et al., Characterization of poly (N-vinyl-2-pyrrolidone) s with broad size distributions. Polymer, 2010. 51(8): p. 1723-1727.
66. Ma, R., et al., Friction properties of novel PVP/PVA blend hydrogels as artificial cartilage. Journal of Biomedical Materials Research Part A: An Official Journal of The Society for Biomaterials, The Japanese Society for Biomaterials, and The Australian Society for Biomaterials and the Korean Society for Biomaterials, 2010. 93(3): p. 1016-1019.
67. Sobczak, M., et al., Polymers for pharmaceutical applications. POLIMERY-WARSAW-, 2007. 52(6): p. 411.
68. Bolten, D. and M. Turk, Experimental study on the surface tension, density, and viscosity of aqueous poly (vinylpyrrolidone) solutions. Journal of Chemical & Engineering Data, 2011. 56(3): p. 582-588.

37
69. Katta, J.K., et al., Friction and wear behavior of poly (vinyl alcohol)/poly (vinyl pyrrolidone) hydrogels for articular cartilage replacement. Journal of Biomedical Materials Research Part A: An Official Journal of The Society for Biomaterials, The Japanese Society for Biomaterials, and The Australian Society for Biomaterials and the Korean Society for Biomaterials, 2007. 83(2): p. 471-479.
70. Yoshida, K., et al., Anaphylaxis to polyvinylpyrrolidone in povidone-iodine for impetigo contagiosum in a boy with atopic dermatitis. International archives of allergy and immunology, 2008. 146(2): p. 169-173.
71. Koczkur, K.M., et al., Polyvinylpyrrolidone (PVP) in nanoparticle synthesis. Dalton Transactions, 2015. 44(41): p. 17883-17905.
72. Wohlfarth, C., Second virial coefficient of poly (1-vinyl-2-pyrrolidinone), in Polymer Solutions. 2010, Springer. p. 1266-1267.
73. Song, G., et al., Strong Fluorescence of Poly (N‐vinylpyrrolidone) and Its Oxidized Hydrolyzate. Macromolecular rapid communications, 2015. 36(3): p. 278-285.
74. Tang, X. and S. Alavi, Recent advances in starch, polyvinyl alcohol based polymer blends, nanocomposites and their biodegradability. Carbohydrate polymers, 2011. 85(1): p. 7-16.
75. Ashland, PVP - Polyvinylpyrrolidone polymers, 2013, Ashland Polymers. 76. De Dardel, F. and T.V. Arden, Ion exchangers. Ullmann's Encyclopedia of Industrial Chemistry,
2000. 77. Sigma-Aldrich, Poly(sodium 4-styrenesulfonate), 2019. 78. Kurtz, S.M., UHMWPE biomaterials handbook: ultra high molecular weight polyethylene in
total joint replacement and medical devices. 2009: Academic Press. 79. Vadivel, H.S., A. Golchin, and N. Emami, Tribological behaviour of carbon filled hybrid
UHMWPE composites in water. Tribology International, 2018. 124: p. 169-177. 80. Chukov, D., et al., Investigation of structure, mechanical and tribological properties of short
carbon fiber reinforced UHMWPE-matrix composites. Composites Part B: Engineering, 2015. 76: p. 79-88.
81. Capela, C., S. Oliveira, and J. Ferreira, Fatigue behavior of short carbon fiber reinforced epoxy composites. Composites Part B: Engineering, 2019. 164: p. 191-197.
82. Wang, Q., et al., Modification effects of short carbon fibers on mechanical properties and fretting wear behavior of UHMWPE composites. Surface and Interface Analysis, 2016. 48(3): p. 139-145.
83. Law, K.-Y., Definitions for hydrophilicity, hydrophobicity, and superhydrophobicity: getting the basics right, 2014, ACS Publications.

38