Revisiting Asian monsoon formation and change associated ...
ORI GIN AL PA PER
Trends and extreme value analysis of rainfall patternover homogeneous monsoon regions of India
T. V. Lakshmi Kumar • K. Koteswara Rao •
Humberto Barbosa • R. Uma
Received: 12 June 2013 / Accepted: 28 February 2014� Springer Science+Business Media Dordrecht 2014
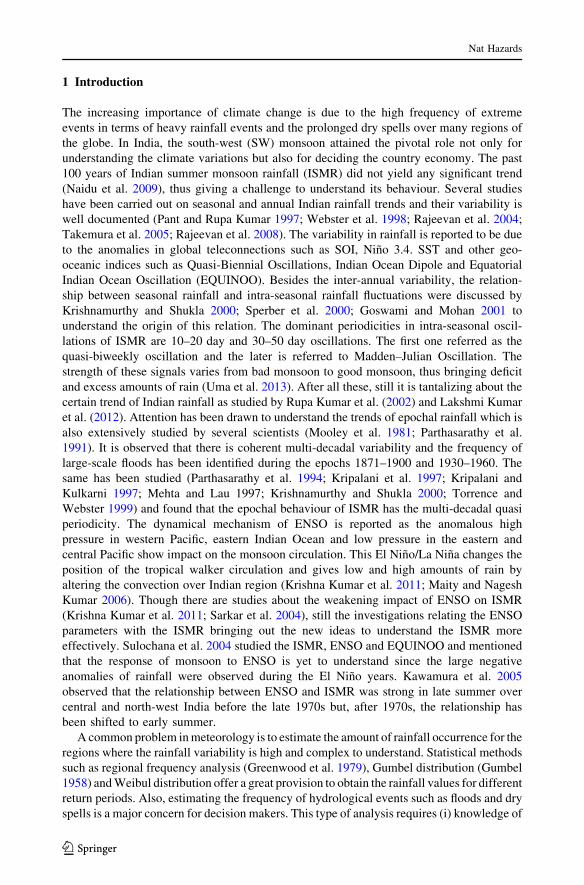
Abstract Trends of pre-monsoon, monsoon and post-monsoon rainfall pattern were
studied on decadal basis over different homogeneous monsoon regions in India for the
period 1871–2008. It is attempted to understand the relation of monsoon rainfall with the
global teleconnections of El Nino and La Nina, for which the correlation analysis has been
carried out with Darwin pressure and Nino 3.4 sea surface temperature (Nino 3.4 SST).
The correlation analysis inferred that the significant correlations were observed when
monsoon rainfall is related to ENSO indices on decadal scale than on annual ones. The
study also found that the north-west region is more affected by the moderate El Nino years
compared to strong El Nino years. The regions Central North-East and North-East could
not make any difference among weak, moderate and strong La Nina events. The authors
also have carried out the extreme value analysis over different homogeneous monsoon
regions of India as well as for whole India. The results show that the return values of
rainfall are increasing with the return periods for the forthcoming 10, 20, 50 and 100 years.
The heterogeneity in number of threshold years that were recorded for the extreme rainfall
over north-east (humid climatic type) and north-west (arid climatic type) described the
climate variability. The results of the present study may be useful for the policy makers in
understanding the rainfall exceedance in different return periods for planning the risk
management strategies.
Keywords Decadal trends of rainfall � ENSO indices � Extreme value
analysis and homogeneous monsoon regions of India
T. V. Lakshmi Kumar (&) � R. UmaAtmospheric Science Research Laboratory, SRM University, Kattankulathur, Indiae-mail: [email protected]
K. Koteswara RaoClimatology and Hydrometeorology Division, Indian Institute of Tropical Meteorology, Pune, India
H. BarbosaUniversidade Federal de Alagoas – UFAL, Maceio, AL, Brazil
123
Nat HazardsDOI 10.1007/s11069-014-1127-2
1 Introduction
The increasing importance of climate change is due to the high frequency of extreme
events in terms of heavy rainfall events and the prolonged dry spells over many regions of
the globe. In India, the south-west (SW) monsoon attained the pivotal role not only for
understanding the climate variations but also for deciding the country economy. The past
100 years of Indian summer monsoon rainfall (ISMR) did not yield any significant trend
(Naidu et al. 2009), thus giving a challenge to understand its behaviour. Several studies
have been carried out on seasonal and annual Indian rainfall trends and their variability is
well documented (Pant and Rupa Kumar 1997; Webster et al. 1998; Rajeevan et al. 2004;
Takemura et al. 2005; Rajeevan et al. 2008). The variability in rainfall is reported to be due
to the anomalies in global teleconnections such as SOI, Nino 3.4. SST and other geo-
oceanic indices such as Quasi-Biennial Oscillations, Indian Ocean Dipole and Equatorial
Indian Ocean Oscillation (EQUINOO). Besides the inter-annual variability, the relation-
ship between seasonal rainfall and intra-seasonal rainfall fluctuations were discussed by
Krishnamurthy and Shukla 2000; Sperber et al. 2000; Goswami and Mohan 2001 to
understand the origin of this relation. The dominant periodicities in intra-seasonal oscil-
lations of ISMR are 10–20 day and 30–50 day oscillations. The first one referred as the
quasi-biweekly oscillation and the later is referred to Madden–Julian Oscillation. The
strength of these signals varies from bad monsoon to good monsoon, thus bringing deficit
and excess amounts of rain (Uma et al. 2013). After all these, still it is tantalizing about the
certain trend of Indian rainfall as studied by Rupa Kumar et al. (2002) and Lakshmi Kumar
et al. (2012). Attention has been drawn to understand the trends of epochal rainfall which is
also extensively studied by several scientists (Mooley et al. 1981; Parthasarathy et al.
1991). It is observed that there is coherent multi-decadal variability and the frequency of
large-scale floods has been identified during the epochs 1871–1900 and 1930–1960. The
same has been studied (Parthasarathy et al. 1994; Kripalani et al. 1997; Kripalani and
Kulkarni 1997; Mehta and Lau 1997; Krishnamurthy and Shukla 2000; Torrence and
Webster 1999) and found that the epochal behaviour of ISMR has the multi-decadal quasi
periodicity. The dynamical mechanism of ENSO is reported as the anomalous high
pressure in western Pacific, eastern Indian Ocean and low pressure in the eastern and
central Pacific show impact on the monsoon circulation. This El Nino/La Nina changes the
position of the tropical walker circulation and gives low and high amounts of rain by
altering the convection over Indian region (Krishna Kumar et al. 2011; Maity and Nagesh
Kumar 2006). Though there are studies about the weakening impact of ENSO on ISMR
(Krishna Kumar et al. 2011; Sarkar et al. 2004), still the investigations relating the ENSO
parameters with the ISMR bringing out the new ideas to understand the ISMR more
effectively. Sulochana et al. 2004 studied the ISMR, ENSO and EQUINOO and mentioned
that the response of monsoon to ENSO is yet to understand since the large negative
anomalies of rainfall were observed during the El Nino years. Kawamura et al. 2005
observed that the relationship between ENSO and ISMR was strong in late summer over
central and north-west India before the late 1970s but, after 1970s, the relationship has
been shifted to early summer.
A common problem in meteorology is to estimate the amount of rainfall occurrence for the
regions where the rainfall variability is high and complex to understand. Statistical methods
such as regional frequency analysis (Greenwood et al. 1979), Gumbel distribution (Gumbel
1958) and Weibul distribution offer a great provision to obtain the rainfall values for different
return periods. Also, estimating the frequency of hydrological events such as floods and dry
spells is a major concern for decision makers. This type of analysis requires (i) knowledge of
Nat Hazards
123
data characteristics, (ii) size of the sample, (iii) parameter estimation and (iv) calculation of
threshold years. Doesken and McKee, 1998, studied the extreme value analysis of meteo-
rological aspects such as flood occurrence and extreme storms. Buishand et al. (2008), de
Laurens and Chen (2008) studied the spatial statistics of rainfall using extreme value analysis
and estimated the total rainfall amount for different periods. Smith (1989) and Rao et al.
(1992) used the extreme value analysis to assess the environmental data and estimated their
concentrations to understand the regional dynamics. Palutikof et al. (1999) and Katz et al.
(2002) estimated the statistics of extremes of weather variables like precipitation, wind speed,
river discharge and surge from huge observational data. Mirza et al. (1998), Sarma et al.
(2009, 2010) carried out investigations on extreme value theory on rainfall patterns in
Ganges, Brahmaputra and Meghna river basins, and the later studied on Andhra Pradesh,
respectively, and concluded that the rainfall increases with the return periods.
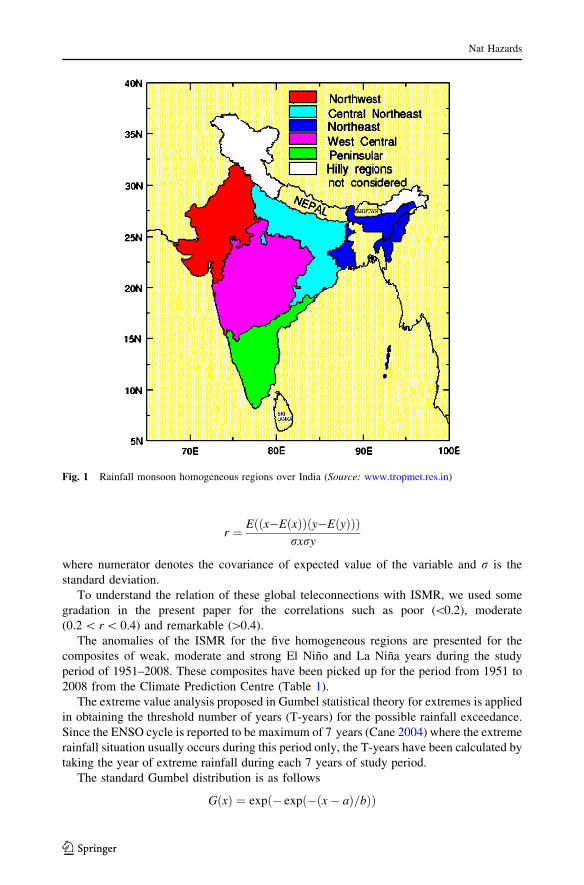
In the present study, the authors, first of all carried out the investigation on rainfall
variability in different homogeneous monsoon regions of India, namely North-West,
Central North-East, North-East, Peninsular and West Central regions for the period
1871–2008. Not only the variability of rainfall during pre-monsoon (January–May), south-
west monsoon (June–September) and post-monsoon (October–December), but also the
influence of global teleconnections such as Nino 3.4 SST and Darwin pressure (DTEND)
are thoroughly investigated to understand the south-west monsoon variability and trends.
The time scales for the aforementioned seasons were adopted from the Bavadekar (1982);
Kakade and Kulkarni (2013). In the other part of the paper, we drew our attention towards
the extreme value analysis of south-west monsoon rainfall over the above said homoge-
neous regions and has been intensively studied by taking into consideration different
statistical techniques, and finally, we have examined the threshold years for the occurrence
of extreme rainfall events.
2 Data and Methodology
The source for monthly rainfall data from 1871 to 2008 for this study is from Indian
Institute of Tropical Meteorology. The data had been averaged from 305 rain gauges set up
by India Meteorological Department that are widespread in India and was developed for
the five homogeneous regions, Peninsular region (50 rainguages), West Central (85 rain-
guages), Central North-East (74 rainguages), North-West (66 rainguages) and North-East
(30 rainguages) by Mooley et al. (1981) (Parthasarathy et al. 1987, 1993, 1995a, b, and
Pant and Rupa Kumar 1997). For brevity sake, these regions are further denoted as PE,
WC, CNE, NW and NE, respectively, in the present study and the figure with these regions
is given as Fig. 1.
The climatology of rainfall on annual as well as decadal basis has been calculated for
the pre-monsoon, monsoon (south-west) and post-monsoon seasons, and their trends and
inter-decadal variability have been analysed. The respective decades that are made for the
present study are denoted by numbers and are used in Fig. 2 as 1—1871 to 1880; 2—1881
to 1890; 3—1891 to 1900; 4—1901 to 1910; 5—1911 to 1920; 6—1921 to 1930; 7—1931
to 1940; 8—1941 to 1950; 9—1951 to 1960; 10—1961 to 1970; 11—1971 to 1980; 12—
1981 to 1990; 13—1991 to 2000; 14—2001 to 2008. The Pearson’s correlation technique
is used to understand the mode of relationship of rainfall with the Darwin pressures
(DTEND) and Nino 3.4 SST and the correlations were obtained for the SW monsoon
months separately as well as for total monsoon rainfall. The formula for the Pearson’s
correlation is given below.
Nat Hazards
123
r ¼ Eððx�EðxÞÞðy�EðyÞÞÞrxry
where numerator denotes the covariance of expected value of the variable and r is the
standard deviation.
To understand the relation of these global teleconnections with ISMR, we used some
gradation in the present paper for the correlations such as poor (\0.2), moderate
(0.2 \ r \ 0.4) and remarkable ([0.4).
The anomalies of the ISMR for the five homogeneous regions are presented for the
composites of weak, moderate and strong El Nino and La Nina years during the study
period of 1951–2008. These composites have been picked up for the period from 1951 to
2008 from the Climate Prediction Centre (Table 1).
The extreme value analysis proposed in Gumbel statistical theory for extremes is applied
in obtaining the threshold number of years (T-years) for the possible rainfall exceedance.
Since the ENSO cycle is reported to be maximum of 7 years (Cane 2004) where the extreme
rainfall situation usually occurs during this period only, the T-years have been calculated by
taking the year of extreme rainfall during each 7 years of study period.
The standard Gumbel distribution is as follows
GðxÞ ¼ expð� expð�ðx� aÞ=bÞÞ
Fig. 1 Rainfall monsoon homogeneous regions over India (Source: www.tropmet.res.in)
Nat Hazards
123
where a and b are location and scale parameters which can be obtained from the given data
and x is the variable (here the variate is rainfall).
The parameters a and b are estimated from the maximum likelihood method, and the
values can be obtained using the numerical solver.
b ¼ �b n�1X
exp�xi
b
� �� �
b� n�1X
xi þP
xi exp �xi
b
� �� �� �P
exp �xi
b
� �� �� � ¼ 0
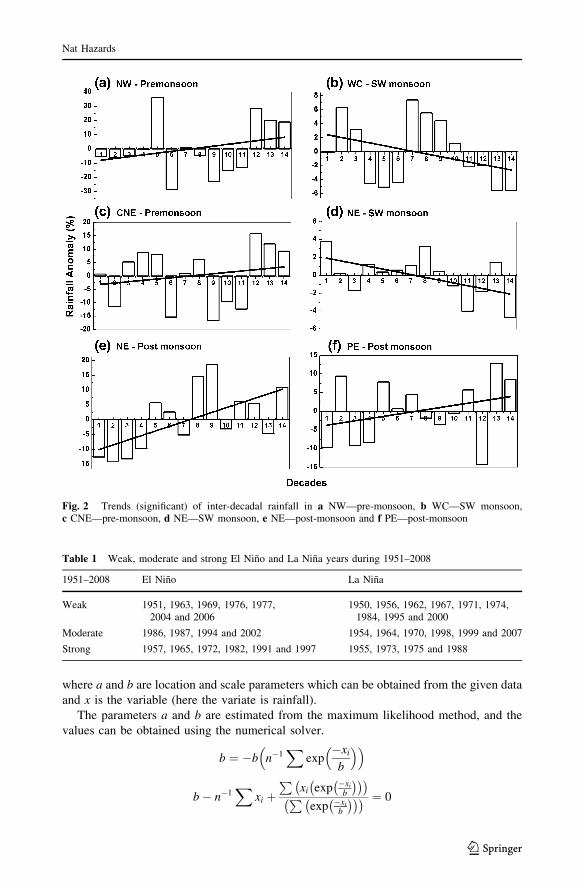
Fig. 2 Trends (significant) of inter-decadal rainfall in a NW—pre-monsoon, b WC—SW monsoon,c CNE—pre-monsoon, d NE—SW monsoon, e NE—post-monsoon and f PE—post-monsoon
Table 1 Weak, moderate and strong El Nino and La Nina years during 1951–2008
1951–2008 El Nino La Nina
Weak 1951, 1963, 1969, 1976, 1977,2004 and 2006
1950, 1956, 1962, 1967, 1971, 1974,1984, 1995 and 2000
Moderate 1986, 1987, 1994 and 2002 1954, 1964, 1970, 1998, 1999 and 2007
Strong 1957, 1965, 1972, 1982, 1991 and 1997 1955, 1973, 1975 and 1988
Nat Hazards
123
where i = 1, n and n is the number of observations for the variate under consideration.
The threshold level of the year (T-year) for an extreme event can be estimated using the
formula.
T � year ¼ 1
ð1� GðxÞÞ
3 Results and discussions
The trends of inter-annual variability of rainfall for the pre-monsoon, monsoon and
post-monsoon seasons have shown insignificant trends (also reported by several people
as mentioned in introduction part) and so were excluded and not discussed in the
present context for brevity sake. Figure 2a–f shows the inter-decadal variability of
rainfall for the homogeneous regions NW, WC, CNE, NE and PE where in rainfall
trend is significant at 0.05–0.10 levels. This statement implies that in other seasons of
above regions, the rainfall trend is insignificant despite their inter-annual variability.
The variability in pre-monsoon season showed increasing trend in NW (Fig. 2a) and
CNE (Fig. 2c) regions with a low and high of -28, -26 % and ?36, ?24 % to the
normal, respectively. The tri-decades during 1951–1980 and 1981–2008 recorded the
below and above normal rainfall values during pre-monsoon, thus leading to increased
trend in the above said regions. Though the inter-decadal variability of SW monsoon
for these two regions are more, they could not yield to any significant trend, and in
particular, the CNE region recorded maximum number of negative anomalies of rainfall
during 1951–2008. During the post-monsoon season, the anomalies are evenly dis-
tributed. The decade 1951–1960 recorded ?40 and ?30 % to the normal rainfall in
NW and CNE regions, respectively (Figures are not shown here). Interestingly, the
trends in inter-decadal anomalies of summer monsoon rainfall in WC (Fig. 2b) and NE
(Fig. 2d) regions showed the decreasing trends. There is no coherence among these
regions in recording the inter-decadal anomalies, rather considerable decrement had
been observed in WC region by recording the negative anomalies compared to NE
region during the tetra-decades of 1971–2008 despite the more number of normal
monsoons during this period except 2002, 1987, 1979, 1974 and 1972. NE region
showed a high rate of decrement, and a reduction of 2 % rainfall is observed in the
monsoon season. The post-monsoon trends in NE (Fig. 2e) and PE (Fig. 2f) regions
show the increasing trend and the inter-decadal variability of post-monsoon rainfall is
more in NE region. There is no consistency in these two regions in recording the
anomalies but is constrained to *15 % above and below the normal rainfall. The
increasing trend in NE region during post-monsoon season might be due to an incre-
ment of rainfall amount (approximately 20 mm) in October from 1940s, whereas for
the PE region, it is 40 mm from 1990s.
The correlation analysis of summer monsoon rainfall (SMR) over the test homoge-
neous regions with the global teleconnections, Nino 3.4 SST and Darwin pressure
(DTEND) shows that the correlation (r) values are better coming on decadal scales than
on annual scales. In the case of annual scale, none of the regions maintained the sig-
nificant correlation with Darwin pressure (DTEND) throughout the monsoon except in
September where in, all the five regions showed the moderate correlations, 0.24, 0.31,
0.22, 0.21 and 0.30, respectively. Unlike the DTEND, Nino 3.4 SST showed moderate
correlations in the month of June (WC = -0.29; CNE = -0.33 and NE = -0.23) and
Nat Hazards
123
July (NW = -0.26; CNE = -0.31; NE = -0.20 and PE = -0.26), respectively. The
correlation values on the decadal scale yielded considerably better than the earlier case
and are of high in July over CNE (r = -0.71) and NE (r = -0.43) regions and in
August, they are 0.89 and -0.68 over NW and WC regions, respectively. The above
analysis may recommend that the ENSO–ISMR relationship could be better explicable
and reasonable, if the attention is being shifted to decadal scale rather than on annual
scales. The weak correlations of rainfall with DTEND when compared to SSTs might be
due to the randomly varying nature of DTEND than SSTs (Lakshmi Kumar et al. 2013).
It is also evidenced from the studies of Krishna Kumar et al. (2011), Krishnamurthy and
Shukla (2000) that the monsoon variance is explained by ENSO with the help of inter-
decadal shift of the relationship between them. Also, it is reported that the frequency and
amplitude of ENSO (Wang and Wang 1996), ENSO–monsoon relationship (Shukla 1995)
have the inter-decadal changes.
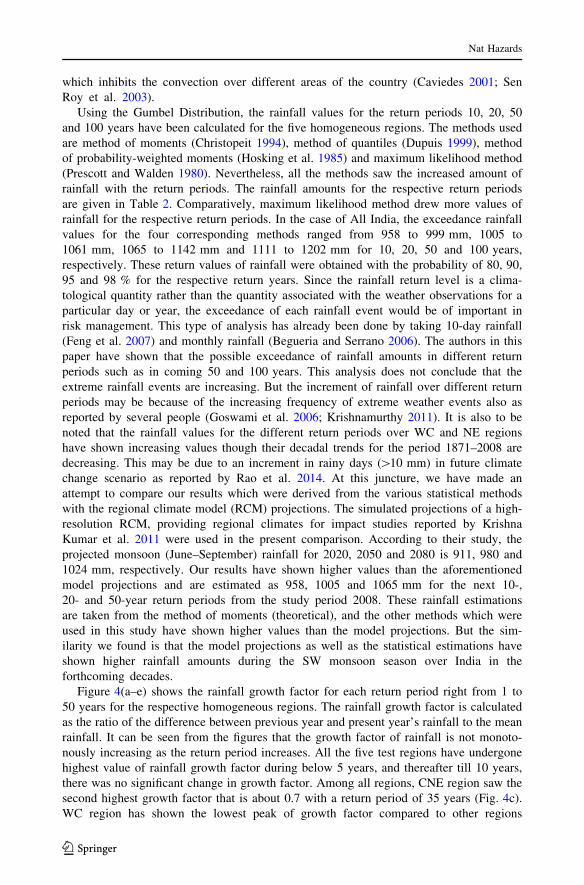
Figure 3a–b shows the composite rainfall anomalies for the five homogeneous
regions during the weak, moderate and strong El Nino as well as La Nina years during
the study period, respectively. Even though, there is a notorious impact on Indian
rainfall because of these short-term climate signals, the influence is distinctly varied
from region to region. And it is to worth mention that the impact of moderate El Nino
is not necessarily associated with severe impacts and likewise a weak El Nino does not
imply an absence of impacts. It is also reported, though there is strong correlation
between ENSO and ISMR, 73 % of ISMR variance could not be explained by ENSO
(Hu et al. 2005). During the moderate El Nino, the NW and PE regions were highly
affected (-23 and -17 % from the normal) than weak and strong composites (Fig. 3a).
It is also found that the difference between the long term (1951–2008) and the
composite El Nino years is 53 and 57 mm over NW and PE regions, respectively,
which evidences the subdued activity of south-west monsoon during El Nino years. It
is observed from the correlation analysis, that the Pearson’s correlation value is
insignificant for the two regions during weak and strong El Nino’s (-0.13, -0.02;
-0.19, -0.06), whereas it is remarkable during moderate (-0.48 and -0.43). In NW
part, remarkable statistical relation was found during June (r = -0.65) and July
(r = -0.43) as compared to other monsoon months in August (r = -0.18) and Sep-
tember (r = –0.21). The regions WC, CNE and NE are affected with -14, -8 and
-5 % from the normal rainfall during the strong composite El Nino. But in the case of
composite La Nina’s, CNE did not make any difference among strong, moderate and
weak La Nina and more or less, same situation prevailed over NE region (variation is
around 0–5 % above the normal) (Fig. 3b); meanwhile, NW part is highly influenced
by the strong La Nina (25 % above normal). The correlation analysis discloses the
relationship between rainfall and DTEND which clearly shows the reasonable corre-
lations (0.31 and 0.33) during weak and moderate La Nina’s in CNE region, whereas
during strong La Nina, the correlation is negative (-0.55) which supports the presence
of La Nina also could give India severe dry spells as a few dry spells were witnessed
in the La Nina years 1988 and 2007 (Rajeevan et al. 2010). Correlation for June
(r = 0.35) and for August (r = 0.28) are found to be good for the CNE region during
weak and strong La Nina’s, respectively. On the other way, NE region could able to
trigger more rainfall during moderate La Nina’s than the other two modes and is
explicable by ?0.42 correlation which seemed to be good than the rest (r = -0.21 and
r = -0.07). The distinct correlations of rainfall with Nino 3.4 SST and DTEND
among different months of monsoon throughout India may be due to the movement of
walker circulation. The ENSO causes the eastward migration of this walker circulation
Nat Hazards
123
which inhibits the convection over different areas of the country (Caviedes 2001; Sen
Roy et al. 2003).
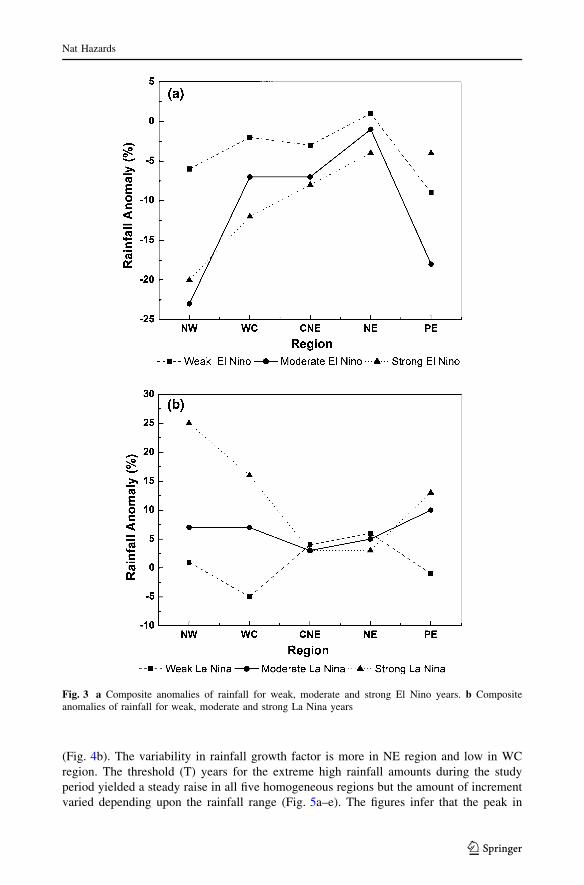
Using the Gumbel Distribution, the rainfall values for the return periods 10, 20, 50
and 100 years have been calculated for the five homogeneous regions. The methods used
are method of moments (Christopeit 1994), method of quantiles (Dupuis 1999), method
of probability-weighted moments (Hosking et al. 1985) and maximum likelihood method
(Prescott and Walden 1980). Nevertheless, all the methods saw the increased amount of
rainfall with the return periods. The rainfall amounts for the respective return periods
are given in Table 2. Comparatively, maximum likelihood method drew more values of
rainfall for the respective return periods. In the case of All India, the exceedance rainfall
values for the four corresponding methods ranged from 958 to 999 mm, 1005 to
1061 mm, 1065 to 1142 mm and 1111 to 1202 mm for 10, 20, 50 and 100 years,
respectively. These return values of rainfall were obtained with the probability of 80, 90,
95 and 98 % for the respective return years. Since the rainfall return level is a clima-
tological quantity rather than the quantity associated with the weather observations for a
particular day or year, the exceedance of each rainfall event would be of important in
risk management. This type of analysis has already been done by taking 10-day rainfall
(Feng et al. 2007) and monthly rainfall (Begueria and Serrano 2006). The authors in this
paper have shown that the possible exceedance of rainfall amounts in different return
periods such as in coming 50 and 100 years. This analysis does not conclude that the
extreme rainfall events are increasing. But the increment of rainfall over different return
periods may be because of the increasing frequency of extreme weather events also as
reported by several people (Goswami et al. 2006; Krishnamurthy 2011). It is also to be
noted that the rainfall values for the different return periods over WC and NE regions
have shown increasing values though their decadal trends for the period 1871–2008 are
decreasing. This may be due to an increment in rainy days ([10 mm) in future climate
change scenario as reported by Rao et al. 2014. At this juncture, we have made an
attempt to compare our results which were derived from the various statistical methods
with the regional climate model (RCM) projections. The simulated projections of a high-
resolution RCM, providing regional climates for impact studies reported by Krishna
Kumar et al. 2011 were used in the present comparison. According to their study, the
projected monsoon (June–September) rainfall for 2020, 2050 and 2080 is 911, 980 and
1024 mm, respectively. Our results have shown higher values than the aforementioned
model projections and are estimated as 958, 1005 and 1065 mm for the next 10-,
20- and 50-year return periods from the study period 2008. These rainfall estimations
are taken from the method of moments (theoretical), and the other methods which were
used in this study have shown higher values than the model projections. But the sim-
ilarity we found is that the model projections as well as the statistical estimations have
shown higher rainfall amounts during the SW monsoon season over India in the
forthcoming decades.
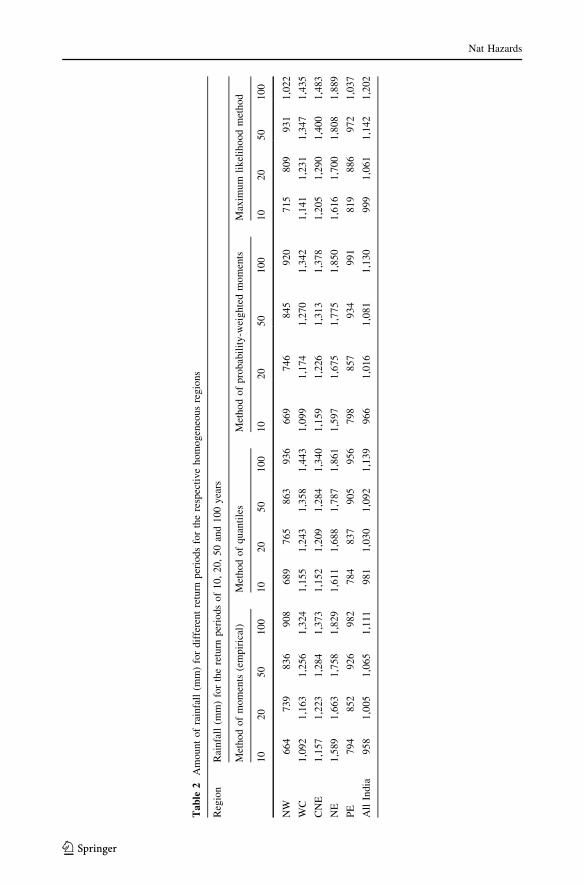
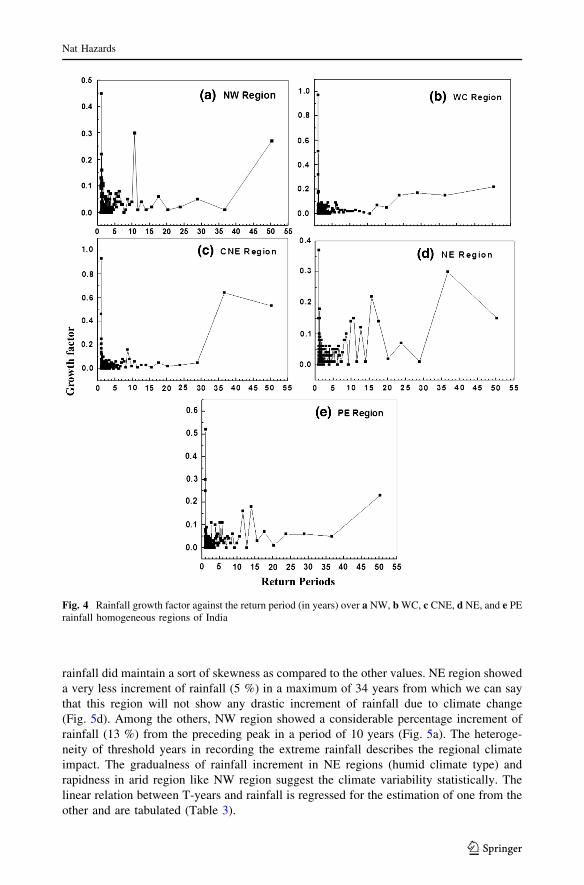
Figure 4(a–e) shows the rainfall growth factor for each return period right from 1 to
50 years for the respective homogeneous regions. The rainfall growth factor is calculated
as the ratio of the difference between previous year and present year’s rainfall to the mean
rainfall. It can be seen from the figures that the growth factor of rainfall is not monoto-
nously increasing as the return period increases. All the five test regions have undergone
highest value of rainfall growth factor during below 5 years, and thereafter till 10 years,
there was no significant change in growth factor. Among all regions, CNE region saw the
second highest growth factor that is about 0.7 with a return period of 35 years (Fig. 4c).
WC region has shown the lowest peak of growth factor compared to other regions
Nat Hazards
123
(Fig. 4b). The variability in rainfall growth factor is more in NE region and low in WC
region. The threshold (T) years for the extreme high rainfall amounts during the study
period yielded a steady raise in all five homogeneous regions but the amount of increment
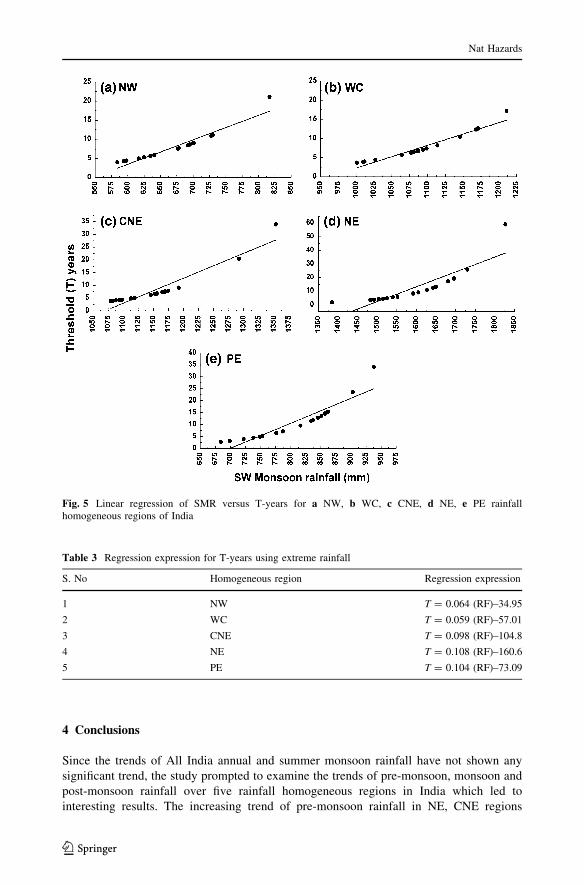
varied depending upon the rainfall range (Fig. 5a–e). The figures infer that the peak in
Fig. 3 a Composite anomalies of rainfall for weak, moderate and strong El Nino years. b Compositeanomalies of rainfall for weak, moderate and strong La Nina years
Nat Hazards
123
Tab
le2
Am
ou
nt
of
rain
fall
(mm
)fo
rd
iffe
ren
tre
turn
per
iods
for
the
resp
ecti
ve
ho
mo
gen
eou
sre
gio
ns
Reg
ion
Rai
nfa
ll(m
m)
for
the
retu
rnp
erio
ds
of
10
,2
0,
50
and
10
0y
ears
Met
ho
do
fm
om
ents
(em
pir
ical
)M
etho
do
fq
uan
tile
sM
eth
od
of
pro
bab
ilit
y-w
eig
hte
dm
om
ents
Max
imu
mli
kel
iho
od
met
ho
d
10
20
50
10
01
02
05
01
00
10
20
50
10
01
02
05
01
00
NW
66
47
39
83
69
08
68
97
65
86
39
36
66
97
46
84
59
20
71
58
09
93
11
,022
WC
1,0
92
1,1
63
1,2
56
1,3
24
1,1
55
1,2
43
1,3
58
1,4
43
1,0
99
1,1
74
1,2
70
1,3
42
1,1
41
1,2
31
1,3
47
1,4
35
CN
E1
,157
1,2
23
1,2
84
1,3
73
1,1
52
1,2
09
1,2
84
1,3
40
1,1
59
1,2
26
1,3
13
1,3
78
1,2
05
1,2
90
1,4
00
1,4
83
NE
1,5
89
1,6
63
1,7
58
1,8
29
1,6
11
1,6
88
1,7
87
1,8
61
1,5
97
1,6
75
1,7
75
1,8
50
1,6
16
1,7
00
1,8
08
1,8
89
PE
79
48
52
92
69
82
78
48
37
90
59
56
79
88
57
93
49
91
81
98
86
97
21
,037
All
Ind
ia9
58
1,0
05
1,0
65
1,1
11
98
11
,030
1,0
92
1,1
39
96
61
,016
1,0
81
1,1
30
99
91
,06
11
,14
21
,202
Nat Hazards
123
rainfall did maintain a sort of skewness as compared to the other values. NE region showed
a very less increment of rainfall (5 %) in a maximum of 34 years from which we can say
that this region will not show any drastic increment of rainfall due to climate change
(Fig. 5d). Among the others, NW region showed a considerable percentage increment of
rainfall (13 %) from the preceding peak in a period of 10 years (Fig. 5a). The heteroge-
neity of threshold years in recording the extreme rainfall describes the regional climate
impact. The gradualness of rainfall increment in NE regions (humid climate type) and
rapidness in arid region like NW region suggest the climate variability statistically. The
linear relation between T-years and rainfall is regressed for the estimation of one from the
other and are tabulated (Table 3).
Fig. 4 Rainfall growth factor against the return period (in years) over a NW, b WC, c CNE, d NE, and e PErainfall homogeneous regions of India
Nat Hazards
123
4 Conclusions
Since the trends of All India annual and summer monsoon rainfall have not shown any
significant trend, the study prompted to examine the trends of pre-monsoon, monsoon and
post-monsoon rainfall over five rainfall homogeneous regions in India which led to
interesting results. The increasing trend of pre-monsoon rainfall in NE, CNE regions
Fig. 5 Linear regression of SMR versus T-years for a NW, b WC, c CNE, d NE, e PE rainfallhomogeneous regions of India
Table 3 Regression expression for T-years using extreme rainfall
S. No Homogeneous region Regression expression
1 NW T = 0.064 (RF)–34.95
2 WC T = 0.059 (RF)–57.01
3 CNE T = 0.098 (RF)–104.8
4 NE T = 0.108 (RF)–160.6
5 PE T = 0.104 (RF)–73.09
Nat Hazards
123
declines in monsoon over WC, NE regions and increasing trend of post-monsoon in NE,
PE regions claims that the climate change impact, and in particular, the October month
rainfall increased in NE and PE regions. The correlation with Darwin pressures was poor
during the monsoon except September where in the r values in this case are 0.24, 0.31,
0.22, 0.21 and 0.30 for NW, WC, CNE, NE and PE regions, respectively. Unlike
the DTEND, Nino 3.4 SST showed the moderate correlations in the month of June
(WC = -0.29; CNE = -0.33; NE = -0.23) and July (NW = -0.26; CNE = -0.31;
NE = -0.20 and PE = -0.26), respectively. The present study with this gist explores the
weak relationship of Darwin pressures with summer monsoon rainfall of five homogeneous
regions, and even the relationship is not found to be strong with sea surface temperatures of
Nino 3.4 region on annual scales. The relations seemed to be consistent if the statistics
were taken on decadal basis. The analysis of rainfall during composite of strong, moderate
and weak El Nino and La Nina have shown that NW and PE regions are left with notorious
foot prints during moderate El Nino than the strong ones. The regions CNE and NE did not
show any difference of recording rainfall during all weak, moderate and strong La Nina.
The Gumbel extreme value analysis revealed that the rainfall increase with the return
period. The T-years which are derived for the extreme rainfall denotes the climate change
impact that is going to be experienced by India. This analysis unravels the steady state of
NE region in attaining the more rainfall during forthcoming decades. The regression
expressions for obtaining T-years from the extreme rainfall are of immense helpful in risk
management.
References
Bavadekar SN (1982) Water vapour transport of the pre-monsoon period and the general performance of theIndian summer monsoon. Pure Appl Geophys 120(1):67–78
Begueria S, Serrano SMV (2006) Mapping the hazard of extreme rainfall by peaks over threshold extremevalue analysis and spatial regression techniques. J Appl Meteor Climatol 45:108–124
Buishand TA, de Haan L, Zhou C (2008) On spatial extremes: with application to a rainfall problem. AnnAppl Stat 2(2):624–642
Cane MA (2004) The evolution of El Nino, past and future. Earth Planet Sci Lett 164:1–10Caviedes CN (2001) El Nino in history: storming through the ages. Gaineville, University Press of FloridaChristopeit N (1994) Estimating parameters of an extreme value distribution by the method of moments.
J Stat Plan Inference 41:173–186De Laurens H, Chen Z (2008) On extreme value analysis of a spatial process. RevStat Stat J 6(1):71–81Doesken NJ, McKee TB (1998) An Analysis of rainfall for the July 28, 1997 flood in Fort Collins, Colorado.
Climatology Report 98-1, Dept of Atmos Sci, CSU, Fort Collins, CO, February, 55 ppDupuis DJ (1999) Parameter and quantile estimation for the generalized extreme value distribution: a second
look. Environmetrics 10:119–124Feng S, Nadarajah S, Hu Q (2007) Modelling annual extreme precipitation in China using generalized
extreme value analysis. J Meteorol Soc Jpn 85(5):599–613Greenwood JA, Landwehr JM, Matalas NC, Wallis JR (1979) Probability-weighted moments: definition and
relation to parameters of several distributions expressable in inverse form. Water Resour Res15:1049–1054
Goswami BN, Mohan RS, Ajaya (2001) Intraseasonal oscillations and interannual variability of the Indiansummer monsoon. J Clim 14:1180–1198
Goswami BN, Venugopal V, Sengupta D, Madhusoodanan MS, Prince KX (2006) Increasing trend ofextreme rain events over India in a warming environment. Science 314(5804):1442–1445
Gumbel EJ (1958) Statistics of extremes. Columbia University Press, New YorkHosking JRM, Wallis JR, Wood EF (1985) Estimation of the generalized extreme value distribution by the
method of probability-weighted moments. Technometrics 27:251–261Hu ZZ, Wu R, Kinter JL III, Yang S (2005) Connection of summer rainfall variations in south and East Asia:
role of El Nino–southern oscillation. Int J Climatol 25:1279–1289
Nat Hazards
123
Kakade SB and Kulkarni A (2013), Prediction of Indian summer monsoon rainfall using surface temperatureand sea-level pressure cluster parameters. Curr Sci 105 (in press)
Katz RW, Parlange MB, Naveau P (2002) Statistics of extremes in hydrology. Adv Water Resour25:1287–1304
Kawamura R, Uemura K, Suppia R (2005) On recent change of the Indian summer monsoon–ENSOrelationship. SOLA 1:201–204. doi:10.2151/sola.2005-052
Kripalani RH, Kulkarni A (1997) Climatic impact of El Nino/La Nina on the Indian monsoon: a newperspective. Weather 52:39–46
Kripalani RH, Kulkarni A, Singh SV (1997) Association of the Indian summer monsoon with the northernhemisphere mid-latitude circulation. Int J Climatol 17:1055–1067
Krishna Kumar K, Patwardhan SK, Kulkarni A, Kamala K, Koteswara Rao K, Jones R (2011) Simulatedprojections for summer monsoon climate over India by a high-resolution regional climate model(PRECIS). Cur Sci 101(3):312–326
Krishnamurthy V (2011). Extreme events and trends in the Indian summer monsoon, COLA TechnicalReport 314, ftp://cola.gmu.edu/pub/ctr/CTR314_ms.pdf
Krishnamurthy V, Shukla J (2000) Intraseasonal and interannual variability of rainfall over India. J Clim13:4366–4377
Lakshmi Kumar TV, Barbosa H, Koteswara Rao K, Prabha Jothi E (2012) Some studies on the frequency ofextreme weather events over India. J Agr Sci Tech 14:1343–1356
Lakshmi Kumar TV, Koteswara Rao K, Barbosa H, Jyoti PE (2013) Studies on spatial pattern of NDVI overIndia and its relationship with rainfall, air temperature, soil moisture adequacy and ENSO. Geofizika30(1):1–18
Maity R, Nagesh Kumar D (2006) Bayesian dynamic modelling for monthly Indian summer monsoonrainfall using El Nino—Southern Oscillation (ENSO) and Equatorial Indian Ocean Oscillation(EQUINOO). J Geophys Res 111:D07104. doi:10.1029/2005JD006539
Mehta VM, Lau KM (1997) Influence of solar irradiance on the Indian Monsoon-ENSO relationship atdecadal-multi decadal time scales, Geophys Res Lett 24(2):159–162. doi: 10.1029/96GL03778
Mirza MQ, Warrick RA, Erickson NJ, Kenny GJ (1998) Trends and persistence in precipitation in theGanges, Brahmaputra and Meghna river basins in south Asia. Hydrol Sci J 43:845–858
Mooley DA, Parthasarathy B, Sontakke NA, Munot AA (1981) Annual rain-water over India, its variabilityand impact on the economy. J Climatol 1:167–186
Naidu CV, Durgalakshmi K, Muni Krishna K, Ramalingeswara Rao S, Satyanarayana P, LakshminarayanaGC, Malleswara Rao L (2009) Is summer monsoon rainfall decreasing over India in the globalwarming era? J Geophys Res 114:D24108. doi:10.1029/2008JD011288
Palutikof JP, Brabson BB, Lister DH, Adcock ST (1999) A review of methods to calculate extreme windspeeds. Meteorol Appl 6:119–132
Pant GB, Rupa Kumar K (1997) Climates of South Asia. Wiley, Chichester, p 320Parthasarathy B, Sontakke NA, Munot AA, Kothawale DR (1987) Droughts/floods in the summer monsoon
rainfall season over different meteorological subdivisions of India for the period 1871–1984. J Cli-matol 7:57–70
Parthasarathy B, Rupa Kumar K, Munot AA (1991) Evidence of secular variations in Indian monsoonrainfall–circulation relationships. J Clim 4:927–938
Parthasarathy B, Munot A, Kothawale DR (1994) All-India monthly and seasonal rainfall series 1887–1993.Theor Appl Climatol 49:217–224
Parthasarathy B, Rupa Kumar K, Munot AA (1993) Homogeneous Indian monsoon rainfall: variability andprediction. Proc Indian Acad Sci (Earth Planet Sci) 102:121–155
Parthasarathy B, Munot AA, Kothawale DR (1995a) All India monthly and seasonal rainfall series:1871–1993. Theor Appl Climatol 49:217–224
Parthasarathy B, Munot AA, Kothawale DR (1995). Monthly and seasonal rainfall series for all-Indiahomogeneous regions and meteorological subdivisions: 1871–1994, Research Report No. RR-065,Indian Institute of Tropical Meteorology, Pune, pp. 113
Prescott P, Walden AT (1980) Maximum likelihood estimation of the parameters of the generalizedextreme-value distribution. Biometrika 67:723–724
Rajeevan M, Pai DS, Dikshit SK, Kelkar RR (2004) IMD’s new operational models for long-range forecastof southwest monsoon rainfall over India and their verification for 2003. Curr Sci 86:422–431
Rajeevan M, Jyoti B, Jaswal AK (2008) Analysis of variability and trends of extreme rainfall events overIndia using 104 years of gridded daily rainfall data. Geophys Res Lett 35:L18707. doi:10.1029/2008GL035143
Rajeevan M, Sulochana G, Jyoti B (2010) Active and break spells of the Indian summer monsoon. J EarthSyst Sci 119(3):229–247
Nat Hazards
123
Rao ST, Sistla G, Henry R (1992) Statistical analysis of trends in urban ozone air quality. J Air WasteManage Assoc 42:1204–1211
Rao KK, Patwardhan SK, Kulkarni A, Kamala K, Sabade SS, Krishna Kumar K (2014) Projected changes inmean and extreme precipitation indices over India using PRECIS. Global Planet Change 113:77–90
Rupa Kumar K, Krishna Kumar K, Ashrit RG, Patwardhan SK, Pant GB (2002) In: Shukla PR (ed) ClimateChange and India, issues, concerns and opportunities. Tata McGraw Hill, New Delhi, pp 24–75
Sarkar S, Singh RP, Kafatos M (2004) Further evidences for weakening relationship of Indian rainfall andENSO over India. Geophys Res Lett 31:L24207. doi:10.1029/2004GL020259
Sarma AALN, Lakshmi Kumar TV and Koteswara Rao K (2009). Quantitative analysis of summer monsoonrainfall over Andhra Pradesh, Vatavaran, 1–9
Sarma AALN, Lakshmi Kumar TV, Koteswara Rao K (2010) Extreme value analysis of summer monsoonrainfall over Andhra Pradesh. Indian J Radio Space Phy 39:32–38
Sen Roy S, Goodrich B Gregory, Balling RC Jr (2003) Influence of El Nino/southern oscillation, Pacificdecadal oscillation, and local sea-surface temperature anomalies on peak monsoon precipitation inIndia. Clim Res 27:171–178
Shukla J (1995) Predictability of the tropical atmosphere, the tropical oceans and TOGA, Proceedings ofInternational Science Conference on the Tropical Ocean Global Atmosphere (TOGA) Programme,WCRP-91, WMO/TD717, Melbourne, Australia, WCRP, 2,725–730
Smith RL (1989) Extreme value analysis of environmental time series: An application to trend detection inground level ozone. Stat Sci 4:367–393
Sperber KR, Slingo JM, Annamalai H (2000) Predictability and the relationship between subseasonal andinterannual variability during the Asian summer monsoon. Quart J R Meteorol Soc 126:2545–2574
Sulochana G, Vinayachandran PN, Francis PA, Siddartha G (2004) Extremes of Indian summer monsoonrainfall, ENSO and equatorial Indian Ocean oscillation. Geophys Res Lett 31:L12213. doi:10.1029/2004GL019733
Takemura T, Nozawa T, Emori S, Nakajima TY, Nakajima T (2005) Simulation of climate response toaerosol direct and indirect effects with aerosol transport-radiation model. J Geophys Res 110:D02202.doi:10.1029/2004JD005029
Torrence C, Webster PJ (1999) Interdecadal Changes in the ENSO–Monsoon System. J Clim 12:2679–2690Uma R, Lakshmi Kumar TV, Narayanan MS, Rajeevan M, Jyoti B, Niranjan Kumar K (2013) Large scale
features and assessment of spatial scale correspondence between TMPA and IMD rainfall datasets overIndian landmass. J Earth Syst Sci 122(3):573–588
Wang B, Wang Y (1996) Temporal structure of the southern oscillation as revealed by wave-form andwavelet analysis. J Clim 9:1586–1598
Webster P, Magana V, Palmer T, Shukla J, Thomas R, Yanai M, Yasunari T (1998) Monsoons: processes,predictability, and the prospects for prediction. J Geophys Res 103(C7):14451–14510
Nat Hazards
123
Copyright © 2022 FDOKUMEN