Impact of vegetation on the simulation of seasonal monsoon rainfall over the Indian subcontinent...
28
Impact of vegetation on the simulation of seasonal monsoon rainfall over the Indian subcontinent using a regional model Surya K Dutta 1 , Someshwar Das 1,∗ , S C Kar 1 , U C Mohanty 2 and P C Joshi 3 1 National Centre for Medium Range Weather Forecasting, Noida, UP 201 307, India. 2 Centre for Atmospheric Science, IIT, Delhi, India. 3 Space Application Centre, ISRO, Ahmedabad 380 015, India. ∗ e-mail: [email protected] [email protected] The change in the type of vegetation fraction can induce major changes in the local effects such as local evaporation, surface radiation, etc., that in turn induces changes in the model simulated outputs. The present study deals with the effects of vegetation in climate modeling over the Indian region using the MM5 mesoscale model. The main objective of the present study is to investigate the impact of vegetation dataset derived from SPOT satellite by ISRO (Indian Space Research Organization) versus that of USGS (United States Geological Survey) vegetation dataset on the simulation of the Indian summer monsoon. The present study has been conducted for five monsoon seasons (1998–2002), giving emphasis over the two contrasting southwest monsoon seasons of 1998 (normal) and 2002 (deficient). The study reveals mixed results on the impact of vegetation datasets generated by ISRO and USGS on the simulations of the monsoon. Results indicate that the ISRO data has a positive impact on the simulations of the monsoon over northeastern India and along the western coast. The MM5- USGS has greater tendency of overestimation of rainfall. It has higher standard deviation indicating that it induces a dispersive effect on the rainfall simulation. Among the five years of study, it is seen that the RMSE of July and JJAS (June–July–August–September) for All India Rainfall is mostly lower for MM5-ISRO. Also, the bias of July and JJAS rainfall is mostly closer to unity for MM5-ISRO. The wind fields at 850 hPa and 200 hPa are also better simulated by MM5 using ISRO vegetation. The synoptic features like Somali jet and Tibetan anticyclone are simulated closer to the verification analysis by ISRO vegetation. The 2 m air temperature is also better simulated by ISRO vegetation over the northeastern India, showing greater spatial variability over the region. However, the JJAS total rainfall over north India and Deccan coast is better simulated using the USGS vegetation. Sensible heat flux over north-west India is also better simulated by MM5-USGS. 1. Introduction Various land surface features, viz., vegetation and soil types, soil moisture, snow cover, land-sea con- trast, inland water bodies, etc., at various tempo- ral and spatial scales greatly influence the regional climate system (Betts et al 1996; Sellers et al 1996; Baldi et al 2008). For any weather system to develop and sustain over land, the contribution of the land surface is of primary concern. Land surface functions as both source and sink for the atmospheric enthalpy and moisture, by absorbing and releasing the solar radiation in different forms. Partitioning of net solar radiation received at the surface into sensible, latent and ground heat fluxes by the land surface modulates the soil wetness Keywords. Vegetation; monsoon; rainfall; mesoscale; simulation; forecast; TRMM. J. Earth Syst. Sci. 118, No. 5, October 2009, pp. 413–440 © Printed in India. 413
-
Upload
independent -
Category
Documents
-
view
0 -
download
0
Transcript of Impact of vegetation on the simulation of seasonal monsoon rainfall over the Indian subcontinent...
Impact of vegetation on the simulation of seasonalmonsoon rainfall over the Indian subcontinent
using a regional model
Surya K Dutta1, Someshwar Das1,∗, S C Kar1, U C Mohanty2 and P C Joshi3
1National Centre for Medium Range Weather Forecasting, Noida, UP 201 307, India.2Centre for Atmospheric Science, IIT, Delhi, India.
3Space Application Centre, ISRO, Ahmedabad 380 015, India.∗e-mail: [email protected] [email protected]
The change in the type of vegetation fraction can induce major changes in the local effects suchas local evaporation, surface radiation, etc., that in turn induces changes in the model simulatedoutputs. The present study deals with the effects of vegetation in climate modeling over the Indianregion using the MM5 mesoscale model. The main objective of the present study is to investigatethe impact of vegetation dataset derived from SPOT satellite by ISRO (Indian Space ResearchOrganization) versus that of USGS (United States Geological Survey) vegetation dataset on thesimulation of the Indian summer monsoon. The present study has been conducted for five monsoonseasons (1998–2002), giving emphasis over the two contrasting southwest monsoon seasons of 1998(normal) and 2002 (deficient).
The study reveals mixed results on the impact of vegetation datasets generated by ISRO andUSGS on the simulations of the monsoon. Results indicate that the ISRO data has a positive impacton the simulations of the monsoon over northeastern India and along the western coast. The MM5-USGS has greater tendency of overestimation of rainfall. It has higher standard deviation indicatingthat it induces a dispersive effect on the rainfall simulation. Among the five years of study, it isseen that the RMSE of July and JJAS (June–July–August–September) for All India Rainfall ismostly lower for MM5-ISRO. Also, the bias of July and JJAS rainfall is mostly closer to unity forMM5-ISRO. The wind fields at 850 hPa and 200 hPa are also better simulated by MM5 using ISROvegetation. The synoptic features like Somali jet and Tibetan anticyclone are simulated closer tothe verification analysis by ISRO vegetation. The 2 m air temperature is also better simulated byISRO vegetation over the northeastern India, showing greater spatial variability over the region.However, the JJAS total rainfall over north India and Deccan coast is better simulated using theUSGS vegetation. Sensible heat flux over north-west India is also better simulated by MM5-USGS.
1. Introduction
Various land surface features, viz., vegetation andsoil types, soil moisture, snow cover, land-sea con-trast, inland water bodies, etc., at various tempo-ral and spatial scales greatly influence the regionalclimate system (Betts et al 1996; Sellers et al1996; Baldi et al 2008). For any weather system
to develop and sustain over land, the contributionof the land surface is of primary concern. Landsurface functions as both source and sink for theatmospheric enthalpy and moisture, by absorbingand releasing the solar radiation in different forms.Partitioning of net solar radiation received at thesurface into sensible, latent and ground heat fluxesby the land surface modulates the soil wetness
Keywords. Vegetation; monsoon; rainfall; mesoscale; simulation; forecast; TRMM.
J. Earth Syst. Sci. 118, No. 5, October 2009, pp. 413–440© Printed in India. 413
414 Surya K Dutta et al
condition, which in turn acts as a modulator oflow frequency variability in the climate. After thesea surface temperature, soil moisture and snowcover are regarded as the most important ‘memorymechanisms’ for time scales ranging from weeks toseasons. Different feedback processes (both posi-tive and negative) from the land surface is animportant contributing aspect of climate changeand variability and has a strong influence overthe various cycles operating between the land andthe atmosphere (Lim et al 2008; Oleson et al 2008;Vinodkumar et al 2008). Thus, the surface weathervariables such as, surface air temperature, surfacehumidity and wind speed at the surface are largelyinfluenced and determined by the surface energyfluxes; the same for the low-level cloudiness andprecipitation, but to a lower extent.
Previously, several studies have been made toinvestigate the role of land surface processesand the mechanisms that govern land–atmosphereinteractions in the monsoon systems (e.g., Meehl1994; Liu and Wu 1997; Webstar et al 1998; Zenget al 1998; Sun et al 2001; Wu et al 2002). Lauand Bua (1998) and Yang and Lau (1998) havefound that the land surface had substantial butlimited effects at local scales. Simulations usingtwo different land surface schemes; one with andthe other without explicit vegetation parameteri-zation but same surface albedo, produces substan-tial differences at regional scales, especially in themonsoon regions and some of the large continentalareas (Xue et al 2004).
Detailed investigation have been made throughGCM simulations to study the effect of changesin vegetation feedback into the climate over SouthAmerica (e.g., Lean and Warrilow 1989; Norbeet al 1991; Hoffmann and Jackson 2000), tropicalAfrica (e.g., Xue 1997; Zeng and Neelin 2000), andtropical Asia (Mabuchi et al 2005). It has beenseen that inclusion of the satellite derived vege-tation indices and sea surface temperature (SST)produces better seasonal and inter-annual precip-itation variations than the experiment with SSTbut no inter-annual variations in fractional vege-tation cover and leaf area index (Weiping et al2005). Using a quasi-equilibrium tropical circula-tion model coupled with a simple land model, Zenget al (1999) demonstrated that interactive vege-tation enhances the decadal variability of Sahelrainfall. In some recent studies using regional cir-culation models over North China it was foundthat increased vegetation cover showed lowering ofsurface temperature, enhancement of precipitationand also, lowering of surface runoff (Lu and Chen1999; Zheng et al 2002).
Over Indian region, the vegetation type and soilmoisture undergoes rapid and significant variationsspecially, during the southwest monsoon period.
Also, India has a very diverse and complex topo-graphy throughout, influencing the climatic vari-ation over varied temporal and spatial scales. Inview of this and because of the importance ofthe land surface forcing, the accuracy of land-useinformation is important to obtain accurate simu-lations. The change in the type of vegetation frac-tion can induce major changes in the local effectssuch as local evaporation, surface radiation, etc.,that in turn induces changes in the model simu-lated outputs. It is also seen that the monsoonprecipitation and land surface temperature overthe Indian subcontinent landmass, in turn have,significant impact on the distribution of vegeta-tion (Sarkar et al 2004). Different vegetation typeswith varied spatial coverage have a marked influ-ence on precipitation patterns, whose effects havealso been observed on the forecast models (Kar1990). Xue et al (1996) through a series of experi-ments have revealed that land surface effects onthe atmospheric variables at and near the surfaceduring the North American summer are very pro-nounced and persistent, but are limited to the areaof the anomalous land surface forcing.
The present study deals with regional climatemodeling, i.e., regarding summer monsoon rain-fall over the Indian region. An attempt has beenmade to see the influence of vegetation over theIndian monsoon rainfall as simulated by the model.The main objective of the present study is thecomparison of ISRO generated vegetation withthat of USGS, i.e., to detect the superior qualityvegetation data over the Indian region. Section 2presents the methodology, the model used, timeand domain of study and data used. Results are dis-cussed in section 3 and finally conclusions are givenin section 4.
2. Methodology
2.1 Model description
The non-hydrostatic version of the MM5 mode-ling system developed at Penn State University/National Centre for Atmospheric Research (PSU/NCAR) has been used for this study (Grell et al1994). It is a limited area, non-hydrostatic modelwith vertical levels as the terrain following sigmaco-ordinate. It has been designed to simulate bothmesoscale and regional-scale atmospheric circula-tions. The model preprocessor was modified to readthe National Centre for Medium Range WeatherForecasting (NCMRWF) global model (T80L18)output to prepare the initial and boundary condi-tions for the MM5 model which are, updated every12 hours. The model has been integrated based onthe initial conditions at 00GMT of 16 May for the
Impact of vegetation on the simulation of seasonal monsoon rainfall 415
Table 1. Configuration of MM5 (Version 3.6) used for this study.
Model elements Components Specifications
Domain Horizontal Outer domain-1 (90 km)(double nested) Inner domain-2 (30 km)
Staggered Arakawa B-grid
Vertical 23 Sigma levels
Time steps Domain-1: 270 s, domain-2: 90 s
Topography USGS
Vegetation/land use USGS & ISRO
Dynamics Non-hydrostatic
Two-way nesting
Time integration Semi-implicit
Boundary conditions Fixed
Time-dependent/nest
Horizontal diffusion Fourth order for inner domain
Second order for the coarser domain
Physics Cumulus parameterization Grell
PBL parameterization MRF PBL
Explicit moisture schemes Simple ice
Radiation scheme Cloud-radiation interaction
Land surface processes Five layer soil model
years 1998–2002. Starting from the date, the simu-lation has been carried forward for all the fourmonths of Southwest Monsoon Season, till 00GMTof 10 October for all the five years (1998–2002).The configuration of the mesoscale model used forthe present study is described in table 1.
T80L18 (triangular truncation at wave number80 with 18 vertical layers) is the global spectralmodel (originally adapted from NCEP – NationalCentre for Environmental Prediction) and is usedas the forecast model at NCMRWF. It has hori-zontal resolution of T80 waves and 18 sigma layersin the vertical. The model has been modified andimproved for use in a Seasonal Prediction System.Details of the model may be found at Kanamitsuet al (1991). Further improvements to the modelare described in John and Begum (1997), Basuet al (2002) and Kar et al (2002). Kar (2007) haveused NCEP Reanalysis-II data as the initial con-ditions along with observed Reynolds SST for sea-sonal simulation of Indian Summer Monsoon. Forthe present study, the MM5 model has been inte-grated for the whole monsoon season (June, July,August and September) based on the boundarycondition obtained from the seasonal simulation ofKar (2007).
2.2 Experimental setup
The MM5 model (version 3.6) has been simulatedfor 138 days starting from 00GMT of 16 May to00GMT of 1 October, for all the five years from1998–2002. Initial and boundary conditions for the
mesoscale model are prepared from the NCMRWFglobal model T80L18. The 138 days integrationsare done based on the initial condition at 00GMTof 16 May for each year. The boundary conditionsfrom the global model are updated every 12 hours.In recent years, many investigators have used suchmodels for downscaling seasonal forecasting andclimate applications (Nobre et al 2001; Rao et al2004; Leung et al 2006). The simulations for allthe five years (1998–2002) have been done sepa-rately using both the vegetation fractions, ISROand USGS. The simulated outputs so obtainedwere compared with the observational dataset.
2.3 Period of study
For the present study, five consecutive (1998–2002)Indian southwest monsoon season has been chosen.Year 1998 has been regarded as a normal southwestmonsoon season in terms of rainfall and year 2002was a deficient monsoon season, especially the rain-fall during the month of July was deficient. For theyears 1999–2001 India had normal monsoon. Forbrevity, the discussions are mostly concentratedover the two contrasting monsoon seasons 1998 and2002.
In 1998, the seasonal rainfall was excess in 12 andnormal in 21 meteorological sub-divisions. It wasdeficient in only two meteorological sub-divisionsnamely Orissa (−25%) and east Madhya Pradesh(−27%). Seasonal total rainfall for the country asa whole was normal and received 105% of its longperiod average value.
416 Surya K Dutta et al
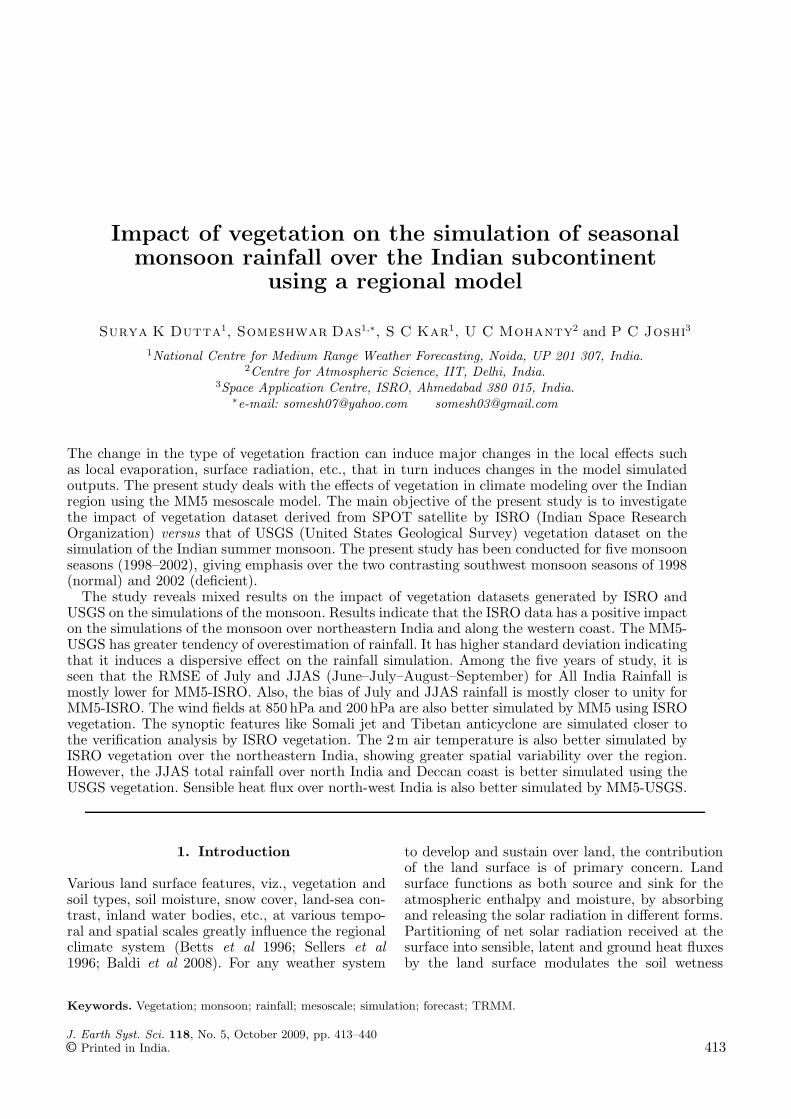
Figure 1. Domains of MM5 simulations. Shading indicatestopography in km.
In 2002, the seasonal rainfall was excess in one,normal in 14, deficient in 19 and scanty in twometeorological sub-divisions. Seasonal total rain-fall for the country as a whole was below normaland country received 81% of its long period averagerainfall.
2.4 Domain of study
MM5 model has been simulated over two nesteddomains of resolution 90 km and 30 km, respec-tively (figure 1). We have discussed the resultsmainly for the inner domain-2 (30 km resolution).
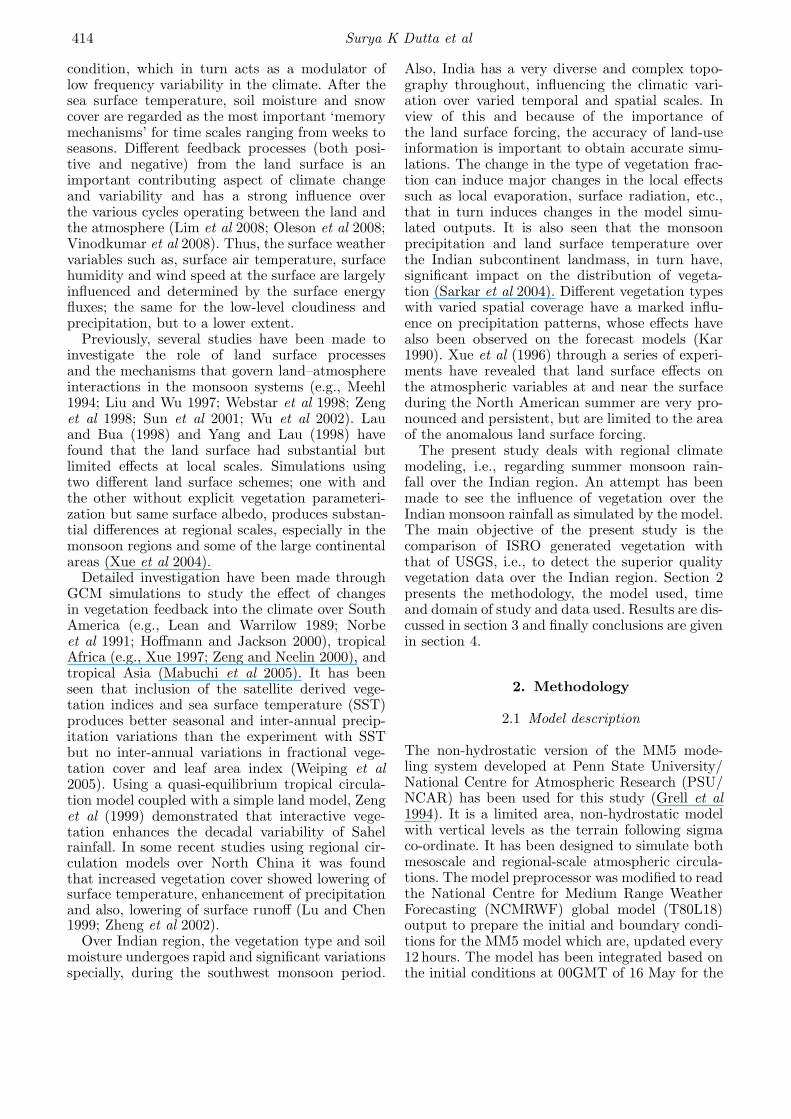
For detailed rainfall study, seven small regionswithin the Indian domain (4.2◦–38.7◦N, 67.0◦–104.8◦E) have been considered (figure 2), which areimportant for rainfall prediction, and have widevariability of rainfall within it.
i. North India (28.5–32.5◦N, 75.5–80.5◦E)ii. Central India (16.5–26.5◦N, 74.5–86.5◦E)iii. East India (21.5–26.5◦N, 84.5–88.5◦E)iv. North-east (25.0–28.5◦N, 91.5–96.5◦E)
Indiav. Head Bay (18.0–21.0◦N, 87.0–92.5◦E)vi. Deccan coast (14.5–21.0◦N, 72.5–74.5◦E)vii Konkan coast (8.0–14.5◦N, 74.0–77.5◦E)
Figure 2. Domains for regional study – north India (NI),central India (CI), east India (EI), northeast India (NEI),Head Bay (HB), Deccan coast (DC) and Konkan coast (KC).
2.5 Data used
2.5.1 Vegetation data
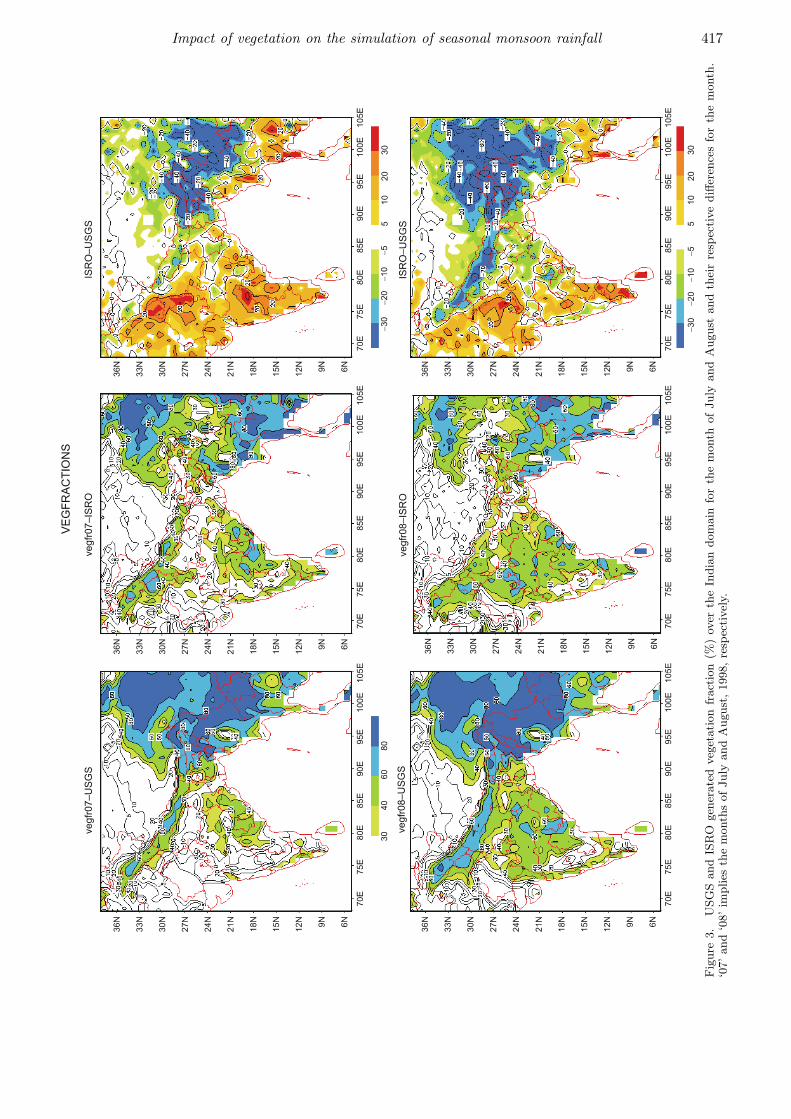
MM5 simulations for the five years have been madeindependently, by using USGS (United States Geo-logical Survey) and ISRO (Indian Space ResearchOrganization) generated vegetation data. For thegeneration of vegetation by ISRO, the land usedata derived for the reference year 2000 from multi-date SPOT vegetation data (spatial resolution ofabout 1 km) was re-aggregated/regrouped to USGS25 classes, and spatially aggregated to 10′ grid size.Monthly vegetation fraction generated from tem-porally filtered 10-day NDVI composite of SPOTvegetation data over the Indian region were spa-tially aggregated to 10′ grid size (Shefali et al 2003;Oza et al 2006). Figure 3 represents the USGS andISRO generated vegetation fraction over the Indiandomain and their respective difference plot for themonths of July and August for the year 1998. It isseen from the difference plot that the ISRO gener-ated data is producing greater spatial coverage overthe Indian region than the USGS data, except overthe northeastern India and foothills of Himalayaswhere USGS vegetation fraction is greater.
Henceforth all simulation using the USGS vege-tation are referred to as MM5-USGS and the simu-lation using the vegetation derived by ISRO (SAC)are referred to as MM5-ISRO. In this study anattempt has been made to highlight the effect ofvegetation on model simulations.
Impact of vegetation on the simulation of seasonal monsoon rainfall 417
Fig
ure
3.
USG
Sand
ISR
Ogen
erate
dveg
etati
on
fract
ion
(%)
over
the
India
ndom
ain
for
the
month
of
July
and
August
and
thei
rre
spec
tive
diff
eren
ces
for
the
month
.‘0
7’and
‘08’im
plies
the
month
sofJuly
and
August
,1998,re
spec
tivel
y.
418 Surya K Dutta et al
2.5.2 Observed rainfall
TRMM (Tropical Rainfall Measuring Mission)data has been used here as a ground truth forthe verification of the rainfall simulations bythe mesoscale model (http://daac.gsfc.nasa.gov/precipitation/documentation.html). The TRMMsatellite uses a passive sensor TRMM MicrowaveImager (TMI), an active Precipitation Radar (PR)operating at 13.6 GHz, and a visible and infraredscanner (VIRS) radiometer. The 3B42 algo-rithm provides daily precipitation and root meansquare (RMS) error estimates at 0.25◦ × 0.25◦
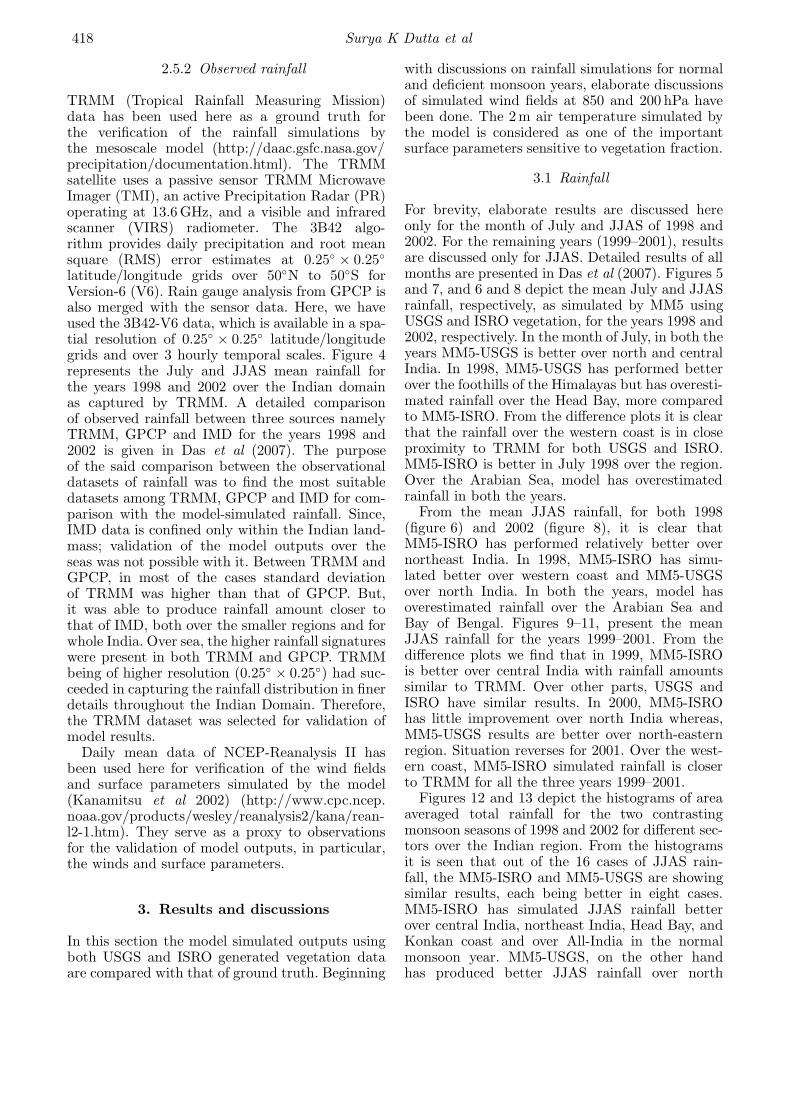
latitude/longitude grids over 50◦N to 50◦S forVersion-6 (V6). Rain gauge analysis from GPCP isalso merged with the sensor data. Here, we haveused the 3B42-V6 data, which is available in a spa-tial resolution of 0.25◦ × 0.25◦ latitude/longitudegrids and over 3 hourly temporal scales. Figure 4represents the July and JJAS mean rainfall forthe years 1998 and 2002 over the Indian domainas captured by TRMM. A detailed comparisonof observed rainfall between three sources namelyTRMM, GPCP and IMD for the years 1998 and2002 is given in Das et al (2007). The purposeof the said comparison between the observationaldatasets of rainfall was to find the most suitabledatasets among TRMM, GPCP and IMD for com-parison with the model-simulated rainfall. Since,IMD data is confined only within the Indian land-mass; validation of the model outputs over theseas was not possible with it. Between TRMM andGPCP, in most of the cases standard deviationof TRMM was higher than that of GPCP. But,it was able to produce rainfall amount closer tothat of IMD, both over the smaller regions and forwhole India. Over sea, the higher rainfall signatureswere present in both TRMM and GPCP. TRMMbeing of higher resolution (0.25◦ × 0.25◦) had suc-ceeded in capturing the rainfall distribution in finerdetails throughout the Indian Domain. Therefore,the TRMM dataset was selected for validation ofmodel results.
Daily mean data of NCEP-Reanalysis II hasbeen used here for verification of the wind fieldsand surface parameters simulated by the model(Kanamitsu et al 2002) (http://www.cpc.ncep.noaa.gov/products/wesley/reanalysis2/kana/rean-l2-1.htm). They serve as a proxy to observationsfor the validation of model outputs, in particular,the winds and surface parameters.
3. Results and discussions
In this section the model simulated outputs usingboth USGS and ISRO generated vegetation dataare compared with that of ground truth. Beginning
with discussions on rainfall simulations for normaland deficient monsoon years, elaborate discussionsof simulated wind fields at 850 and 200 hPa havebeen done. The 2m air temperature simulated bythe model is considered as one of the importantsurface parameters sensitive to vegetation fraction.
3.1 Rainfall
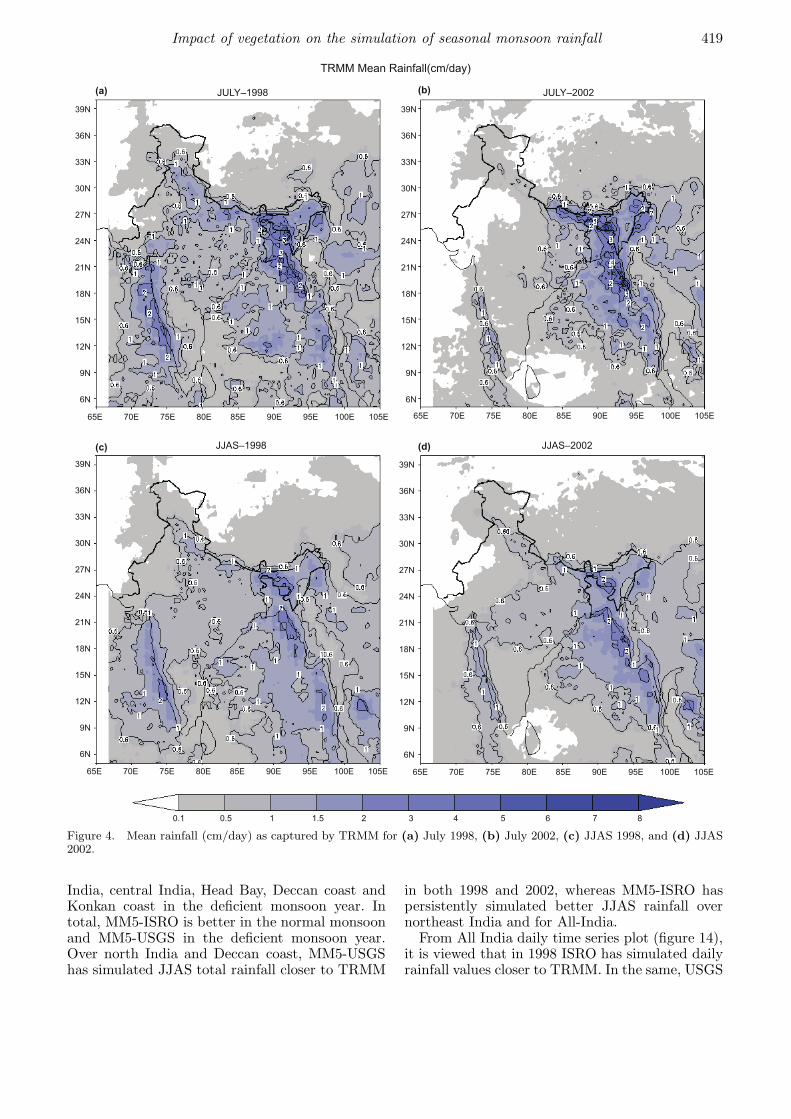
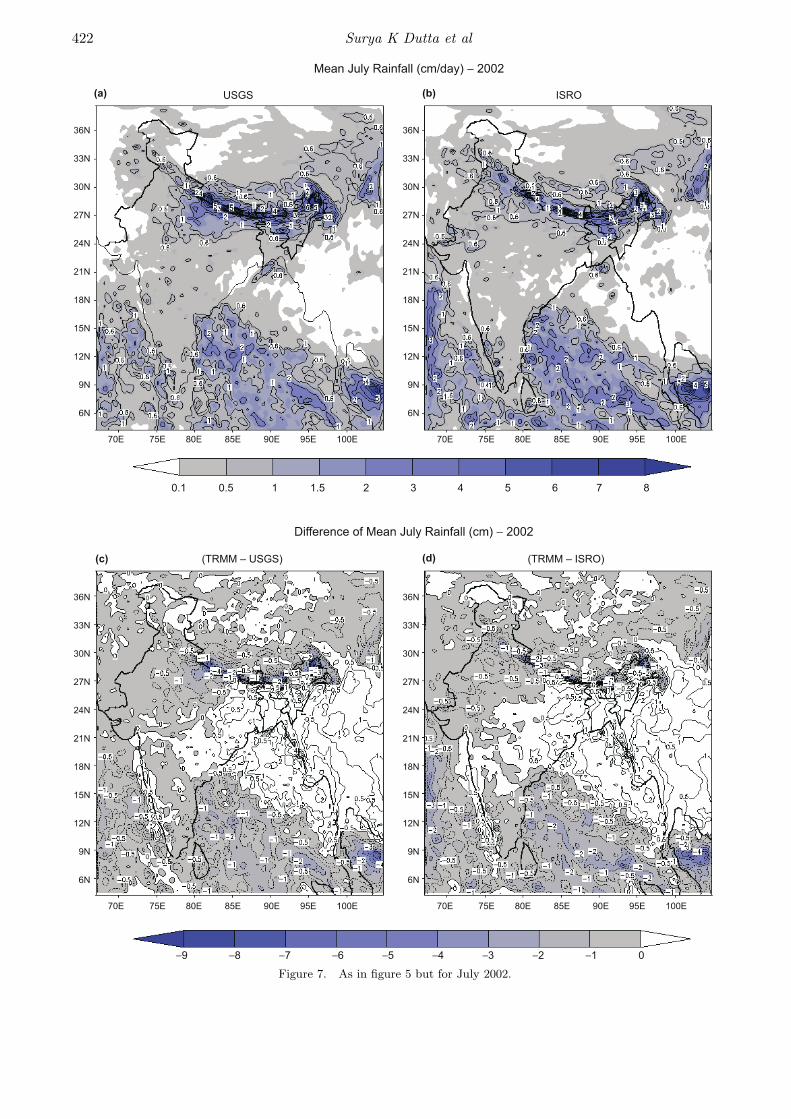
For brevity, elaborate results are discussed hereonly for the month of July and JJAS of 1998 and2002. For the remaining years (1999–2001), resultsare discussed only for JJAS. Detailed results of allmonths are presented in Das et al (2007). Figures 5and 7, and 6 and 8 depict the mean July and JJASrainfall, respectively, as simulated by MM5 usingUSGS and ISRO vegetation, for the years 1998 and2002, respectively. In the month of July, in both theyears MM5-USGS is better over north and centralIndia. In 1998, MM5-USGS has performed betterover the foothills of the Himalayas but has overesti-mated rainfall over the Head Bay, more comparedto MM5-ISRO. From the difference plots it is clearthat the rainfall over the western coast is in closeproximity to TRMM for both USGS and ISRO.MM5-ISRO is better in July 1998 over the region.Over the Arabian Sea, model has overestimatedrainfall in both the years.
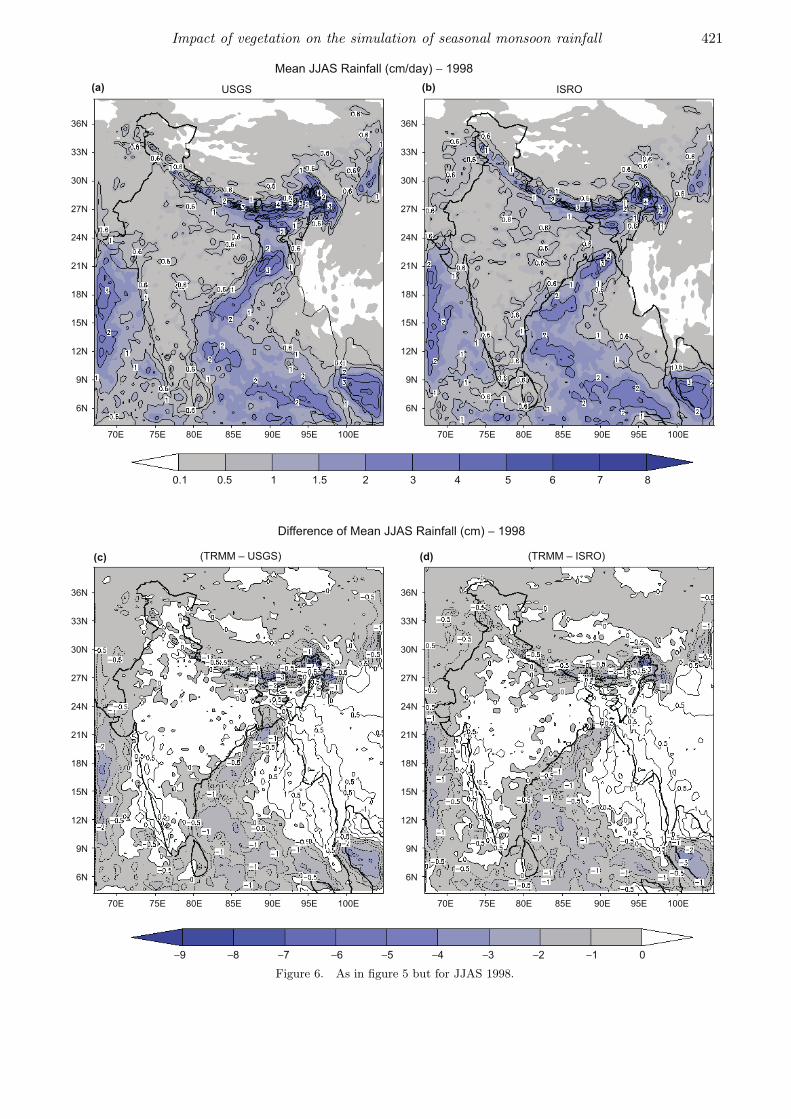
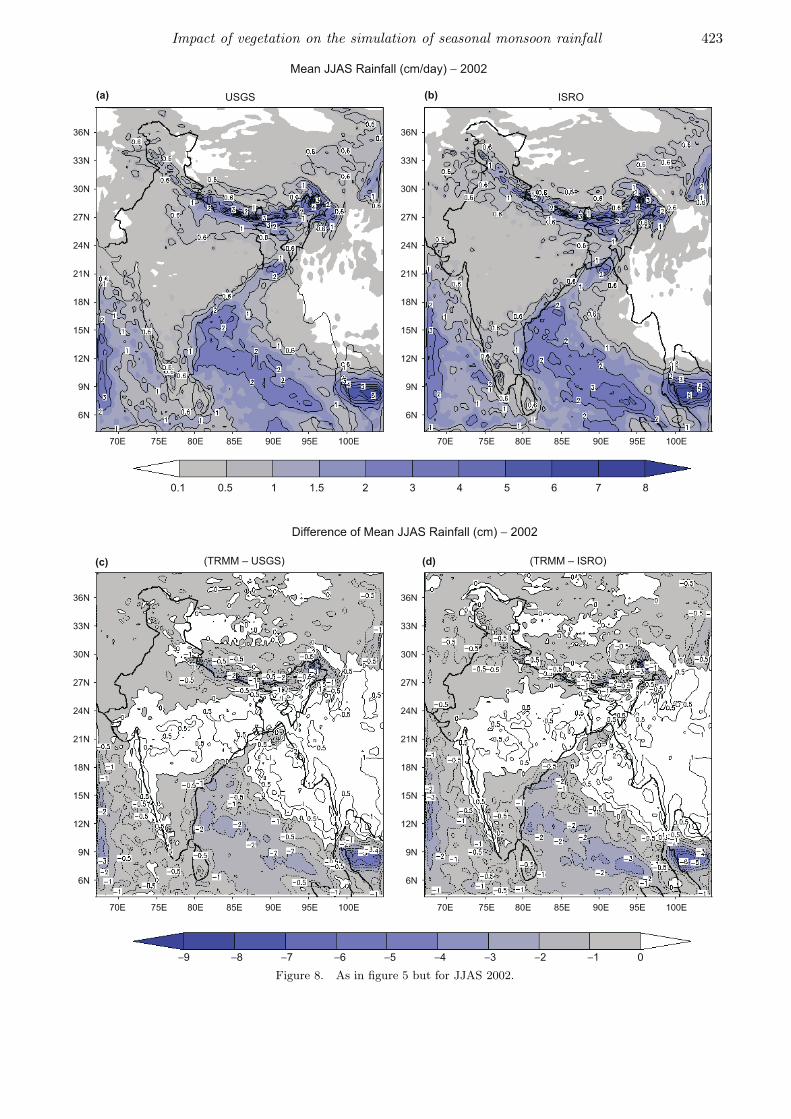
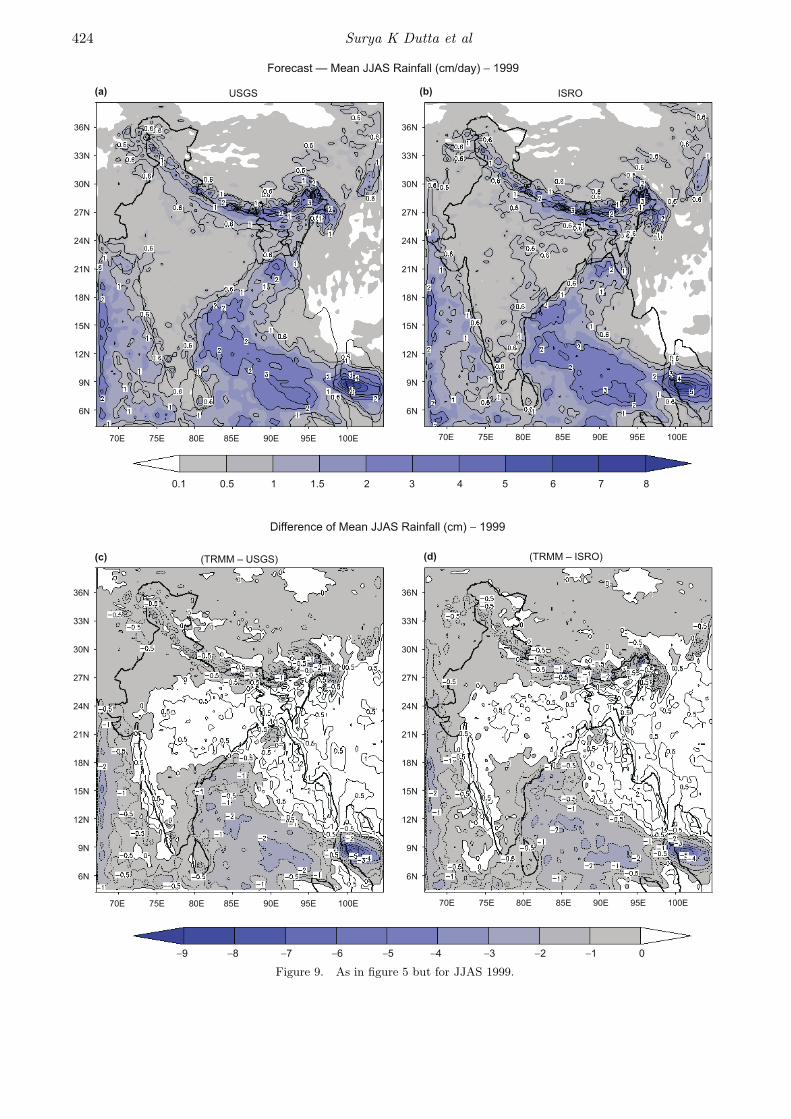
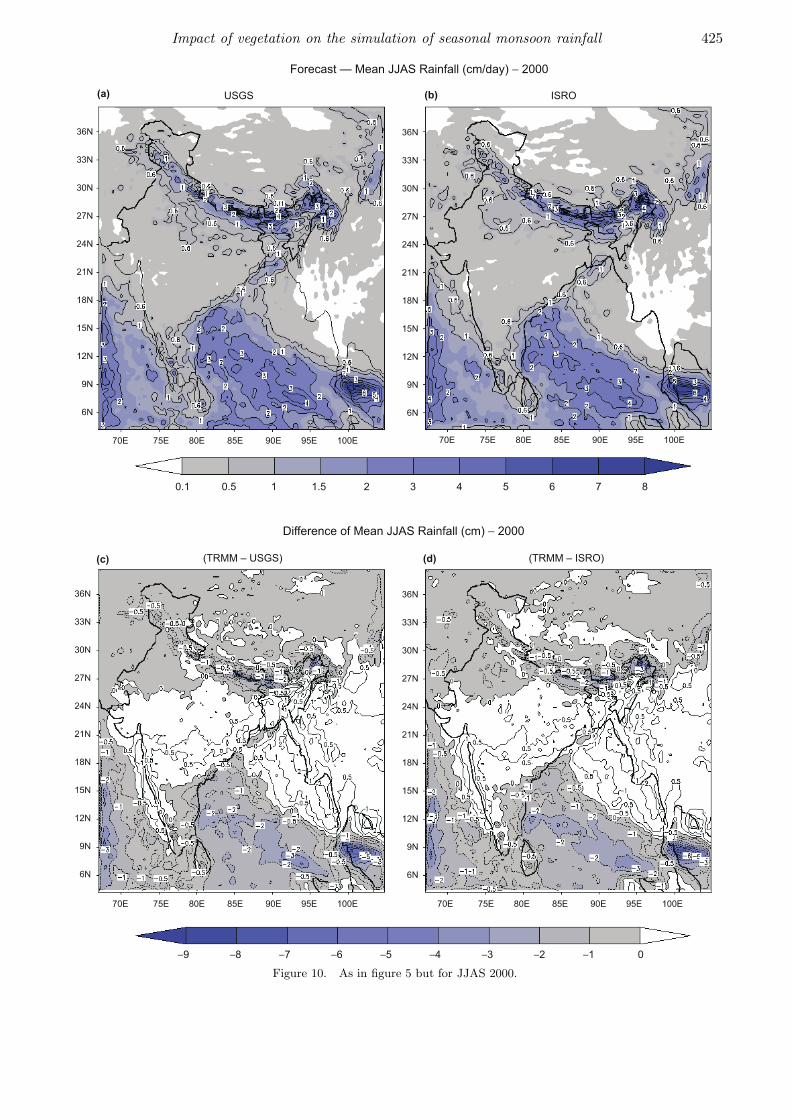
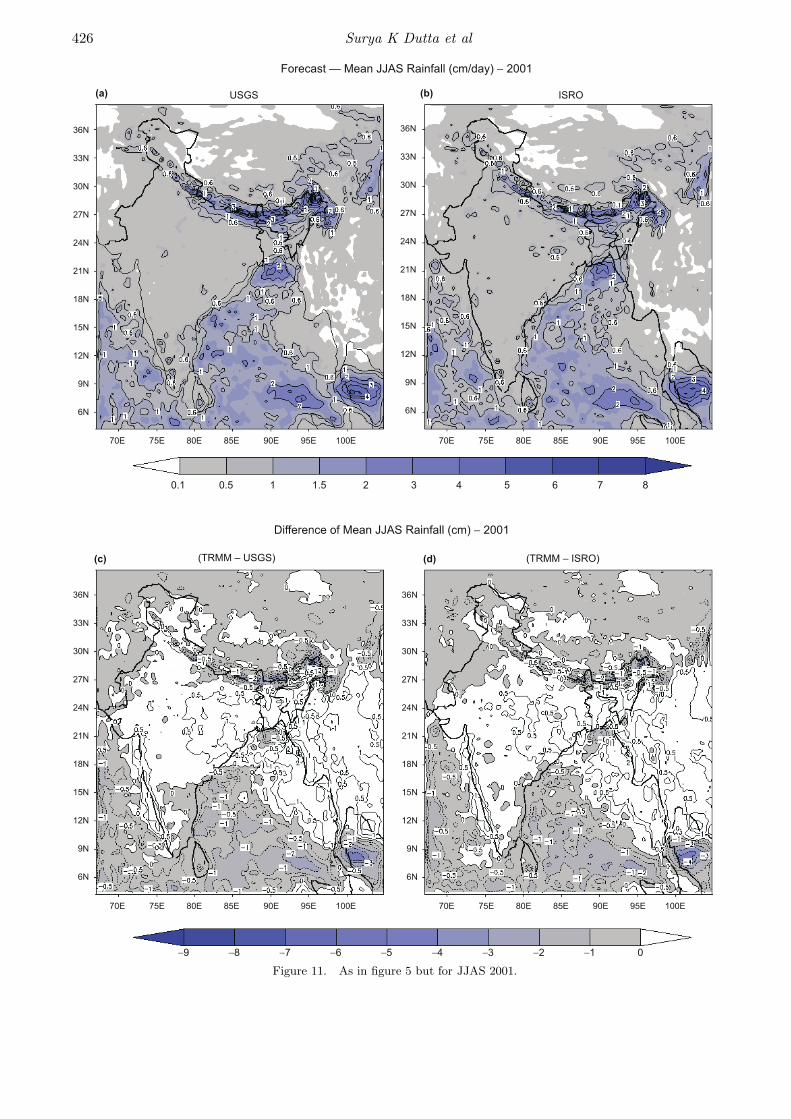
From the mean JJAS rainfall, for both 1998(figure 6) and 2002 (figure 8), it is clear thatMM5-ISRO has performed relatively better overnortheast India. In 1998, MM5-ISRO has simu-lated better over western coast and MM5-USGSover north India. In both the years, model hasoverestimated rainfall over the Arabian Sea andBay of Bengal. Figures 9–11, present the meanJJAS rainfall for the years 1999–2001. From thedifference plots we find that in 1999, MM5-ISROis better over central India with rainfall amountssimilar to TRMM. Over other parts, USGS andISRO have similar results. In 2000, MM5-ISROhas little improvement over north India whereas,MM5-USGS results are better over north-easternregion. Situation reverses for 2001. Over the west-ern coast, MM5-ISRO simulated rainfall is closerto TRMM for all the three years 1999–2001.
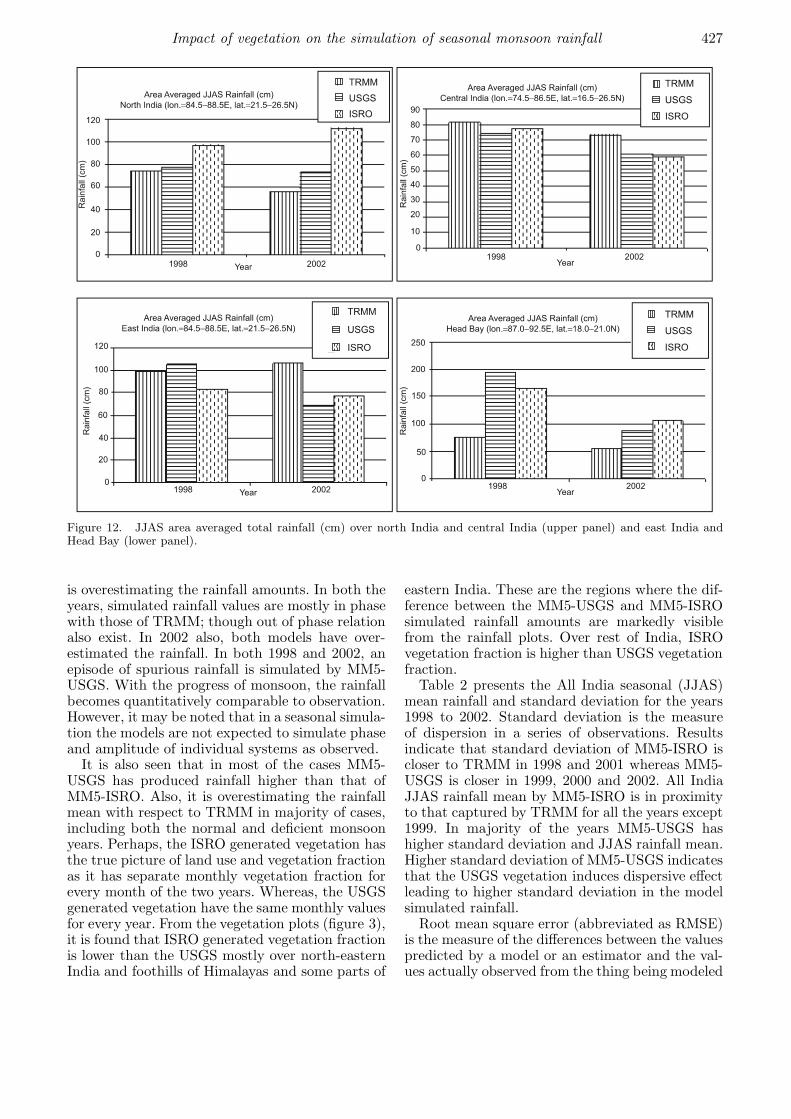
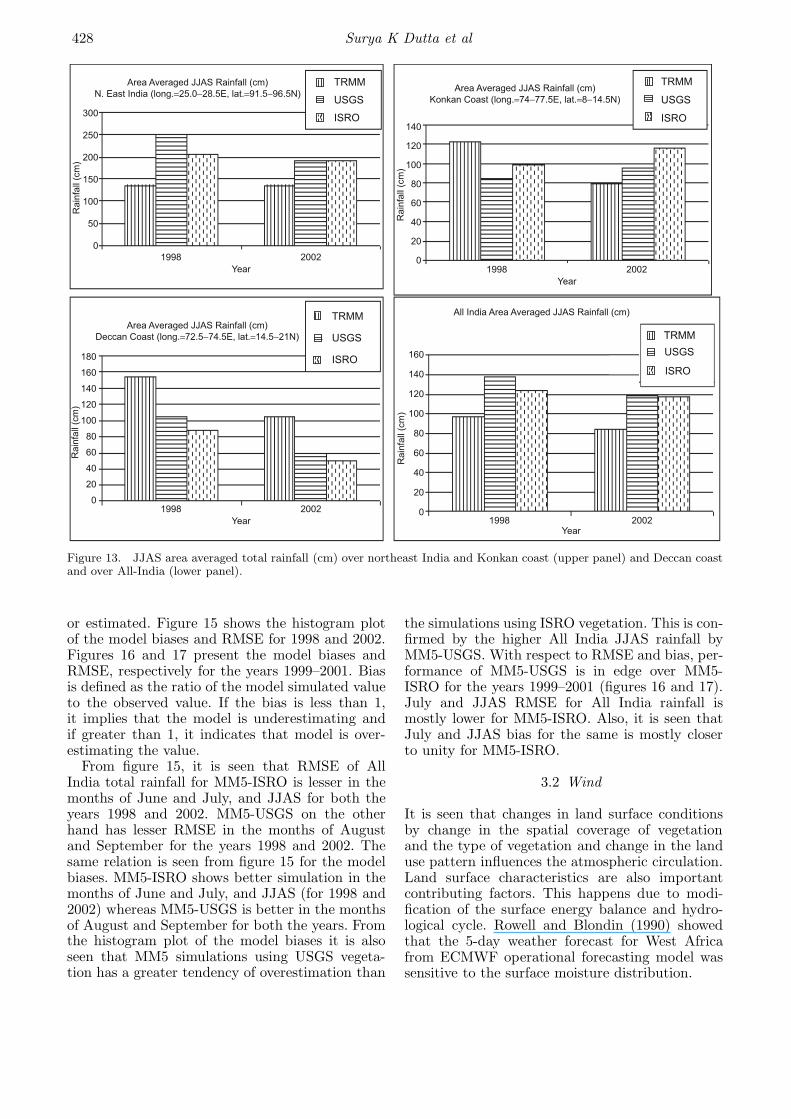
Figures 12 and 13 depict the histograms of areaaveraged total rainfall for the two contrastingmonsoon seasons of 1998 and 2002 for different sec-tors over the Indian region. From the histogramsit is seen that out of the 16 cases of JJAS rain-fall, the MM5-ISRO and MM5-USGS are showingsimilar results, each being better in eight cases.MM5-ISRO has simulated JJAS rainfall betterover central India, northeast India, Head Bay, andKonkan coast and over All-India in the normalmonsoon year. MM5-USGS, on the other handhas produced better JJAS rainfall over north
Impact of vegetation on the simulation of seasonal monsoon rainfall 419
Figure 4. Mean rainfall (cm/day) as captured by TRMM for (a) July 1998, (b) July 2002, (c) JJAS 1998, and (d) JJAS2002.
India, central India, Head Bay, Deccan coast andKonkan coast in the deficient monsoon year. Intotal, MM5-ISRO is better in the normal monsoonand MM5-USGS in the deficient monsoon year.Over north India and Deccan coast, MM5-USGShas simulated JJAS total rainfall closer to TRMM
in both 1998 and 2002, whereas MM5-ISRO haspersistently simulated better JJAS rainfall overnortheast India and for All-India.
From All India daily time series plot (figure 14),it is viewed that in 1998 ISRO has simulated dailyrainfall values closer to TRMM. In the same, USGS
420 Surya K Dutta et al
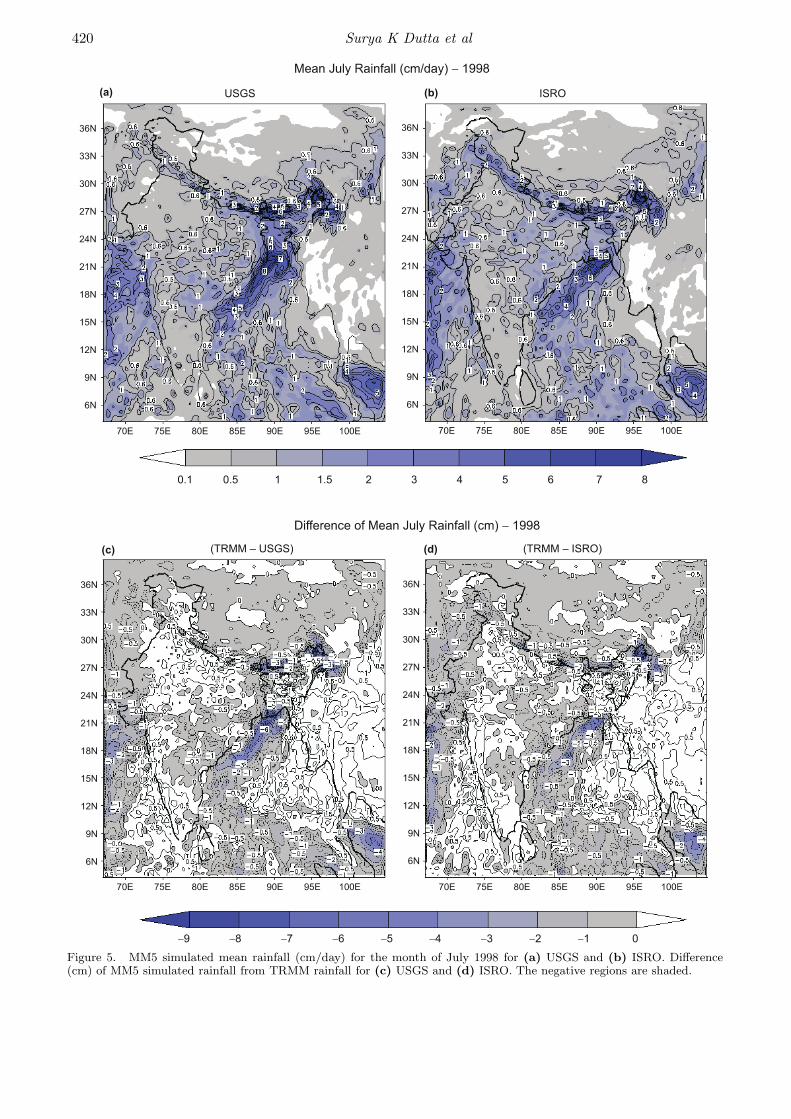
Figure 5. MM5 simulated mean rainfall (cm/day) for the month of July 1998 for (a) USGS and (b) ISRO. Difference(cm) of MM5 simulated rainfall from TRMM rainfall for (c) USGS and (d) ISRO. The negative regions are shaded.
Impact of vegetation on the simulation of seasonal monsoon rainfall 421
Figure 6. As in figure 5 but for JJAS 1998.
422 Surya K Dutta et al
Figure 7. As in figure 5 but for July 2002.
Impact of vegetation on the simulation of seasonal monsoon rainfall 423
Figure 8. As in figure 5 but for JJAS 2002.
424 Surya K Dutta et al
Figure 9. As in figure 5 but for JJAS 1999.
Impact of vegetation on the simulation of seasonal monsoon rainfall 425
Figure 10. As in figure 5 but for JJAS 2000.
426 Surya K Dutta et al
Figure 11. As in figure 5 but for JJAS 2001.
Impact of vegetation on the simulation of seasonal monsoon rainfall 427
Figure 12. JJAS area averaged total rainfall (cm) over north India and central India (upper panel) and east India andHead Bay (lower panel).
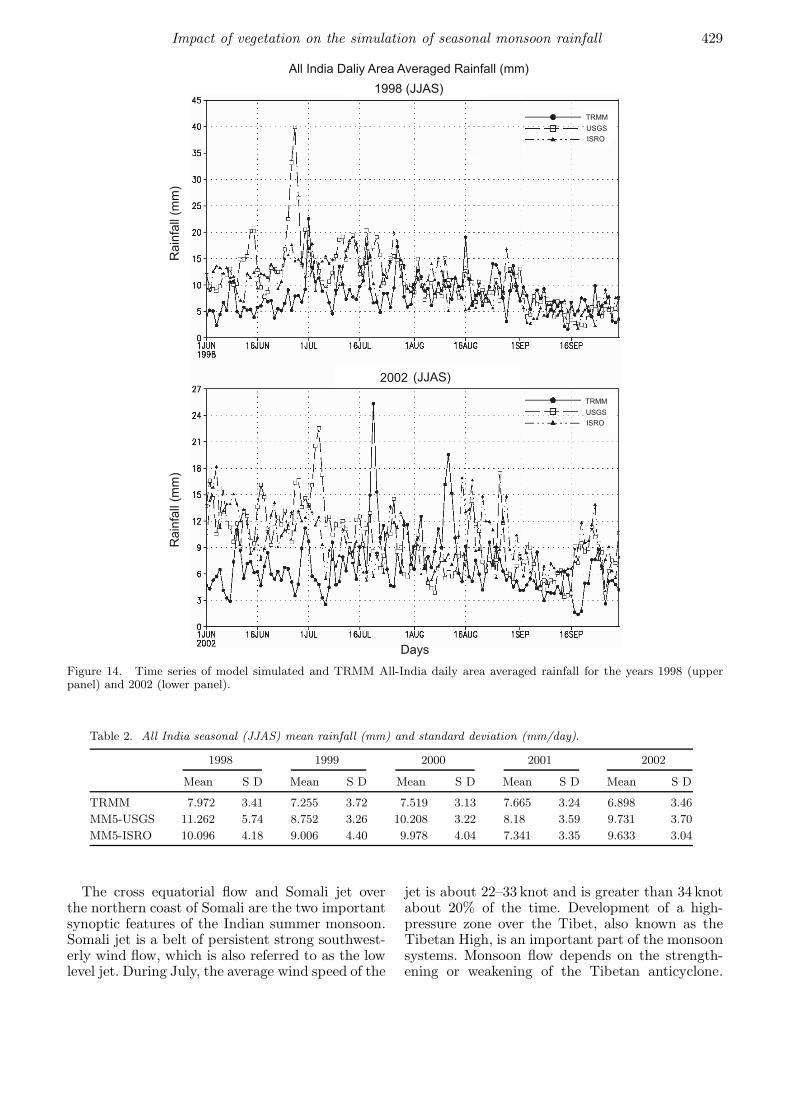
is overestimating the rainfall amounts. In both theyears, simulated rainfall values are mostly in phasewith those of TRMM; though out of phase relationalso exist. In 2002 also, both models have over-estimated the rainfall. In both 1998 and 2002, anepisode of spurious rainfall is simulated by MM5-USGS. With the progress of monsoon, the rainfallbecomes quantitatively comparable to observation.However, it may be noted that in a seasonal simula-tion the models are not expected to simulate phaseand amplitude of individual systems as observed.
It is also seen that in most of the cases MM5-USGS has produced rainfall higher than that ofMM5-ISRO. Also, it is overestimating the rainfallmean with respect to TRMM in majority of cases,including both the normal and deficient monsoonyears. Perhaps, the ISRO generated vegetation hasthe true picture of land use and vegetation fractionas it has separate monthly vegetation fraction forevery month of the two years. Whereas, the USGSgenerated vegetation have the same monthly valuesfor every year. From the vegetation plots (figure 3),it is found that ISRO generated vegetation fractionis lower than the USGS mostly over north-easternIndia and foothills of Himalayas and some parts of
eastern India. These are the regions where the dif-ference between the MM5-USGS and MM5-ISROsimulated rainfall amounts are markedly visiblefrom the rainfall plots. Over rest of India, ISROvegetation fraction is higher than USGS vegetationfraction.
Table 2 presents the All India seasonal (JJAS)mean rainfall and standard deviation for the years1998 to 2002. Standard deviation is the measureof dispersion in a series of observations. Resultsindicate that standard deviation of MM5-ISRO iscloser to TRMM in 1998 and 2001 whereas MM5-USGS is closer in 1999, 2000 and 2002. All IndiaJJAS rainfall mean by MM5-ISRO is in proximityto that captured by TRMM for all the years except1999. In majority of the years MM5-USGS hashigher standard deviation and JJAS rainfall mean.Higher standard deviation of MM5-USGS indicatesthat the USGS vegetation induces dispersive effectleading to higher standard deviation in the modelsimulated rainfall.
Root mean square error (abbreviated as RMSE)is the measure of the differences between the valuespredicted by a model or an estimator and the val-ues actually observed from the thing being modeled
428 Surya K Dutta et al
Figure 13. JJAS area averaged total rainfall (cm) over northeast India and Konkan coast (upper panel) and Deccan coastand over All-India (lower panel).
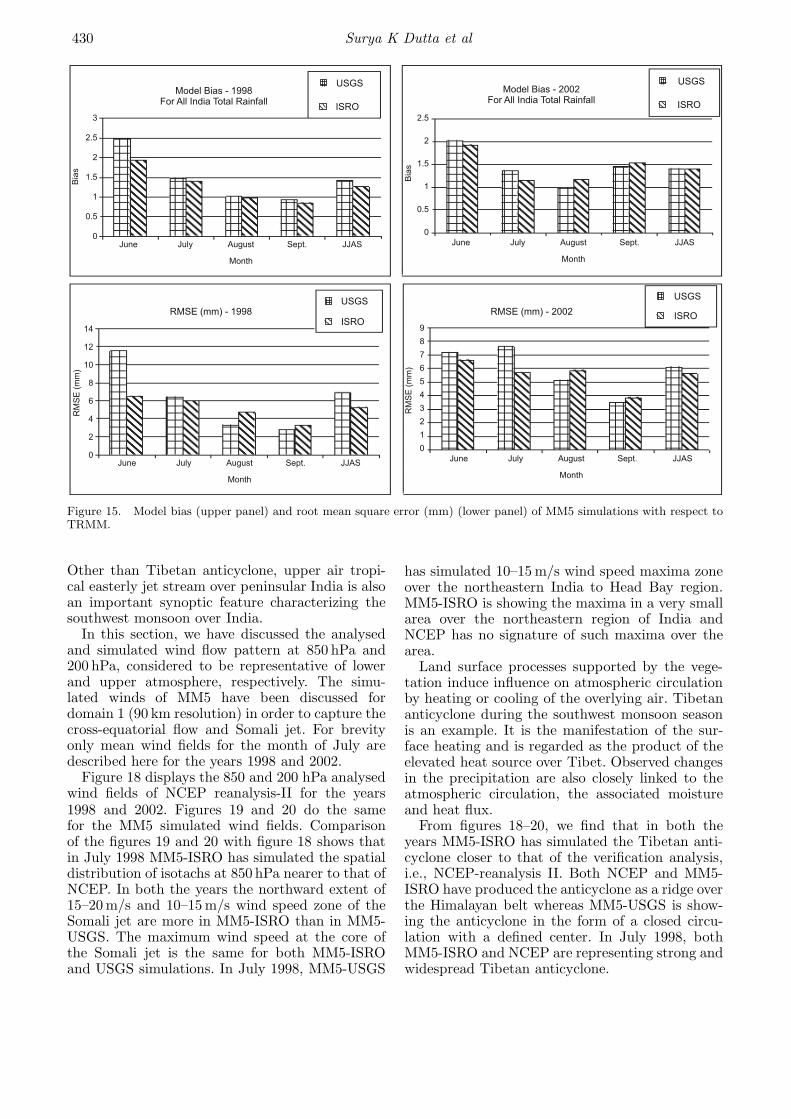
or estimated. Figure 15 shows the histogram plotof the model biases and RMSE for 1998 and 2002.Figures 16 and 17 present the model biases andRMSE, respectively for the years 1999–2001. Biasis defined as the ratio of the model simulated valueto the observed value. If the bias is less than 1,it implies that the model is underestimating andif greater than 1, it indicates that model is over-estimating the value.
From figure 15, it is seen that RMSE of AllIndia total rainfall for MM5-ISRO is lesser in themonths of June and July, and JJAS for both theyears 1998 and 2002. MM5-USGS on the otherhand has lesser RMSE in the months of Augustand September for the years 1998 and 2002. Thesame relation is seen from figure 15 for the modelbiases. MM5-ISRO shows better simulation in themonths of June and July, and JJAS (for 1998 and2002) whereas MM5-USGS is better in the monthsof August and September for both the years. Fromthe histogram plot of the model biases it is alsoseen that MM5 simulations using USGS vegeta-tion has a greater tendency of overestimation than
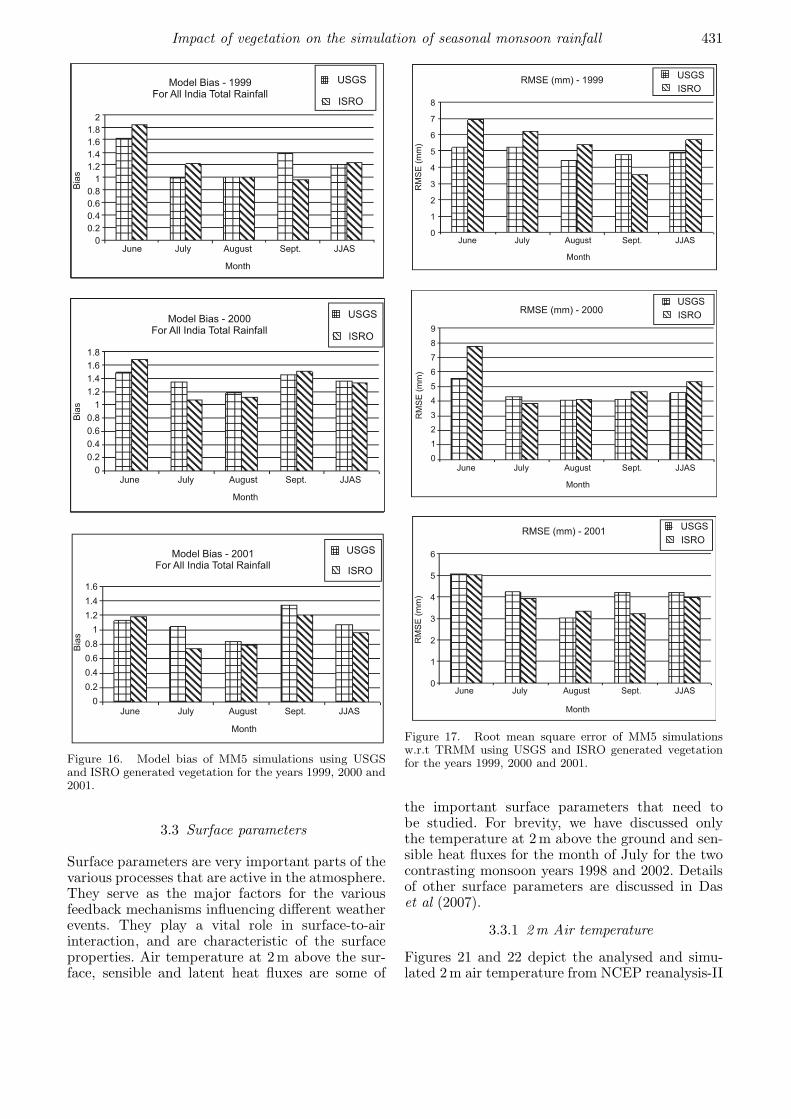
the simulations using ISRO vegetation. This is con-firmed by the higher All India JJAS rainfall byMM5-USGS. With respect to RMSE and bias, per-formance of MM5-USGS is in edge over MM5-ISRO for the years 1999–2001 (figures 16 and 17).July and JJAS RMSE for All India rainfall ismostly lower for MM5-ISRO. Also, it is seen thatJuly and JJAS bias for the same is mostly closerto unity for MM5-ISRO.
3.2 Wind
It is seen that changes in land surface conditionsby change in the spatial coverage of vegetationand the type of vegetation and change in the landuse pattern influences the atmospheric circulation.Land surface characteristics are also importantcontributing factors. This happens due to modi-fication of the surface energy balance and hydro-logical cycle. Rowell and Blondin (1990) showedthat the 5-day weather forecast for West Africafrom ECMWF operational forecasting model wassensitive to the surface moisture distribution.
Impact of vegetation on the simulation of seasonal monsoon rainfall 429
Figure 14. Time series of model simulated and TRMM All-India daily area averaged rainfall for the years 1998 (upperpanel) and 2002 (lower panel).
Table 2. All India seasonal (JJAS) mean rainfall (mm) and standard deviation (mm/day).
1998 1999 2000 2001 2002
Mean S D Mean S D Mean S D Mean S D Mean S D
TRMM 7.972 3.41 7.255 3.72 7.519 3.13 7.665 3.24 6.898 3.46
MM5-USGS 11.262 5.74 8.752 3.26 10.208 3.22 8.18 3.59 9.731 3.70
MM5-ISRO 10.096 4.18 9.006 4.40 9.978 4.04 7.341 3.35 9.633 3.04
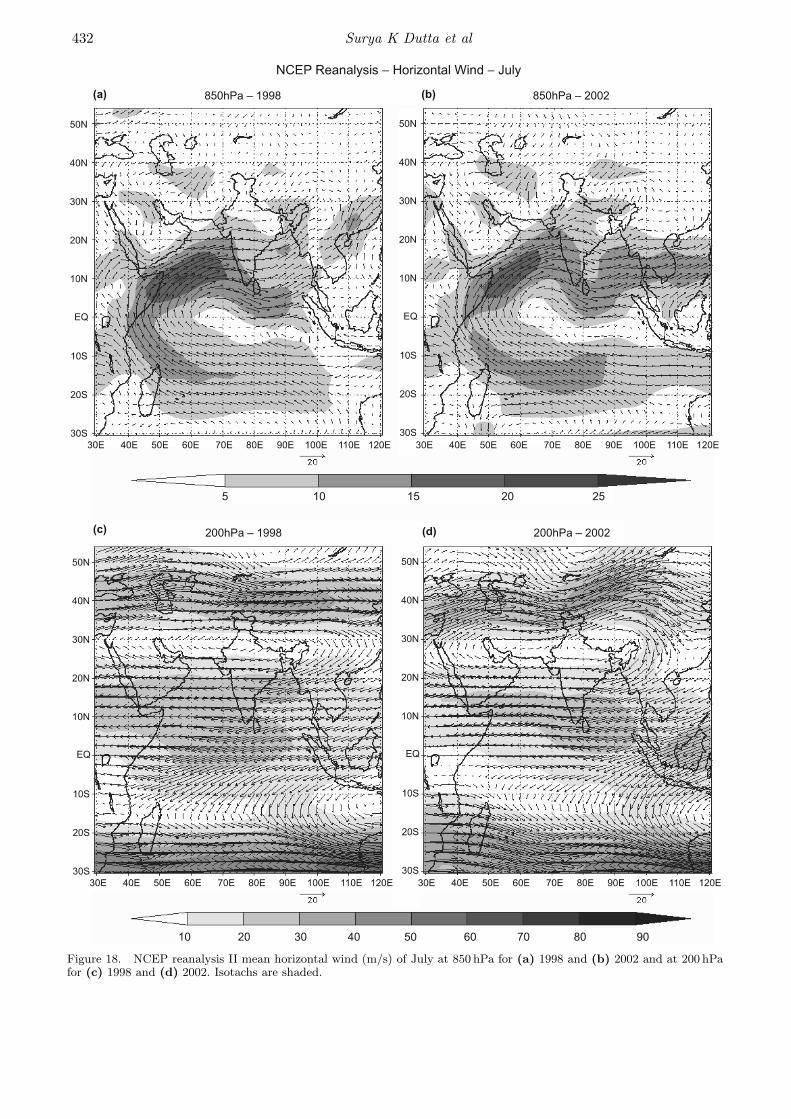
The cross equatorial flow and Somali jet overthe northern coast of Somali are the two importantsynoptic features of the Indian summer monsoon.Somali jet is a belt of persistent strong southwest-erly wind flow, which is also referred to as the lowlevel jet. During July, the average wind speed of the
jet is about 22–33 knot and is greater than 34 knotabout 20% of the time. Development of a high-pressure zone over the Tibet, also known as theTibetan High, is an important part of the monsoonsystems. Monsoon flow depends on the strength-ening or weakening of the Tibetan anticyclone.
430 Surya K Dutta et al
Figure 15. Model bias (upper panel) and root mean square error (mm) (lower panel) of MM5 simulations with respect toTRMM.
Other than Tibetan anticyclone, upper air tropi-cal easterly jet stream over peninsular India is alsoan important synoptic feature characterizing thesouthwest monsoon over India.
In this section, we have discussed the analysedand simulated wind flow pattern at 850 hPa and200 hPa, considered to be representative of lowerand upper atmosphere, respectively. The simu-lated winds of MM5 have been discussed fordomain 1 (90 km resolution) in order to capture thecross-equatorial flow and Somali jet. For brevityonly mean wind fields for the month of July aredescribed here for the years 1998 and 2002.
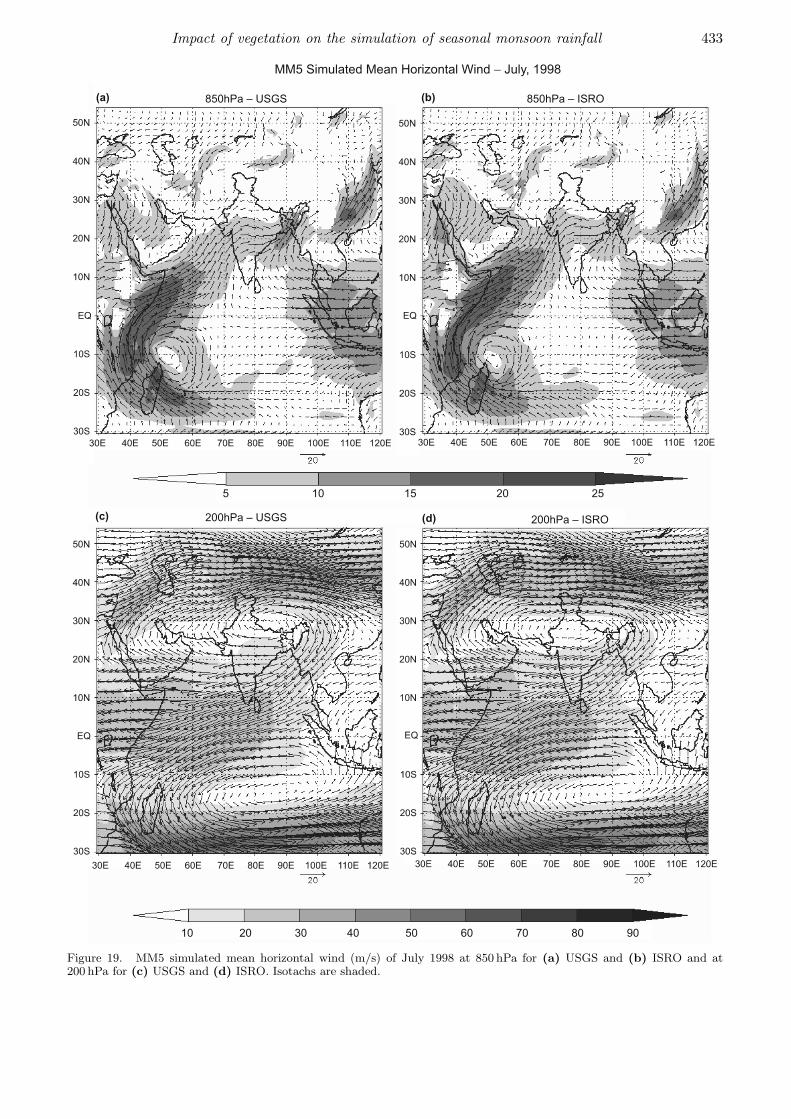
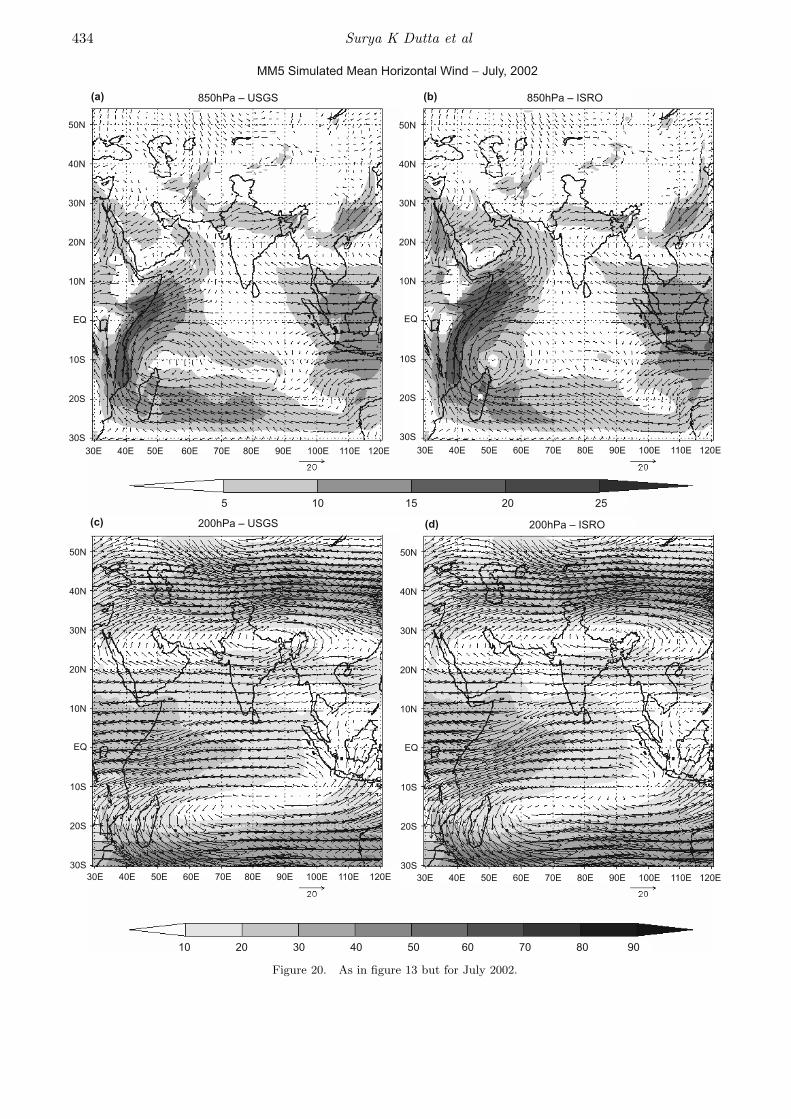
Figure 18 displays the 850 and 200 hPa analysedwind fields of NCEP reanalysis-II for the years1998 and 2002. Figures 19 and 20 do the samefor the MM5 simulated wind fields. Comparisonof the figures 19 and 20 with figure 18 shows thatin July 1998 MM5-ISRO has simulated the spatialdistribution of isotachs at 850 hPa nearer to that ofNCEP. In both the years the northward extent of15–20 m/s and 10–15 m/s wind speed zone of theSomali jet are more in MM5-ISRO than in MM5-USGS. The maximum wind speed at the core ofthe Somali jet is the same for both MM5-ISROand USGS simulations. In July 1998, MM5-USGS
has simulated 10–15 m/s wind speed maxima zoneover the northeastern India to Head Bay region.MM5-ISRO is showing the maxima in a very smallarea over the northeastern region of India andNCEP has no signature of such maxima over thearea.
Land surface processes supported by the vege-tation induce influence on atmospheric circulationby heating or cooling of the overlying air. Tibetananticyclone during the southwest monsoon seasonis an example. It is the manifestation of the sur-face heating and is regarded as the product of theelevated heat source over Tibet. Observed changesin the precipitation are also closely linked to theatmospheric circulation, the associated moistureand heat flux.
From figures 18–20, we find that in both theyears MM5-ISRO has simulated the Tibetan anti-cyclone closer to that of the verification analysis,i.e., NCEP-reanalysis II. Both NCEP and MM5-ISRO have produced the anticyclone as a ridge overthe Himalayan belt whereas MM5-USGS is show-ing the anticyclone in the form of a closed circu-lation with a defined center. In July 1998, bothMM5-ISRO and NCEP are representing strong andwidespread Tibetan anticyclone.
Impact of vegetation on the simulation of seasonal monsoon rainfall 431
Figure 16. Model bias of MM5 simulations using USGSand ISRO generated vegetation for the years 1999, 2000 and2001.
3.3 Surface parameters
Surface parameters are very important parts of thevarious processes that are active in the atmosphere.They serve as the major factors for the variousfeedback mechanisms influencing different weatherevents. They play a vital role in surface-to-airinteraction, and are characteristic of the surfaceproperties. Air temperature at 2m above the sur-face, sensible and latent heat fluxes are some of
Figure 17. Root mean square error of MM5 simulationsw.r.t TRMM using USGS and ISRO generated vegetationfor the years 1999, 2000 and 2001.
the important surface parameters that need tobe studied. For brevity, we have discussed onlythe temperature at 2 m above the ground and sen-sible heat fluxes for the month of July for the twocontrasting monsoon years 1998 and 2002. Detailsof other surface parameters are discussed in Daset al (2007).
3.3.1 2m Air temperature
Figures 21 and 22 depict the analysed and simu-lated 2m air temperature from NCEP reanalysis-II
432 Surya K Dutta et al
Figure 18. NCEP reanalysis II mean horizontal wind (m/s) of July at 850 hPa for (a) 1998 and (b) 2002 and at 200 hPafor (c) 1998 and (d) 2002. Isotachs are shaded.
Impact of vegetation on the simulation of seasonal monsoon rainfall 433
Figure 19. MM5 simulated mean horizontal wind (m/s) of July 1998 at 850 hPa for (a) USGS and (b) ISRO and at200 hPa for (c) USGS and (d) ISRO. Isotachs are shaded.
434 Surya K Dutta et al
Figure 20. As in figure 13 but for July 2002.
Impact of vegetation on the simulation of seasonal monsoon rainfall 435
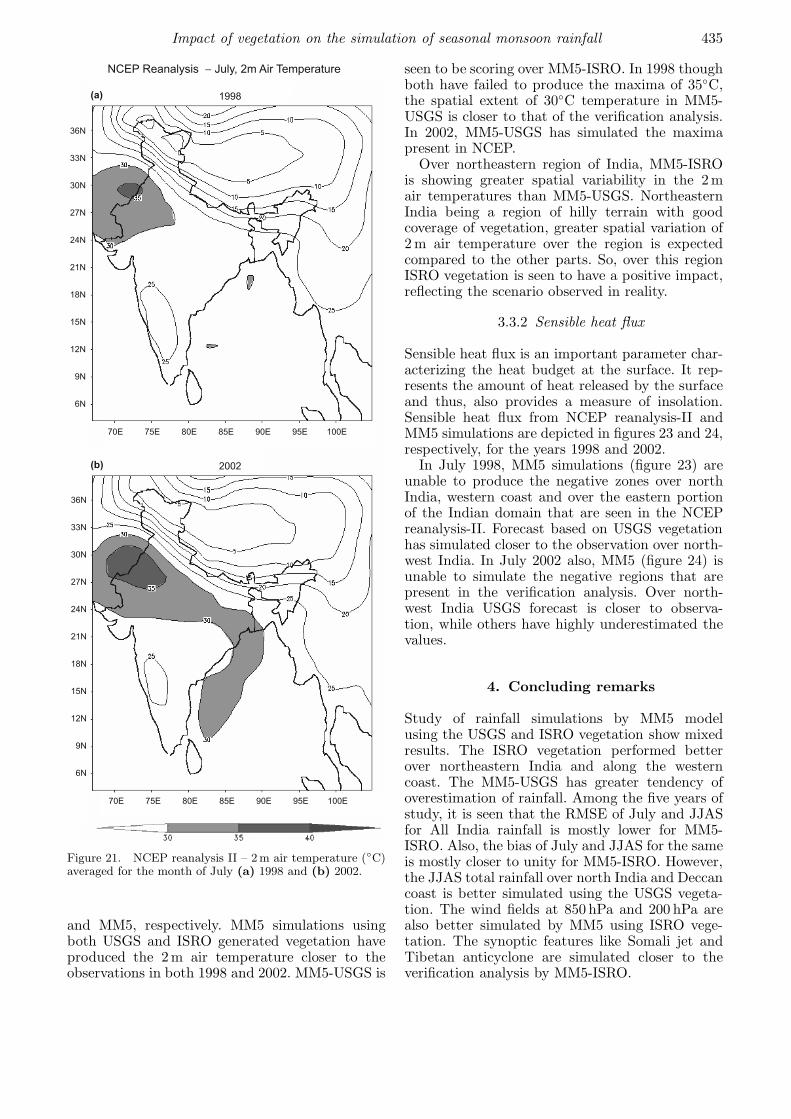
Figure 21. NCEP reanalysis II – 2m air temperature (◦C)averaged for the month of July (a) 1998 and (b) 2002.
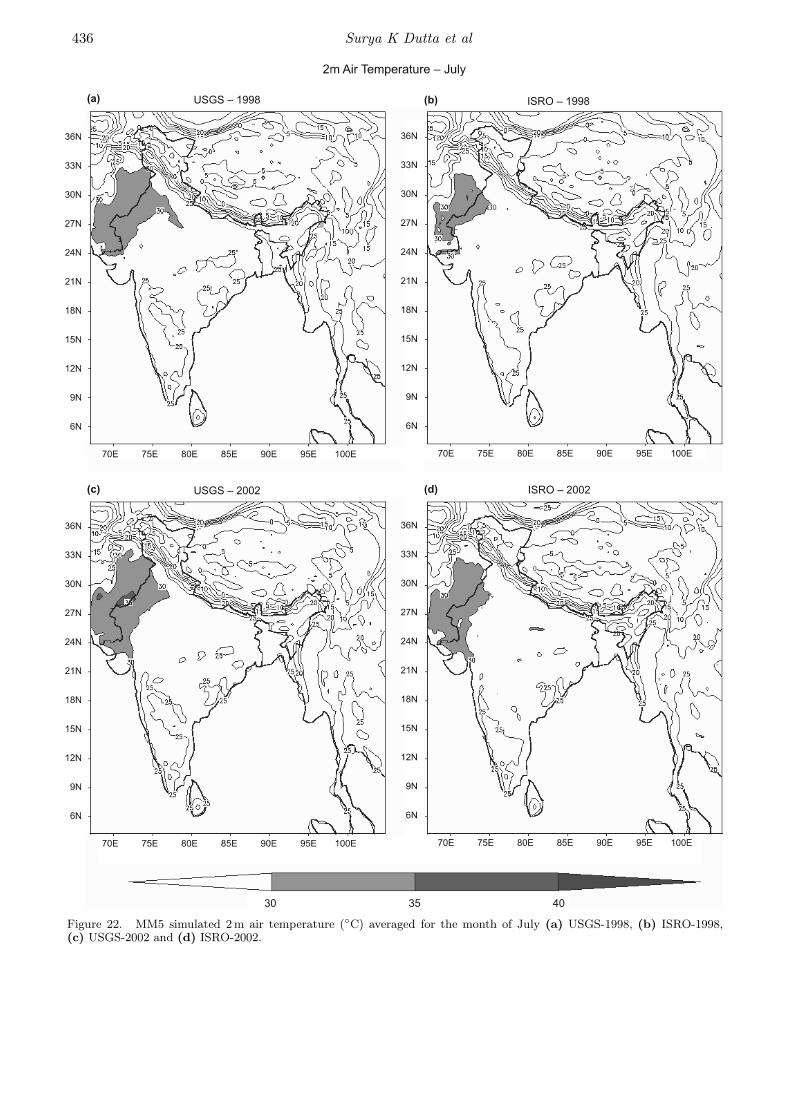
and MM5, respectively. MM5 simulations usingboth USGS and ISRO generated vegetation haveproduced the 2m air temperature closer to theobservations in both 1998 and 2002. MM5-USGS is
seen to be scoring over MM5-ISRO. In 1998 thoughboth have failed to produce the maxima of 35◦C,the spatial extent of 30◦C temperature in MM5-USGS is closer to that of the verification analysis.In 2002, MM5-USGS has simulated the maximapresent in NCEP.
Over northeastern region of India, MM5-ISROis showing greater spatial variability in the 2mair temperatures than MM5-USGS. NortheasternIndia being a region of hilly terrain with goodcoverage of vegetation, greater spatial variation of2 m air temperature over the region is expectedcompared to the other parts. So, over this regionISRO vegetation is seen to have a positive impact,reflecting the scenario observed in reality.
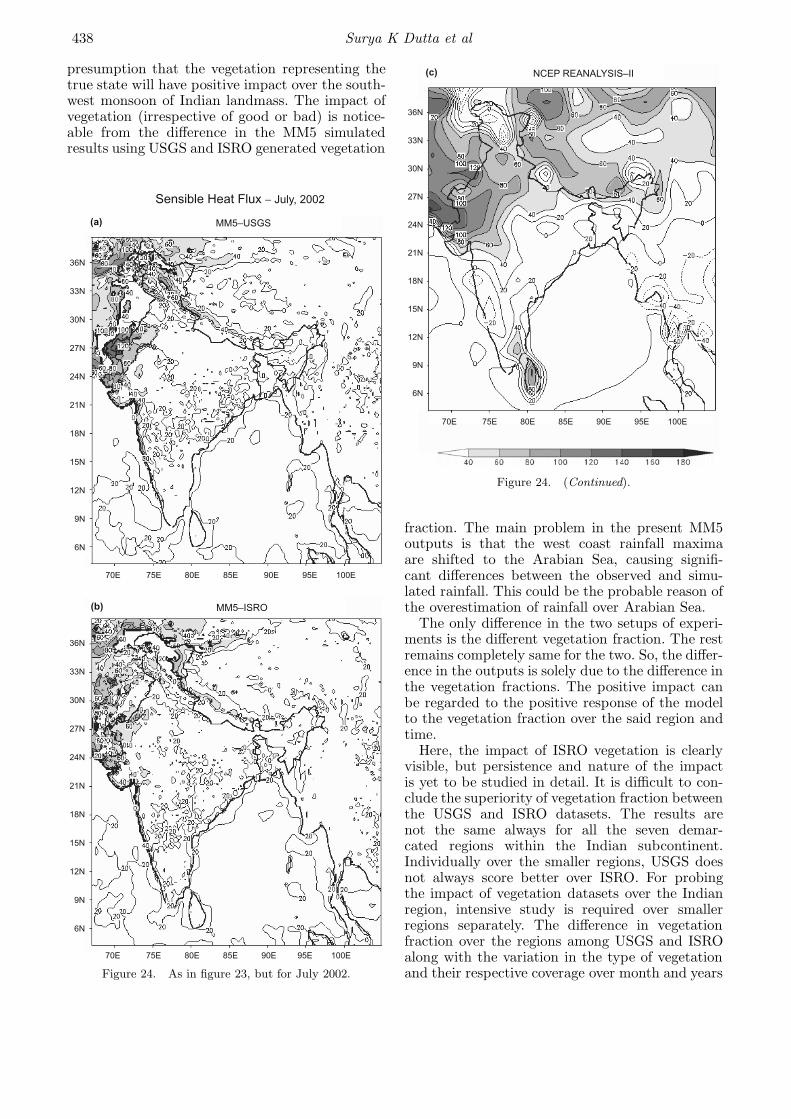
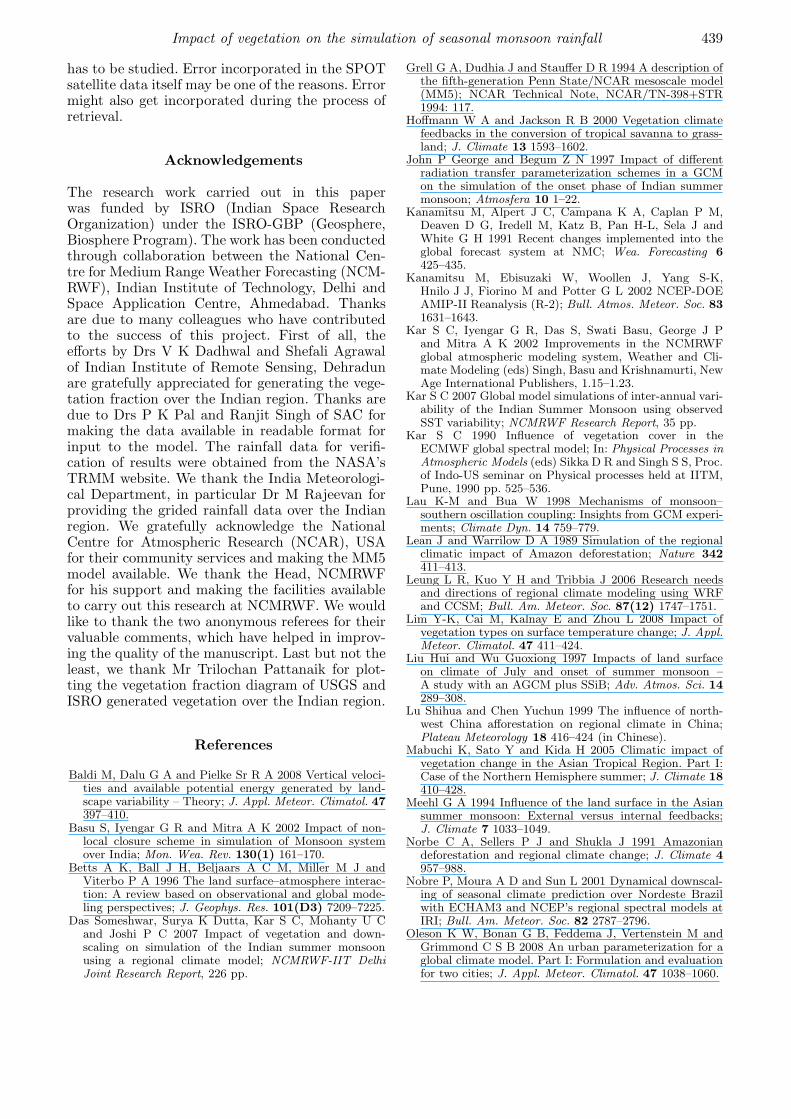
3.3.2 Sensible heat flux
Sensible heat flux is an important parameter char-acterizing the heat budget at the surface. It rep-resents the amount of heat released by the surfaceand thus, also provides a measure of insolation.Sensible heat flux from NCEP reanalysis-II andMM5 simulations are depicted in figures 23 and 24,respectively, for the years 1998 and 2002.
In July 1998, MM5 simulations (figure 23) areunable to produce the negative zones over northIndia, western coast and over the eastern portionof the Indian domain that are seen in the NCEPreanalysis-II. Forecast based on USGS vegetationhas simulated closer to the observation over north-west India. In July 2002 also, MM5 (figure 24) isunable to simulate the negative regions that arepresent in the verification analysis. Over north-west India USGS forecast is closer to observa-tion, while others have highly underestimated thevalues.
4. Concluding remarks
Study of rainfall simulations by MM5 modelusing the USGS and ISRO vegetation show mixedresults. The ISRO vegetation performed betterover northeastern India and along the westerncoast. The MM5-USGS has greater tendency ofoverestimation of rainfall. Among the five years ofstudy, it is seen that the RMSE of July and JJASfor All India rainfall is mostly lower for MM5-ISRO. Also, the bias of July and JJAS for the sameis mostly closer to unity for MM5-ISRO. However,the JJAS total rainfall over north India and Deccancoast is better simulated using the USGS vegeta-tion. The wind fields at 850 hPa and 200 hPa arealso better simulated by MM5 using ISRO vege-tation. The synoptic features like Somali jet andTibetan anticyclone are simulated closer to theverification analysis by MM5-ISRO.
436 Surya K Dutta et al
Figure 22. MM5 simulated 2m air temperature (◦C) averaged for the month of July (a) USGS-1998, (b) ISRO-1998,(c) USGS-2002 and (d) ISRO-2002.

Impact of vegetation on the simulation of seasonal monsoon rainfall 437
The study shows that by changing the type ofvegetation fraction in a mesoscale model, signifi-cant changes in rainfall and wind field simulationsare observed. However, the results do not show
Figure 23. Sensible heat flux (W/m2) for July 1998(a) MM5-USGS, (b) MM5-ISRO and (c) NCEPreanalysis-II.
Figure 23. (Continued).
significant changes in the surface parameters (tem-perature and moisture at 2m above the ground,and the sensible and latent heat fluxes). The 2mair temperature is better simulated by MM5-ISROover the northeastern India, showing greater spa-tial variability over the region. Over northwestIndia, the sensible heat flux simulated by the MM5-USGS is closer to the verification analysis.
Results obtained by Baidya Roy et al (2003)for the US summer climate indicated that landcover changes can impact local precipitation, butnot as significantly as it affects temperature,because US summer rainfall is not largely depen-dent on local land cover and evapo-transpiration.The effects of land cover changes on temperatureare significant because the farmlands tend to createlower temperatures through increased evaporationthan compared to the grasslands, while croplandsare less efficient in transpiration than compared toforest. Both have changed significantly in US since1700. In the present study, the impact of vegetationover the precipitation and wind fields is found tobe more than that over the surface parameters.These studies highlight that the summer rainfallmechanism over US and India and its dependencyover land cover and vegetation fractions are not thesame.
The present study using USGS and ISROgenerated vegetation fraction was made with the
438 Surya K Dutta et al
presumption that the vegetation representing thetrue state will have positive impact over the south-west monsoon of Indian landmass. The impact ofvegetation (irrespective of good or bad) is notice-able from the difference in the MM5 simulatedresults using USGS and ISRO generated vegetation
Figure 24. As in figure 23, but for July 2002.
Figure 24. (Continued).
fraction. The main problem in the present MM5outputs is that the west coast rainfall maximaare shifted to the Arabian Sea, causing signifi-cant differences between the observed and simu-lated rainfall. This could be the probable reason ofthe overestimation of rainfall over Arabian Sea.
The only difference in the two setups of experi-ments is the different vegetation fraction. The restremains completely same for the two. So, the differ-ence in the outputs is solely due to the difference inthe vegetation fractions. The positive impact canbe regarded to the positive response of the modelto the vegetation fraction over the said region andtime.
Here, the impact of ISRO vegetation is clearlyvisible, but persistence and nature of the impactis yet to be studied in detail. It is difficult to con-clude the superiority of vegetation fraction betweenthe USGS and ISRO datasets. The results arenot the same always for all the seven demar-cated regions within the Indian subcontinent.Individually over the smaller regions, USGS doesnot always score better over ISRO. For probingthe impact of vegetation datasets over the Indianregion, intensive study is required over smallerregions separately. The difference in vegetationfraction over the regions among USGS and ISROalong with the variation in the type of vegetationand their respective coverage over month and years
Impact of vegetation on the simulation of seasonal monsoon rainfall 439
has to be studied. Error incorporated in the SPOTsatellite data itself may be one of the reasons. Errormight also get incorporated during the process ofretrieval.
Acknowledgements
The research work carried out in this paperwas funded by ISRO (Indian Space ResearchOrganization) under the ISRO-GBP (Geosphere,Biosphere Program). The work has been conductedthrough collaboration between the National Cen-tre for Medium Range Weather Forecasting (NCM-RWF), Indian Institute of Technology, Delhi andSpace Application Centre, Ahmedabad. Thanksare due to many colleagues who have contributedto the success of this project. First of all, theefforts by Drs V K Dadhwal and Shefali Agrawalof Indian Institute of Remote Sensing, Dehradunare gratefully appreciated for generating the vege-tation fraction over the Indian region. Thanks aredue to Drs P K Pal and Ranjit Singh of SAC formaking the data available in readable format forinput to the model. The rainfall data for verifi-cation of results were obtained from the NASA’sTRMM website. We thank the India Meteorologi-cal Department, in particular Dr M Rajeevan forproviding the grided rainfall data over the Indianregion. We gratefully acknowledge the NationalCentre for Atmospheric Research (NCAR), USAfor their community services and making the MM5model available. We thank the Head, NCMRWFfor his support and making the facilities availableto carry out this research at NCMRWF. We wouldlike to thank the two anonymous referees for theirvaluable comments, which have helped in improv-ing the quality of the manuscript. Last but not theleast, we thank Mr Trilochan Pattanaik for plot-ting the vegetation fraction diagram of USGS andISRO generated vegetation over the Indian region.
References
Baldi M, Dalu G A and Pielke Sr R A 2008 Vertical veloci-ties and available potential energy generated by land-scape variability – Theory; J. Appl. Meteor. Climatol. 47397–410.
Basu S, Iyengar G R and Mitra A K 2002 Impact of non-local closure scheme in simulation of Monsoon systemover India; Mon. Wea. Rev. 130(1) 161–170.
Betts A K, Ball J H, Beljaars A C M, Miller M J andViterbo P A 1996 The land surface–atmosphere interac-tion: A review based on observational and global mode-ling perspectives; J. Geophys. Res. 101(D3) 7209–7225.
Das Someshwar, Surya K Dutta, Kar S C, Mohanty U Cand Joshi P C 2007 Impact of vegetation and down-scaling on simulation of the Indian summer monsoonusing a regional climate model; NCMRWF-IIT DelhiJoint Research Report, 226 pp.
Grell G A, Dudhia J and Stauffer D R 1994 A description ofthe fifth-generation Penn State/NCAR mesoscale model(MM5); NCAR Technical Note, NCAR/TN-398+STR1994: 117.
Hoffmann W A and Jackson R B 2000 Vegetation climatefeedbacks in the conversion of tropical savanna to grass-land; J. Climate 13 1593–1602.
John P George and Begum Z N 1997 Impact of differentradiation transfer parameterization schemes in a GCMon the simulation of the onset phase of Indian summermonsoon; Atmosfera 10 1–22.
Kanamitsu M, Alpert J C, Campana K A, Caplan P M,Deaven D G, Iredell M, Katz B, Pan H-L, Sela J andWhite G H 1991 Recent changes implemented into theglobal forecast system at NMC; Wea. Forecasting 6425–435.
Kanamitsu M, Ebisuzaki W, Woollen J, Yang S-K,Hnilo J J, Fiorino M and Potter G L 2002 NCEP-DOEAMIP-II Reanalysis (R-2); Bull. Atmos. Meteor. Soc. 831631–1643.
Kar S C, Iyengar G R, Das S, Swati Basu, George J Pand Mitra A K 2002 Improvements in the NCMRWFglobal atmospheric modeling system, Weather and Cli-mate Modeling (eds) Singh, Basu and Krishnamurti, NewAge International Publishers, 1.15–1.23.
Kar S C 2007 Global model simulations of inter-annual vari-ability of the Indian Summer Monsoon using observedSST variability; NCMRWF Research Report, 35 pp.
Kar S C 1990 Influence of vegetation cover in theECMWF global spectral model; In: Physical Processes inAtmospheric Models (eds) Sikka D R and Singh S S, Proc.of Indo-US seminar on Physical processes held at IITM,Pune, 1990 pp. 525–536.
Lau K-M and Bua W 1998 Mechanisms of monsoon–southern oscillation coupling: Insights from GCM experi-ments; Climate Dyn. 14 759–779.
Lean J and Warrilow D A 1989 Simulation of the regionalclimatic impact of Amazon deforestation; Nature 342411–413.
Leung L R, Kuo Y H and Tribbia J 2006 Research needsand directions of regional climate modeling using WRFand CCSM; Bull. Am. Meteor. Soc. 87(12) 1747–1751.
Lim Y-K, Cai M, Kalnay E and Zhou L 2008 Impact ofvegetation types on surface temperature change; J. Appl.Meteor. Climatol. 47 411–424.
Liu Hui and Wu Guoxiong 1997 Impacts of land surfaceon climate of July and onset of summer monsoon –A study with an AGCM plus SSiB; Adv. Atmos. Sci. 14289–308.
Lu Shihua and Chen Yuchun 1999 The influence of north-west China afforestation on regional climate in China;Plateau Meteorology 18 416–424 (in Chinese).
Mabuchi K, Sato Y and Kida H 2005 Climatic impact ofvegetation change in the Asian Tropical Region. Part I:Case of the Northern Hemisphere summer; J. Climate 18410–428.
Meehl G A 1994 Influence of the land surface in the Asiansummer monsoon: External versus internal feedbacks;J. Climate 7 1033–1049.
Norbe C A, Sellers P J and Shukla J 1991 Amazoniandeforestation and regional climate change; J. Climate 4957–988.
Nobre P, Moura A D and Sun L 2001 Dynamical downscal-ing of seasonal climate prediction over Nordeste Brazilwith ECHAM3 and NCEP’s regional spectral models atIRI; Bull. Am. Meteor. Soc. 82 2787–2796.
Oleson K W, Bonan G B, Feddema J, Vertenstein M andGrimmond C S B 2008 An urban parameterization for aglobal climate model. Part I: Formulation and evaluationfor two cities; J. Appl. Meteor. Climatol. 47 1038–1060.
440 Surya K Dutta et al
Oza S R, Singh R P and Dadhwal V K 2006 Charac-terization of vegetation fraction estimated using SPOT-VEGETATION NDVI data for regional climate modelingin India; Mausam 57 669–674.
Rao D, Bhaskar V, Karumuri Ashok and Toshio Yamagata2004 A numerical simulation study of the Indian Sum-mer Monsoon of 1994 using NCAR MM5; J. Meteor. Soc.Japan 82(6) 1755–1775.
Rowell D and Blondin C 1990 The influence of soil wet-ness distribution on short-range rainfall forecasting inthe West African Sahel; Quart. J. Roy Meteor. Soc. 1161471–1485.
Sarkar, Sudipta and Menas Kafatos 2004 Interannual vari-ability of vegetation over the Indian sub-continent andits relation to the different meteorological parameters;Remote Sensing of Environment 90 268–280.
Sellars P J and Coauthors 1996 A revised land surface para-meterization (Sib2) for atmospheric GCMs, Part I, Modelformulations; J. Climate 9 676–705.
Shefali A, Joshi P K, Shukla Y and Roy P S 2003SPOT vegetation multi temporal data for classifyingvegetation in south central India; Curr. Sci. 84(11)1440–1448.
Sun Lan, Wu Guoxiong and Sun Shufen 2001 Numeri-cal simulations of land surface processes on climateimplementation of SSiB in IAP/LASG AGCM andits performance; Acta Meteorologica Sinica 15(2)160–177.
Vinodkumar, Chandrasekar A, Alapaty K and Niyogi D2008 The impacts of indirect soil moisture assimilationand direct surface temperature and humidity assimi-lation on a mesoscale model simulation of an Indianmonsoon depression; J. Appl. Meteor. Climatol. 471393–1412.
Webster P J, Magana V, Palmer T N, Shukla J, Tomas R A,Yanai M and Yasunari T 1998 Monsoons: Processes, pre-dictability, and the prospects for prediction; J. Geophys.Res. 103(C7) 14451–14510.
Weiping L I and Yongkang X U E 2005 Numerical simulationof the impact of vegetation index on the inter-annual vari-ation of summer precipitation in the Yellow River basin;Adv. Atmos. Sci. 22(6) 865–876.
Wu Guoxiong, Sun Lan, Liu Yimin, Liu Hui, Sun Shufenand Li Weiping 2002 Impacts of land surface processeson summer climate; Selected Papers of the Fourth Con-ference on East Asia and Western Pacific Meteorologyand Climate (eds) Chang C-P et al, World Scientific,Singapore, 64–76.
Xue Y, Fennessy M and Sellers P 1996 Impact of vegetationproperties on US Summer Weather Prediction. 41pp.Final Published Version: J. Geophys. Res. 101(D3)7419–7430.
Xue Y 1997 Biosphere feedback on regional climate intropical North Africa; Quart. J. Roy. Meteor. Soc. 123B1483–1515.
Xue Y, Juang H-M H, Li W-P, Prince S, De-Fries R, Jiao Yand Vasic R 2004 Role of land surface processes in mon-soon development: East Asia and West Africa; J. Geo-phys. Res. 109 D03105, doi: 10.1029/2003JD003556.
Yang S and Lau K-M 1998 Influences of sea surface tem-perature and ground wetness on Asian summer monsoon;J. Climate 11 3230–3246.
Zeng N, Neelin J D, Lau K M and Tucker C J 1999 Enhance-ment of interdecadal climate variability in the Sahel byvegetation interaction; Science 286 1537–1540.
Zeng Ning and Neelin J D 2000 The role of vegetation cli-mate interaction and interannual variability in shapingthe African savanna; J. Climate 13 2665–2670.
Zeng Qingcun, Dai Yongjiu and Xue Feng 1998 Simulationof the Asian Monsoon by IAP AGCM Coupled with anAdvanced Land Surface Model (IAP94); Adv. Atmos. Sci.15 1–16.
Zheng Yiqun, Qian Yongfu, Miao Manqian, Yu Ge, KongYushou and Zhang Donghua 2002 The effects of vege-tation change on regional climate I: Simulation results;Acta Meteorologica Sinica 60 1–16 (in Chinese).
MS received 13 May 2009; revised 12 June 2009; accepted 15 June 2009