
Interseismic strain accumulation along the western boundary of the Indian subcontinent
14
Interseismic strain accumulation along the western boundary of the Indian subcontinent Walter Szeliga, 1,2 Roger Bilham, 1 Din Mohammad Kakar, 3 and Sarosh H. Lodi 4 Received 1 September 2011; revised 12 June 2012; accepted 20 June 2012; published 8 August 2012. [1] Despite an overall sinistral slip rate of ≈3 cm/yr, few major earthquakes have occurred in the past 200 years along the Chaman fault system, the western boundary of the India Plate with the Eurasia Plate. GPS and InSAR data reported here indicate sinistral shear velocities of 8–17 mm/yr across the westernmost branches of the fault system, suggesting that a significant fraction of the plate boundary slip is distributed in the fold and fault belt to the east. At its southernmost on-land segment (≈26 N), near the triple junction between the Arabia, Eurasia, and India Plates, we find the velocity across the Ornach Nal fault is 15.1 +13.4 +16.9 mm/yr, with a locking depth probably less than 3 km. At latitude 30 N near the town of Chaman, Pakistan, where a M6.5 earthquake occurred in 1892, the velocity is 8.5 +6.8 +10.3 mm/yr and the fault is locked at approximately 3.4 km depth. At latitude 33 N and further north, InSAR data indicate a velocity across the Chaman fault of 16.8 2.7 mm/yr. The width of the plate boundary varies from several km in the south where we observe ≈2 mm/yr of convergence near the westernmost strike-slip faults, to a few hundreds of km in the north where we observe 6–9 mm/yr of convergence, and where the faulting becomes distinctly transpressional. The shallow locking depth along much of the transform system suggests that earthquakes larger than those that have occurred in the historical record would be unexpected, and that the recurrence interval of those earthquakes that have occurred is of the order of one or two centuries, similar in length to the known historical record. Citation: Szeliga, W., R. Bilham, D. M. Kakar, and S. H. Lodi (2012), Interseismic strain accumulation along the western boundary of the Indian subcontinent, J. Geophys. Res., 117, B08404, doi:10.1029/2011JB008822. 1. Introduction [2] The ≈1000-km-long Chaman fault system includes a group of prominent sinistral strike slip fault segments that bound the western edge of the India Plate, and separate it from a southward projecting promontory of the Eurasia Plate to the west [Wellman, 1966]. To the east of these sinistral faults, a complex fold and thrust belt verges eastward implying considerable strain partitioning. The width of these fold belts increases from a few tens of km near the Makran coast in the south, to more than 200 km in the north where the fault strikes veer to the NE. Geological and plate closure estimates suggest sinistral slip across the Chaman fault sys- tem of between 19 and 35 mm/yr over the last 25 Ma [Lawrence and Yeats, 1979]. [3] Three major left-lateral left-stepping faults account for most of the north-south length of the Chaman fault system, the Chaman, Ghazaband, and Ornach-Nal faults (Figure 1). The Chaman fault is the longest of these, extending ≈800 km from 28 N, near the northernmost fold belts of the Makran subduction zone, to 35 N, where the fault branches to the Gardez and Paghman faults to the west and east of Kabul respectively. Despite its considerable length, the only dam- aging earthquake of note to have occurred on the Chaman fault in the past 200 years (1892, M6.5) occurred near the town of Chaman, Pakistan, to which the fault owes its name [Griesbach, 1893]. A major earthquake is inferred to have offset the Paghman fault in 1505 [Ambraseys and Bilham, 2003a, 2003b; Ambraseys and Jackson, 2003]. To the NE of its intersection with the Herat fault, strike slip motion on the Chaman fault system is transferred to the Kunar Valley fault, the location of a major earthquake in 1842 [Baird Smith, 1843; Ambraseys and Douglas, 2004]. [4] Between 27 N and 31 N and starting some 40 km east of the town of Chaman, strike slip deformation is increas- ingly accommodated by the Ghazaband fault. Slip on this fault was responsible for extensive damage to the town of 1 Cooperative Institute for Research in Environmental Sciences and Department of Geological Sciences, University of Colorado at Boulder, Boulder, Colorado, USA. 2 Now at Department of Geological Sciences, Central Washington University, Ellensburg, Washington, USA. 3 Department of Geology, University of Baluchistan, Quetta, Pakistan. 4 Department of Civil Engineering, NED University of Engineering and Technology, Karachi, Pakistan. Corresponding author: W. Szeliga, Department of Geological Sciences, Central Washington University, Ellensburg, WA 98926, USA. ([email protected]) ©2012. American Geophysical Union. All Rights Reserved. 0148-0227/12/2011JB008822 JOURNAL OF GEOPHYSICAL RESEARCH, VOL. 117, B08404, doi:10.1029/2011JB008822, 2012 B08404 1 of 14
-
Upload
independent -
Category
Documents
-
view
2 -
download
0
Transcript of Interseismic strain accumulation along the western boundary of the Indian subcontinent

Interseismic strain accumulation along the western boundaryof the Indian subcontinent
Walter Szeliga,1,2 Roger Bilham,1 Din Mohammad Kakar,3 and Sarosh H. Lodi4
Received 1 September 2011; revised 12 June 2012; accepted 20 June 2012; published 8 August 2012.
[1] Despite an overall sinistral slip rate of ≈3 cm/yr, few major earthquakes haveoccurred in the past 200 years along the Chaman fault system, the western boundary ofthe India Plate with the Eurasia Plate. GPS and InSAR data reported here indicatesinistral shear velocities of 8–17 mm/yr across the westernmost branches of the faultsystem, suggesting that a significant fraction of the plate boundary slip is distributed inthe fold and fault belt to the east. At its southernmost on-land segment (≈26�N), nearthe triple junction between the Arabia, Eurasia, and India Plates, we find the velocityacross the Ornach Nal fault is 15.1+13.4
+16.9 mm/yr, with a locking depth probably less than3 km. At latitude 30�N near the town of Chaman, Pakistan, where a M6.5 earthquakeoccurred in 1892, the velocity is 8.5+6.8
+10.3 mm/yr and the fault is locked at approximately3.4 km depth. At latitude 33�N and further north, InSAR data indicate a velocity acrossthe Chaman fault of 16.8 � 2.7 mm/yr. The width of the plate boundary varies fromseveral km in the south where we observe ≈2 mm/yr of convergence near thewesternmost strike-slip faults, to a few hundreds of km in the north where we observe6–9 mm/yr of convergence, and where the faulting becomes distinctly transpressional.The shallow locking depth along much of the transform system suggests thatearthquakes larger than those that have occurred in the historical record would beunexpected, and that the recurrence interval of those earthquakes that have occurred isof the order of one or two centuries, similar in length to the known historical record.
Citation: Szeliga, W., R. Bilham, D. M. Kakar, and S. H. Lodi (2012), Interseismic strain accumulation along the westernboundary of the Indian subcontinent, J. Geophys. Res., 117, B08404, doi:10.1029/2011JB008822.
1. Introduction
[2] The ≈1000-km-long Chaman fault system includes agroup of prominent sinistral strike slip fault segments thatbound the western edge of the India Plate, and separate itfrom a southward projecting promontory of the Eurasia Plateto the west [Wellman, 1966]. To the east of these sinistralfaults, a complex fold and thrust belt verges eastwardimplying considerable strain partitioning. The width of thesefold belts increases from a few tens of km near the Makrancoast in the south, to more than 200 km in the north wherethe fault strikes veer to the NE. Geological and plate closure
estimates suggest sinistral slip across the Chaman fault sys-tem of between 19 and 35 mm/yr over the last 25 Ma[Lawrence and Yeats, 1979].[3] Three major left-lateral left-stepping faults account for
most of the north-south length of the Chaman fault system,the Chaman, Ghazaband, and Ornach-Nal faults (Figure 1).The Chaman fault is the longest of these, extending ≈800 kmfrom 28�N, near the northernmost fold belts of the Makransubduction zone, to 35�N, where the fault branches to theGardez and Paghman faults to the west and east of Kabulrespectively. Despite its considerable length, the only dam-aging earthquake of note to have occurred on the Chamanfault in the past 200 years (1892, M6.5) occurred near thetown of Chaman, Pakistan, to which the fault owes its name[Griesbach, 1893]. A major earthquake is inferred to haveoffset the Paghman fault in 1505 [Ambraseys and Bilham,2003a, 2003b; Ambraseys and Jackson, 2003]. To the NEof its intersection with the Herat fault, strike slip motion onthe Chaman fault system is transferred to the Kunar Valleyfault, the location of a major earthquake in 1842 [BairdSmith, 1843; Ambraseys and Douglas, 2004].[4] Between 27�N and 31�N and starting some 40 km east
of the town of Chaman, strike slip deformation is increas-ingly accommodated by the Ghazaband fault. Slip on thisfault was responsible for extensive damage to the town of
1Cooperative Institute for Research in Environmental Sciences andDepartment of Geological Sciences, University of Colorado at Boulder,Boulder, Colorado, USA.
2Now at Department of Geological Sciences, Central WashingtonUniversity, Ellensburg, Washington, USA.
3Department of Geology, University of Baluchistan, Quetta, Pakistan.4Department of Civil Engineering, NED University of Engineering and
Technology, Karachi, Pakistan.
Corresponding author: W. Szeliga, Department of Geological Sciences,Central Washington University, Ellensburg, WA 98926, USA.([email protected])
©2012. American Geophysical Union. All Rights Reserved.0148-0227/12/2011JB008822
JOURNAL OF GEOPHYSICAL RESEARCH, VOL. 117, B08404, doi:10.1029/2011JB008822, 2012
B08404 1 of 14

Quetta in an M7.7 earthquake in 1935 [Cox et al., 1936;Skrine, 1936; Ramanathan and Mukherji, 1938; Pinhey,1938]. Between 25.5�N and 28�N, strike-slip motion islargely accommodated by the ≈250 km long Ornach Nalfault, upon which no major earthquake is known of haveoccurred in the historical record. The Ornach Nal fault canbe traced southwards along the western edge of the Som-niani depression toward an offshore triple junction betweenthe Arabia, India and Eurasia Plates.[5] Few details of earthquakes in the region are available
prior to 1800, but it is clear that those major earthquakes thathave been observed have ubiquitously ruptured differentsegments of the plate boundary. Hence, the earthquake cyclealong the Chaman fault is far longer than that reliablyrecorded by the historical record. As a result, we do notknow whether significantly large earthquakes than the 1935Quetta M7.7 may occur along the India plate’s westerntransform system, and we are uncertain of the recurrenceinterval of those major earthquakes that have occurred. Insuch circumstances, the geodetic loading rate of the majorfaults can provide guidance to the tectonic loading rate ofeach of the faults. However, although several triangulationlines cross the strike-slip faults and the fold and thrust beltsthat flank them to the east, none have been remeasured sincetheir initial measurements at the turn of the 20th century[Ambraseys and Bilham, 2003b].[6] The measurements presented here thus provide a first
glimpse of the loading rate and locking depths of some of the
major faults of the Chaman fault system. We analyze datafrom two campaign GPS transects at 27�N and 30�N andseveral continuous GPS station on the stable India Plate inPakistan. Between 31–32�N, we utilize nearly 4.5 years ofInSAR data to produce a fault centered transect of inter-seismic deformation rate. In all three locations we findlocking depths to be shallow. The absence of GPS data to thesouth of Chaman west or east of the Ghazaband fault hindersour ability to estimate interseismic deformation rates acrossthe causal fault of the 1935 Quetta earthquake.
2. Tectonic Summary
[7] The Ornach-Nal fault is the southernmost on-landsegment of the Chaman Fault System (Figure 1) [Zaigham,1991; Lawrence et al., 1992]. Running nearly 250 kmnorth from the Makran Coast, the Ornach-Nal Fault offsetsprimarily Cenozoic mudstones and shales [Snead, 1964;Zaigham, 1991; Lawrence et al., 1992]. The lack of detailedfield mapping in this region, combined with the monotony ofthe mudstones and shales have made estimates of the totaloffset across the Ornach-Nal fault impossible.[8] At the northern terminus of the Ornach-Nal fault,
deformation likely steps westward onto the Ghazaband Fault(Figure 1). Although no modern geodetic measurementsexists across this segment of the Chaman Fault System, theGhazaband fault is a likely candidate for the source of the1935 Quetta earthquake (�M 7.5) which caused surfacecracking and extensive damage in the populated valleyssouth of Quetta and approximately 15 km east of the Gha-zaband Fault [Ramanathan and Mukherji, 1938; Engdahland Villasenor, 2002]. The Ghazaband Fault continuesnorthward to the town of Pishin where it disappears into thesouthern end of the seismically quiet Katawaz Block [Haqand Davis, 1997] (Figure 2a).[9] South of the village of Nushki, Pakistan, the arcuate
thrust faults of the Makran merge to form the N-S trendingChaman Fault (Figure 1). The Chaman Fault and GhazabandFault parallel each other northwards to the latitude of thetown of Chaman, Pakistan. Immediately north of the town ofChaman, the Chaman fault proper veers NNE, entersAfghanistan and becomes the dominant fault in the ChamanFault System.[10] Lawrence et al. [1992] estimate the onset of faulting
along the Chaman Fault System as Oligocene-Miocenebased on post-depositional offsets of the Eocene-Oligoceneaged Khojak flysch. These displacements suggest an averageslip-rate of 19–24 mm/yr over the last 20–25 My. Similarly,correlation of Pliocene volcanic units that straddle the faultnorth of Ab-e-Istada, Afghanistan, yields an average slip-rate of 25–35 mm/yr over the last 2 My [Beun et al., 1979].[11] Kinematic and analogue modeling of the western
boundary of the India plate indicates that pure strike-slipmotion is required along the Chaman fault with shorteningbeing accommodated in the Sulaiman Lobe and Kirtharranges to the east of the Chamanfault [Haq and Davis, 1997;Bernard et al., 2000]. Estimates of modern plate motionindicate convergence of the India plate relative to Eurasia ata rate of 30 mm/yr at N9E near Sukkur, Pakistan (27.69N,68.84E) [Altamimi et al., 2011a]. We estimate the amount ofsinistral slip along the Chaman Fault by noting that its strikebetween Chaman and Ab-e-Istada is approximately N34E,
Figure 1. Map of the western boundary of the India Platehighlighting the major faults of the Chaman Fault System;place names mentioned in the text are also indicated. Themap projection is oblique Mercator about the pole of relativemotion between the India and Eurasia plates. Thrust faultsare shown with filled triangles on the hanging wall; all otherfaults shown are strike slip.
SZELIGA ET AL.: CHAMAN INTERSEISMIC DEFORMATION B08404B08404
2 of 14

suggesting approximately 27 mm/yr of sinistral motion and13 mm/yr of shortening are being accommodated across theChaman Fault System.[12] At least four strike-slip earthquakes with M > 6 have
been recorded historically on the Chaman Fault (Figure 2b).In 1505, a strike-slip event along the Chaman fault occurredwest of Kabul [Oldham, 1883; Babur, 1912; Lawrenceet al., 1992; Ambraseys and Bilham, 2003a], in 1892, anM 6.5 strike-slip event occurred near the city of Chaman[Griesbach, 1893; Ambraseys and Bilham, 2003a], in 1975an MS 6.7 occurred mid-way between Chaman and Nushki[Lawrence and Yeats, 1979; Engdahl and Villasenor, 2002]and in 1978 an Mw 6.1 occurred north of Nushki, Pakistan[Yeats et al., 1979; Engdahl and Villasenor, 2002]. Recentseismicity along the fault appears to consist mostly of small,M 3–5, earthquakes primarily located in regions of majorhistorical seismicity (Figure 2a). However, due to the lack ofseismic instrumentation in the region, most earthquakesoccurring in the Chaman Fault System are poorly located.[13] Earthquakes along the Chaman Fault appear to con-
sistently rupture to the surface. The 1505 earthquake nearKabul was noted to have surface rupture [Oldham, 1883;Babur, 1912], while surface rupture from the 1892 Chaman,Pakistan, earthquake offset railroad tracks crossing the faultby 0.75 m [photograph and diagram in] [Griesbach, 1893].
Surface rupture along the Chaman Fault from the 1892earthquake was estimated to extend for at least 60 km withits northernmost mapped extent lying near the town ofChaman, Pakistan [Griesbach, 1893; Landor, 1902]. Due toits remote location, it is unknown whether the 1975 MS 6.7Chaman Fault earthquake between Nushki, Pakistan, andChaman, Pakistan, produced significant surface rupture.Finally, field investigations by Yeats et al. [1979] indicatethat the 16 Mar. 1978 Mw 6.1 near Nushki, Pakistan, alsoruptured to the surface.[14] Northward, from the 1892 Chaman rupture to the
southern terminus of the 1505 rupture, no major historicalearthquakes are noted. A more thorough analysis of thisobservation using seismic moment release along the Chamanfault system over the last 150 years, led both Bernard et al.[2000] and Ambraseys and Bilham [2003a] to argue that asignificant slip deficit exists along the Chaman fault, par-ticularly north of �31� latitude.
3. Methods
3.1. Introduction
[15] The relative absence of seismotectonic analyses of theChaman Fault System compared with other major transformsystems around the globe leaves many fundamental
Figure 2. Seismicity and locations of historical fault rupture along the western boundary of the IndiaPlate. The dashed line represents the boundary of the Katawaz Block of Haq and Davis [1997]. (a) Earth-quake locations from 1964–2010 from the ISC catalog and moment tensors from 1976–2010 from theGlobal CMT Project. Filled segments of the moment tensors represent the compressional quadrants forthe best fitting double-couple. (b) Approximate rupture lengths for major historical strike-slip earthquakeslisted in Wells and Coppersmith [1994] using published estimates of magnitude. The 375 km segmentbetween the 1892 Chaman earthquake and the 1505 Kabul earthquake has no known major historical seis-micity. The 1842 Jalalabad earthquake [Szeliga et al., 2010] was likely a thrust faulting earthquake and isshown for completeness.
SZELIGA ET AL.: CHAMAN INTERSEISMIC DEFORMATION B08404B08404
3 of 14
questions unanswered. The harsh landscape and generaldifficulty of access to the region can make even basicfieldwork problematic. Yet, the ideal natural laboratoryafforded by the Chaman Fault System makes it an impor-tant location to test hypotheses based on other transformboundaries. This difficulty in accessing the region suggeststhat research using remote sensing techniques are likely tobe most successful.[16] In this study, we utilize various geodetic measure-
ments to quantify and elucidate tectonic processes along thewestern boundary of the India Plate. Each of these variousmeasurement techniques provides knowledge of differenttemporal and spatial aspects of the seismic cycle.[17] In order to examine patterns in seismicity over the
longest temporal span, previous authors have used non-instrumental analysis techniques, mainly archival reports ofshaking and destruction caused by large earthquakes[Ambraseys and Bilham, 2003a, 2003b; Szeliga et al., 2010].With certain caveats, these macroseismic data may be ana-lyzed to provide coarse resolution of epicentral location andmagnitude and thus act as a rough estimate for regionalstrain rates.[18] Geodetic data in the form of direct surface height
measurements and horizontal distances may be obtainedusing spirit-leveling and triangulation. These data, first col-lected on the Indian subcontinent during the late 19th cen-tury [Ambraseys and Bilham, 2003b], provide constraints ongeoid height and baseline length along a transect, and, whencombined with prior observations, differential positions. Theeffort involved in collecting both triangulation and spirit-leveling data with a high temporal resolution results ininfrequent reoccupation of benchmarks with detailed spatialcoverage over limited areas (typically <1 km transects).Unfortunately, triangulation networks that cross the ChamanFault System have never been remeasured [Ambraseys andBilham, 2003b]. Modern estimates of height are routinelymeasured along with high precision location estimates usingGPS receivers. When continuously operated from a perma-nent stable benchmark, relative positions may be obtained toan accuracy of 2–5 mm horizontally and 6–15 mm in height[Segall and Davis, 1997]. While continuously operatingGPS stations provide a vast improvement over spirit-levelingand triangulation in the temporal domain, they suffer in thespatial domain in being essentially point measurements andare often separated by large distances (20–200 km). SyntheticAperture Radar (SAR) data provide dense spatial coverage atthe expense of temporal resolution for geodetic applications.Interferometric SAR (InSAR), produced by differencing twoSAR scenes, provides information about the relative motionof the ground when the SAR scenes are obtained at dif-ferent times from similar vantage points. Deformation dataobtained by any single InSAR image provides spatiallydense measurements of only one component of deforma-tion, and can limit the capability of using InSAR alone tofully describe a deformation field [Bürgmann et al., 2000].However, this high spatial density of deformation infor-mation at low temporal sampling complements GPS posi-tioning data. Although it is possible to translate measuredphase differences from an InSAR image to mm precisionline-of-sight measurements, the relationship between phasemeasurement and ground deformation is dependent on the
atmospheric conditions along the line-of-sight during theacquisition of each SAR scene [Massonnet and Feigl, 1995].These caveats require the use of multiple InSAR scenes tohelp discriminate between ground deformation and atmo-spheric signals. In general, fault azimuths in Chaman FaultSystem south of Chaman, Pakistan, are incompatible with theorbits of current SAR satellites, providing little or no defor-mation-resolving power in their along strike direction.However, the change in fault strike north of Chaman, Pakistan,combined with the arid climate and general lack of vegetationin the region makes this location desirable for study usingInSAR.
3.2. GPS
[19] GPS measurements in Pakistan are historically oflimited coverage and duration with no known measurementsprior to 2001. Campaign measurements from 7 sites withlocations predominantly north of Quetta as well as 5 sites insouthern Baluchistan province, have been measured at leasttwice in the period 2006–2012 and compared to continuousmeasurements made at 23 IGS regional station, plus stationsin Karachi (KCHI), Sukkur (SIBA), and Quetta (QTAG andQTIT) (Figure 3 and Table 1).[20] The location of campaign GPS measurements across
both the Chaman and Ornach-Nal faults are constrained bythe location of major roads to provide security and ease ofaccess. The continuous points in Pakistan are operated fromflat-roofed concrete frame buildings and the campaignpoints are measured on bipods set on stainless steel screwscemented into exposed bedrock. GPS observations wererecorded with Trimble NetRS, 5700 and R7 receivers usinga 30 s sampling rate, and processed using an elevation cutoffangle of 10�. Campaign data have durations of 3–7 days peroccupation from each site.[21] Our GPS data analysis methodology is as follows,
first, we use daily GPS phase observations to estimate stationposition and atmospheric delay while holding IGS finalorbits fixed to produce loosely constrained estimates of sta-tion positions and covariances using GAMIT version 10.40[Herring et al., 2010a]. These loosely constrained estimatesof station positions and covariances are then used as input toGLOBK version 5.19 [Herring et al., 2010b] to estimate aconsistent set of station coordinates and velocities. We tie ourregional measurements to an external global reference frameby simultaneously processing phase data from 23 IGS sta-tions, evenly distributed in azimuth relative to our network.[22] To account for correlated noise in our measurements,
we estimate parameters for a first-order Gauss Markov pro-cess noise from each time series using the “real sigma”method [Herring, 2003; Reilinger et al., 2006]. These first-order Gauss-Markov parameters can then be used to for-mulate an equivalent random walk process noise model to beused in a final run of the GLOBK Kalman filter. This finalGLOBK run produces a station velocity solution with real-istic uncertainty estimates.[23] Comparison of the uncertainty estimates from
GLOBK using the above procedures with the results ofanalysis of select time series using CATS [Williams, 2008]yields similar results.[24] We realize the ITRF2008 reference frame by mini-
mizing the difference between the positions and velocities
SZELIGA ET AL.: CHAMAN INTERSEISMIC DEFORMATION B08404B08404
4 of 14

of our 23 processed IGS stations with those published inAltamimi et al. [2011b], resulting in a post-fit RMS of1.29 mm in position and 0.54 mm/yr in velocity. We thenrotate our station velocities into an India plate fixed ref-erence frame using the pole-of-rotation parameters pub-lished in Altamimi et al. [2011a].
3.3. InSAR
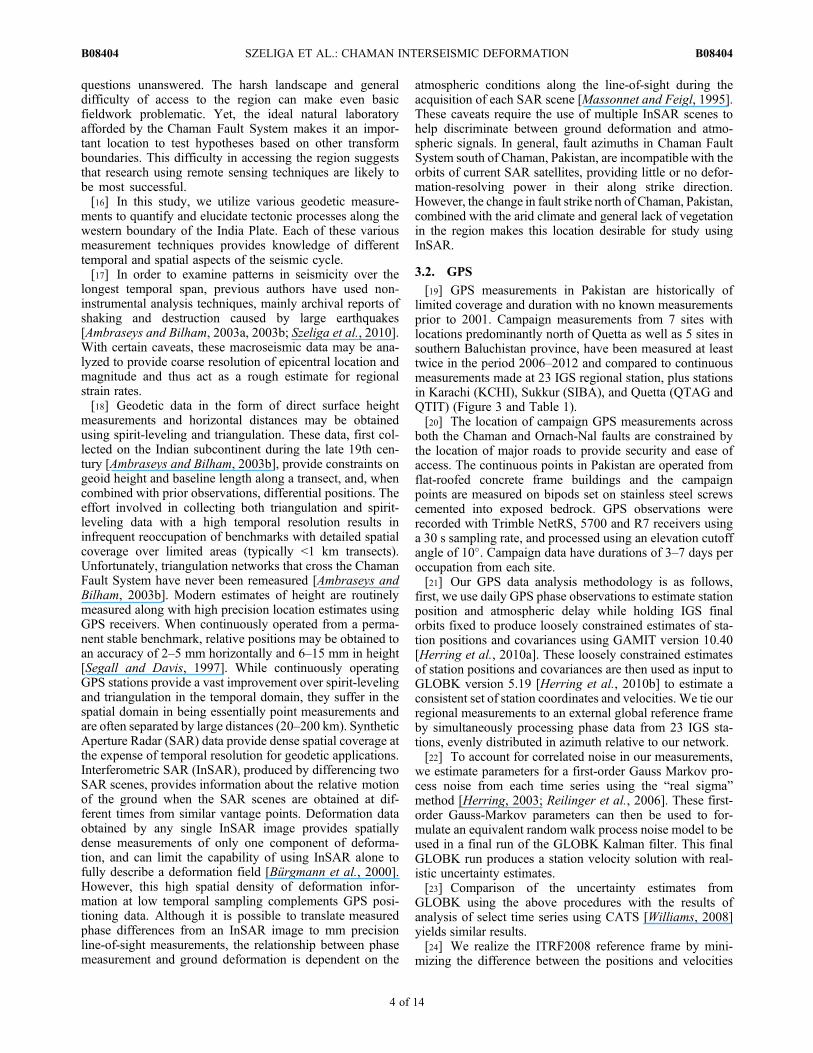
[25] We acquired 27 ascending pass SAR scenes span-ning nearly 4.5 years from track 213 frame 621 of theEuropean Space Agency’s Envisat satellite (Figures 3a and4). A 90 meter resolution DEM was constructed fromSRTM version 2 data [Farr et al., 2007] and used to removetopographic fringes. Interferograms were produced using the
ROI_PAC InSAR software package developed at the JetPropulsion Laboratory in Pasadena, CA [Rosen et al., 2004].Interferograms were sampled with 8 looks in range and 40looks in azimuth to produce 160 m � 160 m resolution cells,filtered using a power spectral method [Goldstein andWerner, 1998] and unwrapped using a least squares meth-odology [Goldstein et al., 1988].[26] Scene selection was guided by visual inspection of
interferograms and application of pair-wise logic [Massonnetand Feigl, 1995]. From the set of 27 ascending pass scenes,we select 12 SAR image pairs that minimize both temporaland spatial baselines while avoiding scenes that are visuallyimpacted by atmospheric noise (Figure 4). These 12 scenes arethen used to form a rate-map using the iterative methodology
Table 1. GPS Velocities Relative to the Stable India Plate as Defined by Altamimi et al. [2011a]a
Site Longitude Latitude Occupations Time SpanE Velocity(mm yr�1)
E Sigma(mm yr�1)
N Velocity(mm yr�1)
N Sigma(mm yr�1) Rho
PANG 64.11 26.98 2 2008.4–2010.1 �3.5 0.8 �23.8 0.7 0.039BEDI 65.23 26.45 2 2008.6–2010.0 �0.6 1.3 �14.2 1.2 �0.054ZHAO 65.61 26.39 2 2008.5–2010.0 0.2 0.8 �13.2 0.8 0.027LAKC 66.22 26.20 3 2006.0–2008.3 �0.7 0.5 1.5 0.5 0.012CHMC 66.45 30.91 4 2007.1–2012.2 �3.1 0.3 �20.8 0.2 0.007SHBG 66.59 30.83 3 2007.1–2008.8 0.5 0.9 �15.4 0.9 �0.015SHFD 66.13 26.18 2 2008.4–2009.6 0.3 0.8 �1.9 0.7 0.017QILA 66.66 30.73 4 2007.1–2012.2 �1.8 0.3 �15.3 0.3 0.021LAKP 66.89 30.00 3 2008.6–2009.7 �4.9 3.2 �12.7 2.7 �0.022SARN 66.87 30.57 6 2007.1–2012.2 �3.6 0.3 �13.6 0.3 0.007QTIT 66.99 30.16 c 2008.6–2012.2 �11.1 0.3 �19.0 0.2 0.002QTAG 66.99 30.17 c 2006.5–2008.7 �5.8 1.1 �7.7 0.3 0.001SURB 67.16 30.57 5 2007.1–2011.0 �12.7 0.4 �11.3 0.3 0.023KCHI 67.11 24.93 c 2006.0–2012.2 �1.4 0.1 1.2 0.1 �0.001KACH 67.29 30.44 5 2007.1–2012.2 �1.1 0.5 �7.9 0.5 0.044SURB 67.16 30.57 5 2007.1–2011.0 �6.5 0.5 �12.6 0.5 0.036SIBA 68.82 27.73 c 2008.4–2012.2 �1.8 0.1 1.2 0.1 0.001KBUL 69.13 34.57 2 2006.2–2008.2 0.9 0.3 �20.6 0.4 0.034NCEG 71.49 34.00 c 2001.2–2012.2 �1.5 0.1 �3.4 0.3 0.000
aContinuous GPS stations are denoted by a “c” in the occupations column.
Figure 3. Map showing GPS station locations and names along the western boundary of the IndiaPlate. Continuous GPS stations are indicated by a square, campaign GPS stations are shown as circles.(a) GPS stations throughout Pakistan. Dashed rectangle indicates the ground footprint of Envisat track213 frame 621. (b) Stations in the Quetta Syntaxis where there is a high station density. (c) Stationsalong the Makran Coast.
SZELIGA ET AL.: CHAMAN INTERSEISMIC DEFORMATION B08404B08404
5 of 14
outlined in Biggs et al. [2007]. Formation of the rate-maputilizes a pixel-based weighted least squares approach with avariance-covariance matrix that accounts for estimates ofatmospheric phase delay and orbital uncertainty from eachinterferogram.[27] To estimate variance-covariance parameters for errors
due to atmospheric phase delay, we analyze a 48 � 48 kmregion from the tectonically quiet, southeastern corner ofeach interferogram. We determine a best fit 1-D covariancefunction of the form
c rð Þ ¼ s2atme
�arð Þ; ð1Þ
where satm2 is the variance, r is the distance between pixels
and a is the e-folding length. Parameters in equation (1) areestimated from the radially averaged 2-D autocovariancefunction calculated using the cosine Fourier transform of thepower spectrum [Hanssen, 2001; Parsons et al., 2006]. Theestimated atmospheric variance (satm
2 ) and e-folding length(a) are then used to weight pixels in each interferogramduring formation of the rate-map.[28] Although we use ROI_PAC to remove the effects of
baseline separation by approximating the earth as a smoothellipsoid, imperfect knowledge of the satellite’s orbit occa-sionally results in apparent deformation in the form of aresidual tilt spanning the InSAR scene. Since the interseismicdeformation signal sought is inherently long-wavelength,estimating the residual orbital correction by simply removinga best fitting plane of the form
z ¼ uxþ vyþ w; ð2Þ
where x and y are, respectively, the across-track and along-track directions in radar coordinates and u, v and w are the
unknowns to be estimated, would result in the removal of aportion of the tectonic signal. To minimize this effect, weestimate orbital corrections using equation (2) from regionsas far from the expected deformation signal as possible bymasking out a swath 50 km wide, centered on the fault. Wethen calculate variance-covariance parameters for uncer-tainty in the orbital correction using the standard deviation ofthe parameters estimated in equation (2). Residual orbitalparameters for our 12 scenes are consistent with results inBiggs et al. [2007] of between 0.5 and 1.5 fringes per frame.
4. Results
4.1. Ornach-Nal
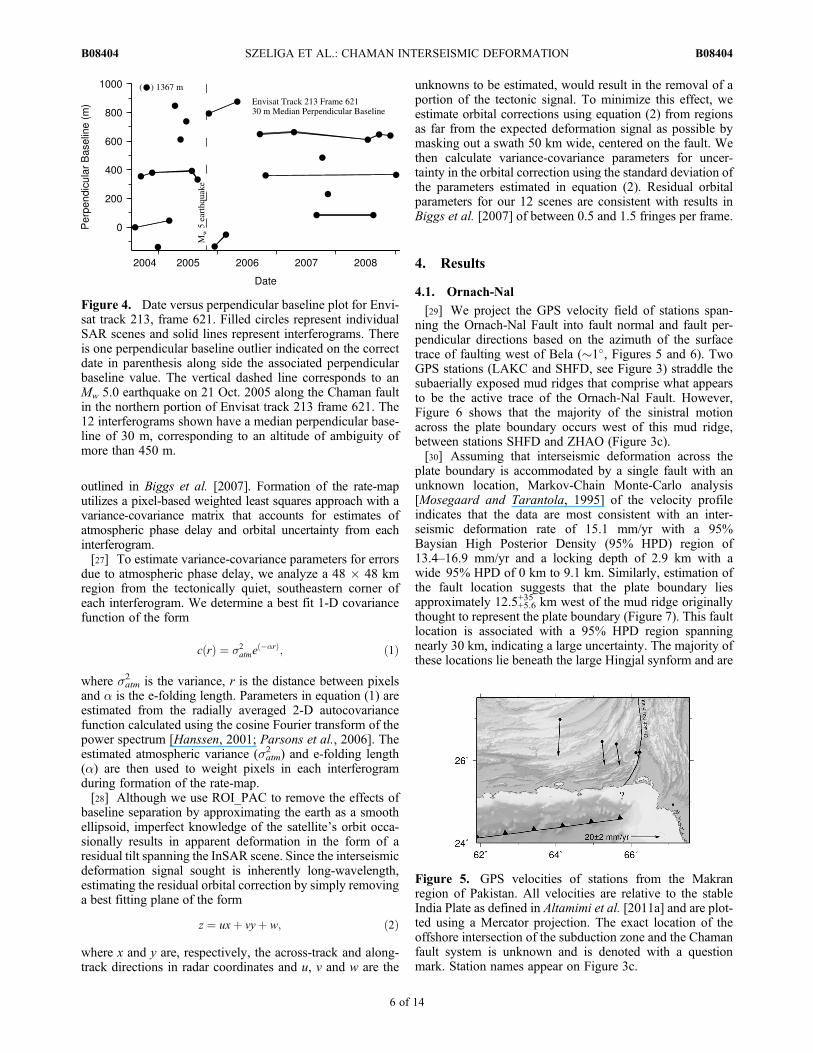
[29] We project the GPS velocity field of stations span-ning the Ornach-Nal Fault into fault normal and fault per-pendicular directions based on the azimuth of the surfacetrace of faulting west of Bela (�1�, Figures 5 and 6). TwoGPS stations (LAKC and SHFD, see Figure 3) straddle thesubaerially exposed mud ridges that comprise what appearsto be the active trace of the Ornach-Nal Fault. However,Figure 6 shows that the majority of the sinistral motionacross the plate boundary occurs west of this mud ridge,between stations SHFD and ZHAO (Figure 3c).[30] Assuming that interseismic deformation across the
plate boundary is accommodated by a single fault with anunknown location, Markov-Chain Monte-Carlo analysis[Mosegaard and Tarantola, 1995] of the velocity profileindicates that the data are most consistent with an inter-seismic deformation rate of 15.1 mm/yr with a 95%Baysian High Posterior Density (95% HPD) region of13.4–16.9 mm/yr and a locking depth of 2.9 km with awide 95% HPD of 0 km to 9.1 km. Similarly, estimation ofthe fault location suggests that the plate boundary liesapproximately 12.5+5.6
+35 km west of the mud ridge originallythought to represent the plate boundary (Figure 7). This faultlocation is associated with a 95% HPD region spanningnearly 30 km, indicating a large uncertainty. The majority ofthese locations lie beneath the large Hingjal synform and are
Figure 4. Date versus perpendicular baseline plot for Envi-sat track 213, frame 621. Filled circles represent individualSAR scenes and solid lines represent interferograms. Thereis one perpendicular baseline outlier indicated on the correctdate in parenthesis along side the associated perpendicularbaseline value. The vertical dashed line corresponds to anMw 5.0 earthquake on 21 Oct. 2005 along the Chaman faultin the northern portion of Envisat track 213 frame 621. The12 interferograms shown have a median perpendicular base-line of 30 m, corresponding to an altitude of ambiguity ofmore than 450 m.
Figure 5. GPS velocities of stations from the Makranregion of Pakistan. All velocities are relative to the stableIndia Plate as defined in Altamimi et al. [2011a] and are plot-ted using a Mercator projection. The exact location of theoffshore intersection of the subduction zone and the Chamanfault system is unknown and is denoted with a questionmark. Station names appear on Figure 3c.
SZELIGA ET AL.: CHAMAN INTERSEISMIC DEFORMATION B08404B08404
6 of 14

consistent with lineations extending north and south of thesynform (Figure 7).[31] Previous authors have suggested that the mud ridges
west of Bela are eruptive features [Jones, 1961; Bannertet al., 1992]. However, reanalysis of outcrop lithologyby Delisle et al. [2002] as part of a systematic study onmud volcanism in Pakistan indicates that the mud ridge(Figure 7) is actually an outcrop of Parkini mudstoneexposed in the core of an anticline, in stratigraphic sequence,and not part of an eruptive feature. The Parkini mudstone isthe source material for mud erupted from mud volcanoesfarther south and west of Bela.[32] The velocity of the site at Panjgur, Pakistan (PANG),
is nearly 82% of the expected ITRF2008 rate [Altamimiet al., 2011a]. This observation combined with the lowvelocities of both SHFD and LAKC relative to the stableIndia Plate suggests that the remaining plate boundarydeformation occurs across faults on the Eurasian side of theplate boundary. It is also notable that the Ornach-Nal parallelvelocity of the site in Panjgur (PANG, Figures 3 and 6) is10.0� 0.72 mm/yr faster than the expected far-field velocitydue solely to slip on the Ornach-Nal fault. This disagreementis likely due to unmodeled convergence along the arcuatefaults that comprise the subaerial Makran forearc betweenBedi and Panjgur, Pakistan (GPS stations BEDI and PANG).[33] The resolved fault normal motion in Figure 5 shows
convergence along the line of the section at <2 mm/yr. Thesubsurface strike of the active Ornach-Nal Fault, however, isnot resolved by our sparse geodetic data. Assuming the faultconsists of a pair of NNE trending, left-stepping en-echelonsinistral faults, as suggested by surface morphology, and thelocal synthetic slip vector of the India plate as defined by theITRF2008 velocity field [Altamimi et al., 2011a] wouldresult in fault normal convergence of �10 mm/yr.
Figure 6. GPS profile across the Ornach-Nal Fault. Veloc-ities and uncertainties are projected into a direction parallelto the Ornach-Nal Fault and are relative to the stable IndiaPlate. Uncertainties shown are 2s. The thick horizontal barindicates the 95% HPD range for possible fault locations.The dotted line represents the model that maximizes theempirical posterior likelihood function as determined usinga Markov-Chain Monte Carlo method [Mosegaard andTarantola, 1995]. The slip rate and locking depth for thefault location that satisfies both the posterior likelihood andgeological criteria (the nominal plate boundary) are indi-cated on the figure.
Figure 7. Landsat 7 image of the southern Ornach Nal fault and adjacent Hinglaj synform. The largesquare brackets indicate the spatial region encompassed by the 95% HPD region shown in Figure 6.NNE trending dashed lines follow surface lineations aligned with surface morphology and mud volcanoes.The region between the fault tips corresponds to the deepest part of the synform [Bannert et al., 1992] con-sistent with a sinistral pull apart structure. GPS velocities are relative to the stable India Plate and are iden-tical to those shown in Figure 5. The image is a combination of bands 7, 4 and 2 to highlight geologicalinformation.
SZELIGA ET AL.: CHAMAN INTERSEISMIC DEFORMATION B08404B08404
7 of 14

4.2. Chaman Fault Near Chaman
[34] We project the GPS velocity field of stations north ofQuetta, Pakistan, onto a Chaman Fault perpendicular profile(108.5�) and calculate both fault-parallel and fault-normalvelocities (Figures 8 and 9). The location of the profile atthis latitude samples the surface deformation field near theintersection of the east-verging folds of the Kirthar Rangeand the SE verging folds of the Sulaiman Lobe, close to the20 degree restraining bend in the Chaman Fault, complicat-ing the velocity field. On Figure 9, a step in the velocityprofile, consistent with sinistral motion, is evident betweenstations CHMC and SHBG, which we interpret to be theresult of aseismic shear at depth beneath the Chaman Fault ata rate of 8.5 mm/yr (95% HPD range of 6.8–10.3 mm/yr)with a shallow locking depth (3.4 km with a 95% HPD rangeof 0–7.0 km). Further, the geodetic data may be interpretedto be consistent surface creep on the Chaman Fault, althoughit has not been reported from field observations.[35] Although located only 8 km from the trace of the
Chaman Fault, station CHMC is moving at approximately75% of the expected ITRF2008 velocity [Altamimi et al.,2011a]. This observation suggests that most of the plateboundary motion is accommodated by faults on the IndiaPlate east of the Chaman Fault. This is in contrast to obser-vations in the Ornach-Nal region (section 4.1) where diffusedeformation appears to be accommodated primarily on theEurasia Plate. Further, the location of Sukkur (SIBA) on thestable India Plate combined with the velocity profile inFigure 9 indicates that the remaining 12 mm/yr of sinistralmotion must be accommodated across structures east of theChaman Fault.[36] Convergence in the Kirthar range is 6.8 � 1.0 mm/yr,
as calculated using a weighted mean of the following sta-tions CHMC, SHBG, QILA. Station SARN appears to dis-play a large seasonal signal in its east component yielding aconvergence estimate of 0 mm/yr. Since SARN is a cam-paign GPS site, the temporal spacing of occupations dis-allows any meaningful estimates of any periodic signal and
thus has been disregarded. The nearly uniform convergencesignal observed at the remaining stations west of Quettasuggests that shortening in the Kirthar Range is focusedalong structures east of Quetta, such as the Dezghat-BannhFault System which ruptured during the 1931 Mach earth-quake [Szeliga et al., 2009].
4.3. Chaman Fault Near Qalat
[37] North of Chaman, Pakistan, the Chaman Fault entersa 20 degree restraining bend and the fault trend becomesmore perpendicular to the azimuth of ascending Envisatsatellite passes (approximately 346�). This favorable geom-etry increases the amount of fault parallel motion visible inthe radar line-of-sight compared with locations further southalong the Chaman Fault. Descending satellite passes wereavoided as the azimuth of such passes relative to the faultstrike makes any strike-slip motion geometrically invisible.We have produced a best fitting rate map using 12 Envisatscenes (Figure 10) and calculated line-of-sight displace-ments through binning of observations by distance fromthe fault trace. Estimates of line-of-sight displacement foreach bin are then calculated using a least squares approach(Figure 11).[38] In Figure 11, slip-rate and fault-locking-depth are
estimated using the two-dimensional strike-slip model ofSavage and Burford [1973], and uncertainties in rate anddepth are determined using a Monte Carlo resamplingtechnique [Wright et al., 2001]. The slip-rate and lockingdepth estimates of 1.91 � 0.31 rad/yr in the radar line-of-sight are consistent with 16.8 � 2.7 mm/yr of fault par-allel motion beneath a locking depth of 5.4 � 2.4 km.
Figure 8. GPS velocities of stations in the region of Quetta,Pakistan. All velocities are relative to the stable India Plateas defined in Altamimi et al. [2011a] and are plotted usinga Mercator projection. Station names appear on Figure 3b.
Figure 9. GPS profile across the Chaman Fault. Velocitiesand uncertainties are projected into a direction parallel to theChaman Fault and are relative to the stable India Plate.Uncertainties shown are 2s. The dotted line represents themodel that maximizes the empirical posterior likelihoodfunction as determined using a Markov-Chain Monte Carlomethod [Mosegaard and Tarantola, 1995]. The slip rateand locking depth for this model are indicated on the figure.
SZELIGA ET AL.: CHAMAN INTERSEISMIC DEFORMATION B08404B08404
8 of 14

[39] A prominent feature seen in both the best fit rate-mapand the fault-centered profile is the deformation in the Tar-nak Rud valley near the village of Qalat. Analysis of thedeformation around the Qalat area using a short-baselinemethodology shows nearly 15 mm/yr of deformation in theline-of-sight of the radar during the time period 10 Aug.2004–6 Jan. 2009 (Figure 12) [Berardino et al., 2002;Hooper, 2008]. Comparisons between Landsat 7 bandcombination 4,3,2 and the InSAR data show a good corre-spondence between areas of subsidence and modern riverchannels. The region of greatest subsidence is locateddownstream of the region of densest agricultural usage butclose to the region of densest population (Figure 12b), sug-gesting that the most probable cause of the deformation isgroundwater withdrawal. As Landsat 7 data acquired after31 May 2003 contains data gaps due to an instrument failure,only data prior to the short-baseline time period are avail-able. It is possible that in the time between when the Landsat7 shown in Figure 12 was acquired and 6 Jan. 2009, thatagricultural land-use in the region surrounding the defor-mation signal changed.
5. Gardez Fault Near Kabul
[40] North of Ab-e-Istada, the Chaman fault systembifurcates, with the Chaman fault proper continuing northand west of Kabul and the Gardez fault continuing north andeast of Kabul [Lawrence et al., 1992] (Figure 1). This regionis characterized by mountainous terrain, primitive roads andhas relatively few GPS sites. We utilize two GPS measure-ments, one continuous station located in Peshawar, Pakistan(NCEG) and one campaign GPS station in Kabul, Afghani-stan (KBUL) to estimate the total strike-slip and conver-gence rate across this remote region of the Chaman faultsystem (Table 1). Although Kabul, Afghanistan is located
Figure 10. InSAR rate-map derived from stacking 12ascending pass Envisat interferograms. Solid arrow indicatesthe flight direction of the satellite while the transparentarrow indicated the line-of-sight direction. Values are phasevelocity in rad/yr in the line-of-sight of the radar andreferenced to a pixel in the far NW corner of the scene. Morepositive values of phase velocity indicate increasing radarline-of-sight distance. Interferograms used in constructionof the rate-map are indicated by solid lines in Figure 4 andhave a median perpendicular baseline of 30 m. The surfacetrace of the Chaman Fault is indicated by the dashed line.For reference, the locations of GPS stations CHMC andSHBG are indicated in the southern portion of the map.The increasing radar line-of-sight velocities near the townof Qalat, Afghanistan, (black triangle) are likely tied to sub-sidence due to groundwater withdrawal for agriculture.
Figure 11. Chaman fault centered profile of line-of-sight velocities from the InSAR rate-map shownin Figure 10. Increasing line-of-sight velocities represent motion away from the radar. The gray dataare SRTM level 2 3s topography sampled in the same manner as the InSAR data. Larger variancesin the topographic data indicate larger changes in topography parallel to the Chaman fault. The dashedline corresponds to the Monte Carlo derived model. Slip rate and locking depth are calculated in theradar line-of-sight. The convex-up feature 25 km northwest of the Chaman Fault corresponds withgroundwater withdrawal near the town of Qalat, Afghanistan.
SZELIGA ET AL.: CHAMAN INTERSEISMIC DEFORMATION B08404B08404
9 of 14

between the two most prominant strike-slip faults in thenorthern Chaman fault system, the Chaman fault proper andthe Gardez fault, the observed velocity of GPS stationKBUL is 76% of the rate expected for stable Eurasia fromITRF2008 [Altamimi et al., 2011a]. Further, while our GPSstation locations are not optimally located to preciselyidentify the active faults in the Chaman fault system at thislatitude, we may assume that all of the strike-slip motionis accommodated on faults with the same orientation asthe Chaman and Gardez fault at this latitude (�22.5�).Decomposing the baseline velocity between GPS stationsin Peshawar, Pakistan (NCEG) and Kabul, Afghanistan(KBUL), we observe a total of 16.8 � 0.51 mm/yr ofsinistral motion and 9.2 � 0.39 mm/yr of convergence.
6. Discussion
[41] Great earthquakes in the past millennium form analmost continuous line of ruptures along India’s northernand eastern boundaries with Eurasia. In contrast, few reportsof major earthquakes exist for the Chaman fault system, thetwo largest on record being the Quetta earthquake of 1935(Mw 7.7) and, from its reports of widespread damage to citiesand ground disruption, the 1505 earthquake reported in thediaries of Babur [Babur, 1912; Ambraseys and Bilham,2003a]. The rupture lengths of these two earthquakes cur-rently remain unquantified, but it is possible that eachearthquake ruptured upwards of 300 km of the 1200 km longChaman system, thereby leaving slip on the remaining600 km to be accounted for in undocumented historicalearthquakes, or by processes of aseismic slip (Figure 2b).[42] The geodetic measurements presented here provide
both a measure of the slip rate on the principal faults of theChaman system, and a clue as to the probable absence of arecord of great earthquakes. From continental scale geodesywe know that India’s relative velocity with respect to Eurasiaat the longitude of the Chaman fault system is 24–28 mm/yr.Our measurements across the Chaman fault reveal that15.1+13.4
+16.9 mm/yr of this slip is accommodated by the OrnachNal fault and the central and southern Chaman fault.
[43] Our measurements are unfavorably disposed toquantify the slip rate on the central Ghazabad fault segment,however near the town of Chaman, Pakistan (30.89�N,66.51�E), we observe an interseismic deformation rate of8.5+6.8
+10.3 mm/yr across the Chaman Fault, with a total of22.1� 0.3 mm/yr of sinistral motion accommodated betweenChaman and Sukkur, Pakistan. The Ghazaband Fault,according to recently relocated epicenters published byEngdahl and Villasenor [2002] is likely to have hosted the1935 Quetta earthquake. Our GPS transect crosses the Gha-zaband Fault at its northern extremity near the town of Pishin,and fails to reveal any significant localized shear across it.[44] Our measurements are unfavorably disposed to quan-
tify the slip rate on the central Ghazaband fault segment,however, near the town of Chaman, Pakistan (30.89�N,66.51�E), we observe an interseismic deformation rate of8.5+6.8
+10.3 mm/yr across the Chaman fault, which is presumablythe loading rate applicable to a recurrence of the 1892earthquake. Slip in the 1892 earthquake was measured inonly one location as 75–80 cm which would suggest arenewal time for earthquake recurrence of 100 years, withlarge uncertainty.[45] The low rate observed at Chaman, Pakistan, leaves a
total of 22.1 � 0.3 mm/yr of sinistral motion unaccountedfor between Chaman, Pakistan and Sukkur, Pakistan, whicheffectively lies on the rigid India Plate to the east of theSeistan ranges. Whether or not the 22 mm/yr of sheardisplacement is entirely accommodated by slip on theGhazaband fault is unclear, and although no alternativemajor fault exists at this latitude, we cannot exclude thepossibility of block rotation or distributed shear in theSeistan Ranges to the east. Our GPS transect crosses theGhazaband fault at its northern extremity near the town ofPishin, Pakistan, and fails to reveal any significant local-ized shear across it. Slip in the 1935 Quetta, Pakistanearthquake was not measured directly, but scaling lawsand seismic moment calculations suggest that with anM7.7 with inferred rupture dimensions of 300 � 12 km itmay have slipped 3–5 m which would suggest a renewaltime of 150–250 years. No previous earthquakes however,are known in the historical record with this magnitude.
Figure 12. Comparison of InSAR short-baseline results and Landsat 7 imagery from the Tarnak Rud val-ley near the town of Qalat, Afghanistan. (a) Line-of-sight (LOS) rate map of ground subsidence near thetown of Qalat, Afghanistan (triangle). Positive values indicate motion away from the radar. Solid arrowindicates the flight direction of the satellite and outlined arrow denotes the line-of-sight direction of thesatellite. Black triangle marks the location of the town of Qalat and is the same as in Figure 10. (b) Landsat7 image from 18 May 2003 using band combination 4,3,2 to highlight vegetation (red areas).
SZELIGA ET AL.: CHAMAN INTERSEISMIC DEFORMATION B08404B08404
10 of 14

[46] In contrast to the locking depth inferred for the Gha-zaband fault, we find significant evidence that shallowlocking depths prevail along both segments of the faultwhere we have examined the velocity field in detail. TheOrnach Nal fault, and the southern and central Chamanfaults are apparently locked only in their uppermost 3 km,reducing the accumulation of a significant seismic momentdeficit. These segments of the fault thus resemble thecreeping and transition parts of the San Andreas and Hay-ward faults, with the exception that no surface creep hasbeen reported from Baluchistan and Afghanistan. Slip in the1892 earthquake extended for at least 60 km according toLawrence et al. [1992], which is consistent with M6.5, meanslip of 0.8 m, and a locking depth of 4 km. Griesbach [1893]indicates that surface rupture from this earthquake extendedsouthward from the point where the railroad crosses the fault(30.85�N 66.52�E) for some distance, but did not extendmuch farther to the north. Our GPS transect across theChaman Fault lies 2 km north of this railroad crossing pos-sibly sampling a northward transition in locking depthanalogous to that observed south of Parkfield on the SanAndreas fault [Lienkaemper et al., 2006]. Indeed, theoccurrence of serpentinite on the fault at this location mayalso provide a lithological and rheological justification forthis transition [Lawrence and Yeats, 1979].[47] Using cumulative seismic moment estimates, previous
authors have noted a slip deficit on the Chaman fault systemnorth of �31�N [Bernard et al., 2000; Ambraseys andBilham, 2003b]. Given the observed interseismic deforma-tion rates of 16.8 � 2.7 mm/yr near Qalat, Afghanistan and16.8 � 0.51 near Kabul, Afghanistan, one would expectMw 7.0 earthquakes every 60–90 years; this is not the case,and as it is likely that the seismic catalog of this region iscomplete above M 6.5 since at least 1890 [Ambraseys andBilham, 2003a], the absence of earthquakes with magni-tudesM > 7 in the historical record suggests that the region ofthe Chaman Fault near Qalat may have accumulated enoughstrain for a large earthquake. Further, this observation sug-gests that the low Peak Ground Acceleration prediction forthis region for the next 50 years presented by the PakistanMeteorological Department [2007] may be too conserva-tive. However, our observed locking depths and the mea-sured slip rate are consistent with the absence of Mw > 7earthquakes in the historical record, and the observed pro-ductivity of 5 <Mw < 5.5 earthquakes on the central Chamanfault. Earthquakes of Mw 5.5 with a locking depth of 5 km, arupture length of 5 km, and coseismic slip of 30 cm would beassociated with renewal times of �20 years. While surfacecreep along the Chaman Fault has been suggested as anexplanation for this moment deficit, our data do not favorsurface creep north of Chaman (Figure 11).[48] The active plate boundary is offset more than 20 km
to the west of the mapped Ornach Nal fault near Bela.Although the GPS station density is too low to provide anaccurate constraint on the locking depth of the plate boundary(2.9+0
+9.1 km) in the Ornach-Nal region, the low seismic pro-ductivity combined with the high interseismic deformationrate shown by the GPS transect (15.1+13.4
+16.9 mm/yr) suggeststhat the locking depth along the plate boundary is eithershallow or accommodated across multiple structures. Nothrough going surface fault exists at the location of maximum
geodetic shear although we have identified a number of weakmorphological lineations using Landsat imagery (Figure 7)that may be associated with incipient subsurface shear. Theformation of a prominent basin, the Hinglaj synform, isconsistent with a pull apart between two left-stepping sinis-tral shears.[49] An alternative interpretation — that the active plate
boundary dips to the west and is creeping at depth below theregion of maximum shear, emerging at the surface near themapped Ornach Nal fault— is considered less likely for tworeasons. The first argument is that previous authors havesupposed the thick package of mud that forms the mountainsto the west of Bela to represent an intruded inhomogeneouslubricant similar to the mud volcanoes found elsewhere inthe region. In fact the muds consist of a steeply dippingsedimentary series in stratigraphic sequence and with littleinternal deformation, which may in part be the source oferuptive material from nearby mud volcanoes [Delisle, 2005,2004; Delisle et al., 2002]. The second argument is that theweakly constrained locking depth of 2.9+0
+9.1 km would requirethe fault to dip at a shallow angle between 13–36�Wwere it toemerge at the foot of the range where the Ornach Nal fault ismapped. It is difficult to conceive of an efficient continentaltransform with this geometry.[50] Historically, the Ornach-Nal region has been seismi-
cally quiet [Zaigham, 1991; Lawrence et al., 1992]; evenMinchin [1907], in his “Gazateer of Las Bela”, notes thatthis region is not prone to earthquakes. Since the 1950’s, theISC catalog has bolstered this view, listing no seismicitynear the Ornach-Nal Fault before 1972 (Figure 2a). Duringthe 1970’s the increasing density of the global seismic net-work led to an increase in sensitivity to small magnitudeearthquakes, yet the ISC lists no earthquakes larger thanMb 4.9 near the Ornach-Nal Fault during the period 1972–2010. The low magnitude of these earthquakes combinedwith sparse regional seismic network coverage results invery poor depth constraints in this area. Although the GPSstation density is too low to provide an accurate constrainton the locking depth of the plate boundary in the Ornach-Nalregion, the low seismic productivity combined with the highinterseismic deformation rate shown by the GPS transect(15.1+13.4
+16.9 mm/yr) suggests that the locking depth along theplate boundary is shallow.[51] Modeling of Bouger gravity transects between Kar-
achi and the Ornach-Nal Fault by Zaigham [1991] suggeststhe presence of east-dipping subducted oceanic crust beneaththe southern Kirthar Range. Although depth estimates forearthquakes in the Ornach-Nal region are poor, the presenceof sparse, deep seismicity combined with the interpretationof an east-dipping crustal layer prompted Zaigham [1991] tosuggest on-going subduction of this crustal sliver, which hetermed the Makran-Bela microplate. However, the loweastward convergence velocity of stations LAKC and SHFDwest of Bela and the southern Kirthar Range (�2 mm/yr)suggests that subduction of this sliver has ceased.[52] In Figure 13, we compare the measurements and
the maximum sinistral and fault-normal deformation esti-mates made from pole-of-rotation parameters published inAltamimi et al. [2011a]. Estimates along each fault shownin Figure 13 assume that slip is perfectly partitioned acrosseach fault. Since all four estimates of sinistral motion and
SZELIGA ET AL.: CHAMAN INTERSEISMIC DEFORMATION B08404B08404
11 of 14

two of the estimates of convergence are lower than theexpected velocities calculated under the assumption of per-fect slip partitioning, this suggests that both sinistral slip andconvergence are likely accommodated across multiplestructures. In the south, across the Ornach-Nal Fault, thefaults across the Hinglaj Synform appear to accommodatethe majority of the sinistral plate motion. Similarly, in thenorth, across the Chaman Fault near Qalat, Afghanistan,the Chaman Fault appears to accommodate the majority ofthe sinistral plate motion. At the latitude of Chaman,Pakistan, however, the large deficit in sinistral deformationsuggests that most of the sinistral plate motion is accom-modated by faults to the east. At the latitude of Kabul,Afghanistan, the baseline between GPS stations NCEG andKBUL only samples the deformation across one of the majorsinistral faults in the Chaman fault system, the Gardez fault.Thus, given the relatively low seismicity rates farther west ofKabul (Figure 2) [Ambraseys and Bilham [2003a], the
remaining 11.4 mm/yr are likely accommodated across theChaman fault proper, just west of our transect. The agree-ment between ITRF2008 and observation in convergencerate across this same transect is supplemented by the occur-rence of thrust faulting earthquakes in the region with NEstriking nodal planes (Figure 2). However, the lack of geo-logical mapping in this region makes further interpretationdifficult. We also note that the upper limits of observedstrike-slip (�17 mm/yr) are similar to convergence ratesreported in the western Himalaya [Apel et al., 2006; Bendicket al., 2007; Mohadjer et al., 2010].
7. Conclusions
[53] We present interseismic deformation rates and lockingdepth estimates for three locations across the Chaman FaultSystem using space geodetic techniques. Along the southernChaman Fault System, the Ornach-Nal fault represents theobvious plate bounding fault. Near the town of Bela, geodeticmeasurements across the fault indicate that the plate bound-ary is actually located 12.5+5.6
+35 km west of the Ornach-NalFault beneath the Hinglaj Synform. Assuming deformationis accommodated across a single fault strand, strain is accu-mulating at a rate of 15.1+13.4
+16.9 mm/yr and is locked to a depthof 2.9+0
+9.1 km. The absence of historical and modern seismic-ity, and the low relative velocities of Bela, Pakistan relative tothe India Plate suggests that aseismic deformation mayaccommodate an additional ≈10 mm/yr west of the plateboundary, most probably on the Ghazaband fault. Farthernorth, at the latitude of Chaman, Pakistan, the Chaman Faultappears to accommodate as little as 40% of the overallsinistral motion across the plate boundary with the remainingdeformation distributed across faults between the Chamanfault and the Seistan Ranges. Geodetic data suggest that thefault is very shallowly locked (3.4+0
+7.0 km) and accumulatingstrain at a rate of 8.5+6.8
+10.3 mm/yr. Although we observe nosignificant strain accumulation across the extreme north-ernmost segment of the Ghazaband Fault, it is likely thatthis fault accommodates a large portion of the sinistralmotion of the plate boundary at latitudes south of Quetta,Pakistan. North of the town of Chaman, Pakistan, inter-seismic deformation across the Chaman fault is consistentwith 16.8 � 2.7 mm/yr of slip beneath a 5.4 � 2.4 kmthick locked elastic lid near Qalat, Afghanistan and 16.8 �0.51 mm/yr near Kabul, Afghanistan. Since there have beenno recorded earthquakes with Mw > 6.5 on these segments ofthe fault system in the past 115 years, it is possible that thesesegments rupture in earthquakes with magnitudes larger thanMw 7 with return intervals of >120 years.
[54] Acknowledgments. We thank Chuck Lindsay of the U.S. Geo-logical Survey, Denver, who was responsible for the important initialinstallation of the Kabul GPS measurement point, and Solmaz Mohadjerat the Aga Khan Development Network, Disaster Risk Management Ini-tiative for its subsequent remeasurement. This research was supported bythe National Science Foundation under grant EAR-0229690. Support forGPS fieldwork in Baluchistan was also provided by the Pakistan ScienceFoundation. ERS and Envisat data were provided by the European SpaceAgency under category-1 proposal 2757 and were processed using theJPL/Caltech software package ROI_PAC [Rosen et al., 2004]. OriginalInSAR data are copyright of the European Space Agency. Occupationand maintenance of continuous and campaign Global Positioning System(GPS) receivers was performed by Din Mohammad Kakar of the Universityof Baluchistan, Quetta, Pakistan and Sarosh Lodi of the NED University,Karachi, Pakistan. GPS data were processed using the MIT GAMIT/
Figure 13. Maximum fault-normal and fault-parallelvelocities based on ITRF2008 pole-of-rotation locationsand rates published in Altamimi et al. [2011a] projected alongmapped faults on the western boundary of the India Plate.Estimates are derived using the azimuth of the surface traceof plate bounding faults and assume that slip partitioning isperfect and occurs only along a single fault. (a) Maximumconvergence estimated assuming perfect partitioning of slip.Locations of convergence observations indicated by text.(b) Maximum sinistral motion estimated assuming perfectpartitioning of slip. Locations of sinistral motion estimatesindicated by horizontal bars and represent 95% confidenceintervals. Note all three measurements of sinistral motionand both measurements of fault-normal motion suggestlower rates compared with perfect slip partitioning.
SZELIGA ET AL.: CHAMAN INTERSEISMIC DEFORMATION B08404B08404
12 of 14

GLOBK software package [Herring et al., 2010a, 2010b]. InternationalSeismological Centre (ISC) and Engdahl, van der Hilst, and Buland(EHB) catalog data were retrieved from http://www.isc.ac.uk. Landsatimagery was acquired using the U.S. Geological Survey’s Earth Explorer(http://edcsns17.cr.usgs.gov/EarthExplorer). All figures were created usingGeneric Mapping Tools [Wessel and Smith, 1998]. We would also like tothank Eric Fielding of the Jet Proplusion Laboratory, Gareth Funning ofthe University of California, Riverside, Rowena Lohman of Cornell Univer-sity, and Tim Wright of the University of Leeds for discussion on InSARprocessing techniques. Gareth Funning provided software for InSAR inver-sion, and Rowena Lohman provided software for InSAR data resampling.
ReferencesAltamimi, Z., L. Métivier, and X. Collilieux (2011a), ITRF2008 platemotion model, Geophys. Res. Abstr., 13, EGU2011-4750.
Altamimi, Z., X. Collilieux, and Métivier (2011b), ITRF2008: An improvedsolution of the international terrestrial reference frame, J. Geod., 85,457–473, doi:10.1007/s00190-011-0444-4.
Ambraseys, N., and R. Bilham (2003a), Earthquakes in Afghanistan, Seis-mol. Res. Lett., 74(2), 107–123.
Ambraseys, N., and R. Bilham (2003b), Earthquakes and associateddeformation in northern Baluchistan, Bull. Seismol. Soc. Am., 93(4),1573–1605.
Ambraseys, N., and J. J. Douglas (2004), Magnitude calibration of northIndian earthquakes, Geophys. J. Int., 159, 165–206.
Ambraseys, N., and D. Jackson (2003), A note on early earthquakes innorthern India and southern Tibet, Curr. Sci. India, 84(4), 570–582.
Apel, E., R. Burgmann, P. Bannerjee, and B. Nagarajan (2006), Geode-tically constrained Indian Plate motion and implications for plateboundary deformation, Eos Trans. AGU, 85(52), Fall Meet. Suppl.,Abstract T51B-1524.
Babur, Z. M. (1912), The Babur-nama in English, translated by A. S.Beveredge, Steven Austin, Hertford, U. K.
Baird Smith, R. (1843), Memoir of Indian earthquakes—Part II, J. Asiat.Soc. Bengal, 12(144), 1029–1056.
Bannert, D., A. Cheema, A. Ahmed, and U. Schaffer (1992), The structuraldevelopment of the Western Fold Belt, Pakistan, Geol. Jahrb., 80, 3–60.
Bendick, R., R. Bilham, M. A. Khan, and S. F. Khan (2007), Slip on anactive wedge thrust from geodetic observations of the 8 October 2005Kashmir earthquake, Geology, 35(3), 267–270.
Berardino, P., R. Lanari, and E. Sansosti (2002), A new algorithm for sur-face deformation monitoring based on small baseline differential SARinterferograms, IEEE Trans. Geosci. Remote Sens., 40(11), 2375–2383.
Bernard, M., B. Shen-Tu, W. E. Holt, and D. M. Davis (2000), Kinematicsof active deformation in the Sulaiman lobe and range, Pakistan, J. Geo-phys. Res., 105(6), 13,253–13,279.
Beun, N., P. Bordet, and J.-P. Carbonnel (1979), Premières données quanti-tatives relatives au coulissage du décrochement de Chaman (Afghanistandu Sud-Est), C. R. Acad. Sci. Paris, 288, 931–934.
Biggs, J., T. J. Wright, L. Zhong, and B. Parsons (2007), Multi-interferogram method for measuring interseismic deformation: Denalifault, Alaska, Geophys. J. Int., 170, 1165–1179.
Bürgmann, R., P. A. Rosen, and E. Fielding (2000), Synthetic aperatureradar interferometry to measure Earth’s surface topography and its defor-mation, Annu. Rev. Earth Planet. Sci., 28, 169–209.
Cox, P., N. Cater, and W. Goodenough (1936), The Quetta earthquake:Discussion, Geogr. J., 88(5), 428–430.
Delisle, G. (2004), Mud volcanoes of Pakistan, Environ. Geol., 46,1024–1029.
Delisle, G. (2005), Mud volcanoes of Pakistan—An overview, in MudVolcanoes, Geodynamics and Seismicity, edited by G. Martinelli andB. Panahi, pp. 159–169, Springer, Dordrecht, Netherlands.
Delisle, G., U. von Rad, H. Andruleit, C. H. von Daniels, A. B. Tabrez, andA. Inam (2002), Active mud volcanoes on- and offshore eastern Makran,Pakistan, Int. J. Earth Sci., 91, 93–110.
Engdahl, E. R., and A. Villasenor (2002), Global seismicity: 1900–1999,in International Handbook of Earthquake and Engineering Seismology,vol. A, edited by W. H. K. Lee et al., chap. 41, pp. 665–690, Academic,Amsterdam.
Farr, T. G., et al. (2007), The shuttle radar topography mission, Rev.Geophys., 45, RG2004, doi:10.1029/2005RG000183.
Goldstein, R. M., and C. L. Werner (1998), Radar interferogram filtering forgeophysical applications, Geophys. Res. Lett., 25(21), 4035–4038.
Goldstein, R. M., H. A. Zebker, and C. L. Werner (1988), Satellite radarinterferometry: Two-dimensional phase unwrapping, Radio Sci., 23(4),713–720.
Griesbach, C. L. (1893), Notes on the earthquake in Baluchistan on the 20thDecember 1892, Rec. Geol. Surv. India, 26(2), 57–61.
Hanssen, R. F. (2001), Radar Interferometry: Data Interpretation andError Analysis, Remote Sens. Digital Image Process., vol. 2, KluwerAcad., Dordrecht, Netherlands.
Haq, S. S. B., and D. M. Davis (1997), Oblique convergence and the lobatemountain belts of western Pakistan, Geology, 25(1), 23–26.
Herring, T. A. (2003), MATLAB tools for viewing GPS velocities and timeseries, GPS Solut., 7, 194–199, doi:10.1007/s10291-003-0068-0.
Herring, T. A., R. W. King, and S. C. McClusky (2010a), GAMIT referencemanual, GPS analysis at MIT release 10.4, report, 171 pp., Dep. of EarthAtmos. and Planet. Sci., Mass. Inst. of Technol., Cambridge.
Herring, T. A., R. W. King, and S. C. McClusky (2010b), GLOBK:Global Kalman filter VLBI and GPS analysis program, release 10.4,report, 95 pp., Dep. of Earth Atmos. and Planet. Sci., Mass. Inst. ofTechnol., Cambridge.
Hooper, A. (2008), A multi-temporal InSAR method incorporating bothpersistent scatterer and small baseline approaches, Geophys. Res. Lett.,35, L16302, doi:10.1029/2008GL034654.
Jones, A. (Ed.) (1961), Reconnaissance Geology of Part of West Pakistan:A Columbo Plan Cooperative Project, Gov. of Pakistan, Oshawa.
Landor, A. H. S. (1902), Across Coveted Lands or a Journey From Flush-ing (Holland) to Calcutta Overland, Macmillan, London.
Lawrence, R. D., and R. S. Yeats (1979), Geological reconnaissance ofthe Chaman Fault in Pakistan, in Geodynamics of Pakistan, edited byA. Farah and K. A. DeJong, pp. 351–357, Geol. Surv. of Pakistan, Quetta.
Lawrence, R. D., S. H. Khan, and T. Nakata (1992), Chaman Fault,Pakistan-Afghanistan, Ann. Tecton., 6, 196–223.
Lienkaemper, J. J., B. Baker, and F. S. McFarland (2006), Surface slip asso-ciated with the 2004 Parkfield, California, earthquake measured withalinement arrays, Bull. Seismol. Soc. Am., 96(4), 239–249.
Massonnet, D., and K. Feigl (1995), Discrimination of geophysicalphenomena in satellite radar interferograms, Geophys. Res. Lett., 22(12),1537–1540.
Minchin, C. F. (Ed.) (1907), The Gazatteer of Las Béla, District GazatteerSer. of Baluchistán, vol. 8, Times Press, Bombay, India.
Mohadjer, S., et al. (2010), Partitioning of India-Eurasia convergence in thePamir-Hindu Kush from GPS measurements, Geophys. Res. Lett., 37,L04305, doi:10.1029/2009GL041737.
Mosegaard, K., and A. Tarantola (1995), Monte Carlo sampling of solutionsto inverse problems, J. Geophys. Res., 100(7), 12,431–12,447.
Oldham, T. (1883), A catalogue of Indian earthquakes from the earliest timeto the end of A.D. 1869, Mem. Geol. Surv. India, 29, 163–215.
Pakistan Meteorological Department (2007), Seismic hazard analysis andzonation for Pakistan, Azad Jammu and Kashmir, report, 156 pp.,Pakistan Meteorol. Dep., Islamabad.
Parsons, B., et al. (2006), The 1994 Sefidabeh (eastern Iran) earthquakerevisited: New evidence from satellite radar interferometry and carbonatedating about the growth of an active fold above a blind thrust fault,Geophys. J. Int., 164, 202–217.
Pinhey, L. A. (1938), The Quetta earthquake of 31 May 1935, report,26 pp., Govt. of India Press, New Delhi.
Ramanathan, K. R., and S. M. Mukherji (1938), A seismological study ofthe Baluchistan (Quetta) earthquake of May 31, 1935, Rec. Geol. Surv.India, 73(4), 483–513.
Reilinger, R., et al. (2006), GPS constraints on continental deformation inthe Africa-Arabia-Eurasia continental collision zone and implicationsfor the dynamics of plate interactions, J. Geophys. Res., 111, B05411,doi:10.1029/2005JB004051.
Rosen, P. A., S. Hensley, G. Peltzer, and M. Simons (2004), UpdatedRepeat Orbit Interferometry package released, Eos Trans. AGU, 85(5),35.
Savage, J. C., and R. O. Burford (1973), Geodetic determination of relativeplate motion in central California, J. Geophys. Res., 78(5), 832–845.
Segall, P., and J. L. Davis (1997), GPS applications for geodynamics andearthquake studies, Annu. Rev. Earth Planet. Sci., 25, 301–336.
Skrine, C. P. (1936), The Quetta earthquake, Geogr. J., 88(5), 414–428.Snead, R. E. (1964), Active mud volcanoes of Baluchistan, west Pakistan,Geogr. Rev., 54(4), 546–560.
Szeliga, W., R. Bilham, D. Schelling, D. M. Kakar, and S. Lodi (2009),Fold and thrust partitioning in a contracting fold belt: Insights fromthe 1931 Mach earthquake in Baluchistan, Tectonics, 28, TC5019,doi:10.1029/2008TC002265.
Szeliga, W., S. E. Hough, S. Martin, and R. Bilham (2010), Intensity, mag-nitude, location and attenuation in India for felt earthquakes since 1762,Bull. Seismol. Soc. Am., 100(2), 570–584.
Wellman, H. W. (1966), Active wrench faults of Iran, Afghanistan andPakistan, Geol. Rundsch., 55(3), 716–735.
Wells, D. L., and K. J. Coppersmith (1994), New empirical relationshipsamong magnitude, rupture length, rupture width, rupture area, and surfacedisplacement, Bull. Seismol. Soc. Am., 84(4), 974–1002.
SZELIGA ET AL.: CHAMAN INTERSEISMIC DEFORMATION B08404B08404
13 of 14

Wessel, P., and W. H. F. Smith (1998), New improved version of GenericMapping Tools released, Eos Trans. AGU, 79, 579.
Williams, S. (2008), CATS: GPS coordinate time series analysis software,GPS Solut., 12, 147–153, doi:10.1007/s10291-007-0086-4.
Wright, T. J., B. Parsons, and E. Fielding (2001), Measurement of interseis-mic strain accumulation across the North Anatolian Fault by satelliteradar interferomety, Geophys. Res. Lett., 28(10), 2117–2120.
Yeats, R. S., R. D. Lawrence, S. Jamil-ud din, and S. H. Khan (1979), Sur-face effects of the 16 March 1978 earthquake, Pakistan-Afghanistan bor-der, in Geodynamics of Pakistan, edited by A. Farah and K. A. DeJong,pp. 159–361, Geol. Surv. of Pakistan, Quetta.
Zaigham, N. A. (1991), Bela ophiolites and associated mineralization insouthern part of axial-belt of Pakistan, PhD thesis, Univ. of Karachi,Karachi, Pakistan.
SZELIGA ET AL.: CHAMAN INTERSEISMIC DEFORMATION B08404B08404
14 of 14