Impact of Downscaling on the Simulation of Seasonal Monsoon Rainfall Over the Indian Region Using a...
20
104 The Open Atmospheric Science Journal, 2009, 3, 104-123 1874-2823/09 2009 Bentham Open Open Access Impact of Downscaling on the Simulation of Seasonal Monsoon Rainfall Over the Indian Region Using a Global and Mesoscale Model Surya K. Dutta 1 , Someshwar Das *,1 , S.C. Kar 1 , U.C.Mohanty 2 and P.C. Joshi 3 1 National Centre for Medium Range Weather Forecasting, NOIDA, India 2 Centre for Atmospheric Science, IIT, Delhi, India 3 Space Application Centre, ISRO, Ahmedabad, India Abstract: A global model (T80L18; Triangular Truncation at wave number 80 with 18 vertical layers) and a mesoscale model MM5 (nested at 90 and 30 km resolutions) are integrated for 5 monsoon years 1998-2002. The impact of dynami- cal downscaling from global to mesoscale in the simulations of Indian summer monsoon rainfall is studied. Comparisons between the global and the mesoscale models show that, though the global model has an edge over the mesoscale model in simulating the all-India mean rainfall closer to the observation, the T80L18 model lacks in simulating the spatial variations in rainfall. The effect of downscaling is better represented in the rainfall variations produced by MM5 both quantitatively and qualitatively over the foothills of the Himalayas and along Nepal to North-eastern India. It is also seen that the mesoscale model is able to represent the dispersion (standard deviation) present in the observed rainfall over India. In the five monsoon seasons, RMSE of mean rainfall (monthly and seasonal) of T80L18 forecasts are mostly lower than that of MM5 forecasts. However, synoptic features like the Somali Jet and Tibetan anticyclone are better rep- resented by MM5. This model has also simulated the regions of convection better than the T80L18 model. However, the MM5 simulations produced an anomalous circulation over the Saudi Arabian region (15-20 0 N and 45-50 0 E) in many cases. The mesoscale model simulates better wind fields than the global model in general. Over peninsular India T80L18 model showed higher temperature gradient but, over Central India this model has better temperature field as compared to MM5. Over southern and north-eastern India, the temperature field of T80L18 and MM5 are very similar. Keywords: Downscaling, Monsoon, Rainfall, Mesoscale, Simulation, Forecast, TRMM. 1. INTRODUCTION Any change or variation in climate and climatic scenarios affecting the south west monsoon over India, directly affects the Indian economy. Thus, long-range prediction of south west monsoon rainfall becomes very important for the inter- est of the Indian nation. There are evidences that mean flow conditions and pre- cipitation patterns at low latitudes are in principle more pre- dictable than those at high latitudes [1]. However, the pre- dictability of day-to-day atmospheric variability is less. As compared to day-to-day and weekly forecast, seasonal fore- casting should be more feasible as the effects of shorter time scale events tend to average out to a large extent, revealing the smaller but more persistent influence of the ocean and land surface on the atmosphere. Hence, the forecast ability over a time scale of days to month is less skillful than sea- sonal forecasts. However, estimates of potential predictabil- ity on seasonal time scales of the Indian monsoon is limited [2]. They [2] have shown that the Indian Monsoon climate is only marginally predictable in monthly time scales as the contribution of the boundary forcing in this region is rela- tively low and that of the internal dynamics is relatively *Address correspondence to this author at the SAARC Meteorological Re- search Centre, Agargaon, Sher-e-Bangla Nagar, Dhaka - 1207, Bangladesh; Tel: 00-880-2-9144374, Ext. 314; Fax: 00-880-2-9144373; E-mails: [email protected], [email protected] large. They have also shown that excluding the Indian mon- soon region, the predictable region is larger and predictabil- ity is higher in the tropics during the northern summer. Large uncertainties in rainfall forecasts in monthly to seasonal time scales are the major challenges faced by long-range forecast- ers. Uncertainty in the initial state, external parameters and model itself are the three main reasons for the uncertainty in these forecasts. Presently, India Meteorological Department provides long-range forecasts of the Indian monsoon rainfall using statistical models [3]. Since the large spatial and temporal variability of monsoon rainfall are not explicit in the statisti- cal models, these forecasts have very limited applications. A large number of modeling studies have been carried out to use dynamic global models to predict the monsoon rainfall variability in seasonal to interannual timescales [4-6]. The primary deficiency of present day General Circula- tion Models for regional climate studies is their coarse spa- tial resolution and simple representation of physical proc- esses [7-9]. The resolution is not sufficient to resolve the meso-scale atmospheric circulations, influenced by the re- gional climate forcing. The computing time required for run- ning a high resolution GCM is large and may be expensive for carrying out climate simulations. The need for climate change assessment and seasonal climate prediction has moti- vated the development of Regional Climate Models (RCMs). These are not only used as dynamical downscaling tools but
-
Upload
independent -
Category
Documents
-
view
0 -
download
0
Transcript of Impact of Downscaling on the Simulation of Seasonal Monsoon Rainfall Over the Indian Region Using a...
104 The Open Atmospheric Science Journal, 2009, 3, 104-123
1874-2823/09 2009 Bentham Open
Open Access
Impact of Downscaling on the Simulation of Seasonal Monsoon Rainfall Over the Indian Region Using a Global and Mesoscale Model
Surya K. Dutta1, Someshwar Das
*,1, S.C. Kar
1, U.C.Mohanty
2 and P.C. Joshi
3
1National Centre for Medium Range Weather Forecasting, NOIDA, India
2Centre for Atmospheric Science, IIT, Delhi, India
3Space Application Centre, ISRO, Ahmedabad, India
Abstract: A global model (T80L18; Triangular Truncation at wave number 80 with 18 vertical layers) and a mesoscale
model MM5 (nested at 90 and 30 km resolutions) are integrated for 5 monsoon years 1998-2002. The impact of dynami-
cal downscaling from global to mesoscale in the simulations of Indian summer monsoon rainfall is studied.
Comparisons between the global and the mesoscale models show that, though the global model has an edge over the
mesoscale model in simulating the all-India mean rainfall closer to the observation, the T80L18 model lacks in simulating
the spatial variations in rainfall. The effect of downscaling is better represented in the rainfall variations produced by
MM5 both quantitatively and qualitatively over the foothills of the Himalayas and along Nepal to North-eastern India. It is
also seen that the mesoscale model is able to represent the dispersion (standard deviation) present in the observed rainfall
over India. In the five monsoon seasons, RMSE of mean rainfall (monthly and seasonal) of T80L18 forecasts are mostly
lower than that of MM5 forecasts. However, synoptic features like the Somali Jet and Tibetan anticyclone are better rep-
resented by MM5. This model has also simulated the regions of convection better than the T80L18 model. However, the
MM5 simulations produced an anomalous circulation over the Saudi Arabian region (15-200
N and 45-500
E) in many
cases. The mesoscale model simulates better wind fields than the global model in general. Over peninsular India T80L18
model showed higher temperature gradient but, over Central India this model has better temperature field as compared to
MM5. Over southern and north-eastern India, the temperature field of T80L18 and MM5 are very similar.
Keywords: Downscaling, Monsoon, Rainfall, Mesoscale, Simulation, Forecast, TRMM.
1. INTRODUCTION
Any change or variation in climate and climatic scenarios affecting the south west monsoon over India, directly affects the Indian economy. Thus, long-range prediction of south west monsoon rainfall becomes very important for the inter-est of the Indian nation.
There are evidences that mean flow conditions and pre-cipitation patterns at low latitudes are in principle more pre-dictable than those at high latitudes [1]. However, the pre-dictability of day-to-day atmospheric variability is less. As compared to day-to-day and weekly forecast, seasonal fore-casting should be more feasible as the effects of shorter time scale events tend to average out to a large extent, revealing the smaller but more persistent influence of the ocean and land surface on the atmosphere. Hence, the forecast ability over a time scale of days to month is less skillful than sea-sonal forecasts. However, estimates of potential predictabil-ity on seasonal time scales of the Indian monsoon is limited [2]. They [2] have shown that the Indian Monsoon climate is only marginally predictable in monthly time scales as the contribution of the boundary forcing in this region is rela-tively low and that of the internal dynamics is relatively
*Address correspondence to this author at the SAARC Meteorological Re-
search Centre, Agargaon, Sher-e-Bangla Nagar, Dhaka - 1207, Bangladesh;
Tel: 00-880-2-9144374, Ext. 314; Fax: 00-880-2-9144373;
E-mails: [email protected], [email protected]
large. They have also shown that excluding the Indian mon-soon region, the predictable region is larger and predictabil-ity is higher in the tropics during the northern summer. Large uncertainties in rainfall forecasts in monthly to seasonal time scales are the major challenges faced by long-range forecast-ers. Uncertainty in the initial state, external parameters and model itself are the three main reasons for the uncertainty in these forecasts.
Presently, India Meteorological Department provides long-range forecasts of the Indian monsoon rainfall using statistical models [3]. Since the large spatial and temporal variability of monsoon rainfall are not explicit in the statisti-cal models, these forecasts have very limited applications. A large number of modeling studies have been carried out to use dynamic global models to predict the monsoon rainfall variability in seasonal to interannual timescales [4-6].
The primary deficiency of present day General Circula-tion Models for regional climate studies is their coarse spa-tial resolution and simple representation of physical proc-esses [7-9]. The resolution is not sufficient to resolve the meso-scale atmospheric circulations, influenced by the re-gional climate forcing. The computing time required for run-ning a high resolution GCM is large and may be expensive for carrying out climate simulations. The need for climate change assessment and seasonal climate prediction has moti-vated the development of Regional Climate Models (RCMs). These are not only used as dynamical downscaling tools but
Impact of Downscaling on Simulation of Seasonal Monsoon Rainfall The Open Atmospheric Science Journal, 2009, Volume 3 105
also for seasonal climate predictions for obtaining detailed and useful regional climate information. Regional Climate Modeling has also aided to improve our understanding of various climate processes such as cloud-radiation forcing, convection and various land surface processes. The finer resolution regional climate models have certain advantages over the GCM. The RCMs allow affordable fine resolution over a limited area and better represent the regional climate phenomena like orographic precipitation, lake effect precipi-tation, etc. Due to these surface forcing RCMs are able to simulate the variations in the climate better than the GCM.
Till date, many reviewed papers have addressed the use of regional climate models and their edge over the GCM for prediction of regional climates [10-12] and the summer mon-soon rainfall [13-15]. Leung et al. (2004) [16] have tried to evaluate how well surface climate and energy fluxes can be simulated by regional climate models during years with ex-treme flood conditions using MM5. It has been found that regional simulations using MM5 can realistically capture many regional climate features [17]. Rao et al. (2004) [18] have shown that NCAR MM5 model simulates many ob-served features of the Indian summer monsoon on a regional scale, which otherwise cannot be simulated using a global general circulation model.
The present study investigates the impact of downscaling from global to mesoscale model for the simulation of sum-mer monsoon rainfall over the Indian region. The primary objective is to compare the performance of a global and a mesoscale model in simulating the different features of In-dian summer monsoon and judge the superiority of one model over the other. The present study is different from the study by Rao et al. (2004) [18] in the following way: They
have made single domain study over the Indian region for the month of June-August for the year 1994 using initial and boundary conditions from the NCEP/NCAR Reanalysis data. For the present study five year period has been considered, with emphasis over two contrasting monsoon seasons. In this study, two domains have been studied. In addition to the reanalysis datasets considered for comparison of model out-put; for downscaling, a global model simulated output has been used as initial and boundary conditions for the mesos-cale model. No studies have been carried out to dynamically downscale the global model simulations using a RCM for the monsoon seasons in India. A detailed analysis has been made of the performance of both meso-scale model MM5 and the global model T80 in simulation of the southwest monsoon rainfall over India. Section 2 presents the methodology, the model used, time and domain of study and data used. Results are discussed in section 3 and finally conclusions are given in section 4.
2. METHODOLOGY
2.1 Model Description
The global spectral model T80L18 (Triangular Trunca-tion at wave number 80 with 18 vertical levels) (originally adapted from NCEP, USA) has been used here for obtaining the initial & lateral boundary conditions of the mesoscale model. This model was used for operational medium range weather forecasting purpose at National Centre for Medium Range Weather Forecasting (NCMRWF). Details of the model may be found at Kanamitsu et al. (1991) [19]. Further improvements to the model are described in John and Begum (1997) [20], Basu et al. (2002) [21] and Kar et al. (2002) [22]. Table 1 presents a summary of the model. The model has been used for seasonal prediction purpose by allowing
Table 1. Description of the NCMRWF Global Spectral Model
Model Elements Components Specifications
Horizontal Global Spectral-T80 (256 x128)
Vertical 18 Sigma Layers (.995, .981, .96, .92, .856, .777, .688, .594, .497, .425, .375, .325, .275, .225, .175, .124,
.074, .021)
Topography Mean
GRID
Prognostic Variables Relative Vorticity, Divergence, Virtual Temperature, Log of surface pressure, Water vapor mixing ratio
Horizontal Transform Orszag’s Technique
Vertical Differencing Arakawa’s Energy conserving scheme
Time Differencing Semi-Implicit, 900 sec
Time Filtering Robert’s Method
DYNAMICS
Horizontal Diffusion Second order over quasi-press. Surface, scale selective
Surface Fluxes Monin-Obukhov similarity theory
Turbulent Diffusion K- theory
Radiation SW- Lacis & Hansen; LW- Fels & Schwarzkopf
Deep convection Kuo scheme modified
Shallow Convection Tiedtke’s Scheme
Largescale condensation Manabe’s Scheme
Clouds Slingo’s Scheme
Rain Evaporation Kessler’s Scheme
Land surface Process Pan’s (3-Layer Soil Temperature, Bucket Hydrology for Soil Moisture)
PHYSICS
Air-Sea Interaction Roughness length (Charnock), SST, SH & LH (Bulk Form.)
106 The Open Atmospheric Science Journal, 2009, Volume 3 Dutta et al.
weekly observed SST (or forecasted SST) as the boundary condition during model simulations. The other details of the model and seasonal prediction methodologies are given in Kar (2007) [23]. The model has been integrated from 15
th
April of each year to 30th
September of that year. Initial con-ditions of 15
th April from NCEP Reanalysis-II were used to
make 168 days of continuous integration with observed SST anomalies.
The non-hydrostatic version of the MM5 modeling sys-tem developed at Penn State University/ National Centre for Atmospheric Research (PSU/NCAR) has been used for this study. It is a limited area, non-hydrostatic model with verti-cal levels as the terrain following sigma co-ordinate. It has been designed to simulate both mesoscale and regional-scale atmospheric circulations. It accepts the surface and upper air analysis fields from the NCMRWF global model ‘T80L18’ as its initial and lateral boundary conditions [23], which are updated 12 hourly. The model has been integrated based on the initial conditions at 00GMT of 16
th May. Starting from
the date, the simulation has been carried forward for all the four months of south west monsoon season, till 00GMT of 1
st October. The configuration of the mesoscale model used
for the present study is described in Table 2.
2.2 Period and Domain of Study
For the present study, five southwest monsoon seasons from 1998 to 2002 have been selected. Among these 1998 to 2001 were normal to good monsoon years whereas 2002 was a deficient monsoon year. 1998 and 2002 being contrasting monsoon seasons, for brevity, the impact of downscaling
over south-west monsoon for these two seasons are dis-cussed in detail in this report. Formation of off-shore vortex over the west coast of India and an active monsoon trough are important criterion for a normal to good monsoon. Off-shore vortex did not form in the year 2002 which resulted in non occurrence of intensive rainfall events. During July-2002, strong and persistent inversions were present in the atmosphere over Arabian Sea and west coast of India. Such strong inversions inhibited the vertical development of clouds; as a result rainfall occurrence was hampered. The large scale circulation during July-2002 was very much dif-ferent compared to the normal monsoon year of 1998.
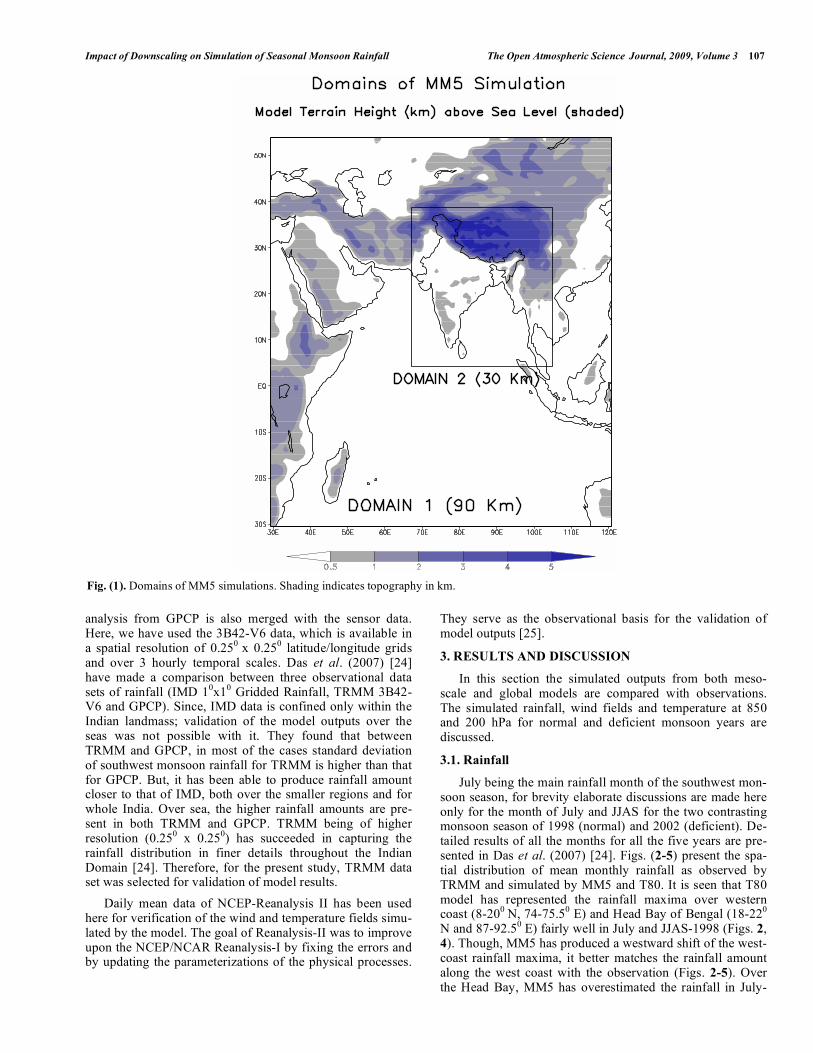
MM5 model has been integrated in two nested domains of resolution 90 km and 30 km, respectively (Fig. 1). We have discussed the results mainly for the inner domain-2 (30 km resolution) for rainfall and temperature, and outer do-main-1 (90 km resolution) for horizontal wind field studies at 850 and 200 hPa.
2.3. Data Used
TRMM (Tropical Rainfall Measuring Mission) data has been used here as a ground truth for the verification of the rainfall simulations by the meso-scale model. (http://daac.gsfc.nasa.gov/precipitation/documentation.shtml). It uses a passive sensor TRMM Microwave Imager (TMI), an active Precipitation Radar (PR) operating at 13.6 GHz, and a visible and infrared scanner (VIRS) radiometer. The 3B42 algorithm provides daily precipitation and root mean square (RMS) error estimates at 0.25
0 x 0.25
0 latitude/longitude
grids over 500
N to 500
S for Version-6 (V6). Rain gauge
Table 2. Configuration of MM5 (Version 3.6) Used for this Study
Model Elements Components Specifications
Horizontal
(Double Nested)
Outer Domain-1 (90 km.)
Inner Domain-2 (30 km.)
Staggered Arakawa B-Grid
Vertical 23 Sigma Levels
Time Steps Domain-1: 270sec., Domain-2: 90 sec.
Topography USGS
Domain
Vegetation/ Land Use USGS & ISRO
Non-Hydrostatic
Nesting Two-way Nesting
Time Integration Semi-implicit
Fixed Boundary Conditions
Time-dependent / Nest
Fourth order for inner domain
Dynamics
Horizontal Diffusion Second order for the coarser domain
Cumulus Parameterization Grell [26]
PBL Parameterization MRF PBL [27]
Explicit Moisture Schemes Simple Ice [28]
Radiation Scheme Cloud-Radiation Interaction
Physics
Land Surface Processes Five Layer Soil Model [29]
Impact of Downscaling on Simulation of Seasonal Monsoon Rainfall The Open Atmospheric Science Journal, 2009, Volume 3 107
analysis from GPCP is also merged with the sensor data. Here, we have used the 3B42-V6 data, which is available in a spatial resolution of 0.25
0 x 0.25
0 latitude/longitude grids
and over 3 hourly temporal scales. Das et al. (2007) [24] have made a comparison between three observational data sets of rainfall (IMD 1
0x1
0 Gridded Rainfall, TRMM 3B42-
V6 and GPCP). Since, IMD data is confined only within the Indian landmass; validation of the model outputs over the seas was not possible with it. They found that between TRMM and GPCP, in most of the cases standard deviation of southwest monsoon rainfall for TRMM is higher than that for GPCP. But, it has been able to produce rainfall amount closer to that of IMD, both over the smaller regions and for whole India. Over sea, the higher rainfall amounts are pre-sent in both TRMM and GPCP. TRMM being of higher resolution (0.25
0 x 0.25
0) has succeeded in capturing the
rainfall distribution in finer details throughout the Indian Domain [24]. Therefore, for the present study, TRMM data set was selected for validation of model results.
Daily mean data of NCEP-Reanalysis II has been used here for verification of the wind and temperature fields simu-lated by the model. The goal of Reanalysis-II was to improve upon the NCEP/NCAR Reanalysis-I by fixing the errors and by updating the parameterizations of the physical processes.
They serve as the observational basis for the validation of model outputs [25].
3. RESULTS AND DISCUSSION
In this section the simulated outputs from both meso-scale and global models are compared with observations. The simulated rainfall, wind fields and temperature at 850 and 200 hPa for normal and deficient monsoon years are discussed.
3.1. Rainfall
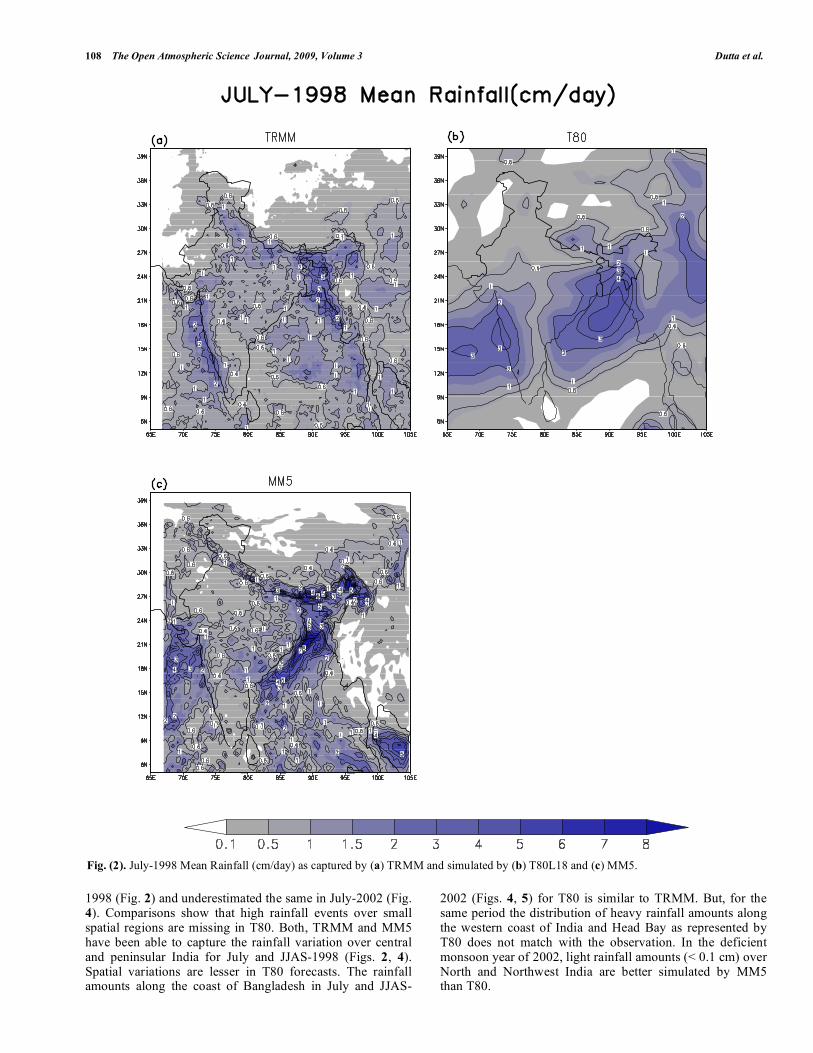
July being the main rainfall month of the southwest mon-soon season, for brevity elaborate discussions are made here only for the month of July and JJAS for the two contrasting monsoon season of 1998 (normal) and 2002 (deficient). De-tailed results of all the months for all the five years are pre-sented in Das et al. (2007) [24]. Figs. (2-5) present the spa-tial distribution of mean monthly rainfall as observed by TRMM and simulated by MM5 and T80. It is seen that T80 model has represented the rainfall maxima over western coast (8-20
0 N, 74-75.5
0 E) and Head Bay of Bengal (18-22
0
N and 87-92.50 E) fairly well in July and JJAS-1998 (Figs. 2,
4). Though, MM5 has produced a westward shift of the west-coast rainfall maxima, it better matches the rainfall amount along the west coast with the observation (Figs. 2-5). Over the Head Bay, MM5 has overestimated the rainfall in July-
Fig. (1). Domains of MM5 simulations. Shading indicates topography in km.
108 The Open Atmospheric Science Journal, 2009, Volume 3 Dutta et al.
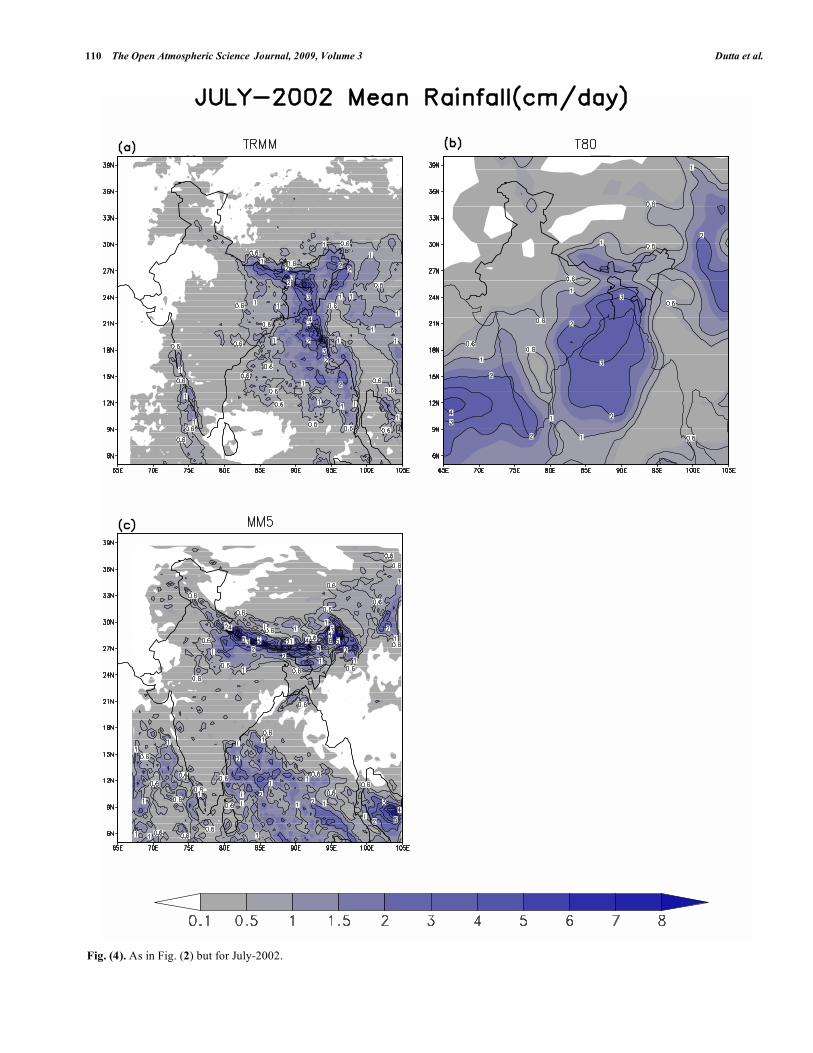
1998 (Fig. 2) and underestimated the same in July-2002 (Fig. 4). Comparisons show that high rainfall events over small spatial regions are missing in T80. Both, TRMM and MM5 have been able to capture the rainfall variation over central and peninsular India for July and JJAS-1998 (Figs. 2, 4). Spatial variations are lesser in T80 forecasts. The rainfall amounts along the coast of Bangladesh in July and JJAS-
2002 (Figs. 4, 5) for T80 is similar to TRMM. But, for the same period the distribution of heavy rainfall amounts along the western coast of India and Head Bay as represented by T80 does not match with the observation. In the deficient monsoon year of 2002, light rainfall amounts (< 0.1 cm) over North and Northwest India are better simulated by MM5 than T80.
Fig. (2). July-1998 Mean Rainfall (cm/day) as captured by (a) TRMM and simulated by (b) T80L18 and (c) MM5.
Impact of Downscaling on Simulation of Seasonal Monsoon Rainfall The Open Atmospheric Science Journal, 2009, Volume 3 109
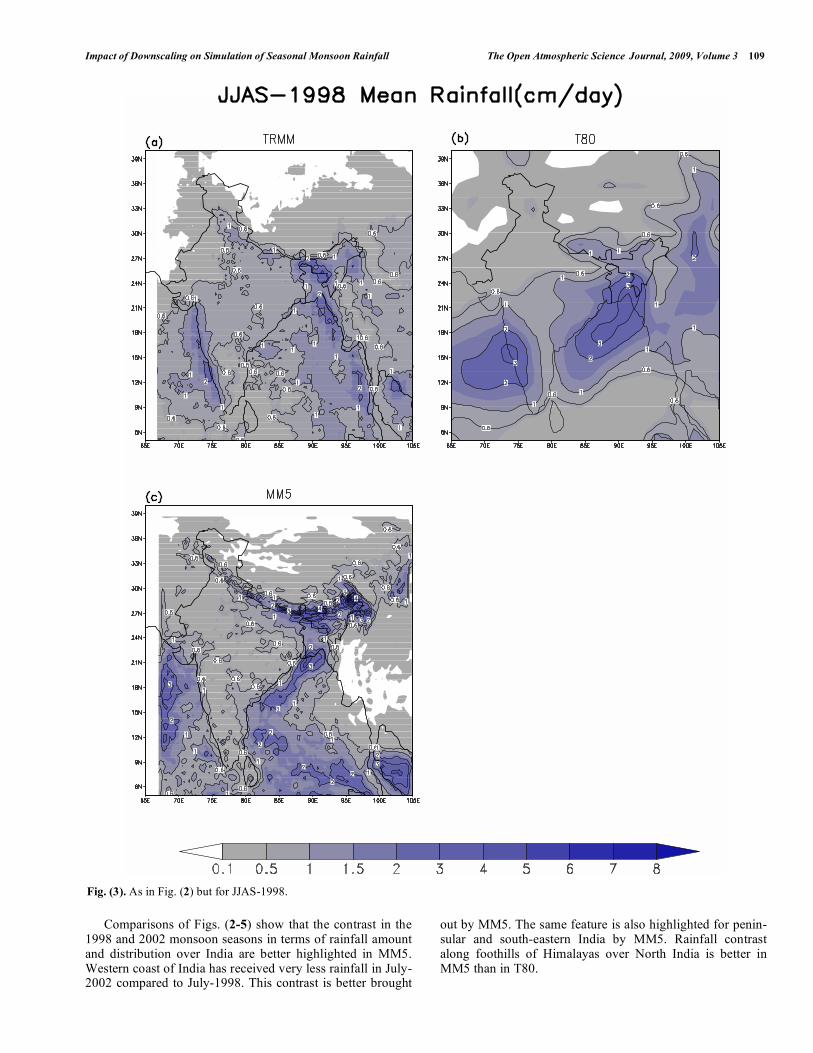
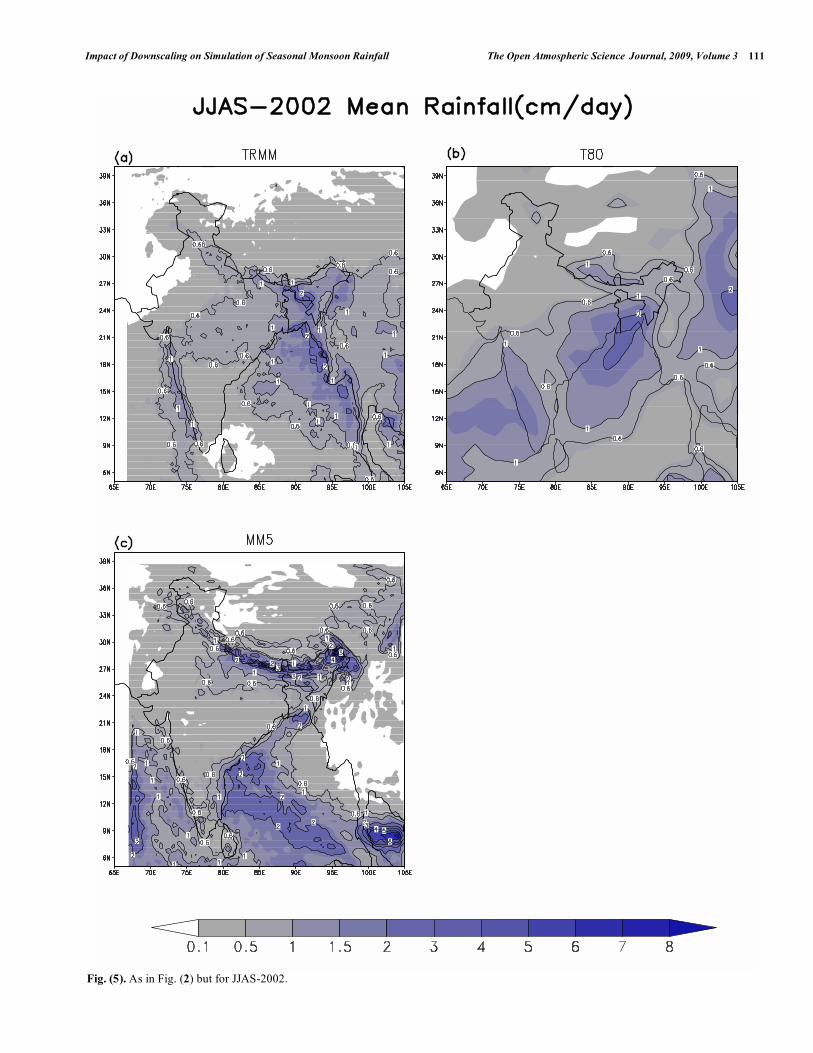
Comparisons of Figs. (2-5) show that the contrast in the 1998 and 2002 monsoon seasons in terms of rainfall amount and distribution over India are better highlighted in MM5. Western coast of India has received very less rainfall in July-2002 compared to July-1998. This contrast is better brought
out by MM5. The same feature is also highlighted for penin-sular and south-eastern India by MM5. Rainfall contrast along foothills of Himalayas over North India is better in MM5 than in T80.
Fig. (3). As in Fig. (2) but for JJAS-1998.
110 The Open Atmospheric Science Journal, 2009, Volume 3 Dutta et al.
Fig. (4). As in Fig. (2) but for July-2002.
Impact of Downscaling on Simulation of Seasonal Monsoon Rainfall The Open Atmospheric Science Journal, 2009, Volume 3 111
Fig. (5). As in Fig. (2) but for JJAS-2002.
112 The Open Atmospheric Science Journal, 2009, Volume 3 Dutta et al.
It is seen that for all the five years (1998-2002) (figures not shown), MM5 has persistently produced good amount of rainfall in the foothills of the Himalayas, mostly along Nepal to Northeastern India, especially in the month of July [24]. This feature is almost absent in T80. For, the good monsoon years (1998-2001) this is a positive feature represented by MM5, but for the deficient monsoon year of 2002, T80 is in edge over MM5. However, T80 is unable to produce the heavy rainfall events over the North and Northeastern India. Owing to coarser resolution, the finer spatial variations of rainfall are absent in T80 model simulations.
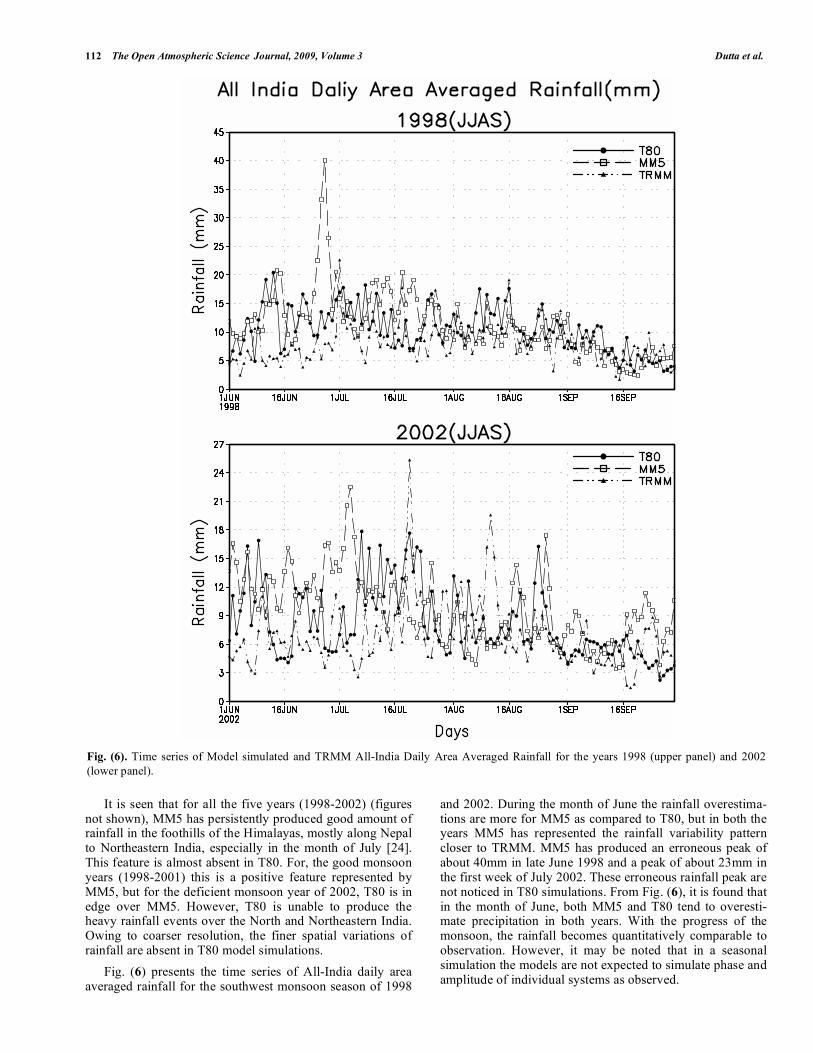
Fig. (6) presents the time series of All-India daily area averaged rainfall for the southwest monsoon season of 1998
and 2002. During the month of June the rainfall overestima-tions are more for MM5 as compared to T80, but in both the years MM5 has represented the rainfall variability pattern closer to TRMM. MM5 has produced an erroneous peak of about 40mm in late June 1998 and a peak of about 23mm in the first week of July 2002. These erroneous rainfall peak are not noticed in T80 simulations. From Fig. (6), it is found that in the month of June, both MM5 and T80 tend to overesti-mate precipitation in both years. With the progress of the monsoon, the rainfall becomes quantitatively comparable to observation. However, it may be noted that in a seasonal simulation the models are not expected to simulate phase and amplitude of individual systems as observed.
Fig. (6). Time series of Model simulated and TRMM All-India Daily Area Averaged Rainfall for the years 1998 (upper panel) and 2002
(lower panel).
Impact of Downscaling on Simulation of Seasonal Monsoon Rainfall The Open Atmospheric Science Journal, 2009, Volume 3 113
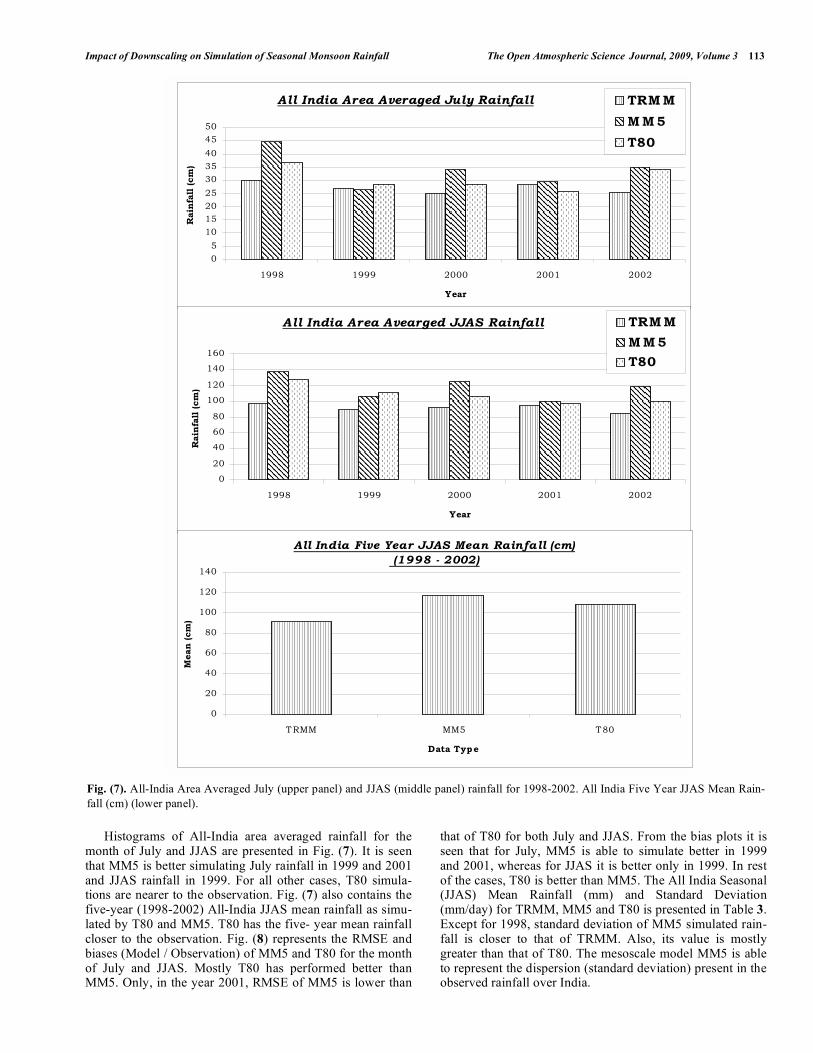
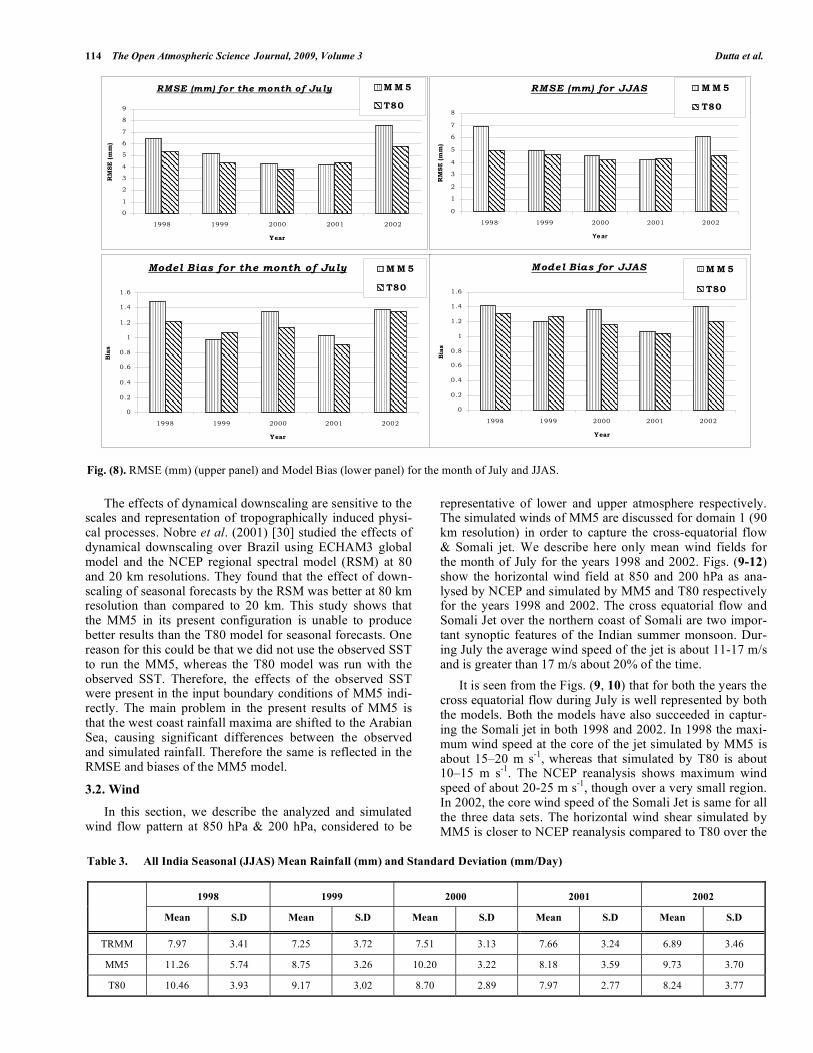
Histograms of All-India area averaged rainfall for the month of July and JJAS are presented in Fig. (7). It is seen that MM5 is better simulating July rainfall in 1999 and 2001 and JJAS rainfall in 1999. For all other cases, T80 simula-tions are nearer to the observation. Fig. (7) also contains the five-year (1998-2002) All-India JJAS mean rainfall as simu-lated by T80 and MM5. T80 has the five- year mean rainfall closer to the observation. Fig. (8) represents the RMSE and biases (Model / Observation) of MM5 and T80 for the month of July and JJAS. Mostly T80 has performed better than MM5. Only, in the year 2001, RMSE of MM5 is lower than
that of T80 for both July and JJAS. From the bias plots it is seen that for July, MM5 is able to simulate better in 1999 and 2001, whereas for JJAS it is better only in 1999. In rest of the cases, T80 is better than MM5. The All India Seasonal (JJAS) Mean Rainfall (mm) and Standard Deviation (mm/day) for TRMM, MM5 and T80 is presented in Table 3. Except for 1998, standard deviation of MM5 simulated rain-fall is closer to that of TRMM. Also, its value is mostly greater than that of T80. The mesoscale model MM5 is able to represent the dispersion (standard deviation) present in the observed rainfall over India.
Fig. (7). All-India Area Averaged July (upper panel) and JJAS (middle panel) rainfall for 1998-2002. All India Five Year JJAS Mean Rain-
fall (cm) (lower panel).
All India Area Averaged July Rainfall
05101520253035404550
1998 1999 2000 2001 2002
Year
Rai
nfal
l (cm
)
TRM MM M 5T80
All India Area Avearged JJAS Rainfall
0
20
40
60
80
100
120
140
160
1998 1999 2000 2001 2002
Year
Rai
nfal
l (cm
)
TRM MM M 5T80
All India Five Year JJAS Mean Rainfall (cm) (1998 - 2002)
0
20
40
60
80
100
120
140
TRMM MM5 T80
Data Type
Mea
n (c
m)
114 The Open Atmospheric Science Journal, 2009, Volume 3 Dutta et al.
The effects of dynamical downscaling are sensitive to the scales and representation of tropographically induced physi-cal processes. Nobre et al. (2001) [30] studied the effects of dynamical downscaling over Brazil using ECHAM3 global model and the NCEP regional spectral model (RSM) at 80 and 20 km resolutions. They found that the effect of down-scaling of seasonal forecasts by the RSM was better at 80 km resolution than compared to 20 km. This study shows that the MM5 in its present configuration is unable to produce better results than the T80 model for seasonal forecasts. One reason for this could be that we did not use the observed SST to run the MM5, whereas the T80 model was run with the observed SST. Therefore, the effects of the observed SST were present in the input boundary conditions of MM5 indi-rectly. The main problem in the present results of MM5 is that the west coast rainfall maxima are shifted to the Arabian Sea, causing significant differences between the observed and simulated rainfall. Therefore the same is reflected in the RMSE and biases of the MM5 model.
3.2. Wind
In this section, we describe the analyzed and simulated wind flow pattern at 850 hPa & 200 hPa, considered to be
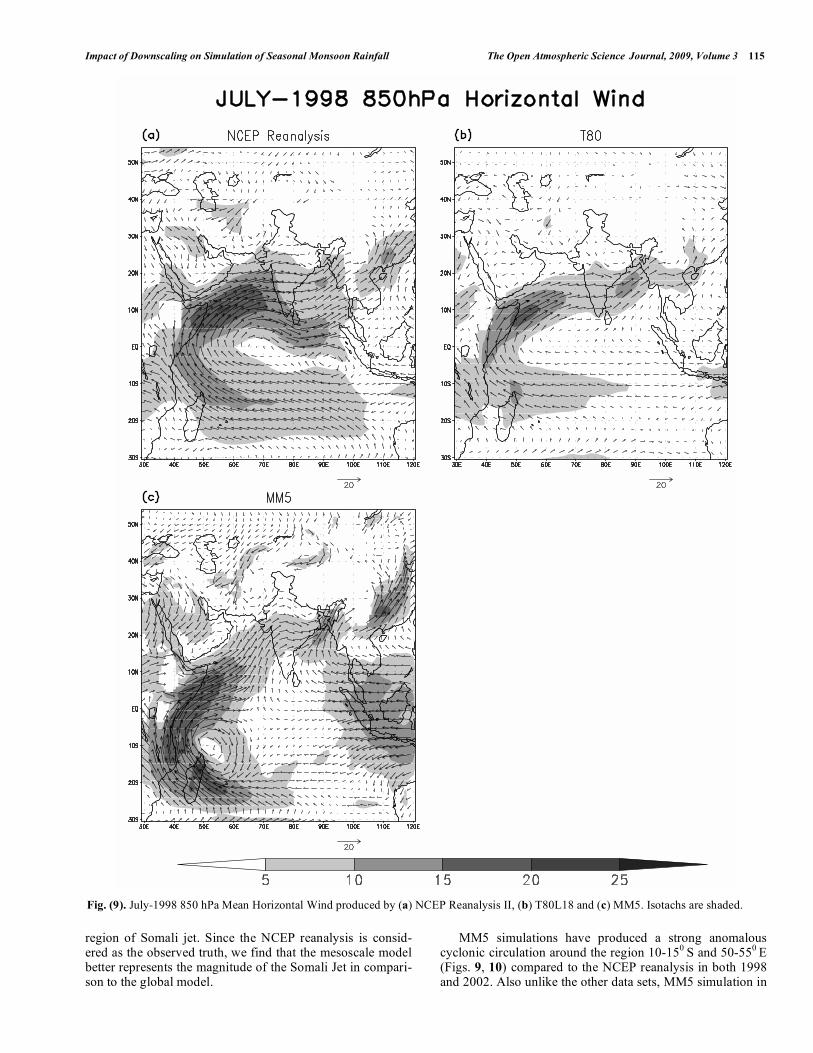
representative of lower and upper atmosphere respectively. The simulated winds of MM5 are discussed for domain 1 (90 km resolution) in order to capture the cross-equatorial flow & Somali jet. We describe here only mean wind fields for the month of July for the years 1998 and 2002. Figs. (9-12) show the horizontal wind field at 850 and 200 hPa as ana-lysed by NCEP and simulated by MM5 and T80 respectively for the years 1998 and 2002. The cross equatorial flow and Somali Jet over the northern coast of Somali are two impor-tant synoptic features of the Indian summer monsoon. Dur-ing July the average wind speed of the jet is about 11-17 m/s and is greater than 17 m/s about 20% of the time.
It is seen from the Figs. (9, 10) that for both the years the cross equatorial flow during July is well represented by both the models. Both the models have also succeeded in captur-ing the Somali jet in both 1998 and 2002. In 1998 the maxi-mum wind speed at the core of the jet simulated by MM5 is about 15–20 m s
-1, whereas that simulated by T80 is about
10–15 m s-1
. The NCEP reanalysis shows maximum wind speed of about 20-25 m s
-1, though over a very small region.
In 2002, the core wind speed of the Somali Jet is same for all the three data sets. The horizontal wind shear simulated by MM5 is closer to NCEP reanalysis compared to T80 over the
Fig. (8). RMSE (mm) (upper panel) and Model Bias (lower panel) for the month of July and JJAS.
Table 3. All India Seasonal (JJAS) Mean Rainfall (mm) and Standard Deviation (mm/Day)
1998 1999 2000 2001 2002
Mean S.D Mean S.D Mean S.D Mean S.D Mean S.D
TRMM 7.97 3.41 7.25 3.72 7.51 3.13 7.66 3.24 6.89 3.46
MM5 11.26 5.74 8.75 3.26 10.20 3.22 8.18 3.59 9.73 3.70
T80 10.46 3.93 9.17 3.02 8.70 2.89 7.97 2.77 8.24 3.77
RMSE (mm) for the month of July
0
1
2
3
4
5
6
7
8
9
1998 1999 2000 2001 2002
Year
RM
SE (m
m)
M M 5
T80
RMSE (mm) for JJAS
0
1
2
3
4
5
6
7
8
1998 1999 2000 2001 2002
Year
RM
SE (m
m)
M M 5
T80
Model Bias for the month of July
0
0.2
0.4
0.6
0.8
1
1.2
1.4
1.6
1998 1999 2000 2001 2002
Year
Bia
s
M M 5
T80
Model Bias for JJAS
0
0.2
0.4
0.6
0.8
1
1.2
1.4
1.6
1998 1999 2000 2001 2002
YearB
ias
M M 5
T80
Impact of Downscaling on Simulation of Seasonal Monsoon Rainfall The Open Atmospheric Science Journal, 2009, Volume 3 115
region of Somali jet. Since the NCEP reanalysis is consid-ered as the observed truth, we find that the mesoscale model better represents the magnitude of the Somali Jet in compari-son to the global model.
MM5 simulations have produced a strong anomalous cyclonic circulation around the region 10-15
0 S and 50-55
0 E
(Figs. 9, 10) compared to the NCEP reanalysis in both 1998 and 2002. Also unlike the other data sets, MM5 simulation in
Fig. (9). July-1998 850 hPa Mean Horizontal Wind produced by (a) NCEP Reanalysis II, (b) T80L18 and (c) MM5. Isotachs are shaded.
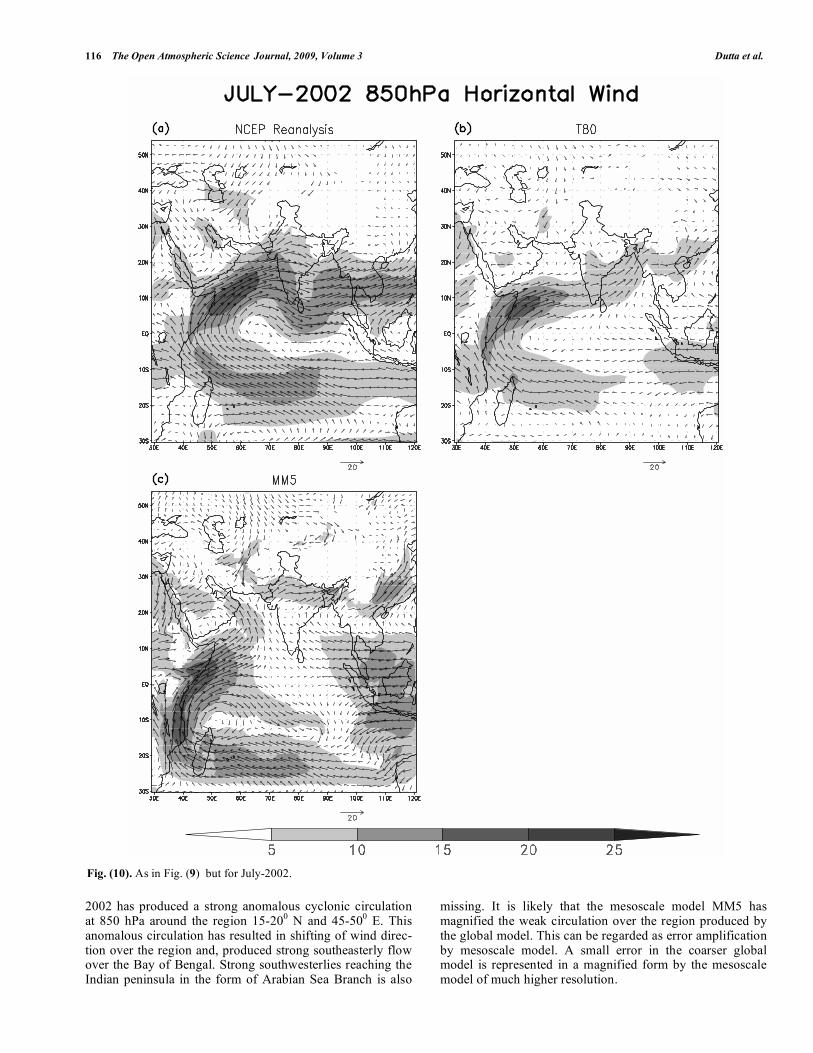
116 The Open Atmospheric Science Journal, 2009, Volume 3 Dutta et al.
2002 has produced a strong anomalous cyclonic circulation at 850 hPa around the region 15-20
0 N and 45-50
0 E. This
anomalous circulation has resulted in shifting of wind direc-tion over the region and, produced strong southeasterly flow over the Bay of Bengal. Strong southwesterlies reaching the Indian peninsula in the form of Arabian Sea Branch is also
missing. It is likely that the mesoscale model MM5 has magnified the weak circulation over the region produced by the global model. This can be regarded as error amplification by mesoscale model. A small error in the coarser global model is represented in a magnified form by the mesoscale model of much higher resolution.
Fig. (10). As in Fig. (9) but for July-2002.
Impact of Downscaling on Simulation of Seasonal Monsoon Rainfall The Open Atmospheric Science Journal, 2009, Volume 3 117
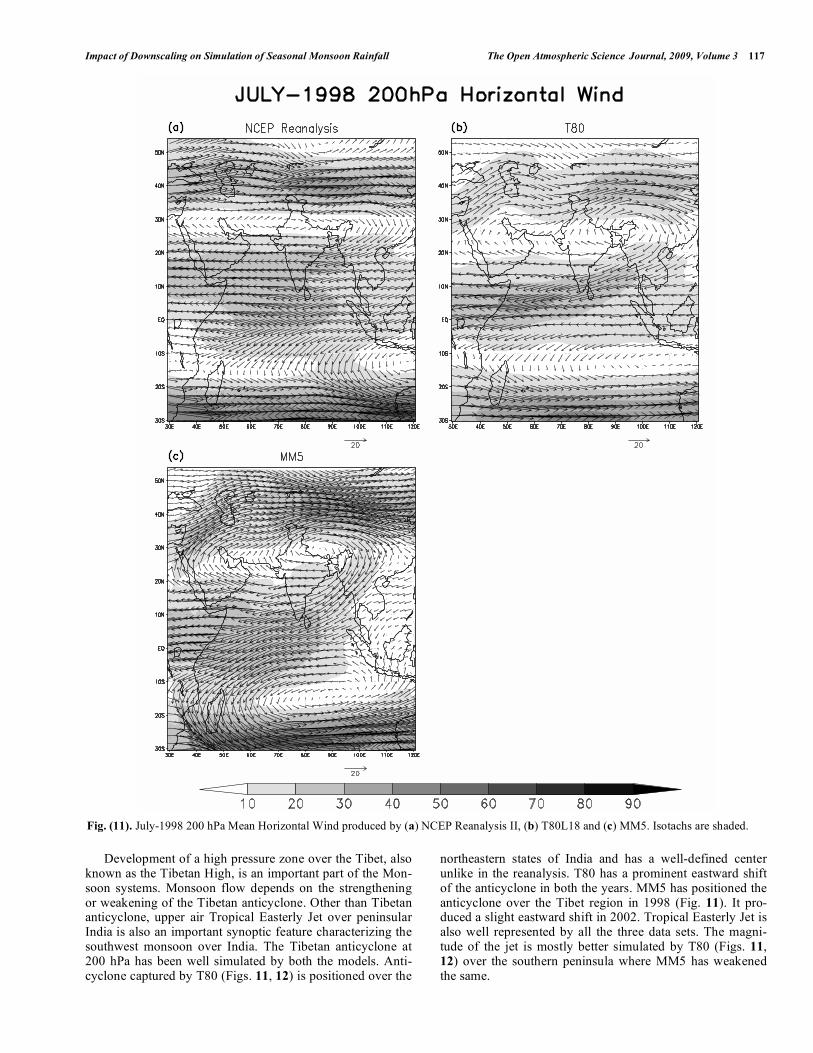
Development of a high pressure zone over the Tibet, also known as the Tibetan High, is an important part of the Mon-soon systems. Monsoon flow depends on the strengthening or weakening of the Tibetan anticyclone. Other than Tibetan anticyclone, upper air Tropical Easterly Jet over peninsular India is also an important synoptic feature characterizing the southwest monsoon over India. The Tibetan anticyclone at 200 hPa has been well simulated by both the models. Anti-cyclone captured by T80 (Figs. 11, 12) is positioned over the
northeastern states of India and has a well-defined center unlike in the reanalysis. T80 has a prominent eastward shift of the anticyclone in both the years. MM5 has positioned the anticyclone over the Tibet region in 1998 (Fig. 11). It pro-duced a slight eastward shift in 2002. Tropical Easterly Jet is also well represented by all the three data sets. The magni-tude of the jet is mostly better simulated by T80 (Figs. 11, 12) over the southern peninsula where MM5 has weakened the same.
Fig. (11). July-1998 200 hPa Mean Horizontal Wind produced by (a) NCEP Reanalysis II, (b) T80L18 and (c) MM5. Isotachs are shaded.
118 The Open Atmospheric Science Journal, 2009, Volume 3 Dutta et al.
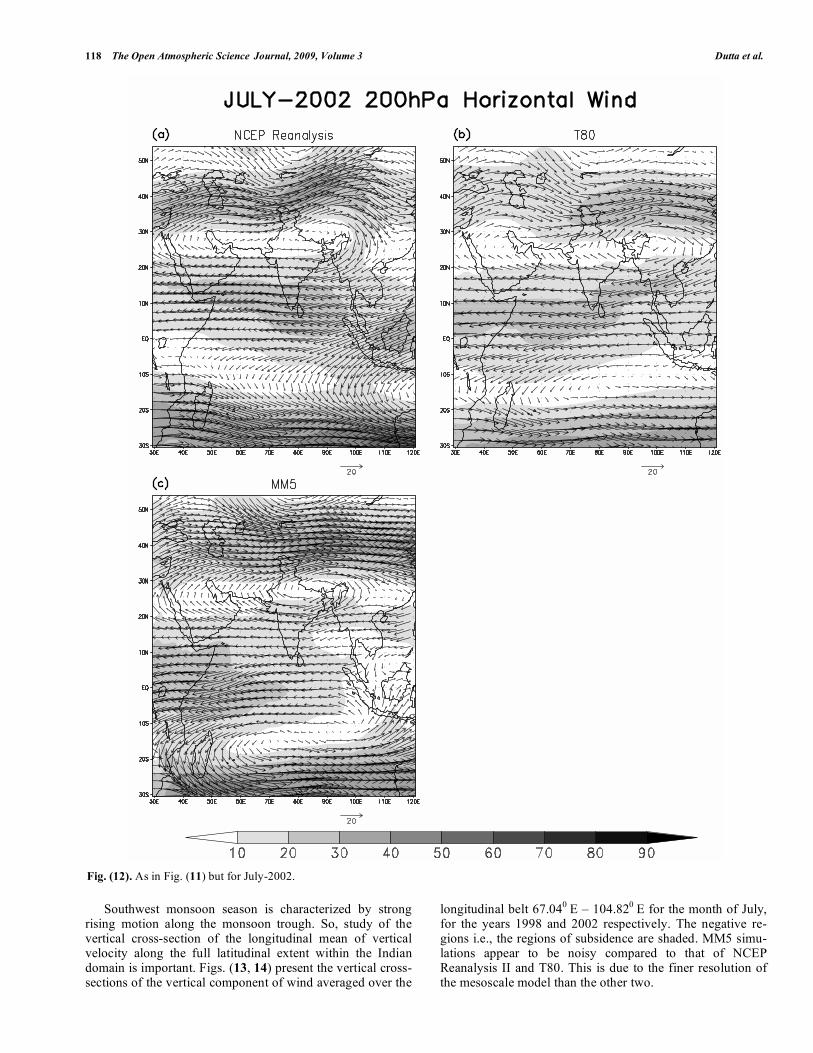
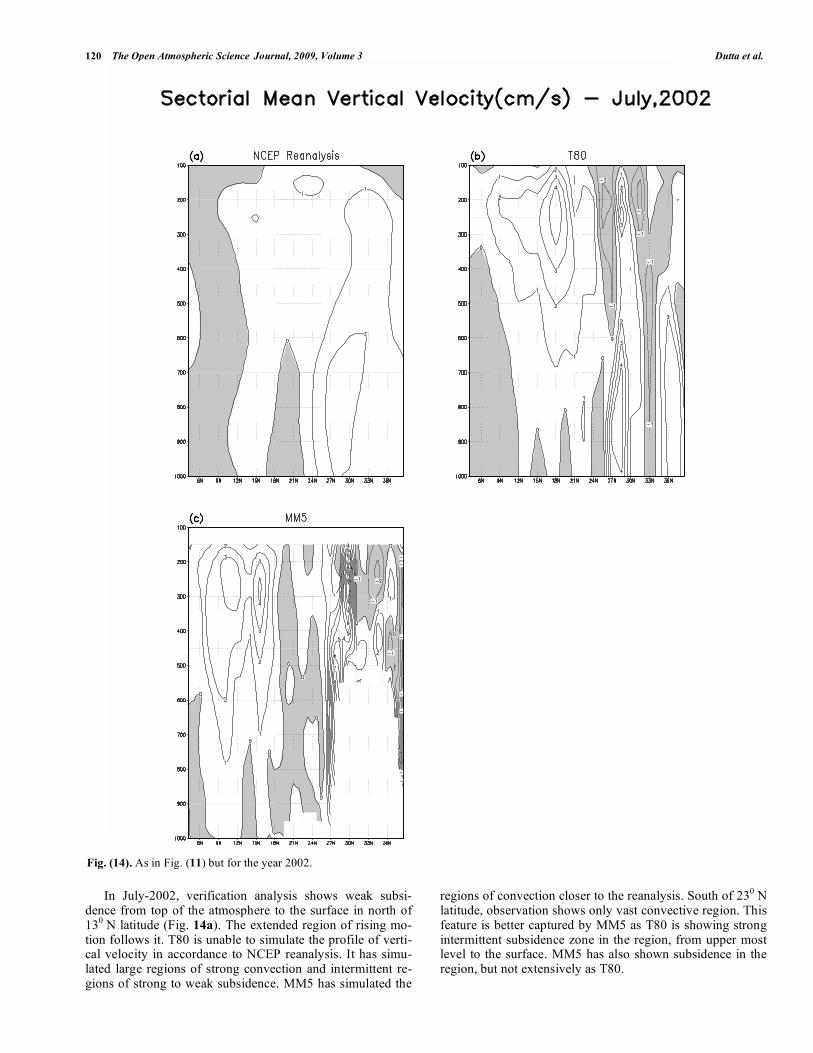
Southwest monsoon season is characterized by strong rising motion along the monsoon trough. So, study of the vertical cross-section of the longitudinal mean of vertical velocity along the full latitudinal extent within the Indian domain is important. Figs. (13, 14) present the vertical cross-sections of the vertical component of wind averaged over the
longitudinal belt 67.040
E – 104.820
E for the month of July, for the years 1998 and 2002 respectively. The negative re-gions i.e., the regions of subsidence are shaded. MM5 simu-lations appear to be noisy compared to that of NCEP Reanalysis II and T80. This is due to the finer resolution of the mesoscale model than the other two.
Fig. (12). As in Fig. (11) but for July-2002.
Impact of Downscaling on Simulation of Seasonal Monsoon Rainfall The Open Atmospheric Science Journal, 2009, Volume 3 119
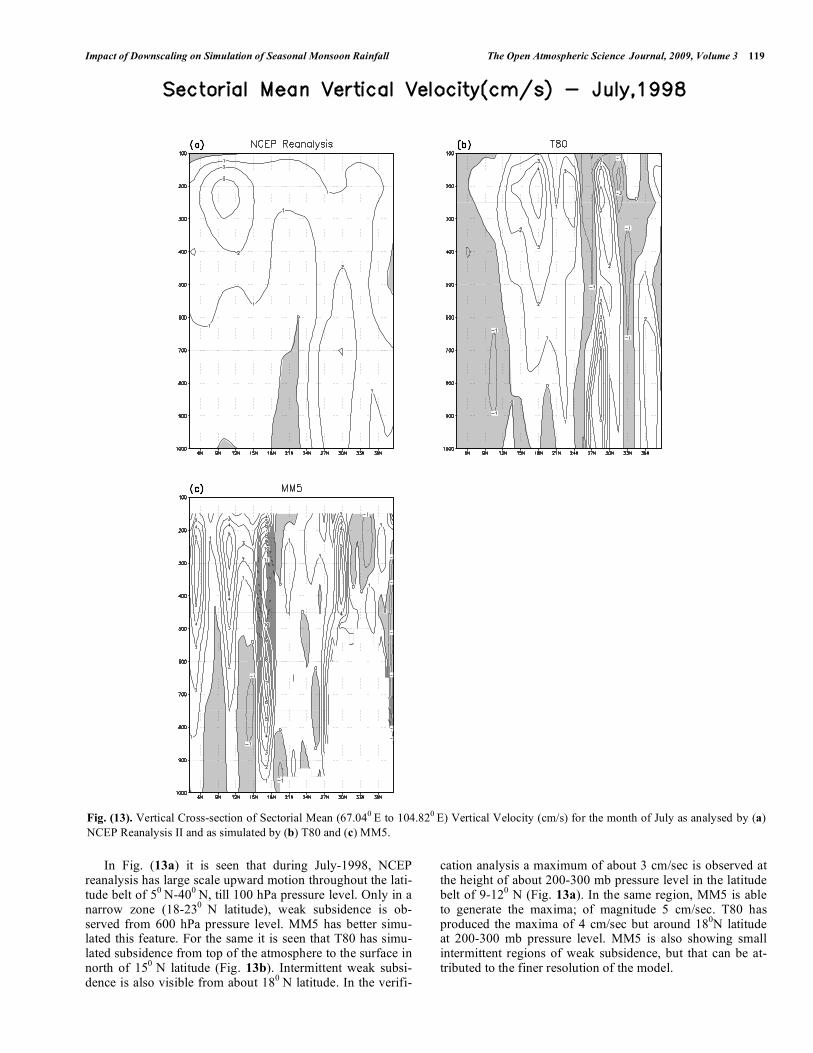
In Fig. (13a) it is seen that during July-1998, NCEP reanalysis has large scale upward motion throughout the lati-tude belt of 5
0 N-40
0 N, till 100 hPa pressure level. Only in a
narrow zone (18-230
N latitude), weak subsidence is ob-served from 600 hPa pressure level. MM5 has better simu-lated this feature. For the same it is seen that T80 has simu-lated subsidence from top of the atmosphere to the surface in north of 15
0 N latitude (Fig. 13b). Intermittent weak subsi-
dence is also visible from about 180
N latitude. In the verifi-
cation analysis a maximum of about 3 cm/sec is observed at the height of about 200-300 mb pressure level in the latitude belt of 9-12
0 N (Fig. 13a). In the same region, MM5 is able
to generate the maxima; of magnitude 5 cm/sec. T80 has produced the maxima of 4 cm/sec but around 18
0N latitude
at 200-300 mb pressure level. MM5 is also showing small intermittent regions of weak subsidence, but that can be at-tributed to the finer resolution of the model.
Fig. (13). Vertical Cross-section of Sectorial Mean (67.040
E to 104.820
E) Vertical Velocity (cm/s) for the month of July as analysed by (a)
NCEP Reanalysis II and as simulated by (b) T80 and (c) MM5.
120 The Open Atmospheric Science Journal, 2009, Volume 3 Dutta et al.
In July-2002, verification analysis shows weak subsi-dence from top of the atmosphere to the surface in north of 13
0 N latitude (Fig. 14a). The extended region of rising mo-
tion follows it. T80 is unable to simulate the profile of verti-cal velocity in accordance to NCEP reanalysis. It has simu-lated large regions of strong convection and intermittent re-gions of strong to weak subsidence. MM5 has simulated the
regions of convection closer to the reanalysis. South of 230 N
latitude, observation shows only vast convective region. This feature is better captured by MM5 as T80 is showing strong intermittent subsidence zone in the region, from upper most level to the surface. MM5 has also shown subsidence in the region, but not extensively as T80.
Fig. (14). As in Fig. (11) but for the year 2002.
Impact of Downscaling on Simulation of Seasonal Monsoon Rainfall The Open Atmospheric Science Journal, 2009, Volume 3 121
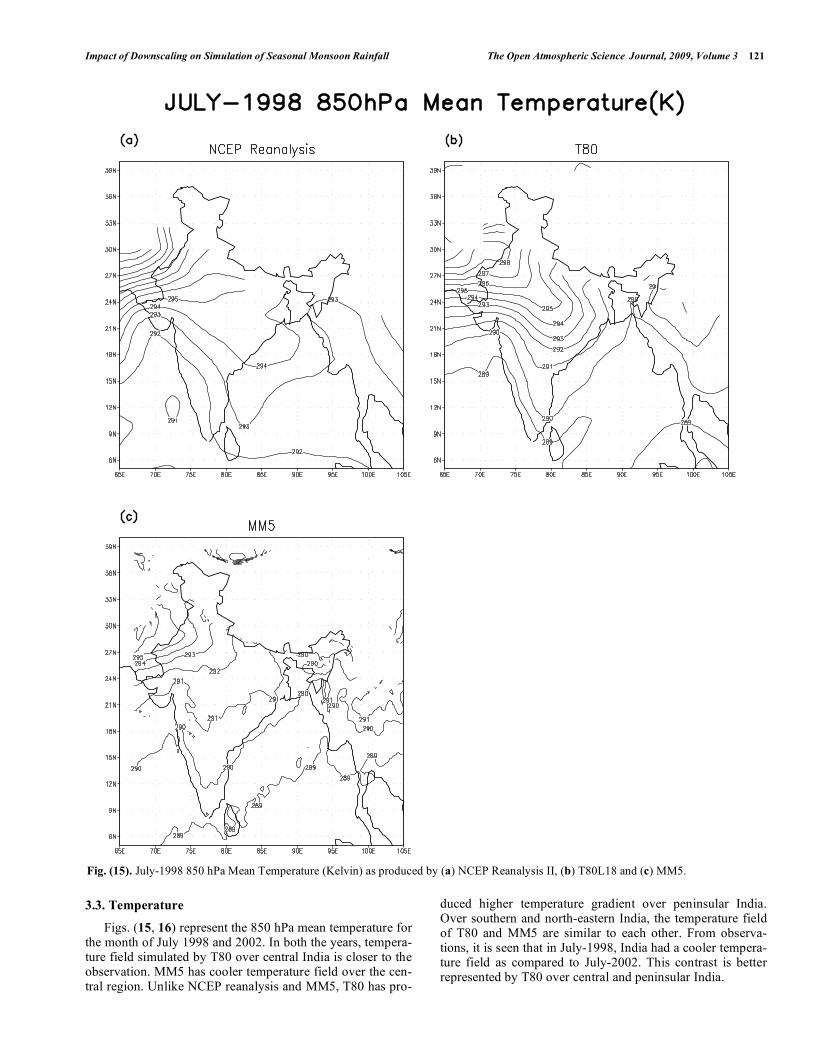
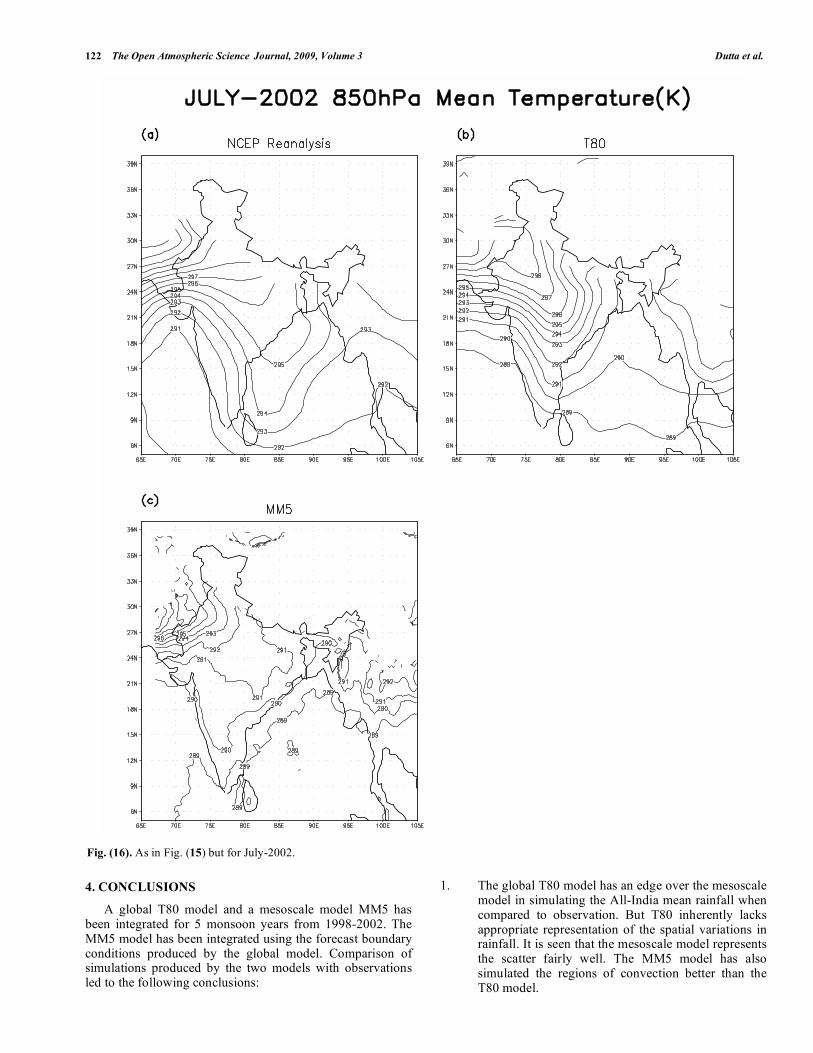
3.3. Temperature
Figs. (15, 16) represent the 850 hPa mean temperature for the month of July 1998 and 2002. In both the years, tempera-ture field simulated by T80 over central India is closer to the observation. MM5 has cooler temperature field over the cen-tral region. Unlike NCEP reanalysis and MM5, T80 has pro-
duced higher temperature gradient over peninsular India. Over southern and north-eastern India, the temperature field of T80 and MM5 are similar to each other. From observa-tions, it is seen that in July-1998, India had a cooler tempera-ture field as compared to July-2002. This contrast is better represented by T80 over central and peninsular India.
Fig. (15). July-1998 850 hPa Mean Temperature (Kelvin) as produced by (a) NCEP Reanalysis II, (b) T80L18 and (c) MM5.
122 The Open Atmospheric Science Journal, 2009, Volume 3 Dutta et al.
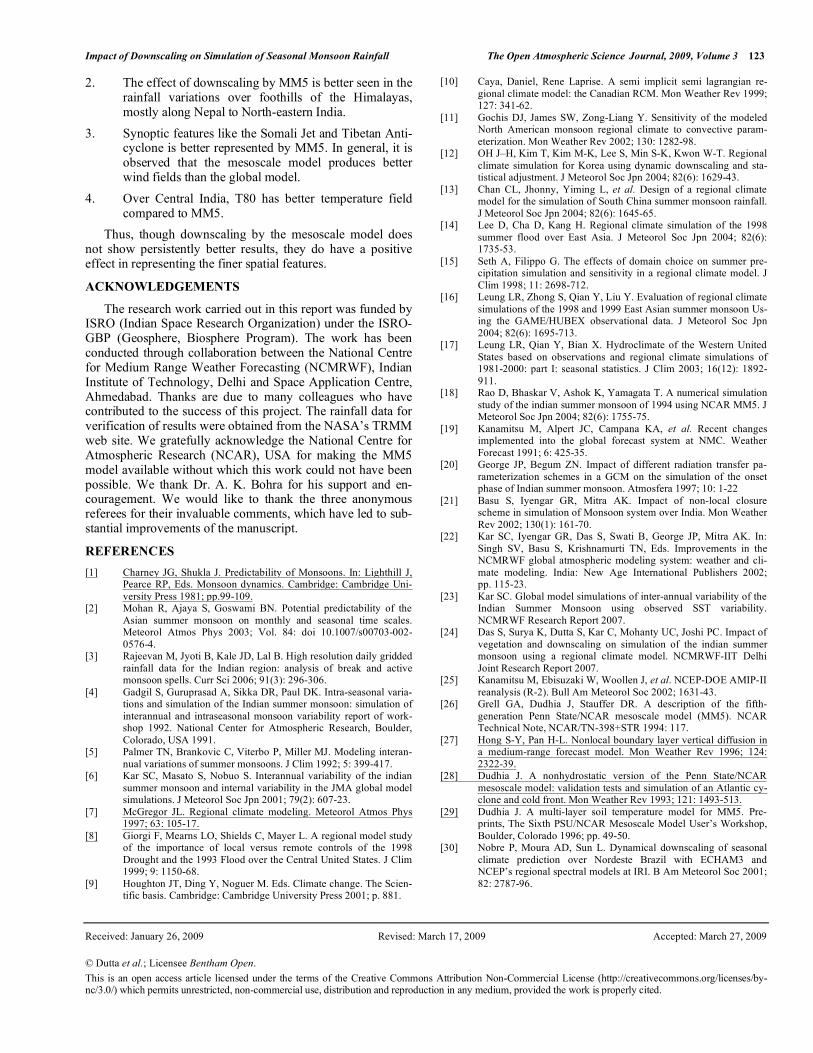
4. CONCLUSIONS
A global T80 model and a mesoscale model MM5 has been integrated for 5 monsoon years from 1998-2002. The MM5 model has been integrated using the forecast boundary conditions produced by the global model. Comparison of simulations produced by the two models with observations led to the following conclusions:
1. The global T80 model has an edge over the mesoscale model in simulating the All-India mean rainfall when compared to observation. But T80 inherently lacks appropriate representation of the spatial variations in rainfall. It is seen that the mesoscale model represents the scatter fairly well. The MM5 model has also simulated the regions of convection better than the T80 model.
Fig. (16). As in Fig. (15) but for July-2002.
Impact of Downscaling on Simulation of Seasonal Monsoon Rainfall The Open Atmospheric Science Journal, 2009, Volume 3 123
2. The effect of downscaling by MM5 is better seen in the rainfall variations over foothills of the Himalayas, mostly along Nepal to North-eastern India.
3. Synoptic features like the Somali Jet and Tibetan Anti-cyclone is better represented by MM5. In general, it is observed that the mesoscale model produces better wind fields than the global model.
4. Over Central India, T80 has better temperature field compared to MM5.
Thus, though downscaling by the mesoscale model does not show persistently better results, they do have a positive effect in representing the finer spatial features.
ACKNOWLEDGEMENTS
The research work carried out in this report was funded by ISRO (Indian Space Research Organization) under the ISRO-GBP (Geosphere, Biosphere Program). The work has been conducted through collaboration between the National Centre for Medium Range Weather Forecasting (NCMRWF), Indian Institute of Technology, Delhi and Space Application Centre, Ahmedabad. Thanks are due to many colleagues who have contributed to the success of this project. The rainfall data for verification of results were obtained from the NASA’s TRMM web site. We gratefully acknowledge the National Centre for Atmospheric Research (NCAR), USA for making the MM5 model available without which this work could not have been possible. We thank Dr. A. K. Bohra for his support and en-couragement. We would like to thank the three anonymous referees for their invaluable comments, which have led to sub-stantial improvements of the manuscript.
REFERENCES
[1] Charney JG, Shukla J. Predictability of Monsoons. In: Lighthill J, Pearce RP, Eds. Monsoon dynamics. Cambridge: Cambridge Uni-
versity Press 1981; pp.99-109. [2] Mohan R, Ajaya S, Goswami BN. Potential predictability of the
Asian summer monsoon on monthly and seasonal time scales. Meteorol Atmos Phys 2003; Vol. 84: doi 10.1007/s00703-002-
0576-4. [3] Rajeevan M, Jyoti B, Kale JD, Lal B. High resolution daily gridded
rainfall data for the Indian region: analysis of break and active monsoon spells. Curr Sci 2006; 91(3): 296-306.
[4] Gadgil S, Guruprasad A, Sikka DR, Paul DK. Intra-seasonal varia-tions and simulation of the Indian summer monsoon: simulation of
interannual and intraseasonal monsoon variability report of work-shop 1992. National Center for Atmospheric Research, Boulder,
Colorado, USA 1991. [5] Palmer TN, Brankovic C, Viterbo P, Miller MJ. Modeling interan-
nual variations of summer monsoons. J Clim 1992; 5: 399-417. [6] Kar SC, Masato S, Nobuo S. Interannual variability of the indian
summer monsoon and internal variability in the JMA global model simulations. J Meteorol Soc Jpn 2001; 79(2): 607-23.
[7] McGregor JL. Regional climate modeling. Meteorol Atmos Phys 1997; 63: 105-17.
[8] Giorgi F, Mearns LO, Shields C, Mayer L. A regional model study of the importance of local versus remote controls of the 1998
Drought and the 1993 Flood over the Central United States. J Clim 1999; 9: 1150-68.
[9] Houghton JT, Ding Y, Noguer M. Eds. Climate change. The Scien-tific basis. Cambridge: Cambridge University Press 2001; p. 881.
[10] Caya, Daniel, Rene Laprise. A semi implicit semi lagrangian re-
gional climate model: the Canadian RCM. Mon Weather Rev 1999; 127: 341-62.
[11] Gochis DJ, James SW, Zong-Liang Y. Sensitivity of the modeled North American monsoon regional climate to convective param-
eterization. Mon Weather Rev 2002; 130: 1282-98. [12] OH J–H, Kim T, Kim M-K, Lee S, Min S-K, Kwon W-T. Regional
climate simulation for Korea using dynamic downscaling and sta-tistical adjustment. J Meteorol Soc Jpn 2004; 82(6): 1629-43.
[13] Chan CL, Jhonny, Yiming L, et al. Design of a regional climate model for the simulation of South China summer monsoon rainfall.
J Meteorol Soc Jpn 2004; 82(6): 1645-65. [14] Lee D, Cha D, Kang H. Regional climate simulation of the 1998
summer flood over East Asia. J Meteorol Soc Jpn 2004; 82(6): 1735-53.
[15] Seth A, Filippo G. The effects of domain choice on summer pre-cipitation simulation and sensitivity in a regional climate model. J
Clim 1998; 11: 2698-712. [16] Leung LR, Zhong S, Qian Y, Liu Y. Evaluation of regional climate
simulations of the 1998 and 1999 East Asian summer monsoon Us-ing the GAME/HUBEX observational data. J Meteorol Soc Jpn
2004; 82(6): 1695-713. [17] Leung LR, Qian Y, Bian X. Hydroclimate of the Western United
States based on observations and regional climate simulations of 1981-2000: part I: seasonal statistics. J Clim 2003; 16(12): 1892-
911. [18] Rao D, Bhaskar V, Ashok K, Yamagata T. A numerical simulation
study of the indian summer monsoon of 1994 using NCAR MM5. J Meteorol Soc Jpn 2004; 82(6): 1755-75.
[19] Kanamitsu M, Alpert JC, Campana KA, et al. Recent changes implemented into the global forecast system at NMC. Weather
Forecast 1991; 6: 425-35. [20] George JP, Begum ZN. Impact of different radiation transfer pa-
rameterization schemes in a GCM on the simulation of the onset phase of Indian summer monsoon. Atmosfera 1997; 10: 1-22
[21] Basu S, Iyengar GR, Mitra AK. Impact of non-local closure scheme in simulation of Monsoon system over India. Mon Weather
Rev 2002; 130(1): 161-70. [22] Kar SC, Iyengar GR, Das S, Swati B, George JP, Mitra AK. In:
Singh SV, Basu S, Krishnamurti TN, Eds. Improvements in the NCMRWF global atmospheric modeling system: weather and cli-
mate modeling. India: New Age International Publishers 2002; pp. 115-23.
[23] Kar SC. Global model simulations of inter-annual variability of the Indian Summer Monsoon using observed SST variability.
NCMRWF Research Report 2007. [24] Das S, Surya K, Dutta S, Kar C, Mohanty UC, Joshi PC. Impact of
vegetation and downscaling on simulation of the indian summer monsoon using a regional climate model. NCMRWF-IIT Delhi
Joint Research Report 2007. [25] Kanamitsu M, Ebisuzaki W, Woollen J, et al. NCEP-DOE AMIP-II
reanalysis (R-2). Bull Am Meteorol Soc 2002; 1631-43. [26] Grell GA, Dudhia J, Stauffer DR. A description of the fifth-
generation Penn State/NCAR mesoscale model (MM5). NCAR Technical Note, NCAR/TN-398+STR 1994: 117.
[27] Hong S-Y, Pan H-L. Nonlocal boundary layer vertical diffusion in a medium-range forecast model. Mon Weather Rev 1996; 124:
2322-39. [28] Dudhia J. A nonhydrostatic version of the Penn State/NCAR
mesoscale model: validation tests and simulation of an Atlantic cy-clone and cold front. Mon Weather Rev 1993; 121: 1493-513.
[29] Dudhia J. A multi-layer soil temperature model for MM5. Pre-prints, The Sixth PSU/NCAR Mesoscale Model User’s Workshop,
Boulder, Colorado 1996; pp. 49-50. [30] Nobre P, Moura AD, Sun L. Dynamical downscaling of seasonal
climate prediction over Nordeste Brazil with ECHAM3 and NCEP’s regional spectral models at IRI. B Am Meteorol Soc 2001;
82: 2787-96.
Received: January 26, 2009 Revised: March 17, 2009 Accepted: March 27, 2009
© Dutta et al.; Licensee Bentham Open.
This is an open access article licensed under the terms of the Creative Commons Attribution Non-Commercial License (http://creativecommons.org/licenses/by-nc/3.0/) which permits unrestricted, non-commercial use, distribution and reproduction in any medium, provided the work is properly cited.