Gap flow measurements during the Mesoscale Alpine Programme
21
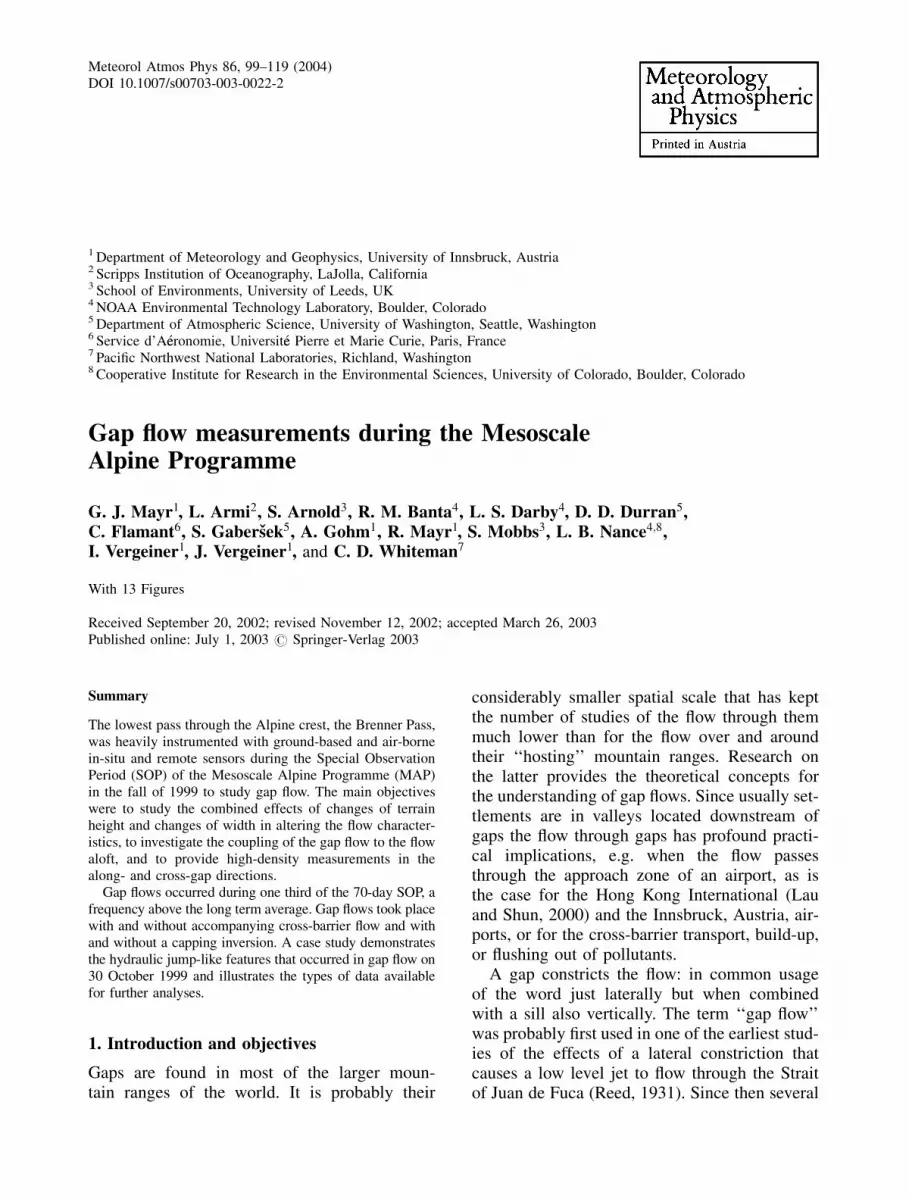
Meteorol Atmos Phys 86, 99–119 (2004) DOI 10.1007/s00703-003-0022-2 1 Department of Meteorology and Geophysics, University of Innsbruck, Austria 2 Scripps Institution of Oceanography, LaJolla, California 3 School of Environments, University of Leeds, UK 4 NOAA Environmental Technology Laboratory, Boulder, Colorado 5 Department of Atmospheric Science, University of Washington, Seattle, Washington 6 Service d’A eronomie, Universit e Pierre et Marie Curie, Paris, France 7 Pacific Northwest National Laboratories, Richland, Washington 8 Cooperative Institute for Research in the Environmental Sciences, University of Colorado, Boulder, Colorado Gap flow measurements during the Mesoscale Alpine Programme G. J. Mayr 1 , L. Armi 2 , S. Arnold 3 , R. M. Banta 4 , L. S. Darby 4 , D. D. Durran 5 , C. Flamant 6 , S. Gabers ˇek 5 , A. Gohm 1 , R. Mayr 1 , S. Mobbs 3 , L. B. Nance 4;8 , I. Vergeiner 1 , J. Vergeiner 1 , and C. D. Whiteman 7 With 13 Figures Received September 20, 2002; revised November 12, 2002; accepted March 26, 2003 Published online: July 1, 2003 # Springer-Verlag 2003 Summary The lowest pass through the Alpine crest, the Brenner Pass, was heavily instrumented with ground-based and air-borne in-situ and remote sensors during the Special Observation Period (SOP) of the Mesoscale Alpine Programme (MAP) in the fall of 1999 to study gap flow. The main objectives were to study the combined effects of changes of terrain height and changes of width in altering the flow character- istics, to investigate the coupling of the gap flow to the flow aloft, and to provide high-density measurements in the along- and cross-gap directions. Gap flows occurred during one third of the 70-day SOP, a frequency above the long term average. Gap flows took place with and without accompanying cross-barrier flow and with and without a capping inversion. A case study demonstrates the hydraulic jump-like features that occurred in gap flow on 30 October 1999 and illustrates the types of data available for further analyses. 1. Introduction and objectives Gaps are found in most of the larger moun- tain ranges of the world. It is probably their considerably smaller spatial scale that has kept the number of studies of the flow through them much lower than for the flow over and around their ‘‘hosting’’ mountain ranges. Research on the latter provides the theoretical concepts for the understanding of gap flows. Since usually set- tlements are in valleys located downstream of gaps the flow through gaps has profound practi- cal implications, e.g. when the flow passes through the approach zone of an airport, as is the case for the Hong Kong International (Lau and Shun, 2000) and the Innsbruck, Austria, air- ports, or for the cross-barrier transport, build-up, or flushing out of pollutants. A gap constricts the flow: in common usage of the word just laterally but when combined with a sill also vertically. The term ‘‘gap flow’’ was probably first used in one of the earliest stud- ies of the effects of a lateral constriction that causes a low level jet to flow through the Strait of Juan de Fuca (Reed, 1931). Since then several
-
Upload
independent -
Category
Documents
-
view
2 -
download
0
Transcript of Gap flow measurements during the Mesoscale Alpine Programme
Meteorol Atmos Phys 86, 99–119 (2004)DOI 10.1007/s00703-003-0022-2
1 Department of Meteorology and Geophysics, University of Innsbruck, Austria2 Scripps Institution of Oceanography, LaJolla, California3 School of Environments, University of Leeds, UK4 NOAA Environmental Technology Laboratory, Boulder, Colorado5 Department of Atmospheric Science, University of Washington, Seattle, Washington6 Service d’A�eeronomie, Universit�ee Pierre et Marie Curie, Paris, France7 Pacific Northwest National Laboratories, Richland, Washington8 Cooperative Institute for Research in the Environmental Sciences, University of Colorado, Boulder, Colorado
Gap flow measurements during the MesoscaleAlpine Programme
G. J. Mayr1, L. Armi2, S. Arnold3, R. M. Banta4, L. S. Darby4, D. D. Durran5,C. Flamant6, S. Gabersek5, A. Gohm1, R. Mayr1, S. Mobbs3, L. B. Nance4;8,I. Vergeiner1, J. Vergeiner1, and C. D. Whiteman7
With 13 Figures
Received September 20, 2002; revised November 12, 2002; accepted March 26, 2003Published online: July 1, 2003 # Springer-Verlag 2003
Summary
The lowest pass through the Alpine crest, the Brenner Pass,was heavily instrumented with ground-based and air-bornein-situ and remote sensors during the Special ObservationPeriod (SOP) of the Mesoscale Alpine Programme (MAP)in the fall of 1999 to study gap flow. The main objectiveswere to study the combined effects of changes of terrainheight and changes of width in altering the flow character-istics, to investigate the coupling of the gap flow to the flowaloft, and to provide high-density measurements in thealong- and cross-gap directions.
Gap flows occurred during one third of the 70-day SOP, afrequency above the long term average. Gap flows took placewith and without accompanying cross-barrier flow and withand without a capping inversion. A case study demonstratesthe hydraulic jump-like features that occurred in gap flow on30 October 1999 and illustrates the types of data availablefor further analyses.
1. Introduction and objectives
Gaps are found in most of the larger moun-tain ranges of the world. It is probably their
considerably smaller spatial scale that has keptthe number of studies of the flow through themmuch lower than for the flow over and aroundtheir ‘‘hosting’’ mountain ranges. Research onthe latter provides the theoretical concepts forthe understanding of gap flows. Since usually set-tlements are in valleys located downstream ofgaps the flow through gaps has profound practi-cal implications, e.g. when the flow passesthrough the approach zone of an airport, as isthe case for the Hong Kong International (Lauand Shun, 2000) and the Innsbruck, Austria, air-ports, or for the cross-barrier transport, build-up,or flushing out of pollutants.
A gap constricts the flow: in common usageof the word just laterally but when combinedwith a sill also vertically. The term ‘‘gap flow’’was probably first used in one of the earliest stud-ies of the effects of a lateral constriction thatcauses a low level jet to flow through the Straitof Juan de Fuca (Reed, 1931). Since then several
observational studies, mostly for lateral constric-tions occurring in fjords and straits, have beenundertaken, most of which are summarized byPan and Smith (1999).
While linear theory, a mainstay in the simpli-fied treatment of flow over mountains, has beenshown to fail (Pan and Smith, 1999) to adequate-ly describe the characteristics of gap flows,hydraulic theory (atmospheric scientists usuallyprefer the unwieldier term ‘‘reduced-gravityshallow water theory’’) has been successfully ap-plied (e.g. Pettre, 1982; Armi and Williams,1983; Jackson and Steyn, 1994; Pan and Smith,1999; Farmer and Armi, 1999). The success ofhydraulic theory relies on the small vertical ex-tent of most gap flows and their frequent decou-pling from the flow aloft through inversions.
In the simplest case, hydraulic models are ap-plied to a single layer of fluid of constant densitythat is topped by a passive layer. Of interest to usare situations that lead to jets on the downstreamside of a pass. The most frequent situation isasymmetrical with respect to the gap as it hasthick, relatively slow (‘‘subcritical’’) flow onthe upstream side and thin rapid (‘‘supercriti-cal’’) flow on the donwstream side. It is the ex-istence of a contraction that uniquely determinesthe solution. The gap is said to ‘‘control’’ theflow: for a given upstream depth of the fluid, onlyone particular (‘‘critical’’) flow rate through thecontraction is possible; similarly, a given flowrate sets the depth of the fluid upstream of thegap. The fluid depth at the contraction is onlytwo thirds of its far-upstream depth. Supercriticalflow is faster than the gravity wave speed so thatgravity waves can travel only downstream awayfrom the obstacle.
The effect of a lateral constriction on the flowfield is similar to that of a vertical constriction inhydraulic theory (e.g., Baines, 1995)! Flow pat-tern complexity increases in a hydraulic model aslayers of different density are added, as bottomtopography changes, and as the influences offriction and rotation are added. Further, flow overmountain ridges on both sides of the gap maycause interactions that modify the gap flowthrough wakes or gravity waves. When thegap flow layer is not clearly separated fromthe flow aloft, hydraulic theory is no longeran appropriate choice to describe the flowfeatures.
The striking similarity between hydraulic flowover an obstacle (Armi and Williams, 1983;Smith, 1985; Durran, 1986) and through a lateralconstriction, and the lack of knowledge about theinfluence of the flow aloft on gap flow called fora further investigation. The chance came with theMesoscale Alpine Programme (MAP), a multi-year international research effort to study intenseweather over mountain ranges with the aimof improving understanding and prediction(Binder and Sch€aar, 1996; Bougeault et al, 1998;Bougeault et al, 2001). Out of the eight projectsin MAP one was focused on the investigation ofthe dynamics of gap flow. The gap flow sub-project’s scientific goals (Bougeault et al, 1998)are:
(i) to study the combined effects of gap widthand terrain elevation changes along thefloor axis for deep, continuously stratifiedflow through realistic topography;
(ii) to determine the relationship between gapflow and the flow above mountain-toplevel; in particular, whether the gap flowis reinforced by flow aloft along the axisof the gap or by a mean-state critical level,which caps the low-level cross mountainflow;
(iiii) to study the vertical and cross-gap distri-bution of wind speed and thermodynamicproperties. These are controlled by invis-cid stratified dynamics together with sur-face friction along the valley floor andsidewalls.
A unique part of MAP was a four-year periodprior to the field experiment, during which a fine-tuning of questions and hypotheses, and numer-ical investigations and climatological studieswere conducted in order to ensure a highly fo-cussed field experiment with optimal site selec-tion and instrument placement. The field phase,the so-called SOP (Special Observing Period),ran from 7 September through 15 November1999. A general overview of the MAP programfield phase has been given by Bougeault et al(2001). The current paper summarizes the SOPfor the subproject ‘‘Dynamics of gap flow’’, or‘‘GAP’’ for short.
The next section describes the location chosenfor the gap flow measurements and presents aclimatology of gap flows. It also provides results
100 G. J. Mayr et al

from prior studies of gap flows and the relatedfoehn flows in this area. An operations summaryis given in Sect. 3. A case study of the gap flowevent of 30 October 1999 in Sect. 4 serves as anexample of the available data and the rich detailscontained in them.
2. Gap and foehn flow acrossthe Brenner Pass
2.1 Location
The Brenner Pass area was chosen as the targetarea for the gap flow measurements within MAP.The Brenner Pass is the lowest pass in the centralAlps (Fig. 1). The valley that runs from the basinat Sterzing on the southern side across the pass toInnsbruck is called Wipp Valley. Its part north ofthe pass is nearly straight and has several tribu-taries. At its exit, 30 km downstream from theBrenner Pass, the Wipp Valley runs nearly per-pendicularly into the Inn Valley through a steep100–200 m deep drop. Downslope windstormsexist along both valley directions and are termed‘‘south foehn’’ and ‘‘north foehn’’, respective-ly. For the case of south foehn, air flowing
northward down the Wipp Valley into the InnValley is obstructed by a range of mountains, theNordkette, that make up the north sidewall of theInn Valley. The Nordkette are a west-to-eastrunning ridge of mountains that attain elevationsof 2200–2600 m MSL. Because of the blockageby the Nordkette, air flowing northward out ofthe Wipp Valley must turn eastwards and flowdown the Inn Valley into the Bavarian foreland,flow over the Nordkette, or turn westward up theInn Valley and flow through an opening in theNordkette 10 km west of Innsbruck.
The Brenner Pass poses a vertical (‘‘sill’’) aswell as lateral (‘‘gap’’) constriction to the flow.The lateral constriction is staggered in the vertical:the lower gap at approximately 1400 m MSL ele-vation has a width of a few hundred meters at itsnarrowest part. This is topped by another gap atapproximately 2100 m MSL with a width ofroughly 30 km. The main Alpine crest continueson both sides of the pass with an average elevationof 3000 m MSL. The cross-sectional area of thelower gap is 1=12 of the upper one. Most of theair reaching the downstream (northern) side of theBrenner will therefore have to come through theupper gap. The relatively minor role of the lower
Fig. 1a. Central part of the Alps with inset and location of operational (filled circles) and MAP SOP special (open circles)radiosonde stations; (b) Detail of the GAP target area in the Brenner Pass region. Elevation shading interval is 350 m. The2100 m MSL contour line (¼ elevation of upper gap) is highlighted. Location of temperature loggers (dot), automatic weatherstations (cross), radiosondes (filled circle), sodars (downward pointing triangle), and the Doppler lidar (upward triangle) aremarked as well as valley names. Stations referred to in the text are Innsbruck (I*, 581 m MSL), Ellboegen (þE, 1080 m MSL),Gedeir (�G, radiosonde and lidar, 1085 m MSL), Steinach (Shþ , 1116 m MSL), Brenner (þB, 1373 m MSL), Sterzing (S*,944 m MSL), and the two mountaintop stations Sattelberg (Sbþ , 2108 m MSL) and Wolfendorn (þW, 2777 m MSL)
Gap flow measurements during the Mesoscale Alpine Programme 101

pass for the gap flow was only realized during thepreparations for the MAP field phase.
2.2 Flow peculiarities
Although downslope windstorms in the Alps(termed ‘‘foehn’’) occur mostly in valleys down-stream of gaps (e.g., in the Reuss, Rhine, andWipp Valleys), the concept of gap flow has onlyrecently been explicitly applied to foehn. Implic-itly, however, the concept of a ‘‘pure’’ gap flow,i.e., flow only through the gap but not across thesurrounding ridges has been in place for a longtime under the name ‘‘shallow foehn’’ (Ficker,1931; Kanitscheider, 1932). The flow aloftoften is westerly or even northwesterly (Fig. 2).Foehn has traditionally been termed ‘‘deep’’when the cross-barrier flow occurs through thepasses and across the main ridge line on eitherside of the gap. Work within GAP has evolvedthe distinction between ‘‘shallow’’ and ‘‘deep’’ tobe based on the location of a separating layerrelative to crest height.
Foehn along the Wipp Valley has been studiedfor more than a century. The correct explanationfor the consequences of the terrain drop at themerger of the Wipp and Inn Valleys and theblocking of the direct path of the flow bythe Nordkette was provided by Ficker in 1905.During the night, radiation-driven cooling of theair in the upper Inn Valley, into which foehn doesnot reach, causes air to become potentially coolerthan the foehn flow. This cooler air lifts the foehnair off the ground at the exit of the Wipp Valley.The main mechanism to (re)establish foehn in theInn Valley is solar radiation, which eliminatesthe difference in potential temperature betweenthe two air masses (Ficker, 1905). Accordingly,foehn occurrence in Innsbruck peaks at noon andin the afternoon. A secondary mechanism is thedrainage of cooler air out the Inn Valley due tolower pressure in the foreland (Billwiller, 1878)caused by an approaching low=cold front fromthe W to NW, or dynamically through the typicalpressure dipole (high pressure upwind, pressureminimum downwind) that forms when air im-pinges on a large obstacle (the Alps in this case).
During south foehn an appropriately namedfoehn inversion frequently caps the flow belowthe main crest. Similarly, chinooks along theColorado Front Range are often accompanied by
an elevated inversion (Brinkmann, 1971). A mainobjective of GAP was to determine whether thisinversion was sufficient to decouple the low-levelflow from the flow above the crest. It was hypoth-esized that sufficient decoupling would allow theapplication of hydraulic theory to explain thesalient flow features.
2.3 Synoptic scenario leading to gapflow and foehn
Passing cold fronts often sweep from the westpast the northern side of the Alps. The relatively
Fig. 2. Schematic depiction of the difference between shal-low and deep foehn. The cross-barrier flow for shallowfoehn is decoupled from the flow above the main crest.Flow aloft could even be from the opposite direction
102 G. J. Mayr et al

cold air behind the front moves around the west-ern and eastern ends of the Alps so that low-levelair on the northern and southern sides of the Alpshas about the same temperature. Warm air asso-ciated with the warm front of the next frontalsystem is usually transported around the pressureridge on the western flank of the Alps to raise thetemperatures to the north of the Alps. The airtemperature differences cause the pressure onthe southern side to be on the order of 5 hPahigher than on the northern side. The resultingpressure gradient drives the shallow cold air tothe south of the Alps northwards through thepasses of the Alpine crest. Thus, the gap flowor shallow foehn is initiated. In these situationsa thin stratocumulus deck often occurs on top ofthe cold air upstream of the pass while only afew, mostly high-level clouds are found on thenorthern side of the Alps. The ridge axis thenpasses and a subsequent trough extends to theMediterranean. On the east side of the trough,flow becomes southwesterly up to the mid-tropo-sphere, sometimes even up to the tropopause. Adeep foehn flow then begins over the main Al-pine crest advecting moist air northward from theMediterranean. As this air is lifted over the Alps,
deeper clouds develop and a foehn wall forms.As the cold front approaches and the synoptic-scale lifting adds to the orographic lifting, pre-cipitation starts on the southside of the Alps. Itcan be heavy, particularly where flow conver-gence occurs in the two orographic ‘‘bowls’’ ofSouth Ticino and Friuli. The intensity is weakerfar upstream of the Brenner Pass due to the di-vergence caused by the bow-shape of the Alpsnear Verona (cf. Fig. 1). The foehn wall can spillover to the downstream side of the pass and it canrain out of the wall cloud with the foehn=gapflow still blowing. The local expression ‘‘dim-mer’’ foehn pointedly describes the absence ofsunshine. In the later stage of the foehn the coldair from behind the cold front fills the valleys tothe north of the passes from the north, ending thefoehn and gap flow there.
2.4 Climatology
A long-term south foehn climatology for the tar-get area exists only for Innsbruck (Kuhn, 1989;cf Fig. 3). Foehn occurs mainly in spring and falland is rare in summer when the polar front isgenerally north of the Alps so there is usually
Fig. 3. Boxplot of monthlysouth foehn days at the InnsbruckUniversity station for the period1906–1995. Boxes extend fromthe lower to the upper quartile,the whiskers to 1.5 times the in-terquartile range beyond them.Data outside the whiskers aremarked individually with a ‘‘þ ’’
Gap flow measurements during the Mesoscale Alpine Programme 103

neither a southerly cross-Alpine flow nor rela-tively colder air on the south side of the Alps.Foehn is also rare in Innsbruck in winter becausevery stable air becomes trapped in the Inn Valley,isolating the valley floor from the strong foehnwinds aloft. On the other hand, data gathered inthe Wipp Valley south of Innsbruck since fall1998 exhibit no winter minimum. This differencebetween the Innsbruck and Wipp Valley cli-matologies suggests that the cold air which pro-tects Innsbruck from foehn does not extend veryfar up the Wipp Valley. The time series in theWipp Valley is too short for climatologically val-id results but, as a rough estimate, there seem tobe about twice as many foehn days in the WippValley as at Innsbruck.
In the 90 years for which the Innsbruck clima-tology exists, there was only one year with nofoehn in Innsbruck during the SOP period (7September – 15 November). The median occur-rence is 11 days during this 70-day period.
3. SOP
3.1 Instrumentation
To meet the project objectives, both mass andwind fields in the Brenner Pass – Innsbruck areaneeded to be known with high spatial and tem-poral resolution. Crucial locations were the basinsouth of the Brenner for upstream conditions, thepass itself as a potential hydraulic control, andInnsbruck at the exit of the N–S Wipp Valley.Since MAP had eight different objectives, com-petition for aircraft resources during IntensiveObservation Periods (IOPs) was high. Therefore,a high-density, continuously operating measure-ment network was set up to put the few expectedIOPs over the Brenner area in a longer-termcontext, to be able to extend the aircraft mea-surements to the ground and evaluate the sta-tionarity of the flow during flights, and to studythe interaction of gap flow with prior cold air inthe valleys.
Although gap flow occurs in both directionsalong the Brenner cross section, the target areawas mainly instrumented to measure south foehndue to the much simpler downstream topographyfor southerly flow and the higher likelihood of itsoccurrence during the SOP. Only three automaticstations with microbarographs and a Doppler
sodar (all south of Sterzing) were dedicated tothe observation of north foehn.
3.1.1 Weather stations
Lines of automatic surface stations were strungalong the valley floor on both sides of the passand in the Inn Valley, as well as up the sidewallsof the Inn and Wipp Valleys to obtain vertical crosssections of winds and temperature. Data wererecorded at intervals from 30 seconds to 15 mi-nutes. Four different types of surface stations weredeployed. Most profiles up the valley sidewalls toaltitudes of 2800 m MSL were made with a net-work of 35 temperature data loggers (Whitemanet al, 2000). An additional 35 automatic stations(AWS) that measured temperature, wind, pressure,and humidity were placed on the floor of the Wippand Inn Valleys and on adjacent mountain peaks.Station altitudes were determined using differen-tial GPS. Where an AWS lay along a line of tem-perature data loggers, pressure at the temperaturedata loggers was computed hydrostatically, whichallowed potential temperature to be computed. Po-tential temperature is a conservative variable forthe mostly non-precipitating gap flow events. Theinaccuracy of the temperature logger height(�2 m) and a possible deviation from hydrostaticflow are negligible for the overall accuracy of thecomputed potential temperature since a pressuredeviation of 1 hPa changes potential temperatureby only 0.1 K. Horizontal potential temperaturedifferences between the valley sidewalls and val-ley center are small during gap flow episodesalthough they can be substantial during weak-wind situations (Mayr et al, 2003).
To make wind measurements less susceptibleto peculiarities of the anemometer site, anemom-eter height was chosen to be the standard 10 mwhenever possible. All 10-m anemometers, ex-cept for one, were mounted on the power pylonsowned by local electricity companies. This novelway saved cost and time.
Several AWS along the valley floor on bothsides of the pass were equipped with microbaro-graphs and three sites had sonic anemometers tomeasure fluxes. The pressure and momentumflux data will be used in future studies to charac-terize the flow by using a version of Bernoulli’stheorem that includes turbulent momentumexchange.
104 G. J. Mayr et al

Because the experimental design was focusedon comparisons of data between sites distributedover distances of up to 50 km and using 70 stationswith a variety of instruments, the accuracy of theinstruments was paramount. Thus pressure, tem-perature, and humidity sensors had to be cali-brat;ed against traceable standards and parallelmeasurements were made with several completestations before and after the SOP. Factory calibra-tions, however, were used for wind sensors.
3.1.2 Remote sensing and radio soundings
Remote sensors measured the wind field overlarge parts of the Brenner region. Doppler sodarswere installed at the southern rim of the Alps nearVerona, about 25 km south of the pass, at the passitself, and at Innsbruck. In addition, a UHF windprofiler was operated at Innsbruck. Finally, theNOAA Environmental Technology Laboratory’s10.59 mm wavelength transversely excited atmos-pheric pressure (TEA) CO2-scanning Dopplerlidar (Post and Cupp, 1990; Neiman et al, 1988;Banta et al, 1999), was installed between theBrenner Pass and Innsbruck on 1 October 1999.This instrument subsequently provided radialvelocities during selected periods in the last twothirds of the SOP. Because winds were channeledby the valley, radial velocities closely approxi-mate true velocities. A comparison betweenDoppler lidar and airborne in-situ P-3 wind mea-surements (Durran et al, 2003) gave an rms differ-ence for the radial velocity of 3 m s� 1.
No remote temperature sensors were available,so that temperature information above the 600–2800 m MSL region that was covered by the sur-face stations, was measured on a case-by-case basisby radiosondes and aircraft. Radiosonde stations atMilano and Udine (Fig. 1) provided routine verticalprofiles upstream of the Alps. Supplementary radi-osounding stations were installed near Verona atthe southern rim of the Alps for the entire SOP.Radiosondes were also launched at Sterzing15 km upstream of the Brenner Pass, from a sitecollocated with the Doppler lidar at Gedeir down-stream of the Brenner Pass in the Wipp Valley, andfrom the routine station in Innsbruck.
3.1.3 Aircraft
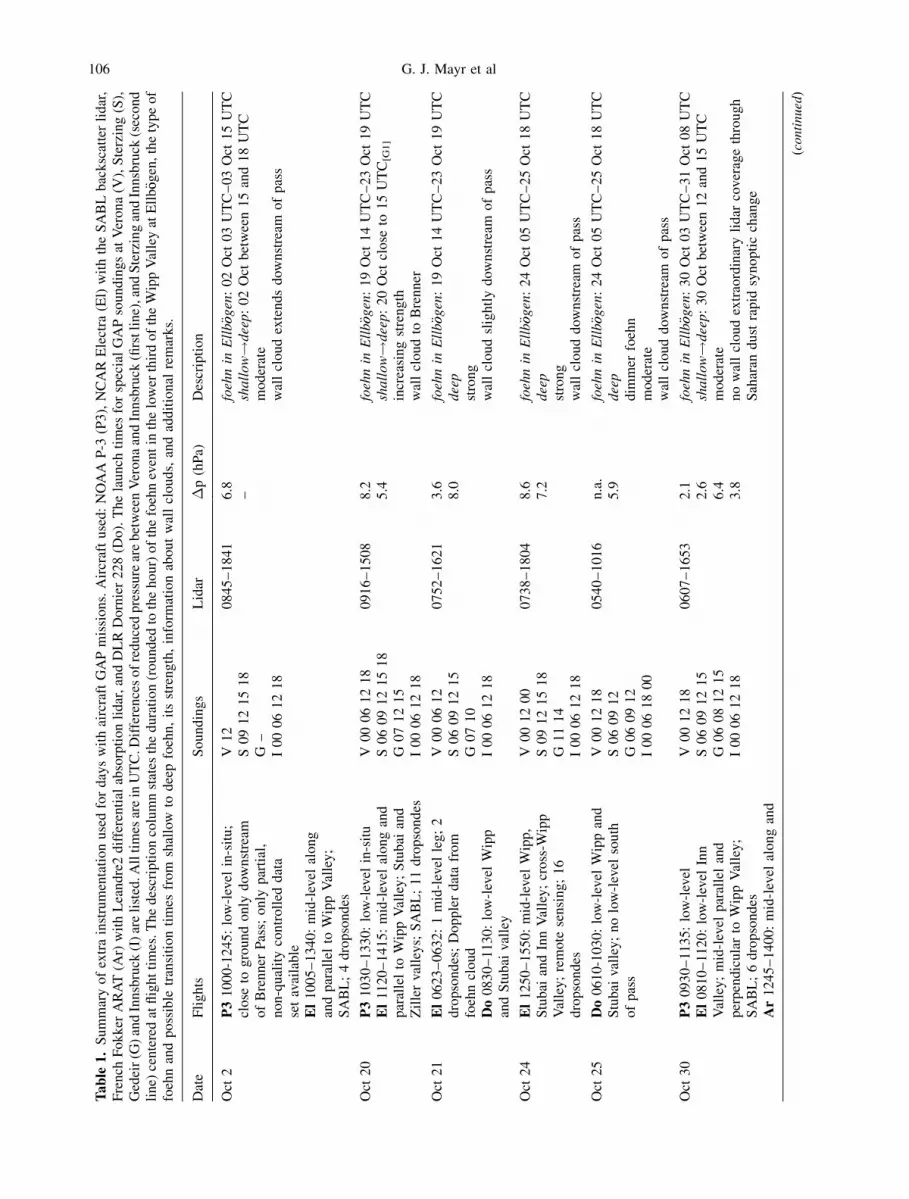
After the Doppler lidar was in place, aircraftmeasurements augmented the dense surface
network during IOPs (Table 1). The two mainaircraft operated were the NOAA P-3 and theNCAR Electra. When both were available, theyflew joint missions. The P-3 made in-situ mea-surements (Fig. 6) in the foehn layer below andimmediately above the foehn inversion us-ing the standard meteorological instrumenta-tion with both inertial and GPS navigationalsystems.
The Electra flew primarily above the inversionin the mid-troposphere to probe the layer belowwith a scanning aerosol backscatter lidar (SABL)at green (532 nm) and red (1064 nm) wavelengths(Rogers et al, 1998), to drop sondes, and to makein-situ measurements with the standard meteoro-logical instrumentation.
On one day (October 30) the French Fokker 27Arat joined the measurements at altitudes abovethe inversion to use the on-board Leandre 2 lidar,which measures reflectivity and water vapor con-tent. Results from this mission were reported byFlamant et al (2002).
Two missions were flown with the DLRDornier-228 research aircraft. This aircraft wasequipped with standard meteorological instru-mentation for making low-level in-situ measure-ments within the foehn layer.
3.2 SOP events compared to climatology
Nature was very kind and provided an above-nor-mal SOP foehn season. A lull at the beginningprovided time to finish the final preparations(Fig. 4); a break in the middle of the SOP al-lowed participants to analyze data and reevaluateobservational strategies.
Foehn and gap flow frequency decreased inthe lowest parts of the Wipp Valley and in theInn Valley as a result of the cold air that wasproduced either by nocturnal cooling or by in-flows from the Alpine foreland to the north.Innsbruck had 16 days with south foehn whilethe lower third of the Wipp Valley (the locationof the wind speed extreme) experienced 33 days(Fig. 4). The foehn there blew during an aston-ishing one third of the SOP, which is about thefourfold duration of foehn in Innsbruck (9%). Itwas lucky that the focus of GAP was on south-erly flows since the north foehn frequency wasfar below average. No north-foehn IOPs wereconducted.
Gap flow measurements during the Mesoscale Alpine Programme 105
Table
1.
Su
mm
ary
of
extr
ain
stru
men
tati
on
use
dfo
rd
ays
wit
hai
rcra
ftG
AP
mis
sio
ns.
Air
craf
tu
sed
:N
OA
AP
-3(P
3),
NC
AR
Ele
ctra
(El)
wit
hth
eS
AB
Lb
ack
scat
ter
lid
ar,
Fre
nch
Fo
kk
erA
RA
T(A
r)w
ith
Lea
nd
re2
dif
fere
nti
alab
sorp
tio
nli
dar
,an
dD
LR
Do
rnie
r2
28
(Do
).T
he
lau
nch
tim
esfo
rsp
ecia
lG
AP
sou
nd
ing
sat
Ver
on
a(V
),S
terz
ing
(S),
Ged
eir
(G)
and
Inn
sbru
ck(I
)ar
eli
sted
.All
tim
esar
ein
UT
C.D
iffe
ren
ces
of
red
uce
dp
ress
ure
are
bet
wee
nV
ero
na
and
Inn
sbru
ck(fi
rstli
ne)
,an
dS
terz
ing
and
Innsb
ruck
(sec
ond
lin
e)ce
nte
red
atfl
igh
tti
mes
.T
he
des
crip
tio
nco
lum
nst
ates
the
du
rati
on
(ro
un
ded
toth
eh
ou
r)o
fth
efo
ehn
even
tin
the
low
erth
ird
of
the
Wip
pV
alle
yat
Ell
b€ oog
en,
the
typ
eo
ffo
ehn
and
poss
ible
tran
siti
on
tim
esfr
om
shal
low
todee
pfo
ehn,
its
stre
ngth
,in
form
atio
nab
out
wal
lcl
ouds,
and
addit
ional
rem
arks.
Dat
eF
lig
hts
So
un
din
gs
Lid
ar�
p(h
Pa)
Des
crip
tio
n
Oct
2P3
10
00
-12
45
:lo
w-l
evel
in-s
itu
;V
12
08
45
–1
84
16
.8foehnin
Ellb€ oogen
:0
2O
ct0
3U
TC
–0
3O
ct1
5U
TC
clo
seto
gro
un
do
nly
dow
nst
ream
S0
91
21
51
8–
shallow!
deep
:0
2O
ctb
etw
een
15
and
18
UT
Co
fB
ren
ner
Pas
s;o
nly
par
tial
,n
on
-qu
alit
yco
ntr
oll
edd
ata
G–
I0
00
61
21
8m
od
erat
ew
all
clo
ud
exte
nd
sd
ow
nst
ream
of
pas
sse
tav
aila
ble
El
10
05
–1
34
0:
mid
-lev
elal
on
gan
dp
aral
lel
toW
ipp
Val
ley
;S
AB
L;
4d
rop
son
des
Oct
20
P3
10
30
–1
33
0:
low
-lev
elin
-sit
uV
00
06
12
18
09
16
–1
50
88
.2foehnin
Ellb€ oogen
:1
9O
ct1
4U
TC
–2
3O
ct1
9U
TC
El
11
20
–1
41
5:
mid
-lev
elal
on
gan
dS
06
09
12
15
18
5.4
shallow!
deep
:2
0O
ctcl
ose
to1
5U
TC
[G1
]
par
alle
lto
Wip
pV
alle
y;
Stu
bai
and
G0
71
21
5in
crea
sin
gst
ren
gth
Zil
ler
val
ley
s;S
AB
L;
11
dro
pso
nd
esI
00
06
12
18
wal
lcl
ou
dto
Bre
nn
er
Oct
21
El
06
23
–0
63
2:
1m
id-l
evel
leg
;2
V0
00
61
20
75
2–
16
21
3.6
foehnin
Ellb€ oogen
:1
9O
ct1
4U
TC
–2
3O
ct1
9U
TC
dro
pso
nd
es;
Do
pp
ler
dat
afr
om
S0
60
91
21
58
.0deep
foeh
ncl
ou
dG
07
10
stro
ng
Do
08
30
–1
13
0:
low
-lev
elW
ipp
I0
00
61
21
8w
all
clo
ud
slig
htl
yd
ow
nst
ream
of
pas
san
dS
tub
aival
ley
Oct
24
El
12
50
–1
55
0:
mid
-lev
elW
ipp
,V
00
12
00
07
38
–1
80
48
.6foehnin
Ellb€ oogen
:2
4O
ct0
5U
TC
–2
5O
ct1
8U
TC
Stu
bai
and
Inn
Val
ley
;cr
oss
-Wip
pS
09
12
15
18
7.2
deep
Val
ley
;re
mo
tese
nsi
ng
;1
6G
11
14
stro
ng
dro
pso
nd
esI
00
06
12
18
wal
lcl
ou
dd
ow
nst
ream
of
pas
s
Oct
25
Do
06
10
-10
30
:lo
w-l
evel
Wip
pan
dV
00
12
18
05
40
–1
01
6n
.a.
foehnin
Ellb€ oogen
:2
4O
ct0
5U
TC
–2
5O
ct1
8U
TC
Stu
bai
val
ley
;n
olo
w-l
evel
sou
thS
06
09
12
5.9
deep
of
pas
sG
06
09
12
dim
mer
foeh
nI
00
06
18
00
mo
der
ate
wal
lcl
ou
dd
ow
nst
ream
of
pas
s
Oct
30
P3
09
30
–1
13
5:
low
-lev
elV
00
12
18
06
07
–1
65
32
.1foehnin
Ellb€ oogen
:3
0O
ct0
3U
TC
–3
1O
ct0
8U
TC
El
08
10
–1
12
0:
low
-lev
elIn
nS
06
09
12
15
2.6
shallow!
deep
:3
0O
ctb
etw
een
12
and
15
UT
CV
alle
y;
mid
-lev
elp
aral
lel
and
G0
60
81
21
56
.4m
od
erat
ep
erp
end
icu
lar
toW
ipp
Val
ley
;I
00
06
12
18
3.8
no
wal
lcl
ou
dex
trao
rdin
ary
lid
arco
ver
age
thro
ug
hS
AB
L;
6d
rop
son
des
Sah
aran
du
stra
pid
syn
op
tic
chan
ge
Ar
12
45
–1
40
0:
mid
-lev
elal
on
gan
d
(continued)
106 G. J. Mayr et al

Table
1(continued
)
per
pen
dic
ula
rto
Wip
pV
alle
y;
Lea
nd
re2
P3
13
10
–1
60
5:
low
-lev
elW
ipp
Val
ley
Nov
1El
13
00
–1
60
5:
mid
-lev
elal
on
gan
dV
–1
11
4–
17
04
5foehnin
Ellb€oogen
:1
Nov
06
UT
C–
2N
ov
06
UT
Cp
erp
end
icu
lar
toW
ipp
Val
ley
;2
S1
43
.5shallow
up
stre
amso
un
din
gs;
low
-lev
elG
12
14
wea
kW
ipp
and
Inn
Val
ley
;4
dro
pso
nd
esI
00
12
15
no
wal
lcl
ou
d
Nov
6P3
08
35
–1
03
0:
mid
-lev
elal
on
gV
06
09
12
15
18
00
48
–1
24
95
foehnin
Ellb€ oogen
:5
Nov
07
UT
C–
6N
ov
12
UT
CW
ipp
Val
ley
;lo
w-l
evel
alo
ng
Inn
21
2.3
shallow!
deep:
inth
en
igh
tfr
om
5to
6N
ov
Val
ley
S0
60
91
2m
od
erat
eG
06
09
12
13
wal
lcl
ou
do
bse
rvat
ion
of
term
inat
ion
by
gra
vit
ycu
rren
t=I
00
03
06
12
18
cold
fro
nt
Nov
12
P3
12
20
–1
44
0:
low
-lev
elV
00
18
10
08
–1
72
4;
1.5
foehnin
Ellb€ oogen
:1
2N
ov
20
(!)
UT
C–
13
Nov
09
UT
CEl
12
00
–1
60
0:
mid
and
low
level
S1
51
95
9–
21
51
1.8
shallow
Wip
pV
alle
y;
up
stre
amso
un
din
g;
G1
21
5m
od
erat
elo
w-l
evel
Inn
Val
ley
;8
dro
pso
nd
esI
00
06
12
18
no
wal
lcl
ou
d
Gap flow measurements during the Mesoscale Alpine Programme 107

3.3 Operations summary and eventclassification
Figure 4 summarizes the use of the crucialinstrumental platforms that did not operatecontinuously. While several gap flow eventsoccurred during the first three weeks of theMAP SOP, only radiosoundings were addedto the continuously operating ground-basednetwork. Aircraft missions were held back tillthe NOAA Doppler lidar arrived at the end ofSeptember, just in time for the first all-outmeasurement effort on 2 October 1999. Theradiosounding unit in Gedeir became availablea few days after the deployment of the Dop-pler lidar. The first intensive measurementphase with all instruments was 20 October1999.
3.3.1 Aircraft
Research aircraft were used to
(i) obtain detailed vertical cross sections of thewind and mass fields along the Wipp Valleyand in the adjoining Inn Valley,
(ii) measure the cross-valley variation of thefoehn flow, and
(iii) map the top of the foehn layer.
The strategy was to fly – if available – twoaircraft simultaneously: one for low-level in-situmeasurements, the other at mid-levels to evaluatethe coupling of the flow aloft with the gap flowand to map the layers underneath with remotesensors and dropsondes.
The frequent low to mid-level cloud deck onthe upstream side of Brenner Pass during gap
Fig. 4. Gap flow periods during MAP SOP in the lower third of the Wipp Valley (Ellb€oogen, ‘‘Wipp vall’’) and in the InnValley (Innsbruck, ‘‘Inn vall’’) combined with operation times of discontinuously measuring instruments (radiosondes atVerona, Sterzing, Gedeir, and Innsbruck; remote wind sounders at ‘‘Brenner, Lidar, Innsbruck’’; 4 research aircraft). Periodsfor which not all data for an objective gap flow classification were available are marked by thin lines
108 G. J. Mayr et al
flow situations imposed flight safety restrictionsas demanded by instrument flight regulations(IFR). In such situations no flight legs belowapprox. 4200 MSL could be flown on the up-stream side. A steep descent immediately down-stream of the foehn wall, sometimes through oneof the narrow tributary valleys, was necessary toget to the lowest level permitted by flight regu-lations on the downstream side, i.e. 300 m aboveground. Elevation decreases from 1400 MSL atthe pass to 600 MSL at Innsbruck.
Prior to take-off of research aircraft, radio-soundings were launched at Sterzing andInnsbruck and cloudiness was observed en routefrom Innsbruck to Sterzing. This information, inparticular the location of the capping stable layer,greatly aided the case-by-case design of the exactflight pattern. The advantage of the short lengthof the Wipp Valley was that unprecedentedlydense vertical stacks of tracks could most ofthe times be completed fast enough for the flowto remain quasi-stationary. The upvalley legswere flown at higher levels so that the planewould not be trapped in the valley in the (unlike-ly) case of engine failure. The return legs cov-ered the lower levels. Flight legs were horizontalwherever possible so as to cut through isentropes,which are roughly terrain-parallel.
The Electra usually stayed at or above theminimum altitude required by IFR over the wholecross section, since one primary goal of its mis-sions was to map the cross-flow variability withits SABL aerosol backscatter lidar. Additionalvertical profiles of temperature, humidity andwind were gained through dropsondes. Drop-ping sondes over such complex terrain was aformidable challenge. Practice was needed toget the sonde down over the desired locationthrough a strongly sheared wind field. The air-craft also had to maintain a line of sight con-nection till the sonde reached the ground. Thein-situ measurements of the Electra were usedto determine the gravity wave activity above thegap flow layer. Later in the SOP (from 1 No-vember on) the Electra took upstream aircraftsoundings and completed some of the low-levelflight legs usually flown by the P-3, especiallyin the Inn Valley, to investigate the structure ofthe gap flow jet as it emerged from the WippValley.
The hope that the Eldora Doppler radar onboard the Electra (Hildebrand et al, 1996) wouldbe sensitive enough to get Doppler velocitiesfrom the relatively shallow foehn wall wasfulfilled only once during a ferry-flight for aheavy precipitation mission (21 October 1999).
3.3.2 SOP events classification
Figure 5 gives a summary of the synoptic situa-tion and describes the upstream soundings for allthe IOPs with aircraft and Doppler lidar meas-urements. A wide variety of synoptic situationsled to dynamically controlled gap flow. The gapflows occurred ahead of warm and cold frontsbut never immediately behind a cold front.Deep-foehn-type gap flow (21, 24, and 25October; 6 November) had the capping layer wellabove mean crest height, while it was at or belowcrest level for shallow foehn. Wind speeds atcrest level (and in the valley downstream of thegap) were higher for deep than for shallow foehn.
The ‘‘description’’ column in Table 1 detailsthe duration of the gap flow events in the lowerthird of the Wipp Valley, the transition times be-tween shallow and deep flows, and the existenceof a wall cloud.
4. Case study of 30 October
The gap flow event of 30 October 1999 was thebest-observed one of the whole SOP. The NOAAP-3 flew two low-level missions accompanied bythe NCAR Electra and French Arat, respectively,at mid-levels (Fig. 6). Since Saharan dust hadbeen advected into the region a few days prior,backscatterers for the ground-based NOAA Dop-pler lidar were so plentiful that its normal rangenearly doubled. This day was selected to give animpression of the anatomy of gap flow across theBrenner Pass, the richness of the flow features,and the available data.
4.1 Synoptic situation
Several aspects of this gap flow event were atyp-ical: First, the main pressure trough remained offthe European coast (cf. Fig. 5 top row, third col-umn). Second, no cold air had been advectedalong the eastern flank of the Alps into the Povalley prior to the gap flow event. A weak ridge
Gap flow measurements during the Mesoscale Alpine Programme 109

Fig. 5. First and third columns: synoptic overview of IOPs with aircraft support. Shown are fronts, 500 hPa isohypses(contour interval 16 dam), and the 700 hPa wind above Brenner Pass from 12 UTC ECMWF analyses. Second and fourthcolumns: Height and extent (m MSL) of and temperature difference (K) across the capping inversion layer in the upstreamsounding at Sterzing
110 G. J. Mayr et al
passed over the target area at 00 UTC. During thelast third of the previous day, warm air had al-ready been advected over the western flank of theAlps into the region north of the Alps. Since thiswarm air advection was confined to the west andnorth of the Alps, a hydrostatic pressure gradientformed with lower pressure to the north. The midand upper troposphere had weak southwesterlyflow all day long, whereas the flow at crest levelchanged from westerly to southwesterly aroundnoon. A weak trough (vorticity maximum)grazed the target area by the end of the day (31October, 00 UTC); it was more pronounced fur-ther north. This relatively rapid synoptic evolu-tion changed the gap flow every few hours.
Another atypical aspect of this gap flow eventwas the absence of a foehn wall cloud. Severalmid-level cloud fields passed the Brenner targetarea during 30 October. They were topped byextensive thin cirrus fields. The day was mostlysunny both up- and downstream of Brenner Pass.
4.2 Vertical profiles: radiosondesequences from Verona to Innsbruck
Radiosoundings at Verona on the southern rim ofthe Alps, Sterzing in the basin upstream of the
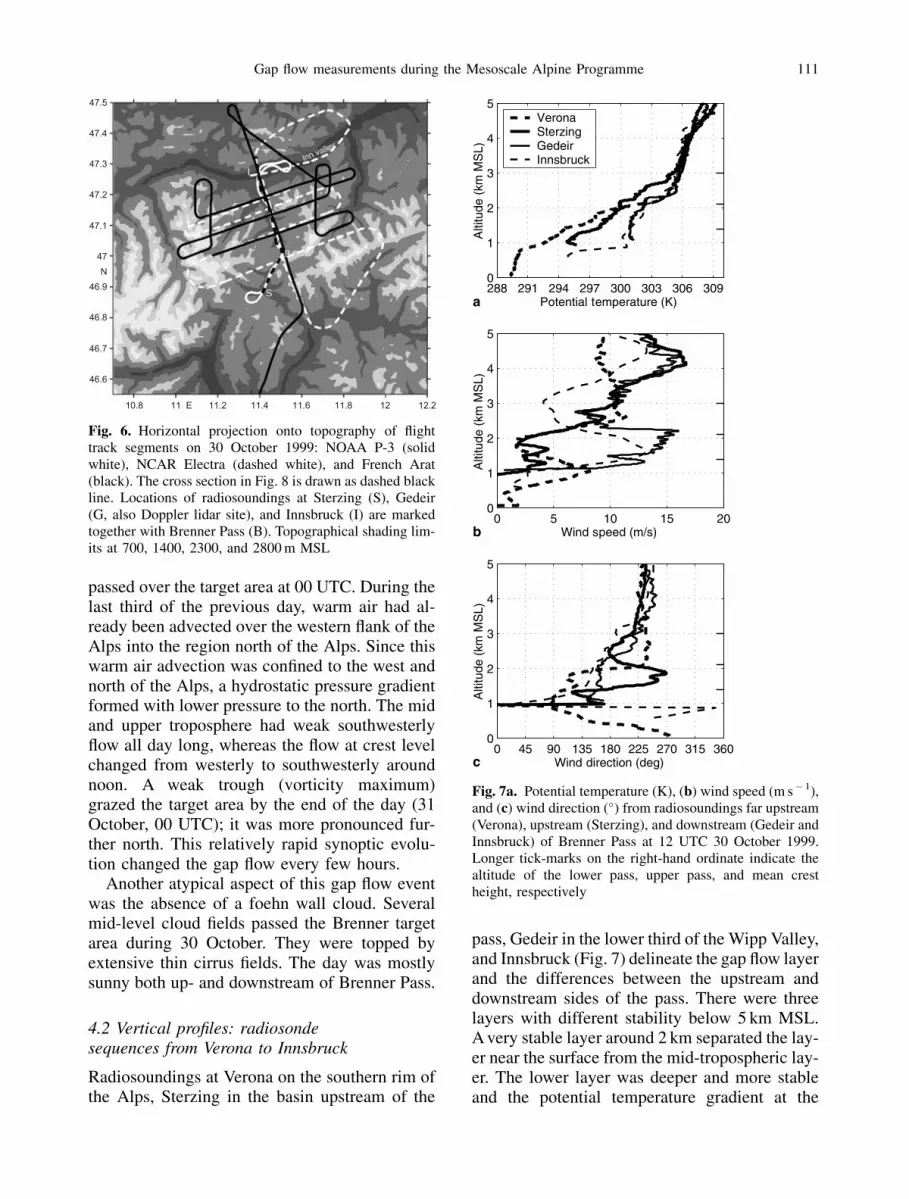
pass, Gedeir in the lower third of the Wipp Valley,and Innsbruck (Fig. 7) delineate the gap flow layerand the differences between the upstream anddownstream sides of the pass. There were threelayers with different stability below 5 km MSL.A very stable layer around 2 km separated the lay-er near the surface from the mid-tropospheric lay-er. The lower layer was deeper and more stableand the potential temperature gradient at the
Fig. 6. Horizontal projection onto topography of flighttrack segments on 30 October 1999: NOAA P-3 (solidwhite), NCAR Electra (dashed white), and French Arat(black). The cross section in Fig. 8 is drawn as dashed blackline. Locations of radiosoundings at Sterzing (S), Gedeir(G, also Doppler lidar site), and Innsbruck (I) are markedtogether with Brenner Pass (B). Topographical shading lim-its at 700, 1400, 2300, and 2800 m MSL
Fig. 7a. Potential temperature (K), (b) wind speed (m s� 1),and (c) wind direction (�) from radiosoundings far upstream(Verona), upstream (Sterzing), and downstream (Gedeir andInnsbruck) of Brenner Pass at 12 UTC 30 October 1999.Longer tick-marks on the right-hand ordinate indicate thealtitude of the lower pass, upper pass, and mean crestheight, respectively
Gap flow measurements during the Mesoscale Alpine Programme 111

capping layer was larger at the two upstreamsounding locations than downstream of the pass.The capping layer at Sterzing began about 1 kmhigher, was vertically compressed and its poten-tial temperature difference smaller than at Verona.It was almost step-like on the downstream sidewhere its upper boundary descended by about700 m. The air above the main crest (3 km) wasbasically the same on both sides.
The lowest layer on the southern rim ofthe Alps did not move towards Brenner Pass(Fig. 7b, c). Instead, it progressed as a pro-nounced low-level jet further westwards up the
Po valley. This is a frequent feature duringsynoptic-scale southwesterly flow towards theAlps and is crucial for producing the high pre-cipitation maximum in the southwestern ‘‘bowl’’of the Alps north of Milano.
The Sterzing sounding shows that only air be-low the capping layer moved towards the passfrom the upstream basin. The layer next to thesurface was basically blocked; the weak windsfrom various directions originated in valleys thatdrain into the basin.
The vertical profiles of the flow changed dramat-ically on the downstream side of the pass. The
Fig. 8. Subjectively drawn vertical cross sec-tion along the dashed black line in Fig. 6 of (a)potential temperature, and (b) northward-com-ponent of wind (based on P-3 aircraft (dotted),radiosoundings (dotted), car (solid), and Dop-pler sodar (south of Brenner; dotted). The alti-tude of the lower and upper gap and the meancrest height are marked on the ordinate. Carmeasurements were taken between 1007 and1040 UTC, the P-3 aircraft measurements be-tween 0930 and 1135 UTC. Radiosondes werelaunched at 12 UTC
112 G. J. Mayr et al
sounding in the lower third of the Wipp Valley(Gedeir) shows a gap flow layer that was well mixedin its lower part and only weakly stable in its upperpart (Fig. 7a). A pronounced jet reached upward tothe bottom of the capping layer, which was onlyseveral decameters thick at this location.
A 300 m deep, cold layer prevented the gapflow from penetrating into the Inn Valley. Sincethe Innsbruck sounding site is west of the exit
region of the Wipp Valley, the southeasterly jetcentered at 1500 m resulted from the flow deflec-tion at the Nordkette.
4.3 Wind and potential temperaturecross sections from aircraft
The vertical cross section of potential tempera-ture and wind (Fig. 8) constructed from densely
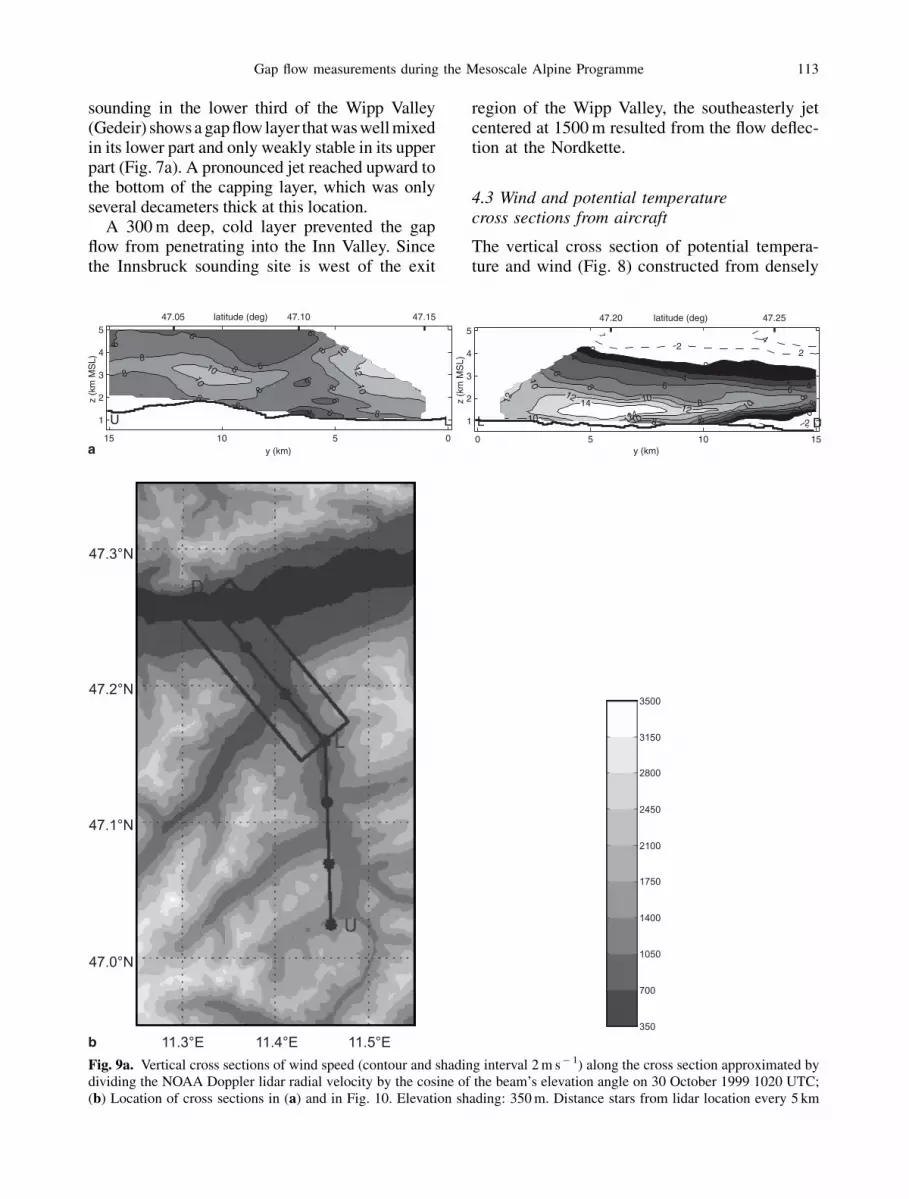
Fig. 9a. Vertical cross sections of wind speed (contour and shading interval 2 m s� 1) along the cross section approximated bydividing the NOAA Doppler lidar radial velocity by the cosine of the beam’s elevation angle on 30 October 1999 1020 UTC;(b) Location of cross sections in (a) and in Fig. 10. Elevation shading: 350 m. Distance stars from lidar location every 5 km
Gap flow measurements during the Mesoscale Alpine Programme 113

stacked flight legs of the P-3 and extended to theground with car measurements (Mayr et al, 2002)fills the spatial gaps between the data from theradiosoundings. Air – visualized by the isen-tropes – had already descended upwind of thepass and rebounded reminiscent of a hydraulicjump. Air from the upper gap reached the floorof the Wipp Valley for the first time at the en-trance of the first downstream tributary valley.The entrance of the next tributary valley furtherdownstream also coincided with a further strongdescent of the isentropes. Cold and stable airfrom the Inn Valley reached into the lower partof the Wipp Valley. Air accelerated from the gapto the exit region, where the flow rapidly decel-erated in a hydraulic-jump like feature. Thelower part of the flow was deflected by theNordkette.
The thin capping layer weakened and be-came deeper on its way to the Nordkette, thenext big obstacle, attaining three times itsthickness on the upstream side. Most of thethickening happened in the hydraulic jump re-gion near the exit of the Wipp Valley. Airabove approximately 1700 m MSL became onlyweakly stable and the speed decreased. At theNordkette, the isentropes became closer togeth-er again.
4.4 Wind cross sections from the NOAAlidar and Doppler sodar
The undulations caused by the ridges protrudingfrom the west into the Wipp Valley were visiblein the velocity measurements of the NOAA scan-ning Doppler lidar (Fig. 9). The speed maximumwas observed where the northernmost tributaryvalley enters the Wipp Valley. The gap flow jetabove Innsbruck was narrow. The downstreamlooking lidar scan captured the weakening to-wards its western edge. Cold, stable air underthe gap wind flowed down the Inn Valley. Flowabove 3.5 km MSL (i.e., maximum crestheight) had a component opposite the gap flowdirection.
Since the lidar measures only the wind com-ponent along its beam, this radial velocity wasdivided by the cosine of the beam’s elevation an-gle to obtain an approximation of the horizontalwind component (neglecting the contribution ofthe vertical velocity) in that azimuthal direction.
Within the valley, flow closely follows the valleydirection.
The downwind looking plan-view scan(Fig. 10) shows that the gap jet at 1100 m MSLdid not follow the northwestward bend the WippValley makes near Gedeir but continued straight,producing large horizontal shear across the valleyin the exit region. A recirculation was observedat the Nordkette (Fig. 9).
Topography obstructed the view of the lidar tothe lower gap of Brenner Pass. The Dopplersodar slightly upstream of the pass (marked witha downward pointing triangle in Fig. 1b) observedgap flow for the whole day of 30 October 1999with highest speeds starting around noon afterthe mid-level winds had turned southwesterly(Fig. 11). Wind direction varied little with heightsince the flow is strongly channeled in the narrow
Fig. 10. Horizontal cross section of along-valley radialwind speed between lidar (bottom) and Inn Valley (top).Contour and shading interval 2 m s� 1
114 G. J. Mayr et al

lower gap. The sodar site was in the vicinity ofthe hydraulic-jump like feature visible in theaircraft cross section (Fig. 8). The sodar datawere used for contouring Fig. 8b.
4.5 Evolution at the surface
The 30 October event was a short-lived (approx.1 day) foehn episode. Rapid changes at the syn-optic scale led to a rapid evolution of the gap-scale flow as evidenced by four selected surfacestations in Fig. 12. Sattelberg (2108 MSL) is inthe upper gap, while Wolfendorn (2777 MSL) isabove it. The air flowing through the upper passin the early morning was stable (Fig. 12a). As thepotential temperature decreased at Wolfendornand increased at Sattelberg later in the morning,stability decreased to almost neutral aroundnoon. Potential temperatures at both stationsdecreased in the afternoon preceding the ap-proach of the vorticity maximum, and stabilityincreased again.
Gap flow had already started in the upper thirdof the Wipp Valley (e.g., at the Steinach station)before midnight of 30 October. Lower potentialtemperature at Steinach than at Sattelberg forthis period suggests that air at Steinach camethrough the lower gap at the Brenner Pass(1370 MSL) The stability of the air in thelower gap (cf. potential temperature differenceSattelberg – Steinach) at that time was roughlythe same as in the upper gap (cf. potential tem-perature difference Wolfendorn – Sattelberg).
The lower third of the valley was in cold air atthe beginning of the time series. A typical break-through sequence is depicted: at first, the airmass from Steinach reached Ellboegen, just tobe pushed back again by the cold air from theInn Valley. After the gap flow had finally won,the air at Ellboegen mainly came from the lowergap with some air from the upper gap mixedin, since potential temperature was higher atEllboegen than at Steinach. As the day prog-ressed, potential temperatures at all four stations
Fig. 11. Horizontal wind vectors and vertical winds (shading in 20 cm s� 1 intervals) from the Doppler sodar immediatelyupstream of Brenner Pass on 30 October 1999. The reference wind vector is a 10 m s� 1 west wind; a vector pointing to the topof the page depicts a south wind
Gap flow measurements during the Mesoscale Alpine Programme 115

became more similar. At noon the air inEllboegen was already the same as at the uppergap (Sattelberg); an hour later this also occurredat Steinach. While the air in the upper third of theWipp Valley continued to come from the uppergap level for the rest of the day, Ellboegen
drew air from about 700 m higher (level ofWolfendorn). During dynamically controlled gapflow, potential temperature typically increasesalong the valley floor with increasing distancefrom the pass as air from progressively higherlevels is mixed down.
Fig. 12. Time series of ten min-ute averages of (a) potentialtemperature (K), and (b) windspeed (m s� 1) at two stationsin the upper gap (Wolfendorn,2777 MSL, and Sattelberg,2108 MSL), a station in the up-per third of the Wipp Valley(Steinach, 1116 MSL), and astation in the lower third of theWipp Valley (Ellb€oogen, 1080MSL) on 30 October 1999
116 G. J. Mayr et al

Wind speed (Fig. 12b) nearly doubled after themorning phase. The upper gap (Sattelberg) hadthe highest wind speeds, followed by Ellboegen.Due to the absence of channeling, wind speeds atthe highest station (Wolfendorn) were only halfas strong as at Sattelberg.
A time series of the (pseudo-)vertical profile ofpotential temperature (Fig. 13) could be con-structed from the twelve temperature loggersand one complete automatic weather station onthe eastern slope of the exit region of the WippValley (cf. Fig. 1). Early in the day cold air fromthe Inn Valley extended into the Wipp Valley. Itstop descended from about 1600 m to 1200 mMSL until gap flow air broke abruptly throughthe remaining 500 m deep cold air shortly beforenoon (long arrow in Fig. 13). As at Ellboegen,which is further upstream, air came first fromthe lower gap for a short time and then from theupper gap for the rest of the day. The next nightcold air recurred near the ground (short arrow inFig. 13).
5. Conclusions and outlook
The GAP data set contains very detailed spatialand temporal measurements of flow through thelowest gap of the Alpine crest during IOPs
which are embedded in the entire MAP SOP.Since the quality control of all data is com-plete, the third objective of GAP – the measure-ment of along- and cross-valley distributionsof wind and thermodynamic properties – is al-ready fulfilled. Data are accessible via internetthrough the MAP Data Centre at http:==www.map.ethz.ch.
The mining of this rich data set has started withthe best-sampled IOPs listed in Table 1. Flow tran-sitions were found downstream of vertical terrainchanges as well as lateral contractions. The flowaloft reinforces the gap flow during deep foehn,but apparently not during shallow foehn. For theshallow foehn, hydraulic theory seems to be aworkable approximation that describes the es-sence of the flow features. More work with thedata should give definitive answers to two objec-tives of GAP: the understanding of the interplay ofheight versus width changes, and the coupling ofthe gap flow to the flow aloft.
Further scientific investigations will bepursuing the following, non-exhaustive list oftopics:
(i) understanding of gap flow dynamicsBoth hydraulic and compressible modelswith varying idealizations of initial conditions
Fig. 13. Temporal evolution ofthe potential temperature (shad-ed in 2.5 K intervals) profile atthe exit of the Wipp Valley on30–31 October 1999. Long ar-row marks the breakthrough offoehn to the ground; the shortarrow indicates the reformationof nocturnal radiatively cooled airnear the surface. The location ofthe stations is indicated by dotsnorth of station E (Ellb€oogen) inFig. 2
Gap flow measurements during the Mesoscale Alpine Programme 117

and underlying topography are being usedto elucidate the mechanisms of gap flow andthe causes for details observed in theflow. There are already results for the caseof 30 October 1999 reported by Flamantet al (2002). Fundamental insights may begained from analytical hydraulic flowmodels.
(ii) forecasting=predictability of gap flowOne of the key motivations for MAPwas improved forecasting of severe weatherevents in mountainous areas. How can gapflow be better forecast? A better under-standing of gap flow dynamics helps toidentify the key parameters that need tobe checked in the output of numericalweather prediction models and in observa-tional data. The resolution of these modelsneeds to be increased and their handling ofsteep topography improved. Additionally,forecasters must be trained to recognizethe conditions leading to gap flow events.A big step has already been taken withinMAP through the formation of a forecast-ers’ group from all participating countries.These forecasters not only provided theforecasts for the field phase but also com-piled manuals on the forecasting of MAPphenomena. Training of more forecasterswill continue through a new project,FACT – forecasting in alpine and complexterrain (Parson, 2001).
(iii) verification for numerical modelsCurrent operational limited-area predictionmodels have a gridmesh as fine as 7 km.During the MAP SOP the Canadian MC2model was run with a 3 km mesh (Benoitet al, 1997; Benoit et al, 2002). Researchmodels use even finer grids. Horizontalmeshes on the order of 100–500 m will beneeded to resolve all the topographical fea-tures (e.g., the lower gap at Brenner Pass)that control the flow. At the same time ver-tical resolution must be fine enough toproperly treat the thin but potentially strongcapping layers (cf. Fig. 5). The increase ofcomputing power has made computationswith such fine resolution possible (e.g.,Z€aangl, 2002). Work is under way to com-pare such high-resolution simulations withthe detailed GAP data set.
Current models that employ terrain-followingvertical coordinates can only cope poorly withthe steepness of the terrain. The horizontal pres-sure gradient term, advection and (numerical)diffusion are very difficult to compute accuratelyin steep, terrain-following coordinates. Differentapproaches are currently being pursued to devel-op new models suited for computations in steepterrain with high horizontal resolution. GAP willbe an ideal data set to test these new model for-mulations and the necessary parameterizations.
Acknowledgments
Our great appreciation goes to the many people involvedwith the GAP measurements! The suggestions of twoanonymous reviewers improved the article. This work waspartly supported by Austrian Science Foundation FWF13489 and FWF 13655.
References
Armi L, Williams R (1983) The hydraulics of a stratifiedfluid flowing through a contraction. J Fluid Mech 251:355–375
Baines PG (1995) Topographic effects in stratified flows.Cambridge monographs on mechanics and applied math-ematics. Cambridge: Cambridge University Press, 482 pp
Banta RM, Darby LS, Kaufmann P, Levison DH, Zhu CJ(1999) Wind-flow patterns in the Grand Canyon asrevealed by Doppler lidar. J Appl Meteor 38: 1069–1083
Benoit R, Desgagn�ee M, Pellerin P, Pellerin S, Desjardins S,Chartier Y (1997) The Canadian MC2: A semi-Lagran-gian, semi-implicit wide-band atmospheric model suitedfor fine-scale process studies and simulation. Mon WeaRev 125: 2382–2415
Benoit R, Sch€aar C, Binder P, Chamberland S, Davies HC,Desgagn�ee M, Girard C, Keil C, Kouwen N, L€uuthi D, MaricD, M€uuller E, Pellerin P, Schmidli J, Schubiger F, SchwierzC, Sprenger M, Walser A, Willemse S, Yu W, Zala E(2002) The real-time ultrafine forecast support during thespecial observing period of the MAP. Bull Amer MeteorSoc 83: 85–109
Binder P, Sch€aar C (1996) MAP-Mesoscale Alpine Pro-gramme Design Proposal, December 1996. Availablefrom Meteo Swiss, Kr€aahb€uuhlstr. 58, CH-8044 Z€uurich,and http:==www.map.ethz.ch=proposal.html
Billwiller A (1878) Referat €uuber M.F.F. H�eebert, �EEtude sur lesgrands mouvements de l’atmosphere et sur le Foehn et leSirocco pendent l’hiver 1876–77. Zeitschr €OOsterr GesMeteor 13: 317–320
Bougeault P, Binder P, Sch€aar C (1998) MAP-MesoscaleAlpine Programme Science Plan, June 1998. Availablefrom SMA, Kr€aahb€uuhlstr. 58, CH-8044 Z€uurich, andhttp:==www.map.ethz.ch=splan= spindex.htm
Bougeault P, Binder P, Buzzi A, Dirks R, Houze R, KuettnerJ, Smith RB, Steinacker R, Volkert H (2001) The MAP
118 G. J. Mayr et al

Special Observing Period. Bull Amer Meteor Soc 82:433–462
Brinkmann WAR (1971) What is a foehn? Weather 26:230–239
Durran DR (1986) Another look at downslope windstorms.Part I: The development of analogs to supercritical flow inan infinitely deep, continuously stratified fluid. J AtmosSci 43: 2527–2543
Durran DR, Mari�cc T, Banta RM, Darby LS, Hardesty RM(2003) A comparison of ground-based Doppler lidar andairborne in situ wind observations above complex terrain.Quart J Roy Meteor Soc 129: 693–714
Farmer D, Armi L (1999) Stratified flow over topography:The role of small-scale entrainment and mixing in flowestablishment. Proc R Soc Lond A 455: 3221–3258
Ficker Hv (1905) Innsbrucker F€oohnstudien, I. Beitr€aage zurDynamik des F€oohns. Denkschrift Kaiserl Akad Wiss 78:85–163
Ficker Hv (1931) Warum steigt der F€oohn in die T€aaler herab?Met Z 66: 227–229
Flamant C, Dobrinski P, Nance L, Banta R, Darby L, DusekJ, Hardesty M, Pelon J, Richard E (2002) Gap flow in anAlpine valley during a shallow south f€oohn event: Obser-vations, numerical simulations and hydraulic analogue.Quart J Roy Meteor Soc 128: 1173–1210
Hildebrand PH, Lee WC, Walther CA, Frush C, Randall M,Loew E, Neitzel R, Parsons R, Testud J, Baudin F,LeCornec A (1996) The ELDORA=ASTRAIA airborneDoppler weather radar: High resolution observations fromTOGA COARE. Bull Amer Meteor Soc 77: 213–232
Jackson PL, Steyn DG (1994) Gap winds in a fjord. Part II:Hydraulic analog. Mon Wea Rev 122: 2666–2676
Kanitscheider R (1932) Beitr€aage zur Mechanik des F€oohns.Ergebnisse von Doppelvisierungen in Innsbruck undUmgebung. Beitr Z Phys Atmos 18: 27–47
Kuhn M (1989) F€oohnstudien. Darmstadt: WissenschaftlicheBuchgesellschaft, 503 pp
Lau SY, Shun CM (2000) Observation of terrain-inducedwindshear around Hong Kong International Airport understably stratified conditions. AMS, 9th Conf. on MountainMeteorology, Aspen, CO, pp 93–98
Mayr GJ, Vergeiner J, Gohm A (2002) An automobileplatform for the measurement of foehn and gap flows.J Atmos Oceanic Tech 19: 1545–1556
Mayr GJ, Vergeiner I, Gohm A, Vergeiner J, Mayr R (2003)Gap flow – an overview and preliminary results. €OOsterrBeitr Meteorol (in press)
Neiman PJ, Hardesty RM, Shapiro MA, Cupp RE (1988)Doppler lidar observations of a downslope windstorm.Mon Wea Rev 116: 2265–2275
Pan F, Smith RB (1999) Gap winds and wakes: SAR ob-servations and numerical simulations. J Atmos Sci 56:905–923
Parson P (2001) ‘‘FACT’’ – Forecasting in Alpine andcomplex terrain. MAP newsletter 14: 17–20. Availablefrom Meteo Swiss, Kr€aahb€uuhlstr. 58, CH-8044 Z€uurich, andat http:==www.map.ethz.ch=newsletter14.htm
Pettre P (1982) On the problem of violent valley winds.J Atmos Sci 39: 542–554
Post MJ, Cupp RE (1990) Optimizing a pulsed Doppler lidar.Appl Opt 29: 4145–4158
Reed TR (1931) Gap winds of the Strait of Juan de Fuca.Mon Wea Rev 59: 373–376
Rogers DP, Dorman CE, Edwards KA, Brooks IM, MelvilleWK, Burk SD, Thompson WT, Holt T, Str€oom LM,Tjernstr€oom M, Grisogono B, Bane JM, Nuss WA, MorleyBM, Schanot AJ (1998) Highlights of coastal waves 1996.Bull Amer Meteor Soc 79: 1307–1326
Smith RB (1985) On severe downslope winds. J Atmos Sci42: 2597–2603
Whiteman CD, Hubbe JM, Shaw WJ (2000) Evaluation of aninexpensive temperature data logger for meteorologicalapplications. J Atmos Ocean Tech 17: 77–81
Z€aangl G (2003) Deep and shallow south foehn in the regionof Innsbruck: Typical features and semi-idealized numer-ical simulations. Meteorol Atmos Phys 83: 237–261
Corresponding author’s address: Georg Mayr, Institutf€uur Meteorologie und Geophysik, Universit€aat Innsbruck,Innrain 52, A-6020 Innsbruck, Austria (E-mail: [email protected])
Gap flow measurements during the Mesoscale Alpine Programme 119