Tree species is the major factor explaining C:N ratios in European forest soils
15
This article appeared in a journal published by Elsevier. The attached copy is furnished to the author for internal non-commercial research and education use, including for instruction at the authors institution and sharing with colleagues. Other uses, including reproduction and distribution, or selling or licensing copies, or posting to personal, institutional or third party websites are prohibited. In most cases authors are permitted to post their version of the article (e.g. in Word or Tex form) to their personal website or institutional repository. Authors requiring further information regarding Elsevier’s archiving and manuscript policies are encouraged to visit: http://www.elsevier.com/authorsrights
Transcript of Tree species is the major factor explaining C:N ratios in European forest soils

This article appeared in a journal published by Elsevier. The attachedcopy is furnished to the author for internal non-commercial researchand education use, including for instruction at the authors institution
and sharing with colleagues.
Other uses, including reproduction and distribution, or selling orlicensing copies, or posting to personal, institutional or third party
websites are prohibited.
In most cases authors are permitted to post their version of thearticle (e.g. in Word or Tex form) to their personal website orinstitutional repository. Authors requiring further information
regarding Elsevier’s archiving and manuscript policies areencouraged to visit:
http://www.elsevier.com/authorsrights

Author's personal copy
Tree species is the major factor explaining C:N ratios in European forestsoils
N. Cools a,⇑, L. Vesterdal b, B. De Vos a, E. Vanguelova c, K. Hansen d
a Research Institute for Nature and Forest (INBO), Gaverstraat 4, B-9500 Geraardsbergen, Belgiumb Dept. of Geosciences and Natural Resource Management, University of Copenhagen, Rolighedsvej 23, DK-1958 Frederiksberg C, Denmarkc Forest Research, Alice Holt Lodge, Farnham, Surrey GU10 4LH, UKd IVL Swedish Environmental Research Institute, Box 210 60, 100 31 Stockholm, Sweden
a r t i c l e i n f o
Article history:Available online 25 July 2013
Keywords:CarbonNitrogenForest floorMineral soilICP forestsTree species
a b s t r a c t
The C:N ratio is considered as an indicator of nitrate leaching in response to high atmospheric nitrogen(N) deposition. However, the C:N ratio is influenced by a multitude of other site-related factors. Thisstudy aimed to unravel the factors determining C:N ratios of forest floor, mineral soil and peat top soilsin more than 4000 plots of the ICP Forests large-scale monitoring network. The first objective was toquantify forest floor, mineral and peat soil C:N ratios across European forests. Secondly we determinedthe main factors explaining this C:N ratio using a boosted regression tree analysis (BRT), including fifteensite and environmental variables.
Ninety-five percent of the C:N ratios were between 16 and 44 in the forest floor, between 13 and 44 inthe peat topsoil and between 10 and 32 in the mineral topsoil. Within the aerated forest floor and themineral soil, the C:N ratios decreased with depth, while in the hydromorphic forest floor and the peatsno clear trend with depth was observed.
Tree species was clearly the most important explanatory variable for the C:N ratio in both forest floorsand topsoils, while it was soil type in the deeper mineral soil layers. The lowest C:N ratios both in theforest floor and the top mineral soil were found in black locust (Robinia pseudoacacia L.) and black alder(Alnus glutinosa L.) stands, both N fixing tree species. While in the forest floor the highest C:N ratios werefound in evergreen species like pine, cork oak (Quercus suber L.) and eucalyptus, the pine species andDouglas-fir (Pseudotsuga menziesii (Mirb.) Franco) showed the highest C:N ratios in the mineral soil.The second most important explanatory variable in the forest floor and mineral topsoil was the biogeo-graphical zoning (ecoregion). In the peat topsoil and in the deeper mineral soil layers it was the humustype. Deposition and climatic variables were of minor importance at the European scale.
Further analysis for eight main forest tree species individually, showed that the influence of environ-mental variables on C:N ratios was tree species dependent. For Aleppo pine (Pinus halepensis Miller)and holm oak (Quercus ilex L.), both with a typical Mediterranean distribution, the relationship betweenN and S deposition and C:N ratio appeared to be positive. This study suggests that applying C:N ratios as ageneral indicator of the N status in forests at the European level, without explicitly accounting for treespecies, is too simplistic and may result in misleading conclusions.
� 2013 Elsevier B.V. All rights reserved.
1. Introduction
Most temperate forest ecosystems that are prone to excessivenitrogen (N) deposition have traditionally been considered N lim-ited, i.e. fertilizer experiments showed tree growth response onlyto added N (Aber et al., 1989). Elevated N deposition represents acontinuous source of plant-available N in surplus to plant-availableN resulting from organic matter mineralisation and/or N2 fixation.
When N loading reaches a level at which inputs to the forest eco-system are in excess of both biological uptake and the storagecapacity of the soil, then nitrate will leach below the rooting zone,a state termed N saturation (Aber et al., 1989). Forest floor C:N ra-tios have been proposed as indicators for nitrate leaching mainly inconiferous forest ecosystems (Dise et al., 1998a; Emmett et al.,1998; Gundersen et al., 1998; Macdonald et al., 2002). In deciduousforests with thin forest floors, the C:N ratio of the mineral topsoilwas shown to be a better indicator of the N status than the forestfloor C:N ratio (Vesterdal et al., 2008; Gundersen et al., 2009).Along the same lines, Kristensen et al. (2004) found that in broad-leaved forests topsoil pH and throughfall N correlated better withsoil solution nitrate concentrations than forest floor C:N ratio.
0378-1127/$ - see front matter � 2013 Elsevier B.V. All rights reserved.http://dx.doi.org/10.1016/j.foreco.2013.06.047
⇑ Corresponding author. Tel.: +32 54 43 61 75; fax: +32 54 43 61 60.E-mail addresses: [email protected] (N. Cools), [email protected] (L. Vesterdal),
[email protected] (B. De Vos), [email protected] (E. Van-guelova), [email protected] (K. Hansen).
Forest Ecology and Management 311 (2014) 3–16
Contents lists available at SciVerse ScienceDirect
Forest Ecology and Management
journal homepage: www.elsevier .com/locate / foreco

Author's personal copy
However, in North America, Lovett et al. (2002) reported a negativerelationship between forest floor C:N ratio and nitrate leaching indeciduous stands. Their analysis indeed demonstrated that theC:N ratio in the catchments soils was mainly determined by treespecies composition. Also in other studies, nitrate leaching wasnot solely and generally governed by forest floor C:N ratio. In Swit-zerland, Thimonier et al. (2010) reported that nitrate leaching oc-curred in forest stands subjected to N deposition levels>10 kg ha�1 year�1 and where the C:N ratio in the forest floorwas below a certain threshold. However, they concluded that therewas no general threshold and that nitrate leaching dependedrather on other soil variables such as the organic C stock and thehumus type.
Low C:N ratios have additionally been associated with in-creased emission of N2 and reactive N trace gases from soil(Sutton et al., 2011), especially from peat soils (Klemedtssonet al., 2005). Several studies have shown that N deposition andnitrous oxide (N2O) as well as nitric oxide (NO) emissions fromforest soils are positively correlated (Pilegaard et al., 2006; Skibaet al., 2006) – from 3.7% (under coniferous) to 5.7% (under broad-leaves) of N deposited could be lost as N2O (Denier van der Gonand Bleeker, 2005). Some studies have found that sites high insoil N concentrations and with low C:N ratios had a lower capac-ity for methane oxidation than those with low N concentrationsand high C:N ratios (Wang and Ineson, 2003; Bodelier andLaanbroek, 2004; Reay and Nedwell, 2004; Saari et al., 2004).Further, in N saturated forest ecosystems, where N is not limitingmicrobial growth, additional N inputs could impede soil respira-tion and particularly the later stages of organic matter decompo-sition (Janssens et al., 2010).
The use of forest soil C:N ratios alone or in combination withthroughfall N input as an indicator of nitrate leaching reflects thatthe C:N ratio does not suffice as a single proxy for high N status.Apart from N deposition, the C:N ratio is potentially influencedby a multitude of other site-related variables. Koerner et al.(1997) and Verheyen et al. (1999) found that former agriculturalsoils displayed a lower C:N ratio than soils in old forests. In sitesunder long-term forest cover, Goodale and Aber (2001) reportedthat historical logging and burning caused higher C:N ratios com-pared to old growth forests. In common garden experimentsincluding common European broadleaf species and Norway spruce,forest floor and topsoil C:N ratios differed among tree species(Vesterdal and Raulund-Rasmussen, 1998; Vesterdal et al., 2008).Ollinger et al. (2002), Aitkenhead-Peterson et al. (2006) and Crossand Perakis (2011) showed a similar effect. Soil type has been re-ported to influence C:N ratios in Northern European studies, withlower C:N ratios in fine-textured than in coarse-textured mineralsoils (Vejre et al., 2003; Callesen et al., 2007). The combined influ-ence of tree species and soils on C:N ratios presents a challenge forinterpretations of large N input–output monitoring datasets acrossEurope. For instance, Kristensen et al. (2004) suggested that broad-leaved stands (with lower C:N ratios) leached more N than conifersat comparable N inputs, but concluded that the tree species effectwas likely confounded with a soil type effect as broadleaved treespecies are more frequently found on fine textured soils. As sug-gested by Gundersen et al. (2009), there is an obvious need to dis-entangle how factors that control nitrate leaching – or theirindicators such as soil C:N ratio – are affected by tree speciesand soil type, respectively.
The aim of this study was to unravel the factors determining theC:N ratios of forest floor, mineral and peat topsoils in more than4000 forest plots located on a systematic 16 � 16 km grid. The firstobjective was to quantify forest floor and mineral or peat topsoilC:N ratios across European forests. The second objective was todetermine the main factors that explain the C:N ratios found inthose forest soils.
2. Materials and methods
2.1. Network, survey, sampling and analytical methods
In 1985, the International Co-operative Programme on Assess-ment and Monitoring of Air Pollution Effects on Forests (ICP Forests)of the United Nations ECE Convention on Long-Range TransboundaryAir Pollution (CLRTAP) set up a systematic 16 � 16 km grid (Level I)throughout Europe to annually assess the condition of the forest eco-systems. Under the Forest Focus Regulation (EC) No. 2152/2003, 22European countries participated in a large-scale soil inventory (Bio-Soil) on 4928 forest stands in this Level I grid. The sampling and anal-yseswereperformedbetween2006and2009.ThedatawerestoredintheLevelIForestSoilConditionDatabase(FSCDB.LI.2.1)ofICPForests.
On each forest plot a detailed profile description was carried outand soils were classified according to the World Reference Base forSoil Resources (WRB; IUSS Working Group WRB, 2006, 2007). Thephysical and chemical status of the soil was assessed by samplingand analysis of composite forest floor and soil samples to a depthof 80 cm following the methods outlined in the ICP Forests Manual(FSCC, 2006).
The forest floor was sampled according to its sublayers: OL (litterlayer), OF (fermentation layer) and OH (humified layer, or OF andOH combined in one sample) or in hydromorphic forest floors: Hf(fibric), Hfs (mesic) and Hs (sapric) (FSCC, 2006). Since it was notmandatory to sample the OL layer, C:N ratios in the OL layer couldonly be calculated for 1240 of out 4928 stands. Unless stated other-wise, the term ‘forest floor’ refers to the combined OF and OH layer.The mineral soil was sampled according to four predefined fixeddepth layers: 0–10 cm, 10–20 cm, 20–40 cm and 40–80 cm wherethe 0 cm line corresponds to the boundary between the forest floorand the underlying mineral soil or peat layer. The topsoil is here de-fined as the 0–10 cm layer. In a number of countries, the 0–5 cm andthe 5–10 cm depths were sampled separately. The composite soilsamples consisted of at least five equal mass subsamples, exceptfor situations with a variable lower depth limit. Organic C (OC)was measured by dry combustion method, mostly using a total Canalyser (ISO, 1995a; Matejovic, 1993) and total N (TON) either bydry combustion (ISO, 1998) or by the modified Kjeldahl method(ISO, 1995b). Bi-annual interlaboratory comparisons showed thatthe analytical results for OC and TON were highly comparable be-tween the laboratories (Cools et al., 2003, 2006, 2007; Cools andDe Vos, 2009). In addition, in most stands undisturbed soil coreswere taken for the measurement of the bulk density (ISO, 1993) atthe same depth as the samples for chemical analysis and the per-centage of coarse fragments was assessed (FSCC, 2006).
The C:N ratios were calculated in two ways. Firstly, based on theratios between concentrations in each of the individual soil layers(OC/TON, both in g kg�1). Secondly, in order to obtain one C:N ratiofor the forest floor and one value for the topsoil, weighted averageswere calculated from the forest floor sub layers (OF and OH) andfrom the 0–5 and 5–10 cm layers. These weighted averages werebased on the total mass (or stocks) of C and N in the individual lay-ers, taking bulk density and stone content into account. As the dee-per mineral soil layers were all sampled according to the samedepth limits, no weighing was necessary.
In 1995, ICP Forests conducted a large-scale foliage survey on asubset of approximately 1400 plots of the Level I grid (Stefan et al.,1997). Assuming a 50% concentration of carbon, bootstrappedmean C:N ratios for the most common tree species were calculated.
2.2. Statistical analyses
Basic statistics were calculated using the TIBCO Spotfire S+ 8.2for Windows (2010). Bootstrapping was used to obtain confidence
4 N. Cools et al. / Forest Ecology and Management 311 (2014) 3–16

Author's personal copy
intervals (CIs) for the C:N ratios. In the bootstrap, ‘‘B’’ new samples,each of the same size as the observed data, were drawn withreplacement from the observed data. The applied number of newsamples (B) was 5000. Confidence intervals of the mean were cal-culated based on bias-corrected and accelerated (Bca) percentilesat 2.5% and 97.5%, respectively. When CIs do not overlap, differ-ences are statistically significant at the 95% confidence level. Espe-cially when comparing multiple levels, CIs are more informativethan p-values. Furthermore, the 95% CI of the bootstrapped mean(95% CI BS mean) does not require a normal distribution. Wherethe C:N distributions deviate from normality, CIs become asym-metrical around the mean which is more robust and reliable.
The most influential predictors for estimating the C:N ratio in for-est floors and topsoil were selected at the plot level, i.e. based on gen-eral plot-related variables. Boosted regression tree models (BRT)were built by means of R-software, version 2.14 (R Development CoreTeam, 2011), using the ‘gbm’ package version 1.6.3.1 (Ridgeway,2010) and its extensions developed by Elith et al. (2008). BRTcombines machine learning methods and regression analysis. Themethod has some important advantages: the predictor variablescan be of any type (numeric, binary or categorical); it is insensitiveto outliers; it can accommodate missing data using surrogates;and interaction predictors are automatically modelled. The residualvariance indicates the relative strength of interactions fitted by BRT,with a relative variance of zero indicating that no interaction effectsare fitted. Models were fitted using the gbm.step function and aGaussian response type (aimed at minimising squared error), withmost effective settings for learning rate (0.001–0.005) and bag frac-tion (0.5–0.7). Tree complexity, i.e. the number of nodes in a tree, wasset to 5, according to recommendations by Elith et al. (2008) for largedatasets. We set the minimum number of trees to 1000. As output,the BRT analysis provides the relative influence of the predictor vari-ables in the model, based on the number of times that this variablewas selected for splitting, weighed by the squared improvement tothe model as a results of each split, and averaged over all trees. Therelative influence or contribution of each variable is scaled so thatthe sum adds to 100, with higher numbers indicating strongerinfluence on the response. A similar approach using BRT in forestecosystems was performed by Aertsen et al. (2012). A drawback ofBRT is the danger of over-fitting when using categorical predictorvariables with a high number of classes. This problem was solvedby limiting the number of classes for the categorical variables to amaximum of 26. This maximum guaranteed a minimum of 20 plots,with C:N data for the upper 10 cm of the mineral soil, for each of theconsidered main tree species.
Fifteen variables related to soil, geography, vegetation, climateand deposition were used to explain the C:N ratio of the OL layer,the forest floor, mineral soil and peat layers (Table 1 and Fig. 1).The information on the main tree species is derived from the ICPForests crown condition survey conducted on the same plots(Lorenz et al., 2007). In case of mixed stands, the main tree speciesis the tree species dominating the forest canopy in terms of canopyclosure of the plot. Cumulative deposition values were calculatedfor 5 years prior to the soil inventory (2002–2006) based on depo-sition data from the Cooperative Programme for Monitoring andEvaluation of the Long-range Transmission of Air Pollutants in Eur-ope (EMEP). The relation with total C and N stocks was investigatedby simple linear regression models for the eight most importantmain tree species separately.
3. Results
3.1. Ranges of C:N ratios across European forests
In European forests, 95% of the forest floor C:N ratios were be-tween 16 and 44 (Table 2). When considering the individual forest
floor sub layers, the C:N ratios in the OL and OF were higher com-pared to the other sub layers, i.e. the humified and water saturatedlayers. The C:N ratios decreased significantly with depth from theOL layer to the OH layer (OL � OF > OFH > OH), i.e. with proceedingstage of decomposition. In hydromorphic forest floors (Hf, Hfs andHs) C:N ratios decreased – though not statistically significant –from the least decomposed layer (Hf, fibric) over the Hfs (mesic)towards the most decomposed (Hs, sapric) layers. The mean C:Nratios in all organic layers were significantly higher compared tothe mineral topsoil. Ninety-five percent of the mineral topsoilC:N ratios were between 10 and 32. The ratios significantlydecreased with depth to a relatively stable level below 20 cm(0–10 cm > 10–20 cm > 20–40 cm � 40–80 cm). The C:N ratios inthe peat topsoil were in the range 13–44 and were comparableor slightly lower than those in the hydromorphic forest floor layers.The C:N ratio tended to increase with the depth of the peat thoughno statistically significant differences between overlying layerswere observed.
3.2. Relationship between C:N ratios and environmental variables
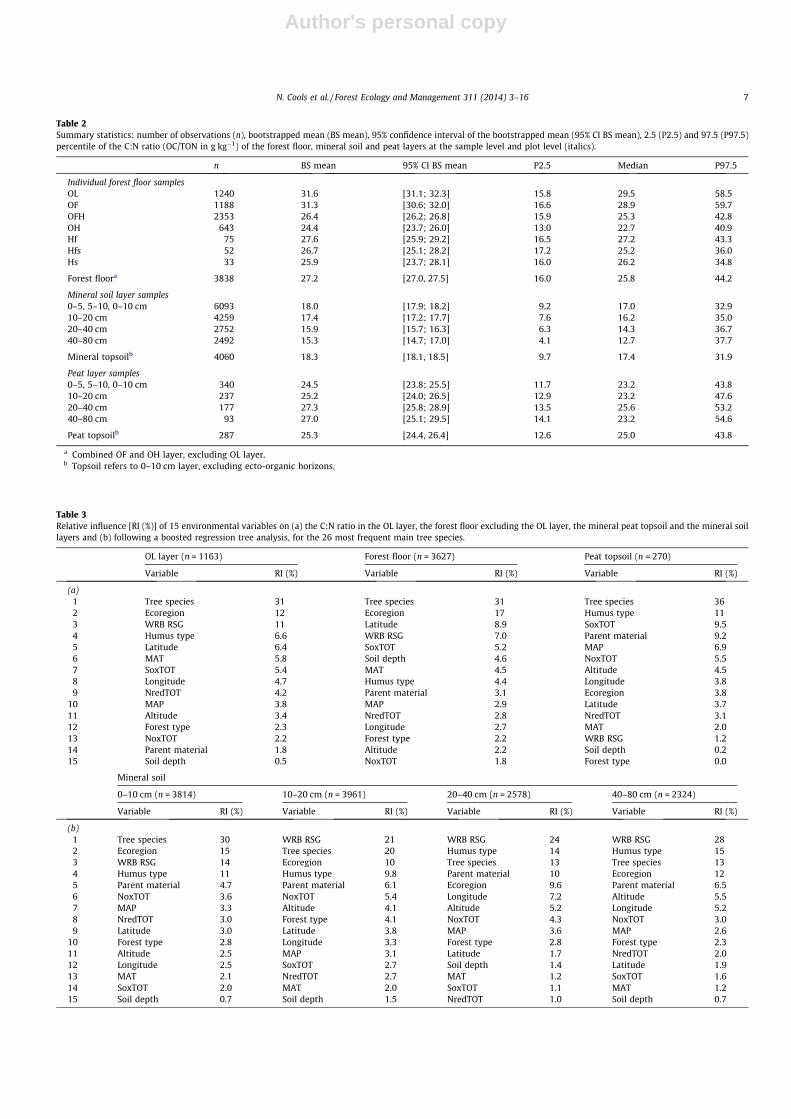
Tree species was the explanatory variable with the highest rel-ative influence in the OL layer, the forest floor, peat and mineraltopsoils (30–36%, Table 3). In the deeper mineral soil layers, thesoil type became the variable with the highest relative influencewhile tree species still contributed for 10–20% of the variation. Inthe OL layer, the forest floor and the mineral topsoil, the ecoregion(12–17%) was the second most important explanatory variable,while tree species was important in the 10–20 cm layer and humustype in the peat topsoil and the deeper mineral soil layers(>20 cm). Soil type was of no importance in the peat topsoil, whiledeposition had a high relative influence (nearly 10%) on the C:N ra-tio. Deposition was not important in any of the other layers.
There was a wide range in the mean C:N ratios of the forest flooramong the main tree species (X-axis in Fig. 2). Black alder (Alnusglutinosa L.) and black locust (Robinia pseudoacacia L.), both N fixingtree species, had C:N ratios below 20. The other non-N fixing mem-bers of the Betulaceae family (silver birch – Betula pendula Roth,hornbeam – Carpinus betulus L. and white birch – Betula pubescensEhrh.) and ash (Fraxinus excelsior L.) were also found in the lowerC:N range. Oak species (Quercus sp.) were found across the wholerange. While sessile oak (Quercus petraea (Mattuschka) Liebl.),pedunculate oak (Quercus robur L.) and pubescent oak (Quercuspubescens Willd.) had low C:N ratios, holm oak (Quercus ilex L.)and cork oak (Quercus suber L.) had high. The Pyrenean oak (Quer-cus pyrenaica Willd. or Quercus toza), an oak species with interme-diate characteristics between the Eurosiberian oaks (sessile andpedunculate oak) and the more sclerophyllous Mediterranean oaks(holm oak (Q. ilex L.) and cork oak (Q. suber L.)) had intermediateC:N ratios. Eucalyptus (Eucalyptus sp.), had the highest mean forestfloor C:N ratio of the broadleaved tree species under consideration.Sitka spruce (Picea sitchensis (Bong) Carrière) with a mean C:N ratioof 25.8 and Norway spruce (Picea abies (L.) Karst.), with a mean C:Nratio of 25.7, were close to the overall median C:N ratios (25.9) ofthe dataset. Evergreen tree species generally had higher C:N ratiosthan the deciduous trees. The five included pine species all hadmean C:N ratios close to or above 30. A notable exception amongconifers was Douglas-fir (Pseudotsuga menziesii (Mirb.) Franco),with a mean forest floor C:N ratio of 21.7 but only recorded on arelatively low number of plots (n = 15). Silver fir (Abies alba L.) alsodiffered from most coniferous species with its relatively low C:Nratio (23.6) in the forest floor.
In the topsoil there were some interesting shifts in the rankingcompared to the forest floor (Y-axis in Fig. 2). Douglas-fir, whichhad a low C:N in the forest floor, showed one of the highest C:N ra-tios in the topsoil. The C:N ratios under silver birch, sessile oak,
N. Cools et al. / Forest Ecology and Management 311 (2014) 3–16 5

Author's personal copy
Aleppo pine (Pinus halepensis Miller), eucalyptus and black pine (Pi-nus nigra J.F. Arnold) were very close to the overall median C:N ra-tio of 17.6. Most pine species consistently had the highest C:Nratios in both topsoil and forest floor.
The ranking of the tree species for the forest floor C:N followedthe order of the C:N ratios of the fresh foliage (Stefan et al., 1997)where all deciduous tree species (including larch) have C:N ratios<29 and evergreen species have fresh foliar C:N ratios >29. When
Table 1Explanatory variables used in the boosted regression tree (BRT) models to estimate the C:N ratio.
Variable Type Unit Description
Latitude, Longitude Numeric km X and Y easting and northing coordinates of the location of the monitoring plot (according toETRS89). X and Y values are always positive
Altitude Numeric m Elevation of the plot above sea levelMAT Numeric �C Mean annual temperature (WORLDCLIM geodatabase version 1.3, 2009)MAP Numeric mm Mean annual precipitation (WORLDCLIM geodatabase version 1.3, 2009)Parent material Factor (9)a Parent material class (Lambert et al., 2003)WRB RSG Factor (26) WRB reference soil group as described on the plot (IUSS Working Group WRB, 2006, 2007)Soil depth Numeric cm Estimated depth of profile (till 100 cm)Humus type Factor (9) Amphi, mull, moder, mor, anmoor, histoamphi, histomull, histomoder and histomor humus
forms (Zanella et al., 2011)Forest type Factor (12) Forest type (FOREST EUROPE, UNECE, FAO, 2011)Tree species Factor (25) Tree species code of main tree species on plotEcoregion Factor (18) Ecoregion (EEA, 2004)NredTOT Numeric kg ha�1 5 yr�1 Total (dry + wet) depositions for reduced and oxidised N and oxidised S by the EMEP/MSC-W
model cumulative totals for the years 2002–2006NoxTOT Numeric kg ha�1 5 yr�1
SoxTOT Numeric kg ha�1 5 yr�1
a Number of levels are given between brackets.
Cyprus
1
16
3
22
6
23
14
20
18
139
21
12
57
8 4
15
11
17
10
25
2
24
Canary Islands
20
1
Ecoregions (EEA, 2004)
1. Ibero-Macaronesian region
2. Pyrenees
3. Italy and Corsica
4. Alps
5. Dinaric western Balkan
6. Hellenic western Balkan
7. Eastern Balkan
8. Western highlands
9. Central highlands
10. The Carpathiens
11. Hungarian lowlands
13. Western plains
14. Central plains
15. Baltic province
16. Eastern plains
17. (Northern) Ireland
18. Great Britain
20. Borealic uplands
22. Fenno-scandian shield
N
Fig. 1. The distribution of the 4928 plots of the ICP Forests large-scale monitoring network involved in this study according to the ecoregions (EEA, 2004).
6 N. Cools et al. / Forest Ecology and Management 311 (2014) 3–16
Author's personal copy
Table 2Summary statistics: number of observations (n), bootstrapped mean (BS mean), 95% confidence interval of the bootstrapped mean (95% CI BS mean), 2.5 (P2.5) and 97.5 (P97.5)percentile of the C:N ratio (OC/TON in g kg�1) of the forest floor, mineral soil and peat layers at the sample level and plot level (italics).
n BS mean 95% CI BS mean P2.5 Median P97.5
Individual forest floor samplesOL 1240 31.6 [31.1; 32.3] 15.8 29.5 58.5OF 1188 31.3 [30.6; 32.0] 16.6 28.9 59.7OFH 2353 26.4 [26.2; 26.8] 15.9 25.3 42.8OH 643 24.4 [23.7; 26.0] 13.0 22.7 40.9Hf 75 27.6 [25.9; 29.2] 16.5 27.2 43.3Hfs 52 26.7 [25.1; 28.2] 17.2 25.2 36.0Hs 33 25.9 [23.7; 28.1] 16.0 26.2 34.8
Forest floora 3838 27.2 [27.0, 27.5] 16.0 25.8 44.2
Mineral soil layer samples0–5, 5–10, 0–10 cm 6093 18.0 [17.9; 18.2] 9.2 17.0 32.910–20 cm 4259 17.4 [17.2; 17.7] 7.6 16.2 35.020–40 cm 2752 15.9 [15.7; 16.3] 6.3 14.3 36.740–80 cm 2492 15.3 [14.7; 17.0] 4.1 12.7 37.7
Mineral topsoilb 4060 18.3 [18.1, 18.5] 9.7 17.4 31.9
Peat layer samples0–5, 5–10, 0–10 cm 340 24.5 [23.8; 25.5] 11.7 23.2 43.810–20 cm 237 25.2 [24.0; 26.5] 12.9 23.2 47.620–40 cm 177 27.3 [25.8; 28.9] 13.5 25.6 53.240–80 cm 93 27.0 [25.1; 29.5] 14.1 23.2 54.6
Peat topsoilb 287 25.3 [24.4, 26.4] 12.6 25.0 43.8
a Combined OF and OH layer, excluding OL layer.b Topsoil refers to 0–10 cm layer, excluding ecto-organic horizons.
Table 3Relative influence [RI (%)] of 15 environmental variables on (a) the C:N ratio in the OL layer, the forest floor excluding the OL layer, the mineral peat topsoil and the mineral soillayers and (b) following a boosted regression tree analysis, for the 26 most frequent main tree species.
OL layer (n = 1163) Forest floor (n = 3627) Peat topsoil (n = 270)
Variable RI (%) Variable RI (%) Variable RI (%)
(a)1 Tree species 31 Tree species 31 Tree species 362 Ecoregion 12 Ecoregion 17 Humus type 113 WRB RSG 11 Latitude 8.9 SoxTOT 9.54 Humus type 6.6 WRB RSG 7.0 Parent material 9.25 Latitude 6.4 SoxTOT 5.2 MAP 6.96 MAT 5.8 Soil depth 4.6 NoxTOT 5.57 SoxTOT 5.4 MAT 4.5 Altitude 4.58 Longitude 4.7 Humus type 4.4 Longitude 3.89 NredTOT 4.2 Parent material 3.1 Ecoregion 3.8
10 MAP 3.8 MAP 2.9 Latitude 3.711 Altitude 3.4 NredTOT 2.8 NredTOT 3.112 Forest type 2.3 Longitude 2.7 MAT 2.013 NoxTOT 2.2 Forest type 2.2 WRB RSG 1.214 Parent material 1.8 Altitude 2.2 Soil depth 0.215 Soil depth 0.5 NoxTOT 1.8 Forest type 0.0
Mineral soil
0–10 cm (n = 3814) 10–20 cm (n = 3961) 20–40 cm (n = 2578) 40–80 cm (n = 2324)
Variable RI (%) Variable RI (%) Variable RI (%) Variable RI (%)
(b)1 Tree species 30 WRB RSG 21 WRB RSG 24 WRB RSG 282 Ecoregion 15 Tree species 20 Humus type 14 Humus type 153 WRB RSG 14 Ecoregion 10 Tree species 13 Tree species 134 Humus type 11 Humus type 9.8 Parent material 10 Ecoregion 125 Parent material 4.7 Parent material 6.1 Ecoregion 9.6 Parent material 6.56 NoxTOT 3.6 NoxTOT 5.4 Longitude 7.2 Altitude 5.57 MAP 3.3 Altitude 4.1 Altitude 5.2 Longitude 5.28 NredTOT 3.0 Forest type 4.1 NoxTOT 4.3 NoxTOT 3.09 Latitude 3.0 Latitude 3.8 MAP 3.6 MAP 2.6
10 Forest type 2.8 Longitude 3.3 Forest type 2.8 Forest type 2.311 Altitude 2.5 MAP 3.1 Latitude 1.7 NredTOT 2.012 Longitude 2.5 SoxTOT 2.7 Soil depth 1.4 Latitude 1.913 MAT 2.1 NredTOT 2.7 MAT 1.2 SoxTOT 1.614 SoxTOT 2.0 MAT 2.0 SoxTOT 1.1 MAT 1.215 Soil depth 0.7 Soil depth 1.5 NredTOT 1.0 Soil depth 0.7
N. Cools et al. / Forest Ecology and Management 311 (2014) 3–16 7

Author's personal copy
visualizing the C:N ratio in the forest floor against the C:N ratio infresh foliage (Fig. 3), the observations clearly fall in two to threegroups. In the upper right corner the evergreen species includingconifers, evergreen oaks and eucalyptus, in the centre the decidu-ous tree species, including larch and in the bottom left corner blacklocust.
Concerning the soil type, the mean C:N ratio of the forest floorranged from 24 in the Chernozems, soils characterised by a thicktopsoil rich in organic matter, to 31 in the Calcisols and Kastanoz-ems, which are two soil types of dry climates (Table 4). The wideCIs of the Andosols, Calcisols and Kastanozems were related tothe low number of observation plots for these soil types. Whenlooking at the most frequently described WRB reference soilgroups (RSGs), the Regosols, Arenosols, Leptosols and Podzolshad significantly higher C:N ratios in the forest floor compared tothe Cambisols and Luvisols. The Gleysols and Stagnosols, both soiltypes under the influence of a fluctuating (surface/ground) watertable, had similar C:N ratios in the forest floor (�25). The forestfloor of the aerated Histosols, showed intermediate C:N ratios. Inthe topsoil, the ranking was somewhat different. The Histosols,which are organic in nature, had a significantly higher C:N ratiocompared to all other RSGs. The RSGs which mainly occur in north-ern Europe on sandy parent material, had high C:N ratios in thetopsoil (Podzols and Arenosols) compared to most other RSGs.The RSGs dominated by fluctuating water tables (Gleysols, Stagno-sols and Planosols) all had the same mean C:N ratio of 18.1. TheAndosols, Fluvisols, Chernozems, Luvisols, Lixisols, and Phaeozemsall showed mean C:N ratios below 16.
The ecoregion was observed to be an important explanatoryvariable of the C:N ratios in forest floors as well as in mineral top-soil. In the forest floor, the highest C:N ratios were observed innorthern ecoregions (Fenno-scandian shield and the Borealic up-lands) as in the South (Ibero-Macaronesian region). The lowestC:N ratios were seen in Italy and Corsica, both in the forest floorand in the mineral topsoil. The highest C:N ratios in the mineraltopsoil were observed in both the Fenno-scandian shield and inthe Central plains (Table 5).
Humus type was yet another important explanatory factor.In the forest floor, significant differences in mean C:N ratiosof the terrestrial humus forms were found in the orderAmphi < Mull = Moder < Mor (Table 6). When the optionallyreported C:N data on the OL layer were included in the calculationof the C:N ratio of the whole forest floor, the ranking in terrestrialhumus forms was in the order Amphi < Moder < Mull < Mor.Within the semi-terrestrial humus forms no significant differenceswere observed. In the topsoil, significant differences in mean C:Nratios were found, below the terrestrial humus forms in the orderAmphi = Mull < Moder < Mor. Below the semi-terrestrial humusforms the order was Histomull < Histomoder < Histomor.
3.3. Stratification by main tree species
The residual variances of the BRT analyses indicated that anumber of variables interacted significantly with the effect of treespecies, both in the forest floor and the topsoil. Therefore, a secondrun of BRT analyses was carried out separately for each of the eightmost common tree species in the dataset.
For most of the considered tree species, the soil type was animportant variable in explaining the C:N ratio in both the forestfloor and the top mineral soil (Table 7). For Scots pine and commonbeech, two species with a wide geographic distribution, the ecore-gion was the most important explanatory variable. When consider-ing the individual tree species, deposition variables gained inimportance compared to the initial analysis, especially for Norwayspruce and Aleppo pine. For Norway spruce the total sulphur (S)deposition seemed to have a negative effect on the C:N ratio inthe forest floor and a small negative effect in the top mineral soil.For Aleppo pine, the total N deposition showed a high positive rel-ative influence on the C:N ratio, especially in the forest floor.
The humus type played an important role explaining the C:N ra-tio in the forest floor and the mineral topsoil of Scots pine, Norwayspruce, common beech, silver birch and pedunculate oak. In thesetree species, the C:N ratio in the mull humus forms was signifi-cantly higher compared to moder and mor humus forms (Table 8).
15 20 25 30 35 40C:N ratio in forest floor
10
15
20
25C
:N ra
tio in
tops
oil
RpsAgl
Qce
Qil
QpyFex
Qpu Cbe
PcoPpi
Psy
Pha PniEuc
Qsu
Qpe Bpe
Pme
Bpu
Pab
Psi
Qro
Csa
Aal
Lde
Fsy
Fig. 2. The bootstrapped mean C:N ratios in the forest floor against the C:N ratios in the topsoil, with their 95% confidence interval of the bootstrapped mean (95% CI BSmean), grouped by main tree species (when the 95% confidence intervals do not overlap, the differences are significant). Legend: Aal: Silver fir, Agl: Black alder, Bpe: Silverbirch, Bpu: White birch, Cbe: Hornbeam, Csa: Sweet chestnut, Euc: Eucaypt, Fsy: Common beech, Fex: Ash, Lde: European larch, Pab: Norway spruce, Psi: Sitka spruce, Pni:European black pine, Pco: Lodgepole pine, Pha: Aleppo pine, Ppi: Maritime pine, Psy: Scots pine, Pme: Douglas fir, Qce: Turkey oak, Qil: Holm oak, Qpe: Sessile oak, Qpu: Pubescentoak, Qpy: Pyrenean oak, Qrob: Pedunculate oak, Qsu: Cork oak, Rps: Black locust. Italic names indicate coniferous species.
8 N. Cools et al. / Forest Ecology and Management 311 (2014) 3–16

Author's personal copy
There was, however, no significant difference between these threehumus forms in holm oak, maritime pine or Aleppo pine.
In the mineral topsoil, the soil variables were more important inexplaining the C:N ratio compared to the forest floor. The soil typehad either the highest or second highest relative influence for eachof the eight considered main tree species. The ecoregion and thehumus type had a relative high influence for the most widely dis-tributed tree species such as Scots pine, Norway spruce, beech andbirch but were less important for tree species with a more narrowand southern distribution such as holm oak, Aleppo pine and mar-itime pine.
On the plots dominated by Scots pine and Norway spruce, His-tosols clearly had the highest C:N ratios in the topsoil, followed byPodzols, Arenosols and Regosols. The Luvisols had the lowest C:Nratios (Table 9). Under beech, there were hardly any significant
differences among soil types (except between Luvisols and Stagno-sols). In silver birch plots, the C:N ratios were significantly higherin Podzols compared to Cambisols or Histosols. Under pedunculateoak the mean C:N ratios on Arenosols were significantly highercompared to the Cambisols and the Luvisols. In holm oak and Alep-po pine plots there were no significant differences between thethree WRB RSGs on which they grow. Maritime pine plots had amean C:N ratio above 20 on all soil types and above 30 on Podzolswhich is high for mineral soil. No significant differences were ob-served between the other RSGs.
On sandy soils (Arenosols) significant differences in C:N ratioswere observed between the five considered tree species (Table 9).The lowest ratios were observed in silver birch with a mean of 17.6.This ratio is considerably lower than the overall mean ratio forArenosols (Table 5) and for Scots pine and maritime pine
15 20 25 30 35 40C:N ratio in forest floor
10
20
30
40
50
C:N
ratio
in fr
esh
folia
ge
Rps
Qce
Qpe
Qro
BpeCbe
Ppi
Pni
Euc
Psy
QsuPsi
PabAal
CsaQpy
Fsy
Lde
Qil
Fig. 3. The bootstrapped mean C:N ratios in the forest floor against the C:N ratios in the fresh foliage, with their 95% confidence interval of the bootstrapped mean (95% CI BSmean), grouped by main tree species (when the 95% confidence intervals do not overlap the differences are significant). Legend: see Fig. 2.
Table 4The bootstrapped mean C:N ratios, with their 95% confidence interval of the bootstrapped mean (95% CI BS mean) for the forest floor and the upper 10 cm of the soil, grouped bythe major WRB reference soil groups (RSGs) (IUSS Working Group WRB, 2006, 2007).
RSG C:N forest floor C:N upper 10 cm
n BS mean 95% CI BS mean n BS mean 95% CI BS mean
Albeluvisols 21 25.5 abcd [23.6; 30.8] 15 16.4 abc [14.5; 18.9]Alisols 49 27.9 bcd [26.3; 29.6] 52 16.1 b [14.9; 17.4]Andosols 14 26.2 abcd [24.0; 29.1] 20 13.5 a [12.5; 14.7]Arenosols 475 28.6 cd [28.1; 29.2] 495 20.9 e [20.4; 21.4]Anthrosols 9 27.0 abcd [23.6; 30.5] 14 17.5 abcde [14.3; 22.2]Chernozems 8 24.4 ab [20.9; 27.5] 9 13.2 a [11.8; 14.9]Calcisols 25 31.3 cd [28.6; 34.1] 29 16.4 abc [14.2; 18.8]Cambisols 740 25.6 a [25.2; 26.0] 1054 16.5 bc [16.2; 16.8]Fluvisols 15 24.2 ab [22.2; 26.4] 26 14.3 ab [12.9; 16.4]Gleysols 121 25.1 a [24.2; 26.0] 149 18.1 bcd [17.2; 19.2]Histosols 85 26.6 ab [25.2; 28.0] 237 26.1 g [25.0; 27.4]Kastanozems 20 31.3 cd [28.1; 33.9] 22 16.9 abcde [13.8; 21.2]Leptosols 292 28.9 cd [28.1; 29.8] 273 16.6 b [16.0; 17.3]Luvisols 167 26.1 a [25.3; 27.1] 237 15.3 a [14.8; 15.8]Lixisols 13 25.2 abc [22.5; 29.3] 26 13.7 a [12.9; 14.6]Phaeozems 53 25.2 ab [23.6; 26.3] 87 15.2 a [14.4; 16.0]Planosols 20 27.3 abcd [24.7; 29.8] 27 18.1 bcd [16.5; 20.4]Podzols 615 29.2 d [28.8; 29.7] 520 22.8 f [22.3; 23.4]Regosols 704 28.3 cd [27.8; 28.8] 632 19.4 d [19; 19.9]Stagnosols 99 25.2 ab [24.3; 26.4] 134 18.1 c [17.4; 18.9]Umbrisols 119 25.9 ab [24.8; 26.9] 141 16.9 bc [16.2; 17.5]
N. Cools et al. / Forest Ecology and Management 311 (2014) 3–16 9

Author's personal copy
individually. The C:N ratio under maritime pine was significantlyhigher compared to all other tree species growing on Arenosols.On the most widespread soil type (Cambisols), Aleppo pine andholm oak showed the lowest C:N ratios followed by beech, pedun-culate oak and birch. Birch had a relatively wide range of mean C:Nratios in the topsoil, though they were generally lower than thoseof Norway spruce. The C:N ratios below Scots pine were signifi-cantly higher compared to the other tree species, except for mari-time pine. On the Gleysols, Luvisols and Stagnosols, no significantdifferences were seen between the considered tree species. Onthe Histosols, birch had remarkably lower C:N ratios compared toNorway spruce and Scots pine. On Leptosols, C:N ratios below holmoak were significantly lower compared to beech, which again weresignificantly lower than Scots pine.
3.4. Total nitrogen and carbon stocks of the soil profile
Single linear regression equations between topsoil C:N ratiosand total N stock (TNS) and total C stock (TCS) of the soil profile(till 1 m depth) were calculated after log transforming the TNSand TCS. Although the r2 values were generally low, the relation-ship between C:N ratio and the TNS were mainly significantly neg-ative and differed among the tree species (Table 10). No significantrelationship was found for holm oak and it was barely significantfor Aleppo pine. For the other six tree species, C:N decreased withincreasing TNS. The relationships with the TCS explained a negligi-ble share of the variability in C:N ratio compared to TNS. In con-trast to the TNS, a significant positive relationship between
topsoil C:N ratio and the TCS was seen for holm oak and Aleppopine, Norway spruce and Scots pine.
4. Discussion
4.1. C:N ratio of the individual soil layers
Sub horizons of the forest floor clearly differed in C:N ratio (Ta-ble 2). The higher C:N ratio in the OL and OF layer can be attributedto higher content of recently fallen and high-lignin materials.These differences were reflected in the C:N ratio differences amonghumus types (Table 8) and relate to the morphology of the forestfloor. By definition, the amphi humus form consists of a thick OHlayer, resulting in a lower C:N ratio than most other humus forms.The mull humus forms do not have an OH layer and are dominatedby relatively recently fallen litter materials resulting in high C:Nratios. In a common garden experiment in Denmark (Vesterdalet al., 2008), the forest floor was sampled as a whole immediatelybefore the onset of the foliar litter fall of deciduous species when atits minimum. At that moment of the year the C:N ratio is expectedto be relatively low as the new fallen leaves with high C:N ratiohave not yet been added to the forest floor. Yet, typical mull-form-ing tree species such as ash (Fraxinus excelsior L.), lime (Tilia cordataL.) and maple (Acer pseudoplatanus L.) had higher C:N ratios thanoak and spruce, as forest floors just before the foliar litter fall,are dominated by the remaining slower decomposing litter mate-rials, such as twigs and hard seeds.
Table 5The bootstrapped mean C:N ratios, with their 95% confidence interval of the bootstrapped mean (95% CI BS mean), for the forest floor and mineral topsoil according to theecoregion (EEA, 2004).
C:N forest floor C:N mineral topsoil
n Sites BS mean 95% CI BS mean n Sites BS mean 95% CI BS mean
Italy and Corsica 110 20.9 [20.0; 21.6] a 162 12.9 [12.4; 13.4] aHungarian lowlands 62 22.7 [21.4; 25.0] abc 46 15.1 [13.8; 16.4] bcWestern highlands 61 22.8 [21.9; 23.7] b 197 16.9 [16.5; 17.4] cThe Carpathiens 98 22.9 [22.3; 23.6] b 117 14.9 [14.4; 15.3] bEastern plains 149 23.4 [22.7; 24.2] b 180 17.3 [16.6; 18.1] cEngland 108 24.3 [23.3; 25.3] bc 93 16.4 [15.6; 17.4] cPyrenees 22 24.8 [22.5; 27.8] bc 24 16.9 [15.7; 18.5] cdCentral highlands 350 25.1 [24.6; 25.6] c 368 18.8 [18.4; 19.3] dAlps 170 25.4 [24.8; 26.0] cd 205 17.2 [16.6; 17.7] cCentral plains 749 25.5 [25.2; 25.9] cd 604 20.9 [20.5; 21.4] eWestern plains 77 25.6 [24.2; 27.2] cd 299 19.5 [18.8; 20.4] dDinaric western Balkan 41 26.4 [24.8; 28.5] cd 27 16.7 [15.7; 18.0] cBaltic province 181 26.7 [25.7; 27.8] d 133 16.4 [15.6; 17.3] cIreland and Northern Ireland 28 28.6 [26.3; 31.3] de 8 17.5 [15.6; 19.2] cdFenno-scandian shield 797 30.6 [30.1; 31.1] e 698 21.4 [21.0; 21.8] eIbero-Macaronesian region 552 31.0 [30.1; 32.1] e 586 16.8 [16.3; 17.4] cBorealic uplands 63 31.9 [30.1; 33.7] e 40 18.0 [16.5; 20.7] cd
Table 6The bootstrapped mean C:N ratios, with their 95% confidence interval of the bootstrapped mean (95% CI BS mean), of the forest floor and mineral topsoil according to the humusform.
Humus type C:N forest floor including OL C:N forest floor C:N topsoil
n BS mean 95% CI BS mean n BS mean 95% CI BS mean n BS mean 95% CI BS mean
Amphi 8 30.4 [17.2; 23.5] a 105 21.5 [20.7; 22.4] a 118 14.1 [13.6; 14.8] aMull 193 27.0 [26.0; 28.1] c 500 25.6 [24.9; 26.3] b 1016 14.9 [14.7; 15.2] aModer 356 25.1 [24.6; 25.6] b 1225 25.4 [25.0; 25.9] b 1338 18.4 [18.1; 18.7] bMor 297 28.9 [28.1; 29.9] d 1561 29.7 [29.3; 30.0] c 1411 20.7 [20.4; 21.0] cAnmoor 5 26.5a 17 28.5 [24.6; 33.2] bc 23 21.8 [18.9; 24.8] cdHistomull 11 19.6a 24 24.6 [21.0; 35.2] abc 49 15.0 [14.2; 16.2] aHistomoder 23 25.9 [23.5; 28.2] bcd 31 27.2 [25.1; 30.8] bc 39 21.5 [19.2; 24.0] cHistomor 7 29.0a 164 27.4 [26.5; 28.4] c 265 25.6 [24.7; 26.6] d
a No reliable CI could be calculated due to low number of observations.
10 N. Cools et al. / Forest Ecology and Management 311 (2014) 3–16

Author's personal copy
Table 7The five environmental variables with highest relative influence (RI%) on the C:N ratio in the forest floor and the mineral topsoil, following a boosted regression tree analysis forthe eight most frequently described main tree species individually.
Forest floor Mineral topsoil
Variable RI (%) Effect Range/value Variable RI (%) Effect Range/value
Scots pine (n = 1291) Scots pine (n = 1144)Ecoregion 21.3 Ecoregion 18.9MAT 12.9 && [1.5; 3.5] WRB RSG 16.9Parent material 9.5 Humus type 11.3WRB RSG 9.1 NoxTOT 9.3 %% [30; 32]Humus type 8.9 Parent material 7.5
Norway spruce (n = 925) Norway spruce (n = 806)SoxTOT 26.5 && [8; 12] Humus type 27.5
& [35; 42] WRB RSG 16.0WRB RSG 12.7 Ecoregion 14.0Humus type 9.7 Parent material 6.9Parent material 8.4 SoxTOT 6.3 %% [5; 10]Ecoregion 6.9
Common beech (n = 257) Common beech (n = 328)Ecoregion 18.5 Ecoregion 29.6Humus type 13.6 WRB RSG 18.2Parent material 11.0 Parent material 16.9WRB RSG 10.8 Humus type 15.2NredTOT 8.9 && [22; 22.5] NredTOT 3.0 & [25; 45]
Silver birch (n = 95) Silver birch (n = 106)WRB RSG 39.3 Humus type 26.6Humus type 17.2 WRB RSG 20.5Parent material 8.0 TNS 19.0 & [4; 8]Longitude 7.4 & [4600; 5100] Parent material 10.6Ecoregion 7.3 Ecoregion 10.4
Pedunculate oak (n = 93) Pedunculate oak (n = 173)WRB RSG 24.2 WRB RSG 30.6Humus type 21.1 TNS 16.1 & [3; 13]Ecoregion 13.9 Ecoregion 10.0Parent material 9.8 Humus type 9.6NoxTOT 8.1 % [25; 30] Parent material 6.8
Holm oak (n = 141) Holm oak (n = 181)WRB RSG 24.8 WRB RSG 29.5NredTOT 12.1 % [14; 22] MAP 11.2 %% [620; 640]Altitude 10.5 % [300; 1100] Latitude 9.8 %% [2100; 2200]Longitude 10.4 %&& [2900; 3100] NoxTOT 9.1 % [10; 26]Humus type 9.0 Parent material 7.9
Maritime pine (n = 92) Maritime pine (n = 130)WRB RSG 29.7 WRB RSG 31.0Parent material 22.4 Altitude 21.6 && [50; 100]NoxTOT 7.8 % [15; 20] Longitude 9.8 % [3150; 3450]Altitude 7.7 & [0; 900] Latitude 7.5 % [2100; 2450]MAT 7.4 &% [11.5; 13] Parent material 7.0
Aleppo pine (n = 90) Aleppo pine (n = 101)NredTOT 49.2 %% [11; 27] WRB RSG 28.2WRB RSG 21.0 NredTOT 26.0 %% [16; 21]NoxTOT 8.6 % [17.5; 25] Latitude 9.6 % [1760; 2080]Latitude 8.4 %& [1800; 2100] SoxTOT 7.7 %% [16; 20]Altitude 2.8 % [300; 800] Parent material 6.5
Legend:%/& gradual increase/decrease (within specified range); Double arrows indicate strong effects (i.e. covering >50% of the common range of the fitted function). Units:see Table 1.
Table 8The bootstrapped mean of the C:N ratio in the forest floor, with its 95% confidence interval of the bootstrapped mean (95% CI BS mean), for the eight most frequently recorded treespecies on the ICP Forests systematic grid by humus type.
Mull Moder Mor
n BS mean 95% CI BS mean n BS mean 95% CI BS mean n BS mean 95% CI BS mean
Scots pine 57 32.0 [30.1; 34.1] 317 27.6 [27.1; 28.1] 789 31.8 [31.4; 32.3]Norway spruce 80 28.4 [27.0; 29.6] 319 24.9 [24.4; 25.3] 403 27.1 [26.5; 27.6]Common beech 138 27.4 [26.5; 28.2] 105 23.9 [23.2; 24.6] 15 24.5 [22.1; 26.4]Silver birch 24 27.1 [25.1; 29.1] 35 22.4 [21.1; 22.4] 32 25.5 [23.8; 27.4]Pedunculate oak 50 26.9 [25.5; 28.6] 35 21.5 [20.3; 23.1] 21 22.5 [21.4; 24.2]Holm oak 36 28.5 [26.4; 31.2] 82 27.2 [25.8; 28.8] 25 29.9 [27.0; 32.7]Maritime pine 7 32.3a – 48 33.0 [31.3; 35.1] 48 33.8 [31.9; 35.6]Aleppo pine 22 29.7 [28.2; 31.4] 46 30.9 [28.9; 33.1] 27 31.5 [28.9; 35.5]
a No reliable CI could be calculated due to low number of observations.
N. Cools et al. / Forest Ecology and Management 311 (2014) 3–16 11

Author's personal copy
In the mineral soil the mean C:N ratios further decreasedwith depth which is similar to previous findings (Callesenet al., 2007; Melillo et al., 1989; Vejre et al., 2003). C concentra-tions decreased at a faster rate with depth than N concentra-tions. The resulting depth gradient in C:N ratio reflects thebreakdown of organic plant residues by the microbial soil com-munity where plant material tends to have high C:N ratios andmicrobial biomass low C:N ratio.
The median C:N ratio in the peat topsoil was 25.0 (Table 2). Ex-actly this value was identified by Klemedtsson et al. (2005) as athreshold for significant N2O emissions. Assuming that this studyis representative for the distribution of forest soil types across Eur-ope, this would mean that 50% of the peat soils in Europe wouldemit significant amounts of N2O, the fourth most important greenhouse gas after water, carbon dioxide and methane.
4.2. Environmental variables explaining C:N ratios
4.2.1. Main tree speciesIn spite of the numerous potential variables affecting soil prop-
erties in the European-wide soil inventory, we found a striking ef-fect from the main tree species. The importance of tree species forthe C:N ratio is supported by Lovett and Rueth (1999) and Lovettet al. (2002, 2004) in the US as well as Hobbie et al. (2006),Hansson et al. (2011) and Vesterdal et al. (2008, 2012) in Europe.These studies suggested that tree species influences microbialdecomposition primarily via differences in litter lignin and Ncontent, with high lignin and low N species decomposing mostslowly, with subsequent influences on soil C:N ratio of the forestfloor. Different nutrient cycling traits are indeed seen betweenbroadleaves and conifers (Fassnacht and Gower, 1999) and among
Table 9The bootstrapped mean C:N ratios of the top soil (0–10 cm), with their 95% confidence interval of the bootstrapped mean (95% CI BS mean – in brackets), grouped by WRBreference soil groups for the eight most frequently recorded main tree species on ICP Forests systematic grid.
Main tree species ?Reference soil group ;
Scots pine Norwayspruce
Commonbeech
Silver birch Pedunculateoak
Holm oak Maritimepine
Aleppo pine
Arenosols 20.9 b b [20.4;21.4]
20.8 cd ab[19.0; 22.4]
17.6 ab a [16.0;20.2]
19.4 a ab[17.7; 21.9]
27.9 b c [23.0;32.8]
Cambisols 20.3 b d [19.3;21.5]
18.3 b bc [17.8;18.8]
15.7 ab b [15.2;16.2]
16.6 a b [15.4;18.4]
15.3 b ab[14.7; 15.9]
14.4 a ab[12.9; 16.0]
24.6 ab e[21.6; 30.1]
13.3 a a [10.3;15.2]
Gleysols 20.9 c a [18.7;23.4]
18.3 bcd a[16.5; 20.4]
17.2 ab a [14.7;21.5]
Histosols 30.7 d b [29.2;32.2]
26.4 e b [24.4;30.8]
16.7 a a [15.1;18.4]
Leptosols 20.2 b c [18.6;22.0]
18.4 bc bc[17.4; 19.5]
15.8 ab b [14.7;17.6]
13.5 a a [12.6;14.6]
17.0 a abc[14.3; 20.0]
Luvisols 16.4 a a [14.4;18.2]
14.9 a a [13.9;15.8]
14.9 a a [14.2;15.7]
15.1 b a [14.2;16.1]
Phaeozems 18.2 b b [16.6;20.3]
17.2 b b [16.3;18.5]
14.9 ab a [14.0;16.2]
Podzols 23.6 c ab[22.9; 24.5]
20.8 d a [20.1;21.6]
22.0 b a [19.4;25.4]
30.5 b c [26.6;34.5]
Regosols 21.5 b d [20.8;22.2]
19.4 c c [18.8;20.0]
16.6 ab ab[14.9; 18.5]
21.0 ab bcd[18.3; 24.2]
13.7 a a [12.2;15.5]
23.8 ab d[20.8; 26.2]
15.1 a ab [11.3;20.2]
Stagnosols 21.3 b a [19.8;22.9]
19.3 bcd a[18.0; 20.7]
17.5 b a [16.0;20.2]
16.4 ab a[14.7; 18.2]
Umbrisols 16.1 a a [14.4;17.9]
18.0 bc ab[16.7; 19.2]
16.0 ab a [14.5;17.1]
20.0 a b [18.0;22.0]
Latin letters indicate differences between the WRB RSGs (IUSS Working Group WRB, 2006, 2007). Greek letters indicate differences between the tree species.
Table 10Single linear regression models for the C:N ratio in the mineral topsoil as dependent on the total N stock (TNS) and total C stock (TCS), for the eight most frequently recorded maintree species on ICP Forests systematic grid.
Single linear regression model n Intercept Log10 TNS r2 p
Scots pine 1116 23.38 �4.39 0.08 <0.001Norway spruce 774 22.26 �4.88 0.14 <0.001Common beech 320 21.16 �5.72 0.19 <0.001Silver birch 105 21.31 �0.51 0.18 <0.001Pedunculate oak 171 20.30 �5.30 0.13 <0.001Holm oak 151 14.15 �0.82 0.005 0.3922Maritime pine 133 30.34 �9.10 0.16 <0.001Aleppo pine 100 21.76 �5.76 0.04 0.02
Log10 TCS
Scots pine 1248 14.80 3.95 0.07 <0.001Norway spruce 829 15.43 1.98 0.015 <0.001Common beech 320 18.90 0.78 0.008 0.0612Silver birch 118 20.75 �1.56 0.003 0.2451Pedunculate oak 173 15.94 �0.115 �0.006 0.9229Holm oak 151 12.30 0.018 0.13 <0.001Maritime pine 130 28.38 �1.79 �0.003 0.4547Aleppo pine 100 0.35 9.16 0.20 <0.001
12 N. Cools et al. / Forest Ecology and Management 311 (2014) 3–16

Author's personal copy
individual tree species within those species categories (Finzi et al.,1998; Vesterdal et al., 2008). Our results did not directly confirm ageneral contrast in C:N ratio between conifers and broadleaves(Fig. 2), but rather indicated clear differences between deciduousand evergreen tree species, especially in the forest floor.Eucalyptus, cork oak and holm oak, which are evergreenbroadleaved tree species showed C:N ratios in the same range asthe pine and spruce species, while larch, a deciduous conifer, hasC:N ratios below 25. In this respect, Douglas-fir was an exceptionas it also has low C:N ratios, at least in the forest floor.
The fact that such large differences were found in C:N ratioamong tree species at the European level supports a stratificationof thresholds of critical C:N ratios according to tree species forthe evaluation of risk of nitrate leaching. Previous evaluations ofnitrate leaching across Europe only stratified tree species to coni-fers and broadleaves (Kristensen et al., 2004) while our resultsindicate that specific species differences in C:N ratio are poorlyrepresented by these overall categories. When applying the N sta-tus classes proposed by Gundersen et al. (2006), large differencesare indicated among individual conifer species, all of them deviat-ing from the distribution computed for all conifers (Table 11). Sostratification into a conifer-only group seems highly questionable.Presumably the same holds true for stratification into one commondeciduous group. Our results support strong arguments to deriveindividual critical C:N thresholds for potential nitrate leaching foreach of the main tree species. Therefore it is also essential to spec-ify whether the OL layers are included in the calculations of the C:Nratio of the forest floor.
The range of the C:N ratio in the topsoil was more narrow com-pared to the forest floor (Fig. 2) indicating a decreasing influence ofthe tree species on the C:N ratio with depth. This can be explainedby decreasing organic matter content and decreasing tree root den-sity with increasing soil depth. Decreasing influence of tree specieson C:N ratio and other soil properties with increasing soil depth issupported by studies of Díaz-Pinés et al. (2011), Hansson et al.(2011), Langenbruch et al. (2012) and Vesterdal et al. (2008).
After elimination of the tree species effect on forest floor C:N ra-tio, the most important explanatory variable was the soil type.However, this was less pronounced for the tree species with thewidest geographical distribution across Europe (Scots pine, Nor-way spruce and common beech) where the soil effect is dilutedby a broad range of other environmental variables. A number ofenvironmental variables had comparable relative influences (10–15%), namely climatic (temperature for Scots pine), ecoregion, par-ent material, soil and humus type and deposition characteristics.This result is not surprising given the challenge of identifying spe-cific drivers for soil N status in large inventories across a multitudeof environmental gradients.
4.2.2. Soil propertiesThe analyses of the influence of the plot-related soil variables
was done after a first BRT analysis on the chemical and physicalproperties of the individual soil samples. In this analysis soil pHhad a high relative influence while soil texture only received asmall relative importance (not shown). The advantage of working
at the plot level, was that the soil type, as an integral variableincluding a whole set of soil properties, could be included.
For a single tree species there was strong influence of soil typeon the C:N ratios in the upper 10 cm of the mineral soil. The soiltype contributed more to the variation in the C:N ratio in the min-eral soil layers compared to that of the forest floor and the relativeinfluence of the soil type increased with increasing mineral soildepth. The Histosols had high C:N ratios below Scots pine and Nor-way spruce but low C:N ratios below silver birch. The effect of thesoil type on the soil C:N ratio was tree species dependent, or theother way round – the effect of the tree species on the soil C:N ratiowas dependent on the soil type. So there was evidence of a com-bined soil type and tree species effect on the C:N ratios.
The linear regressions between the C:N ratio of the topsoil andTCS and TNS showed a significant relationship for a number of treespecies. It is indeed not surprising that the C:N ratio is negativelyrelated to TNS and positively to TCS in the soil profile. Howeverthe range in C:N ratio within individual tree species was moreinfluenced by TNS than TCS, as indicated by the higher r2 valueswith TNS in most tree species (Table 10). The magnitude of thesestocks did not play a determining role since only a small propor-tion of the variance (<20%) in the C:N ratio was explained by thesestocks. Our findings thus suggest that soil type should be taken intoaccount in addition to stratification of thresholds of critical C:N ra-tios according to tree species in the evaluation of risk for nitrateleaching.
4.2.3. The humus typeAlthough mull forest floors are considered to have the fastest
decomposition rates (Zanella et al., 2011; Jabiol et al., 2013; VanWesemael and Veer, 1992), such forest floors did not have the low-est C:N ratio when all the sublayers of the forest floor were in-cluded in the calculation of the C:N ratio. When the OL layer wasexcluded, the C:N ratios of the mull and moder humus forms werevery similar. The higher C:N ratio in mull type forest floors is in linewith a regional study in sugar maple (Acer saccharum Marshall)dominated stands in Southern Ontario (Watmough, 2010). Here,forest floors without OH layer (mull humus types) had relativelyhigh C:N ratios that were well correlated to the litterfall C:N ratios.Much lower C:N ratios were observed in the forest floors with aclearly developed OH horizon (mor) due to the relative increasein N content during the early stages of decomposition. This patternin forest floor C:N ratio has also been observed between mull- andmoder/mor forming tree species in forest floors and decomposinglitter in Denmark (Vesterdal, 1999; Vesterdal et al., 2008). Therelitterfall C:N ratio was lower in mull-forming species and litterfallC:N ratio failed to explain the forest floor C:N ratio. Instead, thespecies range in litterfall C:N ratio was positively related to C:N ra-tio in the mineral topsoil suggesting C:N ratios in this layer wouldbe a better predictor of N status and N leaching (Vesterdal et al.2008; Gundersen et al., 2009). In the topsoil, the trend was moreas expected with lower C:N ratios associated with faster decompo-sition rates. The C:N ratio was significantly lower in soils with mullhumus forms compared to soils with moder forms and with moderforms significantly lower in C:N ratio than in mor forms.
Table 11The number of coniferous forest plots by main coniferous tree species with high, intermediate and low N status (according to Gundersen et al., 2006) when excluding the OL layer.
n High N status Intermediate N status Low N statusC:N < 25 25 6 C:N 6 30 C:N > 30
Scots pine 1291 326 (25%) 431 (33%) 534 (41%)Norway spruce 927 425 (46%) 368 (40%) 134 (15%)Maritime pine 103 10 (9.7%) 20 (19%) 73 (71%)Aleppo pine 90 20 (22%) 28 (31%) 42 (47%)
All coniferous stands 2745 924 (34%) 922 (34%) 899 (33%)
N. Cools et al. / Forest Ecology and Management 311 (2014) 3–16 13

Author's personal copy
4.2.4. DepositionC:N ratios in forest floors and soils across all main tree species
were not primarily explained by N deposition at the Europeanscale, but N deposition did appear in the explanatory models with<10% relative importance. In a Canadian study by Watmough(2010), the C:N ratio of the forest floor was also not related to esti-mated N deposition (in a smaller N deposition range 9–13 kg ha�1
a�1) but was instead correlated to soil pH and annual air tempera-ture. Dise et al. (2009) also concluded that the C:N ratio of the for-est floor was independent of N deposition for sites receivingP8 kg N ha�1 a�1 which most forests experience. In our secondanalysis within each of the most common tree species, the deposi-tion variables gained in relative importance, although the patternsdiffered between the tree species and were more pronounced inthe forest floor compared to the topsoil. For the Norway spruce,we could show a negative relationship between the C:N ratio inthe forest floor and deposited sulphur dioxide-S (Norway spruce).However, in the topsoil this relationship became positive, thoughless significant. For Scots pine, there was no clear influence ofdeposition variables on the C:N ratio in the forest floor and therewas a small positive effect of nitrate-N deposition in the mineraltopsoil. For common beech, there was a relatively small negativeeffect of ammonium-N deposition both in the forest floor and inthe mineral topsoil. Aleppo pine and holm oak, two evergreen treespecies with a typical Mediterranean distribution, had significantpositive relationships between C:N ratio and N deposition, bothin the forest floor and in the topsoil. These inconsistent patternsdo not support the idea that N deposition plays an important rolefor forest floor C:N ratios at the European level.
Results from other more regional studies within the sametree species were also inconclusive regarding the influence ofN deposition on forest floor C:N ratios. For sugar maple standsin Ontario, Miller and Watmough (2009) reported a significantpositive correlation between the C:N ratio of the forest floorand modelled S, NO3-N and NH4-N deposition (on top of temper-ature, precipitation and latitude). On the other hand, significantnegative relationships were found between modelled total Nand dry ammonium deposition and C:N ratios in forest floor(both OL and OF layers) and mineral soil down to 40 cm depthin the UK BioSoil plots (Vanguelova and Pitman, 2011). Whendata were analysed by tree species, a significant positive rela-tionship was observed between mineral soil C:N ratio underoak with deposition of oxidised N, and a significant negativerelationship between mineral soil C:N ratio under Sitka spruce(P. Sitchensis (Bong.) Carr.) with dry NH4 deposition (Villadaet al., 2011).
We observed the expected negative relationship between depo-sition and C:N ratios for common beech, both in the forest floor andin the mineral topsoil and for Norway spruce in the forest floor(Falkengren-Grerup et al., 1998). As these two tree species arewidely spread across European forests, the extrapolation of thenegative relationship between deposition and forest floor C:N ratiowas alluring. Though, the unexpected positive relationship, whichwas strongest for some Mediterranean tree species, makes itimpossible to demonstrate that increasing N deposition would de-crease the C:N ratios in the forest floors or upper mineral soil at theEuropean level. This large-scale study suggests that the trends inforest floor C:N ratios may not be as closely related to N depositionas previously believed and that it is more likely combined withother variables. The tree species in particular as well as other siterelated variables appear to be more important determinants ofC:N ratios at the European level than N deposition. Note howeverthat this study was based on rather crudely modelled depositiondata (50 � 50 km2 grid) and that a more consistent trend couldbe present when more accurate deposition data for each plotwould be available.
4.2.5. ClimateA negative relationship between the C:N ratio of the forest floor
and the mean annual temperature at the European level was estab-lished for Scots pine but not for other tree species. The most logicalexplanation is that Scots pine is the only tree species in this studywith a sufficiently large geographical distribution to allow such arelationship to appear. This result confirms the findings of Callesenet al. (2007) who reported such a negative relationship betweenC:N ratio and temperature and precipitation for Scots pine in forestsites in Fenno-scandinavia. For holm oak, the C:N ratio in the min-eral topsoil increased with increasing precipitation. According tothe trends established by Sardans et al. (2011) in foliar C:nutrientconcentrations, we would rather have expected a decrease in C:Nratio in the forest floor and soil with increasing precipitation asin Mediterranean climates water availability is often the limitingfactor in nutrient cycling.
4.2.6. EcoregionThe patterns observed for the C:N ratios across the ecoregions
were not similar in the forest floor and in the mineral soil (Table 5).In the forest floor the highest C:N ratios were recorded in the Ibero-Macaronesian region, the Fenno-scandian shield and the Borealicuplands. In the mineral topsoil, the lowest ratios were observedin Italy and Corsica while the highest ratios were observed onthe Fenno-scandian shield. The ecoregion possibly better reflectsthe combined effect of climatic parameters than when temperatureand rainfall are considered independently. As one moves from war-mer to cooler climates, the C:N ratio of the mineral topsoil tends toincrease somewhat (Brady, 1990). In general, the decomposition oforganic matter and the release of nutrients are accelerated in war-mer, as long as water availability is not a limiting factor – as in theforest floor in the Ibero-Macaronesian region, compared to coolerregions which results in lower residual organic matter accumula-tion in warmer compared to cooler soils (Jobbágy and Jackson,2000).
4.3. Methodological considerations
An important added value of this study is that all TOC and TONanalyses were determined according to the ISO reference methodswhile in the literature several different analytical methods havebeen used. Nitrogen is for example often determined by the Kjel-dahl method and not by the modified Kjeldahl method (Cassagneet al., 2003; Díaz-Pinés et al., 2011), which was used in the BioSoilsurvey. The modified Kjeldahl method determines the total N con-tent (including ammonium-N, nitrate-N, nitrite-N and organic N)of a soil while the original Kjeldahl method does not include the ni-trate-N and nitrite-N. Such methodological differences could be thecause for additional sources of variation which make study com-parisons at the European scale less straightforward. The harmoni-sation effort made in the BioSoil survey, both for sampling andanalysis, is an important improvement compared to the first forestsoil inventory conducted in the 1990s (Vanmechelen et al., 1997).
In studies that identified C:N thresholds for nitrate leaching, dif-ferent approaches have been used in relation to the sub horizons ofthe forest floor. Dise et al. (1998a,b) found a weak relationship be-tween forest floor OH horizon C:N ratio and nitrate leachingwhereas Gundersen et al. (1998) included the whole forest floorwithout the freshly fallen litter (if specified) and did note that dif-ferences in methods introduced some uncertainties in their analy-ses. On the other hand Kristensen et al. (2004) based their analysisof nitrate leaching on the C:N ratio of the total forest floor. In theUS, Lovett and Rueth (1999) and Lovett et al. (2002, 2004) includedthe OF and OH layer but excluded the OL layers from their analysis.Our results confirmed that sampling methods where forest floorlayers are split or not, do influence the C:N ratio and consequently
14 N. Cools et al. / Forest Ecology and Management 311 (2014) 3–16

Author's personal copy
the indicator value of forest floors in terms of nitrate leaching (Ta-ble 2). Sampling methodology thus needs to be accounted for instudies applying forest floor C:N ratio as indicator of N losses andboth the sampling date and the sampled (sub)horizons should beclearly specified.
In our analysis we decided to work with the C:N ratio of thecombined OF and OH layer, i.e. to exclude the OL layer. We areaware that it creates a bias towards lower C:N ratios comparedto some previous studies where the whole forest floor was in-cluded. Additionally the exclusion of OL layers may under-repre-sent the mull humus forms that only consist of an OL and/or athin OF layer.
5. Conclusions
At the European scale, tree species was the most important dis-criminating variable in explaining C:N ratio in the forest floor aswell as in the top mineral and peat soil. C:N ratios below 20 inthe forest floor were found in black locust and alder stands, bothN fixing tree species. The highest C:N ratios in the forest floor werefound in pine, eucalypt and cork oak stands. In the forest floor, thelargest differences were seen between deciduous and evergreenspecies, while in the mineral soil the largest differences wererather observed between the broadleaved and coniferous speciescategories. The second most important set of variables at the Euro-pean level were related to geographic location (ecoregion) or re-lated to soil and humus type, for both forest floor and topsoil.The effect of site variables differed considerably among the eightmost common tree species on the ICP Forest Level I network, espe-cially for the tree species with the widest geographical distribu-tion. We consequently suggest that C:N ratio thresholds for Nleaching should be evaluated for each tree species individually.
This study clearly stated that a combination of variables shouldbe investigated when the variables influencing soil C:N ratio areevaluated, of which the most important ones are tree species, eco-logical region, soil and humus types. Individual climatic variablesdid only occasionally play an important role. Mean annual temper-ature was important in explaining the C:N ratio in the forest floorof Scots pine but not for other tree species. Nitrogen deposition didnot show any consistent direct impact on C:N ratios at the Euro-pean scale. Within certain common tree species N deposition didexplain a small part of the variation in C:N ratio, but these relation-ships were inconsistent among tree species and soil layers andtherefore did not unequivocally support a positive effect of N depo-sition on soil N status. Finally, conclusions based on forest floor C:Nratios are often different from those drawn from topsoil C:N ratios.The mechanisms behind this deviance need further investigation.Meanwhile, we recommend C:N ratios to be systematically as-sessed both in the forest floor and topsoil.
Acknowledgements
The authors wish to acknowledge the ICP Forests National FocalCentres of Austria, Belgium, Czech Republic, Cyprus, Denmark,Estonia, Finland, France, Germany, Greece, Hungary, Ireland, Italy,Latvia, Lithuania, Poland, Portugal, Serbia, Slovenia, Slovak Repub-lic, Spain, Sweden and the United Kingdom for making the soil sur-vey data available to the Forest Soil Coordinating Centre foranalysis and evaluation at the European level. Financial supportfor the data collection was granted by the European Commissionthrough Commission Regulation (EEC) No. 926/93 and the Euro-pean Commission Forest Focus Regulation (EC) No. 2152/2003. Lastbut not least we want to thank Maarten Hens and Rona Pitman for
revising the English and two anonymous reviewers for construc-tive comments on the manuscript.
References
Aber, J.D., Nadelhoffer, K.J., Steudler, P., Melillo, J.M., 1989. Nitrogen saturation innorthern forest ecosystems, excess nitrogen from fossil fuel combustion maystress the biosphere. Bioscience 39, 378–386.
Aertsen, W., Kint, V., De Vos, B., Deckers, J., Van Orshoven, J., Muys, B., 2012.Predicting forest site productivity in temperate lowland from forest floor, soiland litterfall characteristics using boosted regression trees. Plant Soil 354, 157–172.
Aitkenhead-Peterson, J.A., Alexander, J.E., Albrechtová, J., Krám, P., Rock, B., Cudlín,P., Hruška, J., Lhotaková, Z., Huntley, R., Oulehle, F., Polák, T., McDowell, W.H.,2006. Linking foliar chemistry to forest floor solid and solution phase organic Cand N in Picea abies [L.] Karst stands in northern Bohemia. Plant Soil 283, 187–201.
Bodelier, P.L.E., Laanbroek, H.J., 2004. Nitrogen as a regulatory factor of methaneoxidation in soils and sediments. FEMS Microbiol. Ecol. 47, 265–277.
Brady, N.C., 1990. The Nature and Properties of Soils, 10th ed. MacMillan PublishingCompany, New York.
Callesen, I., Raulund-Rasmussen, K., Westman, C.J., Tau-Strand, L., 2007. Nitrogenpools and C:N ratios in well-drained Nordic forest soils related to climate andsoil texture. Boreal Environ. Res. 12, 681–692.
Cassagne, N., Gers, C., Gauquelin, T., 2003. Relationships between Collembola, soilchemistry and humus types in forest stands (France). Biol. Fert. Soils 37, 355–361.
Cools, N., De Vos, B., 2009. In: 6th FSCC Interlaboratory Comparison 2009.INBO.R.2010. Forest Soil Coordinating Centre, Research Institute for Natureand Forest, Geraardsbergen, Belgium, 52pp + annexes (on CD-Rom).
Cools, N., Delanote, V., De Vos, B., Quataert, P., Roskams, P., Scheldeman, X., 2003. In:Quality Assurance and Quality control in Forest Soil Analysis: 3rd FSCCInterlaboratory Comparison. Forest Soil Coordinating Centre, Institute forForestry and Game Management, Geraardsbergen, Belgium, p. 301p.
Cools, N., Verschelde, P., Quataert, P., Mikkelsen, J., De Vos, B., 2006. In: QualityAssurance and Quality Control in Forest Soil Analysis: 4th FSCC InterlaboratoryComparison. INBO.R.2006.6. Forest Soil Coordinating Centre, Research Institutefor Nature and Forest, Geraardsbergen, Belgium, 66pp + annexes (on CD-Rom).
Cools, N., Mikkelsen J.H., De Vos, B., 2007. In: Quality Assurance and Quality controlin Forest Soil Analysis: 5th FSCC Interlaboratory Comparison. INBO.R.2007.46.Forest Soil Coordinating Centre, Research Institute for Nature and Forest,Geraardsbergen, Belgium, 59pp + annexes (on CD-Rom).
Cross, A., Perakis, S.S., 2011. Tree species and soil nutrient profiles in old-growthforests of the Oregon Coast Range. Can. J. For. Res. 41, 195–210.
Denier van der Gon, H., Bleeker, A., 2005. Indirect N2O emission due to atmosphericN deposition for the Netherlands. Atmos. Environ. 39, 5827–5838.
Díaz-Pinés, E., Rubio, A., Van Miegroet, H., Montes, F., Benito, M., 2011. Does treespecies composition control soil organic carbon pools in Mediterraneanmountain forests? For. Ecol. Manage. 262, 1895–1904.
Dise, N.B., Matzner, E., Forsius, M., 1998a. Evaluation of organic horizon C:N ratio asan indicator of nitrate leaching in conifer forests across Europe. Environ. Pollut.102, 453–456.
Dise, N.B., Matzner, E., Gundersen, P., 1998b. Synthesis of nitrogen pools and fluxesfrom European forest ecosystems. Water Air Soil Pollut. 105, 143–154.
Dise, N.B., Rothwell, J.J., Gauci, V., Van der Salm, C., de Vries, W., 2009. Predictingdissolved inorganic nitrogen leaching in European forests using twoindependent databases. Sci. Total Environ. 40, 1798–1808.
EEA, 2004. Ecoregions for Rivers and Lakes. <http://www.eea.europe.eu/data-and-maps/data/ecoregions-for-rivers-and-lakes>.
Elith, J., Leathwick, J.R., Hastie, T., 2008. A working guide to boosted regression trees.J. Anim. Ecol. 77, 802–813.
Emmett, B.A., Boxman, D., Bredemeier, M., Gundersen, P., Kjønaas, O.J., Moldan, F.,Schleppi, P., Tietema, A., Wright, R.F., 1998. Predicting the effects of atmosphericnitrogen deposition in conifer stands: evidence from the NITREX ecosystem-scale experiments. Ecosystems 1, 352–360.
Falkengren-Grerup, U., Brunet, J., Diekmann, M., 1998. Nitrogen mineralisation indeciduous forest soils in south Sweden in gradients of soil acidity anddeposition. Environ. Pollut. 102, 415–420.
Fassnacht, K.S., Gower, S.T., 1999. Comparison of the litterfall and forest floororganic matter and nitrogen dynamics of upland forest ecosystems in northcentral Wisconsin. Biogeochemistry 45, 265–284.
Finzi, A.C., van Breemen, N., Canham, C.D., 1998. Canopy tree-soil interactionswithin temperate forests: species effects on soil carbon and nitrogen. Ecol. Appl.8, 440–446.
FOREST EUROPE, UNECE, FAO, 2011. State of Europe’s Forests 2011. Status andTrends in Sustainable Forest Management in Europe, 337p.
FSCC (Forest Soil Co-Ordinating Centre), 2006. Manual IIIa: sampling and analysis ofsoil. In: ICP Forests, 2006: Manual on Methods and Criteria for HarmonizedSampling, Assessment, Monitoring and Analysis of the Effects of Air Pollution onForests. UNECE ICP Forests Programme Co-ordinating Centre, Hamburg,26pp + annexes. <http://www.icp-forests.org/Manual.htm>.
Goodale, C.L., Aber, J.D., 2001. The long-term effects of land-use history on nitrogencycling in northern hardwood forests. Ecol. Appl. 11, 253–267.
N. Cools et al. / Forest Ecology and Management 311 (2014) 3–16 15

Author's personal copy
Gundersen, P., Callesen, I., de Vries, W., 1998. Nitrate leaching in forest ecosystemsis related to forest floor C:N ratios. Environ. Pollut. 102, 403–407.
Gundersen, P., Schmidt, I.K., Raulund-Rasmussen, K., 2006. Leaching of nitrate fromtemperate forests – effects of air pollution and forest management. Environ.Rev. 14, 1–57.
Gundersen, P., Sevel, L., Christiansen, J.R., Vesterdal, L., Hansen, K., Bastrup-Birk, A.,2009. Do indicators of nitrogen retention and leaching differ betweenconiferous and broadleaved forests in Denmark? For. Ecol. Manage. 258,1137–1146.
Hansson, K., Olsson, B.A., Olsson, M., Johansson, U., Kleja, D.B., 2011. Differences insoil properties in adjacent stands of Scots pine, Norway spruce and silver birchin SW Sweden. For. Ecol. Manage. 262, 522–530.
Hobbie, S.E., Reich, P.B., Oleksyn, J., Ogdahl, M., Zytkowiak, R., Hale, C., Karolewski,P., 2006. Tree species effects on decomposition and forest floor dynamics in acommon garden. Ecology 87, 2288–2297.
ISO, 1993. ISO 11272. Soil Quality – Determination of Dry Bulk Density.International Organization for Standardization, Geneva, Switzerland, 10p.
ISO, 1995a. ISO 10694. Soil Quality – Determination of Organic and Total Carbonafter Dry Combustion (Elementary Analysis). International Organization forStandardization, Geneva, Switzerland, 7p.
ISO, 1995b. ISO 11261. Soil Quality – Determination of Total Nitrogen – ModifiedKjeldahl Method. International Organization for Standardization, Geneva,Switzerland, 4p.
ISO, 1998. ISO 13878. Soil Quality – Determination of Total Nitrogen Content by DryCombustion (‘‘Elemental Analysis’’). International Organization forStandardization, Geneva, Switzerland, 5p.
IUSS Working Group WRB, 2006. World Reference Base for Soil Resources 2006,FAO, Rome, 128p.
IUSS Working Group WRB, 2007. World Reference Base for Soil Resources 2006,First Update 2007, FAO, Rome, 116p.
Jabiol, B., Zanella, A., Ponge, J.-F., Sartori, G., Englisch, M., van Delft, B., De Waal, R., LeBayon, R.-C., 2013. A proposal for including humus forms in the WorldReference Base for Soil Resources (WRB-FAO). Geoderma 192, 286–294.
Janssens, I.A., Dieleman, W., Luyssaert, S., Subke, J.A., Reichstein, M., Ceulemans, R.,Ciais, P., Dolman, A.J., Grace, J., Matteucci, G., Papale, D., Piao, S.L., Schulze, E.D.,Tang, J., Law, B.E., 2010. Reduction of forest soil respiration in response tonitrogen deposition. Nat. Geosci. 3, 315–322.
Jobbágy, E.G., Jackson, R.B., 2000. The Vertical Distribution of Soil Organic Carbonand Its Relation to Climate and Vegetation. Ecol. Appl 10, 423–436.
Klemedtsson, L., Von Arnold, K., Weslien, P., Gundersen, P., 2005. Soil CN ratio as ascalar parameter to predict nitrous oxide emissions. Global Change Biol. 11,1142–1147.
Koerner, W., Dupouey, J.L., Dambrine, E., Benoit, M., 1997. Influence of past land useon the vegetation and soils of present day forest in the Vosges mountains,France. J. Ecol. 85, 351–358.
Kristensen, H.L., Gundersen, P., Callesen, I., Reinds, G.J., 2004. Throughfall nitrogendeposition has different impacts on soil solution nitrate concentration ineuropean coniferous and deciduous forests. Ecosystems 7, 180–192.
Lambert, J.J., Daroussin, J., Eimberck, M., Le Bas, C., Jamagne, M., King, D.,Montanarella, L., 2003. Soil Geographical Database for Eurasia and TheMediterranean: Instructions Guide for Elaboration at scale 1:1,000,000,Version 4.0. European Soil Bureau Research Report No.8, EUR 20422 EN,Office for Official Publications of the European Communities, Luxembourg, 64p.
Langenbruch, C., Helfrich, M., Flessa, H., 2012. Effects of beech (Fagus sylvatica), ash(Fraxinus excelsior) and lime (Tilia spec.) on soil chemical properties in a mixeddeciduous forest. Plant Soil 352, 389–403.
Lorenz, M., Fischer, R., Becher, G., Granke, O., Roskams, P., Nagel, H.D., Kraft, Ph.,2007. Forest Condition in Europe. 2007 Technical Report of ICP Forests. Instituteof World Forestry, Hamburg.
Lovett, G.M., Rueth, H., 1999. Soil nitrogen transformations in beech and maplestands along a nitrogen deposition gradient. Ecol. Appl. 9, 1330–1344.
Lovett, G.M., Weathers, K.C., Arthur, M.A., 2002. Control of nitrogen loss fromforested watersheds by soil carbon:nitrogen ratio and tree species composition.Ecosystems 5, 712–718.
Lovett, G.M., Weathers, K.C., Arthur, M.A., Schultz, J.C., 2004. Nitrogen cycling in anorthern hardwood forest: do species matter? Biogeochemistry 67, 289–308.
MacDonald, J.A., Dise, N.B., Matzner, E., Armbruster, M., Gundersen, P., Forsius, M.,2002. Nitrogen input together with ecosystem nitrogen enrichment predictnitrate leaching from European forests. Global Change Biol. 8, 1028–1033.
Matejovic, I., 1993. Determination of carbon, hydrogen, and nitrogen in soils byautomated elemental analysis (dry combustion method). Commun. Soil Sci.Plant Anal. 24, 2213–2222.
Melillo, J., Aber, J., Linkins, A., Ricca, A., Fry, B., Nadelhoffer, K., 1989. Carbon andnitrogen dynamics along the decay continuum: plant litter to soil organicmatter. Plant Soil 115, 189–198.
Miller, D.E., Watmough, S.A., 2009. Air pollution, climate, soil acidity, and indicatorsof forest health in Ontario’s sugar maple forests. Can. J. For. Res. 39, 2065–2079.
Ollinger, S.V., Smith, M.L., Martin, M.E., Hallett, R.A., Goodale, C.L., Aber, J.D., 2002.Regional variation in foliar chemistry and N cycling among forests of diversehistory and composition. Ecology 83, 339–355.
Pilegaard, K., Skiba, U., Ambus, P., Beier, C., Brüggemann, N., Butterbach-Bahl, K.,Dick, J., Dorsey, J., Duyzer, J., Gallagher, M., Gasche, R., Horvath, L., Kitzler, B.,Leip, A., Pihlatie, M.K., Rosenkranz, P., Seufert, G., Vesala, T., Westrate, H.,Zechmeister-Boltenstern, S., 2006. Nitrogen load and forest type determine thesoil emission of nitrogen oxides (NO and N2O). Biogeosci. Discuss. 3, 837–869.
R Development Core Team, 2011. R: a language and environment for statisticalcomputing. R Foundation for Statistical Computing, Vienna, Austria. ISBN 3-900051-07-0. <http://www.R-project.org/>.
Reay, D.S., Nedwell, D.B., 2004. Methane oxidation in temperate soils: effects ofinorganic N. Soil Biol. Biochem. 36, 2059–2065.
Ridgeway, G., 2010. Gbm: Generalized Boosted Regression Models. R PackageVersion 1.6-3.1. <http://CRAN.R-project.org/package=gbm>.
Saari, A., Rinnan, R., Martikainen, P.J., 2004. Methane oxidation in boreal forest soils:kinetics and sensitivity to pH and ammonium. Soil Biol. Biochem. 36, 1037–1046.
Sardans, J., Rivas-Ubach, A., Peñuelas, J., 2011. Factors affecting nutrientconcentration and stoichiometry of forest trees in Catalonia (NE Spain). For.Ecol. Manage. 262, 2024–2034.
Skiba, U., Dick, J., Storeton-West, R., Lopez-Fernandez, S., Woods, C., Tang, S., vanDijk, N., 2006. The relationship between NH3 emissions from a poultry farm andsoil NO and N2O fluxes from a downwind forest. Biogeosciences 3, 375–382.
Stefan, K., Fürst, A., Hacker, R., Bartels, U., 1997. Forest Foliar Condition in Europe –Results of Large-Scale Foliar Chemistry Surveys 1995 (Survey 1995 and Datafrom Previous Years). EC, UN/ECE, Brussels.
Sutton, M.A., Howard, C.M., Erisman, J.W., Billen, G., Bleeker, A., Grennfelt, P., vanGrinsven, H., Grizetti, B., 2011. The European Nitrogen Assessment. CambridgeUniversity Press.
Thimonier, A., Graf Pannatier, E., Schmitt, M., Waldner, P., Walthert, L., Schleppi, P.,Dobbertin, M., Kräuchi, N., 2010. Does exceeding the critical loads for nitrogenalter nitrate leaching, the nutrient status of trees and their crown condition atSwiss Long-term Forest Ecosystem Research (LWF) sites? Eur. J. For. Res. 129,443–461.
van Wesemael, B., Veer, M.A.C., 1992. Soil organic matter accumulation, litterdecomposition and humus forms under mediterranean-type forests in southernTuscany, Italy. J. Soil Sci. 43, 133–144.
Vanguelova, E., Pitman, R., 2011. Impacts of N inputs on forests and forest soilbiogeochemistry in Great Britain. In: Paper in Proceedings of ‘‘Nitrogen & GlobalChange – Key Findings – Future Challenges’’, Edinburgh, UK, April 11–15, 2011.
Vanmechelen, L., Groenemans, R., Van Ranst, E., 1997. Forest soil condition inEurope, results of a large-scale soil survey. 1997 Technical Report. EC, UN/ECE,Ministry of the Flemish Community, Brussels, Geneva, 261p.
Vejre, H., Callesen, I., Vesterdal, L., Raulund-Rasmussen, K., 2003. Carbon andnitrogen in danish forest soils – contents and distribution determined by soilorder. Soil Sci. Soc. Am. J. 67, 335–343.
Verheyen, K., Bossuyt, B., Hermy, M., Tack, G., 1999. The land use history (1278–1990) of a mixed hardwood forest in western Belgium and its relationship withchemical soil characteristics. J. Biogeogr. 26, 1115–1128.
Vesterdal, L., 1999. Influence of soil type on mass loss and nutrient release fromdecomposing foliage litter of beech and Norway spruce. Can. J. For. Res. 29, 95–105.
Vesterdal, L., Raulund-Rasmussen, K., 1998. Forest floor chemistry under seven treespecies along a soil fertility gradient. Can. J. For. Res. 28, 1636–1647.
Vesterdal, L., Schmidt, I.K., Callesen, I., Nilsson, L.O., Gundersen, P., 2008. Carbon andnitrogen in forest floor and mineral soil under six common European treespecies. For. Ecol. Manage. 255, 35–48.
Vesterdal, L., Elberling, B., Christiansen, J.R., Callesen, I., Schmidt, I.K., 2012. Soilrespiration and rates of soil carbon turnover differ among six commonEuropean tree species. For. Ecol. Manage. 264, 185–196.
Villada, A., Shaw, L., Verhoef, Vanguelova, E., 2011. Effect of tree species and soiltype on chemical and physical carbon fractions in UK forest soils. In:Proceedings of EU COST FP0803 Meeting ‘‘Carbon Balance After Disturbancesand Drought’’, Barcelona, Spain, 27 June–1 July, 2011.
Wang, Z.P., Ineson, P., 2003. Methane oxidation in a temperate coniferous forestsoil: effects of inorganic N. Soil Biol. Biochem. 35, 427–433.
Watmough, S., 2010. An assessment of the relationship between potential chemicalindices of nitrogen saturation and nitrogen deposition in hardwood forests insouthern Ontario. Environ. Monit. Assess. 164, 9–20.
Zanella, A., Jabiol, B., Ponge, J.F., Sartori, G., De Waal, R., Van Delft, B., Graefe, U.,Cools, N., Katzensteiner, K., Hager, H., Englisch, M., 2011. A European morpho-functional classification of humus forms. Geoderma 164, 138–145.
16 N. Cools et al. / Forest Ecology and Management 311 (2014) 3–16