Rehabilitation of degraded seagrass area in Tuticorin coast of ...

This article was downloaded by:[University of Newcastle]On: 16 August 2007Access Details: [subscription number 772827635]Publisher: Taylor & FrancisInforma Ltd Registered in England and Wales Registered Number: 1072954Registered office: Mortimer House, 37-41 Mortimer Street, London W1T 3JH, UK
Environmental BioindicatorsPublication details, including instructions for authors and subscription information:http://www.informaworld.com/smpp/title~content=t716100765
Translational Fluctuating Asymmetry and LeafDimension in Seagrass, Zostera capricorni Aschers ina Gradient of Heavy Metals
Online Publication Date: 01 April 2007To cite this Article: Ambo-Rappe, Rohani, Lajus, Dmitry L. and Schreider, Maria J.(2007) 'Translational Fluctuating Asymmetry and Leaf Dimension in Seagrass,Zostera capricorni Aschers in a Gradient of Heavy Metals', EnvironmentalBioindicators, 2:2, 99 - 116To link to this article: DOI: 10.1080/15555270701457752URL: http://dx.doi.org/10.1080/15555270701457752
PLEASE SCROLL DOWN FOR ARTICLE
Full terms and conditions of use: http://www.informaworld.com/terms-and-conditions-of-access.pdf
This article maybe used for research, teaching and private study purposes. Any substantial or systematic reproduction,re-distribution, re-selling, loan or sub-licensing, systematic supply or distribution in any form to anyone is expresslyforbidden.
The publisher does not give any warranty express or implied or make any representation that the contents will becomplete or accurate or up to date. The accuracy of any instructions, formulae and drug doses should beindependently verified with primary sources. The publisher shall not be liable for any loss, actions, claims, proceedings,demand or costs or damages whatsoever or howsoever caused arising directly or indirectly in connection with orarising out of the use of this material.
© Taylor and Francis 2007

Dow
nloa
ded
By:
[Uni
vers
ity o
f New
cast
le] A
t: 09
:43
16 A
ugus
t 200
7
99
Environmental Bioindicators, 2:99–116, 2007Copyright © Taylor & Francis Group, LLCISSN: 1555-5275 print/ 1555-5267 onlineDOI: 10.1080/15555270701457752
UEBI1555-52751555-5267Environmental Bioindicators, Vol. 2, No. 2, June 2007: pp. 1–41Environmental Bioindicators
Translational Fluctuating Asymmetry and Leaf Dimension in Seagrass, Zostera capricorni Aschers
in a Gradient of Heavy Metals
Zostera capricorni Aschers in a gradient of heavy metalsAmbo-Rappe et al. ROHANI AMBO-RAPPE,1,3 DMITRY L. LAJUS,2 AND MARIA J. SCHREIDER1
1School of Environmental and Life Sciences, Newcastle University, Ourimbah,Australia2Department of Ichthyology and Hydrobiology, St. Petersburg State University,St. Petersburg, Russia3Department of Marine Sciences, Hasanuddin University, Makassar, Indonesia
Methodology for measuring translational fluctuating asymmetry (TFA) on leaves ofseagrass, Zostera capricorni Aschers has been developed and tested to detect a subtleeffect of environmental stress associated with heavy metal pollution on developmentalinstability. Our analyses showed that concentration of heavy metals (Cd, Pb, Cu, Zn,Se) in leaves and roots of the seagrass were significantly higher in the polluted loca-tion than in relatively unpolluted locations. We found significant differences in TFAbetween different locations, showing that the method is sensitive enough to detect spa-tial differences even within a rather small water body, but these differences were notassociated with a higher concentration of heavy metals, i.e. plants from the pollutedlocation did not show higher TFA. Possibly, seagrass can store heavy metals in theirtissues and protect their development from the toxic effect, or the effect of heavy metalsin the natural environment is confounded by other environmental factors. At the sametime, we found that plants from the polluted location had narrower leaves than in rela-tively unpolluted ones, which may be caused by heavy metals or associated factors.
Keywords developmental instability, heavy metals, translational fluctuating asym-metry, Zostera capricorni
Introduction
Seagrass beds serve as nursery grounds for numerous ecologically and commerciallyimportant species of fish and invertebrates (den Hartog 1977; Kikuchi and Peres 1977;Gillanders 2006). Seagrass leaves and stems support numerous and abundant epiphytes,which are fed upon by small epifaunal organisms, such as amphipods and gastropods(Jernakoff and Nielsen 1998). Epifaunal organisms, in turn, provide food to the fishesforaging in the seagrass beds (Hemminga and Duarte 2000) and constitute an importantlink between primary producers, such as microalgae and detritus, and higher-level con-sumers (Kikuchi and Peres 1977; Edgar and Shaw 1995). Hence, seagrass meadows are
Received 23 December 2006; accepted 16 May 2007.Address correspondence to Rohani Ambo-Rappe, Department of Marine Sciences, Faculty
of Marine Sciences and Fisheries, Hasanuddin University, Makassar 90245, Indonesia.E-mail: [email protected]

Dow
nloa
ded
By:
[Uni
vers
ity o
f New
cast
le] A
t: 09
:43
16 A
ugus
t 200
7
100 Ambo-Rappe et al.
essential in maintaining marine biodiversity (Duarte 2000; Hemminga and Duarte 2000).Moreover, the strap-like leaves of seagrass plants slow the overlying water and allowsediment suspended in the water to fall out into the seagrass meadow. The extensive rhi-zome systems of the seagrass then stabilize the underlying sediment (Bulthuis et al.1984).
In Australia, there are about 30 different species of seagrass from 11 genera. Zosteracapricorni Aschers is the most common species of Australian estuarine seagrass that isrestricted to sheltered areas in estuaries and semi-enclosed embayments (Wood 1959;Kirkman 1997). The study was conducted at Lake Macquarie of New South Wales, one ofthe largest estuaries in Australia, which is predominantly covered by Z. capricorni. How-ever, seagrass beds in Lake Macquarie have experienced a significant reduction due tocoastal development (King and Hodgson 1986).
The lake extends approximately 22 km in a north-south direction. It has a maximumwidth of 10 km and a maximum depth of 11 m, with an average depth of 8 m (Peters et al.1999a). The total waterway area of Lake Macquarie is 120 km2 and the catchments are700 km2 (Manly Hydraulics Laboratory 2002). It is separated from the ocean by a narrowentrance channel and sand-bars, resulting in poor tidal mixing (Spencer 1959). Despitethis poor tidal exchange, the lake has a marine character (with salinity usually in therange of 25–33 ppt) because of minimal freshwater dilution from the fluvial inputs.Winds produce larger water mixing within the lake than do tides (Roy and Crawford1984).
Lake Macquarie is surrounded by residential areas and used for a wide range of indus-trial activities, including power generation, smelting and extractive industries (LakeMacquarie City Council 1995). Urban development is extensive on the northern parts ofthe Lake Macquarie resulting in increased urban run-off while the southern parts are lessdeveloped, although urbanization has increased in the last decades (Batley 1987). Indus-trial development in the north is also more extensive than in the south. In addition to theeffects of storm water, three major point sources have the potential to impact water qualitywithin the north part of Lake Macquarie. These include: (a) Stockton Borehole Colliery(1 km north of the lake), which discharges sediments; (b) Edgeworth Sewage TreatmentPlant (3 km north), which discharges nutrients such as phosphorus and nitrogen; and (c)Pasminco Metals-Sulphide Smelter (1.5 km north east), which discharges heavy metals(Environmental Resource Management 2000).
The Pasminco Cockle Creek smelter was the major contributor of the heavy metalsthat contaminated Lake Macquarie from 1897 until its operation ceased on 12 September2003. The smelter site was located at the northern end of Lake Macquarie (the area sur-rounding Cockle Creek and Cockle Bay). Although the smelter has now ceased opera-tions, the accumulated contamination of the site and surrounding areas remains a seriousissue. The sediment of Cockle Creek and Cockle Bay contained high concentrations oflead, zinc, copper and cadmium, which were one to two orders of magnitude greater thanin sediments from other parts of Lake Macquarie (Spurway 1982; Batley 1991). Sea-grasses grow in small patches around the foreshore. This might be related with the highconcentrations of heavy metals that inhibited the growth of seagrass. Their actual role,however, was unclear (Environment Protection Authority 2001).
Heavy metals can be incorporated into seagrass leaves and vascular tissue from eitherwater column or sediments. In locations where elevated concentration of metals was sus-pected, seagrass leaves also contained an elevated concentration of metals. The presenceof heavy metals in both water and sediment has been demonstrated to inhibit the growthof seagrass (Ward 1989). Moreover, toxic concentrations of metals inhibited metabolic

Dow
nloa
ded
By:
[Uni
vers
ity o
f New
cast
le] A
t: 09
:43
16 A
ugus
t 200
7
Zostera capricorni Aschers in a Gradient of Heavy Metals 101
activity and interfered with vital biochemical pathways, such as photosynthesis (Ralphand Burchett 1998).
In field conditions, however, seagrasses seem relatively resistant to substances thatcan poison other forms of marine life. For example, turtle grass Thalassia maintainedusual population density in the highly contaminated sediment receiving effluent from adesalination plant, while the nearby echinoids were killed. At the same time, thephotosynthetic activity of the turtle grass was depressed by 50% during 24-hr exposure toa 12% effluent in the laboratory (McRoy and Helffrich 1980). Seagrasses Z. mucronata,Posidonia australis and P. sinuosa were found growing at their usual depths in sedimentswith extremely high concentrations of cadmium, lead, and zinc near a lead-zinc smelter atPort Pirie, South Australia. Their distribution seemed normal, although their leaves con-tained high concentrations of metals (Ward et al. 1984).
The effect of metals on seagrasses in the field seems to be very complex and could bemodified by other environmental factors. Little is known about how seagrasses respond tocontamination leading to a poor understanding of tolerance/resistance mechanism (Ralphet al. 2006). It is essential to understand whether metal can kill, permanently damage ormerely cause stress to the seagrass.
Morphological traits of seagrass, in particular the shape of its leaves, have beeninvestigated for use as indicators of environmental quality. It was found that narrowerleaves were developed in more stressful conditions (McMillan 1978; McMillan andPhillips 1979; Phillips 1980). Another morphological characteristic that can be used forassessing stress is fluctuating asymmetry (FA). FA represents the random deviations fromperfect symmetry and usually increases under stressful conditions (Tracy et al. 1995;Kozlov et al. 1996; Anne et al. 1998; Hosken et al. 2000; Lens et al. 2000; Lens et al.2002; Mal et al. 2002; Tan-Kristanto et al. 2003). By its nature FA represents randomcomponent of phenotypic variance standing on equal footing with genotypic and environ-mental components (Lajus et al., 2003). Fluctuating asymmetry has been proposed as atool for monitoring the quality of the environment and is being considered as a sensitivemonitor of stress (Tracy et al. 1995; Anne et al. 1998; Leung et al. 2003). It has beenclaimed to be impacted at concentrations less than those required to impact life historyfeatures (Anne et al., 1998; Hoffmann and Woods 2003). Moreover, this technique hasbeen recommended because it is biologically relevant, non-destructive, and time- andcost-effective (Tracy et al. 1995).
Using fluctuating asymmetry at present, however, is limited almost exclusively tostructures that possess bilateral symmetry. At the same time, there are also other types ofsymmetry, such as translational symmetry, when a particular translation does not changethe object. This type of symmetry was also proposed as potential measures of develop-mental instability (Graham et al. 1993). Although common in living organisms, the struc-tures with non-bilateral symmetries are rarely used for analyzing symmetry (Freeman etal. 2003). The expansion of the developmental instability technique to structures possess-ing these types of symmetry would considerably increase the range of organisms in whichit can be measured.
Fluctuating asymmetry measured on traits possessing translational symmetry is oftencalled “translational asymmetry” (Alados et al. 2001; Sinclair and Hoffmann 2003; Tan-Kristanto et al. 2003; Alados et al. 2006). We suggest that term “translational fluctuatingasymmetry” is more appropriate in this case because asymmetry of translationally sym-metrical traits, like asymmetry of bilaterally symmetrical traits, can be both fluctuating(i.e. randomly deviating from perfect translational symmetry) and directional (i.e. havesystematic deviations from perfect translational symmetry). Directional asymmetry is

Dow
nloa
ded
By:
[Uni
vers
ity o
f New
cast
le] A
t: 09
:43
16 A
ugus
t 200
7
102 Ambo-Rappe et al.
manifested, for instance, in the decrease of internode distances from the root to the top ofthe plant. Using the “translational asymmetry” together with the term “fluctuating asym-metry” unintentionally suggests the different nature of the phenomena, although indeedthe same characteristic, namely developmental instability, is measured. The only differenceis the type of symmetry from which the random deviations take place. The term “transla-tional symmetry” is in the same manner incomplete as the term “bilateral symmetry,”because both can be either fluctuating or directional. When authors use “fluctuating asym-metry,” they by default mean that it is analyzed on bilaterally symmetrical traits. Analysesof fluctuating asymmetry on translationally symmetrical traits is considered a relativelynew method, although such analyses were already performed a long time ago (Astauroff1930), and it is important to point out that in this study we also deal with deviations fromtranslational and not bilateral symmetry.
The longitudinal veins on the leaves of Z. capricorni are interconnected by the lateralveins at regular intervals (Kuo and den Hartog 2006). This character clearly shows transla-tional symmetry. Thus, translational fluctuating asymmetry measurement in Z. capricorniis a measure of deviation from perfect translational symmetry, which is a translation alonga certain straight line over some interval.
There were two main goals in this study: first, to develop an effective technique ofmeasuring translational fluctuating asymmetry on seagrass, Z. capricorni; and second, todetermine if there are differences in translational fluctuating asymmetry and leaf dimen-sion characters between locations with different heavy metal loading.
Materials and Methods
Sampling Locations
Choice of sampling locations was based on the previous studies about heavy metal con-centrations in the sediment of Lake Macquarie (Spurway 1982; Roy and Crawford 1984;Batley 1987; Peters et al. 1999b; Kirby et al. 2001; Roach 2005). We sampled in one pol-luted location (Cockle Bay), which had the highest concentration of heavy metals in thesediment, and six relatively clean locations (Fennel Bay, Killaben Bay, Wangi-EraringBay, Myuna Bay, Bonnels Bay, and Wyee Bay) (Figure 1). Depth ranged from 40 to 60 cmin all locations and types of sediment were sand and mud. In each location, we sampledthree sites at distance 100–200 m. Within each site, 20 individual plants not closer than 3 mfrom each other were collected.
Measurement of Leaves
We selected two individual leaves with minimum epiphytic growth from each plant. Thelength of leaf was measured from the base to its tip. The width of leaf was measured fromone side of the margin to the other side in its widest section. These measurements weretaken using a mm-ruler. Then the leaves were cut up to about 11 cm from the leaf-sheathto the tip of the leaf and cleared of epiphytes by scraping the leaf surface. After that theleaves were scanned (using Epson Perfection 3170 Photo at resolution 1200 dpi). Toaccount for measurement error, after taking the first image, each leaf was turned over andscanned again (Stige et al. in press).
The analysis of images (two from each leaf) was performed with “Image Tool” soft-ware (University of Texas Health Science Centre, San Antonio, Texas; freely available atftp://maxrad6.uthscsa.edu). We placed 11 dots along the medial vein of the leaf in places

Dow
nloa
ded
By:
[Uni
vers
ity o
f New
cast
le] A
t: 09
:43
16 A
ugus
t 200
7
Zostera capricorni Aschers in a Gradient of Heavy Metals 103
of interception with lateral veins and obtained coordinates of these dots. Based on thesecoordinates, we calculated 10 distances between the lateral veins (DBLV) from each indi-vidual leaf (Figure 2).
Figure 1. Sampling locations from north to south along the western part of Lake Macquarie, NewSouth Wales, Australia. The point sources of heavy metal were indicated with symbols: + Colliery� Sewage treatment plant Lead-zinc smelter.
5
Cockle Bay
Fennel Bay
Killaben Bay
Myuna Bay
Bonnels Bay
WyeeBay
LAKEMAQUARIE
Wangi-EraringBay
SOUTHPACIFICOCEAN
EntranceChannel
(Swansea)
km
0 2,5 5
Figure 2. Translational fluctuating asymmetry (TFA) measurement of Z. capricorni leaf. Arrowsindicate interception points between lateral veins of the upper half of the leaf and medial veins. Dis-tances between these points are distances between lateral veins (DBLV). Ten distances were mea-sured from each specimen.
DBLV10DBLV9DBLV1 DBLV2 DBLV3 DBLV4 DBLV5 DBLV6 DBLV7 DBLV8

Dow
nloa
ded
By:
[Uni
vers
ity o
f New
cast
le] A
t: 09
:43
16 A
ugus
t 200
7
104 Ambo-Rappe et al.
Heavy Metal Analyses
Prior to the heavy metal analyses, seagrass tissue was washed with lake water to removeresidual sediment and other debris, because previous studies showed that rinsingseagrasses with distilled water caused premature leaching of metals and other cations(Ledent et al. 1995). Epiphytes were removed by scraping them from the leaf surface. Theseagrass tissue was blotted dry with paper towels and set out at room temperature untilpartially dry. Then, the seagrass tissue was oven dried at 60ºC for 48 h followed by separationinto leaf blades and roots/rhizomes. The individual seagrass plants from each samplingsite were combined and three sub-samples of about 0.1 g (dry wt) leaves or root/rhizomesmaterial were placed into 50 ml beakers. All glassware was acid-washed in 5% nitric acidprior to the use for metal analyses. Ten milliliters of concentrated nitric acid was added toeach beaker before it was placed on a hot plate at 85 – 95°C with a watch-glass on top ofit. The samples were allowed to digest for several hours before 1 ml hydrogen peroxidewas added step-wise, while the samples remained on the hot plate for several more hours.Upon completion of the digestion, the samples were allowed to cool, and then filtered into50 ml volumetric flasks using Whatman no. 5 filter paper. The solution was made up to 50ml using Milli-Q deionised water. Samples solutions were filtered through Sartorius 0.45μm acetate membrane filters and stored in 10 ml plastic centrifuge tubes. The sample solu-tions were analyzed using a Thermo Electron High Resolution Inductively Coupled MassSpectrometer (ICP-MS; Element 2) to determine metal concentrations.
Analytical quality control was performed with a reference material, estuarine sedi-ment. As there is no certified reference material for seagrass, samples of Z. capricornifrom Lake Macquarie that has been dried, mixed and ground to less than 0.8 μm was used.Spike recoveries of 0.1 ppm of solution (Cr, Cu, and As) were performed. Referencematerial and spike seagrass material were digested with each analytical batch to checkrecovery rates. In addition to check reference sediment material, the certified referencematerial PACS-2 (National Research Council Canada) was analyzed. The recovery ratesobtained for sediment were: 60.75% for Cu, 84.83% for Cd, 75.46% for Pb, 130.43% forSe, and 84.73% for Zn, while the recovery rates for seagrass were 92.55 ± 6.77% for Cr,82.26 ± 5.32% for Cu, and 108.11 ± 7.26% for As.
Statistical Analyses
Asymmetrical analysis of variance (ANOVA) was used for all variables as we wanted tocompare between one location that was purportedly impacted and more than one control loca-tions. This analysis was designed to deal with the environmental impact assessment when nodata have been obtained before the purported impact and, thus, only after data are available,so called ACI (After-Control/Impact) (Underwood 1991; 1992; 1993; 1994). More specifi-cally, in the absence of before data, it may be possible to detect consistent differencesbetween one or more impact locations and several control or reference locations. Glasby(1997) provided a detailed description of how to deal with asymmetrical data and a discus-sion of the problems associated with detecting impacts when only after data are available.
The differences in concentrations of heavy metals (Cd, Pb, Cu, Zn, Se) between pol-luted and control locations were identified with the asymmetrical ANOVA: Location (ran-dom, with one polluted and six controls) and Site (three sampling sites, nested inLocation), with three replicate measurements at each site. The main indication of impactwould be a significant difference between Cockle Bay and control locations (CB vs Con-trol in the analysis table).

Dow
nloa
ded
By:
[Uni
vers
ity o
f New
cast
le] A
t: 09
:43
16 A
ugus
t 200
7
Zostera capricorni Aschers in a Gradient of Heavy Metals 105
Leaf-length, leaf-width, and ratio between leaf-width and leaf-length were calculatedand also compared between polluted and control locations with an asymmetrical analysisof variance with factors: Location (random, with one polluted and six controls) and Site(three sampling sites, nested in Location), with 20 replicates at each site. The similar exper-imental design was used for average DBLV with 40 replicate measurements at each site.
Translational fluctuating asymmetry (TFA) data were analyzed using three-factorasymmetrical analysis of variance (ANOVA): Location (random, one polluted and sixcontrols), Site (three sampling sites, nested in Location), and Leaf (two leaves), with 20replicate measurements per combination of factors. Moreover, TFA data were correlatedwith metals concentrations in both leaves and roots/rhizomes of seagrass using Spear-man’s correlation analysis.
The initial and repeat measurements of subset data (20 plants per location) were ana-lyzed to determine whether the variation in non-directional asymmetry (i.e. TFA) was sig-nificantly larger than the measurement error. This was done through a two-way ANOVAwith DBLV and individual plant as random factors, which also test for directional asym-metry (DA) (Palmer 1994).
As fluctuating asymmetry is deviation from perfect symmetry (in this case transla-tional symmetry), we first needed to perform a standardization to adjust our data to perfecttranslational symmetry. This standardization was needed because there was a variation inDBLV for each leaf. To standardize, we first divided each individual DBLV to averageDBLV for each leaf to adjust changes from first to last DBLVs, and second, each DBLVwas divided by an average length of respective DBLV for each site to account for system-atic variation in DBLV within a leaf.
Results
Heavy Metals in Seagrass Tissues
Concentration of heavy metals in the roots/rhizomes of seagrass were highly correlatedwith the concentrations in its leaves with exception for Cd (r ranged from 0.84 to 0.99, p <0.01 for other metals), while correlation coefficient for Cd was 0.15 (p > 0.05). Roots inmost cases contained higher concentrations of metals than leaves with the most pro-nounced difference observed for lead (Tables 1 and 2). Spatial variation in heavy metalconcentrations was observed both within and between locations, with significantly higherconcentrations in samples from Cockle Bay (polluted location) compared to controls(Tables 1 and 2). At the same time, there were notable differences between different siteswithin Cockle Bay. Patterns of differences varied from metal to metal, but in all metals atleast one site within the Cockle Bay exhibited a considerably higher concentration ofmetal than in all other locations (Table 2).
Leaf Dimension Characters
The size of Zostera leaves in term of their length and width varied significantly amonglocations (F6,14, p < 0.01), but the variation in these variables was more pronouncedamong the control locations and among the site within control locations. Overall, Zosteraleaves in Cockle Bay were longer than in control locations though the differences were notsignificant. The width of the leaves varied among locations and no further differencesbetween polluted and control locations were found (Figures 3a and 3b). Variation in leafdimensions was not correlated with depth.

Dow
nloa
ded
By:
[Uni
vers
ity o
f New
cast
le] A
t: 09
:43
16 A
ugus
t 200
7
106
Tab
le 1
Hea
vy m
etal
con
cent
rati
on (
μg g
−1 d
ry w
t) in
sea
gras
s Z
. cap
rico
rni f
rom
Lak
e M
acqu
arie
, New
Sou
th W
ales
, Aus
tral
ia
Loc
atio
nS
ecti
onC
dP
bC
uZ
nSe
Coc
kle
Bay
Roo
t20
.2 ±
5.4
211.
7 ±
44.5
84.1
± 3
3.2
592.
4 ±
138.
910
.6 ±
7.2
Lea
f6.
1 ±
2.0
148.
4 ±
30.6
52.1
± 1
5.9
396.
5 ±
90.6
7.3
± 5.
5Fe
nnel
Bay
Roo
t3.
1 ±
0.9
26.5
± 2
.017
.4 ±
2.1
116.
2 ±
14.1
0.1
± 0.
04L
eaf
2.1
± 0.
520
.2 ±
2.7
13.8
± 1
.317
0.9
± 13
.20.
1 ±
0.04
Kil
labe
n B
ayR
oot
5.6
± 0.
542
.6 ±
18.
919
.7 ±
1.7
152.
8 ±
11.7
2.0
± 0.
7L
eaf
4.2
± 0.
46.
2 ±
0.4
13.5
± 1
.513
4.4
± 19
.20.
6 ±
0.1
Wan
gi-E
rari
ng B
ayR
oot
3.3
± 0.
64.
1 ±
0.4
15.3
± 2
.265
.7 ±
15.
10.
2 ±
0.05
Lea
f4.
4 ±
0.4
3.4
± 0.
215
.0 ±
1.6
115.
4 ±
25.1
0.04
± 0
.02
Myu
na B
ayR
oot
3.0
± 0.
54.
1 ±
0.5
22.3
± 2
.463
.9 ±
4.6
0.9
± 0.
06L
eaf
6.6
± 1.
14.
1 ±
0.6
18.6
± 2
.611
9.6
± 20
.11.
2 ±
0.2
Bon
nels
Bay
Roo
t4.
2 ±
0.5
7.4
± 0.
717
.2 ±
1.7
104.
4 ±
10.3
1.05
± 0
.2L
eaf
4.8
± 0.
37.
3 ±
1.1
17.4
± 0
.615
4.8
± 18
.10.
8 ±
0.05
Wye
e B
ayR
oot
5.8
± 0.
75.
9 ±
0.8
20.9
± 2
.765
.2 ±
6.4
1.3
± 0.
1L
eaf
8.4
± 1.
15.
5 ±
0.8
19.7
± 1
.812
8.2
± 6.
61.
3 ±
0.1

Dow
nloa
ded
By:
[Uni
vers
ity o
f New
cast
le] A
t: 09
:43
16 A
ugus
t 200
7
107
Tab
le 2
Sum
mar
y of
asy
mm
etri
cal a
naly
sis
of v
aria
nce
(AN
OV
A)
resu
lts c
ompa
ring
hea
vy m
etal
s co
ncen
trat
ions
in Z
. cap
rico
rni
bet
wee
n po
llut
ed (
CB
) an
d co
ntro
l loc
atio
ns
Cad
miu
m (
Cd)
Cop
per
(Cu)
Lea
d (P
b)Z
inc
(Zn)
Sele
nium
(Se
)
Sour
ce o
f va
riat
ion
DF
MS
FM
SF
MS
FM
SF
MS
F
Sec
tion
147
.40
0.91
ns
1420
.29
3.07
ns
7387
.65
11.3
6**
2256
.36
0.10
ns
14.4
82.
49 n
sL
ocat
ions
622
0.08
4.52
**66
33.6
11.
99 n
s74
532.
286.
92**
3782
99.9
84.
54**
175.
551.
02 n
sC
B v
s C
ontr
ol1
1124
.27
28.6
5**
3932
9.25
416.
26**
*43
8703
.81
258.
37**
*22
1012
9.82
185.
20**
*10
25.1
518
1.97
***
Con
trol
539
.24
2.80
ns
94.4
80.
87 n
s16
97.9
75.
25**
1193
4.02
4.48
*5.
635.
20**
Site
s (L
ocat
ions
)14
48.6
92.
99**
*33
25.8
55.
84**
*10
774.
2511
.75*
**83
349.
7910
.39*
**17
2.51
4.19
***
Site
s (C
B)
225
6.66
18.3
0***
2263
2.43
209.
40**
*73
478.
0722
7.06
***
5674
61.5
821
2.97
***
1201
.09
1109
.49*
**Si
tes
(Con
trol
)12
14.0
26.
08**
*10
8.08
5.33
***
323.
611.
25 n
s26
64.4
91.
56 n
s1.
083.
34 n
sSe
ctio
n �
Loc
atio
ns6
157.
913.
02*
583.
241.
26 n
s27
93.1
94.
30*
3994
0.88
1.69
ns
6.97
1.20
ns
Sect
ion
� S
ites
(Loc
atio
ns)
1452
.24
3.21
***
462.
990.
81 n
s65
0.10
0.71
ns
2363
0.06
2.94
**5.
810.
14 n
s
Res
idua
ls84
16.2
856
9.43
917.
2780
24.2
841
.13
Res
idua
ls (
CB
)12
Res
idua
ls (
Con
trol
)72
Tot
al12
5
ns –
not
sig
nifi
cant
; * -
sig
nifi
cant
at p
< 0
.05;
**
- si
gnif
ican
t at p
< 0
.01;
and
***
- s
igni
fica
nt a
t p <
0.0
01.

Dow
nloa
ded
By:
[Uni
vers
ity o
f New
cast
le] A
t: 09
:43
16 A
ugus
t 200
7
108 Ambo-Rappe et al.
Ratio of leaf-width and leaf-length of Zostera leaves were significantly smaller inCockle Bay (the polluted location) than in control locations (Table 3, Figure 3c). Therewas more variation in the dimension of the leaves among the sites within control locationsthan among the sites within the polluted location.
Patterns of Variation in Distances between Lateral Veins DBLV and Translational Fluctuating Asymmetry (TFA)
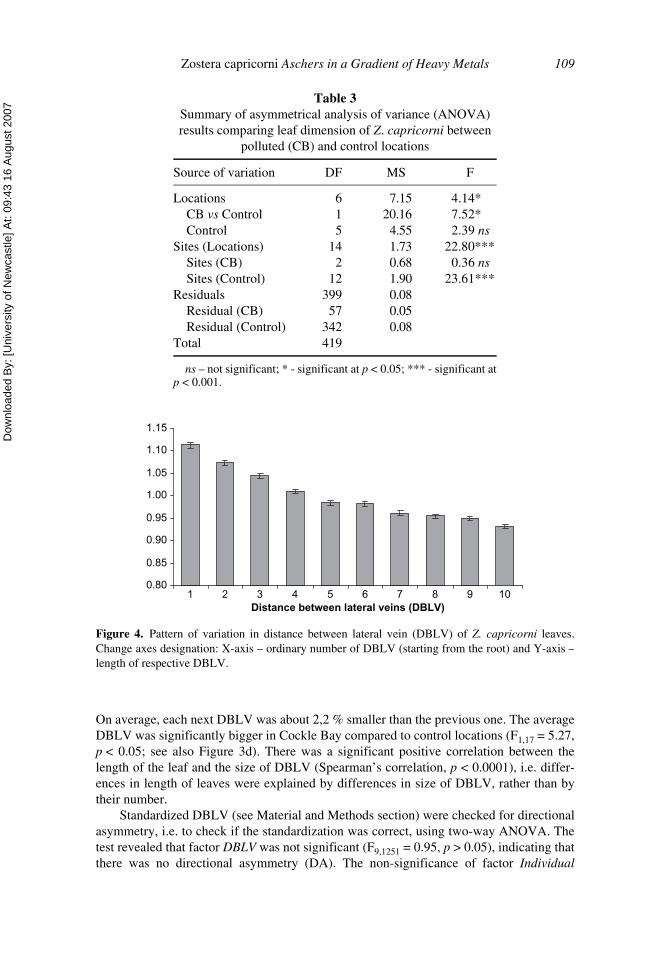
Distances between lateral veins (DBLV) decreased from the base to the top of the leaf.The pattern of decrease was most pronounced from the first to the fifth DBLV (Figure 4).
Figure 3. Leaf-length (3a), leaf-width (3b), ratio leaf-width and leaf-length (3c), and distance betweenlateral vein (DBLV; 3d) of Z. capricorni in comparison between polluted and control locations.
3a. Leaf length (LL)
0
300
450
3b. Leaf width (LW)
0.0
1.5
3.0
4.5
3c. Ratio LW/LL
0.00
0.01
0.02
0.03
0.04
0.05
3d. Distance between lateral vein (DBLV)
Cockle
Polluted Control
Fennel Killaben Wangi-Eraring
0
50
100
150
200
250
Wyee
DB
LV
(d
pi)
Rat
io L
W/L
LL
eaf-
wid
th (
mm
)L
eaf-
len
gth
(m
m)
150
Myuna Bonnels
Dow
nloa
ded
By:
[Uni
vers
ity o
f New
cast
le] A
t: 09
:43
16 A
ugus
t 200
7
Zostera capricorni Aschers in a Gradient of Heavy Metals 109
On average, each next DBLV was about 2,2 % smaller than the previous one. The averageDBLV was significantly bigger in Cockle Bay compared to control locations (F1,17 = 5.27,p < 0.05; see also Figure 3d). There was a significant positive correlation between thelength of the leaf and the size of DBLV (Spearman’s correlation, p < 0.0001), i.e. differ-ences in length of leaves were explained by differences in size of DBLV, rather than bytheir number.
Standardized DBLV (see Material and Methods section) were checked for directionalasymmetry, i.e. to check if the standardization was correct, using two-way ANOVA. Thetest revealed that factor DBLV was not significant (F9,1251 = 0.95, p > 0.05), indicating thatthere was no directional asymmetry (DA). The non-significance of factor Individual
Table 3Summary of asymmetrical analysis of variance (ANOVA)results comparing leaf dimension of Z. capricorni between
polluted (CB) and control locations
Source of variation DF MS F
Locations 6 7.15 4.14*CB vs Control 1 20.16 7.52*Control 5 4.55 2.39 ns
Sites (Locations) 14 1.73 22.80***Sites (CB) 2 0.68 0.36 nsSites (Control) 12 1.90 23.61***
Residuals 399 0.08Residual (CB) 57 0.05Residual (Control) 342 0.08
Total 419
ns – not significant; * - significant at p < 0.05; *** - significant atp < 0.001.
Figure 4. Pattern of variation in distance between lateral vein (DBLV) of Z. capricorni leaves.Change axes designation: X-axis – ordinary number of DBLV (starting from the root) and Y-axis –length of respective DBLV.
0.80
0.85
0.90
0.95
1.00
1.05
1.10
1.15
Distance between lateral veins (DBLV)10987654321

Dow
nloa
ded
By:
[Uni
vers
ity o
f New
cast
le] A
t: 09
:43
16 A
ugus
t 200
7
110 Ambo-Rappe et al.
(F139,1251 = 0.01, p > 0.05) means that the variation of DBLV was not different amongindividual plants within the site. Deviation from perfect translational symmetry (i.e.translational fluctuating asymmetry) was shown by a significant interaction of factorsDBLV x Individual (F1251,1400 = 2.50, p < 0.0001). The significant deviation from the per-fect translational symmetry (p < 0.0001) in this case was larger than measurement error.Repeated measures of translational fluctuating asymmetry were positively correlated (r =0.987, p < 0.01) indicating that measurement error was negligible.
There was no significant differences in TFA between first and second leaves, andamong sites within a location, but differences between locations were significant (F6,14 =6.43, p < 0.01). TFA significantly varied among the control locations with the highest val-ues in Killaben Bay and the lowest in samples from Fennels Bay. There was no significantincrease in TFA of Zostera leaves from the polluted location (Table 4, Figure 5). Therewas also no correlation found between metals concentrations in seagrass tissues and theTFA (Spearman’s correlation, p > 0.05).
Discussion
Concentrations of heavy metals in seagrass, Z. capricorni were significantly higher inCockle Bay (the polluted location) compared to control locations, reflecting the corre-sponding concentrations of heavy metals in the sediments of Lake Macquarie recorded inthe previous studies (Spurway 1982; Roy and Crawford 1984; Batley 1987; Peters et al.1999b; Kirby et al. 2001; Roach 2005). This result is in line with other studies of the rela-tionships between metal levels in the environment and in seagrasses (Brix et al. 1983;Ward 1987; Ward 1989; Malea et al. 1994; Sanchiz et al. 2000; Campanella et al. 2001;Filho et al. 2004). Therefore, given a simple correlation between metal levels in their
Table 4Summary of asymmetrical analysis of variance (ANOVA) results
comparing translational fluctuating asymmetry (TFA) of Z. capricorni leaves between polluted (CB) and control locations
Source of variation DF MS F
Location 6 0.61 6.43**CB vs Control 1 0.42 0.65 nsControl 5 0.65 6.27**
Site (Location) 14 0.10 0.82 nsSite (CB) 2 0.04 0.43 nsSite (Control) 12 0.10 0.91 ns
Leaves 1 0.00 0.00 nsLocation � Leaves 6 0.21 0.98 nsLeaves � Site (Location) 14 0.21 1.82*Residuals 798 0.12
Residuals (CB) 114 0.13Residuals (Control) 684 0.11
Total 839
ns – not significant; * - significant at p < 0.05; ** - significant at p < 0.01.

Dow
nloa
ded
By:
[Uni
vers
ity o
f New
cast
le] A
t: 09
:43
16 A
ugus
t 200
7
Zostera capricorni Aschers in a Gradient of Heavy Metals 111
tissue and average metal levels in its environment, seagrasses can be used as an indicatorfor heavy metal pollution (Phillips 1977).
Experimental exposure of seagrass to concentrations of heavy metals in water from0.5 to 5 ppm for Pb, Cu, Cd and Zn had an effect on the photosynthetic activity, structuralcharacteristics of leaves and shoots, and on seagrass growth (Conroy et al. 1991). How-ever, seagrass exposed to higher concentrations of heavy metals (18.4 ppm of Cd, 406ppm of Pb and 1270 ppm of Zn) in the field did not show evidence of growth inhibition(Ward et al. 1984; Ward 1987).
In this study, however, seagrass leaves from the more polluted location were longerand had smaller width/length ratio than the leaves from control locations. Phillips (1980)suggested that leaf dimension characters are plastic and vary according to the environmentwhere the plants live. For example, Thalassia populations from shallow and turbid bayshad narrow leaves and those from clear water have wider leaves; Halodule populationswith frequent exposure to air at low tides tended to produce narrow leaves and those thatwere not exposed at low tides tended to produce wider leaves; Zostera populations fromintertidal areas produced narrow leaves and those in subtidal habitats produced broaderleaves (McMillan and Phillips 1979; Phillips 1980). Moreover, turbid water and variablesalinity and temperature of the shallow bays correlated with the presence of narrow-leavedplants, and the clear water and relatively constant salinity and temperature of the bays cor-related with the broader-leaved populations (McMillan 1978).
Interestingly, the difference in DBLV showed even more pronounced differencesbetween polluted and control locations. DBLV was clearly correlated with length of leafand therefore increase in leaf length is caused by increase of DBLV rather than thenumber of DBLV. Possibly, the increase of DBLV reflects a response of Zostera to heavymetals on a tissue level; however, other studies are needed to investigate the utility of thismorphological response as a marker for the effect of heavy metals on seagrass.
The difference in the leaf dimension of seagrass between polluted and unpollutedlocations in this study might be related to the high concentration of heavy metals in thesediment or might be a response to the high turbidity and high nutrient content in the pol-luted site. The high levels of suspended solids, nitrates and orthophosphates in the waterat the northern side of Lake Macquarie have been observed previously (Conroy et al.1991). This suggests that heavy metals may have an effect on seagrass morphology,
Figure 5. Translational fluctuating asymmetry of Z. capricorni leaves in comparison between pol-luted and control locations.
0
0.02
0.04
0.06
0.08
CockleBay
FennelBay
KillabenBay
WangiBay
MyunaBay
BonnelsBay
WyeeBay
Polluted Control

Dow
nloa
ded
By:
[Uni
vers
ity o
f New
cast
le] A
t: 09
:43
16 A
ugus
t 200
7
112 Ambo-Rappe et al.
although the effect should be demonstrated by manipulative studies (i.e. transplantationexperiments).
Traditionally, fluctuating asymmetry is most frequently studied on bilaterally sym-metrical traits, although translational symmetry is known to be suitable for such analyses(Graham et al. 1993). Recently, several works analyzing translational fluctuating asymme-try and showing that it can be used as a good indicator of environmental stress on plants,were published (Alados et al. 2001; Sinclair and Hoffmann 2003; Tan-Kristanto et al., 2003;Alados et al. 2006). Zostera with their wide distribution range, important role in coastalecosystems and vulnerability to human-induced changes, represents one of such objects.
The method developed in this study showed high resolution in terms of discriminatinggeographically distinct samples. Samples situated at distances of 3–5 km showed signifi-cant differences in fluctuating asymmetry, although the analyses showed homogeneity ofthe samples from distances of hundred meters. Most likely, variation in environmentalfactors causes variation in fluctuating asymmetry, the but effect of genotypic factors,namely adaptation to local environmental conditions, may also be important.
None of the factors that we controlled in this study, such as heavy metal concentra-tion, depth, and type of sediments, showed a significant effect on fluctuating asymmetry.Thus some uncontrolled factors probably cause the observed heterogeneity. Among themcan be nutrient availability, light intensity, and turbidity of water. The polluted locationchosen for this study was heavily polluted both by heavy metals and urban run-off. There-fore, the effect of heavy metals on seagrass might have been confounded by other uncon-trolled factors (in this case, nutrient concentrations and level of water turbidity). Theinteraction of heavy metals and other stress factors (e.g. high nutrient level and turbidity)on seagrasses have not been studied so far (Ralph et al. 2006). According to the suggestionof Conroy et al (1991), heavy metals and nutrients may affect seagrass growth in oppositedirections. The lack of differences in developmental instability in our study might be dueto the fact that the negative effect of heavy metals and the positive effect of nutrients com-pensated each other.
This is supported by the results of our study on other seagrass species, Halophila ova-lis, from the same locations in Lake Macquarie. Fluctuating asymmetry of H. ovalis fromthe most polluted location of the lake was not higher than in relatively unpolluted loca-tions (Ambo-Rappe et al. 2007), but in laboratory experiments, fluctuating asymmetry ofthe seagrass increased under concentrations of Cu and Pb similar to those found in the lakewater (Ambo-Rappe et al. unpublished data).
Tracy et al. (1995) also found no clear link between fluctuating asymmetry and envi-ronmental stress in an aquatic plant, Ceratophyllum demersum. The authors suggested thatthe absence of roots in this plant make it less exposed to the principal location of pollut-ants (in the sediments). Tan-Kristanto et al. (2003) found significantly lower trichomeasymmetry of Arabidopsis thaliana when exposed to cadmium. They suggested that thereis a possibility that heavy metal exposure induced or activated enzymes, such as phytoch-elatin synthase, in the plant that protects plant development from further damage, leadingto a decrease in asymmetry rather than the expected increase. Fluctuating asymmetry is,therefore, not simply a function of pollution but mediated by other factors.
It also should be taken into account that seagrasses seem to be able to accumulatehigh concentrations of metals, store them in a special compartment where they have littlemetabolic effect (Ward 1989). Mechanisms of this phenomena in algae, which can be sim-ilar to those on seagrass are discussed by Pinto et al (2003).
Moreover, seagrass in Lake Macquarie, especially at the northern side, might havedeveloped genetic tolerance to metals due to a long-term (more than 100 years) exposure

Dow
nloa
ded
By:
[Uni
vers
ity o
f New
cast
le] A
t: 09
:43
16 A
ugus
t 200
7
Zostera capricorni Aschers in a Gradient of Heavy Metals 113
from the smelter. Plants can increase a tolerance to metal exposure as a result of naturalselection, where selection pressure favors the tolerant genotype. The tolerant seagrass pop-ulations from heavily developed estuaries were less sensitive to the metal contaminationcompared to seagrasses from a less developed estuary (Macinnis-Ng and Ralph 2004).
Therefore, observed differences in morphological characteristics of seagrass, Z. cap-ricorni, from different locations in Lake Macquarie may be explained by combined effectsof different environmental factors. In Cockle Bay, the high nutrient content might havepromoted seagrass growth (including the increase in width and length of leaves, andincrease of DBLV on tissue level), but high water turbidity and also possible high heavymetal content might have retarded the growth resulting in narrow leaves. Thus, there is apossibility that leaf dimension and tissue structure of seagrass, Z. capricorni, could beused as an indicator of environmental stress in estuarine system. However, the oppositeeffect of different environmental forces can also result in a complicated pattern of transla-tional fluctuating asymmetry. The method used in our study is sensitive enough to detectspatial differences between populations, but to interpret these differences and to estimateutility of translational fluctuating asymmetry as a marker of environmental stress causedby heavy metals on Zostera, additional experiments are necessary.
Acknowledgments
The study was funded by an AUS-aid scholarship to R. Ambo-Rappe and a visitor’s grant from theUniversity of Newcastle to D. Lajus. We thank Dr. Geoff MacFarlane and Dr. Claudia Koller forhelp with heavy metal analyses.
References
Alados CL, Giner ML, Pueyo Y. 2006. An assessment of the differential sensitivity of four summer-deciduous chamaephytes to grazing and plant interactions using translational asymmetry. Eco-logical Indicators 6:554–566.
Alados CL, Navarro T, Escos J, et al. 2001. Translational and fluctuating asymmetry as tools todetect stress in stress-adapted and nonadapted plants. International Journal of Plant Sciences162:607–616.
Ambo-Rappe R, Lajus DL, Schreider MJ. 2007. Increased heavy metal and nutrient contaminationdoes not increase fluctuating asymmetry in the seagrass Halophila ovalis. Ecological IndicatorsIn Press, Corrected Proof.
Ambo-Rappe R, Lajus DL, Schreider MJ. Growth and fluctuating asymmetry of seagrass, Halophilaovalis, exposed to lead and copper. Marine Pollution Bulletin, Paper under review.
Anne P, Mawri F, Gladstone S, et al. 1998. Is fluctuating asymmetry a reliable biomonitor ofstress? A test using life history parameters in soybean. International Journal of Plant Sciences159:559–565.
Astauroff BL. 1930. Analyse der erblichen störungfälle der bilateralen symmetrie im zusammen-hang mit der selbstständigen variabilität änlicher structuren. Zeitschr indukt Abs und Vererbungs55:183–262.
Batley GE. 1987. Heavy metal speciation in waters, sediment and biota from Lake Macquarie, NewSouth Wales. Australian Journal of Marine and Freshwater Research 38:591–606.
Batley GE. 1991. Current Heavy Metal Status of Lake Macquarie. In: Whitehead JH, Kidd RW,Bridgman HA, editors. Lake Macquarie: An Environmental Reappraisal. NSW (Australia): Uni-versity of Newcastle. Department of Community Programmes. p 17–27.
Brix H, Lyngby JE, Schierup H-H. 1983. Eelgrass (Zostera marina L.) as an indicator organism oftrace metals in the Limfjord, Denmark. Marine Environmental Research 8:165–181.

Dow
nloa
ded
By:
[Uni
vers
ity o
f New
cast
le] A
t: 09
:43
16 A
ugus
t 200
7
114 Ambo-Rappe et al.
Bulthuis DA, Bland GW, Mobley MC. 1984. Suspended sediments and nutrients in water ebbingfrom seagrass-covered and denuded tidal mudflats in a southern Australian embayment. AquaticBotany 20:257–266.
Campanella L, Conti ME, Cubadda F, et al. 2001. Trace metals in seagrass, algae and molluscs froman uncontaminated area in the Mediterranean. Environmental Pollution 111:117–126.
Conroy BA, Lake P, Buchhorn N, et al. 1991. Studies on The Effects of Heavy Metals on Seagrassin Lake Macquarie. In: Whitehead JH, Kidd RW, Bridgman HA, editors. Lake Macquarie: AnEnvironmental Reappraisal. New South Wales (Australia): University of Newcastle, Departmentof Community Programmes. p 55–65.
den Hartog C. 1977. Structure, Function, and Classification in Seagrass Communities. In: McRoy CP,Helffrich C, editors. Seagrass Ecosystems: A Scientific Perspective. New York: Marcel Dekker.p 89–121.
Duarte CM. 2000. Marine biodiversity and ecosystem services: an elusive link. Journal of Experi-mental Marine Biology and Ecology 250:117–131.
Edgar GJ, Shaw C. 1995. The production and trophic ecology of shallow-water fish assemblages insouthern Australia II: diets of fishes and trophic relationships between fishes and benthos atWestern Port, Victoria. Journal of Experimental Marine Biology and Ecology 194:83–106.
Environment Protection Authority. 2001. An Assessment of the Biological Effects of Metals in Sed-iments from Lake Macquarie, New South Wales, Australia. New South Wales (Australia): NewSouth Wales Environment Protection Authority-Environmental Science.
Environmental Resource Management. 2000. Five Islands Road Project: Environmental ImpactStatement Vol. 1. (Australia): Roads and Traffic Authority (RTA). New South Wales (Australia):Environmental Resource Management Australia.
Filho GMA, Creed JC, Andrade LR, et al. 2004. Metal accumulation by Halodule wrightii popula-tions. Aquatic Botany 80:241–251.
Freeman DC, Graham JH, Emlen JM, et al. 2003. Plant Developmental Instability: New Measures,Applications, and Regulations. In: Polak M, editor. Developmental Instability: Causes andConsequenses. New York: Oxford University Press. p 367–386.
Gillanders BM. 2006. Seagrasses, Fish, and Fisheries. In: Larkum AWD, Orth RJ, Duarte CM, editors.Seagrasses: Biology, Ecology and Conservation. Dordrecht (The Netherlands): Springer. p 503–536.
Glasby TM. 1997. Analysing data from post-impact studies using asymmetrical analyses of variance:a case study of epibiota on marinas. Australian Journal of Ecology 22:448–459.
Graham JH, Freeman DC, Emlen JM. 1993. Developmental Stability: A Sensitive Indicator of Pop-ulation Under Stress. In: Landis WG, Hughes JS, Lewis MA, editors. Environmental and RiskAssessment. Philadelphia: American Society for Testing and Materials. p 136–158.
Hemminga MA, Duarte CM. 2000. Seagrass Ecology. Cambridge, England: Cambridge UniversityPress. 298 p.
Hoffmann AA, Woods RE. 2003. Associating Environmental Stress with Developmental Stability:Problems and Patterns. In: Polak M, editor. Developmental Instability: Causes and Conse-quences. New York: Oxford University Press. p 387–401.
Hosken DJ, Blanckenhorn WU, Ward PI. 2000. Developmental stability in yellow dung flies(Scathophaga stercoraria): fluctuating asymmetry, heterozygosity and environmental stress.Journal of Evolutionary Biology 13:919–926.
Jernakoff P, Nielsen J. 1998. Plant-animal associations in two species of seagrasses in WesternAustralia. Aquatic Botany 60:359–376.
Kikuchi T, Peres JM. 1977. Consumer Ecology of Seagrass Beds. In: McRoy CP, Helffrich C, edi-tors. Seagrass Ecosystems: A Scientific Perspective. New York: Marcel Dekker. p 147–193.
King RJ, Hodgson BR. 1986. Aquatic angiosperms in coastal saline lagoons of New South WalesIV: long-term changes. Proceeding of the Linnean Society of New South Wales 109:51–60.
Kirby J, Maher W, Krikowa F. 2001. Selenium, cadmium, copper, and zinc concentrations in sedi-ments and mullet (Mugil cephalus) from the southern basin of Lake Macquarie, New SouthWales, Australia. Archives of Environmental Contamination and Toxicology 40: 246–256.
Kirkman H. 1997. Seagrass of Australia. Canberra: Department of the Environment.

Dow
nloa
ded
By:
[Uni
vers
ity o
f New
cast
le] A
t: 09
:43
16 A
ugus
t 200
7
Zostera capricorni Aschers in a Gradient of Heavy Metals 115
Kozlov MV, Wilsey BJ, Koricheva J, et al. 1996. Fluctuating asymmetry of birch leaves increasesunder pollution impact. Journal of Applied Ecology 33:1489–1495.
Kuo J, den Hartog C. 2006. Seagrass Morphology, Anatomy, and Ultrastructure. In: Larkum AWD,Orth RJ, Duarte CM, editors. Seagrasses: Biology, Ecology and Conservation. Dordrecht(The Netherlands): Springer. p 51–87.
Lajus DL, Graham JH, Kozhara AV. 2003. Developmental Instability and The Stochastic Compo-nent of Total Phenotypic Variance. In: Polak M, editor. Developmental Instability: Causes andConsequences. New York: Oxford University Press. p 343–363.
Lake Macquarie City Council. 1995. Lake Macquarie Estuary Process Study. Lake Macquarie, NewSouth Wales (Australia): Lake Macquarie City Council. Australian Water and Coastal StudiesReport No. 94/25.
Ledent G, Mateo MA, Warnau M, et al. 1995. Element losses following distilled water rinsing ofleaves of the seagrass Posidonia oceanica (L.) Delile. Aquatic Botany 52:229–235.
Lens L, Van Dongen S, Galbusera P, et al. 2000. Developmental instability and inbreeding in naturalbird populations exposed to different levels of habitat disturbance. Journal of Evolutionary Biol-ogy 13:889–896.
Lens L, Van Dongen S, Matthysen E. 2002. Fluctuating asymmetry as an early warning system inthe critically endangered taita thrush. Conservation Biology 16:479–487.
Leung B, Knopper L, Mineau P. 2003. A Critical Assessment of the Utility of Fluctuating Asymme-try as a Biomarker of Anthropogenic Stress. In: Polak M, editor. Developmental Instability:Causes and Consequences. New York: Oxford University Press. p 415–426.
Macinnis-Ng CMO, Ralph PJ. 2004. Variations in sensitivity to copper and zinc among three iso-lated populations of the seagrass, Zostera capricorni. Journal of Experimental Marine Biologyand Ecology 302:63–83.
Mal TK, Uveges JL, Turk KW. 2002. Fluctuating asymmetry as an ecological indicator of heavymetal stress in Lythrum salicaria. Ecological Indicators 1:189–195.
Malea P, Haritonidis S, Kevrekidis T. 1994. Seasonal and local variations of metal concentrations inthe seagrass Posidonia oceanica (L.) Delile in the Antikyra Gulf, Greece. The Science of TheTotal Environment 153:225–235.
Manly Hydraulics Laboratory. 2002. Feasibility Study Environmental Improvements/Managementof Cockle Bay. Manly Hydraulics Laboratory, New South Wales Department of Public Worksand Services.
McMillan C. 1978. Morphogeographic variation under controlled conditions in five seagrasses,Thalassia testudinum, Halodule wrightii, Syringodium filiforme, Halophila engelmannii, andZostera marina. Aquatic Botany 4:169–189.
McMillan C, Phillips RC. 1979. Differentiation in habitat response among populations of NewWorld seagrass. Aquatic Botany 7:185–196.
McRoy CP, Helffrich C. 1980. Applied Aspects of Seagrasses. In: Phillips RC, McRoy CP, editors.Handbook of Seagrass Biology: An Ecosystem Perspective. New York: Garland STPM Press.p 297–343.
Palmer AR. 1994. Fluctuating Asymmetry Analyses: A Primer. In: Markow TA, editor. Develop-mental Instability: Its Origins and Evolutionary Implications. Dordrecht, Netherlands: Kluwer.p 335–364.
Peters GM, Maher WA, Jolley D, et al. 1999a. Selenium contamination, redistribution and remobili-sation in sediments of Lake Macquarie, NSW. Organic Geochemistry 30:1287–1300.
Peters GM, Maher WA, Krikowa F, et al. 1999b. Selenium in sediments, pore waters and benthicinfauna of Lake Macquarie, New South Wales, Australia. Marine Environmental Research47:491–508.
Phillips DJH. 1977. The use of biological indicator organisms to monitor trace metal pollution inmarine and estuarine environments: a review. Environmental Pollution 13:281–317.
Phillips RC. 1980. Phenology and Taxonomy of Seagrasses. In: Phillips RC, McRoy CP, editors.Handbook of Seagrass Biology: An Ecosystem Perspective. New York: Garland STPM Press.p 29–40.

Dow
nloa
ded
By:
[Uni
vers
ity o
f New
cast
le] A
t: 09
:43
16 A
ugus
t 200
7
116 Ambo-Rappe et al.
Pinto E, Sigaud-Kutner TCS, Leitão MAS, et al. 2003. Review Heavy metal–induced oxidativestress in algae. Journal of Phycology 39:1008–1018.
Ralph PJ, Burchett MD. 1998. Photosynthetic response of Halophila ovalis to heavy metal stress.Environmental Pollution 103:91–101.
Ralph PJ, Tomasko D, Moore KA, et al. 2006. Human Impacts on Seagrasses: Eutrophication, Sedi-mentation and Contamination. In: Larkum AWD, Orth RJ, Duarte CM, editors. Seagrasses: Biol-ogy, Ecology and Conservation. Dordrecht (The Netherlands): Springer. p 567–593.
Roach AC. 2005. Assessment of metals in sediments from Lake Macquarie, New South Wales, Aus-tralia, using normalisation models and sediment quality guidelines. Marine EnvironmentalResearch 59:453–472.
Roy PS, Crawford EA. 1984. Heavy metals in a contaminated Australian estuary - dispersion andaccumulation trend. Estuarine Coastal and Shelf Science 19:341–358.
Sanchiz C, Garcia-Carrascosa AM, Pastor A. 2000. Heavy metal contents in soft-bottom marinemacrophytes and sediments along the Mediterranean coast of Spain. Marine Ecology 21:1–16.
Sinclair C, Hoffmann AA. 2003. Developmental stability as a potential tool in the early detection ofsalinity stress in wheat. International Journal of Plant Sciences 164:325–331.
Spencer RS. 1959. Some aspects of the ecology of Lake Macquarie, NSW, with regard to thealleged depletion of fish II: hydrology. Australian Journal of Marine and Freshwater Research10:279–296.
Spurway R. 1982. Heavy metal in the sediments of Cockle Creek. Duntoon: Department of Geogra-phy, Faculty of Military Studies, University of New South Wales, R.M.C. Duntroon ACT.
Stige LC, Lajus DL, Shoshina EV, et al. In press. Fluctuating asymmetry in a macro-alga popula-tion: high hypothetical repeatability but low variability in developmental instability and nodetectable association with fitness. Biological Journal of the Linnean Society.
Tan-Kristanto A, Hoffmann A, Woods R, et al. 2003. Translational asymmetry as a sensitive indica-tor of cadmium stress in plants: a laboratory test with wild-type and mutant Arabidopsis thaliana.New Phytologist 159:471–477.
Tracy M, Freeman DC, Emlen JM, et al. 1995. Developmental Instability as A Biomonitor of Envi-ronmental Stress. In: Butterworth FM, Corkum LD, Guzman-Rincon J, editors. Biomonitors andBiomarkers as Indicators of Environmental Change. New York: Plenum Press, p 314–337.
Underwood AJ. 1991. Beyond BACI: experimental designs for detecting human environmentalimpacts on temporal variations in natural populations. Australian Journal of Marine and Fresh-water Research 42:569–587.
Underwood AJ. 1992. Beyond BACI: the detection of environmental impacts on populations in thereal, but variable, world. Journal of Experimental Marine Biology and Ecology 161:145–178.
Underwood AJ. 1993. The mechanics of spatially replicated sampling programmes to detect envi-ronmental impacts in a variable world. Australian Journal of Ecology 18:99–116.
Underwood AJ. 1994. On beyond BACI: sampling designs that might reliably detect environmentaldisturbances. Ecological Applications 4:3–15.
Ward TJ. 1987. Temporal variation of metals in the seagrass Posidonia australis and its potential asa sentinel accumulator near a lead smelter. Marine Biology 95:315–321.
Ward TJ. 1989. The Accumulation and Effects of Metals in Seagrass Habitats. In: Larkum AWD,McComb AJ, Shepherd SA, editors. Biology of Seagrasses: A Treatise on The Biology of Sea-grasses with Special Reference to The Australian Region. New York: Elsevier. p 797–820.
Ward TJ, Warren LJ, Tiller KG. 1984. The Distribution and Effects of Metals in The Marine Envi-ronment Near A Lead-Zinc Smelter, South Australia. In: Nriagu JO, editor. EnvironmentalImpacts of Smelters. New York: John Wiley & Sons. p 1–73.
Wood EJF. 1959. Some aspects of the ecology of Lake Macquarie, NSW with regard to an allegeddepletion of fish VI: plant communities and their significance. Australian Journal of Marine andFreshwater Research 10:322–340.
Copyright © 2022 FDOKUMEN