EVOLUTION OF VARIATION AND VARIABILITY UNDER FLUCTUATING, STABILIZING, AND DISRUPTIVE SELECTION
14
ORIGINAL ARTICLE doi:10.1111/j.1558-5646.2010.00979.x EVOLUTION OF VARIATION AND VARIABILITY UNDER FLUCTUATING, STABILIZING, AND DISRUPTIVE SELECTION Christophe P ´ elabon, 1,2 Thomas F. Hansen, 3,4 Ashley J. R. Carter, 3,5 and David Houle 3 1 Department of Biology, Center for Conservation Biology, Norwegian University of Science and Technology, 7491 Trondheim, Norway 2 E-mail: [email protected] 3 Department of Biological Science, Florida State University, Tallahassee, Florida 32306 4 CEES, Department of Biology, University of Oslo, PO Box 1066, 0316 Oslo, Norway 5 Department of Biological Sciences, California State University, Long Beach, California 90840 Received September 16, 2009 Accepted February 3, 2010 How variation and variability (the capacity to vary) may respond to selection remain open questions. Indeed, effects of different selection regimes on variational properties, such as canalization and developmental stability are under debate. We analyzed the patterns of among- and within-individual variation in two wing-shape characters in populations of Drosophila melanogaster maintained under fluctuating, disruptive, and stabilizing selection for more than 20 generations. Patterns of variation in wing size, which was not a direct target of selection, were also analyzed. Disruptive selection dramatically increased phenotypic variation in the two shape characters, but left phenotypic variation in wing size unaltered. Fluctuating and stabilizing selection consistently decreased phenotypic variation in all traits. In contrast, within-individual variation, measured by the level of fluctuating asymmetry, increased for all traits under all selection regimes. These results suggest that canalization and developmental stability are evolvable and presumably controlled by different underlying genetic mechanisms, but the evolutionary responses are not consistent with an adaptive response to selection on variation. Selection also affected patterns of directional asymmetry, although inconsistently across traits and treatments. KEY WORDS: Canalization, directional asymmetry, disruptive selection, Drosophila melanogaster , fluctuating asymmetry, fluctu- ating selection, stabilizing selection, variational properties. Phenotypic variation and the relative contribution of its different components vary enormously across populations and characters (Houle 1998). Traditionally, attempts at explaining this diversity have focused on patterns of selection and levels of mutation. More recent work has investigated the possibility that variational poten- tial itself may be an evolvable character. This work stemmed from Wagner and Altenberg’s (1996) conceptual distinction between variation and variability, where the latter refers to variational po- tential, that is, the ability to vary. Population variation has both genetic and environmental components. These are affected by the organism’s capacity to respond to or regulate the effects of various internal (genetic) or external (environmental) differences. Genetic variation is caused by genotypic differences among individuals. Environmental variation is caused by exposure to different macro- or microenvironments, as well as stochastic perturbations during the development that results in developmental noise (Nijhout and Davidowitz 2003). Organisms may differ in their response to ge- netic or environmental differences, some being relatively robust and able to produce similar phenotypes in the face of genetic (mutational) or environmental changes, and others being more 1912 C 2010 The Author(s). Journal compilation C 2010 The Society for the Study of Evolution. Evolution 64-7: 1912–1925
Transcript of EVOLUTION OF VARIATION AND VARIABILITY UNDER FLUCTUATING, STABILIZING, AND DISRUPTIVE SELECTION

ORIGINAL ARTICLE
doi:10.1111/j.1558-5646.2010.00979.x
EVOLUTION OF VARIATION AND VARIABILITYUNDER FLUCTUATING, STABILIZING, ANDDISRUPTIVE SELECTIONChristophe Pelabon,1,2 Thomas F. Hansen,3,4 Ashley J. R. Carter,3,5 and David Houle3
1Department of Biology, Center for Conservation Biology, Norwegian University of Science and Technology, 7491
Trondheim, Norway2E-mail: [email protected]
3Department of Biological Science, Florida State University, Tallahassee, Florida 323064CEES, Department of Biology, University of Oslo, PO Box 1066, 0316 Oslo, Norway5Department of Biological Sciences, California State University, Long Beach, California 90840
Received September 16, 2009
Accepted February 3, 2010
How variation and variability (the capacity to vary) may respond to selection remain open questions. Indeed, effects of different
selection regimes on variational properties, such as canalization and developmental stability are under debate. We analyzed the
patterns of among- and within-individual variation in two wing-shape characters in populations of Drosophila melanogaster
maintained under fluctuating, disruptive, and stabilizing selection for more than 20 generations. Patterns of variation in wing size,
which was not a direct target of selection, were also analyzed. Disruptive selection dramatically increased phenotypic variation in
the two shape characters, but left phenotypic variation in wing size unaltered. Fluctuating and stabilizing selection consistently
decreased phenotypic variation in all traits. In contrast, within-individual variation, measured by the level of fluctuating asymmetry,
increased for all traits under all selection regimes. These results suggest that canalization and developmental stability are evolvable
and presumably controlled by different underlying genetic mechanisms, but the evolutionary responses are not consistent with
an adaptive response to selection on variation. Selection also affected patterns of directional asymmetry, although inconsistently
across traits and treatments.
KEY WORDS: Canalization, directional asymmetry, disruptive selection, Drosophila melanogaster, fluctuating asymmetry, fluctu-
ating selection, stabilizing selection, variational properties.
Phenotypic variation and the relative contribution of its different
components vary enormously across populations and characters
(Houle 1998). Traditionally, attempts at explaining this diversity
have focused on patterns of selection and levels of mutation. More
recent work has investigated the possibility that variational poten-
tial itself may be an evolvable character. This work stemmed from
Wagner and Altenberg’s (1996) conceptual distinction between
variation and variability, where the latter refers to variational po-
tential, that is, the ability to vary. Population variation has both
genetic and environmental components. These are affected by the
organism’s capacity to respond to or regulate the effects of various
internal (genetic) or external (environmental) differences. Genetic
variation is caused by genotypic differences among individuals.
Environmental variation is caused by exposure to different macro-
or microenvironments, as well as stochastic perturbations during
the development that results in developmental noise (Nijhout and
Davidowitz 2003). Organisms may differ in their response to ge-
netic or environmental differences, some being relatively robust
and able to produce similar phenotypes in the face of genetic
(mutational) or environmental changes, and others being more
1 9 1 2C© 2010 The Author(s). Journal compilation C© 2010 The Society for the Study of Evolution.Evolution 64-7: 1912–1925

EVOLUTION OF VARIATIONAL PROPERTIES
sensitive, or perhaps plastic, in their responses. The variability of
an organism or genotype is thus determined by its sensitivity or ca-
pability to respond to genetic and environmental differences. Tra-
ditionally, the buffering of genetic and environmental differences
between individuals have been referred to as genetic and environ-
mental canalization, respectively (Wagner et al. 1997; Flatt 2005),
whereas mechanisms buffering against stochastic perturbations of
individual development have been referred to as developmental
stability (Waddington 1957; Debat and David 2001; Klingenberg
2003). Individual and population differences in developmental
stability and canalization suggest that these properties may be
quite evolvable. Although selection acts on the realized variation,
it is unclear how efficiently it can act on the variational potential,
and the relationship between selection on variation and selection
on variability is far from simple (Hansen 2006).
The direct effect of selection on variation depends on the
convexity of the fitness function (Layzer 1980). Concave fitness
functions (negative second derivatives) reduce variance, whereas
convex fitness functions (positive second derivatives) increase
variance over an episode of selection. Thus, variance is expected
to decrease under stabilizing selection and increase under dis-
ruptive selection. The direct effect of linear directional selection
on variance depends on the skew of the trait distribution (e.g.,
Burger 1991; Hansen 1992), but with polygenic traits where near-
Gaussian distributions are generated by recombination, we do not
expect strong selection on variance. It has recently been shown,
however, that rapid changes of additive genetic variance can oc-
cur under linear selection in the presence of directional epistasis,
that is, when genes systematically modify each other in particular
directions in the morphospace; positive directional epistasis leads
to an increase in additive variance, whereas negative directional
epistasis leads to canalization (Hansen and Wagner 2001; Carter
et al. 2005; Hansen et al. 2006a). Prolonged directional selection
is, however, unlikely to be common in nature, and it is unclear
what general effects fluctuating directional selection may have
on genetic variance components (but see Burger 1999; Kawecki
2000; Jones et al. 2004, 2007; Draghi and Wagner 2008 for some
results from specific models). The short-term response of genetic
variance to stabilizing selection is also complicated and depends
strongly on many different aspects of genetic architecture (e.g.,
Barton and Turelli 1987; Turelli and Barton 1990; Burger 1991,
2000; Wagner et al. 1997; Hermisson et al. 2003). Over longer
time scales, epistatic genetic architectures may have a tendency
to evolve a degree of genetic canalization under stabilizing selec-
tion (Hermisson et al. 2003; Alvarez-Castro et al. 2009), but it is
unclear whether this can have significant effects on shorter time
scales or in the face of unavoidable indirect selection pressures.
Similarly, theoretical analyses agree that disruptive selection may
lead to an initial increase in genetic variance, and may eventually
lead to bimodal distributions and lineage splitting (e.g., Bulmer
1971, 1980; Sorensen and Hill 1983; Burger 2002; Gavrilets 2004;
Spichtig and Kawecki 2004; Kopp and Hermisson 2006), but the
effects of disruptive selection on genetic canalization are largely
unknown. The evolution of the environmental components of vari-
ance under selection for variation is even less well understood, but
Zhang and Hill (2005; Zhang 2005) found a tendency for the evo-
lution of environmental canalization under stabilizing selection
and a tendency for the evolution of environmental decanalization
under fluctuating selection.
There are several problems with the idea that variational
properties can be selected as adaptations. One is that selection for
variational properties is most often a weak second-order effect
(Proulx and Phillips 2005), susceptible to being overshadowed by
indirect selection (Hansen 2010) or genetic drift (Lynch 2007).
The question also remains whether variational properties are suf-
ficiently evolvable to respond to whatever selection pressures
they encounter. For example, it is generally thought that genetic
canalization is not evolvable under an additive genetic architec-
ture (e.g., Flatt 2005; but see Hansen 2003, 2010 for a proposed
mechanism based on “heritable allelic effects”). With epistasis,
several studies have found that a degree of genetic canalization
can evolve under stabilizing selection, but that this is a relatively
weak and slow process sensitive to the genetic architecture and
strength of selection (Wagner et al. 1997; Hermisson et al. 2003;
Alvarez-Castro et al. 2009). The most likely mechanism for the
evolution of genetic canalization may in fact be as an indirect
effect of selection for environmental canalization (Gavrilets and
Hastings 1994; Wagner et al. 1997; de Visser et al. 2003; Rifkin
et al. 2005). Empirically, much effort has been devoted to studying
the evolvability of developmental stability. Most of these studies
have found that fluctuating asymmetry has low additive genetic
variation, but whether this translates into a similar low evolvabil-
ity of developmental stability is less clear (Van Dongen and Lens
2000; Santos 2002; Fuller and Houle 2003; Pelabon et al. 2004a;
Leamy et al. 2005; Leamy and Klingenberg 2005).
Although the theoretical results paint a complex picture of
the evolution of variational properties under different selective
regimes, we can identify some general hypotheses that can be
tested against data by answering the following questions: (1) Can
variational properties be changed within the time scale of a se-
lection experiment, and if these changes occur, are they pre-
dictable from the expected effects of selection on variation?
(2) Alternatively, are canalization and developmental stability
generally optimized under natural selection, so that we may
expect decanalization and increased developmental noise under
most artificial-selection regimes? (3) Are the variational prop-
erties of genetic, environmental, and individual developmental
components concordant? Indeed, although developmental stabil-
ity and canalization should be similarly affected by selection on
variation, it is unknown whether the underlying bases of these
EVOLUTION JULY 2010 1 9 1 3

CHRISTOPHE PELABON ET AL.
variational properties are distinct. Although several authors have
proposed that canalization and developmental stability may be in-
fluenced by common buffering mechanisms (Klingenberg 2003;
Flatt 2005), empirical data are highly inconsistent; some stud-
ies support the idea of common regulatory mechanisms (Clarke
1998; Klingenberg and McIntyre 1998; Hallgrımsson et al. 2002;
Willmore et al. 2005; Breuker et al. 2006), but others reject this
hypothesis (Debat et al. 2000; Hoffmann and Woods 2001; Reale
and Roff 2003; Pelabon et al. 2004b; Debat et al. 2006, 2009).
To test these hypotheses, we analyzed data from artificial-
selection experiments that exposed Drosophila melanogaster pop-
ulations to more than 20 generations of stabilizing, fluctuating,
and disruptive selection on individual differences in a wing shape
index. Selection was performed on an index derived from two
traits corresponding to the relative position of wing veins. We
compared the effects of the different selection regimes on the
within-individual variance (phenotypic expression of develop-
mental stability) estimated by the level of fluctuating asymmetry
and on the among-individual variance (combination of standing
genetic variation and genetic and environmental canalization) for
the two traits composing the selection index and for wing size,
which was not directly selected. We also analyzed the effects
of the different selection regimes on directional asymmetry. Al-
though directional asymmetry in shape and size are widespread
in insect wings (Pelabon and Hansen 2008), its short-term evolv-
ability is unknown. Indeed, despite the absence of response to
selection on directional asymmetry (Maynard-Smith and Sondhi
1960; Coyne 1987; Carter et al. 2009), we have previously found
that directional asymmetry can respond indirectly to selection on
wing shape (Pelabon et al. 2006), and Rego et al. (2006) demon-
strated a considerable potential for genetic variation in directional
asymmetry in interspecific hybrids. We therefore tested if the se-
lection regimes applied here had similar effects on directional
asymmetry in wing size and shape.
Material and MethodsSELECTION PROCEDURE
We used two different base populations for the selection exper-
iments. The IV population descended from about 200 flies col-
lected by P. T. Ives in Amherst, Massachusetts in 1975. These
flies have been maintained by B. Charlesworth (1976–1992) and
D. Houle (1992 onwards) since that time in laboratory conditions
under a 12:12 L:D cycle at 25◦C in bottles with transfers every
14 days (see Houle and Rowe 2003 for more details about this
line). The LHM population descends from 400 flies collected
by L. Harshman in central California in 1991. In 1995, 2000 of
these flies were used to found a subpopulation maintained by
W. R. Rice until it was obtained by the Houle lab shortly before
initiating the selection experiments in 2004. During the selec-
tion experiment flies were reared at 25◦C in plastic shell vials
(95 mm height, 25 mm diameter) containing corn-meal, sucrose,
dead-yeast medium without the addition of live yeast.
To perform selection on the shape of the wing, we measured
wings from live flies using an automated image-analysis system
(WINGMACHINE, Houle et al. 2003). Each wing was immo-
bilized between a slide and a cover slip using a simple suction
device, the wing grabber (see Fig. 1 in Houle et al. 2003). A digital
image of the wing was then recorded using a macroscope. Cubic
B-splines (Lu and Milios 1994) were fitted to the vein structure
distal to a line defined by user-supplied landmarks (dashed line
Fig. 1) (Houle et al. 2003). For the analysis of the asymmetry
Figure 1. Representation of the wing of Drosophila melanogaster with the reference numbers of the different landmarks used in this
analysis (landmarks 0 and 13–16 are not used in the analysis). The effects of the selection on the position of the veins are represented by
the arrows (decreasing index: black arrows; increasing index: grey arrows). Black dots along the vein III represent the evenly distributed
reference points where the distance between the vein III and IV is calculated to estimate the first trait composing the selection index (see
text for details).
1 9 1 4 EVOLUTION JULY 2010

EVOLUTION OF VARIATIONAL PROPERTIES
patterns, we imaged both left and right wings, reversed the right
image, and used the same B-spline model to fit both images.
Selection was performed on an index derived from two traits
defined from the fitted spline models. For logistic reason, only the
left wing was photographed and measured during the selection
process. Therefore, selection was performed on measurements
taken from the left wing only. The first trait, I1 measured the
distance between veins III and IV, defined as
I1 = average distance between veins III and IV√total wing area
.
The average distance was calculated by taking 10 evenly
spaced points along vein III distal to the anterior cross-vein (be-
tween landmark 3 and 10, shown as black dots in Fig. 1). We
calculated the distances from each of these 10 points to the clos-
est point on vein IV, averaged these 10 distances, and standardized
for wing size by dividing by the square root of the area enclosed
by the outer spline function. The second trait, I2, measured the
relative position of the posterior cross-vein, defined as
I2 = (d[15, 8]/d[15, 2] + d[16, 7]/d[16, 1])/2,
where d[a, b] is the linear distance between the landmarks a and
b. The standard deviation of trait I1 was initially 2.6 times smaller
than that of I2. To perform selection of equal strength on the two
traits, the selection index was a weighted sum of the two traits I =2.6 × I1 + I2. By the time of the measurements, the average ratio
(±standard error) between the standard deviation of the two traits
in each selection treatment was: Control: 2.65 ± 0.18; Disruptive:
2.54 ± 0.37; Fluctuating: 2.42 ± 0.23; Stabilizing: 2.53 ± 0.21.
Therefore, despite changes in the phenotypic variance of the two
traits (see results), the strength of selection applied on both traits
was approximately constant during the course of the experiment.
The selection lines were started early spring 2004.
In each selected line, 100 virgin flies from each gender were
measured at each generation and 25 from each gender selected as
parents of the next generation. There were five selection regimes
plus a control, each replicated twice in each of the two base
populations. The selection regimes were up, down, stabilizing,
disruptive, and fluctuating selection. In the stabilizing-selection
lines, we sorted the flies within each gender by their selection-
index score and chose 25 flies with consecutive scores such that
their average score was closest to the average value at the start of
the experiment. In the disruptive-selection lines, we chose 25 flies
of each gender from the extreme ends of the distribution in such
a ratio that their average score was closest to the starting average
value (e.g., the top 10 and lowest 15 or the top 12 and lowest 13).
Fluctuating selection was achieved by computing the mean of the
selection index for the 200 flies measured. If this value was lower
than the starting value, directional selection to increase the index
value (up selection) was performed, whereas directional selection
to decrease the index value (down selection) was performed when
the average score was above the starting value. As a result, the
direction of selection changed nearly every generation. For the
up (and down) line the 25 males and females with the highest
(or lowest) within-gender scores were selected for mating. For
the control lines, 25 individuals of each gender were haphazardly
chosen.
For mating, we placed five selected individuals of each gen-
der in five vials. In each treatment, flies were randomly assigned
to a mating vial. These parental flies were transferred to new vials
after approximately 24 h and the individuals for the next genera-
tion were collected as virgins approximately—eight to nine days
later. The effects of the two directional-selection treatments on
fluctuating and directional asymmetry have been presented else-
where (Pelabon et al. 2006); we report here the results for the
other treatments.
MEASUREMENTS AND ANALYSIS
At generation 21 for IV2 and LHM2 and generation 22 for IV1
and LHM1 (indices refer to the replicate number), we imaged
both left and right wings for about 100 female flies in each line.
In approximately half of these flies we imaged and measured both
wings a second time to estimate measurement error. Data were
registered and size-corrected using the generalized least-squares
Procrustes superimposition (Rohlf and Slice 1990). We analyzed
the effect of the different selection regimes on the variational
properties of three traits. The first trait was the average distance
between landmarks 2 and 3, and 9 and 10 (Fig. 1). This mimics, but
does not replicate, index I1, because it uses only the size-corrected
distances at the ends of the selected region, rather than all along
it. The second trait corresponded to I2, defined above. Finally,
we analyzed wing size measured by the centroid size (the square
root of the sum of squared distances from each landmark to the
centroid) based on landmarks 1–12. Wing size was not a direct
target of selection because both traits composing the selection
index were corrected for wing size.
The full model fit followed Palmer and Strobeck (1986) and
Palmer (1994) in including Side as a fixed effect to test for direc-
tional asymmetry. In this model, the Individual (random effect) ×Side interaction term estimates the variance due to fluctuating
asymmetry, whereas the error term estimates measurement error
for replicated measurements. As we also had Treatments, Popu-
lations and Replicated selection lines nested within Treatments
and Populations, the full model included: Treatment, Side and
Side × Treatment interaction as fixed effects, and Population,
Population × Treatment, Replicate within Population and Treat-
ment, Individual within Replicate, Individual × Side interaction
as random factors. Models were fitted in Proc Mixed in SAS
9.1 (SAS Institute, Cary, NC). To stabilize estimates of variance
components in Proc Mixed, all data were multiplied by 100.
EVOLUTION JULY 2010 1 9 1 5

CHRISTOPHE PELABON ET AL.
Ideally, a test for differences in trait variances among treat-
ments would be performed directly in Proc Mixed in SAS using
the group = treat option. Unfortunately, this was not possible
due to limited computation power. Therefore, we fitted separate
models to each treatment, and then compared the AIC values of
these unconstrained models with the AIC values of similar models
in which the variance parameters were constrained to equal the
estimates from the full analyses. We summed the log-likelihood
values for the constrained and unconstrained models across treat-
ments, and calculated the AIC (AIC = −2 log(likelihood) + 2p,
where p is the number of variance components following SAS
Mixed procedure).
Finally, to directly test for differences in variances, we esti-
mated the best unbiased linear predictors (BLUPs) for each level
of each random effect from the full model. To check the mea-
surement error, we calculated the residuals from the full model
for the subset of individuals that were measured twice. We then
performed Levene tests, one-way analyses of variance (ANOVAs)
on the absolute value of these BLUPs and residuals (Palmer and
Strobeck 1992) with Treatment as factor.
Fluctuating-asymmetry analyses are particularly sensitive to
outliers. We used a multistep procedure to remove potential out-
liers. First, we noted apparent outliers for centroid size and each
landmark coordinate after Procrustes alignment. The original im-
ages of wings with unusual phenotype for any of these traits were
then examined for errors, such as the wing being slightly folded
or damaged, or from a badly fitted B-spline. Those with apparent
errors were excluded from further analysis.
Second, for those flies imaged and measured twice, we fit-
ted a full mixed-model analysis of individual wings for the two
shape traits and centroid size implemented in Proc GLM. The
resulting residuals reflect the differences between wings within
replicate measurements. We performed Grubb’s test for outliers
with P = 0.01, and N = 2 × 450, the approximate sample size
of twice measured wings within each treatment. When a resid-
ual was tested as an outlier, the offending replicate was excluded
from further analysis (both wings for all traits). This resulted
in wings with residuals more than 4.3 SD from the mean being
identified as outliers. Of a total of 880 flies where both wings
were measured twice, 32 pairs of wings were dropped. A final
round of outlier removal was done at the level of individual flies.
We averaged the replicate measurements of the same wings, and
calculated the value of left–right wing for each trait. Grubb’s
test was then applied within each treatment, with the critical val-
ues calculated with P = 0.01 and N = 450. Individuals with
wing measurements > 4.05 SD from the mean were discarded.
Twelve individuals were dropped as outliers at this step. The final
dataset contained 860 individuals where each wing was mea-
sured twice and 794 individuals where both wings were measured
once.
In three of four cases, the measurement variances for the two
traits under selection were the highest in the disruptive-selection
lines (Appendix S1). Although we did not observe obvious prob-
lems in the fit of the B-spline, it is possible that the particular shape
of some of the wings in the disruptive-selection lines affected this
fit, and therefore increased the measurement variance. Although
this variation in measurement error does not affect our results
because estimates of fluctuating asymmetry were corrected for
measurement variance, it underlines the importance of estimating
measurement variance in each selection line with a sufficiently
large sample size of repeated measures.
Following Hansen et al. (2006b), we calculated the relative
developmental imprecision as the part of phenotypic variation
due to developmental instability, i.e., the part of phenotypic vari-
ation due to within-individual variation measured by the fluctuat-
ing asymmetry. The developmental imprecision was obtained by
dividing the Individuals × Side variance component by the to-
tal among-individual variance component (including the within-
individual variance, in Tables 2–4).
ResultsTRAIT MEANS AND AMONG-INDIVIDUAL
PHENOTYPIC VARIANCE
As intended, neither the average wing size nor the mean of the
two shape characters were significantly affected by the different
selection treatments (Table 1; Appendix S1). Analyses of each
of the three traits showed that Selection treatment, Population,
and Population × Selection treatment means were never statis-
tically significantly different from zero when all effects were in
the model (P > 0.28 in all cases). Given the lack of Population
and Population × Selection treatment effects on the traits mean,
we chose to treat Population as a fixed effect and to drop the
Population × Selection treatment effect from further analyses.
The among-individual variance for both traits under selec-
tion was strongly affected by the selection treatment (Fig. 2A,
B, Table 2 and 3). As expected, lines under disruptive selection
displayed the highest among-individual variance, whereas lines
under fluctuating and stabilizing selection generally displayed
levels of among-individual variance lower than the control lines.
Among-individual variance in centroid size, however, tended to
decrease under stabilizing and fluctuating selection (significantly
so in the latter), but did not increase under disruptive selection
(Fig. 2C, Table 4).
In addition to the marked effects on the phenotypic variance
of the two selected traits, disruptive selection also affected the
development of the wing. In a few cases, we observed individ-
uals with anomalous wing veins (Fig. 3). Because these anoma-
lies prevented us from properly fitting the cubic B-splines and
1 9 1 6 EVOLUTION JULY 2010

EVOLUTION OF VARIATIONAL PROPERTIES
Table 1. Results of mixed-effects model analyses of variance of the two shape traits and the centroid size for the full dataset. The units
for trait 1 are the average distances between veins III and IV in centroid size units×100; the unit for trait 2 is the proportional position
of the distal cross-vein×100.
Trait 1 Trait 2 Centroid sizeSource
Variance±SE P Variance±SE P Variance±SE P
Treatment 0.90 0.86 0.79Side 0.0001 0.0001 0.0001Treatment × Side 0.014 0.37 0.042Population 0.58 0.043 0.79Replicate in Population × 12.612±5.485 0.011 39.218±17.528 0.013 17.269±7.626 0.012
TreatmentIndividual in Replicate 22.773±0.900 <0.0001 168.850±6.662 <0.0001 63.517±2.239 <0.0001Individual × Side 3.922±0.201 <0.0001 37.674±1.434 <0.0001 0.975±0.0388 <0.0001Residual 2.269±0.078 <0.0001 4.573±0.156 <0.0001 0.180±0.0062 <0.0001−2 log(�) 26,265.7 34,058.4 20,753.4AIC 26,273.7 34,066.4 20,761.4
accurately estimate the position of the landmarks, these flies were
discarded during the selection phase and unfortunately we do not
have estimates of the frequency with which these anomalies were
encountered.
FLUCTUATING ASYMMETRY AND DEVELOPMENTAL
PRECISION
The shape characters displayed an average fluctuating asymmetry
in the control lines of 2.20% ± 0.20% and 1.17% ± 0.10% of the
trait size, for the trait 1 and 2, respectively. In comparison, cen-
troid size displayed an average level of fluctuating asymmetry of
0.47% ± 0.04% (Appendix S1). Contrary to the effects on among-
individual variance, all selection treatments provoked an increase
in fluctuating asymmetry in both selected traits and in wing size
(Fig 4; Table 2–4). These increases were sometimes substantial,
with an average increase in the within-individual variance in the
disruptive-selection lines of 21%, but remained limited compared
to the 412% and 530% increase in among-individual variance
under disruptive selection in trait 1 and 2, respectively.
Changes in within- and among-individual variance among
selection treatments were inconsistent, leading to marked varia-
tion in the relative developmental imprecision of the two selected
traits (Fig. 5A, B). Because the effect of disruptive selection on
these traits was more pronounced on phenotypic variation than
on fluctuating asymmetry, the relative developmental impreci-
sion strongly decreased in the disruptive-selection lines despite
an increase in fluctuating asymmetry. Because phenotypic vari-
ation in centroid size was not affected by the different selection
treatments, the relative developmental imprecision in this trait
primarily reflected changes in fluctuating asymmetry (Fig. 5C).
DIRECTIONAL ASYMMETRY
As reported in earlier studies on asymmetry in Drosophila wings
(see Pelabon and Hansen 2008 for a review), we observed statisti-
cally significant directional asymmetry (Side effect in Tables 2–4)
of small magnitude in both wing size (centroid size) and wing
shape (traits 1 and 2). In the control lines, the distance between
veins III and IV was on average 0.64% ± 0.17% larger in the left
wing, the position of the posterior cross-vein was 0.18% ± 0.05%
more distal on the right wing, and the left wing was 0.23% ±0.04% larger than the right one.
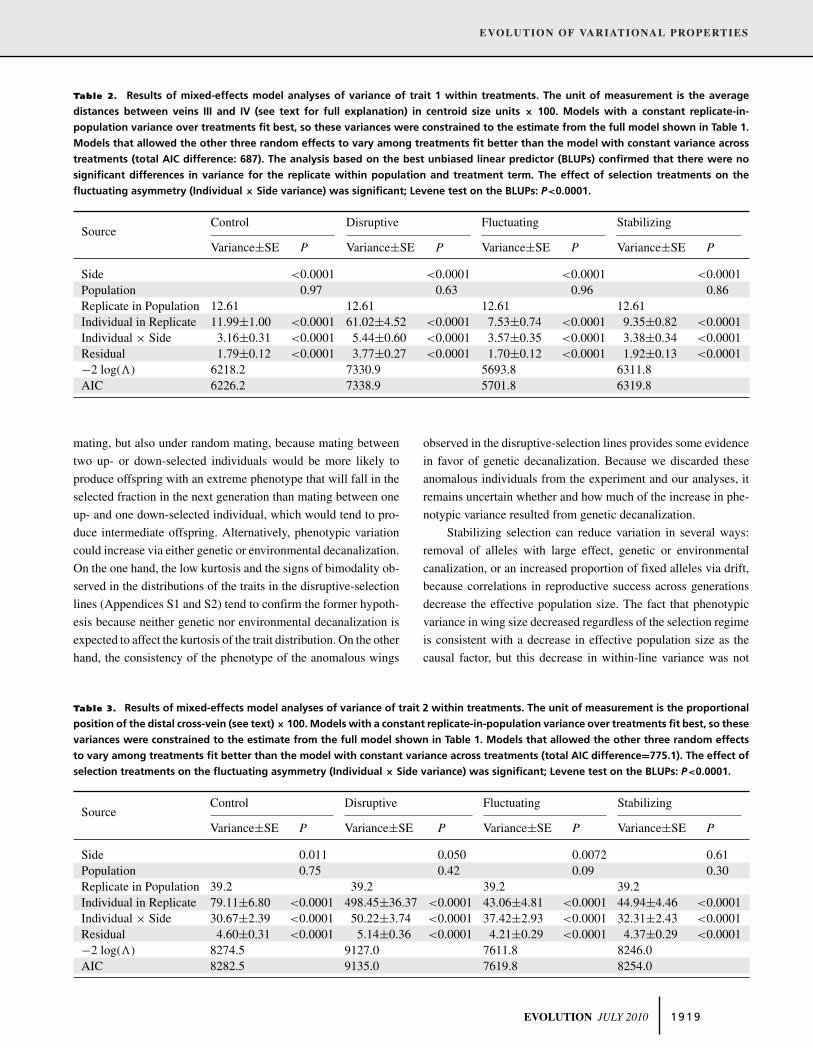
Directional asymmetries in trait 1 and centroid size were af-
fected by the selection treatments (Selection treatment × Side
effect in Table 1). The pattern of these effects, however, was id-
iosyncratic. Directional asymmetry increased in all selected lines
for trait 1 (Fig. 6A), whereas disruptive and fluctuating selection
tended to decrease directional asymmetry in wing size (Fig. 6C).
Directional asymmetry in the position of the posterior cross-vein
(trait 2) did not show large or statistically significant effects of
any selection treatment (Fig. 6B, Table 1).
DiscussionOur results from slightly more than 20 generations of disruptive,
fluctuating, or stabilizing selection on the Drosophila wing con-
form for the most part to the traditional expectations for the evolu-
tion of among-individual variation. Phenotypic variance strongly
increased under disruptive selection but decreased under fluctuat-
ing and stabilizing selection relative to the controls. The increases
in phenotypic variance in the disruptive selection lines were also
accompanied by the appearance of individuals with highly de-
viant phenotypes. Phenotypic variance in wing size, however, was
EVOLUTION JULY 2010 1 9 1 7

CHRISTOPHE PELABON ET AL.
Figure 2. Coefficients of phenotypic variation (±SE) of the trait 1
(A), trait 2 (B), and centroid size (C) for the two populations (LHM:
open symbols; IV: black symbols) in the different selection treat-
ments (replicates combined).
unaffected or modestly decreased in all selected lines. Although
this was not entirely surprising considering that wing size was not
under selection, this also supports the hypothesis that the genetic
controls of shape and size in the Drosophila wing are independent
(Gilchrist and Partridge 2001, but see Breuker et al. 2006). Ef-
fects of the different selection treatments on the within-individual
variance were, however, largely inconsistent with the expecta-
tions, because fluctuating asymmetry increased in all selection
treatments for wing size and both shape characters.
Directional asymmetry was affected by the different selec-
tion treatments, but in a rather unpredictable manner. Direc-
tional asymmetry in size and shape is widespread in insect wings
(Pelabon and Hansen 2008), and has even been considered as
adaptive (Van Valen 1962), but all direct attempts at detecting
genetic variance in this trait have failed (Maynard Smith and
Sondhi 1960; Tuinstra et al. 1990; Carter et al. 2009), indicating
a lack of evolutionary potential. This apparent lack of genetic
variation is, however, contradicted by the observations of changes
in directional asymmetry in response to selection on wing shape
(Pelabon et al. 2006; this study), by the increase in the level of
directional asymmetry in wing size observed in hybrids between
two Drosophila species (Rego et al. 2006), and the variation in
direction and magnitude of directional asymmetry in wing size ob-
served across, and even sometimes within insect species (Pelabon
and Hansen 2008).
Although these results appear contradictory, Pelabon and
Hansen (2008) found that directional asymmetry in wing size was
expressed with extremely poor developmental precision, which
implies that a genetic signal for directional asymmetry could be
swamped by developmental noise. Pelabon and Hansen (2008)
therefore suggested that this might explain the repeated failure of
directional asymmetry to respond to direct selection, because the
lack of developmental precision would make selection extremely
inefficient despite possible genetic variation in directional asym-
metry. It is still possible, however, that directional asymmetry can
evolve via a correlated response to selection if its genetic vari-
ation is correlated with genetic variation in other traits. Such a
correlated response to selection could explain the idiosyncratic
changes in directional asymmetry we and other have observed.
Using recombining populations increases the realism of the
study but limits our ability to infer the relative contribution of the
different processes that affect the among-individual phenotypic
variation and therefore our capacity to interpret the results in
terms of changes in canalization. Indeed, changes in the among-
individual variance can result from either changes in genetic
and/or environmental canalization, changes in allele frequency
due to selection or drift, or a combination of these effects. These
difficulties, however, do not extend to the effect of selection on
developmental stability because variation in the level of fluctu-
ating asymmetry in a constant environment is expected to be a
direct reflection of changes in developmental stability. Keeping
the above-mentioned limitations in mind, we now discuss our re-
sults in relation to the questions posed in the introduction about
the evolution of variational properties.
(1) Can variational properties be changed within the time
scale of a selection experiment, and if these changes occur, are
they predictable from the effects of selection on variation?
Disruptive selection is expected to maintain or even increase
genetic variation by equalizing allele frequency at polymorphic
loci (Bulmer 1971; Spichtig and Kawecki 2004). Linkage disequi-
librium may further increase genetic variance creating a bimodal
distribution of the phenotypes. This could occur under assortative
1 9 1 8 EVOLUTION JULY 2010
EVOLUTION OF VARIATIONAL PROPERTIES
Table 2. Results of mixed-effects model analyses of variance of trait 1 within treatments. The unit of measurement is the average
distances between veins III and IV (see text for full explanation) in centroid size units × 100. Models with a constant replicate-in-
population variance over treatments fit best, so these variances were constrained to the estimate from the full model shown in Table 1.
Models that allowed the other three random effects to vary among treatments fit better than the model with constant variance across
treatments (total AIC difference: 687). The analysis based on the best unbiased linear predictor (BLUPs) confirmed that there were no
significant differences in variance for the replicate within population and treatment term. The effect of selection treatments on the
fluctuating asymmetry (Individual × Side variance) was significant; Levene test on the BLUPs: P<0.0001.
Control Disruptive Fluctuating StabilizingSource
Variance±SE P Variance±SE P Variance±SE P Variance±SE P
Side <0.0001 <0.0001 <0.0001 <0.0001Population 0.97 0.63 0.96 0.86Replicate in Population 12.61 12.61 12.61 12.61Individual in Replicate 11.99±1.00 <0.0001 61.02±4.52 <0.0001 7.53±0.74 <0.0001 9.35±0.82 <0.0001Individual × Side 3.16±0.31 <0.0001 5.44±0.60 <0.0001 3.57±0.35 <0.0001 3.38±0.34 <0.0001Residual 1.79±0.12 <0.0001 3.77±0.27 <0.0001 1.70±0.12 <0.0001 1.92±0.13 <0.0001−2 log(�) 6218.2 7330.9 5693.8 6311.8AIC 6226.2 7338.9 5701.8 6319.8
mating, but also under random mating, because mating between
two up- or down-selected individuals would be more likely to
produce offspring with an extreme phenotype that will fall in the
selected fraction in the next generation than mating between one
up- and one down-selected individual, which would tend to pro-
duce intermediate offspring. Alternatively, phenotypic variation
could increase via either genetic or environmental decanalization.
On the one hand, the low kurtosis and the signs of bimodality ob-
served in the distributions of the traits in the disruptive-selection
lines (Appendices S1 and S2) tend to confirm the former hypoth-
esis because neither genetic nor environmental decanalization is
expected to affect the kurtosis of the trait distribution. On the other
hand, the consistency of the phenotype of the anomalous wings
observed in the disruptive-selection lines provides some evidence
in favor of genetic decanalization. Because we discarded these
anomalous individuals from the experiment and our analyses, it
remains uncertain whether and how much of the increase in phe-
notypic variance resulted from genetic decanalization.
Stabilizing selection can reduce variation in several ways:
removal of alleles with large effect, genetic or environmental
canalization, or an increased proportion of fixed alleles via drift,
because correlations in reproductive success across generations
decrease the effective population size. The fact that phenotypic
variance in wing size decreased regardless of the selection regime
is consistent with a decrease in effective population size as the
causal factor, but this decrease in within-line variance was not
Table 3. Results of mixed-effects model analyses of variance of trait 2 within treatments. The unit of measurement is the proportional
position of the distal cross-vein (see text) × 100. Models with a constant replicate-in-population variance over treatments fit best, so these
variances were constrained to the estimate from the full model shown in Table 1. Models that allowed the other three random effects
to vary among treatments fit better than the model with constant variance across treatments (total AIC difference=775.1). The effect of
selection treatments on the fluctuating asymmetry (Individual × Side variance) was significant; Levene test on the BLUPs: P<0.0001.
Control Disruptive Fluctuating StabilizingSource
Variance±SE P Variance±SE P Variance±SE P Variance±SE P
Side 0.011 0.050 0.0072 0.61Population 0.75 0.42 0.09 0.30Replicate in Population 39.2 39.2 39.2 39.2Individual in Replicate 79.11±6.80 <0.0001 498.45±36.37 <0.0001 43.06±4.81 <0.0001 44.94±4.46 <0.0001Individual × Side 30.67±2.39 <0.0001 50.22±3.74 <0.0001 37.42±2.93 <0.0001 32.31±2.43 <0.0001Residual 4.60±0.31 <0.0001 5.14±0.36 <0.0001 4.21±0.29 <0.0001 4.37±0.29 <0.0001−2 log(�) 8274.5 9127.0 7611.8 8246.0AIC 8282.5 9135.0 7619.8 8254.0
EVOLUTION JULY 2010 1 9 1 9

CHRISTOPHE PELABON ET AL.
Table 4. Results of mixed-effects model analyses of variance of centroid size (mm) × 100 within treatments. Models with a constant
replicate-in-population variance over treatments fit best, so these variances were constrained to the estimate from the full model shown
in Table 1. Models that allowed the other three random effects to vary among treatments fit better than the model with constant
variance across treatments (total AIC difference=60.9). The effect of selection treatments on the fluctuating asymmetry (Individual ×Side variance) was significant; Levene test on the BLUPs: P<0.0034.
Control Disruptive Fluctuating StabilizingSource
Variance±SE P Variance±SE P Variance±SE P Variance±SE P
Side <0.0001 0.0010 0.0011 <0.0001Population 0.49 0.94 0.90 0.77Replicate in Population 17.27 17.27 17.27 17.27Individual in Replicate 76.714±5.378 <0.0001 64.564±4.506 <0.0001 41.386±3.044 <0.0001 69.525±4.798 <0.0001Individual × Side 0.818±0.066 <0.0001 1.144±0.090 <0.0001 1.089±0.090 <0.0001 0.860±0.067 <0.0001Residual 0.168±0.011 <0.0001 0.196±0.014 <0.0001 0.207±0.014 <0.0001 0.153±0.010 <0.0001−2 log(�) 5217.4 5347.7 4818.9 5284.5AIC 5225.4 5355.7 4826.9 5292.5
accompanied by an increase in the among-line variance as ex-
pected under drift. Therefore, a decrease in genetic variance via
selection and/or an increase in genetic and environmental canal-
ization remain the most likely mechanisms that affected pheno-
typic variation under stabilizing selection. Scharloo et al. (1967)
also observed that the decrease in phenotypic variation under
stabilizing selection was partly caused by the decrease in the
genotype sensitivity to environmental variation (i.e., increased
environmental canalization).
Our fluctuating-selection treatment applied truncated direc-
tional selection that changed direction nearly every generation.
Over the course of the experiment this regime could have resulted
in net stabilizing selection. The effects of such a selection treat-
ment on random environmental variation (i.e., variation unrelated
to environmental cues; Bull 1987) are less predictable, however,
because intermediate genotypes with a high phenotypic variance
due to low environmental canalization or developmental stabil-
ity could have larger geometric mean fitness than more canalized
Figure 3. Example of the abnormal development of the Drosophila wing observed in the disruptive selection lines (upper panel: normal
wings; lower panel: wings with anomalous development).
1 9 2 0 EVOLUTION JULY 2010

EVOLUTION OF VARIATIONAL PROPERTIES
Figure 4. Mean (±SE) relative fluctuating asymmetry (RFA, size
standardized fluctuating asymmetry) in the trait 1 (A), trait 2 (B),
and in centroid size (C) for the two populations (LHM: open sym-
bols; IV: black symbols) in the different selection treatments. The
size standardized FA was obtained by dividing the average fluc-
tuating asymmetry (corrected for the directional asymmetry) by
the average trait size (replicates combined). RFAs are given in per-
centage of the mean trait size. Therefore, a mean RFA of 2.2% in
the trait 1 indicates that the average asymmetry between the left
and the right wings in the distance between veins III and IV equals
2.2% of the average distance between the two veins.
genotypes (Bull 1987; Simons and Johnston 2006). Following this
scenario, the decrease in phenotypic variance resulting from the
loss of extreme genotypes could be balanced by the increasing
frequency of genotypes with intermediate means, but increased
variance. Our results support this hypothesis because we observed
a simultaneous decrease in phenotypic variance and increase in
Figure 5. Developmental imprecision (±SE) of the trait 1 (A),
trait 2 (B), and centroid size (C) for the two populations (LHM: open
symbols; IV: black symbols) in the different selection treatments.
The developmental imprecision is expressed as the percentage of
phenotypic variance due to fluctuating asymmetry. It is obtained
by dividing the total among-individual variance component (in-
cluding the within-individual variance) by the individual × Side
variance component (replicates combined).
developmental instability. Nevertheless, despite the possible de-
crease in environmental canalization under fluctuating selection,
this treatment appeared more efficient at decreasing phenotypic
variation than stabilizing selection, suggesting that rapid fluctuat-
ing selection as applied here was particularly efficient at removing
alleles with larger effects.
Developmental stability was clearly affected by selection
on variation. Fluctuating asymmetry in all traits increased un-
der disruptive selection, suggesting that this selection treatment
EVOLUTION JULY 2010 1 9 2 1
CHRISTOPHE PELABON ET AL.
Figure 6. Mean (±SE) directional asymmetry expressed in per-
centage of trait size in trait 1 (A), trait 2 (B), and in centroid size (C)
for the two populations (LHM: open symbols; IV: black symbols)
in the different selection treatments (replicates combined).
negatively affects developmental stability, as expected from some
models. This result seems to confirm earlier studies by Scharloo
et al. (1967) and Thoday (1959) where disruptive selection pro-
voked an increase in both phenotypic variation and fluctuating
asymmetry. However, the increase in fluctuating asymmetry in
the disruptive-selection lines is not necessarily an adaptive re-
sponse of developmental stability to selection on variation. In-
deed, fluctuating asymmetry in wing size also increased although
no selection was applied on this character. Furthermore, stabi-
lizing selection provoked a weak but consistent increase in fluc-
tuating asymmetry. This last result is in sharp contrast with the
general expectation that stabilizing selection should decrease any
sources of phenotypic variation. It also contrasts with the results
from Scharloo et al. (1967). However, selection in Scharloo’s ex-
periment started immediately after the introduction of a mutant
allele into the reference genetic background. Although this was
justified to prevent natural selection on the mutant character, in-
troduction of the mutant allele may have disrupted developmental
stability. The subsequent increase in developmental stability may
have resulted from the reorganization of the genetic architecture
around the new allele, as observed in Lucilia cuprina (Clarke and
McKenzie 1987), and not as a response of developmental stability
to selection on variation.
(2) Are canalization and developmental stability generally
optimized under natural selection, so that we may expect decanal-
ization and increased developmental noise under most artificial-
selection regimes?
The nonadaptive changes in fluctuating asymmetry suggest
that developmental instability may be effectively optimized in the
control lines and that any changes in the genetic background re-
sulting from whatever selection regimes would lead to a decrease
in developmental stability. This hypothesis finds further support
in the asymmetrical responses that A. J. R. Carter and D. Houle
(unpubl. ms.) obtained when selecting flies from the LHM popu-
lation for an increase and a decrease in fluctuating asymmetry in
wing shape. Although lines selected for an increase in fluctuating
asymmetry showed a consistent response during the 42 genera-
tions of selection, only one of the two lines selected for a decrease
in fluctuating asymmetry showed a significant response to selec-
tion, this response being weaker than the response in the lines
selected for an increase fluctuating asymmetry. Alternatively, the
general increase in fluctuating asymmetry under selection could
be explained by a negative effect of inbreeding on developmen-
tal stability (Mitton and Grant 1984) if selected lines were more
homozygous than the control lines. This hypothesis is unlikely,
however, because the association between developmental stability
and inbreeding is generally weak even in studies where the level
of inbreeding was high (Vøllestad et al. 1999), and our selected
lines were maintained with the rather large population size.
Developmental stability was most affected by disruptive
selection in our study. Furthermore, both Thoday (1959) and
Scharloo et al. (1967) found that the negative effect of disruptive
selection on developmental stability depended on the occurrence
of disassortative mating (mating between opposite extremes).
These observations together with the often observed decrease in
developmental stability in interpopulation or interspecific hybrids
(Alibert and Auffray 2003), suggest that interactions among-loci,
that is, epistasis, may be the primary source of genetic vari-
ance in developmental stability, as suggested by Leamy et al.
(2005).
(3) Are the variational properties of genetic, environmental,
and individual developmental components concordant?
1 9 2 2 EVOLUTION JULY 2010

EVOLUTION OF VARIATIONAL PROPERTIES
Changes in among- and within-individual variance were only
congruent in the disruptive-selection lines for the selected char-
acters, although the increase in fluctuating asymmetry was much
smaller than the increase in phenotypic variance. Under stabiliz-
ing selection, where all sources of phenotypic variation should
be minimized, fluctuating asymmetry increased. Furthermore,
disruptive selection on the shape character did not affect, or
slightly decreased the among-individual variance in wing size
but increased fluctuating asymmetry. To the extent that changes
in among-individual variation reflect, at least partly, changes in
canalization, these results support the hypothesis that different
processes affect canalization and developmental stability (Debat
et al. 2000, 2006, 2009; Hoffmann and Woods 2001; Reale and
Roff 2003; Pelabon et al. 2004b).
ACKNOWLEDGMENTSThe authors would like to thank C. Evers, M. Gudarzi, A. Nafus, S.Schwinn and T. Weier, K. Chung, S. Graf, E. Kleiman, S. Brooks, K.Amrose, and J. Woechlke for selecting and imaging the different linesof Drosophila. We also thank S. Proulx and an anonymous reviewer forproviding valuable comments that improved our manuscript. This workwas supported in part by the NSF grant DEB-0344417 to DH and TFH.
LITERATURE CITEDAlibert, P., and J. C. Auffray. 2003. Genomic coadaptation, outbreeding de-
pression, and developmental stability. Pp. 116–134 in M. Polak, ed. De-velopmental Instability: causes and consequences. Oxford Univ. Press,Oxford, UK.
Alvarez-Castro, J. M., M. Kopp, and J. Hermisson. 2009. Effects of epistasisand the evolution of genetic architecture: exact results for a 2-locusmodel. Theor. Pop. Biol. 75:109–122.
Barton, N. H., and M. Turelli. 1987. Adaptive landscapes, genetic distance andthe evolution of quantitative characters. Genet. Res. Camb. 49:157–173.
Breuker C. J., J. S. Patterson, and C. P. Klingenberg. 2006. A single basis fordevelopmental buffering of Drosophila wing shape. Plos ONE, 1:e7.
Bull, J. J. 1987. Evolution of phenotypic variance. Evolution 41:303–315.Bulmer, M. G. 1971. The effect of selection on genetic variability. Am. Nat.
105:201–211.———. 1980. The mathematical theory of quantitative genetics, Clarendon,
Oxford Univ. Press, Oxford.Burger, R. 1991. Moments, cumulants, and polygenic dynamics. J. Math. Biol.
30:199–213.———. 1999. Evolution of genetic variability and the advantage of sex and
recombination in a changing environment. Genetics 153:1055–1069.———. 2000. The mathematical theory of selection, recombination, and mu-
tation. Wiley, Chichester.———. 2002. On a genetic model of intraspecific competition and stabilizing
selection. Am. Nat. 160:661–682.Carter, A. J. R., J. Hermisson, and T. F. Hansen. 2005. The role of epistatic gene
interactions in response to selection and the evolution of evolvability.Theor. Pop. Biol. 168:179–196.
Carter, A. J. R., E. Osborne, and D. Houle. 2009. Heritability of directionalasymmetry in Drosophila melanogaster. Int. J. Evol. Biol. Vol. 2009:1–7.
Clarke, G. M. 1998. The genetic basis of developmental stability. V. Inter- andintra-individual character variation. Heredity 80:562–567.
Clarke, G. M., and J. A. McKenzie. 1987. Developmental stability of in-
secticide resistant phenotypes in blowfly: a result of canalizing naturalselection. Nature 325:345–346.
Coyne, J. A. 1987. Lack of response to selection for directional asymmetry inDrosophila melanogaster. J. Hered. 78:119.
Debat, V., and P. David. 2001. Mapping phenotypes: canalization and devel-opmental plasticity. Trends Ecol. Evol. 16:555–561.
Debat, V., P. Alibert, P. David, E. Paradis, and J. C. Auffray. 2000. Indepen-dence between developmental stability and canalization in the skull ofthe house mouse. Proc. R. Soc. Lond. B 267:423–430.
Debat, V., C. C. Milton, S. Rutherford, C. P. Klingenberg, and A. A. Hoffmann.2006. Hsp90 and the quantitative variation of wing shape in Drosophilamelanogaster. Evolution 60:2529–2538.
Debat, V., A. Debelle, and I. Dworkin. 2009. Plasticity, canalization anddevelopmental stability of the Drosophila wing: joint effects of mutationand developmental temperature. Evolution 63:2864–2876.
de Visser, J. A. G. M., J. Hermisson, G. P. Wagner, L. A. Meyers, H. C.Bagheri, J. L. Blanchard, L. Chao, J. M. Cheverud, S. F. Elena, W.Fontana, et al. 2003. Evolution and detection of genetic robustness.Evolution 57:1959–1972.
Draghi, J., and G. P. Wagner. 2008. Evolution of evolvability in a develop-mental model. Evolution 62:301–315.
Flatt, T. 2005. The evolutionary genetics of canalization. Quart. Rev. Biol.80:287–316.
Fuller, R. C., and D. Houle. 2003. Inheritance of developmental instability.Pp. 157–184 in M. Polak, ed. Developmental stability: causes and con-sequences. Oxford Univ. Press, Oxford, UK.
Gavrilets, S. 2004. Fitness landscape and the origin of species. Monographs inPopulation Biology vol. 41. pp. 476. Princeton Univ. Press, Princeton.
Gavrilets, S., and A. Hastings. 1994. A quantitative-genetic model for selectionon developmental noise. Evolution 48:1478–1486.
Gilchrist, A. S., and L. Partridge. 2001. The contrating genetic architecture ofwing size and shape in Drosophila melanogaster. Heredity 86:144–152.
Hallgrımsson, B., K. Willmore, and B. K. Hall. 2002. Canalization, develop-mental stability, and morphological integration in primate limbs. Year.Phys. Anthropol. 45:131–158.
Hansen, T. F. 1992. Selection in asexual populations: an extension of thefundamental theorem. J. Theor. Biol. 155:537–544.
———. 2003. Is modularity necessary for evolvability? Remarks on the rela-tionship between pleiotropy and evolvability. Biosystems 69:83–94.
———. 2006. The evolution of genetic architecture. Ann. Rev. Ecol. Evol.Syst. 37:123–157.
———. 2010. Epigenetics: adaptation or contingency? In B. Hallgrımssonand B. K. Hall, eds. Epigenetics: linking genotype and phenotype indevelopment and evolution. California Univ. press. In press.
Hansen, T. F., and G. P. Wagner. 2001. Modeling genetic architecture: amultilinear theory of gene interaction. Theor. Pop. Biol. 59:61–86.
Hansen, T. F., J. M. Alvarez-Castro, A. J. R. Carter, J. Hermisson, and G.P. Wagner. 2006a. Evolution of genetic architecture under directionalselection. Evolution 60:1523–1536.
Hansen, T. F., A. J. R. Carter, and C. Pelabon. 2006b. On adaptive accuracyand precision in natural populations. Am. Nat. 168:168–181.
Hermisson, J., T. F. Hansen, and G. P. Wagner. 2003. Epistasis in polygenictraits and the evolution of genetic architecture under stabilizing selection.Am. Nat. 161:708–734.
Hoffmann, A. A., and R. Woods. 2001. Trait variability and stress: canaliza-tion, developmental stability and the need for a broad approach. Ecol.Lett. 4:97–101.
Houle, D. 1998. How should we explain variation in the genetic variance oftraits? Genetica 102:241–253.
Houle, D., and L. Rowe. 2003. Natural selection in a bottle. Am. Nat. 161:50–67.
EVOLUTION JULY 2010 1 9 2 3

CHRISTOPHE PELABON ET AL.
Houle, D., J. Mezey, P. Galpern, and A. J. R. Carter. 2003. Automated mea-surement of Drosophila wings. BMC Evol. Biol. 3:25.
Jones, A. G., S. J. Arnold, and R. Burger. 2004. Evolution and stability of theG-matrix on a landscape with a moving optimum. Evolution 58:1639–1654.
———. 2007. The mutation matrix and the evolution of evolvability. Evolu-tion 61:727–745.
Kawecki, T. J. 2000. The evolution of genetic canalization under fluctuatingselection. Evolution 54:1–12.
Klingenberg, C. P. 2003. A developmental perspective on developmental insta-bility: theory, models and mechanisms. Pp. 14–34 in M. Polak, ed. De-velopmental instability: causes and consequences. Oxford Univ. Press,Oxford, UK.
Klingenberg, C. P., and G. S. McIntyre. 1998. Geometric morphometrics ofdevelopmental instability: analyzing patterns of fluctuating asymmetrywith Procrustes methods. Evolution 52:1363–1375.
Kopp, M., and J. Hermisson. 2006. The evolution of genetic architecture underfrequency-dependent disruptive selection. Evolution 60:1537–1550.
Layzer, D. 1980. Genetic variation and progressive evolution. Am. Nat.115:809–826.
Leamy, L. J., and C. P. Klingenberg. 2005. The genetics and evolution offluctuating asymmetry. Ann. Rev. Ecol. Evol. Syst. 36:1–21.
Leamy, L. J., M. S. Workman, E. J. Routman, and J. M. Cheverud. 2005. Anepistatic genetic basis for fluctuating asymmetry of tooth size and shapein mice. Heredity 94:316–325.
Lu, F., and E. E. Milios. 1994. Optimal spline fitting to planar shape. SignalProcess 37:129–140.
Lynch, M. 2007. The origins of genome architecture. Sinauer.Maynard Smith, J., and K. C. Sondhi. 1960. The genetics of a pattern. Genetics
45:1039–1050.Mitton, J. B., and M. C. Grant. 1984. Association among protein heterozygos-
ity, growth rate, and developmental homeostasis. Ann. Rev. Ecol. Syst.15:479–499.
Nijhout, H. F., and G. Davidowitz. 2003. Developmental perspectives onphenotypic variation, canalization, and fluctuating asymmetry. Pp. 3–13 in M. Polak, ed. Developmental stability: causes and consequences.Oxford Univ. Press, Oxford, UK.
Palmer, A. R. 1994. Fluctuating asymmetry analyses: a primer. Pp. 335–364 in
T. A. Markow, ed. Development instability: its origins and evolutionaryimplications. Kluver Academic Publishers, Dordrecht.
Palmer, A. R., and C. Strobeck. 1986. Fluctuating asymmetry: measurement,analysis, pattern. Ann. Rev. Ecol. Syst. 17:391–421.
———-. 1992. Fluctuating asymmetry as a measure of developmental sta-bility: implications of non-normal distributions and power of statisticaltest. Acta Zool. Fenn. 191:55–70.
Pelabon, C., T. F. Hansen, M. L. Carlson, and W. S. Armbruster. 2004a. Varia-tional and genetic properties of developmental stability in Dalechampia
scandens. Evolution 58:504–514.Pelabon, C., M. L. Carlson, T. F. Hansen, N. G. Yoccoz, and W. S. Armbruster.
2004b. Consequences of inter-population crosses on developmental sta-bility and canalization of floral traits in Dalechampia scandens (Euphor-biaceae). J. Evol. Biol. 17:19–32.
Pelabon, C., T. F. Hansen, A. J. R. Carter, and D. Houle. 2006. Responseof fluctuating and directional asymmetry to selection on wing shape inDrosophila melanogaster. J. Evol. Biol. 19:764–776.
Pelabon, C, and T. F. Hansen. 2008. On the adaptive accuracy of subtledirectional asymmetry in insect wing size. Evolution 62:2855–2867.
Proulx, S. R., and P. C. Phillips. 2005. The opportunity for canalization andthe evolution of genetic networks. Am. Nat. 165:147–162.
Reale, D., and D. A. Roff. 2003. Inbreeding, developmental stability, andcanalization in the sand cricket Gryllus firmus. Evolution 57:597–605.
Rego, C., M. Matos, and M. Santos. 2006. Symmetry breaking in interspecificDrosophila hybrids is not due to developmental noise. Evolution 60:746–761.
Rifkin, S. A., D. Houle, J. Kim, and K. P. White. 2005. A mutation accu-mulation assay reveals a broad capacity for rapid evolution of geneexpression. Nature 438:220–223.
Rohlf, F. J., and D. Slice. 1990. Extensions of the Procrustes method for theoptimal superimposition of landmarks. Syst. Zool. 39:40–59.
Santos, M. 2002. Genetics of wing asymmetry in Drosophila buzzatii. J. Evol.Biol. 15:720–734.
Scharloo, W., M. S. Hoogmoed, and A. Ter Kuile. 1967. Stabilizing and dis-ruptive selection on a mutant character in Drosophila. I. The phenotypicvariance and its components. Genetics 56:709–726.
Simons, A. M., and M. O. Johnston. 2006. Environmental and genetic sourcesof diversification in the timing of seed germination: implications for theevolution of bet hedging. Evolution 60:2280–2292.
Sorensen, D. A., and W. G. Hill. 1983. Effects of disruptive selection ongenetic variance. Theor. Appl. Genet. 65:173–180.
Spichtig, M., and T. J. Kawecki. 2004. The maintenance (or not) of polygenicvariation by soft selection in heterogeneous environments. Am. Nat.164:70–84.
Thoday, J. M. 1959. Effects of disruptive selection. I. Genetic flexibility.Heredity 13:187–203.
Tuinstra, E. J., G. De Jong, and W. Scharloo. 1990. Lack of response to familyselection for directional asymmetry in Drosophila melanogaster – leftand right are not distinguished in development. Proc. R. Soc. Lond. B241:146–152.
Turelli, M., and N. H. Barton. 1990. Dynamics of polygenic characters underselection. Theor. Pop. Biol. 38:1–57.
Van Dongen, S., and L. Lens. 2000. The evolutionary potential of develop-mental instability. J. Evol. Biol. 13:326–335.
Van Valen, L. 1962. A study of fluctuating asymmetry. Evolution 16:125–142.Vøllestad, L. A., K. Hindar, and A. P. Møller. 1999. A meta-analysis of
fluctuating asymmetry in relation to heterozygosity. Heredity 83:206–218.
Waddington, C. H. 1957. The strategy of the genes. MacMillan Co., NewYork.
Wagner, G. P., and L. Altenberg. 1996. Complex adaptations and the evolutionof evolvability. Evolution 50:967–976.
Wagner, G. P., G. Booth, and H. Bagheri-Chaichian. 1997. A populationgenetic theory of canalization. Evolution 51:329–347.
Willmore, K. E., C. P. Klingenberg, and B. Hallgrımsson. 2005. The rela-tionship between fluctuating asymmetry and environmental variance inRhesus macaque skulls. Evolution 59:898–909.
Zhang, X. Z. 2005. Evolution and maintenance of the environmental compo-nent of the phenotypic variance: benefit of plastic traits under changingenvironments. Am. Nat. 166:569–580.
Zhang, X. Z., and W. G. Hill. 2005. Evolution of the environmental com-ponent of the phenotypic variance: stabilizing selection in changingenvironments and the cost of homogeneity. Evolution 59:1237–1244.
Associate Editor: J. Wolf
1 9 2 4 EVOLUTION JULY 2010

EVOLUTION OF VARIATIONAL PROPERTIES
Supporting InformationThe following supporting information is available for this article:
Appendix S1. Means and variance components for the three traits for each population in each selection treatment.
Appendix S2. Distribution of the phenotypic values for the traits under selection.
Supporting Information may be found in the online version of this article.
Please note: Wiley-Blackwell is not responsible for the content or functionality of any supporting information supplied by the
authors. Any queries (other than missing material) should be directed to the corresponding author for the article.
EVOLUTION JULY 2010 1 9 2 5