Transgenes monitoring in an industrial soybean processing chain by DNA-based conventional approaches...
7
Analytical Methods Transgenes monitoring in an industrial soybean processing chain by DNA-based conventional approaches and biosensors Patrizia Bogani a , Maria Minunni b, * , Maria M. Spiriti a , Michele Zavaglia b , Sara Tombelli b , Marcello Buiatti a , Marco Mascini b a Dipartimento di Biologia Evoluzionistica ‘‘Leo Pardi”., Università degli Studi di Firenze, Via Romana 17-19, Firenze, Italy b Dipartimento di Chimica, Università degli Studi di Firenze, Polo Scientifico, Via della Lastruccia 3, 50019 Sesto F.No., Firenze, Italy article info Article history: Received 26 March 2008 Received in revised form 10 July 2008 Accepted 19 July 2008 Keywords: Roundup Ready Ò soybean Food processing chain PCR Piezoelectric biosensor GMO traceability abstract The development of analytical methods for genetically modified organisms (GMO) screening is of great interest. In particular, since even highly processed GMO-derived food products are covered by new Euro- pean legislations, a great effort has been devoted to the application of the analytical tests to these prod- ucts. This work describes a polymerase chain reaction-based qualitative screening assay and a biosensor- based approach to detect transgenes in a Roundup Ready Ò soybean processing line. Roundup Ready Ò soy- bean was specifically analyzed in eight types of processed materials – seeds, crushed seeds, expander, crude flour, proteic flour, crude oil, degummed oil and lecithin – all derived from the same initial source and produced during the manufacturing process. Specific combinations of primers were used to differen- tiate sequences from the whole insert. The amplification of ‘‘marker” fragments with a maximum length of 500 bp was successfully achieved both in raw material (seeds) and in partially (crushed seeds, crude and proteic flours) and highly (crude and degummed oils and fluid lecithin) processed materials. Moreover, the extraction procedure was optimised and the polymerase chain reaction-electrophoresis analysis has been implemented by a biosensor-based approach. Ó 2008 Elsevier Ltd. All rights reserved. 1. Introduction In recent years a great effort has been devoted to the develop- ment of new methods for the qualitative and quantitative detec- tion of transgenic sequences in food. The European Union (EU) has elaborated a legislation for genetically modified (GM) food control, which establishes both the legal basis for the approval pro- cedure of GMOs and the post market traceability and labelling requirements for GMOs and GMO-derived food and feeds (Euro- pean Commission, 2003a, 2003b). Most of the developed analytical methods for GMO detection are DNA-based, since protein-based assays are not suitable for processed food. Polymerase chain reaction (PCR) and real time PCR-based methods have been generally accepted for regulatory compliance. They are widely used to amplify target DNA fragments corresponding to marker genes, promoter and terminator se- quences, or to transgene-host integration junctions (Ahmed, 2002; Anklam, Gadani, Heinze, Pijnenburg, & van den Eede, 2002; Corbisier et al., 2007; Miraglia et al., 2004; Rodriguez-Lazaro et al., 2007). Beyond end-point and real-time PCR, several innovative, fast and reproducible methods have been recently developed for the identi- fication of different GMO events (Bordoni, Germini, Mezzelani, Marchelli, & De Bellis, 2005; Germini et al., 2005; Kim, Chae, Chang, & Kang, 2005; Peano et al., 2005; Rossi et al. 2007; Xu et al., 2006). Among these, DNA biosensors based on several transduction princi- ples (Gambari & Feriotto, 2006; Giakoumaki et al., 2003; Kalogianni, Koraki, Christopoulos, & Ioannou, 2006; Leimanis et al., 2006; Mannelli, Minunni, Tombelli, & Mascini, 2003; Minunni et al., 2005; Passamano & Pighini, 2006) are methods able to detect target sequences in complex media and in real time. The official methods for the detection of GMO events in food and the quantification of material deriving from authorised trans- genic crops are provided by the European Commission reference laboratory, but when dealing with surveillance testing of GMOs in highly processed food, researchers must face with major analyt- ical challenges. Moreover, since each food and each processing phase contribute to a unique environment, more data on the kinet- ics of DNA degradation and amplificability along the whole indi- vidual food processing chain are necessary. The traceability of transgenes in processed food has been stud- ied by selecting different set of primers to amplify regions of the endogenous genes varying in length (Germini et al., 2005) co- amplifying, as internal control, also a specie-specific housekeeping 0308-8146/$ - see front matter Ó 2008 Elsevier Ltd. All rights reserved. doi:10.1016/j.foodchem.2008.07.056 * Corresponding author. Tel.: +39 0554573314; fax: +39 0554573384. E-mail address: maria.minunni@unifi.it (M. Minunni). Food Chemistry 113 (2009) 658–664 Contents lists available at ScienceDirect Food Chemistry journal homepage: www.elsevier.com/locate/foodchem
Transcript of Transgenes monitoring in an industrial soybean processing chain by DNA-based conventional approaches...

Food Chemistry 113 (2009) 658–664
Contents lists available at ScienceDirect
Food Chemistry
journal homepage: www.elsevier .com/locate / foodchem
Analytical Methods
Transgenes monitoring in an industrial soybean processing chainby DNA-based conventional approaches and biosensors
Patrizia Bogani a, Maria Minunni b,*, Maria M. Spiriti a, Michele Zavaglia b, Sara Tombelli b,Marcello Buiatti a, Marco Mascini b
a Dipartimento di Biologia Evoluzionistica ‘‘Leo Pardi”., Università degli Studi di Firenze, Via Romana 17-19, Firenze, Italyb Dipartimento di Chimica, Università degli Studi di Firenze, Polo Scientifico, Via della Lastruccia 3, 50019 Sesto F.No., Firenze, Italy
a r t i c l e i n f o
Article history:Received 26 March 2008Received in revised form 10 July 2008Accepted 19 July 2008
Keywords:Roundup Ready� soybeanFood processing chainPCRPiezoelectric biosensorGMO traceability
0308-8146/$ - see front matter � 2008 Elsevier Ltd. Adoi:10.1016/j.foodchem.2008.07.056
* Corresponding author. Tel.: +39 0554573314; faxE-mail address: [email protected] (M. Minun
a b s t r a c t
The development of analytical methods for genetically modified organisms (GMO) screening is of greatinterest. In particular, since even highly processed GMO-derived food products are covered by new Euro-pean legislations, a great effort has been devoted to the application of the analytical tests to these prod-ucts.
This work describes a polymerase chain reaction-based qualitative screening assay and a biosensor-based approach to detect transgenes in a Roundup Ready� soybean processing line. Roundup Ready� soy-bean was specifically analyzed in eight types of processed materials – seeds, crushed seeds, expander,crude flour, proteic flour, crude oil, degummed oil and lecithin – all derived from the same initial sourceand produced during the manufacturing process. Specific combinations of primers were used to differen-tiate sequences from the whole insert. The amplification of ‘‘marker” fragments with a maximum lengthof 500 bp was successfully achieved both in raw material (seeds) and in partially (crushed seeds, crudeand proteic flours) and highly (crude and degummed oils and fluid lecithin) processed materials.Moreover, the extraction procedure was optimised and the polymerase chain reaction-electrophoresisanalysis has been implemented by a biosensor-based approach.
� 2008 Elsevier Ltd. All rights reserved.
1. Introduction
In recent years a great effort has been devoted to the develop-ment of new methods for the qualitative and quantitative detec-tion of transgenic sequences in food. The European Union (EU)has elaborated a legislation for genetically modified (GM) foodcontrol, which establishes both the legal basis for the approval pro-cedure of GMOs and the post market traceability and labellingrequirements for GMOs and GMO-derived food and feeds (Euro-pean Commission, 2003a, 2003b).
Most of the developed analytical methods for GMO detectionare DNA-based, since protein-based assays are not suitable forprocessed food. Polymerase chain reaction (PCR) and real timePCR-based methods have been generally accepted for regulatorycompliance. They are widely used to amplify target DNA fragmentscorresponding to marker genes, promoter and terminator se-quences, or to transgene-host integration junctions (Ahmed,2002; Anklam, Gadani, Heinze, Pijnenburg, & van den Eede, 2002;Corbisier et al., 2007; Miraglia et al., 2004; Rodriguez-Lazaroet al., 2007).
ll rights reserved.
: +39 0554573384.ni).
Beyond end-point and real-time PCR, several innovative, fast andreproducible methods have been recently developed for the identi-fication of different GMO events (Bordoni, Germini, Mezzelani,Marchelli, & De Bellis, 2005; Germini et al., 2005; Kim, Chae, Chang,& Kang, 2005; Peano et al., 2005; Rossi et al. 2007; Xu et al., 2006).Among these, DNA biosensors based on several transduction princi-ples (Gambari & Feriotto, 2006; Giakoumaki et al., 2003; Kalogianni,Koraki, Christopoulos, & Ioannou, 2006; Leimanis et al., 2006;Mannelli, Minunni, Tombelli, & Mascini, 2003; Minunni et al.,2005; Passamano & Pighini, 2006) are methods able to detect targetsequences in complex media and in real time.
The official methods for the detection of GMO events in foodand the quantification of material deriving from authorised trans-genic crops are provided by the European Commission referencelaboratory, but when dealing with surveillance testing of GMOsin highly processed food, researchers must face with major analyt-ical challenges. Moreover, since each food and each processingphase contribute to a unique environment, more data on the kinet-ics of DNA degradation and amplificability along the whole indi-vidual food processing chain are necessary.
The traceability of transgenes in processed food has been stud-ied by selecting different set of primers to amplify regions of theendogenous genes varying in length (Germini et al., 2005) co-amplifying, as internal control, also a specie-specific housekeeping

Fig. 2. (A) Schematic diagram of part of heterologous DNA event RR GTS-40-3-2.Arrows indicate the positions of different primers used for PCR qualitative analysis.(B) List of primers used for the PCR analysis.
P. Bogani et al. / Food Chemistry 113 (2009) 658–664 659
gene, naturally present in the genome of the analyzed species (i.e.,zein in Zea mays and lectin in Glycine max) (Meyer, Chardonnens,Hubner, & Luthy, 1996; Meyer & Jaccaud, 1997). Despite the inter-esting aspects of these studies, most of the reported work refers toraw material, such as flours or seeds, or to the final product of foodprocessing (Aarts, van Rie, & Kok, 2002; Ahmed, 2002; Di Pinto etal., 2007; Engel, Moreano, Ehlert, & Busch, 2006; Germini et al.,2005; Passamano & Pighini, 2006; Peano et al., 2005). A systematicstudy on the traceability of GM DNA along a food processing chainhas never been reported, and only laboratory model studies havebeen conducted on different processing procedures (Bauer, Weller,Hames, & Hertel, 2003).
The correct traceability of the transgenic events in food process-ing can be achieved only by monitoring target sequences duringthe whole manufacturing process, where the target analytes arefollowed from the initial source to the end product, in a systematicand controlled manner passing through a series of intermediatephases. It should be mentioned that the analysis of processed foodencounters a certain number of complications, negatively affectingthe detection of transgenes, on dependence of the consideredmatrices. Complications can be ascribed to manufacturing pro-cesses involving enzymes or chemical reactions, as well as simplemechanical procedures, such as milling, or thermal treatments.Moreover, the use of harsh conditions in the processing steps couldimpact on the integrity of genomic DNA, which represents thestarting point of the whole analysis (Moreano, Busch, & Engel,2005). It is thus of primary importance to verify the possibility toamplify (amplificability) the extracted DNA. The DNA degradationcan be caused, for example, by heating treatments (Ahmed, 2002)and exposure to pH changes (Aarts et al., 2002). Finally, anotherimportant factor which could affect the amplification step, leadingalso to false negative results should be taken into account, which is
Fig. 1. Flow chart of a soybean processing chain. The products analysed in thisstudy are highlighted with an asterisk.
the presence of different inhibitors of the enzyme Taq polymerasesuch as proteins, fats, polysaccharides, polyphenolics and othercompounds that may be present in DNA extracted from food matri-ces (Corbisier et al., 2007; Di Pinto et al., 2007; Lüthy, 1999; Peanoet al., 2005).
In this work we report for the first time the study of transgenetraceability along a complete industrial soybean processing chain.The analysed samples were collected from the different levels of anindustrial soybean processing plant working with 80% GM Round-up Ready� soybean. The genetic modification is the RoundupReady� soybean event GTS 40-3-2 (notification C/UK/94/M3/1 ofMonsanto). In particular, the analysis was conducted aiming tostudy the traceability of different parts of the inserted cassette inall the different matrices, derived from the same source, producedduring the manufacturing process (Fig. 1). For this purpose, anoptimised extraction procedure was applied and various primercouples were set for PCR amplification of the event cassette (Fig. 2).The ‘‘marker” fragment which should be followed along the soy-bean processing procedure has been identified and the electropho-retic analysis was at the end replaced by a biosensor-basedapproach. Biosensor development aims at making the analyticalapproach simpler, faster and less costly. Moreover, biosensors ex-hibit several advantages with respect to electrophoresis which isnot automatable and provides no sequence confirmation. The find-ings confirms the suitability of biosensor analysis not only for rawmaterials (Kalogianni et al., 2006; Mannelli et al., 2003; Minunniet al., 2005) but also for process control and traceability of GMcrops in industrial processing plants.
2. Materials and methods
2.1. Soybean samples
The soybean samples were kindly provided by Dr. R. Onori (Isti-tuto Superiore di Sanità, Rome, Italy). The samples were collectedfrom the different levels of an industrial soybean processing plantworking with 80% GM Roundup Ready� soybean. The genetic mod-ification is the Roundup Ready� soybean event GTS 40-3-2 (notifica-tion C/UK/94/M3/1 of Monsanto) which was developed to betolerant to the activity of glyphosate herbicide through the insertionof a gene encoding the glyphosate tolerant 5-enol-pyruvylshiki-
660 P. Bogani et al. / Food Chemistry 113 (2009) 658–664
mate-3-phosphate synthase from Agrobacterium sp. CP4 (CP4EPSPS).
The soybean processing steps along the industrial chain areillustrated in Fig. 1. The samples used in this work for the extrac-tion of DNA cover all the different stages and they consisted inseeds, crushed seeds, expander, crude flour, proteic flour, crudeoil, degummed oil and lecithin.
PCR qualitative analysis was performed by using the followingCertified Reference Materials: non-GM soybean powder and soy-bean powder containing 0.1%, 0.5%, 1%, 2% and 5% of powder pre-pared from genetically modified Roundup Ready� soybean(IRMM-410S, Fluka, Sigma–Aldrich, Milan, Italy).
2.2. DNA extraction
DNA was extracted from all the soybean samples by using a‘‘Wizard� Magnetic DNA Purification System for Food” kit, Prome-ga (Leiden, The Netherlands). The method was slightly modified toimprove the yield of the extraction from highly processed prod-ucts. One hundred milligram per sample of seeds, flours, expanderand fluid lecithin were ground in a mortar with liquid nitrogen to afine powder before their suspension in the extraction buffer. DNAextraction was then performed according to the manufacturerinstructions. With crude and degummed oils, 500 lL of the relativesample were mixed with 500 lL of chloroform instead of hexane(this latter, suggested by the manufacturer), 500 lL of extractionbuffer A (Promega kit), 250 lL of extraction buffer B (Promegakit) and then centrifuged at 11,000g for 5 min. The supernatantwas removed, thoroughly remixed with 500 lL of chloroform, cen-trifuged at 11,000g for 5 min, and transferred into a new tube con-taining 750 lL of precipitation buffer (Promega kit) and 500 lL ofchloroform. The mixture was mixed thoroughly for 1 min and cen-trifuged at 11,000g for 5 min. The aqueous phase was then mixedwith 50 lL of MagnesilTM PMPs (Promega kit) according to the man-ufacturer instructions.
After extraction, the DNA was further purified by adding anequivalent volume of phenol:chloroform:isoamil alcohol(50:49:1). The suspension was gently mixed for 1 min and thencentrifuged at 4000g for 5 min. Finally the extracted DNA was puri-fied by precipitation at �20 �C overnight, after mixing with abso-lute ethanol, 3 M sodium acetate (pH 5.2) in a 1:2.5:0.1 volumeratio and centrifugation for 30 min at 11,000g (4 �C). The resultingpellet was washed with 500 lL 70% ethanol, air dried and re-sus-pended in 20 lL of distilled water until use.
The DNA concentration was measured by UV absorption at260 nm, while DNA purity was evaluated on the basis of the UVabsorption ratios at 260/280 nm and 260/230 nm. The concentra-tion of the DNA samples was evaluated by DyNA Quant 200 fluo-rometer (Höefer, Pharmacia Biotech, Uppsala, Sweden).
2.3. PCR analysis
The extracted DNA was diluted with distilled water to a finalconcentration of 50 ng/lL for seeds and flours and of 10 ng/lLfor oils and lecithin. PCR was performed by using a final volumeof 25 lL of these DNA stock solutions. Each reaction contained1 lL of template DNA, 1.5 U of DNA Taq polymerase (Amersham,UK), 1� reaction buffer for DNA polymerase, 2.5 or 1.5 mM MgCl2
and 200 lM dATP, dTTP, dGTP, dCTP (Amersham, UK). The detec-tion of sequences from the transgenic GTS 40-3-2 cassette, wasperformed by using 200 nM of each primer. The PCR program con-sisted of the hot start activation of the polymerase at 95 �C for5 min. The amplification profile comprised 40 cycles of 45 s at94 �C (denaturation step), 45 s at 55 �C (annealing step) and 45 sfor short fragments or 1 min and 10 s for long fragments at 72 �C(extension step), followed by a final extension at 72 �C for
10 min. Amplification reactions were performed in a MJPT200thermocycler and PCR products were separated on a 2% agarose(Roche Diagnostics, Milan, Italy) gel in 1� Tris acetate EDTA(TAE) buffer at constant voltage (8 V cm�1) for 30 min. Gels werevisualised with a Gel Doc 2000 gel imaging system (BioRad, Inc.,USA).
The CP4 EPSPS cassette contained in the plasmid vector usedto produce the transgenic event GTS 40-3-2, which was consid-ered in this work, is reported in Fig. 2A. In the cassette, the CP4EPSPS coding sequence is linked to a chloroplast transit peptidesequence designated CTP4, under the control of the 35S cauli-flower mosaic virus promoter (P-35S) and it is joined to thenopaline synthase 30 non-translated sequence (T-NOS) from Agro-bacterium tumefaciens. The primers used in the PCR analysis andlisted in Fig. 2B are internal to the cassette and they cover theP-35S promoter, the CTP4 region and the CP4 EPSPS codingregion.
2.4. Biosensor development
2.4.1. Reagents and instrumentationAT-Cut (9.5 MHz) quartz crystals (14 mm) with gold evaporated
(42.6 mm2 area) on both sides were purchased from InternationalCrystal Manufacturing (USA). The quartz crystal analyzer used forthe measurements was the QCMagic by Elbatech (Marciana,Livorno, Italy).
11-Mercaptoundecanol and Dextran 500 were from Sigma(Milan, Italy); (+)/�epichlorohydrin and N-hydroxysucciminidewere purchased from Fluka (Milan, Italy). Ethanol and all thereagents for the buffers were purchased from Merck (Italy). Twodifferent buffers, immobilisation buffer (NaCl 300 mM, Na2HPO4
20 mM, EDTA 0.1 mM, pH 7.4) and hybridisation buffer (NaCl150 mM, Na2HPO4 20 mM, EDTA 0.1 mM, pH 7.4), were used.
The following oligonucleotides were purchased from MWG Bio-tech (Milan, Italy): biotinylated probe (35S, 25 mer) 50 Biotin-GGCCAT CGT TGA AGA TGC CTC TGC C-30; complementary target (35S,25 mer) 50-GGC AGA GGC ATC TTC AAC GAT GGC C-30; non-com-plementary (Tnos, 25 mer) 50-GAT TAG .AGT CCC GCA ATT AATCAT T-30.
2.4.2. ImmobilisationThe biotinylated probe was immobilised via biotin-streptavidin
binding on the gold sensor surface, previously modified with thiol/dextran/streptavidin (Mannelli et al., 2003).
2.4.3. Hybridisation reactionSixty microliter of the DNA solution (synthetic oligonucleotides
or PCR amplified samples) in hybridisation buffer were added tothe measuring cell and incubated with the immobilised probe for10 and 20 min with oligonucleotides or amplified samples, respec-tively. The surface was then washed with the same hybridisationbuffer to eliminate the unbound oligonucleotides. The reportedfrequency shifts (DF) are the difference between this final valueand the value displayed before the hybridisation reaction. Thesignal is considered positive when DF > 3 Hz, which representsthree times the blank signal, both for oligonucleotides and PCRsamples.
After each cycle of hybridisation, the single stranded probe onthe crystal surface was regenerated by two consecutive treatmentsof 30 s with 1 mM HCl allowing a further use of the sensor.
All the experiments are performed at room temperature (25 �C).
2.4.4. Thermal denaturationThe PCR DNA samples were heated at 95 �C for 5 min and then
cooled in ice for 1 min and immediately injected in the cell.
P. Bogani et al. / Food Chemistry 113 (2009) 658–664 661
3. Results and discussion
3.1. Optimisation of the PCR procedure for DNA extracted fromsamples representing the whole industrial soybean processing chain
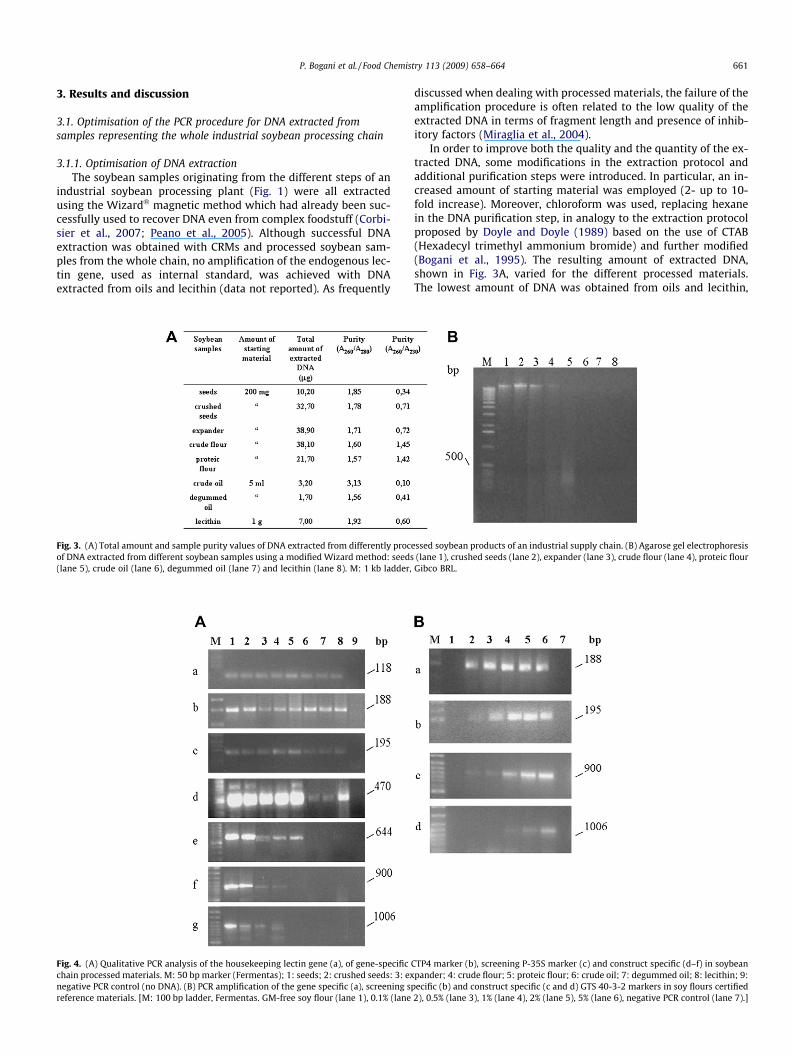
3.1.1. Optimisation of DNA extractionThe soybean samples originating from the different steps of an
industrial soybean processing plant (Fig. 1) were all extractedusing the Wizard� magnetic method which had already been suc-cessfully used to recover DNA even from complex foodstuff (Corbi-sier et al., 2007; Peano et al., 2005). Although successful DNAextraction was obtained with CRMs and processed soybean sam-ples from the whole chain, no amplification of the endogenous lec-tin gene, used as internal standard, was achieved with DNAextracted from oils and lecithin (data not reported). As frequently
Fig. 3. (A) Total amount and sample purity values of DNA extracted from differently proceof DNA extracted from different soybean samples using a modified Wizard method: seeds(lane 5), crude oil (lane 6), degummed oil (lane 7) and lecithin (lane 8). M: 1 kb ladder,
Fig. 4. (A) Qualitative PCR analysis of the housekeeping lectin gene (a), of gene-specific Cchain processed materials. M: 50 bp marker (Fermentas); 1: seeds; 2: crushed seeds: 3: exnegative PCR control (no DNA). (B) PCR amplification of the gene specific (a), screening spreference materials. [M: 100 bp ladder, Fermentas. GM-free soy flour (lane 1), 0.1% (lane
discussed when dealing with processed materials, the failure of theamplification procedure is often related to the low quality of theextracted DNA in terms of fragment length and presence of inhib-itory factors (Miraglia et al., 2004).
In order to improve both the quality and the quantity of the ex-tracted DNA, some modifications in the extraction protocol andadditional purification steps were introduced. In particular, an in-creased amount of starting material was employed (2- up to 10-fold increase). Moreover, chloroform was used, replacing hexanein the DNA purification step, in analogy to the extraction protocolproposed by Doyle and Doyle (1989) based on the use of CTAB(Hexadecyl trimethyl ammonium bromide) and further modified(Bogani et al., 1995). The resulting amount of extracted DNA,shown in Fig. 3A, varied for the different processed materials.The lowest amount of DNA was obtained from oils and lecithin,
ssed soybean products of an industrial supply chain. (B) Agarose gel electrophoresis(lane 1), crushed seeds (lane 2), expander (lane 3), crude flour (lane 4), proteic flourGibco BRL.
TP4 marker (b), screening P-35S marker (c) and construct specific (d–f) in soybeanpander; 4: crude flour; 5: proteic flour; 6: crude oil; 7: degummed oil; 8: lecithin; 9:ecific (b) and construct specific (c and d) GTS 40-3-2 markers in soy flours certified
2), 0.5% (lane 3), 1% (lane 4), 2% (lane 5), 5% (lane 6), negative PCR control (lane 7).]

662 P. Bogani et al. / Food Chemistry 113 (2009) 658–664
in line with the known difficulties in extracting DNA from oils andwith the fact that such kind of products are characterised by extre-mely low traces of DNA (Miraglia et al., 2004).
Moreover, despite the applied purification steps, A260/A280 andA260/A230 values still demonstrate the presence of proteins, fatand polysaccharides in all the DNA samples.
To check the DNA quality in terms of size and degradation level,the extracted samples (100 ng) were analysed by gel electrophore-sis (Fig. 3B). The results showed that DNA from proteic flour (lane5) is highly degraded with an average fragment size below 500 bp.DNA extracted from oils and lecithin (lanes 6–8), was instead notvisible on the agarose gel due to an even higher degradation levelcaused by repeated thermal and chemical treatments in the foodprocessing steps.
Fig. 5. (A) Sequence of the 195 bp PCR fragment containing the two primers (ingrey) and the probe (underlined). (B) Frequency changes during the hybridisation ofthe complementary oligonucleotide (0.1 lM). (C) Frequency changes after theaddition of a non-complementary oligonucleotide (1 lM). (D) Frequency changesduring the hybridisation of a PCR fragment after the denaturation (sample:soyflour).
3.1.2. PCR amplificationTo assess the amplificability of the DNA extracted with the im-
proved procedure, a fragment of 118 bp, corresponding to a part ofthe endogenous lectin gene, was amplified in all the samples usingGM03 and GM04 primer pair (Meyer & Jaccaud, 1997). As shown inFig. 4A (set a), PCR products were obtained from all the DNA sam-ples. To achieve these results, the amount of template DNA to beused in the amplification procedure has been varied for the differ-ent samples. In particular, 50 ng of template DNA were used forseeds, crushed seeds, expander and flours, whereas 10 ng were em-ployed in the case of DNA extracted from oils and lecithin. Theimprovements in amplificability of the DNA extracted from theselatter materials with a lower amount of DNA template, could be re-lated to the consistent lower amount of PCR inhibitory factors inthese non-pure samples.
After PCR optimisation using the lectin gene, all the sampleswere amplified using different primer pairs (Fig. 2B) and analysedby gel electrophoresis (Fig. 4A (sets b–g)). In addition, as positivecontrol, CRMs of soybean flours containing 0%, 0.1%, 0.5%, 1%, 2%and 5% of Roundup Ready� soybean were analysed with the sameselected primer pairs (Fig. 4B).
Fig. 4A reports the PCR results obtained with the different soy-bean samples for the amplification of the short CTP4 188 bp frag-ment (set b), of the P-35S promoter 195 bp fragment (set c), ofthe construct-specific CP4 EPSPS 644 and 1006 bp fragments (setse and g) and the construct-specific P-35S CTP4 470 and 900 bpfragments (sets d and f).
The amplificability of the fragments was inversely related totheir size since the degree of template DNA integrity affected thesuccess of the PCR reaction, especially in the case of long ampli-cons. This could explain the finding that only short fragments(up to 470 bp) could be detected in highly processed samples,while both, long and short amplicons can be found into raw or littleprocessed matrices. These results are in agreement with the workperformed on soybean and maize processed food, where theamplificability of short, medium and long fragments of endoge-nous genes was studied (from 169 bp up to 1626 in soybean and133 up to 1956 in maize, respectively) using different extractionprotocols (Peano et al., 2005).
Finally, the 188, 195, 470, 644, 900 and 1006 bp fragments werecloned and sequenced to check their identity, which was confirmed(data not shown).
This demonstrates that for a correct traceability of the targettransgenic event along an industrial food (soybean) processingchain, which means working with raw and highly processed mate-rials, short PCR fragments should be taken into consideration forthe amplification. The processing chain which was considered ischaracterised by the presence of a high percentage (80%) of trans-genic material, thus, to more generally apply the proposed ap-proach as traceability method in food processing, it is important
to clarify if the selected fragments are the correct choice also whenthe transgenic material is present in low percentage.

P. Bogani et al. / Food Chemistry 113 (2009) 658–664 663
With this aim, the same fragments were analysed in soybeanflour containing from 0.1% up to 5% Roundup Ready� soybean(CRM). Fig. 4B shows that 188 bp (CTP4) and 195 bp (P-35S) frag-ments were detected in all the samples, while longer fragments(900 and 1006 bp) could be detected in CRMs with a different sen-sitivity. In particular, the 900 bp fragment was detectable in all thetested samples (0.1%, 0.5%, 1%, 2% and 5%) while the 1006 bp frag-ment was detected only in soybean flour containing 1%, 2% and 5%transgenic flour.
The final out-coming of these data was that 188, 195 and 470 bpfragments can be detected in all the matrices along the whole soy-bean processing chain, while longer fragments were not detectedin highly processed materials, such as proteic flour, oils and leci-thin. Moreover, when dealing with CRMs at a low percentage oftransgenic materials, shorter fragments are still the best choicefor a complete traceability.
Thus, for the correct traceability of transgenic materials alongan industrial processing chain, it is important to analyze short frag-ments (188, 195 or 470 bp), and this finding seems independentfrom the transgenic material content, as indicated by the resultsconducted on CRMs.
3.2. Biosensor
The first step in the development of the biosensor for the trace-ability of GMOs along the industrial soybean processing chain wasthe choice of the probe that should be immobilised onto the sensor.Since the study conducted on the PCR detection has identified as‘‘marker” fragment the 195 bp one internal to the Roundup Ready�
soybean P-35S promoter, the probe sequence should be comprisedin this fragment.
A 25 bp probe has been chosen in the P-35S amplified fragmentand immobilised on the sensing surface of piezoelectric quartzcrystals as already reported in other works by this group (Fig.5A) (Mannelli et al., 2003; Minunni et al., 2005). The good analyt-ical performances of the biosensor have been confirmed (Mannelliet al., 2003) by using synthetic 25 bp complementary oligonucleo-tides. Key characteristics for the further application to the analysisof complex samples, such as sensitivity, reproducibility and selec-tivity have been verified (Mannelli et al., 2003). The sensorgramsreporting the signal during the hybridisation between the immobi-lised probe and the target DNA, and the interaction between theprobe and the non-complementary DNA are reported in Fig. 5Band C, respectively.
Fig. 6. Sensor responses recorded with samples consisting in PCR amplified DNA(195 bp) containing the target sequence (P-35S) complementary to the immobilisedprobe. The tested DNA was extracted from different processing phases along theselected soybean processing chain.
The calibrated biosensor has been further applied to the analy-sis of the PCR fragments representing all the different stages alongthe soybean industrial processing chain. A simple and fast pre-treatment (95 �C 5 and 1 min cooling in ice) to denaturate theamplicon double helix to allow hybridisation with the probe wasperformed. The sensorgram reporting the frequency changes dur-ing the hybridisation between a PCR fragment (from a soyfloursample) and the immobilised probe is reported in Fig. 5D. In thiscase the kinetic is influenced by the initial temperature of the sam-ple which is added to the cell after the final step of the denatur-ation (1 min in ice). The analytical datum is the differencebetween the initial frequency value with the buffer and the valueafter the washing when the crystal is in contact with the same buf-fer, which are both at the same temperature.
A negative control consisted in an amplified fragment from theT-NOS terminator of the transgenic cassette. Moreover, the same195 bp fragment has been tested after amplification from DNA ex-tracted from soybean CRMs (0%, 2% and 5% of Roundup Ready�
soybean powder). The ‘‘blank” samples consisted in all the PCR re-agents, except the template DNA. Fig. 6 reports the frequency shiftsobtained with the different samples of the soybean processingchain and with the CRMs. All the samples were analysed in tripli-cate. Negative samples (CRM 0%, T-NOS fragment and blank) wereclearly distinguishable (DF 6 3 Hz) from the positive ones. The va-lue of 3 Hz, calculated as three time the blank signal, was consid-ered as cut-off value for discriminating positive from negativesamples. All the samples containing the P-35S fragment were cor-rectly identified. The heterogeneity in the positive signals is due tothe different concentrations of the amplified fragments when usingDNA extracted from the different matrices, but it is not affectingthe identification of the GM samples. Good reproducibility (aver-age CV% = 11%) was achieved for all the measurements.
The same complete protocol, from the extraction of DNA to thebiosensor analysis, has been applied to a different lot of the sam-ples, analysed in triplicate, coming from the same soy processingchain. The results were in agreement with the reported ones, con-firming the reliability of the method.
After the measurements, the surface of the biosensor can beregenerated by dissociating the hybrid and making the immobi-lised probe free again for a new hybridisation. This was achievedby exposing the surface to a treatment with 1 mM HCl (30 s),allowing up to 20 measurements on the same sensing surface (datanot reported).
These findings confirm the suitability of this kind of DNA-basedbiosensors for GMO detection. In particular, the innovative applicationto the monitoring of an entire industrial soybean processing chaingives further relevance to the method. Moreover, the already reportedadvantages of biosensors with respect to the electrophoretic ap-proach, such as the possibility of automatisation, the simple handling,the label-free characteristic and the sequence-specific recognition,can be transferred also to this kind of complex application.
4. Conclusion
In this work we have underlined the importance of analyticalmethods for transgene traceability along the whole food process-ing chain together with that most of the reported work refers toraw material, such as flours and seed or to processed food as endproduct. What is missing is a systematic approach where targettransgenes sequences are monitored during the whole manufac-turing process. In this work a homogenous processing line involv-ing Roundup Ready� soybean, event GTS 40-3-2 (C/UK/94/M3/1,Monsanto), along a whole soybean industrial processing chainhas been considered. The analytical steps considered, were tailoredto the homogeneous Roundup Ready� soybean food chain, rangedfrom the optimisation of the extraction protocol to allow amplifi-

664 P. Bogani et al. / Food Chemistry 113 (2009) 658–664
cability of DNA also from highly processed matrices) to the designof specific primer couples to amplify fragments of various length(from 118 up to 1006 bp). The suitable fragment lengths for trans-gene analysis in all the different matrices considered, were 188,195, 470 bp indicating that short or medium size fragments arethe choice for monitoring of transgenes over the whole food chain.Differently long fragments were not detected in highly processedsamples. This finding is in agreement with some work reportedon processed isolated samples analyzing endogenous genes (Peanoet al., 2005).
The importance of this study relies on the combined approachbased on the systematic analysis of the same markers in a homog-enous food chain at high degree of transgenic content, and suitablebiosensor design. In this way, it was possible study the traceabilityof the same targets in different materials, undergoing to differentdegree of processing, starting from the same source. In this condi-tion, difficulties eventually encountered in direct analysis of highlyprocessed food samples, could be controlled and ascribed to partic-ular treatments occurring during the processing, such as milling,thermal or chemical treatments. Our findings showed how theDNA amplificability was related both to the DNA degradation andto the presence of different inhibitors of Taq polymerase, particu-larly significant in highly processed food. Specific primer pairs dif-ferentiated sequences from the whole insert, corresponding toscreening, gene-specific and construct-specific methods (Fig. 2).On the base of these findings, biosensor analysis to detect anamplified fragment of the P-35S promoter (195 bp), present in allthe sample along the industrial food chain, was applied and resultscompared with the reference technique. The results emerged fromthis approach confirmed the suitability of the biosensor for GMOanalysis not only in raw material but also for monitoring the trans-genic event along all the steps involved in the considered food pro-cessing chain.
References
Aarts, H. J. M., van Rie, J. P. P. F., & Kok, E. J. (2002). Traceability of geneticallymodified organisms. Expert Review of Molecular Diagnostics, 2, 69–77.
Ahmed, F. E. (2002). Detection of genetically modified organisms in foods. Trends inBiotechnology, 20, 215–223.
Anklam, E., Gadani, F., Heinze, P., Pijnenburg, H., & van den Eede, G. (2002).Analytical methods for detection and determination of genetically modifiedorganisms in agricultural crops and plant-derived food products. European FoodResearch and Technology, 214, 3–26.
Bauer, T., Weller, P., Hames, W. P., & Hertel, C. (2003). The effect of processingparameters on DNA degradation in food. European Food Research and Technology,217, 338–343.
Bogani, P., Simoni, A., Bettini, P., Mugnai, M., Pellegrini, M. G., & Buiatti, M. (1995).Genome flux in tomato auto and auxotrophic cell clones cultured in differentauxin/cytokinin equilibira: I DNA multiplicity and methylation levels. Genome,38, 902–912.
Bordoni, R., Germini, A., Mezzelani, A., Marchelli, R., & De Bellis, G. (2005). Amicroarray platform for parallel detection of five transgenic events in foods: Acombined polymerase chain reaction-ligation detection reaction-universalarray method. Journal of Agricultural and Food Chemistry, 53(4), 912–918.
Corbisier, P., Broothaerts, W., Gioria, S., Schimmel, H., Burns, M., Baoutin, A. A., et al.(2007). Toward metrological traceability for DNA fragment ratios in GMquantification. 1. Effect of DNA extraction methods on the quantitativedetermination of Bt176 corn by real-time PCR. Journal of Agricultural and FoodChemistry, 55, 3249–3257.
Di Pinto, A., Forte, V. T., Corsignano Guastadisegni, M., Martino, C., Schena, F. P., &Tantillo, G. (2007). A comparison of DNA extraction methods for food analysis.Food Control, 18, 76–80.
Doyle, J., & Doyle, J. (1989). Isolation of plant DNA from fresh tissue. Focus, 12,13–15.
Engel, K., Moreano, F., Ehlert, A., & Busch, U. (2006). Quantification of DNA fromgenetically modified organisms in composite and processed foods. Trends inFood Science and Technology, 17, 490–497.
European Commission (2003a). Regulation (EC) No. 1829/2003 of the EuropeanParliament and of the Council of 22 September 2003 on genetically modifiedfood and feed. Official Journal of European Communities, L 268, 1–23.
European Commission (2003b). Regulation (EC) No. 1830/2003 of the EuropeanParliament and of the Council of 22 September 2003 concerning the traceabilityand labelling of genetically modified organisms and the traceability of foodand feed products produced from genetically modified organisms andamending Directive 2001/18/EC. Official Journal of European Communities, L268, 24–28.
Gambari, R., & Feriotto, G. (2006). Surface plasmon resonance for detection ofgenetically modified organisms in the food supply. Journal of AOAC International,89(3), 893–897.
Germini, A., Rossi, S., Zanetti, A., Corradini, R., Fogher, C., & Marchelli, R. (2005).Development of a peptide nucleic acid array platform for the detection ofgenetically modified organisms in food. Journal of Agricultural and FoodChemistry, 53(10), 3958–3962.
Giakoumaki, E., Minunni, M., Tombelli, S., Tothill, I. E., Mascini, M., Bogani, P., et al.(2003). Combination of amplification and post-amplification strategies toimprove optical DNA sensing. Biosensors and Bioelectronics, 19, 337–344.
Kalogianni, D. P., Koraki, T., Christopoulos, T. K., & Ioannou, P. C. (2006).Nanoparticle-based DNA biosensor for visual detection of geneticallymodified organisms. Biosensors and Bioelectronics, 21, 1069–1076.
Kim, Y., Chae, J., Chang, J., & Kang, S. H. (2005). Microchip capillary gelelectrophoresis using programmed field strength gradients for the ultra-fastanalysis of genetically modified organisms in soybeans. Journal ofChromatography A, 1083(1–2), 179–184.
Leimanis, S., Hernandez, M., Fernandez, S., Boyer, F., Burns, M., Bruderer, S., et al.(2006). A microarray-based detection system for genetically modified (GM)food ingredients. Plant Molecular Biology, 61, 123–139.
Lüthy, J. (1999). Detection strategies for food authenticity and genetically modifiedfoods. Food Control, 10, 359–361.
Mannelli, I., Minunni, M., Tombelli, S., & Mascini, M. (2003). Quartz crystalmicrobalance (QCM) affinity biosensor for genetically modified organisms(GMOs) detection. Biosensors and Bioelectronics, 18, 129–140.
Meyer, R., & Jaccaud, E. (1997). Detection of genetically modified soya in processedfood products: Development and validation of a PCR assay for the specificdetection of glyphosphate-tolerant soybeans. In R. Amadò, R. Battaglia (Eds.),Authenticity and Adulteration of Food – the Analytical Approach (pp. 23–28).European Food Chemistry IX.
Meyer, R., Chardonnens, P., Hubner, J., & Luthy, Z. (1996). Polymerase chain reaction(PCR) in the quality and safety assurance of food: Detection of soya in processedmeat products. Lebensm Unters Forsch, 203, 339.
Minunni, M., Tombelli, S., Fonti, J., Spiriti, M. M., Mascini, M., Bogani, P., et al. (2005).Detection of fragmented genomic DNA by PCR-free piezoelectric sensing using adenaturation approach. Journal of the American Chemical Society, 127(22), 7966.
Miraglia, M., Berdal, K. G., Brera, C., Corbisier, P., Holst-Jensen, A., Kok, E., et al.(2004). Detection and traceability of genetically modified organisms in the foodproduction chain. Food and Chemical Toxicology, 42, 1157–1180.
Moreano, F., Busch, U., & Engel, K. H. (2005). Distortion of genetically modifiedorganism quantification in processed foods: Influence of particle sizecompositions and heat-induced DNA degradation. Journal of Agricultural andFood Chemistry, 53, 997.
Passamano, M., & Pighini, M. (2006). QCM DNA-sensor for GMOs detection. Sensorsand Actuators, B: Chemistry, B118(1–2), 177–181.
Peano, C., Lesignoli, F., Gulli, M., Corradini, R., Samson, M. C., Marchelli, R., et al.(2005). Development of a peptide nucleic acid polymerase chain reactionclamping assay for semiquantitative evaluation of genetically modifiedorganism content in food. Analytical Biochemistry, 344(2), 174–182.
Rodriguez-Lazaro, D., Lombard, B., Smith, H., Rzezutka, A., D’Agostino, M., Helmuth,R., et al. (2007). Trends in analytical methodology in food safety and quality:Monitoring microorganisms and genetically modified organisms. Trends in FoodScience Technology, 18(6), 306–319.
Rossi, S., Lesignoli, F., Germini, A., Faccini, A., Sforza, S., Corradini, R., et al. (2007).Identification of PCR-amplified genetically modified organisms (GMOs) DNA bypeptide nucleic acid (PNA) probes in anion-exchange chromatographic analysis.Journal of Agricultural and Food Chemistry, 55(7), 2509–2516.
Xu, J., Miao, H., Wu, H., Huang, W., Tang, R., Qiu, M., et al. (2006). Screeninggenetically modified organisms using multiplex-PCR coupled witholigonucleotide microarray. Biosensors and Bioelectronics, 22(1), 71–77.