Transformed epithelial cells and fibroblasts/myofibroblasts interaction in breast tumor: a...
21
J. Math. Biol. (2010) 61:401–421 DOI 10.1007/s00285-009-0307-2 Mathematical Biology Transformed epithelial cells and fibroblasts/ myofibroblasts interaction in breast tumor: a mathematical model and experiments Yangjin Kim · Julie Wallace · Fu Li · Michael Ostrowski · Avner Friedman Received: 3 September 2008 / Revised: 11 August 2009 / Published online: 10 November 2009 © Springer-Verlag 2009 Abstract It is well known that tumor and its microenvironment, or stroma, inter- act with each other and that this interaction plays a critical role in tumor initiation, growth, and metastasis. This interaction consists of complex relations between tumor cells, stromal cells such as fibroblasts, epithelial cells and immunocytes, the vascular system, the extracellular matrix, and cytokines secreted by the cells. Understanding these relationships may lead to new therapeutic approaches to cancer. In the present paper, we consider tumor-stroma crosstalk in a simple in vitro situation which involves interaction between tumor epithelial cells from breast cancer and a microenvironment consisting of just fibroblasts. The two populations of cells are separated by a semi-per- meable membrane that allows only cytokines to cross over. We develop a mathematical model that includes two critical growth factors: TGF-β , produced by the tumor cells, and EGF, secreted by the fibroblasts. The TGF-β modifies the microenvironment by transforming fibroblasts into myofibroblasts. Myofibroblasts secrete higher concen- trations of EGF than fibroblasts, thereby, increasing the proliferation of tumor cells. Thus already in this simple setup one sees a mutual interaction between tumor cells and their microenvironment. We conducted experiments which show good agreement Y. Kim and A. Friedman were supported by the National Science Foundation upon agreement 112050. F. Li was supported by Department of Defense BCRP Predoctoral fellowship (BC083301). J. Wallace, F. Li and M. Ostrowski were supported by NIH P01CA097189, Susan Komen Foundation and the Evelyn Simmers Foundation (M.C.O.). Y. Kim (B ) · A. Friedman Mathematical Biosciences Institute, The Ohio State University, Columbus, OH 43210, USA e-mail: [email protected]; [email protected] J. Wallace · F. Li · M. Ostrowski Department of Molecular and Cellular Biochemistry, The Ohio State University, Columbus, OH 43210, USA 123
Transcript of Transformed epithelial cells and fibroblasts/myofibroblasts interaction in breast tumor: a...
J. Math. Biol. (2010) 61:401–421DOI 10.1007/s00285-009-0307-2 Mathematical Biology
Transformed epithelial cells and fibroblasts/myofibroblasts interaction in breast tumor:a mathematical model and experiments
Yangjin Kim · Julie Wallace · Fu Li ·Michael Ostrowski · Avner Friedman
Received: 3 September 2008 / Revised: 11 August 2009 / Published online: 10 November 2009© Springer-Verlag 2009
Abstract It is well known that tumor and its microenvironment, or stroma, inter-act with each other and that this interaction plays a critical role in tumor initiation,growth, and metastasis. This interaction consists of complex relations between tumorcells, stromal cells such as fibroblasts, epithelial cells and immunocytes, the vascularsystem, the extracellular matrix, and cytokines secreted by the cells. Understandingthese relationships may lead to new therapeutic approaches to cancer. In the presentpaper, we consider tumor-stroma crosstalk in a simple in vitro situation which involvesinteraction between tumor epithelial cells from breast cancer and a microenvironmentconsisting of just fibroblasts. The two populations of cells are separated by a semi-per-meable membrane that allows only cytokines to cross over. We develop a mathematicalmodel that includes two critical growth factors: TGF-β, produced by the tumor cells,and EGF, secreted by the fibroblasts. The TGF-β modifies the microenvironment bytransforming fibroblasts into myofibroblasts. Myofibroblasts secrete higher concen-trations of EGF than fibroblasts, thereby, increasing the proliferation of tumor cells.Thus already in this simple setup one sees a mutual interaction between tumor cellsand their microenvironment. We conducted experiments which show good agreement
Y. Kim and A. Friedman were supported by the National Science Foundation upon agreement 112050.F. Li was supported by Department of Defense BCRP Predoctoral fellowship (BC083301). J. Wallace,F. Li and M. Ostrowski were supported by NIH P01CA097189, Susan Komen Foundation and the EvelynSimmers Foundation (M.C.O.).
Y. Kim (B) · A. FriedmanMathematical Biosciences Institute, The Ohio State University, Columbus, OH 43210, USAe-mail: [email protected]; [email protected]
J. Wallace · F. Li · M. OstrowskiDepartment of Molecular and Cellular Biochemistry, The Ohio State University,Columbus, OH 43210, USA
123
402 Y. Kim et al.
with the model’s simulations, hence confirming the model’s ability to predict aspectsof tumor cell behavior in response to signaling from fibroblasts.
Keywords Tumor growth · Fibroblasts · Myofibroblasts · Epithelial cells
Mathematics Subject Classification (2000) 92C17 · 92C45 · 92C50
1 Introduction
It is well established that tumor microenvironment affects tumor growth and metas-tasis (Cheng and Weiner 2003; Sadlonova et al. 2005; Samoszuk et al. 2005; Yashiroet al. 2005). The tumor microenvironment is composed of various cell types, includingin addition to transformed (or tumor) epithelial cells also fibroblasts, myofibroblasts,endothelial cells and inflammatory cells. These different cell types are involved, bymeans of cytokines and growth factors they secrete, in a complex crosstalk in whichthey communicate with one another and influence each others behavior. Understand-ing the relationship between tumor and its microenvironment may lead to importantnew therapeutic approaches in controlling the growth and metastasis of cancer. Indeed,instead of (or in addition to) targeting the tumor cells, one may then target stromalelements in order to manipulate the host-tumor interaction in a way that will confinethe tumor. An example of such an approach is the use of anti-angiogenesis drugs whichblock the movement of new blood vessels toward the tumor, thus depriving the tumorof nutrients and preventing or slowing its growth.
Fibroblasts are of particular interest because both in vitro and in vivo studies haveshown that they contribute to both the formation and growth rates of tumors (Hooff1988). A recent study of a chemotherapeutic drug for breast cancer, for instance,found that a strong stroma reaction characterized by an increased quantity of fibro-blasts surrounding the tumor is likely to have a bad response to this drug (Farmeret al. 2009). Myofibroblasts, described as activated fibroblasts with smooth muscledifferentiation, are abundant in the stroma of malignant breast tissue, but rarely seenin normal breast tissue (Sappino et al. 1988). Active proliferation of myofibroblastsand, in turn, increased collagen deposition near tumor regions are characteristic ofmany solid tumors, including breast, prostate, colon and lung (Tlsty 2001). In fact,increased numbers of myofibroblasts along with deformed basal lamina can be usedas a diagnostic indicator in breast cancer detection (Tamimi and Ahmed 1986). Alongwith increased cell proliferation, the localization of myofibroblasts also changes dur-ing tumor progression. Whereas in in situ carcinoma myofibroblasts predominantlyreside in the immediate periphery of the developing carcinoma, after the transition toinvasive breast cancer myofibroblasts migrate to the invading front. These differencesin both the abundance and location of myofibroblasts most likely stem from signalssent by epithelial cells in which oncogenic changes have occurred.
Significant evidence also exists that fibroblasts and myofibroblasts residing in thetumor microenvironment affect tumor cell proliferation. Recently, Samoszuk et al.(2005) demonstrated the ability of fibroblasts to enhance the growth of a relativelysmall number of breast cancer cells in vitro. Yashiro et al. (2005) also demonstrated that
123
Transformed epithelial cells and fibroblasts/myofibroblasts interaction 403
tumor size is significantly increased in mice when breast cancer cells are co-inoculatedwith breast fibroblasts. In other experiments it was shown that fibroblasts cultured fromnormal tissue tend to have inhibitory effects on cell growth, whereas fibroblasts cul-tured from tumors stimulate the growth of several cell types, including muscle cells,mammary carcinoma cells and myofibroblasts (Adams et al. 1988; Ronnov-Jessenet al. 1990; Ogmundsdottir et al. 1993; Ronnov-Jessen et al. 1995; Horgan et al.1987; Mueller and Fusenig 2004; Bhowmick et al. 2004b; Hooff 1988; Tsukada et al.1987).
Communication between the tumor epithelial cells and stromal fibroblasts isachieved through various mechanisms, including signaling via cytokines and che-mokines as well as secretion of growth factors. It is well known that breast cancer riskis associated with increased levels of epidermal growth factor (EGF), which has beenshown to have mitogenic effects on cultured cells (Boccardo et al. 2003). EGF levelsin breast cancer patients are also often associated with increased levels of Her2/Neu,a protein associated with the family of EGF receptors (EGFRs). Transforming growthfactor (TGF-β) is another growth factor which has been shown to be associated withbreast cancer. When epithelial cells in the breast duct are transformed by geneticmutations, they begin to form aggregates that secrete higher concentrations of TGF-β (Yang et al. 2002; Schwarz et al. 1990; Wakefield et al. 1987; Dalal et al. 1993),resulting in transformation of fibroblasts into myofibroblasts. The increased concen-tration of TGF-β also triggers the fibroblasts and myofibroblasts to secrete higherconcentrations of EGF than in a healthy tissue. EGF then binds to EGFR on the epi-thelial cell membrane which enables the release of membrane bound Her2/Neu intothe cytoplasm. These increased cytoplasmic levels of Her2/Neu are then available toinhibit an anti-proliferation control mechanism through the TGF-β/SMAD pathway,as shown in Fig. 1.
In this paper, we develop a mathematical model based on interactions betweentumor epithelial cells (TECs), fibroblasts, myofibroblasts, EGF and TGF-β. Theseinteractions are schematically described in Fig. 2 and, experimentally, in Fig. 3. Ourmodel depicts a situation where the TECs are placed on one side of a semi-permeablemembrane and either normal fibroblasts or tumor associated fibroblasts are placed onthe other side. The membrane allows growth factors such as EGF and TGF-β to crossover, but acts as a barrier to cells and thus inhibits cell-to-cell contact. While the stro-mal fibroblasts can enhance TEC growth when they make physical contact (Samoszuket al. 2005; Sadlonova et al. 2005), TECs are known to be able to communicate withfibroblasts via molecules even when they do not have physical contact (Hofland et al.1995). This physical separation of cells in each compartment would mimic an earlystage of breast cancer when TECs are separated from the surrounding stromal tissue,including fibroblasts, by a basement membrane (ductal carcinoma in situ) (Kalluriand Zeisberg 2006). Hence a better understanding of the signaling between fibroblastsand tumor epithelial cells is important for understanding the molecular mechanismsof tumor initiation as well as tumor progression.
The model is formulated as a system of partial differential equations. Most of theparameters in the model are taken from the literature but a few are estimated. Wehave also conducted experiments, as reported in Appendix, and shown that the modelpredictions are in good agreement with the experimental results.
123

404 Y. Kim et al.
Nucleus
RASSMAD
Proliferation
EGF
TGF−receptorHer2/neu
Cell
ECM TGF−β
MAP−kinase
(a)
β
Nucleus
Epithelial Cell
EGF
ECM
(b)
Fibroblast
Transformation
Myo−fibroblast
RAS
TGF−receptor
SMAD
TGF−
Proliferation
MAP−kinase
Her2/neu
Fig. 1 EGF and TGF-β control over proliferation in breast cancer (see Massague 1998; Kretzschmar 2000for discussion and more details). a In a healthy tissue, EGF and TGF-β concentrations control proliferation.b Increased level of TGF-β by TECs triggers fibroblasts and myofibroblasts to secrete more EGF which thendisrupts the proliferation-inhibition mechanism and triggers proliferation by blocking the TGF-β/SMADpathway
Fig. 2 Schematics of theinteractions across themembrane. While EGF andTGF-β can move across thesemi-permeable membrane,tumor cells, fibroblasts, andmyofibroblasts cannot cross themembrane
TEC ( )
MEMBRANE
Fibroblasts ( )
Myo−fibroblasts ( )
EGF ( )
β
EGF ( )
TGF− ( )βTGF− ( )
E
nf
m
GG
E
x=0
Ω+Ω−
Fig. 3 Structure of a transwellkit
Tumor cells
FibroblastsMembrane (insert)
123
Transformed epithelial cells and fibroblasts/myofibroblasts interaction 405
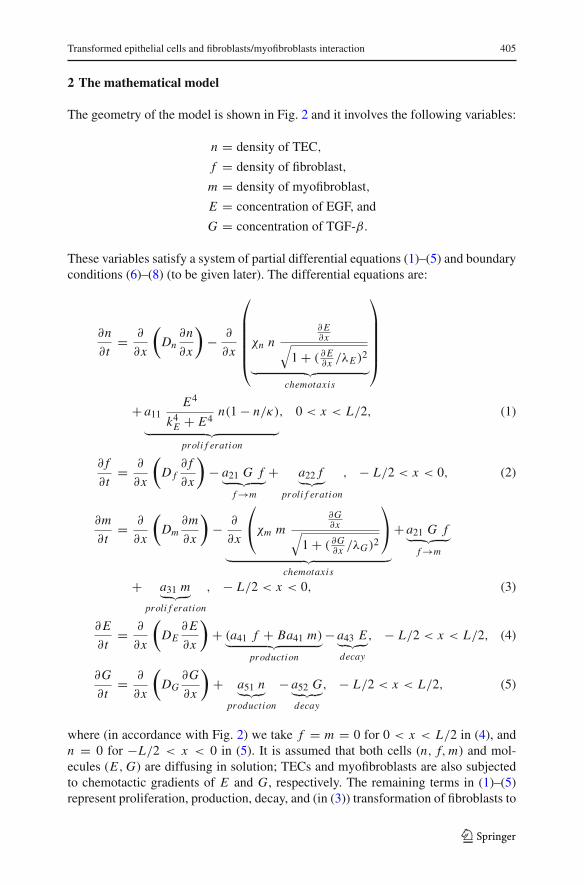
2 The mathematical model
The geometry of the model is shown in Fig. 2 and it involves the following variables:
n = density of TEC,
f = density of fibroblast,
m = density of myofibroblast,
E = concentration of EGF, and
G = concentration of TGF-β.
These variables satisfy a system of partial differential equations (1)–(5) and boundaryconditions (6)–(8) (to be given later). The differential equations are:
∂n
∂t= ∂
∂x
(Dn
∂n
∂x
)− ∂
∂x
⎛⎜⎜⎜⎜⎜⎝
χn n∂ E∂x√
1 + ( ∂ E∂x /λE )2
︸ ︷︷ ︸chemotaxis
⎞⎟⎟⎟⎟⎟⎠
+ a11E4
k4E + E4
n(1 − n/κ)
︸ ︷︷ ︸proli f eration
, 0 < x < L/2, (1)
∂ f
∂t= ∂
∂x
(D f
∂ f
∂x
)− a21 G f︸ ︷︷ ︸
f →m
+ a22 f︸︷︷︸proli f eration
, − L/2 < x < 0, (2)
∂m
∂t= ∂
∂x
(Dm
∂m
∂x
)− ∂
∂x
⎛⎝χm m
∂G∂x√
1 + ( ∂G∂x /λG)2
⎞⎠
︸ ︷︷ ︸chemotaxis
+ a21 G f︸ ︷︷ ︸f →m
+ a31 m︸ ︷︷ ︸proli f eration
, − L/2 < x < 0, (3)
∂ E
∂t= ∂
∂x
(DE
∂ E
∂x
)+ (a41 f + Ba41 m)︸ ︷︷ ︸
production
− a43 E︸ ︷︷ ︸decay
, − L/2 < x < L/2, (4)
∂G
∂t= ∂
∂x
(DG
∂G
∂x
)+ a51 n︸ ︷︷ ︸
production
− a52 G︸ ︷︷ ︸decay
, − L/2 < x < L/2, (5)
where (in accordance with Fig. 2) we take f = m = 0 for 0 < x < L/2 in (4), andn = 0 for −L/2 < x < 0 in (5). It is assumed that both cells (n, f, m) and mol-ecules (E, G) are diffusing in solution; TECs and myofibroblasts are also subjectedto chemotactic gradients of E and G, respectively. The remaining terms in (1)–(5)represent proliferation, production, decay, and (in (3)) transformation of fibroblasts to
123
406 Y. Kim et al.
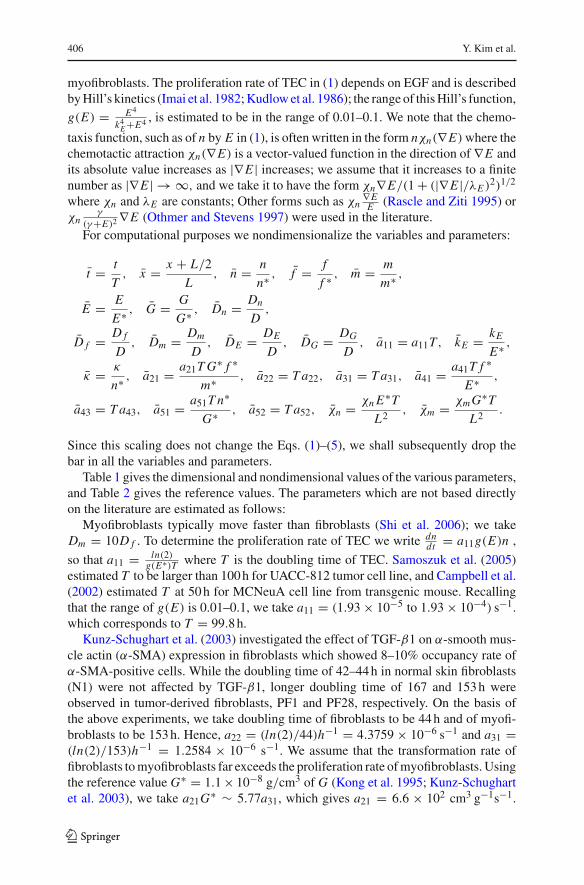
myofibroblasts. The proliferation rate of TEC in (1) depends on EGF and is describedby Hill’s kinetics (Imai et al. 1982; Kudlow et al. 1986); the range of this Hill’s function,g(E) = E4
k4E +E4 , is estimated to be in the range of 0.01–0.1. We note that the chemo-
taxis function, such as of n by E in (1), is often written in the form nχn(∇E) where thechemotactic attraction χn(∇E) is a vector-valued function in the direction of ∇E andits absolute value increases as |∇E | increases; we assume that it increases to a finitenumber as |∇E | → ∞, and we take it to have the form χn∇E/(1 + (|∇E |/λE )2)1/2
where χn and λE are constants; Other forms such as χn∇EE (Rascle and Ziti 1995) or
χnγ
(γ+E)2 ∇E (Othmer and Stevens 1997) were used in the literature.For computational purposes we nondimensionalize the variables and parameters:
t = t
T, x = x + L/2
L, n = n
n∗ , f = f
f ∗ , m = m
m∗ ,
E = E
E∗ , G = G
G∗ , Dn = Dn
D,
D f = D f
D, Dm = Dm
D, DE = DE
D, DG = DG
D, a11 = a11T, kE = kE
E∗ ,
κ = κ
n∗ , a21 = a21T G∗ f ∗
m∗ , a22 = T a22, a31 = T a31, a41 = a41T f ∗
E∗ ,
a43 = T a43, a51 = a51T n∗
G∗ , a52 = T a52, χn = χn E∗T
L2 , χm = χm G∗T
L2 .
Since this scaling does not change the Eqs. (1)–(5), we shall subsequently drop thebar in all the variables and parameters.
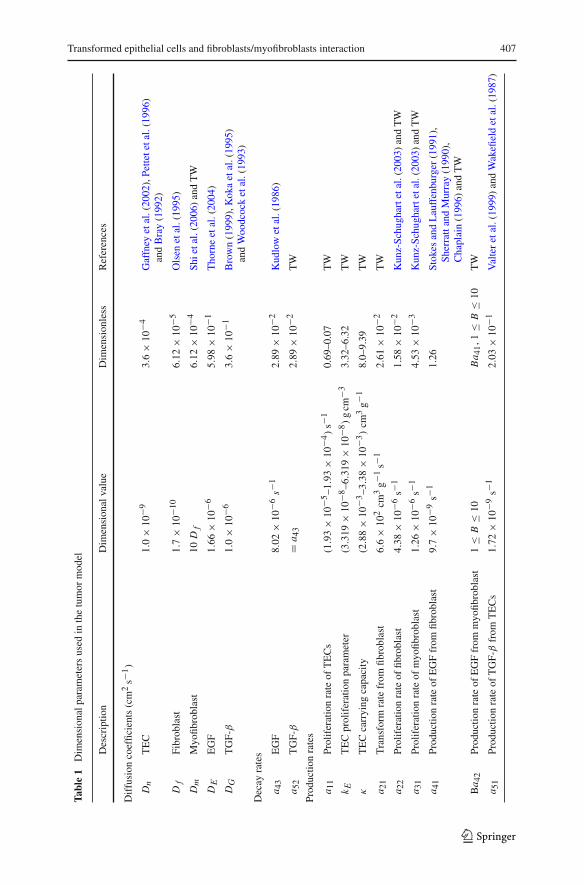
Table 1 gives the dimensional and nondimensional values of the various parameters,and Table 2 gives the reference values. The parameters which are not based directlyon the literature are estimated as follows:
Myofibroblasts typically move faster than fibroblasts (Shi et al. 2006); we takeDm = 10D f . To determine the proliferation rate of TEC we write dn
dt = a11g(E)n ,
so that a11 = ln(2)g(E∗)T where T is the doubling time of TEC. Samoszuk et al. (2005)
estimated T to be larger than 100 h for UACC-812 tumor cell line, and Campbell et al.(2002) estimated T at 50 h for MCNeuA cell line from transgenic mouse. Recallingthat the range of g(E) is 0.01–0.1, we take a11 = (1.93 × 10⁻⁵ to 1.93 × 10⁻⁴) s−1.which corresponds to T = 99.8 h.
Kunz-Schughart et al. (2003) investigated the effect of TGF-β1 on α-smooth mus-cle actin (α-SMA) expression in fibroblasts which showed 8–10% occupancy rate ofα-SMA-positive cells. While the doubling time of 42–44 h in normal skin fibroblasts(N1) were not affected by TGF-β1, longer doubling time of 167 and 153 h wereobserved in tumor-derived fibroblasts, PF1 and PF28, respectively. On the basis ofthe above experiments, we take doubling time of fibroblasts to be 44 h and of myofi-broblasts to be 153 h. Hence, a22 = (ln(2)/44)h−1 = 4.3759 × 10⁻⁶ s−1 and a31 =(ln(2)/153)h−1 = 1.2584 × 10⁻⁶ s−1. We assume that the transformation rate offibroblasts to myofibroblasts far exceeds the proliferation rate of myofibroblasts. Usingthe reference value G∗ = 1.1 × 10⁻⁸ g/cm3 of G (Kong et al. 1995; Kunz-Schughartet al. 2003), we take a21G∗ ∼ 5.77a31, which gives a21 = 6.6 × 102 cm3 g−1s−1.
123
Transformed epithelial cells and fibroblasts/myofibroblasts interaction 407
Tabl
e1
Dim
ensi
onal
para
met
ers
used
inth
etu
mor
mod
el
Des
crip
tion
Dim
ensi
onal
valu
eD
imen
sion
less
Ref
eren
ces
Dif
fusi
onco
effic
ient
s(c
m2
s−1)
Dn
TE
C1.
0×
10−9
3.6
×10
−4G
affn
eyet
al.(
2002
),Pe
ttete
tal.
(199
6)an
dB
ray
(199
2)
Df
Fibr
obla
st1.
7×
10−1
06.
12×
10−5
Ols
enet
al.(
1995
)
Dm
Myo
fibro
blas
t10
Df
6.12
×10
−4Sh
ieta
l.(2
006)
and
TW
DE
EG
F1.
66×
10−6
5.98
×10
−1T
horn
eet
al.(
2004
)
DG
TG
F-β
1.0
×10
−63.
6×
10−1
Bro
wn
(199
9),K
oka
etal
.(19
95)
and
Woo
dcoc
ket
al.(
1993
)
Dec
ayra
tes
a 43
EG
F8.
02×
10−6
s−1
2.89
×10
−2K
udlo
wet
al.(
1986
)
a 52
TG
F-β
=a 4
32.
89×
10−2
TW
Prod
uctio
nra
tes
a 11
Prol
ifer
atio
nra
teof
TE
Cs
(1.9
3×
10−5
–1.9
3×
10−4
)s−
10.
69–0
.07
TW
k ET
EC
prol
ifer
atio
npa
ram
eter
(3.3
19×
10−8
–6.3
19×
10−8
)g
cm−3
3.32
–6.3
2T
W
κT
EC
carr
ying
capa
city
(2.8
8×
10−3
–3.3
8×
10−3
)cm
3g−
18.
0–9.
39T
W
a 21
Tra
nsfo
rmra
tefr
omfib
robl
ast
6.6
×10
2cm
3g−
1s−
12.
61×
10−2
TW
a 22
Prol
ifer
atio
nra
teof
fibro
blas
t4.
38×
10−6
s−1
1.58
×10
−2K
unz-
Schu
ghar
teta
l.(2
003)
and
TW
a 31
Prol
ifer
atio
nra
teof
myo
fibro
blas
t1.
26×
10−6
s−1
4.53
×10
−3K
unz-
Schu
ghar
teta
l.(2
003)
and
TW
a 41
Prod
uctio
nra
teof
EG
Ffr
omfib
robl
ast
9.7
×10
−9s−
11.
26St
okes
and
Lau
ffen
burg
er(1
991)
,Sh
erra
ttan
dM
urra
y(1
990)
,C
hapl
ain
(199
6)an
dT
W
Ba 4
2Pr
oduc
tion
rate
ofE
GF
from
myo
fibro
blas
t1
≤B
≤10
Ba 4
1,1
≤B
≤10
TW
a 51
Prod
uctio
nra
teof
TG
F-β
from
TE
Cs
1.72
×10
−9s−
12.
03×
10−1
Val
ter
etal
.(19
99)
and
Wak
efiel
det
al.(
1987
)
123
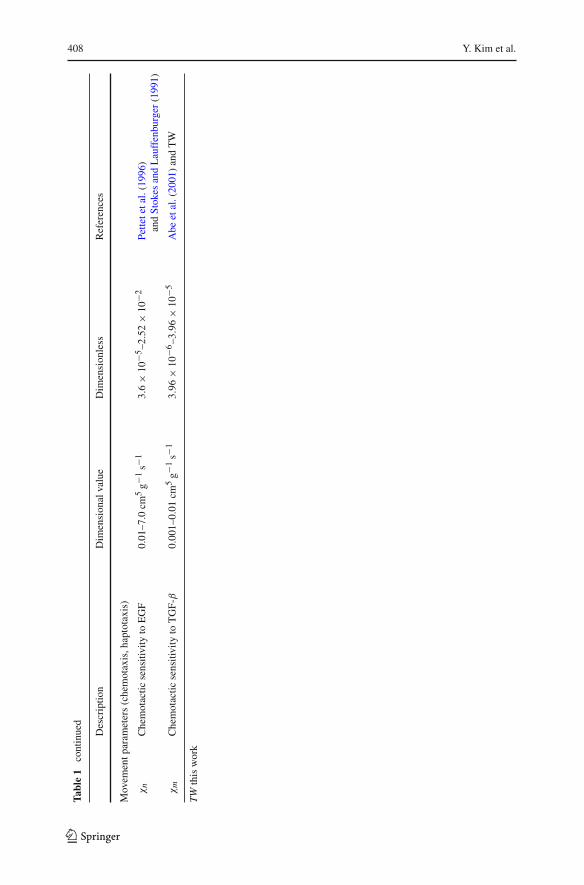
408 Y. Kim et al.
Tabl
e1
cont
inue
d
Des
crip
tion
Dim
ensi
onal
valu
eD
imen
sion
less
Ref
eren
ces
Mov
emen
tpar
amet
ers
(che
mot
axis
,hap
tota
xis)
χn
Che
mot
actic
sens
itivi
tyto
EG
F0.
01–7
.0cm
5g−
1s−
13.
6×
10−5
–2.5
2×
10−2
Pette
teta
l.(1
996)
and
Stok
esan
dL
auff
enbu
rger
(199
1)
χm
Che
mot
actic
sens
itivi
tyto
TG
F-β
0.00
1–0.
01cm
5g−
1s−
13.
96×
10−6
–3.9
6×
10−5
Abe
etal
.(20
01)
and
TW
TW
this
wor
k
123
Transformed epithelial cells and fibroblasts/myofibroblasts interaction 409
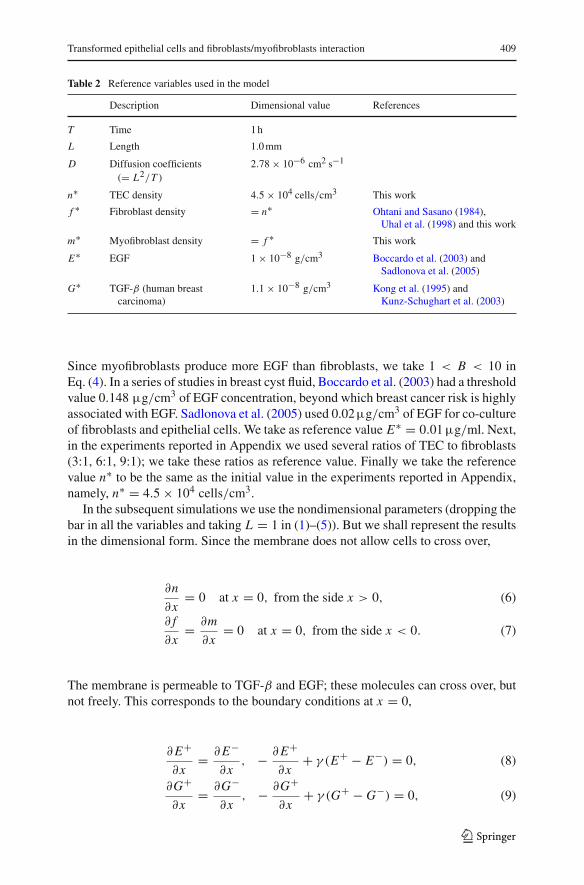
Table 2 Reference variables used in the model
Description Dimensional value References
T Time 1 h
L Length 1.0 mm
D Diffusion coefficients 2.78 × 10⁻⁶ cm2 s−1
(= L2/T )
n∗ TEC density 4.5 × 10⁴ cells/cm3 This work
f ∗ Fibroblast density = n∗ Ohtani and Sasano (1984),Uhal et al. (1998) and this work
m∗ Myofibroblast density = f ∗ This work
E∗ EGF 1 × 10⁻⁸ g/cm3 Boccardo et al. (2003) andSadlonova et al. (2005)
G∗ TGF-β (human breast 1.1 × 10⁻⁸ g/cm3 Kong et al. (1995) andcarcinoma) Kunz-Schughart et al. (2003)
Since myofibroblasts produce more EGF than fibroblasts, we take 1 < B < 10 inEq. (4). In a series of studies in breast cyst fluid, Boccardo et al. (2003) had a thresholdvalue 0.148 µg/cm3 of EGF concentration, beyond which breast cancer risk is highlyassociated with EGF. Sadlonova et al. (2005) used 0.02µg/cm3 of EGF for co-cultureof fibroblasts and epithelial cells. We take as reference value E∗ = 0.01 µg/ml. Next,in the experiments reported in Appendix we used several ratios of TEC to fibroblasts(3:1, 6:1, 9:1); we take these ratios as reference value. Finally we take the referencevalue n∗ to be the same as the initial value in the experiments reported in Appendix,namely, n∗ = 4.5 × 10⁴ cells/cm3.
In the subsequent simulations we use the nondimensional parameters (dropping thebar in all the variables and taking L = 1 in (1)–(5)). But we shall represent the resultsin the dimensional form. Since the membrane does not allow cells to cross over,
∂n
∂x= 0 at x = 0, from the side x > 0, (6)
∂ f
∂x= ∂m
∂x= 0 at x = 0, from the side x < 0. (7)
The membrane is permeable to TGF-β and EGF; these molecules can cross over, butnot freely. This corresponds to the boundary conditions at x = 0,
∂ E+
∂x= ∂ E−
∂x, − ∂ E+
∂x+ γ (E+ − E−) = 0, (8)
∂G+
∂x= ∂G−
∂x, − ∂G+
∂x+ γ (G+ − G−) = 0, (9)
123
410 Y. Kim et al.
where
E(x) ={
E+(x) if x > 0,
E−(x) if x < 0,G(x) =
{G+(x) if x > 0,
G−(x) if x < 0,(10)
and the parameter γ is determined by the size and density of the holes (see Friedmanet al. 1995 for the derivation of these boundary conditions by the method of homogeni-zation). If the size or density of the holes in the membrane is increased, the membranebecomes more permeable, and γ increases. We finally prescribe initial conditions,
n(x, 0) = 1.0 exp(−40(x − 1.0)2) on [0.5, 1], (11)
f (x, 0) = 1.0 exp(−40(x)2) ∗ r f on [0, 0.5], (12)
m(x, 0) = 0.00 on [0, 0.5], (13)
E(x, 0) = 1.0 on [0, 1], (14)
G(x, 0) = 1.0 on [0, 1], (15)
where r f is a parameter that determines initial ratio of tumor cells to fibroblasts.
3 Results
In the following simulations of the system (1)–(15) we shall determine the baseline ofthree important parameters: γ, B and a21; we do this by fitting the simulation resultsto experimental results. In Sect. 3.2 we shall perform sensitivity analysis for the fiveparameters γ, B, a21 and χn, χm . We shall find that the model’s results are sensitiveonly to B and a21.
3.1 Simulation and experimental results
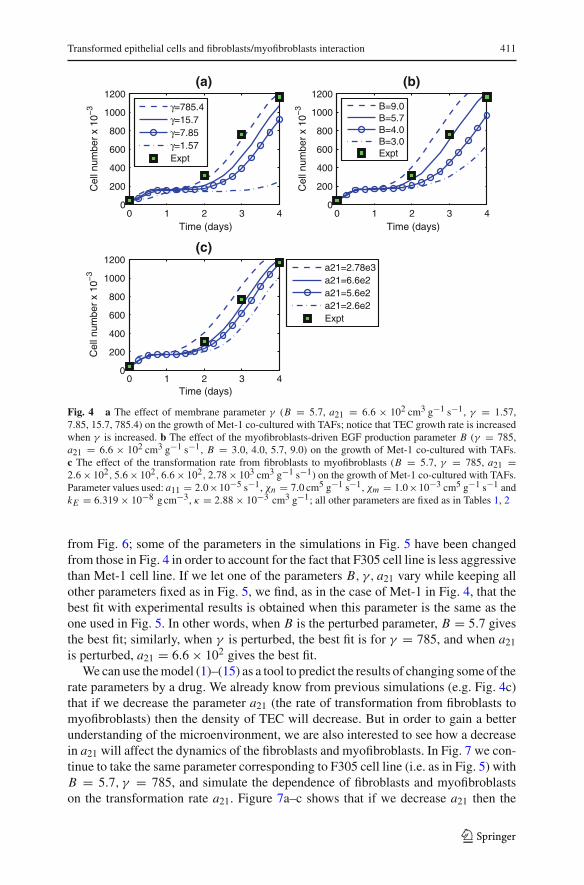
The curves in Fig. 4a are simulations of the tumor cells for different values of mem-brane parameter γ when B and the transformation rate a21 from fibroblasts to myofi-broblasts, are fixed. As the membrane parameter γ decreases, TEC density decreases.The curves in Fig. 4b are simulations of the tumor cells for different values of B whenγ and a21 are fixed. We see that the TEC density increases as the production rate ofEGF by myofibroblasts, Ba41, increases. Figure 4c shows the dependence of TEC ona21 when B and γ are fixed. The black squares in Fig. 4 are experimental results forMet-1 tumor cell line (to be described at the end of this section). The best fit withexperiments is obtained for B = 5.7, γ = 785 and a21 = 6.6 × 10².
In Fig. 5 we simulated the model with B = 5.7, γ = 785 mm−1 and a21 =6.6 × 102 cm3g−1s−1. Figure 5a shows the profile of all the variables at day 4. Wesee that tumor cells and fibroblasts/myofibroblasts move toward each other but cannotcross the membrane. On the other hand TGF-β and EGF move toward the membraneand cross it. The solid curve in Fig. 5b shows the growth of tumor cells over a period offour days. The black squares are experimental results with F305 tumor cell line taken
123
Transformed epithelial cells and fibroblasts/myofibroblasts interaction 411
0 1 2 3 40
200
400
600
800
1000
1200
Time (days)
Cel
l num
ber
x 10
−3
(a)
γ=785.4γ=15.7γ=7.85γ=1.57Expt
0 1 2 3 40
200
400
600
800
1000
1200
Time (days)
Cel
l num
ber
x 10
−3
(b)
B=9.0B=5.7B=4.0B=3.0Expt
0 1 2 3 40
200
400
600
800
1000
1200
Time (days)
Cel
l num
ber
x 10
−3
(c)a21=2.78e3a21=6.6e2a21=5.6e2a21=2.6e2Expt
Fig. 4 a The effect of membrane parameter γ (B = 5.7, a21 = 6.6 × 102 cm3 g−1 s−1, γ = 1.57,7.85, 15.7, 785.4) on the growth of Met-1 co-cultured with TAFs; notice that TEC growth rate is increasedwhen γ is increased. b The effect of the myofibroblasts-driven EGF production parameter B (γ = 785,a21 = 6.6 × 102 cm3 g−1 s−1, B = 3.0, 4.0, 5.7, 9.0) on the growth of Met-1 co-cultured with TAFs.c The effect of the transformation rate from fibroblasts to myofibroblasts (B = 5.7, γ = 785, a21 =2.6 × 10², 5.6 × 10², 6.6 × 10², 2.78 × 103 cm3 g−1 s−1) on the growth of Met-1 co-cultured with TAFs.Parameter values used: a11 = 2.0×10⁻⁵ s−1, χn = 7.0 cm5 g−1 s−1, χm = 1.0×10⁻³ cm5 g−1 s−1 andkE = 6.319 × 10⁻⁸ g cm−3, κ = 2.88 × 10⁻³ cm3 g−1; all other parameters are fixed as in Tables 1, 2
from Fig. 6; some of the parameters in the simulations in Fig. 5 have been changedfrom those in Fig. 4 in order to account for the fact that F305 cell line is less aggressivethan Met-1 cell line. If we let one of the parameters B, γ, a21 vary while keeping allother parameters fixed as in Fig. 5, we find, as in the case of Met-1 in Fig. 4, that thebest fit with experimental results is obtained when this parameter is the same as theone used in Fig. 5. In other words, when B is the perturbed parameter, B = 5.7 givesthe best fit; similarly, when γ is perturbed, the best fit is for γ = 785, and when a21is perturbed, a21 = 6.6 × 10² gives the best fit.
We can use the model (1)–(15) as a tool to predict the results of changing some of therate parameters by a drug. We already know from previous simulations (e.g. Fig. 4c)that if we decrease the parameter a21 (the rate of transformation from fibroblasts tomyofibroblasts) then the density of TEC will decrease. But in order to gain a betterunderstanding of the microenvironment, we are also interested to see how a decreasein a21 will affect the dynamics of the fibroblasts and myofibroblasts. In Fig. 7 we con-tinue to take the same parameter corresponding to F305 cell line (i.e. as in Fig. 5) withB = 5.7, γ = 785, and simulate the dependence of fibroblasts and myofibroblastson the transformation rate a21. Figure 7a–c shows that if we decrease a21 then the
123

412 Y. Kim et al.
0 0.5 10
5
10Tumor
0 0.5 10
2
4
x 10−8 Fibroblasts
0 0.5 10
0.1
0.2Myofibroblasts
0 0.5 1
7.9
8
8.1EGF
0 0.5 120.8
21
21.2
21.4
21.6
TGF−β
0 1 2 3 40
200
400
600
800
1000
1200
1400
1600
1800
(b)
Time (days)
Cel
l num
ber
x 10
−3
SimulationExperiment
(a)
Fig. 5 a Simulation results at day 4, b comparison of simulation results (solid curve) to experimentalresults (marked by squares) for F305 cell line. Simulation results are converted to cell number for com-parison. Dimensionless parameters γ = 785 and B = 5.7 are used for simulation; also a11 = 4.0 ×10⁻⁵ s−1, χn = 7.0 cm5 g−1 s−1, χm = 1.0 × 10⁻³ cm5 g−1 s−1, kE = 3.3196 × 10⁻⁸ g cm−3, andκ = 3.38 × 10⁻³ cm3 g−1; other parameters are fixed as in Tables 1, 2
Fig. 6 Growth of epithelial F-305 cells plated with no fibroblasts, normal mammary fibroblasts or tumor-igenic mammary fibroblasts. Cells were initially plated at a 1:6 ratio of fibroblasts to epithelial cells andthen counted on days 2, 3 and 4. NF normal fibroblasts, TAFs tumor associated fibroblasts
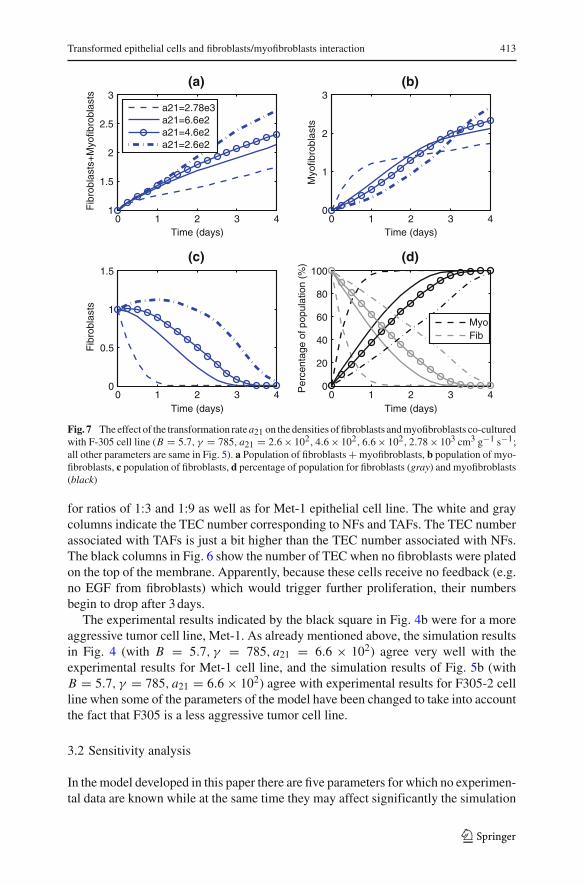
density of fibroblasts will increase but the total population density of fibroblasts andmyofibroblasts will decrease. This can be explained by the fact that the doubling timeof myofibroblasts is larger than the doubling time of fibroblasts. In Sect. 3.2 we shallperform sensitivity analysis with respect to the five parameters B, γ, a21, χn, χm in arange that includes the values B = 5.7, γ = 785 cm−1, a21 = 6.6×102 cm3 g−1 s−1,χn = 7.0 cm5 g−1 s−1, χm = 1.0 × 10⁻³ cm3 g−1 s−1.
We conclude this section by describing the experimental results that we used todetermine the parameters γ, B and a21.
Figure 6 summarizes the experimental results in the case of 1:6 ratio of fibroblaststo epithelial cells (for cell line F305-2); similar results (not shown here) were obtained
123
Transformed epithelial cells and fibroblasts/myofibroblasts interaction 413
0 1 2 3 41
1.5
2
2.5
3
Time (days)
Fib
robl
asts
+M
yofib
robl
asts
(a)
a21=2.78e3a21=6.6e2a21=4.6e2a21=2.6e2
0 1 2 3 40
1
2
3
Time (days)
Myo
fibro
blas
ts
(b)
0 1 2 3 40
0.5
1
1.5
Time (days)
Fib
robl
asts
(c)
0 1 2 3 40
20
40
60
80
100
Time (days)
Per
cent
age
of p
opul
atio
n (%
) (d)
MyoFib
Fig. 7 The effect of the transformation rate a21 on the densities of fibroblasts and myofibroblasts co-culturedwith F-305 cell line (B = 5.7, γ = 785, a21 = 2.6 × 10², 4.6 × 10², 6.6 × 10², 2.78 × 103 cm3 g−1 s−1;all other parameters are same in Fig. 5). a Population of fibroblasts + myofibroblasts, b population of myo-fibroblasts, c population of fibroblasts, d percentage of population for fibroblasts (gray) and myofibroblasts(black)
for ratios of 1:3 and 1:9 as well as for Met-1 epithelial cell line. The white and graycolumns indicate the TEC number corresponding to NFs and TAFs. The TEC numberassociated with TAFs is just a bit higher than the TEC number associated with NFs.The black columns in Fig. 6 show the number of TEC when no fibroblasts were platedon the top of the membrane. Apparently, because these cells receive no feedback (e.g.no EGF from fibroblasts) which would trigger further proliferation, their numbersbegin to drop after 3 days.
The experimental results indicated by the black square in Fig. 4b were for a moreaggressive tumor cell line, Met-1. As already mentioned above, the simulation resultsin Fig. 4 (with B = 5.7, γ = 785, a21 = 6.6 × 10²) agree very well with theexperimental results for Met-1 cell line, and the simulation results of Fig. 5b (withB = 5.7, γ = 785, a21 = 6.6 × 10²) agree with experimental results for F305-2 cellline when some of the parameters of the model have been changed to take into accountthe fact that F305 is a less aggressive tumor cell line.
3.2 Sensitivity analysis
In the model developed in this paper there are five parameters for which no experimen-tal data are known while at the same time they may affect significantly the simulation
123
414 Y. Kim et al.
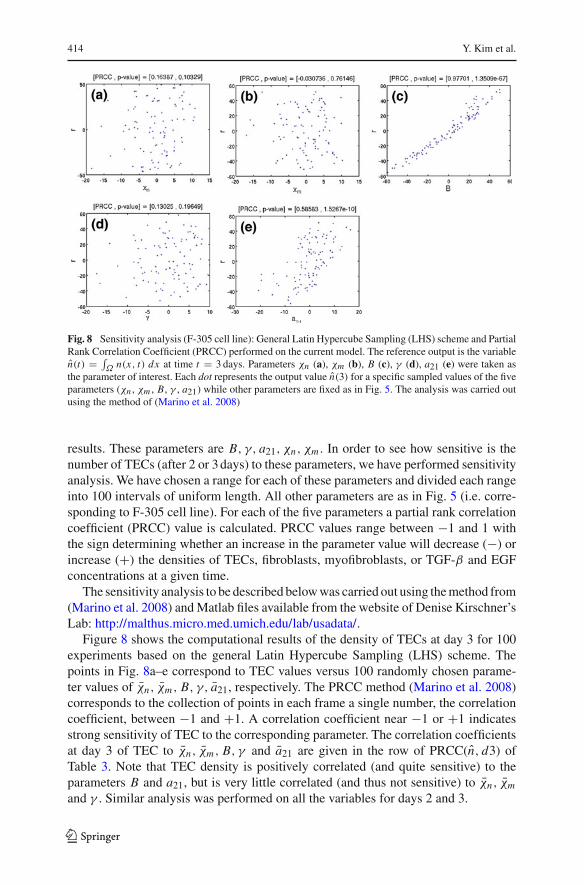
Fig. 8 Sensitivity analysis (F-305 cell line): General Latin Hypercube Sampling (LHS) scheme and PartialRank Correlation Coefficient (PRCC) performed on the current model. The reference output is the variablen(t) = ∫
Ω n(x, t) dx at time t = 3 days. Parameters χn (a), χm (b), B (c), γ (d), a21 (e) were taken asthe parameter of interest. Each dot represents the output value n(3) for a specific sampled values of the fiveparameters (χn , χm , B, γ , a21) while other parameters are fixed as in Fig. 5. The analysis was carried outusing the method of (Marino et al. 2008)
results. These parameters are B, γ, a21, χn, χm . In order to see how sensitive is thenumber of TECs (after 2 or 3 days) to these parameters, we have performed sensitivityanalysis. We have chosen a range for each of these parameters and divided each rangeinto 100 intervals of uniform length. All other parameters are as in Fig. 5 (i.e. corre-sponding to F-305 cell line). For each of the five parameters a partial rank correlationcoefficient (PRCC) value is calculated. PRCC values range between −1 and 1 withthe sign determining whether an increase in the parameter value will decrease (−) orincrease (+) the densities of TECs, fibroblasts, myofibroblasts, or TGF-β and EGFconcentrations at a given time.
The sensitivity analysis to be described below was carried out using the method from(Marino et al. 2008) and Matlab files available from the website of Denise Kirschner’sLab: http://malthus.micro.med.umich.edu/lab/usadata/.
Figure 8 shows the computational results of the density of TECs at day 3 for 100experiments based on the general Latin Hypercube Sampling (LHS) scheme. Thepoints in Fig. 8a–e correspond to TEC values versus 100 randomly chosen parame-ter values of χn, χm, B, γ, a21, respectively. The PRCC method (Marino et al. 2008)corresponds to the collection of points in each frame a single number, the correlationcoefficient, between −1 and +1. A correlation coefficient near −1 or +1 indicatesstrong sensitivity of TEC to the corresponding parameter. The correlation coefficientsat day 3 of TEC to χn, χm, B, γ and a21 are given in the row of PRCC(n, d3) ofTable 3. Note that TEC density is positively correlated (and quite sensitive) to theparameters B and a21, but is very little correlated (and thus not sensitive) to χn, χm
and γ . Similar analysis was performed on all the variables for days 2 and 3.
123
Transformed epithelial cells and fibroblasts/myofibroblasts interaction 415
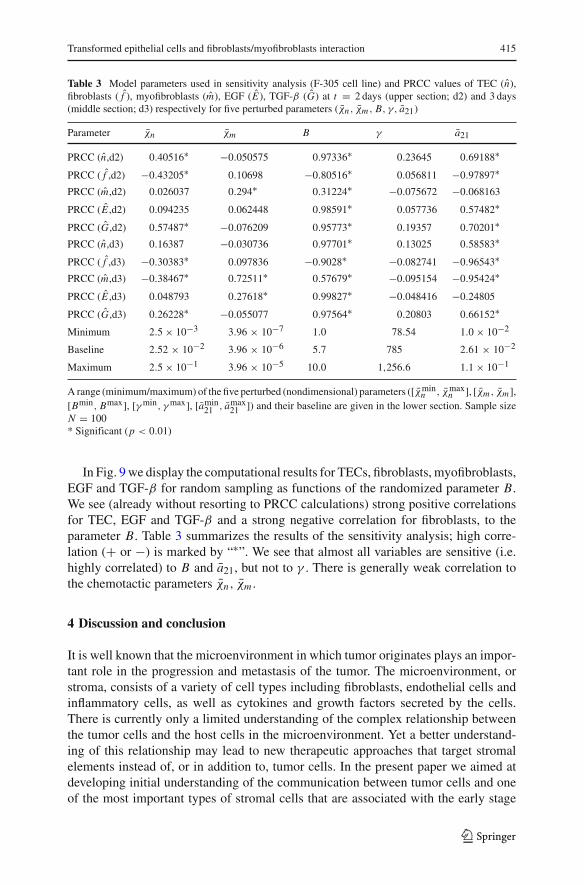
Table 3 Model parameters used in sensitivity analysis (F-305 cell line) and PRCC values of TEC (n),fibroblasts ( f ), myofibroblasts (m), EGF (E), TGF-β (G) at t = 2 days (upper section; d2) and 3 days(middle section; d3) respectively for five perturbed parameters (χn , χm , B, γ, a21)
Parameter χn χm B γ a21
PRCC (n,d2) 0.40516∗ −0.050575 0.97336∗ 0.23645 0.69188∗
PRCC ( f ,d2) −0.43205∗ 0.10698 −0.80516∗ 0.056811 −0.97897∗PRCC (m,d2) 0.026037 0.294∗ 0.31224∗ −0.075672 −0.068163
PRCC (E ,d2) 0.094235 0.062448 0.98591∗ 0.057736 0.57482∗
PRCC (G,d2) 0.57487∗ −0.076209 0.95773∗ 0.19357 0.70201∗PRCC (n,d3) 0.16387 −0.030736 0.97701∗ 0.13025 0.58583∗
PRCC ( f ,d3) −0.30383∗ 0.097836 −0.9028∗ −0.082741 −0.96543∗PRCC (m,d3) −0.38467∗ 0.72511∗ 0.57679∗ −0.095154 −0.95424∗
PRCC (E ,d3) 0.048793 0.27618∗ 0.99827∗ −0.048416 −0.24805
PRCC (G,d3) 0.26228∗ −0.055077 0.97564∗ 0.20803 0.66152∗
Minimum 2.5 × 10⁻³ 3.96 × 10⁻⁷ 1.0 78.54 1.0 × 10⁻²
Baseline 2.52 × 10⁻² 3.96 × 10⁻⁶ 5.7 785 2.61 × 10⁻²
Maximum 2.5 × 10⁻¹ 3.96 × 10⁻⁵ 10.0 1,256.6 1.1 × 10⁻¹
A range (minimum/maximum) of the five perturbed (nondimensional) parameters ([χminn , χmax
n ], [χm , χm ],[Bmin, Bmax], [γ min, γ max], [amin
21 , amax21 ]) and their baseline are given in the lower section. Sample size
N = 100* Significant (p < 0.01)
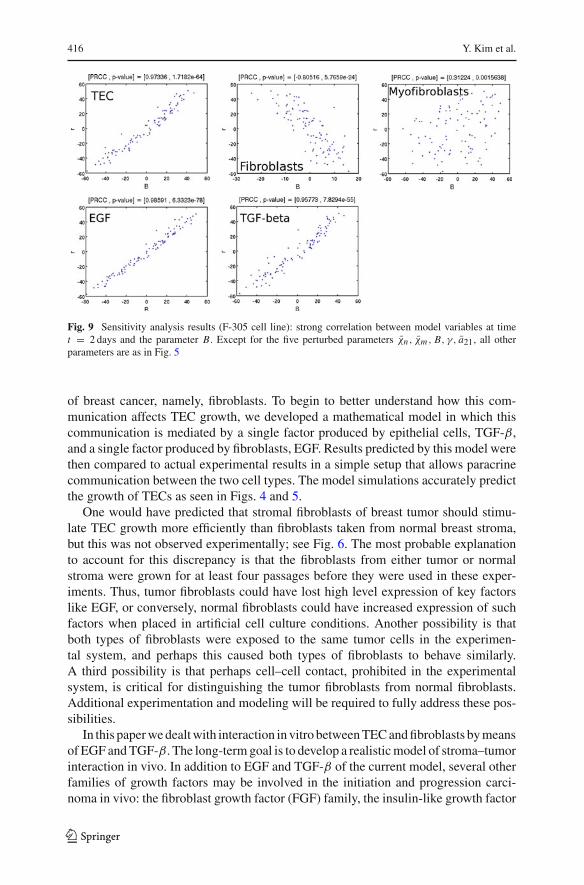
In Fig. 9 we display the computational results for TECs, fibroblasts, myofibroblasts,EGF and TGF-β for random sampling as functions of the randomized parameter B.We see (already without resorting to PRCC calculations) strong positive correlationsfor TEC, EGF and TGF-β and a strong negative correlation for fibroblasts, to theparameter B. Table 3 summarizes the results of the sensitivity analysis; high corre-lation (+ or −) is marked by “∗”. We see that almost all variables are sensitive (i.e.highly correlated) to B and a21, but not to γ . There is generally weak correlation tothe chemotactic parameters χn, χm .
4 Discussion and conclusion
It is well known that the microenvironment in which tumor originates plays an impor-tant role in the progression and metastasis of the tumor. The microenvironment, orstroma, consists of a variety of cell types including fibroblasts, endothelial cells andinflammatory cells, as well as cytokines and growth factors secreted by the cells.There is currently only a limited understanding of the complex relationship betweenthe tumor cells and the host cells in the microenvironment. Yet a better understand-ing of this relationship may lead to new therapeutic approaches that target stromalelements instead of, or in addition to, tumor cells. In the present paper we aimed atdeveloping initial understanding of the communication between tumor cells and oneof the most important types of stromal cells that are associated with the early stage
123
416 Y. Kim et al.
Fig. 9 Sensitivity analysis results (F-305 cell line): strong correlation between model variables at timet = 2 days and the parameter B. Except for the five perturbed parameters χn , χm , B, γ, a21, all otherparameters are as in Fig. 5
of breast cancer, namely, fibroblasts. To begin to better understand how this com-munication affects TEC growth, we developed a mathematical model in which thiscommunication is mediated by a single factor produced by epithelial cells, TGF-β,and a single factor produced by fibroblasts, EGF. Results predicted by this model werethen compared to actual experimental results in a simple setup that allows paracrinecommunication between the two cell types. The model simulations accurately predictthe growth of TECs as seen in Figs. 4 and 5.
One would have predicted that stromal fibroblasts of breast tumor should stimu-late TEC growth more efficiently than fibroblasts taken from normal breast stroma,but this was not observed experimentally; see Fig. 6. The most probable explanationto account for this discrepancy is that the fibroblasts from either tumor or normalstroma were grown for at least four passages before they were used in these exper-iments. Thus, tumor fibroblasts could have lost high level expression of key factorslike EGF, or conversely, normal fibroblasts could have increased expression of suchfactors when placed in artificial cell culture conditions. Another possibility is thatboth types of fibroblasts were exposed to the same tumor cells in the experimen-tal system, and perhaps this caused both types of fibroblasts to behave similarly.A third possibility is that perhaps cell–cell contact, prohibited in the experimentalsystem, is critical for distinguishing the tumor fibroblasts from normal fibroblasts.Additional experimentation and modeling will be required to fully address these pos-sibilities.
In this paper we dealt with interaction in vitro between TEC and fibroblasts by meansof EGF and TGF-β. The long-term goal is to develop a realistic model of stroma–tumorinteraction in vivo. In addition to EGF and TGF-β of the current model, several otherfamilies of growth factors may be involved in the initiation and progression carci-noma in vivo: the fibroblast growth factor (FGF) family, the insulin-like growth factor
123
Transformed epithelial cells and fibroblasts/myofibroblasts interaction 417
(IGF) family, and hepatocyte growth factor (HGF) (Bhowmick et al. 2004b). TGF-βis known to play a dual role as the inhibitor and promoter of tumor growth whilemost of the other factors are known to be stimulators of proliferation (Bhowmick et al.2004b). TGF-β can also be secreted by inflammatory cells and stromal fibroblasts inthe microenvironment (Gold 1999). There are also evidences (Bhowmick et al. 2004a;Kuperwasser et al. 2004) that carcinoma can be induced by genetic modification offibroblasts. For example, engineered fibroblasts with HGF or TGF-β1 expression caninduce development of ductal carcinoma in situ and adenocarcinoma whereas wild-type fibroblasts do not (Kuperwasser et al. 2004). TGF-β and EGF in appropriateconcentrations can also control SMADs (Chung et al. 2009; Kretzschmar et al. 1999),anti-proliferation proteins. While all these complex interactions between differentmolecules may play a significant role in breast cancer progression in vivo, our currentmodel system in vitro still represents a well-defined model system of the TEC–stromainteraction where EGF and TGF-β play significant roles for a biochemical connectionbetween TECs and fibroblasts.
The results of this paper serve as a starting point for more detailed modeling andexperimentation. For example, the size of the membrane pores can be adjusted in themodel to allow for cell contact. Alternatively, the pores can be covered with extracellu-lar matrix material, and the role of extracellular proteases in communication betweencell types could be modeled under these conditions. We indicate two directions forfurther development of in vivo and/or in vitro fibroblast-assisted invasion models:
(i) classical Boyden invasion array models (Yuan et al. 2006) can be used to exper-imentally investigate the role of fibroblasts in tumor invasion from one compart-ment to another. In these experiments, membrane holes are bigger than thosewe used here so that cells can migrate to the other compartment, and the mem-brane separating two compartments are usually coated with different type ofgel/ECM to mimic a basement membrane. These experiments can provide insightof how different ECM compositions influence tumor cell invasion, with the goalof developing a drug that will block or slow the tumor invasion. Based on thepresent paper we hope to investigate invasion behavior by mathematical modelsin tumor invasion assays with fibroblasts and tumor cells initially in differentcompartments.
(ii) It is also important to understand how this stroma–TEC interaction occurs invivo and how it leads to metastasis. Mechanical feedback from stroma near thebreast duct has been known to be one of the important players that can triggertumor growth/invasion as well as modulate breast cancer progression (Paszek andWeaver 2004; Paszek et al. 2005). Hybrid/multiscale models (see Kim et al. 2007for a review and models) have been developed in the context of tumor spheroidgrowth in vitro in different time/space scale. A multi-scale model has to addressseveral important issues: (a) the geometric effects on the fibroblasts–TEC inter-action (b) the mechanical (viscoelastic) feedback from stroma in a response tothe pressure acting on the wall of breast duct due to fibroblasts-driven expandingtumor inside the duct (c) the effect of intracellular dynamics that control TECproliferation. All these issues involve the TGF-β and EGF pathways for inhi-bition and enhancement of proliferation that has been described in Fig. 1. The
123
418 Y. Kim et al.
invasion of TECs into stroma leads to angiogenesis and metastasis, and survivalrate then dramatically drops at this stage. In these events proteolytic activityand unstable homeostasis near basal membrane is important and fibroblasts areknown to play a significant role in this degradation of basal membrane by secret-ing MMPs (Kalluri and Zeisberg 2006). A mechanistic model in real geometry(cylindrical duct) with experimental validation needs to be developed in orderto understand the role of stroma in assisting this desmoplasia and cancer devel-opment at the late stage. Building on the present paper we hope to investigatethe role of microenvironment in stroma on TEC invasion into the surroundingtissue.
In conclusion, we developed a novel model and verified a key prediction of themodel experimentally. Since the model was based on indirect interactions betweencells separated by a permeable membrane, our model probably best describes the ini-tial evolution of breast cancer, when the tumor cells are still confined to the mammaryduct. Our study may thus lead to new concepts useful for understanding and eventuallytargeting the early stages of cancer development.
Appendix: Materials and methods
We describe the method we used to obtain the experimental results, such as thosereported in Fig. 6. In early stage of breast tumor the TEC are confined to the mam-mary duct while the fibroblasts reside on the outside. Later on, as the basal membraneis broken and TECs invade into the stroma, these cells mix together with fibroblasts,and it is hard to define the clear boundary between tumor cells and fibroblasts. Inorder to understand the relationship between TECs and fibroblasts in the early stageof breast cancer, we conducted experiments in which these two types of cells are sep-arated by a membrane that allows only small molecules (such as TGF-β and EGF)to cross over. An epithelial cell line established from MMTV-PyMT mice was pro-vided by Dr. Jeffery Pollard. These cells were plated on well dishes at a density of4.5 ×104 cells/well in DMEM supplemented with 10% FBS and pen/strep and wereallowed to attach overnight. The following day 0.4µm cell culture inserts (Falcon)were placed in each well, as shown in Fig. 3; the insert is a circular semi-permeablemembrane with holes of diameter 0.4µm. Tumor associated fibroblasts were obtainedfrom mammary glands of 10-week-old female mice positive for the murine mam-mary tumor virus-polyoma middle T (MMTV-PyMT) transgene. Normal fibroblasts(NFs) were obtained from control FVB/N animals. Either tumor associated fibroblasts(TAFs) or normal fibroblasts were isolated from the mouse mammary tissue throughovernight collagenase digestion at 37◦C and gravity purification (modified from Souleand McGrath 1986). Either NFs or TAFs were plated on top of the cell culture inserts inDMEM supplemented with 10% FBS and pen/strep at ratios of 1:3, 1:6 or 1:9 relativeto the number of tumor epithelial cells. Cells were maintained at 37◦C in 5% CO2.Epithelial cells were counted in triplicate on days 2, 3 and 4 using a Coulter ParticleCounter (Beckman Coulter).
123
Transformed epithelial cells and fibroblasts/myofibroblasts interaction 419
References
Abe R, Donnelly S, Peng T, Bucala R, Metz C (2001) Peripheral blood fibrocytes: differentiation pathwayand migration to wound sites. J Immunol 166(12):7556–7562
Adams E, Newton C, Braunsberg H, Shaikh N, Ghilchik M, James V (1988) Effects of human breast fibro-blasts on growth and 17 beta-estradiol dehydrogenase activity of mcf-7 cells in culture. Breast CancerRes Treat 11(2):165–172
Bhowmick N, Chytil A, Plieth D, Gorska A, Dumont N, Shappell S, Washington M, Neilson E, MosesH (2004a) Tgf-beta signaling in fibroblasts modulates the oncogenic potential of adjacent epithelia.Science 303(5659):848–851
Bhowmick N, Neilson E, Moses H (2004b) Stromal fibroblasts in cancer initiation and progression. Nature432(7015):332–337
Boccardo F, Lunardi G, Petti A, Rubagotti A (2003) Enterolactone in breast cyst fluid: correlation with egfand breast cancer risk. Breast Cancer Res Treat 79(1):17–23
Bray D (1992) Cell movements. Gerland, New YorkBrown D (1999) Dependence of neurones on astrocytes in a coculture system renders neurones sensitive to
transforming growth factor beta1-induced glutamate toxicity. J Neurochem 72(3):943–953Campbell M, Wollish W, Lobo M, Esserman L (2002) Epithelial and fibroblast cell lines derived from a
spontaneous mammary carcinoma in a mmtv/neu transgenic mouse. In Vitro Cell Dev Biol Anim38(6):326–333
Chaplain MAJ (1996) Avascular growth, angiogenesis and vascular growth in solid tumours: The mathe-matical modeling of the stages of tumour development. Mathl Comput Model 23(6):47–87
Cheng J, Weiner L (2003) Tumors and their microenvironments: tilling the soil commentary re: A. m. scottet al., a phase i dose-escalation study of sibrotuzumab in patients with advanced or metastatic fibroblastactivation protein-positive cancer. Clin Cancer Res 9(5):1590–1595
Chung S, Miles F, Sikes R, Cooper C, Farach-Carson M, Ogunnaike B (2009) Quantitative modeling andanalysis of the transforming growth factor beta signaling pathway. Biophys J 96(5):1733–1750
Dalal B, Keown P, Greenberg A (1993) Immunocytochemical localization of secreted transforming growthfactor-beta 1 to the advancing edges of primary tumors and to lymph node metastases of humanmammary carcinoma. Am J Pathol 143(2):381–389
Farmer P, Bonnefoi H, Anderle P, Cameron D, Wirapati P, Becette V, Andre S, Piccart M, Campone M,Brain E, Macgrogan G, Petit T, Jassem J, Bibeau F, Blot E, Bogaerts J, Aguet M, Bergh J, Iggo R,Delorenzi M (2009) A stroma-related gene signature predicts resistance to neoadjuvant chemotherapyin breast cancer. Nat Med 15(1):68–74
Friedman A, Huang C, Yong J (1995) Effective permeability of the boundary of a domain. Commun PartialDiffer Equ 20(1–2):59–102
Gaffney E, Pugh K, Maini P, Arnold F (2002) Investigating a simple model of cutaneous wound healingangiogenesis. J Math Biol 45(4):337–374
Gold L (1999) The role for transforming growth factor-beta (TGF-beta) in human cancer. Crit Rev Oncog10(4):303–360
Hofland L, Burg B, Eijck C, Sprij D, Koetsveld P, Lamberts S (1999) Role of tumor-derived fibroblasts inthe growth of primary cultures of human breast-cancer cells: effects of epidermal growth factor andthe somatostatin analogue octreotide. Int J Cancer 60(1):93–99
Hooff A (1988) Stromal involvement in malignant growth. Adv Cancer Res 50:159–196Horgan K, Jones D, Mansel R (1987) Mitogenicity of human fibroblasts in vivo for human breast cancer
cells. Br J Surg 74(3):227–229Imai Y, Leung C, Friesen H, Shiu R (1982) Epidermal growth factor receptors and effect of epidermal growth
factor on growth of human breast cancer cells in long-term tissue culture. Cancer Res 42(11):4394–4398
Kalluri R, Zeisberg M (2006) Fibroblasts in cancer. Nat Rev Cancer 6(5):392–401Kim Y, Stolarska M, Othmer H (2007) A hybrid model for tumor spheroid growth in vitro i: theoretical
development and early results. Math Models Methods Appl Sci 17:1773–1798Koka S, Vance J, Maze G (1995) Bone growth factors: potential for use as an osseointegration enhancement
technique (oet). J West Soc Periodontol Periodontal Abstr 43(3):97–104Kong F, Anscher M, Murase T, Abbott B, Iglehart J, Jirtle R (1995) Elevated plasma transforming growth
factor-beta 1 levels in breast cancer patients decrease after surgical removal of the tumor. Ann Surg222(2):155–162
123
420 Y. Kim et al.
Kretzschmar M (2000) Transforming growth factor-beta and breast cancer: transforming growth factor-beta/smad signaling defects and cancer. Breast Cancer Res 2(2):107–115
Kretzschmar M, Doody J, Timokhina I, Massague J (1999) A mechanism of repression of tgfbeta/smadsignaling by oncogenic ras. Genes Dev 13(7):804–816
Kudlow J, Cheung C, Bjorge J (1986) Epidermal growth factor stimulates the synthesis of its own receptorin a human breast cancer cell line. J Biol Chem 261(9):4134–4138
Kunz-Schughart L, Wenninger S, Neumeier T, Seidl P, Knuechel R (2003) Three-dimensional tissue struc-ture affects sensitivity of fibroblasts to TGF-beta 1. Am J Physiol Cell Physiol 284(1):C209–C219
Kuperwasser C, Chavarria T, Wu M, Magrane G, Gray J, Carey L, Richardson A, Weinberg R (2004) Recon-struction of functionally normal and malignant human breast tissues in mice. Proc Natl Acad Sci USA101(14):4966–4971
Marino S, Hogue I, Ray C, Kirschner D (2008) A methodology for performing global uncertainty andsensitivity analysis in systems biology. J Theor Biol 254(1):178–196
Massague J (1998) Tgf-beta signal transduction. Ann Rev Biochem 67(1):753Mueller M, Fusenig N (2004) Friends or foes—bipolar effects of the tumour stroma in cancer. Nat Rev
Cancer 4(11):839–849Ogmundsdottir H, Petursdottir I, Gudmundsdottir I, Amundadottir L, Ronnov-Jessen L, Petersen O
(1993) Effects of lymphocytes and fibroblasts on the growth of human mammary carcinoma cellsstudied in short-term primary cultures. In Vitro Cell Dev Biol Anim 29A(12):936–942
Ohtani H, Sasano N (1984) Stromal cells of the fibroadenoma of the human breast. an immunohistochemicaland ultrastructural study. Virchows Arch A Pathol Anat Histopathol 404(1):7–16
Olsen L, Sherratt J, Maini P (1995) A mechanochemical model for adult dermal wound contraction and thepermanence of the contracted tissue displacement profile. J Theor Biol 177(2):113–128
Othmer H, Stevens A (1997) Aggregation, blowup, and collapse: the abc’s of taxis in reinforced randomwalks. SIAM J Appl Math 57(4):1044–1081
Paszek MJ, Weaver VM (2004) The tension mounts: mechanics meets morphogenesis and malignancy.J Mammary Gland Biol Neoplasia 9(4):325–342 (review)
Paszek MJ, Zahir N, Johnson KR, Lakins JN, Rozenberg GI, Gefen A, Reinhart-King CA, Margulies SS,Dembo M, Boettiger D, Hammer DA, Weaver VM (2005) Tensional homeostasis and the malignantphenotype. Cancer cell 8(3):241–254
Pettet GJ, Byrne HM, McElwain DLS, Norbury J (1996) A model of wound healing angiogenesis in soft-tissue. Math Bios 136:35–64
Rascle M, Ziti C (1995) Finite time blow-up in some models of chemotaxis. J Math Biol 33:388–414Ronnov-Jessen L, Deurs B, Celis J, Petersen O (1990) Smooth muscle differentiation in cultured human
breast gland stromal cells. Lab Invest 63(4):532–543Ronnov-Jessen L, Petersen O, Koteliansky V, Bissell M (1995) The origin of the myofibroblasts in breast
cancer. recapitulation of tumor environment in culture unravels diversity and implicates convertedfibroblasts and recruited smooth muscle cells. J Clin Invest 95(2):859–873
Sadlonova A, Novak Z, Johnson M, Bowe D, Gault S, Page G, Thottassery J, Welch D, Frost A (2005) Breastfibroblasts modulate epithelial cell proliferation in three-dimensional in vitro co-culture. Breast CancerRes 7(1):R46–R59
Samoszuk M, Tan J, Chorn G (2005) Clonogenic growth of human breast cancer cells co-cultured in directcontact with serum-activated fibroblasts. Breast Cancer Res 7:R274–R283
Sappino A, Skalli O, Jackson B, Schurch W, Gabbiani G (1988) Smooth muscle differentiation in stromalcells of malignant and non-malignant breast tissue. Int J Cancer 41:707–712
Schwarz L, Wright J, Gingras M, Kondaiah P, Danielpour D, Pimentel M, Sporn M, Greenberg A(1990) Aberrant TGF-beta production and regulation in metastatic malignancy. Growth Factors3(2):115–127
Sherratt JA, Murray JD (1990) Models of epidermal wound healing. Proc R Soc Lond B241:29–36Shi J, Badri K, Choudhury R, Schuger L (2006) P311-induced myofibroblasts exhibit ameboid-like migra-
tion through rala activation. Exp Cell Res 312(17):3432–3442Soule H, McGrath C (1986) A simplified method for passage and long-term growth of human mammary
epithelial cells. In Vitro Cell Dev Biol 22:6–12Stokes CL, Lauffenburger DA (1991) Analysis of the roles of microvessel endothelial cell random motility
and chemotaxis in angiogenesis. J Theor Biol 152:377–403Tamimi S, Ahmed A (1986) Stromal changes in early invasive and non-invasive breast carcinoma: an ultra-
structural study. J Pathol 150(1):43–49
123

Transformed epithelial cells and fibroblasts/myofibroblasts interaction 421
Thorne R, Hrabetov S, Nicholson C (2004) Diffusion of epidermal growth factor in rat brain extracellularspace measured by integrative optical imaging. J Neurophysiol 92(6):3471–3481
Tlsty T (2001) Stromal cells can contribute oncogenic signals. Semin Cancer Biol 11(2):97–104Tsukada T, McNutt M, Ross R, Gown A (1987) Hhf35, a muscle actin-specific monoclonal antibody. II.
Reactivity in normal, reactive, and neoplastic human tissues. Am J Pathol 127(2):389–402Uhal B, Ramos C, Joshi I, Bifero A, Pardo A, Selman M (1998) Cell size, cell cycle, and alpha-smooth
muscle actin expression by primary human lung fibroblasts. Am J Physiol 275(5 Pt 1):L998–L1005Valter M, Wiestler O, Pietsch T (1999) Differential control of vegf synthesis and secretion in human glioma
cells by il-1 and egf. Int J Dev Neurosci 17(5–6):565–577Wakefield L, Smith D, Masui T, Harris C, Sporn M (1987) Distribution and modulation of the cellular
receptor for transforming growth factor-beta. J Cell Biol 105(2):965–975Woodcock E, Land S, Andrews R (1993) A low affinity, low molecular weight endothelin-a receptor present
in neonatal rat heart. Clin Exp Pharmacol Physiol 20(5):331–334Yang Y, Dukhanina O, Tang B, Mamura M, Letterio J, MacGregor J, Patel S, Khozin S, Liu Z, Green J,
Anver M, Merlino G, Wakefield L (2002) Lifetime exposure to a soluble TGF-antagonist protectsmice against metastasis without adverse side effects. J Clin Invest 109(12):1607–1615
Yashiro M, Ikeda K, Tendo M, Ishikawa T, Hirakawa K (2005) Effect of organ-specific fibroblasts onproliferation and differentiation of breast cancer cells. Breast Cancer Res Treat 90(3):307–313
Yuan K, Singh R, Rezonzew G, Siegal G (2006) In vitro matrices for studying tumor cell invasion, cancermetastasis-biology and treatment. In: Cell motility in cancer invasion and metastasis, vol 8. Springer,Netherlands, pp 25–54
123