Transcription Profiling of Signal Transduction-Related Genes in Sugarcane Tissues
12
DNA Research 12, 27–38 (2005) Transcription Profiling of Signal Transduction-Related Genes in Sugarcane Tissues Fl´ avia Stal Papini-Terzi, 1,† Fl´ avia Riso Rocha, 1,† Ricardo Zorzetto Nicoliello Vˆ encio, 2 K´atiaCristina Oliveira, 1 Juliana de Maria Felix, 3,4 Renato Vicentini, 4 Cristiane de Souza Rocha, 4 Ana Carolina Quirino Sim˜ oes, 1 Eugˆ enio C´ esar Ulian, 5 Sˆ onia Marli Zingaretti di Mauro, 6 Aline Maria Da Silva, 1 Carlos Alberto de Braganc ¸a Pereira, 2 Marcelo Menossi, 3,4 and Gl´ aucia Mendes Souza 1,∗ Departamento de Bioqu´ ımica, Instituto de Qu´ ımica, Universidade de S˜ao Paulo, Av. Prof. Lineu Prestes, 748 05508-900, S˜ao Paulo, Brasil, 1 Departamento de Estat´ ıstica, Instituto de Matem´ atica e Estat´ ıstica, Universidadede S˜ao Paulo, Rua do Mat˜ ao, 101005508-090, S˜aoPaulo, Brasil, 2 Departamento de Gen´ etica e Evolu¸ c˜ ao, Instituto de Biologia, Universidade Estadual de Campinas, CP 6010, 13083-970, Campinas, Brasil, 3 Centro de Biologia Molecular e Engenharia Gen´ etica, Universidade Estadual de Campinas, CP 6010, 13083-970, Campinas, Brasil, 4 Centro de Tecnologia Copersucar, CP 162, 13400-970, Piracicaba, S˜ao Paulo, Brasil, 5 and Departamento de Tecnologia, Faculdade de Ciˆ encias Agr´arias e Veterin´ arias de Jaboticabal, Universidade Estadual Paulista, Centro de Estocagem Clones (BCCCenter) Via de Acesso Professor Paulo Donato Castellane, S/N 14870-000, Jaboticabal, S˜ao Paulo, Brasil 6 (Received 28 September 2004; revised 28 December 2004) Abstract A collection of 237,954 sugarcane ESTs was examined in search of signal transduction genes. Over 3,500 components involved in several aspects of signal transduction, transcription, development, cell cycle, stress responses and pathogen interaction were compiled into the Sugarcane Signal Transduction (SUCAST) Catalogue. Sequence comparisons and protein domain analysis revealed 477 receptors, 510 protein kinases, 107 protein phosphatases, 75 small GTPases, 17 G-proteins, 114 calcium and inositol metabolism proteins, and over 600 transcription factors. The elements were distributed into 29 main categories subdivided into 409 sub-categories. Genes with no matches in the public databases and of unknown function were also catalogued. A cDNA microarray was constructed to profile individual variation of plants cultivated in the field and transcript abundance in six plant organs (flowers, roots, leaves, lateral buds, and 1 st and 4 th internodes). From 1280 distinct elements analyzed, 217 (17%) presented differential expression in two biological samples of at least one of the tissues tested. A total of 153 genes (12%) presented highly similar expression levels in all tissues. A virtual profile matrix was constructed and the expression profiles were validated by real-time PCR. The expression data presented can aid in assigning function for the sugarcane genes and be useful for promoter characterization of this and other economically important grasses. Key words: Saccharum; sugarcane; microarray; signal transduction; transcriptome 1. Introduction The unraveling of signal transduction pathways is of strategic importance to the understanding of fundamen- Communicated by Satoshi Tabata ∗ To whom correspondence should be addressed. Tel. +55-11-3091-3815 ext. 216, Fax. +55-11-3091-2186, E-mail: [email protected] † The first two authors contributed equally to this work. ‡ Accession numbers: The gene expression data was deposited in The Gene Expression Omnibus (GEO) Database under ac- cess numbers GSE1702 (series), GPL1375 and GPL1376 (plat- forms) and GSM29453 to GSM29506 (samples). § Supplementary Materials can be found at http://www.sucest- fun.org/pub/SUCAST. tal processes such as growth and development as well as cellular responses triggered by biotic and abiotic stresses. In recent years, the wealth of information related to sig- nal transduction generated by several genome sequenc- ing projects, coupled with the global transcription profil- ing of a diversity of organisms, has brought many as- pects of signaling under scrutiny. Protein superfami- lies, such as protein kinases and transcription factors, have been systematically classified and analyzed follow- ing their identification by the sequencing projects 1–4 and comparative studies of complete genomes are defining the conserved signaling modules and revealing their inherent differences. 5–7 by guest on August 17, 2015 http://dnaresearch.oxfordjournals.org/ Downloaded from
-
Upload
independent -
Category
Documents
-
view
1 -
download
0
Transcript of Transcription Profiling of Signal Transduction-Related Genes in Sugarcane Tissues

DNA Research 12, 27–38 (2005)
Transcription Profiling of Signal Transduction-Related Genes in
Sugarcane Tissues
Flavia Stal Papini-Terzi,1,† Flavia Riso Rocha,1,† Ricardo Zorzetto Nicoliello Vencio,2
Katia Cristina Oliveira,1 Juliana de Maria Felix,3,4 Renato Vicentini,4 Cristiane de Souza Rocha,4
Ana Carolina Quirino Simoes,1 Eugenio Cesar Ulian,5 Sonia Marli Zingaretti di Mauro,6
Aline Maria Da Silva,1 Carlos Alberto de Braganca Pereira,2 Marcelo Menossi,3,4 andGlaucia Mendes Souza
1,∗
Departamento de Bioquımica, Instituto de Quımica, Universidade de Sao Paulo, Av. Prof. Lineu Prestes,748 05508-900, Sao Paulo, Brasil,1 Departamento de Estatıstica, Instituto de Matematica e Estatıstica,Universidade de Sao Paulo, Rua do Matao, 1010 05508-090, Sao Paulo, Brasil,2 Departamento de Geneticae Evolucao, Instituto de Biologia, Universidade Estadual de Campinas, CP 6010, 13083-970, Campinas,Brasil,3 Centro de Biologia Molecular e Engenharia Genetica, Universidade Estadual de Campinas, CP6010, 13083-970, Campinas, Brasil,4 Centro de Tecnologia Copersucar, CP 162, 13400-970, Piracicaba,Sao Paulo, Brasil,5 and Departamento de Tecnologia, Faculdade de Ciencias Agrarias e Veterinarias deJaboticabal, Universidade Estadual Paulista, Centro de Estocagem Clones (BCCCenter) Via de AcessoProfessor Paulo Donato Castellane, S/N 14870-000, Jaboticabal, Sao Paulo, Brasil6
(Received 28 September 2004; revised 28 December 2004)
Abstract
A collection of 237,954 sugarcane ESTs was examined in search of signal transduction genes. Over3,500 components involved in several aspects of signal transduction, transcription, development, cell cycle,stress responses and pathogen interaction were compiled into the Sugarcane Signal Transduction (SUCAST)Catalogue. Sequence comparisons and protein domain analysis revealed 477 receptors, 510 protein kinases,107 protein phosphatases, 75 small GTPases, 17 G-proteins, 114 calcium and inositol metabolism proteins,and over 600 transcription factors. The elements were distributed into 29 main categories subdivided into409 sub-categories. Genes with no matches in the public databases and of unknown function were alsocatalogued. A cDNA microarray was constructed to profile individual variation of plants cultivated inthe field and transcript abundance in six plant organs (flowers, roots, leaves, lateral buds, and 1st and4th internodes). From 1280 distinct elements analyzed, 217 (17%) presented differential expression in twobiological samples of at least one of the tissues tested. A total of 153 genes (12%) presented highly similarexpression levels in all tissues. A virtual profile matrix was constructed and the expression profiles werevalidated by real-time PCR. The expression data presented can aid in assigning function for the sugarcanegenes and be useful for promoter characterization of this and other economically important grasses.Key words: Saccharum; sugarcane; microarray; signal transduction; transcriptome
1. Introduction
The unraveling of signal transduction pathways is ofstrategic importance to the understanding of fundamen-
Communicated by Satoshi Tabata∗ To whom correspondence should be addressed. Tel.
+55-11-3091-3815 ext. 216, Fax. +55-11-3091-2186, E-mail:[email protected]
† The first two authors contributed equally to this work.‡ Accession numbers: The gene expression data was deposited
in The Gene Expression Omnibus (GEO) Database under ac-cess numbers GSE1702 (series), GPL1375 and GPL1376 (plat-forms) and GSM29453 to GSM29506 (samples).
§ Supplementary Materials can be found at http://www.sucest-fun.org/pub/SUCAST.
tal processes such as growth and development as well ascellular responses triggered by biotic and abiotic stresses.In recent years, the wealth of information related to sig-nal transduction generated by several genome sequenc-ing projects, coupled with the global transcription profil-ing of a diversity of organisms, has brought many as-pects of signaling under scrutiny. Protein superfami-lies, such as protein kinases and transcription factors,have been systematically classified and analyzed follow-ing their identification by the sequencing projects1–4 andcomparative studies of complete genomes are defining theconserved signaling modules and revealing their inherentdifferences.5–7
by guest on August 17, 2015
http://dnaresearch.oxfordjournals.org/D
ownloaded from

28 The SUCAST Catalogue [Vol. 12,
The tropical crop sugarcane (Saccharum sp.) is ofgreat economical interest, contributing to about two-thirds of the world’s raw sugar production. In somecountries, part of the crop is also destined to the produc-tion of ethanol, a less polluting fuel alternative. Tradi-tional breeding programs that select for varieties showinghigh productivity and resistance to stresses and diseasesare slow. Therefore, it could be greatly advantageousto have genes associated with desirable traits targetedfor directed improvement of sugarcane varieties. Withthe aim of expediting sugarcane genomics, the SUCESTconsortium (http://sucest.lad.ic.unicamp.br/public) se-quenced and annotated 237,000 expressed sequence tags(ESTs) derived from 26 cDNA libraries.8 The sequenceswere assembled into 43,141 contigs or sugarcane assem-bled sequences (SASs) covering an estimated 90% of theexpressed genome. As for all other cDNA and genomicsequences released, the challenge now is to attribute rel-evant biological information to the extracted data. Sev-eral studies have described particular features of sug-arcane’s general metabolism, growth and developmentbased on the analysis of the data from the SUCESTproject.9 Notwithstanding, given the enormous amountof data generated by a project of this magnitude, manytopics remain to be investigated. The SUCAST Project(Sugarcane Signal Transduction)10 is an ongoing effortthat aims to identify the sugarcane signaling componentsand define their role in grasses. In this study, we presentthe SUCAST Catalogue and its categories, and investi-gate gene expression patterns using cDNA microarrays.
2. Materials and Methods
2.1. AnnotationThe Sugarcane cDNA sequences can be found at
the SUCEST database (http://sucest.lbi.ic.unicamp.br/public/) and GenBank under Accession NumbersCA064599-CA301538. Members of the SUCAST cata-logue were identified using the BLAST algorithm11 withconserved protein sequences as drivers. Conserved pro-tein family domains were identified by searches at thePfam12 and SMART13 databases using default parame-ters.
2.2. PCR amplification and array printingSugarcane cDNA plasmid clones of 1,632 ESTs ob-
tained from the SUCEST collection were re-arranged andamplified in 100-µl PCR reactions (40 cycles, annealingat 51◦C), directly from bacterial clones in culture, us-ing T7 and SP6 primers. Ninety percent of the cloneshad their identity validated by re-sequencing. PCR prod-ucts were purified by filtration using 96-well filter plates(Millipore Multiscreen r© MAFBN0B50). Samples werevisualized on 1% agarose gels to inspect PCR amplifi-cation quality and quantity. Purified PCR products (in
10 mM Tris-HCl solution at pH 8.0) were mixed withan equal volume of DMSO in 384 well V-bottom plates.Microarrays were constructed by arraying cDNA frag-ments on DMSO optimized, metal-coated glass slides(type 7, Amersham Biosciences) using the GenerationIII Microarray Spotter (Molecular Dynamics/AmershamPharmacia Biotech). Each cDNA fragment was spottedon the slides at least four times (i.e., technical replicates).Following printing, the slides were allowed to dry and thespotted DNA was bound to the slides by UV cross-linking(50 mJ).
2.3. Sugarcane tissue samplesTwo different samples (i.e., biological samples) were
collected for cDNA microarray tissue profiling fromleaves (LV), flowers (FL), lateral buds (LB), roots (RT),first internode (IN1), and fourth internode (IN4) of dis-tinct plants. Five leaf samples, each from a single fieldgrown plant, were collected and tested for field variability(LV-1, LV-2, LV-a, LV-b, LV-c). Culms of the commer-cial variety SP80-3280 were planted in May 2001 and May2002 at the Copersucar Experimental Station. The firstleaf with a visible dewlap (leaf+1) was collected froma 12-month-old plant for the LV-1 sample, from a 14-month-old plant for the LV-2 sample (both planted in2001) and from 12-month-old plants for LV-a, LV-b andLV-c (planted in 2002). Two flower samples were col-lected from immature inflorescences (variety SP87-342)with 5 to 30 cm (FL-1) or ∼50 cm (FL-2) in length.Lateral bud and root samples derived from single-eyedseed setts were collected from 12- to 14-month-old fieldgrown plants (variety SP80-3280). For the LB-1 and RT-1 samples, seed setts were treated with Benlate (Beno-myl) 0.6 g/l and Decis (Deltamethrin) 5 ml/l, and ger-minated in the dark on wet paper towels for 10 days at25◦C. For the LB-2 and RT-2 samples, seed setts wereplanted in 200-ml plastic cups containing moist whitesand and tissues and were collected after 12 days. Theinternode samples were collected from field grown plantsof the commercial variety SP80-3280. For the IN1-1 andIN1-2 samples, the leaves were removed and the first andsecond internodes visible below the apical meristem wereused. For the IN4-1 and IN4-2 samples, the fourth in-ternode was collected. Also, an independent collectionof leaves, flowers, lateral buds, roots, first internode andfourth internode was performed, which were used in real-time PCR assays. Tissues were sectioned, frozen in liquidnitrogen, and stored at −80◦C.
2.4. RNA extractionFrozen tissues were ground using a homogenizer. Tis-
sue samples of 2–2.5 g were weighed and ground to afine powder in liquid nitrogen using a pre-cooled mortarand pestle. The pulverized tissue was transferred to a50-ml tube and homogenized with 5 ml of Trizol r© (Life
by guest on August 17, 2015
http://dnaresearch.oxfordjournals.org/D
ownloaded from

No. 1] F. S. Papini-Terzi et al. 29
Technologies) per gram of tissue, according to the man-ufacturer’s instructions. RNA pellets were resuspendedin 20 µl of warm diethyl pyrocarbonate-treated water,vortexing gently for about 15 min. RNA samples werequantified in a spectrophotometer and loaded on 1.0%agarose/formaldehyde gels for quality inspection. Anequimolar pool of RNA samples of five sugarcane tissues(flower, leaf, stem, root, bud) was prepared for use as acommon reference in all hybridizations.
2.5. Probe preparation and hybridizationTen micrograms of total RNA were reverse-
transcribed, labeled, and hybridized using the reagentsprovided with the CyScribe Post-Labeling kit (AmershamBiosciences), according to the manufacturer’s instruc-tions. The products of the labeling reactions were pu-rified in Millipore Multiscreen r© filtering plates to re-move unincorporated labeled nucleotides. Microarrayswere co-hybridized with the fluorescently labeled probes.Hybridizations were performed overnight at 42◦C in hu-mid chambers. The slides were then washed in 1×SSCand 0.2% SDS (10 min, 55◦C), twice in 0.1×SSC and0.2% SDS (10 min, 55◦C), and in 0.1×SSC (1 min, atroom temperature). Slides were rinsed briefly in filteredmilli-Q water and dried under a nitrogen stream. Eachexperimental step was carefully monitored to ensure highquality of the slides and extracted data. The hybridiza-tions were performed as displayed in Table 1.
2.6. Data acquisition, processing and statistical analysisSlides were scanned using the Generation III
ScannerTM (Molecular Dynamics) adjusting the photo-multiplier tube (PMT) to 700 for both channels. Imageswere processed and data collected using the ArrayVision(Imaging Research Inc.) software. Local median back-ground was subtracted from the median-based trimmedmean (MTM) density for each spot. Data from clonesthat generated poor quality PCR fragments (no amplifi-cation or unspecific bands) or poor quality spots (visu-ally inspected) were excluded. The data were stored andmanaged by the BioArray Software environment14 freeweb-based database.
A set of custom programs based on R language15
were developed for data processing based on methodsdescribed previously16 (available at http://verjo19.iq.usp.br/xylella/microarray/). Pearson correlation valuesamong the leaf samples were calculated using normal-ized expression ratios obtained from leaf versus poolhybridizations for 1,280 genes (Table S-1, http://www.dna-res.kazusa.or.jp/12/1/03/supplement/supplementt1.html). We used homotypic or ‘self-self’ hybridiza-tions of the reference pool sample to define intensity-dependent cutoff levels that would indicate differentiallyexpressed genes. Based on these results, eight inter-vals were set integrating the probability density func-
tion to 99.5% for different signal intensity levels, whichwere used to define differentially expressed genes inthe inspected tissues. Figure S1 (http://www.dna-res.kazusa.or.jp/12/1/03/supplement/supplement f1.html)shows the data from four ‘self-self’ hybridizations ofthe reference pool sample computed to establish thelimits of the random variations in the SUCAST mi-croarray experiments. The fluorescence ratios werenormalized to account for systematic errors using theLOWESS fitting17 and used to calculate the expres-sion ratios for all genes between the tissue sampleand the reference sample (Tables S-1, http://www.dna-res.kazusa.or.jp/12/1/03/supplement/supplementt1.html and S-2, http://www.dna-res.kazusa.or.jp/12/1/03/supplement/supplement t2.html). For everygene, the percentage of replicates within or outsidethe cutoff limits was calculated in each tissue sample(Table S-3, http://www.dna-res.kazusa.or.jp/12/1/03/supplement/supplement t3.html). Genes with at least70% of the replicate points above or below the cutoff lim-its were considered differentially expressed in that partic-ular sample, while genes with 55% of the points withinthe cutoff were considered ubiquitous among samples.
For the clustering analysis and the visualization ofa profile matrix, a single intensity value for each genewas obtained by calculating the median of all repli-cate points representing the same clone. Data wereclustered hierarchically using the unweighted pair-groupmethod average (UPGMA) algorithm with the euclid-ian distance as a measure. Further details are avail-able at the supplementary web site (http://www.sucest-fun.org/pub/SUCAST).
2.7. Validation of microarray results by real-time PCR(RT-PCR)
Five micrograms of total RNA were treated withDNAse (Promega) according to the manufacturer’s in-structions and an aliquot of 7.5 µl of the treated RNA wasreverse-transcribed using the SuperScript First-StrandSynthesis System for RT-PCR (Invitrogen). The 20-µlreverse transcription reactions contained the RNA tem-plate; 2 µl 10X RT buffer; 0.5 mM each dATP, dGTP,dCTP and dTTP; 50 ng random hexamers; 0.25 µgoligo(dT); 5 mM MgCl2; 10 mM DTT (dithiothreitol);40 U Rnase OUT; and 50 U SuperScript II ReverseTranscriptase. RNA, random hexamers, dNTPs, andoligo(dT) were mixed first, incubated at 70◦C for 5 minand placed on ice. Subsequently, the remaining compo-nents, except the SuperScript II Reverse Transcriptase,were added to the reaction and the mixture was heatedto 25◦C for 10 min and then incubated at 42◦C for 2 min.The SuperScript II Reverse Transcriptase was added toeach tube and the reaction was incubated at 42◦C for1.5 hr, 72◦C for 10 min, and chilled on ice. An identicalreaction without the reverse transcriptase was performed
by guest on August 17, 2015
http://dnaresearch.oxfordjournals.org/D
ownloaded from

30 The SUCAST Catalogue [Vol. 12,
Table 1. cDNA microarray hybridizations performed with sugarcane tissue samples. All hybridizations were performed against areference sample (pool of tissues composed of an equimolar mixture of flower, leaf, stem, root and bud RNA). The table indicateswhich CyDye was used to label each sample in each different hybridization.
Cy3 Cy5 Cy3 Cy5 Cy3 Cy5 Cy3 Cy5 Cy3 Cy5 Cy3 Cy5Pool vs. FL-1 Pool vs. LB-1 Pool vs. LV-1 Pool vs. RT-1 Pool vs. IN1-1 Pool vs. IN4-1Pool vs. FL-1 Pool vs. LB-1 Pool vs. LV-1 Pool vs. RT-1 Pool vs. IN1-1 Pool vs. IN4-2FL-1 vs. Pool LB-1 vs. Pool Pool vs. LV-2 RT-1 vs. Pool IN1-1 vs. Pool IN4-1 vs. PoolFL-2 vs. Pool LB-2 vs. Pool LV-1 vs. Pool RT-2 vs. Pool IN1-2 vs. Pool
LV-2 vs. PoolLV-a vs. PoolLV-b vs. PoolLV-c vs. Pool
1st internode 4th internodeflower lateral bud leaf root
as a control to confirm the absence of genomic DNA. ThecDNA product was treated with 2 U of RNAseH (Invit-rogen) for 30 min at 37◦C and for 10 min at 72◦C. Real-time PCR reactions were performed using SYBR GreenPCR Master Mix (Applied Biosystems) in a GeneAmp5,700 Sequence Detection System (Applied Biosystems).Primers were designed using the Primer Express 2.0 Soft-ware (Applied Biosystems). BLAST searches against theSUCEST database were conducted to ensure the speci-ficity of the selected primers. The primer sequencesdesigned are listed in Table S-4 (http://www.dna-res.kazusa.or.jp/12/1/03/supplement/supplement t4.html).Each reaction was performed in duplicate and contained2 µl of a 1:10 dilution of the synthesized cDNA, primersto a final concentration of 600 nM each, 12.5 µl of theSYBR Green PCR Master Mix and PCR-grade water toa total volume of 25 µl. The parameters for the PCRreaction were 50◦C for 2 min, 95◦C for 10 min, 40 cyclesof 95◦C for 15 sec and 60◦C for 1 min. The specificityof the amplified products was evaluated by the analysisof the dissociation curves generated by the equipment.Negative controls were also prepared in order to confirmthe absence of any contamination. The ratio between therelative amounts of the target gene and the endogenouscontrol gene in the RT-PCR reactions was determinedbased on the 2 −∆∆Ct method18 with modifications. Thenormalized expression level was calculated as L = 2−∆Ct
and ∆CT = CT,target − CT,reference, for each tissue. Toclassify a gene’s distribution of expression levels amongthe different tissues, ranging from ubiquitous to tissue-specific, we used the entropy measure19:
Hgene =∑
pt · log6(1/pt)
where pt = Lt/∑
Lt, Lt is the expression level of thegene in the t-th tissue, and the sums are taken over thesix tissues.
3. Results and Discussion
3.1. The SUCAST cataloguePlant responses to developmental and environmental
signals rely on the activity of different cellular compo-nents, which detect these signals and transduce themthrough the cytoplasm and nucleus to trigger the ap-propriate metabolic answer. These signaling pathwayscoordinate growth and development, as well as responsesto stress and pathogens. With the aim of creating a sig-nal transduction catalogue for sugarcane we undertook adetailed survey of 43 thousand transcripts identified bythe SUCEST project.8 This EST project sequenced the5′ and 3′ end of clones from 26 libraries prepared from 11different sugarcane tissues and plants submitted to threestress treatments. The large sampling of many tissuesallowed possibly 90% of the sugarcane expressed genesto be tagged.
We used BLAST11 searches, Pfam12 and SMART13
domain analyses to identify conserved signal transduc-tion components such as receptors, adapters, G-proteins,small GTPases, members of the two-component relay sys-tem, nucleotide cyclases, protein kinases, protein phos-phatases and elements of the ubiquitination machin-ery and infer their putative functions. Around 2000SASs encoding signal transduction related proteins andalso 611 transcription factors were indexed in the SU-CAST catalogue, which is organized into 29 categoriesand 409 subcategories (Table S-5, http://www.dna-res.kazusa.or.jp/12/1/03/supplement/supplement t5.html).These elements represent 5% of the total SASs from thecurrent SUCEST dataset. In addition, 717 SASs thatmight be involved in processes triggered by stress andpathogens or that may play a role in growth and devel-opment were also catalogued. Table 2 summarizes theSUCAST categories. The combined analysis of the sug-arcane EST data bank, by means of an in depth annota-tion and gene architecture analysis, generated a cataloguewith 3,563 members, which covers several aspects of sig-naling and transcription. It includes around 100 SASs
by guest on August 17, 2015
http://dnaresearch.oxfordjournals.org/D
ownloaded from

No. 1] F. S. Papini-Terzi et al. 31
Table 2. The SUCAST Catalogue. The number of SASs inthe catalogue and the number selected for the cDNA mi-croarray analysis for each category are shown. For a listof all SASs refer to the Supplementary Material, Table S-5(http : //www. dna - res. kazusa. or. jp/12 /1 /03 / supplement /supplement t5.html).
SUCAST classification
Protein categories:
Receptors 477 181Adapters 12 9G proteins 17 10Small GTPases 75 36Two component relayCyclase 1Calcium metabolismInositol metabolism 21Protein Phosphatases 107 36Protein kinases 510 65Ubiquitination 106 41Transcription factors 611 175Hormone biosynthesisHormone related 22
Functional categories:
Development 30 13Cell cycle 34Stress 305 119Pathogenicity 382 104
’No matches’ and unknown proteins 548 294Others 118 84
TOTAL 3563 1280
# SAS in array# SAS
46
10
1375 30
19 8
68 310
the
for hormone biosynthesis10 and also 548 SASs with nosimilarities to known proteins, which were selected dueto our interest in associating function to new genes.
On the basis of sequence analysis, it has been inferredthat 13% of the Arabidopsis genes are involved in tran-scription or signal transduction.20 The automated cat-egorization of the SUCEST data indicated that 13.6%of the tagged genes belong to these categories.8 With agenome size expected to be similar to the rice genome, thesugarcane genome might have around 3 thousand genesencoding putative signal transduction components.
3.2. The SUCAST cDNA microarrayTo evaluate the expression profile of the SUCAST com-
ponents in different sugarcane tissues we constructedglass slide cDNA microarrays with PCR products derivedfrom 1632 cDNA clones. For 21% of the clones we couldnot obtain satisfactory PCR fragments and the corre-sponding data were removed from the analysis. There-fore, data of transcript abundance for 1,280 SASs arepresented as indicated in the categories of Table 2. As a
reference sample in all microarray hybridizations we usedan equimolar pool of total RNA extracted from flowers,lateral buds, leaves, stems and roots.
3.3. Assessing individual variability in the fieldSince sugarcane is propagated vegetatively, the genetic
variability among the individuals should be low. Ex-pression patterns obtained assaying few individuals ofthe same variety should be representative of a popula-tion in the field, provided that growth conditions aresimilar. To minimize individual differences and differ-ences attributable to local field variations, RNA sam-ples were typically obtained from more than one plantin our experiments. Even so, we reasoned that it wouldbe important to evaluate whether the individual vari-ability was as low as expected. With that purpose,we collected leaves from five different sugarcane individ-ual stools and extracted the RNA separately. Leaveswere collected in May 2002 (LV-1), July 2002 (LV-2)and May 2003 (LV-a, LV-b, LV-c). The RNA sampleswere labeled and hybridized to the microarrays againstthe reference sample (Table S-1, http://www.dna-res.kazusa.or.jp/12/1/03/supplement/supplement t1.html).Pair-wise Pearson correlation calculations show a highcorrelation between leaves of the three individualscollected at the same time or within a short in-terval of time (p=0.84 to 0.88), and a lower cor-relation between individuals collected in differentyears (p=0.61 to 0.64) (Fig. S2, http://www.dna-res.kazusa.or.jp/12/1/03/supplement/supplement f2.html).The results imply sufficiently low individual variationwithin each sampling event, and even between closeevents, and indicate that pooling a large number of plantsto represent a subpopulation is not necessary.
3.4. Differentially and evenly distributed genesTotal RNA samples extracted from six different sug-
arcane tissues were labeled and hybridized to the mi-croarrays against the reference sample. Two different bi-ological samples of each tissue were analyzed, and theresults of at least two technical replicates were com-puted. Median ratio values for each gene in each sam-ple can be found in Table S-2 (http://www.dna-res.kazusa.or.jp/12/1/03/supplement/supplement t2.html).Cutoff limits for differential expression were calculatedbased on ‘self-self’ hybridizations (see Methods). To es-timate replicate data consistency, the expression ratioversus signal intensity data of the replicates of a givengene in different ‘tissue vs. pool’ hybridizations (Table 1)were studied (Fig. 1). Genes with at least 70% of thereplicate points outside the cutoff limits (above or be-low) in both biological samples of one or more tissueswere considered differentially expressed, whereas geneswith more than 55% of the replicates within the cutofflimits were considered ubiquitous. Figure 1 shows four
by guest on August 17, 2015
http://dnaresearch.oxfordjournals.org/D
ownloaded from

32 The SUCAST Catalogue [Vol. 12,
Figure 1. Differential expression consistency. a through d - Normalized log ratios against log average intensity plots, where M=log2(Cy5/ Cy3), and S=log2(0.5∗(Cy5+Cy3)). The graphics correspond to examples of the data distribution of the technical replicates fora gene we considered to have tissue-increased expression (a), ubiquity or no differential expression (b), low reproducibility (c), ortissue-reduced expression (d). The bars indicate the intensity-dependent cutoffs. E - Global distribution of SUCAST microarraydata. The position of each dot in the triangle relates to the percentage of reproducible replicates in each hybridization. The areasA, B, C and D contain data as exemplified in the corresponding graphics a, b, c and d.
Table 3. Distribution of differentially expressed and ubiquitous genes among sugarcane tissue samples. Genes with at least 70% ofreplicate points outside the cutoff limits in both biological samples of one or more tissues were considered differentially expressed,whereas genes with more than 55% of replicates within the cutoff limits in all samples were considered ubiquitous. The percentageof genes with expression above, within or below the ratio cutoff limits are indicated for each sample.
tissue sample % of genesabove
% of geneswithin
% of genesbelow
% of genesvariable
Total # of SASanalyzed
flowers FL-1 3.19% 78.59% 8.33% 9.89% 1224FL-2 5.00% 80.15% 6.87% 7.97% 1179
lateral buds LB-1 1.18% 90.10% 3.47% 5.25% 1182LB-2 4.61% 77.30% 5.36% 12.73% 1194
leaves LV-1 8.84% 72.50% 9.98% 8.67% 1222LV-2 7.36% 76.05% 9.13% 7.46% 1073
roots RT-1 5.52% 80.46% 7.31% 6.71% 1177RT-2 11.78% 61.33% 10.46% 16.43% 1205
internodes IN1-1 .91% 86.34% 4.58% 5.16% 1201IN1-2 6.20% 69.31% 5.80% 18.69% 1225IN4-1 .40% 88.33% 1.91% 5.36% 1045IN4-2 8.26% 54.57% 10.77% 26.40% 1235
5.87% 76.02% 7.05% 11.05% 1180Average
3
4
cases of gene expression distribution: (a) over 70% of thedata points are above the cutoff limits, indicating thatthis gene was more expressed in the tissue being testedthan in the reference; (b) all the replicates are withinthe cutoff limits, indicating that there was no differen-tial expression; (c) a variable pattern among the repli-cates was observed, showing low reproducibility for theexpression levels of the gene; (d) over 70% of the data
points are below the cutoff limits, indicating that thisgene is less expressed in the tissue being tested than inthe reference. A graphical representation of the globaldistribution of the data in the M-S space, taking into ac-count the reproducibility of the technical replicates foreach gene in each hybridization is seen in Fig. 1e andsummarized in Table 3. The number of genes analyzedfor each tissue varied from 1045 to 1235, due to differ-
by guest on August 17, 2015
http://dnaresearch.oxfordjournals.org/D
ownloaded from

No. 1] F. S. Papini-Terzi et al. 33
ences in the quality of some spots in different slides. Themajority of the genes analyzed (avg. 76%) showed ex-pression levels in each particular tissue similar to thoseof the pool of tissues. This result is in agreement withthe observations of Obayashi and colleagues,21 who haveidentified a large cluster of ubiquitously expressed genesafter global macroarray analysis of the Arabidopsis tran-scriptome. It is important to note, however, that onlypart of the sugarcane transcriptome is represented in ourarray. Nevertheless, this could be an indication that themajority of the signaling elements in sugarcane are notdifferentially expressed in the different tissues analyzed.The highest percentages of preferential expression in onetissue were found in leaves (8.84% and 7.36%), in theRT-2 root sample (11.78%), and in the internode sampleIN4-2 (8.26%). Likewise, a high proportion of the genesin these samples showed reduced expression in one partic-ular tissue. The flower samples exhibited a high numberof underrepresented or non-expressed genes (8.33% and6.87%, respectively, for each of the two different biolog-ical samples). An average of 11% of the genes showed avariable pattern of expression, with high variation amongthe technical replicates.
For the majority of the genes present in our microar-ray there is little information in the literature regardingtissue distribution of transcripts. Cho and colleagues22
performed microarray hybridizations using samples fromseven different organs of maize. This approach allowedthe elucidation of organ relationships and the detectionof organ-specific gene expression. Recently, a compre-hensive study of organ-specific gene expression has beenreported for Arabidopsis.21 Other reports focus on a fewgenes or specific metabolic routes, involving families ofclosely related genes such as the MADS transcriptionfactors,23 genes involved in particular pathways such asthe acyl lipid metabolism,24 and often rely solely on ESTin silico data. Watson and collaborators25 described themapping of the proteome of the model legume barrelmedic (Medicago truncatula). Spatial mapping of thetranscriptome and proteome of diverse plant species canshed light on the regulation of many developmental path-ways.
Our results indicated 217 genes that presented dif-ferential expression in both biological samples in atleast one of the tissues analyzed. These elements wereclustered according to their expression patterns, ev-idencing groups of genes with marked expression inleaves, roots, or internodes (Fig. S3, http://www.dna-res.kazusa.or.jp/12/1/03/supplement/supplement f3.html).Smaller groups of genes with prominent expression inflowers and lateral buds were also uncovered. Table 4lists the SASs with enriched or reduced expression in thevarious tissues.
Several differentially expressed genes encode transcrip-tion factors. Among these, we detected ten genes highlyexpressed in flowers: a GARP transfactor, an AP2, four
zinc-finger and four MADS-box domain-containing pro-teins. MADS and the zinc finger YABBY transcriptionfactor play important roles during organ developmentand together with AP2 and zinc finger C3H proteins wereshown to have enhanced expression levels in flowers.26
A discrete group of eight receptor genes was foundto be preferentially expressed in leaves, most of whichare members of the receptor-like kinase (RLK) family.We also found a sugarcane receptor possibly involvedin signaling pathways in the sugarcane reproductive tis-sues. This SASs is very similar to MSP1 from rice andEXS/EMS1 from Arabidopsis. MSP1 and EXS/EMS1are genes expressed in reproductive tissues and, amongother functions, control the fate of germinative cells.27–29
These observations indicate that this SAS possibly rep-resents an ortholog of the MSP1 and EXS/EMS1 genes.Three SASs were found that code for putative receptorscontaining a protein kinase domain and a Ubox as pre-dicted by the SMART database.13 All of them showeda homogeneous transcript distribution among the tissuesanalyzed. One of them, SAS SCQSRT2031C08.g, pos-sesses a complex structure, comprised by TPRs (tetra-tricopeptide repeats), low complexity regions, a pkinasedomain and a Ubox domain followed by a ZnF NFXdomain (a presumed zinc binding domain) near the C-terminus. The U-box is believed to have a role inubiquitination.30 Protein kinases containing the U-boxdomain have already been reported for Arabidopsis.31
However, the function of these plant proteins remains tobe determined. Moreover, 13 receptors of unknown func-tion were found to have a differential expression pattern.Six of these presented predominant expression and sevenshowed weak expression in at least one of the tissues. Theelucidation of the expression profiles of new receptors isof great interest, since it can help in assigning putativefunctions to these proteins.
It is remarkable that several genes related to the ubiq-uitination system have been found to be more expressedin the internodes than in the other tissues examined. Theubiquitin/26S proteasome pathway32 is implicated in se-lected protein breakdown, used to control the level andactivity of proteins in a diverse range of metabolic routes.In sugarcane, an intense protein degradation activity inthe internodes could be related to their specialization insucrose storage.
A group of hormone-related elements, including fournitrilases and three lipoxygenases, showed prevalent ex-pression in root tissues. The nitrilases are homolo-gous to the Arabidopsis nit4 gene, which was character-ized as being predominantly expressed in roots.33 Thelipoxygenases (LOX) are a functionally diverse class ofdioxygenases implicated in physiological processes suchas growth, senescence, and stress responses in plants,that show different organ-specific expression in differentplants.34,35 Another group of hormone-related genes com-posed by members of biosynthetic pathways of salicylic
by guest on August 17, 2015
http://dnaresearch.oxfordjournals.org/D
ownloaded from

34T
heSU
CA
STC
atalogue[V
ol.12,
SAS Putative cellular function
flow
er
late
ral b
ud
leaf
root
inte
rnod
e 1
inte
rnod
e 4
SAS Putative cellular function
flow
er
late
ral b
ud
leaf
root
inte
rnod
e 1
inte
rnod
e 4
SAS Putative cellular function
flow
er
late
ral b
ud
leaf
root
inte
rnod
e 1
inte
rnod
e 4
SCCCRZ2001F07.g Calmodulin-binding protein + SCCCRZ1002H08.g Saposin B domain-containing protein + SCAGLR2011H07.g Thioredoxin - +SCCCCL2001B01.b Apyrase + - SCEPLB1043F03.g WD40 protein - SCRFLB1056D04.g Thioredoxin -SCCCRZ1C01H06.g Apyrase + - SCCCSD2001E05.g Thaumatin - - - SCJFLR1013A09.g Thiol protease -SCEZLB1012F10.g GNGC calmodulin-binding protein + - SCCCSD1003E02.g Thaumatin - - SCCCAD1001C08.g Peroxidase - P7X +SCCCRZ1003A03.g HSP70s (heat shock protein) - SCVPRZ2035H07.g R-gene Mlo + - SCCCRZ1002F06.g Enolase -SCEPLR1051D05.g Calreticulin - - - SCCCCL3080A08.g R-gene - NBS/LRR + SCCCCL2001G03.b istone deacetylase (HOS1-like) -SCRFLR2037F09.g Calreticulin - - - SCRLAD1098H03. g R-gene - NBS/LRR + SCUTST3084F06.g Stress related/Low temperature induced (LTI) - +SCEPSD1069D02.g Calreticulin - - SCBFAD1089A09. g R-gene - NBS/LRR + SCACCL6008H06.g Stress related/Low temperature induced (LTI) -SCEQRT2090E04.g Calreticulin - SCQSRZ3038H06.g R-gene - NBS/LRR + SCSBST3096E10.g Aquaporin (tonoplast intrinsic protein) - +SCRULR1020D11.g Fructose-bisphosphate aldolase + - SCCCLR1065F03.g R-gene - NBS/LRR - SCEQRT2100B02.g Aquaporin (tonoplast intrinsic protein) - +SCCCRZ2001F03.g Fructose-bisphosphate aldolase - SCBGLR1023D05.g R-genes transduction - lsd1 + SCCCLR1024C03.g Aquaporin (tonoplast intrinsic protein) +SCUTLR1058G02.g Cyclin III - - + - SCEQRT1028C03.g Pathogenicity - PR protein - - - - - SCJLFL4186B12.g Aquaporin (tonoplast intrinsic protein) -SCRLLR1038H01.g Zeaxanthin epoxidase (ABA2) - + - SCQSRT1036D03.g Pathogenicity - PR protein - - - - - SCCCST3001H12.g Aquaporin (tonoplast intrinsic protein) -SCJLLR1011C06.g Zeaxanthin epoxidase (ABA2) - SCACLR1036B06.g Protein kinase/CBL-interacting - + SCQGLR1085F11.g Dehydrin +SCRFLR1012D12.g itrilase - Auxin biosynthesis - - - + - SCEQRT2099H01.g Protein kinase - CDPK + SCEZST3149E09.g Glutathione S-transferase +SCCCCL6002B05.g itrilase - Auxin biosynthesis - + SCQSLR1018F05.g Protein kinase - CDPK + SCAGFL1089C03.g Glutathione S-transferase - -SCEZHR1047G06.g itrilase - Auxin biosynthesis + SCCCCL4001E05.g Protein kinase - GSK3-like - SCCCCL3002C09.b lutathione S-transferase - -SCEQRT1028H06.g Nitrilase - Auxin biosynthesis - - - SCCCRZ1003E02.g Protein kinase - MAPK + SCJLRT1020A09.g Glutathione S-transferase - - -SCVPLR2012A10.g ACC oxidase - Ethylene biosynthesis + SCSGRT2064G11.g Protein kinase - MAPK - + SCJLHR1028C12.g Histone H4 - - -SCJFRT1005C11.g ACC oxidase - Ethylene biosynthesis - SCJLST1025H09.g Protein kinase - cAMP dependent - SCSFHR1043G09.g S-adenosylmethionine synthase -SCSGCL6070B03.g ACC synthase - Ethylene biosynthesis + SCCCLR1076F09.g Protein kinase - S6 ribosomal-like + SCMCLR1122E10.g NADPH-ferrihemoprotein reductase + -SCSBAM1085B06.g Linoleic acid desaturase - Jasmonic acid biosynthesis - - SCEPRZ1010E06.g Protein Phosphatases - 2C - SCJLLR1011F11.g Acyl-coA-oxidase +SCUTLR2030B03.g Lipoxygenase - Jasmonic acid biosynthesis + - SCMCCL6048A12. g Protein Phosphatase 2A + SCJLRT1021D12.g Chalcone synthase +SCCCRT1001E01.g Lipoxygenase - Jasmonic acid biosynthesis - + SCEZRZ3052A09.g Protein Phosphatase 2A - SCVPLR2027D02.g Chalcone synthase - - -SCJFRT1007H07.g Lipoxygenase - Jasmonic acid biosynthesis - + SCMCST1051F08.g Dual Specificity Protein Phosphatases (DSPP) + SCUTRZ2022B12.g Fatty acid desaturase +SCEQRT1024E12.g Phenylalanine ammonia-lyase (SA biosynthesis) + - - SCSBHR1056H08.g Ethylene receptor EIN2 + - + SCCCLR1070D02.g Photosystem II oxygen-evolving enhancer (wound-induced) +SCSGAM1094D05.g Phenylalanine ammonia-lyase (SA biosynthesis) + SCJFST1017H03.g Receptor - NPH1-like - SCCCCL3004C07.b ranscription factor - ABL3/VP1 +SCCCLR2002F08.g Auxin repressed/dormancy-associated + + SCRUAD1133D10.b Photoreceptor - blue light - cry1 + SCSGFL5C05G12.g Transcription factor - Alfin-like -SCRLLR1038D05.g Jasmonate responsive protein - + + SCAGST3138B05.g Photoreceptor - blue light - cry1 + SCCCLR1079H06.g Transcription factor - Alfin-like -SCCCLR1001E04.g Rubisco - small subunit + - SCJFRZ2027C05.g Receptor - Clavata1 - - - SCCCRZ1001G10.g Transcription factor - Aux/IAA -SCRFLR1012F12.g Caffeic acid 3-O-methyltransferase - + SCBGFL5080E07.g EXS receptor kinase + - - SCVPFL1132B06.g Transcription factor - Aux/IAA -SCCCLR1C02F07.g yo-Inositol-1-phosphate synthase - - SCEZRZ1012E03.g Leucine-rich transmembrane kinase (LTK1) - - SCRLRZ3041C03.g Transcription factor - GARP +SCSBFL1109C05.g Cyclopropane fatty acid synthase - SCQSAM2100F06.g Leucine-rich transmembrane kinase (LTK1) - SCRLAM1010D08.g Transcription factor - knotted homeobox - - +SCACLR1126E09.g No match - + - SCAGLR1021B11.g Receptor Ser/Thr kinase + SCCCLR1066C06.g Transcription factor - HSF +SCBFSD2038H10.g No match + SCQSLR1061E06.g Receptor Ser/Thr kinase + SCCCRZ3002D03.g Transcription factor - LIM -SCBFST3136A06.g No match + SCSGAD1009D03.g Receptor Ser/Thr kinase + SCEPRZ1008F02.g Transcription factor - LIM -SCCCLR1001D09.g No match + SCSGRT2065D10.g Receptor Ser/Thr kinase - - + SCCCFL6003A11.g Transcription factor - MADS - - -SCRLFL3009C03.b No match + SCEZAM2058E08.g Receptor Ser/Thr kinase + SCSGSB1007G01.g Transcription factor - MADS + - -SCSBSB1051A09.g No match + SCJLST1020G08.g Receptor Ser/Thr kinase - SCCCLR2C03H07.g Transcription factor - MADS -SCCCCL1001H07.b No match + SCSBAM1086H09. g Receptor Ser/Thr kinase - SCSBSD1032G02.g Transcription factor - MADS -SCAGLR2026G12.g No match + SCEPLR1030G10.g Receptor Ser/Thr kinase - SCCCLR1C08G10.g Transcription - Myb/LHY/CAA1 +SCRFLR2034D09.g No match - - + SCJFRT1009B11.b Receptor Ser/Thr kinase + SCCCLR2003E10.g Transcription factor - NAC +SCRFLB2056A06.g No match - + SCVPCL6041G02.g Receptor Ser/Thr kinase - - - SCRLCL6032B05.g Transcription factor - NAM +SCCCLR1066G12.g No match + SCCCLB1023E12.g Receptor Ser/Thr kinase - - SCEPLB1042D02.g Transcription factor - NAC +SCBGLR1023G07.g No match - + + SCVPLR2005F07.g Receptor Ser/Thr kinase - - SCEZRT2019E05.g Transcription factor - NAC +SCCCLR2001E10.g No match + + SCJLRZ1021D12.g Receptor Ser/Thr kinase - SCCCLR1024F10.g Transcription factor - Auxin responsive - -SCCCCL3004C02.b No match + SCEQRT1029G10.g Receptor Ser/Thr kinase with lectin domain + SCCCLR1001D10.g Transcription factor - AP2-domain -SCRUAD1063D03.g No match + SCCCCL3120C09.g Receptor Ser/Thr kinase with LysM domain + SCUTLR2023G02.g Transcription factor - WRKY +SCJFST1012G07.g No match - SCCCRZ2003C02.g Receptor - Somatic embryogenesis + SCUTHR1065C05.g Transcription factor - Zinc finger/ C2C2 / YABBY +SCRUFL1022F09.g No match (non-coding) - - - - - SCMCST1053A06.g* Receptor - Somatic Embryogenesis - SCQSFL3031C01.g Transcription factor - Zn finger C3H -SCRLLR1111D02.g No match (non-coding) - - - SCQGST1031D02.g Receptor - Somatic embryogenesis - SCEZRZ1017C07.g Pumilio - Translation -SCRUFL1017D09.g* No match - - - SCBFSB1048C08.g S-receptor - + SCCCLR1077F09.g Response regulator (ARR-like) + - +SCMCAM1101G01.g No match - SCEPAM1017E02.g Wall-associated Ser/Thr kinase receptor - - SCACLR1057G02.g Response regulators (ARR-like) +SCUTAM2114F04.g No match - SCCCRT2001H11.g Small GTPase - Ar f + SCEPRT2048E07.g Response regulators (ARR-like) -SCJFST1009H11.g No match - SCCCLR1066D10.g Small GTPase - Ar f + SCVPCL6041F12.g Ubiquitin-specific protease - -SCCCCL4007H07.g No match - SCJLRT1019H05.g* mall GTPases - Ar f - SCSBFL4011F05.g Ubiquitin-conjugating enzyme E2 +SCEQLR1091A10.g 60S Ribosomal protein L23 - SCCCRT1001E12.g Small GTPase - Rab + SCACLR2014E12.g Ubiquitin-conjugating enzyme E2 +SCUTLR1037F12.g 60S Ribosomal protein L5 - SCBGLR1117A05.g Small GTPase -Ran - SCCCLR1C07A06.g Ubiquitin-conjugating enzyme E2 +SCACLR2022H05.g Acyl carrier protein-like - SCCCAD1004H02.g Catalase - - - SCCCRZ2001H09.g Ubiquitin-conjugating enzyme E2 +SCCCRZ2002C09.g lpha tubulin - SCSGRT2066D05.g Cytochrome P450 + SCCCRZ2C01F09.g Ubiquitin-conjugating enzyme E2 +SCSBAD1084C01.g lpha-2 tubulin - - SCJLRZ1024A03.g Cytochrome P450 + SCQGLR1019D10.g Ubiquitin-conjugating enzyme E2 +SCBFAD1045D12.g eta-glucosidase - - SCJFRT2055E06.b ytochrome P450 - CYP71C - - - - - SCCCLR1C01E03.g* Ubiquitination - F-box protein +SCCCLR1022F10.g lycine hydroxymethyltransferase - - SCCCRZ2C04A07.g Cytochrome P450 - CYP71E + SCSGLR1045F05.g Unknown protein +SCCCLR2002D04.g istone H4 - - - SCCCAM2001B04.g Cytochrome P450 - CYP71E + SCVPLR1049B12.g Unknown protein + -SCCCLR2002G09.g istone H4 - SCAGLR1064G02.g Cytochrome P450 - CYP73 + SCRFAM2129A08.g Unknown protein +SCCCRZ2001F06.g 60S ribosomal protein - SCSGFL4193B05.g Cytochrome P450 - CYP73 + SCBFRZ2045D11.g Unknown protein - - +SCEPAM2015H01.g* ATP-dependent DNA helicase + SCAGLR1043E04.g Cytochrome P450 - CYP74A + SCSBST3102C05.g Unknown protein +SCCCLR2002E04.g et v I pollen allergen + - SCEQRT1026H08.g Cytochrome P450 - CYP75 + SCSGSB1009D11.g Unknown protein +SCCCRT2001A03.g Homeodomain protein + SCMCAM2084B09.g Cytochrome P450 - CYP75 + SCRFLR2038D12.g Unknown protein - -SCCCRT2002B03.g ibosomal protein - SCEZRZ1012A02.g Cytochrome P450 - CYP90 - + SCCCRZ2C03B08.g Unknown protein -SCCCLR1067A05.g Sugar transporter + SCJLLB2077E09.g Dioxygenase - - + - SCSBSD2029F05.g Unknown protein -SCRUSB1062E12.g riacylglycerol lipase - - SCJFLR1074E10.g Cysteine proteinase precursor + + SCSGFL5C08F04.g Unknown protein - -
SCQGLR2032E12.g Unknown protein -* SAS identity not verified by re-sequencing
T
R
B
HHGBAA
M
NNN
S
C
H
G
T
-
-+
+
by guest on August 17, 2015 http://dnaresearch.oxfordjournals.org/ Downloaded from
No. 1] F. S. Papini-Terzi et al. 35
acid (phenylalanine ammonia-lyase), abscisic acid (zeax-anthin epoxidase), and ethylene (ACC oxidase, ACC syn-thase) biosynthetic pathways was mainly expressed inleaves.
We detected a caffeic acid 3-O-methyltransferase(COMT) gene expressed primarily in the fourth intern-ode. This enzyme is involved in lignin biosynthesis and,in association with other enzymes like the CCOMT (caf-feoyl CoA 3-O-methyltransferase), keeps in check thecontent and the composition of lignin in cells. A cor-relation between the lignin content of alfalfa internodesof progressive maturity and the activity of COMT andCCOMT has been demonstrated.36 A sugarcane COMThas been cloned and exhibited a peak of expression inculms.37 The SUCEST database indicates the presence offive complete sequences for this enzyme, that may repre-sent a promising target for sugarcane genetic engineeringwith the aim of modifying the content and/or composi-tion of sugarcane bagasse, allowing it to become a usefuland low cost raw material for paper production and ani-mal feed.
Among the 43,141 SASs in the SUCEST database, 35%did not show similarity to known proteins (no matches)and are therefore new genes of unknown function. Wefound nine no-matches to be predominantly expressed ininternodes, seven in leaves, two in roots and two in flowers(Table 4). The latter are non-coding transcripts. Theinvolvement of non-coding RNAs in floral developmenthas been described38–40 and thus it is possible that thesesugarcane elements are involved in gene regulation duringfloral development. Among all the SUCEST no-matches,2010 SASs correspond to sugarcane-specific non-codingsequences that could also contain regulatory elements.
In addition to the differentially expressed genes,we also investigated genes that showed similar ex-pression levels in all tissues. The identification of“housekeeping” genes is of great interest in expressionstudies, since they are valuable experimental controlsand indicate promoters useful for plant biotechnology.Among the analyzed genes, 153 presented over 55%of the replicate data points within the cutoff limitsfor all 12 samples analyzed (Table S-6, http://www.dna-res.kazusa.or.jp/12/1/03/supplement/supplementt6.html). A total of 35 no-matches were found amongthem, an indication that these sugarcane-specific genesmay have a central role in this plant’s physiology.
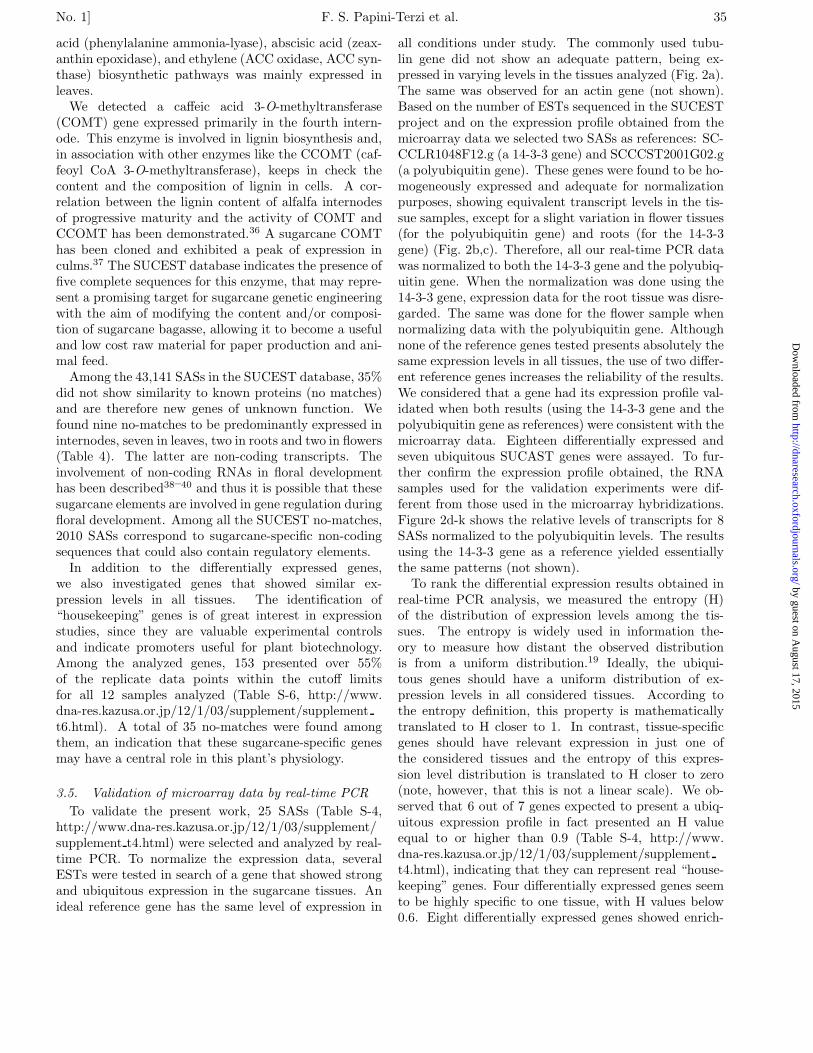
3.5. Validation of microarray data by real-time PCRTo validate the present work, 25 SASs (Table S-4,
http://www.dna-res.kazusa.or.jp/12/1/03/supplement/supplement t4.html) were selected and analyzed by real-time PCR. To normalize the expression data, severalESTs were tested in search of a gene that showed strongand ubiquitous expression in the sugarcane tissues. Anideal reference gene has the same level of expression in
all conditions under study. The commonly used tubu-lin gene did not show an adequate pattern, being ex-pressed in varying levels in the tissues analyzed (Fig. 2a).The same was observed for an actin gene (not shown).Based on the number of ESTs sequenced in the SUCESTproject and on the expression profile obtained from themicroarray data we selected two SASs as references: SC-CCLR1048F12.g (a 14-3-3 gene) and SCCCST2001G02.g(a polyubiquitin gene). These genes were found to be ho-mogeneously expressed and adequate for normalizationpurposes, showing equivalent transcript levels in the tis-sue samples, except for a slight variation in flower tissues(for the polyubiquitin gene) and roots (for the 14-3-3gene) (Fig. 2b,c). Therefore, all our real-time PCR datawas normalized to both the 14-3-3 gene and the polyubiq-uitin gene. When the normalization was done using the14-3-3 gene, expression data for the root tissue was disre-garded. The same was done for the flower sample whennormalizing data with the polyubiquitin gene. Althoughnone of the reference genes tested presents absolutely thesame expression levels in all tissues, the use of two differ-ent reference genes increases the reliability of the results.We considered that a gene had its expression profile val-idated when both results (using the 14-3-3 gene and thepolyubiquitin gene as references) were consistent with themicroarray data. Eighteen differentially expressed andseven ubiquitous SUCAST genes were assayed. To fur-ther confirm the expression profile obtained, the RNAsamples used for the validation experiments were dif-ferent from those used in the microarray hybridizations.Figure 2d-k shows the relative levels of transcripts for 8SASs normalized to the polyubiquitin levels. The resultsusing the 14-3-3 gene as a reference yielded essentiallythe same patterns (not shown).
To rank the differential expression results obtained inreal-time PCR analysis, we measured the entropy (H)of the distribution of expression levels among the tis-sues. The entropy is widely used in information the-ory to measure how distant the observed distributionis from a uniform distribution.19 Ideally, the ubiqui-tous genes should have a uniform distribution of ex-pression levels in all considered tissues. According tothe entropy definition, this property is mathematicallytranslated to H closer to 1. In contrast, tissue-specificgenes should have relevant expression in just one ofthe considered tissues and the entropy of this expres-sion level distribution is translated to H closer to zero(note, however, that this is not a linear scale). We ob-served that 6 out of 7 genes expected to present a ubiq-uitous expression profile in fact presented an H valueequal to or higher than 0.9 (Table S-4, http://www.dna-res.kazusa.or.jp/12/1/03/supplement/supplementt4.html), indicating that they can represent real “house-keeping” genes. Four differentially expressed genes seemto be highly specific to one tissue, with H values below0.6. Eight differentially expressed genes showed enrich-
by guest on August 17, 2015
http://dnaresearch.oxfordjournals.org/D
ownloaded from

36 The SUCAST Catalogue [Vol. 12,
Figure 2. Validation of microarray results using real-time PCR. a through c - Raw values of the log10 fluorescence were plotted againstthe cycle number for a tubulin gene (a), a polyubiquitin gene (b), and a 14-3-3 gene (c). Each tissue analyzed is represented by adifferent color. All the reactions were carried out in parallel and each reaction was performed in duplicate. d through k - Real-timePCR results for a Phosphatase - PP6 / catalytic subunit (d), a Cytochrome P450 - CYP71A (e), an EXS receptor kinase (f), alipoxygenase (g), a zeaxanthin epoxidase (h), SCACLR1126E09.g (no match) (i), LSD1 gene (j) and SCCCLR2001E10.g (no match)(k). The bars show target mRNA levels relative to the polyubiquitin mRNA. RT = root, LV = leaf, FL = flower, LB = lateral bud,IN1 = first internode, IN4 = fourth internode. The measured entropy (H) for each distribution obtained is indicated. Error barswere calculated as described by Livak and Schmittgen.18
ment in a particular tissue, as pointed out by the mi-croarray data, but were also expressed at high levels inother tissues. In these cases, the H values were higherthan the ones obtained for genes expressed in a singletissue, as expected, but were always lower than 0.9.
In summary, 18 out of the 25 genes tested (72%) had aprofile in real-time PCR assays consistent with the differ-ential or ubiquitous expression observed in the microar-ray experiments. It is important to stress that the RNAsamples used in the real-time PCR experiments derivedfrom a third biological sample, further suggesting thatthe data set generated in our microarray experiments isrobust in indentifying ubiquitous and differentially ex-pressed genes. The criteria used to select the differen-tially expressed and ubiquitous genes, although arbitrary,proved to be effective. The selection of data with at least70% of the replicates in agreement with the cutoff fordifferential expression and 55% for ubiquitous expressionwas adequate, as shown by the high validation rate ob-tained. The less stringent value for ubiquity proved tobe as effective probably because the genes selected hadsimilar expression in all biological samples of all tissues.
3.6. The SUCAST expression matrixAs pointed out previously, all hybridizations were
made against a common reference, consisting of a poolof tissues. When there are several samples to be com-pared, this strategy requires fewer hybridizations thana direct pair-wise setup, and is useful when there is nonatural control (like a non-treated sample) as in treat-ment versus control studies. Additionally, the pool oftranscripts theoretically represents the transcripts of alltissues, minimizing the occurrence of spots without a hy-bridization signal, for which it is not possible to calculatethe expression ratio.
Although this approach allowed us to identify ubiqui-tous and differentially expressed genes among the sug-arcane tissues, it generated relative — not absolute —information on the expression profiles. This means it ev-idences, for example, that a certain gene is more highlyexpressed in leaves than in the average of the tissues, butit does not tell us whether this same gene is more highlyexpressed in flowers than in roots. To get access to thistype of information, we calculated “virtual ratios” be-tween pairs of tissues using the reference values of thecommon sample (pool) as the common denominator.
This approach provided us with the expression pat-
by guest on August 17, 2015
http://dnaresearch.oxfordjournals.org/D
ownloaded from

No. 1] F. S. Papini-Terzi et al. 37
terns of each individual SAS in the SUCAST microar-ray among all tissues analyzed (Table S-7, http://www.dna-res.kazusa.or.jp/12/1/03/supplement/supplementt7.html and Fig. S4, http://www.dna-res.kazusa.or.jp/12/1/03/supplement/supplement f4.html). Addition-ally, the clustering of the patterns allows a spatial com-parative picture of transcript abundance, which cancomplement the information provided by the ratio cut-off analysis (that uses 70% replication stringency lev-els). Using the matrix, we could note expression pat-terns not evident in the previous analysis. As an ex-ample, all four of the MADS transcription factors thatwere identified as differentially expressed due to lowerexpression in roots or other tissues than in the ref-erence, are indicated by the matrix to be primarilyexpressed in flowers (Table S-7, http://www.dna-res.kazusa.or.jp/12/1/03/supplement/supplement t7.html),although only SAS SCSGSB1007G01.g had been classi-fied as such (Table 4).
3.7. ConclusionsThe success of the sugarcane culture has relied for
decades on traditional breeding of varieties resistant toplagues and diseases, with increased sucrose content, andmore adaptable to different soils and environmental con-ditions, a slow and uncertain approach. Therefore, ge-nomic data that could assist traditional breeding in theimprovement of sugarcane varieties are awaited. Thereare very few molecular studies on sugarcane signaling re-sponse to environmental changes, and none on the distri-bution of these components in the different plant tissues.The comparison of the transcript complement found insix tissues using microarrays provided a spatial pictureof the transcriptome of this grass, which can greatly con-tribute to the assignment of function to new genes. Thepresent work focused on the identification of genes thatmay participate in tissue-specific activities and ubiqui-tous genes. The cloning of strong ubiquitous promotersor tissue-specific promoters can increase the availabilityof tools for sugarcane transformation and study. Theidentification of genes highly expressed in stems or leavescould also help in the understanding of metabolic path-ways involved in sugar production and accumulation, andcould constitute targets for crop improvement. The de-scribed signaling elements are currently being studied insearch for candidates that might regulate hormone re-sponses, the accumulation of sucrose in the stalk, andthe response to several biotic and abiotic stresses allow-ing us to step forward in the efficient manipulation ofsugarcane varieties. The knowledge accumulated on therole for signal transduction processes in the regulationof stress and pathogenesis responses brings the SUCASTcomponents to center stage in the search for genes thatmight be modified to obtain plants with desired traits.
Acknowledgements: This work was funded byFAPESP (Fundacao de Amparo a Pesquisa do Estado deSao Paulo). We are indebted to Adriana Y. Matsukumaand Denise Yamamoto for technical assistance on mi-croarray printing and scanning performed in the lab-oratory of the Cooperation for Analysis of Gene Ex-pression (CAGE) inter-departmental Project, Dr. SergioVerjovski-Almeida and Dr. Hugo Aguirre Armelin fortheir support throughout the development of this work,Apua C. M. Paquola for valuable help providing bioin-formatic tools and Dr. Jesus Ferro for coordinating theSUCEST cDNA clone collection in the beginning ofthis work. AMdS was partially supported by ConselhoNacional de Desenvolvimento Cientıfico e Tecnologico,(CNPq). FSPT, FRR, RZNV, KCO and ACQS weresupported by FAPESP fellowships.
References
1. Manning, G., Plowman, G. D., Hunter, T., andSudarsanam, S. 2002a, Evolution of protein kinase sig-naling from yeast to man, Trends Biochem. Sci., 27(10),514–520.
2. Manning, G., Whyte, D. B., Martinez, R., Hunter, T.,and Sudarsanam, S. 2002b, The protein kinase comple-ment of the human genome, Science, 298(5600), 1912–1934.
3. Chen, W., Provart, N. J., Glazebrook, J. et al. 2002, Ex-pression profile matrix of Arabidopsis transcription fac-tor genes suggests their putative functions in response toenvironmental stresses, Plant Cell, 14(3), 559–574.
4. Gribskov, M., Fana, F., Harper, J. et al. 2001, PlantsP: afunctional genomics database for plant phosphorylation,Nucleic Acids Res., 29, 111–113.
5. Rives, A. W. and Galitski, T. 2003, Modular organizationof cellular networks, Proc. Natl. Acad. Sci. USA, 100(3),1128–1133.
6. Lin, J., Qian, J., Greenbaum, D. et al. 2002, GeneCen-sus: genome comparisons in terms of metabolic pathwayactivity and protein family sharing, Nucleic Acids Res.,30, 4574–4582.
7. McCarty, D. R. and Chory, J. 2000, Conservation and in-novation in plant signaling pathways, Cell, 103(2), 201–209.
8. Vettore, A. L., da Silva, F. R., Kemper, E. L. et al. 2003,Analysis and Functional Annotation of an Expressed Se-quence Tag Collection for the Tropical Crop Sugarcane,Genome Res., 13, 2725–2735.
9. Arruda, P. 2001, Sugarcane transcriptome. A landmarkin plant genomics in the tropics, Genetics and Mol. Biol.,24, 1–296.
10. Souza, G. M., Simoes, A. C. Q., Oliveira, K. C. et al.2001, The sugarcane signal transduction (SUCAST) cat-alogue: prospecting signal transduction in sugarcane,Genetics and Mol. Biol., 24(1–4), 25–34.
11. Altschul, S. F., Madden, T., Schaffer, A. et al. 1997,Gapped BLAST and PSI-BLAST: a new generation ofprotein database search programs, Nucleic Acids Res.,25, 3389–3402.
by guest on August 17, 2015
http://dnaresearch.oxfordjournals.org/D
ownloaded from

38 The SUCAST Catalogue [Vol. 12,
12. Sonnhammer, E. L. L., Eddy, S. R., Birney, E.,Bateman, A., and Durbin, R. 1998, Pfam: multiple se-quence alignments and HMM-profiles of protein domains,Nucleic Acids Res., 26, 320–322.
13. Schultz, J., Milpetz, F., Bork, P., and Ponting, C. P.1998, SMART, a simple modular architecture researchtool: identification of signaling domains, Proc. Natl.Acad. Sci. USA, 95(11), 5857–5864.
14. Saal, L. H., Troein, C., Vallon-Christersson, J.,Gruvberger, S., Borg, A., and Peterson C. 2002, Bioar-ray software environment: A platform for comprehensivemanagement and analysis of microarray data, GenomeBiol., 3, software0003.1–software0003.6.
15. Ihaka, R. and Gentleman, R. 1996, R: A language fordata analysis and graphics, Journal of Computationaland Graphical Statistics, 5, 299–314.
16. Koide, T., Zaini, P. A., Moreira, L. M. et al. 2004, DNAmicroarray-based genome comparison of a pathogenicand a non-pathogenic strain of Xylella fastidiosa delin-eates genes important for bacterial virulence, Journal ofBacteriology, 186, 5442–5449.
17. Yang, Y. H., Dudoit, S., Luu, P. et al. 2002, Normal-ization for cDNA microarray data: a robust compositemethod addressing single and multiple slide systematicvariation, Nucleic Acids Res., 30(4), e15.
18. Livak, K. J. and Schmittgen, T. D. 2001, Analysis ofrelative gene expression data using real-time quantitativePCR and the 2(-Delta Delta C(T)) Method, Methods,25(4), 402–408.
19. MacKay, D. 2003, Probability, entropy, and inference. In:Information Theory, Inference, and Learning Algorithms,Cambridge University Press, Cambridge, UK.
20. Arabidopsis Genome Initiative. 2000, Analysis of thegenome sequence of the flowering plant Arabidopsisthaliana, Nature, 408, 796–815.
21. Obayashi, T., Okegawa, T., Sasaki-Sekimoto, Y. et al.2004, Distinctive features of plant organs characterizedby global analysis of gene expression in Arabidopsis, DNARes. 11(1), 11–25.
22. Cho, Y., Fernandes, J., Kim, S. H., and Walbot, V. 2002,Gene-expression profile comparisons distinguish seven or-gans of maize, Genome Biol., 3(9), research0045.
23. Alvarez-Buylla, E. R., Liljegren, S. J., Pelaz, S. et al.2000, MADS-box gene evolution beyond flowers: expres-sion in pollen, endosperm, guard cells, roots and tri-chomes, Plant J., 24(4), 457–466.
24. Beisson, F., Koo, A. J. K., Ruuska, S. et al. 2003, Ara-bidopsis Genes Involved in Acyl Lipid Metabolism. A2003 Census of the Candidates, a Study of the Distribu-tion of Expressed Sequence Tags in Organs, and a Web-Based Database, Plant Physiol., 132, 681–697.
25. Watson, B. S., Asirvatham, V. S., Wang, L., andSumner, L. W. 2003, Mapping the Proteome of BarrelMedic (Medicago truncatula), Plant Physiol., 131, 1104–1123.
26. Henning, L., Gruissem, W., Grossniklaus, U., andKohler, C. 2004, Transcriptional programs of early repro-
ductive stages in Arabidopsis, Plant Physiol., 135,1765–1775.
27. Zhao, D. Z., Wang, G. F., Speal, B., and Ma, H. 2002,The excess microsporocytes1 gene encodes a putativeleucine-rich repeat receptor protein kinase that controlssomatic and reproductive cell fates in the Arabidopsis an-ther, Genes Dev., 16(15), 2021–2031.
28. Canales, C., Bhatt, A. M., Scott, R., and Dickinson,H. 2002, EXS, a putative LRR receptor kinase, regu-lates male germline cell number and tapetal identity andpromotes seed development in Arabidopsis, Curr. Biol.,12(20), 1718–1727.
29. Nonomura, K., Miyoshi, K., Eiguchi, M. et al. 2003, TheMSP1 gene is necessary to restrict the number of cellsentering into male and female sporogenesis and to initiateanther wall formation in rice, Plant Cell, 15(8), 1728–1739.
30. Aravind, L. and Koonin, E. V. 2000, The U box is a mod-ified RING finger — a common domain in ubiquitination,Curr Biol., 10, R132–134.
31. Azevedo, C., Santos-Rosa, M. J., and Shirasu, K. 2001,The U-box protein family in plants, Trends Plant Sci.,6(8), 354–358.
32. Vierstra, R. D. 2003, The ubiquitin/26S proteasomepathway, the complex last chapter in the life of manyplant proteins, Trends Plant Sci., 8(3), 135–142.
33. Bartel, B. and Fink, G. R. 1994, Differential regulation ofan auxin-producing nitrilase gene family in Arabidopsisthaliana, Proc. Natl. Acad. Sci. USA, 91(14), 6649–6653.
34. Kolomiets, M. V., Hannape, D. J., Chen, H., Tymeson,M., and Gladon, R. J. 2001, Lipoxygenase is involvedin the control of potato tuber development, Plant Cell,13(3), 613–626.
35. Porta, H. and Rocha-Sosa, M. 2002, Plant lipoxy-genases. Physiological and molecular features, PlantPhysiol., 130(1), 15–21.
36. Inoue, K., Sewalt, V. J., Murray, G. B., Ni, W.,Sturzer, C., and Dixon, R. A. 1998, Developmentalexpression and substrate specificities of alfalfa caffeicacid 3-O-methyltransferase and caffeoyl coenzyme A 3-O-methyltransferase in relation to lignification, PlantPhysiol., 117(3), 761–770.
37. Selman-Housein, G., Lopez, M., Hernandez, D. et al.1999, Molecular cloning of cDNAs coding for three sug-arcane enzymes involved in lignification, Plant Sci., 143,163–171.
38. Schmid, M., Uhlenhaut, N. H., Godard, F. et al. 2003,Dissection of floral induction pathways using global ex-pression analysis, Development, 130, 6001–6012.
39. Aukerman, M. J. and Sakai, H. 2003, Regulation of Flow-ering Time and Floral Organ Identity by MicroRNA andIts APETALA2-Like Target Genes. The Plant Cell, 15,2730–2741.
40. Chen, X. 2004, A MicroRNA as a Translational Repres-sor of APETALA2 in Arabidopsis Flower Development,Science, 303, 2022–2025.
by guest on August 17, 2015
http://dnaresearch.oxfordjournals.org/D
ownloaded from