Transcription factors induced by interferons alpha and gamma
8
Nucleic Acids Research, Vol. 18, No. 22 6573 Transcription factors induced by interferons ao and -y A.M.Ali Imam, Andrew M.Ackrill, Trevor C.Dale, Ian M.Kerr and George R.Stark* Imperial Cancer Research Fund, Lincoln's Inn Fields, London, WC2A 3PX, UK Received August 1, 1990; Revised and Accepted October 12, 1990 ABSTRACT Factors induced by interferons (IFNs) bind to the IFN- stimulated response elements (ISREs) of many genes. In human cells treated with type I ( a, 3) IFN, factor E is induced in about 1 min and factor M after about 1 hr. Factor G is induced after about 1 hr in cells treated with type 11 (-y) IFN. G and M have very similar positions in bandshift assays, sensitivities to cycloheximide, footprints on an ISRE and relative affinities for different ISREs. Four different patterns of expression were observed in different cell lines: E,M and G strongly induced; M and G strongly but E weakly; only E and M induced; only E induced. Transcription in response to IFN a is initiated by E and probably maintained by M since, in fibroblasts, M is present maximally when transcription is most active and declines together with transcription. In Bristol-8 cells, where induction of M is not detected, transcription is still induced by IFN a and still declines in its continued presence, suggesting that M is not essential for either process. A variant ISRE with two G-to-C mutations binds E especially weakly but M and G strongly. The mutations don't change the response of a reporter gene to IFN y but do abolish its response to IFN a, suggesting that the binding of M is not sufficient for the latter. G probably acts positively, since its appearance correlates well with induction of transcription by IFN e. A 39-bp ISRE from the 9-27 gene binds E much better than M or G. Conversely, a 39-bp ISRE from the 6 - 16 gene binds M and G much better than E. Different patterns of expression of E, M, and G and different affinities of these factors for alternative ISREs may play a part in modulating the relative responses of genes to type I and type 11 IFNs in vivo. INTRODUCTION Treatment of cells with interferons (IFNs) can lead to establishment of an anti-viral state, inhibition of cell growth, and induction of differentiation (reviewed in ref. 1). Type I ( a, 3) IFNs bind to one or more related receptors (2-4), while type I1 ( y) IFN binds to a unique receptor (5). Upon binding, a signal passes from the membrane to the nucleus, causing transcription of a set of genes to be initiated (6,7). Several IFN-induced genes have been cloned and comparisons of their upstream sequences have revealed interferon-stimulated response elements (ISREs), which confer inducibility by type I and type II IFNs (8). The core ISREs, 13 base pairs (bp) long, are highly conserved (9) but there is no obvious homology in the sequences immediately flanking them. We (9-11) and others (12-15) have shown that ISREs can bind to a number of factors present constitutively in untreated cells or induced in cells treated with IFN. The following factors, originally observed in different laboratories, are likely to be the same, although this is not yet directly proven. For convenience, we use single-letter abbreviations. C is a constitutive factor(s) that binds to ISREs, also called ISGF1 (13,15) and C1-C2 (ourselves and ref. 12). E is a factor induced rapidly by IFN a, also called ISGF3 (13,15) or C3 (12). M is a factor induced in 1-2 hr by IFN a, also called ISGF2 (13,15) or C1-C2 (12). G is a factor induced in 1-2 hr by IFN y, also called ISGF2 (16) or IBP-1 (17). The recent work of Pine et al. (16) has partially clarified the relationship between M and G since both factors seem to be encoded by the IRF-1 gene, previously identified by Miyamoto et al. (18). Yet M and G may still be functionally distinct due to post-translational modification or association with other induced factors, and evidence presented here gives support to such possibilities. C is different from M and G (16), despite its very similar binding characteristics (see below). The role of E as the induced factor responsible for initiating transcription in response to IFN a is well established (10,11,15) but the functions of M, G, and C are much less clear. M was proposed previously to be an IFN-induced negative regulator of transcription (15), a conclusion not in agreement with evidence presented here. We have examined the kinetics of expression of E, M, and G in different cells and correlated these with the kinetics of transcription of IFN-regulated genes. We also show that C, M, and G have very similar affinities for native, mutant and hybrid ISREs and that the relative affinities of E for these ISREs can be very different. A mutant ISRE with high affinity for M and G and low affinity for E is unchanged in its transcriptional response to IFN -y but has lost the response to IFN a characteristic of the wild-type ISRE. We now conclude that M is uniikely to have any negative effect and that it is neither necessary nor sufficient to initiate transcription in response to * To whom correspondence should be addressed + Present address: National Institute for Medical Research, The Ridgeway, Mill Hill, London, NW7 IAA, UK .=) 1990 Oxford University Press
-
Upload
independent -
Category
Documents
-
view
3 -
download
0
Transcript of Transcription factors induced by interferons alpha and gamma
Nucleic Acids Research, Vol. 18, No. 22 6573
Transcription factors induced by interferons ao and -y
A.M.Ali Imam, Andrew M.Ackrill, Trevor C.Dale, Ian M.Kerr and George R.Stark*Imperial Cancer Research Fund, Lincoln's Inn Fields, London, WC2A 3PX, UK
Received August 1, 1990; Revised and Accepted October 12, 1990
ABSTRACT
Factors induced by interferons (IFNs) bind to the IFN-stimulated response elements (ISREs) of many genes.In human cells treated with type I ( a, 3) IFN, factor Eis induced in about 1 min and factor M after about 1
hr. Factor G is induced after about 1 hr in cells treatedwith type 11 (-y) IFN. G and M have very similar positionsin bandshift assays, sensitivities to cycloheximide,footprints on an ISRE and relative affinities for differentISREs. Four different patterns of expression wereobserved in different cell lines: E,M and G stronglyinduced; M and G strongly but E weakly; only E andM induced; only E induced. Transcription in responseto IFN a is initiated by E and probably maintained byM since, in fibroblasts, M is present maximally whentranscription is most active and declines together withtranscription. In Bristol-8 cells, where induction of Mis not detected, transcription is still induced by IFN a
and still declines in its continued presence, suggestingthat M is not essential for either process. A variant ISREwith two G-to-C mutations binds E especially weaklybut M and G strongly. The mutations don't change theresponse of a reporter gene to IFN y but do abolish itsresponse to IFN a, suggesting that the binding of M isnot sufficient for the latter. G probably acts positively,since its appearance correlates well with induction oftranscription by IFN e. A 39-bp ISRE from the 9-27gene binds E much better than M or G. Conversely, a39-bp ISRE from the 6 - 16 gene binds M and G muchbetter than E. Different patterns of expression of E, M,and G and different affinities of these factors foralternative ISREs may play a part in modulating therelative responses of genes to type I and type 11 IFNsin vivo.
INTRODUCTION
Treatment of cells with interferons (IFNs) can lead toestablishment of an anti-viral state, inhibition of cell growth, andinduction of differentiation (reviewed in ref. 1). Type I ( a, 3)
IFNs bind to one or more related receptors (2-4), while typeI1 ( y) IFN binds to a unique receptor (5). Upon binding, a signalpasses from the membrane to the nucleus, causing transcription
of a set of genes to be initiated (6,7). Several IFN-induced genes
have been cloned and comparisons of their upstream sequences
have revealed interferon-stimulated response elements (ISREs),which confer inducibility by type I and type II IFNs (8). Thecore ISREs, 13 base pairs (bp) long, are highly conserved (9)but there is no obvious homology in the sequences immediatelyflanking them. We (9-11) and others (12-15) have shown thatISREs can bind to a number of factors present constitutively inuntreated cells or induced in cells treated with IFN. The followingfactors, originally observed in different laboratories, are likelyto be the same, although this is not yet directly proven. Forconvenience, we use single-letter abbreviations. C is a constitutivefactor(s) that binds to ISREs, also called ISGF1 (13,15) andC1-C2 (ourselves and ref. 12). E is a factor induced rapidly byIFN a, also called ISGF3 (13,15) or C3 (12). M is a factorinduced in 1-2 hr by IFN a, also called ISGF2 (13,15) or C1-C2(12). G is a factor induced in 1-2 hr by IFN y, also called ISGF2(16) or IBP-1 (17).The recent work of Pine et al. (16) has partially clarified the
relationship between M and G since both factors seem to beencoded by the IRF-1 gene, previously identified by Miyamotoet al. (18). Yet M and G may still be functionally distinct dueto post-translational modification or association with other inducedfactors, and evidence presented here gives support to suchpossibilities. C is different from M and G (16), despite its verysimilar binding characteristics (see below).The role of E as the induced factor responsible for initiating
transcription in response to IFN a is well established (10,11,15)but the functions of M, G, and C are much less clear. M was
proposed previously to be an IFN-induced negative regulator oftranscription (15), a conclusion not in agreement with evidencepresented here. We have examined the kinetics of expression ofE, M, and G in different cells and correlated these with thekinetics of transcription of IFN-regulated genes. We also showthat C, M, and G have very similar affinities for native, mutantand hybrid ISREs and that the relative affinities of E for theseISREs can be very different. A mutant ISRE with high affinityfor M and G and low affinity for E is unchanged in itstranscriptional response to IFN -y but has lost the response toIFN a characteristic of the wild-type ISRE. We now concludethat M is uniikely to have any negative effect and that it is neithernecessary nor sufficient to initiate transcription in response to
* To whom correspondence should be addressed
+ Present address: National Institute for Medical Research, The Ridgeway, Mill Hill, London, NW7 IAA, UK
.=) 1990 Oxford University Press
6574 Nucleic Acids Research, Vol. 18, No. 22
IFN a. Its most likely role is to help maintain transcription thathas been initiated by E.
H-2Kb:AGGTTAGGTGCAGAAGTGAAACTGTGGAGATGGGGAATCCHEX4:AAGTGAAAGTGAAAGTGAAAGTGA
MATERIALS AND METHODSTreatment of cells with IFNBristol-8 B cells (19) and Daudi cells (20) were grown as spinnercultures in RPMI medium, 2% bicarbonate and 5% fetal calfserum. HeLa cells (kindly provided by Dr. H. Land, ImperialCancer Research Fund) were grown either in suspension spinnercultures or as monolayers in Dulbecco's modified Eagle'smedium with 10% fetal calf serum. Human foreskin fibroblast(HFF), HT1080 (human fibrosarcoma) and W138-SV (SV40transformed human lung fibroblast) cells were also grown asmonolayers as above. Cells were treated with 1000 IU/ml of ahighly purified mixture of human IFN a's (specific activity 108IU/mg protein), supplied by Dr. K. Fantes, Wellcome ResearchLaboratories (21). Human recombinant IFN zy was used at 500units/ml and was a gift of Dr. G.R. Adolph, Ernst-Boehringer-Institut fur Arzneimittel-Forschung, Vienna, Austria.
Band-shift assaysWhole cell extracts were prepared by the method of Zimarinoand Wu (22). Cells treated with IFN for various lengths of timewere collected by centrifugation, frozen immediately in eitherliquid N2 or dry ice, and stored at -70°C. All extracts weredialyzed against binding buffer (10 mM HEPES, pH 7.9, 0.1mM EGTA, 75 mM NaCl, 0.5 mM dithiothreitol, 0.5 mMphenylmethanesulfonylfluoride, 5% glycerol) for 2 h in amicrodialyzer. In a few experiments, we supplemented this bufferwith increasing concentrations of MgCl2, up to 10 mM, with nosignificant changes in binding activity, using extracts of Bristol-8,HeLa and W138 SV cells. Band shift assays were performedessentially as described by Dale et al. (10). The finalconcentration of NaCl in binding reactions was 75 mM for alldialyzed extracts. Competition assays were performed by adding2 ,lA of double-stranded competitor DNA in 75 mM NaCl to theprobe mixture before adding the extracts.
Cleavage with copper orthophenanthrolineBinding reactions and preparative band-shifts were performedas described before (10). Whole cell extracts were usually used,but in some experiments we used fractions from a heparin-agarosecolumn, kindly provided by John Parrington, Imperial CancerResearch Fund. Cleavage in the agarose gel was performed asdescribed earlier (10).
OligonucleotidesProbes used in band-shift and competition assays were purifiedby high performance liquid chromatography. Their sequences are:6-16 wt:GAGCTGGGAGAGAGGGGAAAATGAAACTGCAGAGTGCAC6-16 Double early mutant:GAGCTGGCAGAGAGGCGAAAATGAAACTGCAGAGTGCAC6-16 Core mutant:GAGCTGGGAGAGAGGGGACAATGACACTGCAGAGTGCAC9-27 wt:TTTACAAACAGCAGGAAATAGAAACTTAAGAGAAATACA6-9-6:GAGCTGGGAGAGAGGGGAAATAGAAACTGCAGAGTGCAC9-6-9:TTTACAAACAGCAGGAAAATGAAACTTAAGAGAAATACA
Nuclear run-on assaysThe method used was that of Rodaway et al. (23). Briefly, nucleiwere resuspended in glutamate buffer (125 mM potassiumglutamate, 10 mM HEPES, pH 8, 5 mM MgCl2, 2 mMdithiothreitol, 1 mM EGTA, 40% glycerol) before freezing at-70°C. Elongation (15 min at 37°C) was carried out in 50 jAof glutamate buffer containing 160 yCi [ a32P]UTP (800Ci/mmol), 1.5 mM ATP, 0.5 mM CTP, 0.5 mM GTP, 10 mMcreatine phosphate and 50 jig/ml creatine kinase. Labelled RNAwas isolated by phenol extraction followed by two ammoniumacetate precipitation steps. The RNA was denatured in 0.3 MNaOH for 10 min before hybridization.
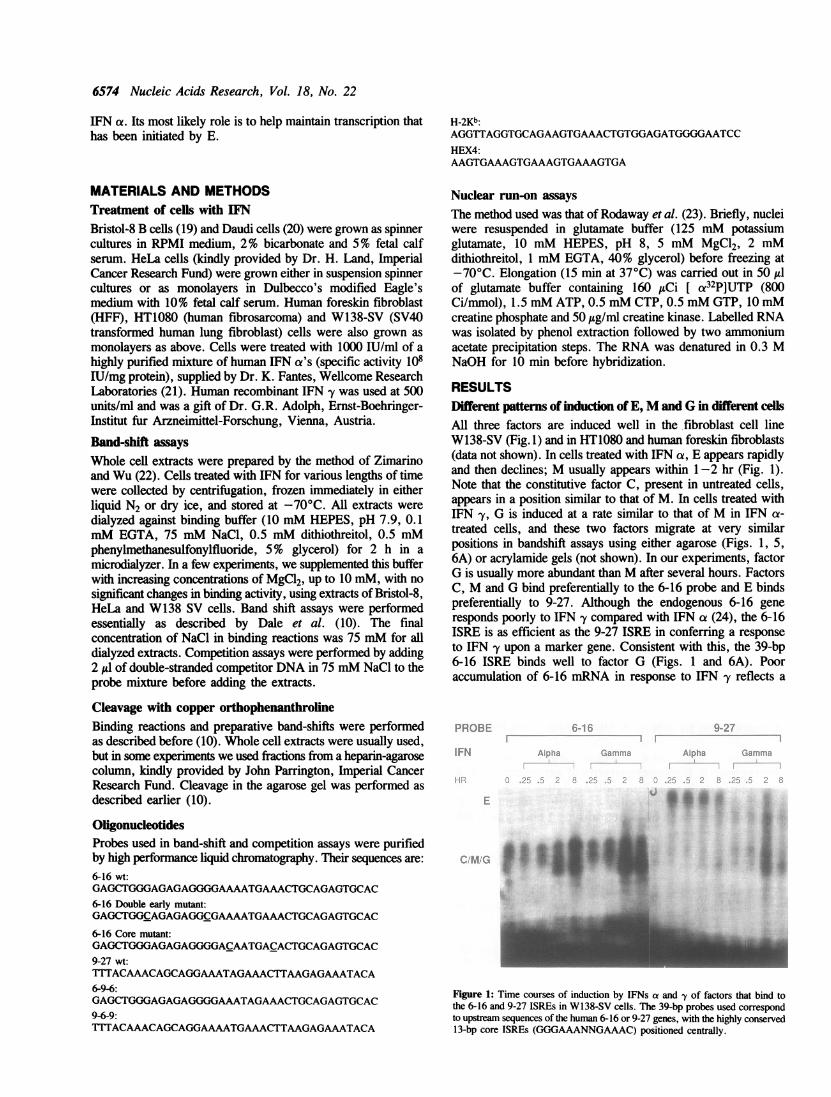
RESULTSDifferent patterns of induction of E, M and G in different cellsAll three factors are induced well in the fibroblast cell lineW138-SV (Fig. 1) and in HT1080 and human foreskin fibroblasts(data not shown). In cells treated with IFN a, E appears rapidlyand then declines; M usually appears within 1-2 hr (Fig. 1).Note that the constitutive factor C, present in untreated cells,appears in a position similar to that of M. In cells treated withIFN y, G is induced at a rate similar to that of M in IFN ca-treated cells, and these two factors migrate at very similarpositions in bandshift assays using either agarose (Figs. 1, 5,6A) or acrylamide gels (not shown). In our experiments, factorG is usually more abundant than M after several hours. FactorsC, M and G bind preferentially to the 6-16 probe and E bindspreferentially to 9-27. Although the endogenous 6-16 generesponds poorly to IFN -y compared with IFN ca (24), the 6-16ISRE is as efficient as the 9-27 ISRE in conferring a responseto IFN -y upon a marker gene. Consistent with this, the 39-bp6-16 ISRE binds well to factor G (Figs. 1 and 6A). Pooraccumulation of 6-16 mRNA in response to IFN y reflects a
*.. .s
.
Figure 1: Time courses of induction by IFNs a and -y of factors that bind tothe 6-16 and 9-27 ISREs in W138-SV cells. The 39-bp probes used correspondto upstream sequences of the human 6-16 or 9-27 genes, with the highly conserved13-bp core ISREs (GGGAAANNGAAAC) positioned centrally.
M f.
Nucleic Acids Research, Vol. 18, No. 22 6575
Table I. Patterns of induced factors and transcriptional responses for human cellstreated with IFNcr or IFN>y
Pattern of Response Induced Factor Transcriptionalresponse to:
E M G IFNa IFN-y
All factors induced + + + + +well (W138-SV, HFF,HT1080)
E induced poorly 4 + + + +(HeLa)
Only E and M + + - + -induced (Daudi)
Only E induced + - - + -
(Bristol-8)
In cells treated with IFN a, E was detected within 1-2 min with the 9-27 probeand M was usually detected within 1-2 hr with the 6-16 probe. G was detectedin 1-2 hr in cells treated with IFN y, with the 6-16 probe. All untreated cellstested have a constitutive factor C that migrates slightly differently from M or
G in bandshift assays.
A 6-16 probe 9-27 probe
0.4 2 3 4 5 0.4 2 3 4 5
E
C
4...
B 6-9-6 probe 9-6-9 probe
0.4 2 3 4 5 0.4 2 3 4 5
E
C
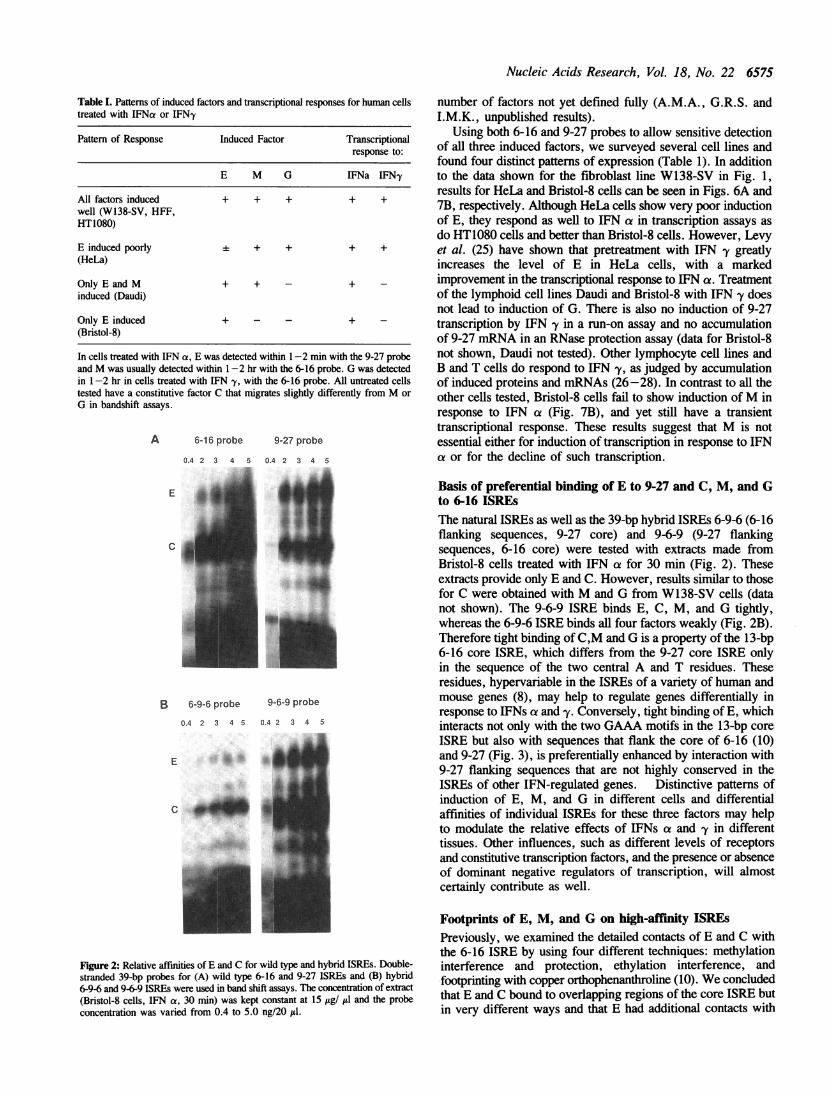
Figure 2: Relative affinities of E and C for wild type and hybrid ISREs. Double-
stranded 39-bp probes for (A) wild type 6-16 and 9-27 ISREs and (B) hybrid6-9-6 and 9-6-9 ISREs were used in band shift assays. The concentration of extract
(Bristol-8 cells, IFN a, 30 min) was kept constant at 15 itg/ itl and the probeconcentration was varied from 0.4 to 5.0 ng/20 d1.
number of factors not yet defined fully (A.M.A., G.R.S. andI.M.K., unpublished results).
Using both 6-16 and 9-27 probes to allow sensitive detectionof all three induced factors, we surveyed several cell lines andfound four distinct patterns of expression (Table 1). In additionto the data shown for the fibroblast line W138-SV in Fig. 1,results for HeLa and Bristol-8 cells can be seen in Figs. 6A and7B, respectively. Although HeLa cells show very poor inductionof E, they respond as well to IFN cx in transcription assays asdo HT1080 cells and better than Bristol-8 cells. However, Levyet al. (25) have shown that pretreatment with IFN -y greatlyincreases the level of E in HeLa cells, with a markedimprovement in the transcriptional response to IFN a. Treatmentof the lymphoid cell lines Daudi and Bristol-8 with IFN -y doesnot lead to induction of G. There is also no induction of 9-27transcription by IFN 'y in a run-on assay and no accumulationof 9-27 mRNA in an RNase protection assay (data for Bristol-8not shown, Daudi not tested). Other lymphocyte cell lines andB and T cells do respond to IFN 'y, as judged by accumulationof induced proteins and mRNAs (26-28). In contrast to all theother cells tested, Bristol-8 cells fail to show induction ofM inresponse to IFN ca (Fig. 7B), and yet still have a transienttranscriptional response. These results suggest that M is notessential either for induction of transcription in response to IFNca or for the decline of such transcription.
Basis of preferential binding of E to 9-27 and C, M, and Gto 6-16 ISREsThe natural ISREs as well as the 39-bp hybrid ISREs 6-9-6 (6-16flanking sequences, 9-27 core) and 9-6-9 (9-27 flankingsequences, 6-16 core) were tested with extracts made fromBristol-8 cells treated with IFN a for 30 min (Fig. 2). Theseextracts provide only E and C. However, results similar to thosefor C were obtained with M and G from W138-SV cells (datanot shown). The 9-6-9 ISRE binds E, C, M, and G tightly,whereas the 6-9-6 ISRE binds all four factors weakly (Fig. 2B).Therefore tight binding of C,M and G is a property of the 13-bp6-16 core ISRE, which differs from the 9-27 core ISRE onlyin the sequence of the two central A and T residues. Theseresidues, hypervariable in the ISREs of a variety of human andmouse genes (8), may help to regulate genes differentially inresponse to IFNs at and -y. Conversely, tight binding of E, whichinteracts not only with the two GAAA motifs in the 13-bp coreISRE but also with sequences that flank the core of 6-16 (10)and 9-27 (Fig. 3), is preferentially enhanced by interaction with9-27 flanking sequences that are not highly conserved in theISREs of other IFN-regulated genes. Distinctive patterns ofinduction of E, M, and G in different cells and differentialaffinities of individual ISREs for these three factors may helpto modulate the relative effects of IFNs ca and 'y in differenttissues. Other influences, such as different levels of receptorsand constitutive transcription factors, and the presence or absenceof dominant negative regulators of transcription, will almostcertainly contribute as well.
Footprints of E, M, and G on high-affinity ISREsPreviously, we examined the detailed contacts of E and C withthe 6-16 ISRE by using four different techniques: methylationinterference and protection, ethylation interference, andfootprinting with copper orhnophenanthroline (10). We concludedthat E and C bound to overlapping regions of the core ISRE butin very different ways and that E had additional contacts with
m -..
*._
iImI"
upW,
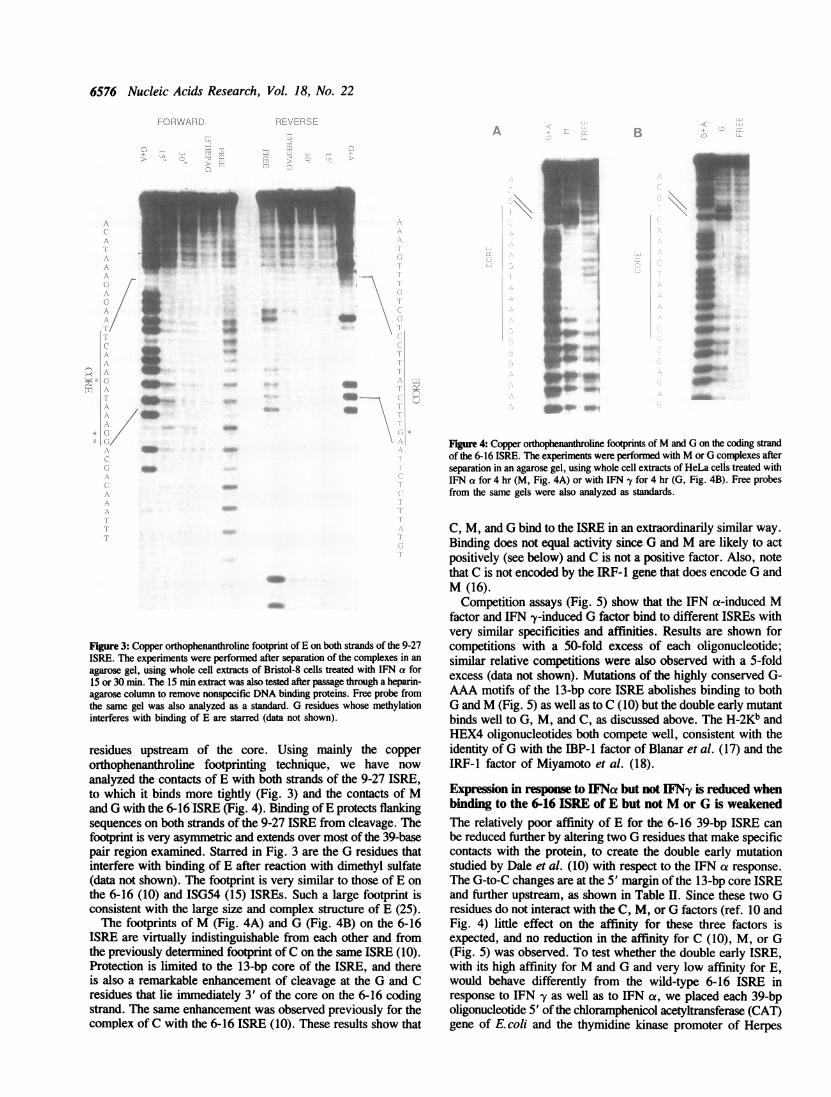
Figure 4: Copper orthophenanthroline footprints ofM and G on the coding strandof the 6-16 ISRE. The experiments were performed with M or G complexes afterseparation in an agarose gel, using whole cell extracts of HeLa celis treated withIFN a for 4 hr (M, Fig. 4A) or with IFN -y for 4 hr (G, Fig. 4B). Free probesfrom the same gels were also analyzed as standards.
Figure 3: Copper orthophenanthroline footprint of E on both strands of the 9-27ISRE. The experiments were performed after separation of the complexes in anagarose gel, using whole cell extracts of Bristol-8 cells treated with IFN a for15 or 30 min. The 15 min extract was also tested after passage through a heparin-agarose column to remove nonspecific DNA binding proteins. Free probe fromthe same gel was also analyzed as a standard. G residues whose methylationinterferes with binding of E are starred (data not shown).
residues upstream of the core. Using mainly the copperorthophenanthroline footprinting technique, we have now
analyzed the contacts of E with both strands of the 9-27 ISRE,to which it binds more tightly (Fig. 3) and the contacts of Mand G with the 6-16 ISRE (Fig. 4). Binding ofE protects flankingsequences on both strands of the 9-27 ISRE from cleavage. Thefootprint is very asymmetric and extends over most of the 39-basepair region examined. Starred in Fig. 3 are the G residues thatinterfere with binding of E after reaction with dimethyl sulfate(data not shown). The footprint is very similar to those of E onthe 6-16 (10) and ISG54 (15) ISREs. Such a large footprint isconsistent with the large size and complex structure of E (25).The footprints of M (Fig. 4A) and G (Fig. 4B) on the 6-16
ISRE are virtually indistinguishable from each other and fromthe previously determined footprint of C on the same ISRE (10).Protection is limited to the 13-bp core of the ISRE, and thereis also a remarkable enhancement of cleavage at the G and Cresidues that lie immediately 3' of the core on the 6-16 codingstrand. The same enhancement was observed previously for thecomplex of C with the 6-16 ISRE (10). These results show that
C, M, and G bind to the ISRE in an extraordinarily similar way.Binding does not equal activity since G and M are likely to actpositively (see below) and C is not a positive factor. Also, notethat C is not encoded by the IRF-1 gene that does encode G andM (16).Competition assays (Fig. 5) show that the IFN a-induced M
factor and IFN -y-induced G factor bind to different ISREs withvery similar specificities and affinities. Results are shown forcompetitions with a 50-fold excess of each oligonucleotide;similar relative competitions were also observed with a 5-foldexcess (data not shown). Mutations of the highly conserved G-AAA motifs of the 13-bp core ISRE abolishes binding to bothG and M (Fig. 5) as well as to C (10) but the double early mutantbinds well to G, M, and C, as discussed above. The H-2Kb andHEX4 oligonucleotides both compete well, consistent with theidentity of G with the IBP-1 factor of Blanar et al. (17) and theIRF-1 factor of Miyamoto et al. (18).
Expression in response to IFNa but not LENy is reduced whenbinding to the 6-16 ISRE of E but not M or G is weakenedThe relatively poor affinity of E for the 6-16 39-bp ISRE canbe reduced further by altering two G residues that make specificcontacts with the protein, to create the double early mutationstudied by Dale et al. (10) with respect to the IFN a response.The G-to-C changes are at the 5' margin of the 13-bp core ISREand further upstream, as shown in Table I. Since these two Gresidues do not interact with the C, M, or G factors (ref. 10 andFig. 4) little effect on the affinity for these three factors isexpected, and no reduction in the affinity for C (10), M, or G(Fig. 5) was observed. To test whether the double early ISRE,with its high affinity for M and G and very low affinity for E,would behave differently from the wild-type 6-16 ISRE inresponse to IFN 'y as well as to IFN ca, we placed each 39-bpoligonucleotide 5' of the chloramphenicol acetyltransferase (CAT)gene of E. coli and the thymidine kinase promoter of Herpes
6576 Nucleic Acids Research, Vol. 18, No. 22
_..
,1
VW
4m
_.._.w_
_...
4wt
_4fw_p...
i-0._AM

Nucleic Acids Research, Vol. 18, No. 22 6577
CL n
o ccn x 0Z F 0 Ulj L Z F=> 0 Da I c D
Owc=UJ E Di ez y x
o w c4 uJu a I I
M
Alpha IFN Gamma IFN
Figure 5: Competition of M or G. Whole cell extracts of HeLa cells, treatedwith IFN a or IFN 'y for 2 hr, were assayed with labeled 39-bp 6-16 ISRE andcompeted with a 50-fold molar excess of unlabeled oligonucleotides derived from6-16 (see Materials and Methods for sequence). In CORE MUT the highlyconserved GAAA motifs are changed to GACA and in DE MUT two G residuesupstream of the core ISRE have been changed to C residues.
Table II. Effect of the double early mutation on response of the 6-16 ISRE toIFNs a or -y
Data from one experiment Average of(cpm) 3 experiments
(fold induction)
No IFN a 'y a ly
6-16 1413 7053 4756 5.5 3.3double early 823 1071 3238 1.2 3.9
-core-6-16: GAGCTGGGAGAGAGGGGAAAATGAAACTGCAGAGTGCACDE: C C
6) nor Decker et al. (32) observed induction of E in responseto IFN y.
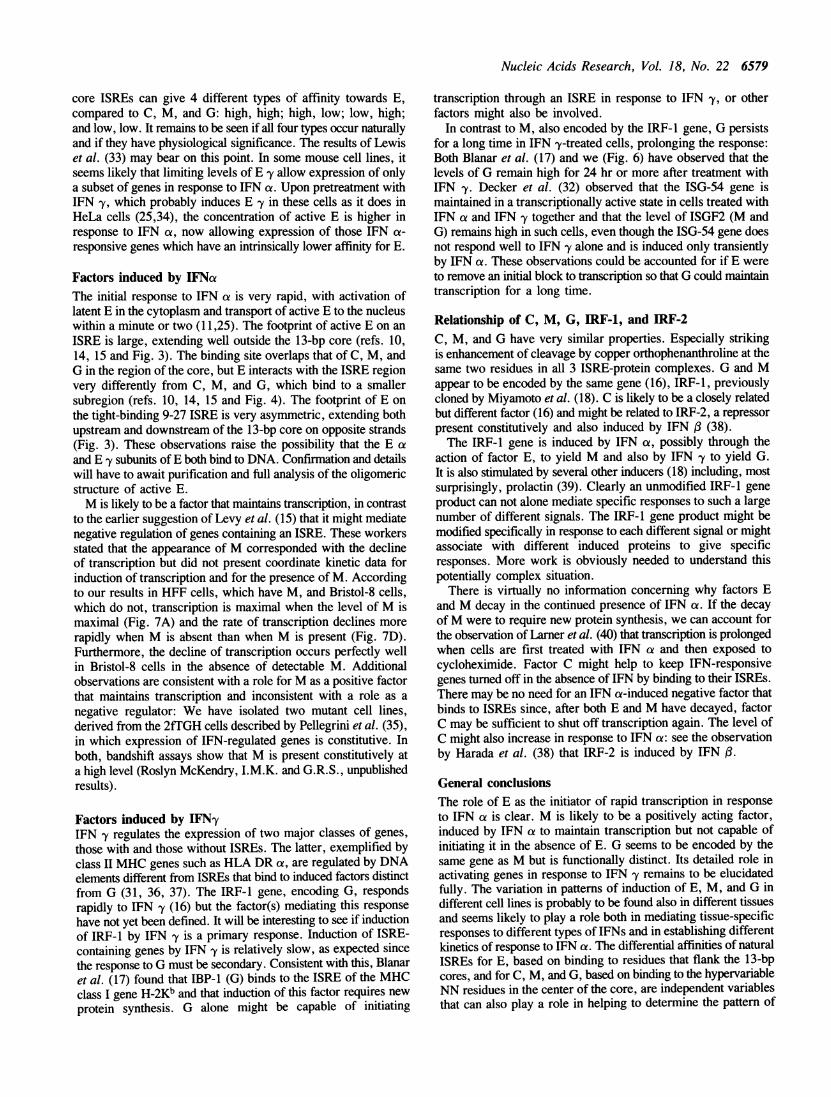
M is likely to act positivelyLevy et al. (15) have proposed that ISGF2 (M in the presentpaper) is a negatively acting factor, mediating the down-regulationof transcription observed by many workers several hours aftercells are treated with IFN a. However, since G almost certainlyacts positively, and since M and G are very similar, it seemedpossible that M would also act positively. To investigate thefunction of M, we compared induction by IFN ca of E and Mwith induction of transcription of the 6-16 gene in two cell lineswith different characteristics. In HFF cells, both E and M areinduced well by IFN ca (bandshift data not shown, but see Fig.1 for similar results with the fibroblast cell line W138-SV). Whenthe time course of transcriptional induction is compared withchanges in the relative amounts of E and M in these cells (Fig.7A), it is apparent that transcription is nearly maximal when theamount ofM is maximal, strongly arguing against the possibilitythat M acts to suppress transcription. Furthermore, transcriptionpersists at a high rate long after the level of E has declined andcorrelates best with the sum ofE and M, consistent with the ideathat both factors act positively. In Bristol-8 cells, E is inducedwell but there is no detectable induction of M by IFN a (Fig.7B). Transcription still declines after several hours (Fig. 7C),so M is not likely to be obligatory either for induction or shut-off of transcription. Transcription declines significantly morerapidly in Bristol-8 cells (Fig. 7D) than in HFF cells (Fig. 7A),a result most consistent with the idea that M funtions to maintainthe transcription first induced by E in IFN a-treated cells. Shut-off may occur when the levels of E and M have both declinedand may not require the action of an induced negative factor thatbinds to DNA. Induction of transcription of 6-16 is relativelypoor in Bristol-8 compared to other cell lines (compare Fig. 7Awith 7D) and similar results have been obtained with other IFN-induced genes (data not shown). It may be that this is due to thelack of M.
Plasmids were constructed by inserting 6-16 wild type or double early (DE) 39-bpoligonucleotides into the CAT expression vector pBLCAT2 (29). Transienttransfection and CAT assays were carried out in HeLa cells as previously described(30) but without glycerol shock. IFN treatment was for 30 hr.
simplex virus, as shown in Table II. The responses of the twoconstructs were then tested after transient transfection into HeLacells. There was no significant effect of the double early mutationon the ability of the 6-16 ISRE to respond to IFN y, but theresponse to IFN a was abolished (Table II). These results areconsistent with the idea that G acts positively to stimulatetranscription and show that tight binding of M is not sufficientto achieve a good transcriptional response to IFN a.
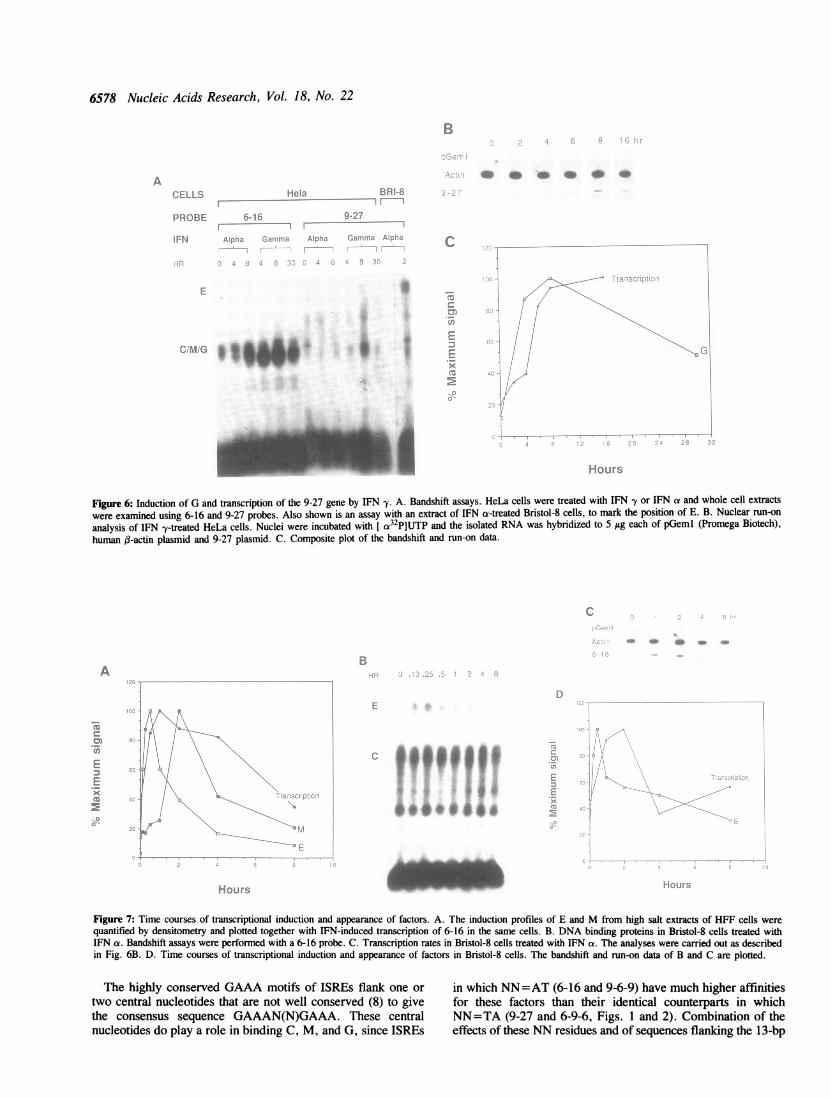
Sinilar kinetics of transcription of 9-27 and induction of Gin IFNy-treated cellsThe increase in transcription of the 9-27 gene and appearanceof G are comparable in HeLa cells after treatment with IFN -y(Fig. 6), indicating that G is likely to be a positively actingtranscription factor. Similar observations have been made byBlanar et al. (31) using the regulatory element of an MHC ClassI gene and by Decker et al. (32), using the regulatory elementof a gene encoding a guanylate-binding protein. Neither we (Fig.
DISCUSSIONVariation in induction of E, M, and G in different cells andin their affmities for different ISREsAs shown in Table I, we observed four patterns of induction.HeLa cells have low levels of E due to a deficit in one of itssubunits, E -y. Pretreatment of the cells with IFN -y to increaseE -y leads to an increase of active E after exposure to IFN a,a property of other cells lines as well (25). Daudi and Bristol-8cells apparently lack a response to IFN y completely; there isno induction of G, no induction of gene expression, and no abilityto achieve an antiviral state upon treatment with IFN -y (data notshown). The basis of this unresponsive state is unclear.
Mutations in ISREs have been shown to affect the affinitiesfor different classes of factors in two ways. Mutations in the 13-bpcore that disrupt the two GAAA motifs affect the binding of allfactors, whereas some mutations at the edge of the core or outsideit interfere with the binding of E selectively (10, 13-15). Thedouble early mutation provides a good example of the lattersituation, and the experiment described in Table II shows thatreduced binding of E abolishes the response to IFN a in vivo,while the response to IFN 'y is retained, as expected since theaffinity for G is not decreased (Fig. 5). It is important to notethat M is not sufficient to induce this construct to respond to IFNa, suggesting that M and G may be functionally different.
6578 Nucleic Acids Research, Vol. 18, No. 22
b
POBF-F t 1i
......,._OB....F..
A .:-AL. AL,-., m G ": m
.1,-.6
Figure 6: Induction of G and transcription of the 9-27 gene by IFN y. A. Bandshift assays. HeLa cells were treated with IFN -y or IFN a and whole cell extractswere examined using 6-16 and 9-27 probes. Also shown is an assay with an extract of IFN a-treated Bristol-8 cells, to mark the position of E. B. Nuclear run-onanalysis of IFN -y-treated HeLa cells. Nuclei were incubated with [ a32P]UTP and the isolated RNA was hybridized to 5 jig each of pGeml (Promega Biotech),human (3-actin plasmid and 9-27 plasmid. C. Composite plot of the bandshift and run-on data.
A
Coi
D1C
'CZCU
ri. 0 I..u
Figure 7: Time courses of transcriptional induction and appearance of factors. A. The induction profiles of E and M from high salt extracts of HFF cells were
quantified by densitometry and plotted together with IFN-induced transcription of 6-16 in the same cells. B. DNA binding proteins in Bristol-8 cells treated with
IFN az. Bandshift assays were performed with a 6-16 probe. C. Transcription rates in Bristol-8 cells treated with IFN a. The analyses were carried out as described
in Fig. 6B. D. Time courses of transcriptional induction and appearance of factors in Bristol-8 cells. The bandshift and run-on data of B and C are plotted.
The highly conserved GAAA motifs of ISREs flank one or
two central nucleotides that are not well conserved (8) to givethe consensus sequence GAAAN(N)GAAA. These centralnucleotides do play a role in binding C, M, and G, since ISREs
in which NN=AT (6-16 and 9-6-9) have much higher affinitiesfor these factors than their identical counterparts in whichNN=TA (9-27 and 6-9-6, Figs. 1 and 2). Combination of theeffects of these NN residues and of sequences flanking the 13-bp
Ai *0do.0
.....
-1 i u r
-A
.7.i0.0 0. I
Nucleic Acids Research, Vol. 18, No. 22 6579
core ISREs can give 4 different types of affinity towards E,compared to C, M, and G: high, high; high, low; low, high;and low, low. It remains to be seen if all four types occur naturallyand if they have physiological significance. The results of Lewiset al. (33) may bear on this point. In some mouse cell lines, itseems likely that limiting levels of E -y allow expression of onlya subset of genes in response to IFN ca. Upon pretreatment withIFN 'y, which probably induces E y in these cells as it does inHeLa cells (25,34), the concentration of active E is higher inresponse to IFN a, now allowing expression of those IFN ax-responsive genes which have an intrinsically lower affinity for E.
Factors induced by IFNaThe initial response to IFN ae is very rapid, with activation oflatent E in the cytoplasm and transport of active E to the nucleuswithin a minute or two (11,25). The footprint of active E on anISRE is large, extending well outside the 13-bp core (refs. 10,14, 15 and Fig. 3). The binding site overlaps that of C, M, andG in the region of the core, but E interacts with the ISRE regionvery differently from C, M, and G, which bind to a smallersubregion (refs. 10, 14, 15 and Fig. 4). The footprint of E onthe tight-binding 9-27 ISRE is very asymmetric, extending bothupstream and downstream of the 13-bp core on opposite strands(Fig. 3). These observations raise the possibility that the E caand E y subunits ofE both bind to DNA. Confirmation and detailswill have to await purification and full analysis of the oligomericstructure of active E.M is likely to be a factor that maintains transcription, in contrast
to the earlier suggestion of Levy et al. (15) that it might mediatenegative regulation of genes containing an ISRE. These workersstated that the appearance of M corresponded with the declineof transcription but did not present coordinate kinetic data forinduction of transcription and for the presence of M. Accordingto our results in HFF cells, which have M, and Bristol-8 cells,which do not, transcription is maximal when the level of M ismaximal (Fig. 7A) and the rate of transcription declines morerapidly when M is absent than when M is present (Fig. 7D).Furthermore, the decline of transcription occurs perfectly wellin Bristol-8 cells in the absence of detectable M. Additionalobservations are consistent with a role for M as a positive factorthat maintains transcription and inconsistent with a role as anegative regulator: We have isolated two mutant cell lines,derived from the 2fTGH cells described by Pellegrini et al. (35),in which expression of IFN-regulated genes is constitutive. Inboth, bandshift assays show that M is present constitutively ata high level (Roslyn McKendry, I.M.K. and G.R.S., unpublishedresults).
Factors induced by IFN-yIFN -y regulates the expression of two major classes of genes,those with and those without ISREs. The latter, exemplified byclass II MHC genes such as HLA DR a, are regulated by DNAelements different from ISREs that bind to induced factors distinctfrom G (31, 36, 37). The IRF-1 gene, encoding G, respondsrapidly to IFN -y (16) but the factor(s) mediating this responsehave not yet been defined. It will be interesting to see if inductionof IRF-1 by IFN -y is a primary response. Induction of ISRE-containing genes by IFN -y is relatively slow, as expected sincethe response to G must be secondary. Consistent with this, Blanaret al. (17) found that IBP-1 (G) binds to the ISRE of the MHCclass I gene H-2Kb and that induction of this factor requires newprotein synthesis. G alone might be capable of initiating
transcription through an ISRE in response to IFN 'y, or otherfactors might also be involved.
In contrast to M, also encoded by the IRF-1 gene, G persistsfor a long time in IFN -y-treated cells, prolonging the response:Both Blanar et al. (17) and we (Fig. 6) have observed that thelevels of G remain high for 24 hr or more after treatment withIFN -y. Decker et al. (32) observed that the ISG-54 gene ismaintained in a transcriptionally active state in cells treated withIFN a and IFN -y together and that the level of ISGF2 (M andG) remains high in such cells, even though the ISG-54 gene doesnot respond well to IFN 'y alone and is induced only transientlyby IFN a. These observations could be accounted for if E wereto remove an initial block to transcription so that G could maintaintranscription for a long time.
Relationship of C, M, G, IRF-1, and IRF-2C, M, and G have very similar properties. Especially strikingis enhancement of cleavage by copper orthophenanthroline at thesame two residues in all 3 ISRE-protein complexes. G and Mappear to be encoded by the same gene (16), IRF-1, previouslycloned by Miyamoto et al. (18). C is likely to be a closely relatedbut different factor (16) and might be related to IRF-2, a repressorpresent constitutively and also induced by IFN 3 (38).The IRF-1 gene is induced by IFN at, possibly through the
action of factor E, to yield M and also by IFN -y to yield G.It is also stimulated by several other inducers (18) including, mostsurprisingly, prolactin (39). Clearly an unmodified IRF-1 geneproduct can not alone mediate specific responses to such a largenumber of different signals. The IRF-1 gene product might bemodified specifically in response to each different signal or mightassociate with different induced proteins to give specificresponses. More work is obviously needed to understand thispotentially complex situation.There is virtually no information concerning why factors E
and M decay in the continued presence of IFN a. If the decayofM were to require new protein synthesis, we can account forthe observation of Lamer et al. (40) that transcription is prolongedwhen cells are first treated with IFN a and then exposed tocycloheximide. Factor C might help to keep IFN-responsivegenes turned off in the absence of IFN by binding to their ISREs.There may be no need for an IFN a-induced negative factor thatbinds to ISREs since, after both E and M have decayed, factorC may be sufficient to shut off transcription again. The level ofC might also increase in response to IFN a: see the observationby Harada et al. (38) that IRF-2 is induced by IFN ,(.
General conclusionsThe role of E as the initiator of rapid transcription in responseto IFN a is clear. M is likely to be a positively acting factor,induced by IFN a to maintain transcription but not capable ofinitiating it in the absence of E. G seems to be encoded by thesame gene as M but is functionally distinct. Its detailed role inactivating genes in response to IFN -y remains to be elucidatedfully. The variation in patterns of induction of E, M, and G indifferent cell lines is probably to be found also in different tissuesand seems likely to play a role both in mediating tissue-specificresponses to different types of IFNs and in establishing differentkinetics of response to IFN a. The differential affinities of naturalISREs for E, based on binding to residues that flank the 13-bpcores, and for C, M, and G, based on binding to the hypervariableNN residues in the center of the core, are independent variablesthat can also play a role in helping to determine the pattern of
6580 Nucleic Acids Research, Vol. 18, No. 22
response of a particular gene. The availability and relativeconcentrations of additional transcription factors, repressors, andextinguishers will surely also contribute to tissue-specificvariations in response to the interferons. It is of obvious advantagefor an organism to have several ways to regulate the responsesof individual genes to the various interferons in different tissues.
ACKNOWLEDGEMENTSWe thank Paula Machlin for excellent technical assistance,Andrew Porter and Andrew Lewin for constructs based onpBLCAT2, John Parrington for heparin-agarose fractionsenriched for E, and Clare Middlemiss for typing the manuscript.
33. Lewis,J.A., Huq,A. and Shan,B. (1989) J. Virol. 63, 4569-4578.34. Levy,D.E., Lew,D.J., Decker,T., Kessler,D.S. and Darnell,J.E.,Jr. (1990)
EMBO J. 9, 1105-1111.35. Pellegrini,S., John,J., Shearer,M., Kerr,I.M. and Stark,G.R. (1989)
MoL Cell.Biol. 9, 4605-4612.36. Basta,P.V., Sherman,P.A. and Ting,J.P.-Y. (1988) Proc.Natl.Acad.Sci. USA.
85, 8618-8622.37. Finn,P.W., Kara,C.J., Douhan III,J., Van,T.T., Folsom,V. and
Glimcher,L.H. (1990) Proc.Natl.Acad.Sci. USA. 87, 914-918.38. Harada,H., Fujita,T., Miyamoto,M., Kimura,Y., Maruyama,M., Furia,A.,
Miyata,T. and Taniguchi,T. (1989) Cell 58, 729-739.39. Yu-Lee,L.-Y., Hrachovy,J.A., Stevens,A.M. and Schwartz,L.A. (1990)
Mol. Cell.Biol. 10, 3087-3094.40. Larner,A.C., Chaudhuri,A. and Darnell,J.E.,Jr. (1986) J.BioL Chem. 261,
453-459.
REFERENCES1. Revel,M. and Chebath,J. (1986) Trends in Biochem. Science 11, 166-170.2. Mogensen,K.E. and Bandu,M.T. (1983) Eur.J.Biochem. 134, 355-364.3. Anderson,P., Yip,Y.K. and Vilcek,J. (1982) J.Biol. Chem. 257,
11301-11304.4. Zoon,K.C. and Arnheiter,H. (1984) Pharmac. Ther. 24, 259-278.5. Aguet,M., Dembic,Z. and Merlin,G. (1988) Cell 55, 273-280.6. Chebath,J., Merlin,G., Metz,R., Benech,P. and Revel,M. (1983) NuclAcids
Res. 11, 1213-1226.7. Friedman,R.L., Manley,S.P., McMahon,M., Kerr,I.M. and Stark,G.R.
(1984) Cell 38, 745-755.8. Reid,L.E., Brasnett,A.H., Gilbert,C.S., Porter,A.C.G., Gewert,D.R.,
Stark,G.R. and Kerr,I.M. (1989) Proc.Natl.Acad.Sci. USA 86, 840-844.9. Porter,A.C.G., Chernajovsky,Y., Dale,T.C., Gilbert,C.S., Stark,G.R. and
Kerr,I.M. (1988) EMBO J. 7, 85-92.10. Dale,T.C., Rosen,J.M., Guille,M.J., Lewin,A.R., Porter,A.C.G., Kerr,I.M.
and Stark,G.R. (1989) EMBO J. 8, 831-839.11. Dale,T.C., Imam,A.M.A., Kerr,I.M. and Stark,G.R. (1989)
Proc.Natl.Acad.Sci. USA 86, 1203-1207.12. Rutherford,M.N., Hannigan,G.E. and Williams,B.R.G. (1988) EMBO J.
7, 751-759.13. Kessler,D.S., Levy,D.E. and Darnell,J.E. (1988) PrNoc.Natl.Acad.Sci. USA.
85, 8521-8525.14. Reich,N.C. and Darnmll,J.E.,Jr. (1989) NucdAcids Res. 17, 3415-3434.15. Levy,D.E., Kessler,D.S., Pine,R., Reich,N. and Darnell,J.E.,Jr. (1988)
Genes andl Develop. 2, 383-393.16. Pine,R., Decker,T., Kessler,D.S., Levy,D.E. and Darnell,J.E.,Jr. (1990)
Mol.Cell.Biol. 10, 2448-2457.17. Blanar,M.A., Baldwin,A.S., Flavell,R.A. and Sharp,P.A. (1989) EMBO
J. 8, 1139-1144.18. Miyamoto,M., Fujita,T., Kimura,Y., Maniyama,M., Harada,H., Sudo,Y.,
Miyata,T. and Taniguchi,T. (1988) Cell 54, 903-913.19. Brodsky,F.M., Parham,P., Barnstable,C.J., Crumpton,M.J. and
Bodmer,W.F. (1979) Immunol.Rev. 47, 3-61.20. Silverman,R.H., Watling,D., Balkwill,F.R., Trowsdale,J. and Kerr,I.M.
(1982) Eur.J.Biochem. 126, 333-341.21. Allen,G., Fantes,K.H., Burke,D.C. and Morser,J. (1982) J.Gen. Virol. 63,
207-212.22. Zimarino,V. and Wu,C. (1987) Nature 327, 727-730.23. Rodaway,A.R.F., Teahan,C.G., Casimir,C.M., Segal,A.W. and
Bentley,D.L. (1990) Mol.Cell.Biol. In press.24. Kelly,J.M., Porter,A.C.G., Chernajovsky,Y., Gilbert,C.S., Stark,G.R. and
Kerr,I.M. (1986) EMBO J. 5, 1601-1606.25. Levy,D.E., Kessler,D.S., Pine,R. and Darneli,J.E.,Jr. (1989) Genes Develop.
3, 1362-1371.26. Wong,G.H.W., Clark-Lewis,I., McKimm-Breschkin,J.L., Harris,A.W. and
Schrader,J.W. (1983) J.Immun. 131, 788-793.27. Rosa,F., Hatat,D., Abadie,A., Wallach,D., Revel,M. and Fellous,M. (1983)
EMBO J. 2, 1585-1589.28. Lecchi,M., Lovisone,E., Genetta,C., Peruccio,D., Resegotti,L. and
Richiardi,P. (1989) Leukaemia Res. 13, 221-226.29. Klock,G., Strahle,V. and Schutz,G. (1987) Nature 329, 734-736.30. Porter,A.C.G., Chernajovsky,Y., Dale,T.C., Gilbert,C.S., Stark,G.R. and
Kerr,I.M. (1988) EMBO J. 7, 85-92.31. Blanar,M.A., Boettger,E.C. and Flavell,R.A. (1988)
Proc.NatL.Acad.Sci. USA. 85, 4672-4676.32. Decker,T., Lew,D.J., Cheng,Y.-S.E., Levy,D.E. and Darnell,J.E.,Jr. (1989)
EMBO J. 8, 2009-2014.