Longitudinal system-based analysis of transcriptional responses to type I interferons
11
doi:10.1152/physiolgenomics.00058.2009 38:362-371, 2009. First published 16 June 2009; Physiol. Genomics Oksenberg and S. E. Baranzini D. J. Pappas, G. Coppola, P. A. Gabatto, F. Gao, D. H. Geschwind, J. R. responses to type I interferons Longitudinal system-based analysis of transcriptional You might find this additional info useful... for this article can be found at: Supplemental material http://physiolgenomics.physiology.org/content/suppl/2009/06/29/00058.2009.DC1.html 75 articles, 33 of which can be accessed free at: This article cites http://physiolgenomics.physiology.org/content/38/3/362.full.html#ref-list-1 including high resolution figures, can be found at: Updated information and services http://physiolgenomics.physiology.org/content/38/3/362.full.html can be found at: Physiological Genomics about Additional material and information http://www.the-aps.org/publications/pg This infomation is current as of February 8, 2011. the American Physiological Society. ISSN: 1094-8341, ESSN: 1531-2267. Visit our website at http://www.the-aps.org/. July, and October by the American Physiological Society, 9650 Rockville Pike, Bethesda MD 20814-3991. Copyright © 2009 by techniques linking genes and pathways to physiology, from prokaryotes to eukaryotes. It is published quarterly in January, April, publishes results of a wide variety of studies from human and from informative model systems with Physiological Genomics on February 8, 2011 physiolgenomics.physiology.org Downloaded from
Transcript of Longitudinal system-based analysis of transcriptional responses to type I interferons
doi:10.1152/physiolgenomics.00058.2009 38:362-371, 2009. First published 16 June 2009;Physiol. Genomics
Oksenberg and S. E. BaranziniD. J. Pappas, G. Coppola, P. A. Gabatto, F. Gao, D. H. Geschwind, J. R.responses to type I interferonsLongitudinal system-based analysis of transcriptional
You might find this additional info useful...
for this article can be found at:Supplemental material http://physiolgenomics.physiology.org/content/suppl/2009/06/29/00058.2009.DC1.html
75 articles, 33 of which can be accessed free at:This article cites http://physiolgenomics.physiology.org/content/38/3/362.full.html#ref-list-1
including high resolution figures, can be found at:Updated information and services http://physiolgenomics.physiology.org/content/38/3/362.full.html
can be found at:Physiological Genomicsabout Additional material and information http://www.the-aps.org/publications/pg
This infomation is current as of February 8, 2011.
the American Physiological Society. ISSN: 1094-8341, ESSN: 1531-2267. Visit our website at http://www.the-aps.org/.July, and October by the American Physiological Society, 9650 Rockville Pike, Bethesda MD 20814-3991. Copyright © 2009 bytechniques linking genes and pathways to physiology, from prokaryotes to eukaryotes. It is published quarterly in January, April,
publishes results of a wide variety of studies from human and from informative model systems withPhysiological Genomics
on February 8, 2011
physiolgenomics.physiology.org
Dow
nloaded from

Longitudinal system-based analysis of transcriptional responses to type Iinterferons
D. J. Pappas,1 G. Coppola,2 P. A. Gabatto,1 F. Gao,2 D. H. Geschwind,2 J. R. Oksenberg,1
and S. E. Baranzini11Department of Neurology, University of California, San Francisco; and 2Program in Neurogenetics, Departmentof Neurology, University of California, Los Angeles, California
Submitted 1 April 2009; accepted in final form 9 June 2009
Pappas DJ, Coppola G, Gabatto PA, Gao F, Geschwind DH,Oksenberg JR, Baranzini SE. Longitudinal system-based analy-sis of transcriptional responses to type I interferons. PhysiolGenomics 38: 362–371, 2009. First published June 16, 2009;doi:10.1152/physiolgenomics.00058.2009.—Type I interferons(IFNs) are pleiotropic cytokines that modulate both innate and adap-tive immune responses. They have been used to treat autoimmunedisorders, cancers, and viral infection and have been demonstrated toelicit differential responses within cells, despite sharing a singlereceptor. The molecular basis for such differential responses hasremained elusive. To identify the mechanisms underlying differentialtype I IFN signaling, we used whole genome microarrays to measurelongitudinal transcriptional events within human CD4� T cells treatedwith IFN-�2b or IFN-�1a. We identified differentially regulated genes,analyzed them for the enrichment of known promoter elements andpathways, and constructed a network module based on weighted genecoexpression network analysis (WGCNA). WGCNA uses advancedstatistical measures to find interconnected modules of correlatedgenes. Overall, differential responses to IFN in CD4� T cells relatedto three dominant themes: migration, antigen presentation, and thecytotoxic response. For migration, WGCNA identified subtype-specific regulation of pre-mRNA processing factor 4 homolog B andeukaryotic translation initiation factor 4A2, which work at variouslevels within the cell to affect the expression of the chemokine CCL5.WGCNA also identified sterile �-motif domain-containing 9-like(SAMD9L) as critical in subtype-independent effects of IFN treatment.RNA interference of SAMD9L expression enhanced the migratoryphenotype of activated T cells treated with IFN-� compared withcontrols. Through the analysis of the dynamic transcriptional eventsafter differential IFN treatment, we were able to identify specificsignatures and to uncover novel genes that may underpin the type IIFN response.
human; T cell; cytokines; gene regulation
INTERFERONS (IFNs) are pleiotropic molecules implicated in awide range of cellular responses (44) and are Federal DrugAdministration-approved therapeutics for the treatment of can-cer, infection, and autoimmunity (49). Based on sequencehomology and structure, IFNs are divided into three classes:types I, II, and III. Type I IFNs include IFN-� (15 known�-subtypes), IFN-�, and IFN-�, whereas type II IFN consistsonly of IFN-� and type III IFN consists only of IFN-�. All typeI IFNs activate a common cell surface receptor [the IFNreceptor (IFNR)], which exists as two separate polypeptides(IFNAR1 and IFNAR2) with no intrinsic dimerization capacity(12). Binding of type I IFNs to IFNAR2, recruitment ofIFNAR1, and stabilization of a heterotrimeric ligand/receptor
complex activate members of the Jak1/tyrosine kinase 2 (Tyk2)and JAK/STAT pathways (12, 45). Phosphorylated STAT1/STAT2 heterodimers form transcriptional activation com-plexes with IFN regulatory factor (IRF)9/p48, translocate tothe nucleus, and drive the expression of numerous genes,including myxovirus resistance protein 1 (MX1), 2�,5�-oligoad-enylate synthetase 1, and double-stranded RNA-activated pro-tein kinase (EIF2AK2).
Although type I IFNs share the same cognate receptor andunderlying canonical activation cascade (54), they have beenshown to elicit differential cellular responses (66). For exam-ple, IFN-�, but not IFN-� or IFN-�, was able to induce thephosphorylation of an IFNAR1-associated subunit (1, 62) lateridentified as IFNAR-2c (15). The TYK2-deficient cell line U1Awas responsive to IFN-� but not to IFN-�2 (25, 63), and IFN-�has been shown to be 100-fold more potent than IFN-�2 atinhibiting the differentiation of human monocytes into oste-oclasts (11). These differences persist even within a single IFNsubfamily. Treatment of Daudi and AU937 cells with 21different purified IFN-� proteins produced a range of antipro-liferative activities spanning at least three orders of magnitude(33). Moreover, differences can be detected at the transcrip-tional level, where different IFN subtypes trigger largely sim-ilar, but not identical, microarray expression profiles (16, 19,39). Finally, there is a notable difference underlying patienttolerability to IFNs. IFN-�, used in treatments of melanoma, Tcell lymphomas, and hepatitis C virus, induces a more frequentand diverse range of side effects including fatigue, myalgia,depression, sexual and sleep disorders, and flu-like symptomsthat often precipitate patient voluntary withdrawal (30).
The nature of the biological diversity intrinsic to type I IFNsignaling is still controversial, although it appears that thesedifferential signaling responses can be attributed in part tomRNA splicing variation and ligand affinity. A splice variantof IFNAR1, lacking one of the four extracellular repeat do-mains, is differentially responsive to a subset of the INF-�subfamily compared with the full-length polypeptide (14, 20).Moreover, IFN-� has been shown to possess an �50-foldhigher affinity for IFNAR1 than IFN-�2 (26, 45), and onlyIFN-� has been shown to induce IFNAR2 receptor recycling(50). Finally, mutations of conversed ligand/receptor interfaceamino acids on IFN-�2 resulted in an activity profile charac-teristic of IFN-�, including higher affinity, enhanced receptor/ligand complex stabilization, antiviral and antiproliferativeproperties, and similar transcriptional response profiles (39).
However, despite the identification and functional classifi-cation of several IFN-inducible genes, clear subcellular mech-anisms relevant to disease treatment have not yet been eluci-dated. Previous studies using cross-sectional, single-time point
Address for reprint requests and other correspondence: S. E. Baranzini,Dept. of Neurology, Univ. of California, 513 Parnassus Ave., Rm. S256, SanFrancisco, CA 94143-0435 (e-mail: [email protected]).
Physiol Genomics 38: 362–371, 2009.First published June 16, 2009; doi:10.1152/physiolgenomics.00058.2009.
1094-8341/09 $8.00 Copyright © 2009 the American Physiological Society362
on February 8, 2011
physiolgenomics.physiology.org
Dow
nloaded from

comparisons have not addressed the underlying dynamic natureof the cellular response and overarching pathways that governthe changes in transcript expression. In this study, we usedmicroarray technology to measure global transcriptional re-sponses of CD4� T cells over a time series after both IFN-�2b
and IFN-�1a treatment. We analyzed differentially expressedgenes (DEG) and interrogated those DEGs for the enrichmentof known transcription factor-binding sites (TFBSs) and path-ways. We constructed networks based on unbiased weightedgene coexpression network analysis (WGCNA) that corre-spond to general and specific IFN responses. Through the useof a time series as well as by comparing and contrastingIFN-�1a- and IFN-�2b-evoked responses, we were able toidentify kinetic differences between IFN subtypes and specificpathways after IFN stimulation and discover several genesnovel to IFN signaling that may represent attractive candidatesin the formulation of new therapies for disease treatment.
MATERIALS AND METHODS
Cell culture and isolation. CD4� T cells were isolated fromperipheral blood mononuclear cells (PBMCs) of one healthy donor(white male, 32 yr old, with no familial history of immune-relateddiseases) using the Dynal CD4� T cell negative isolation kit (Invitro-gen). The resultant population of stimulated cells were 95% CD3�
and 98% CD4� (data not shown) when analyzed by FACS. PBMCswere isolated from whole blood using Ficoll-Paque Plus (GE Health-care) following the manufacturer’s recommended protocol. BeforeIFN stimulation, 1 107 cells were cultured in RPMI-1640 (Invitro-gen) and supplemented with 10% FCS (Gemini Bioproducts) and 1penicillin-streptomycin (Invitrogen) for a period of 2 h. Cells wereeither untreated or treated with 1,000 U/ml of either IFN-�1a orIFN-�2b (Cell Sciences) for 1, 3, 6, 9, or 12 h and were harvested forRNA extraction (see RNA isolation and microarray analysis). IFN-�1a-treated cells were processed as biological duplicates; all IFN-�2b-treated cells were processed as biological triplicates. In the WGCNA
analysis, we included IFN-�1a-treated Jurkat and CEM cell linesprocessed as described above. For activated T cells, PBMCs wereactivated with 3 g/ml phytohemagglutinin (Roche) and 25 U/mlhuman recombinant (r)IL-2 (Invitrogen) for 3 days followed by 2 daysof human rIL-2. The resultant population of stimulated cells was 95%CD3�, 70% CD8�, 30% CD4�, and 70% CD25� (data not shown)when analyzed by FACS.
RNA isolation and microarray analysis. Total RNA was extractedusing TRIzol reagent (Invitrogen) following the manufacturer’s rec-ommended protocol. Total RNA was cleaned using the RNeasy Kit(Qiagen). For microarray analysis, 5 g of total RNA were sent to theTranslational Genomics Research Institute (Phoenix, AZ) and assayedusing the HG-U1133 Plus 2.0 GeneChip system (Affymetrix). Theresultant microarray .cel files were subject to quality control using theBioconductor (27) packages: AffyQCreport (24) and AffyPLM (37).All arrays adhered to author-recommended quality control thresholds,including GAPDH and �-actin 3�/5�-probeset ratios, array scalingfactors, mean array intensity distributions, and positive/negativeedge elements. Probesets were annotated using version 24 of theAffymetrix probeset annotation file (see Supplemental Table 1 forprobeset annotations used), with some manual annotation usingGeneAnnot (8).1
RNA interference transfection and proliferation/migration assays.IFN-�1a was used at 1,000 U/ml as indicated. For transfection,activated T cells were prestimulated with or without IFN-�1a for 3 h.T cells were then transfected with either 33 pmol (�0.5 g) of RNAinhibitor (control or target, Invitrogen) or mock (water) using theAmaxa Nucleofector system (Lonza) and the T Cell Nucleofector kitaccording to the manufacturer-suggested protocols. For oligonucleo-tide controls, we used the Invitrogen-recommended negative controls.After transfection, cells were cultured in RPMI-1640 (without cyto-kines, rIL-2, and IFN-�1a) for 6 h, at which time the media werereplaced, cytokines were reintroduced, and cells were cultured for anadditional 18 h before being assayed. To assess migration, 1 105
1 The online version of this article contains supplemental material.
Fig. 1. Experimental outline. A: overview. CD4� T cells weretreated with either INF-� or IFN-� for a time course of 0 (notreatment), 1, 3, 6, 9, and 12 h. B: principal componentanalysis (PCA) of time 0-normalized arrays (colored as in A).Inset, y-axis rotated down to face out of page. Axis labelsmaintain the relative position after rotation. C: hierarchicalclustering of the top 500 transcripts (by variance). D: repre-sentative group of known IFN-stimulated genes. The colorscale in C and D is as shown. OAS1, 2�,5�-oligoadenylatesynthetase 1; MX1, myxovirus resistance protein 1; AIM2,absent in melanoma 2; EIF2AK2, double-stranded RNA-activated protein kinase; IRF, IFN-regulatory factory; SOCS2,suppressor of cytokine signaling 2; ACTB, �-actin. *Signfi-cant difference between subtypes (corrected P value � 0.05).
363IFN BIOLOGICAL SYSTEMS ANALYSIS
Physiol Genomics • VOL 38 • www.physiolgenomics.org
on February 8, 2011
physiolgenomics.physiology.org
Dow
nloaded from
transfected T cells in RPMI-1640 containing 25 U/ml human rIL-2were seeded into the upper chamber of 24-well (3-m pores, BDBiosciences) cell culture inserts with or without IFN-�1a. The lowerchamber contained RPMI-1640 supplemented with 100 ng/ml CXCL12(SDF-1�, Cell Sciences) with or without IFN-�1a. Cells were allowedto migrate for 24 h, at which time cell numbers in the lower chamberwere quantified using the Cyquant Cell Proliferation Assay kit (In-vitrogen).
RNA for quantitative RT-PCR (see Quantitative RT-PCR for mi-croarray validation) was extracted from an aliquot of posttransfectedcells using the RNeasy Kit (Qiagen) before the beginning of themigration assay (i.e., at 24 h posttransfection).
Quantitative RT-PCR for microarray validation. RNA quantitationwas determined by TaqMan Gene Expression assays (Applied Bio-systems, ABI) on an ABI 7900HT Sequence Detection System fol-lowing all manufacturers’ protocol. Assays were performed in tripli-cate using 1 ng RNA/reaction. A log10 GAPDH dilution series wasused to calculate equivalent copy numbers for each reaction (Supple-mental Fig. 1).
Data and statistical analysis. Expression data were extracted fromAffymetrix .cel files using the BRB-ArrayTools Microsoft Excelplug-in (56a). The microarray .cel files were background corrected,normalized, and summarized using the robust multiarray analysisalgorithm (6). To identify DEGs over time, a class comparison(F-test) was run to control for the proportion of false discoveries (0.1).When comparisons were made between IFN subtypes, intensity valueswere normalized to time 0 to account for any baseline differences.
Principal component analysis (PCA) and hierarchical clustering (Eu-clidean distance metric) were performed with the Multiple Experi-ment Viewer (70). Pathway enrichment analysis was done with theDAVID functional annotation tool (18) and the Pathway-Expressprofiling tool (21) using default parameters. Pajek (4) and Cytoscape(73) were used for network visualization, analysis, and image cre-ation. To identify and visualize differences in IFN-� and IFN-�expression, we calculated a normalized differential longitudinal ex-pression index, which was calculated as the difference between thenormalized sum of all time 0-subtracted expression values over timefor IFN-� and IFN-� treatments (see the Supplemental Material for acomplete description). Graphs and tables were created using Mi-crosoft Excel. P values were calculated using either the MicrosoftExcel data analysis add-in or the R software environment (www.R-project.com) (64).
WGCNA. WGCNA was performed as previously described (51, 57,77) using either CD4� T cells alone (subtype-specific response) or anexpanded panel of cells including CD4� T cells, PBMCs, and CEM/Jurkat cell lines. First, probesets called present in �50% of all arrayswere removed, leaving 17,936 probesets for the IFN general responseanalysis and 16,002 for the subtype-specific response analysis. Afterthe gene list had been finalized, the correlation matrix was obtained bycalculating pair-wise Pearson correlations between all variable probe-sets across all arrays. Next, the adjacency matrix was calculated byraising the absolute values of the correlation matrix to a power of 6 forthe IFN-specific network and a power of 12 for the subtype-specificnetwork (77). Topological overlap (TO) was calculated by comparing
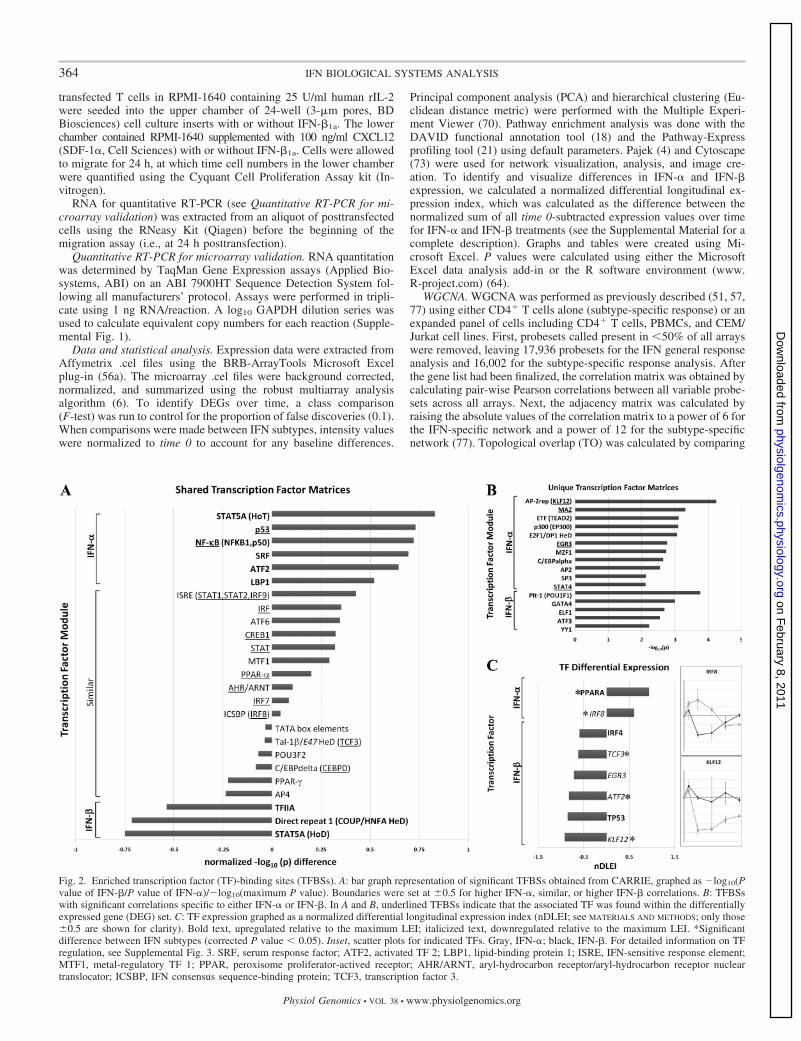
Fig. 2. Enriched transcription factor (TF)-binding sites (TFBSs). A: bar graph representation of significant TFBSs obtained from CARRIE, graphed as �log10(Pvalue of IFN-�/P value of IFN-�)/�log10(maximum P value). Boundaries were set at 0.5 for higher IFN-�, similar, or higher IFN-� correlations. B: TFBSswith significant correlations specific to either IFN-� or IFN-�. In A and B, underlined TFBSs indicate that the associated TF was found within the differentiallyexpressed gene (DEG) set. C: TF expression graphed as a normalized differential longitudinal expression index (nDLEI; see MATERIALS AND METHODS; only those 0.5 are shown for clarity). Bold text, upregulated relative to the maximum LEI; italicized text, downregulated relative to the maximum LEI. *Significantdifference between IFN subtypes (corrected P value � 0.05). Inset, scatter plots for indicated TFs. Gray, IFN-�; black, IFN-�. For detailed information on TFregulation, see Supplemental Fig. 3. SRF, serum response factor; ATF2, activated TF 2; LBP1, lipid-binding protein 1; ISRE, IFN-sensitive response element;MTF1, metal-regulatory TF 1; PPAR, peroxisome proliferator-actived receptor; AHR/ARNT, aryl-hydrocarbon receptor/aryl-hydrocarbon receptor nucleartranslocator; ICSBP, IFN consensus sequence-binding protein; TCF3, transcription factor 3.
364 IFN BIOLOGICAL SYSTEMS ANALYSIS
Physiol Genomics • VOL 38 • www.physiolgenomics.org
on February 8, 2011
physiolgenomics.physiology.org
Dow
nloaded from
connections strengths between a pair of genes to all other genes in thenetwork. To define modules, average linkage hierarchical clusteringwas applied using 1 � TO as the distance measure and the applicationof a height cutoff for the resulting dendrogram (0.96 for both analy-ses).
RESULTS
Transcriptome overview. The temporal transcriptionalevents associated with IFN-�1a (henceforth, IFN-�) or IFN-�2b
(henceforth, IFN-�) treatment in CD4� T cells were measuredusing microarray technology. Cells were treated in vitro fol-lowing a time course of 0 (no treatment, baseline), 1, 3, 6, 9, or12 h (Fig. 1A), at which times total RNA was extracted andgene expression was measured. We validated several randomlyselected genes by quantitative RT-PCR (Supplemental Fig. 1).
To gauge how the expression variances segregated treatmentand time points, we applied PCA for samples and hierarchicalclustering for genes. PCA clustered samples by IFN subtypeand array replicate as well as by spatially disseminating themrelative to their treatment length (Fig. 1B). Hierarchical clus-tering of genes revealed that the pattern of the IFN-� CD4� Tcell response was preserved across most genes when cells weretreated with either IFN (Fig. 1C). The expression of a repre-sentative group of known IFN-stimulated genes was similar forboth treatments; however, certain genes [e.g., suppressor ofcytokine signaling 2 (SOCS2)] showed specific regulatorykinetics specific to each IFN subtype (Fig. 1D).
To make comparisons based on biological pathways andgene network analyses, we first identified DEG transcripts.Class comparisons by time identified 1,157 transcripts forIFN-� treatment, 1,133 of which were also regulated afterIFN-� treatment and 24 that were unique to IFN-� (see theSupplemental Material and Supplemental Fig. 2). By analyzingtheir kinetic profiles, we discovered that most transcriptionalresponses differed in rate and range, with almost no differencein the response direction (Supplemental Fig. 3).
Enriched TFBSs. To gain insight into the mechanisms thatunderlie these transcriptional responses, we searched for TFBSswithin the 1,000 bp upstream sequences of the 1,133 commonDEGs using CARRIE (31). CARRIE accounts for not onlytranscript identity but also significance and fold change overtime. Using the default thresholds for significance (corrected Pvalue of 0.01, inclusive all 1,133 DEGs) and a stringentfourfold threshold for up-/downregulation, we identified 56significant TFBS matrixes from 215 transcripts. After redun-dancies had been removed, 41 matrixes (25 shared and 16unique) were highly correlated with IFN stimulation. Weplotted the shared matrixes as normalized P value ratios be-tween IFN-� and IFN-� (Fig. 2A) and defined 0.5 (on thenormalized �log10 scale) as boundaries for higher IFN-�,similar, or higher IFN-� associations (Fig. 2A). Many of theseshared TFBSs have been previously linked to type I IFNsignaling (e.g., STATs and IRFs); however, others were novelassociations (aryl-hydrocarbon receptor/aryl-hydrocarbon re-ceptor nuclear translocator). As with the shared TFBSs, manyof the subtype-specific TFBSs have previously been linked toT cell regulation and/or IFN induction (e.g., YY1 and STAT4)with some unique associations (MYC-associated zinc fingerprotein). We also looked for the transcriptional regulation oftranscription factors known to bind to the respective sites,which could serve to amplify (upregulation) or repress (down-
regulation) the transcription of target genes. We found severaltranscription factors that displayed a significant change inexpression over time (Fig. 2C and Supplemental Fig. 4).Moreover, we uncovered IFN-subtype dependent expressionfor the transcription factor genes IRF8, Kruppel-like factor 12(KLF12), activating transcription factor 2, peroxisome prolif-erator-activated receptor-�, and transcription factor 3 (Fig. 2C,inset).
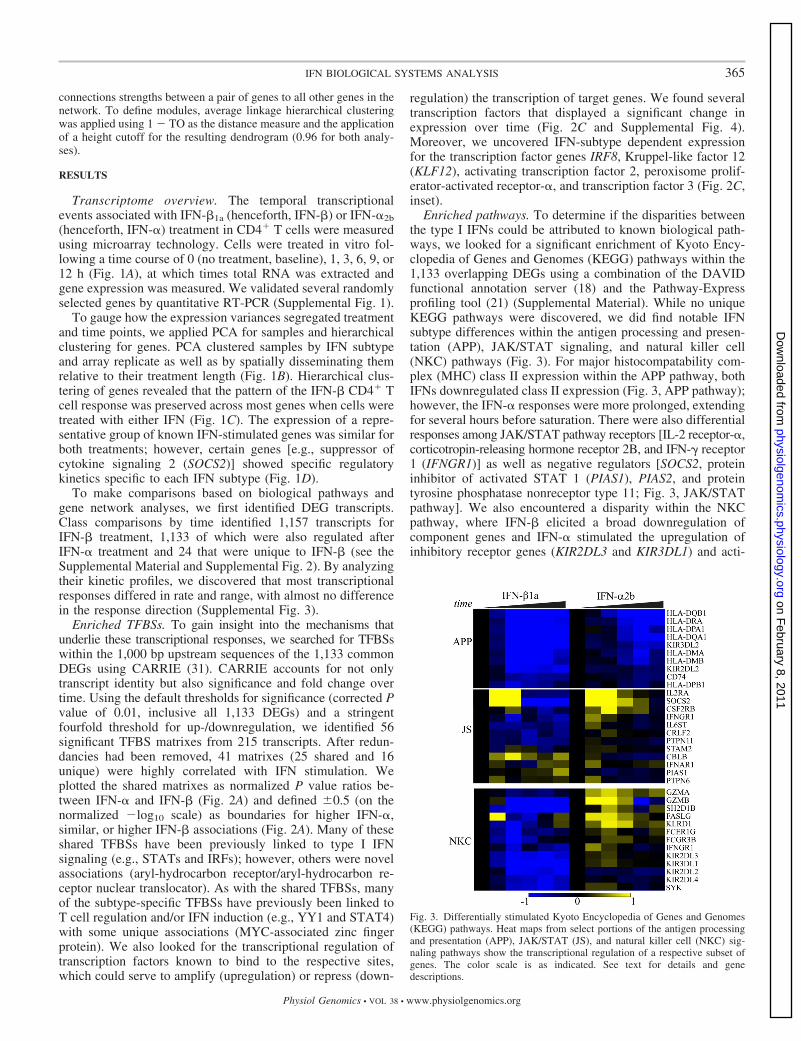
Enriched pathways. To determine if the disparities betweenthe type I IFNs could be attributed to known biological path-ways, we looked for a significant enrichment of Kyoto Ency-clopedia of Genes and Genomes (KEGG) pathways within the1,133 overlapping DEGs using a combination of the DAVIDfunctional annotation server (18) and the Pathway-Expressprofiling tool (21) (Supplemental Material). While no uniqueKEGG pathways were discovered, we did find notable IFNsubtype differences within the antigen processing and presen-tation (APP), JAK/STAT signaling, and natural killer cell(NKC) pathways (Fig. 3). For major histocompatability com-plex (MHC) class II expression within the APP pathway, bothIFNs downregulated class II expression (Fig. 3, APP pathway);however, the IFN-� responses were more prolonged, extendingfor several hours before saturation. There were also differentialresponses among JAK/STAT pathway receptors [IL-2 receptor-�,corticotropin-releasing hormone receptor 2B, and IFN-� receptor1 (IFNGR1)] as well as negative regulators [SOCS2, proteininhibitor of activated STAT 1 (PIAS1), PIAS2, and proteintyrosine phosphatase nonreceptor type 11; Fig. 3, JAK/STATpathway]. We also encountered a disparity within the NKCpathway, where IFN-� elicited a broad downregulation ofcomponent genes and IFN-� stimulated the upregulation ofinhibitory receptor genes (KIR2DL3 and KIR3DL1) and acti-
Fig. 3. Differentially stimulated Kyoto Encyclopedia of Genes and Genomes(KEGG) pathways. Heat maps from select portions of the antigen processingand presentation (APP), JAK/STAT (JS), and natural killer cell (NKC) sig-naling pathways show the transcriptional regulation of a respective subset ofgenes. The color scale is as indicated. See text for details and genedescriptions.
365IFN BIOLOGICAL SYSTEMS ANALYSIS
Physiol Genomics • VOL 38 • www.physiolgenomics.org
on February 8, 2011
physiolgenomics.physiology.org
Dow
nloaded from

vation of the repressor gene SH2 domain-containing 1B, thestimulatory receptor genes killer cell lectin-like receptor sub-family D member 1, FCGR3B, and IFNGR1 (see above) aswell as spleen tyrosine kinase, granzyme A (GZMA), GZMB,and Fas ligand (FASLG) (Fig. 3, NKC pathway).
WGCNA. Because KEGG pathways were manually collatedfrom published materials (41), they have a defined architecturedetermined by biological interactions and are independent ofIFN treatment. To put these genes into the perspective of abiological system and to find unbiased transcriptional associ-ations derived from the expression data, we constructed net-works using WGCNA. WGCNA uses TO, a measure of agene’s connectivity in the network relative to its neighbors(77), to organize the network into modules (subnetworks) oftightly coexpressed genes across multiple samples. Using thisapproach, we discovered two modules (shown in black andred) representative of the general response to IFN and twomodules (shown in blue and deep pink) that differentiatesubtype responses (Fig. 4 and Supplemental Fig. 5).
We used DAVID to identify functional annotation enrich-ment within these modules (Table 1 and Supplemental Table3). The enrichment of known functional gene annotations
within modules provides a validation of WGCNA. The generalresponse black module corresponded to protein catabolism,mRNA processing, and DNA repair, whereas the generalresponse red module was defined by classical IFN signalingcategories such as the immune response, apoptosis, and NF-�Bsignaling. The functional composition of the subtype-specificdeep pink module was similar to the black module and com-posed of RNA metabolism and splicing as well as proteinmetabolic categories. Thus, the same functional categories thatcorrelate with the general IFN response were also able toidentify the subtype-specific IFN response, consistent with theprevious observation that responses differed mainly by rate,range, and duration. The subtype-specific blue module pos-sessed functional annotations related to several themes, includ-ing transcription (RNA binding/processing), transport (proteinlocalization/Golgi transport), and nucleotide binding (kinases).
We used Pajek to identify hubs within each module (Fig. 4).Hubs are the highly connected nodes within a network that arethe hallmark feature of scale-free networks (3). Hubs identifiedby WGCNA in previous reports have been shown to have asignificant impact on the expression of neighboring genes andmay be functionally representative of the whole module (32,
Fig. 4. Weighted gene coexpression network analysis (WGCNA) modules. Modules were identified by WGCNA. The black, red, and blue modules overlap,forming a larger component. The node size is proportional to connection density. Node color was assigned based on the scale bar using the nDLEI (see materialsand methods). Blue shading denotes higher IFN-� LEI; yellow shading denotes higher IFN-� LEI. Node shape relative to change in expression is as follows:circle, upregulation; triangle; downregulation; and square, differential regulation relative to IFN subtype. See text for details and gene descriptions.
366 IFN BIOLOGICAL SYSTEMS ANALYSIS
Physiol Genomics • VOL 38 • www.physiolgenomics.org
on February 8, 2011
physiolgenomics.physiology.org
Dow
nloaded from

51, 57, 77). We identified six general response module hubs[SP110, sterile �-motif domain-containing 9-like (SAMD9L),senataxin, poly(ADP-ribose) polymerase family member 11, Gprotein-coupled receptor 155 (GPR155), and LOC646890] andnine specific response module hubs [core binding factor-�,pre-mRNA processing factor 4 homolog B (PRPF4B), EIF4A2,tyrosine 3-monooxygenase/tryptophan 5-monooxygenase acti-vation protein-�, BAT2 domain-containing 1 (BAT2D1), UDP-N-acetyl-�-D-galactosamine:polypeptide N-acetylgalactosami-nyltransferase 1 (GALNT1), prothymosin-� (PTMA), proteinkinase N2 (PKN2), and RNA-binding motif protein 25(RBM25)].
The general response hubs showed identical upregulatedresponse patterns for both IFNs (Fig. 4 and Supplemental Fig.5). Although GPR155 and LOC646890 have no clear func-tional annotations, the remaining hubs included functionalannotations relating to transcriptional regulation, DNA repair/recombination, and the regulation of cell proliferation andmotility.
The specific response hubs showed the same aforementioneddifferential transcriptional patterns, namely, differing in theirrate and range of expression. Blue module hubs were down-regulated and were functionally associated with transcription(CBFB), mRNA processing (PRPF4B), and translation(EIF4A2). The deep pink module was densely connected withmarginal separation of hub weights (data not shown); thus,only the top five hubs are discussed. These hubs also showedextensive subtype disparity, where IFN-� generally stimulateda slight increase in expression, in contrast to the overallrepression stimulated by IFN-� treatment (Fig. 4 and Supple-mental Fig. 5). Within these hubs, BAT2D1, GALNT1, and
RBM25 were significantly different (single-factor ANOVA,corrected P � 0.05). Functionally, they were related to metab-olism (PTMA, PKN, and GALNT1) and transcription/RNAprocessing (BAT2D1 and RBM25).
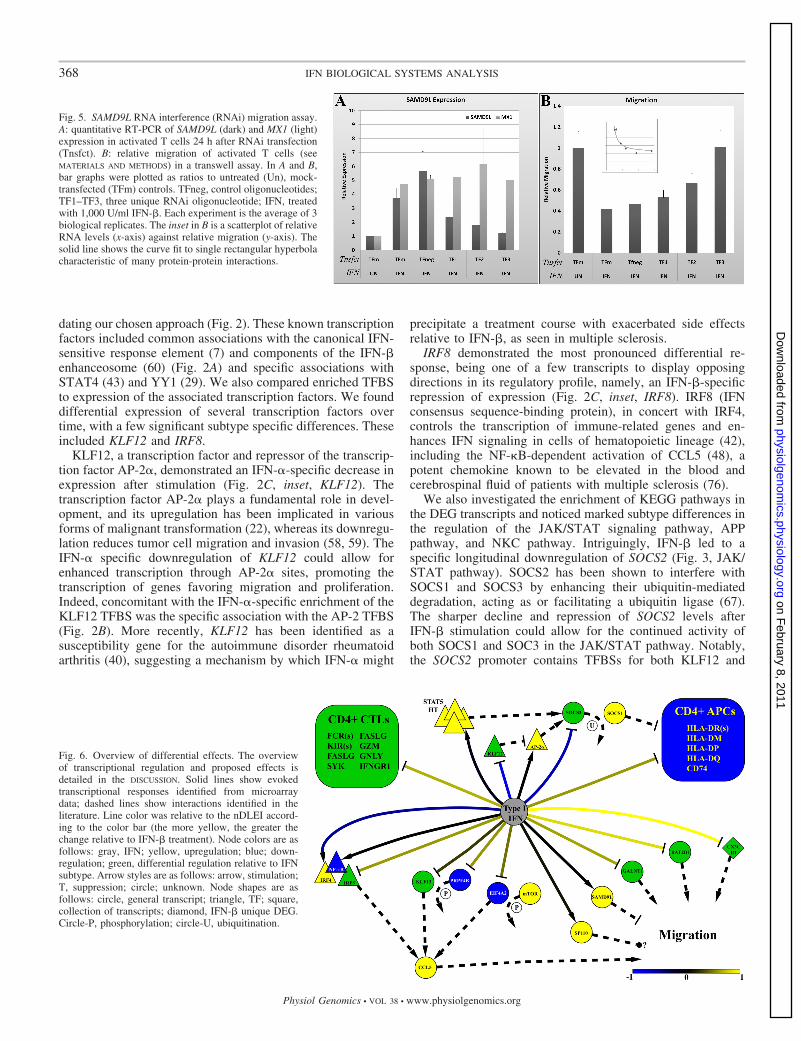
WGCNA hub gene targeting. A few of the hubs (SAMD9L,EIF4A2, and PRPF4B) identified by WGCNA have beenshown to be involved in aspects of cell migration and prolif-eration (see DISCUSSION). Little has been published on SAMD9L;however, it has been previously shown to be substantiallydownregulated in invasive tumors, and its restoration corre-lated with a reduction in tumor invasion and proliferation (47).Given the upregulation of SAMD9L expression after IFN stim-ulation and the known inhibitory effect of IFN on activated Tcell migration (46), we postulated that SAMD9L may be anecessary component of the signaling pathway required toinhibit T cell migration. We tested this by gene silencing ofSAMD9L using RNA interference and measured the effects onmigration relative to IFN stimulation. RNA interference sup-pressed the IFN-stimulated expression (Fig. 5A, black) ofSAMD9L in activated T cells relative to controls, with no effecton the expression of the unrelated IFN-stimulated gene MX1(Fig. 5A, gray). Moreover, the reduction in SAMD9L expres-sion coincided with an increase in CXCL12-stimulated migra-tion of activated T cells in a transwell assay (Fig. 5B). Plottingthe SAMD9L expression against the level of migration revealedan approximate plateau, indicating a saturable effect that ischaracteristic of biological interactions (Fig. 5B, inset). Insummary, our data suggests that SAMD9L expression is nec-essary for the inhibitory effect of IFN.
DISCUSSION
The precise mechanism of the variable, but undoubtedlybeneficial, effects of IFNs in treating diseases like multiplesclerosis or cancer has not yet been clearly elucidated. This isat least partially due to the incompletely defined intracellularresponses that IFN evokes within the various cell types impli-cated in disease pathogenesis. In efforts to increase our under-standing of IFN signaling and the differential responses of typeI IFNs, global transcriptional responses in isolated CD4� Tcells were analyzed after IFN-� and IFN-� stimulation. Weidentified a set of 1,133 transcripts differentially expressedafter treatment with either IFN (Fig. 1).
Given the known subtype disparities in IFN cell signalingand therapeutic efficacies (see Introduction), we focused onIFN subtype differential responses to identify the regulatorypatterns that may be relevant to an overarching biologicalmechanism, including enriched TFBSs and KEGG pathways.
Subtype-specific differences in observed transcription pat-terns were most often a result of inequalities in expression ratesand ranges rather than in directions (Supplemental Fig. 2).Nevertheless, we identified a small set of 12 genes uniquelydownregulated by IFN-� (Supplemental Fig. 3). Among thesewas the chemokine receptor CX3CR1, previously recognizedas a potential therapeutic target for autoimmune diseases (76).Its ligand, CX3CL1 (fractalkine), has been reported to beelevated in the cerebrospinal fluid and serum of inflammatorydiseases of the central nervous system (76).
At the level of transcript regulation, we found enrichmentfor several TFBSs, many of which had been previously iden-tified in inflammatory cascades and IFN signaling, thus vali-
Table 1. Weighted gene coexpression network analysismodule ontology
Category P Value
Black module
Cadmium 9.7e�7
Intracellular 2.2e�3
Modification-dependent protein catabolism 4.0e�3
DNA repair 2.2e�2
Red module
IFN induction 4.6e�28
Zinc finger, B-box 1.0e�9
Poly(ADP-ribose) polymerase, catalytic region 5.4e�6
2�,5�-Oligoadenylate synthetase 1.4e�6
Immune response 2.5e�4
Blue module
Intracellular 6.3e�25
RNA binding 1.5e�11
Cellular physiological process 6.2e�11
RNA processing 5.4e�9
Nucleus 2.8e�14
Deep pink module
RNA splicing 5.4e�5
RNA binding 1.3e�3
Biopolymer metabolism 2.5e�5
Nucleus 7.7e�4
P values were from DAVID functional annotation analysis. Only the top fivecategories (by P value) per module are shown.
367IFN BIOLOGICAL SYSTEMS ANALYSIS
Physiol Genomics • VOL 38 • www.physiolgenomics.org
on February 8, 2011
physiolgenomics.physiology.org
Dow
nloaded from
dating our chosen approach (Fig. 2). These known transcriptionfactors included common associations with the canonical IFN-sensitive response element (7) and components of the IFN-�enhanceosome (60) (Fig. 2A) and specific associations withSTAT4 (43) and YY1 (29). We also compared enriched TFBSto expression of the associated transcription factors. We founddifferential expression of several transcription factors overtime, with a few significant subtype specific differences. Theseincluded KLF12 and IRF8.
KLF12, a transcription factor and repressor of the transcrip-tion factor AP-2�, demonstrated an IFN-�-specific decrease inexpression after stimulation (Fig. 2C, inset, KLF12). Thetranscription factor AP-2� plays a fundamental role in devel-opment, and its upregulation has been implicated in variousforms of malignant transformation (22), whereas its downregu-lation reduces tumor cell migration and invasion (58, 59). TheIFN-� specific downregulation of KLF12 could allow forenhanced transcription through AP-2� sites, promoting thetranscription of genes favoring migration and proliferation.Indeed, concomitant with the IFN-�-specific enrichment of theKLF12 TFBS was the specific association with the AP-2 TFBS(Fig. 2B). More recently, KLF12 has been identified as asusceptibility gene for the autoimmune disorder rheumatoidarthritis (40), suggesting a mechanism by which IFN-� might
precipitate a treatment course with exacerbated side effectsrelative to IFN-�, as seen in multiple sclerosis.
IRF8 demonstrated the most pronounced differential re-sponse, being one of a few transcripts to display opposingdirections in its regulatory profile, namely, an IFN-�-specificrepression of expression (Fig. 2C, inset, IRF8). IRF8 (IFNconsensus sequence-binding protein), in concert with IRF4,controls the transcription of immune-related genes and en-hances IFN signaling in cells of hematopoietic lineage (42),including the NF-�B-dependent activation of CCL5 (48), apotent chemokine known to be elevated in the blood andcerebrospinal fluid of patients with multiple sclerosis (76).
We also investigated the enrichment of KEGG pathways inthe DEG transcripts and noticed marked subtype differences inthe regulation of the JAK/STAT signaling pathway, APPpathway, and NKC pathway. Intriguingly, IFN-� led to aspecific longitudinal downregulation of SOCS2 (Fig. 3, JAK/STAT pathway). SOCS2 has been shown to interfere withSOCS1 and SOCS3 by enhancing their ubiquitin-mediateddegradation, acting as or facilitating a ubiquitin ligase (67).The sharper decline and repression of SOCS2 levels afterIFN-� stimulation could allow for the continued activity ofboth SOCS1 and SOC3 in the JAK/STAT pathway. Notably,the SOCS2 promoter contains TFBSs for both KLF12 and
Fig. 5. SAMD9L RNA interference (RNAi) migration assay.A: quantitative RT-PCR of SAMD9L (dark) and MX1 (light)expression in activated T cells 24 h after RNAi transfection(Tnsfct). B: relative migration of activated T cells (seeMATERIALS AND METHODS) in a transwell assay. In A and B,bar graphs were plotted as ratios to untreated (Un), mock-transfected (TFm) controls. TFneg, control oligonucleotides;TF1–TF3, three unique RNAi oligonucleotide; IFN, treatedwith 1,000 U/ml IFN-�. Each experiment is the average of 3biological replicates. The inset in B is a scatterplot of relativeRNA levels (x-axis) against relative migration (y-axis). Thesolid line shows the curve fit to single rectangular hyperbolacharacteristic of many protein-protein interactions.
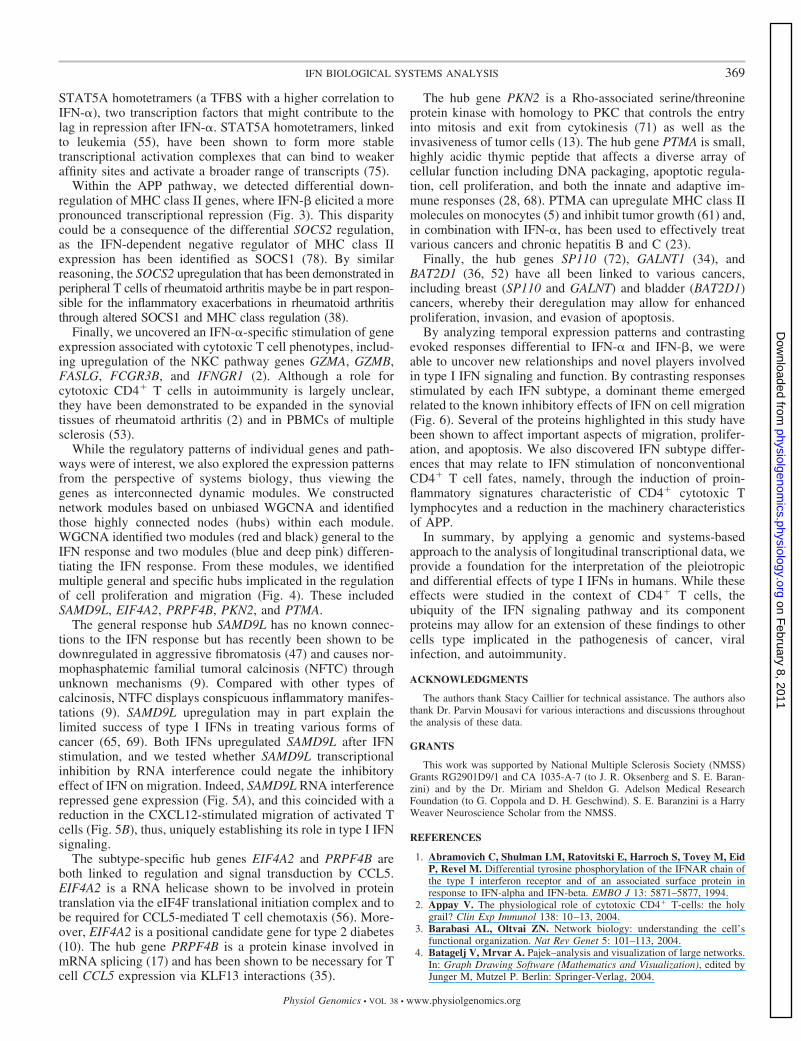
Fig. 6. Overview of differential effects. The overviewof transcriptional regulation and proposed effects isdetailed in the DISCUSSION. Solid lines show evokedtranscriptional responses identified from microarraydata; dashed lines show interactions identified in theliterature. Line color was relative to the nDLEI accord-ing to the color bar (the more yellow, the greater thechange relative to IFN-� treatment). Node colors are asfollows: gray, IFN; yellow, upregulation; blue; down-regulation; green, differential regulation relative to IFNsubtype. Arrow styles are as follows: arrow, stimulation;T, suppression; circle; unknown. Node shapes are asfollows: circle, general transcript; triangle, TF; square,collection of transcripts; diamond, IFN-� unique DEG.Circle-P, phosphorylation; circle-U, ubiquitination.
368 IFN BIOLOGICAL SYSTEMS ANALYSIS
Physiol Genomics • VOL 38 • www.physiolgenomics.org
on February 8, 2011
physiolgenomics.physiology.org
Dow
nloaded from
STAT5A homotetramers (a TFBS with a higher correlation toIFN-�), two transcription factors that might contribute to thelag in repression after IFN-�. STAT5A homotetramers, linkedto leukemia (55), have been shown to form more stabletranscriptional activation complexes that can bind to weakeraffinity sites and activate a broader range of transcripts (75).
Within the APP pathway, we detected differential down-regulation of MHC class II genes, where IFN-� elicited a morepronounced transcriptional repression (Fig. 3). This disparitycould be a consequence of the differential SOCS2 regulation,as the IFN-dependent negative regulator of MHC class IIexpression has been identified as SOCS1 (78). By similarreasoning, the SOCS2 upregulation that has been demonstrated inperipheral T cells of rheumatoid arthritis maybe be in part respon-sible for the inflammatory exacerbations in rheumatoid arthritisthrough altered SOCS1 and MHC class regulation (38).
Finally, we uncovered an IFN-�-specific stimulation of geneexpression associated with cytotoxic T cell phenotypes, includ-ing upregulation of the NKC pathway genes GZMA, GZMB,FASLG, FCGR3B, and IFNGR1 (2). Although a role forcytotoxic CD4� T cells in autoimmunity is largely unclear,they have been demonstrated to be expanded in the synovialtissues of rheumatoid arthritis (2) and in PBMCs of multiplesclerosis (53).
While the regulatory patterns of individual genes and path-ways were of interest, we also explored the expression patternsfrom the perspective of systems biology, thus viewing thegenes as interconnected dynamic modules. We constructednetwork modules based on unbiased WGCNA and identifiedthose highly connected nodes (hubs) within each module.WGCNA identified two modules (red and black) general to theIFN response and two modules (blue and deep pink) differen-tiating the IFN response. From these modules, we identifiedmultiple general and specific hubs implicated in the regulationof cell proliferation and migration (Fig. 4). These includedSAMD9L, EIF4A2, PRPF4B, PKN2, and PTMA.
The general response hub SAMD9L has no known connec-tions to the IFN response but has recently been shown to bedownregulated in aggressive fibromatosis (47) and causes nor-mophasphatemic familial tumoral calcinosis (NFTC) throughunknown mechanisms (9). Compared with other types ofcalcinosis, NTFC displays conspicuous inflammatory manifes-tations (9). SAMD9L upregulation may in part explain thelimited success of type I IFNs in treating various forms ofcancer (65, 69). Both IFNs upregulated SAMD9L after IFNstimulation, and we tested whether SAMD9L transcriptionalinhibition by RNA interference could negate the inhibitoryeffect of IFN on migration. Indeed, SAMD9L RNA interferencerepressed gene expression (Fig. 5A), and this coincided with areduction in the CXCL12-stimulated migration of activated Tcells (Fig. 5B), thus, uniquely establishing its role in type I IFNsignaling.
The subtype-specific hub genes EIF4A2 and PRPF4B areboth linked to regulation and signal transduction by CCL5.EIF4A2 is a RNA helicase shown to be involved in proteintranslation via the eIF4F translational initiation complex and tobe required for CCL5-mediated T cell chemotaxis (56). More-over, EIF4A2 is a positional candidate gene for type 2 diabetes(10). The hub gene PRPF4B is a protein kinase involved inmRNA splicing (17) and has been shown to be necessary for Tcell CCL5 expression via KLF13 interactions (35).
The hub gene PKN2 is a Rho-associated serine/threonineprotein kinase with homology to PKC that controls the entryinto mitosis and exit from cytokinesis (71) as well as theinvasiveness of tumor cells (13). The hub gene PTMA is small,highly acidic thymic peptide that affects a diverse array ofcellular function including DNA packaging, apoptotic regula-tion, cell proliferation, and both the innate and adaptive im-mune responses (28, 68). PTMA can upregulate MHC class IImolecules on monocytes (5) and inhibit tumor growth (61) and,in combination with IFN-�, has been used to effectively treatvarious cancers and chronic hepatitis B and C (23).
Finally, the hub genes SP110 (72), GALNT1 (34), andBAT2D1 (36, 52) have all been linked to various cancers,including breast (SP110 and GALNT) and bladder (BAT2D1)cancers, whereby their deregulation may allow for enhancedproliferation, invasion, and evasion of apoptosis.
By analyzing temporal expression patterns and contrastingevoked responses differential to IFN-� and IFN-�, we wereable to uncover new relationships and novel players involvedin type I IFN signaling and function. By contrasting responsesstimulated by each IFN subtype, a dominant theme emergedrelated to the known inhibitory effects of IFN on cell migration(Fig. 6). Several of the proteins highlighted in this study havebeen shown to affect important aspects of migration, prolifer-ation, and apoptosis. We also discovered IFN subtype differ-ences that may relate to IFN stimulation of nonconventionalCD4� T cell fates, namely, through the induction of proin-flammatory signatures characteristic of CD4� cytotoxic Tlymphocytes and a reduction in the machinery characteristicsof APP.
In summary, by applying a genomic and systems-basedapproach to the analysis of longitudinal transcriptional data, weprovide a foundation for the interpretation of the pleiotropicand differential effects of type I IFNs in humans. While theseeffects were studied in the context of CD4� T cells, theubiquity of the IFN signaling pathway and its componentproteins may allow for an extension of these findings to othercells type implicated in the pathogenesis of cancer, viralinfection, and autoimmunity.
ACKNOWLEDGMENTS
The authors thank Stacy Caillier for technical assistance. The authors alsothank Dr. Parvin Mousavi for various interactions and discussions throughoutthe analysis of these data.
GRANTS
This work was supported by National Multiple Sclerosis Society (NMSS)Grants RG2901D9/1 and CA 1035-A-7 (to J. R. Oksenberg and S. E. Baran-zini) and by the Dr. Miriam and Sheldon G. Adelson Medical ResearchFoundation (to G. Coppola and D. H. Geschwind). S. E. Baranzini is a HarryWeaver Neuroscience Scholar from the NMSS.
REFERENCES
1. Abramovich C, Shulman LM, Ratovitski E, Harroch S, Tovey M, EidP, Revel M. Differential tyrosine phosphorylation of the IFNAR chain ofthe type I interferon receptor and of an associated surface protein inresponse to IFN-alpha and IFN-beta. EMBO J 13: 5871–5877, 1994.
2. Appay V. The physiological role of cytotoxic CD4� T-cells: the holygrail? Clin Exp Immunol 138: 10–13, 2004.
3. Barabasi AL, Oltvai ZN. Network biology: understanding the cell’sfunctional organization. Nat Rev Genet 5: 101–113, 2004.
4. Batagelj V, Mrvar A. Pajek–analysis and visualization of large networks.In: Graph Drawing Software (Mathematics and Visualization), edited byJunger M, Mutzel P. Berlin: Springer-Verlag, 2004.
369IFN BIOLOGICAL SYSTEMS ANALYSIS
Physiol Genomics • VOL 38 • www.physiolgenomics.org
on February 8, 2011
physiolgenomics.physiology.org
Dow
nloaded from
5. Baxevanis CN, Sfagos C, Anastasopoulos E, Reclos GJ, PapamichailM. Prothymosin-alpha enhances HLA-DR antigen expression on mono-cytes from patients with multiple sclerosis. J Neuroimmunol 27: 141–147,1990.
6. Bolstad BM, Irizarry RA, Astrand M, Speed TP. A comparison ofnormalization methods for high density oligonucleotide array data basedon variance and bias. Bioinformatics 19: 185–193, 2003.
7. Brierley MM, Fish EN. IFN-alpha/beta receptor interactions to biologicoutcomes: understanding the circuitry. J Interferon Cytokine Res 22:835–845, 2002.
8. Chalifa-Caspi V, Yanai I, Ophir R, Rosen N, Shmoish M, Benjamin-Rodrig H, Shklar M, Stein TI, Shmueli O, Safran M, Lancet D.GeneAnnot: comprehensive two-way linking between oligonucleotidearray probesets and GeneCards genes. Bioinformatics 20: 1457–1458,2004.
9. Chefetz I, Ben Amitai D, Browning S, Skorecki K, Adir N, ThomasMG, Kogleck L, Topaz O, Indelman M, Uitto J, Richard G, BradmanN, Sprecher E. Normophosphatemic familial tumoral calcinosis is causedby deleterious mutations in SAMD9, encoding a TNF-alpha responsiveprotein. J Invest Dermatol 128: 1423–1429, 2008.
10. Cheyssac C, Dina C, Lepretre F, Vasseur-Delannoy V, Dechaume A,Lobbens S, Balkau B, Ruiz J, Charpentier G, Pattou F, Joly E, PrentkiM, Hansen T, Pedersen O, Vaxillaire M, Froguel P. EIF4A2 is apositional candidate gene at the 3q27 locus linked to type 2 diabetes inFrench families. Diabetes 55: 1171–1176, 2006.
11. Coelho LF, Magno de Freitas Almeida G, Mennechet FJ, Blangy A,Uze G. Interferon-alpha and -beta differentially regulate osteoclastogen-esis: role of differential induction of chemokine CXCL11 expression. ProcNatl Acad Sci USA 102: 11917–11922, 2005.
12. Cohen B, Novick D, Barak S, Rubinstein M. Ligand-induced associationof the type I interferon receptor components. Mol Cell Biol 15: 4208–4214, 1995.
13. Coniglio SJ, Zavarella S, Symons MH. Pak1 and Pak2 mediate tumorcell invasion through distinct signaling mechanisms. Mol Cell Biol 28:4162–4172, 2008.
14. Cook JR, Cleary CM, Mariano TM, Izotova L, Pestka S. Differentialresponsiveness of a splice variant of the human type I interferon receptorto interferons. J Biol Chem 271: 13448–13453, 1996.
15. Croze E, Russell-Harde D, Wagner TC, Pu H, Pfeffer LM, Perez HD.The human type I interferon receptor. Identification of the interferonbeta-specific receptor-associated phosphoprotein. J Biol Chem 271:33165–33168, 1996.
16. da Silva AJ, Brickelmaier M, Majeau GR, Lukashin AV, Peyman J,Whitty A, Hochman PS. Comparison of gene expression patterns inducedby treatment of human umbilical vein endothelial cells with IFN-alpha 2bvs. IFN-beta 1a: understanding the functional relationship between distincttype I interferons that act through a common receptor. J InterferonCytokine Res 22: 173–188, 2002.
17. Dellaire G, Makarov EM, Cowger JJ, Longman D, Sutherland HG,Luhrmann R, Torchia J, Bickmore WA. Mammalian PRP4 kinasecopurifies and interacts with components of both the U5 snRNP and theN-CoR deacetylase complexes. Mol Cell Biol 22: 5141–5156, 2002.
18. Dennis G Jr, Sherman BT, Hosack DA, Yang J, Gao W, Lane HC,Lempicki RA. DAVID: database for annotation, visualization, and inte-grated discovery. Genome Biol 4: P3, 2003.
19. Der SD, Zhou A, Williams BR, Silverman RH. Identification of genesdifferentially regulated by interferon alpha, beta, or gamma using oligo-nucleotide arrays. Proc Natl Acad Sci USA 95: 15623–15628, 1998.
20. Domanski P, Nadeau OW, Platanias LC, Fish E, Kellum M, Pitha P,Colamonici OR. Differential use of the betaL subunit of the type Iinterferon (IFN) receptor determines signaling specificity for IFNalpha2and IFNbeta. J Biol Chem 273: 3144–3147, 1998.
21. Draghici S, Khatri P, Tarca AL, Amin K, Done A, Voichita C,Georgescu C, Romero R. A systems biology approach for pathway levelanalysis. Genome Res 17: 1537–1545, 2007.
22. Eckert D, Buhl S, Weber S, Jager R, Schorle H. The AP-2 family oftranscription factors. Genome Biol 6: 246, 2005.
23. Garaci E, Favalli C, Pica F, Sinibaldi Vallebona P, Teresa PalamaraA, Matteucci C, Pierimarchi P, Serafino A, Mastino A, Bistoni F,Romani L, Rasi G. Thymosin alpha 1: from bench to bedside. Ann NYAcad Sci 1112: 225–234, 2007.
24. Gautier L, Cope L, Bolstad BM, Irizarry RA. affy–analysis of Af-fymetrix GeneChip data at the probe level. Bioinformatics 20: 307–315,2004.
25. Gauzzi MC, Barbieri G, Richter MF, Uze G, Ling L, Fellous M,Pellegrini S. The amino-terminal region of Tyk2 sustains the level ofinterferon alpha receptor 1, a component of the interferon alpha/betareceptor. Proc Natl Acad Sci USA 94: 11839–11844, 1997.
26. Gavutis M, Lata S, Lamken P, Muller P, Piehler J. Lateral ligand-receptor interactions on membranes probed by simultaneous fluorescence-interference detection. Biophys J 88: 4289–4302, 2005.
27. Gentleman RC, Carey VJ, Bates DM, Bolstad B, Dettling M, DudoitS, Ellis B, Gautier L, Ge Y, Gentry J, Hornik K, Hothorn T, Huber W,Iacus S, Irizarry R, Leisch F, Li C, Maechler M, Rossini AJ, SawitzkiG, Smith C, Smyth G, Tierney L, Yang JY, Zhang J. Bioconductor:open software development for computational biology and bioinformatics.Genome Biol 5: R80, 2004.
28. Goldstein AL. History of the discovery of the thymosins. Ann NY AcadSci 1112: 1–13, 2007.
29. Gordon S, Akopyan G, Garban H, Bonavida B. Transcription factorYY1: structure, function, and therapeutic implications in cancer biology.Oncogene 25: 1125–1142, 2006.
30. Hauschild A, Kahler KC, Schafer M, Fluck M. Interdisciplinary man-agement recommendations for toxicity associated with interferon-alfatherapy. J Dtsch Dermatol Ges 6: 829–837, 2008.
31. Haverty PM, Frith MC, Weng Z. CARRIE web service: automatedtranscriptional regulatory network inference and interactive analysis. Nu-cleic Acids Res 32: W213–W216, 2004.
32. Horvath S, Zhang B, Carlson M, Lu KV, Zhu S, Felciano RM,Laurance MF, Zhao W, Qi S, Chen Z, Lee Y, Scheck AC, Liau LM,Wu H, Geschwind DH, Febbo PG, Kornblum HI, Cloughesy TF,Nelson SF, Mischel PS. Analysis of oncogenic signaling networks inglioblastoma identifies ASPM as a molecular target. Proc Natl Acad SciUSA 103: 17402–17407, 2006.
33. Hu R, Gan Y, Liu J, Miller D, Zoon KC. Evidence for multiple bindingsites for several components of human lymphoblastoid interferon-alpha.J Biol Chem 268: 12591–12595, 1993.
34. Hu Y, Sun H, Drake J, Kittrell F, Abba MC, Deng L, Gaddis S, SahinA, Baggerly K, Medina D, Aldaz CM. From mice to humans: identifi-cation of commonly deregulated genes in mammary cancer via compara-tive SAGE studies. Cancer Res 64: 7748–7755, 2004.
35. Huang B, Ahn YT, McPherson L, Clayberger C, Krensky AM.Interaction of PRP4 with Kruppel-like factor 13 regulates CCL5 transcrip-tion. J Immunol 178: 7081–7087, 2007.
36. Huang WC, Taylor S, Nguyen TB, Tomaszewski JE, Libertino JA,Malkowicz SB, McGarvey TW. KIAA1096, a gene on chromosome 1q,is amplified and overexpressed in bladder cancer. DNA Cell Biol 21:707–715, 2002.
37. Irizarry RA, Hobbs B, Collin F, Beazer-Barclay YD, Antonellis KJ,Scherf U, Speed TP. Exploration, normalization, and summaries of highdensity oligonucleotide array probe level data. Biostatistics 4: 249–264,2003.
38. Isomaki P, Alanara T, Isohanni P, Lagerstedt A, Korpela M, Moil-anen T, Visakorpi T, Silvennoinen O. The expression of SOCS is alteredin rheumatoid arthritis. Rheumatology (Oxford) 46: 1538–1546, 2007.
39. Jaitin DA, Roisman LC, Jaks E, Gavutis M, Piehler J, Van der HeydenJ, Uze G, Schreiber G. Inquiring into the differential action of interferons(IFNs): an IFN-alpha2 mutant with enhanced affinity to IFNAR1 is function-ally similar to IFN-beta. Mol Cell Biol 26: 1888–1897, 2006.
40. Julia A, Ballina J, Canete JD, Balsa A, Tornero-Molina J, Naranjo A,Alperi-Lopez M, Erra A, Pascual-Salcedo D, Barcelo P, Camps J,Marsal S. Genome-wide association study of rheumatoid arthritis in theSpanish population: KLF12 as a risk locus for rheumatoid arthritis sus-ceptibility. Arthritis Rheum 58: 2275–2286, 2008.
41. Kanehisa M, Goto S, Hattori M, Aoki-Kinoshita KF, Itoh M, Ka-washima S, Katayama T, Araki M, Hirakawa M. From genomics tochemical genomics: new developments in KEGG. Nucleic Acids Res 34:D354–D357, 2006.
42. Kanno Y, Levi BZ, Tamura T, Ozato K. Immune cell-specific ampli-fication of interferon signaling by the IRF-4/8-PU.1 complex. J InterferonCytokine Res 25: 770–779, 2005.
43. Kaplan MH. STAT4: a critical regulator of inflammation in vivo. Immu-nol Res 31: 231–242, 2005.
44. Kappos L. Interferons in multiple sclerosis. Neurol Clin 23: 189–214 andvii–viii, 2005.
45. Lamken P, Lata S, Gavutis M, Piehler J. Ligand-induced assembling ofthe type I interferon receptor on supported lipid bilayers. J Mol Biol 341:303–318, 2004.
370 IFN BIOLOGICAL SYSTEMS ANALYSIS
Physiol Genomics • VOL 38 • www.physiolgenomics.org
on February 8, 2011
physiolgenomics.physiology.org
Dow
nloaded from

46. Leppert D, Waubant E, Burk MR, Oksenberg JR, Hauser SL. Inter-feron beta-1b inhibits gelatinase secretion and in vitro migration of humanT cells: a possible mechanism for treatment efficacy in multiple sclerosis.Ann Neurol 40: 846–852, 1996.
47. Li CF, MacDonald JR, Wei RY, Ray J, Lau K, Kandel C, Koffman R,Bell S, Scherer SW, Alman BA. Human sterile alpha motif domain 9, anovel gene identified as down-regulated in aggressive fibromatosis, isabsent in the mouse. BMC Genomics 8: 92, 2007.
48. Liu J, Ma X. Interferon regulatory factor 8 regulates RANTES gene tran-scription in cooperation with interferon regulatory factor-1, NF-kappaB, andPU.1. J Biol Chem 281: 19188–19195, 2006.
49. Maher SG, Romero-Weaver AL, Scarzello AJ, Gamero AM. Inter-feron: cellular executioner or white knight? Curr Med Chem 14: 1279–1289, 2007.
50. Marijanovic Z, Ragimbeau J, van der Heyden J, Uze G, Pellegrini S.Comparable potency of IFNalpha2 and IFNbeta on immediate JAK/STATactivation but differential down-regulation of IFNAR2. Biochem J 407:141–151, 2007.
51. Miller JA, Oldham MC, Geschwind DH. A systems level analysis oftranscriptional changes in Alzheimer’s disease and normal aging. J Neu-rosci 28: 1410–1420, 2008.
52. Mitra P, Xie R, Harper JW, Stein JL, Stein GS, van Wijnen AJ.HiNF-P is a bifunctional regulator of cell cycle controlled histone H4 genetranscription. J Cell Biochem 101: 181–191, 2007.
53. Miyazaki Y, Iwabuchi K, Kikuchi S, Fukazawa T, Niino M, HirotaniM, Sasaki H, Onoe K. Expansion of CD4�CD28� T cells producing highlevels of interferon-� in peripheral blood of patients with multiple scle-rosis. Mult Scler 14: 1044–1055, 2008.
54. Mogensen KE, Lewerenz M, Reboul J, Lutfalla G, Uze G. The type Iinterferon receptor: structure, function, and evolution of a family business.J Interferon Cytokine Res 19: 1069–1098, 1999.
55. Moriggl R, Sexl V, Kenner L, Duntsch C, Stangl K, Gingras S,Hoffmeyer A, Bauer A, Piekorz R, Wang D, Bunting KD, Wagner EF,Sonneck K, Valent P, Ihle JN, Beug H. Stat5 tetramer formation isassociated with leukemogenesis. Cancer Cell 7: 87–99, 2005.
56. Murooka TT, Rahbar R, Platanias LC, Fish EN. CCL5-mediated T-cellchemotaxis involves the initiation of mRNA translation through mTOR/4E-BP1. Blood 111: 4892–4901, 2008.
56a.National Cancer Institute. Biometric Research Branch. Division ofCancer Treatment and Diagnosis. BRB-ArrayTools, developed by Si-mon R, Lam AP, BRB-ArrayTools development team (online). http://linus.nci.nih.gov/BRB-ArrayTools.html [25 June 2009].
57. Oldham MC, Horvath S, Geschwind DH. Conservation and evolution ofgene coexpression networks in human and chimpanzee brains. Proc NatlAcad Sci USA 103: 17973–17978, 2006.
58. Orso F, Fassetta M, Penna E, Solero A, De Filippo K, Sismondi P, DeBortoli M, Taverna D. The AP-2alpha transcription factor regulatestumor cell migration and apoptosis. Adv Exp Med Biol 604: 87–95, 2007.
59. Orso F, Penna E, Cimino D, Astanina E, Maione F, Valdembri D,Giraudo E, Serini G, Sismondi P, De Bortoli M, Taverna D. AP-2� andAP-2� regulate tumor progression via specific genetic programs. FASEB J22: 2702–2714, 2008.
60. Panne D. The enhanceosome. Curr Opin Struct Biol 18: 236–242, 2008.61. Paul S, Sodhi A. Modulatory role of thymosin-alpha-1 in normal bone-
marrow haematopoiesis and its effect on myelosuppression in T-celllymphoma bearing mice. Immunol Lett 82: 171–182, 2002.
62. Platanias LC, Uddin S, Colamonici OR. Tyrosine phosphorylation ofthe alpha and beta subunits of the type I interferon receptor. Interferon-
beta selectively induces tyrosine phosphorylation of an alpha subunit-associated protein. J Biol Chem 269: 17761–17764, 1994.
63. Platis D, Foster GR. Activity of hybrid type I interferons in cells lackingTyk2: a common region of IFN-alpha 8 induces a response, but IFN-alpha2/8 hybrids can behave like IFN-beta. J Interferon Cytokine Res 23:655–666, 2003.
64. R Development Core Team. R: a language and environment for statis-tical computing. Vienna, Austria: R Foundation for Statistical Computing,2007.
65. Raguse JD, Gath HJ, Oettle H, Bier J. Interferon-induced remission ofrapidly growing aggressive fibromatosis in the temporal fossa. Int J OralMaxillofac Surg 33: 606–609, 2004.
66. Rani MR, Ransohoff RM. Alternative and accessory pathways in theregulation of IFN-beta-mediated gene expression. J Interferon CytokineRes 25: 788–798, 2005.
67. Rico-Bautista E, Flores-Morales A, Fernandez-Perez L. Suppressor ofcytokine signaling (SOCS) 2, a protein with multiple functions. CytokineGrowth Factor Rev 17: 431–439, 2006.
68. Romani L, Bistoni F, Montagnoli C, Gaziano R, Bozza S, Bonifazi P,Zelante T, Moretti S, Rasi G, Garaci E, Puccetti P. Thymosin alpha1:an endogenous regulator of inflammation, immunity, and tolerance. AnnNY Acad Sci 1112: 326–338, 2007.
69. Ruiz-Maldonado R, Duran-McKinster C, Saez-de-Ocariz M, Cal-deron-Elvir C, Yamazaki-Nakashimada MA, Orozco-Covarrubias L.Interferon alpha-2B in juvenile hyaline fibromatosis. Clin Exp Dermatol31: 478–479, 2006.
70. Saeed AI, Sharov V, White J, Li J, Liang W, Bhagabati N, Braisted J,Klapa M, Currier T, Thiagarajan M, Sturn A, Snuffin M, RezantsevA, Popov D, Ryltsov A, Kostukovich E, Borisovsky I, Liu Z, VinsavichA, Trush V, Quackenbush J. TM4: a free, open-source system formicroarray data management and analysis. Biotechniques 34: 374–378,2003.
71. Schmidt A, Durgan J, Magalhaes A, Hall A. Rho GTPases regulatePRK2/PKN2 to control entry into mitosis and exit from cytokinesis.EMBO J 26: 1624–1636, 2007.
72. Sellers TA, Huang Y, Cunningham J, Goode EL, Sutphen R, VierkantRA, Kelemen LE, Fredericksen ZS, Liebow M, Pankratz VS, Hart-mann LC, Myer J, Iversen ES Jr, Schildkraut JM, Phelan C. Asso-ciation of single nucleotide polymorphisms in glycosylation genes withrisk of epithelial ovarian cancer. Cancer Epidemiol Biomarkers Prev 17:397–404, 2008.
73. Shannon P, Markiel A, Ozier O, Baliga NS, Wang JT, Ramage D,Amin N, Schwikowski B, Ideker T. Cytoscape: a software environmentfor integrated models of biomolecular interaction networks. Genome Res13: 2498–2504, 2003.
75. Soldaini E, John S, Moro S, Bollenbacher J, Schindler U, LeonardWJ. DNA binding site selection of dimeric and tetrameric Stat5 proteinsreveals a large repertoire of divergent tetrameric Stat5a binding sites. MolCell Biol 20: 389–401, 2000.
76. Szczucinski A, Losy J. Chemokines and chemokine receptors in multiplesclerosis. Potential targets for new therapies. Acta Neurol Scand 115:137–146, 2007.
77. Zhang B, Horvath S. A general framework for weighted gene co-expression network analysis. Stat Appl Genet Mol Biol 4: article 17, 2005.
78. Zhao W, Cha EN, Lee C, Park CY, Schindler C. Stat2-dependentregulation of MHC class II expression. J Immunol 179: 463–471, 2007.
371IFN BIOLOGICAL SYSTEMS ANALYSIS
Physiol Genomics • VOL 38 • www.physiolgenomics.org
on February 8, 2011
physiolgenomics.physiology.org
Dow
nloaded from