Analysis of Transcriptional Regulatory Circuitry - DSpace@MIT
194
Analysis of Transcriptional Regulatory Circuitry by Nicola J. Rinaldi B.A., Chemistry Johns Hopkins University, 1994 SUBMITTED TO THE DEPARTMENT OF BIOLOGY IN PARTIAL FULFILLMENT OF THE REQUIREMENTS FOR THE DEGREE OF DOCTOR OF PHILOSOPHY at the MASSACHUSETTS INSTITUTE OF TECHNOLOGY September 2004 ©Nicola J. Rinaldi, 2004. All rights reserved. The author hereby grants to MIT permission to reproduce and to distribute Publicly copies of this thesis document in whole or in part. Signature of Author' Department of Biology July 26, 2004 Certified by c<- Dr. Richard A. Young Professor of Biology Thesis Supervisor Accepted by 'v~~ `7- ~~~~Steve Bell Professor of Biology and Co-Chairperson, Biology Graduate Committee MASSACHUSETTS INSTM't OF TECHNOLOGY SEP 2 2 2004 ii LIBRARIES ARCHIVES i ' I I ---
-
Upload
khangminh22 -
Category
Documents
-
view
0 -
download
0
Transcript of Analysis of Transcriptional Regulatory Circuitry - DSpace@MIT

Analysis of Transcriptional Regulatory Circuitry
by
Nicola J. RinaldiB.A., Chemistry
Johns Hopkins University, 1994
SUBMITTED TO THE DEPARTMENT OF BIOLOGYIN PARTIAL FULFILLMENT OF THE REQUIREMENTS
FOR THE DEGREE OF
DOCTOR OF PHILOSOPHYat the
MASSACHUSETTS INSTITUTE OF TECHNOLOGYSeptember 2004
©Nicola J. Rinaldi, 2004. All rights reserved.
The author hereby grants to MIT permission to reproduce and to distributePublicly copies of this thesis document in whole or in part.
Signature of Author'Department of Biology
July 26, 2004
Certified by c<-Dr. Richard A. YoungProfessor of Biology
Thesis Supervisor
Accepted by'v~~ ̀ 7- ~~~~Steve Bell
Professor of Biology andCo-Chairperson, Biology Graduate Committee
MASSACHUSETTS INSTM'tOF TECHNOLOGY
SEP 2 2 2004
ii
LIBRARIES
ARCHIVES i 'I I
--- �

Dedication
In memory of my father, Anthony Sykes.
2

Acknowledgements
I owe thanks to many people for their help and support during mygraduate career. Rick Young and David Gifford for providing an environmentwhere I could pursue my interest in computational biology, and teaching me howto think about the problems and issues that arise with these large scale data. Mythesis committee, consisting of David Page, Eric Lander, David Housman andMartha Bulyk for taking the time to offer suggestions on my work through theyears, including on this thesis. In particular I'd like to thank Martha Bulyk forproviding me with access to a manuscript pre-publication. All the people thathave been in the Young lab with me over the years have been wonderful,providing both intellectual stimulation and help with scientific issues, as well asbeing really fun to hang out with! In particular I'd like to thank Tony Lee, DuncanOdom, Ann Schlesinger and Francois Robert for all their help and mentoringthrough my four years in the lab. Francois and Sarah Johnstone have also beensuper bench-mates! I owe many thanks to Elizabeth (Bizzy) Herbolsheimerwithout whose computational assistance I would never have been able to finishmy thesis. I would also like to thank my other labmates who have made theYoung lab so entertaining through the years - Craig Thompson, Jo Terragni,Nancy Hannett, Chris Harbison, Dmitry Pokholok, Jean-Bosco Tagne, Jane Yoo,Liz McReynolds, Ezra Jennings, Matt Guenther, David Reynolds, HeatherMurray, Jerry Nau, Megan Cole, Richard Jenner, Julia Zeitlinger, JoergSchreiber, Nora Zizlsperger, Lea Medeiros, Rhonda Harrison, John Barnett,Itamar Simon, Brett Chevalier, Laurie Boyer, Jen Love, Bruno Chazaro and TomVolkert. Kathleen Blackett, Kercine Elie and Carolyn Carpenter were incrediblyhelpful with all kinds of administrative issues. I also would not have survivedwithout advice and commiseration from fellow graduate students, particularlyJulie Wallace and Natalia Comella. Finally, I would not have made it without myfamily. Particularly my father, who passed away in 1995, whom I had told I wouldbe getting my PhD - nothing like that for motivation! Also, my husband Mark hasbeen my biggest supporter through the years. My mom, sister, their husbandsand my in-laws have also been such great sources of strength andencouragement. Thank you from the bottom of my heart.
3

Analysis of Transcriptional Regulatory Circuitry
by
Nicola J. Rinaldi
Submitted to the Department of Biology on July 26, 2004in partial fulfillment of the requirementsJ!for the Degree of
Doctor of Philosophy in Biology
Abstract
The research in this thesis has focused on the analysis of data from twotypes of microarray technologies with the goal of improving understanding oftranscriptional regulatory circuitry in yeast. These microarray technologies,expression analysis and location analysis (ChIP on CHIP), bring uniquechallenges for data analysis. I have adapted methods described previously andhave developing new algorithms for addressing some of these challenges.
I generated yeast transcription factor location data as part of a team effortto determine how a large set of transcriptional regulators occupy the yeastgenome and to facilitate discovery of regulatory network structures. I alsocontributed to another team effort to deduce a portion of the yeast transcriptionalregulatory code, the set of genomic DNA sequences recognized bytranscriptional regulators to effect gene expression programs. Finally, I usedthese experimental and analytical methods to explore changes in geneexpression circuitry that occur after exposure to oxidative stress in yeast.
Thesis Supervisor: Dr. Richard A. YoungTitle: Professor of Biology
Thesis Supervisor: Dr. David K. GiffordTitle: Professor of Computer Science and Engineering
4

Table of Contents
Title Page ........................................ 1
Dedication ................................................................................. 2
Acknowledgements ......... ........................... .......................... 3
Abstract .................................... ................... ......... 4
Table of Contents ........................................ 5
Chapter 1:Introduction: Regulation of Transcriptional Activation .................. ........ 6
Chapter 2:Microarray Data Analysis for Biological Insight .................................... 53
Chapter 3:Transcriptional Regulatory Networks in Saccharomyces cerevisiae ......... 98
Chapter 4:Transcriptional Regulatory Code of a Eukaryotic Genome ..................... 129
Chapter 5:Conclusions: The future of systems biology ....................................... 155
Appendix A:Computational Discovery of Gene Modules and Regulatory Networks ...... 167
5

Chapter 1
Introduction: Regulation of Transcriptional Activation
6

Overview
"The discovery of regulator and operator genes, and of repressive regulation of
the activity of structural genes, reveals that the genome contains not only a
series of blue-prints, but a coordinated program of protein synthesis and the
means for controlling its execution"
Jacob and Monod, 1961
The ability of a cell to respond to its environment is based on exquisite
control of gene expression, protein synthesis, and enzymatic activity. The simple
step of initiating transcription of genes from DNA into RNA is a carefully
choreographed process, involving hundred of proteins. The RNA polymerase
holoenzyme, associated general transcription factors, transcriptional activators
and repressors, chromatin modifiers and remodelers, kinases, phosphatases,
import and export proteins are all components of this coordinated program. Of
particular interest is how all this machinery is controlled to regulate the
expression of an individual gene. Transcriptional activators and repressors seem
to provide the requisite specificity by binding to only a select set of DNA
sequences. Combinatorial interactions of these gene-specific factors with other
transcription factors, the chromatin modifying enzymes which control access of
the basic transcriptional machinery to the DNA template, and various
components of the initiation apparatus, determine which genes are transcribed in
response to a particular stimulus. Therefore, this introduction will focus on the
regulation of transcription at the level of these gene-specific transcription factors.
7
-I~~~~~~~~~~.i··II·Y II-* L-~i . . % 'I-~y·UU l~·

One of the keys to establishing this gene-specific regulation of
transcription is that the transcription factors themselves must be responsive to
varied environmental conditions. Without such changes that affect the DNA
binding or protein-protein interaction abilities of transcription factors, all gene
expression would necessarily be constitutive. Transcription factors have been
shown to be regulated in many different ways including modification of the
transcription factor protein, changes in the amount of protein present in the
nucleus, and sequestration from the DNA.
Initial studies of transcription factors and their modifications focused on
the function of a few regulators at the promoters of single genes or reporter
constructs. With the sequencing of the yeast genome and advent of microarray
technology, however, it is now possible to study the regulation of gene
expression globally. Beyond gene expression, microarray technologies have
been adapted to study the direct effects of transcription factors by finding the
promoters to which the factors are bound in vivo. These data, in combination
with additional information such as sequence conservation between species, are
leading to a much deeper understanding of global mechanisms for controlling the
cellular program, as suggested by Jacob and Monod in 1961.
This introduction will focus, in two sections, on the regulation of gene
expression in Saccharomyces cerevisiae at the level of transcriptional activators.
First, I will discuss the components involved in transcription and activation of
expression, how those components are controlled by interactions with the gene-
specific transcription factors, and how the activities of the transcription factors
8

themselves are modulated. Following that, I will focus on new microarray
technologies available for the study of transcriptional regulation and how use of
these technologies has impacted our knowledge of the regulatory network of the
cell. Later chapters will discuss methods for analyzing the data obtained from
microarray experiments as well as my contributions to the data analysis arena,
followed by examples of how these analyses have been used to further our
understanding of transcriptional regulation in Saccharomyces cerevisiae.
Transcriptional machinery components
The current understanding of transcription regulation is that gene-specific
transcription factors, activators and repressors, control the expression of
individual genes or sets of genes. This regulation is based upon the specificity
provided by two distinct domains in the transcription factor protein. The
archetypal transcription factor consists of a DNA-binding domain, which contacts
the specific DNA sequence, and an activation ( or repression) domain that
recruits specific pieces of the basal transcription machinery (Ptashne 1988). The
crystal structures of a number of these domains have been solved. Activation
domains tend to be highly unstructured (Donaldson and Capone 1992; Van Hoy
et al. 1993; Schmitz et al. 1994; Cho et al. 1996), and make contacts with other
proteins in a manner that depends on general properties of the activation domain
rather than specific protein-protein contacts. For example, the strength of the
interaction between Gal4 and the basal transcriptional machinery depends on the
length of the acidic region of the activation domain as opposed to depending on
9

specific amino acids (Wu et aL. 1996). Crystal structures of many transcription
factor DNA-binding domains complexed with DNA have also been solved,
including those for the most well-studied activators Gcn4, Gal4 and Hsfl
(Ellenberger et a. 1992; Marmorstein et al. 1992; Harrison et a. 1994). In
contrast to the activation domains, the DNA binding domains are highly
structured and make conserved contacts with specific DNA sequences. These
sequences vary from 4 to approximately 17 base pairs in length, with some
degeneracy allowed (Maniatis et al. 1975; Pelham 1982; Stormo 2000; Bulyk et
al. 2001). Because of the relatively short length of these recognition sequences,
they are found throughout the genome. A four base pair site will arise about
every 256 base pairs by random chance. The Gal4 binding site occurs 236 times
in the S. cerevisiae genome, of which 186 instances are positioned within open
reading frames. However, these sites appear to affect transcription only when
located within promoters (Li and Johnston 2001; Topalidou and Thireos 2003).
This is likely because of the additional elements such as the TATA-box that are
contained in promoters, that help to stabilize the binding interaction between the
transcription factor and DNA (Lee and Struhl 1995; Vashee and Kodadek 1995).
A typical promoter in yeast consists of three elements: the upstream
activating sequences (UAS), at which these transcription factors bind, the TATA-
box (consensus sequence TATAAA), which nucleates the assembly of the
apparatus that actually performs the transcription, and the initiator element (Inr),
where gene transcription begins. A promoter can also contain operator
10

sequences, bound by transcriptional repressors, which act to turn off gene
expression.
For the most part, these promoters are not readily accessible to the
transcriptional machinery in the cell. Most cellular DNA is contained in
chromatin, an ordered structure consisting of repeats of approximately 146 base
pairs of DNA wrapped around a complex comprised of histone proteins, into a
structure called a nucleosome. The nucleosomes serve to package DNA into a
small volume, and also to repress transcription of genes. In vitro, the basal
transcriptional machinery is able to bind to and transcribe DNA in the absence of
transcription factors, but in vivo this machinery is unable to overcome the
repression by chromatin. TATA-binding protein (TBP), for example, is unable to
bind to a TATA-box wrapped in a nucleosome (Workman and Roeder 1987;
Imbalzano et al. 1994). The transcriptional activators direct a series of additional
enzymes to modify and remodel the chromatin to allow access to the DNA
template by the transcriptional machinery.
The protein components of this transcriptional machinery (Struhl 1995;
Ptashne and Gann 1997; Kornberg 1998; Martinez 2002; Roeder 2003; Hahn
2004) have been discovered and characterized through a series of biochemical
studies. The machinery that transcribes DNA to RNA is the 12 subunit RNA
polymerase II complex (Bushnell and Kornberg 2003). Tethering of polymerase
subunits to DNA by attaching a DNA binding domain results in synthesis of the
complementary messenger RNA molecule (Barberis et al. 1995; Farrell et al.
1996). However, without the physical attachment of the polymerase to DNA,
11

other factors are required for transcription to take place. These are termed
General Transcription Factors (GTFs), and provide many of the accessory
functions necessary for the initiation of transcription. GTFs and polymerase
alone are sufficient to transcribe DNA to RNA in vitro (Sayre et al. 1992) but in
vivo gene-specific transcription factors are generally required to recruit both the
enzymes to open the chromatin structure and the GTFs and polymerase.
Additionally, a form of the polymerase called the holoenzyme is also required for
activated transcription (Kelleher et al. 1990; Kim et al. 1994; Koleske and Young
1994). This consists of RNA polymerase II and another complex of
approximately 20 proteins called Mediator (Kim et al. 1994).
The recruitment of these complexes by activators begins the assembly of
a large group of proteins, called the pre-initiation complex (PIC). The assembly
of the PIC is well understood in vitro, however, whether the same model is
followed in vivo is not known. In vitro this assembly begins with a GTF called
TATA-binding protein (TBP). TBP binds to the TATA box in the promoter with a
defined orientation, establishing the direction in which transcription will occur
(Struhl 1995). Other GTFs that are components of the PIC include TFIIB and
TFIIF, which recruit the polymerase. These three complexes select the start site
of transcription based on their contacts with the Initiator element in the promoter
DNA (Kornberg 1998; Ziegler et al. 2003; Bushnell et al. 2004). Additional GTFs
involved in the initiation super complex include TFIIE, which appears to be
involved promoter melting, clearance, and recruitment of TFIIH (Goodrich and
Tjian 1994; Lommel et al. 2000; Sakurai and Fukasawa 2000), and TFIIH itself.
12

TFIIH comprises two enzymatic functions: a DNA helicase, which opens the
DNA at the promoter (Goodrich and Tjian 1994), and a kinase, for
phosphorylating the C-terminal domain (CTD) of the large subunit of RNA
polymerase (Feaver et al. 1991; Sakurai and Fukasawa 1998). After this
complex is assembled, gene transcription begins. The transcriptional activator
and some components of the PIC remain at the promoter to form a scaffold for
reinitiation of transcription, while the polymerase traverses the DNA being
transcribed (Zawel et al. 1995; Yudkovsky et al. 2000).
Model for transcriptional activation
As just mentioned, gene specific transcription factors are used by the cell
to recruit most of the apparatus needed to activate gene transcription. In
general, the first barrier to transcription that must be overcome is the packaging
of DNA into chromatin. A few different models for how the changes in chromatin
that allow gene transcription can occur have been described (Morse 2003). First,
some promoters, which tend to be constitutively transcribed, do not complex with
histones. This can be due either to constraints based on sequence, or binding of
general regulatory factors such as Rebl (Workman and Buchman 1993;
Angermayr and Bandlow 2003; Morse 2003). Poly(dA:dT) sequences near a
promoter are another mechanism by which nucleosome formation can be
discouraged (lyer and Struhl 1995).
In cases where the promoter is found in chromatin, activators can bind
and destabilize the interaction between DNA and histones. For example, the
13
_� .�UU·--Y··U�···LMU·IW·LYII�Y··YI�Y
activator Gal4 has been demonstrated to bind to DNA contained in nucleosomes.
That binding alone seems to be sufficient to destabilize the DNA-histone
interaction, as the activation domain is not necessary for the destabilization
(Workman and Kingston 1992; Axelrod et al. 1993; Morse 2003). In fact, some
activators have been demonstrated to have a higher affinity for DNA complexed
with nucleosomes than for naked DNA, perhaps because the bending of the DNA
around the histones exposes the binding sequence (Cirillo and Zaret 1999).
The chromatin structure is dynamic rather than static, with stretches of
DNA being transiently exposed. This can allow for binding of sequence specific
proteins to DNA packaged in nucleosomes. Restriction enzyme sites were
engineered into the ends and middle of a 150bp DNA molecule that was known
to form a positioned nucleosome. The equilibrium constants for binding of the
restriction enzymes to each restriction site were calculated by comparing the rate
of cleavage in the nucleosomal DNA versus free DNA. Contrary to previous
theory, binding and cleavage was seen even at the DNA positioned in the middle
of the nucleosome, indicating that the DNA does occasionally separate from the
histone proteins for long enough to allow for binding of another protein (Polach
and Widom 1995). This also can explain the cooperativity of binding of
transcription factors to nucleosomal DNA even when the factors do not contact
one another (Adams and Workman 1995). The binding of one activator to the
nucleosome exposes the site to which the second factor binds, significantly
reducing the free energy required for binding of the second factor (Polach and
Widom 1996).
14
Another way in which activators can interfere with the nucleosomal
structure is illustrated by the binding of the transcription factor Pho4 to the PH05
promoter (Venter et al. 1994; Svaren and Horz 1997). Pho4 binds to a UAS that
is located in the free DNA region between two nucleosomes. This binding event
disrupts the adjacent nucleosome, allowing Pho4 binding to a second UAS which
was previously complexed in the nucleosome and inaccessible. This model was
confirmed in two ways. First, mutation of the free UAS so that Pho4 could no
longer bind blocked the nucleosome remodeling (Svaren et al. 1994). Second,
removal of the activation domain of Pho4 also interfered with the restructuring at
the promoter (Svaren et al. 1994). Unlike the situation with Gal4 where the
binding of the factor to the DNA is sufficient to remodel the chromatin, in this
case the activation domain is required for the remodeling.
Finally, the binding of transcriptional activators to promoters can open
chromatin structure through recruitment of additional proteins. Activators have
been demonstrated to recruit various general transcription factors that can
stabilize the interaction of the transcription factor with DNA by tilting the energy
equilibrium. For example, Gal4 binding is enhanced in the presence of a TATA
site, indicating that recruitment of TBP and its subsequent binding to DNA can
stabilize the Gal4 - DNA interaction (Vashee and Kodadek 1995). Other proteins
that can be recruited by the transcription factors are chromatin modifiers and
remodelers. One group of these enzymes, Histone Acetyl-Tranferases (HATs)
acetylates the N-terminal tails of the histone proteins (Allfrey et al. 1964), which
15

is hypothesized to destabilize chromatin by disrupting nucleosome - nucleosome
interactions (Bannister and Miska 2000; Narlikar et al. 2002).
The other class of complexes recruited by transcription factors consists of
ATP dependent chromatin remodeling enzymes, which function to either slide
histones along DNA to expose different stretches (Meersseman et al. 1992;
Whitehouse et a. 1999; Narlikar et al. 2002), or to change the conformation of
the histones to expose the DNA in situ (Lorch et al. 1998; Jaskelioff et al. 2000;
Schnitzler et al. 2001). Interactions of the activation domain of transcription
factors with at least three subunits of the yeast SWI/SNF complex, one of the
complexes effecting chromatin remodeling, has been demonstrated (Neely et al.
1999; Neely et al. 2002).
Based on studies of how these various chromatin remodeling or modifying
factors are recruited at two different promoters, PHO8 and HO, it appears that
the order in which these events occur is promoter dependent (Cosma 2002;
Neely and Workman 2002). Acetylation of the histones at the PHO8 promoter
was measured in strains containing either a deletion or mutation of the catalytic
subunit of the SWI/SNF chromatin remodeling complex, so that no remodeling
could occur. Hyperacetylation of histones at the promoter region was observed
in these strains, in contrast to the wild type strain, where acetylation at the
promoter was somewhat lower than before activation of the gene. No
hyperacetylation was found in a strain deleted for the HAT Gcn5, or in a strain
with no Pho4. Therefore, the model for activation of transcription at this promoter
is that Pho4 binds to its cognate sequence and recruits the Gcn5 containing
16

SAGA complex, which then acetylates the histones in the nucleosomes at the
promoter. This acetylation leads to recruitment of SWI/SNF, which remodels the
chromatin, with acetylation lost during the remodeling (Reinke et al. 2001). A
subsequent study of the PHO5 promoter found a similar order of events, but with
complete loss of the histones. This might explain the loss of acetylation due to
SWI/SNF at the PHO8 promoter also (Reinke and Horz 2003).
The order of recruitment of these complexes was also studied at the HO
promoter (Cosma et al. 1999). In this case, an epitope tag was added to the
transcription factors or remodeling complex subunits thought to be involved.
Chromatin immunoprecipitation was performed at various times throughout the
cell cycle to detect the presence or absence of each tagged factor. The
interdependence of the events was assessed by using deletion mutants of the
various factors. At this promoter the model consists of the initial step of binding
of the transcription factor Swi5, followed by Swi5 dependent recruitment of the
SWI/SNF chromatin remodeling complex. Subsequent recruitment of SAGA to
acetylate the histones is dependent upon the prior presence of SWI/SNF. Only
after each of these events has occurred can the transcription factor complex SBF
bind to the HO promoter and recruit the transcription apparatus. Finally, this
entire chain of events is obviated when the transcription factor Ash1 is expressed
- Ash1 binds to Swi5 and prevents interactions with the SWI/SNF complex.
Subsequent to the recruitment of activators and the release of repressive
chromatin structures, the transcription initiation apparatus must be recruited.
This is another step that takes place through interactions with the transcription
17

factors. In vitro interactions between activators and many components of the
basal machinery have been demonstrated: TFIIA (Kobayashi et al. 1995), TFIIB
(Lin et al. 1991), TFIID, comprised of TBP (Stringer et al. 1990) and TAFs (Tjian
and Maniatis 1994), TFIIF (Joliot et al. 1995), TFIIH (Xiao et al. 1994) and the
Rpb5 subunit of RNA polymerase II (Lin et al. 1997). As mentioned earlier,
artificial recruitment of many of these factors has also been shown to activate
transcription in vivo, close to the levels seen with wild type transcription factor /
basal machinery interactions. For example, a fusion of TBP to the LexA DNA
binding domain activates transcription from a LexA promoter (Chatterjee and
Struhl 1995; Ryan et al. 2000). Using fusions of a DNA binding domain and TBP
with leucine zippers to promote dimerization and thus artificially recruit TBP to
the promoter also causes activation of transcription (Klages and Strubin 1995).
This artificial recruitment does not, however, circumvent the requirement for the
prior opening of chromatin. A TBP-Gal4 fusion is unable to activate transcription
from a promoter complexed with histones, in contrast to the normal activation
from a less constrained promoter (Ryan et al. 2000). Artificial tethering of TAFs
associated with TBP in TFIID, as well as artificial recruitment of TFIIB also
activate transcription (Gonzalez-Couto et al. 1997).
In vivo, interactions between TFIIA and TBP are required for activation of
genes regulated by Gcn4, Acel or Gal4 (Stargell and Struhl 1995). A mutant
TBP unable to interact with TFIIA was also incapable of activating transcription
from promoters regulated by these three activators. This implies that TFIIA is the
GTF recruited by these activators, which then recruits the remainder of the
18

transcription machinery. It is possible that this recruitment is mediated by other
cofactors - in human cells a positive cofactor PC4 was required for an interaction
between the activator VP16 and TFIIA to take place (Ge et al. 1994). Direct
interactions of activation domains with TBP have also been demonstrated in vivo.
Using a construct where the single cysteine in the activation domain of the
human transcription factor E2F-1 was derivatized with maleimide-4-
benzophenone, photocrosslinking demonstrated a specific interaction between
this activator and TBP (Emili and Ingles 1995). Finally, TFIIB is also a bona fide
target of transcriptional activators. A mutant TFIIB with a serine to proline
substitution is unable to activate PH05 transcription under conditions of
phosphate starvation, although the basal level of transcription is unaffected.
GST pull down experiments demonstrated an inability of the activator Pho4 to
interact with this TFIIB S53P mutant. A similar defect in interaction, and thus in
transcription, was seen with the transcription factor Adrl (Wu and Hampsey
1 999).
Regulation of transcription factor activity
In order that genes be expressed only when needed by the cell, the
transcription factors themselves must be regulated. To effect all the
transcriptional programs that are required by the cell upon various stimuli or
environmental changes, a large number of mechanisms are used to control the
transcription factors. These include modulation of the amount of a transcription
factor present in the cell, covalent modification by phosphorylation, ubiquitination,
19
.. ... . . . 1. `". - ~ "-.~..-'.·~-~ L~.LUL-U~~yLI·

or acetylation, direct repression by protein-protein interactions, indirect
repression by competition for general transcription factors or chromatin modifiers,
competition for binding sites within the DNA sequence, binding of a small
molecule substrate, and alterations in subcellular protein localization (Struhl
1995; Reece and Platt 1997; Sharrocks 2000; Tansey 2001). These
mechanisms have been studied in detail for a few canonical activators, as
described below.
The most obvious way for a cell to regulate transcription factors is through
controlling the amount of the factor present in the cell. This can be achieved
through increasing or decreasing the amount of transcription of the gene, through
the half-life of the mRNA, through the rate of protein synthesis, and finally
through the control of protein degradation. Examples of transcription factors
controlled in these varied ways include the the cell cycle factors Swi4, Swi5, and
Ace2, as well as the amino acid biosynthesis master regulator, Gcn4 (Struhl
1995). The transcription of the cell cycle factors seems to be controlled by serial
binding of transcriptional activators to the promoters of activators turned on later
in the cycle (Simon et al. 2001). Swi4, for example, is activated by Swi6 at the
M/G1 transition, and later shut down by Mcml in combination with Yox1 and
Yhpl (Breeden and Mikesell 1991; Foster et al. 1993; Mclnerny et al. 1997;
Pramila et al. 2002).
The concentration of Gcn4 in the cell is controlled by numerous
mechanisms, one of which is alteration in the rate of translation. The eukaryotic
translation initiation factor 2 (elF-2) is phosphorylated upon amino acid
20
...- _- ... .............. -_ __·_ -·_'..l__'.'._r'_·

starvation, leading to an increase in the amount of Gcn4 protein synthesized.
Mutation of the phosphorylated elF-2 serine to an alanine ablates this increase in
Gcn4. Conversely, a serine to aspartate mutation to mimic phosphorylation
derepresses Gcn4 regardless of the amino acid content of the growth media
(Dever et al. 1992). This regulation of Gcn4 occurs through small open reading
frames occurring upstream of the start of the major exon, called uORFs
(Hinnebusch 1984; Hinnebusch 1994). Ribosomes initiate translation at the first
uORF. In the presence of unphosphorylated elF-2 the ribosomes that continue
scanning downstream of uORF1 are able to re-initiate translation of the
downstream uORFs, particularly uORF4, which then blocks initiation at the Gcn4
coding region. The phosphorylated elF-2 is unable to re-initiate as quickly.
Therefore it cannot translate uORF4, but rather starts translation of Gcn4. Yap1
and Yap2 are also regulated through uORFs (Vilela et al. 1998). The Yap1
uORF is comparable to the Gcn4 uORF1, allowing leaky re-initiation of
translation as the ribosomes scan through the mRNA. In contrast, the uORFs in
the Yap2 leader sequence post a strong block to translation of the Yap2 ORF like
the Gcn4 uORF4, and also mediate accelerated decay of the mRNA. How stress
conditions increase synthesis of the Yap regulators when needed has not yet
been described, but it seems likely that these uORFs will be involved, as they are
for Gcn4.
Regulation of transcription factors by phosphorylation seems to be one of
the most common mechanisms by which activity is controlled, based upon the
number of factors that show alterations in phosphorylation state (Yeast Proteome
21

Database, (Costanzo et al. 2000; Csank et aL. 2002)). This is because a change
in phosphorylation state, as well as potentially modifying the DNA-binding
properties of a transcription factor or activity of its activation domain, can also be
the signal for regulation by another mechanism, such as nuclear exclusion or
protein degradation.
The DNA-binding ability of the transcriptional repressor Rgtl, involved in
regulation of glucose transporters, is modulated by the its phosphorylation state,
which is dependent on the carbohydrate source in the growth medium (Kim et al.
2003; Mosley et al. 2003). In high glucose conditions, Rgtl is
hyperphosphorylated and unable to bind to DNA, and the hexose transport genes
regulated by Rgt1 are expressed. On the other hand, in low glucose conditions
the phosphates are removed and DNA binding and repression of the hexose
transporters takes place. The observation was strengthened by assays showing
that removal of the serine residues that undergo phosphorylation induces
constitutive DNA binding and repression of the transporters. Other transcription
factors that are regulated in this manner include Crtl, involved in DNA damage
response (Huang et al. 1998), and Mac1, which regulates intracellular copper
levels (Heredia et a. 2001).
Regulation of the level of activity of transcriptional activation domains by
phosphorylation has been proposed to occur by altering the protein-protein
contacts the activation domain is able to participate in. In one example, Pho4 is
unable to bind to its partner Pho2 when a particular serine in the Pho4 activation
domain is phosphorylated (Komeili and O'Shea 1999). Phosphorylation of Pho2
22
-. .. ........ ·r~··- ·-·---~ ·-·-- I Y--i· uyl- w2rr~ -· +rl~

likewise inhibits the Pho4 - Pho2 interaction (Liu et al. 2000). The interaction
between cell cycle regulators Fkh2 and Nddl is similarly affected by activation
domain phosphorylation, altering the ability to Fkh2 activate gene expression
(Darieva et al. 2003). Phosphorylation of activation domains has also been
postulated to help with interactions of transcription factors with the general
transcription machinery by increasing the negative charge / acidity of the
activation domain (Struhl 1995), but no clear examples of this mechanism for
alteration in activation function have been found.
Phosphorylation of transcription factors also affects interactions with
nuclear import and export proteins. Pho4 contains five phosphorylation sites,
one of which, as mentioned above, affects its interaction with Pho2.
Phosphorylation at two of the remaining four sites is required for interaction with
Msn5, the P-importin family member that exports Pho4 from the nucleus.
Dephosphorylation at yet another site is required for interaction with Psel, the p-
importin that imports Pho4 (Komeili and O'Shea 1999). The subcellular
localization of transcription factors is almost always signaled by a change in
phosphorylation state - other examples include Msn2/4, Gat1, Gln3 (Beck and
Hall 1999), Skol (Pascual-Ahuir et al. 2001) and cell cycle factors Ace2 and
Swi5 (Nasmyth et al. 1990; Moll et al. 1991; O'Conallain et al. 1999), to name just
a few.
Gal4 provides an example of a transcription factor regulated by direct
repression through additional proteins. This transcription factor provides a switch
highly sensitive to the carbohydrate source available to the cell. In media where
23

-···----·---- -.'·~~~~~l ~j~igCu~r- . .-.----.- .rr-ru·· ~W dki Cjj1
glucose is present, GAL genes are transcriptionally inert, repressed by Migl
(Nehlin et al. 1991). Under non-inducing, non-repressing conditions, such as
growth in glycerol, Gal4 is expressed and binds in a complex with Gal80 to the
promoters containing its cognate sequence (Leuther and Johnston 1992). GaI80
is thought to block access of the transcriptional machinery to the Gal4 activation
domain. When the cell is grown in galactose, Gal3 binds to Gal80, likely inducing
a conformational change that exposes the Gal4 activation domain, thus allowing
the recruitment of TBP and TFIID, and activated transcription of the GAL genes
(Suzuki-Fujimoto et al. 1996; Wu et al. 1996)
Regulation through the presence or absence of a small molecule was the
first model described for regulation of a transcription factor in bacteria (Jacob and
Monod 1961). Sensing of cellular conditions through binding of an intermediate
in a biosynthetic pathway or binding of another small molecule to a transcription
factor provides a sensitive mechanism for the cell to regulate gene transcription
based on extracellular conditions. One example of the effects of small molecules
is the regulation of DNA binding of Acel and Mac1 by copper ions. This allows
the cell to tightly regulate the amount of copper and other metal ions available
(Furst and Hamer 1989; Heredia et al. 2001). As the amount of heavy metal in
the cell decreases, these factors can bind to DNA, activating transcription of
heavy metal transporters. This increases the intracellular concentration of these
ions, restoring the required balance. Another transcription factor regulated
similarly is Leu3, which is regulated by the presence of a-lsopropylmalate, one of
the intermediates in the biosynthesis of leucine (Sze et al. 1992). If the
24

intermediate is present, Leu3 binds to the promoters of leucine synthesis genes
but is transcriptionally inactive. As the levels of intermediate drop, the
conformation of the activation domain changes such that components of the
general transcription machinery are recruited (Sze et al. 1992). A final example
of regulation through binding of a small molecule is' illustrated by the interaction
of the regulator Hap1 with heme. In the absence of heme Hap1 forms a high
molecular weight complex and is sequestered from DNA through interactions
with other proteins like Hsp90O, showing yet another possible mechanism of
regulation of regulators (Zhang and Guarente 1994; Zhang et al. 1998). The
activation domain of Hap1 is also regulated by the presence of heme, through a
heme responsive domain (Zhang and Guarente 1995). In this case, binding of
heme seems to block the binding site for an additional repressive protein,
perhaps Hsp90O (Zhang et al. 1998).
Changes that activate transcription factors to begin recruitment of the
transcriptional machinery must be reversible in order that transcription be shut
down when the stimuls is no longer present. An elegant model for how this is
accomplished has been described (Chi et al. 2001; Tansey 2001; Ansari et al.
2002). Srb10O, a component of the RNA polymerase II holoenzyme
phosphorylates the transcription factor Gcn4 as the activator and holoenzyme
make contacts at the promoter. This phosphorylation then leads to ubiquitination
of the marked Gcn4 molecule, which is then degraded by the 26S proteasome.
Similarly, Msn2 is phosphorylated by Srb10O during their interaction at the
promoter, leading to the subsequent export of Msn2 from the nucleus. Using the
25
~,.... ~.....; ., ~ - . .- L.·..·,...-----··_ --·IlLI IlrY y·I· - *I- - ·

time during which the transcriptional machinery is contacting the transcription
factor to mark that factor for subsequent removal from the cell ensures that
activation of a gene does not outlive the need for the gene product. Ste12 is also
regulated in this manner (Nelson et al. 2003), and Gal4 and Sip4 are likewise
phosphorylated by SrblO, although in these cases the phosphorylation is
associated with activation of the transcription factors rather than degradation or
removal (Sadowski et al. 1996; Hirst et al. 1999; Vincent et al. 2001).
Microarray technologies and the analysis of transcription
Many of the experiments used to elucidate the mechanisms and ideas
described so far were performed on the level of a single gene. In vitro assays
were used to determine the components necessary for transcription, and how
different complexes were interacting with one another. In vivo, reporter
constructs were used to test activation at a single promoter, or expression levels
of individual genes were tested using Northern or Western blots. However, since
the S. cerevisiae genome was fully sequenced (Goffeau et al. 1996), new
technologies have been developed that enable us to ask similar questions, on a
genome-wide scale.
The first technology to be developed was analysis of the mRNA
expression level of essentially all S. cerevisiae genes using DNA microarrays
(Schena et al. 1995; Shalon et al. 1996). These microarrays consist of cDNAs
corresponding to each gene printed in spots on glass slides, or oligonucleotides
synthesized in situ or printed on slides (Pease et al. 1994; Lipshutz et al. 1995).
26

Total RNA or purified mRNA is used as a template for reverse transcription with
nucleotides conjugated to a fluorescent moiety, and the resulting labeled DNA is
hybridized to the array. Genes of interest are found by scanning the array with a
laser, using software to find spots and quantitate the level of fluorescence in
each spot, and performing statistical manipulationsiand tests (Bowtell 1999;
Holloway et al. 2002)
This technology has been used to gain many insights into the global
transcriptional regulation in the cell. Initial experiments were focused on the
changes in gene expression during a cellular process, or following an
environmental perturbation. For example, some of the earliest studies used
various methods to synchronize yeast cells in the cell cycle, then examined the
transcriptional readout as the cells progressed through the cycle (Cho et aL.
1998; Spellman et al. 1998). In another series of experiments, effects of various
environmental stresses on the cell, including changes in pH, high salt
concentration, oxidative and osmotic stress, and nutrient deprivation were
examined (Gasch et a. 2000; Causton et al. 2001). These results highlighted the
global changes in gene expression effected by transcription factors. In another
landmark study, the effects on gene expression of over three hundred
perturbations, including knockouts of selected genes such as transcription
factors, were profiled (Hughes et aL. 2000b). In these experiments, as well as
others performed with transcription factor knockouts, a surprisingly small number
of the genes with changes in expression contain a recognizable DNA binding site
for the particular transcription factor being studied. This highlights the extent of
27

secondary effects that occur based on the regulation of additional transcription
factors, as well as other proteins involved in transcriptional regulation. Large
surveys like these are complemented by hundreds of experiments in which
microarrays have been used to elucidate components of individual pathways and
understand the transcriptional regulation of those pathways (Ogawa et al. 2000;
Natarajan et al. 2001; Agarwal et al. 2003; Schuller et al. 2004).
Aside from studying the downstream effects of transcriptional regulation,
microarrays have also been used to analyze the cellular requirements for
components of the general transcriptional apparatus. In a seminal study, the
function of subunits of each of the main complexes involved in transcriptional
initiation was abolished either through a knockout, a point mutation, or a
temperature sensitive mutation (Holstege et al. 1998). The genome-wide
requirement for each complex was then assessed. Many of the observations
made about the function of these complexes at individual genes were confirmed
and extended. For example, because of the equivalent requirement for RNA
polymerase II and the Srb4 component of the Srb/Mediator complex at almost
every gene, previous assertions about the in vivo requirement for the
holoenzyme rather than just the polymerase were confirmed (Holstege et al.
1998). The kinase subunit of the GTF TFIIH was also required at almost every
gene, giving added credence to the hypothesis that phosphorylation of RNA
polymerase is required for transcriptional initiation to proceed to elongation. The
genome-wide nature of these experiments also enables conclusions about
transcriptional regulation that cannot be drawn from studies at a single gene.
28

Micoarray analysis of mutants of essential subunits of the chromatin remodeler
Swi/Snf showed that nucleosome perturbations were localized to individual
genes rather than chromosomal domains (Sudarsanam et al. 2000).
A technique that brings together the direct study of the targets of
transcriptional components with DNA microarrays is variously termed
"Chromatin-immunoprecipitation on a Chip", "ChIP-Chip", and "Genome-wide
location analysis" (Ren et al. 2000; lyer et al. 2001). When these experiments
are performed in yeast, typically an epitope tag is introduced into the genomic
locus of the protein of interest (Knop et al. 1999). The cells containing the
epitope tagged factor are grown under a relevant condition, proteins are
crosslinked to DNA using formaldehyde, and sonicated to shear chromatin. The
cellular extract is then subjected to immunoprecipitation using an antibody to the
epitope tag. Alternatively, an antibody raised directly against the protein can be
used. This immunoprecipitation selectively purifies the factor of interest, along
with any DNA to which it may be binding. The DNA is then amplified in the
presence of fluorescently labeled nucleotides, genomic DNA from the same
strain is labeled with a different fluorophore, and the two samples are hybridized
to a microarray containing yeast intergenic regions. Statistical analyses (Hughes
et al. 2000b; Lee et a/. 2002) are used to assign a significance of enrichment to
each spot, and spots with a high significance are likely to be bound by the protein
of interest.
Genome-wide location analysis has led to a better understanding of the
transcriptional regulation underlying the yeast cell cycle. The promoters bound
29

by the complexes SBF, consisting of Swi4 and Swi6, and MBF, comprising Mbpl
and Swi6, were examined in one study (yer et aL 2001). Approximately 200
novel targets for these factors were found, and the genes downstream of these
promoters were enriched for the functions that take place during the G1 phase of
the cell cycle, when these factors are active. Sixteen of the promoters to which
SBF and MBF were binding putatively regulate transcription factors. Genome-
wide location analysis was performed on nine of these additional transcription
factors, and these were found to bind to a number of genes performing additional
functions necessary for the G1 phase (Horak et al. 2002). This idea of
transcription factor cascades was delineated in another study, where the nine
known cell cycle transcription factors were profiled (Simon et al. 2001). The
transcriptional regulation of the entire cell cycle was shown to be cyclical, with
transcription factors from each stage regulating the transcription of regulators
from the next stage, as well as other signaling molecules that stimulate and shut
down the activation function of these regulators. Additional transcriptional
regulators regulating the cell cycle, as well as an increased number of genes
regulated by the cell cycle transcription factors were found by using an algorithm
to combine expression and location data (Lee et aL. 2002; Bar-Joseph et al.
2003).
In an approach highly complementary to location analysis, binding of
transcription factors and other sequence specific DNA binding proteins to
microarrays has been used to analyze the specificity of that binding. Initial
studies demonstrated sequence specific binding and cutting by restriction
30

enzymes on DNA immobilized on an array (Bulyk et al. 1999). Subsequently, the
sequence specificities of a number of zinc finger mutants were assessed (Bulyk
et al. 2001). The second zinc finger of a three finger mouse transcription factor
was mutagenized, and displayed on a phage. Binding of this protein to
oligonucleotides containing all 64 variants of the second finger's binding sites
was tested. Interestingly, different mutants showed varying levels of selectivity:
some mutants were only able to bind to one or two of the sixty four
oligonucleotides, while others were able to bind to almost all of the
oligonucleotide variants. Finally, tagged transcription factors were bound directly
to arrays containing most yeast intergenic regions to find all sequences to which
DNA binding by the factors was possible (Mukherjee et al. 2004). A direct
comparison with location data for the same factors (Lee et al. 2002) showed that
while there was significant overlap in the intergenic regions bound for two out of
three factors, there were intergenic regions that were bound only in one of the
two assays (Mukherjee et al. 2004). Promoters at which these differences were
seen could be used to study the different determinants of binding in the in vitro
versus in vivo situations.
Each of these sources of microarray data has been used computationally
to attempt to determine the actual sequence specificity of the gene-specific
transcription factors. Prior to the advent of the microarray technologies, the
sequence motifs to which a few factors bound had been painstakingly identified.
The first motifs were defined in the bacterium E. coli by searching for patterns by
eye: the sequence to which the lambda repressor binds (Maniatis et al. 1975),
31

and the -10 promoter element (Pribnow 1975). In S. cerevisiae, the consensus
motif for the transcription factor Hsfl was one of the first to be identified (Pelham
1982). The DNA sequence necessary for upregulation of the heat shock protein
Hsp70 by Hsfl was narrowed down to a 20 base pair stretch by deletion
analysis, then a palindromic sequence within this region was also found
upstream of several other genes regulated by Hsfl. It was quickly realized that
unlike restriction enzymes, the sequence specificity of transcription factors was
much less stringent (Pribnow 1975). This led to the use of Position Weight
Matrices (PWMs) to account for the variable affinity of transcription factor
proteins for variations in their binding sites (Stormo 2000).
Microarray data were initially used to find consensus sequences or PWMs
by clustering genes with similar expression patterns then searching for sequence
motifs, based on the assumption that the similar expression patterns were
effected by the same regulators (DeRisi et al. 1997; Brazma et al. 1998; Roth et
al. 1998; Spellman et al. 1998; van Helden et al. 1998). Since then, many other
methods have been developed or used to take advantage of these data, using
varied statistical sampling to determine sensitivity and specificity. These include
expectation-maximization (EM) (Lawrence and Reilly 1990; Spellman et al.
1998), and Gibbs sampling (Hughes et al. 2000a; Liu et al. 2001). The inclusion
of additional data sources, such as location data, has been used to further
narrow the set of input sequences to raise the signal to noise ratio of the site
specific sequence within the background random DNA (Ren et al. 2000; lyer et
al. 2001; Simon et al. 2001; Lee et al. 2002; Liu et al. 2002; Zeitlinger et al. 2003;
32

Harbison et al. 2004). The sequencing of multiple similar species has added an
additional constraint, making motif finding easier with the assumption that the
nucleotides important for transcription factor binding will be more conserved
between species than nucleotides without constraint on mutation (Cliften et al.
2003; Kellis et al. 2003; Harbison et al. 2004).
The knowledge of the sequence specificity of transcription factors allows
prediction of genes regulated by the factor, and provides an important
component of any network model of the cell. While large leaps in the ability to do
this have been achieved over the past decade as described above, we are still
far from a complete understanding of the phenomenon. For example,
transcriptional activators seem to bind to and regulate genes where no sequence
motif for the factor can be found (Lieb et al. 2001; Lee et al. 2002). Conversely,
there are hundreds of copies of factor specific motifs throughout the genome,
many of which are not bound by the site's cognate transcription factor (Lieb et a/.
2001; Harbison et al. 2004). And for a large percentage of additional genes, no
site specific regulator can be found (Harbison et a/. 2004).
The holy grail in the study of transcriptional regulation is to determine the
complete network of interactions that drives gene expression in the living cell.
Each of the microarray technologies described provides information towards
attaining this goal. Expression analysis provides a functional readout of the
results of the transcriptional regulation, but with expression data one cannot
deconvolute direct effects of transcription factor binding from indirect effects.
Location analysis complements the expression data by providing the information
33
about which genes are likely to be the direct targets of a transcription factor. This
method has also been used to examine the regulation of transcription at other
levels. Histone density (D. Pokholok, unpublished data), chromatin modifications
(Kurdistani et al. 2002; Ng et al. 2002; Robyr et al. 2002; Wang et al. 2002; Ng et
al. 2003), and the promoters at which other components of the complete
transcription apparatus are acting ((Odom et aL. 2004), D. Pokholok, unpublished
data) have all been assayed using location analysis. Binding of transcription
factors directly to arrays, particularly arrays containing intergenic regions, allows
determination of every possible genomic sequence to which a particular factor
can bind. The derived sequence specificity of these factors based on these data
will also play a part in the construction of a complete network model, along with
additional high throughput data sources. The in vivo subcellular localization of
most yeast proteins (Huh et al. 2003), systematic analysis of synthetic lethality
between genes (Tong et al. 2004), and high-throughput analysis of protein
complexes using mass spectrometry (Krogan et al. 2004) all provide a wealth of
additional data towards the goal.
My contributions to this work
When I started my graduate studies, I was interested in doing both
experimental and computational work. At that time, microarray analysis of gene
expression was in full swing, opening exciting avenues to explore many aspects
of biology. The number of experiments using expression microarrays was
exploding, and the technique of genome-wide location analysis was being
34

developed for publication in Ren et al. 2000. Both of these experimental
approaches generate vast amounts of data, but in 1999 computational support
and analytical methods were in their infancy and still required development and
refinement. I joined the Young lab because their studies with microarrays
afforded me the opportunity to work both at the bench and on the computer.
My initial contribution to the lab came in the computational arena, when I
set up a public website for Itamar Simon's paper on the cell-cycle. This website
was among the first to make data from genome-wide studies publicly available
and searchable. Through this open approach, I set up a forum to not only share
our data, but also to address the need to standardize microarray data and the
analytical approaches in this burgeoning field.
My first summer, I started performing location analysis experiments with
the aim of elucidating networks of interactions between transcription factors. I
was interested in several fundamental metabolic systems; my first experiments
were performed with factors involved in glucose metabolism, Rgtl, Mthl and
Migl and I followed up by investigating factors from the nitrogen and phosphate
metabolic pathways. These experiments yielded a wealth of data which led me
to believe that the approach which would most benefit the yeast community
consisted of profiling as many factors as possible. I decided to work as a team
with several other investigators in the Young lab, synergizing our efforts to
perform hundreds of chips worth of location-analysis experiments.
I also focused on improving the analysis of the data we were acquiring.
This analysis occurred on two levels: basic analysis for each experiment to
35

determine which intergenic regions were bound by the profiled transcription
factor, and then meta-analyses to gain a deeper understanding of the overall
biology. The framework of the analysis for each experiment had been laid out in
Ren et al. (2001), based on an error model described for gene expression data in
Hughes TR et al. (2000). I expanded significantly on this model. I put in place a
series of templates for use by researchers for analyzing individual experiments,
making them as versatile and user-friendly as possible. In addition, I wrote
scripts to perform batch analyses for making comparisons between data sets, a
key step to integrate data from different experiments and expand comparative
analyses. I also took advantage of the large number of data sets that we had
generated to help with noise reduction (see discussion in chapter 2). Another of
my computational contributions consisted of a number of meta-analyses, which
ranged from determining various statistics about the data in general to
collaborating with Tony Lee to determine the definitions of the network motifs.
Based on these analyses, I developed computational tools such as a series of
scripts for finding network motifs. The results from the genome-wide location
analysis, interpreted using the tools I developed, was published (Lee, Rinaldi,
Robert et al. 2002), and is included in chapter 3.
I next extended our results, by addressing one of the weaknesses of our
approach. Looking at transcription under a single condition, in most cases the
rich medium Yeast extract - Peptone - Dextrose, affords a snapshot of the cell's
function. It does not, however, help to understand the most important role of the
cellular machinery in the life cycle of that cell: adapting to changes. Cells
36

constantly need to adjust the amount of metabolic enzymes based on the
available nutrients, to respond to cellular damage caused by external forces, and
to remove toxic elements from the cell. The work we published in Lee et al. did
not investigate cellular adaptation. We were able to find transcription factors
interacting with the promoters of only approximately 30% of the genome.
Additionally, although we did use expression data from conditions in which the
external environment was manipulated, without the matching binding data it was
difficult to assess which promoter-transcription factor interactions were leading to
productive regulation. We described regulatory network motifs based on the
binding data in rich media, but could not determine which of the motifs were
essential to transcription of the genes involved, as opposed to those that might
be used in another condition. To remedy this, location analysis under 12
additional conditions on a number of factors was performed. I focused mainly on
the experiments in hydrogen peroxide, and performed the data analysis for the
>400 experiments we had accumulated. These data and analyses were
published (Harbison et al. 2004) and are included in chapter 4.
In order to further improve the analysis of microarray data, I collaborated
with Ron Dror and Jon Murnick on a project that originated in the "Computational
Functional Genomics" course taught by Rick Young, David Gifford and Tommi
Jaakkola. We were concerned with the practice that was common at the time of
"flooring" Affymetrix intensity results to an arbitrary small number, and of
averaging repeated measurements without regard for their reliability. Instead, we
devised a noise model to incorporate both additive and multiplicative noise
37

introduced throughout the experiments, and used a Bayesian estimation method
to provide a principled way of dealing with negative results, combining repeated
measurements, and determining differentially expressed genes. This work was
published as Dror et al. 2003. 1 also took part in the development of the Genetic
RegulAtory Modules algorithm, performing the large scale analysis of location
data that was required, collecting and curating over 500 expression data sets
from publicly available sources, and participating in a series of discussions during
the development. This work was published (Bar-Joseph et al. 2003), and can be
found in Appendix A.
Through my research and reading I have come to understand many of the
nuances involved in the various steps necessary for thorough analysis of
genome-wide data. My experience with both bench work and computational
analysis has allowed me a well-rounded view of the field of genomics. I have
included, in Chapter 2 of this thesis, many of my findings and observations in this
arena.
38

References
Adams CC and Workman JL (1995). "Binding of disparate transcriptionalactivators to nucleosomal DNA is inherently cooperative." Mol Cell Biol 15(3):1405-21.
Agarwal AK, Rogers PD, Baerson SR, Jacob MR, Barker KS, Cleary JD, WalkerLA, Nagle DG and Clark AM (2003). "Genome-wide expression profiling of theresponse to polyene, pyrimidine, azole, and echinocandin antifungal agents inSaccharomyces cerevisiae." J Biol Chem 278(37): 34998-5015.
Allfrey VG, Faulkner R and Mirsky AE (1964). "Acetylation and Methylation ofHistones and Their Possible Role in the Regulation of Rna Synthesis." Proc NatlAcad Sci U S A 51: 786-94.
Angermayr M and Bandlow W (2003). "Permanent nucleosome exclusion fromthe Gal4p-inducible yeast GCY1 promoter." J Biol Chem 278(13): 11026-31.
Ansari AZ, Koh SS, Zaman Z, Bongards C, Lehming N, Young RA and PtashneM (2002). "Transcriptional activating regions target a cyclin-dependent kinase."Proc Natl Acad Sci U S A 99(23): 14706-9.
Axelrod JD, Reagan MS and Majors J (1993). "GAL4 disrupts a repressingnucleosome during activation of GAL1 transcription in vivo." Genes Dev 7(5):857-69.
Bannister AJ and Miska EA (2000). "Regulation of gene expression bytranscription factor acetylation." Cell Mol Life Sci 57(8-9): 1184-92.
Barberis A, Pearlberg J, Simkovich N, Farrell S, Reinagel P, Bamdad C, Sigal Gand Ptashne M (1995). "Contact with a component of the polymerase IIholoenzyme suffices for gene activation." Cell 81(3): 359-68.
Bar-Joseph Z, Gerber GK, Lee TI, Rinaldi NJ, et al. (2003). "Computationaldiscovery of gene modules and regulatory networks." Nat Biotechnol 21(11):1337-42.
Beck T and Hall MN (1999). "The TOR signalling pathway controls nuclearlocalization of nutrient-regulated transcription factors." Nature 402(6762): 689-92.
Bowtell DD (1999). "Options available--from start to finish--for obtainingexpression data by microarray." Nat Genet 21(1 Suppl): 25-32.
Brazma A, Jonassen I, Vilo J and Ukkonen E (1998). "Predicting gene regulatoryelements in silico on a genomic scale." Genome Res 8(11): 1202-15.
39

Breeden L and Mikesell GE (1991). "Cell cycle-specific expression of the SWI4transcription factor is required for the cell cycle regulation of HO transcription."Genes Dev 5(7): 1183-90.
Bulyk ML, Gentalen E, Lockhart DJ and Church GM (1999). "Quantifying DNA-protein interactions by double-stranded DNA arrays." Nat Biotechnol 17(6): 573-7.
Bulyk ML, Huang X, Choo Y and Church GM (2001). "Exploring the DNA-bindingspecificities of zinc fingers with DNA microarrays." Proc Natl Acad Sci U S A98(13): 7158-63.
Bushnell DA and Kornberg RD (2003). "Complete, 12-subunit RNA polymerase IIat 4.1-A resolution: implications for the initiation of transcription." Proc Natl AcadSci U S A 100(12): 6969-73.
Bushnell DA, Westover KD, Davis RE and Kornberg RD (2004). "Structural basisof transcription: an RNA polymerase II-TFIIB cocrystal at 4.5 Angstroms."Science 303(5660): 983-8.
Causton HC, Ren B, Koh SS, Harbison CT, et al. (2001). "Remodeling of yeastgenome expression in response to environmental changes." Mol Biol Cell 12(2):323-37.
Chatterjee S and Struhl K (1995). "Connecting a promoter-bound protein to TBPbypasses the need for a transcriptional activation domain." Nature 374(6525):820-2.
Chi Y, Huddleston MJ, Zhang X, Young RA, Annan RS, Carr SA and DeshaiesRJ (2001). "Negative regulation of Gcn4 and Msn2 transcription factors by Srb10cyclin-dependent kinase." Genes Dev 15(9): 1078-92.
Cho HS, Liu CW, Damberger FF, Pelton JG, Nelson HC and Wemmer DE(1996). "Yeast heat shock transcription factor N-terminal activation domains areunstructured as probed by heteronuclear NMR spectroscopy." Protein Sci 5(2):262-9.
Cho RJ, Campbell MJ, Winzeler EA, Steinmetz L, et al. (1998). "A genome-widetranscriptional analysis of the mitotic cell cycle." Mol Cell 2(1): 65-73.
Cirillo LA and Zaret KS (1999). "An early developmental transcription factorcomplex that is more stable on nucleosome core particles than on free DNA." MolCell 4(6): 961-9.
Cliften P, Sudarsanam P, Desikan A, Fulton L, Fulton B, Majors J, Waterston R,Cohen BA and Johnston M (2003). "Finding functional features inSaccharomyces genomes by phylogenetic footprinting." Science 301(5629): 71-6.
40

Cosma MP (2002). "Ordered recruitment: gene-specific mechanism oftranscription activation." Mol Cell 10(2): 227-36.
Cosma MP, Tanaka T and Nasmyth K (1999). "Ordered recruitment oftranscription and chromatin remodeling factors to a cell cycle- anddevelopmentally regulated promoter." Cell 97(3): 299-311.
Costanzo MC, Hogan JD, Cusick ME, Davis BP, et al. (2000). "The yeastproteome database (YPD) and Caenorhabditis elegans proteome database(WormPD): comprehensive resources for the organization and comparison ofmodel organism protein information." Nucleic Acids Res 28(1): 73-6.
Csank C, Costanzo MC, Hirschman J, Hodges P, et al. (2002). "Three yeastproteome databases: YPD, PombePD, and CalPD (MycoPathPD)." MethodsEnzymol 350: 347-73.
Darieva Z, Pic-Taylor A, Boros J, Spanos A, Geymonat M, Reece RJ, SedgwickSG, Sharrocks AD and Morgan BA (2003). "Cell cycle-regulated transcriptionthrough the FHA domain of Fkh2p and the coactivator Nddlp." Curr Biol 13(19):1740-5.
DeRisi JL, lyer VR and Brown PO (1997). "Exploring the metabolic and geneticcontrol of gene expression on a genomic scale." Science 278(5338): 680-6.
Dever TE, Feng L, Wek RC, Cigan AM, Donahue TF and Hinnebusch AG (1992)."Phosphorylation of initiation factor 2 alpha by protein kinase GCN2 mediatesgene-specific translational control of GCN4 in yeast." Cell 68(3): 585-96.
Donaldson L and Capone JP (1992). "Purification and characterization of thecarboxyl-terminal transactivation domain of Vmw65 from herpes simplex virustype 1." J Biol Chem 267(3): 1411-4.
Ellenberger TE, Brandl CJ, Struhl K and Harrison SC (1992). "The GCN4 basicregion leucine zipper binds DNA as a dimer of uninterrupted alpha helices:crystal structure of the protein-DNA complex." Cell 71(7): 1223-37.
Emili A and Ingles CJ (1995). "Promoter-dependent photocross-linking of theacidic transcriptional activator E2F-1 to the TATA-binding protein." J Biol Chem270(23): 13674-80.
Farrell S, Simkovich N, Wu Y, Barberis A and Ptashne M (1996). "Geneactivation by recruitment of the RNA polymerase II holoenzyme." Genes Dev10(18): 2359-67.
Feaver WJ, Gileadi O, Li Y and Kornberg RD (1991). "CTD kinase associatedwith yeast RNA polymerase II initiation factor b." Cell 67(6): 1223-30.
41

Foster R, Mikesell GE and Breeden L (1993). "Multiple SW16-dependent cis-acting elements control SW14 transcription through the cell cycle." Mol Cell Biol13(6): 3792-801.
Furst P and Hamer D (1989). "Cooperative activation of a eukaryotic transcriptionfactor: interaction between Cu(l) and yeast ACE1 protein." Proc Natl Acad Sci US A 86(14): 5267-71.
Gasch AP, Spellman PT, Kao CM, Carmel-Harel O0 Eisen MB, Storz G, BotsteinD and Brown PO (2000). "Genomic expression programs in the response ofyeast cells to environmental changes." Mol Biol Cell 11(12): 4241-57.
Ge H, Zhao Y, Chait BT and Roeder RG (1994). "Phosphorylation negativelyregulates the function of coactivator PC4." Proc Natl Acad Sci U S A 91(26):12691-5.
Goffeau A, Barrell BG, Bussey H, Davis RW, et al. (1996). "Life with 6000genes." Science 274(5287): 546, 563-7.
Gonzalez-Couto E, Klages N and Strubin M (1997). "Synergistic and promoter-selective activation of transcription by recruitment of transcription factors TFIIDand TFIIB." Proc Natl Acad Sci U S A 94(15): 8036-41.
Goodrich JA and Tjian R (1994). "Transcription factors IIE and IIH and ATPhydrolysis direct promoter clearance by RNA polymerase II." Cell 77(1): 145-56.
Hahn S (2004). "Structure and mechanism of the RNA polymerase II transcriptionmachinery." Nat Struct Mol Biol 11(5): 394-403.
Harbison CT, Gordon DB, Lee TI, Rinaldi NJ, et al. (2004). "Transcriptionalregulatory code of a eukaryotic genome." Nature 431(7004): 99-104.
Harrison CJ, Bohm AA and Nelson HC (1994). "Crystal structure of the DNAbinding domain of the heat shock transcription factor." Science 263(5144): 224-7.
Heredia J, Crooks M and Zhu Z (2001). "Phosphorylation and Cu+ coordination-dependent DNA binding of the transcription factor Macl p in the regulation ofcopper transport." J Biol Chem 276(12): 8793-7.
Hinnebusch AG (1984). "Evidence for translational regulation of the activator ofgeneral amino acid control in yeast." Proc Natl Acad Sci U S A 81(20): 6442-6.
Hinnebusch AG (1994). "Translational control of GCN4: an in vivo barometer ofinitiation-factor activity." Trends Biochem Sci 19(10): 409-14.
Hirst M, Kobor MS, Kuriakose N, Greenblatt J and Sadowski I (1999). "GAL4 isregulated by the RNA polymerase II holoenzyme-associated cyclin-dependentprotein kinase SRB10/CDK8." Mol Cell 3(5): 673-8.
42
YIUIIYI-�P· · ·�W·--·ll· L·- ·--_-- _1·�·_-·.··(I·· I····_·L

Holloway AJ, van Laar RK, Tothill RW and Bowtell DD (2002). "Optionsavailable--from start to finish--for obtaining data from DNA microarrays II." NatGenet 32 Suppl: 481-9.
Holstege FC, Jennings EG, Wyrick JJ, Lee TI, Hengartner CJ, Green MR, GolubTR, Lander ES and Young RA (1998). "Dissecting the regulatory circuitry of aeukaryotic genome." Cell 95(5): 717-28.
Horak CE, Luscombe NM, Qian J, Bertone P, Piccirrillo S, Gerstein M andSnyder M (2002). "Complex transcriptional circuitry at the G1/S transition inSaccharomyces cerevisiae." Genes Dev 16(23): 3017-33.
Huang M, Zhou Z and Elledge SJ (1998). "The DNA replication and damagecheckpoint pathways induce transcription by inhibition of the Crtl repressor." Cell94(5): 595-605.
Hughes JD, Estep PW, Tavazoie S and Church GM (2000a). "Computationalidentification of cis-regulatory elements associated with groups of functionallyrelated genes in Saccharomyces cerevisiae." J Mol Biol 296(5): 1205-14.
Hughes TR, Marton MJ, Jones AR, Roberts CJ, et al. (2000b). "Functionaldiscovery via a compendium of expression profiles." Cell 102(1): 109-26.
Huh WK, Falvo JV, Gerke LC, Carroll AS, Howson RW, Weissman JS andO'Shea EK (2003). "Global analysis of protein localization in budding yeast."Nature 425(6959): 686-91.
Imbalzano AN, Kwon H, Green MR and Kingston RE (1994). "Facilitated bindingof TATA-binding protein to nucleosomal DNA." Nature 370(6489): 481-5.
lyer V and Struhl K (1995). "Poly(dA:dT), a ubiquitous promoter element thatstimulates transcription via its intrinsic DNA structure." Embo J 14(11): 2570-9.
lyer VR, Horak CE, Scafe CS, Botstein D, Snyder M and Brown PO (2001)."Genomic binding sites of the yeast cell-cycle transcription factors SBF andMBF." Nature 409(6819): 533-8.
Jacob F and Monod J (1961). "Genetic regulatory mechanisms in the synthesisof proteins." J Mol Biol 3: 318-56.
Jaskelioff M, Gavin IM, Peterson CL and Logie C (2000). "SWI-SNF-mediatednucleosome remodeling: role of histone octamer mobility in the persistence of theremodeled state." Mol Cell Biol 20(9): 3058-68.
Joliot V, Demma M and Prywes R (1995). "Interaction with RAP74 subunit ofTFIIF is required for transcriptional activation by serum response factor." Nature373(6515): 632-5.
43
-rYr·-··· · · ·--- ·�-�U-.�----·---lrl·�-rultry·-rrr* �y��WUIILIW·P-�li-··WI

Kelleher RJ, 3rd, Flanagan PM and Kornberg RD (1990). "A novel mediatorbetween activator proteins and the RNA polymerase II transcription apparatus."Cell 61(7): 1209-15.
Kellis M, Patterson N, Endrizzi M, Birren B and Lander ES (2003). "Sequencingand comparison of yeast species to identify genes and regulatory elements."Nature 423(6937): 241-54.
Kim JH, Polish J and Johnston M (2003). "Specificity and regulation of DNAbinding by the yeast glucose transporter gene repressor Rgtl." Mol Cell Biol23(15): 5208-16.
Kim YJ, Bjorklund S, Li Y, Sayre MH and Kornberg RD (1994). "A multiproteinmediator of transcriptional activation and its interaction with the C-terminal repeatdomain of RNA polymerase II." Cell 77(4): 599-608.
Klages N and Strubin M (1995). "Stimulation of RNA polymerase II transcriptioninitiation by recruitment of TBP in vivo." Nature 374(6525): 822-3.
Knop M, Siegers K, Pereira G, Zachariae W, Winsor B, Nasmyth K and SchiebelE (1999). "Epitope tagging of yeast genes using a PCR-based strategy: moretags and improved practical routines." Yeast 15(10B): 963-72.
Kobayashi N, Boyer TG and Berk AJ (1995). "A class of activation domainsinteracts directly with TFIIA and stimulates TFIIA-TFIID-promoter complexassembly." Mol Cell Biol 15(11): 6465-73.
Koleske AJ and Young RA (1994). "An RNA polymerase II holoenzymeresponsive to activators." Nature 368(6470): 466-9.
Komeili A and O'Shea EK (1999). "Roles of phosphorylation sites in regulatingactivity of the transcription factor Pho4." Science 284(5416): 977-80.
Kornberg RD (1998). "Mechanism and regulation of yeast RNA polymerase IItranscription." Cold Spring Harb Symp Quant Biol 63: 229-32.
Krogan NJ, Peng WT, Cagney G, Robinson MD, et al. (2004). "High-definitionmacromolecular composition of yeast RNA-processing complexes." Mol Cell13(2): 225-39.
Kurdistani SK, Robyr D, Tavazoie S and Grunstein M (2002). "Genome-widebinding map of the histone deacetylase Rpd3 in yeast." Nat Genet 31(3): 248-54.
Lawrence CE and Reilly AA (1990). "An expectation maximization (EM) algorithmfor the identification and characterization of common sites in unalignedbiopolymer sequences." Proteins 7(1): 41-51.
44
.- "LLYLL-LY---- _�_ �-r�i�u-r-ui-ru��u���-·r�·*iuw·rr·l·-r�i ·-- ·. ��-·u-

Lee M and Struhl K (1995). "Mutations on the DNA-binding surface of TATA-binding protein can specifically impair the response to acidic activators in vivo."Mol Cell Biol 15(10): 5461-9.
Lee TI, Rinaldi NJ, Robert F, Odom DT, et al. (2002). "Transcriptional regulatorynetworks in Saccharomyces cerevisiae." Science 298(5594): 799-804.
Leuther KK and Johnston SA (1992). "Nondissociation of GAL4 and GAL80 invivo after galactose induction." Science 256(5061): 1333-5.
Li Q and Johnston SA (2001). "Are all DNA binding and transcription regulationby an activator physiologically relevant?" Mol Cell Biol 21(7): 2467-74.
Lieb JD, Liu X, Botstein D and Brown PO (2001). "Promoter-specific binding ofRap1 revealed by genome-wide maps of protein-DNA association." Nat Genet28(4): 327-34.
Lin Y, Nomura T, Cheong J, Dorjsuren D, lida K and Murakami S (1997)."Hepatitis B virus X protein is a transcriptional modulator that communicates withtranscription factor IIB and the RNA polymerase II subunit 5." J Biol Chem272(11): 7132-9.
Lin YS, Ha I, Maldonado E, Reinberg D and Green MR (1991). "Binding ofgeneral transcription factor TFIIB to an acidic activating region." Nature353(6344): 569-71.
Lipshutz RJ, Morris D, Chee M, Hubbell E, Kozal MJ, Shah N, Shen N, Yang Rand Fodor SP (1995). "Using oligonucleotide probe arrays to access geneticdiversity." Biotechniques 19(3): 442-7.
Liu C, Yang Z, Yang J, Xia Z and Ao S (2000). "Regulation of the yeasttranscriptional factor PHO2 activity by phosphorylation." J Biol Chem 275(41):31972-8.
Liu X, Brutlag DL and Liu JS (2001). "BioProspector: discovering conserved DNAmotifs in upstream regulatory regions of co-expressed genes." Pac SympBiocomput: 127-38.
Liu XS, Brutlag DL and Liu JS (2002). "An algorithm for finding protein-DNAbinding sites with applications to chromatin-immunoprecipitation microarrayexperiments." Nat Biotechnol 20(8): 835-9.
Lommel L, Gregory SM, Becker KI and Sweder KS (2000). "Transcription-coupled DNA repair in yeast transcription factor IIE (TFIIE) mutants." NucleicAcids Res 28(3): 835-42.
45

Lorch Y, Cairns BR, Zhang M and Kornberg RD (1998). "Activated RSC-nucleosome complex and persistently altered form of the nucleosome." Cell94(1): 29-34.
Maniatis T, Ptashne M, Backman K, Kield D, Flashman S, Jeffrey A and MaurerR (1975). "Recognition sequences of repressor and polymerase in the operatorsof bacteriophage lambda." Cell 5(2): 109-13.
Marmorstein R, Carey M, Ptashne M and Harrison SC (1992). "DNA recognitionby GAL4: structure of a protein-DNA complex." Nature 356(6368): 408-14.
Martinez E (2002). "Multi-protein complexes in eukaryotic gene transcription."Plant Mol Biol 50(6): 925-47.
Mclnerny CJ, Partridge JF, Mikesell GE, Creemer DP and Breeden LL (1997). "Anovel Mcml-dependent element in the SWI4, CLN3, CDC6, and CDC47promoters activates M/G 1-specific transcription." Genes Dev 11(10): 1277-88.
Meersseman G, Pennings S and Bradbury EM (1992). "Mobile nucleosomes--ageneral behavior." Embo J 11(8): 2951-9.
Moll T, Tebb G, Surana U, Robitsch H and Nasmyth K (1991). "The role ofphosphorylation and the CDC28 protein kinase in cell cycle-regulated nuclearimport of the S. cerevisiae transcription factor SWI5." Cell 66(4): 743-58.
Morse RH (2003). "Getting into chromatin: how do transcription factors get pastthe histones?" Biochem Cell Biol 81(3): 101-12.
Mosley AL, Lakshmanan J, Aryal BK and Ozcan S (2003). "Glucose-mediatedphosphorylation converts the transcription factor Rgt1 from a repressor to anactivator." J Biol Chem 278(12): 10322-7.
Mukherjee S, Berger MF, Jona G, Wang XS, Muzzey D, Snyder M, Young RAand Bulyk ML (2004). "Rapid analysis of the DNA binding specificities oftranscription factors with DNA microarrays." Nat Genet.
Narlikar GJ, Fan HY and Kingston RE (2002). "Cooperation between complexesthat regulate chromatin structure and transcription." Cell 108(4): 475-87.
Nasmyth K, Adolf G, Lydall D and Seddon A (1990). "The identification of asecond cell cycle control on the HO promoter in yeast: cell cycle regulation ofSW15 nuclear entry." Cell 62(4): 631-47.
Natarajan K, Meyer MR, Jackson BM, Slade D, Roberts C, Hinnebusch AG andMarton MJ (2001). "Transcriptional profiling shows that Gcn4p is a masterregulator of gene expression during amino acid starvation in yeast." Mol Cell Biol21(13): 4347-68.
46
-·YIL·�-U·-�-·I·� ---· ·�. ---IU--CI-·--I·--U··--·····L·ULUliUI· DiY·�··YYII--- -·Y*nl�Y-·--C-�YOI-·Ir--. L-Y--l· ···I·· ·I·LI · ·IUIY�·iU·LLL·YIS.Li�··1ILI·Y·Y·l)··i-· -····�NLMl�iy

Neely KE, Hassan AH, Brown CE, Howe L and Workman JL (2002)."Transcription activator interactions with multiple SWI/SNF subunits." Mol CellBiol 22(6): 1615-25.
Neely KE, Hassan AH, Wallberg AE, Steger DJ, Cairns BR, Wright AP andWorkman JL (1999). "Activation domain-mediated targeting of the SWI/SNFcomplex to promoters stimulates transcription from nucleosome arrays." Mol Cell4(4): 649-55.
Neely KE and Workman JL (2002). "Histone acetylation and chromatinremodeling: which comes first?" Mol Genet Metab 76(1): 1-5.
Nehlin JO, Carlberg M and Ronne H (1991). "Control of yeast GAL genes byMIG1 repressor: a transcriptional cascade in the glucose response." Embo J10(11): 3373-7.
Nelson C, Goto S, Lund K, Hung W and Sadowski I (2003). "Srbl 0/Cdk8regulates yeast filamentous growth by phosphorylating the transcription factorSte12." Nature 421(6919): 187-90.
Ng HH, Robert F, Young RA and Struhl K (2002). "Genome-wide location andregulated recruitment of the RSC nucleosome-remodeling complex." Genes Dev16(7): 806-19.
Ng HH, Robert F, Young RA and Struhl K (2003). "Targeted recruitment of Set1histone methylase by elongating Pol II provides a localized mark and memory ofrecent transcriptional activity." Mol Cell 11(3): 709-19.
O'Conallain C, Doolin MT, Taggart C, Thornton F and Butler G (1999)."Regulated nuclear localisation of the yeast transcription factor Ace2p controlsexpression of chitinase (CTS1) in Saccharomyces cerevisiae." Mol Gen Genet262(2): 275-82.
Odom DT, Zizlsperger N, Gordon DB, Bell GW, et al. (2004). "Control ofpancreas and liver gene expression by HNF transcription factors." Science303(5662): 1378-81.
Ogawa N, DeRisi J and Brown PO (2000). "New components of a system forphosphate accumulation and polyphosphate metabolism in Saccharomycescerevisiae revealed by genomic expression analysis." Mol Biol Cell 11(12): 4309-21.
Pascual-Ahuir A, Posas F, Serrano R and Proft M (2001). "Multiple levels ofcontrol regulate the yeast cAMP-response element-binding protein repressorSkolp in response to stress." J Biol Chem 276(40): 37373-8.
47
u·YLU-LIIY·YIR·-- ��-·L-LY ·L··Y·n*lliY·LLLIIUYYU··�·urr�u _·ul�-;.u�.�--uruu�ruuuulu�l·u�u�iUJDLyu .��uu·u·--�r;rr.u,.�

Pease AC, Solas D, Sullivan EJ, Cronin MT, Holmes CP and Fodor SP (1994)."Light-generated oligonucleotide arrays for rapid DNA sequence analysis." ProcNatl Acad Sci U S A 91(11): 5022-6.
Pelham HR (1982). "A regulatory upstream promoter element in the Drosophilahsp 70 heat-shock gene." Cell 30(2): 517-28.
Polach KJ and Widom J (1995). "Mechanism of protein access to specific DNAsequences in chromatin: a dynamic equilibrium model for gene regulation." J MolBiol 254(2): 130-49.
Polach KJ and Widom J (1996). "A model for the cooperative binding ofeukaryotic regulatory proteins to nucleosomal target sites." J Mol Biol 258(5):800-12.
Pramila T, Miles S, GuhaThakurta D, Jemiolo D and Breeden LL (2002)."Conserved homeodomain proteins interact with MADS box protein Mcml torestrict ECB-dependent transcription to the M/G1 phase of the cell cycle." GenesDev 16(23): 3034-45.
Pribnow D (1975). "Bacteriophage T7 early promoters: nucleotide sequences oftwo RNA polymerase binding sites." J Mol Biol 99(3): 419-43.
Ptashne M (1988). "How eukaryotic transcriptional activators work." Nature335(6192): 683-9.
Ptashne M and Gann A (1997). "Transcriptional activation by recruitment."Nature 386(6625): 569-77.
Reece RJ and Platt A (1997). "Signaling activation and repression of RNApolymerase II transcription in yeast." Bioessays 19(11): 1001 -1 0.
Reinke H, Gregory PD and Horz W (2001). "A transient histone hyperacetylationsignal marks nucleosomes for remodeling at the PHO8 promoter in vivo." MolCell 7(3): 529-38.
Reinke H and Horz W (2003). "Histones are first hyperacetylated and then losecontact with the activated PHO5 promoter." Mol Cell 11(6): 1599-607.
Ren B, Robert F, Wyrick JJ, Aparicio O, et al. (2000). "Genome-wide location andfunction of DNA binding proteins." Science 290(5500): 2306-9.
Robyr D, Suka Y, Xenarios I, Kurdistani SK, Wang A, Suka N and Grunstein M(2002). "Microarray deacetylation maps determine genome-wide functions foryeast histone deacetylases." Cell 109(4): 437-46.
48
I -��·�uL�-··c�iwL·liuruurr��h�r�:�-;�;u�L u-sl·ruh--·i;i�n)··lUiYI·l�·UlrU+Yil··J�

A...... - - . .
Roeder RG (2003). "Lasker Basic Medical Research Award. The eukaryotictranscriptional machinery: complexities and mechanisms unforeseen." Nat Med9(10): 1239-44.
Roth FP, Hughes JD, Estep PW and Church GM (1998). "Finding DNA regulatorymotifs within unaligned noncoding sequences clustered by whole-genome mRNAquantitation." Nat Biotechnol 16(10): 939-45.
Ryan MP, Stafford GA, Yu L and Morse RH (2000). "Artificially recruited TATA-binding protein fails to remodel chromatin'and does not activate three promotersthat require chromatin remodeling." Mol Cell Biol 20(16): 5847-57.
Sadowski I, Costa C and Dhanawansa R (1996). "Phosphorylation of Gal4p at asingle C-terminal residue is necessary for galactose-inducible transcription." MolCell Biol 16(9): 4879-87.
Sakurai H and Fukasawa T (1998). "Functional correlation among Gall 1,transcription factor (TF) IIE, and TFIIH in Saccharomyces cerevisiae. Gall 1 andTFIIE cooperatively enhance TFIIH-mediated phosphorylation of RNApolymerase II carboxyl-terminal domain sequences." J Biol Chem 273(16): 9534-8.
Sakurai H and Fukasawa T (2000). "Functional connections between mediatorcomponents and general transcription factors of Saccharomyces cerevisiae." JBiol Chem 275(47): 37251-6.
Sayre MH, Tschochner H and Kornberg RD (1992). "Reconstitution oftranscription with five purified initiation factors and RNA polymerase II fromSaccharomyces cerevisiae." J Biol Chem 267(32): 23376-82.
Schena M, Shalon D, Davis RW and Brown PO (1995). "Quantitative monitoringof gene expression patterns with a complementary DNA microarray." Science270(5235): 467-70.
Schmitz ML, dos Santos Silva MA, Altmann H, Czisch M, Holak TA and BaeuerlePA (1994). "Structural and functional analysis of the NF-kappa B p65 C terminus.An acidic and modular transactivation domain with the potential to adopt analpha-helical conformation." J Biol Chem 269(41): 25613-20.
Schnitzler GR, Cheung CL, Hafner JH, Saurin AJ, Kingston RE and Lieber CM(2001). "Direct imaging of human SWI/SNF-remodeled mono- andpolynucleosomes by atomic force microscopy employing carbon nanotube tips."Mol Cell Biol 21(24): 8504-11.
Schuller C, Mamnun YM, Mollapour M, Krapf G, Schuster M, Bauer BE, PiperPW and Kuchler K (2004). "Global phenotypic analysis and transcriptionalprofiling defines the weak acid stress response regulon in Saccharomycescerevisiae." Mol Biol Cell 15(2): 706-20.
49

Shalon D, Smith SJ and Brown PO (1996). "A DNA microarray system foranalyzing complex DNA samples using two-color fluorescent probehybridization." Genome Res 6(7): 639-45.
Sharrocks AD (2000). "Introduction: the regulation of eukaryotic transcriptionfactor function." Cell Mol Life Sci 57(8-9): 1147-8.
Simon I, Barnett J, Hannett N, Harbison CT, et al. (001). "Serial regulation oftranscriptional regulators in the yeast cell cycle." Cell 106(6): 697-708.
Spellman PT, Sherlock G, Zhang MQ, lyer VR, Anders K, Eisen MB, Brown PO,Botstein D and Futcher B (1998). "Comprehensive identification of cell cycle-regulated genes of the yeast Saccharomyces cerevisiae by microarrayhybridization." Mol Biol Cell 9(12): 3273-97.
Stargell LA and Struhl K (1995). "The TBP-TFIIA interaction in the response toacidic activators in vivo." Science 269(5220): 75-8.
Stormo GD (2000). "DNA binding sites: representation and discovery."Bioinformatics 16(1): 16-23.
Stringer KF, Ingles CJ and Greenblatt J (1990). "Direct and selective binding ofan acidic transcriptional activation domain to the TATA-box factor TFIID." Nature345(6278): 783-6.
Struhl K (1995). "Yeast transcriptional regulatory mechanisms." Annu Rev Genet29: 651-74.
Sudarsanam P, lyer VR, Brown PO and Winston F (2000). "Whole-genomeexpression analysis of snf/swi mutants of Saccharomyces cerevisiae." Proc NatlAcad Sci U S A 97(7): 3364-9.
Suzuki-Fujimoto T, Fukuma M, Yano KI, Sakurai H, Vonika A, Johnston SA andFukasawa T (1996). "Analysis of the galactose signal transduction pathway inSaccharomyces cerevisiae: interaction between Gal3p and Gal80p." Mol Cell Biol16(5): 2504-8.
Svaren J and Horz W (1997). "Transcription factors vs nucleosomes: regulationof the PHO5 promoter in yeast." Trends Biochem Sci 22(3): 93-7.
Svaren J, Schmitz J and Horz W (1994). "The transactivation domain of Pho4 isrequired for nucleosome disruption at the PHO5 promoter." Embo J 13(20):4856-62.
Sze JY, Woontner M, Jaehning JA and Kohlhaw GB (1992). "In vitrotranscriptional activation by a metabolic intermediate: activation by Leu3 dependson alpha-isopropylmalate." Science 258(5085): 1143-5.
50
. .. .. . .I~i · C(i-i-·YI·ILC·4le·~Li 1-·--~-·~·1l~l~;·- ·~·__·-iCI· -_ Y;;·i_/_Y Y1U ... .· L .yii~~- · ~ij~·Y-·liL-~

Tansey WP (2001). "Transcriptional activation: risky business." Genes Dev 15(9):1045-50.
Tjian R and Maniatis T (1994). "Transcriptional activation: a complex puzzle withfew easy pieces." Cell 77(1): 5-8.
Tong AH, Lesage G, Bader GD, Ding H, et al. (2004). "Global mapping of theyeast genetic interaction network." Science 303(5659): 808-13.
Topalidou I and Thireos G (2003). "Gcn4 occupancy of open reading frameregions results in the recruitment of chromatin-modifying complexes but not themediator complex." EMBO Rep 4(9): 872-6.
van Helden J, Andre B and Collado-Vides J (1998). "Extracting regulatory sitesfrom the upstream region of yeast genes by computational analysis ofoligonucleotide frequencies." J Mol Biol 281(5): 827-42.
Van Hoy M, Leuther KK, Kodadek T and Johnston SA (1993). "The acidicactivation domains of the GCN4 and GAL4 proteins are not alpha helical but formbeta sheets." Cell 72(4): 587-94.
Vashee S and Kodadek T (1995). "The activation domain of GAL4 proteinmediates cooperative promoter binding with general transcription factors in vivo."Proc Natl Acad Sci U S A 92(23): 10683-7.
Venter U, Svaren J, Schmitz J, Schmid A and Horz W (1994). "A nucleosomeprecludes binding of the transcription factor Pho4 in vivo to a critical target site inthe PHO5 promoter." Embo J 13(20): 4848-55.
Vilela C, Linz B, Rodrigues-Pousada C and McCarthy JE (1998). "The yeasttranscription factor genes YAP1 and YAP2 are subject to differential control atthe levels of both translation and mRNA stability." Nucleic Acids Res 26(5): 1150-9.
Vincent O, Kuchin S, Hong SP, Townley R, Vyas VK and Carlson M (2001)."Interaction of the Srb10 kinase with Sip4, a transcriptional activator ofgluconeogenic genes in Saccharomyces cerevisiae." Mol Cell Biol 21(17): 5790-6.
Wang A, Kurdistani SK and Grunstein M (2002). "Requirement of Hos2 histonedeacetylase for gene activity in yeast." Science 298(5597): 1412-4.
Whitehouse I, Flaus A, Cairns BR, White MF, Workman JL and Owen-Hughes T(1999). "Nucleosome mobilization catalysed by the yeast SWI/SNF complex."Nature 400(6746): 784-7.
Workman JL and Buchman AR (1993). "Multiple functions of nucleosomes andregulatory factors in transcription." Trends Biochem Sci 18(3): 90-5.
51
_"l-~~l· -r 1·~~i ·L~1Lu l*Y~rWL ··j ··:·jr·LYUSL·--jYLn·

Workman JL and Kingston RE (1992). "Nucleosome core displacement in vitrovia a metastable transcription factor-nucleosome complex." Science 258(5089):1780-4.
Workman JL and Roeder RG (1987). "Binding of transcription factor TFIID to themajor late promoter during in vitro nucleosome assembly potentiates subsequentinitiation by RNA polymerase II." Cell 51(4): 613-22.
Wu WH and Hampsey M (1999). "An activation-specific role for transcriptionfactor TFIIB in vivo." Proc Natl Acad Sci U S A 96(6): 2764-9.
Wu Y, Reece RJ and Ptashne M (1996). "Quantitation of putative activator-targetaffinities predicts transcriptional activating potentials." Embo J 15(15): 3951-63.
Xiao H, Pearson A, Coulombe B, Truant R, et al. (1994). "Binding of basaltranscription factor TFIIH to the acidic activation domains of VP16 and p53." MolCell Biol 14(10): 7013-24.
Yudkovsky N, Ranish JA and Hahn S (2000). "A transcription reinitiationintermediate that is stabilized by activator." Nature 408(6809): 225-9.
Zawel L, Kumar KP and Reinberg D (1995). "Recycling of the generaltranscription factors during RNA polymerase II transcription." Genes Dev 9(12):1479-90.
Zeitlinger J, Simon I, Harbison CT, Hannett NM, Volkert TL, Fink GR and YoungRA (2003). "Program-specific distribution of a transcription factor dependent onpartner transcription factor and MAPK signaling." Cell 113(3): 395-404.
Zhang L and Guarente L (1994). "HAP1 is nuclear but is bound to a cellularfactor in the absence of heme." J Biol Chem 269(20): 14643-7.
Zhang L and Guarente L (1995). "Heme binds to a short sequence that serves aregulatory function in diverse proteins." Embo J 14(2): 313-20.
Zhang L, Hach A and Wang C (1998). "Molecular mechanism governing hemesignaling in yeast: a higher-order complex mediates heme regulation of thetranscriptional activator HAP1." Mol Cell Biol 18(7): 3819-28.
Ziegler LM, Khaperskyy DA, Ammerman ML and Ponticelli AS (2003). "YeastRNA polymerase II lacking the Rpb9 subunit is impaired for interaction withtranscription factor IIF." J Biol Chem 278(49): 48950-6.
52
uyi-L··iu.r�:rUu�·lr;·�·�i�YrYl�yY�i(;UI j(;YL�·I�`�YL�LYIILI�LL·iYil�Lilr-Li�·�j

Chapter 2
Microarray Data Analysis for Biological Insight
53
I· I··-.-..·.LYU� i-ii�;i�LL;�·Ub�··W�bTli;�·L·I�I�UL---- i-··---L .��-i���L;;_�·ll:�^l·IC���·l.i · I-�YIL·I--·N IWii_··L�·���··�j�iiIU�·U··YIY·Lj····IYI �-.·l·-YI-:--- ·I-·I- --L·1Y·�·L--·-li�;;jiilUIII)··�iYJ�··YIW

Overview
The link between the projects I have undertaken while a member of the
Young Lab is analysis of the enormous amount of microarray data we have
generated. Both expression and location experiments are complicated by a
multitude of factors, not the least of which are the scale of the data and
inconsistencies in experimental performance. The analysis process needs to
account for all of these issues. There are two levels at which analysis occurs:
technically, in manipulating the data to remove bias based on those experimental
inconsistencies and determining which genes are expressed or enriched, and
biologically, in assessing the implications of these results.
In the technical phase of the analysis, normalization is used to
mathematically remove many of the sources of noise present in the data. I will
discuss the methods available for normalization and the optimal choices for
removing bias. The second technical issue is assessing the quality of the data. I
will discuss some current suggestions for metrics for spot quality, as well as
offering an initial statistic for determining the overall array quality. One other key
technical question is which method to use to determine differentially expressed or
enriched genes. I will describe many of the algorithms available for this purpose,
as well as adjustments that I made to the Rosetta error model to account for
some chromatin immunoprecipitation specific issues.
The second level of analysis is in interpreting the data for biological
understanding. One of the common approaches to this is to assess the
significance of the overlap between one expression or location dataset and
54
-1-··- .I·CYL· _-··/iali · ~L -I · · L P ~ · i~- L U)· C~i ;1o ·se vhni -UYIY··iF~~·~~·~

annotations, categories, or other datasets. I will describe some of the techniques
for performing these comparisons, as well as a novel method I developed.
Another area in which I have made contributions is in determining which
regulators and genes are involved in minimal regulatory motifs. Finally, I will
cover various approaches to visualizing these microarray data and analyses to
improve our ability to make biological discoveries.
Introduction
Just as the 1980's heralded the coming of age of molecular biology, with
cloning, sequencing and mutagenizing genes becoming commonplace, the
1990's saw the beginning of the genomic revolution. Coming on the heels of the
first complete sequences of bacterial (Fleischmann et al. 1995) and eukaryotic
genomes (Goffeau et al. 1996), microarray technology enabled researchers for
the first time to examine the expression of every gene in a population of cells.
This meant that for the first time scientists were able to see the full spectrum of
changes occurring during normal cell growth and division (Cho et al. 1998; Chu
et al. 1998; Spellman et al. 1998), brought on by alteration of a cell's environment
(DeRisi et al. 1997; Gasch et al. 2000; Causton et al. 2001), or caused by
perturbation of the normal genetic complement (Hughes et al. 2000). These
microarray data were used both to assign tentative functions to previously
unannotated genes, as well as defining cohorts of similarly expressed genes
defining each of the cellular responses.
55
�Lilacs+r;uln�urir�;ii;i�'�LI�L;�·iuUIW -- ---- so�··-·I�'La�+EYYI·i·O·LY�·�Urr��i.. �.I.,,,... ____
In a typical expression experiment, cDNA is reverse transcribed from
messenger RNA in the cell type of interest, labeled with a fluorophore and
hybridized to an appropriate microarray. Data are collected, analyzed, and the
differentially expressed genes discovered and investigated for biological
relevance. Another technology being widely used is location analysis. In these
experiments, proteins and DNA are crosslinked and an immunoprecipitation is
performed using an antibody to the transcription factor of interest.
Immunoprecipitated DNA is labeled with a fluorophore, then hybridized. Data
collection and analysis are performed similarly to an expression experiment.
Despite the seeming simplicity of these processes, each stage of the experiment
requires that a series of non-trivial choices be made that can drastically affect the
outcome. These options involve everything from the type of microarray to use to
which labeling method to employ. Once the experiment has been physically
completed and the raw data are in hand, a new series of decisions about each
step of the analysis process begins.
Removal of noise and systematic bias from the data through normalization
is the first component of the analysis. This should be followed by assessment of
the quality of the data, both for individual spots and for whole arrays. At this
point, a statistical model can be used to determine which spots in the test
sample(s) are different from the control. Then, the biological analysis begins.
Comparisons are made with other expression data, with annotations, and with
additional genome-wide data such as protein-protein interactions or subcellular
localization data. Various visualization tools are used for reducing the data to a
56

space where intuition becomes more feasible. Finally, biological conclusions can
be drawn.
Normalization
In order to use data from microarrays effectively, it is important to be able
to compare between samples at many levels. First, in two-color arrays, one must
be able to make reliable comparisons between the control and the test channel.
Unequal amounts of RNA as starting material could cause biases, as could the
preferential incorporation of one fluorophore over the other, as well as differential
response of the fluorophores to the laser. At a higher level, comparison across
arrays is almost more important, allowing meta-analysis such as how the
expression of a gene changes throughout a timecourse (Cho et al. 1998;
Spellman et al. 1998; Cho et al. 2001), or construction of a regulatory network
(Ideker et al. 2001; Tegner et a/. 2003). Finally, the ability to compare results
across different studies could allow for discovery of inter-relations between
pathways and modules that are not assessed in single experimental series.
While it was recognized in the early microarray experiments that some
degree of consistency was necessary between channels or arrays in order to
make valid comparisons, the approaches used were highly subjective, if they
were even discussed. In the first reports of genome-wide expression analysis
experiments, normalization was performed at the scanning stage, by adjusting
the scan power to obtain a ratio as close to 1.0 as possible in spots containing
total genomic DNA (DeRisi et al. 1997). In another study, normalization was
57

mentioned as using spiked-in controls, but no specifics were given (Holstege et
al. 1998). Others did not report any normalization step in the data processing at
all (Cho et al. 1998; Spellman et al. 1998).
Subsequently, biologists have begun to understand the importance of both
using and reporting statistical methods for analysis. The most straightforward
method for normalization involves computing a single constant by which to
multiply one channel on an array in order to account for gross differences.
Various approaches to this achieve the same ends: normalizing so that total,
mean or median intensity in the two channels or across chips are the same, or
using the same operation on a subset of spots, such as control spots. While
these methods have been widely used (Richmond et al. 1999; Ren et al. 2000;
Natarajan et al. 2001; Newton et al. 2001; Dasgupta et al. 2002; Lee et al. 2002b;
Moqtaderi and Struhl 2004) and are effective in eliminating gross differences
between channels or arrays, they definitely do not remove all bias introduced to
this point (Schuchhardt et al. 2000; Yang et al. 2002a; Yang et al. 2002b). In
particular, there is an intensity dependent bias, and can be spatial array effects,
that are not removed by global normalization. Figure 1 shows how median
normalization does not correct for localized or regional spatial anomalies, or for
intensity dependent bias.
Based on these intensity dependent effects, a normalization procedure
based on a locally weighted linear regression (lowess) method (Cleveland 1979)
has been adapted for use with microarrays and is rapidly becoming the standard
58

Figure 1: Methods for Normalization
A. Localized Anomalyunnormalized median normalized
I I I I
6 8 10 12 14
5-
4-
EZ 3
1
0log (WCE)1 2 3log (WCE)
3
2-II..
1
0
-1
-2 dO.
4I I I I I I I
4 5 6 8 101214
lowess normalized spatially normalized
1
0
-1
-2
:1
. .
I6 8 12 14
6 8 10 12 14
s-. .., ~ t-i-
rr.
- -?-·
2-
1-
0-
-1-
*0
6 I I I I
6 8 10 12 14
B. Regional Anomalyunnormalized median normalized
I I I I I !
4 6 8 10 12 14
5-
4-
- 3-o 2-
1-
0-
I-- -I
I I I I0 1 2 3log (WCE)
I 1 :2-
I .0 -f
-1
-2
I -31 *I I I I I I I 1
4 5 4 6 8 101214
r---<r r--
lowess normalized spatially normalized
- .$ Z~~··S-C"=~
-1-tn,~"~. *cr;~~;~~;-~F~-~? ·-
2
1
0
-1
-2
-3I I I I I 1
4 6 8 10 12 14
1 - -1 --·
F- _ | , L'
''1----' '-'1e
3
2
1
0
-1
-2
,:, $A
C
aiS
I .
- 1.7
- 0.33- -0.33
- -1.7
--3I
I 1. Ti
' ' 1
~- 7,
2
1
0
-1
-2
-3
-4
I 1 - . I
I * I
1
/
-4
-2.2
-0.44--0.44
--2.2
-- 4
2
1
0
-1
-2
-3
i
5_ _ ,e:
- I I I I I
4 6 8 10 12 14
1 * -q * . .
1 ;I
.
- _! l .g - i soo PM" q0tw _
LL4~
wmi6P
-,- ---L.-- ;
-, I
O"
-4~-1·---- -
It-
-t.;fii;-;- I wilro"~
F -
L ~~ .01;
Or-4VI A.-w,.
1114~1. "
. O- won WNMmm,_
0
I"I
41-- .I- .z
booko
i r:'·"
r -.---
i·i-
I-
�-'t· -.'
r
I
.
r ·.rr
I ,I
I
..
·
:-
[

Figure 1: Methods for Normalization
In each panel, four methods of normalization are compared. Unnormalized data
are shown, with an M-A scatter plot with the log of the sum of intensities on the x
axis plotted against the log of the ratio of intensities on the y axis. The red line
indicates the intensity dependent bias. A spatial representation of the ratios is
shown on a virtual chip. Finally, the unnormalized data are plotted on an R-G
scatter plot, with the log of the control intensity on the x axis versus the log of the
immunoprecipitated DNA on the y axis. The M-A and spatial representations are
show for each of the additional three normalization methods, median, lowess and
spatial lowess. A) Normalization of a chip with a small spatial anomaly. B)
Normalization of a chip with a regional anomaly, an intensity gradient down the
chip.
60

for normalization (Finkelstein et al. 2002; Quackenbush 2002; Leung and
Cavalieri 2003). The lowess procedure determines the dependency of the log
ratio on the log of the intensity, and subtracts this function from each observed
log ratio (Yang et aL. 2002a; Yang et aL. 2002b; Smyth and Speed 2003; Wilson
et aL. 2003). This procedure can also be modified to normalize the group of spots
printed by each individual print tip separately. This can correct for defects during
the printing process that might be pin specific (Yang et al. 2002b). The removal
of intensity dependent bias is illustrated in Figure 1. This figure shows, however,
that the lowess normalization still cannot correct for regional anomalies that
might be due to uneven hybridization. A spatial normalization filter following
lowess normalization has been suggested to correct for these biases (Wilson et
aL. 2003). This could prove to be an important addition to any normalization
procedure, as ANOVA tests on arrays produced for the Arabidopsis Functional
Genomics Consortium indicated that approximately 20% of arrays have
significant spatial effects, explaining more than 10% of the variance in log ratios
(Finkelstein et aL. 2002). This spatial smoothing is accomplished by computing
the median log ratio, for each spot, of the surrounding spots in some grid size:
from 3x3 to 7x7. The data are then rescaled by dividing by the median absolute
deviation (Wilson et aL. 2003). This method removes both the intensity
dependent bias and spatial anomalies, as shown in Figure 1.
One issue with all of these normalization methods is that each makes the
assumption that only a small proportion of spots are differentially affected
between the two channels or samples. This is usually true in the case of
61

perturbations of single genes, or in immunoprecipitated DNA from a single gene-
specific transcription factor. However, serious environmental perturbations or
immunoprecipitations from general transcription factors, or 'boutique' arrays
designed to capture a specific gene set, can significantly deviate from this in
practice. In these cases it is imperative to use normalization based upon a
selected set of probes rather than the entire array. Housekeeping genes have
been suggested as controls under certain circumstances, although these are not
as consistently expressed as had been imagined (Savonet et al. 1997; Lee et al.
2002a). For experiments like location analysis, the use of DNA sequences found
within long ORFs, or DNA from regions of the genome with low gene density,
"desert regions", has been suggested. However, as with the housekeeping
genes, there is no guarantee that a particular factor is not binding to any one of
these regions. Exogenous controls added during one or more steps of the
experiment are likely to be the most reliable set of data to which to normalize in
such cases.
Just because arrays are normalized within channels, or one array to
another, does not mean that an entire set of arrays is comparable. There are still
likely to be differences between arrays, based mostly upon different amounts of
RNA used as starting material, but also because of differential labeling of
samples or differential scanning. Two methods have been proposed to correct
for these between slide errors. First, a Singular Value Decomposition (SVD),
also called Principle Components Analysis (PCA) approach has been suggested
(Alter et al. 2000). In this algorithm, the data undergo a linear transformation so
62
that the expression ratios for each gene are based upon a sum of biologically
relevant expression patterns. In re-analyzing data from the yeast cell cycle
(Spellman et al. 1998), the most predominant pattern found was determined to
be noise based. Other patterns included sinusoid waves with peaks at different
times, as would be expected from the cell cycle with genes peaking at various
cell cycle stages (Alter et al. 2000). The noise pattern was subtracted from each
array to normalize the expression values. Problems with this method include its
requirement for no missing data, as well as unclear assignment of the biological
function of each of the determined patterns. The second method of
normalization between arrays normalizes for different levels of variation on
different slides by scaling each array to have the same median absolute
deviation (Yang et al. 2002b). This assumes that variation should be the same
across slides, which is not necessarily the case, for example, in a series of
expression measurements after a perturbation over time. So, while these
methods may be an improvement over no between slide normalization, it is clear
that more work is required in this area.
Quality Control
There are many steps in a microarray experiment during which things can
go awry. Poor purification of the initial starting material, contamination of
reagents or samples, loss of pellets, leaky or uneven hybridization are just some
of the problems that can arise. However, even if one of these issues has
occurred, it is often without knowledge of the researcher, and does not prevent
63
^--*·-··.·I·. . -· --· . -I- -· ·- �···-' ·�·-.�. .-C·L-.-.··� . ,-L�---··r-; ·' Y · ·- '--�--^--- -·---·- .. I·^rrr·r·�-�·u·�·· ·- · · ·--- · r:._.. ..._..·�.�·r·LI·---lr······· ·- ·I-··r . ·- · · l-I-.�L-· �,.,�C�YLYI -.-- I··LIL·Y�.� -L·�-·: · · ;·��VylUIL;^ .·: -··�·-��-··I···0*·��(
obtaining labeled material to hybridize to an array or the subsequent data
analysis. Datasets affected by one of these difficulties should be discarded as
they are likely to be irreproducible and to give spurious results. Especially as the
use of microarrays becomes more high-throughput, this means that there must
be some qualitative, or preferably quantitative, measure of array data quality.
As with every other aspect of microarray technology, quality has to be
assessed on different levels. The first check occurs at the level of individual
spots. During initial analysis of the scanned image, spots that are missing, have
an aberrant shape or contain an artifact, can be flagged as 'bad' and discarded
from further analysis. This is performed automatically by spot-finding programs
to some extent, but frequently requires manual curation. Another quality
standard that has been proposed is to use a secondary stain to assess the
amount of DNA physically present in a spot, and discard those spots where no
signal is present. Some stains that have been used include Sybr Green I for
dsDNA arrays (Mukherjee et al. 2004), Sybr Green II for ssDNA arrays (Battaglia
et al. 2000), DAPI (Finkelstein et al. 2002), or spiking a fluorophore labeled dNTP
into the printing reaction (Shearstone et al. 2002).
A composite spot quality score based on a quantitative assessment of five
common problems with microarray spots has recently been proposed (Wang et
al. 2001; Wang et al. 2003). This score incorporates the size of the spots, their
signal to noise ratio, variability in the local background of the spot, the absolute
intensity of the background, and whether the spot is saturated or not. On arrays
containing replicated spots, there is a high correlation between a good quality
64
· · ·- lr·--·-U-LIU·YLUr;�·��·�h;�..· · · ;·c--U�CIY*LY·U __ --�-·--I-�I��·` ·�L�····�·�LVL·--. I--YIY·�iYiW·IIlI·YI-�U·*U· - Ss - -e-_--

score and low variability between replicates. The same is seen when duplicate
chips are tested, and the high quality spots are significantly more consistent
between different image processing programs than are the low quality spots.
Possible uses for this spot quality score are to remove spots with a score below
some threshold from further analysis (Wang et al. 2001; Wang et al. 2003), or to
use the score to weight each spot in the analysis, such as normalization (Smyth
and Speed 2003).
Some attention has been paid recently to quality control for microarrays at
the level of the entire array. Various researchers have advocated examinations
of visual representations of data to determine chip quality. M-A scatter plots
graph the log ratio of each spot versus the log of the sum of intensities in the two
channels (Dudoit et al. 2000; Tseng et al. 2001; Yang et al. 2002a; Yang et al.
2002b; Petri et al. 2004). This is similar to the more traditional scatter plots
where the log intensity in one channel is plotted against the log intensity in the
other channel, but the M-A plots can make significant effects more obvious.
Spatial representation of the intensities on a virtual array can also be used as a
quality check, as it can reveal hybridization or other spatial artifacts (Petri et al.
2004). Examples of each of these displays are shown in Figure 1. Each of these
methods requires the researcher to make a determination about whether an
array is acceptable based on individual inspection of these displays. In order to
remove the variability introduced by this subjective measure, a quantitative metric
is essential. One such metric that has been proposed offhand is to examine the
distribution of coefficients of variation for multiple spots corresponding to the
65
........... L,- -uuYY~uu·u~ u ~ i~.·1 .~;L-Y rYlU~·july t~ii·i.r.··- * I·ltj)U~·)~sUVi~~~~Li

same gene in a given slide, or for single spots across replicated arrays (Tseng et
al. 2001). Again, however, there is no empirical measure for determining
whether a slide should be used or not, just the subjectivity of the researcher.
I have developed a quality control statistic for genome-wide location
analysis experiments, similar to the spot quality score proposed by Wang et al.
(2001). It does incorporate some elements that are specific to chromatin
immunoprecipitation versus traditional gene expression microarrays, but could
easily be adapted to the latter. The quality statistic is based upon a number of
metrics that have been chosen to incorporate various aspects of both raw and
normalized microarray data. Examples of chips that would be discarded due to
each of these metrics are shown in Figure 2. The first metric incorporates a
simple count of the number of spots with low intensity or missing data in each
channel, and the difference between the two channels, as well as the median
and maximum intensity in each channel (Figure 2A). Additional metrics include
the distribution of the intensities in the control channel (Figure 2B), the standard
deviation of the log ratios (Figure 2C), and the number of spots with a significant
p-value (<0.001) versus the number with a non-significant p-value (>0.999)
(Figure 2D).
The first two metrics are appropriate for all microarray experiments. A
large number of spots with low signal intensity generally indicates a poor labeling
reaction. It is also important that there not be a much greater number of spots
with low intensity in one channel than the other. Both of these mean that a high
percentage of the spots will not yield meaningful data, confounding interpretation
66
-r�ur�uuuiu·sll;��:,�1.· �Y·--Yb�·LI.Y·��U-�·I·-.I*SLUI··bllll;L� r· �YYLY�-·LYYLYLLLY WMI·��IYII�;·i�LYII�Wi--iY-·�-L(I�LI-L*L ··L-_ .ill_- -·-�L�Y�L�WYI�C:

of the results. The median and maximum intensity in each channel indicate
whether a large proportion of measurements are towards the low end of the
scale, regardless of how many spots fall below the intensity threshold, although
the two are related. In general results obtained from low intensity spots are less
reliable (Wang et al. 2001), so the lower the median and maximum intensity, the
less reliable the results. The second metric compares the distribution of
intensities in the control channel with the average distribution across all chips. A
distribution for an individual chip that is significantly different from the average is
indicative of problems during the experiment (Figure 2B).
The other metrics are more specific for chromatin immunoprecipitation
experiments, and have only been examined for gene-specific transcription factors
with a small percentage of enriched spots. The expectation in a location analysis
experiment performed in a cell containing no antibody target is that the
distribution of DNA species in the immunoprecipitated sample will be the same
as the distribution in the genomic control. This is due to non-specific binding of
the DNA to the beads and antibody. Therefore, the histogram of log-ratios for
each spot should have a low standard deviation. In practice, we find this to be
true for a majority of experiments. However, when the experiment fails for any
number of reasons, including a low amount of starting material, poor DNA
cleanup, or low quality linker incorporated prior to ligation mediated PCR (LM-
PCR), the result is a much higher standard deviation than expected. Finally, we
expect enrichment (p < 0.001) to occur only in the immunoprecipitated channel.
67
- " - ..;.., ~ · 1Y I·- i·i· ·~iL··j~- 1 CLLW·II·~··-LYU L·YU-_ _IYi;li-~~

Figure 2:
A.
Components of the Quality Metric
Large number of low intensity spots,low median / max intensity
B. Whole Cell Extract Channel Distribution
0 1 2 3 4log (WCE)
High ratio / X standard deviation
',··
Atypical distribution
5
LU
0.-oo0)0
4
3
2
00 1 2 3 4 5 0
log (mean WCE)
Typical distribution
1 2 3 4
log (mean WCE)
5
D.5
4
0~Q-_v
o,0
3
2
I
00 1 2 3 4 5
log (WCE)
Excess of high p-value spots
0 1 2 3 4 5log (WCE)
4
4
o)0
3
2 iii1
0
C.5
4
5
o7
0
3
2
1
0
< 0.001p-value > 0.999
·
t_ _ _. _
* * * ·- 1
e.. .
... m.'r %3. .0

Figure 2: Components of the Quality Metric
R-G scatter plots with the log of the median normalized control intensity on the x
axis versus the log of the median normalized immunoprecipitated DNA on the y
axis are shown to illustrate the components of the quality metric.
A) Large number of low intensity spots, low overall intensity.
B) In these plots, the average log control intensity of each spot over >1000 chips
is plotted on the x axis. The log control intensity for each spot on individual chips
is plotted on the y axis. The chip on the left has an atypical distribution, as seen
by the cluster of spots on the left side of the plot, and the low density and
banding of the remaining group of spots, indicating a large number of missing
spots. The chip on the right has a typical distribution that clusters more tightly
around the 1:1 line.
C) A chip with ratios with a high standard deviation.
D) A chip with significantly more high p-value (p > 0.999, in red) spots than low
p-value (p < 0.001, in green) spots.
69
�-�Li-3U ---- _.j·YIIL�Y�L_ Y* U·UI·IIIUU···I. ·Li··-·I�-Y(L·L- · ·· ·- LII- I�·-IU- LII·I-J�··I··YIIC ·L�···L*··-__···L�ii�Li-·I·LLUI· · ·�U·L·I;CIIY(-ill·YI�··�·j�U··Y-I
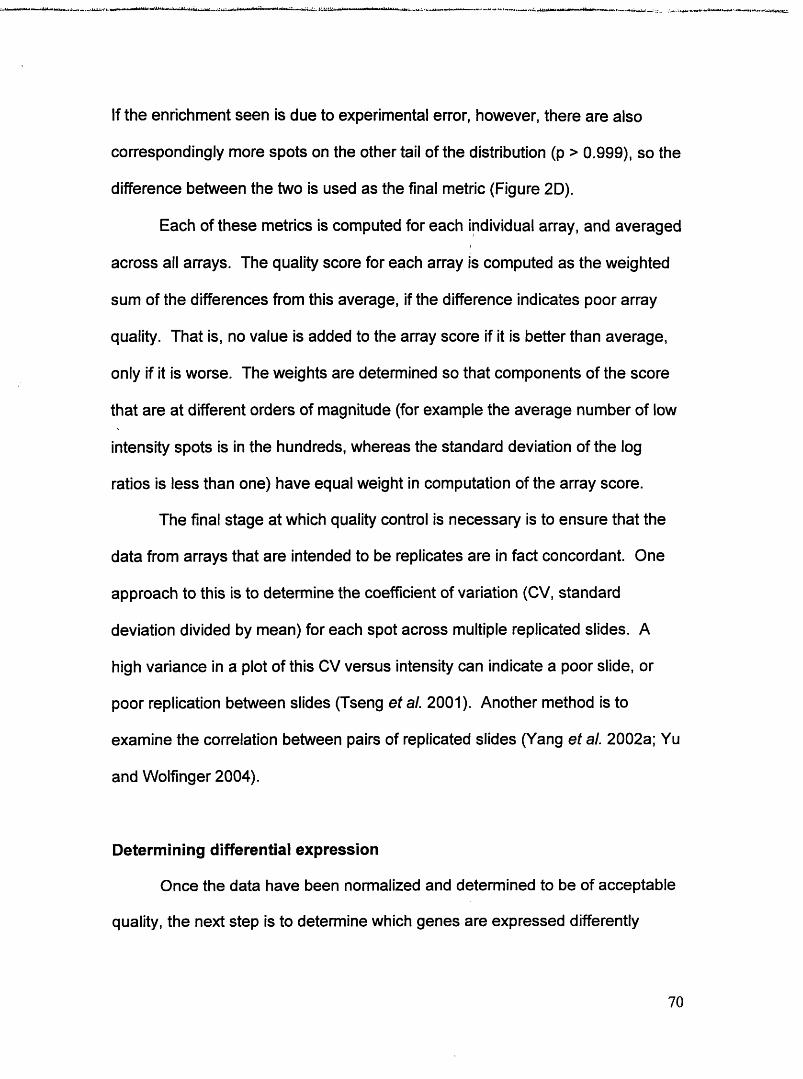
If the enrichment seen is due to experimental error, however, there are also
correspondingly more spots on the other tail of the distribution (p > 0.999), so the
difference between the two is used as the final metric (Figure 2D).
Each of these metrics is computed for each individual array, and averaged
across all arrays. The quality score for each array is computed as the weighted
sum of the differences from this average, if the difference indicates poor array
quality. That is, no value is added to the array score if it is better than average,
only if it is worse. The weights are determined so that components of the score
that are at different orders of magnitude (for example the average number of low
intensity spots is in the hundreds, whereas the standard deviation of the log
ratios is less than one) have equal weight in computation of the array score.
The final stage at which quality control is necessary is to ensure that the
data from arrays that are intended to be replicates are in fact concordant. One
approach to this is to determine the coefficient of variation (CV, standard
deviation divided by mean) for each spot across multiple replicated slides. A
high variance in a plot of this CV versus intensity can indicate a poor slide, or
poor replication between slides (Tseng et al. 2001). Another method is to
examine the correlation between pairs of replicated slides (Yang et al. 2002a; Yu
and Wolfinger 2004).
Determining differential expression
Once the data have been normalized and determined to be of acceptable
quality, the next step is to determine which genes are expressed differently
70
;uru·�-�urp. r�-·,·riL�L·IL· UIW·W·Y·�·I+H*-··iL··i�LI1Uj-·iei��_il·i i�"�i)inCrru�ulrJCur.rt·:. iv... I·.run-r.ru--.r. -n·r r.*.,,..,....L

between samples. The naive method is to select a fold change ratio cutoff, then
consider any gene with a larger increase or decrease in expression as
differentially expressed. This heuristic is still in common use, but has some
serious drawbacks. First, it has been well documented that expression changes
at low intensity are much less reliable than those at high intensity (Tusher et al.
2001; Wang et al. 2001; Yang et al. 2002a), but this method does not account for
that. Second, some genes are inherently more variable in expression than
others, which can lead to a high rate of false positives (Hughes et al. 2000;
Tusher et al. 2001). For other genes that are expressed at a much more
constant level, a small amount of change in an experiment could be extremely
significant, but missed by using a simple fold-change criterion.
A burgeoning literature in this field has proposed many statistics for
quantifying differential expression and significance thereof. There are three
major problems with this literature: most of it is incomprehensible to the typical
biologist who could benefit from using these analyses, tools for performing the
analysis are not provided in a user-friendly form, and there is generally no
comparison of the results with those of other methods. Standards have been
developed for the reporting of microarray experimental data, and are now largely
in place (Ball et al. 2002). Similarly, the community interested in the analysis of
these data must develop principles for assessing each new method, and should
perform these tests on a common data set(s). The leukemia dataset from Golub
et al. (1999) seems to be becoming one such data set. A standardization of the
reported results would also be useful. Two authors have recently performed
71
�U- --· ·-- ·YI'I�.....·L�L�_�.·ii�·�·�--i�L -I- -I··IYi--·_�;i�a�ll�·LI�·I-_--Y-C-� ·YW·IY*··L�YU·L·-II·jly�.·l_ --·--�·i·Y-· )-)··L·--II·I_·U-y··�_IU__^l^iLUII· .··-···�··YIIY···-·

comparative studies of selected analysis methods using the leukemia data (Pan
2002; Broberg 2003), but as they report different statistics, it is difficult to
compare between the two.
Despite the difficulties in comparing individual methods to decide which is
optimum for a given analysis, some consensus has emerged as to the properties
of different techniques. First of all, statisticians uniformly agree that the use of a
straightforward fold-change criterion for selecting differentially expressed genes
is a poor metric. Because this method does not take into account the variability
of expression for each gene, nor the intensity of the measurements the fold
change is based on, the fold-change cutoff leads to an unacceptable rate of both
false positives and false negatives (Ideker et al. 2000; Baldi and Long 2001;
Tusher et aL. 2001; Wang and Ethier 2004). A conventional t-test, also widely
used, is a poor metric as well, because it assumes many more replicates than
are typically performed in a microarray experiment, as well as assuming that the
data are normally distributed, which is not the case (Baldi and Long 2001; Pan
2002; Broberg 2003; Wang and Ethier 2004).
Beyond that consensus, a de facto standard for analysis of microarray
data does seem to have emerged, Significance Analysis of Microarrays (SAM)
(Tusher et al. 2001). In this method, each gene is assigned a score based on its
change in expression relative to its standard deviation. A significance threshold
is then set, based on permutations of the data, to allow the researcher to choose
an acceptable level of false positives within the list of genes passing the
threshold. This technique makes three major advances over the more simplistic
72
------ 'rrYr�LYu;�3pl·:i..uliiu+lrrir�j.ii�p·�� .,;_ .,r�yuYwuuurrY·ul-u.ur.;:j �·i.

measures discussed above. First, the use of an empirical calculation of the false
discovery rate rather than making assumptions about the distribution of the data
for determining significance. Second, the incorporation of a gene-specific metric
to account for differences in variance between mRNA species. Finally, a
regularizing parameter is used to remove the dependence of variance on
intensity, thus making inferences at lower intensities more sound. More recently,
a proposal has been made to improve this analysis by modifying the test statistic,
but it remains to be seen whether the improvement is significant enough to
warrant general use (Broberg 2003).
There is one drawback with SAM - because it relies on replicated data
both to calculate the metric for differential expression and to assess the
significance of this difference, it cannot be used on a single chip level. This
weakness is not present in the other most commonly used method for assessing
differential expression, an error model developed originally for use with ink-jet
synthesized expression arrays (Hughes et al. 2000). Like SAM, this algorithm
improves over the basic analyses in that the larger variability at low intensities is
incorporated into the model. The test statistic incorporates a measure of the
background variance, as well as normalizing the statistic by intensity so that it
becomes intensity independent. However, it does assume normality of the data
in order to calculate a probability. This is the error model we adopted for use
with genome-wide location analysis.
It is important, with whatever statistical method is chosen for analysis of
differential expression, to keep the underlying biology in mind. For example,
73
:- ·- �Li-r�---l- -- iu··�ul·irCi*uY*w'�·�L�V�·u· ·lyl·-·i-iWly·-- '·------·L-Y··
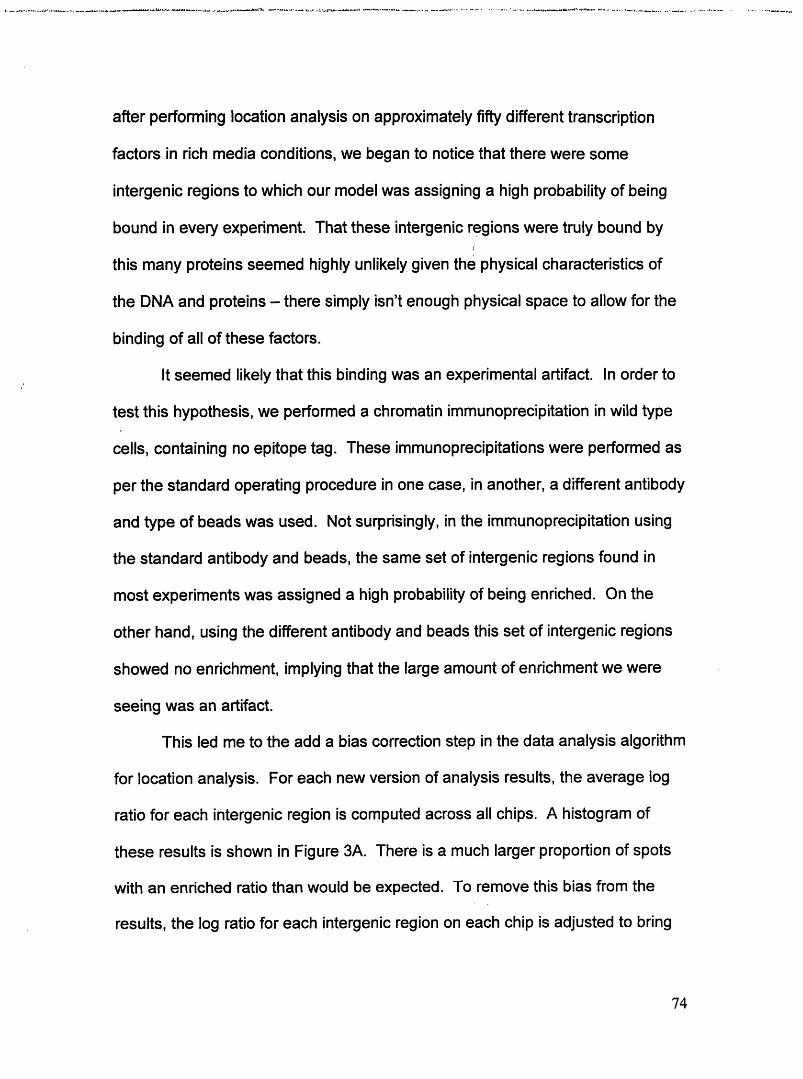
after performing location analysis on approximately fifty different transcription
factors in rich media conditions, we began to notice that there were some
intergenic regions to which our model was assigning a high probability of being
bound in every experiment. That these intergenic regions were truly bound by
this many proteins seemed highly unlikely given the physical characteristics of
the DNA and proteins - there simply isn't enough physical space to allow for the
binding of all of these factors.
It seemed likely that this binding was an experimental artifact. In order to
test this hypothesis, we performed a chromatin immunoprecipitation in wild type
cells, containing no epitope tag. These immunoprecipitations were performed as
per the standard operating procedure in one case, in another, a different antibody
and type of beads was used. Not surprisingly, in the immunoprecipitation using
the standard antibody and beads, the same set of intergenic regions found in
most experiments was assigned a high probability of being enriched. On the
other hand, using the different antibody and beads this set of intergenic regions
showed no enrichment, implying that the large amount of enrichment we were
seeing was an artifact.
This led me to the add a bias correction step in the data analysis algorithm
for location analysis. For each new version of analysis results, the average log
ratio for each intergenic region is computed across all chips. A histogram of
these results is shown in Figure 3A. There is a much larger proportion of spots
with an enriched ratio than would be expected. To remove this bias from the
results, the log ratio for each intergenic region on each chip is adjusted to bring
74
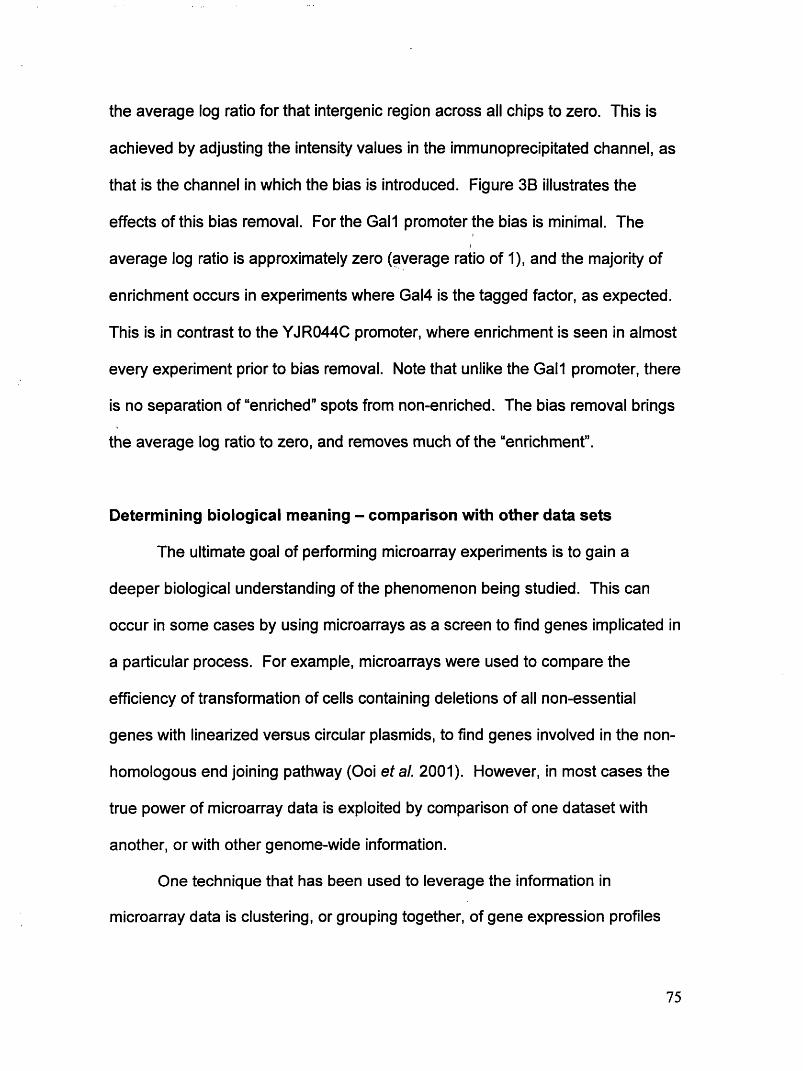
the average log ratio for that intergenic region across all chips to zero. This is
achieved by adjusting the intensity values in the immunoprecipitated channel, as
that is the channel in which the bias is introduced. Figure 3B illustrates the
effects of this bias removal. For the Gall promoter the bias is minimal. The
average log ratio is approximately zero (average ratio of 1), and the majority of
enrichment occurs in experiments where Gal4 is the tagged factor, as expected.
This is in contrast to the YJR044C promoter, where enrichment is seen in almost
every experiment prior to bias removal. Note that unlike the Gall promoter, there
is no separation of "enriched" spots from non-enriched. The bias removal brings
the average log ratio to zero, and removes much of the "enrichment".
Determining biological meaning - comparison with other data sets
The ultimate goal of performing microarray experiments is to gain a
deeper biological understanding of the phenomenon being studied. This can
occur in some cases by using microarrays as a screen to find genes implicated in
a particular process. For example, microarrays were used to compare the
efficiency of transformation of cells containing deletions of all non-essential
genes with linearized versus circular plasmids, to find genes involved in the non-
homologous end joining pathway (Ooi et al. 2001). However, in most cases the
true power of microarray data is exploited by comparison of one dataset with
another, or with other genome-wide information.
One technique that has been used to leverage the information in
microarray data is clustering, or grouping together, of gene expression profiles
75

Figure 3: Bias reduction
Average log ratio for each intergenic region
500
Number ofintergenic 400
regions
300
-0.4Average log ratio
-0.3
-0.5
0.2
-0.2
-0.25 0
I
0.3 0.4Average log ratio
0.25 0.5
Average log ratio
Effect of bias subtraction on individual intergenic regions, across chips
GAL1 promoterwithout bias subtraction
1 2 3 4 5 0
log (WCE) GAL1 promoter I
GAL1 promoterwithout bias subtraction
-1 -0.5 0 0.5 1 1.5
log (ratio)
5
oE4
0 3Ia
oa)
A
YJR044C promoterwithout bias subtraction
5a)
E4
o
~ 2
1
oA
1 2 3 4 5 v0
og (WCE) YJR044C promoter II
YJR044C promoterwithout bias subtraction
OU
a 60c-o
40a)
E
z 20
A
:600
°40a)
Ez 20
02 -1 -0.5 0 0.5 1 1.5 2
YJR044C promoterbias subtraction
1 2 3 4 5
og (WCE) YJR044C promoter
YJR044C promoterbias subtraction
-1 -. 5 0 0.5 1 1.5 2
log (ratio)
A.
-0.5
Lmi
B.
0.5
5
a)4
E2"3
-J
_10 10
Ce0.
0)
E0
z
1 I l · · l · l
-
f -
i____ J
n
}
L- . .1·- -
.I . .· L...
log (ratio)

Figure 3: Bias Reduction
A) A histogram of the average log base 10 ratio for each spot across > 1000
chips. The inset shows a blowup of the histogram for log ratios > 0.25. Average
log ratios greater than zero indicate enrichment. Note that the tail on the
enriched side is heavier than the tail on the non-enriched (left) side.
B) R-G scatter plots and ratio histograms for individual promoters across > 1000
chips. In each R-G plot the control intensity for the selected spot (x-axis) is
plotted against the immunoprecipitated DNA intensity for that spot on each chip
(y-axis). The GAL1 promoter is an unbiased spot, the average log ratio is close
to zero, and enriched chips are separated from non-enriched chips. GAL1 is
known to be regulated by Gal4, so spots corresponding to chips where Gal4 was
the tagged factor are marked in red. Other highly enriched spots correspond to
tagged factors Migl and Mthl, also known to regulate galactose synthesis.
YJR044C is a highly biased promoter, with a log ratio greater than zero in almost
every experiment, and no separation between spot populations, indicating a low
likelihood of enrichment. The bias reduction reduces the average log ratio to 0.
77

generated through perturbations. This is based on the hypothesis that genes
involved in the same function will have similar effects on gene expression when
deleted. Likewise, extracellular perturbations such as application of a drug or
other small molecule that affect a particular pathway will cause analogous
changes. Clustering of such expression profiles has been used to annotate
previously uncharacterized genes (Hughes et al. 2000; Wu et al. 2002), to find
targets of drugs (Hughes et al. 2000; Parsons et al. 2004), and to find novel
genes involved in peroxisome biogenesis (Smith et al. 2002).
Comparison amongst various types of genome-wide data has been
particularly productive for determining functional significance of microarray
results. Genes in common between expression data and the binding of gene-
specific transcription factors (Ren et al. 2000; Bar-Joseph et al. 2003) indicate
likely transcriptional regulation. The overlap between genes whose upstream
region contains a particular sequence motif and expression data can correlate
that motif with gene functions (Kellis et al. 2003). Overlaps with location data can
indicate which transcription factor is binding to the selected sequence motif.
Comparison of genes or sequences culled from any of these types of
experiments with functional annotation based on literature curation has been
widely used to determine pathways or functions affected (Robinson et al. 2002;
Doniger et al. 2003) These comparisons are performed by selecting genes from
one dataset that meet a particular threshold, then counting the number of genes
in common with the comparison gene set. A probability is calculated using the
hypergeometric distribution or its binomial approximation. The categories with
78
-·- -..LU."-U U~;··- ·-·Y 1 h·~L i·~l C;i·_··i;yUi·i·IW *~i~~iI~l~_Ul:~l·

the most significant enrichment are taken as likely to inform on the biological
function of the set of genes being tested, and in many cases have been validated
experimentally as such.
The biggest drawback to this approach is the use of a fixed cutoff in
selection of one or both gene sets being examined' A novel algorithm called
"Gene Set Enrichment Analysis" (GSEA) which avoids this shortcoming has been
proposed (Mootha et al. 2003). The expression profiles of muscle tissue from
both diabetic patients and normal controls were obtained. After correcting for
multiple testing, there were no genes which met the threshold for significance.
Instead, each gene was ranked based on the average difference in expression
between the patients and controls, and an enrichment score for
overrepresentation of genes in a particular category or biological pathway was
computed. Significance of the enrichment was assessed by comparison with
permuted data. In this study, the functional class with the highest enrichment
score was genes involved in oxidative phosphorylation. Examination of the
genes so classified showed a highly significant decrease in expression of
approximately 20% across this set of genes (Mootha et al 2003). Thus by using
a rank ordering of genes for comparison with functional annotations, the problem
of selection of an appropriate significance threshold for a single gene was
avoided.
Despite the improvement that GSEA makes over the previously used
heuristics, it does face the same problem in that the gene sets must be static.
The groups of genes culled from literature annotation, containing particular
79
IU --r�·rr�··l�c�L�uLI-u�i��L· L�1-irYLUI·····�··Yi*�L·�W/liriY�ruW-L-Y ^.--U · r·r·�--·-k�·rW1LU-··�·Y�··YU�UI*�,·,.L; ,�iii-.. �... I·�U��Ulr ~�CY'"-�"l··*-U·I�··i��

sequence motifs, or clusters of expression data meet this criterion, but genes
selected as highly differentially expressed in other microarray studies do not.
Another case where the use of a significance cutoff can prove problematic is in
comparison of location data for different factors. Determining the overlap of
binding between factors can be used to decide if the factors are functioning at the
same promoters (Zeitlinger et al. 2003). Particularly if one or both factors are
more general, the use of a significance cutoff for binding can mask detection of a
true overlap, or the extent of an overlap.
I have developed a simple algorithm and statistic for overcoming these
obstacles. Rather than comparing a fixed number of genes or intergenic regions
from each dataset, a sliding comparison is performed. Similar to GSEA, genes in
each dataset are first ranked by significance. Then, for the top N genes the
number of genes in common between the two datasets is plotted, with N varying
from 1 to the size of the dataset. The area under the curve is used as the test
statistic. Significance is computed based on the number of higher test statistics
seen when testing the overlap with other data. This test statistic could be
improved - an enrichment score computed as in GSEA would probably be more
sensitive (Mootha et aL 2003).
The differences between computing overlaps between static, thresholded
sets of genes and the sliding overlap method are highlighted in Figure 4. The
first comparison, Figure 4A, is between the binding of each of four factors in rich
media versus peroxide. Using the static method, overlaps between the two
conditions are significant for three of the four factors, Hsfl, Rebl, and Yap4. The
80
___r~y*:L·;Pru~Yi·YI-·CL·U· · ~_rrrYY-LU-LU i~iLi-~~L~··L··Y··-~-I~YL~~ ~j;11:;i i ii W·* 1·- -. i.*yl

4,
I%
t7
46.
-7.#0Ž
%,
70'.%0~
y, 0%o. ,
4,
.z0
V.
I1 01v
AIT
A112~
It,
I>j~
111-0I-
,40
0.1 r
Is,-~·

Figure 4: Overlaps Between Datasets
Two methods of assessing overlaps between datasets. The static method,
where genes are selected for comparison if they pass a threshold, in this case a
p-value <0.001. The overlaps between selected genes are counted, and a
probability computed using the hypergeometric test. These overlaps are shown
using Venn diagrams, where the size of the circle or overlap is proportional to the
number of genes. In the sliding overlap method, genes in one dataset are
ranked in order of enrichment (or expression). For each N, the number of the top
N ranked genes in that dataset found in the top N ranked genes of the
comparison dataset is counted, and this overlap is plotted from 1 to N. An
overlap probability is computed by comparing with randomized data.
A) Comparison between binding of factors in rich media with peroxide. The
factors chosen for comparison were Rebl, Msn2, Yap4 and Hsfl. A separate
Venn diagram with associated p-value is shown for each factor for the static
overlap method. Using this tool, significant overlaps are seen for Yap4, Hsfl and
Rebl. No overlap is found for Msn2 in rich media versus peroxide. The Yap4
and Hsfl overlaps are equally significant according to the hypergeometric test,
with a slightly less significant overlap for Rebl. For the sliding overlap technique,
a line showing the extent of the overlap is graphed for each factor, Rebl (green),
Msn2 (red), Yap4 (blue) and Hsfl (magenta). The black dotted line indicates the
maximum possible overlap. In contrast to the results seen with the static overlap
method, Rebl has the highest overlap between the YPD and peroxide
82
�hllr�-·rruu�w�'iul�;;;;rua-�-ruuu�r�La; --- ··��r���� .YUYYYY·ar-.-I�.....-I�;1Wlir_··I�ULULLL I·I··�-·-··L-CXY � YY··�·(i·Y1·Ly*CyyElj�j��l·M·L--�l-Clr� ·I�EII�Y

_____________ .- - . . ' - . .i1-; l1Zi 6 -Ti---.WLb.9
conditions, followed by Yap4 and Hsfl. In agreement with the static method,
minimal overlap is seen with Msn2.
B) Comparison between binding of Yap7 and four hyperoxia regulators in
peroxide - Msn2 (green), Skn7 (red), Yap1 (blue) and Msn4 (magenta).
Significant overlaps are computed for each factor compared with Yap7 with the
static method. Yap1 has the highest overlap, followed by Msn4. Again, this is
contrasted with the results from the sliding overlap technique, where the only
significant overlap is between Yap7 and Yap1, and the overlaps with the other
three factors are equivalent.
83

*-4-1.4· i j · - - -· - -I -I -
overlap is most significant for Hsfl, followed by Rebl and Yap4. On the other
hand, the sliding overlap method makes it clear that the binding of Rebl is
actually the most similar between the two conditions, followed by Yap4 then
Hsfl. In Figure 4B, comparisons are made between binding of regulators in the
same condition, hyperoxia, to determine whether any of the regulators might be
functioning at the same promoters. The binding of Yap7 is compared with the
binding of the four master regulators of the hyperoxic stress response. With the
static method, despite only small overlaps between Yap7 and Msn2, Msn4 and
Skn7, all overlaps are assigned a reasonably significant p-value. The overlap
between Yap7 and Yap1 is most significant, followed by the overlap of Yap7 with
Msn4. However, the sliding overlap method shows that only the overlap between
Yap7 and Yap1 is significant, and that the overlaps with the other three factors
are almost identical. This illustrates how use of a fixed cutoff can introduce
artifacts into the analysis.
Determining biological meaning - network motifs
One way that the overlaps between the sets of genes bound by
transcription factors have been used is to find factors that might be binding as a
complex, or cooperatively regulating genes in some other way. Groups of
regulators jointly regulating expression of groups of genes has been termed a
"multi-input motif' (Lee et al. 2002b), or "dense overlapping regulon" (Shen-Orr et
al. 2002). This is one example of a network motif, patterns of regulation that
occur more frequently than expected by chance (Milo et al. 2002; Shen-Orr et al.
84

2002). Other network motifs include autoregulation, feedforward loops, single-
input motifs, multi-component loops, and regulator chains (Lee et al. 2002b).
Individual network motifs for a small subset of regulators have been defined on a
gene by gene basis, but until genome-wide location analysis was used to profile
most regulators, enumeration of the possible network motifs used by the cell
globally was not feasible.
I developed a set of algorithms for finding all of the network motifs present
in the genome-wide binding data. These motifs are not definitive, but instead
designed to provide hypotheses for further testing. As with other analyses we
performed with these location data, we used a fixed p value threshold of 0.001 to
minimize the number of false positives, but this does mean that we are probably
not capturing all network motifs. The methods for discovering the motifs ranged
from the trivial determination of the autoregulatory motifs, the set of regulators
found to be binding to their own promoters, to the complexities of finding the
multi-component loops and regulator chains.
Single-input motifs consisted of simply listing the genes bound by each
regulator. Multi-input motifs were found by testing each gene (see schematic in
Figure 5A), first to determine if it was bound by multiple regulators, then to find
out if the pattern of bound regulators had already been cataloged. If the
regulatory pattern was novel, the remaining genes were searched to find any
additional instances of the pattern. This reduced computational time significantly
over testing each possible regulatory pattern. To obtain the list of feedforward
loops, any additional regulators bound by a given factor were found, followed by
85
.~-llu~r · ~.~iri~irr YY·rui~~LY :-1IIY----- -,biti-, , - .l~i&l~ii~
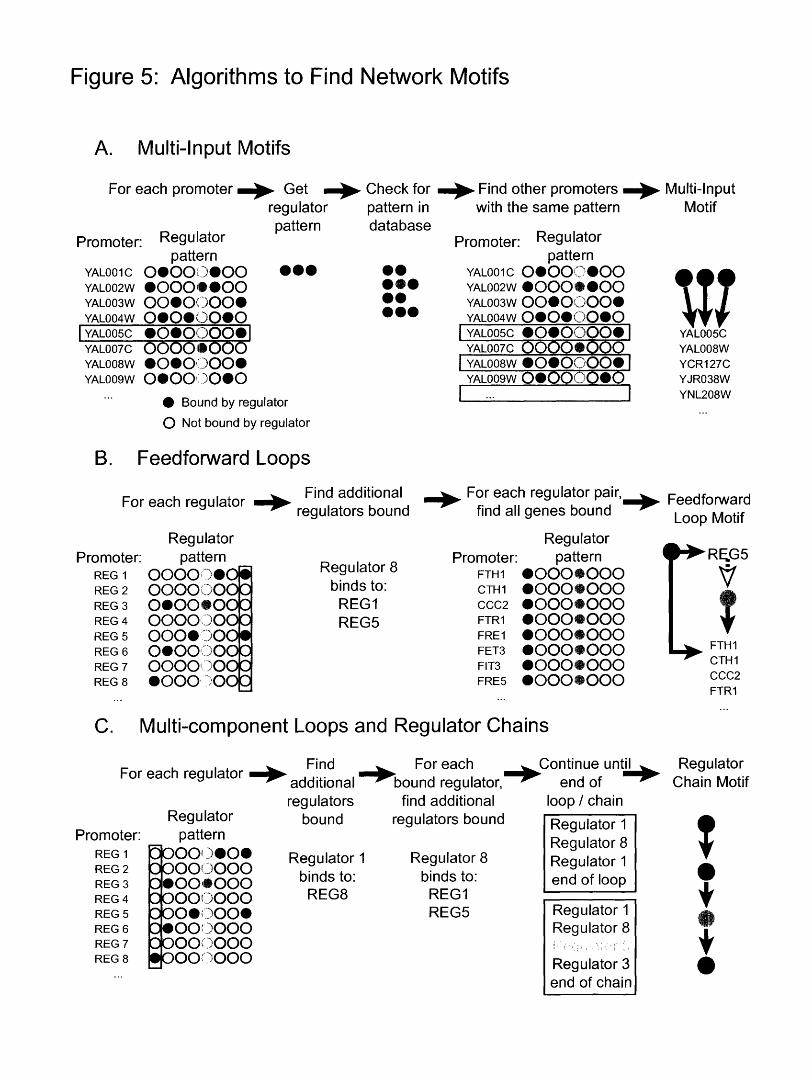
Figure 5: Algorithms to Find Network Motifs
A. Multi-Input Motifs
For each promoter . Get
Promoter: Regulatorpattern
YAL001C 0 000:000YAL002W 000 )00YAL003W 00O0': 00YAL004W 0009i.)O0
I YAL005C OOOOOO-JYAL007CYAL008WYALOO9W
regulatorpattern
*11
00000000000.0000
0 Bound by regulator
uinm Check for . Find other promoters . Multi-Inputpattern indatabase
0000000*s
with the same pattern
Promoter: Regulator
YAL001 CYAL002WYAL003WYAL004W
pattern0*000'0000000e0000000000000oo)00o
YAL00C 00000000YAL007C OOOO*OO,
I YAL008W 0000000 IYALOO9W 0000000
I ... I
Motif
YAL005CYAL008WYCR1 27CYJR038W
YNL208W
O Not bound by regulator
B. Feedforward Loops
Find additionalFor each regulator F regulators bound
regulators bound
Regulatorpattern
0000-000000(:00000000000'000000 :00)0-001,' @)OC0000 ':000000 '00
i
S-
Regulator 8binds to:
REG 1
REG5
For each regulator pair, Feedforward·ir, . 11 k- ,- I..,IIIIU :111 yt1iis; L)UUIIU
Promoter:Regulator
pattern
Loop Motif
4
FTH1 000O*000CTH1 0000*000CCC2 0000000FTR1 00000000FRE1 0000000FET3 0000*000FIT3 000O*000FRE5 0OOOOOO
C. Multi-component Loops and Regulator Chains
For each regulator .
Regulatorpattern
000O-)0O00& 9'000000000000 9000000O')00O000.)000
0000')000000 '')000
Find For each Continue untiladditional * bound regulator,_ end of regulators find additional loop / chain
bound
Regulator 1
binds to:REG8
regulators bound
Regulator 8binds to:
REG1REG5
Rgl REG5
FTH1
RegulatorChain Motif
0OBs
e
CTH1
CCC2FTR1
Promoter:REG 1
REG 2
REG 3
REG 4
REG 5REG 6
REG 7
REG 8
Promoter:REG 1REG 2REG 3REG 4REG 5REG 6REG 7REG 8
I-
8
Regulator Regulator 8Regulator 1
end of loop
Regulator IRegulator 8
Regulator 3end of chain

Figure 5: Algorithms to Find Network Motifs
For these schematics, the promoter for a given gene is labeled with capital
letters. The pattern of regulators binding to a promoter is indicated by circles,
which are filled if the regulator is binding, or empty if the regulator is not binding.
The promoter or regulator being examined is boxed in red. In the motif
schematics, regulator proteins are denoted by circles, the promoters to which
they are binding are denoted by rectangles. A binding interaction is shown by an
arrow point from the regulator to the promoter to which it binds. This figure
shows schematics for how network motifs were found as follows:
A) Multi-Input Motifs. The list of genes is scanned through, one by one. The
pattern of regulators binding to the current gene is found. If that pattern has not
already been used, all other genes that are bound by the same pattern of
regulators are added to the motif.
B) Feedforward Loops. Each regulator is examined to find promoters to which it
binds that could regulate additional regulators. All genes that are bound by both
regulators are added to the motif.
C) Multi-component Loops and Regulator Chains. This is a recursive algorithm,
where the list of regulators bound by the factor being examined is obtained. The
list of regulator bound by each of those downstream regulators is then found, and
so on. The motif terminates when a downstream regulator does not bind to any
additional regulators, leading to a Regulator Chain, or the downstream regulator
binds to a regulator earlier in the series, leading to a Multi-Component Loop.
87
ururrowuluol···i�urr�;;�" '--·�··-· -Y--'-.YY-..-hay�ai�i�i�i·Liiy�Z:�L····· --Li-YIII··-·LL·4·U�·�·�·_(Ul�iiYY·D�UI· ·- ·�I�LL�n·L·LII�LW_*dLl�j�jlL�:�Y(LL�·Y

the group of genes bound by these two regulators (Figure 5B). Since multi-
component loops and regulator chains are similar in that they consist of multiple
sequential regulator-regulator promoter interactions, they were found using a
single recursive algorithm (Figure 5C). In each loop of the recursion, one more
regulator was added onto a loop or chain, until a regulator earlier in the sequence
was repeated (loop), or no further regulators were bound by the terminal factor
(chain). After the final list of loops and chains was determined, any motif that
was a subset of another motif was removed. Some improvements that could be
made to these methods include incorporating additional sources of data such as
sequence motifs, conservation and expression information in order to relax the p-
value threshold used.
While the biological effects of the motifs we discovered have yet to be
demonstrated, network motifs discovered using traditional biological experiments
have been shown to effect particular patterns of transcriptional regulation.
Positive autoregulatory events increase the amount of a transcription factor
available to regulate expression of additional genes upon a specific change in
environment. Transcription of Pdr3, a regulator involved in response to various
drugs, is initially stimulated by binding of Pdrl followed by autoregulation
(Delahodde et al. 1995). These two regulators are also involved in a feedforward
loop: Pdrl binds to and activates Pdr3, and the two activators together regulate
expression of a number of transporters, including Pdr5, Pdrl, Pdrl Pdr15, Snq2 and
Yorl (Decottignies et al. 1994; Decottignies et al. 1995; Wolfger et al. 1997;
Decottignies et al. 1998). Examples of multi-input motifs abound; in the
88
. - __ .r~~;~iiU~~IL; r~liu~r; -~llr~*·Ih~·is ii~tLi;ib~~j~u~·liauurli~i~ ~ :,.~~tU;UQ u~iiwd:;(;

regulation of response to various stresses, Hsfl and Msn2/4 coordinate the
response of some genes (Treger et al. 1998; Amoros and Estruch 2001), while
Skn7 and Hsfl regulate others (Raitt et al. 2000).
Determining biological meaning - data visualization
Comparing microarray data with annotations or other data sets can yield
biological discovery in terms of which pathways might be regulated by a
particular perturbation, or which regulators might be causing those changes, for
example. However, it can be very easy to miss key discoveries because of the
size of the data sets and our inherent inability to cope with that much information.
Methods for visualizing the data have proved invaluable in spotting global trends.
The first type of visualization used was developed for viewing the results
of clustering analyses. In this depiction, now commonly called a 'heat map',
ratios that indicate an increase in expression are colored in red, those indicating
a decrease are colored green, and the intensity of the color is proportional to the
magnitude of the change (Eisen et al. 1998; Wen et al. 1998). The data are
clustered using one of a number of metrics, then displayed. Patterns of changes
that might be missed just by examination of the numerical data are now clearly
obvious. In analyzing the response of yeast cells to varying stress conditions
(Gasch et al. 2000; Causton et al. 2001), for example, the fact that there is a
common response to all the stresses becomes obvious when the data are
clustered and visualized in this manner. Besides being effective with expression
data, this method of visualizing data can aid discoveries with other technologies
89
r u-*rirul~r~~;,: -- " -- ` L~ l i~r·~,;i:r; I-:---:--L-I~~~~j .)1~ ~li~~illyi· _ · VLl~ IYUJ~·YY3jii;

as well. A heat map of clustered location data for the cell cycle regulators shows
the waves of regulation over time (Simon et al. 2001). Heat maps of location
data for the binding of 106 yeast transcription factors to promoters shows pairs
and groups of regulators that are functioning together, as well as the sets of
genes being regulated (Lee et al. 2002b).
Another useful way of displaying both expression and location data is by
chromosomal location. Genes that are changing in expression, or that are bound
by a transcription factor are colored on a depiction of each chromosome.
Visualizing changes in expression upon depletion of histone H4 in this manner
led to the insight that histones do not seems to be generally repressive to gene
expression except at the 20kb most proximal to telomeres (Wyrick et al. 1999).
This contrasted strikingly with the pattern seen upon deletion of the silencing
proteins, Sir2, 3 and 4, where the repressive effect did not spread nearly as far.
In another instance, the chromosomal coloring was used to illustrate the gene-
specificity of Swi/Snf dependent remodeling (Sudarsanam et al. 2000). An open
question had been whether this chromatin remodeling complex was altering the
nuclesome structure of entire chromatin domains, or whether the changes were
localized to individual promoters. Visualization of the expression changes
occurring in Swi/Snf mutants showed no clustering of changes by chromosomal
location, indicating that the remodeling action of Swi/Snf occurs on a very limited
basis. Microarrays for genome-wide location analysis are constantly being
improved; the latest generations include tiled promoter regions. Similar
90
rrja�iiiyl.Hur·�unniilr�iu+lc��d

representations of these tiled regions could assist in discovering the global
positions at which general regulatory factors or chromatin modifiers are acting.
Other displays of genome-scale data are often used, but more to illustrate
discoveries than to make them. Venn diagrams of overlaps between data sets or
between data sets and annotations are frequently used to give a visual sense of
the scale of the overlap. Scatter plots of intensities or ratios for a single
experiment can show the effectiveness of the normalization and analysis
methods; scatter plots comparing different experiments illustrate the extent of
differences between the two data sets. Graphs of clustered expression profiles,
for example, illustrated the changes seen in the profile over time or through
experiments.
Because we are much better able to process the amount of information
generated in a microarray experiment visually rather than by examining numbers,
it behooves the community to develop even more methods by which biological
discoveries can be made. With so many novel genome-wide data sets of which
to take advantage, methods that can distill these into clear representations will
greatly assist in helping to use these data to make global discoveries rather than
serving in the same way as gene by gene approaches have for the past century.
91
...... - --- . .

References:
Alter O, Brown PO and Botstein D (2000). "Singular value decomposition forgenome-wide expression data processing and modeling." Proc Natl Acad Sci U SA 97(18): 10101-6.
Amoros M and Estruch F (2001). "Hsflp and Msn2/;4p cooperate in theexpression of Saccharomyces cerevisiae genes HSP26 and HSP104 in a gene-and stress type-dependent manner." Mol Microbiol 39(6): 1523-32.
Baldi P and Long AD (2001). "A Bayesian framework for the analysis ofmicroarray expression data: regularized t -test and statistical inferences of genechanges." Bioinformatics 17(6): 509-19.
Ball CA, Sherlock G, Parkinson H, Rocca-Sera P, et al. (2002). "Standards formicroarray data." Science 298(5593): 539.
Bar-Joseph Z, Gerber GK, Lee TI, Rinaldi NJ, et al. (2003). "Computationaldiscovery of gene modules and regulatory networks." Nat Biotechnol 21(11):1337-42.
Battaglia C, Salani G, Consolandi C, Bernardi LR and De Bellis G (2000)."Analysis of DNA microarrays by non-destructive fluorescent staining usingSYBR green II." Biotechniques 29(1): 78-81.
Broberg P (2003). "Statistical methods for ranking differentially expressedgenes." Genome Biol 4(6): R41.
Causton HC, Ren B, Koh SS, Harbison CT, et al. (2001). "Remodeling of yeastgenome expression in response to environmental changes." Mol Biol Cell 12(2):323-37.
Cho RJ, Campbell MJ, Winzeler EA, Steinmetz L, et al. (1998). "A genome-widetranscriptional analysis of the mitotic cell cycle." Mol Cell 2(1): 65-73.
Cho RJ, Huang M, Campbell MJ, Dong H, et al. (2001). "Transcriptionalregulation and function during the human cell cycle." Nat Genet 27(1): 48-54.
Chu S, DeRisi J, Eisen M, Mulholland J, Botstein D, Brown PO and Herskowitz I(1998). "The transcriptional program of sporulation in budding yeast." Science282(5389): 699-705.
Cleveland WS (1979). "Robust locally weighted regression and smoothingscatterplots." J Amer Stat Assoc 74: 829-836.
92

Dasgupta A, Darst RP, Martin KJ, Afshari CA and Auble DT (2002). "Mot1activates and represses transcription by direct, ATPase-dependentmechanisms." Proc Natl Acad Sci U S A 99(5): 2666-71.
Decottignies A, Grant AM, Nichols JW, de Wet H, Mcintosh DB and Goffeau A(1998). "ATPase and multidrug transport activities of the overexpressed yeastABC protein Yorlp." J Biol Chem 273(20): 12612-22.
Decottignies A, Kolaczkowski M, Balzi E and Goffeau A (1994). "Solubilizationand characterization of the overexpressed PDR5 multidrug resistance nucleotidetriphosphatase of yeast." J Biol Chem 269(17): 12797-803.
Decottignies A, Lambert L, Catty P, Degand H, Epping EA, Moye-Rowley WS,Balzi E and Goffeau A (1995). "Identification and characterization of SNQ2, anew multidrug ATP binding cassette transporter of the yeast plasma membrane."J Biol Chem 270(30): 18150-7.
Delahodde A, Delaveau T and Jacq C (1995). "Positive autoregulation of theyeast transcription factor Pdr3p, which is involved in control of drug resistance."Mol Cell Biol 15(8): 4043-51.
DeRisi JL, Iyer VR and Brown PO (1997). "Exploring the metabolic and geneticcontrol of gene expression on a genomic scale." Science 278(5338): 680-6.
Doniger SW, Salomonis N, Dahlquist KD, Vranizan K, Lawlor SC and Conklin BR(2003). "MAPPFinder: using Gene Ontology and GenMAPP to create a globalgene-expression profile from microarray data." Genome Biol 4(1): R7.
Dudoit Y, Yang YH, Callow MJ and Speed T (2000). Statistical methods foridentifying differentially expressed genes in replicated cDNA microarrayexperiments. Technical Report 578, Department of Statistics. UC Berkeley, CA.
Eisen MB, Spellman PT, Brown PO and Botstein D (1998). "Cluster analysis anddisplay of genome-wide expression patterns." Proc Natl Acad Sci U S A 95(25):14863-8.
Finkelstein D, Ewing R, Gollub J, Sterky F, Cherry JM and Somerville S (2002)."Microarray data quality analysis: lessons from the AFGC project. ArabidopsisFunctional Genomics Consortium." Plant Mol Biol 48(1-2): 119-31.
Fleischmann RD, Adams MD, White O, Clayton RA, et al. (1995). "Whole-genome random sequencing and assembly of Haemophilus influenzae Rd."Science 269(5223): 496-512.
Gasch AP, Spellman PT, Kao CM, Carmel-Harel O, Eisen MB, Storz G, BotsteinD and Brown PO (2000). "Genomic expression programs in the response ofyeast cells to environmental changes." Mol Biol Cell 11(12): 4241-57.
93
rOi-LLYWI*l.�-·iL-*Lj��-r ... r·L(11(1·--- -·· YL-YIYUI·II-·Y�UU.-� · YII_ YI� -LI- -- ·-- YUW··.WIWUli-I.�·_iJ�il�--·CU�-*IILY···· �···WIL.^·YCUlr�YUY· � · 1_ · _Yiil·Y_·_y__·__�y·_%�Y·IL·I-

Goffeau A, Barrell BG, Bussey H, Davis RW, et al. (1996). "Life with 6000genes." Science 274(5287): 546, 563-7.
Holstege FC, Jennings EG, Wyrick JJ, Lee TI, Hengartner CJ, Green MR, GolubTR, Lander ES and Young RA (1998). "Dissecting the regulatory circuitry of aeukaryotic genome." Cell 95(5): 717-28.
Hughes TR, Marton MJ, Jones AR, Roberts CJ, et al. (2000). "Functionaldiscovery via a compendium of expression profiles." Cell 102(1): 109-26.
Ideker T, Thorsson V, Ranish JA, Christmas R, et al. (2001). "Integrated genomicand proteomic analyses of a systematically perturbed metabolic network."Science 292(5518): 929-34.
Ideker T, Thorsson V, Siegel AF and Hood LE (2000). "Testing for differentially-expressed genes by maximum-likelihood analysis of microarray data." J ComputBiol 7(6): 805-17.
Kellis M, Patterson N, Endrizzi M, Birren B and Lander ES (2003). "Sequencingand comparison of yeast species to identify genes and regulatory elements."Nature 423(6937): 241-54.
Lee PD, Sladek R, Greenwood CM and Hudson TJ (2002a). "Control genes andvariability: absence of ubiquitous reference transcripts in diverse mammalianexpression studies." Genome Res 12(2): 292-7.
Lee TI, Rinaldi NJ, Robert F, Odom DT, et al. (2002b). "Transcriptional regulatorynetworks in Saccharomyces cerevisiae." Science 298(5594): 799-804.
Leung YF and Cavalieri D (2003). "Fundamentals of cDNA microarray dataanalysis." Trends Genet 19(11): 649-59.
Milo R, Shen-Orr S, Itzkovitz S, Kashtan N, Chklovskii D and Alon U (2002)."Network motifs: simple building blocks of complex networks." Science298(5594): 824-7.
Mootha VK, Lindgren CM, Eriksson KF, Subramanian A, et al. (2003). "PGC-lalpha-responsive genes involved in oxidative phosphorylation are coordinatelydownregulated in human diabetes." Nat Genet 34(3): 267-73.
Moqtaderi Z and Struhl K (2004). "Genome-wide occupancy profile of the RNApolymerase III machinery in Saccharomyces cerevisiae reveals loci withincomplete transcription complexes." Mol Cell Biol 24(10): 4118-27.
Mukherjee S, Berger MF, Jona G, Wang XS, Muzzey D, Snyder M, Young RAand Bulyk ML (2004). "Rapid analysis of the DNA binding specificities oftranscription factors with DNA microarrays." Nat Genet.
94

Natarajan K, Meyer MR, Jackson BM, Slade D, Roberts C, Hinnebusch AG andMarton MJ (2001). "Transcriptional profiling shows that Gcn4p is a masterregulator of gene expression during amino acid starvation in yeast." Mol Cell Biol21(13): 4347-68.
Newton MA, Kendziorski CM, Richmond CS, Blattner FR and Tsui KW (2001)."On differential variability of expression ratios: improving statistical inferenceabout gene expression changes from microarray data." J Comput Biol 8(1): 37-52.
Ooi SL, Shoemaker DD and Boeke JD (2001). "A DNA microarray-based geneticscreen for nonhomologous end-joining mutants in Saccharomyces cerevisiae."Science 294(5551): 2552-6.
Pan W (2002). "A comparative review of statistical methods for discoveringdifferentially expressed genes in replicated microarray experiments."Bioinformatics 18(4): 546-54.
Parsons AB, Brost RL, Ding H, Li Z, et aL. (2004). "Integration of chemical-geneticand genetic interaction data links bioactive compounds to cellular targetpathways." Nat Biotechnol 22(1): 62-9.
Petri A, Fleckner J and Matthiessen MW (2004). "Array-A-Lizer: a serial DNAmicroarray quality analyzer." BMC Bioinformatics 5(1): 12.
Quackenbush J (2002). "Microarray data normalization and transformation." NatGenet 32 Suppl: 496-501.
Raitt DC, Johnson AL, Erkine AM, Makino K, Morgan B, Gross DS and JohnstonLH (2000). "The Skn7 response regulator of Saccharomyces cerevisiae interactswith Hsfl in vivo and is required for the induction of heat shock genes byoxidative stress." Mol Biol Cell 11(7): 2335-47.
Ren B, Robert F, Wyrick JJ, Aparicio O, et al. (2000). "Genome-wide location andfunction of DNA binding proteins." Science 290(5500): 2306-9.
Richmond CS, Glasner JD, Mau R, Jin H and Blattner FR (1999). "Genome-wideexpression profiling in Escherichia coli K-12." Nucleic Acids Res 27(19): 3821-35.
Robinson MD, Grigull J, Mohammad N and Hughes TR (2002). "FunSpec: aweb-based cluster interpreter for yeast." BMC Bioinformatics 3(1): 35.
Savonet V, Maenhaut C, Miot F and Pirson I (1997). "Pitfalls in the use of several"housekeeping" genes as standards for quantitation of mRNA: the example ofthyroid cells." Anal Biochem 247(1): 165-7.
95
--·....... - -... ... ..... -..·. ·.. ~··;·.-.·. _,.·· .·I-··-_ I- _~~r.ru-·.r··~··L LI __U III~·.-Y U Y-U --· L·W·

Schuchhardt J, Beule D, Malik A, Wolski E, Eickhoff H, Lehrach H and Herzel H(2000). "Normalization strategies for cDNA microarrays." Nucleic Acids Res28(10): E47.
Shearstone JR, Allaire NE, Getman ME and Perrin S (2002). "Nondestructivequality control for microarray production." Biotechniques 32(5): 1051-2, 1054,1056-7.
Shen-Orr SS, Milo R, Mangan S and Alon U (2002). "Network motifs in thetranscriptional regulation network of Escherichia coli." Nat Genet 31(1): 64-8.
Simon I, Barnett J, Hannett N, Harbison CT, et al. (2001). "Serial regulation oftranscriptional regulators in the yeast cell cycle." Cell 106(6): 697-708.
Smith JJ, Marelli M, Christmas RH, Vizeacoumar FJ, et al. (2002)."Transcriptome profiling to identify genes involved in peroxisome assembly andfunction." J Cell Biol 158(2): 259-71.
Smyth GK and Speed T (2003). "Normalization of cDNA microarray data."Methods 31(4): 265-73.
Spellman PT, Sherlock G, Zhang MQ, lyer VR, Anders K, Eisen MB, Brown PO,Botstein D and Futcher B (1998). "Comprehensive identification of cell cycle-regulated genes of the yeast Saccharomyces cerevisiae by microarrayhybridization." Mol Biol Cell 9(12): 3273-97.
Sudarsanam P, lyer VR, Brown PO and Winston F (2000). "Whole-genomeexpression analysis of snf/swi mutants of Saccharomyces cerevisiae." Proc NatlAcad Sci U S A 97(7): 3364-9.
Tegner J, Yeung MK, Hasty J and Collins JJ (2003). "Reverse engineering genenetworks: integrating genetic perturbations with dynamical modeling." Proc NatlAcad Sci U S A 100(10): 5944-9.
Treger JM, Schmitt AP, Simon JR and McEntee K (1998). "Transcriptional factormutations reveal regulatory complexities of heat shock and newly identifiedstress genes in Saccharomyces cerevisiae." J Biol Chem 273(41): 26875-9.
Tseng GC, Oh MK, Rohlin L, Liao JC and Wong WH (2001). "Issues in cDNAmicroarray analysis: quality filtering, channel normalization, models of variationsand assessment of gene effects." Nucleic Acids Res 29(12): 2549-57.
Tusher VG, Tibshirani R and Chu G (2001). "Significance analysis of microarraysapplied to the ionizing radiation response." Proc Natl Acad Sci U S A 98(9):5116-21.
Wang S and Ethier S (2004). "A generalized likelihood ratio test to identifydifferentially expressed genes from microarray data." Bioinformatics 20(1): 100-4.
96

Wang X, Ghosh S and Guo SW (2001). "Quantitative quality control in microarrayimage processing and data acquisition." Nucleic Acids Res 29(15): E75-5.
Wang X, Hessner MJ, Wu Y, Pati N and Ghosh S (2003). "Quantitative qualitycontrol in microarray experiments and the application in data filtering,normalization and false positive rate prediction." Bioinformatics 19(11): 1341-7.
Wen X, Fuhrman S, Michaels GS, Carr DB, Smith S, Barker JL and Somogyi R(1998). "Large-scale temporal gene expression mapping of central nervoussystem development." Proc Natl Acad Sci U S A 95(1): 334-9.
Wilson DL, Buckley MJ, Helliwell CA and Wilson IW (2003). "New normalizationmethods for cDNA microarray data." Bioinformatics 19(11): 1325-32.
Wolfger H, Mahe Y, Parle-McDermott A, Delahodde A and Kuchler K (1997)."The yeast ATP binding cassette (ABC) protein genes PDR10 and PDR15 arenovel targets for the Pdrl and Pdr3 transcriptional regulators." FEBS Lett 418(3):269-74.
Wu LF, Hughes TR, Davierwala AP, Robinson MD, Stoughton R and AltschulerSJ (2002). "Large-scale prediction of Saccharomyces cerevisiae gene functionusing overlapping transcriptional clusters." Nat Genet 31(3): 255-65.
Wyrick JJ, Holstege FC, Jennings EG, Causton HC, Shore D, Grunstein M,Lander ES and Young RA (1999). "Chromosomal landscape of nucleosome-dependent gene expression and silencing in yeast." Nature 402(6760): 418-21.
Yang IV, Chen E, Hasseman JP, Liang W, et al. (2002a). "Within the fold:assessing differential expression measures and reproducibility in microarrayassays." Genome Biol 3(11): research0062.
Yang YH, Dudoit S, Luu P, Lin DM, Peng V, Ngai J and Speed TP (2002b)."Normalization for cDNA microarray data: a robust composite method addressingsingle and multiple slide systematic variation." Nucleic Acids Res 30(4): el 5.
Yu X and Wolfinger R (2004). A mixed model approach to identify yeasttranscription regulatory motifs via microarray experiments, personalcommunication.
Zeitlinger J, Simon I, Harbison CT, Hannett NM, Volkert TL, Fink GR and YoungRA (2003). "Program-specific distribution of a transcription factor dependent onpartner transcription factor and MAPK signaling." Cell 113(3): 395-404.
97

Chapter 3
Transcriptional Regulatory Networks in Saccharomyces cerevisiae
Published as: Lee TI, Rinaldi NJ, Robert F, Odom DT, Bar-Joseph Z, GerberGK, Hannett NM, Harbison CT, Thompson CM, Simon I, Zeitlinger J, JenningsEG, Murray HL, Gordon DB, Ren B, Wyrick JJ, Tagne JB, Volkert TL, FraenkelE, Gifford DK and Young RA (2002). "Transcriptional regulatory networks inSaccharomyces cerevisiae." Science 298(5594): 799-804.
98
· · · · · ·C- ----· · ·- -····· · · · · ·- · ·- ·--· · -- · · --- · ·· · · · ·- ·-· ·.-r-r··�-�··--··· - -·'·l�·--�U\-LUI···-·Ily·····Li··*WLYYI-

Summary
We have determined how most of the transcriptional regulators encoded in
the eukaryote Saccharomyces cerevisiae associate with genes across the
genome in living cells. Just as maps of metabolic networks describe the potential
pathways that may be used by a cell to accomplish, metabolic processes, this
network of regulator-gene interactions describes potential pathways yeast cells
can use to regulate global gene expression programs. We use this information to
identify network motifs, the simplest units of network architecture, and
demonstrate that an automated process can use motifs to assemble a
transcriptional regulatory network structure. Our results reveal that eukaryotic
cellular functions are highly connected through networks of transcriptional
regulators that regulate other transcriptional regulators.
Introduction
Genome sequences specify the gene expression programs that produce
living cells, but how the cell controls global gene expression programs is far from
understood. Each cell is the product of specific gene expression programs
involving regulated transcription of thousands of genes. These transcriptional
programs are modified as cells progress through the cell cycle, in response to
changes in environment, and during organismal development (DeRisi et al. 1997;
Cho et al. 1998; Spellman et al. 1998; Gasch et al. 2000; Causton et al. 2001).
Gene expression programs depend on recognition of specific promoter
sequences by transcriptional regulatory proteins (Lee and Young 2000; Garvie
99

and Wolberger 2001; Orphanides and Reinberg 2002; Ptashne and Gann 2002).
Because these regulatory proteins recruit and regulate chromatin modifying
complexes and components of the transcription apparatus, knowledge of the
sites bound by all the transcriptional regulators encoded in a genome can provide
the information necessary to nucleate models for transcriptional regulatory
networks. With the availability of complete genome sequences and development
of a method for genome-wide binding analysis (also known as genome-wide
location analysis), investigators can identify the set of target genes bound in vivo
by each of the transcriptional regulators that are encoded in a cell's genome.
This approach has been used to identify the genomic sites bound by nearly a
dozen regulators of transcription (Ren et al. 2000; lyer et al. 2001; Lieb et al.
2001; Simon et al. 2001) and several regulators of DNA synthesis (Wyrick et al.
2001) in yeast.
Experimental Design
We have used genome-wide location analysis to investigate how yeast
transcriptional regulators bind to promoter sequences across the genome (Fig.
1A). All 141 transcription factors listed in the Yeast Proteome Database
(Costanzo et al. 2000) and reported to have DNA-binding and transcriptional
activity were selected for study. Yeast strains were constructed so that each of
the transcription factors contained a myc epitope tag. To increase the likelihood
that tagged factors were expressed at physiologic levels, we introduced epitope
tag coding sequences into the genomic sequences encoding the COOH terminus
100
....... · I·--·-~·ijYY I ~·1··· · ·· · l··l IiiY~ LII ~ · · l··11y~y~nly··d Y1~·

A. Systematic Genome-wide Location Analysis of Regulators B. Influence of P-value Cutoff
Regulator Tag
106 strains, eachwith a tagged
regulator
Chromatin IP to enrichpromoters bound
by regulator in vivo
p-value 0.0535,345 interactions
p-value 0.0112,028 interactions
p-value 0.0058,180 interactions
p-value 0.0013,979 interactions
Microarray to identifypromoters bound
by regulator in vivo
Figure 1

Figure 1. Systematic genome-wide location analysis for yeast transcription
regulators.
(A) Methodology. Yeast transcriptional regulators were tagged by introducing the
coding sequence for a c-myc epitope tag into the normal genomic locus for each
regulator. Of the yeast strains constructed in this fashion, 106 contained a single
epitope-tagged regulator whose expression could be detected in rich growth
conditions. Chromatin immunoprecipitation (ChlIP) was performed on each of
these 106 strains. Promoter regions enriched through the ChIP procedure were
identified by hybridization to microarrays containing a genome-wide set of yeast
promoter regions.
(B) Effect of p-value threshold. The sum of all regulator-promoter region
interactions is displayed as a function of varying p-value thresholds applied to the
entire location dataset for the 106 regulators. More stringent p-values reduce the
number of interactions reported, but decrease the likelihood of false positive
results.
102

of each regulator as described (Knop et al. 1999). We confirmed appropriate
insertion of the tag and expression of the tagged protein by polymerase chain
reaction and immunoblot analysis. Introduction of an epitope tag might be
expected to affect the function of some transcriptional regulators; for 17 of the
141 factors, we were not able to obtain viable tagged cells, despite three
attempts to tag each regulator. Not all the transcriptional regulators were
expected to be expressed at detectable levels when yeast cells were grown in
rich medium, but immunoblot analysis showed that 106 of the 124 tagged
regulator proteins could be detected under these conditions.
We performed a genome-wide location analysis experiment (Ren et al.
2000) for each of the 106 yeast strains that expressed epitope-tagged
regulators.' Each tagged strain was grown in three independent cultures in rich
medium (yeast extract, peptone, dextrose). Genome-wide location data were
subjected to quality control filters and normalized, and the ratio of
immunoprecipitated to control DNA was determined for each array spot. We
calculated a confidence value (P value) for each spot from each array by using
an error model (Hughes et al. 2000). The data for each of the three samples in
an experiment were combined by a weighted average method (Hughes et al.
2000); each ratio was weighted by P value and then averaged. Final P values for
these combined ratios were then calculated.2
Given the properties of the biological system studied here (cell
populations, DNA-binding factors capable of binding to both specific and non-
Additional information is available at the authors' Web site:http://web.wi.mit.edu/young/regulator network. See supporting data on Science online.2 lbid.
103
·r .. ~., __....~- I·~.~...·r,,· .. · - · ' · -·'·- ·· .,--· 1._.....___._r - -... ..... -.. -- ___. ._--··-··---I -·--··-- · ·- __·I...... - · 1- .. -.- · ·- ·....._._Y ···.·1·1·· -.-·-·I-·- -·- -. - -I

specific sequences) and the expectation of noise in microarray-based data, it
was important to use error models to obtain a probabilistic assessment of
regulator location data. The total number of protein-DNA interactions in the
location analysis dataset, using a range of P value thresholds, is shown in Fig.
1 B. We selected specific P value thresholds to facilitate discussion of a subset of
the data at a high confidence level, but note that this artificially imposes a "bound
or not bound" binary decision for each protein-DNA interaction.
We will generally describe results obtained at a P value threshold of 0.001
because our analysis indicates that this threshold maximizes inclusion of
legitimate regulator-DNA interactions and minimizes false positives. Various
experimental and analytical methods indicate that the frequency of false positives
in the genome-wide location data at the 0.001 threshold is 6% to 10%. 3 For
example, conventional, gene-specific chromatin immunoprecipitation
experiments have confirmed 93 of 99 binding interactions (involving 29 different
regulators) that were identified by location analysis data at a threshold P value of
0.001. Use of a high-confidence threshold should underestimate the regulator-
DNA interactions that actually occur in these cells. We estimate that about one-
third of the actual regulator-DNA interactions in cells are not reported at the
0.001 threshold. 4
104
3Ibid.4 lbid.
Regulator Density
We observed nearly 4000 interactions between regulators and promoter
regions at a P value threshold of 0.001. The promoter regions of 2343 of 6270
yeast genes (37%) were bound by one or more of the 106 transcriptional
regulators in yeast cells grown in rich medium. Many yeast promoters were
bound by multiple transcriptional regulators (Fig. 2A), a feature previously
associated with gene regulation in higher eukaryotes (Lemon and Tjian 2000;
Merika and Thanos 2001), suggesting that yeast genes are also frequently
regulated through combinations of regulators. More than one-third of the
promoter regions that are bound by regulators were bound by two or more
regulators (P value threshold = 0.001), and, relative to the expected distribution
from randomized data, a disproportionately high number of promoter regions
were bound by four or more regulators. Because of the stringency of the P value
threshold, we expect that this represents an underestimate of regulator density.
The number of different promoter regions bound by each regulator in cells
grown in rich medium ranged from 0 to 181 (P value threshold = 0.001), with an
average of 38 promoter regions per regulator (Fig. 2B). The regulator Abfl bound
the largest number (181) of promoter regions. Regulators that should be active
under growth conditions other than yeast extract, peptone and dextrose were
typically found, as expected, to bind the smallest number of promoter regions.
For example, Thi2, which activates transcription of thiamine biosynthesis genes
under conditions of thiamine starvation (Kawasaki et al. 1990; Nishimura et al.
1992), was among the regulators that bound the smallest number (3) of
105
· ~ .~~ur~-·l- ·· ·--- ·- ~U- l u~~i-ur~~ui·.~ ·· - rr-,.~~ ;;s~· r ·l~·-r-·~- -· r · ;~

Figure 2
A. Number of Regulators Bound Per Promoter Region
c0n'
o
oE
z
10000
1000
100
i c
B. Number of Promoter Regions Bound Per Regulator
40
3o0C 30
CDan
a).-0Ez
20
10
1 2 3 4 5 6 7 8 9 10 11 12
Number of Regulators Bound
III .1- 21- 41- 61- 81- 101- 121-20 40 60 80 100 120 140 141+
Number of Promoter Regions Bound
-__J
Figure 2. Genome-wide distribution of transcriptional regulators.
(A) A plot of the number of regulators bound per promoter region. The
distribution for the actual location data (red circles) is shown alongside the
distribution expected from the same set of p-values randomly assigned among
regulators and intergenic regions (white circles). At a p-value threshold of 0.001,
significantly more intergenic regions bind 4 or more regulators than expected by
chance.
(B) Distribution of the number of promoter regions bound per regulator.
107
�u��rrur�u.,......�;�,lr·lll- --l-·.--Y·- ------ · ·- · ·- i�O··CLLIP���IYI);*II·Y·l- ·--L�-·-···WUYlli:I···)lr··IYY-I-�-�-. .j-·-�-. ��__y�;;i·l··_��_^_��·IOI-IIIII:-·ZIC�·L �·-IL·L--LC&

promoters. Identification of a set of promoter regions that are bound by specific
regulators allowed us to predict sequence motifs that are bound by these
regulators. 5
Network Motifs
The simplest units of commonly used transcriptional regulatory network
architecture, or network motifs, provide specific regulatory capacities such as
positive and negative feedback loops. We used the genome-wide location data
to identify six regulatory network motifs: autoregulation, multi-component loops,
feedforward loops, single input, multi-input and regulator chains (Fig. 3). These
motifs suggest models for regulatory mechanisms that can be tested.
Descriptions of the algorithms used to identify motifs and a complete compilation
of motifs can be obtained at http://web.wi.mit.edu/young/regulator_network.
An autoregulation motif consists of a regulator that binds to the promoter
region of its own gene. We identified 10 autoregulation motifs with genome-wide
location data for the 106 regulators (P value threshold = 0.001), which suggests
that about 10% of yeast genes encoding regulators are autoregulated. This
percentage does not change substantially at less stringent P value thresholds. In
contrast, studies of Escherichia coli genetic regulatory networks indicate that
most (52% to 74%) prokaryotic genes encoding transcriptional regulators are
autoregulated (Thieffry et al. 1998; Shen-Orr et al. 2002).
Autoregulation is thought to provide several selective growth advantages,
including reduced response time to environmental stimuli, decreased biosynthetic
5 Ibid.
108
L.Y.~'~~~~L~Y~YY.~' ~I·~:I··-i·LL~d~Lii~L 11·;·YiYYWI IL· ~ · L·;~.1Jyt;Z+LLY-·I~·IY·IY··Y~llllL · il·~YWYY-L·-_.;-~~·iM

Figure 3
Examples of Network Motifs in the Yeast Regulatory Network
Autoregulation
- - - ,
+ ,
1 1_1
Multi-Component Loop
A"*z:x1*, * t111
1-V jD
Feedforward Loop
!C i
44%
En
Single Input Motif Multi-Input Motif
Regulator Chain
e-- , -. 1 - - s
�� F"1 lrnW"l Isb��

Figure 3. Examples of network motifs in the yeast regulatory network.
Regulators are represented by blue circles, and gene promoters are represented
by red rectangles. Binding of a regulator to a promoter is indicated by a solid
arrow. Genes encoding regulators are linked to their respective regulators by
dashed arrows. For example, in the autoregulation motif, the Ste12 protein binds
to the STE12 gene, which is transcribed and translated into Ste12 protein.
These network motifs were uncovered by searching binding data with various
algorithms. For details on the algorithms used, and a full list of motifs found, see
http://web.wi.mit.edu/young/regulator_network.
110
c-i--_.uu uj·; Y~i-*·· ' - - EL

cost of regulation, and increased stability of gene expression (McAdams and
Arkin 1997; Thieffry et al. 1998; Becskei and Serrano 2000; Guelzim et al. 2002;
Shen-Orr et al. 2002). For example, upon exposure to mating pheromone, the
concentrations of the pheromone-responsive Ste12 transcriptional regulator
rapidly increase because Ste12 binds to and up-regulates its own gene (Dolan
and Fields 1990; Ren et al. 2000) (Fig. 3). The consequent increase in Ste12
protein leads to the binding of other genes required for the mating process (Ren
et al. 2000).
A multi-component loop motif consists of a regulatory circuit whose
closure involves two or more factors (Fig. 3). We observed three multi-
component loop motifs in the location data for 106 regulators (P value threshold
= 0.001). The closed-loop structure provides the capacity for feedback control
and offers the potential to produce bistable systems that can switch between two
alternative states (Ferrell 2002). The multi-component loop motif has yet to be
identified in bacterial genetic networks (Thieffry et al. 1998; Shen-Orr et al.
2002).
Feedforward loop motifs contain a regulator that controls a second
regulator, and have the additional feature that both regulators bind a common
target gene (Fig. 3). The regulator location data reveal that feedforward loop
architecture has been highly favored during the evolution of transcriptional
regulatory networks in yeast. We found that 39 regulators are involved in 49
feedforward loops potentially controlling 240 genes in the yeast network (about
10% of genes that are bound in the genome-wide location dataset).
111

In principle, a feedforward loop can provide several features to a
regulatory circuit. The feedforward loop may act as a switch that is designed to
be sensitive to sustained rather than transient inputs (Shen-Orr et al. 2002).
Feedforward loops have the potential to provide temporal control of a process
because expression of the ultimate target gene may depend on the accumulation
of adequate levels of the master and secondary regulators. Feedforward loops
may provide a form of multistep ultrasensitivity (Goldbeter and Koshland 1984)
as small changes in the level or activity of the master regulator at the top of the
loop might be amplified at the ultimate target gene because of the combined
action of the master regulator and a second regulator that is under the control of
the master regulator.
Single-input motifs contain a single regulator that binds a set of genes
under a specific condition. Single-input motifs are potentially useful for
coordinating a discrete unit of biological function such as a set of genes that code
for the subunits of a biosynthetic apparatus or enzymes of a metabolic pathway.
For example, several genes of the leucine biosynthetic pathway are controlled by
the Leu3 transcriptional regulator (Fig. 3).
Multi-input motifs consist of a set of regulators that bind together to a set
of genes. We found 295 combinations of two or more regulators that could bind
to a common set of promoter regions. This motif offers the potential for
coordination of gene expression across a wide variety of growth conditions. For
example, each of the regulators bound to a set of genes can be responsible for
regulating those genes in response to a unique input. In this manner, two
112

different regulators responding to two different inputs would allow coordinate
expression of the set of genes under these two different conditions.
Regulator chain motifs consist of chains of three or more regulators in
which one regulator binds the promoter for a second regulator, the second binds
the promoter for a third regulator, and so forth (Fig. 3). This network motif is
observed frequently in the location data for yeast regulators; we found 188
regulator chain motifs, which varied in size from 3 to 10 regulators. The chain
represents the simplest circuit logic for ordering transcriptional events in a
temporal sequence. The most straightforward form of this appears in the
regulatory circuit of the cell cycle where regulators functioning at one stage of the
cell cycle regulate the expression of factors required for entry into the next stage
of the cell cycle (Simon et al. 2001).
The regulatory motifs described above suggest models for gene regulatory
mechanisms whose predictions can be tested with experimental data. One
regulatory motif that caught our attention involved ribosomal protein genes;
ribosomes are important protein biosynthetic machines, but transcriptional
regulation of ribosomal protein genes is not well understood. Fhll, a protein
whose function was not previously known, forms a single-input regulatory motif
consisting of essentially all ribosomal protein genes, but little else. No other
regulator studied here exhibited this behavior. This predicts that loss of Fhll1
function should have a profound effect on ribosome biosynthesis if no other
regulators are capable of taking its place. Indeed, a mutation in Fhll causes
severe defects in ribosome biosynthesis (Hermann-Le Denmat et al. 1994), an
113

observation that was difficult to interpret previously in the absence of the
genome-wide location data. Many ribosomal protein genes are also components
of a multi-input motif involving Fhll1 and additional regulators (Fig. 3), which
suggests that expression of these genes may be coordinated by multiple
regulators under various growth conditions. This model and others suggested by
regulatory motifs can be addressed with future experiments.
Assembling Motifs into Network Structures
We assume that regulatory network motifs form building blocks that can
be combined into larger network structures. An algorithm was developed that
explores all the genome-wide location data together with the expression data
from over 500 expression experiments to identify groups of genes that are both
coordinately bound and coordinately expressed. In brief, the algorithm begins by
defining a set of genes, G, that are bound by a set of regulators, S, with a P
value threshold of 0.001. We find a large subset of genes in G that are similarly
expressed over the entire set of expression data, and we use those genes to
establish a core expression profile. Genes are then dropped from G if their
expression profile is significantly different from this core profile. The remainder of
the genome is scanned for genes with expression profiles that are similar to the
core profile. Genes with a significant match in expression profiles are then
examined to see if the set of regulators S are bound. At this step, the probability
of a gene being bound by the set of regulators is used instead of the individual
probabilities of that gene being bound by each of the individual regulators.
114

Because we are assaying the combined probability of the set of regulators being
bound, and are relying on similarity of expression patterns, we can relax the P
value for individual binding events and thus recapture information that is lost
because of the use of an arbitrary P value threshold. The process is repeated
until all combinations of genes bound by regulators have been considered.
Additional details of the algorithm are available upon request. The resulting sets
of regulators and genes are essentially multi-input motifs refined for common
expression (MIM-CE). We expect these to be robust examples of coordinate
binding and expression and therefore useful for nucleating network models.
We used the refined motifs to construct a network structure for the yeast
cell cycle by an automatic process that requires no prior knowledge of the
regulators that control transcription during the cell cycle. We selected the cell
cycle regulatory network because of the importance of this biological process, the
availability of extensive genome-wide expression data for the cell cycle (Cho et
al. 1998; Spellman et al. 1998) and the extensive literature that can be used to
explore features of a network model. Our goal was to determine whether the
computational approach would construct the regulatory logic of cell cycle from
the location and expression data without previous knowledge of the regulators
involved. We reasoned that MIM-CEs that are significantly enriched in genes
whose expression oscillates through the cell cycle (Spellman et al. 1998) would
identify the regulators that control these genes. We identified 11 regulators with
this approach. To construct the cell cycle network, we generated a new set of
115

MIM-CEs by using only the 11 regulators and the cell cycle expression data
(Spellman et al. 1998).
To produce a cell cycle transcriptional regulatory network model, we
aligned the MIM-CEs around the cell cycle on the basis of peak expression of the
genes in the group by means of an algorithm described previously (Bar-Joseph
et al. 2002) (Fig. 4). Three features of the resulting network model are notable.
First, the computational approach correctly assigned all the regulators to stages
of the cell cycle where they were shown to function in previous studies (Simon et
al. 2001). Second, two regulators that have been implicated in cell cycle control
but whose functions were ill-defined (Morgan et al. 1995; Bouquin et al. 1999; Ho
et al. 1999), could be assigned within the network on the basis of direct binding
data. Third, and most important, reconstruction of the regulatory architecture
was automatic and required no prior knowledge of the regulators that control
transcription during the cell cycle. This approach should represent a general
method for constructing other regulatory networks.
Coordination of Cellular Processes
Transcriptional regulators were often bound to genes encoding other
transcriptional regulators (Fig. 5). For example, there were many instances in
which transcriptional regulators within a functional category (for example, cell
cycle) bound to genes encoding regulators within the same category. We have
noted that cell cycle regulators bound to other cell cycle regulators (Simon et al.
2001), and this phenomenon was also apparent among transcriptional regulators
116

Figure 4
A Model for the Yeast Cell Cycle Transcriptional Regulatory Network

Figure 4. Model for the yeast cell cycle transcriptional regulatory network.
A transcriptional regulatory network for the yeast cell cycle was derived from a
combination of binding and expression data as described in the text. Yeast cell
morphologies are depicted during the various stages of the cell cycle. Each blue
box represents a set of genes that are bound by a common set of regulators and
co-expressed throughout the cell cycle. The text inside each blue box identifies
the common set of regulators that bind to the set of genes represented by the
box. Each box is positioned in the cell cycle according to the time of peak
expression levels for the genes represented by the box. Regulators, represented
by ovals, are connected to the sets of genes they regulate by solid lines. The arc
associated with each regulator effectively defines the period of activity for the
regulator. Dashed lines indicate that a gene in the box encodes a regulator
found in the outer rings.
118

U)a)U)nC,,0L-C,,
ci
a)0
a0a)
a)U 0
1.eL-o
Ean
a)
E
oEUa)
I0c).
U)
0) c7 0o'-7~~~~~~~~~~~~~~~~~~~~~~~~~~~~~~
-F
cCD0a4a0C,)
3
mI-a)
0)
0)L-J
70a)
0)U)c00-
. _~~~~~~~~~~~~~~~~~~~~~~~~~~~~~~1
a)oQ
a)E0.5
w
c
ooU)
C
00
o
-z
zC
U)
0
i* C
Ua)0)(nC,)C L0-)>. o
U- 0L- m
('3 U-
zC,)U)
(na)
5cnC0MC-._0~
zCL
z0tzO
E
a)oa)
IC)a)
I
Figure 5
f
d-
L- IL
V
, IL-

Figure 5. Network of transcriptional regulators binding to genes encoding
other transcriptional regulators.
All 106 transcriptional regulators that were subjected to location analysis in rich
media are displayed in a circle, segregated into functional categories based on
the primary functions of their target genes (Cell Cycle in red, Development in
black, DNAIRNAIProtein Biosynthesis in tan, Environmental Response in green,
and Metabolism in blue). Lines with arrows depict binding of a regulator (0.001
p-value threshold) to the gene encoding another regulator. Circles with arrows
depict binding of a regulator to the promoter region of its own gene.
120

that fall into the metabolism and environmental response categories. For
example, the metabolic regulator Gcn4 bound to promoters for PUT3 and UGA3,
genes that encode transcriptional regulators for amino acid and other metabolic
functions. The stress response activator Yap6 bound to the gene encoding the
Roxl repressor, and vice versa, suggesting positive and negative feedback
loops.
We also found that multiple transcriptional regulators within each category
were able to bind to genes encoding regulators that are responsible for control of
other cellular processes. For example, the cell cycle activators bind to genes for
transcriptional regulators that play key roles in metabolism (GAT1, GAT3, NRG1,
SFL1); environmental responses (ROX1, YAP1, ZMS1); development (ASH1,
SOK2, MOT3); and DNA, RNA and protein biosynthesis (ABF1). These
observations are likely to explain, in part, how cells coordinate transcriptional
regulation of the cell cycle with other cellular processes. These connections are
generally consistent with previous experimental information about the
relationships between cellular processes. For example, the developmental
regulator Phdl has been shown to regulate genes involved in pseudohyphal
growth during certain nutrient stress conditions; we found that Phdl also binds to
genes that are key to regulation of general stress responses (MSN4, CUP9 and
ZMS1) and metabolism (HAP4).
These observations have several important implications. The control of
most, if not all, cellular processes is characterized by networks of transcriptional
regulators that regulate other regulators. It is also evident that the effects of
121

transcriptional regulator mutations on global gene expression as measured by
expression profiling (DeRisi et al. 1997; Chu et al. 1998; Jelinsky and Samson
1999; Madhani et al. 1999; Gasch et al. 2000; Hughes et al. 2000; Lopez and
Baker 2000; Lyons et al. 2000; Roberts et al. 2000; Shamji et al. 2000; Travers et
al. 2000; Causton et al. 2001; Epstein eta/. 2001; Natarajan et al. 2001; Devaux
et al. 2002) are as likely to reflect the effects of the network of regulators as they
are to identify the direct targets of a single regulator.
Significance of regulatory network information
This study identified network motifs that provide specific regulatory
capacities for yeast, revealing the regulatory strategies that were selected during
evolution for this eukaryote. These motifs can be used as building blocks to
construct large network structures through an automated approach that
combines genome-wide location and expression data in the absence of prior
knowledge of regulator functions. The network of transcriptional regulators that
control other transcriptional regulators is highly connected, suggesting that the
network substructures for cellular functions such as cell cycle and development
are themselves coordinated at a transcriptional level.
It is possible to envision mapping the regulatory networks that control
gene expression programs in considerable depth in yeast and in other living
cells. More complete understanding of transcriptional regulatory networks in
yeast will require knowledge of regulator binding sites under various growth
122

conditions6 and experimental testing of models that emerge from computational
analysis of regulator binding, gene expression and other information. The
approach described here can also be used to discover transcriptional regulatory
networks in higher eukaryotes. Knowledge of these networks will be important
for understanding human health and designing new strategies to combat
disease.
123
.

Acknowledgements
We thank J. Terragni, D. Pokholok and E. Kanin for experimental support.
We thank J. Liang for assistance with the supporting website. We thank R.
DeShaeis, T. Ideker and T. Jaakkola for helpful discussions. Supported by
fellowships from National Cancer Institute of Canada (F.R.), Human Frontier
Sceince Program (J.Z.), Sloan/DOE Program for Computational Molecular
Biology (D.O.), Program in Mathematics and Molecular Biology at Florida State
University and Burroughs Wellcome Fund Interfaces Program (Z.B.J.), Helen
Hay Whitney foundation (B.R.). Supported by grants from the National Institutes
of Health and Corning, Inc.
124

References
Bar-Joseph Z, Gerber GK, Gifford DK, Jaakkola TS and Simon I (2002). A newapproach to analyzing gene expression time series data. Sixth AnnualInternational Conference on Research in Computational Molecular Biology.
Becskei A and Serrano L (2000). "Engineering stability in gene networks byautoregulation." Nature 405(6786): 590-3.
Bouquin N, Johnson AL, Morgan BA and Johnston LH (1999). "Association of thecell cycle transcription factor Mbpl with the Skn7 response regulator in buddingyeast." Mol Biol Cell 10(10): 3389-400.
Causton HC, Ren B, Koh SS, Harbison CT, et al. (2001). "Remodeling of yeastgenome expression in response to environmental changes." Mol Biol Cell 12(2):323-37.
Cho RJ, Campbell MJ, Winzeler EA, Steinmetz L, et al. (1998). "A genome-widetranscriptional analysis of the mitotic cell cycle." Mol Cell 2(1): 65-73.
Chu S, DeRisi J, Eisen M, Mulholland J, Botstein D, Brown PO and Herskowitz I(1998). "The transcriptional program of sporulation in budding yeast." Science282(5389): 699-705.
Costanzo MC, Hogan JD, Cusick ME, Davis BP, et al. (2000). "The yeastproteome database (YPD) and Caenorhabditis elegans proteome database(WormPD): comprehensive resources for the organization and comparison ofmodel organism protein information." Nucleic Acids Res 28(1): 73-6.
DeRisi JL, lyer VR and Brown PO (1997). "Exploring the metabolic and geneticcontrol of gene expression on a genomic scale." Science 278(5338): 680-6.
Devaux F, Carvajal E, Moye-Rowley S and Jacq C (2002). "Genome-widestudies on the nuclear PDR3-controlled response to mitochondrial dysfunction inyeast." FEBS Lett 515(1-3): 25-8.
Dolan JW and Fields S (1990). "Overproduction of the yeast STE12 protein leadsto constitutive transcriptional induction." Genes Dev 4(4): 492-502.
Epstein CB, Waddle JA, Hale Wt, Dave V, Thornton J, Macatee TL, Garner HRand Butow RA (2001). "Genome-wide responses to mitochondrial dysfunction."Mol Biol Cell 12(2): 297-308.
Ferrell JE, Jr. (2002). "Self-perpetuating states in signal transduction: positivefeedback, double-negative feedback and bistability." Curr Opin Cell Biol 14(2):140-8.
125
Garvie CW and Wolberger C (2001). "Recognition of specific DNA sequences."Mol Cell 8(5): 937-46.
Gasch AP, Spellman PT, Kao CM, Carmel-Harel O, Eisen MB, Storz G, BotsteinD and Brown PO (2000). "Genomic expression programs in the response ofyeast cells to environmental changes." Mol Biol Cell 11(12): 4241-57.
Goldbeter A and Koshland DE, Jr. (1984). "Ultrasensitivity in biochemicalsystems controlled by covalent modification. Interplay between zero-order andmultistep effects." J Biol Chem 259(23): -14441-7.
Guelzim N, Bottani S, Bourgine P and Kepes F (2002). "Topological and causalstructure of the yeast transcriptional regulatory network." Nat Genet 31(1): 60-3.
Hermann-Le Denmat S, Werner M, Sentenac A and Thuriaux P (1994)."Suppression of yeast RNA polymerase III mutations by FHL1, a gene coding fora fork head protein involved in rRNA processing." Mol Cell Biol 14(5): 2905-13.
Ho Y, Costanzo M, Moore L, Kobayashi R and Andrews BJ (1999). "Regulationof transcription at the Saccharomyces cerevisiae start transition by Stbl, a Swi6-binding protein." Mol Cell Biol 19(8): 5267-78.
Hughes TR, Marton MJ, Jones AR, Roberts CJ, et al. (2000). "Functionaldiscovery via a compendium of expression profiles." Cell 102(1): 109-26.
lyer VR, Horak CE, Scafe CS, Botstein D, Snyder M and Brown PO (2001)."Genomic binding sites of the yeast cell-cycle transcription factors SBF andMBF." Nature 409(6819): 533-8.
Jelinsky SA and Samson LD (1999). "Global response of Saccharomycescerevisiae to an alkylating agent." Proc Natl Acad Sci U S A 96(4): 1486-91.
Kawasaki Y, Nosaka K, Kaneko Y, Nishimura H and Iwashima A (1990)."Regulation of thiamine biosynthesis in Saccharomyces cerevisiae." J Bacteriol172(10): 6145-7.
Knop M, Siegers K, Pereira G, Zachariae W, Winsor B, Nasmyth K and SchiebelE (1999). "Epitope tagging of yeast genes using a PCR-based strategy: moretags and improved practical routines." Yeast 15(10B): 963-72.
Lee TI and Young RA (2000). "Transcription of eukaryotic protein-coding genes."Annu Rev Genet 34: 77-137.
Lemon B and Tjian R (2000). "Orchestrated response: a symphony oftranscription factors for gene control." Genes Dev 14(20): 2551-69.
126

Lieb JD, Liu X, Botstein D and Brown PO (2001). "Promoter-specific binding ofRap1 revealed by genome-wide maps of protein-DNA association." Nat Genet28(4): 327-34.
Lopez MC and Baker HV (2000). "Understanding the growth phenotype of theyeast gcr1 mutant in terms of global genomic expression patterns." J Bacteriol182(17): 4970-8.
Lyons TJ, Gasch AP, Gaither LA, Botstein D, Brown PO and Eide DJ (2000)."Genome-wide characterization of the Zaplp zinc-responsive regulon in yeast."Proc Natl Acad Sci U S A 97(14): 7957-62.
Madhani HD, Galitski T, Lander ES and Fink GR (1999). "Effectors of adevelopmental mitogen-activated protein kinase cascade revealed by expressionsignatures of signaling mutants." Proc Natl Acad Sci U S A 96(22): 12530-5.
McAdams HH and Arkin A (1997). "Stochastic mechanisms in gene expression."Proc Natl Acad Sci U S A 94(3): 814-9.
Merika M and Thanos D (2001). "Enhanceosomes." Curr Opin Genet Dev 11(2):205-8.
Morgan BA, Bouquin N, Merrill GF and Johnston LH (1995). "A yeasttranscription factor bypassing the requirement for SBF and DSC1/MBF inbudding yeast has homology to bacterial signal transduction proteins." Embo J14(22): 5679-89.
Natarajan K, Meyer MR, Jackson BM, Slade D, Roberts C, Hinnebusch AG andMarton MJ (2001). "Transcriptional profiling shows that Gcn4p is a masterregulator of gene expression during amino acid starvation in yeast." Mol Cell Biol21(13): 4347-68.
Nishimura H, Kawasaki Y, Kaneko Y, Nosaka K and Iwashima A (1992). "Cloningand characteristics of a positive regulatory gene, THI2 (PHO6), of thiaminbiosynthesis in Saccharomyces cerevisiae." FEBS Left 297(1-2): 155-8.
Orphanides G and Reinberg D (2002). "A unified theory of gene expression." Cell108(4): 439-51.
Ptashne M and Gann A (2002). Genes and Signals. Cold Spring Harbor, ColdSpring Harbor Laboratories Press.
Ren B, Robert F, Wyrick JJ, Aparicio O, et al. (2000). "Genome-wide location andfunction of DNA binding proteins." Science 290(5500): 2306-9.
Roberts CJ, Nelson B, Marton MJ, Stoughton R, et 'al. (2000). "Signaling andcircuitry of multiple MAPK pathways revealed by a matrix of global geneexpression profiles." Science 287(5454): 873-80.
127
Shamji AF, Kuruvilla FG and Schreiber SL (2000). "Partitioning the transcriptionalprogram induced by rapamycin among the effectors of the Tor proteins." CurrBiol 10(24): 1574-81.
Shen-Orr SS, Milo R, Mangan S and Alon U (2002). "Network motifs in thetranscriptional regulation network of Escherichia coli." Nat Genet 31(1): 64-8.
Simon I, Barnett J, Hannett N, Harbison CT, et al. (2001). "Serial regulation oftranscriptional regulators in the yeast cell cycle." Cell 106(6): 697-708.
Spellman PT, Sherlock G, Zhang MQ, lyer VR, Anders K, Eisen MB, Brown PO,Botstein D and Futcher B (1998). "Comprehensive identification of cell cycle-regulated genes of the yeast Saccharomyces cerevisiae by microarrayhybridization." Mol Biol Cell 9(12): 3273-97.
Thieffry D, Huerta AM, Perez-Rueda E and Collado-Vides J (1998). "Fromspecific gene regulation to genomic networks: a global analysis of transcriptionalregulation in Escherichia coli." Bioessavs 20(5): 433-40.
Travers KJ, Patil CK, Wodicka L, Lockhart DJ, Weissman JS and Walter P(2000). "Functional and genomic analyses reveal an essential coordinationbetween the unfolded protein response and ER-associated degradation." Cell101(3): 249-58.
Wyrick JJ, Aparicio JG, Chen T, Barnett JD, Jennings EG, Young RA, Bell SPand Aparicio OM (2001). "Genome-wide distribution of ORC and MCM proteins inS. cerevisiae: high-resolution mapping of replication origins." Science 294(5550):2357-60.
128
'·--···- L-r··-·�·i···Y·-�-YLo-Y·-PII---·rw�UI··yI...... . I... ... .... ........... _- ....... -I-- ·U Yk-· IIr-_: .~··U·~-Y1····r·· _·_-·~· c- " -·__·"---~-· I·

Chapter 4
Transcriptional Regulatory Code of a Eukaryotic Genome
Published as: Harbison CT, Gordon DB, Lee TI, Rinaldi NJ, Macisaac KD,Danford TW, Hannett N, Tagne JB, Reynolds DB, Yoo JY, Jennings EG,Zeitlinger J, Pokholok DK, Kellis M, Rolfe PA, Takusagawa KT, Lander ES,Gifford DK and Young RA (2004). "Transcriptional regulatory code of aeukaryotic genome." Nature. 431(7004): 99-104.
129
,.U.--... ~,~u~,;,. ,,~ur~~-rLYL·P-Li~ l~)Yi · WL··~*-·· i i~iiL·W1 -·--.-II *-I., I-·-i**YLIY·DL) ; l--- .- ~~~W(I1~YL~l~y

Summary
DNA-binding transcriptional regulators interpret the genome's regulatory code by
binding to specific sequences to induce or repress gene expression (Jacob and
Monod 1961). Comparative genomics has recently been used to identify potential
cis-regulatory sequences within the yeast genome on the basis of phylogenetic
conservation (Blanchette and Tompa 2003; Cliften et al. 2003; Kellis et al. 2003;
Wang and Stormo 2003; Pritsker et al. 2004), but this information alone does not
reveal if or when transcriptional regulators occupy these binding sites. We have
constructed an initial version of yeast's transcriptional regulatory code by
mapping the sequence elements that are bound by regulators under various
conditions and that are conserved among Saccharomyces species. The
organization of regulatory elements in promoters and the environment-dependent
use of these elements by regulators are discussed. We find that environment-
specific use of regulatory elements predicts mechanistic models for the function
of a large population of yeast's transcriptional regulators.
130

We used genome-wide location analysis (Ren et al. 2000; lyer et al. 2001;
Lieb et aL. 2001; Lee et al. 2002) to determine the genomic occupancy of 203
DNA-binding transcriptional regulators in rich media conditions and, for 84 of
these regulators, in at least one of twelve other environmental conditions
(Supplementary Table 1, Supplementary Figure 1,
http://web.wi.mit.edu/young/regulatory_code). These 203 proteins are likely to
include nearly all of the DNA-binding transcriptional regulators encoded in the
yeast genome. Regulators were selected for profiling in an additional
environment if they were essential for growth in that environment or if there was
other evidence implicating them in regulation of gene expression in that
environment. The genome-wide location data identified 11,000 unique
interactions between regulators and promoter regions at high confidence (P '
0.001).
To identify the cis-regulatory sequences that likely serve as recognition
sites for transcriptional regulators, we merged information from genome-wide
location data, phylogenetically conserved sequences, and prior knowledge
(Figure 1A). We used six motif discovery methods (Bailey and Elkan 1995; Roth
et aL. 1998; Liu et al. 2002) to discover 68,279 DNA sequence motifs for the 147
regulators that bound more than ten probes (Supplementary Methods;
Supplementary Figure 2). From these motifs we derived the most likely specificity
for each regulator through clustering and stringent statistical tests. This motif
discovery process identified highly significant (P s 0.001) motifs for each of 116
regulators. We determined a single high-confidence motif for 65 of these
131

Figure 1
A
Phylogeneticconservation data
Other publishedevidence
Triplicate ChIP- ChlIP-2 ChlP-3
experiments I I. S. cerevisiae . .S. paradoxus . .S. mikatae ..S. bayanus . .
.ATCGCACGTGAT...
.ATTTCACATGAT...
.ATATCACGTGAC...
.CTTGCACGTGCC...
Identification ofC ACTG bidtranscription factorC ACG h e binding site specificitiesB
"Rediscovered" sequence specificities
Abfl -TCAC
Basl r&ACTC
Pho4 CACGTL
Rpn4
AQ-i
TTIGCCACc
Stel2 TGrsAAAC
"Discovered" sequence specificities
Phdl CP ' ,
Rdsl
Snt2 -G-C CTA-..c
Stb4 TC , C`A
YDR026C -TTACCCG
Genome-widelocation data
I m

Figure 1. Discovering binding site specificities for yeast transcriptional
regulators.
A) Cis-regulatory sequences that likely serve as recognition sites for
transcriptional regulators were identified by combining information from genome-
wide location data, phylogenetically conserved sequences, and previously
published evidence, as described in Supplementary Methods. The compendium
of regulatory sequence motifs can be found in Supplementary Table 3.
B) Selected sequence specificities that were "rediscovered" and were newly
discovered are displayed. The total height of the column is proportional to the
information content of the position, and the individual letters have height
proportional to the product of their frequency and the information content
(Schneider and Stephens 1990).
133

Figure 2
RoxlPhdl
SutlPhdl_r-10
YBR069C (TATI)Chromosome II(positions 370000:379000)
Leu3Gcn4 PhdlYap7 Gcn4
YBR068C (BAP2)
Nrgl Skn7Nrgl Stel2
YBR067C (TIPI) YBR066C (NRG2)
Phdl PhdlNddl Swi6 Sok2 Fh11Mcml Fkhl Fkhl RaplNddl Fkh2 Fkhl Fhll
Fkhl MbplMbpl Fkh2 Raplr_ _ 1-
Skn7
YDR453C(TSA2)
Chromosome IV(positions 1358800:1366600)
YDR452W(PPN ) YDR451 C(YHPI) YDR450W(RPS 18A)
BaslGcn4
BaslUme6 Basl
Met4 Gcn4 r H1-: 'YGL183C(MND?) YGL184C(STR3)
Chromosome VII(positions 150000:157000)
Basl
Gcn4
YGL185C YGL186C(TPNI)
Hap5Hap3Hap2
Hapl
YGL1 87C(COX4)
All sequence matches to DNA binding specificitiesTATI--11 l1 1 111 1III 11 111 1 I I r-- BAP2
1111 I IIIlI 1 [1 IIII IlI I I T
Sequence matches conserved across multiple species
TAT1 -I 1 11 1 II I I II
--
as-.ar;2
._
C-{IBP2 °Ez
Conserved sequence matches associated with bound regulators
Gcn4,Yap7 Leu3 Phdl Gcn4Gcn4,Yap7 Leu3 Phdl Gcn4
-1000 -800 -600 -400 -200
Distance from translational start site
A
B
0
!
ml
'' 'I
---- '
c" '"-' �Y~. | . -~~~~ I =
�_....... _ ........

Figure 2. Drafting the yeast transcriptional regulatory map.
A) Portions of chromosomes illustrating locations of genes (grey rectangles) and
conserved DNA sequences (coloured boxes) bound in vivo by transcriptional
regulators.
B) Combining binding data and sequence conservation data. The diagram
depicts all sequences matching a motif from our compendium (top), all such
conserved sequences (middle) and all such conserved sequences bound by a
regulator (bottom).
C) Regulator binding site distribution. The red line shows the distribution of
distances from the start codon of open reading frames to binding sites in the
adjacent upstream region. The green line represents a randomized distribution.
136

used to construct the map includes binding data from multiple growth
environments, the map describes transcriptional regulatory potential within the
genome. During growth in any one environment, only subsets of the binding sites
identified in the map are occupied by transcriptional regulators, as we describe in
more detail below.
Where the functions of specific transcriptional regulators were established
previously, the functions of the genes they bind in the regulatory map are highly
consistent with this prior information. For example, the amino acid biosynthetic
regulators Gcn4 and Leu3 bind to sites in the promoter of BAP2 (chromosome II),
which encodes an amino acid transporter (Figure 2A). Six well-studied cell cycle
transcriptional regulators bind to the promoter for YHP1 (chromosome IV), which
has been implicated in regulation of the G1 phase of the cell cycle. The regulator
of respiration Hap5, binds upstream of COX4 (chromosome VII), which encodes
a component of the respiratory electron transport chain. Where regulators with
established functions bind to genes of unknown function, these target genes are
newly implicated in such functional processes.
The utility of combining regulator binding data and sequence conservation
data is illustrated in Figure 2B. All sequences matching the regulator DNA
binding specificities described in this study (Supplementary Table 2) that occur
within the 884 base-pair intergenic region upstream of the gene BAP2 are shown
in the upper panel. The subset of these sequences that have been conserved in
multiple yeast species, and are thus likely candidates for regulator interactions,
are shown in the middle panel. The presence of these conserved regulatory sites
137

indicates the potential for regulation via this sequence, but does not indicate
whether the site is actually bound by a regulator under some growth condition.
The incorporation of binding information (bottom panel) identifies those
conserved sequences that are utilized by regulators in cells grown under the
conditions examined.
The distribution of binding sites for transcriptional regulators reveals there
are constraints on the organization of these sites in yeast promoters (Figure 2C).
Binding sites are not uniformly distributed over the promoter regions, but rather
show a sharply peaked distribution. Very few sites are located in the region 100
base pairs (bp) upstream of protein coding sequences. This region typically
includes the transcription start site and is bound by the transcription initiation
apparatus. The vast majority (74%) of the transcriptional regulator binding sites
lie between 100 and 500 bp upstream of the protein coding sequence, far more
than would be expected at random (53%). Regions further than 500 bp contain
fewer binding sites than would be expected at random. It appears that yeast
transcriptional regulators function at short distances along the linear DNA, a
property that reduces the potential for inappropriate activation of nearby genes.
We note that specific arrangements of DNA binding site sequences occur within
promoters, and suggest that these promoter architectures provide clues to
regulatory mechanisms (Figure 3). For example, the presence of a DNA binding
site for a single regulator is the simplest promoter architecture and, as might be
expected, we found that sets of genes with this feature are often involved in a
common biological function (Supplementary Table 4). A second type of promoter
138
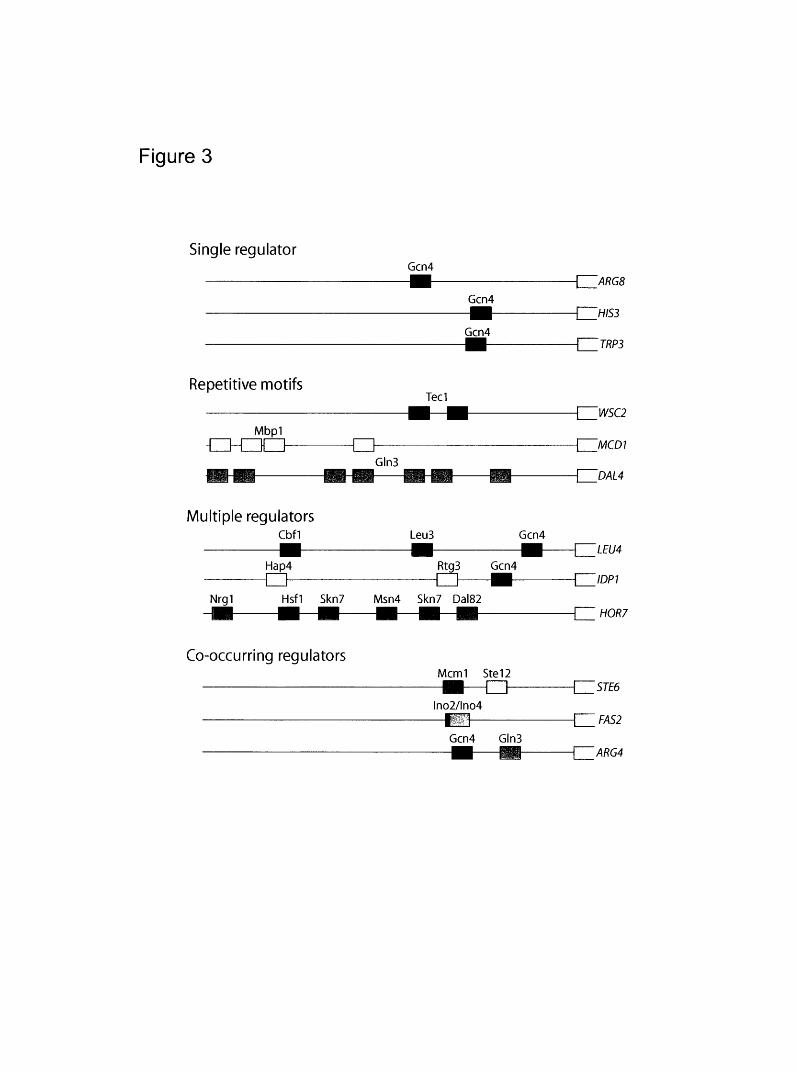
Figure 3
Single regulatorGcn4
r--ARG8Gcn4
Gcn4
ZHIS3
- TRP3
Repetitive motifs
Mbpl
{}{111 }~r-
Multiple regulatorsCbfl
Hap4m-
I J
Nrgl HsflM~~~~~
Skn7
a-
Leu3
Rtg3r-''I I
Msn4 Skn7 Da182w --t Mll
Gcn4-= LEU4
Gcn4
{IDP1
-- HOR7
Co-occurring regulatorsMcml
Ino2/Ino4
Gcn4/
Stel2I---------- STE6
I At-
Gln3
Tecl_ _- -
Gln3
t-WSC2
- MCDI
'nAI A
{-ARG4
M��
�I
!
I
"' "I II -
-· 4 !
'"`I J
/ !~sr

Figure 3. Yeast promoter architectures. Single regulator architecture: promoter
regions that contain one or more copies of the binding site sequence for a single
regulator. Repetitive motif architecture: promoter regions that contain multiple
copies of a binding site sequence of a regulator. Multiple regulator architecture:
promoter regions that contain one or more copies of the binding site sequences
for more than one regulator. Co-occurring regulator architecture: promoters that
contain binding site sequences for recurrent pairs of regulators. For the purposes
of illustration, not all sites are shown and scale is approximate. Additional
information can be found in Supplementary Tables 4-6.
140

architecture consists of repeats of a particular binding site sequence. Repeated
binding sites have been shown to be necessary for stable binding by the
regulator Dal80 (Cunningham and Cooper 1993). This repetitive promoter
architecture can also allow for a graded transcriptional response, as has been
observed for the HIS4 gene (Donahue et al. 1983). A number of regulators,
including Dig1, Mbpl, and Swi6 show a statistically significant preference for
repetitive motifs (Supplementary Table 5). A third class of promoter contains
binding sites for multiple different regulators. This promoter arrangement implies
that the gene may be subject to combinatorial regulation, and we expect that in
many cases the various regulators can be used to execute differential responses
to varied growth conditions. Indeed, we note that many of the genes in this
category encode products that are required for multiple metabolic pathways and
are regulated in an environment-specific fashion. In the fourth type of promoter
architecture we discuss here, binding sites for specific pairs of regulators occur
more frequently within the same promoter regions than would be expected by
chance (Supplementary Table 6). This "co-occurring" motif architecture implies
that the two regulators physically interact or have shared functions at multiple
genes.
By conducting genome-wide binding experiments for some regulators
under multiple cell growth conditions, we learned that regulator binding to a
subset of the regulatory sequences is highly dependent on the environmental
conditions of the cell (Supplementary Figure 4). We observed four common
patterns of regulator binding behaviour (Figure 4, Supplementary Table 7). Prior
141

Global behaviour Selected regulator-gene interactions
AW/
Leu3
Environment 1 - ' LEU4
Leu3
Environment 2 Q CLEU4
Leu3
-- -- ILV2Leu3
a '- ILV2
OEnvironment 1 - -GSY2
-cm -cm -C= -cm -C
Msn2 Msn2 Msn2Environment 2 --- GSY2 a -- CCP1 A GPH1
Environment 1 , .-ASNI
Gcn4Environment 2 . " ASNI
Gcn4
a 'ARG8 " BNA 1
Gcn4 Gcn4
S '-- ARG8 a -BNA I
Stel12 Ste12
Environment 1 - AGAI a - STE1 2 ---- f ZMSB2
Ste12 Stel2
S STE2 . MSB2Environment 2 * L..AGA1
Figure 4
Conditioninvariant(e.g. Leu3)
Leu3
Lu ILV5
Leu3
,-ILV5
Conditionenabled
(e.g. Msn2)
Conditionexpanded(e.g. Gcn4)
Conditionaltered
(e.g. Ste 12)

Figure 4. Environment-specific utilization of the transcriptional regulatory
code. Four patterns of genome-wide binding behaviour are depicted in a graphic
representation on the left, where transcriptional regulators are represented by
coloured circles and are placed above and below a set of target
genes/promoters. The lines between the regulators and the target
genes/promoters represent binding events. Specific examples of the
environment-dependent behaviours are depicted on the right. Coloured circles
represent regulators and coloured boxes represent their DNA binding sequences
within specific promoter regions. We note that regulators may exhibit different
behaviours when different pairs of conditions are compared.
143
.... . .. ·.. -.-1 ...... . - ·· ·. r -. · ·I--· ·- ·-·.' · - '···'-···-·.~ ~ -LrU ~I.· L~·~-·· I ·~ -- ·- ~· ~- · I-~· ·- LIUL-·I~

information about the regulatory mechanisms employed by well-studied
regulators in each of the four groups suggests hypotheses to account for the
environment-dependent binding behaviour of the other regulators.
"Condition invariant" regulators bind essentially the same set of promoters (within
the limitations of noise) in two different growth environments (Figure 4). Leu3,
which is known to regulate genes involved in amino acid biosynthesis, is among
the best studied of the regulators in this group. Binding of Leu3 in vivo has been
shown to be necessary, but not sufficient for activation of Leu3-regulated genes
(Kirkpatrick and Schimmel 1995). Rather, regulatory control of these genes
requires association of a leucine metabolic precursor with Leu3 to convert it from
a negative to positive regulator. We note that other zinc cluster type regulators
that show "condition invariant" behaviour are known to be regulated in a similar
manner (Ma and Ptashne 1987; Axelrod et al. 1991). Thus, it is reasonable to
propose that the activation or repression functions of some of the other
regulators in this class will be independent of DNA binding.
"Condition enabled" regulators do not bind the genome detectably under
one condition, but bind a substantial number of promoters with a change in
environment. Msn2 is among the best-studied regulators in this class, and the
mechanisms involved in Msn2-dependent transcription provide clues to how the
other regulators in that class may operate. Msn2 is known to be excluded from
the nucleus when cells grow in the absence of stresses, but accumulates rapidly
in the nucleus when cells are subjected to stress (Beck and Hall 1999; Chi et al.
2001). This condition-enabled behaviour was also observed for the thiamine
144
------ u···--- '··-�-·· '··'· -�-'··' · `�·· --- ·---·----- ----''-·-- ·- · ·- ''··- '�`-�-·-' �····-· ----- ·-· · ··--- ··--·-· ·· · ·· ·' · ' - ·· ·· · · ·-· · ' ·- · · ·--· ' �··-· · " -' '·� -···-· ·· -·..�-···rc-···-·- ·--· ·---· ·· · '····-�·...�__·1�U�·rrrrll·ll···l·w·-.�

biosynthetic regulator Thi2, the nitrogen regulator Gat1, and the developmental
regulator Rim101. We suggest that many of these transcriptional regulators are
regulated by nuclear exclusion or by another mechanism that would cause this
extreme version of condition-specific binding.
"Condition expanded" regulators bind to a core set of target promoters
under one condition, but bind an expanded set of promoters under another
condition. Gcn4 is the best-studied of the regulators that fall into this "expanded"
class. The levels of Gcn4 are reported to increase 6-fold when yeast are
introduced into media with limiting nutrients (Albrecht et al. 1998), due largely to
increased nuclear protein stability (Kornitzer et al. 1994; Chi et al. 2001), and
under this condition we find Gcn4 binds to an expanded set of genes.
Interestingly, the probes bound when Gcn4 levels are low contain better matches
to the known Gcn4 binding site than probes that are bound exclusively at higher
protein concentrations, consistent with a simple model for specificity based on
intrinsic protein affinity and protein concentration (Supplementary Figure 5). The
expansion of binding sites by many of the regulators in this class may reflect
increased levels of the regulator available for DNA binding.
"Condition altered" regulators exhibit altered preference for the set of
promoters bound in two different conditions. Ste12 is the best studied of the
regulators whose binding behaviour falls into this "altered" class. Depending on
the interactions with other regulators, the specificity of Ste12 can change and
alter its cellular function (Zeitlinger et al. 2003). For example, under filamentous
growth conditions, Ste12 interacts with Tecl, which has its own DNA-binding
145

specificity (Baur et al. 1997). This condition-altered behaviour was also observed
for the transcriptional regulators Aft2, Skn7, and Ume6. We propose that the
binding specificity of many of the transcriptional regulators may be altered
through interactions with other regulators or through modifications (e.g.,
chemical) that are environment-dependent.
Substantial portions of eukaryotic genome sequence are believed to be
regulatory (Waterston et al. 2002; Cliften et al. 2003; Kellis et al. 2003), but the
DNA sequences that actually contribute to regulation of genome expression have
been ill-defined. By mapping the DNA sequences bound by specific regulators in
various environments, we identify the regulatory potential embedded in the
genome and provide a framework for modeling the mechanisms that contribute to
global gene expression. We anticipate that the approaches used here to map
regulatory sequences in yeast can also be used to map the sequences that
control genome expression in higher eukaryotes.
146
·- ·- r----rr -�·�-r�-L·irU;IYYYI··Lr·r�^�-rr�··r·r · · ·- Y��-YIYL·�·i···YZCr'·'·�-�-··�-·I'UL-· i�·lr··U·-�I-L·^·--.-lu� �·-*I*-···-·�·YU-�i�U-�·�·Ugi·�i�;i.lli^

Methods
Strain Information
For each of the 203 regulators, strains were generated in which a
repeated Myc epitope coding sequence was integrated into the endogenous
gene encoding the regulator. Polymerase chain reaction (PCR) constructs
containing the Myc epitope coding sequence and a selectable marker flanked by
regions of homology to either the 5' or 3' end of the targeted gene were
transformed into the W303 yeast strain Z1256 (Ren et al. 2000; Lee et al. 2002).
Genomic integration and expression of the epitope-tagged protein were
confirmed by PCR and Western blotting, respectively.
Genome wide location analysis
Genome-wide location analysis was performed as previously described
(Ren et al. 2000; Lee et al. 2002). Bound proteins were formaldehyde-
crosslinked to DNA in vivo, followed by cell lysis and sonication to shear DNA.
Crosslinked material was immunoprecipitated with an anti-myc antibody, followed
by reversal of the crosslinks to separate DNA from protein. Immunoprecipitated
DNA and DNA from an unenriched sample were amplified and differentially
fluorescently labeled by ligation-mediated PCR. These samples were hybridized
to a microarrray consisting of spotted PCR products representing the intergenic
regions of the S. cerevisiae genome. Relative intensities of spots were used as
the basis for an error model that assigns a probability score (P value) to binding
147

interactions. All microarray data are available from ArrayExpress (accession
number: E-WMIT-10) as well as from the authors' web site.
Growth environments
We profiled all 203 regulators in rich medium. In addition, we profiled 84
regulators in at least one other environmental condition. The list of regulators is
given in Supplementary Table 1.
Regulator Binding Specificity
The putative specificities of regulators were identified by applying a suite
of motif discovery programs to the intergenic sequences identified by the binding
data. The resulting specificity predictions were filtered for significance using
uniform metrics and then clustered to yield representative motifs (Supplementary
Figure 2).
We used six methods to identify the specific sequences bound by
regulators: AlignACE (Roth et al. 1998), MEME (Bailey and Elkan 1995), Mdscan
(Liu et al. 2002), the method of Kellis et al. (Kellis et al. 2003) and two additional
new methods that incorporate conservation data: MEME_c and CONVERGE.
MEME_c uses the existing MEME program without change, but applies it to a
modified set of sequences in which bases that are not conserved in the sensu
stricto Saccharomyces species were replaced with the letter "N". CONVERGE is
a novel expectation-maximization (EM)-based algorithm for discovering
specificities using sequence information from multiple genomes. Rather than
148
··_·~_···_·_ ___l~i··_ IY~ ·· ·· ·_·I_·____ · LL_·U........._IUY LI .. . - ....... - ---·-. .·''·.·`.· .'l'··-u-r-1-.-·-·i.__rr· ··· · · ·· ·· .··rr ·L··.^u-r -rl-

searching for sites that are identical across the sensu stricto species, as is the
case for MEME_c, CONVERGE searches for loci where all aligned sequences
are consistent with the same specificity model. See Supplementary Methods for
runtime parameters and additional details for all of these methods.
Each of the programs we used attempts to measure the significance of its
results with one or more statistical scores. However, we observed that these
programs report results with high scores even when applied to random selections
of intergenic regions. To distinguish the true motifs, we chose a set of statistical
measures that are described in the Supplementary Methods, and we converted
these scores into the empirical probability that a motif with a similar score could
be found by the same program in randomly selected sequences. To estimate
these P values, we ran each program 50 times on randomly selected sets of
sequences of various sizes. We accepted only those motifs that were judged to
be significant by these scores (P < 0.001).
Significant motifs from all programs were pooled together and clustered
using a k-medoids algorithm. Aligned motifs within each cluster were averaged
together to produce consensus motifs and filtered according to their
conservation. This procedure typically produced several distinct consensus
motifs for each regulator. To choose a single specificity for each regulator, we
compared the results with information in the TRANSFAC (Matys et al. 2003),
YPD (Hodges et al. 1999), and SCPD (Zhu and Zhang 1999) databases. When
no prior information was available, we chose the specificity with the most
significant statistical score.
149

Regulatory Code
Potential binding sites were included in the map of the regulatory code if
they satisfied two criteria. First, a locus had to match the specificity model for a
regulator in the Saccharomyces cerevisiae genome and at least two other sensu
stricto cerevisiae genomes with a score > 60% of the maximum possible.
Second, the locus had to lie in an intergenic region that also contained a probe
bound by the corresponding regulator in any condition (P < 0.001). All analyses
of promoter architecture and environment-specific binding were based on this
map, and can be found in Supplementary Information.
Supplementary Methods
More detailed information concerning all the methods used in this paper
can be found in at http://web.wi.mit.edu/young/regulatory_code and in
Supplementary Information.
150

Acknowledgements
We thank T. Ideker and S. McCuine for help in selecting regulators to study in
environmental conditions. We thank E. Herbolsheimer, G. Bell, R. Latek and F.
Lewitter for computational assistance, and E. McReynolds for technical
assistance. E. F. is a Whitehead Fellow and was funded in part by Pfizer. D.B.G.
was supported by NIH/NIGMS NRSA Award GM068278. This work was
supported by NIH grant HG002668.
151
--'··-·- �L�--·�---uu·ir�··-·�-�-�Y·^·--l·-l-�-�.

References:
Albrecht G, Mosch HU, Hoffmann B, Reusser U and Braus GH (1998)."Monitoring the Gcn4 protein-mediated response in the yeast Saccharomycescerevisiae." J Biol Chem 273(21): 12696-702.
Axelrod JD, Majors J and Brandriss MC (1991). "Proline-independent binding ofPUT3 transcriptional activator protein detected by footprinting in vivo." Mol CellBiol 11(1): 564-7.
Bailey TL and Elkan C (1995). "The value of prior knowledge in discoveringmotifs with MEME." Proc Int Conf Intell Syst Mol Biol 3: 21-9.
Baur M, Esch RK and Errede B (1997). "Cooperative binding interactionsrequired for function of the Tyl sterile responsive element." Mol Cell Biol 17(8):4330-7.
Beck T and Hall MN (1999). "The TOR signalling pathway controls nuclearlocalization of nutrient-regulated transcription factors." Nature 402(6762): 689-92.
Blanchette M and Tompa M (2003). "FootPrinter: A program designed forphylogenetic footprinting." Nucleic Acids Res 31(13): 3840-2.
Chi Y, Huddleston MJ, Zhang X, Young RA, Annan RS, Carr SA and DeshaiesRJ (2001). "Negative regulation of Gcn4 and Msn2 transcription factors by Srb10cyclin-dependent kinase." Genes Dev 15(9): 1078-92.
Cliften P, Sudarsanam P, Desikan A, Fulton L, Fulton B, Majors J, Waterston R,Cohen BA and Johnston M (2003). "Finding functional features inSaccharomyces genomes by phylogenetic footprinting." Science 301(5629): 71-6.
Cunningham TS and Cooper TG (1993). "The Saccharomyces cerevisiae DAL80repressor protein binds to multiple copies of GATAA-containing sequences(URSGATA)." J Bacteriol 175(18): 5851-61.
Donahue TF, Daves RS, Lucchini G and Fink GR (1983). "A short nucleotidesequence required for regulation of HIS4 by the general control system of yeast."Cell 32(1): 89-98.
Hodges PE, McKee AH, Davis BP, Payne WE and Garrels JI (1999). "The YeastProteome Database (YPD): a model for the organization and presentation ofgenome-wide functional data." Nucleic Acids Res 27(1): 69-73.
lyer VR, Horak CE, Scafe CS, Botstein D, Snyder M and Brown PO (2001)."Genomic binding sites of the yeast cell-cycle transcription factors SBF andMBF." Nature 409(6819): 533-8.
152
·T-··Y-UY--·---YW·I�·�WlllsCIY·i"·.··.·Y ^I�YY�;I-··I· · IilYYi·YII

Jacob F and Monod J (1961). "Genetic regulatory mechanisms in the synthesisof proteins." J Mol Biol 3: 318-56.
Kellis M, Patterson N, Endrizzi M, Birren B and Lander ES (2003). "Sequencingand comparison of yeast species to identify genes and regulatory elements."Nature 423(6937): 241-54.
Kirkpatrick CR and Schimmel P (1995). "Detection of leucine-independent DNAsite occupancy of the yeast Leu3p transcriptional activator in vivo." Mol Cell Biol15(8): 4021-30.
Knuppel R, Dietze P, Lehnberg W, Frech K and Wingender E (1994)."TRANSFAC retrieval program: a network model database of eukaryotictranscription regulating sequences and proteins." J Comput Biol 1(3): 191-8.
Kornitzer D, Raboy B, Kulka RG and Fink GR (1994). "Regulated degradation ofthe transcription factor Gcn4." Embo J 13(24): 6021-30.
Lee TI, Rinaldi NJ, Robert F, Odom DT, et al. (2002). "Transcriptional regulatorynetworks in Saccharomyces cerevisiae." Science 298(5594): 799-804.
Lieb JD, Liu X, Botstein D and Brown PO (2001). "Promoter-specific binding ofRap1 revealed by genome-wide maps of protein-DNA association." Nat Genet28(4): 327-34.
Liu XS, Brutlag DL and Liu JS (2002). "An algorithm for finding protein-DNAbinding sites with applications to chromatin-immunoprecipitation microarrayexperiments." Nat Biotechnol 20(8): 835-9.
Ma J and Ptashne M (1987). "The carboxy-terminal 30 amino acids of GAL4 arerecognized by GAL80." Cell 50(1): 137-42.
Matys V, Fricke E, Geffers R, Gossling E, et al. (2003). "TRANSFAC:transcriptional regulation, from patterns to profiles." Nucleic Acids Res 31(1):374-8.
Pritsker M, Liu YC, Beer MA and Tavazoie S (2004). "Whole-genome discoveryof transcription factor binding sites by network-level conservation." Genome Res14(1): 99-108.
Ren B, Robert F, Wyrick JJ, Aparicio O, et al. (2000). "Genome-wide location andfunction of DNA binding proteins." Science 290(5500): 2306-9.
Roth FP, Hughes JD, Estep PW and Church GM (1998). "Finding DNA regulatorymotifs within unaligned noncoding sequences clustered by whole-genome mRNAquantitation." Nat Biotechnol 16(10): 939-45.
153

Schneider TD and Stephens RM (1990). "Sequence logos: a new way to displayconsensus sequences." Nucleic Acids Res 18(20): 6097-100.
Wang T and Stormo GD (2003). "Combining phylogenetic data with co-regulatedgenes to identify regulatory motifs." Bioinformatics 19(18): 2369-80.
Waterston RH, Lindblad-Toh K, Birney E, Rogers J, et al. (2002). "Initialsequencing and comparative analysis of the mouse genome." Nature 420(6915):520-62.
Zeitlinger J, Simon I, Harbison CT, Hannett NM, Volkert TL, Fink GR and YoungRA (2003). "Program-specific distribution of a transcription factor dependent onpartner transcription factor and MAPK signaling." Cell 113(3): 395-404.
Zhu J and Zhang MQ (1999). "SCPD: a promoter database of the yeastSaccharomyces cerevisiae." Bioinformatics 15(7-8): 607-11.
154

Chapter 5
Conclusions: The Future of Systems Biology
155

The ultimate goal of systems biology is to have a complete understanding
of all the elements that comprise a cell and how those elements interact to effect
the functions of the cell (Aggarwal and Lee 2003). We should be able to
construct a working computational model of a cell that responds to stimuli exactly
as a real cell does. This will allow us to make predictions about cellular
responses and to understand every component of that response. In the medical
field, such models will enable thorough understanding of the mechanisms behind
diseases as well as suggesting the best pathways and steps at which to interfere
to cure or alleviate illness.
The elements of a cell that we need to catalog in order to enable a
complete model include, but are not limited to, genomic elements, proteomic
elements, and the interactions between the two. We need to know what
elements are encoded by the DNA in the genome: their location, function, and
presence under varied environmental conditions. We need to catalog the
components of the proteome, their functions, modifications and different
complexes that are formed. In addition, the interactions between the genome
and proteome that control the content of the proteome must be understood and
cataloged.
Of each of these levels of knowledge required to model a cell, we currently
have the most thorough understanding of the genome and its elements.
Complete sequences of the genomes of many organisms (excluding the hard to
sequence highly repetitive regions) have been published. In addition to this
knowledge of the DNA sequence, the list of elements encoded is approaching
156
completion, particularly for smaller organisms such as the yeast Saccharomyces
cerevisiae (Cliften et al. 2003; Kellis et al. 2003). One set of these elements is
comprised of the sequence of protein coding genes. Many complementary
methods have been used for finding these elements, including computational
prediction based on searching for sequence patterns that match those
associated with known genes (Burge and Karlin 1998; Katoh 2002; Yada et al.
2003). A second technique is sequencing the messenger RNA population that is
intermediate between the genome and the proteome, via Expressed Sequence
Tags (ESTs) (Williamson et al. 1995; Eckman et al. 1998). Comparison of
sequences between related organisms is also used to find protein coding genes,
based on the assumption that these genes are more likely to be conserved
across species than random DNA sequence (Morgenstern et al. 2002; Cliften et
al. 2003; Kellis et al. 2003; Taher et al. 2004). These techniques enumerate all
the elements that are present in the genome; genome-wide expression analysis
(Schena et al. 1995; Shalon et al. 1996) provides an assessment of which
elements are being utilized by the cell under particular conditions by measuring
the mRNA population, or other genomic components.
Similar methods have been used to find elements in the genome that code
for RNA molecules that are not translated into proteins (Eddy 2001). These
include tRNAs that assist in the translation of messenger RNA into proteins by
linking the RNA sequence code with the appropriate amino acids. MicroRNAs
are small RNA molecules that bind to and cause degradation of specific
messenger RNAs, thus participating in the regulation of the level of protein coded
157

for by the mRNA (Lagos-Quintana et al. 2001; Lau et al. 2001; Lee and Ambros
2001). These and other types of RNA molecules, such as ribozymes, are also
found using computational predictions based on pattern recognition and cross
species comparison (Grad et al. 2003; Lai et al. 2003; Ohler et al. 2004).
In addition to these coding sequences, the genome also contains
regulatory elements. These are short sequences that serve as the points of
interaction between the genome and proteome. They include sequences that
nucleate the assembly of the general transcriptional machinery, as well as the
more specific sequences that are bound by gene-specific transcription factors.
Transcription factors can control the assembly or disassembly of the
transcriptional machinery as well as the rate of transcription, by varied affinities
for the DNA sequences as well as the recruited general transcription apparatus.
While various methods for finding these regulatory elements have been
described (Lawrence and Reilly 1990; Roth et al. 1998; Spellman et al. 1998;
Hughes et aL 2000; Liu et al. 2001), these elements have proved more elusive
than the protein and RNA coding genes. The main reason for this is that a wide
range of sequences can be bound by each transcription factor, in contrast to the
single defined sequences that codes for a protein or RNA message.
The proteome is the second level studied in systems biology. Mass
spectrometry provides an assessment of the protein complement of cells under
various conditions as well as how that complement changes as the cellular
environment is altered. Mass spec in addition to the yeast-two-hybrid system
has provided information about which proteins are present in complex with one
158

another (Dziembowski and Seraphin 2004). Information about the function of
proteins has been obtained on a genome-wide scale by deletion or knockdown of
genes followed by phenotypic assessment (Winzeler et al. 1999). Deletion or
knockdown of multiple proteins in concert provides information about which
genes are acting in the same pathways (Krogan et a/. 2004; Tong et al. 2004).
Covalent linkage of small molecules to proteins can have a marked effect on
protein functionality. These modifications can also be measured by mass
spectrometry (Wilkins et al. 1999; Sickmann et al. 2001; Sickmann et al. 2002),
but this has not been accomplished on a genome-wide level to date.
Another level of knowledge necessary to model a cell is of the interactions
between the genome and the proteome. As mentioned, transcriptional regulators
bind to specific DNA sequences close to genes and recruit other proteins to
either increase or decrease transcription of the associated gene. In addition,
DNA is complexed with histone proteins into chromatin, which packages the DNA
into a small volume inside the nucleus (Allfrey et al. 1964). Various modifications
of the histone proteins, as well as modifications of the transcription factors, have
been shown to have an effect on regulation of gene synthesis (Allfrey et al. 1964;
Struhl 1995; Reece and Platt 1997; Sharrocks 2000). Chromatin
immunoprecipitation has long been used to study interactions between both
regulatory transcription factors or histones and the genome. Using microarrays
to examine the immunoprecipitates has turned this technique into another that
can assess interactions on a genome-wide scale (Ren et al. 2000; lyer et al.
2001). Computational analysis of the sequences that are reported to be bound
159

by these various factors is one way in which the sequence elements involved are
discovered (Harbison et al. 2004).
At the moment, we have gathered knowledge about the pieces of a cell
that we need in order to build these cellular models, and in fact, have managed
to build models of small systems within cells (Hartemink et a/. 2001; Ideker et al.
2001; Davidson et al. 2002; Ideker 2004; Oliveri and Davidson 2004). The goal
of modeling a complete cell is still somewhat farfetched, however. The
regulatory sequences in the genome present one major challenge. As
mentioned, these sequences are hard to find because a single protein has affinity
for a range of sequences as opposed to only a single sequence. This means
that for many genes known to be bound or regulated by a given transcription
factor, we are unable to discover the particular sequence to which the protein
binds, using the high throughput analyses and experiments that are essential to
the systems biology approach. Improvements in analysis of groups of
sequences to detect motifs with higher variability than is currently possible will
assist in overcoming this limitation, as will more sensitive binding assays. The
other side of this problem is that these regulatory sequences are comprised of
only a few nucleotides and thus are found randomly throughout the genome. We
do not understand yet why these sequences are bound only in a subset of their
locations across the genome, and why even fewer of these sequences cause
changes in gene expression.
There are also aspects of the system that we do not currently measure on
a genome-wide level that could enhance our current understanding. One such
160

aspect is complementary to genome-wide location analysis - a high throughput
method of measuring, at each individual promoter, which proteins are present.
For an individual promoter this could be accomplished using an oligonucleotide
column to capture proteins bound to the sequence of interest, followed by mass
spectrometry to identify those proteins. This assumes that the interactions
between proteins and DNA are sufficiently strong to survive the column washing.
Otherwise some form of crosslinking might be required. To do this in a high
throughput fashion, one could possibly create oligonucleotides containing a
barcode and linked to beads. After capturing the cognate DNA sequences from
a lysed cell, mass spectrometry on individual beads could identify the bound
proteins, and the barcode could identify the captured DNA sequence. Another
technology that would assist is a method for directly reading the transcriptional
output of the cell. Current technologies measure the RNA complement of a cell
at a given time, but one cannot deconvolute effects of differential rates of
synthesis and degradation to assess the direct effect of perturbations on
transcription. Additional technological improvements to enable measuring
changes occurring in cells in real time will enable clearer understanding of effects
of perturbations. Finally, being able to make measurements on a single cell to
avoid population effects will allow us to directly link cause and effect.
In the decade since the first eukaryotic genome was sequenced, we have
made great strides towards the goal of a computational model of a complete cell.
With some of the new technologies suggested here, as well as improvements in
161

existing methods and analysis, the virtual cell should become a reality in the not
too distant future.
162
References:
Aggarwal K and Lee KH (2003). "Functional genomics and proteomics as afoundation for systems biology." Brief Funct Genomic Proteomic 2(3): 175-84.
Allfrey VG, Faulkner R and Mirsky AE (1964). "Acetylation and Methylation ofHistones and Their Possible Role in the Regulation of Rna Synthesis." Proc NatlAcad Sci U S A 51: 786-94.
Burge CB and Karlin S (1998). "Finding the genes in genomic DNA." Curr OpinStruct Biol 8(3): 346-54.
Cliften P, Sudarsanam P, Desikan A, Fulton L, Fulton B, Majors J, Waterston R,Cohen BA and Johnston M (2003). "Finding functional features inSaccharomyces genomes by phylogenetic footprinting." Science 301(5629): 71-6.
Davidson EH, Rast JP, Oliveri P, Ransick A, et al. (2002). "A provisionalregulatory gene network for specification of endomesoderm in the sea urchinembryo." Dev Biol 246(1): 162-90.
Dziembowski A and Seraphin B (2004). "Recent developments in the analysis ofprotein complexes." FEBS Lett 556(1-3): 1-6.
Eckman BA, Aaronson JS, Borkowski JA, Bailey WJ, Elliston KO, Williamson ARand Blevins RA (1998). "The Merck Gene Index browser: an extensible dataintegration system for gene finding, gene characterization and EST data mining."Bioinformatics 14(1): 2-13.
Eddy SR (2001). "Non-coding RNA genes and the modern RNA world." Nat RevGenet 2(12): 919-29.
Grad Y, Aach J, Hayes GD, Reinhart BJ, Church GM, Ruvkun G and Kim J(2003). "Computational and experimental identification of C. elegansmicroRNAs." Mol Cell 11(5): 1253-63.
Harbison CT, Gordon DB, Lee TI, Rinaldi NJ, et al. (2004). "Transcriptionalregulatory code of a eukaryotic genome." Nature 431(7004): 99-104.
Hartemink AJ, Gifford DK, Jaakkola TS and Young RA (2001). "Using graphicalmodels and genomic expression data to statistically validate models of geneticregulatory networks." Pac Symp Biocomput: 422-33.
Hughes JD, Estep PW, Tavazoie S and Church GM (2000). "Computationalidentification of cis-regulatory elements associated with groups of functionallyrelated genes in Saccharomyces cerevisiae." J Mol Biol 296(5): 1205-14.
163

Ideker T (2004). "A systems approach to discovering signaling and regulatorypathways--or, how to digest large interaction networks into relevant pieces." AdvExp Med Biol 547: 21-30.
Ideker T, Thorsson V, Ranish JA, Christmas R, et al. (2001). "Integrated genomicand proteomic analyses of a systematically perturbed metabolic network."Science 292(5518): 929-34.
lyer VR, Horak CE, Scafe CS, Botstein D, Snyder M and Brown PO (2001)."Genomic binding sites of the yeast cell-cycle transcription factors SBF andMBF." Nature 409(6819): 533-8.
Katoh M (2002). "Paradigm shift in gene-finding method: From bench-topapproach to desk-top approach (review)." Int J Mol Med 10(6): 677-82.
Kellis M, Patterson N, Endrizzi M, Birren B and Lander ES (2003). "Sequencingand comparison of yeast species to identify genes and regulatory elements."Nature 423(6937): 241-54.
Krogan NJ, Peng WT, Cagney G, Robinson MD, et al. (2004). "High-definitionmacromolecular composition of yeast RNA-processing complexes." Mol Cell13(2): 225-39.
Lagos-Quintana M, Rauhut R, Lendeckel W and Tuschl T (2001). "Identificationof novel genes coding for small expressed RNAs." Science 294(5543): 853-8.
Lai EC, Tomancak P, Williams RW and Rubin GM (2003). "Computationalidentification of Drosophila microRNA genes." Genome Biol 4(7): R42.
Lau NC, Lim LP, Weinstein EG and Bartel DP (2001). "An abundant class of tinyRNAs with probable regulatory roles in Caenorhabditis elegans." Science294(5543): 858-62.
Lawrence CE and Reilly AA (1990). "An expectation maximization (EM) algorithmfor the identification and characterization of common sites in unalignedbiopolymer sequences." Proteins 7(1): 41-51.
Lee RC and Ambros V (2001). "An extensive class of small RNAs inCaenorhabditis elegans." Science 294(5543): 862-4.
Liu X, Brutlag DL and Liu JS (2001). "BioProspector: discovering conserved DNAmotifs in upstream regulatory regions of co-expressed genes." Pac SympBiocomput: 127-38.
Morgenstern B, Rinner O, Abdeddaim S, Haase D, Mayer KF, Dress AW andMewes HW (2002). "Exon discovery by genomic sequence alignment."Bioinformatics 18(6): 777-87.
164

Ohler U, Yekta S, Lim LP, Bartel DP and Burge CB (2004). "Patterns of flankingsequence conservation and a characteristic upstream motif for microRNA geneidentification." Rna 10(9): 1309-1322.
Oliveri P and Davidson EH (2004). "Gene regulatory network controllingembryonic specification in the sea urchin." Curr Opin Genet Dev 14(4): 351-60.
Reece RJ and Platt A (1997). "Signaling activation and repression of RNApolymerase II transcription in yeast." Bioessays 19i 1): 1001-10.
Ren B, Robert F, Wyrick JJ, Aparicio O, et al. (2000). "Genome-wide location andfunction of DNA binding proteins." Science 290(5500): 2306-9.
Roth FP, Hughes JD, Estep PW and Church GM (1998). "Finding DNA regulatorymotifs within unaligned noncoding sequences clustered by whole-genome mRNAquantitation." Nat Biotechnol 16(10): 939-45.
Schena M, Shalon D, Davis RW and Brown PO (1995). "Quantitative monitoringof gene expression patterns with a complementary DNA microarray." Science270(5235): 467-70.
Shalon D, Smith SJ and Brown PO (1996). "A DNA microarray system foranalyzing complex DNA samples using two-color fluorescent probehybridization." Genome Res 6(7): 639-45.
Sharrocks AD (2000). "Introduction: the regulation of eukaryotic transcriptionfactor function." Cell Mol Life Sci 57(8-9): 1147-8.
Sickmann A, Marcus K, Schafer H, Butt-Dorje E, Lehr S, Herkner A, Suer S, BahrI and Meyer HE (2001). "Identification of post-translationally modified proteins inproteome studies." Electrophoresis 22(9): 1669-76.
Sickmann A, Mreyen M and Meyer HE (2002). "Identification of modified proteinsby mass spectrometry." IUBMB Life 54(2): 51-7.
Spellman PT, Sherlock G, Zhang MQ, lyer VR, Anders K, Eisen MB, Brown PO,Botstein D and Futcher B (1998). "Comprehensive identification of cell cycle-regulated genes of the yeast Saccharomyces cerevisiae by microarrayhybridization." Mol Biol Cell 9(12): 3273-97.
Struhl K (1995). "Yeast transcriptional regulatory mechanisms." Annu Rev Genet29: 651-74.
Taher L, Rinner O, Garg S, Sczyrba A and Morgenstern B (2004). "AGenDA:gene prediction by cross-species sequence comparison." Nucleic Acids Res32(Web Server issue): W305-8.
165
Tong AH, Lesage G, Bader GD, Ding H, et al. (2004). "Global mapping of theyeast genetic interaction network." Science 303(5659): 808-13.
Wilkins MR, Gasteiger E, Gooley AA, Herbert BR, et al. (1999). "High-throughputmass spectrometric discovery of protein post-translational modifications." J MolBiol 289(3): 645-57.
Williamson AR, Elliston KO and Sturchio JL (1995). "The Merck Gene Index, apublic resource for genomics research." J NIH Res7: 61-63.
Winzeler EA, Shoemaker DD, Astromoff A, Liang H, et al. (1999). "Functionalcharacterization of the S. cerevisiae genome by gene deletion and parallelanalysis." Science 285(5429): 901-6.
Yada T, Takagi T, Totoki Y, Sakaki Y and Takaeda Y (2003). "DIGIT: a novelgene finding program by combining gene-finders." Pac Symp Biocomput: 375-87.
166

Appendix B
Computational Discovery of Gene Modules and Regulatory Networks
Published as: Bar-Joseph Z, Gerber GK, Lee TI, Rinaldi NJ, Yoo JY, Robert F,
Gordon DB, Fraenkel E, Jaakkola TS, Young RA and Gifford DK (2003).
"Computational discovery of gene modules and regulatory networks." Nat
Biotechnol 21(11): 1337-42.
167

Summary
We present a new algorithm, GRAM (Genetic RegulAtory Modules), which fuses
information from genome-wide location and expression data sets to discover
regulatory networks of gene modules. A gene module is defined as a set of
genes that are both co-expressed and bound by the same set of transcription
factors. Unlike previous approaches (Eisen et al. 1998; Pilpel et al. 2001;
Berman et al. 2002; Ihmels et al. 2002; Segal et al. 2003) that have relied
primarily on functional information from expression data, the GRAM algorithm
explicitly links genes to the factors that regulate them by using DNA binding data
to incorporate direct physical evidence of regulatory interactions. We use the
GRAM algorithm to discover a genome-wide regulatory network using binding
information for 106 transcription factors in Saccharomyces cerevisiae in rich
media conditions and over 500 expression experiments. Additionally, we present
a new genome-wide location analysis data set for regulators in yeast cells treated
with rapamycin, and use the GRAM algorithm to provide biological insights in this
regulatory network.
168

High-throughput biological data sources hold the promise of
revolutionizing molecular biology by providing large-scale views of genetic
regulatory networks. Many genome-wide expression data sets are now readily
available, and typical computational analyses have applied clustering algorithms
to expression data to find sets of co-expressed and potentially co-regulated
genes (Eisen et al. 1998). Recent approaches have used more sophisticated
algorithms, such as the work of Segal et al., in which they construct a
probabilistic model that uses expression data to link regulators to regulated
genes (Segal et al. 2003). Their method relies on the assumption that
expression levels of regulated genes will depend on expression levels of
regulators, which is a limitation in cases in which the expression level of the
regulator does not change appropriately (e.g., cases of post-transcriptional
modification). Other approaches have combined expression data with additional
information, such as shared DNA binding motifs or MIPS categories (Pilpel et al.
2001; Berman et al. 2002; Ihmels et al. 2002), but the use of these data sources
provides essentially only functional or indirect evidence of genetic regulatory
interactions. These methods cannot distinguish among genes that have similar
expression patterns but are under the control of different regulatory networks
(see Supplementary Notes online for further details).
Large scale, genome-wide location analysis for DNA-binding regulators
offers a second means for identifying regulatory relationships (Lee et al. 2002).
Location analysis identifies physical interactions between regulators and DNA
regions providing strong direct evidence for genetic regulation. While useful,
169
... .. ......~.. ... I.... ....... ... .. ..... . -- ·- --.:- l_.r--)··-· L . ... -·... ·. ·· · l..._.- --· · ·· · · -· · · ·· ··· ·-· '-.-·--:---··· ·-- · · I··l.· w-~·~y-UI· ·

binding information is also limited, as the presence of the regulator at a promoter
region indicates binding but not function: the regulator may act positively,
negatively or not at all. In addition, as with all microarray based data sources,
location analysis data contains substantial experimental noise. Since expression
and location analysis data provide complementary information, our goal was to
develop an efficient computational method for integrating these data sources.
We expected that such an algorithm could provide assignments of groups of
genes to regulators that would be both more accurate and more biologically
relevant than assignment based solely on either data source alone.
The GRAM algorithm begins by performing an efficient, exhaustive search
over all possible combinations of transcriptional regulators indicated by the DNA-
binding data with a stringent criterion for determining binding. Once a set of
genes bound by a common set of transcriptional regulators is found, the
algorithm identifies a subset of these genes with highly correlated expression,
which serves as a "seed" for a gene module. The algorithm then revisits the
binding data, and seeks to add additional genes to the module that are similarly
expressed and bound by the same set of transcriptional regulators using a
relaxed binding criteria. Our algorithm allows genes to belong to more than one
module. See the Methods section for a complete description of the GRAM
algorithm.
The GRAM algorithm was applied to genome-wide location data for 106
transcription factors and over 500 expression experiments (details on the data
used are available in Supplementary Table 1 online). One-hundred six gene
170

modules were identified, containing 655 distinct genes and regulated by 68 of the
transcription factors. Figure 1 presents a visualization of these results as a graph
with edges between gene modules and regulators.
The gene modules abstraction allowed us to label regulator-module edges
in the graph to indicate whether there is significant evidence that regulators may
be functioning as activators. Since a gene module provides a link between a set
of regulators and the common expression pattern of a set of bound genes, we
can use the relationship between a regulator's expression pattern and the
common expression pattern of genes in a module to infer whether a regulator
acts as an activator. In contrast, the use of genomic location data alone only
allows us to infer the presence of regulators at promoters, but can give no
information about the type of interaction. We searched for activator relationships
by examining regulators with expression profiles that are positively correlated
with the expression profiles of genes in the corresponding modules. Positive
correlation indicates that higher levels of regulator expression correlate with
higher levels of expression of genes in the module and suggests that the
transcription factor positively regulates the expression of genes in the module.
We determined the statistical significance of the activator relationships by
computing correlation coefficients between all transcriptional regulators studied
and all gene modules and taking the 5% positive tail of the distribution of
correlation coefficients. Supplementary Table 2 online presents the eleven
activators determined using the method described above. Ten of the eleven
activators were previously identified in the literature, suggesting that this analysis
171
;··.--r...,·o l·-~- --- yl·lC· ·- · _-l·~·Y ·'-·L-·-'-l"�-·······-·-··-*-L-·U*li-r�. ·-··· `··--·I·----^*�·.· l··IIY�LLli�·�LYYL-·-·I·--- ul ----- 31

Figure 1
Stress responseTPho4 .
,i T- |Hsfl ~Msn4l"~ ? |'4cadil Y: 1.~y.;~.. c
=Transcription factor -O Activator -* Function not determined
Module categories:* tRNA/rRNA activity * Respiration 0 Carbohydrate metabolism 0 Vacuolar degradation* Ribosome biogenesis * Stress response Sporulation/pheromone resp. * Cell-cycleg Amino acid met./biosynth. Protein synthesis 0 Chromosome/histone 0 Unknown* Glycolysis/metabolism 0 Fermentation * Lipid/fatty acid biosynth.

Figure 1: Rich media gene modules network
Visualization of the transcriptional regulatory network discovered by the GRAM
algorithm as a graph with edges between gene modules and regulators shows
that there are many groups of connected gene modules/regulators involved in
similar biological processes. The network consists!of 106 modules containing
655 distinct genes regulated by 68 transcription factors. In most cases in which a
gene module is controlled by one or more regulators, there was previous
evidence suggesting that these regulators physically or functionally interact (see
Supplementary Table 3 online for details). The directed arrows point from
transcription factors to the gene modules that they regulate. Blue arrows
indicate discovered activator regulatory relationships (see Supplementary Table
2 online and the text for details). Gene modules are colored according to the
MIPS category to which a significant number of genes belong (significance test
using the hypergeometric distribution p < 0.005). Modules containing many
genes with unknown function or an insignificant number belonging to the same
MIPS category are uncolored. When the gene modules discovered by the
GRAM algorithm were compared to results generated using location data alone,
the GRAM algorithm yielded an almost three-fold increase in modules
significantly enriched for genes in the same MIPS category.
173
nlru·--··���L·IIIIYuuu�-·^rC�- ·�rl�·�,,,�,� .��.�.�-··I�LI-�_.,.�L--�)YiLL·�.yLI�LL·- . -. · -- ..... ....... rr·-·i-~-··L·-·-·· ·. '··-·--~ L ~ ,y Y Y-·i u-r· ·-- l~-r· Y

produces biologically meaningful results.
Several results obtained by analysis of the discovered gene modules
suggest that the algorithm identifies biologically relevant groupings of genes.
First, we found that gene modules generally identify groups of genes that
function in a similar biological pathway as defined by the MIPS functional
categorization (Mewes et al. 2000) (see Fig. 1 and Supplementary Table 3 online
for details). Second, we found the gene modules to be generally accurate in
assigning regulators to sets of genes whose functions are consistent with the
regulators' known roles. As an example, Gcrl is a well-characterized regulator of
glucose metabolism (Baker 1986; Holland et al. 1987); 6 of the 7 genes identified
in the Gcrl module are enzymes involved in glycolysis and gluconeogenesis.
Additionally, we found that in most cases in which a gene module is controlled by
one or more regulators, there was previous evidence suggesting that these
regulators physically or functionally interact (see Supplementary Table 4 online).
For example, gene modules identify Hap2/3/4/5, Hap4/Abfl, Ino2/lno4, Hirl/Hir2,
Mbpl/Swi6, and Swi4/Swi6 interactions. Taken together, these results provide
evidence that the GRAM algorithm identifies not only biologically related sets of
genes, but also relevant factors that are interacting to control the genes.
While genome-wide location data alone is potentially useful for deriving
transcriptional regulatory networks, a key feature of the GRAM algorithm is its
ability to compensate for technical limitations in the location data through the
integration of expression data. To determine binding events in location data, Lee
et al. (Lee et al. 2002) used a statistical model and chose a relatively stringent p-
174
··- __·. ··. I ·-.... · · ·_ _· I.··.._. · ·- - -··_· . ........ ........ ........ .. -. ._· ·I· ·· ··· 1 ·__·I_··_·· _ _ _ ·· · ·.... .. ··I_)__ ___. ........... · ·· _···_· · l- - -W 1 _ll-

value threshold (.001) with the intention of reducing false positives at the
expense of false negatives. The GRAM algorithm presents a powerful alternative
to using a single p-value threshold to predict binding events, since our method
allows the p-value cutoff to be relaxed if there is sufficient supporting evidence
from expression data. As an example, consider Hap4, a well-characterized
regulator of genes involved in oxidative phosphorylation and respiration
(Forsburg and Guarente 1989). The Hap4 modules contain twenty-eight genes
that are involved in respiration and show a high degree of co-regulation over the
collected expression data sets (Fig. 2). Six of these genes (PET9, ATP16,
KGD2, QCR6, SDH1, and NDI1) would not have been identified as Hap4 targets
using the stringent .001 p-value threshold (p-values range from .0011 to .0036).
Overall, 627 out of 1560 unique regulator-gene interactions (40%) in the rich
media network discovered by the GRAM algorithm would not have been detected
using only location data and the stringent p-value cutoff.
To further verify the ability of the GRAM algorithm to improve the rate of
false negatives without contributing significantly to the rate of false positives, we
performed gene-specific chromatin-IP experiments for the factor Stbl and 36
genes. The profiled genes were picked randomly from the full set of yeast
genes, with representatives selected from four p-values ranges. In these
experiments, three additional genes were determined to be bound by Stbl that
had p-values between .01 and .001 in the genomic location experiments and had
thus been excluded with the stringent cutoff. The GRAM algorithm identified all
three genes as bound by Stbl without adding any additional genes that were not
175
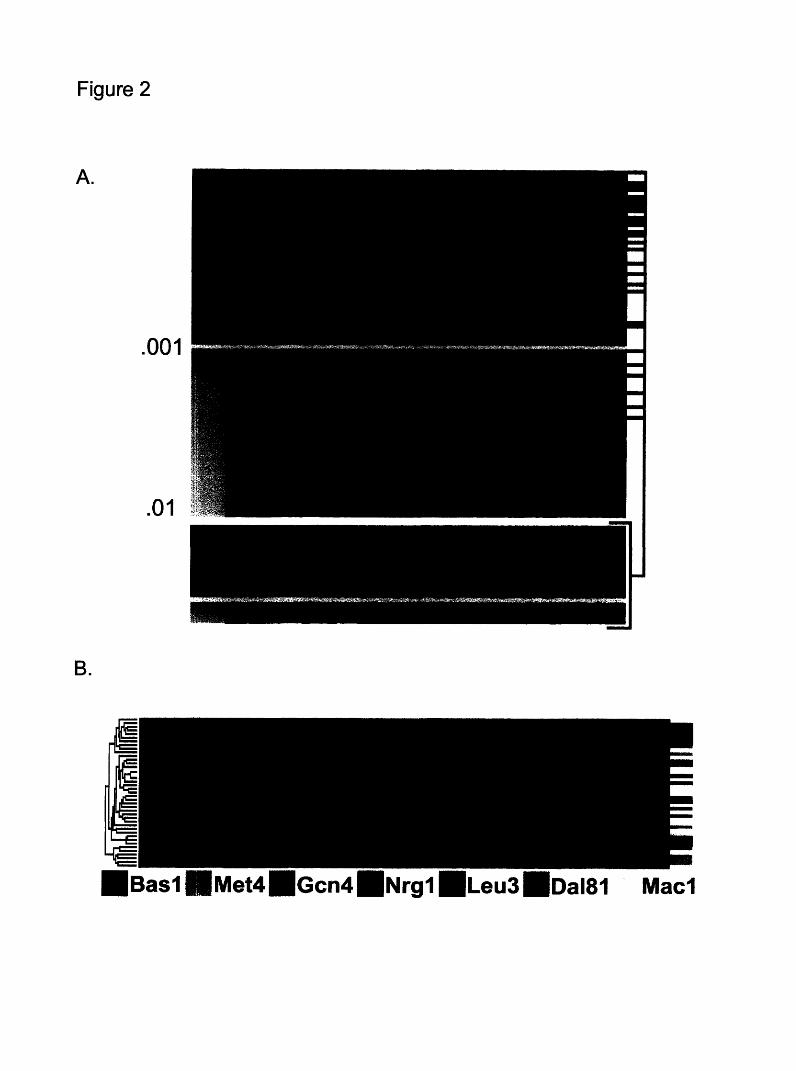
Figure 2
A.
.001
.01
B.
lm
F

Figure 2: The GRAM algorithm integrates genome-wide binding and
expression data and improves on either data source alone. A) Binding data:
the GRAM algorithm can improve the quality of DNA-binding information, since it
uses expression data to avoid a strict statistical significance threshold. Shown is
DNA-binding and expression informationfor the 99 genes bound by the regulator
Hap4 with a p-value < .01 using the statistical model in Lee et a16. The blue-
white column on the left indicates binding p-values, and the horizontal yellow line
denotes the strict significance threshold of .001. As can be seen, the p-values
form a continuum and a strict threshold is unlikely to produce good results. The
blue horizontal lines on the right indicate the 28 genes that were selected for
modules by the GRAM algorithm. As can be seen, 22 (79%) have a p-value <
.001, but 6 (21 %) have p-values above this threshold. The lower portion of the
figure shows together the 28 genes selected by the GRAM algorithm, and it can
be seen that they exhibit coherent expression. Further, all the selected genes
are involved in respiration. Six of these genes (PET9, ATP16, KGD2, QCR6,
SDH1, and NDI1) would not have been identified as Hap4 targets using the
stringent .001 p-value threshold (p-values range from .0011 to .0036).
B) Expression data: the GRAM algorithm can assign different regulators to genes
with similar expression patterns that cannot be distinguished using expression
clustering methods alone. Hierarchical clustering of expression data was used to
obtain the sub-tree on the left. On the right, the regulators assigned to genes by
the GRAM algorithm are color coded. As can be seen, many genes with very
similar expression patterns are regulated by different transcription factors.
177
detected in the gene-specific chromatin-IP experiments (see Supplementary
Table 5 and Methods online for full details).
We also expected that the gene modules derived by the GRAM algorithm
would improve on the biological relevance of gene groupings that could be
inferred from location data only. Since genes that participate in the same
biological pathway often have similar expression patterns, and genes in a module
share not only a common set of transcription factors but also similar expression
patterns, we expected that genes in modules would more likely be functionally
related than sets of genes identified by location data alone. Indeed, we found
that gene modules derived using the GRAM algorithm were almost three times
more likely to show enrichment for genes in the same MIPS functional category
than were sets of genes derived solely from location data.
We similarly expected that genes in modules derived by the GRAM
algorithm would be more likely to show independent evidence of co-regulation by
the regulators assigned to the module when compared to sets of genes obtained
using location data alone. One line of evidence for such an improvement would
be enrichment for specific DNA sequence motifs. We identified 34 transcriptional
regulators that bind to genes in at least one module and have well-characterized
DNA binding motifs in the TRANSFAC database (Matys et al. 2003). For each of
these 34 transcriptional regulators, we generated a list of genes in modules
bound by the regulator and a second list of genes bound by the regulator using
location data alone (stringent p-value cutoff of .001). We then computed the
percentage of genes from each list that contained the appropriate known motif in
178

the upstream region of DNA. We found that in most cases, the percentage of
genes containing the correct motif was higher when modules generated using the
GRAM algorithm were used as compared to sets of genes generated from
location data alone (see Fig. 3 and Supplementary Table 6).
For the gene modules discussed above, we used a very large set of
genome-wide location and expression data, which allowed us to validate the
results of the GRAM algorithm comprehensively with searches of the prior
literature, independent chromatin-IP experiments, and analysis for enrichment for
genes in the same MIPS category and for known DNA binding motifs. The
results of this large-scale validation gave us confidence that the GRAM algorithm
would be useful in analyzing new data sources. Since biological insights are
often gained by examining responses to specialized treatments or environmental
conditions, we were interested in exploring the performance of the GRAM
algorithm on a smaller, more biologically targeted data set than the rich media
data. So, we chose to examine a transcriptional regulatory sub-network involved
in the response to Tor kinase signaling.
The Tor proteins are highly conserved and function as critical regulators in
the response to nutrient stress (Hardwick et al. 1999; Raught et al. 2001; Crespo
and Hall 2002; Jacinto and Hall 2003). Tor kinase signaling can be inhibited by
the addition of the small macrolide rapamycin, which mimics nutrient starvation
and results in a wide range of physiological responses including cytoskeleton
reorganization, decreased translation initiation, decreased ribosome biogenesis,
179

Basl Hap3
Msn4
Stel2 * Gcr Gcn4
Yapl
RebICad Reb
Leu3 o Put3
* _ o -
9- o V
10 20 30 40 50 60 70 80 90 100
DNA-binding data only
Figure 3
E
._
':
O
100
90
80
70
60
50
40
30
20
10
0
0

Figure 3: Motif enrichment
Genes in modules discovered by the GRAM algorithm are more likely to show
independent evidence of co-regulation by the regulators assigned to the module
when compared to sets of genes obtained using genomic location analysis data
alone, as demonstrated by an enrichment for the presence of known DNA-
binding motifs. We identified 34 transcriptional regulators that bind to genes in at
least one module and have well-characterized DNA binding motifs in the
TRANSFAC database (Matys et al. 2003). For each of these 34 transcriptional
regulators, we generated a list of genes in modules bound by the regulator and a
second list of genes bound by the regulator using location analysis data alone
(stringent p-value cutoff of .001). We then computed the percentage of genes
from each list that contained the appropriate known motif in the upstream region
of DNA. In most cases, the percentage of genes containing the correct motif was
higher when modules generated using the GRAM algorithm were used versus
sets of genes generated from location analysis data alone. See Supplementary
Table 6 online for a complete list of transcription factors.
181

amino acid permease regulation, and autophagy (Cardenas et aL 1999; Rep et
al. 2000; Shamji et al. 2000; Hasan et al. 2002). Expression analysis indicates
that Tor signaling also controls transcriptional regulation of metabolic pathways
involving nitrogen metabolism, glycolysis and the TCA cycle (Cardenas et al.
1999; Hardwick et al. 1999; Shamji et al. 2000).
The rapamycin response presented an ideal opportunity for applying the
GRAM algorithm to analyzing a novel transcriptional regulatory sub-network.
Previous studies suggest a specific set of regulators that are likely to function in
the transcriptional response to rapamycin (Hardwick et al. 1999; Shamji et al.
2000). Also, several publicly available genome-wide expression datasets
measuring response after rapamycin treatment are available (Hardwick et al.
1999; Shamji et al. 2000). More importantly, the fact that there is little
information about the transcriptional regulatory network involved and how this
transcriptional network may contribute to the overall response to rapamycin
treatment presented an opportunity for new biological insights.
We selected 14 transcriptional regulators that seemed likely to function in
the rapamycin response in S. cerevisiae based on evidence from the literature,
and performed genome-wide location analysis experiments (see the Methods
section and Supplementary Table 7 online for full details). We ran the GRAM
algorithm using the location data for the 14 transcription factors in rapamycin and
22 previously published expression experiments relevant to rapamycin
conditions. Thirty-nine gene modules containing 317 unique genes and
regulated by 13 transcription factors were discovered (see Fig. 4 and
182

Figure 4
ITranscription factor (TF) -TF regulates module -TF regulates TF
Module categories*A.A. metabolism/biosynth. *Fermentation *mRNA processing*Nitrogen/sulfur metabolism Pheromone response * Unknown*Lipid/fatty acid metabolism Transport facilitation*TCA cycle/respiration g Ribosome/translation

Figure 4: Rapamycin gene modules network
Analysis of the rapamycin transcriptional regulatory sub-network revealed a
number of novel biological insights, including evidence that some transcriptional
regulators may control genes involved in biological pathways different from those
generally associated with these regulators. Further, analysis of the network
suggested more complex regulatory interactions in which there is communication
among modules. Such complicated network topologies may be important for
facilitating rapid and flexible responses to changing environmental conditions.
See the text for further details. Thirty-nine modules containing 317 unique genes
and regulated by 13 transcription factors were discovered. Red arrows between
transcriptional regulators indicate that the source transcription factor binds at
least one module containing the target transcription factor. Modules are colored
according to the MIPS category to which a significant number of genes belong
(significance test using the hypergeometric distribution p < .05).
184

Supplementary Table 8 online). The GRAM algorithm added 192 gene-regulator
interactions that would not have been identified with a strict p-value (.001) in the
location analysis experiments. Since genome-wide binding experiments for the
rapamycin regulatory network have not previously been performed, it was not
possible to verify these interactions comprehensively using literature searches.
As in the case for the rich media gene modules network, many features of
the rapamycin regulatory network discovered by the GRAM algorithm were
consistent with expectations from the literature. Twenty-three of the gene
modules were found to contain a significant number of genes (p-value < 0.05)
belonging to a single MIPS category. There were a total of 9 categories, all
corresponding to biological responses associated with rapamycin treatment
(Raught et al. 2001; Crespo and Hall 2002; Jacinto and Hall 2003). We also
found that in general, regulators were assigned to genes that reflect functions
described in previously published results.
In addition to identifying established regulatory interactions, analysis of the
rapamycin gene modules suggested several unexpected interactions in which
regulators typically assigned to a particular biological response also appear to
bind genes acting in different biological pathways. Below we give several
examples of such regulatory interactions. These findings suggest models of
transcriptional regulation of the rapamycin response that can be validated in
further more directed studies. A first example of an unexpected regulatory
interaction involves the factors Msn2 and Msn4, which are generally regarded as
stress response factors and have been well-studied as activators of such stress-
185

related responses (Martinez-Pastor et al. 1996; Boy-Marcotte et al. 1998; Rep et
al. 2000; Hasan et al. 2002). Unexpectedly, there were five gene modules in
which Msn2 and Msn4 were bound to a significant number of genes involved in
the mating pheromone response pathway. A second example involves the
factors Rtg1 and Rtg3, which are generally thought to regulate directly genes of
the TCA cycle and indirectly contribute to nitrogen metabolism (Liao and Butow
1993; Komeili et al. 2000; Crespo et al. 2002; Schuller 2003) (products of the
TCA cycle are shunted to nitrogen metabolism pathways in low or poor nitrogen
conditions). The gene modules network suggests that Rtg regulators may
directly regulate genes involved in nitrogen metabolism.
A third example of an unexpected regulatory interaction involves Hap2, a
part of the Hap2/3/4/5 complex which has been well-characterized as a regulator
of genes involved in respiration (Pinkham and Guarente 1985; Schuller 2003).
Indeed, in the rich media gene modules network, members of the Hap complex
are unique among the 106 regulators profiled as the only regulators controlling
modules that are significantly enriched for genes involved in respiration. As
expected, Hap2 regulates a module of respiration genes under rapamycin
conditions. Unexpectedly, Hap2 was also found to regulate two modules
containing genes involved in nitrogen metabolism. There is some genetic
evidence for such cross-pathway regulation, as Hap2 was previously implicated
as a regulator of two nitrogen metabolism genes (Dang et al. 1996a; Dang et al.
1996b). Our results indicate that Hap2 participates in cross-pathway regulation
more extensively than previously reported.
186
I-` '-"`I·' -Il'·-'�Yy"··--·�-ii.�··tlY·LLI--iYW-·-·

In addition to suggesting that some transcriptional regulators may control
genes involved in biological pathways different from those generally associated
with these regulators, analysis of the gene modules network suggests more
complex regulatory interactions in which there is communication among gene
modules. Such complicated network topologies may be important for facilitating
rapid and flexible responses to changing environmental conditions. As an
example, we found that several transcriptional regulators may be involved in a
feed-forward regulatory loop in which the gene encoding a regulator is bound by
another regulator and both regulators bind to a set of common genes (Lee et al.
2002; Shen-Orr et al. 2002). The regulator Gat1 has been previously identified
as a general activator of nitrogen responsive genes (Coffman et al. 1996). We
found that Gat1 is itself contained in several modules along with genes involved
in nitrogen metabolism. These gene modules are bound by the transcriptional
regulators Dal81, Dal82, Gln3 and Hap2. Interestingly, Gat1 also binds several
gene modules along with DaI81, Dal82, and Gln3 (see Fig. 4). Feed-forward
mechanisms may be important in regulatory responses (such as the response to
rapamycin) by modulating regulatory sensitivity to sustained rather than transient
inputs, providing temporal control, or amplifying the transcriptional response
(Shen-Orr et al. 2002). These findings can be validated in further directed
experimental studies.
The above analyses indicate that the GRAM algorithm can be useful for
studying transcriptional regulatory networks using genome-wide location and
expression data sources. We have made a Java implementation of the algorithm
187
.... .. -. *l·-~r l··- L- · ~-·l~1r

publicly available (see Supplementary Methods online), and believe that as new
genome-wide location data becomes increasingly available other researchers will
find the algorithm helpful. As demonstrated, the algorithm can integrate sources
of genome-wide location and expression data to help compensate for technical
limitations in the data. Further, the inferred gene modules networks can give a
clearer view of regulation than can either location or expression data sources
alone. We have found the algorithm is particularly useful for uncovering how
certain regulators may act in multiple biological pathways. Overall, the GRAM
algorithm facilitates a genome-wide approach to analysis of transcriptional
regulatory networks that can suggest specific novel regulatory models, which can
then be validated in more directed experimental studies.
188

Methods
The GRAM (Genetic RegulAtory Modules) algorithm
Below we describe the operation of the algorithm. Some details are
omitted due to space constraints; see the Supplementary Methods online for
complete information as well as a Java implementation of the algorithm.
Let ei denote an expression vector and bi a vector of binding p-values for
gene i, where there are ng genes. Let B(i,t) denote the set of all transcription
factors that bind to gene i with p-value less than t, i.e., the list of indices j such
that bj < t. Let F c B(i,t) denote a subset of the transcription factors that are
bound to i. Let G(F,t) be the set of all genes i such that for any gene i E G(F,t),
F c B(i,t), i.e., genes to which all the factors in F bind with a given significance
threshold. The algorithm begins by going over all genes, and assigning each
gene i to all possible sets G(F,t1 ), where t is a high stringency binding threshold
and F ranges over all subsets of B(i,t).
For every set of transcription factors F, the genes in G(F,t) serve as
candidates for a module regulated by F. For each such set G(F,t1 ) with a
sufficient number n of genes (e.g., n > 5), the algorithm attempts to find a "core"
expression profile. That is, we are seeking a point c in expression space such
that for an expression similarity threshold Sn, the ball centered at c of radius sn
contains as many genes in G(F,ti) as possible. Denote by C(F,t1,c) the "core" set
of genes such that C(F,tl,c) c G(F,tI) and for each gene i C(F,t1,c), d(ei,c) < Sn,
where d is the Euclidian distance between two points. The threshold Sn is
determined by using all genes, and randomly sampling subsets of size n to
189
determine the distribution of expression distances from a subset to all genes.
The problem of finding a point c for a set of expression vectors is non-trivial, and
cannot be optimally solved in reasonable time given the dimensionality of the
expression space (>500). Thus, we use a theoretically motivated approximation
algorithm which looks for the central point in all triplets of genes in G(F,t). See
the Supplementary Methods online for more details.
The genes in C(F,t 1,c) are used to initialize a module M(F). Conceptually,
we would like to expand this module by relaxing our criteria for binding if a gene's
expression profile is sufficiently similar to those in the "core." In order to do so,
the algorithm calculates a combined p-value pi for each gene i that belongs to the
expanded set C(F,t2,c) and does not belong to C(F,tq,c), where t2 > t. The p-
value pi is arrived at by computing independent p-values for gene i and each
transcription factor in F and then combining the p-values using the Fisher
method. A gene i from C(F,t2,c) is then included in M(F) if pi < t. This module
initialization and expansion is completed for each feasible F, starting with the
sets containing the largest number of factors and proceeding to the smallest. If
a gene is included in a module M(F), it is masked out (not considered) when
forming modules with factor subsets, M(F') where F' cF. That is, the algorithm
will seek to explain a gene's expression using the most specific regulatory
patterns. The thresholds t=.001 and t2=.01 were chosen based on experiments
reported in Lee et al. (Lee et al. 2002) that suggested very low false positive
rates for a significance threshold of .001. Further, the rate of false negatives was
190
·-�-- · ·-- · l�rr_��··-�W1Y·Y·-U··LUiCII·--Y�--� y ·.y·-IIYIYlr-·-j--L··-·L+·U·IIIYM*· ·- · W·nUU···LY·IIY--·I�·LW·YYIIWL·�·-iW·j _; L�Y·Y·j·i�l�UIUI· · ·I-IIPC�YYY

found to be relatively high for p-values between .01 and .001, but decreased
dramatically (to less than 3%) thereafter.
Strains
Epitope-tagged strains were generated as described previously (Lee et al.
2002). Briefly, regulators were tagged at the C-terminus by using homologous
recombination to insert multiple copies of the Myc epitope coding sequence into
the normal chromosomal loci of these genes. Insertion of the epitope coding
sequence was confirmed by PCR and expression of the epitope-tagged protein
was confirmed by Western blotting analysis.
Growth conditions
Strains containing epitope-tagged regulators were grown in 50 ml YPD
(yeast extract - peptone - dextrose) at 30 degrees C. Cells were grown to an
OD600 of 0.7-0.8 and rapamycin was then added to a final concentration of 100
nM. Cells were grown for 20 minutes at 30 degrees C in the presence of
rapamycin.
Genome-wide Location Analysis
Genome-wide location analysis was performed as previously described
(Lee et al. 2002). Briefly, cells containing an epitope-tagged regulator were fixed
with formaldehyde (1% final concentration) and then harvested by centrifugation.
Cells were lysed and then sonicated to shear DNA. DNA fragments representing
191
chromosomal regions crosslinked to a protein of interest were enriched by
immunoprecipitation with an anti-epitope antibody. After reversal of crosslinking,
enriched DNA was purified. The ends of DNA fragments were then blunted using
T4 DNA polymerase and ligated to previously prepared linkers. The enriched
DNA was then amplified and labeled with a fluorescent dye by ligation-mediated
PCR (LM-PCR). A sample of control DNA was similarly processed and labeled
with a different fluorophore. Both IP-enriched and control DNA were then
hybridized to a single DNA microarray. For each factor, three independently
grown cell cultures were processed and scanned to generate binding information
as previously described.
192

References:
Baker HV (1986). "Glycolytic gene expression in Saccharomyces cerevisiae:nucleotide sequence of GCR1, null mutants, and evidence for expression." MolCell Biol 6(11): 3774-84.
Berman BP, Nibu Y, Pfeiffer BD, Tomancak P, Celniker SE, Levine M, Rubin GMand Eisen MB (2002). "Exploiting transcription factor binding site clustering toidentify cis-regulatory modules involved in pattern formation in the Drosophilagenome." Proc Natl Acad Sci U S A 99(2)' 757-62.
Boy-Marcotte E, Perrot M, Bussereau F, Boucherie H and Jacquet M (1998)."Msn2p and Msn4p control a large number of genes induced at the diauxictransition which are repressed by cyclic AMP in Saccharomyces cerevisiae." JBacteriol 180(5): 1044-52.
Cardenas ME, Cutler NS, Lorenz MC, Di Como CJ and Heitman J (1999). "TheTOR signaling cascade regulates gene expression in response to nutrients."Genes Dev 13(24): 3271-9.
Coffman JA, Rai R, Cunningham T, Svetlov V and Cooper TG (1996). "Gatlp, aGATA family protein whose production is sensitive to nitrogen cataboliterepression, participates in transcriptional activation of nitrogen-catabolic genes inSaccharomyces cerevisiae." Mol Cell Biol 16(3): 847-58.
Crespo JL and Hall MN (2002). "Elucidating TOR signaling and rapamycin action:lessons from Saccharomyces cerevisiae." Microbiol Mol Biol Rev 66(4): 579-91,table of contents.
Crespo JL, Powers T, Fowler B and Hall MN (2002). "The TOR-controlledtranscription activators GLN3, RTG1, and RTG3 are regulated in response tointracellular levels of glutamine." Proc Natl Acad Sci U S A 99(10): 6784-9.
Dang VD, Bohn C, Bolotin-Fukuhara M and Daignan-Fornier B (1996a). "TheCCAAT box-binding factor stimulates ammonium assimilation in Saccharomycescerevisiae, defining a new cross-pathway regulation between nitrogen andcarbon metabolisms." J Bacteriol 178(7): 1842-9.
Dang VD, Valens M, Bolotin-Fukuhara M and Daignan-Fornier B (1996b)."Cloning of the ASN1 and ASN2 genes encoding asparagine synthetases inSaccharomyces cerevisiae: differential regulation by the CCAAT-box-bindingfactor." Mol Microbiol 22(4): 681-92.
Eisen MB, Spellman PT, Brown PO and Botstein D (1998). "Cluster analysis anddisplay of genome-wide expression patterns." Proc Natl Acad Sci U S A 95(25):14863-8.
193

Forsburg SL and Guarente L (1989). "Identification and characterization of HAP4:a third component of the CCAAT-bound HAP2/HAP3 heteromer." Genes Dev3(8): 1166-78.
Hardwick JS, Kuruvilla FG, Tong JK, Shamji AF and Schreiber SL (1999)."Rapamycin-modulated transcription defines the subset of nutrient-sensitivesignaling pathways directly controlled by the Tor proteins." Proc Natl Acad Sci US A 96(26): 14866-70.
Hasan R, Leroy C, Isnard AD, Labarre J, Boy-Marcotte E and Toledano MB(2002). "The control of the yeast H202 response by the Msn2/4 transcriptionfactors." Mol Microbiol 45(1): 233-41.
Holland MJ, Yokoi T, Holland JP, Myambo K and Innis MA (1987). "The GCR1gene encodes a positive transcriptional regulator of the enolase andglyceraldehyde-3-phosphate dehydrogenase gene families in Saccharomycescerevisiae." Mol Cell Biol 7(2): 813-20.
Ihmels J, Friedlander G, Bergmann S, Sarig O, Ziv Y and Barkai N (2002)."Revealing modular organization in the yeast transcriptional network." Nat Genet31(4): 370-7.
Jacinto E and Hall MN (2003). "Tor signalling in bugs, brain and brawn." Nat RevMol Cell Biol 4(2): 117-26.
Komeili A, Wedaman KP, O'Shea EK and Powers T (2000). "Mechanism ofmetabolic control. Target of rapamycin signaling links nitrogen quality to theactivity of the Rtgl and Rtg3 transcription factors." J Cell Biol 151(4): 863-78.
Lee TI, Rinaldi NJ, Robert F, Odom DT, et al. (2002). "Transcriptional regulatorynetworks in Saccharomyces cerevisiae." Science 298(5594): 799-804.
Liao X and Butow RA (1993). "RTG1 and RTG2: two yeast genes required for anovel path of communication from mitochondria to the nucleus." Cell 72(1): 61-71.
Martinez-Pastor MT, Marchler G, Schuller C, Marchler-Bauer A, Ruis H andEstruch F (1996). "The Saccharomyces cerevisiae zinc finger proteins Msn2pand Msn4p are required for transcriptional induction through the stress responseelement (STRE)." Embo J 15(9): 2227-35.
Matys V, Fricke E, Geffers R, Gossling E, et a/. (2003). "TRANSFAC:transcriptional regulation, from patterns to profiles." Nucleic Acids Res 31(1):374-8.
Mewes HW, Frishman D, Gruber C, Geier B, et al. (2000). "MIPS: a database forgenomes and protein sequences." Nucleic Acids Res 28(1): 37-40.
194
··.. - -·- --· -- -l-- ·- . - __'--- ' -· -- ·· -· -· . ----- .. --l-· - - , · a , ·--.. . - -· ~-- .....- - . - ...-- . - --· - - .·..- ..'I· ..l·-- _-lr _r _ ............._·-·r· -.-· ··~

Pilpel Y, Sudarsanam P and Church GM (2001). "Identifying regulatory networksby combinatorial analysis of promoter elements." Nat Genet 29(2): 153-9.
Pinkham JL and Guarente L (1985). "Cloning and molecular analysis of theHAP2 locus: a global regulator of respiratory genes in Saccharomycescerevisiae." Mol Cell Biol 5(12): 3410-6.
Raught B, Gingras AC and Sonenberg N (2001). "The target of rapamycin (TOR)proteins." Proc Natl Acad Sci U S A 98(13): 7037-44.
Rep M, Krantz M, Thevelein JM and Hohmann S (2000). "The transcriptionalresponse of Saccharomyces cerevisiae to osmotic shock. Hotl p andMsn2p/Msn4p are required for the induction of subsets of high osmolarityglycerol pathway-dependent genes." J Biol Chem 275(12): 8290-300.
Schuller HJ (2003). "Transcriptional control of nonfermentative metabolism in theyeast Saccharomyces cerevisiae." Curr Genet 43(3): 139-60.
Segal E, Shapira M, Regev A, Pe'er D, Botstein D, Koller D and Friedman N(2003). "Module networks: identifying regulatory modules and their condition-specific regulators from gene expression data." Nat Genet 34(2): 166-76.
Shamji AF, Kuruvilla FG and Schreiber SL (2000). "Partitioning the transcriptionalprogram induced by rapamycin among the effectors of the Tor proteins." CurrBiol 10(24): 1574-81.
Shen-Orr SS, Milo R, Mangan S and Alon U (2002). "Network motifs in thetranscriptional regulation network of Escherichia coli." Nat Genet 31(1): 64-8.
195
-;:_ -^--.I.----..:--iL~:jYLiU~~uY·iilii·~; i~*·~·LaI~~-- i~U~~:_~~~L·~l·IUl ~ O~_~I···I·ILLIU Y · ·~~I·