Extreme mineral-scale Sr isotope heterogeneity in granites by disequilibrium melting of the crust
Upload
independentCategory
view
1download
0
, 20122974, published online 30 January 2013280 2013 Proc. R. Soc. B Primmer, J. Merilä and E. H. LederM. Nikinmaa, R. J. S. McCairns, M. W. Nikinmaa, K. A. Vuori, M. Kanerva, T. Leinonen, C. R. sticklebackequilibrium and disequilibrium levels in the three-spined Transcription and redox enzyme activities: comparison of
Referenceshttp://rspb.royalsocietypublishing.org/content/280/1755/20122974.full.html#ref-list-1
This article cites 44 articles, 12 of which can be accessed free
Subject collections
(32 articles)systems biology � (50 articles)physiology �
(1383 articles)evolution � Articles on similar topics can be found in the following collections
Email alerting service hereright-hand corner of the article or click Receive free email alerts when new articles cite this article - sign up in the box at the top
http://rspb.royalsocietypublishing.org/subscriptions go to: Proc. R. Soc. BTo subscribe to
on January 30, 2013rspb.royalsocietypublishing.orgDownloaded from
on January 30, 2013rspb.royalsocietypublishing.orgDownloaded from
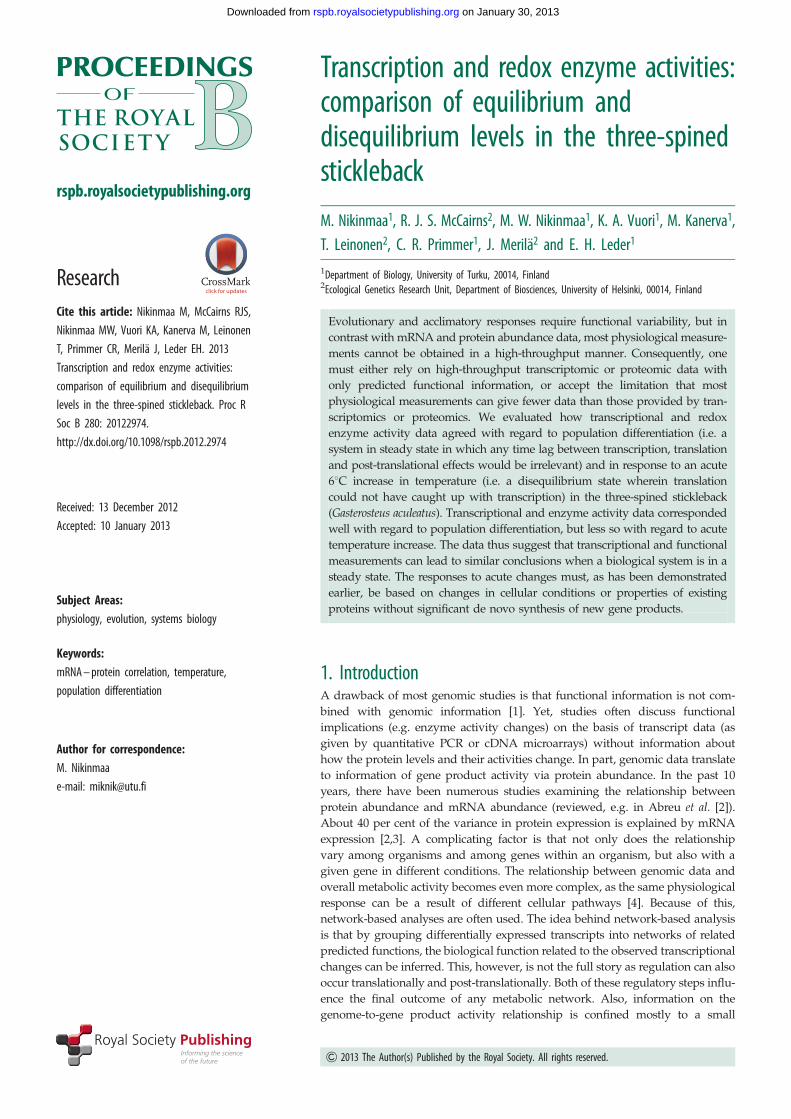
rspb.royalsocietypublishing.org
ResearchCite this article: Nikinmaa M, McCairns RJS,
Nikinmaa MW, Vuori KA, Kanerva M, Leinonen
T, Primmer CR, Merila J, Leder EH. 2013
Transcription and redox enzyme activities:
comparison of equilibrium and disequilibrium
levels in the three-spined stickleback. Proc R
Soc B 280: 20122974.
http://dx.doi.org/10.1098/rspb.2012.2974
Received: 13 December 2012
Accepted: 10 January 2013
Subject Areas:physiology, evolution, systems biology
Keywords:mRNA – protein correlation, temperature,
population differentiation
Author for correspondence:M. Nikinmaa
e-mail: [email protected]
& 2013 The Author(s) Published by the Royal Society. All rights reserved.
Transcription and redox enzyme activities:comparison of equilibrium anddisequilibrium levels in the three-spinedstickleback
M. Nikinmaa1, R. J. S. McCairns2, M. W. Nikinmaa1, K. A. Vuori1, M. Kanerva1,T. Leinonen2, C. R. Primmer1, J. Merila2 and E. H. Leder1
1Department of Biology, University of Turku, 20014, Finland2Ecological Genetics Research Unit, Department of Biosciences, University of Helsinki, 00014, Finland
Evolutionary and acclimatory responses require functional variability, but in
contrast with mRNA and protein abundance data, most physiological measure-
ments cannot be obtained in a high-throughput manner. Consequently, one
must either rely on high-throughput transcriptomic or proteomic data with
only predicted functional information, or accept the limitation that most
physiological measurements can give fewer data than those provided by tran-
scriptomics or proteomics. We evaluated how transcriptional and redox
enzyme activity data agreed with regard to population differentiation (i.e. a
system in steady state in which any time lag between transcription, translation
and post-translational effects would be irrelevant) and in response to an acute
68C increase in temperature (i.e. a disequilibrium state wherein translation
could not have caught up with transcription) in the three-spined stickleback
(Gasterosteus aculeatus). Transcriptional and enzyme activity data corresponded
well with regard to population differentiation, but less so with regard to acute
temperature increase. The data thus suggest that transcriptional and functional
measurements can lead to similar conclusions when a biological system is in a
steady state. The responses to acute changes must, as has been demonstrated
earlier, be based on changes in cellular conditions or properties of existing
proteins without significant de novo synthesis of new gene products.
1. IntroductionA drawback of most genomic studies is that functional information is not com-
bined with genomic information [1]. Yet, studies often discuss functional
implications (e.g. enzyme activity changes) on the basis of transcript data (as
given by quantitative PCR or cDNA microarrays) without information about
how the protein levels and their activities change. In part, genomic data translate
to information of gene product activity via protein abundance. In the past 10
years, there have been numerous studies examining the relationship between
protein abundance and mRNA abundance (reviewed, e.g. in Abreu et al. [2]).
About 40 per cent of the variance in protein expression is explained by mRNA
expression [2,3]. A complicating factor is that not only does the relationship
vary among organisms and among genes within an organism, but also with a
given gene in different conditions. The relationship between genomic data and
overall metabolic activity becomes even more complex, as the same physiological
response can be a result of different cellular pathways [4]. Because of this,
network-based analyses are often used. The idea behind network-based analysis
is that by grouping differentially expressed transcripts into networks of related
predicted functions, the biological function related to the observed transcriptional
changes can be inferred. This, however, is not the full story as regulation can also
occur translationally and post-translationally. Both of these regulatory steps influ-
ence the final outcome of any metabolic network. Also, information on the
genome-to-gene product activity relationship is confined mostly to a small

rspb.royalsocietypublishing.orgProcR
SocB280:20122974
2
on January 30, 2013rspb.royalsocietypublishing.orgDownloaded from
number of model organisms. This biases functional predictions
based on gene sequences—they can give accurate results as
long as the function of the gene product is similar to that in
model organisms, but in the case of divergent pathways or
neofunctionalization, such predictions may be erroneous. Con-
sequently, there is a need for investigations simultaneously
assessing transcriptional changes and protein activities for
the same animals with the ultimate goal of evaluating con-
ditions under which conclusions of functional or structural
changes can be drawn from transcript data and those in
which it cannot.
Self-evidently, the ecological and evolutionary success of
organisms depends both on their functions and the adapta-
bility of these functions. However, a full understanding of
the evolutionary potential and constraints of such functions
remains a challenge since inference based strictly on gene
sequences or protein abundances rather than actual protein
activities gives us an incomplete picture. For example,
Oleksiak et al. [5] have estimated the relationship between
transcriptional differences of genes coding for enzymes
involved in cardiac energy metabolism and protein activity
changes. They found that there was marked inter-individual
variation in the relationship between mRNA expression and
activity of enzymes coded for by the genes. The individuals
could be divided into different groups with regard to major
metabolic substrate type used. These results strengthen the
conclusion that information regarding gene product activity
is required to get a complete picture about the ecologically
and evolutionarily important organismal activities and their
relationship to genomic data.
It is now possible to use high-throughput methods to
obtain transcriptomic [6] and protein abundance [7] data. Simi-
lar high-throughput methodology is not available for most
protein activity measurements. As an example, while it is poss-
ible to determine how a treatment affects the transcription of
thousands of genes with microarrays, one cannot measure
the biological activities of the thousands of gene products
even if rapid measurements of one or a few gene product
activities are possible. It has become common to carry out
microarray and quantitative reverse transcription PCR
measurements also in evolutionary studies, and use thus
obtained transcript data to infer functions, or use variations
in protein abundance to infer the overall activity of the protein.
To increase their usefulness in evolutionary studies, the
relationship of such genomic and proteomic data to gene
product activity data should be evaluated.
In the present study, we evaluated the correspondence of
genomic and enzyme activity data in both steady-state and
disequilibrium conditions using the three-spined stickleback
as model. This species was selected for the following reasons:
first, its genome has been sequenced [8] which has facilitated
development of genomic resources, such as a high density
custom microarray [9]; second, it is a major model in evol-
utionary studies [10]; and third, physiological and genomic
measurements in this species have been integrated [11].
Two different types of data were examined: the relationship
between transcription and redox enzyme activities at the
steady state was studied by evaluating the differences
between populations, and the relationship in disequilibrium
conditions by looking at the responses to acute temperature
change. The acute temperature increase was of such a short
duration that transcriptional and translational responses
could be uncoupled [12,13]. We used redox balance and
redox enzyme activities to estimate some physiological
features, as the redox balance is a major evolutionarily
adjusted parameter [14] integrating both temperature and
oxygen-level changes [15–17].
2. Material and methods(a) FishMature sticklebacks from Lake Pulmankijarvi in Finnish Lapland
(698580500 N, 2785903500 E), the Baltic Sea in the vicinity of Hel-
sinki, Finland (5984901700 N, 2285801400 E) and Lake Vattern
(5883800000 N, 1485100000 E) from south-central Sweden were
spawned, and fertilized eggs were transported to the laboratory
at the University of Helsinki where the fish hatched. After hatch-
ing, the fish were maintained at 17 + 18C, with a photoperiod of
18 L : 6 D cycle for six months, whereafter their environmental
conditions were gradually changed to simulate wintering con-
ditions (24 h darkness; temperature 9 + 18C). After five
months, fish were stimulated to breed by gradually reverting
the photoperiod back to an 18 L : 6 D cycle and the water temp-
erature to 17 + 18C. The generated F2 offspring from each
population was used in the experiments at approximately 20
months of age. Although sexually mature, all experimental fish
were reproductively inactive. Ten F2 fish from each population
were housed in one of two identical tanks (20 fish per population
altogether). Fish were acclimated overnight. One tank was main-
tained as a control at 178C, and water in the second tank was
heated approximately 18C per hour for 6 h to a final temperature
of 238C. After 1 h at the final temperature, every fish was eutha-
nized with a lethal amount of MS-222 in water, and its liver
removed and immediately frozen in liquid nitrogen and stored
at 2808C. In total, sufficient quantities of RNA and protein
could be extracted from 50 fish and used to measure enzyme
activities; a random subset of these same individuals (n ¼ 35)
were also used for transcriptome-wide (microarray) analysis of
transcript expression.
(b) Sample preparationFor transcriptome work, total RNA was isolated from liver tissue
by means of Tri Reagent (Sigma; St Louis, MO, USA), following
the manufacturer’s protocol. RNA was treated with DNase (Pro-
mega; Madison, WI, USA) and re-isolated using Tri Reagent.
RNA concentration was quantified using a Nanodrop ND-1000
(Thermo Scientific; Waltham, MA, USA), and RNA quality was
assessed using an Experion automated electrophoresis system
(Bio-Rad; Hercules, CA, USA).
For glutathione (GSH) concentration and enzyme activity
measurements, the frozen liver samples were homogenized
using TissueLyser II Bead mill (Qiagen, Hamburg, Germany)
in 0.1 M K2HPO4þ 0.15 M KCl-buffer (pH 7.4). The homogenate
was centrifuged for 15 min at 10 000g at þ48C. The supernatant
was divided into several aliquots of which one was used for
the preparation of the GSH determination sample and the rest
were frozen in liquid nitrogen and stored at 2808C until further
measurements.
(c) Microarray analysisA short oligo microarray was custom-designed as earlier
described [9]. Each sample (1.65 mg) was hybridized to the
custom-designed stickleback array at 658C overnight (17 h)
using Agilent’s GE Hybridization Kit. Washes were carried out
as recommended by the manufacturer using Agilent’s Gene
Expression Wash Pack. Arrays were scanned with Agilent
Technologies Scanner, model G2505B. Spot intensities and
other quality control features were extracted with Agilent’s

rspb.royalsocietypublishing.orgProcR
SocB280:20122974
3
on January 30, 2013rspb.royalsocietypublishing.orgDownloaded from
Feature Extraction Software v. 9.5.3.1. Array quality was assessed
through the use of Agilent control features, as well as spike-in
controls (Agilent One-Color Spike-in Kit for RNA experiment).
Feature Extraction Software was used to flag features above back-
ground at the 99%; however, to further filter the data within each
population, only probes with a background-corrected median
intensity value of greater than 50 across their respective groups
were retained. Because probes with very low expression levels
may not be reliable, this is similar to keeping only the probes
that are more than two times as intense as background levels.
Post-processed signals were further normalized within and
across arrays using the quantile method, implemented in the
R/BIOCONDUCTOR package ‘limma’ [18]. Probes with missing
values were removed from further analyses, which were thus
based on data for 23 946 unique probes, representing 11 203
predicted/projected genes (Ensembl Stickleback Genome
v. 65.1, updated May 2010). The microarray data are available
at http://www.ebi.ac.uk/microarray-as/ae/ with accession no.
A-MEXP-1443.
Differentially expressed transcripts between populations
were identified using the empirical Bayes procedure [19], as
implemented in the R/BIOCONDUCTOR package ‘siggenes’ [20].
This was performed within each temperature treatment separately,
and by iteratively selecting a Z-score correction factor ‘a0’ par-
ameter to achieve an acceptable posterior false discovery rate
(less than or equal to 0.10). Transcript lists were then pooled
prior to enrichment analyses. Similarly, to identify probes differen-
tially expressed between temperature treatments, data were
analysed via the empirical Bayes procedure (populations
pooled) contrasting control and temperature treatment groups.
(d) Functional annotation analysisThe database for annotation, visualization and integrated discov-
ery (DAVID) [21] was used to determine if differentially
expressed probes were significantly over-represented by genes
of particular functional categories [22]. Although DAVID will
accept several probe identifiers, Entrez Gene identifiers generally
produce the most comprehensive annotation data [23,24]. Stickle-
back genes were initially matched to their human orthologues
using BIOMART [25,26], and further supplemented via BLAST
search to increase inferred annotations. Of the 23 946 probes, 75
per cent (18 060) were assigned an Entrez GeneID number.
Approximately the same proportions (1874) of the 2509 probes
differentially expressed among populations, and (2698) of the
3516 probes differentially expressed between temperature treat-
ments were also assigned ENTREZ identifiers. Input for
analysis consisted of the list of differentially expressed probes
with Entrez GeneID, contrasted with a customized ‘background’
set, including only those genes represented on the custom array.
Though DAVID can integrate non-redundant functional annota-
tions across multiple databases, we focused on gene ontology
(GO) annotations at the ‘biological process’ level [27]. We further
restricted output by grouping enriched terms into functional
annotation clusters, using default settings [28].
(e) Glutathione concentration determinationsSamples for GSH determination were deproteinized with 5 per
cent sulfosalicylic acid. Reduced and oxidized GSH species
(GSH/GSSG) were measured with ThioStar GSH detection
reagent (Arbor Assays, MI, USA) using reduced GSH as the stan-
dard (Sigma Chemicals, St. Louis, MO, USA) as described by
Lilley et al. [29].
( f ) Determinations of enzyme activitiesThe enzyme activity determinations were carried out mainly as
described by Vuori et al. [30] at 258C. Briefly, glutathione
reductase (GSR) activity was measured according to Smith
et al. [31]. Glutathione S-transferase (GST) activity was measured
according to Habig et al. [32] with the exception of using 2 mM
GSH instead of 1 mM. Glutathione peroxidase (GPX) activity
was measured using a Sigma kit (Sigma Chemicals) with
2 mM H2O2 as a substrate. The inhibition rate of superoxide dis-
mutase (SOD) was measured using a Fluka kit (Fluka, Buchs,
Germany). The measurement of catalase (CAT) activity was
modified to microplate from the Catalase Assay kit (Sigma
Chemicals), where a reaction of CAT and H2O2 is stopped with
NaN3 [33], an aliquot is pipetted to a microplate and the leftover
H2O2 is detected with colorimetric reaction [34]. The protein con-
tents of the samples were determined using Pierce BCA Reagents
(Thermo Fisher Scientific, Rockford, IL, USA) with bovine serum
albumin (Sigma Chemicals) as the standard.
Both GSH and enzyme activity analyses were conducted
with EnSpire plate reader (Wallac, PerkinElmer Life Sciences,
Turku, Finland) using either 96-well (protein and CAT assays)
or 384-well plates (GSH, GSR, GST, GPX and SOD).
(g) Analysis of trait divergence in enzyme andglutathione concentration data
To infer if between population differences in enzyme data were
best explained by neutral or putatively selective processes, we con-
trasted an index of quantitative genetic differentiation (QST) with
that of neutral genetic divergence [35]. Among and within-
group phenotypic variance were estimated as random effects via
mixed effects modelling, after first controlling for temperature
effects as a fixed model term. Since family groups were
unavailable within each population—the standard source of
within-group variance—we first created five pseudo-replicate
samples within each population-by-treatment group by random
sampling with replacement. Within-group variance was estimated
as variation among replicate samples, nested within each popu-
lation. Confidence intervals (95%) were obtained by parametric
bootstrapping (10 000 simulations). The range of neutral expec-
tation was defined based on a previously published dataset of
17 microsatellite markers [36], using data pertaining only to the
three populations in the current study. We evaluated the dataset
via outlier analysis to ensure that all markers fell within a simu-
lated range of neutral expectation [37], and used the observed
range of FST values for comparison against QST estimates.
(h) Multivariate association between mRNA expressionand enzyme activity
Associations between multivariate descriptors of enzymatic and
transcriptional variation were inferred via co-inertia analysis
(CoIA). In brief, CoIA finds common sets of principal axes for
two datasets pertaining to the same cases—in this instance cases
were individual fish, and datasets were an individual’s transcrip-
tional profile at all 23 946 probes detected above background and
activity data for four enzymes and total GSH concentration—such
that principal components have maximum covariance, while also
accounting for partitioning between and co-variation within
discrete classes/groups of individual cases [38,39]. Only individ-
uals for which both transcriptomic and enzyme activity data
were available were used for CoIA. Between-class (i.e. among
treatment-specific population groups) PCA and CoIA of both
data projections were performed using the ‘ade4’ package [40]
implemented in R. Significant contributions of transcriptional
probes to among-group discrimination was ascertained by evalu-
ating their respective loadings on the dominant principal axes:
probes whose squared score exceeded the 90th quantile of a distri-
bution describing all squared loading scores for a focal axis were
deemed to be significant.
0.30 ***
*
2.2
2.0
1.8
1.6
1.4
1.2
1.0
HEL VAT
catalase
SOD glutathione reductase
glutathione peroxidase
mM
µmol
mg–1
min
–1
µmol
mg–1
min
–1
nmol
mg–1
min
–1
inhi
bitio
n (%
)
total glutathione
PUL HEL VAT PUL
HEL VAT PUL
0.25
0.20
0.15
0.10
0.05
7876747270686664
0
50
100
150
200
250
55
50
45
40
35
30
0
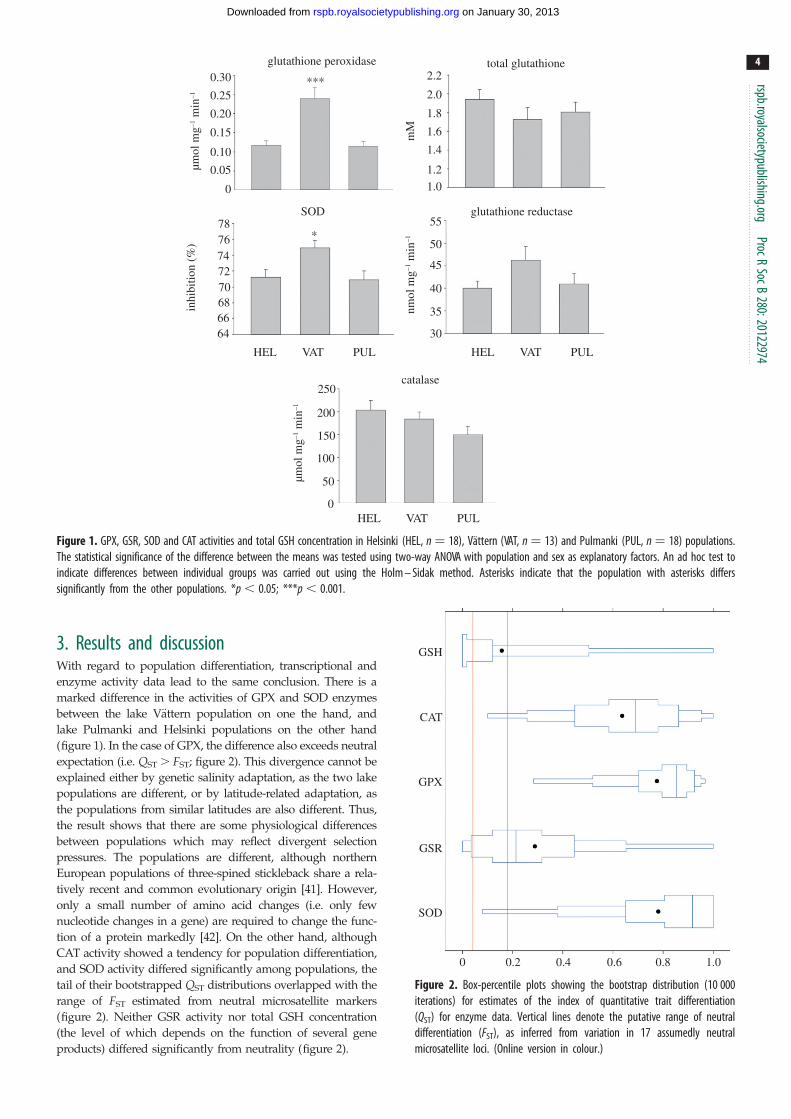
Figure 1. GPX, GSR, SOD and CAT activities and total GSH concentration in Helsinki (HEL, n ¼ 18), Vattern (VAT, n ¼ 13) and Pulmanki (PUL, n ¼ 18) populations.The statistical significance of the difference between the means was tested using two-way ANOVA with population and sex as explanatory factors. An ad hoc test toindicate differences between individual groups was carried out using the Holm – Sidak method. Asterisks indicate that the population with asterisks differssignificantly from the other populations. *p , 0.05; ***p , 0.001.
GSH
CAT
GPX
GSR
SOD
0 0.2 0.4 0.6 0.8 1.0
Figure 2. Box-percentile plots showing the bootstrap distribution (10 000iterations) for estimates of the index of quantitative trait differentiation(QST) for enzyme data. Vertical lines denote the putative range of neutraldifferentiation (FST), as inferred from variation in 17 assumedly neutralmicrosatellite loci. (Online version in colour.)
rspb.royalsocietypublishing.orgProcR
SocB280:20122974
4
on January 30, 2013rspb.royalsocietypublishing.orgDownloaded from
3. Results and discussionWith regard to population differentiation, transcriptional and
enzyme activity data lead to the same conclusion. There is a
marked difference in the activities of GPX and SOD enzymes
between the lake Vattern population on one the hand, and
lake Pulmanki and Helsinki populations on the other hand
(figure 1). In the case of GPX, the difference also exceeds neutral
expectation (i.e. QST . FST; figure 2). This divergence cannot be
explained either by genetic salinity adaptation, as the two lake
populations are different, or by latitude-related adaptation, as
the populations from similar latitudes are also different. Thus,
the result shows that there are some physiological differences
between populations which may reflect divergent selection
pressures. The populations are different, although northern
European populations of three-spined stickleback share a rela-
tively recent and common evolutionary origin [41]. However,
only a small number of amino acid changes (i.e. only few
nucleotide changes in a gene) are required to change the func-
tion of a protein markedly [42]. On the other hand, although
CAT activity showed a tendency for population differentiation,
and SOD activity differed significantly among populations, the
tail of their bootstrapped QST distributions overlapped with the
range of FST estimated from neutral microsatellite markers
(figure 2). Neither GSR activity nor total GSH concentration
(the level of which depends on the function of several gene
products) differed significantly from neutrality (figure 2).

Table 1. Functional enrichment analysis of differentially transcribed genes. (Functional clusters are based on inter-relationships and redundancies among GObiological processes, implemented in DAVID. Ad hoc descriptions of retained clusters are based on common themes/functions of constituent GO annotations.Clusters are ranked by overall enrichment score (enrich. score). Data pertaining to the number of GO terms (no. BP), the number of differentially expressed genetranscripts (no. genes) and the mean (95% quantiles) fold enrichment score (fold enrich.) of constituent GO terms are also presented. Functional clustersrelevant to enzymatic data are italicized.)
functional cluster enrich. score no. BP no. genes fold enrich.
regulation of protein localization transport and secretion 2.34 14 63 2.50 (1.50 – 4.20)
detection of external stimuli 1.66 4 13 2.95 (2.05 – 4.28)
response to steroidal stimuli 1.36 4 12 2.83 (2.02 – 3.60)
regulation of cellular growth 1.11 10 24 1.76 (1.19 – 2.40)
regulation of GTPase activity 1.11 12 40 2.23 (1.10 – 3.90)
regulation of cell adhesion 1.08 3 12 2.17 (1.83 – 2.55)
glucose and carbohydrate homeostasis 1.08 3 9 2.37 (2.20 – 2.65)
regulation of ion transport 1.08 6 12 2.40 (1.83 – 3.70)
nuclear organization 1.03 6 11 2.18 (1.55 – 2.68)
regulation of protein signalling 0.99 3 9 2.70 (2.70 – 2.70)
SMAD protein localization 0.91 3 11 2.50 (1.61 – 3.95)
glucose and carbohydrate metabolism 0.87 27 26 2.37 (1.63 – 3.87)
membrane protein proteolysis 0.87 4 8 3.23 (1.44 – 5.82)
regulation of immune response 0.86 13 28 2.31 (1.04 – 4.80)
response to intra-cellular pathogens 0.85 7 10 2.49 (1.33 – 3.80)
mitochondrial organization 0.83 3 7 3.70 (2.00 – 4.70)
regulation of intra-cellular protein transport 0.81 8 19 1.68 (1.24 – 2.03)
water homeostasis 0.81 6 10 3.22 (1.65 – 4.70)
response to oxidative stress 0.75 9 25 1.92 (1.22 – 2.62)
regulation of lipid metabolism 0.74 14 17 2.33 (1.23 – 3.80)
regulation of macromolecular secretion 0.64 7 7 2.29 (1.76 – 2.70)
exocytosis 0.63 6 26 1.53 (1.13 – 2.03)
GSH, peptide and sulphur metabolism 0.60 3 17 1.57 (1.24 – 1.87)
regulation of cellular development 0.59 7 25 1.90 (1.22 – 2.70)
transport of organic acids 0.55 5 16 1.60 (1.14 – 2.52)
regulation of muscle development 0.53 10 10 1.86 (1.19 – 3.33)
DNA catabolism 0.51 7 14 1.71 (1.36 – 1.97)
rspb.royalsocietypublishing.orgProcR
SocB280:20122974
5
on January 30, 2013rspb.royalsocietypublishing.orgDownloaded from
The differentiation between populations was also seen in
the transcriptome data. In the microarray analysis, we ident-
ified 1698 genes (1834 splice variants in total) which were
differentially transcribed among populations. This reduced
probe-set was largely divided into transcripts that were
differentially expressed in the lake Vattern population when
compared with the other two populations. Enrichment
analysis grouped the differentially transcribed genes into 164
functional clusters. We excluded those clusters with an
enrichment score less than 0.5, and for which the mean fold
enrichment of constituent GO biological processes was signifi-
cantly less than 1. Ultimately, we retained 27 functional
annotation clusters which met these criteria (table 1). Of
these, most inferred functions relate to basic cellular function
and maintenance. However, of the retained groups, ‘responses
to oxidative stress’ and closely related ‘GSH, peptide and
sulphur metabolism’ were in line with trends in independent
enzyme activity data, suggesting inferential correspondence
between datasets.
Even though the number of parameters and the number
of data points in the enzyme activity measurements were
small, they revealed the same clusters as microarray determi-
nations based on several thousand genes with regard to the
different populations. Common ordination in multivariate
space revealed a significant co-variation (35.7%; p ¼ 0.002)
between transcriptional and enzymatic data. A total of
65.7% co-inertia was captured by a single axis which separ-
ated Vattern samples from the other populations (figure 3).
A second co-inertia axis captured 22 per cent of total (co)var-
iation in the data, and described common differences
attributable to thermal treatments. This finding is very reas-
suring for environmentally oriented physiologists, as it
suggests that evolutionarily relevant findings can be made
with datasets that are manageable in terms of measuring.

PUL (23°C)
HEL (23°C)
PUL (17°C)
HEL (17°C)
VAT (17°C)
0.8
0.6
0.4
0.2
ColA1 ColA2 ColA3 ColA4 ColA50
VAT (23°C)
GSH
CAT GSR
GPX
SOD
Figure 3. CoIA of between-group ordinations of log2 transcript abundance (triangles) and GSH enzymatics (circles). Global similarity (co-inertia) between transcrip-tion and enzyme datasets is 35.7% ( p ¼ 0.002). A total of 65.7% of co-inertia is described by the first axis (screeplot; inset lower right) which appears to describedifferentiation between Lake Vattern samples from the other populations. Loadings on this axis (correlation circle; inset upper right) suggest that these differencesare largely driven by SOD and GPX activity. The second co-inertia axis capture 22% of total (co)variation in the data, and describes common differences attributableto thermal treatment—this ‘effect’ seems more pronounced in Helsinki and Lake Pulmankijarvi populations. Loadings on axis two suggest that thermally inducedpatterns of (co)variation are mostly observed with respect to GSR and CAT activity. (Online version in colour.)
rspb.royalsocietypublishing.orgProcR
SocB280:20122974
6
on January 30, 2013rspb.royalsocietypublishing.orgDownloaded from
The observation is also in line with the recent result that there
was more divergence in markers linked to physiologically
important genes than to neutral genes, indicating that phy-
siological processes are important targets of selection
underlying adaptive divergence in this species [43]. The pre-
sent study goes further than the previous one, as we have
looked into both transcriptional and physiological (i.e.
enzyme activity) data. The observation also lends support
for the use of using transcriptional findings for suggesting
functional pathways in cases where a priori function is not
evident when population divergence is studied.
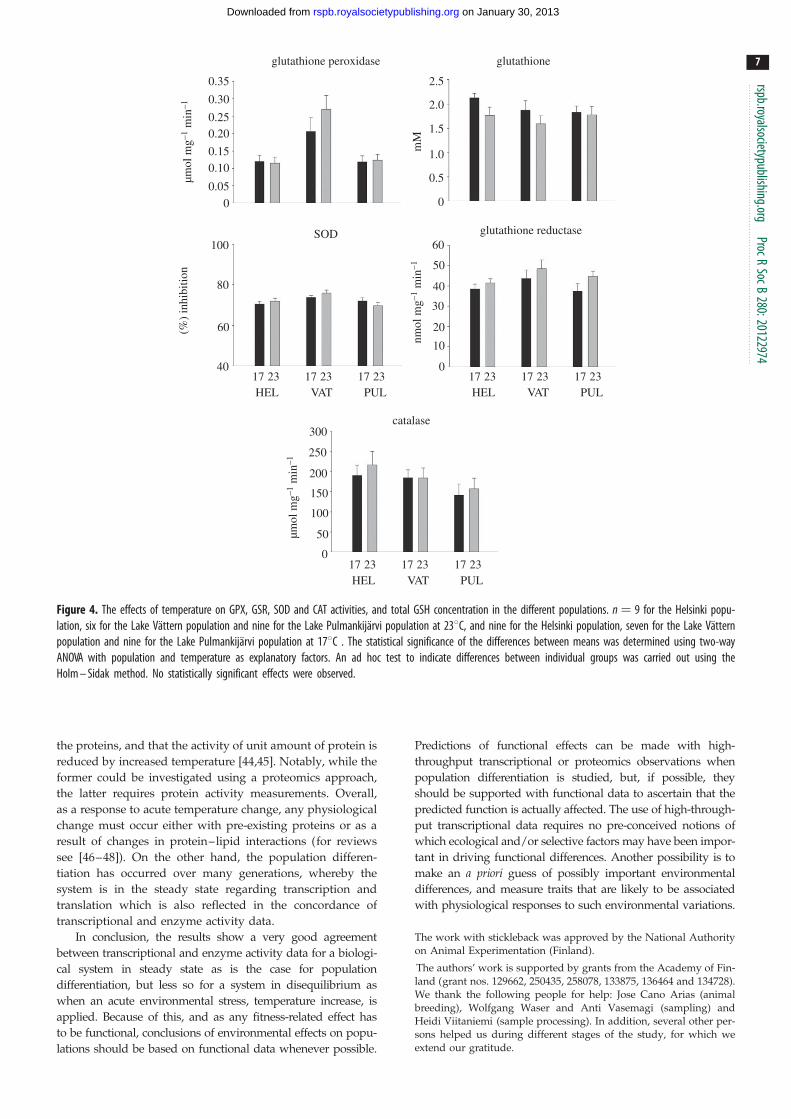
While transcriptional and enzyme activity data led to
similar conclusions with regard to population differentiation,
the responses to acute temperature increase were some-
what different. With regard to enzyme activity data, no
significant differences between populations in their tempera-
ture response were observed. Also, the acute temperature
increase did not affect any of the measured parameters signifi-
cantly (figure 4). Only 199 genes (215 splice variants) were
identified as potentially differentially expressed in both popu-
lation and temperature contrasts. By contrast, 1925 genes (2141
unique transcripts) responded transcriptionally to the acute
temperature increase in the three populations. Among the
transcripts differentially regulated, only 11 were in the genes
coding for redox-relevant proteins. Although two of them
were transcripts of a gene coding for GPX (GPX4), post
hoc analysis of probe-specific false discovery rate-corrected
significance levels (q-values) indicated that the fold change in
response to the acute temperature treatment (0.85 in treatment
relative to control) was not statistically significant. It should be
noted that one of the main clusters in GO, based on
transcriptional responses to acute temperature increase, is
regulation of metabolism suggesting that acute temperature
changes may be more associated with metabolism than
redox changes.
There are a couple of possible explanations as to why
there can be significant transcriptional changes but enzyme
activities remain unchanged after an acute temperature
increase. The first is that transcription and translation have
different time courses. Even if transcription of a gene
would later lead to a change in protein activity, the different
time courses [12] would result in transcriptional change
immediately upon an increase in temperature without a mea-
surable change in protein level. The second possibility is that
cellular and tissue conditions are such that increased tran-
scription and further production of a protein is needed to
maintain a constant activity [4]. This can be caused by the
facts that temperature increase speeds up the breakdown of
0.35 2.5
2.0
1.5
1.0
0.5
0
0.30
µmol
mg–1
min
–1
µmol
mg–1
min
–1
nmol
mg–1
min
–1m
M
(%
) in
hibi
tion
0.250.20
0.150.10
0.05
0
100
300
250
200
150
100
50
0
60
50
40
30
20
10
0
80
60
40
SOD glutathione reductase
17 23 17 23 17 23PULVATHEL
glutathione peroxidase glutathione
catalase
17 23 17 23 17 23PULVATHEL
17 23 17 23 17 23PULVATHEL
Figure 4. The effects of temperature on GPX, GSR, SOD and CAT activities, and total GSH concentration in the different populations. n ¼ 9 for the Helsinki popu-lation, six for the Lake Vattern population and nine for the Lake Pulmankijarvi population at 238C, and nine for the Helsinki population, seven for the Lake Vatternpopulation and nine for the Lake Pulmankijarvi population at 178C . The statistical significance of the differences between means was determined using two-wayANOVA with population and temperature as explanatory factors. An ad hoc test to indicate differences between individual groups was carried out using theHolm – Sidak method. No statistically significant effects were observed.
rspb.royalsocietypublishing.orgProcR
SocB280:20122974
7
on January 30, 2013rspb.royalsocietypublishing.orgDownloaded from
the proteins, and that the activity of unit amount of protein is
reduced by increased temperature [44,45]. Notably, while the
former could be investigated using a proteomics approach,
the latter requires protein activity measurements. Overall,
as a response to acute temperature change, any physiological
change must occur either with pre-existing proteins or as a
result of changes in protein–lipid interactions (for reviews
see [46–48]). On the other hand, the population differen-
tiation has occurred over many generations, whereby the
system is in the steady state regarding transcription and
translation which is also reflected in the concordance of
transcriptional and enzyme activity data.
In conclusion, the results show a very good agreement
between transcriptional and enzyme activity data for a biologi-
cal system in steady state as is the case for population
differentiation, but less so for a system in disequilibrium as
when an acute environmental stress, temperature increase, is
applied. Because of this, and as any fitness-related effect has
to be functional, conclusions of environmental effects on popu-
lations should be based on functional data whenever possible.
Predictions of functional effects can be made with high-
throughput transcriptional or proteomics observations when
population differentiation is studied, but, if possible, they
should be supported with functional data to ascertain that the
predicted function is actually affected. The use of high-through-
put transcriptional data requires no pre-conceived notions of
which ecological and/or selective factors may have been impor-
tant in driving functional differences. Another possibility is to
make an a priori guess of possibly important environmental
differences, and measure traits that are likely to be associated
with physiological responses to such environmental variations.
The work with stickleback was approved by the National Authorityon Animal Experimentation (Finland).
The authors’ work is supported by grants from the Academy of Fin-land (grant nos. 129662, 250435, 258078, 133875, 136464 and 134728).We thank the following people for help: Jose Cano Arias (animalbreeding), Wolfgang Waser and Anti Vasemagi (sampling) andHeidi Viitaniemi (sample processing). In addition, several other per-sons helped us during different stages of the study, for which weextend our gratitude.

8
on January 30, 2013rspb.royalsocietypublishing.orgDownloaded from
References
rspb.royalsocietypublishing.orgProcR
SocB280:20122974
1. Furlong EEM. 2011 Molecular biology: a fly in theface of genomics. Nature 471, 458 – 459. (doi:10.1038/471458a)
2. Abreu RD, Penalva LO, Marcotte EM, Vogel C. 2009Global signatures of protein and mRNA expressionlevels. Mol. Biosyst. 5, 1512 – 1526.
3. Schwanhausser B, Busse D, Li N, Dittmar G,Schuchhardt J, Wolf J, Chen W, Selbach M. 2011Global quantification of mammalian geneexpression control. Nature 473, 337 – 342. (doi:10.1038/nature10098)
4. Nikinmaa M, Waser W. 2007 Molecular and cellularstudies in evolutionary physiology of naturalvertebrate populations: influences of individualvariation and genetic components on sampling andmeasurements. J. Exp. Biol. 210, 1847 – 1857.(doi:10.1242/jeb.002717)
5. Oleksiak MF, Roach JL, Crawford DL. 2005 Naturalvariation in cardiac metabolism and gene expressionin Fundulus heteroclitus. Nat. Genet. 37, 67 – 72.
6. Fu N, Drinnenberg I, Kelso J, Wu JR, Paabo S, ZengR, Khaitovich P. 2007 Comparison of protein andmRNA expression evolution in humans andchimpanzees. PLoS ONE 2, e216. (doi:10.1371/journal.pone.0000216)
7. Shim YH, Paik YK. 2010 Caenorhabditis elegansproteomics comes of age. Proteomics 10, 846 – 857.(doi:10.1002/pmic.200900542)
8. Jones FC et al. 2012 The genomic basis of adaptiveevolution in threespine sticklebacks. Nature 484,55 – 61. (doi:10.1038/nature10944)
9. Leder EH, Merila J, Primmer CR. 2009 A flexiblewhole-genome microarray for transcriptomics inthree-spine stickleback (Gasterosteus aculeatus).BMC Genomics 10, 426. (doi:10.1186/1471-2164-10-426)
10. Ostlund-Nilsson S, Mayer I, Huntingford F. 2007 Thebiology of three-spined stickleback. Boca Raton, FL:CRC Press.
11. Leveelahti L, Leskinen P, Leder EH, Waser W,Nikinmaa M. 2011 Responses of threespinestickleback (Gasterosteus aculeatus, L) transcriptometo hypoxia. Comp. Biochem. Physiol. D GenomicsProteomics 6, 370 – 381. (doi:10.1016/j.cbd.2011.08.001)
12. Buckley BA, Gracey AY, Somero GN. 2006 Thecellular response to heat stress in the gobyGillichthys mirabilis: a cDNA microarray and protein-level analysis. J. Exp. Biol. 209, 2660 – 2677.(doi:10.1242/jeb.02292)
13. Nikinmaa M, Rytkonen KT. 2011 Functionalgenomics in aquatic toxicology: do not forget thefunction. Aquat. Toxicol. 105, 16 – 24. (doi:10.1016/j.aquatox.2011.05.019)
14. Rytkonen KT, Vuori KAM, Primmer CR, Nikinmaa M.2007 Comparison of hypoxia-inducible factor-1alpha in hypoxia-sensitive and hypoxia-tolerant fishspecies. Comp. Biochem. Physiol. D-GenomicsProteomics 2, 177 – 186. (doi:10.1016/j.cbd.2007.03.001)
15. Heise K, Puntarulo S, Nikinmaa M, Abele D, PortnerHO. 2006 Oxidative stress during stressful heatexposure and recovery in the North Sea eelpoutZoarces viviparus L. J. Exp. Biol. 209, 353 – 363.(doi:10.1242/jeb.01977)
16. Heise K, Puntarulo S, Nikinmaa M, Lucassen M,Portner HO, Abele D. 2006 Oxidative stress and HIF-1DNA binding during stressful cold exposure andrecovery in the North Sea eelpout (Zoarces viviparus).Comp. Biochem. Physiol. A-Mol. Integr. Physiol. 143,494 – 503. (doi:10.1016/j.cbpa.2006.01.014)
17. Lesser MP. 2006 Oxidative stress in marineenvironments: biochemistry and physiologicalecology. Annu. Rev. Physiol. 68, 253 – 278. (doi:10.1146/annurev.physiol.68.040104.110001)
18. Smyth GK, Speed T. 2003 Normalization of cDNAmicroarray data. Methods 31, 265 – 273. (doi:10.1016/S1046-2023(03)00155-5)
19. Efron B, Tibshirani R, Storey JD, Tusher V. 2001Empirical Bayes analysis of a microarray experiment.J. Am. Stat. Assoc. 96, 1151 – 1160. (doi:10.1198/016214501753382129)
20. Schwender H, Krause A, Ickstadt K. 2006 Identifyinginteresting genes with siggenes. RNews 6, 45 – 50.
21. Debat V, David P. 2001 Mapping phenotypes:canalization, plasticity and developmental stability.Trends Ecol. Evol. 16, 555 – 561. (doi:10.1016/S0169-5347(01)02266-2)
22. Huang DW et al. 2007 The DAVID gene functionalclassification tool: a novel biological module-centricalgorithm to functionally analyze large gene lists.Genome Biol. 8, R183. (doi:10.1186/gb-2007-8-9-r183)
23. Maglott D, Ostell J, Pruitt KD, Tatusova T. 2005Entrez Gene: gene-centered information at NCBI.Nucleic Acids Res. 33, D54 – D58. (doi:10.1093/nar/gki031)
24. Sherman BT et al. 2007 DAVID Knowledgebase: agene-centered database integrating heterogeneousgene annotation resources to facilitate high-throughput gene functional analysis. BMCBioinform. 8, 426. (doi:10.1186/1471-2105-8-426)
25. Durinck S, Moreau Y, Kasprzyk A, Davis S, De MoorB, Brazma A, Huber W. 2005 BIOMART andBIOCONDUCTOR: a powerful link between biologicaldatabases and microarray data analysis.Bioinformatics 21, 3439 – 3440. (doi:10.1093/bioinformatics/bti525)
26. Smedley D, Haider S, Ballester B, Holland R, LondonD, Thorisson G, Kasprzyk A. 2009 BIOMART—biological queries made easy. BMC Genomics 10, 22.(doi:10.1186/1471-2164-10-22)
27. Harris MA et al. 2004 The gene ontology (GO)database and informatics resource. Nucleic Acids Res.32, D258 – D261. (doi:10.1093/nar/gkh036)
28. Huang DW, Sherman BT, Lempicki RA. 2009Systematic and integrative analysis of largegene lists using DAVID bioinformatics resources.Nat. Protoc. 4, 44 – 57. (doi:10.1038/nprot.2008.211)
29. Lilley TM, Ruokolainen L, Meierjohann A, KanervaM, Stauffer J, Laine VN, Nikinmaa M. In press.Impacts of organic tin compounds on redoxregulation and complement reaction in naturalpopulations of Daubenton’s bats (Myotisdaubentonii). Comp. Biochem. Physiol. C Toxicol.Pharmacol.
30. Vuori KA, Kanerva M, Ikonen E, Nikinmaa M. 2008Oxidative stress during Baltic salmon feedingmigration may be associated with yolk-sac frymortality. Environ. Sci. Technol. 42, 2668 – 2673.(doi:10.1021/es702632c)
31. Smith IK, Vierheller TL, Thorne CA. 1988 Assay ofglutathione reductase in crude tissue homogenatesusing 5,50-dithiobis(2-nitrobenzoic acid). Anal.Biochem. 175, 408 – 413. (doi:10.1016/0003-2697(88)90564-7)
32. Habig WH, Pabst MJ, Jakoby WB. 1974 GlutathioneS-transferases. The first enzymatic step inmercapturic acid formation. J. Biol. Chem. 249,7130 – 7139.
33. Deisseroth A, Dounce AL. 1970 Catalase: physicaland chemical properties, mechanism ofcatalysis, and physiological role. Physiol. Rev. 50,319 – 375.
34. Fossati P, Prencipe L, Berti G. 1980 Use of3,5-dichloro-2-hydroxybenzenesulfonic acid/4-aminophenazone chromogenic system in directenzymic assay of uric acid in serum and urine. Clin.Chem. 26, 227 – 231.
35. Spitze K. 1993 Population—structure in Daphnia-obtusa—quantitative genetic and allozymicvariation. Genetics 135, 367 – 374.
36. Cano JM, Matsuba C, Makinen H, Merila J. 2006 Theutility of QTL-Linked markers to detect selectivesweeps in natural populations: a case study of theEDA gene and a linked marker in threespinestickleback. Mol. Ecol. 15, 4613 – 4621. (doi:10.1111/j.1365-294X.2006.03099.x)
37. Antao T, Lopes A, Lopes RJ, Beja-Pereira A, Luikart G.2008 LOSITAN: a workbench to detect molecularadaptation based on a Fst-outlier method.BMC Bioinform. 9, 323. (doi:10.1186/1471-2105-9-323)
38. Dray S, Chessel D, Thioulouse J. 2003 Co-inertiaanalysis and the linking of ecological datatables. Ecology 84, 3078 – 3089. (doi:10.1890/03-0178)
39. Jombart T, Pontier D, Dufour AB. 2009 Geneticmarkers in the playground of multivariate analysis.Heredity 102, 330 – 341. (doi:10.1038/hdy.2008.130)
40. Dray S, Dufour AB. 2007 The ade4 package:implementing the duality diagram for ecologists.J. Stat. Softw. 22, 1 – 20.
41. Makinen HS, Cano M, Merila J. 2008 Identifyingfootprints of directional and balancing selection inmarine and freshwater three-spined stickleback(Gasterosteus aculeatus) populations. Mol. Ecol.17, 3565 – 3582. (doi:10.1111/j.1365-294X.2008.03714.x)

rspb.royalsocietypublishing.or
9
on January 30, 2013rspb.royalsocietypublishing.orgDownloaded from
42. Weber RE, Hiebl I, Braunitzer G. 1988 High altitudeand hemoglobin function in the vultures Gypsrueppellii and Aegypius monachus. Biol. Chem.Hoppe-Seyler 369, 233 – 240. (doi:10.1515/bchm3.1988.369.1.233)
43. Shimada Y, Shikano T, Merila J. 2011 A highincidence of selection on physiologically importantgenes in the three-spined stickleback, Gasterosteusaculeatus. Mol. Biol. Evol. 28, 181 – 193. (doi:10.1093/molbev/msq181)
44. Coquelle N, Fioravanti E, Weik M, Vellieux F, MadernD. 2007 Activity, stability and structural studies oflactate dehydrogenases adapted to extreme thermalenvironments. J. Mol. Biol. 374, 547 – 562. (doi:10.1016/j.jmb.2007.09.049)
45. Gatt S. 1969 Thermal lability of beta galactosidasefrom pink salmon liver. Science 164, 1422 – 1423.(doi:10.1126/science.164.3886.1422)
46. Cossins AR, Raynard RS. 1987 Adaptive responses ofanimal cell membranes to temperature. In
Temperature and animal cells (eds K Bowler,BJ Fuller), pp. 95 – 111. Cambridge, UK: Company ofBiologists.
47. Hazel JR. 1984 Effects of temperature on thestructure and metabolism of cell membranes in fish.Am. J. Physiol. 246, R460 – R470.
48. Hochachka PW, Somero GN. 2002 Biochemicaladaptation: mechanism and process inphysiological evolution. Oxford, UK: Oxford UniversityPress.
g
ProcRSocB280:20122974
Copyright © 2022 FDOKUMEN