Tracking the Trends 2013 - Edmonton Social Planning Council
126
-
Upload
khangminh22 -
Category
Documents
-
view
1 -
download
0
Transcript of Tracking the Trends 2013 - Edmonton Social Planning Council

Important Notes: Data in this publication can apply to either the City of Edmonton, the Edmonton Census Metropolitan Area (CMA), or both. Each table and chart is labeled to specify the geography of the underlying data. In a few instances, national or provincial data is used when Edmonton data is unavailable. This edition includes data from both the mandatory 2011 Census and the voluntary 2011 National Household Survey (NHS). Other than population, age, and dwelling types, most of the included information is from the NHS and not the Census. Due to the higher non-response rate in the voluntary NHS compared to the previous mandatory long-form census, data quality may be compromised. Disadvantaged socio-economic groups tend to have lower response rates in voluntary surveys compared to more advantaged groups. Tracking the Trends 2013 12th Edition Cover photos by City of Edmonton Previous editions: 2011 Edmonton’s Increasing Diversity 2009 Neighbourhood Well-Being in Edmonton 2007 Social Health in Edmonton 2002 The Cost of Healthy Living 2000 The Cost of Healthy Living 1995 Mental Health 1994 Youth 1993 Aboriginal People 1991 Immigrants 1990 Families with Children 1989 Youth and Seniors For information on previous editions, please contact: Suite 37, 9912-106 Street Edmonton, AB T5K 1C5 Tel: (780) 423-2031 Fax: (780) 425-6244 Email: [email protected] Visit our Website: www.edmontonsocialplanning.ca Like us on Facebook: www.facebook.com/edmontonspc Follow us on Twitter: twitter.com/edmontonspc ISBN: 978-0-92147-63-7 How to cite this report: Neilson, M., Dowdell, V., & Kolkman, J. (2013). Tracking the Trends 2013: 12th Edition. Edmonton, Canada: Edmonton Social Planning Council. Produced by Michelle Neilson, Virginia Dowdell & John Kolkman Edmonton Social Planning Council
a member of the United Way
of the Alberta Capital Region
Page|iii
TRACKING THE TRENDS: provides a comprehensive picture of many aspects of Edmonton’s social well-being.
This 12th edition of Tracking the Trends presents a number of new social and economic data variables in addition to updates on the trends featured in the 11th
edition released in 2011.
As in the previous edition, we have divided the trends into six major categories:
Demographics - indicators of population growth, immigration and population diversity.
Education & Employment - indicators of educational achievement and employment status of the population.
Cost of Living & Housing Trends - indicators of the costs of basic necessities, such as food and housing, as well as the housing status of the population.
Wages & Income - indicators of the changing value of the wages (earnings), and incomes of individuals and families.
Poverty - indicators of the prevalence of low income, as well as the incidence of acute forms of poverty, such as homelessness.
Government Income Supports - indicators of the investments made by governments towards improving financial security and the impact of those investments on low income families.
This edition also includes an updated Social Health Index. The intent of this index is to provide a rough measure of the overall social health of Edmonton, and how it has changed over time.
Presented together, these trends give us a clearer picture of the social changes taking place in Edmonton. They also offer a broad understanding of the segments of the population which are disadvantaged or marginalized.
Research on the social determinants of health tells us that low income and socioeconomic inequality impacts people’s health and well-being. The negative consequences are far-reaching, with implications for disadvantaged individuals as well as their communities (and their city). The costs to all levels of government are
also significant.
Decisions that affect the citizens of Edmonton must be informed by an understanding of social trends in order to be effective in the long term.
The ESPC is pleased to present this 12th edition of Tracking the Trends. Twenty four years after the release of the first edition in 1989, we remain committed to regularly updating this valuable compendium of social and economic data critical to sound decision-making. We hope that decision-makers, social policy planners, researchers and the general public will find this publication useful in broadening their understanding of the social trends in the Edmonton Region.
Acknowledgements
Preparing this edition would not have been possible without the ongoing partnership and support of the United Way of the Alberta Capital Region.
Thanks to Vasant Chotai and Susan Morrissey for reviewing earlier drafts, and to Stephanie Haar and Stephen MacDonald for proof-reading.
We are also grateful to the many organizations who contributed data to be published in this volume. Any errors or omissions are strictly ours.
Preface
Page|iv
Table of Contents|Trends at a Glance
Introduction 1 Part 1: Major Social & Economic Trends 2
Indicator Geography Most Recent Data Trend Page
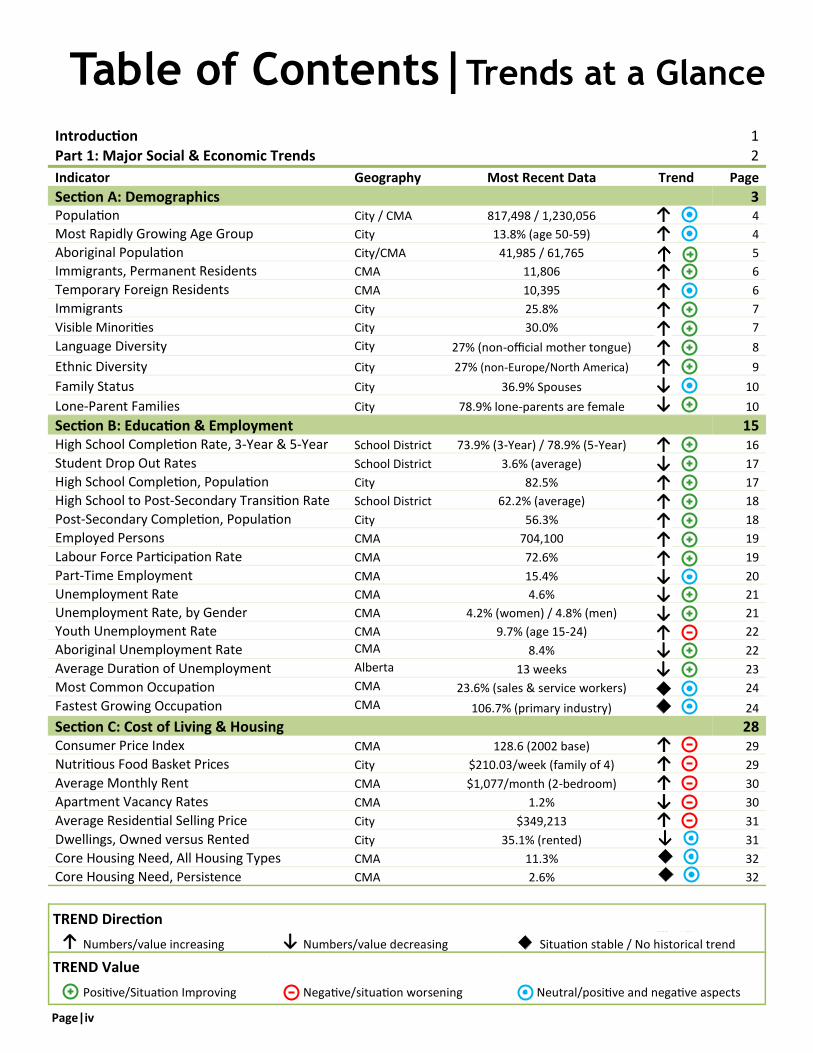
Section A: Demographics 3 Population City / CMA 817,498 / 1,230,056 4
Most Rapidly Growing Age Group City 13.8% (age 50-59) 4
Aboriginal Population City/CMA 41,985 / 61,765 5
Immigrants, Permanent Residents CMA 11,806 6
Temporary Foreign Residents CMA 10,395 6
Immigrants City 25.8% 7
Visible Minorities City 30.0% 7
Language Diversity City 27% (non-official mother tongue) 8
Ethnic Diversity City 27% (non-Europe/North America) 9
Family Status City 36.9% Spouses 10
Lone-Parent Families City 78.9% lone-parents are female 10
Section B: Education & Employment 15 High School Completion Rate, 3-Year & 5-Year School District 73.9% (3-Year) / 78.9% (5-Year) 16
Student Drop Out Rates School District 3.6% (average) 17
High School Completion, Population City 82.5% 17
High School to Post-Secondary Transition Rate School District 62.2% (average) 18
Post-Secondary Completion, Population City 56.3% 18
Employed Persons CMA 704,100 19
Labour Force Participation Rate CMA 72.6% 19
Part-Time Employment CMA 15.4% 20
Unemployment Rate CMA 4.6% 21
Unemployment Rate, by Gender CMA 4.2% (women) / 4.8% (men) 21
Youth Unemployment Rate CMA 9.7% (age 15-24) 22
Aboriginal Unemployment Rate CMA 8.4% 22
Average Duration of Unemployment Alberta 13 weeks 23
Most Common Occupation CMA 23.6% (sales & service workers) 24
Fastest Growing Occupation CMA 106.7% (primary industry) 24
Section C: Cost of Living & Housing 28 Consumer Price Index CMA 128.6 (2002 base) 29
Nutritious Food Basket Prices City $210.03/week (family of 4) 29
Average Monthly Rent CMA $1,077/month (2-bedroom) 30
Apartment Vacancy Rates CMA 1.2% 30
Average Residential Selling Price City $349,213 31
Dwellings, Owned versus Rented City 35.1% (rented) 31
Core Housing Need, All Housing Types CMA 11.3% 32
Core Housing Need, Persistence CMA 2.6% 32
TREND Direction
Numbers/value increasing Numbers/value decreasing Situation stable / No historical trend
TREND Value
Positive/Situation Improving Negative/situation worsening Neutral/positive and negative aspects
Page|v
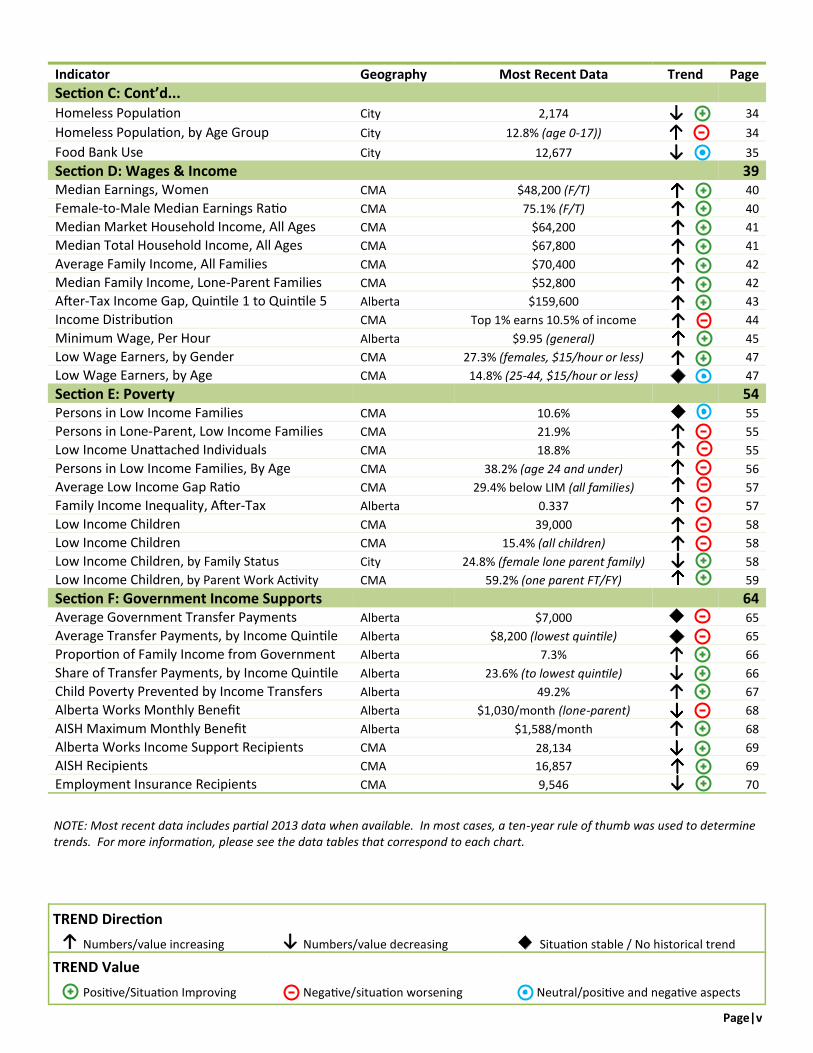
Indicator Geography Most Recent Data Trend Page
Section C: Cont’d... Homeless Population City 2,174 34
Homeless Population, by Age Group City 12.8% (age 0-17)) 34
Food Bank Use City 12,677 35
Section D: Wages & Income 39 Median Earnings, Women CMA $48,200 (F/T) 40
Female-to-Male Median Earnings Ratio CMA 75.1% (F/T) 40
Median Market Household Income, All Ages CMA $64,200 41
Median Total Household Income, All Ages CMA $67,800 41
Average Family Income, All Families CMA $70,400 42
Median Family Income, Lone-Parent Families CMA $52,800 42
After-Tax Income Gap, Quintile 1 to Quintile 5 Alberta $159,600 43
Income Distribution CMA Top 1% earns 10.5% of income 44
Minimum Wage, Per Hour Alberta $9.95 (general) 45
Low Wage Earners, by Gender CMA 27.3% (females, $15/hour or less) 47
Low Wage Earners, by Age CMA 14.8% (25-44, $15/hour or less) 47
Section E: Poverty 54 Persons in Low Income Families CMA 10.6% 55
Persons in Lone-Parent, Low Income Families CMA 21.9% 55
Low Income Unattached Individuals CMA 18.8% 55
Persons in Low Income Families, By Age CMA 38.2% (age 24 and under) 56
Average Low Income Gap Ratio CMA 29.4% below LIM (all families) 57
Family Income Inequality, After-Tax Alberta 0.337 57
Low Income Children CMA 39,000 58
Low Income Children CMA 15.4% (all children) 58
Low Income Children, by Family Status City 24.8% (female lone parent family) 58
Low Income Children, by Parent Work Activity CMA 59.2% (one parent FT/FY) 59
Section F: Government Income Supports 64 Average Government Transfer Payments Alberta $7,000 65
Average Transfer Payments, by Income Quintile Alberta $8,200 (lowest quintile) 65
Proportion of Family Income from Government Alberta 7.3% 66
Share of Transfer Payments, by Income Quintile Alberta 23.6% (to lowest quintile) 66
Child Poverty Prevented by Income Transfers Alberta 49.2% 67
Alberta Works Monthly Benefit Alberta $1,030/month (lone-parent) 68
AISH Maximum Monthly Benefit Alberta $1,588/month 68
Alberta Works Income Support Recipients CMA 28,134 69
AISH Recipients CMA 16,857 69
Employment Insurance Recipients CMA 9,546 70
TREND Direction
Numbers/value increasing Numbers/value decreasing Situation stable / No historical trend
TREND Value
Positive/Situation Improving Negative/situation worsening Neutral/positive and negative aspects
NOTE: Most recent data includes partial 2013 data when available. In most cases, a ten-year rule of thumb was used to determine trends. For more information, please see the data tables that correspond to each chart.

Page|vi
Table of Contents, cont’d...
Part 2: Edmonton Social Health Index 76
Indicator Geography Most Recent Data Trend Page
Section A: Social Health Indicators 77 Life Expectancy at Birth Edmonton Zone 82.4 years 78
Sexually Transmitted Infections (per 100,000 pop.) Edmonton Zone 503 infections 78
Low Birth-Weight Babies (% live births) Edmonton Zone 6.4% 79
Infant Mortality Rate (per 1,000 live births) Edmonton Zone 6.3 deaths 79
Teen Birth Rate (per 1,000 females, 15-19 yrs) Edmonton Zone 12.9 80
Child & Family Services Caseloads (per 100,000 pop.) C&FS Region 341.3 80
Suicide Rate (per 100,000 pop.) Edmonton Zone 13.2 suicides 81
Crisis Support Calls (per 100,000 pop.) City 2,012 81
Proportion of Persons Divorced or Separated City & CMA 7.8% 82
Median Family Income (After-Tax) CMA $59,200 83
Personal Bankruptcy Rate (per 1,000 pop.) CMA 2.3 bankruptcies 83
Low-Income Families (% living below LIM) CMA 10.6% 84
Depth of Poverty (How far families are below LIM) CMA 29.4% (average) 85
Rental Vacancy Rate CMA 1.2% 85
Food Bank Use (per 100,000 pop. in March) City 1,551 86
Student Dropout Rate School District 3.6% (average) 86
Post-secondary Completion City 56.3% 87
Unemployment Rate CMA 4.6% 87
Property Crime Rate (per 100,000 pop.) City 3,949 88
Violent Crime Rate (per 100,000 pop.) City 1,220 88
Commuting by Transit, Bike or Walking City & CMA 20.8% 89
Voter Turnout (all elections) City 57.3% (federal) 89
Section B: Social Health Index 94 Social Health Index (1993=100) Edmonton 127.6 94
Terms & Definitions 102
Sources 111
TREND Direction
Numbers/value increasing Numbers/value decreasing Situation stable / No historical trend
TREND Value
Positive/Situation Improving Negative/situation worsening Neutral/positive and negative aspects
NOTE: Trends were determined using the Social Health Index (SHI). The SHI measures the average rate of change of the social health indicators over a twenty-year period (base year = 1993) corrected for inflation and/or population grwoth. For more information, please see the data tables that correspond to each section.
PART 1|Major Social & Economic Trends Page|1
Whether for planning programs and services, or developing policies, timely, accurate information is critical. Likewise, an understanding of the historical context of social issues is critical to the development of effective strategies for positive social change.
Presenting data in a single source, such as Tracking the Trends, permits us to see the trends in the context of other social changes occurring simultaneously. For example, the Consumer Price Index and average rents have risen at a more rapid rate than Alberta Works benefits. This means an erosion of living standards for vulnerable Albertans relying on these benefits.
Most Canadian publications present data at the national or provincial level. Tracking the Trends includes primarily Edmonton-level data. This makes it a useful tool for people working on social issues in Edmonton and the surrounding region.
A Tool for the Public
Edmontonians’ awareness of social issues is critical to improving the inclusiveness of our communities. A better understanding of the challenges our fellow citizens face can affect the way we think of and treat each other. Regardless of our backgrounds, we all share this city and region, and have an interest in its healthy future.
A Tool for Decision-Makers
For a planner or policy maker, this collection of data provides a clearer understanding of the current and historical social conditions in Edmonton. This information can provide the background necessary to make informed decisions, and even the insight needed to anticipate future changes.
We encourage readers to use Tracking the Trends to assess how well all levels of government are fulfilling their role in ensuring citizens have the support they need to maintain a decent standard of living.
A Tool for Social Organizations and Researchers
The work of organizations involved in social development activities must be informed by the current and historical context. The information in Tracking the Trends will prove useful for program planning, organizational strategy-building, as well as other community development activities.
Students and researchers will also benefit from this rich and unified source of data to inform their research projects. Such in-depth research is important for expanding our knowledge of specific issues and informing social policy development.
Introduction
Why Track the Trends?
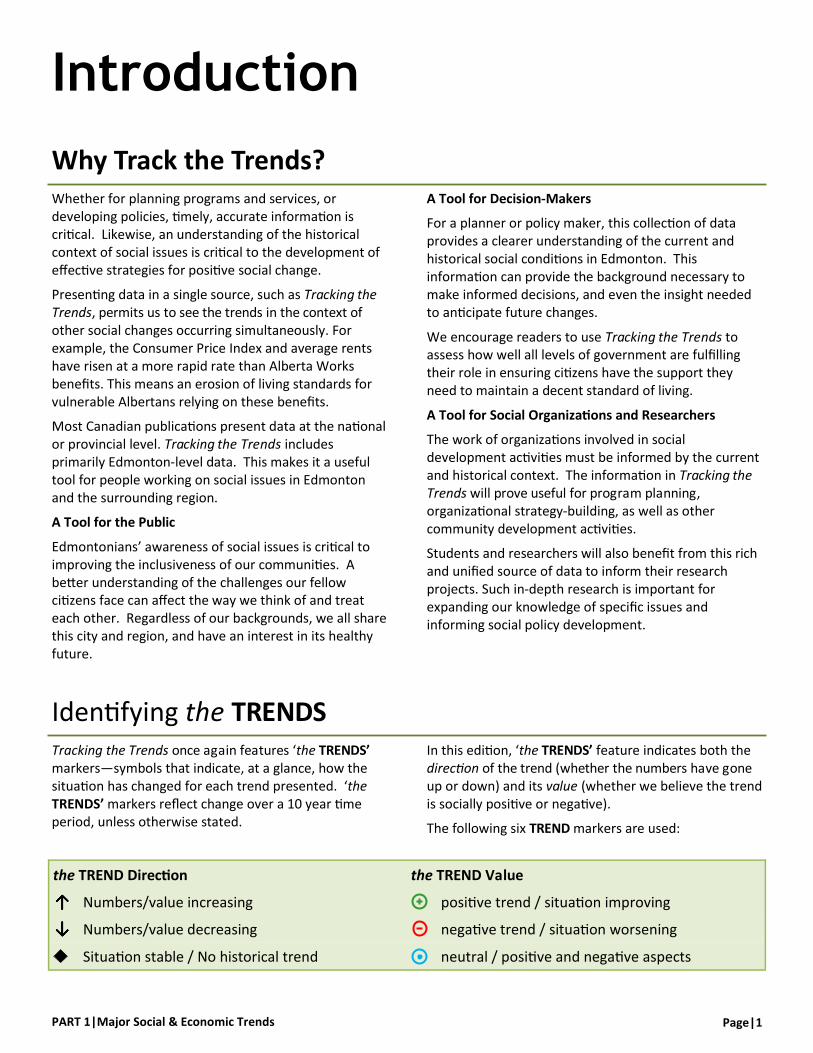
Tracking the Trends once again features ‘the TRENDS’ markers—symbols that indicate, at a glance, how the situation has changed for each trend presented. ‘the TRENDS’ markers reflect change over a 10 year time period, unless otherwise stated.
In this edition, ‘the TRENDS’ feature indicates both the direction of the trend (whether the numbers have gone up or down) and its value (whether we believe the trend is socially positive or negative).
The following six TREND markers are used:
Identifying the TRENDS
the TREND Direction the TREND Value
Numbers/value increasing positive trend / situation improving
Numbers/value decreasing negative trend / situation worsening
Situation stable / No historical trend neutral / positive and negative aspects

PART 1|Major Social & Economic Trends Page|2
Part 1|Major Social & Economic Trends
In any community, public policy, social health and economic well-being are intricately linked. Still, there is disagreement on how these factors influence each other and on how to use public policy and social programs to bring about positive change.
The following section presents graphs, tables and analysis on social and economic trends in the Edmonton area. Some data show us what it costs to live, such as the Consumer Price Index and average rents. Other data indicate people’s capacity to earn an income and maintain a decent standard of living.
Labour force participation and minimum wage tell us something about what percentage of the population is working and how much employers are paying for labour. Alberta Works benefit rates reflect the standard of living for those on the margins of the labour market. Low income data give an indication of the proportion of the population that live on incomes that are insufficient to cover the costs of living.
The data presented in Part 1 of Tracking the Trends will help to answer the following questions:
How is Edmonton’s population changing? Have opportunities to make a living increased?
How has the cost of living changed? Has the cost of living become more affordable? Has social equality improved? What groups within the population experience
inequities, and how deep are the inequities they experience?
Are disadvantaged people receiving the support they need to improve their situations?
A Note on Recent Developments
Edmonton faced a sharp economic downturn which began in late 2008 and continued into 2010. Since then, the economy—as reflected in such indicators as population, employment and earnings growth— has recovered strongly. Wherever possible, we have included partial-year data for 2013 in order to capture the impact of these economic shifts on other social trends. Trend Directions and Values are assigned based on longer timeframes (ten or more years) rather than on shorter term fluctuations. In some cases the recent recession changed longer-term trends. In other cases, longer-term trends did not change.
the TREND Markers
the TREND Direction the TREND Value
Numbers/value increasing positive trend / situation improving
Numbers/value decreasing negative trend / situation worsening
Situation stable / No historical trend neutral / positive and negative aspects

Page|3 Section A|Demographics
Section A|Demographics
Demography is concerned with the characteristics of a
population. At a practical level, this type of information
is important in planning a community’s future. Knowing
how many people live in a given area, as well as their
basic attributes, is critical to making funding decisions
and delivering services effectively.
Demographic Signals, Planning Opportunities
The age profile and cultural composition of a city, for example, dictate the types of programs, services and policies needed to support a population.
In Edmonton, as in most developed urban areas, the population is aging due to the combination of a lower birth rate and a higher life expectancy. Strategies for
dealing with this demographic shift must be made in advance in order to adequately prepare for the greying population’s changing needs.
An aging population also foreshadows a shrinking
labour force. One way to mitigate this is through
immigration. There are, however, many steps involved
in successfully welcoming new immigrants to a city,
particularly in terms of integration into communities.
Immigrants and newcomers are often at an economic
and social disadvantage. They need additional support
to become fully active citizens, and to feel welcome and
valued.
Metro Edmonton had the second highest rate of population growth of all Canadian CMAs between 2006 and 2011 [Statistics Canada]. Edmonton is also the fifth most popular city in Canada for new immigrants to settle, attracting 4.6% of all newcomers to the country in 2012 [CIC]. The number of immigrants settling permanently in Edmonton has increased steadily over the past decade.
In contrast, the number of Temporary Foreign Workers in Edmonton spiked sharply until 2009, then dropped slightly once the recession began [Statistics Canada]. Today, however, levels of TFWs remain on par with those at the peak of the boom, indicating the continued draw of Alberta’s economy.
Age Profile
Though Canada’s population is aging as a whole, Edmonton’s population is younger than the national average [Statistics Canada]. International and interprovincial in-migration is helping to slow population aging.
Another significant trend is that Edmonton’s Aboriginal population is significantly younger, and growing more rapidly, than the general population [City of Edmonton].
The Aboriginal population in the City of Edmonton saw a 74% increase between 1996 and 2011, compared to a 32% increase for the general population during the same period of time.
Diversity
Edmonton’s population continues to become more
diverse. One quarter of residents are immigrants, and
30% of residents self-identify as a visible minority. The
African population, in particular, has nearly doubled
since 2006. Language diversity has kept pace, with
native Asian and Middle-Eastern speakers overtaking
those with a European mother tongue.
the TRENDS: population increasing
diversity increasing
How is Edmonton Changing?
Why are Demographic Trends Important?
PART 1|Major Social & Economic Trends Page|4
Population
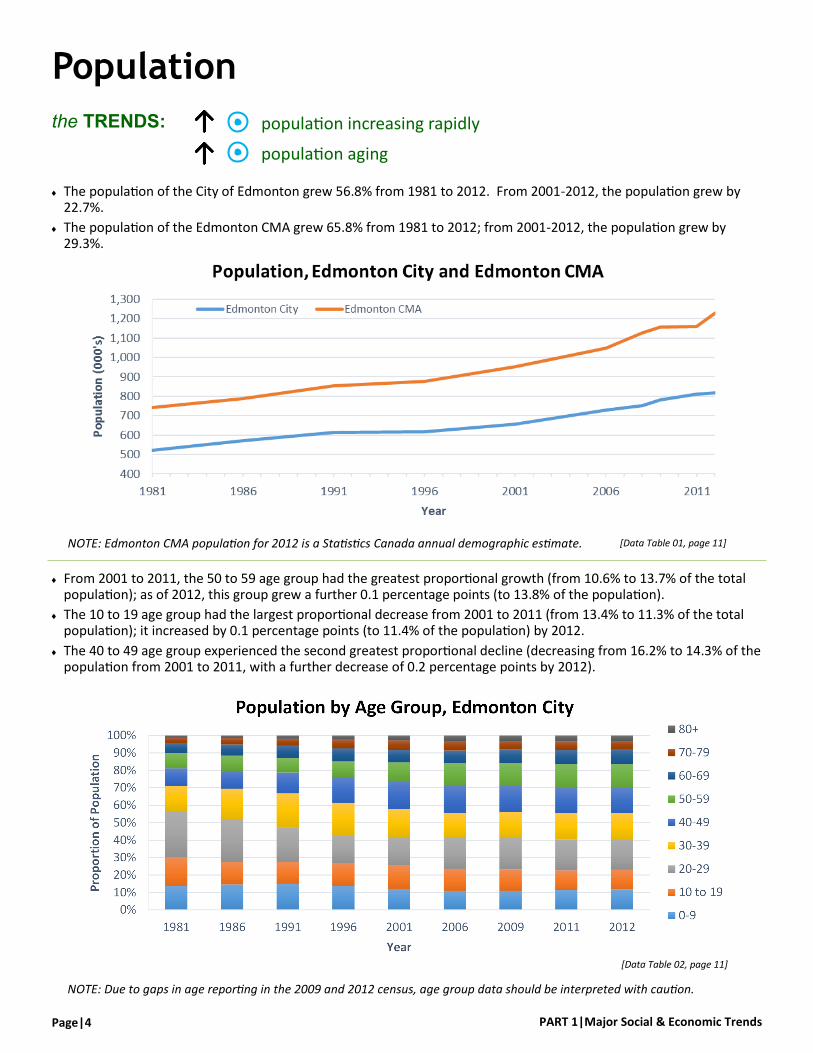
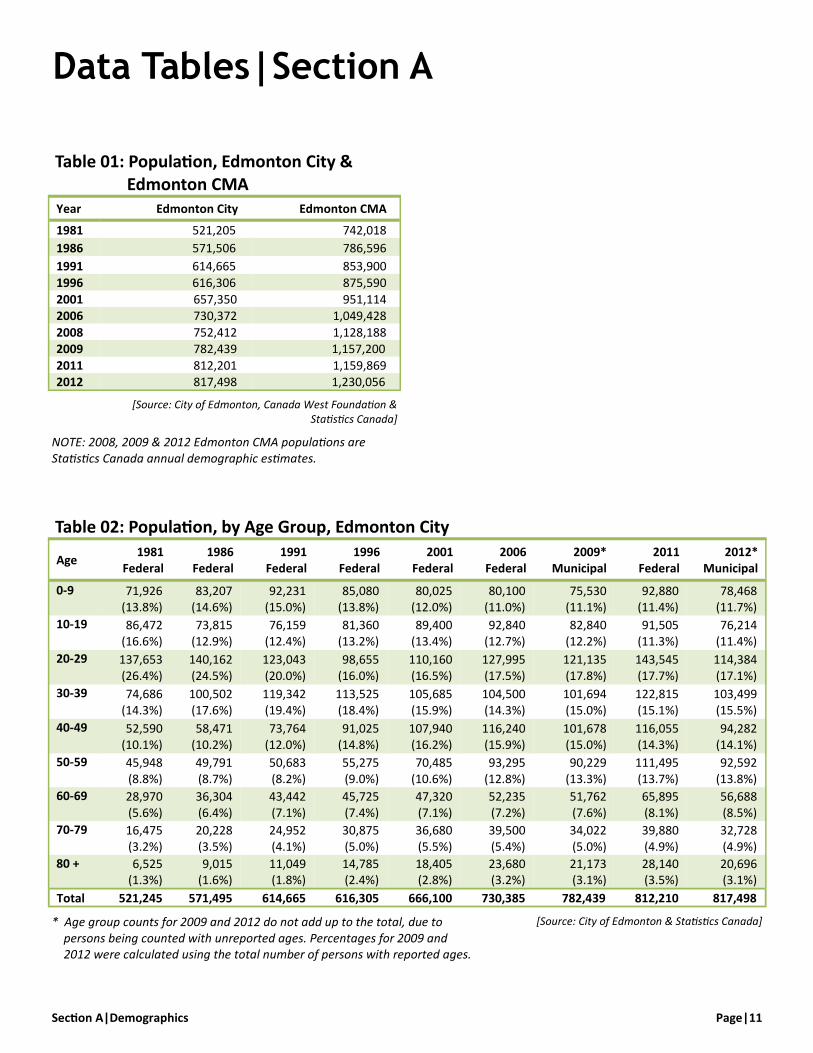
The population of the City of Edmonton grew 56.8% from 1981 to 2012. From 2001-2012, the population grew by 22.7%.
The population of the Edmonton CMA grew 65.8% from 1981 to 2012; from 2001-2012, the population grew by 29.3%.
the TRENDS: population increasing rapidly
population aging
From 2001 to 2011, the 50 to 59 age group had the greatest proportional growth (from 10.6% to 13.7% of the total population); as of 2012, this group grew a further 0.1 percentage points (to 13.8% of the population).
The 10 to 19 age group had the largest proportional decrease from 2001 to 2011 (from 13.4% to 11.3% of the total population); it increased by 0.1 percentage points (to 11.4% of the population) by 2012.
The 40 to 49 age group experienced the second greatest proportional decline (decreasing from 16.2% to 14.3% of the population from 2001 to 2011, with a further decrease of 0.2 percentage points by 2012).
NOTE: Due to gaps in age reporting in the 2009 and 2012 census, age group data should be interpreted with caution.
[Data Table 01, page 11]
[Data Table 02, page 11]
NOTE: Edmonton CMA population for 2012 is a Statistics Canada annual demographic estimate.
Page|5 Section A|Demographics
Aboriginal Population
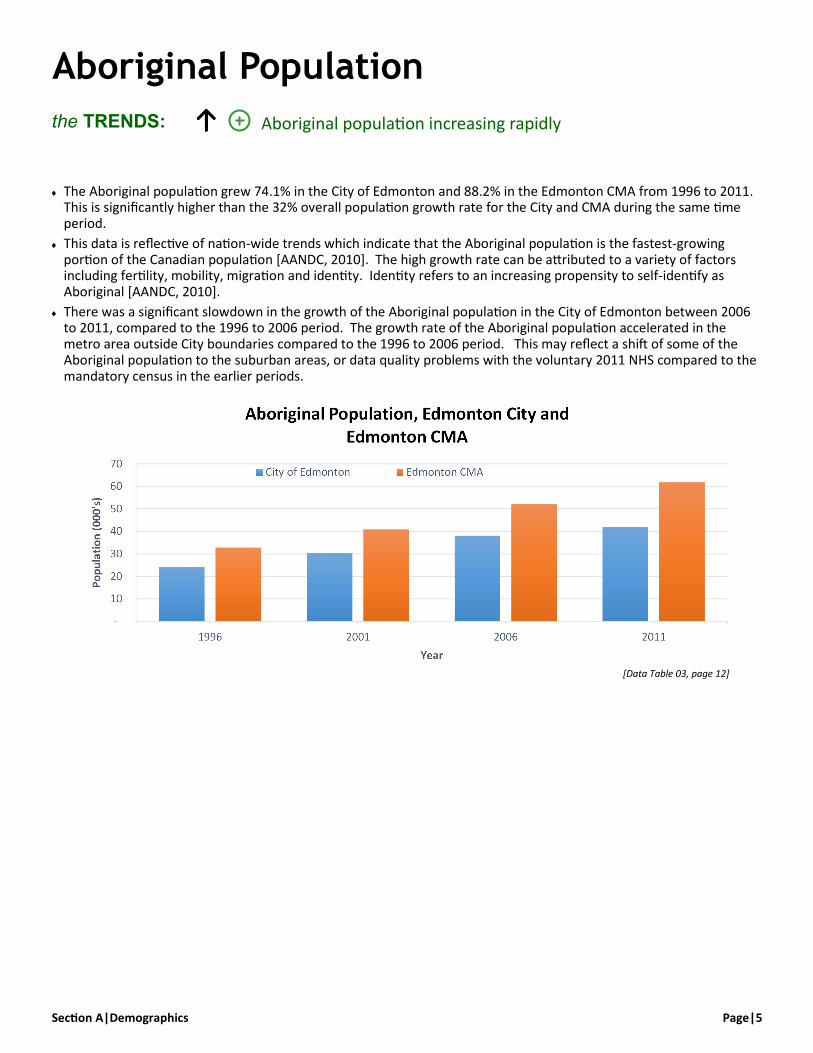
The Aboriginal population grew 74.1% in the City of Edmonton and 88.2% in the Edmonton CMA from 1996 to 2011. This is significantly higher than the 32% overall population growth rate for the City and CMA during the same time period.
This data is reflective of nation-wide trends which indicate that the Aboriginal population is the fastest-growing portion of the Canadian population [AANDC, 2010]. The high growth rate can be attributed to a variety of factors including fertility, mobility, migration and identity. Identity refers to an increasing propensity to self-identify as Aboriginal [AANDC, 2010].
There was a significant slowdown in the growth of the Aboriginal population in the City of Edmonton between 2006 to 2011, compared to the 1996 to 2006 period. The growth rate of the Aboriginal population accelerated in the metro area outside City boundaries compared to the 1996 to 2006 period. This may reflect a shift of some of the Aboriginal population to the suburban areas, or data quality problems with the voluntary 2011 NHS compared to the mandatory census in the earlier periods.
the TRENDS: Aboriginal population increasing rapidly
[Data Table 03, page 12]
PART 1|Major Social & Economic Trends Page|6
Immigration
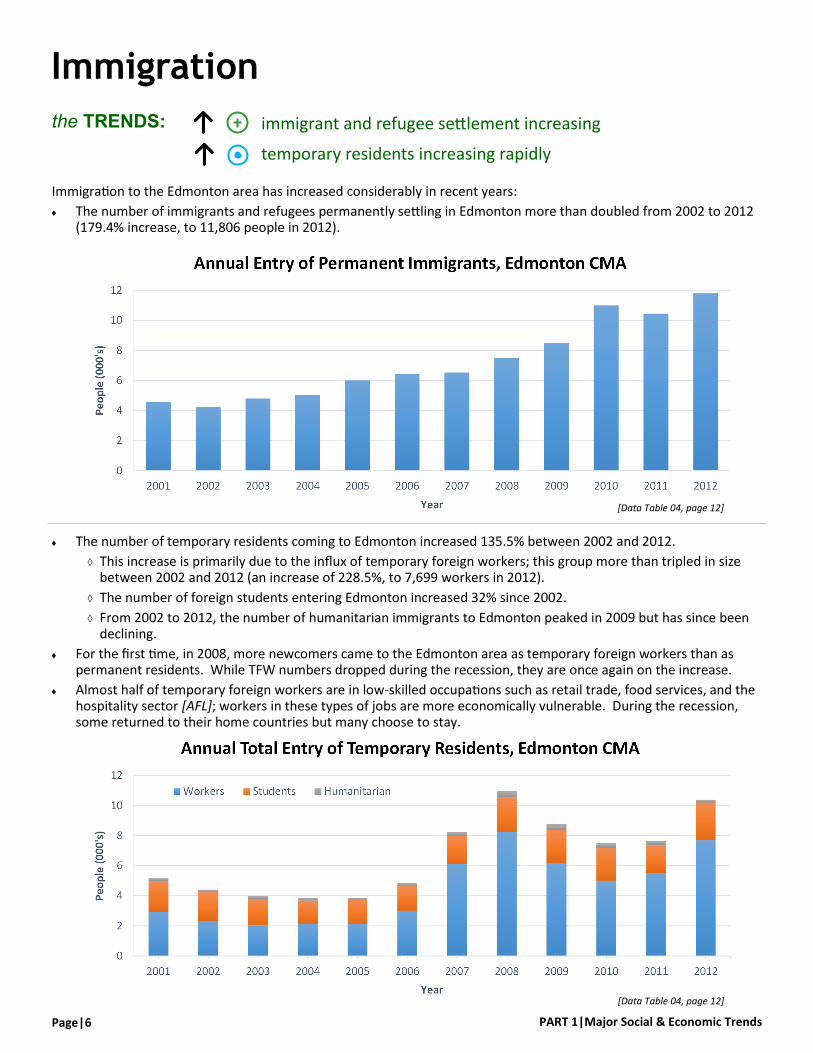
Immigration to the Edmonton area has increased considerably in recent years:
The number of immigrants and refugees permanently settling in Edmonton more than doubled from 2002 to 2012 (179.4% increase, to 11,806 people in 2012).
the TRENDS: immigrant and refugee settlement increasing
temporary residents increasing rapidly
[Data Table 04, page 12]
[Data Table 04, page 12]
The number of temporary residents coming to Edmonton increased 135.5% between 2002 and 2012.
This increase is primarily due to the influx of temporary foreign workers; this group more than tripled in size between 2002 and 2012 (an increase of 228.5%, to 7,699 workers in 2012).
The number of foreign students entering Edmonton increased 32% since 2002.
From 2002 to 2012, the number of humanitarian immigrants to Edmonton peaked in 2009 but has since been declining.
For the first time, in 2008, more newcomers came to the Edmonton area as temporary foreign workers than as permanent residents. While TFW numbers dropped during the recession, they are once again on the increase.
Almost half of temporary foreign workers are in low-skilled occupations such as retail trade, food services, and the hospitality sector [AFL]; workers in these types of jobs are more economically vulnerable. During the recession, some returned to their home countries but many choose to stay.

Page|7 Section A|Demographics
the TRENDS: percentage of immigrants increasing
percentage of visible minorities increasing
The percentage of Edmontonians born outside of Canada has grown over the past twenty-five years. In 2011, there were 205,445 immigrants living in Edmonton, making up 25.8% of the city’s total population. The number of immigrants in Edmonton grew 70.6% from 1986 to 2011, while the number of non-immigrants in-
creased by 30.1%.
Collection of data on visible minorities in Canada began in 1996. While most visible minorities are immigrants, many individuals with visible minority backgrounds are Canadian-born [Statistics Canada]. Visible minorities made up 30% of Edmonton’s total population in 2011. From 1996 to 2011, the number of visible minorities increased by 116.7%, while the number non-visible minorities
grew by only 11.5%.
Immigrants and Visible Minorities
[Data Table 05, page 12]
[Data Table 05, page 12]

PART 1|Major Social & Economic Trends Page|8
Language Diversity
The Edmonton area is becoming increasingly diverse, as evidenced by the proportion of residents speaking languages other than English or French (Canada’s official languages).
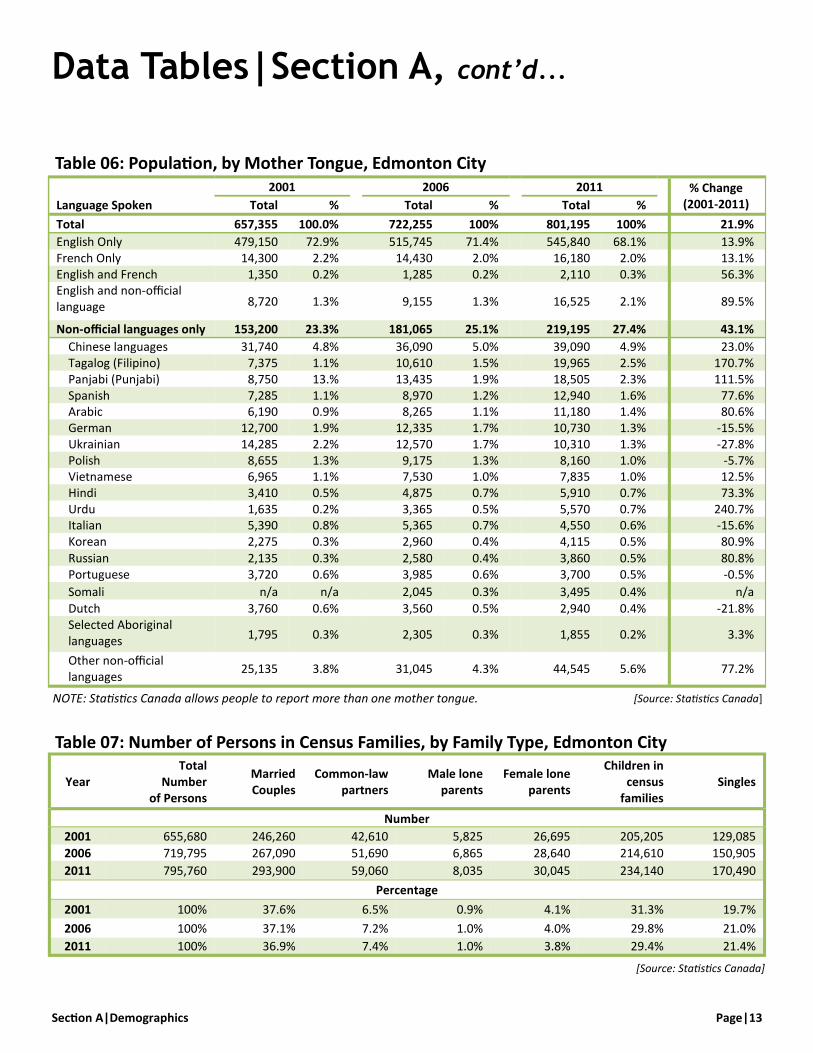
In 2011, 219,195 (27.4%) Edmonton City residents reported having a non-official mother tongue; this represents a 43.1% increase from the 2001 census.
The most common non-official mother tongues are: Chinese, Tagalog (Filipino), Panjabi (Punjabi), and Spanish.
the TRENDS: language diversity increasing
[Data Table 06, page 13]
[Data Table 06, page 13]
The Urdu, Tagalog (Filipino), Panjabi (Punjabi) and Korean mother tongues experienced the greatest growth between 2001 and 2011; The Ukrainian, Dutch, Italian and German mother tongues experienced the largest proportional decrease between 2001 and 2011.
*The Somali percent change is from 2006-2011 due to the absence of specific data in 2001.
Page|9 Section A|Demographics
Ethnic Diversity
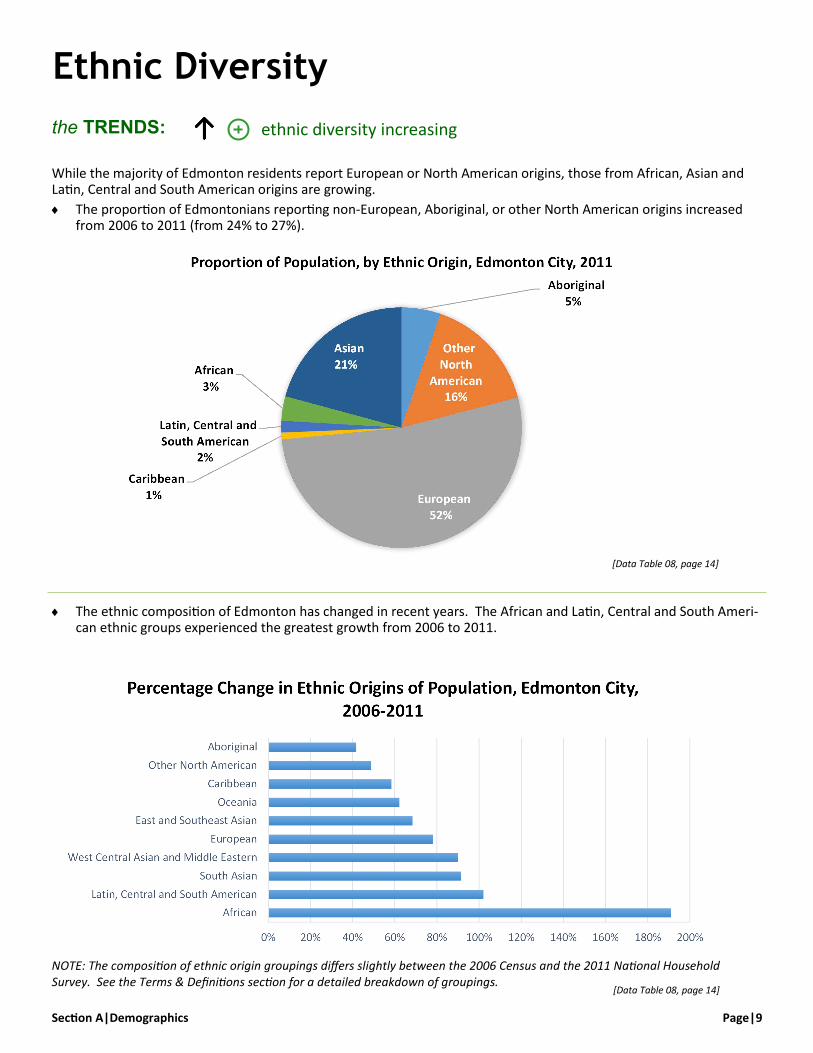
the TRENDS: ethnic diversity increasing
While the majority of Edmonton residents report European or North American origins, those from African, Asian and Latin, Central and South American origins are growing.
The proportion of Edmontonians reporting non-European, Aboriginal, or other North American origins increased from 2006 to 2011 (from 24% to 27%).
[Data Table 08, page 14]
The ethnic composition of Edmonton has changed in recent years. The African and Latin, Central and South Ameri-can ethnic groups experienced the greatest growth from 2006 to 2011.
NOTE: The composition of ethnic origin groupings differs slightly between the 2006 Census and the 2011 National Household Survey. See the Terms & Definitions section for a detailed breakdown of groupings.
[Data Table 08, page 14]
PART 1|Major Social & Economic Trends Page|10
Families
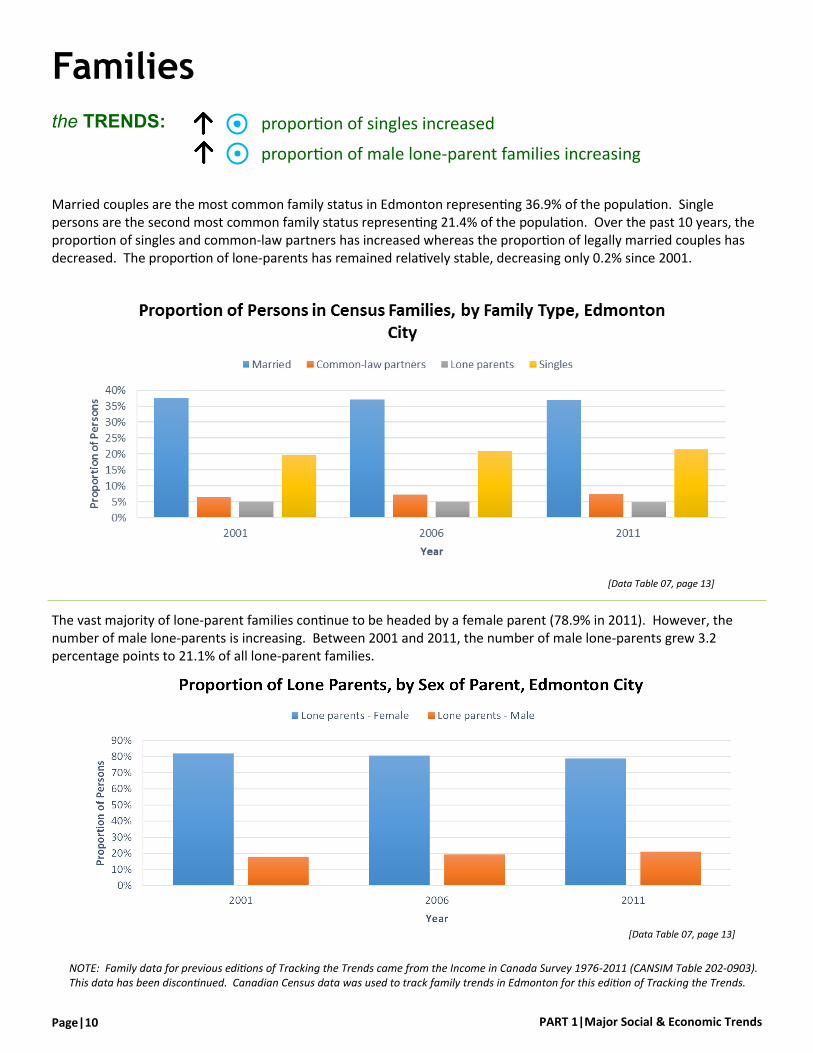
Married couples are the most common family status in Edmonton representing 36.9% of the population. Single persons are the second most common family status representing 21.4% of the population. Over the past 10 years, the proportion of singles and common-law partners has increased whereas the proportion of legally married couples has decreased. The proportion of lone-parents has remained relatively stable, decreasing only 0.2% since 2001.
the TRENDS: proportion of singles increased
proportion of male lone-parent families increasing
[Data Table 07, page 13]
The vast majority of lone-parent families continue to be headed by a female parent (78.9% in 2011). However, the number of male lone-parents is increasing. Between 2001 and 2011, the number of male lone-parents grew 3.2 percentage points to 21.1% of all lone-parent families.
NOTE: Family data for previous editions of Tracking the Trends came from the Income in Canada Survey 1976-2011 (CANSIM Table 202-0903). This data has been discontinued. Canadian Census data was used to track family trends in Edmonton for this edition of Tracking the Trends.
[Data Table 07, page 13]
Page|11 Section A|Demographics
Data Tables|Section A
Table 01: Population, Edmonton City & Edmonton CMA
Year Edmonton City Edmonton CMA
1981 521,205 742,018
1986 571,506 786,596
1991 614,665 853,900
1996 616,306 875,590
2001 657,350 951,114 2006 730,372 1,049,428
2008 752,412 1,128,188 2009 782,439 1,157,200
2011 812,201 1,159,869 2012 817,498 1,230,056
Table 02: Population, by Age Group, Edmonton City
Age 1981
Federal 1986
Federal 1991
Federal 1996
Federal 2001
Federal 2006
Federal 2009*
Municipal 2011
Federal 2012*
Municipal
0-9 71,926 (13.8%)
83,207 (14.6%)
92,231 (15.0%)
85,080 (13.8%)
80,025 (12.0%)
80,100 (11.0%)
75,530 (11.1%)
92,880 (11.4%)
78,468 (11.7%)
10-19 86,472 (16.6%)
73,815 (12.9%)
76,159 (12.4%)
81,360 (13.2%)
89,400 (13.4%)
92,840 (12.7%)
82,840 (12.2%)
91,505 (11.3%)
76,214 (11.4%)
20-29 137,653 (26.4%)
140,162 (24.5%)
123,043 (20.0%)
98,655 (16.0%)
110,160 (16.5%)
127,995 (17.5%)
121,135 (17.8%)
143,545 (17.7%)
114,384 (17.1%)
30-39 74,686 (14.3%)
100,502 (17.6%)
119,342 (19.4%)
113,525 (18.4%)
105,685 (15.9%)
104,500 (14.3%)
101,694 (15.0%)
122,815 (15.1%)
103,499 (15.5%)
40-49 52,590 (10.1%)
58,471 (10.2%)
73,764 (12.0%)
91,025 (14.8%)
107,940 (16.2%)
116,240 (15.9%)
101,678 (15.0%)
116,055 (14.3%)
94,282 (14.1%)
50-59 45,948 (8.8%)
49,791 (8.7%)
50,683 (8.2%)
55,275 (9.0%)
70,485 (10.6%)
93,295 (12.8%)
90,229 (13.3%)
111,495 (13.7%)
92,592 (13.8%)
60-69 28,970 (5.6%)
36,304 (6.4%)
43,442 (7.1%)
45,725 (7.4%)
47,320 (7.1%)
52,235 (7.2%)
51,762 (7.6%)
65,895 (8.1%)
56,688 (8.5%)
70-79 16,475 (3.2%)
20,228 (3.5%)
24,952 (4.1%)
30,875 (5.0%)
36,680 (5.5%)
39,500 (5.4%)
34,022 (5.0%)
39,880 (4.9%)
32,728 (4.9%)
80 + 6,525 (1.3%)
9,015 (1.6%)
11,049 (1.8%)
14,785 (2.4%)
18,405 (2.8%)
23,680 (3.2%)
21,173 (3.1%)
28,140 (3.5%)
20,696 (3.1%)
Total 521,245 571,495 614,665 616,305 666,100 730,385 782,439 812,210 817,498
[Source: City of Edmonton & Statistics Canada] * Age group counts for 2009 and 2012 do not add up to the total, due to persons being counted with unreported ages. Percentages for 2009 and 2012 were calculated using the total number of persons with reported ages.
[Source: City of Edmonton, Canada West Foundation & Statistics Canada]
NOTE: 2008, 2009 & 2012 Edmonton CMA populations are Statistics Canada annual demographic estimates.

PART 1|Major Social & Economic Trends Page|12
[Source: Citizenship and Immigration Canada]
Table 04: Annual Entry of Permanent and Temporary Residents, Edmonton CMA
Year Permanent
Residents
Temporary Residents
Workers Students Humanitarian Total
2001 4,583 2,921 2,062 183 5,166
2002 4,225 2,344 1,900 169 4,413
2003 4,810 2,028 1,772 174 3,974
2004 5,057 2,135 1,556 150 3,841
2005 6,016 2,141 1,623 99 3,863
2006 6,444 3,007 1,646 200 4,853
2007 6,540 6,098 1,901 241 8,240
2008 7,517 8,262 2,299 405 10,966
2009 8,508 6,178 2,204 408 8,790
2010 11,005 5,005 2,198 319 7,522
2011 10,457 5,504 1,858 307 7,669
2012 11,806 7,699 2,508 188 10,395
Data Tables|Section A, cont’d...
[Source: Statistics Canada]
Year
Immigrants Visible Minorities
Total Population Number % of Population Number % of Population
1986 573,985 120,410 21.0% N/A N/A
1991 604,835 132,490 21.9% N/A N/A
1996 609,745 137,145 22.5% 110,160 18.1%
2001 657,355 143,335 21.8% 129,335 19.7%
2006 722,260 165,615 22.9% 165,465 22.9%
2011 795,675 205,445 25.8% 238,755 30.0%
Table 05: Population of Immigrants and Visible Minorities, Edmonton City
Table 03: Aboriginal Population, Edmonton City & Edmonton CMA
Year Edmonton City Edmonton CMA
1996 24,110 32,825
2001 30,365 40,930
2006 38,170 52,105 2011 41,985 61,765
[Source: Statistics Canada]
Page|13 Section A|Demographics
[Source: Statistics Canada]
[Source: Statistics Canada]
Table 06: Population, by Mother Tongue, Edmonton City
Language Spoken
2001 2006 2011 % Change (2001-2011) Total % Total % Total %
Total 657,355 100.0% 722,255 100% 801,195 100% 21.9%
English Only 479,150 72.9% 515,745 71.4% 545,840 68.1% 13.9% French Only 14,300 2.2% 14,430 2.0% 16,180 2.0% 13.1% English and French 1,350 0.2% 1,285 0.2% 2,110 0.3% 56.3% English and non-official language 8,720 1.3% 9,155 1.3%
16,525 2.1%
89.5%
Non-official languages only 153,200 23.3% 181,065 25.1% 219,195 27.4% 43.1%
Chinese languages 31,740 4.8% 36,090 5.0% 39,090 4.9% 23.0% Tagalog (Filipino) 7,375 1.1% 10,610 1.5% 19,965 2.5% 170.7% Panjabi (Punjabi) 8,750 13.% 13,435 1.9% 18,505 2.3% 111.5% Spanish 7,285 1.1% 8,970 1.2% 12,940 1.6% 77.6% Arabic 6,190 0.9% 8,265 1.1% 11,180 1.4% 80.6% German 12,700 1.9% 12,335 1.7% 10,730 1.3% -15.5% Ukrainian 14,285 2.2% 12,570 1.7% 10,310 1.3% -27.8% Polish 8,655 1.3% 9,175 1.3% 8,160 1.0% -5.7% Vietnamese 6,965 1.1% 7,530 1.0% 7,835 1.0% 12.5% Hindi 3,410 0.5% 4,875 0.7% 5,910 0.7% 73.3% Urdu 1,635 0.2% 3,365 0.5% 5,570 0.7% 240.7% Italian 5,390 0.8% 5,365 0.7% 4,550 0.6% -15.6% Korean 2,275 0.3% 2,960 0.4% 4,115 0.5% 80.9%
Russian 2,135 0.3% 2,580 0.4% 3,860 0.5% 80.8% Portuguese 3,720 0.6% 3,985 0.6% 3,700 0.5% -0.5%
Somali n/a n/a 2,045 0.3% 3,495 0.4% n/a
Dutch 3,760 0.6% 3,560 0.5% 2,940 0.4% -21.8% Selected Aboriginal languages 1,795 0.3%
2,305 0.3% 1,855 0.2%
3.3%
Other non-official languages
25,135 3.8% 31,045 4.3%
44,545 5.6%
77.2%
NOTE: Statistics Canada allows people to report more than one mother tongue.
Data Tables|Section A, cont’d...
Table 07: Number of Persons in Census Families, by Family Type, Edmonton City
Year Total
Number of Persons
Married Couples
Common-law partners
Male lone parents
Children in census
families Singles
Female lone parents
Number
2001 655,680 246,260 42,610 5,825 205,205 129,085 26,695
2006 719,795 267,090 51,690 6,865 214,610 150,905 28,640
2011 795,760 293,900 59,060 8,035 234,140 170,490 30,045
Percentage
2001 100% 37.6% 6.5% 0.9% 31.3% 19.7% 4.1%
2006 100% 37.1% 7.2% 1.0% 29.8% 21.0% 4.0%
2011 100% 36.9% 7.4% 1.0% 29.4% 21.4% 3.8%

PART 1|Major Social & Economic Trends Page|14
Table 08: Population, by Reported Ethnic Origins, Edmonton City
Area of Origin
2006 2011 Change (2006—2011)
Total % Total % Total %
Total 598,900 100.0% 795,675 100.0% 196,775 32.9%
North American Aboriginal 35,495 5.9% 50,300 6.3% 14,805 41.7%
Other North American 100,405 16.8% 149,370 18.8% 48,965 48.8%
European 280,875 46.9% 499,955 62.8% 219,080 78.0% British Isles 229,915 38.4% 276,800 34.8% 46,885 20.4%
French 65,865 11.0% 83,275 10.5% 17,410 26.4%
Western European (except French) 124,785 20.8% 153,120 19.2% 28,335 22.7%
Northern European (except British) 42,860 7.2% 53,240 6.7% 10,380 24.2%
Eastern European 125,875 21.0% 151,845 19.1% 25,970 20.6% Southern European 37,530 6.3% 50,370 3.6% 12,840 34.2%
Caribbean 5,360 0.9% 8,490 1.1% 3,130 58.4%
Latin, Central and South American 7,515 1.3% 15,190 1.9% 7,675 102.1%
African 10,615 1.8% 30,880 3.9% 20,265 190.9%
Asian n/a n/a 197,860 24.9% n/a n/a
West Central Asian and Middle Eastern 13,975 2.3% 26,555 3.3% 12,580 90.0%
South Asian 30,105 5.0% 57,670 7.2% 27,565 91.6%
East and Southeast Asian 68,075 11.4% 114,630 14.4% 46,555 68.4%
Oceania 1,865 0.3% 3,025 0.4% 1,160 62.2%
[Source: Statistics Canada] NOTE: The totals for each ethnic origin do not add up to the reported total (population), because Statistics Canada allows people to report more than one ethnic origin. The composition of ethnic origin groupings differs slightly between the 2006 Census and the 2011 National Household Survey. The 2006 West Central Asian and Middle Eastern population was calculated by combining the Arab and West Asian populations from the 2006 census. See the Terms & Definitions section for a detailed breakdown of groupings.
Data Tables|Section A, cont’d...

Section B|Education & Employment Page|15
Section B|Education & Employment
Education is a determinant of future career options and lifetime earning potential, particularly as the economy becomes increasingly knowledge-based. Earnings for university graduates are significantly higher than high school graduates, both on a per annum and lifetime basis.
Higher education also provides some protection against
economic fluctuations; more highly educated individuals
are less likely to become unemployed in the event of an
economic downturn. They are also more likely to
achieve financial security after retiring. [Statistics
Canada]
Overall, Edmontonians benefit greatly from Alberta’s strong economy. They also appear to be investing more in their education, likely a response to the increased prevalence of high-skilled and knowledge-based jobs.
Education
Edmonton’s population is becoming more highly educated, both in terms of high school completion and post-secondary educational attainment. That said, there is still considerable room for improvement. Nearly one in five Edmontonians have not completed high school, thereby severely limiting their career options in an economy that increasingly values higher education.
Employment
Economic growth has been strong in Edmonton over the past decade, and employment levels increased as a result. The economic downturn that began in late 2008, however, resulted in significant job losses. Employment numbers only returned to pre-recession levels in late 2010. Since then, employment growth has rebounded strongly.
Some groups have historically been at a greater risk of
unemployment. Young people, the Aboriginal
population, persons with disabilities, and newcomers
continue to be at a disadvantage.
How is Edmonton Changing?
the TRENDS: education trends consistently improving
employment trends improving after recent economic downturn
Why are Education Trends Important?
Employment-related measures indicate the strength of an economy and, accordingly, the population’s ability to sustain itself. The higher unemployment rises, the more people will need income support to maintain a decent standard of living. Times of high unemployment additionally challenge government and business to find opportunities for stimulating job growth.
Times of low unemployment also have their challenges.
For instance, working families may struggle to balance
their work and family roles, and may face difficulties
securing adequate child care. These issues all require
informed program and policy planning, as facilitated by
trend analysis.
Why are Employment Trends Important?
Page|16 PART 1|Major Social & Economic Trends
High School Education
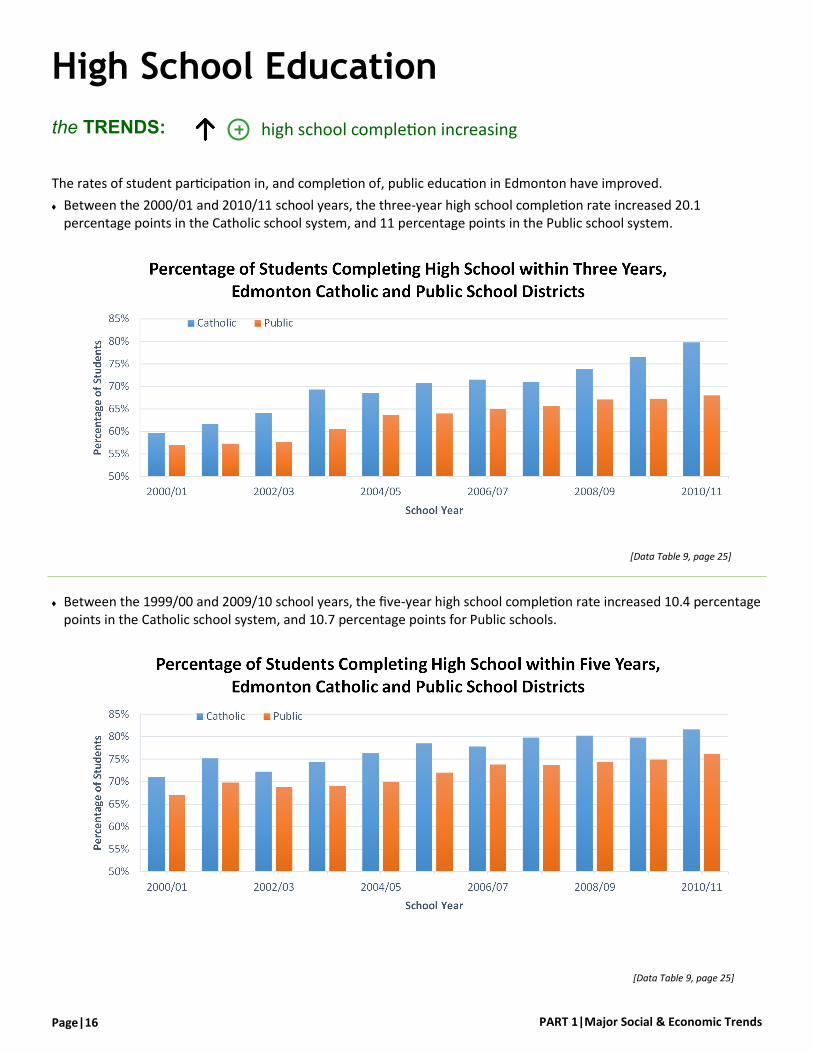
The rates of student participation in, and completion of, public education in Edmonton have improved.
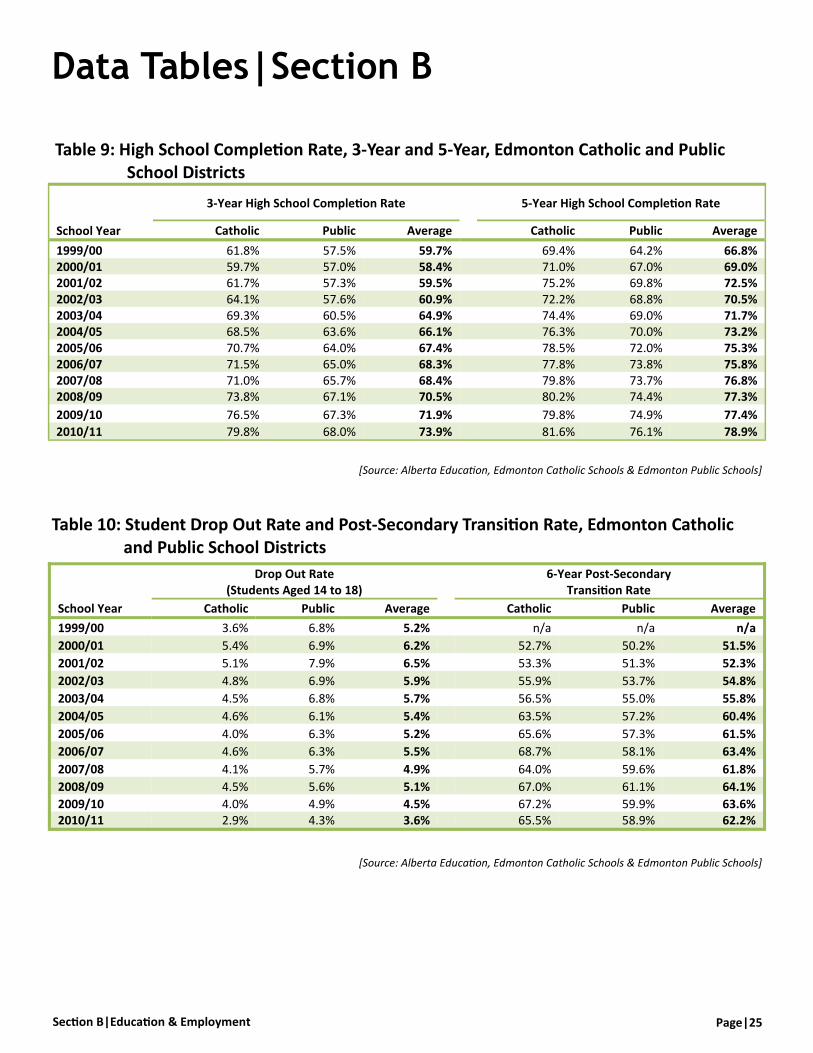
Between the 2000/01 and 2010/11 school years, the three-year high school completion rate increased 20.1 percentage points in the Catholic school system, and 11 percentage points in the Public school system.
the TRENDS: high school completion increasing
[Data Table 9, page 25]
Between the 1999/00 and 2009/10 school years, the five-year high school completion rate increased 10.4 percentage points in the Catholic school system, and 10.7 percentage points for Public schools.
[Data Table 9, page 25]

Section B|Education & Employment Page|17
The proportion of Edmontonians that have completed high school has increased.
In 2011, 17.5% of Edmontonians had not completed their High School Diploma—a decrease of 16.2 percentage points since 1991.
In 2011, 82.5% of Edmonton’s population had completed their High School Diploma—an increase of 4.4 percentage points since 2006.
The annual drop-out rate decreased 2.5 percentage points in Catholic schools and 2.6 percentage points in Public schools between the 2000/01 and 2010/11 school years.
the TRENDS: student drop-out rate declining
High School Education, cont’d...
NOTE: 2001 data is based on the population aged 20
completion of high school education increasing
[Data Table 10, page 25]
[Data Table 11, page 26]
Page|18 PART 1|Major Social & Economic Trends
Post-Secondary Education
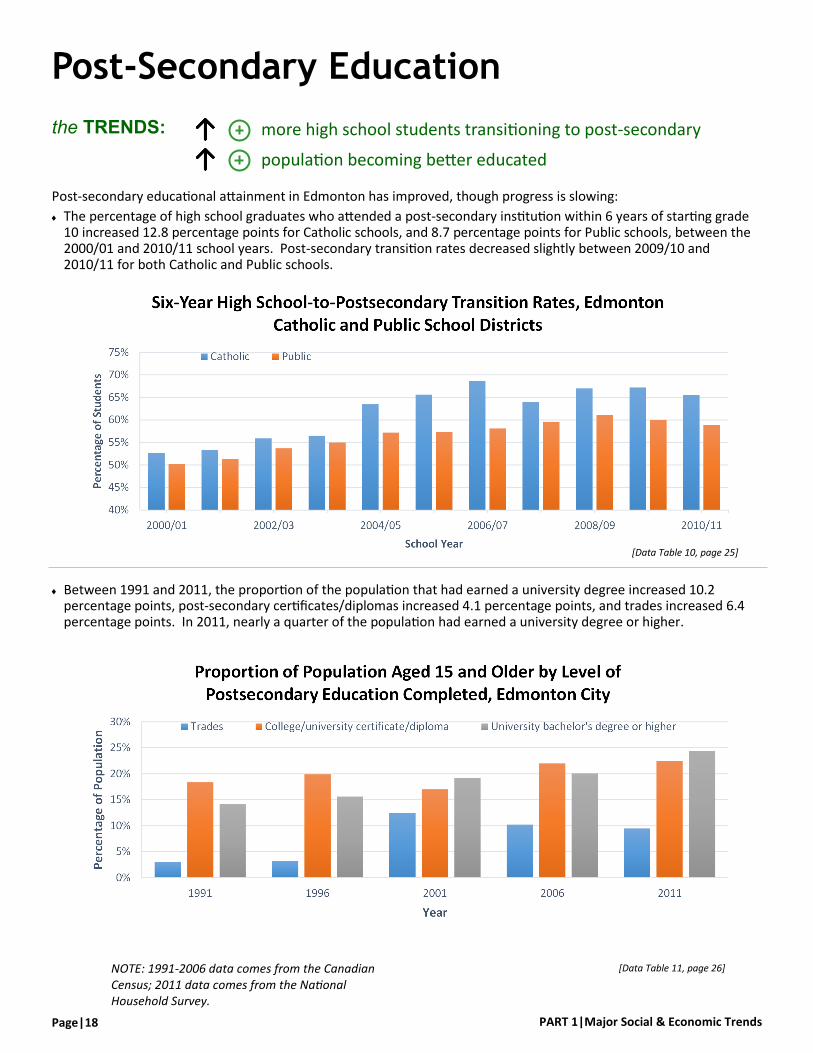
Between 1991 and 2011, the proportion of the population that had earned a university degree increased 10.2 percentage points, post-secondary certificates/diplomas increased 4.1 percentage points, and trades increased 6.4 percentage points. In 2011, nearly a quarter of the population had earned a university degree or higher.
the TRENDS: more high school students transitioning to post-secondary
population becoming better educated
Post-secondary educational attainment in Edmonton has improved, though progress is slowing:
The percentage of high school graduates who attended a post-secondary institution within 6 years of starting grade 10 increased 12.8 percentage points for Catholic schools, and 8.7 percentage points for Public schools, between the 2000/01 and 2010/11 school years. Post-secondary transition rates decreased slightly between 2009/10 and 2010/11 for both Catholic and Public schools.
[Data Table 11, page 26] NOTE: 1991-2006 data comes from the Canadian Census; 2011 data comes from the National Household Survey.
[Data Table 10, page 25]
Section B|Education & Employment Page|19
the TRENDS: number of employed persons increased
labour force participation returning to pre-recession levels
Employment
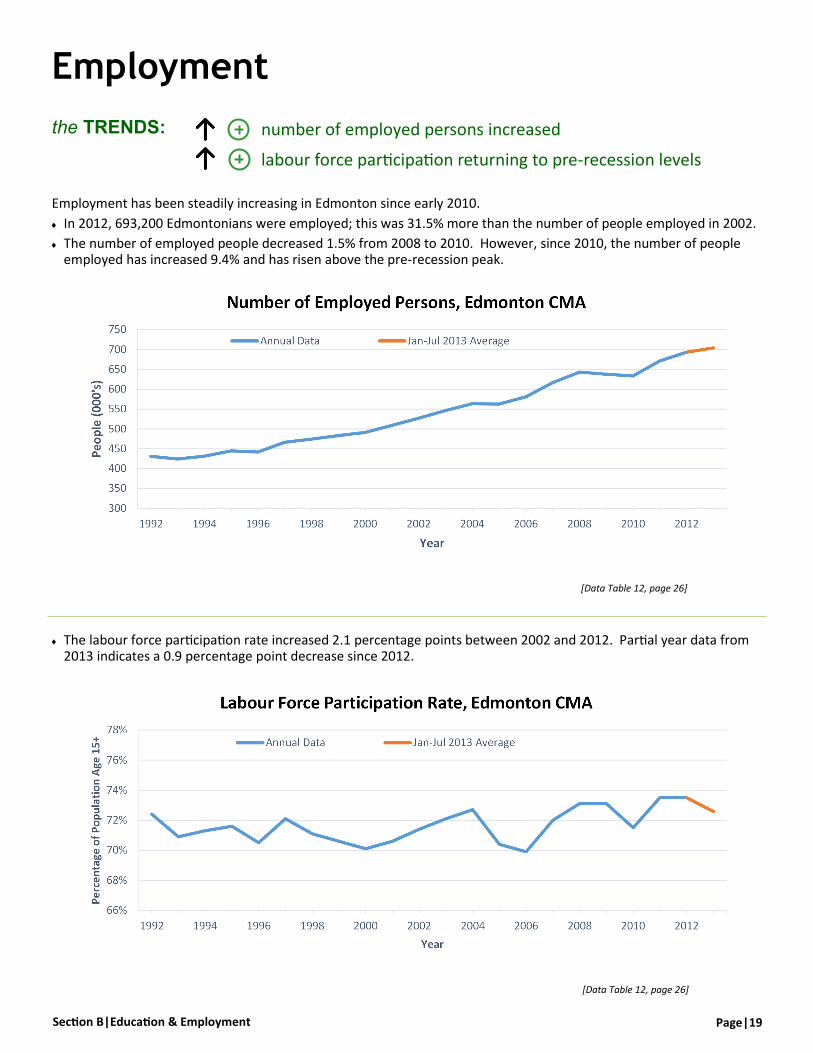
The labour force participation rate increased 2.1 percentage points between 2002 and 2012. Partial year data from 2013 indicates a 0.9 percentage point decrease since 2012.
Employment has been steadily increasing in Edmonton since early 2010.
In 2012, 693,200 Edmontonians were employed; this was 31.5% more than the number of people employed in 2002.
The number of employed people decreased 1.5% from 2008 to 2010. However, since 2010, the number of people employed has increased 9.4% and has risen above the pre-recession peak.
[Data Table 12, page 26]
[Data Table 12, page 26]
Page|20 PART 1|Major Social & Economic Trends
Employment, cont’d...
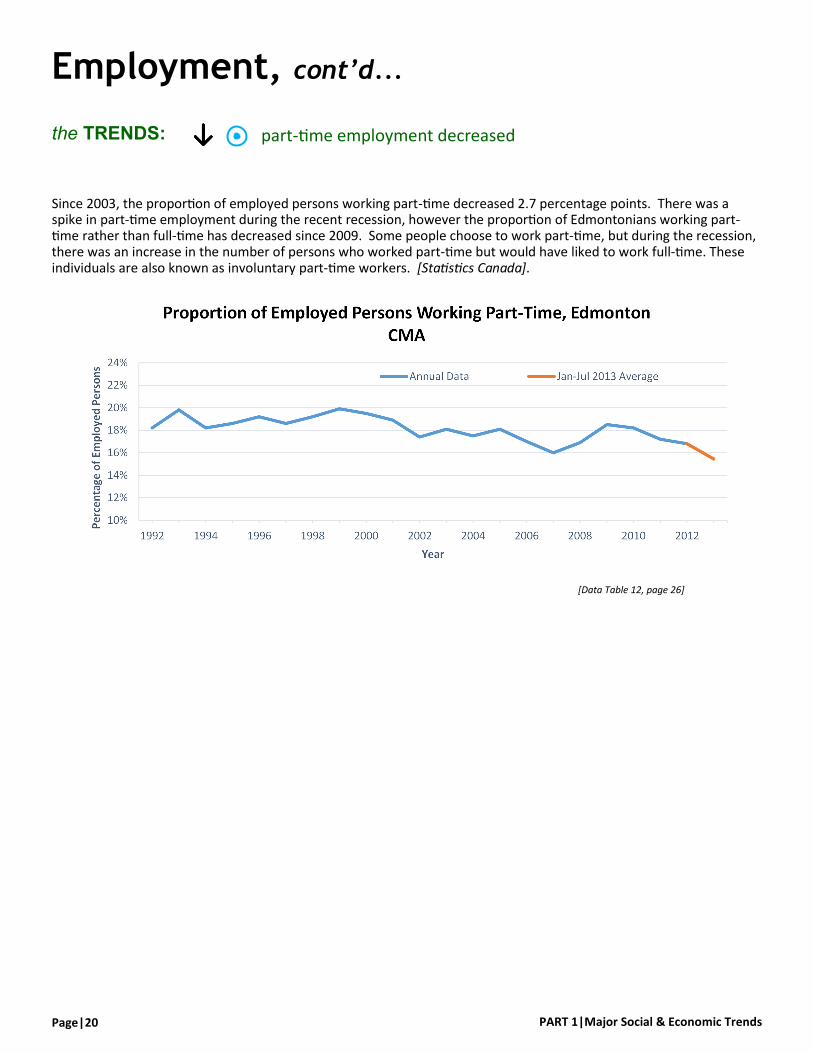
Since 2003, the proportion of employed persons working part-time decreased 2.7 percentage points. There was a spike in part-time employment during the recent recession, however the proportion of Edmontonians working part-time rather than full-time has decreased since 2009. Some people choose to work part-time, but during the recession, there was an increase in the number of persons who worked part-time but would have liked to work full-time. These individuals are also known as involuntary part-time workers. [Statistics Canada].
the TRENDS: part-time employment decreased
[Data Table 12, page 26]
Section B|Education & Employment Page|21
Unemployment
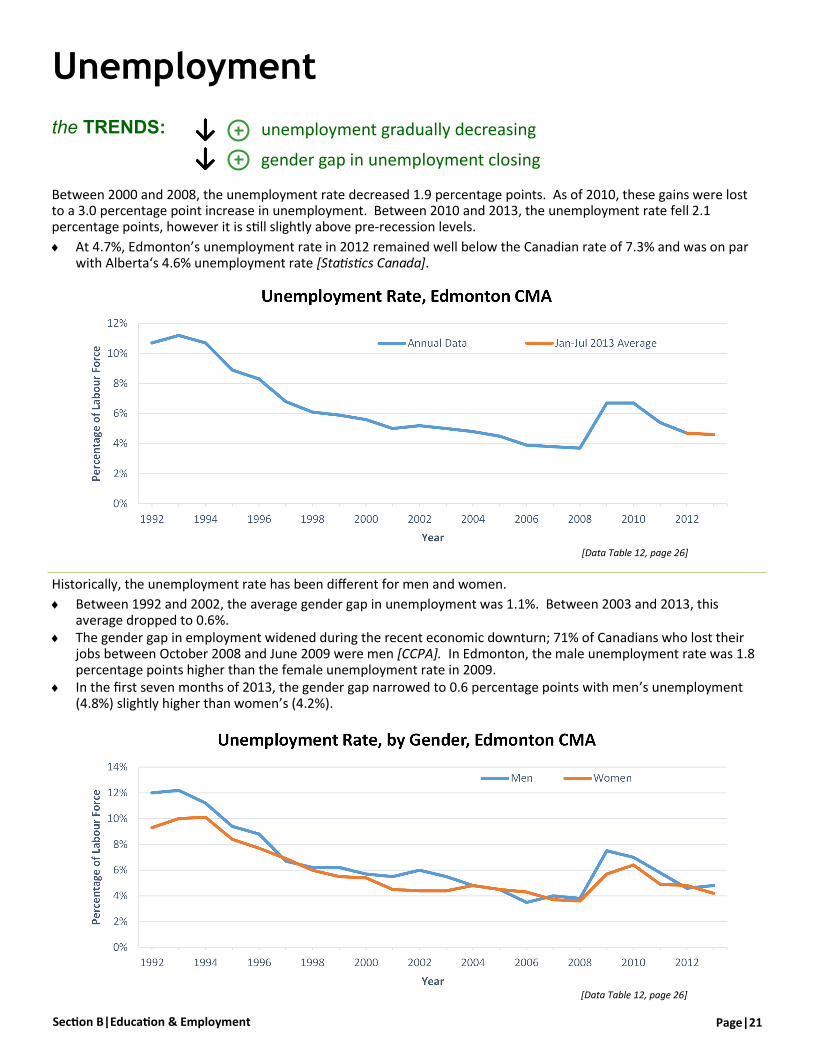
Between 2000 and 2008, the unemployment rate decreased 1.9 percentage points. As of 2010, these gains were lost to a 3.0 percentage point increase in unemployment. Between 2010 and 2013, the unemployment rate fell 2.1 percentage points, however it is still slightly above pre-recession levels.
At 4.7%, Edmonton’s unemployment rate in 2012 remained well below the Canadian rate of 7.3% and was on par with Alberta‘s 4.6% unemployment rate [Statistics Canada].
Historically, the unemployment rate has been different for men and women.
Between 1992 and 2002, the average gender gap in unemployment was 1.1%. Between 2003 and 2013, this average dropped to 0.6%.
The gender gap in employment widened during the recent economic downturn; 71% of Canadians who lost their jobs between October 2008 and June 2009 were men [CCPA]. In Edmonton, the male unemployment rate was 1.8 percentage points higher than the female unemployment rate in 2009.
In the first seven months of 2013, the gender gap narrowed to 0.6 percentage points with men’s unemployment (4.8%) slightly higher than women’s (4.2%).
[Data Table 12, page 26]
[Data Table 12, page 26]
the TRENDS: unemployment gradually decreasing
gender gap in unemployment closing

Page|22 PART 1|Major Social & Economic Trends
the TRENDS: age gap in unemployment widened
Aboriginal unemployment decreasing
Aboriginal unemployment higher than average
Unemployment, cont’d…
Before the economic downturn, significant gains were made in terms of Aboriginal employment. Partial year data from 2013 indicates a return pre-recession unemployment levels.
From 2005 to 2007, the Aboriginal unemployment rate decreased 3.1 percentage points. This was followed by a 5.8 percentage point increase between 2008 and 2009. Aboriginal unemployment rates have fallen 7.2 percentage points since 2009 compared to 2.1 percentage points for the overall population.
Currently, the Aboriginal unemployment rate is almost twice that of the overall population.
Edmonton’s unemployment rate also varies by age.
The unemployment rate for youth (age 15-24) remains considerably higher than for older workers. There was a 6.2% gap in the unemployment rate between the 15-24 and 25-54 age groups in the first seven months of 2013 (1.6%higher than the gap in 2003).
The 25-54 age group has made the largest recovery since the recession sitting only 0.6% above pre-recession unemployment levels. The 15-24 age group has made the smallest recovery sitting 2.0% above pre-recession unemployment levels.
[Data Table 13, page 27] NOTE: 2013 data is a Jan-Jul average
[Data Table 12, page 26]
Section B|Education & Employment Page|23
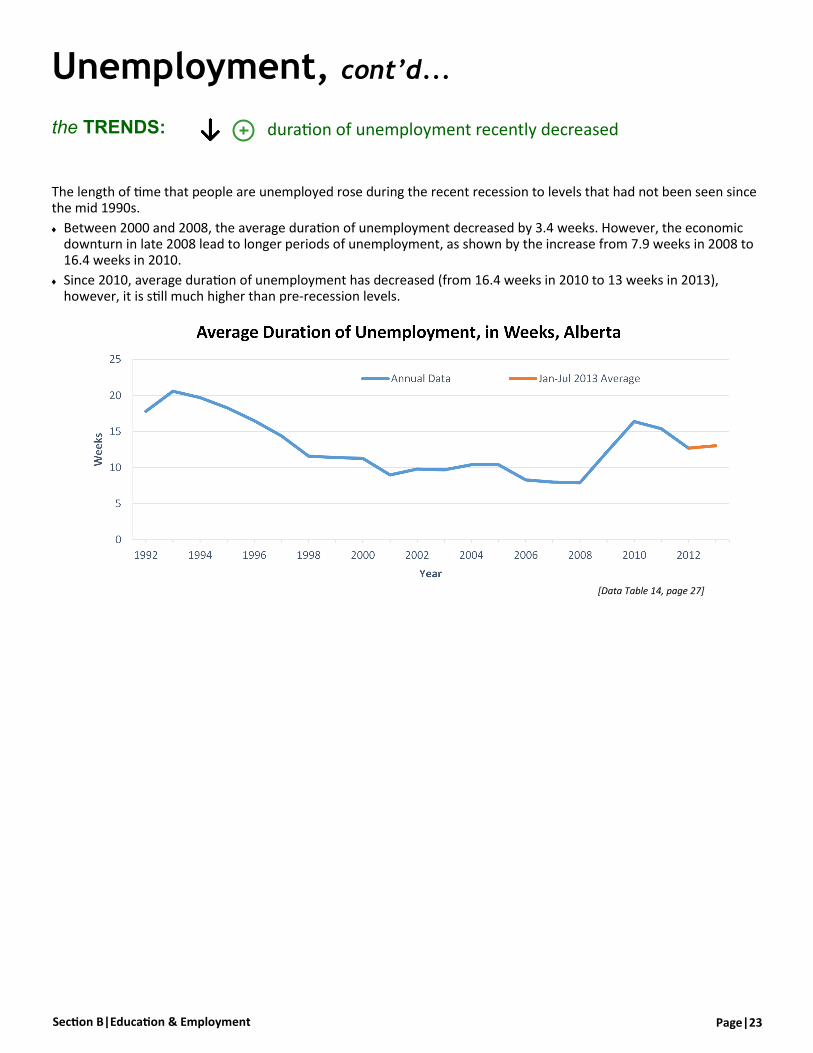
the TRENDS: duration of unemployment recently decreased
The length of time that people are unemployed rose during the recent recession to levels that had not been seen since the mid 1990s.
Between 2000 and 2008, the average duration of unemployment decreased by 3.4 weeks. However, the economic downturn in late 2008 lead to longer periods of unemployment, as shown by the increase from 7.9 weeks in 2008 to 16.4 weeks in 2010.
Since 2010, average duration of unemployment has decreased (from 16.4 weeks in 2010 to 13 weeks in 2013), however, it is still much higher than pre-recession levels.
Unemployment, cont’d...
[Data Table 14, page 27]

Page|24 PART 1|Major Social & Economic Trends
Proportion of Employed Persons by Occupation (2012), Edmonton CMA
Occupation
The most common occupations in the Edmonton area in 2012 were: sales and service; trades, transportation and equipment operation; and, business, finance and administration.
The fastest growing occupations between 2002 and 2012 were: primary industry (106.7% increase); health (66.1% increase); and trades, transportation and equipment operation (57.5%).
The largest decline was in processing, manufacturing, and utilities occupations (14.5% decrease).
the TRENDS: sales & service most common occupation
primary industry experiencing the highest growth
[Data Table 15, page 27]
[Data Table 15, page 27]
Section B|Education & Employment Page|25
Data Tables|Section B
Table 9: High School Completion Rate, 3-Year and 5-Year, Edmonton Catholic and Public School Districts
School Year
3-Year High School Completion Rate 5-Year High School Completion Rate
Catholic Public Average Catholic Public Average
1999/00 61.8% 57.5% 59.7% 69.4% 64.2% 66.8% 2000/01 59.7% 57.0% 58.4% 71.0% 67.0% 69.0% 2001/02 61.7% 57.3% 59.5% 75.2% 69.8% 72.5% 2002/03 64.1% 57.6% 60.9% 72.2% 68.8% 70.5% 2003/04 69.3% 60.5% 64.9% 74.4% 69.0% 71.7% 2004/05 68.5% 63.6% 66.1% 76.3% 70.0% 73.2% 2005/06 70.7% 64.0% 67.4% 78.5% 72.0% 75.3% 2006/07 71.5% 65.0% 68.3% 77.8% 73.8% 75.8% 2007/08 71.0% 65.7% 68.4% 79.8% 73.7% 76.8% 2008/09 73.8% 67.1% 70.5% 80.2% 74.4% 77.3%
2009/10 76.5% 67.3% 71.9% 79.8% 74.9% 77.4%
2010/11 79.8% 68.0% 73.9% 81.6% 76.1% 78.9%
[Source: Alberta Education, Edmonton Catholic Schools & Edmonton Public Schools]
School Year
Drop Out Rate (Students Aged 14 to 18)
6-Year Post-Secondary
Transition Rate
Catholic Public Average Catholic Public Average
1999/00 3.6% 6.8% 5.2% n/a n/a n/a
2000/01 5.4% 6.9% 6.2% 52.7% 50.2% 51.5%
2001/02 5.1% 7.9% 6.5% 53.3% 51.3% 52.3%
2002/03 4.8% 6.9% 5.9% 55.9% 53.7% 54.8%
2003/04 4.5% 6.8% 5.7% 56.5% 55.0% 55.8%
2004/05 4.6% 6.1% 5.4% 63.5% 57.2% 60.4%
2005/06 4.0% 6.3% 5.2% 65.6% 57.3% 61.5%
2006/07 4.6% 6.3% 5.5% 68.7% 58.1% 63.4%
2007/08 4.1% 5.7% 4.9% 64.0% 59.6% 61.8%
2008/09 4.5% 5.6% 5.1% 67.0% 61.1% 64.1%
2009/10 4.0% 4.9% 4.5% 67.2% 59.9% 63.6% 2010/11 2.9% 4.3% 3.6% 65.5% 58.9% 62.2%
Table 10: Student Drop Out Rate and Post-Secondary Transition Rate, Edmonton Catholic and Public School Districts
[Source: Alberta Education, Edmonton Catholic Schools & Edmonton Public Schools]

Page|26 PART 1|Major Social & Economic Trends
Table 12: Employment & Unemployment Statistics, Edmonton CMA
Year
Unemployment Employment
Employed Persons
Participa-tion Rate
Part-time (%) Average
Gender Age Group
Men Women 15-24 yrs 25-54 yrs 55+ yrs
1991 430,700 72.2% 16.4% 9.3% 10.3% 8.0% 12.3% 8.5% 8.6%
1992 430,900 72.4% 18.2% 10.7% 12.0% 9.3% 14.7% 9.6% 10.6%
1993 424,200 70.9% 19.8% 11.2% 12.2% 10.0% 14.9% 10.2% 11.2%
1994 431,400 71.3% 18.2% 10.7% 11.2% 10.1% 15.2% 9.5% 12.0%
1995 444,700 71.6% 18.6% 8.9% 9.4% 8.4% 14.3% 7.5% 10.1%
1996 441,700 70.5% 19.2% 8.3% 8.8% 7.7% 13.6% 7.0% 8.9%
1997 466,300 72.1% 18.6% 6.8% 6.7% 6.9% 11.8% 5.7% 5.8%
1998 474,500 71.1% 19.2% 6.1% 6.2% 6.0% 11.6% 4.9% 5.3%
1999 483,100 70.6% 19.9% 5.9% 6.2% 5.5% 12.5% 4.6% 3.2%
2000 491,100 70.1% 19.5% 5.6% 5.7% 5.4% 11.3% 4.3% 4.1%
2001 508,900 70.6% 18.9% 5.0% 5.5% 4.5% 11.1% 3.9% 2.6%
2002 527,100 71.4% 17.4% 5.3% 6.0% 4.4% 9.6% 4.3% 3.5%
2003 546,200 72.1% 18.1% 5.0% 5.5% 4.4% 8.8% 4.2% 3.9%
2004 563,600 72.7% 17.5% 4.8% 4.8% 4.8% 9.4% 3.9% 2.9%
2005 562,500 70.4% 18.1% 4.5% 4.5% 4.5% 7.6% 3.9% 2.6%
2006 580,900 69.9% 17.0% 3.9% 3.5% 4.3% 7.3% 3.2% 2.3%
2007 616,300 72.0% 16.0% 3.9% 4.0% 3.7% 7.5% 3.0% 2.6%
2008 642,900 73.1% 16.9% 3.7% 3.8% 3.6% 7.6% 2.9% 2.4%
2009 637,900 73.1% 18.5% 6.7% 7.5% 5.7% 11.1% 5.9% 4.9%
2010 633,400 71.5% 18.2% 6.7% 7.0% 6.4% 11.3% 6.1% 4.5%
2011 671,000 73.5% 17.2% 5.4% 5.8% 4.9% 9.2% 4.6% 4.6%
2012 693,200 73.5% 16.8% 4.7% 4.6% 4.8% 9.3% 3.9% 3.7%
2013* 704,100 72.6% 15.4% 4.6% 4.8% 4.2% 9.7% 3.5% 3.9%
[Source: Statistics Canada]
Data Tables|Section B, cont’d...
*Jan—Jul 2013 average
Table 11: Highest Level of Education Completed, Population Aged 15 & Older, Edmonton City
Education Level Attained
1991 1996 2001 2011 2006
Number % Number % Number % Number % Number %
Total 479,440 100% 483,095 100% 487,855 100% 598,900 100% 660,820 100% High School not completed
161,720 33.7% 153,785 31.8% 122,795 25.2% 131,220 21.9%
115,630 17.5%
High School Diploma, or higher (detail below)
317,720 66.3% 329,310 68.2% 365,060 74.8% 467,680 78.1% 545,190 82.5%
High School 147,280 30.7% 142,065 29.4% 127,750 26.2% 154,680 25.8% 172,970 26.2%
Trades 14,665 3.1% 15,690 3.2% 61,085 12.5% 61,155 10.2% 62,650 9.5% College/university certificate/diploma
87,920 18.3% 96,050 19.9% 82,870 17.0% 131,700 22.0% 148,435 22.5%
University, bachelor's degree+
67,855 14.2% 75,505 15.6% 93,355 19.1% 120,145 20.1% 161,135 24.4%
[Source: Statistics Canada] NOTE: 1991-2006 data is from the Canadian Census; 2011 data is from the National Household Survey.

Section B|Education & Employment Page|27
Data Tables|Section B, cont’d...
Table 15: Population, by Occupation, Edmonton CMA
Occupation
2002 Change (2002-2012) 2012
Number % Number % Number %
Total 527,100 100% 693,200 100% 166,100 29.0%
Management 46,300 8.8% 46,800 6.8% 500 1.1%
Business, Finance, Admin. 96,800 18.4% 127,000 18.3% 30,200 31.2%
Natural & Applied Science 38,300 7.3% 52,900 7.6% 14,600 38.1%
Health 31,000 5.9% 51,500 7.4% 20,500 66.1% Social Science, Education, Government, Religion 49,200 9.3% 52,600 7.6% 3,400 6.9%
Art, Culture, Recreation, Sport 12,400 2.4% 13,400 1.9% 1,000 8.1%
Sales & Service 127,400 24.2% 163,800 23.6% 36,400 28.6%
Trades, Transport, Equipment Operation 92,700 17.6% 146,000 21.1% 53,300 57.5%
Primary Industry 9,000 1.7% 18,600 2.7% 9,600 106.7% Processing, Manufacturing, Utilities 24,100 4.6% 20,600 3.0% -3,500 -14.5%
[Source: Statistics Canada]
[Source: Statistics Canada]
Table 14: Average Duration of Unemployment, Alberta
Year Weeks Year Weeks
1981 7.0 1998 11.6
1982 11.2 1999 11.4 1983 17.3 2000 11.3
1984 19.7 2001 9.0
1985 19.0 2002 9.8
1986 17.0 2003 9.7
1987 18.2 2004 10.4
1988 17.2 2005 10.4 1989 16.0 2006 8.3
1990 14.2 2007 8.0
1991 16.0 2008 7.9
1992 17.8 2009 12.2
1993 20.6 2010 16.4 1994 19.7 2011 15.4
1995 18.3 2012 12.7
1996 16.5 2013* 13.0
1997 14.4
[Source: Statistics Canada]
Table 13: Aboriginal Unemployment Rate, Edmonton CMA
Year Aboriginal Overall Population
1981 11.0% 4.0%
1986 24.0% 12.0%
2001 12.0% 5.0%
2005 11.1% 4.3%
2006 7.0% 3.5% 2007 8.0% 3.6%
2008 9.8% 3.7%
2009 15.6% 6.7%
2010 14.0% 6.7%
2011 13.0% 5.6%
2012 12.1% 4.7%
2013 8.4% 4.6%
NOTE: Data prior to 2005 is based on Census data; 2005-2011 is based on the monthly Labour Force Survey. 2013 figures are the averages for January-July 2013.
[Source: Alberta Enterprise and Advanced Education &
Statistics Canada ] *Jan—Jul 2013 average

PART 1|Major Social & Economic Trends Page|28
One of the key factors that determines a family’s quality of life is the cost of the goods and services needed to maintain their household—food, housing, clothing, education, health care, child care, and so on. Increases in these costs can impact a family’s ability to support a decent standard of living. If costs rise faster than a family’s income, the health, well-being and financial
security of the family may deteriorate.
The greater the number of families unable to maintain a
decent standard of living, the greater the costs to the
government in terms of providing services and income
supports.
The recent economic boom, and the resulting increase in population, created multiple pressures on individuals and families living in and moving to Edmonton.
Costs of Living
The costs of living, and particularly housing, have risen significantly over time. Food costs have also increased, particularly since 2007. The combination of these rising costs with decreasing vacancy rates and growth in population created a housing crisis that affected many people, including a growing number of working poor.
Housing
The percentage of Edmontonians living in housing that
is too costly, crowded, or unsafe has remained stable
over the past decade. The rental vacancy rate has
plummeted since 2009, while the cost of renting has
increased steadily. Housing purchase prices are now
higher than their previous peak in 2007, meaning the
cost of home ownership remains a barrier for low and
modest income households.
Section C|Cost of Living & Housing
the TRENDS: living costs rising
housing affordability reduced
Why are Cost of Living Trends Important?
For almost everyone, housing represents the single largest component of living costs. The availability, affordability and adequacy of housing is therefore crucial to quality of life for both renters and homeowners.
Renters tend to have lower and more variable incomes and are therefore less able to afford substantial rent increases or the cost of purchasing a home. Vulnerable groups facing integral challenges, such as recent immigrants, refugees, and Aboriginals, often live in crowded or substandard housing.
Home ownership rates are an indicator of the overall level of financial independence in a community. Purchasing a home requires a great deal of capital, to
which many low and moderate income families do not have access. Rising housing costs can make it more difficult to enter the housing market, thereby delaying financial independence.
Incomes are closely linked to housing affordability. If incomes do not keep up with the rising cost of housing, people’s ability to cover other living costs and to save for their future (education, retirement, etc.) declines.
Policy makers and program planners need to be aware
of these trends in order to anticipate and appropriately
respond to housing needs. Rising rents and decreasing
vacancy rates, for example, signal a need for increased
rent subsidies and affordable rental housing.
How is Edmonton Changing?
Why are Housing Trends Important?
Page|29 Section C|Cost of Living & Housing
Costs of Living
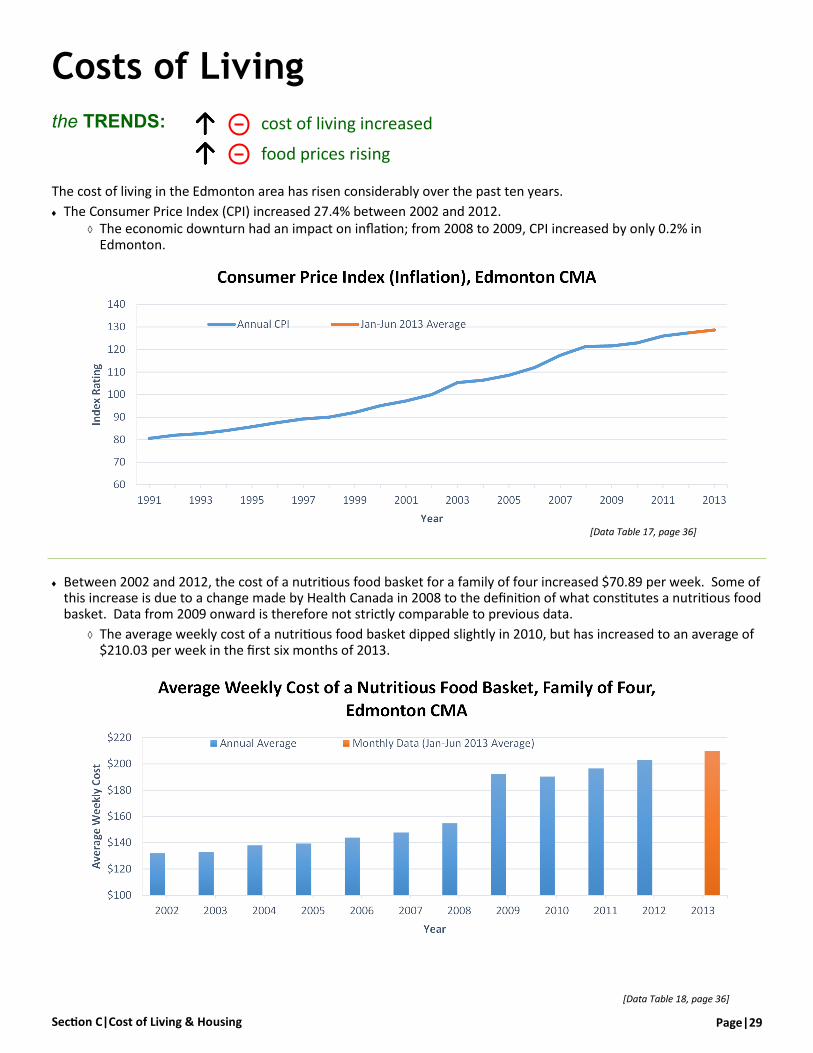
The cost of living in the Edmonton area has risen considerably over the past ten years.
The Consumer Price Index (CPI) increased 27.4% between 2002 and 2012. The economic downturn had an impact on inflation; from 2008 to 2009, CPI increased by only 0.2% in
Edmonton.
the TRENDS: cost of living increased
food prices rising
Between 2002 and 2012, the cost of a nutritious food basket for a family of four increased $70.89 per week. Some of this increase is due to a change made by Health Canada in 2008 to the definition of what constitutes a nutritious food basket. Data from 2009 onward is therefore not strictly comparable to previous data.
The average weekly cost of a nutritious food basket dipped slightly in 2010, but has increased to an average of $210.03 per week in the first six months of 2013.
[Data Table 17, page 36]
[Data Table 18, page 36]
PART 1|Major Social & Economic Trends Page|30
Rental Housing
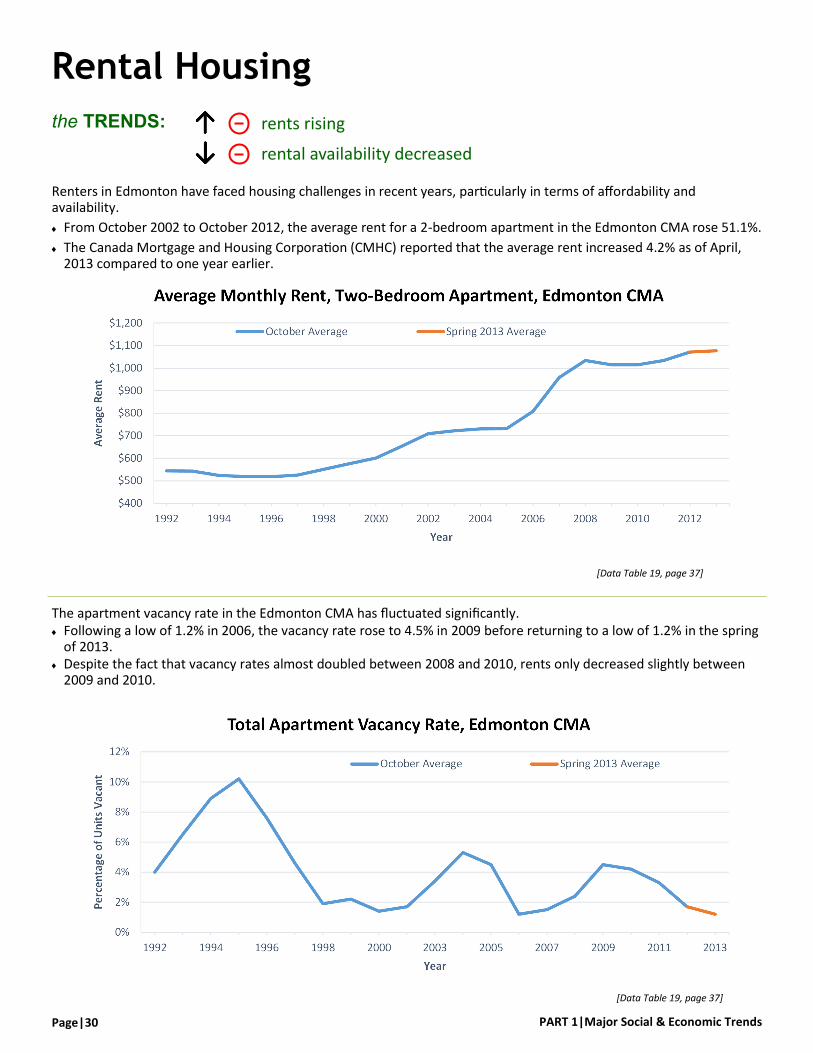
Renters in Edmonton have faced housing challenges in recent years, particularly in terms of affordability and availability.
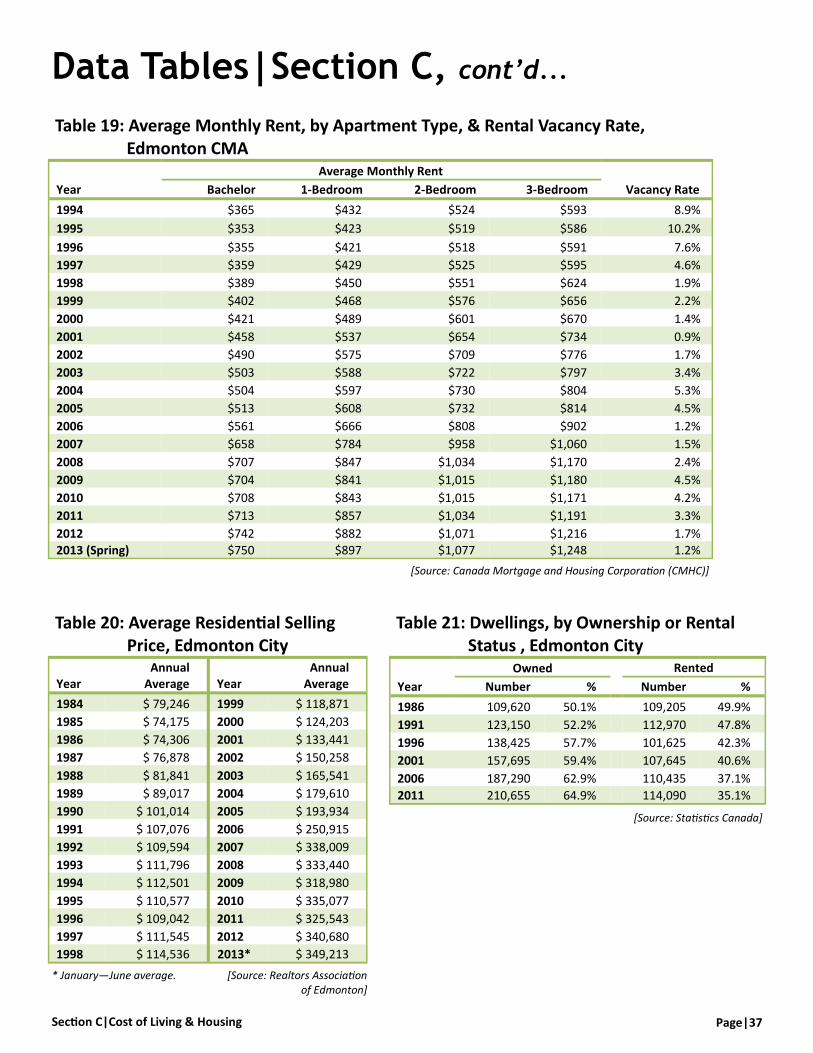
From October 2002 to October 2012, the average rent for a 2-bedroom apartment in the Edmonton CMA rose 51.1%.
The Canada Mortgage and Housing Corporation (CMHC) reported that the average rent increased 4.2% as of April, 2013 compared to one year earlier.
the TRENDS: rents rising
rental availability decreased
The apartment vacancy rate in the Edmonton CMA has fluctuated significantly. Following a low of 1.2% in 2006, the vacancy rate rose to 4.5% in 2009 before returning to a low of 1.2% in the spring
of 2013. Despite the fact that vacancy rates almost doubled between 2008 and 2010, rents only decreased slightly between
2009 and 2010.
[Data Table 19, page 37]
[Data Table 19, page 37]

Page|31 Section C|Cost of Living & Housing
the TRENDS: home prices increasing slowly
home ownership rising
Home Ownership
Home ownership has been on the rise in Edmonton, as have housing prices.
From 2000 to 2007, residential sale prices increased 172.1%. In 2008, home prices abruptly stopped increasing, and declined an average of 1.5% from 2007 prices.
The average sale price in 2012 increased 2.2% from the 2008 average. As of June 2013, average sale price had risen an additional 2.5%.
Since 1986, the proportion of Edmontonians owning their own house has increased from about half to almost two-
thirds. In part this trend is driven by a sustained period of low interest rates, which has made qualifying for home
mortgages less expensive in some cases than renting accommodation. However, most low income households contin-
ue to rent rather than own their dwelling.
[Data Table 20, page 37]
[Data Table 21, page 37]

PART 1|Major Social & Economic Trends Page|32
the TRENDS: core housing need relatively unchanged
core housing need temporary for most individuals
Core Housing Need
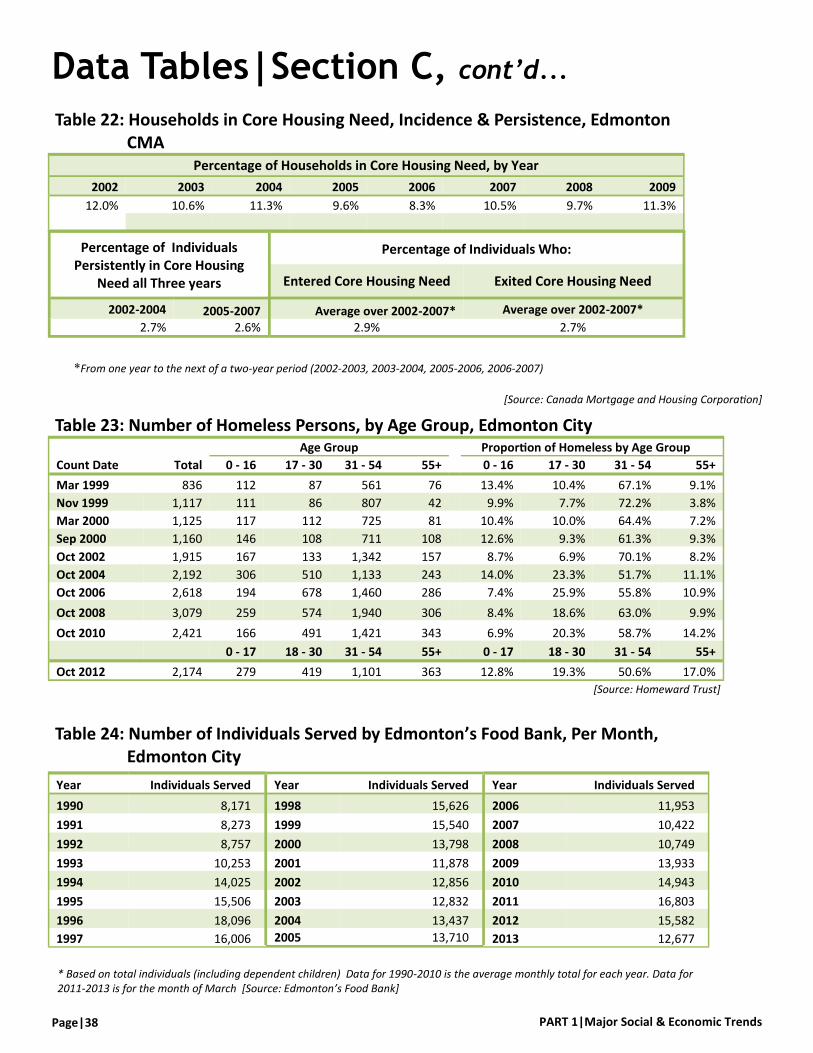
Core housing need – the proportion of households without adequate, suitable and affordable shelter – has fluctuated
in the range of one in ten metro Edmonton households. The incidence of core housing need reached a low of 8.3% of
Edmonton households at the peak of the recent boom in 2006, and has since increased to 11.3% in 2009.
Data on core housing need from the 2011 National Household Survey is not yet available for this edition. Instead a data
set from the annual Survey of Labour Income and Dynamics is being used instead.
Most people are in core housing need temporarily, not permanently. Looking at results where the same individuals are
followed over time, 2.7% were in core housing need all three years between 2002 and 2004. This dropped to 2.6% of
individuals during the three year period from 2005 and 2007. These percentages mean that only about one in four
Edmontonians are in core housing need for three consecutive years.
[Data Table 22, page 38]
[Data Table 22, page 38]
Page|33 Section C|Cost of Living & Housing
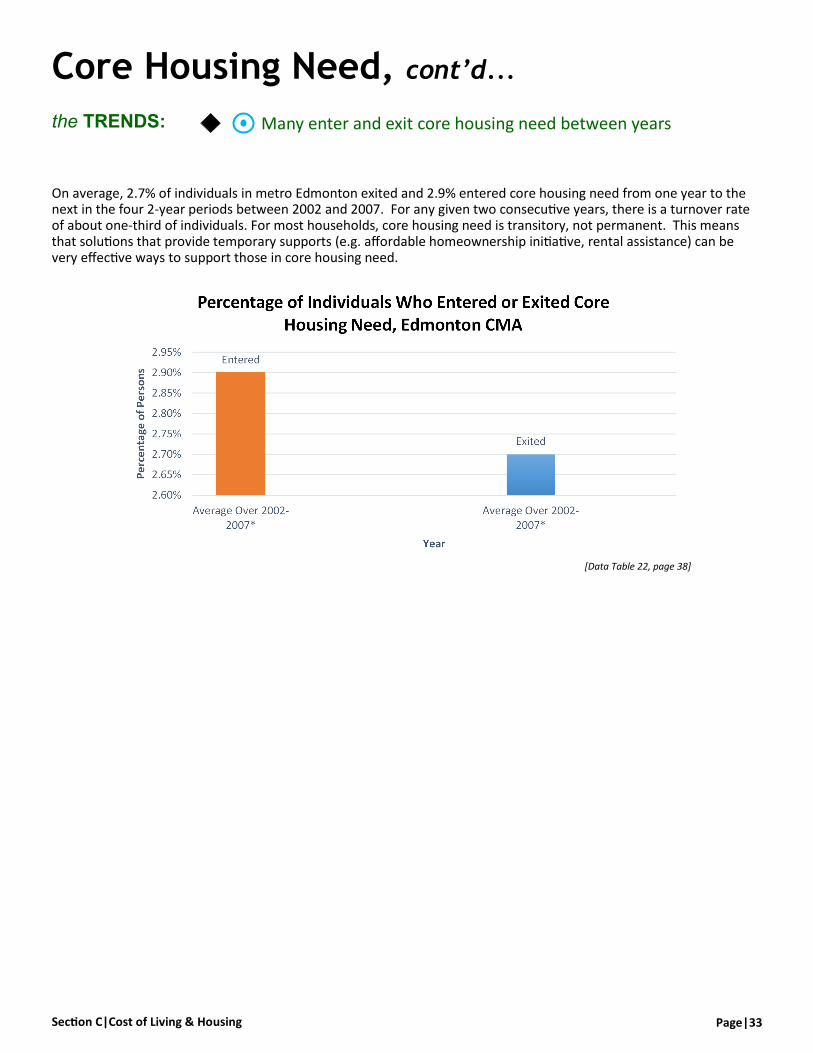
On average, 2.7% of individuals in metro Edmonton exited and 2.9% entered core housing need from one year to the next in the four 2-year periods between 2002 and 2007. For any given two consecutive years, there is a turnover rate of about one-third of individuals. For most households, core housing need is transitory, not permanent. This means that solutions that provide temporary supports (e.g. affordable homeownership initiative, rental assistance) can be very effective ways to support those in core housing need.
Core Housing Need, cont’d...
the TRENDS: Many enter and exit core housing need between years
[Data Table 22, page 38]

PART 1|Major Social & Economic Trends Page|34
[Data Table 23, page 38]
Homelessness
Edmonton has experienced an overall increase in the number of homeless persons over the past decade.
Since the first Edmonton Homeless Count in March 1999, the homeless population has nearly tripled from 836 to 2,174.
The most recent count in 2012 shows a 29.4% decrease from the October 2008 count. This decrease is attributable to the efforts of a 10 Year Plan to End Homelessness adopted in February 2009.
the TRENDS: overall homelessness decreasing
youth homelessness increasing
When broken down by age, the results indicate that the 17 to 30 age group had the greatest proportional growth over the long-term, increasing 14.1 percentage points since October 2002.
While the 31 to 54 age group is still the largest (1,101 individuals), the proportion of homeless in this group decreased 14.1 percentage points since 2002.
Over the short-term, the 0-17 age group experienced the greatest proportional growth, increasing 68% since 2010. Some of the increase may be due to adding 17 year olds to this age group for the 2012 count (see Table 23).
[Data Table 23, page 38]
Note: In Oct 2012, the youngest age category was changed from 0-16 to 0-17.
Page|35 Section C|Cost of Living & Housing
Food Bank Use
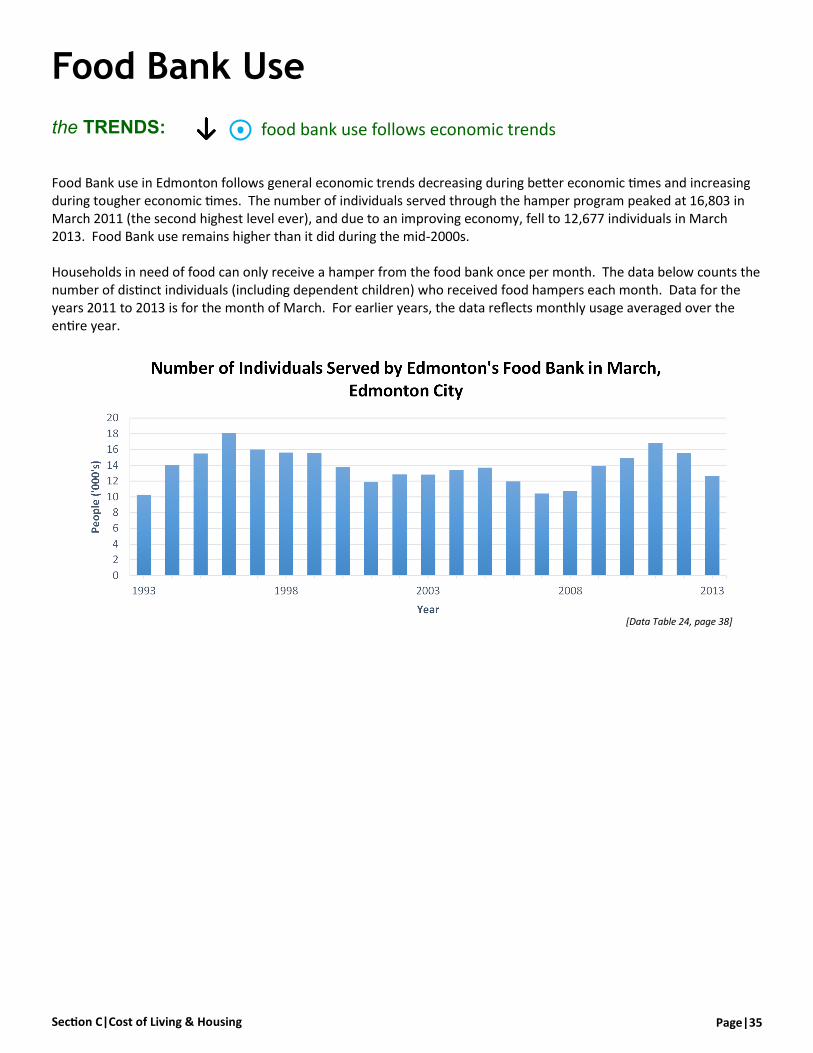
the TRENDS: food bank use follows economic trends
Food Bank use in Edmonton follows general economic trends decreasing during better economic times and increasing during tougher economic times. The number of individuals served through the hamper program peaked at 16,803 in March 2011 (the second highest level ever), and due to an improving economy, fell to 12,677 individuals in March 2013. Food Bank use remains higher than it did during the mid-2000s. Households in need of food can only receive a hamper from the food bank once per month. The data below counts the number of distinct individuals (including dependent children) who received food hampers each month. Data for the years 2011 to 2013 is for the month of March. For earlier years, the data reflects monthly usage averaged over the entire year.
[Data Table 24, page 38]

PART 1|Major Social & Economic Trends Page|36
[Source: Statistics Canada]
Table 18: Average Weekly Cost of a Nutritious Food Basket, for Family of Four & by Gender and Age Group, Edmonton
Year
Family of Four Male (25-49)
Female (25-49)
Male (7-18)
Female (7-18)
Child (1-6) Cost $ Change
2002 $132.10 $4.58 $40.35 n/a n/a n/a n/a
2003 $133.11 $1.01 $40.65 $29.44 $35.21 $25.47 $17.53
2004 $137.96 $4.85 $42.62 $30.36 $36.56 $29.90 $17.98
2005 $139.51 $1.55 $42.96 $30.63 $37.05 $30.29 $18.32
2006 $143.92 $4.41 $45.40 $31.60 $38.27 $31.46 $19.17
2007 $147.84 $3.92 $45.29 $32.53 $39.26 $32.37 $19.60
2008 $154.85 $7.01 $47.49 $33.99 $41.23 $33.81 $20.54
Male
(19-50) Female (19-50)
Male (9-18)
Female (9-18)
Child (2-8)
2009 $192.51 $37.66 $63.52 $51.02 $57.77 $43.97 $30.75
2010 $190.48 ($2.03) $62.71 $50.30 $57.31 $43.62 $30.48
2011 $196.66 $6.18 $64.79 $51.92 $59.25 $45.01 $31.40
2012 $202.99 $6.33 $66.76 $53.50 $61.25 $46.49 $32.52
2013* $210.03 $7.04 $69.17 $55.46 $63.32 $48.05 $33.58
Total Change/Week (2002-12) $70.89 $26.41 $24.06 $26.04 $21.02 $14.99
Total Change/Year (2002-12) $3,686.28 $1,373.32 $1,251.12 $1,354.08 $1,093.04 $779.48
[Source: Alberta Agriculture and Rural Development]
Table 17: Consumer Price Index (2002 base year), Edmonton CMA
Year Consumer Price Index Year Consumer Price Index
1992 82.0 2003 105.3
1993 82.7 2004 106.4
1994 84.0 2005 108.6 1995 85.7 2006 112.0
1996 87.6 2007 117.4
1997 89.2 2008 121.4
1998 90.0 2009 121.6
1999 92.1 2010 122.9
2000 95.1 2011 126.0 2001 97.2 2012 127.4
2002 100.0 2013* 128.6
Data Tables|Section C
* Jan-Jun 2013 Average
NOTE: Alberta Agriculture bases its calculations on Health Canada’s National Nutritious Food Basket. The weekly costs from 2009 onward are based on the new 2008 Canada Food Guide Nutritious Food Basket. Starting in 2009, the age categories have been changed to: 2-8 years (children), 9-18 years, and 19-50 years.
* Jan-Jun 2013 Average
Page|37 Section C|Cost of Living & Housing
[Source: Canada Mortgage and Housing Corporation (CMHC)]
Table 19: Average Monthly Rent, by Apartment Type, & Rental Vacancy Rate, Edmonton CMA
Year
Average Monthly Rent
Vacancy Rate Bachelor 1-Bedroom 2-Bedroom 3-Bedroom
1994 $365 $432 $524 $593 8.9%
1995 $353 $423 $519 $586 10.2%
1996 $355 $421 $518 $591 7.6%
1997 $359 $429 $525 $595 4.6%
1998 $389 $450 $551 $624 1.9%
1999 $402 $468 $576 $656 2.2%
2000 $421 $489 $601 $670 1.4%
2001 $458 $537 $654 $734 0.9%
2002 $490 $575 $709 $776 1.7%
2003 $503 $588 $722 $797 3.4%
2004 $504 $597 $730 $804 5.3%
2005 $513 $608 $732 $814 4.5%
2006 $561 $666 $808 $902 1.2%
2007 $658 $784 $958 $1,060 1.5%
2008 $707 $847 $1,034 $1,170 2.4%
2009 $704 $841 $1,015 $1,180 4.5%
2010 $708 $843 $1,015 $1,171 4.2%
2011 $713 $857 $1,034 $1,191 3.3%
2012 $742 $882 $1,071 $1,216 1.7%
2013 (Spring) $750 $897 $1,077 $1,248 1.2%
Table 20: Average Residential Selling Price, Edmonton City
Year Annual
Average Year Annual
Average
1984 $ 79,246 1999 $ 118,871
1985 $ 74,175 2000 $ 124,203
1986 $ 74,306 2001 $ 133,441
1987 $ 76,878 2002 $ 150,258
1988 $ 81,841 2003 $ 165,541
1989 $ 89,017 2004 $ 179,610
1990 $ 101,014 2005 $ 193,934
1991 $ 107,076 2006 $ 250,915
1992 $ 109,594 2007 $ 338,009
1993 $ 111,796 2008 $ 333,440
1994 $ 112,501 2009 $ 318,980
1995 $ 110,577 2010 $ 335,077
1996 $ 109,042 2011 $ 325,543
1997 $ 111,545 2012 $ 340,680
1998 $ 114,536 2013* $ 349,213
[Source: Realtors Association of Edmonton]
Table 21: Dwellings, by Ownership or Rental Status , Edmonton City
Year
Owned Rented
Number % Number %
1986 109,620 50.1% 109,205 49.9%
1991 123,150 52.2% 112,970 47.8%
1996 138,425 57.7% 101,625 42.3%
2001 157,695 59.4% 107,645 40.6%
2006 187,290 62.9% 110,435 37.1%
2011 210,655 64.9% 114,090 35.1%
[Source: Statistics Canada]
Data Tables|Section C, cont’d...
* January—June average.
PART 1|Major Social & Economic Trends Page|38
Table 22: Households in Core Housing Need, Incidence & Persistence, Edmonton CMA
Percentage of Households in Core Housing Need, by Year
2002 2003 2004 2005 2006 2007 2008 2009
12.0% 10.6% 11.3% 9.6% 8.3% 10.5% 9.7% 11.3%
[Source: Canada Mortgage and Housing Corporation]
[Source: Homeward Trust]
Table 23: Number of Homeless Persons, by Age Group, Edmonton City
Count Date Total
Age Group Proportion of Homeless by Age Group
0 - 16 17 - 30 31 - 54 55+ 0 - 16 17 - 30 31 - 54 55+
Mar 1999 836 112 87 561 76 13.4% 10.4% 67.1% 9.1%
Nov 1999 1,117 111 86 807 42 9.9% 7.7% 72.2% 3.8%
Mar 2000 1,125 117 112 725 81 10.4% 10.0% 64.4% 7.2%
Sep 2000 1,160 146 108 711 108 12.6% 9.3% 61.3% 9.3%
Oct 2002 1,915 167 133 1,342 157 8.7% 6.9% 70.1% 8.2%
Oct 2004 2,192 306 510 1,133 243 14.0% 23.3% 51.7% 11.1%
Oct 2006 2,618 194 678 1,460 286 7.4% 25.9% 55.8% 10.9%
Oct 2008 3,079 259 574 1,940 306 8.4% 18.6% 63.0% 9.9%
Oct 2010 2,421 166 491 1,421 343 6.9% 20.3% 58.7% 14.2%
0 - 17 18 - 30 31 - 54 55+ 0 - 17 18 - 30 31 - 54 55+
Oct 2012 2,174 279 419 1,101 363 12.8% 19.3% 50.6% 17.0%
Table 24: Number of Individuals Served by Edmonton’s Food Bank, Per Month, Edmonton City
Year Individuals Served Year Individuals Served Year Individuals Served
1990 8,171 1998 15,626 2006 11,953
1991 8,273 1999 15,540 2007 10,422
1992 8,757 2000 13,798 2008 10,749
1993 10,253 2001 11,878 2009 13,933
1994 14,025 2002 12,856 2010 14,943
1995 15,506 2003 12,832 2011 16,803
1996 18,096 2004 13,437 2012 15,582
1997 16,006 2005 13,710 2013 12,677
Data Tables|Section C, cont’d...
* Based on total individuals (including dependent children) Data for 1990-2010 is the average monthly total for each year. Data for 2011-2013 is for the month of March [Source: Edmonton’s Food Bank]
Percentage of Individuals Persistently in Core Housing
Need all Three years
Percentage of Individuals Who:
Entered Core Housing Need Exited Core Housing Need
2002-2004 2005-2007 Average over 2002-2007* Average over 2002-2007*
2.7% 2.6% 2.9% 2.7%
*From one year to the next of a two-year period (2002-2003, 2003-2004, 2005-2006, 2006-2007)

Page|39 Section D|Wages and Income
Income is perhaps the key determinant of a family’s ability to maintain an adequate quality of life. As such, it is important to understand how incomes are changing in relation to costs of living.
People with low incomes or wages are the least able to withstand rising costs or unexpected emergencies. When costs of living rise at a faster rate than incomes,
more low and modest income families are at risk of poverty.
Family income also affects educational attainment,
which in turn impacts lifetime earning potential. For
example, low income youth are less likely to attend
university [Frenette, M., 2007].
The gap between the richest Edmontonians and the other 99% has been steadily increasing over the last 30 years, consistent with national and provincial trends. There has been a shorter-term decrease in inequality since 2007 corresponding to the recent economic downturn. Edmontonians are becoming less economically equal.
Wages
Beginning in September 2011, predictable yearly increases to the minimum wage were reinstated using a formula linked to average weekly earnings and the consumer price index. As of March 2013, Alberta is the province with the lowest percentage of minimum wage
earners in Canada [Government of Alberta].
While relatively few Albertans work for minimum wage, a much larger number (one in five) work in low-wage jobs paying less than $15 per hour. The assumption that low-wage earners are all teenagers is incorrect. Many low-wage workers in Edmonton are in older age groups and have families to support.
The gender gap in income persists despite
improvements in the past decade. Age disparities in
income also persist; young people have considerably
lower earnings and incomes than older adults despite
Edmonton’s strong economy.
Section D|Wages & Income
the TRENDS: value of incomes increased
women, youth, single-parent families at income disadvantage
income gap increasing
Why are Wage and Income Trends Important?
Wealth, or a family’s net worth, is also an important variable to track. In general, families with a low or negative net worth are at a much greater risk of poverty and homelessness.
There is, however, no available data on wealth
distribution at either the provincial or Edmonton level,
and the most recent national data is from the year
2005. For this reason we have decided to omit the
wealth statistics we have traditionally included in this
section.
Why are Wealth Trends Important?
How is Edmonton Changing?
PART 1|Major Social & Economic Trends Page|40
Income
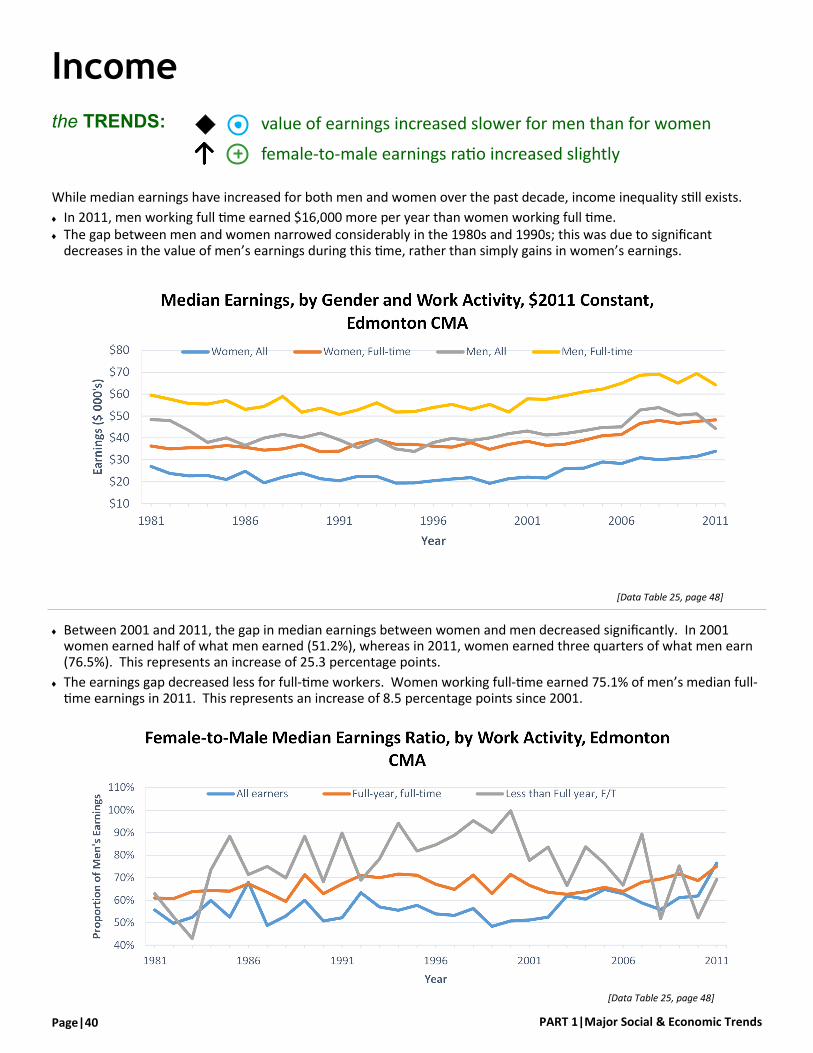
While median earnings have increased for both men and women over the past decade, income inequality still exists.
In 2011, men working full time earned $16,000 more per year than women working full time. The gap between men and women narrowed considerably in the 1980s and 1990s; this was due to significant
decreases in the value of men’s earnings during this time, rather than simply gains in women’s earnings.
the TRENDS: value of earnings increased slower for men than for women
female-to-male earnings ratio increased slightly
Between 2001 and 2011, the gap in median earnings between women and men decreased significantly. In 2001 women earned half of what men earned (51.2%), whereas in 2011, women earned three quarters of what men earn (76.5%). This represents an increase of 25.3 percentage points.
The earnings gap decreased less for full-time workers. Women working full-time earned 75.1% of men’s median full-time earnings in 2011. This represents an increase of 8.5 percentage points since 2001.
[Data Table 25, page 48]
[Data Table 25, page 48]

Page|41 Section D|Wages and Income
Income, cont’d...
The economic boom in Alberta had a significant impact on Edmontonians’ market incomes (incomes earned through employment or investments), which increased in value by 18.5% from 2001 to 2008. However, the economic downturn caused a 11.7% decrease from 2008 to 2009.
People under 25 years of age, in particular, benefitted from a 85.3% increase in median market income between 2001 and 2008, but saw a 25.9% decrease from 2008 to 2011.
The median income of people aged 65 and over has increased 15.7% since 2001.
the TRENDS: market incomes increased, but declined in 2011
total incomes increased
The overall median total income was $67,800 in 2011; this represents an increase of 8.1% since 2001.
The total income of people under age 25 was $3,800 more than their market income. The value of this group’s total income increased 47.2% since 2001.
The total income of people aged 65 and over was $15,700 more than their market income. The value of seniors’ total income increased 3.6% since 2001.
[Data Table 26, page 49]
[Data Table 26, page 49]
PART 1|Major Social & Economic Trends Page|42
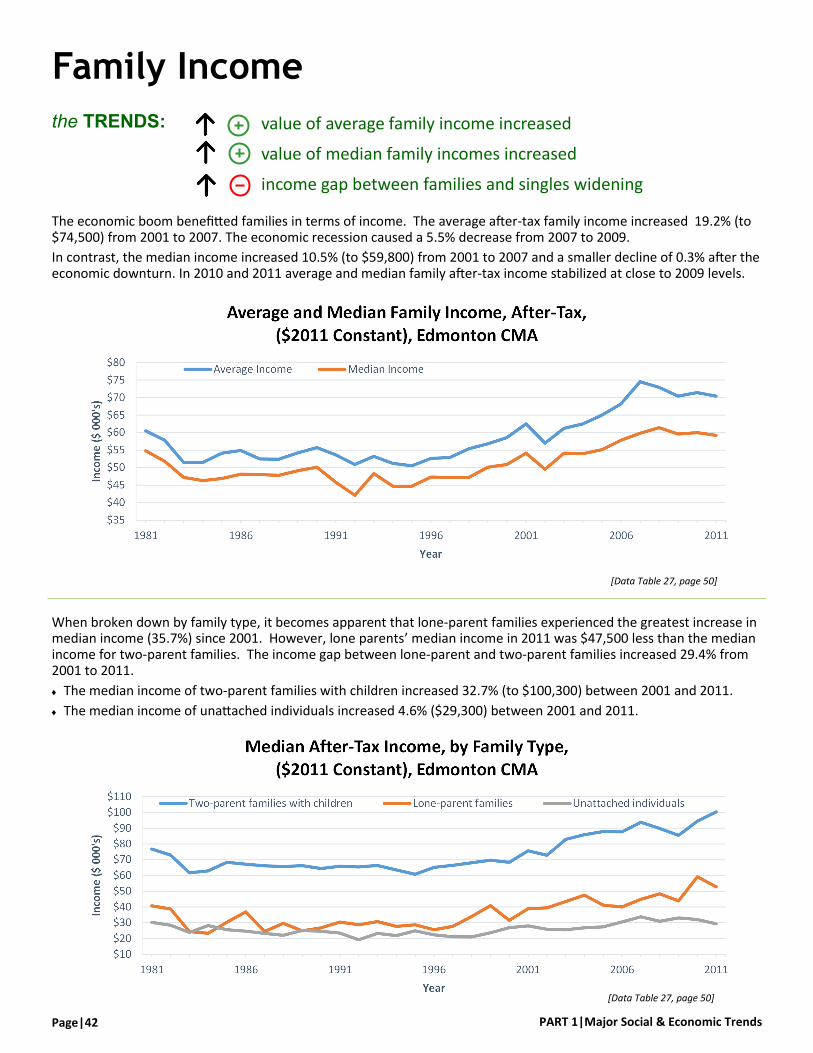
the TRENDS: value of average family income increased
value of median family incomes increased
income gap between families and singles widening
Family Income
The economic boom benefitted families in terms of income. The average after-tax family income increased 19.2% (to $74,500) from 2001 to 2007. The economic recession caused a 5.5% decrease from 2007 to 2009.
In contrast, the median income increased 10.5% (to $59,800) from 2001 to 2007 and a smaller decline of 0.3% after the economic downturn. In 2010 and 2011 average and median family after-tax income stabilized at close to 2009 levels.
[Data Table 27, page 50]
When broken down by family type, it becomes apparent that lone-parent families experienced the greatest increase in median income (35.7%) since 2001. However, lone parents’ median income in 2011 was $47,500 less than the median income for two-parent families. The income gap between lone-parent and two-parent families increased 29.4% from 2001 to 2011.
The median income of two-parent families with children increased 32.7% (to $100,300) between 2001 and 2011.
The median income of unattached individuals increased 4.6% ($29,300) between 2001 and 2011.
[Data Table 27, page 50]

Page|43 Section D|Wages and Income
Family Income, cont’d...
Income inequality leveled out briefly during the 2009 recession, but has since begun to increase. In 2011, the top 20% of income earners earned $159,600 more than the bottom 20% of earners. The gap in after-tax income was $27,500 greater in 2007 than it was in 2001 (in 2011 constant dollars) - a 23.2%
increase. The rate of increase slowed down from 2007 to 2009 to 1.4% but rose again from 2009-2011 to 7.7%.
The market income gap was $59,300 more than the after-tax income gap in 2011; however, it increased at a comparable rate (36%) to the after-tax income gap (34.5%) between 2001 and 2011.
the TRENDS: after-tax income gap increasing
market income gap increasing
[Data Table 28, page 51]
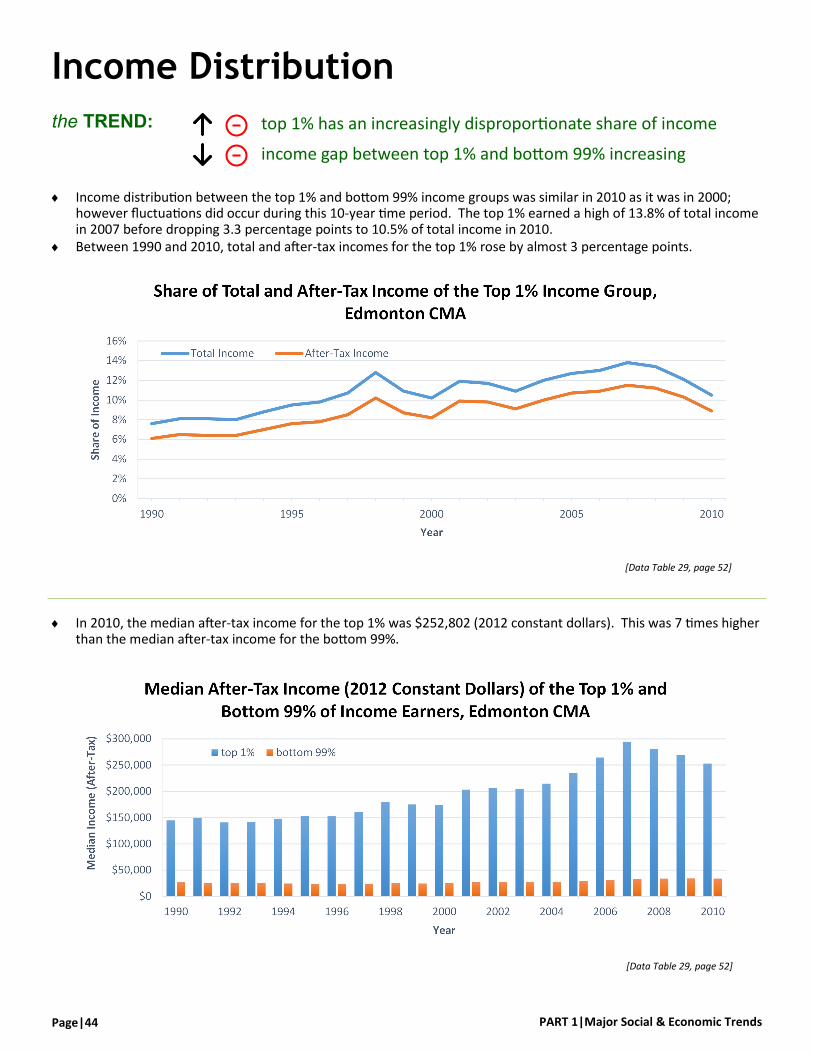
PART 1|Major Social & Economic Trends Page|44
Income Distribution
the TREND: top 1% has an increasingly disproportionate share of income
income gap between top 1% and bottom 99% increasing
[Data Table 29, page 52]
Income distribution between the top 1% and bottom 99% income groups was similar in 2010 as it was in 2000; however fluctuations did occur during this 10-year time period. The top 1% earned a high of 13.8% of total income in 2007 before dropping 3.3 percentage points to 10.5% of total income in 2010.
Between 1990 and 2010, total and after-tax incomes for the top 1% rose by almost 3 percentage points.
[Data Table 29, page 52]
In 2010, the median after-tax income for the top 1% was $252,802 (2012 constant dollars). This was 7 times higher than the median after-tax income for the bottom 99%.
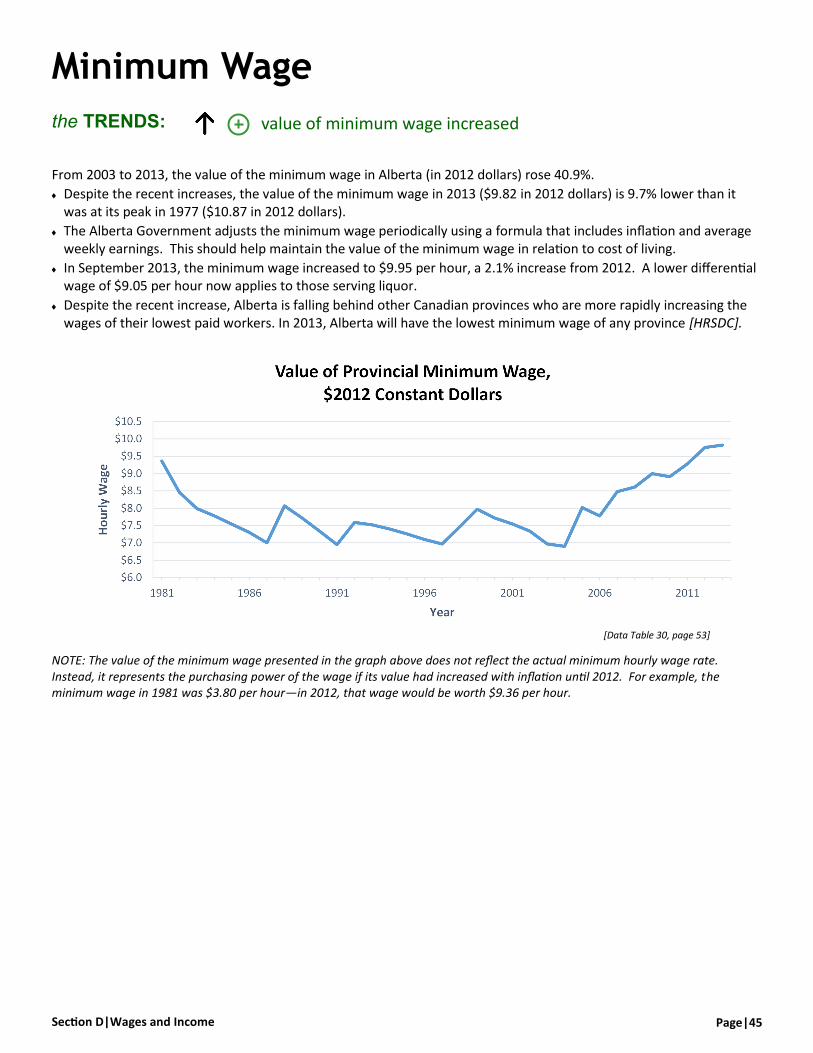
Page|45 Section D|Wages and Income
the TRENDS: value of minimum wage increased
Minimum Wage
From 2003 to 2013, the value of the minimum wage in Alberta (in 2012 dollars) rose 40.9%.
Despite the recent increases, the value of the minimum wage in 2013 ($9.82 in 2012 dollars) is 9.7% lower than it was at its peak in 1977 ($10.87 in 2012 dollars).
The Alberta Government adjusts the minimum wage periodically using a formula that includes inflation and average weekly earnings. This should help maintain the value of the minimum wage in relation to cost of living.
In September 2013, the minimum wage increased to $9.95 per hour, a 2.1% increase from 2012. A lower differential wage of $9.05 per hour now applies to those serving liquor.
Despite the recent increase, Alberta is falling behind other Canadian provinces who are more rapidly increasing the wages of their lowest paid workers. In 2013, Alberta will have the lowest minimum wage of any province [HRSDC].
[Data Table 30, page 53]
NOTE: The value of the minimum wage presented in the graph above does not reflect the actual minimum hourly wage rate. Instead, it represents the purchasing power of the wage if its value had increased with inflation until 2012. For example, the minimum wage in 1981 was $3.80 per hour—in 2012, that wage would be worth $9.36 per hour.
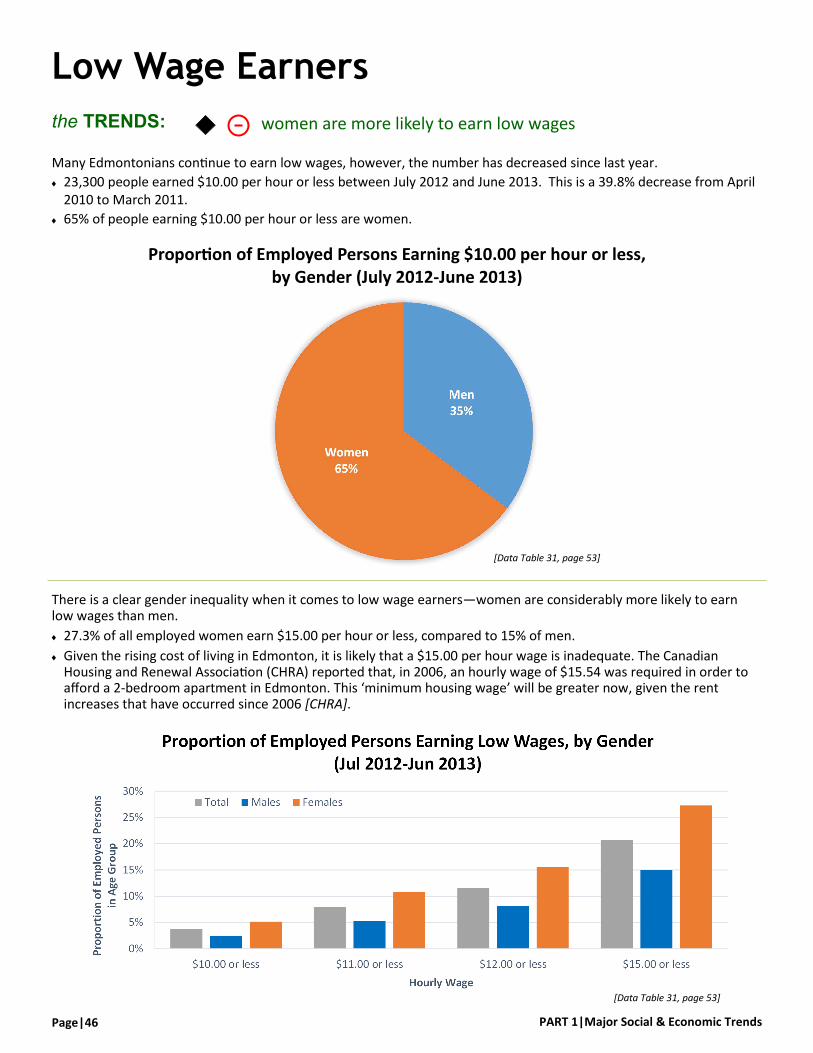
PART 1|Major Social & Economic Trends Page|46
Low Wage Earners
There is a clear gender inequality when it comes to low wage earners—women are considerably more likely to earn low wages than men.
27.3% of all employed women earn $15.00 per hour or less, compared to 15% of men.
Given the rising cost of living in Edmonton, it is likely that a $15.00 per hour wage is inadequate. The Canadian Housing and Renewal Association (CHRA) reported that, in 2006, an hourly wage of $15.54 was required in order to afford a 2-bedroom apartment in Edmonton. This ‘minimum housing wage’ will be greater now, given the rent increases that have occurred since 2006 [CHRA].
the TRENDS: women are more likely to earn low wages
Many Edmontonians continue to earn low wages, however, the number has decreased since last year.
23,300 people earned $10.00 per hour or less between July 2012 and June 2013. This is a 39.8% decrease from April 2010 to March 2011.
65% of people earning $10.00 per hour or less are women.
[Data Table 31, page 53]
[Data Table 31, page 53]
Proportion of Employed Persons Earning $10.00 per hour or less, by Gender (July 2012-June 2013)

Page|47 Section D|Wages and Income
Low Wage Earners, cont’d...
Most people aged 15 to 19 earned $15.00 per hour or less (84.8%); more than 1 in 3 people aged 20 to 24 (39.9%) earned an hourly wage in that range.
While workers aged 25 to 44 and are much better off, 14.8% earn $15.00 or less per hour. Given the cost of living in Edmonton, this is likely not an adequate wage for those who are supporting a family.
the TRENDS: young people are more likely to earn low wages
[Data Table 31, page 53]
[Data Table 31, page 53]
In addition to gender inequality, there are notable differences in wages between workers in different age groups.
54% of people earning $10.00 per hour or less are less than 25 years old.
Proportion of Employed Persons Earning $10.00 per hour or less, by Age (July 2012-June 2013)

PART 1|Major Social & Economic Trends Page|48
[Source: Statistics Canada]
Table 25: Median Earnings by Gender and Work Activity & Female-to-Male Earnings Ratio, Edmonton CMA, ($2011 Constant)
Year
Median Earnings (All Earners)
Median Earnings (Full-time Earners) Female-to-Male Median Earnings Ratio
Women Men Women Men All earners Full-year, F/T Less than Full-
year, F/T
1981 $27,000 $48,400 $36,300 $59,500 55.7% 61.0% 62.9%
1982 $23,800 $47,900 $35,000 $57,700 49.7% 60.7% 52.7%
1983 $22,700 $43,400 $35,500 $55,700 52.4% 63.8% 43.0%
1984 $22,800 $38,000 $35,600 $55,400 59.9% 64.3% 73.5%
1985 $21,000 $40,000 $36,500 $57,100 52.5% 64.0% 88.4%
1986 $24,800 $36,600 $35,700 $53,000 67.9% 67.3% 71.4%
1987 $19,500 $39,900 $34,400 $54,300 48.8% 63.5% 75.0%
1988 $22,100 $41,600 $35,000 $58,900 53.0% 59.4% 69.9%
1989 $24,000 $40,100 $36,800 $51,700 60.0% 71.3% 88.4%
1990 $21,400 $42,200 $33,700 $53,500 50.8% 62.9% 68.3%
1991 $20,400 $39,100 $34,000 $50,700 52.2% 67.2% 89.8%
1992 $22,500 $35,500 $37,500 $52,800 63.3% 71.0% 68.9%
1993 $22,400 $39,200 $39,200 $56,000 57.0% 70.0% 78.3%
1994 $19,400 $35,000 $37,100 $51,800 55.5% 71.6% 94.2%
1995 $19,500 $33,800 $37,000 $52,000 57.7% 71.1% 81.9%
1996 $20,400 $37,900 $36,200 $53,900 53.9% 67.1% 84.6%
1997 $21,200 $39,800 $35,800 $55,300 53.3% 64.8% 88.9%
1998 $21,900 $38,800 $37,800 $53,000 56.3% 71.2% 95.3%
1999 $19,300 $40,000 $34,800 $55,300 48.4% 63.0% 90.1%
2000 $21,400 $42,000 $37,000 $51,800 50.8% 71.5% 99.7%
2001 $22,100 $43,100 $38,500 $57,800 51.2% 66.6% 77.7%
2002 $21,700 $41,300 $36,600 $57,600 52.5% 63.5% 83.6%
2003 $26,000 $42,000 $37,100 $59,300 61.9% 62.6% 66.5%
2004 $26,200 $43,300 $38,900 $61,000 60.5% 63.8% 83.7%
2005 $29,000 $44,800 $41,000 $62,300 64.8% 65.7% 76.3%
2006 $28,300 $45,000 $41,500 $64,900 62.9% 63.9% 66.7%
2007 $31,000 $52,700 $46,600 $68,600 58.8% 68.0% 89.4%
2008 $30,000 $53,800 $48,000 $69,100 55.8% 69.4% 51.8%
2009 $30,700 $50,300 $46,600 $65,000 61.1% 71.7% 75.2%
2010 $31,600 $51,000 $47,600 $69,400 61.9% 68.7% 52.1%
2011 $33,900 $44,300 $48,200 $64,200 76.5% 75.1% 69.3%
Data Tables|Section D
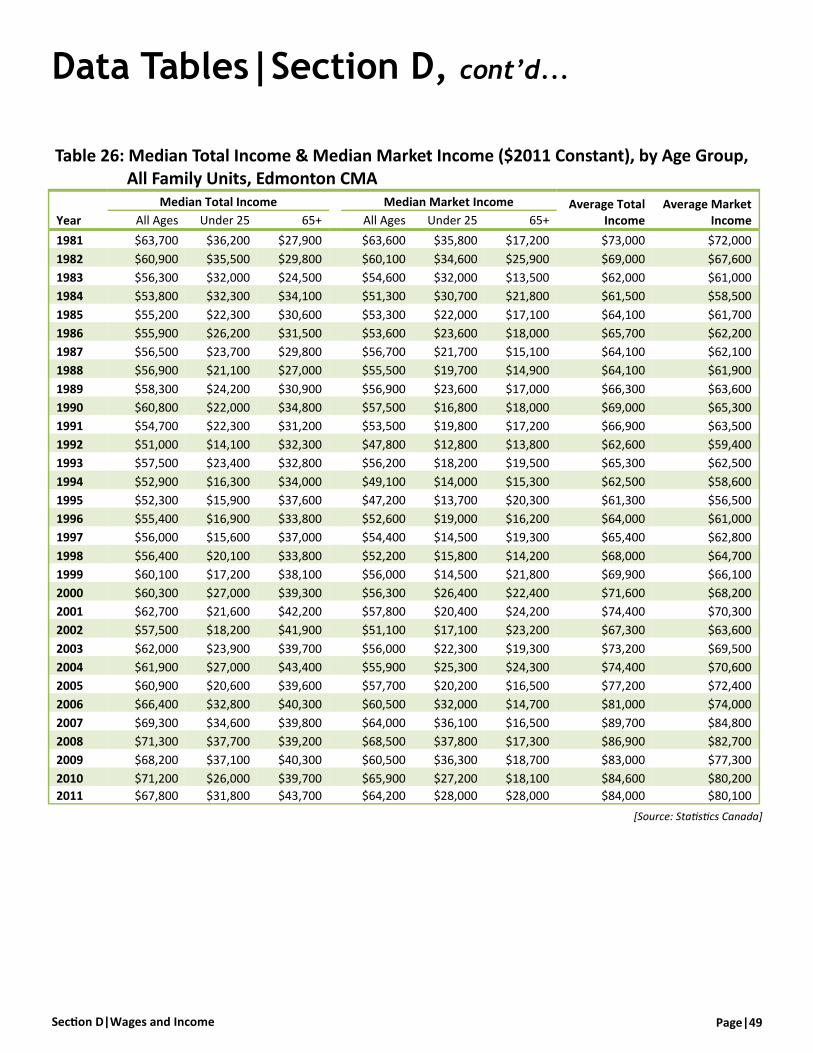
Page|49 Section D|Wages and Income
Table 26: Median Total Income & Median Market Income ($2011 Constant), by Age Group, All Family Units, Edmonton CMA
Year
Median Total Income Median Market Income Average Total Income
Average Market Income All Ages Under 25 65+ All Ages Under 25 65+
1981 $63,700 $36,200 $27,900 $63,600 $35,800 $17,200 $73,000 $72,000
1982 $60,900 $35,500 $29,800 $60,100 $34,600 $25,900 $69,000 $67,600
1983 $56,300 $32,000 $24,500 $54,600 $32,000 $13,500 $62,000 $61,000
1984 $53,800 $32,300 $34,100 $51,300 $30,700 $21,800 $61,500 $58,500
1985 $55,200 $22,300 $30,600 $53,300 $22,000 $17,100 $64,100 $61,700
1986 $55,900 $26,200 $31,500 $53,600 $23,600 $18,000 $65,700 $62,200
1987 $56,500 $23,700 $29,800 $56,700 $21,700 $15,100 $64,100 $62,100
1988 $56,900 $21,100 $27,000 $55,500 $19,700 $14,900 $64,100 $61,900
1989 $58,300 $24,200 $30,900 $56,900 $23,600 $17,000 $66,300 $63,600
1990 $60,800 $22,000 $34,800 $57,500 $16,800 $18,000 $69,000 $65,300
1991 $54,700 $22,300 $31,200 $53,500 $19,800 $17,200 $66,900 $63,500
1992 $51,000 $14,100 $32,300 $47,800 $12,800 $13,800 $62,600 $59,400
1993 $57,500 $23,400 $32,800 $56,200 $18,200 $19,500 $65,300 $62,500
1994 $52,900 $16,300 $34,000 $49,100 $14,000 $15,300 $62,500 $58,600
1995 $52,300 $15,900 $37,600 $47,200 $13,700 $20,300 $61,300 $56,500
1996 $55,400 $16,900 $33,800 $52,600 $19,000 $16,200 $64,000 $61,000
1997 $56,000 $15,600 $37,000 $54,400 $14,500 $19,300 $65,400 $62,800
1998 $56,400 $20,100 $33,800 $52,200 $15,800 $14,200 $68,000 $64,700
1999 $60,100 $17,200 $38,100 $56,000 $14,500 $21,800 $69,900 $66,100
2000 $60,300 $27,000 $39,300 $56,300 $26,400 $22,400 $71,600 $68,200
2001 $62,700 $21,600 $42,200 $57,800 $20,400 $24,200 $74,400 $70,300
2002 $57,500 $18,200 $41,900 $51,100 $17,100 $23,200 $67,300 $63,600
2003 $62,000 $23,900 $39,700 $56,000 $22,300 $19,300 $73,200 $69,500
2004 $61,900 $27,000 $43,400 $55,900 $25,300 $24,300 $74,400 $70,600
2005 $60,900 $20,600 $39,600 $57,700 $20,200 $16,500 $77,200 $72,400
2006 $66,400 $32,800 $40,300 $60,500 $32,000 $14,700 $81,000 $74,000
2007 $69,300 $34,600 $39,800 $64,000 $36,100 $16,500 $89,700 $84,800
2008 $71,300 $37,700 $39,200 $68,500 $37,800 $17,300 $86,900 $82,700
2009 $68,200 $37,100 $40,300 $60,500 $36,300 $18,700 $83,000 $77,300
2010 $71,200 $26,000 $39,700 $65,900 $27,200 $18,100 $84,600 $80,200
2011 $67,800 $31,800 $43,700 $64,200 $28,000 $28,000 $84,000 $80,100
[Source: Statistics Canada]
Data Tables|Section D, cont’d...

PART 1|Major Social & Economic Trends Page|50
[Source: Statistics Canada]
Table 27: Average and Median Family Income, After-Tax ($2011 Constant), by Family Type, Edmonton CMA
Year Average Income
Median Income
All Family Units Two-parent Families
with Children Single-Parent
Families Unattached individuals
1981 $60,500 $54,800 $76,700 $40,700 $30,200
1982 $57,800 $51,800 $72,900 $38,700 $28,400
1983 $51,500 $47,200 $61,700 $24,300 $23,800
1984 $51,500 $46,300 $62,900 $23,300 $28,200
1985 $54,100 $46,900 $68,300 $30,300 $25,600
1986 $54,900 $48,100 $67,100 $36,900 $24,600
1987 $52,500 $48,000 $66,100 $24,400 $23,200
1988 $52,400 $47,800 $65,600 $29,600 $22,000
1989 $54,200 $49,100 $66,200 $24,800 $25,100
1990 $55,700 $50,100 $64,400 $26,800 $24,500
1991 $53,600 $45,800 $65,800 $30,400 $23,400
1992 $50,900 $42,100 $65,400 $28,700 $19,200
1993 $53,200 $48,300 $66,300 $30,700 $23,200
1994 $51,200 $44,700 $63,500 $27,700 $21,800
1995 $50,500 $44,700 $60,800 $28,700 $24,800
1996 $52,600 $47,300 $65,100 $25,600 $22,300
1997 $52,900 $47,200 $66,400 $27,700 $21,100
1998 $55,400 $47,200 $68,000 $33,900 $21,000
1999 $56,800 $50,100 $69,700 $40,800 $23,600
2000 $58,600 $50,900 $68,300 $31,500 $26,900
2001 $62,500 $54,100 $75,600 $38,900 $28,000
2002 $57,000 $49,500 $72,800 $39,400 $25,900
2003 $61,200 $54,100 $82,900 $43,500 $25,600
2004 $62,500 $54,000 $85,800 $47,500 $26,800
2005 $65,000 $55,100 $87,900 $41,100 $27,400
2006 $68,200 $57,800 $87,700 $40,000 $30,500
2007 $74,500 $59,800 $93,700 $44,900 $33,700
2008 $72,900 $61,400 $89,800 $48,300 $30,900
2009 $70,400 $59,600 $85,400 $43,900 $33,000
2010 $71,400 $60,000 $94,400 $59,100 $32,000
2011 $70,400 $59,200 $100,300 $52,800 $29,300
Data Tables|Section D, cont’d...
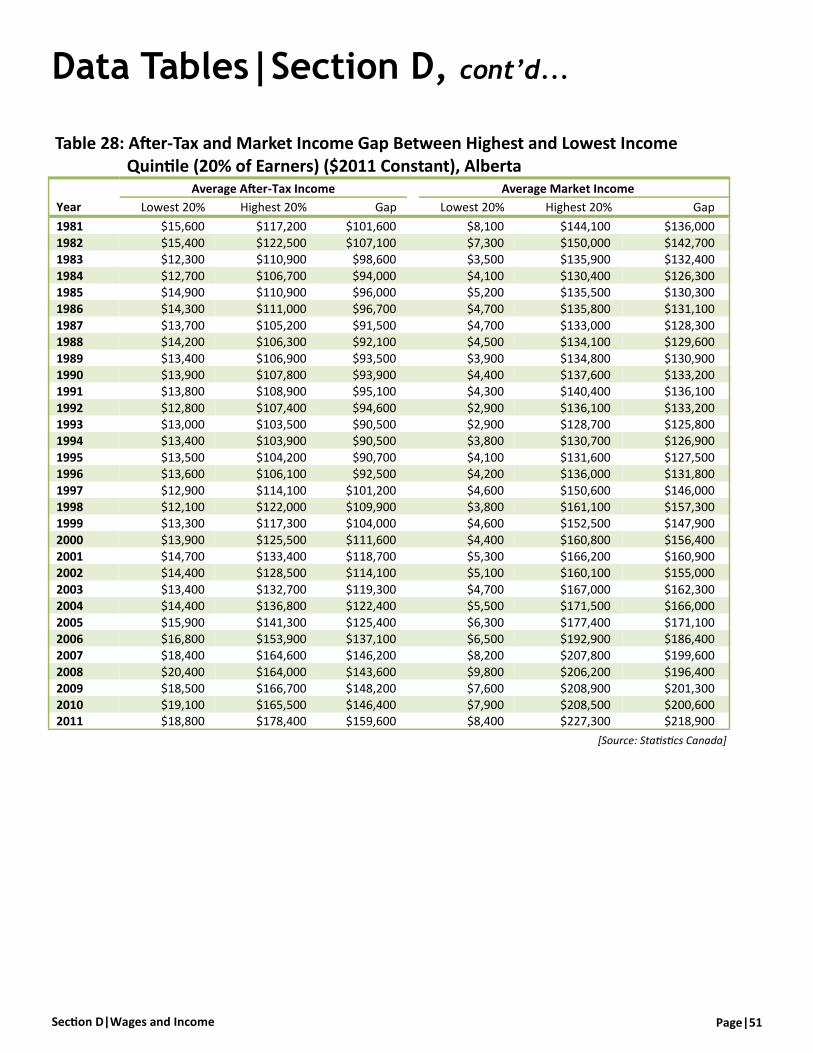
Page|51 Section D|Wages and Income
[Source: Statistics Canada]
Table 28: After-Tax and Market Income Gap Between Highest and Lowest Income Quintile (20% of Earners) ($2011 Constant), Alberta
Year
Average After-Tax Income Average Market Income
Lowest 20% Highest 20% Gap Lowest 20% Highest 20% Gap
1981 $15,600 $117,200 $101,600 $8,100 $144,100 $136,000
1982 $15,400 $122,500 $107,100 $7,300 $150,000 $142,700 1983 $12,300 $110,900 $98,600 $3,500 $135,900 $132,400
1984 $12,700 $106,700 $94,000 $4,100 $130,400 $126,300 1985 $14,900 $110,900 $96,000 $5,200 $135,500 $130,300 1986 $14,300 $111,000 $96,700 $4,700 $135,800 $131,100
1987 $13,700 $105,200 $91,500 $4,700 $133,000 $128,300 1988 $14,200 $106,300 $92,100 $4,500 $134,100 $129,600
1989 $13,400 $106,900 $93,500 $3,900 $134,800 $130,900 1990 $13,900 $107,800 $93,900 $4,400 $137,600 $133,200 1991 $13,800 $108,900 $95,100 $4,300 $140,400 $136,100
1992 $12,800 $107,400 $94,600 $2,900 $136,100 $133,200 1993 $13,000 $103,500 $90,500 $2,900 $128,700 $125,800 1994 $13,400 $103,900 $90,500 $3,800 $130,700 $126,900
1995 $13,500 $104,200 $90,700 $4,100 $131,600 $127,500 1996 $13,600 $106,100 $92,500 $4,200 $136,000 $131,800
1997 $12,900 $114,100 $101,200 $4,600 $150,600 $146,000 1998 $12,100 $122,000 $109,900 $3,800 $161,100 $157,300 1999 $13,300 $117,300 $104,000 $4,600 $152,500 $147,900
2000 $13,900 $125,500 $111,600 $4,400 $160,800 $156,400 2001 $14,700 $133,400 $118,700 $5,300 $166,200 $160,900 2002 $14,400 $128,500 $114,100 $5,100 $160,100 $155,000
2003 $13,400 $132,700 $119,300 $4,700 $167,000 $162,300 2004 $14,400 $136,800 $122,400 $5,500 $171,500 $166,000
2005 $15,900 $141,300 $125,400 $6,300 $177,400 $171,100 2006 $16,800 $153,900 $137,100 $6,500 $192,900 $186,400 2007 $18,400 $164,600 $146,200 $8,200 $207,800 $199,600
2008 $20,400 $164,000 $143,600 $9,800 $206,200 $196,400 2009 $18,500 $166,700 $148,200 $7,600 $208,900 $201,300 2010 $19,100 $165,500 $146,400 $7,900 $208,500 $200,600 2011 $18,800 $178,400 $159,600 $8,400 $227,300 $218,900
Data Tables|Section D, cont’d...
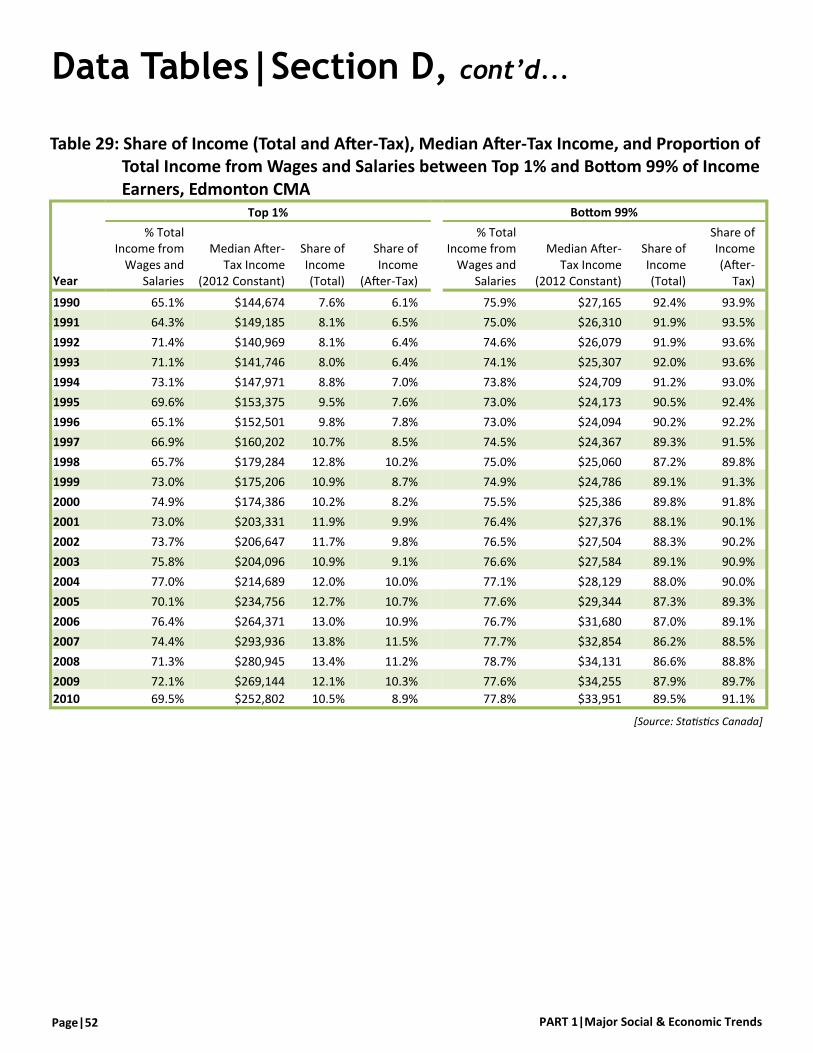
PART 1|Major Social & Economic Trends Page|52
[Source: Statistics Canada]
Data Tables|Section D, cont’d...
Table 29: Share of Income (Total and After-Tax), Median After-Tax Income, and Proportion of Total Income from Wages and Salaries between Top 1% and Bottom 99% of Income Earners, Edmonton CMA
Top 1% Bottom 99%
Year
% Total Income from
Wages and Salaries
Median After-Tax Income
(2012 Constant)
Share of Income (Total)
Share of Income
(After-Tax)
% Total Income from
Wages and Salaries
Median After-Tax Income
(2012 Constant)
Share of Income (Total)
Share of Income (After-
Tax)
1990 65.1% $144,674 7.6% 6.1% 75.9% $27,165 92.4% 93.9%
1991 64.3% $149,185 8.1% 6.5% 75.0% $26,310 91.9% 93.5%
1992 71.4% $140,969 8.1% 6.4% 74.6% $26,079 91.9% 93.6%
1993 71.1% $141,746 8.0% 6.4% 74.1% $25,307 92.0% 93.6%
1994 73.1% $147,971 8.8% 7.0% 73.8% $24,709 91.2% 93.0%
1995 69.6% $153,375 9.5% 7.6% 73.0% $24,173 90.5% 92.4%
1996 65.1% $152,501 9.8% 7.8% 73.0% $24,094 90.2% 92.2%
1997 66.9% $160,202 10.7% 8.5% 74.5% $24,367 89.3% 91.5%
1998 65.7% $179,284 12.8% 10.2% 75.0% $25,060 87.2% 89.8%
1999 73.0% $175,206 10.9% 8.7% 74.9% $24,786 89.1% 91.3%
2000 74.9% $174,386 10.2% 8.2% 75.5% $25,386 89.8% 91.8%
2001 73.0% $203,331 11.9% 9.9% 76.4% $27,376 88.1% 90.1%
2002 73.7% $206,647 11.7% 9.8% 76.5% $27,504 88.3% 90.2%
2003 75.8% $204,096 10.9% 9.1% 76.6% $27,584 89.1% 90.9%
2004 77.0% $214,689 12.0% 10.0% 77.1% $28,129 88.0% 90.0%
2005 70.1% $234,756 12.7% 10.7% 77.6% $29,344 87.3% 89.3%
2006 76.4% $264,371 13.0% 10.9% 76.7% $31,680 87.0% 89.1%
2007 74.4% $293,936 13.8% 11.5% 77.7% $32,854 86.2% 88.5%
2008 71.3% $280,945 13.4% 11.2% 78.7% $34,131 86.6% 88.8%
2009 72.1% $269,144 12.1% 10.3% 77.6% $34,255 87.9% 89.7%
2010 69.5% $252,802 10.5% 8.9% 77.8% $33,951 89.5% 91.1%
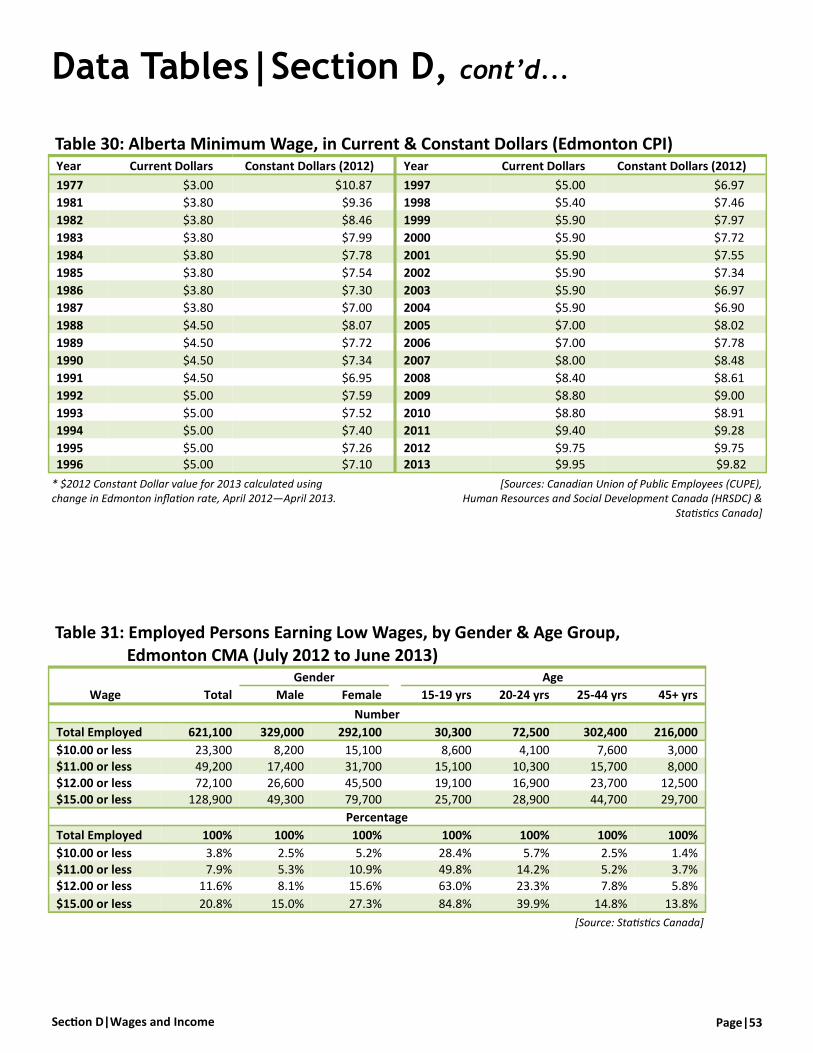
Page|53 Section D|Wages and Income
Table 30: Alberta Minimum Wage, in Current & Constant Dollars (Edmonton CPI) Year Current Dollars Constant Dollars (2012) Year Current Dollars Constant Dollars (2012)
1977 $3.00 $10.87 1997 $5.00 $6.97
1981 $3.80 $9.36 1998 $5.40 $7.46
1982 $3.80 $8.46 1999 $5.90 $7.97
1983 $3.80 $7.99 2000 $5.90 $7.72
1984 $3.80 $7.78 2001 $5.90 $7.55
1985 $3.80 $7.54 2002 $5.90 $7.34
1986 $3.80 $7.30 2003 $5.90 $6.97
1987 $3.80 $7.00 2004 $5.90 $6.90
1988 $4.50 $8.07 2005 $7.00 $8.02
1989 $4.50 $7.72 2006 $7.00 $7.78
1990 $4.50 $7.34 2007 $8.00 $8.48
1991 $4.50 $6.95 2008 $8.40 $8.61
1992 $5.00 $7.59 2009 $8.80 $9.00
1993 $5.00 $7.52 2010 $8.80 $8.91
1994 $5.00 $7.40 2011 $9.40 $9.28
1995 $5.00 $7.26 2012 $9.75 $9.75 1996 $5.00 $7.10 2013 $9.95 $9.82
[Sources: Canadian Union of Public Employees (CUPE), Human Resources and Social Development Canada (HRSDC) &
Statistics Canada]
[Source: Statistics Canada]
Table 31: Employed Persons Earning Low Wages, by Gender & Age Group, Edmonton CMA (July 2012 to June 2013)
Wage Total
Gender Age
Male Female 15-19 yrs 20-24 yrs 25-44 yrs 45+ yrs
Number
Total Employed 621,100 329,000 292,100 30,300 72,500 302,400 216,000
$10.00 or less 23,300 8,200 15,100 8,600 4,100 7,600 3,000 $11.00 or less 49,200 17,400 31,700 15,100 10,300 15,700 8,000 $12.00 or less 72,100 26,600 45,500 19,100 16,900 23,700 12,500 $15.00 or less 128,900 49,300 79,700 25,700 28,900 44,700 29,700
Percentage
Total Employed 100% 100% 100% 100% 100% 100% 100%
$10.00 or less 3.8% 2.5% 5.2% 28.4% 5.7% 2.5% 1.4% $11.00 or less 7.9% 5.3% 10.9% 49.8% 14.2% 5.2% 3.7% $12.00 or less 11.6% 8.1% 15.6% 63.0% 23.3% 7.8% 5.8%
$15.00 or less 20.8% 15.0% 27.3% 84.8% 39.9% 14.8% 13.8%
Data Tables|Section D, cont’d...
* $2012 Constant Dollar value for 2013 calculated using change in Edmonton inflation rate, April 2012—April 2013.
PART 1|Major Social & Economic Trends Page|54
While Edmonton is a relatively wealthy city, it still has a significant level of poverty.
People in Poverty
Poverty rates tend to respond to economic boom-and-bust cycles. As the economy improves, poverty rates decrease; as the economy deteriorates, poverty rates rise. When income and poverty trends are compared (see pages 43 and 56 respectively), one can see that this trend holds true for Edmonton. During the boom that ended in the fall of 2008, poverty decreased. Then, during the recession that followed, poverty rates spiked sharply.
As measured by the Gini Co-efficient, the level of
inequality in metro Edmonton has been increasing. In the past 30 years, Edmonton has gone from a low level of inequality to a medium level of inequality.
Poverty rates vary by age and gender. The younger a person is, the more likely they are to live in poverty. The older a person is, the more likely they are to be female. Poverty rates are twice as high among female seniors than male seniors.
Work and Poverty
Full-time work does not guarantee poverty will be
avoided. A significant and growing proportion of
children living in poverty in Edmonton have at least one
parent working full-time for the entire year.
Section E|Poverty
the TRENDS: poverty rates increased due to recession
poverty is higher for female, lone-parent and youth headed households
full-time, full-year work does not lift many out of poverty
Why are Poverty Trends Important?
How is Edmonton Changing?
Poverty is a complex issue and an undesirable feature in any society. It both causes and results from other social concerns. Some of the consequences of poverty include poor nutrition and physical health, social isolation, and limited financial stability [O’Hara, 2006]. Poverty prevents our society from reaching its full potential.
The Costs of Poverty
In terms of daily reality, poverty represents an inability to maintain a standard of living that will ensure a family’s overall health and well-being. The effects of poverty, however, are not limited to those who are poor. As shown repeatedly by research on the Social Determinants of Health (SDOH), poverty and social inequality decrease the overall health of a society. And poverty doesn’t come cheap. A recent report found poverty costs Albertans in the range of $7.1 billion to $9.5 billion from extra health care and crime costs, and reduced economic opportunities [Poverty Costs].
Measuring Poverty
Canada does not have an official poverty line. While equating poverty with an income threshold over-simplifies a complex issue, poverty is inextricably linked
with income, and the poverty line can be a useful tool for making comparisons of the financial well-being of a population over time.
For the first time in this edition of Tracking the Trends, the Low Income Measure After Tax (LIM AT) replaces the Low Income Cut-Off After Tax (LICO AT) as a measure of poverty. There are several reasons for the switch. Since 1992, LICO has only been updated for inflation. LIM, on the other hand, is recalculated annually, and more accurately reflects changes in the expenditures of Canadian households.
LIM has other advantages over LICO. LIM is a more easily understood measure. LIM is based on 50% median household income. LICO is a much more complex calculation. LIMs are also useful for international data comparisons. LICO is used only in Canada.
The poverty (or low income) rate refers to all persons
whose household income fall below the LIM after taxes
have been deducted and income transfers added
compared to the total population.
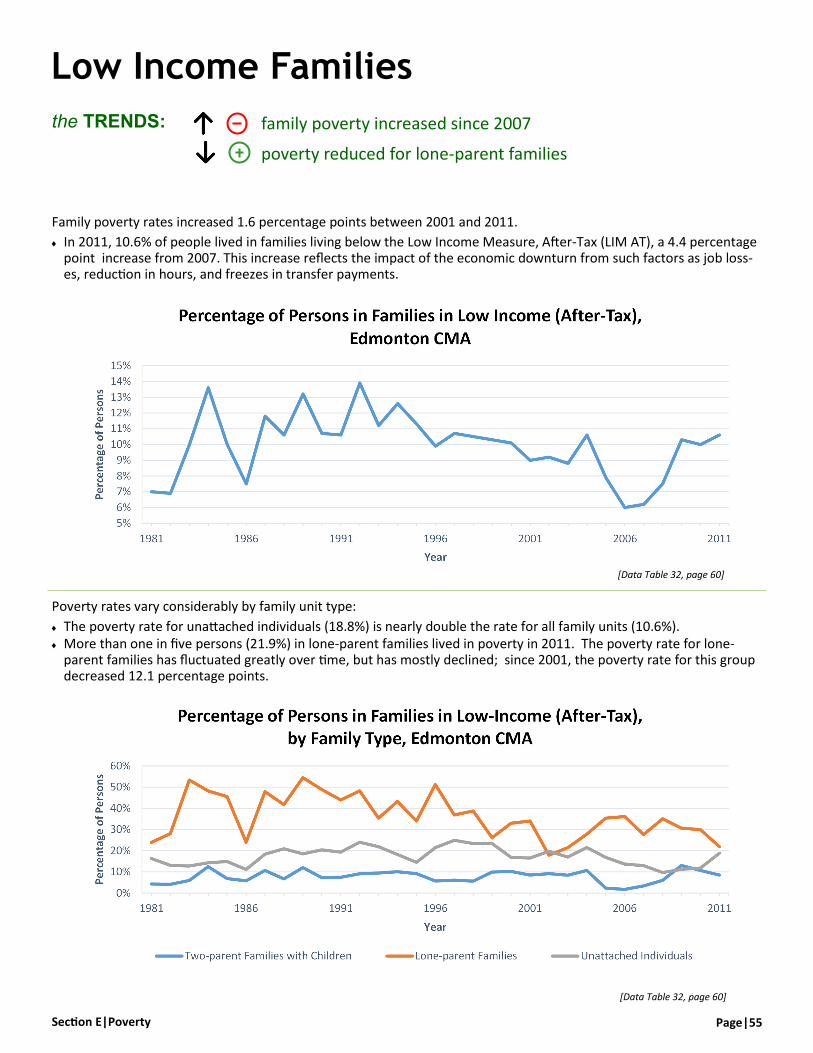
Page|55 Section E|Poverty
Low Income Families
Family poverty rates increased 1.6 percentage points between 2001 and 2011.
In 2011, 10.6% of people lived in families living below the Low Income Measure, After-Tax (LIM AT), a 4.4 percentage point increase from 2007. This increase reflects the impact of the economic downturn from such factors as job loss-es, reduction in hours, and freezes in transfer payments.
Poverty rates vary considerably by family unit type:
The poverty rate for unattached individuals (18.8%) is nearly double the rate for all family units (10.6%). More than one in five persons (21.9%) in lone-parent families lived in poverty in 2011. The poverty rate for lone-
parent families has fluctuated greatly over time, but has mostly declined; since 2001, the poverty rate for this group decreased 12.1 percentage points.
the TRENDS: family poverty increased since 2007
poverty reduced for lone-parent families
[Data Table 32, page 60]
[Data Table 32, page 60]
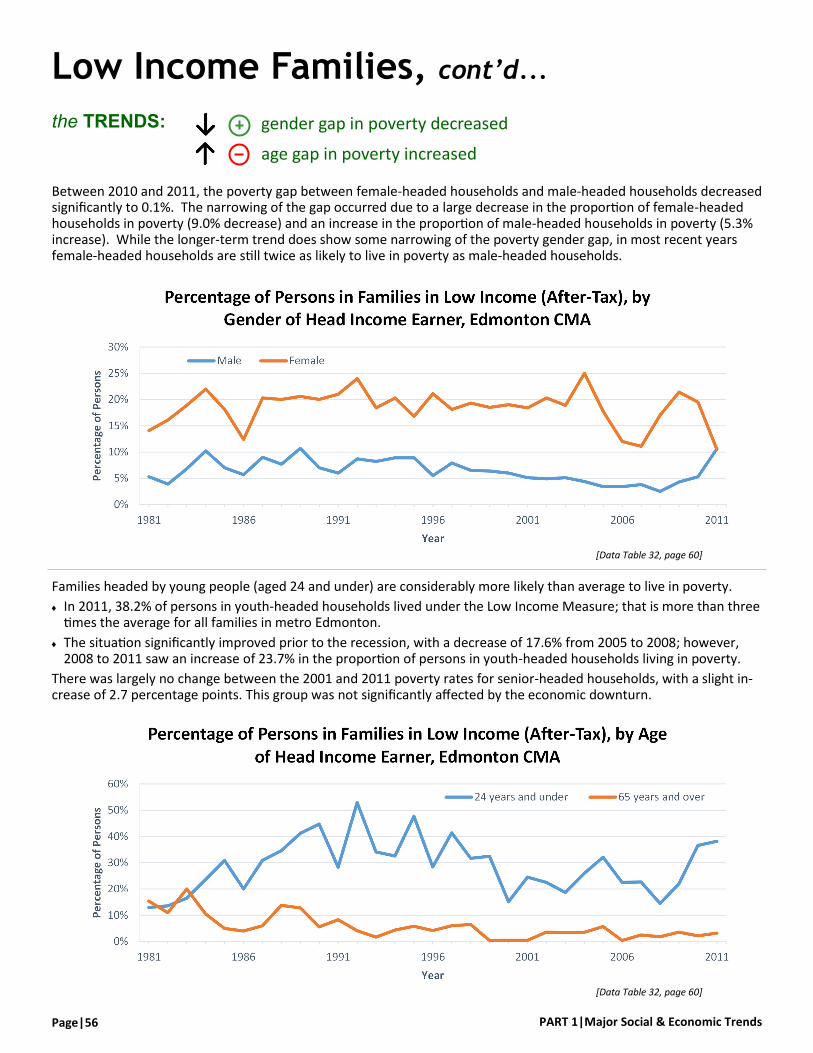
PART 1|Major Social & Economic Trends Page|56
Between 2010 and 2011, the poverty gap between female-headed households and male-headed households decreased significantly to 0.1%. The narrowing of the gap occurred due to a large decrease in the proportion of female-headed households in poverty (9.0% decrease) and an increase in the proportion of male-headed households in poverty (5.3% increase). While the longer-term trend does show some narrowing of the poverty gender gap, in most recent years female-headed households are still twice as likely to live in poverty as male-headed households.
Families headed by young people (aged 24 and under) are considerably more likely than average to live in poverty.
In 2011, 38.2% of persons in youth-headed households lived under the Low Income Measure; that is more than three times the average for all families in metro Edmonton.
The situation significantly improved prior to the recession, with a decrease of 17.6% from 2005 to 2008; however, 2008 to 2011 saw an increase of 23.7% in the proportion of persons in youth-headed households living in poverty.
There was largely no change between the 2001 and 2011 poverty rates for senior-headed households, with a slight in-crease of 2.7 percentage points. This group was not significantly affected by the economic downturn.
the TRENDS: gender gap in poverty decreased
age gap in poverty increased
Low Income Families, cont’d...
[Data Table 32, page 60]
[Data Table 32, page 60]
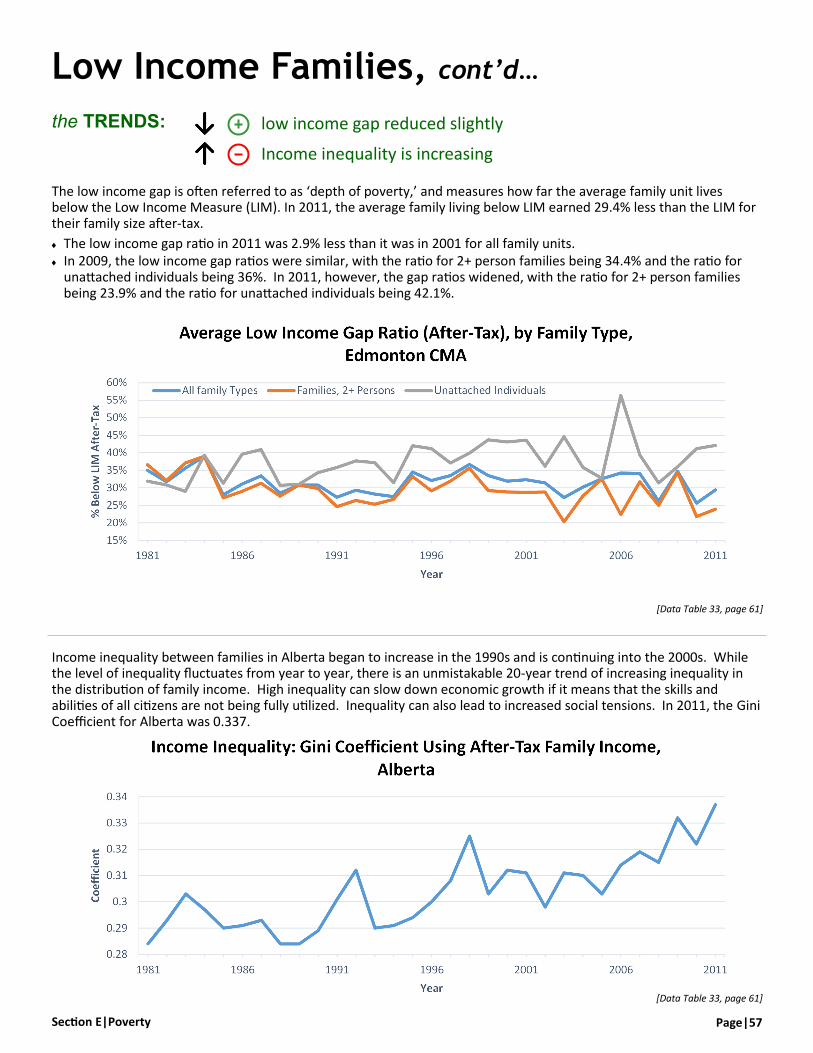
Page|57 Section E|Poverty
[Data Table 33, page 61]
Low Income Families, cont’d…
The low income gap is often referred to as ‘depth of poverty,’ and measures how far the average family unit lives below the Low Income Measure (LIM). In 2011, the average family living below LIM earned 29.4% less than the LIM for their family size after-tax.
The low income gap ratio in 2011 was 2.9% less than it was in 2001 for all family units. In 2009, the low income gap ratios were similar, with the ratio for 2+ person families being 34.4% and the ratio for
unattached individuals being 36%. In 2011, however, the gap ratios widened, with the ratio for 2+ person families being 23.9% and the ratio for unattached individuals being 42.1%.
the TRENDS: low income gap reduced slightly
Income inequality is increasing
[Data Table 33, page 61]
Income inequality between families in Alberta began to increase in the 1990s and is continuing into the 2000s. While the level of inequality fluctuates from year to year, there is an unmistakable 20-year trend of increasing inequality in the distribution of family income. High inequality can slow down economic growth if it means that the skills and abilities of all citizens are not being fully utilized. Inequality can also lead to increased social tensions. In 2011, the Gini Coefficient for Alberta was 0.337.

PART 1|Major Social & Economic Trends Page|58
the TRENDS: children living in poverty recently increased
child poverty rates increased slightly
Low Income Children
The strong economy, combined with improvements in programs like child tax benefits, led to falling child poverty rates from the mid 1990s to the mid 2000s. Since 2006, child poverty rates have increased due to the recession.
Since 2001, the overall child poverty rate has increased 2.5 percentage points. Over the past 30 years, however, it has mostly declined.
Female-headed lone-parent families saw the greatest improvement, with a 15.5 percentage point reduction in child poverty rate since 2001.
Since 2001, the poverty rate for children living in two-parent families increased 1.1 percentage points.
[Data Table 34, page 62]
Poverty rates for children in Edmonton have increased over the past decade. Child poverty has tended to decline during years of economic growth (2005-2007), and increase during periods of economic downturn (2008-2011).
39,000 children (under 18 years of age) in the Edmonton CMA lived below LIM in 2011— 9,000 more than in 2001. Between the years 2007 and 2009, the number of children in poverty doubled as a result of the economic downturn.
Since 2009, this number has decreased 17%.
[Data Table 34, page 62]
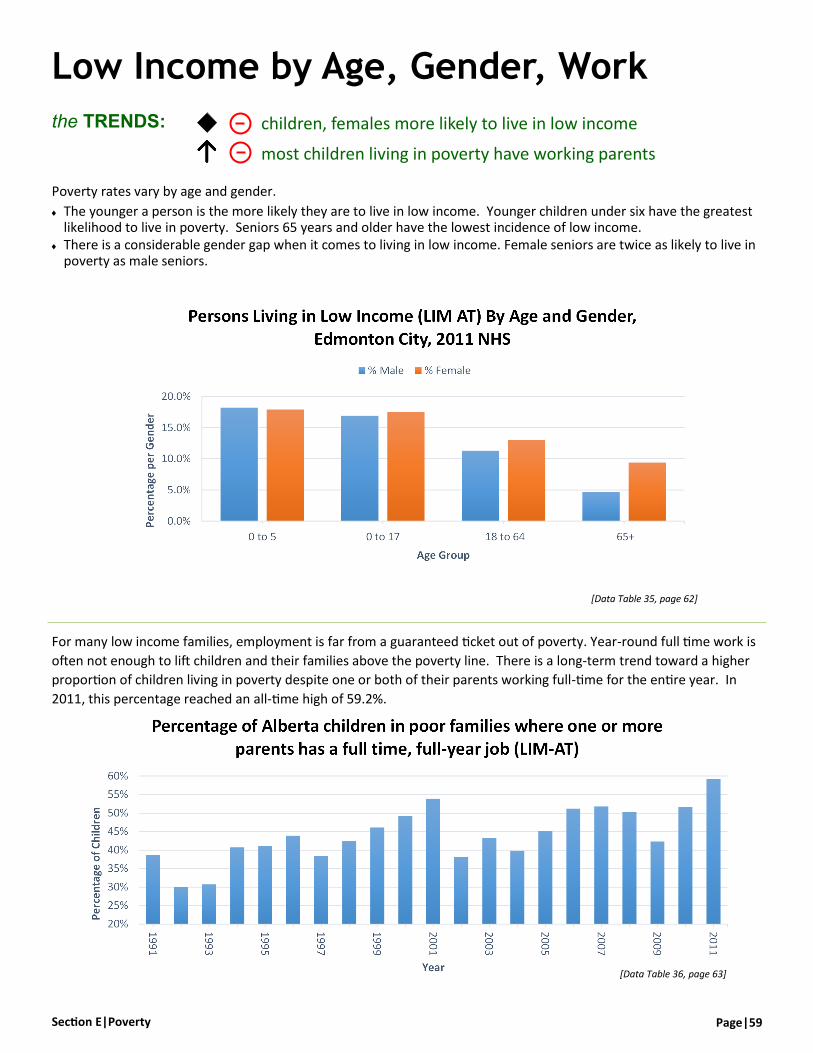
Page|59 Section E|Poverty
Poverty rates vary by age and gender.
The younger a person is the more likely they are to live in low income. Younger children under six have the greatest likelihood to live in poverty. Seniors 65 years and older have the lowest incidence of low income.
There is a considerable gender gap when it comes to living in low income. Female seniors are twice as likely to live in poverty as male seniors.
the TRENDS: children, females more likely to live in low income
most children living in poverty have working parents
For many low income families, employment is far from a guaranteed ticket out of poverty. Year-round full time work is
often not enough to lift children and their families above the poverty line. There is a long-term trend toward a higher
proportion of children living in poverty despite one or both of their parents working full-time for the entire year. In
2011, this percentage reached an all-time high of 59.2%.
Low Income by Age, Gender, Work
[Data Table 35, page 62]
[Data Table 36, page 63]

PART 1|Major Social & Economic Trends Page|60
Table 32: Proportion of Persons in Families Living Below Low Income Measure (LIM), After-Tax, by Family Type, Gender and Age, Edmonton CMA
Year
Persons in All
Families
Family Type Head/Major Income Earner Characteristics
Two-Parent Lone-Parent Individuals Male Female 24 and Under 65 and Over
1981 7.0% 4.3% 23.9% 16.3% 5.3% 14.1% 13.0% 15.4% 1982 6.9% 4.1% 28.0% 13.1% 3.9% 16.1% 13.6% 11.0%
1983 10.0% 5.9% 53.3% 12.8% 6.8% 18.9% 16.5% 20.0% 1984 13.6% 12.5% 48.2% 14.3% 10.2% 22.0% 23.6% 10.5% 1985 10.0% 6.8% 45.5% 14.9% 7.0% 18.1% 30.9% 5.0%
1986 7.5% 5.8% 24.0% 11.1% 5.7% 12.4% 20.0% 4.0% 1987 11.8% 10.7% 47.8% 18.3% 9.0% 20.3% 30.9% 6.0%
1988 10.6% 6.7% 41.7% 20.9% 7.7% 20.0% 34.6% 13.8% 1989 13.2% 12.0% 54.4% 18.5% 10.7% 20.6% 41.2% 12.8% 1990 10.7% 7.3% 48.9% 20.4% 7.0% 20.0% 44.7% 5.6%
1991 10.6% 7.4% 43.9% 19.3% 6.0% 21.0% 28.3% 8.3% 1992 13.9% 9.1% 48.2% 24.0% 8.7% 24.0% 52.9% 4.1% 1993 11.2% 9.5% 35.3% 21.9% 8.2% 18.4% 34.1% 1.7%
1994 12.6% 10.1% 43.2% 18.2% 8.9% 20.3% 32.6% 4.4% 1995 11.3% 9.2% 34.0% 14.5% 8.9% 16.8% 47.7% 5.8%
1996 9.9% 5.7% 51.2% 21.4% 5.5% 21.1% 28.4% 4.2% 1997 10.7% 6.1% 36.8% 24.9% 7.9% 18.1% 41.4% 6.0% 1998 10.5% 5.6% 38.7% 23.4% 6.5% 19.3% 31.7% 6.5%
1999 10.3% 9.9% 26.1% 23.4% 6.4% 18.5% 32.5% 0.4% 2000 10.1% 10.2% 32.9% 16.8% 6.0% 19.0% 15.2% 0.5% 2001 9.0% 8.5% 34.0% 16.5% 5.1% 18.4% 24.5% 0.5%
2002 9.2% 9.2% 17.9% 19.7% 4.9% 20.3% 22.5% 3.6% 2003 8.8% 8.4% 21.4% 17.0% 5.1% 18.9% 18.7% 3.4%
2004 10.6% 10.7% 27.8% 21.5% 4.4% 25.0% 26.0% 3.5% 2005 7.9% 2.3% 35.3% 16.8% 3.4% 17.7% 32.1% 5.7% 2006 6.0% 1.7% 36.1% 13.7% 3.4% 12.0% 22.5% 0.4%
2007 6.2% 3.4% 27.6% 12.9% 3.8% 11.1% 22.7% 2.5% 2008 7.5% 6.0% 35.0% 9.7% 2.5% 17.0% 14.5% 1.8% 2009 10.3% 13.0% 30.6% 11.2% 4.3% 21.4% 22.0% 3.6%
2010 10.0% 10.7% 29.9% 11.8% 5.3% 19.5% 36.6% 2.2% 2011 10.6% 8.5% 21.9% 18.8% 10.6% 10.5% 38.2% 3.2%
[Source: Statistics Canada]
Data Tables|Section E

Page|61 Section E|Poverty
[Source: Statistics Canada]
Data Tables|Section E, cont’d...
Table 33: Average Low Income Gap (LIM AT), by Family Type, $2011 Constant, Edmonton CMA, and After-Tax Family Income Inequality, Alberta
Average Low Income Gap
Year All Family Types Families, 2+ Persons Unattached Individuals Gini Coefficient
1981 35.0% 36.6% 31.9% 0.284 1982 31.7% 32.1% 30.8% 0.293
1983 35.6% 37.1% 29.0% 0.303 1984 39.0% 39.0% 39.3% 0.297 1985 28.0% 27.1% 31.3% 0.290
1986 31.1% 29.0% 39.6% 0.291 1987 33.4% 31.3% 40.9% 0.293
1988 28.5% 27.6% 30.7% 0.284 1989 30.8% 30.8% 31.0% 0.284 1990 30.8% 29.8% 34.3% 0.289
1991 27.3% 24.6% 35.8% 0.301 1992 29.3% 26.4% 37.7% 0.312 1993 28.2% 25.3% 37.2% 0.290
1994 27.5% 26.7% 31.5% 0.291 1995 34.5% 33.2% 42.0% 0.294
1996 32.1% 29.1% 41.2% 0.300 1997 33.5% 31.9% 37.1% 0.308 1998 36.7% 35.6% 39.9% 0.325
1999 33.5% 29.2% 43.7% 0.303 2000 31.9% 28.8% 43.1% 0.312 2001 32.3% 28.7% 43.6% 0.311
2002 31.4% 28.8% 36.2% 0.298 2003 27.2% 20.3% 44.6% 0.311 2004 30.2% 27.7% 35.8% 0.310
2005 32.6% 32.5% 32.7% 0.303 2006 34.2% 22.4% 56.4% 0.314
2007 34.1% 31.7% 39.4% 0.319 2008 26.2% 25.0% 31.4% 0.315 2009 34.7% 34.4% 36.0% 0.332
2010 25.6% 21.8% 41.2% 0.322 2011 29.4% 23.9% 42.1% 0.337
NOTE: Gini Coefficient is for all family types. For a definition of the Gini Coefficient see the Terms and Definitions section.
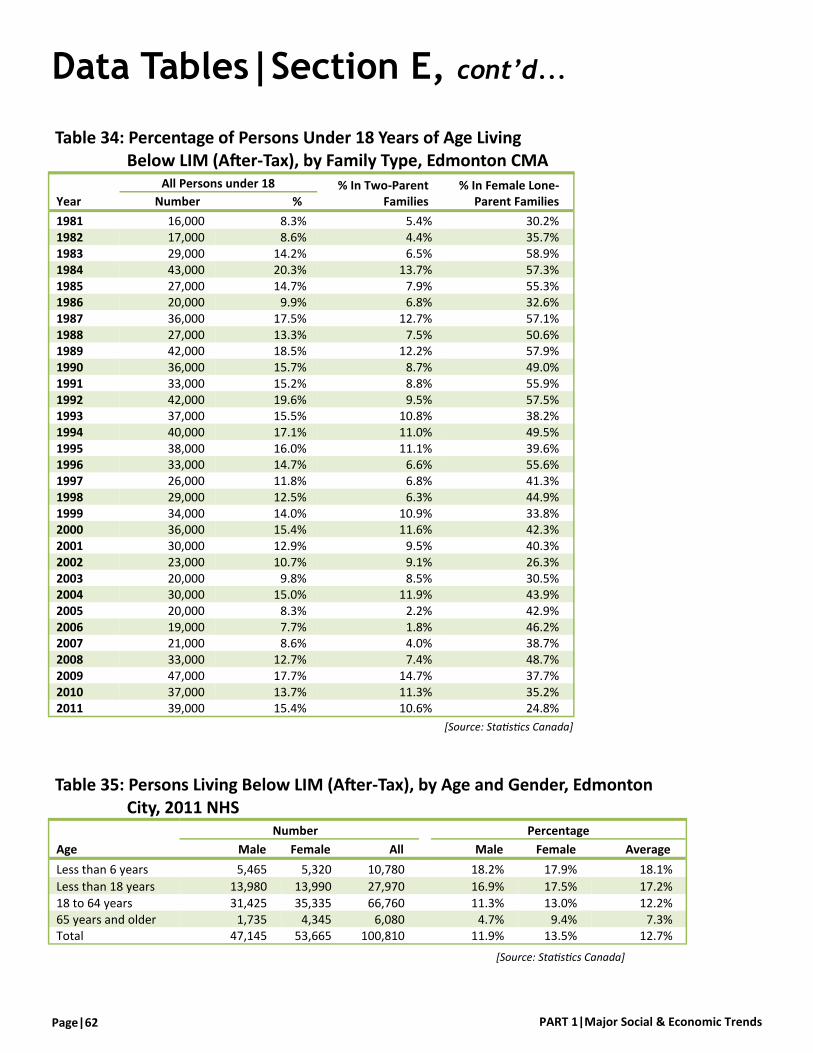
PART 1|Major Social & Economic Trends Page|62
[Source: Statistics Canada]
Table 34: Percentage of Persons Under 18 Years of Age Living Below LIM (After-Tax), by Family Type, Edmonton CMA
Year
All Persons under 18 % In Two-Parent Families
% In Female Lone-Parent Families Number %
1981 16,000 8.3% 5.4% 30.2% 1982 17,000 8.6% 4.4% 35.7% 1983 29,000 14.2% 6.5% 58.9% 1984 43,000 20.3% 13.7% 57.3% 1985 27,000 14.7% 7.9% 55.3% 1986 20,000 9.9% 6.8% 32.6% 1987 36,000 17.5% 12.7% 57.1% 1988 27,000 13.3% 7.5% 50.6% 1989 42,000 18.5% 12.2% 57.9% 1990 36,000 15.7% 8.7% 49.0% 1991 33,000 15.2% 8.8% 55.9% 1992 42,000 19.6% 9.5% 57.5% 1993 37,000 15.5% 10.8% 38.2% 1994 40,000 17.1% 11.0% 49.5% 1995 38,000 16.0% 11.1% 39.6% 1996 33,000 14.7% 6.6% 55.6% 1997 26,000 11.8% 6.8% 41.3% 1998 29,000 12.5% 6.3% 44.9% 1999 34,000 14.0% 10.9% 33.8% 2000 36,000 15.4% 11.6% 42.3% 2001 30,000 12.9% 9.5% 40.3% 2002 23,000 10.7% 9.1% 26.3% 2003 20,000 9.8% 8.5% 30.5% 2004 30,000 15.0% 11.9% 43.9% 2005 20,000 8.3% 2.2% 42.9% 2006 19,000 7.7% 1.8% 46.2% 2007 21,000 8.6% 4.0% 38.7% 2008 33,000 12.7% 7.4% 48.7% 2009 47,000 17.7% 14.7% 37.7% 2010 37,000 13.7% 11.3% 35.2% 2011 39,000 15.4% 10.6% 24.8%
Table 35: Persons Living Below LIM (After-Tax), by Age and Gender, Edmonton City, 2011 NHS
Age
Number Percentage
Male All Male Average Female Female
Less than 6 years 5,465 10,780 18.2% 18.1% 5,320 17.9%
Less than 18 years 13,980 27,970 16.9% 17.2% 13,990 17.5%
18 to 64 years 31,425 66,760 11.3% 12.2% 35,335 13.0% 65 years and older 1,735 6,080 4.7% 7.3% 4,345 9.4% Total 47,145 100,810 11.9% 12.7% 53,665 13.5%
[Source: Statistics Canada]
Data Tables|Section E, cont’d...
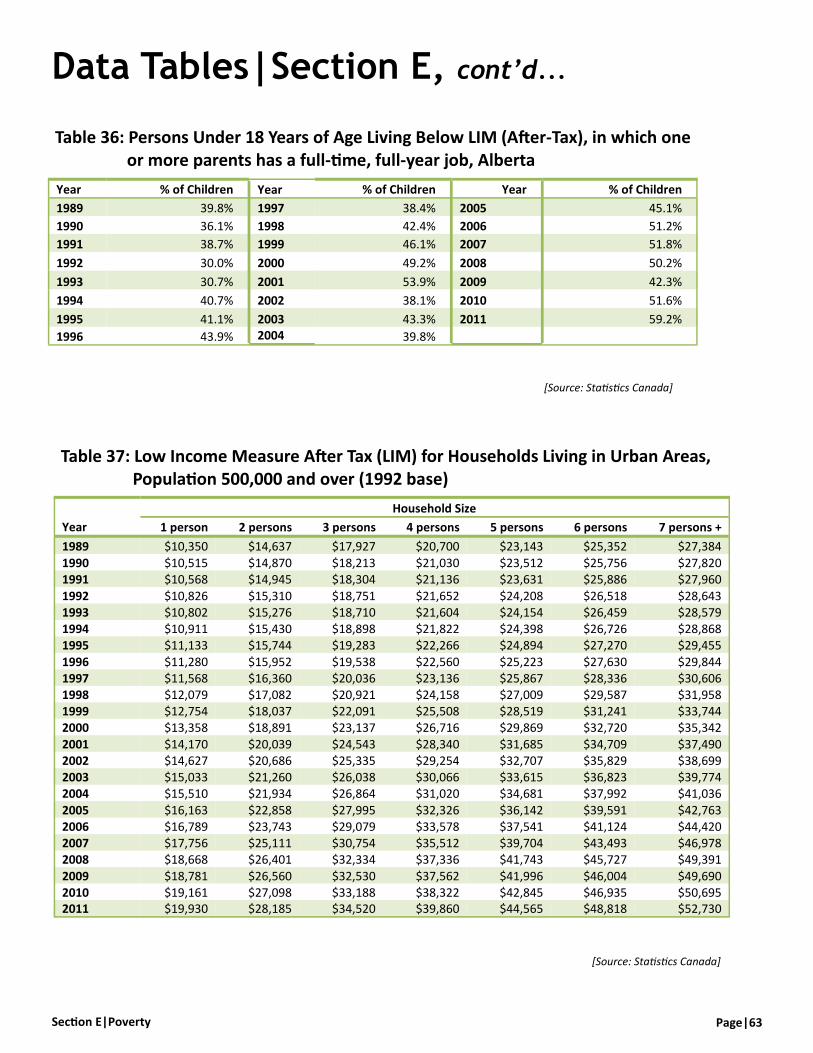
Page|63 Section E|Poverty
Table 36: Persons Under 18 Years of Age Living Below LIM (After-Tax), in which one or more parents has a full-time, full-year job, Alberta
Year % of Children Year % of Children Year % of Children
1989 39.8% 1997 38.4% 2005 45.1%
1990 36.1% 1998 42.4% 2006 51.2%
1991 38.7% 1999 46.1% 2007 51.8%
1992 30.0% 2000 49.2% 2008 50.2%
1993 30.7% 2001 53.9% 2009 42.3%
1994 40.7% 2002 38.1% 2010 51.6%
1995 41.1% 2003 43.3% 2011 59.2%
1996 43.9% 2004 39.8%
[Source: Statistics Canada]
Data Tables|Section E, cont’d...
[Source: Statistics Canada]
Table 37: Low Income Measure After Tax (LIM) for Households Living in Urban Areas, Population 500,000 and over (1992 base)
Year
Household Size
1 person 2 persons 3 persons 4 persons 5 persons 6 persons 7 persons +
1989 $10,350 $14,637 $17,927 $20,700 $23,143 $25,352 $27,384
1990 $10,515 $14,870 $18,213 $21,030 $23,512 $25,756 $27,820 1991 $10,568 $14,945 $18,304 $21,136 $23,631 $25,886 $27,960
1992 $10,826 $15,310 $18,751 $21,652 $24,208 $26,518 $28,643 1993 $10,802 $15,276 $18,710 $21,604 $24,154 $26,459 $28,579 1994 $10,911 $15,430 $18,898 $21,822 $24,398 $26,726 $28,868 1995 $11,133 $15,744 $19,283 $22,266 $24,894 $27,270 $29,455
1996 $11,280 $15,952 $19,538 $22,560 $25,223 $27,630 $29,844 1997 $11,568 $16,360 $20,036 $23,136 $25,867 $28,336 $30,606 1998 $12,079 $17,082 $20,921 $24,158 $27,009 $29,587 $31,958 1999 $12,754 $18,037 $22,091 $25,508 $28,519 $31,241 $33,744 2000 $13,358 $18,891 $23,137 $26,716 $29,869 $32,720 $35,342
2001 $14,170 $20,039 $24,543 $28,340 $31,685 $34,709 $37,490 2002 $14,627 $20,686 $25,335 $29,254 $32,707 $35,829 $38,699 2003 $15,033 $21,260 $26,038 $30,066 $33,615 $36,823 $39,774 2004 $15,510 $21,934 $26,864 $31,020 $34,681 $37,992 $41,036
2005 $16,163 $22,858 $27,995 $32,326 $36,142 $39,591 $42,763 2006 $16,789 $23,743 $29,079 $33,578 $37,541 $41,124 $44,420 2007 $17,756 $25,111 $30,754 $35,512 $39,704 $43,493 $46,978 2008 $18,668 $26,401 $32,334 $37,336 $41,743 $45,727 $49,391
2009 $18,781 $26,560 $32,530 $37,562 $41,996 $46,004 $49,690 2010 $19,161 $27,098 $33,188 $38,322 $42,845 $46,935 $50,695 2011 $19,930 $28,185 $34,520 $39,860 $44,565 $48,818 $52,730

PART 1|Major Social & Economic Trends Page|64
Government income supports (also known as income transfers), as well as other social programs and services, play an important role in preventing poverty.
Despite a pervasive belief in meritocracy, there are many people for whom hard work is not a ticket out of poverty. Some of the barriers to well-paid employment include: limited English language proficiency; lack of access to education; non-recognition of foreign credentials; social isolation; limited access to child care; conflicting work and family responsibilities; and even the structure of government programs [CACL; CCPA; Doyle-Bedwell, 2008; PRC]. These barriers often disproportionately affect visible minority groups (particularly newcomers), Aboriginal people, persons with disabilities, and lone-parent women.
Income Security
Income transfers should help all citizens maintain a decent quality of life—in particular, the ability to afford a nutritious diet and safe housing—and some level of financial stability. Income security is necessary for both those who are and are not able to work.
When incomes do not increase at the rate of inflation, more low and modest income families are at risk of poverty. Those already living in poverty fall even further behind.
The affordability and accessibility of services such as
childcare and education are crucial to enabling people
to acquire and maintain adequate employment and,
accordingly, financial independence. Government
transfers are thus an important factor in reducing levels
of poverty.
The value of government income transfers given to families in Alberta has been relatively consistent over the past twenty years, with Albertans in the second lowest income quintile continuing to receive the highest proportion of transfers. Families in the second lowest quintile are more likely to have children and receive a child tax credit than those in the lowest income quintile (lowest 20%), who tend to be single individuals.
In April 2012, the Government of Alberta increased Alberta Income for the Severely Handicapped (AISH) benefits by $400 per month. This was a welcome development for some of the most vulnerable households in the province.
The number of Edmontonians receiving Alberta Works (AW) benefits and Employment Insurance (EI) was on a steady decline until 2009. When the recession hit, EI usage rates nearly tripled as newly unemployed persons
sought financial assistance. Alberta Works usage then peaked in 2011, representing those individuals who were still unable to find employment after their EI benefits ran out. This trend reinforces the need for effective income support programs in order to prevent an increase in poverty during rough economic patches.
Effectiveness of Transfer Payments
The level of poverty reduction achieved by government
transfer payments has increased markedly over the past
decade in Alberta. Government benefits targeted to
families, such as child tax benefits, have contributed to
lifting a significant proportion (nearly 50% in 2011) of
children living in low income above the poverty line.
With the Government of Alberta’s stated aim of ending
child poverty within five years, these numbers should
be expected to increase from now on.
Section F|Government Income Supports
the TRENDS: use of income supports declining but spiked during recession
real value of income supports declining for lowest income families
effectiveness of government income supports improved
Why are Income Support Trends Important?
How is Edmonton Changing?

Page|65 Section F|Government Income Supports
the TRENDS: value of transfers stagnant
value of transfers increased for lowest quintile
Government Transfer Payments
The value of government transfer payments given to families in Alberta has changed very little since the early 1990s. However, some minor fluctuations have occurred. For instance, the value of transfers was $900 higher in 2010 than it was in 2001, a change that was likely due to the economic downturn.
When families are divided into income quintiles, it is apparent that the value of transfers received by families varies by income level.
Families in the lowest income quintile (earning the lowest 20% of incomes) experienced a 15.2% increase in the value of the transfer payments they received between 2001 and 2011.
The second income quintile (earning the lowest 20% - 40% of incomes) experienced fluctuations in the value of trans-fer payments between 2001 and 2011, including a 23.2% increase between 2008 and 2009. This group receives the highest amount of all the quintiles.
The highest income quintile (families earning the top 20% of incomes) experienced a 10.3% increase in the value of transfer payments between 2001 and 2011. This group receives the lowest amount of all the quintiles.
[Data Table 38, page 71]
[Data Table 38, page 71]
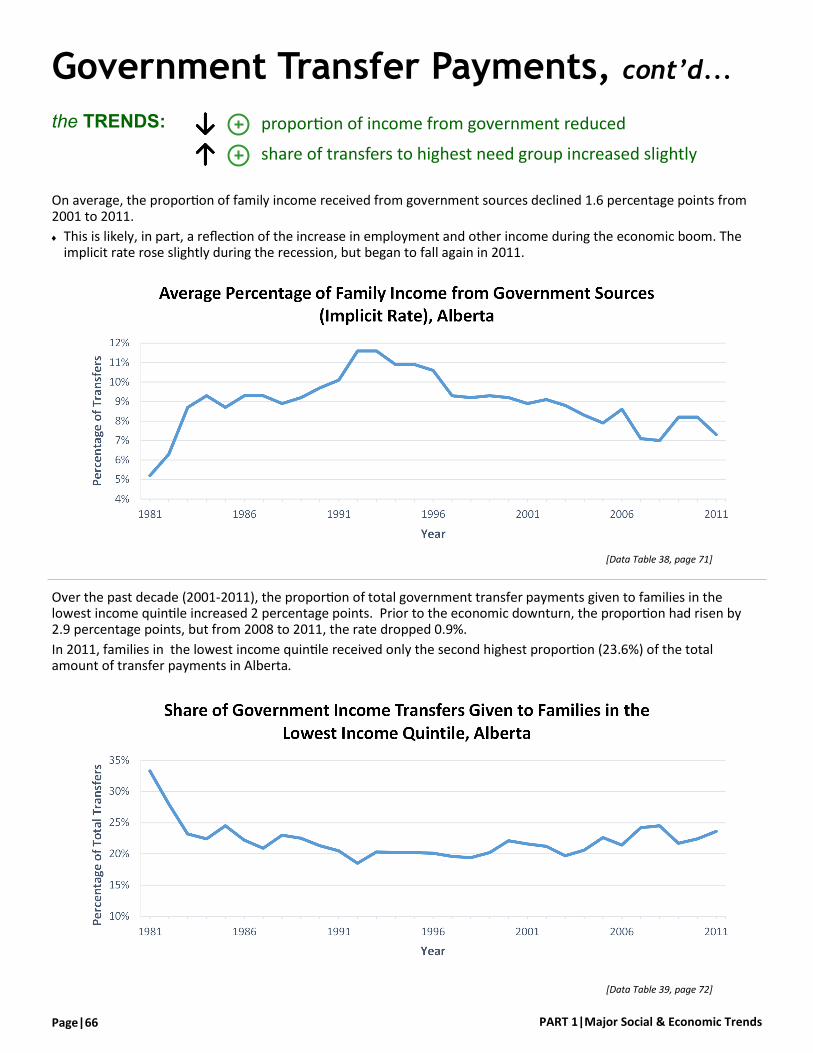
PART 1|Major Social & Economic Trends Page|66
Government Transfer Payments, cont’d...
On average, the proportion of family income received from government sources declined 1.6 percentage points from 2001 to 2011.
This is likely, in part, a reflection of the increase in employment and other income during the economic boom. The implicit rate rose slightly during the recession, but began to fall again in 2011.
Over the past decade (2001-2011), the proportion of total government transfer payments given to families in the lowest income quintile increased 2 percentage points. Prior to the economic downturn, the proportion had risen by 2.9 percentage points, but from 2008 to 2011, the rate dropped 0.9%.
In 2011, families in the lowest income quintile received only the second highest proportion (23.6%) of the total amount of transfer payments in Alberta.
[Data Table 38, page 71]
[Data Table 39, page 72]
the TRENDS: proportion of income from government reduced
share of transfers to highest need group increased slightly
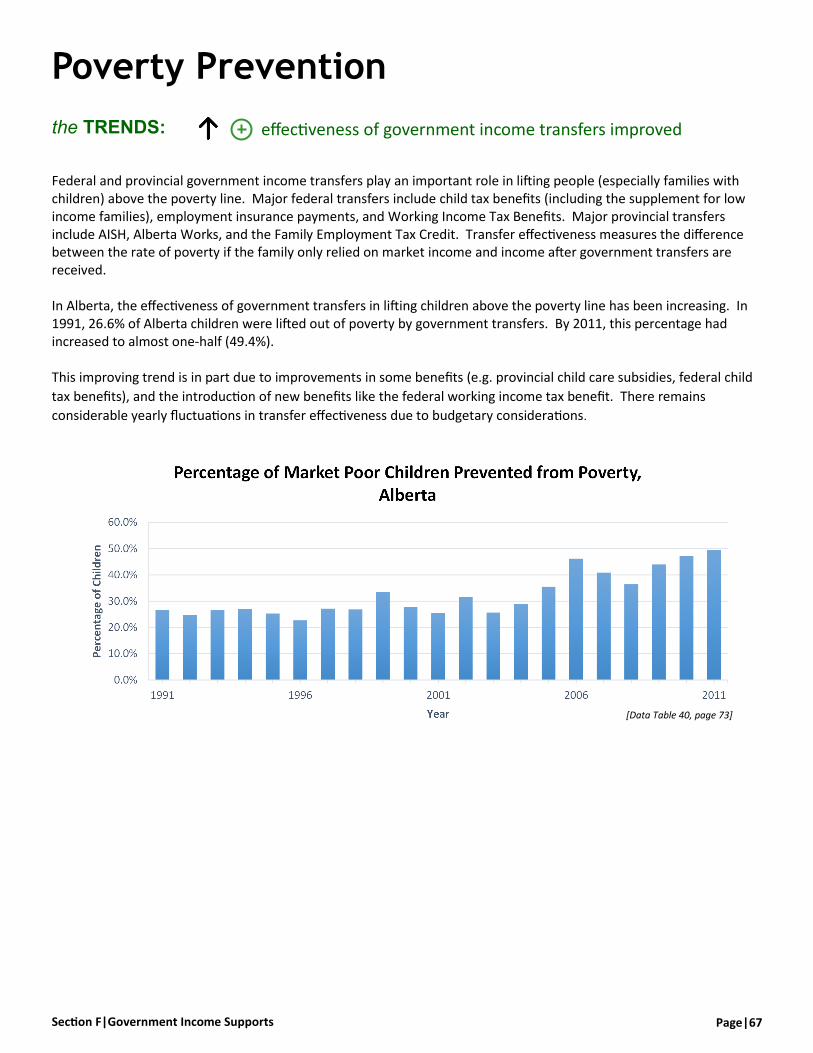
Page|67 Section F|Government Income Supports
Poverty Prevention
Federal and provincial government income transfers play an important role in lifting people (especially families with children) above the poverty line. Major federal transfers include child tax benefits (including the supplement for low income families), employment insurance payments, and Working Income Tax Benefits. Major provincial transfers include AISH, Alberta Works, and the Family Employment Tax Credit. Transfer effectiveness measures the difference between the rate of poverty if the family only relied on market income and income after government transfers are received. In Alberta, the effectiveness of government transfers in lifting children above the poverty line has been increasing. In 1991, 26.6% of Alberta children were lifted out of poverty by government transfers. By 2011, this percentage had increased to almost one-half (49.4%). This improving trend is in part due to improvements in some benefits (e.g. provincial child care subsidies, federal child
tax benefits), and the introduction of new benefits like the federal working income tax benefit. There remains
considerable yearly fluctuations in transfer effectiveness due to budgetary considerations.
the TRENDS: effectiveness of government income transfers improved
[Data Table 40, page 73]
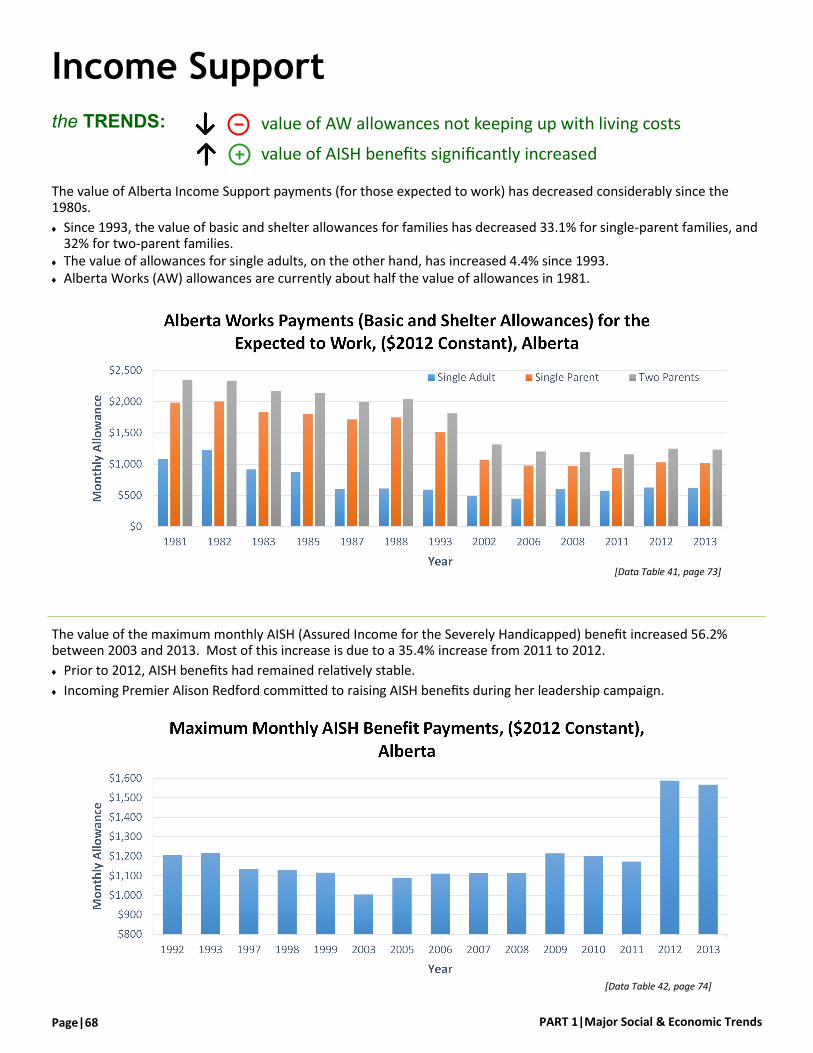
PART 1|Major Social & Economic Trends Page|68
Income Support
The value of Alberta Income Support payments (for those expected to work) has decreased considerably since the 1980s.
Since 1993, the value of basic and shelter allowances for families has decreased 33.1% for single-parent families, and 32% for two-parent families.
The value of allowances for single adults, on the other hand, has increased 4.4% since 1993. Alberta Works (AW) allowances are currently about half the value of allowances in 1981.
the TRENDS: value of AW allowances not keeping up with living costs
value of AISH benefits significantly increased
The value of the maximum monthly AISH (Assured Income for the Severely Handicapped) benefit increased 56.2%between 2003 and 2013. Most of this increase is due to a 35.4% increase from 2011 to 2012.
Prior to 2012, AISH benefits had remained relatively stable.
Incoming Premier Alison Redford committed to raising AISH benefits during her leadership campaign.
[Data Table 42, page 74]
[Data Table 41, page 73]
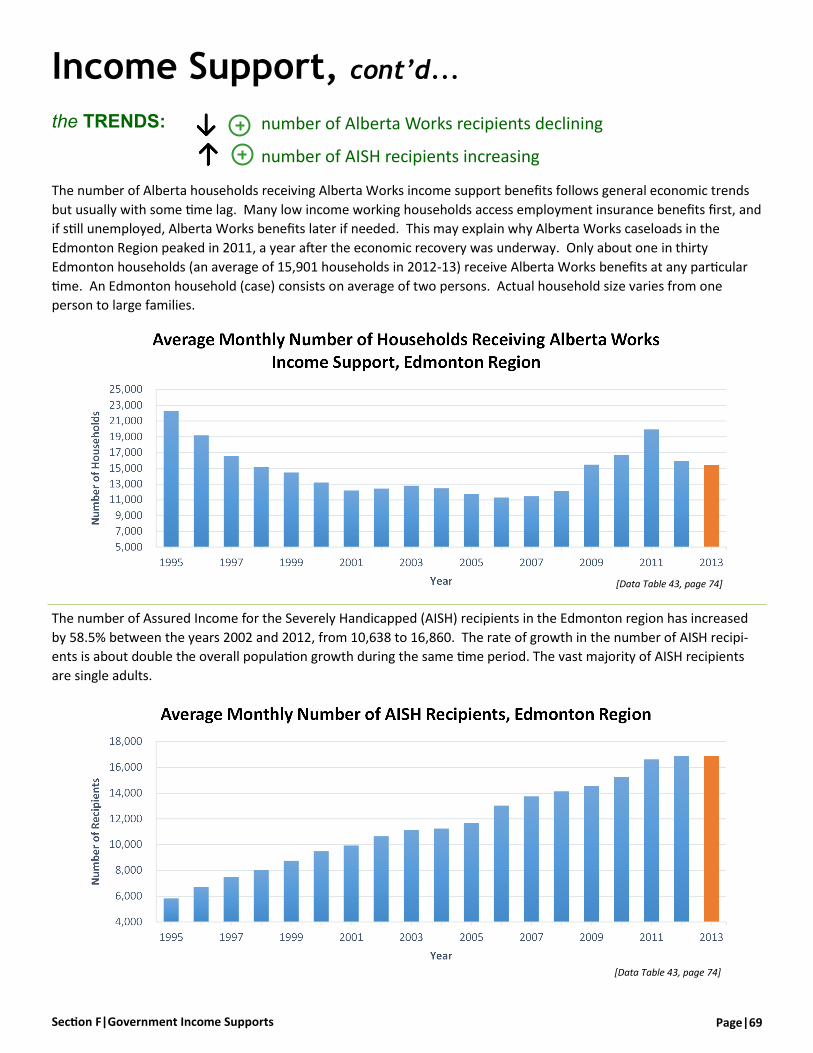
Page|69 Section F|Government Income Supports
Income Support, cont’d...
The number of Alberta households receiving Alberta Works income support benefits follows general economic trends
but usually with some time lag. Many low income working households access employment insurance benefits first, and
if still unemployed, Alberta Works benefits later if needed. This may explain why Alberta Works caseloads in the
Edmonton Region peaked in 2011, a year after the economic recovery was underway. Only about one in thirty
Edmonton households (an average of 15,901 households in 2012-13) receive Alberta Works benefits at any particular
time. An Edmonton household (case) consists on average of two persons. Actual household size varies from one
person to large families.
the TRENDS: number of Alberta Works recipients declining
number of AISH recipients increasing
[Data Table 43, page 74]
[Data Table 43, page 74]
The number of Assured Income for the Severely Handicapped (AISH) recipients in the Edmonton region has increased
by 58.5% between the years 2002 and 2012, from 10,638 to 16,860. The rate of growth in the number of AISH recipi-
ents is about double the overall population growth during the same time period. The vast majority of AISH recipients
are single adults.
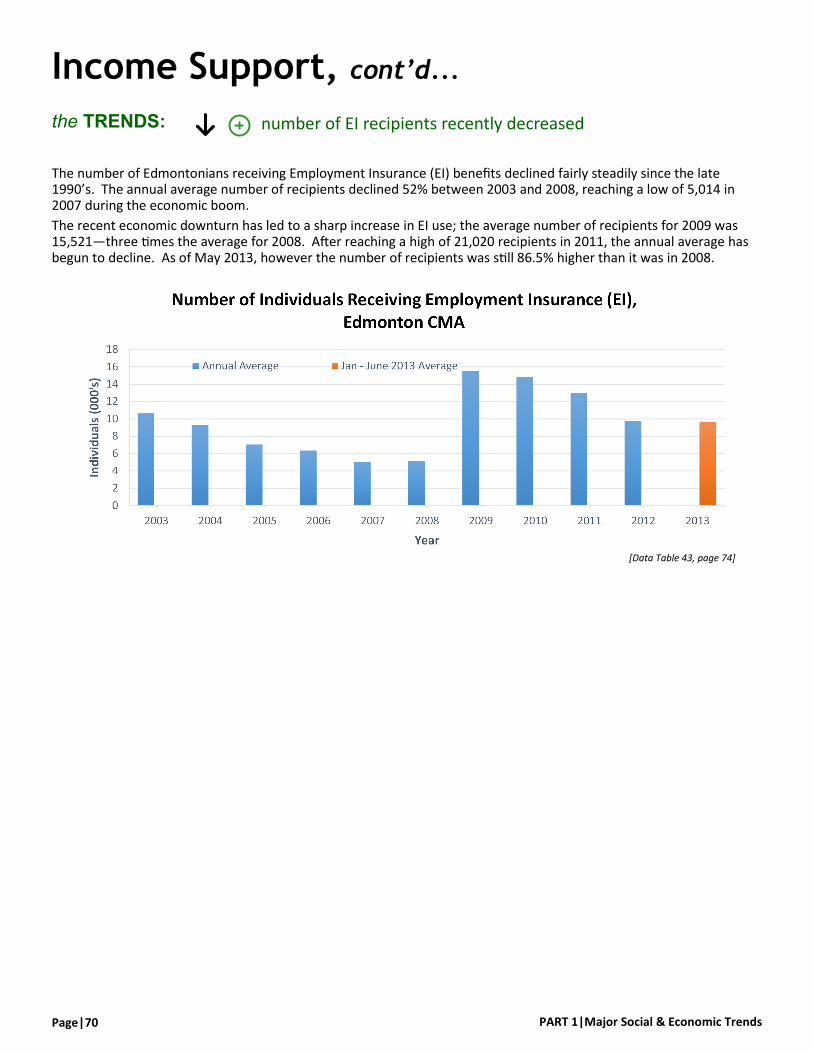
PART 1|Major Social & Economic Trends Page|70
Income Support, cont’d...
The number of Edmontonians receiving Employment Insurance (EI) benefits declined fairly steadily since the late 1990’s. The annual average number of recipients declined 52% between 2003 and 2008, reaching a low of 5,014 in 2007 during the economic boom.
The recent economic downturn has led to a sharp increase in EI use; the average number of recipients for 2009 was 15,521—three times the average for 2008. After reaching a high of 21,020 recipients in 2011, the annual average has begun to decline. As of May 2013, however the number of recipients was still 86.5% higher than it was in 2008.
the TRENDS: number of EI recipients recently decreased
[Data Table 43, page 74]

Page|71 Section F|Government Income Supports
[Source: Statistics Canada]
Table 38: Government Transfer Payments to Families, by Income Quintile, & Proportion of Family Income from Government Sources (Implicit Rate), $2011 Constant, Alberta
Year
Average Government Transfer Payments by Income Quintile Implicit Rate (All Quintiles) All Quintiles Lowest Q2 Q3 Q4 Highest
1981 $3,700 $6,100 $4,400 $3,100 $2,600 $2,200 5.2%
1982 $4,500 $6,300 $5,800 $3,800 $3,500 $3,100 6.3%
1983 $5,700 $6,600 $7,300 $5,400 $4,900 $4,200 8.7%
1984 $5,800 $6,500 $8,200 $5,800 $4,800 $3,700 9.3%
1985 $5,700 $7,000 $8,200 $5,000 $4,500 $3,800 8.7%
1986 $6,000 $6,700 $8,600 $6,100 $4,500 $4,100 9.3%
1987 $5,900 $6,200 $8,500 $6,000 $4,400 $4,600 9.3%
1988 $5,700 $6,600 $8,900 $5,400 $4,200 $3,700 8.9%
1989 $6,000 $6,700 $8,200 $5,500 $4,900 $4,500 9.2%
1990 $6,400 $6,800 $9,000 $6,000 $5,200 $4,800 9.7%
1991 $6,600 $6,800 $9,300 $6,100 $5,700 $5,100 10.1%
1992 $7,100 $6,600 $10,000 $8,100 $6,400 $4,500 11.6%
1993 $7,100 $7,300 $9,700 $7,600 $6,000 $5,200 11.6%
1994 $6,700 $6,800 $9,700 $7,200 $5,600 $4,400 10.9%
1995 $6,800 $6,800 $9,000 $7,200 $5,900 $5,000 10.9%
1996 $6,600 $6,600 $9,100 $7,300 $6,200 $3,900 10.6%
1997 $6,300 $6,100 $9,000 $7,000 $4,900 $4,200 9.3%
1998 $6,400 $6,200 $8,900 $6,800 $5,900 $4,100 9.2%
1999 $6,300 $6,400 $9,200 $6,900 $5,200 $3,900 9.3%
2000 $6,600 $7,200 $9,100 $7,000 $5,500 $3,900 9.2%
2001 $6,600 $7,100 $9,200 $7,200 $5,600 $3,900 8.9%
2002 $6,600 $7,000 $8,600 $7,300 $6,200 $4,000 9.1%
2003 $6,400 $6,300 $9,400 $6,700 $5,800 $3,900 8.8%
2004 $6,300 $6,500 $9,400 $7,500 $4,300 $3,900 8.3%
2005 $6,200 $7,000 $8,600 $7,500 $4,900 $3,100 7.9%
2006 $7,300 $7,800 $10,100 $7,600 $6,600 $4,400 8.6%
2007 $6,300 $7,700 $8,600 $6,600 $6,000 $2,800 7.1%
2008 $6,400 $7,800 $8,200 $6,600 $5,500 $3,900 7.0%
2009 $7,400 $8,000 $10,100 $8,100 $6,600 $4,000 8.2%
2010 $7,500 $8,400 $10,100 $8,000 $6,800 $4,100 8.2%
2011 $7,000 $8,200 $9,200 $6,900 $6,200 $4,300 7.3%
Data Tables|Section F
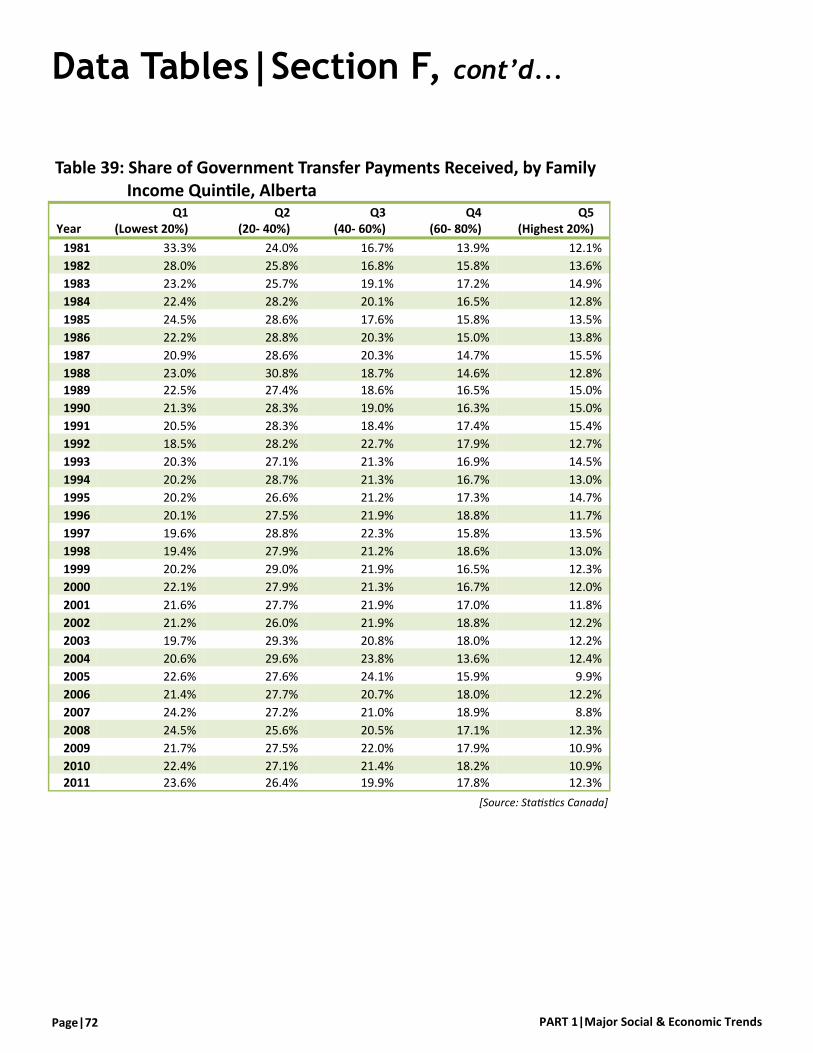
PART 1|Major Social & Economic Trends Page|72
[Source: Statistics Canada]
Table 39: Share of Government Transfer Payments Received, by Family Income Quintile, Alberta
Year Q1
(Lowest 20%) Q2
(20- 40%) Q3
(40- 60%) Q4
(60- 80%) Q5
(Highest 20%)
1981 33.3% 24.0% 16.7% 13.9% 12.1%
1982 28.0% 25.8% 16.8% 15.8% 13.6%
1983 23.2% 25.7% 19.1% 17.2% 14.9%
1984 22.4% 28.2% 20.1% 16.5% 12.8%
1985 24.5% 28.6% 17.6% 15.8% 13.5%
1986 22.2% 28.8% 20.3% 15.0% 13.8%
1987 20.9% 28.6% 20.3% 14.7% 15.5%
1988 23.0% 30.8% 18.7% 14.6% 12.8%
1989 22.5% 27.4% 18.6% 16.5% 15.0%
1990 21.3% 28.3% 19.0% 16.3% 15.0%
1991 20.5% 28.3% 18.4% 17.4% 15.4%
1992 18.5% 28.2% 22.7% 17.9% 12.7%
1993 20.3% 27.1% 21.3% 16.9% 14.5%
1994 20.2% 28.7% 21.3% 16.7% 13.0%
1995 20.2% 26.6% 21.2% 17.3% 14.7%
1996 20.1% 27.5% 21.9% 18.8% 11.7%
1997 19.6% 28.8% 22.3% 15.8% 13.5%
1998 19.4% 27.9% 21.2% 18.6% 13.0%
1999 20.2% 29.0% 21.9% 16.5% 12.3%
2000 22.1% 27.9% 21.3% 16.7% 12.0%
2001 21.6% 27.7% 21.9% 17.0% 11.8%
2002 21.2% 26.0% 21.9% 18.8% 12.2%
2003 19.7% 29.3% 20.8% 18.0% 12.2%
2004 20.6% 29.6% 23.8% 13.6% 12.4%
2005 22.6% 27.6% 24.1% 15.9% 9.9%
2006 21.4% 27.7% 20.7% 18.0% 12.2%
2007 24.2% 27.2% 21.0% 18.9% 8.8%
2008 24.5% 25.6% 20.5% 17.1% 12.3%
2009 21.7% 27.5% 22.0% 17.9% 10.9%
2010 22.4% 27.1% 21.4% 18.2% 10.9%
2011 23.6% 26.4% 19.9% 17.8% 12.3%
Data Tables|Section F, cont’d...
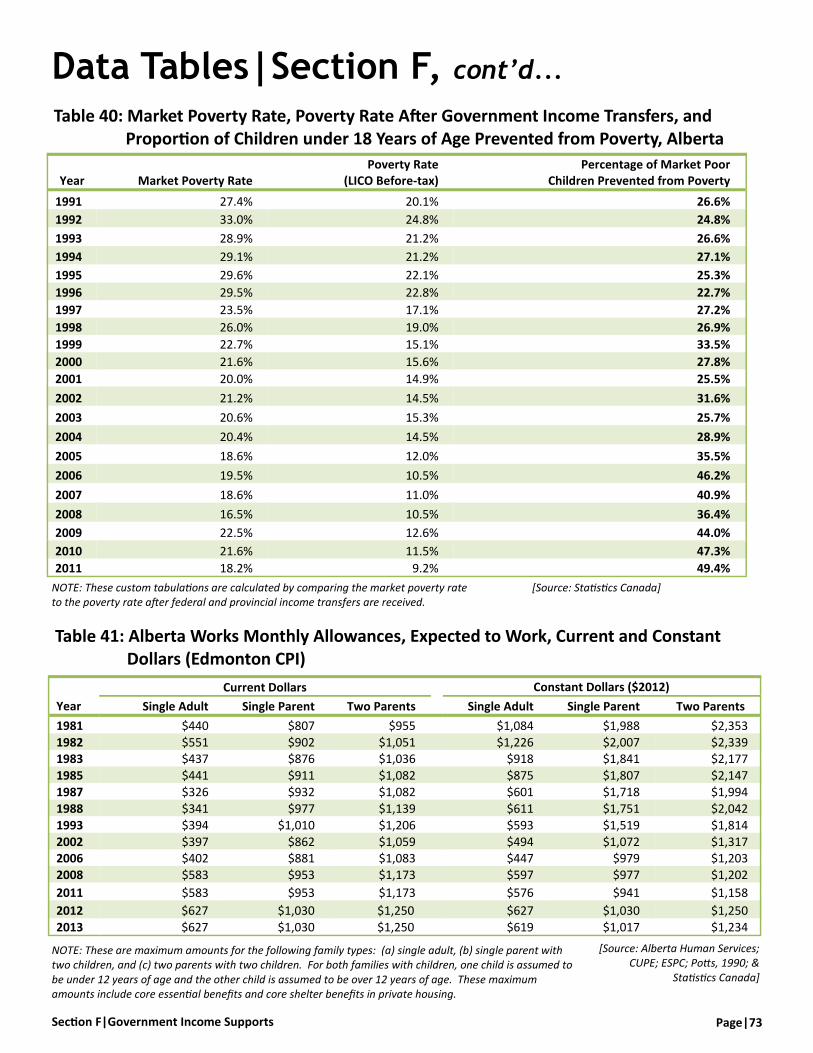
Page|73 Section F|Government Income Supports
Table 40: Market Poverty Rate, Poverty Rate After Government Income Transfers, and Proportion of Children under 18 Years of Age Prevented from Poverty, Alberta
Year Market Poverty Rate Poverty Rate
(LICO Before-tax) Percentage of Market Poor
Children Prevented from Poverty
1991 27.4% 20.1% 26.6%
1992 33.0% 24.8% 24.8%
1993 28.9% 21.2% 26.6%
1994 29.1% 21.2% 27.1%
1995 29.6% 22.1% 25.3%
1996 29.5% 22.8% 22.7%
1997 23.5% 17.1% 27.2%
1998 26.0% 19.0% 26.9%
1999 22.7% 15.1% 33.5%
2000 21.6% 15.6% 27.8%
2001 20.0% 14.9% 25.5%
2002 21.2% 14.5% 31.6%
2003 20.6% 15.3% 25.7%
2004 20.4% 14.5% 28.9%
2005 18.6% 12.0% 35.5%
2006 19.5% 10.5% 46.2%
2007 18.6% 11.0% 40.9%
2008 16.5% 10.5% 36.4%
2009 22.5% 12.6% 44.0%
2010 21.6% 11.5% 47.3%
2011 18.2% 9.2% 49.4%
[Source: Alberta Human Services; CUPE; ESPC; Potts, 1990; &
Statistics Canada]
Table 41: Alberta Works Monthly Allowances, Expected to Work, Current and Constant Dollars (Edmonton CPI)
Year
Current Dollars Constant Dollars ($2012)
Single Adult Single Parent Two Parents Single Adult Single Parent Two Parents
1981 $440 $807 $955 $1,084 $1,988 $2,353
1982 $551 $902 $1,051 $1,226 $2,007 $2,339 1983 $437 $876 $1,036 $918 $1,841 $2,177
1985 $441 $911 $1,082 $875 $1,807 $2,147
1987 $326 $932 $1,082 $601 $1,718 $1,994
1988 $341 $977 $1,139 $611 $1,751 $2,042
1993 $394 $1,010 $1,206 $593 $1,519 $1,814
2002 $397 $862 $1,059 $494 $1,072 $1,317 2006 $402 $881 $1,083 $447 $979 $1,203
2008 $583 $953 $1,173 $597 $977 $1,202
2011 $583 $953 $1,173 $576 $941 $1,158
2012 $627 $1,030 $1,250 $627 $1,030 $1,250
2013 $627 $1,030 $1,250 $619 $1,017 $1,234
Data Tables|Section F, cont’d...
NOTE: These are maximum amounts for the following family types: (a) single adult, (b) single parent with two children, and (c) two parents with two children. For both families with children, one child is assumed to be under 12 years of age and the other child is assumed to be over 12 years of age. These maximum amounts include core essential benefits and core shelter benefits in private housing.
[Source: Statistics Canada] NOTE: These custom tabulations are calculated by comparing the market poverty rate to the poverty rate after federal and provincial income transfers are received.

PART 1|Major Social & Economic Trends Page|74
Table 42: Assured Income for the Severely Handicapped (AISH) Monthly Maximum Allowances, Current and Constant Dollars (Edmonton CPI)
Year Current Dollars Constant Dollars ($2012)
1993 $810 $1,218
1997 $814 $1,135 1998 $818 $1,131
1999 $826 $1,116 2003 $850 $1,004 2005 $950 $1,088
2006 $1,000 $1,111 2007 $1,050 $1,113
2008 $1,088 $1,115 2009 $1,188 $1,215
2010 $1,188 $1,203
2011 $1,188 $1,173
2012 $1,588 $1,588 2013 $1,588 *$1,568
Table 43: Alberta Works, Assured Income for the Severely Handicapped (AISH) and Employment Insurance Recipients, Edmonton CMA
Year
Alberta Works AISH Recipients
Employment Insurance (EI) Recipients, Regular Benefits Recipients Cases
1995 43,726 22,309 5,830 N/A
1996 37,607 19,187 6,713 N/A
1997 32,501 16,582 7,503 10,367
1998 29,782 15,195 8,012 10,838
1999 28,377 14,478 8,746 11,607
2000 25,688 13,106 9,472 8,784
2001 23,904 12,196 9,935 7,703
2002 24,349 12,423 10,638 9,614
2003 25,063 12,787 11,109 10,653
2004 24,429 12,464 11,247 9,287
2005 23,065 11,768 11,707 7,047
2006 22,166 11,309 13,024 6,346
2007 22,450 11,454 13,750 5,014
2008 23,689 12,086 14,130 5,118
2009 22,833 15,470 14,546 15,521
2010 28,623 16,718 15,260 14,814
2011 31,444 19,942 16,624 21,020
2012 29,224 15,901 16,860 17,769
2013 *28,134 *15,406 *16,857 **9,635 [Sources: Alberta Human Services &
Statistics Canada]
[Sources: Alberta Human Services; Alberta Disabilities Forum; CUPE; Kneebone, 2005; &
Statistics Canada]
Data Tables|Section F, cont’d...
* $2012 Constant Dollar value for 2013 calculated using change in Edmonton inflation rate, April 2012—April 2013
NOTE: Alberta Works Caseloads are measured by fiscal year. (1994 = April 1994—March 1995) * April to June average **January to June average

Page|75
Notes
PART 2|Edmonton Social Health Index Page|76
The data presented in Part 1 give a comprehensive look at multiple social factors that affect Edmontonians. However, it can be difficult to gain a cohesive sense of how the city has changed over the years from such a wide and varied array of data.
The Edmonton Social Health Index is an attempt to generate such an overarching view based on a selection of key social features.
Social Health Indicators
In this edition of Tracking the Trends, we have chosen to include 23 of the 25 social health indicators that were used in the 2011 edition. Premature deaths and number of reported family disputes were excluded due to a lack of sufficient or comparable data. For similar reasons, new indicators replace lone-parent households, core housing need, and the high school student dropout rate.
Several of the indicators use census data which is only available every five years. Projections from the 2011 Census and National Household Survey have been done. Projected values were calculated using a linear trend line for data over the 20-year period from 1993 to 2012. In some instances, projections for shorter time-frames were done when reporting methodologies changed or projections were grossly out of line with contemporary trends. These exceptions are indicated in the text.
The 23 indicators can be grouped into five broad categories:
Population Health Personal and Family Stability Financial Security Community Safety Participation and Environment Calculation of the Index To calculate the index, the data for each indicator is first classified as positive or negative. A positive indicator is
one that shows improved quality of life when the value increases. For example, increased life expectancy indicates improvements in health. A negative indicator is one for which an increase adversely affects the community. For instance, increases in unemployment or food bank use are undesirable.
The data are then converted to an index value based on the benchmark year of 1993. The rate of change from the base year is calculated normally for positive indicators, while negative indicator values are indexed using their inverse to reflect their negative impact on social health.
The averages of all indicator values are then compiled for each year, and the mean of these annual averages is calculated to form the composite index value (see page 101). The index thereby factors in the variability shown by the indicator over time.
The composite index gives equal weight to each
indicator. We extrapolate values for years in which data
is missing for an indicator in order to ensure that this
equal weighting is maintained for all years. Projections
and estimates are clearly indicated in all tables and
charts.
A Note on Presentation
The average percent change reported for each indicator encompasses all up and down changes for a given indicator. It can be thought of as a summary measure of everything that occurred between 1993 and the most recently available data year. As a result, the average percent change reported will not necessarily coincide with the contemporary trends or projections presented in the accompanying graphs, and in some instances may even appear to contradict them. For this reason, we suggest you think of these components as complimentary, rather than corresponding, illustrations of the data.
Part 2|Edmonton Social Health Index
the TREND Markers
the TREND Direction the TREND Value
Numbers/value increasing positive trend / situation improving
Numbers/value decreasing negative trend / situation worsening
Situation stable / No historical trend neutral / positive and negative aspects

Section A|Social Health Indicators Page|77
Population Health
1 Life Expectancy 2 Sexually Transmitted Infections 3 Low Birth-Weight Babies 4 Infant Mortality
Personal & Family Stability
5 Teen Birth Rate 6 Child & Family Services Caseloads 7 Suicide 8 Crisis Support Services 9 Divorced / Separated Families
Financial Security
10 Median Family Income 11 Personal Bankruptcy Rate 12 Percentage of Persons in Families Below LIM 13 Percentage of Children in Families Below LIM 14 Depth of Poverty 15 Vacancy Rate 16 Food Bank Use 17 High School Not Completed 18 Post-Secondary Educational Attainment 19 Unemployment
Community Safety
20 Property Crime Rate 21 Violent Crime Rate
Participation & Environment
22 Commuting by Transit, Bike, or Walking 23 Voter Turnout
Section A|Social Health Indicators
The following 23 key indicators measure different aspects of personal, family and community well-being.
population health trends mixed, decrease overall the TRENDS:
personal and family stability
financial stability trends
community safety improved overall
participation and environment trends mixed, decrease overall
A composite index provides an opportunity to gain an overall impression of the social health of a city. In addition, the indicators included represent some of the effects of the social trends discussed throughout this document. For example:
Life expectancy gives a basic indication of quality of life and population health.
Suicide rates may reflect the level of social cohesion in a community.
Child welfare caseloads may reflect levels of stress in families.
Crime rates are a basic indication of community safety.
Voter turnout may reflect the level of citizen participation in the community.
The values comprising the index are, of course, not an exhaustive list of social health indicators. However, they do help us to gain a general sense of how Edmonton’s overall social health is changing.
Combined with the social and economic indicators in Part 1, the index will help us to make informed judgments of the overall social health of Edmonton.
Why is the Social Health Index Important?
The 23 Social Health Indicators

PART 2|Edmonton Social Health Index Page|78
Population Health
[Data Table 44, page 90]
Life Expectancy
Average Percent Change 1993-2012: 1.1%
[Data Table 44, page 90] NOTE: Comparisons between 1993-1999 data and 2000-2006 data should be made with caution. Earlier data (obtained from the 2011 Edition of Tracking the Trends) is for the City of Edmonton, while 2000
Sexually Transmitted Infections
Average Percent Change 1993-2012: 17.0%
Category Summary
Average Percent Change 1993-2012: 3.9% Overall Decline
Life expectancy was 3.9 % higher in 2012 than it was in 1993.
The number of STI was 12.2% lower in 2012 than it was in 1993, but more than double what it was in 2000. Due to a change in how data was collected between 1999 and 2000 (see note), the 1993 base year has a relatively high STI count. It is clear that since 2000, STI rates have been increasing.

Section A|Social Health Indicators Page|79
Population Health, cont’d...
[Data Table 44, page 90]
The infant mortality rate was 18.9% higher in 2011 than it was in 1993. This is due to a relatively low infant mortality rate during the 1993 base year. Infant mortality rates have fluctuated over time; however, they have remained relatively stable since 2006.
[Data Table 44, page 90]
The percentage of babies born with low birth weight was 16.6% higher in 2011 than it was in 1993.
While the Social Health Index measures the average rate of change over 20 years, it is important to note recent trends such as the 0.74% drop in low birth weight rates between 2008 and 2011.
Low Birth Weight
Average Percent Change 1993-2012: 16.2%
Infant Mortality Rate
Average Percent Change 1993-2012: 17.5%

PART 2|Edmonton Social Health Index Page|80
NOTE: Figures are based on fiscal years - for example, 2005 represents the 2005/06 fiscal year. Region boundaries changed in 1998/99 and 2003/04, so comparisons before and after these changes must be made with some caution. Rates are based on population estimates of the region boundaries reported by Edmonton & Area Child & Family Services.
Personal & Family Stability
The teen birth rate was 58.9% lower in 2012 than it was in 1993.
The average number of monthly child intervention caseloads was 21.2% lower in 2011 than it was in 1993.
[Data Table 45, page 91]
[Data Table 45, page 91]
Category Summary
Average Percent Change 1993-2012: 36.8% Overall Increase
Teen Birth Rate
Average Percent Change 1993-2012: 69.6%
Child Intervention Caseloads
Average Percent Change 1993-2012: 0.2%

Section A|Social Health Indicators Page|81
Personal & Family Stability, cont’d...
The suicide rate was 28.3% lower in 2010 than it was in 1993.
The number of crisis support calls received by The Support Network was 54.5% lower in 2012 than it was in 1993.
The decline in crisis support calls may, in part, be a result of the Support Network’s launch of 211 Edmonton—which has gained a high profile—and its online Live Crisis Chat service, in 2004. The Support Network has observed that while the number of calls are decreasing, the proportion of high-risk (e.g. suicide, violence) and multiple-risk calls has increased.
[Data Table 45, page 91]
[Data Table 45, page 91]
NOTE: Data from 2001-2010 includes distress-related calls to the 211 call line (formerly the Information & Referral Line). The Support Network estimates that 10% to 15% of calls to 211 are crisis-related—we have assumed a 12.5% distress call rate to 211.
Suicide Rate
Average Percent Change 1993-2012: 32.6%
Crisis Support Services
Average Percent Change 1993-2012: 64.3%

PART 2|Edmonton Social Health Index Page|82
Personal & Family Stability, cont’d...
Divorced or Separated
Average Percent Change 1993-2012: 17.3%
[Data Table 45, page 91]
The percentage of persons divorced or separated was 48.4% lower in 2012 than it was in 1993.
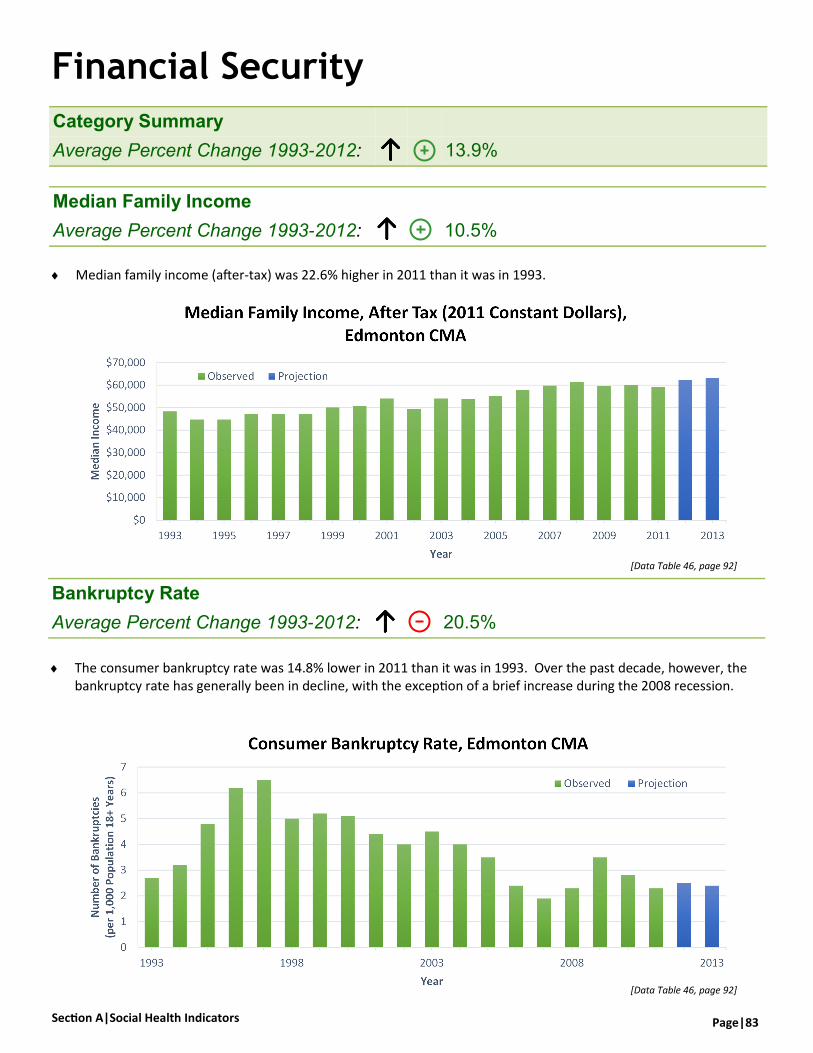
Section A|Social Health Indicators Page|83
Financial Security
Median family income (after-tax) was 22.6% higher in 2011 than it was in 1993.
[Data Table 46, page 92]
Median Family Income
Average Percent Change 1993-2012: 10.5%
Category Summary
Average Percent Change 1993-2012: 13.9%
[Data Table 46, page 92]
The consumer bankruptcy rate was 14.8% lower in 2011 than it was in 1993. Over the past decade, however, the bankruptcy rate has generally been in decline, with the exception of a brief increase during the 2008 recession.
Bankruptcy Rate
Average Percent Change 1993-2012: 20.5%
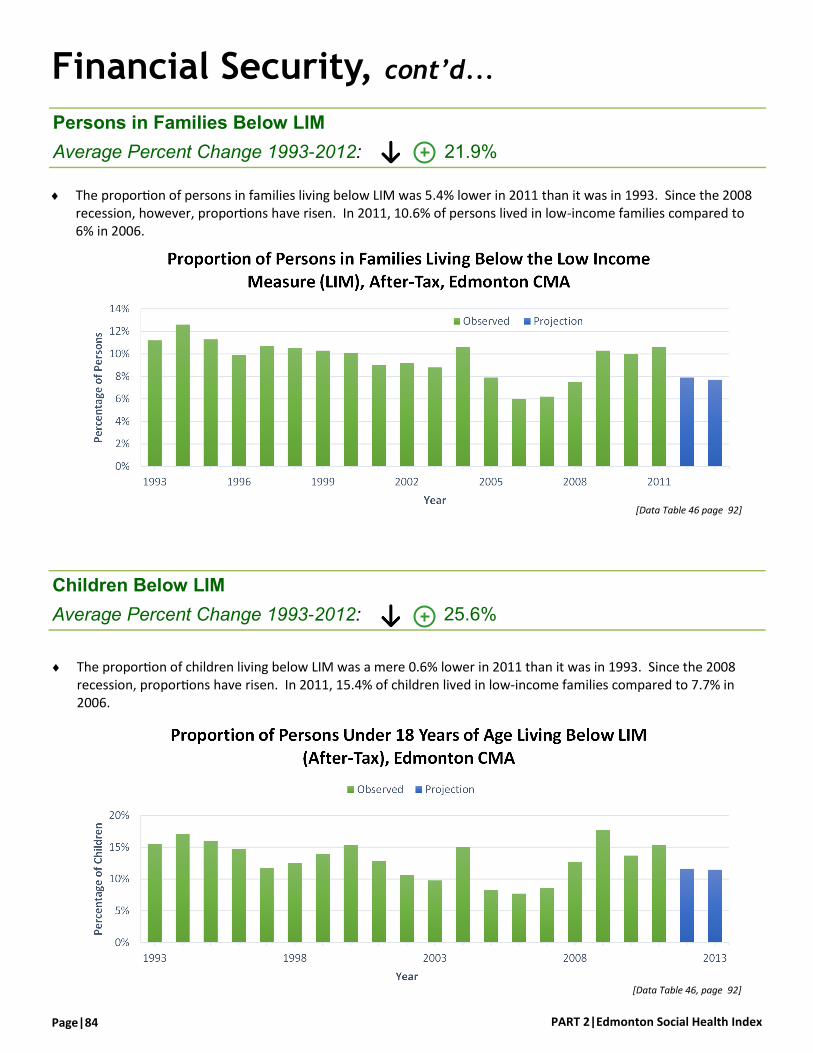
PART 2|Edmonton Social Health Index Page|84
Financial Security, cont’d...
The proportion of persons in families living below LIM was 5.4% lower in 2011 than it was in 1993. Since the 2008 recession, however, proportions have risen. In 2011, 10.6% of persons lived in low-income families compared to 6% in 2006.
[Data Table 46 page 92]
Persons in Families Below LIM
Average Percent Change 1993-2012: 21.9%
Children Below LIM
Average Percent Change 1993-2012: 25.6%
[Data Table 46, page 92]
The proportion of children living below LIM was a mere 0.6% lower in 2011 than it was in 1993. Since the 2008 recession, proportions have risen. In 2011, 15.4% of children lived in low-income families compared to 7.7% in 2006.
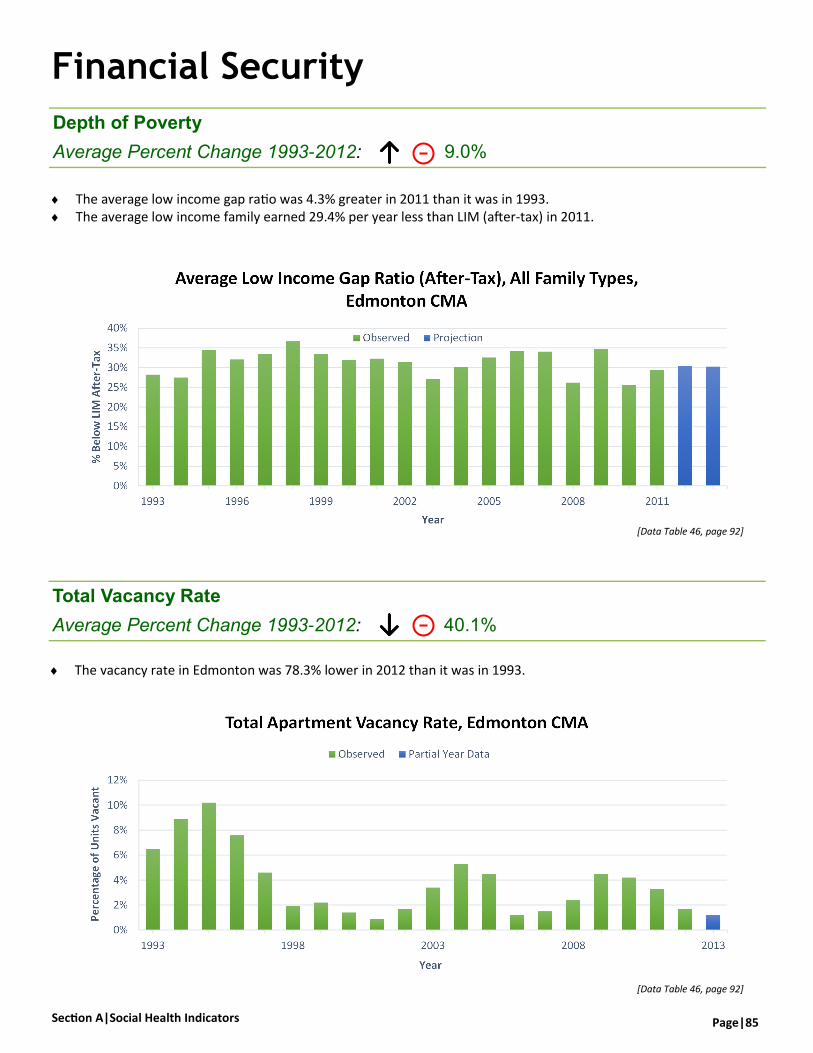
Section A|Social Health Indicators Page|85
Financial Security
The average low income gap ratio was 4.3% greater in 2011 than it was in 1993. The average low income family earned 29.4% per year less than LIM (after-tax) in 2011.
[Data Table 46, page 92]
[Data Table 46, page 92]
Depth of Poverty
Average Percent Change 1993-2012: 9.0%
The vacancy rate in Edmonton was 78.3% lower in 2012 than it was in 1993.
Total Vacancy Rate
Average Percent Change 1993-2012: 40.1%
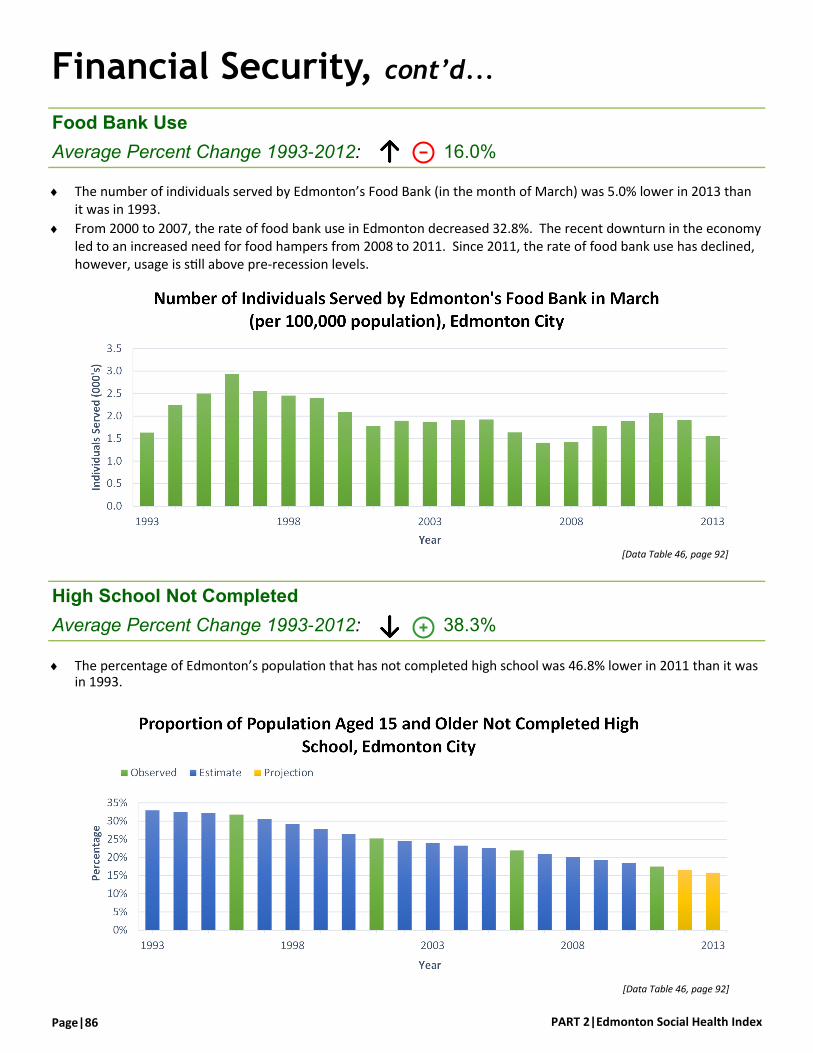
PART 2|Edmonton Social Health Index Page|86
Financial Security, cont’d...
[Data Table 46, page 92]
The percentage of Edmonton’s population that has not completed high school was 46.8% lower in 2011 than it was in 1993.
High School Not Completed
Average Percent Change 1993-2012: 38.3%
The number of individuals served by Edmonton’s Food Bank (in the month of March) was 5.0% lower in 2013 than it was in 1993.
From 2000 to 2007, the rate of food bank use in Edmonton decreased 32.8%. The recent downturn in the economy led to an increased need for food hampers from 2008 to 2011. Since 2011, the rate of food bank use has declined, however, usage is still above pre-recession levels.
[Data Table 46, page 92]
Food Bank Use
Average Percent Change 1993-2012: 16.0%
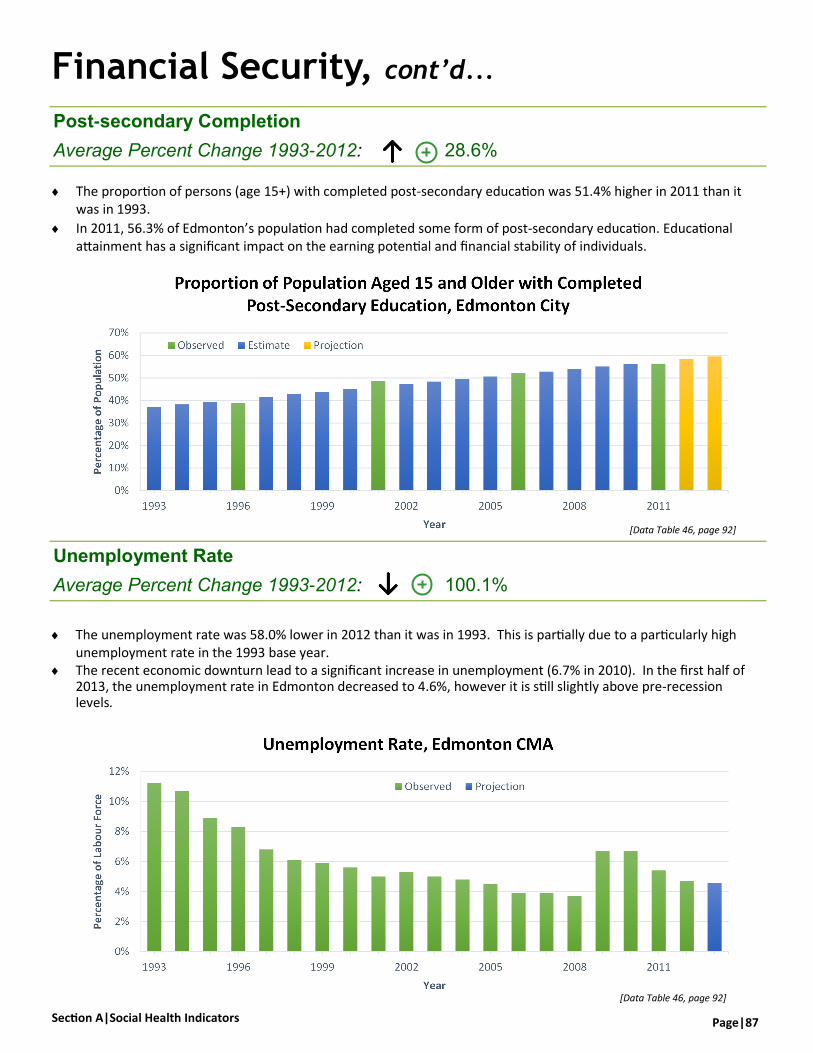
Section A|Social Health Indicators Page|87
Financial Security, cont’d...
[Data Table 46, page 92]
The unemployment rate was 58.0% lower in 2012 than it was in 1993. This is partially due to a particularly high unemployment rate in the 1993 base year.
The recent economic downturn lead to a significant increase in unemployment (6.7% in 2010). In the first half of 2013, the unemployment rate in Edmonton decreased to 4.6%, however it is still slightly above pre-recession levels.
Unemployment Rate
Average Percent Change 1993-2012: 100.1%
[Data Table 46, page 92]
The proportion of persons (age 15+) with completed post-secondary education was 51.4% higher in 2011 than it was in 1993.
In 2011, 56.3% of Edmonton’s population had completed some form of post-secondary education. Educational attainment has a significant impact on the earning potential and financial stability of individuals.
Post-secondary Completion
Average Percent Change 1993-2012: 28.6%

PART 2|Edmonton Social Health Index Page|88
Community Safety
[Data Table 47, page 93]
[Data Table 47, page 93]
Category Summary
Average Percent Change 1993-2012: 5.5% overall improvement
Property Crime
Average Percent Change 1993-2012: 7.9%
Violent Crime
Average Percent Change 1993-2012: 3.1%
The number of violent criminal code violations was 3.0% higher in 2012 than it was in 1993. However, violent crime rates have been slightly higher than average over the past 6 years.
The number of property crime violations was 41.0% lower in 2012 than it was in 1993. Property crime trends tend to vary in line with the demographic (age) composition of a community.
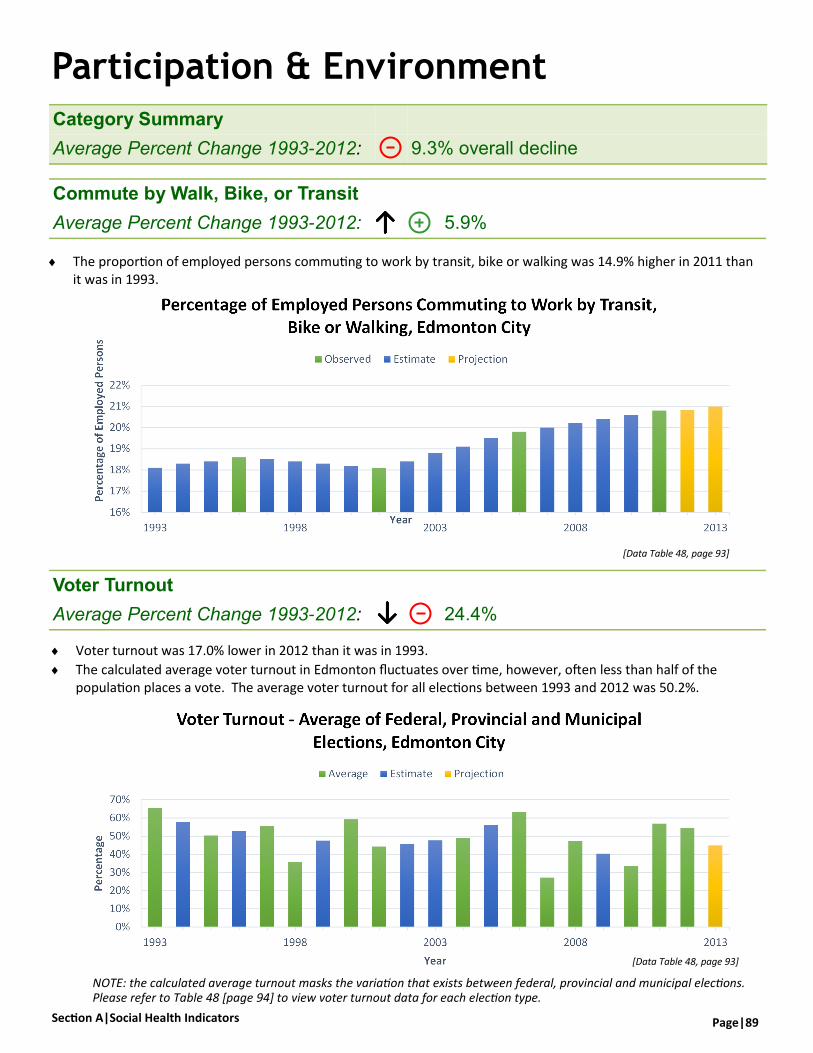
Section A|Social Health Indicators Page|89
Participation & Environment
[Data Table 48, page 93]
Voter turnout was 17.0% lower in 2012 than it was in 1993.
The calculated average voter turnout in Edmonton fluctuates over time, however, often less than half of the population places a vote. The average voter turnout for all elections between 1993 and 2012 was 50.2%.
[Data Table 48, page 93]
NOTE: the calculated average turnout masks the variation that exists between federal, provincial and municipal elections. Please refer to Table 48 [page 94] to view voter turnout data for each election type.
Category Summary
Average Percent Change 1993-2012: 9.3% overall decline
Commute by Walk, Bike, or Transit
Average Percent Change 1993-2012: 5.9%
Voter Turnout
Average Percent Change 1993-2012: 24.4%
The proportion of employed persons commuting to work by transit, bike or walking was 14.9% higher in 2011 than it was in 1993.
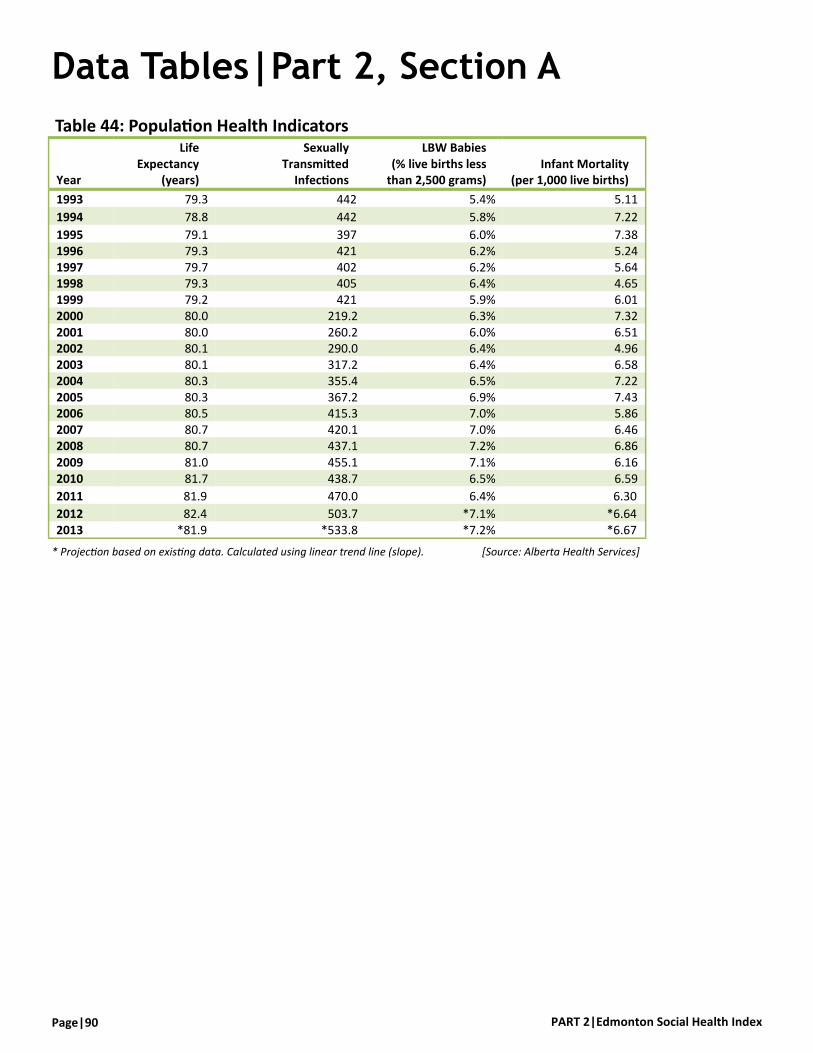
PART 2|Edmonton Social Health Index Page|90
Table 44: Population Health Indicators
Year
Life Expectancy
(years)
Sexually Transmitted
Infections
LBW Babies (% live births less
than 2,500 grams) Infant Mortality
(per 1,000 live births)
1993 79.3 442 5.4% 5.11
1994 78.8 442 5.8% 7.22
1995 79.1 397 6.0% 7.38 1996 79.3 421 6.2% 5.24 1997 79.7 402 6.2% 5.64 1998 79.3 405 6.4% 4.65 1999 79.2 421 5.9% 6.01 2000 80.0 219.2 6.3% 7.32 2001 80.0 260.2 6.0% 6.51 2002 80.1 290.0 6.4% 4.96 2003 80.1 317.2 6.4% 6.58 2004 80.3 355.4 6.5% 7.22 2005 80.3 367.2 6.9% 7.43 2006 80.5 415.3 7.0% 5.86 2007 80.7 420.1 7.0% 6.46 2008 80.7 437.1 7.2% 6.86 2009 81.0 455.1 7.1% 6.16 2010 81.7 438.7 6.5% 6.59
2011 81.9 470.0 6.4% 6.30
2012 82.4 503.7 *7.1% *6.64 2013 *81.9 *533.8 *7.2% *6.67
Data Tables|Part 2, Section A
* Projection based on existing data. Calculated using linear trend line (slope). [Source: Alberta Health Services]

Section A|Social Health Indicators Page|91
Table 45: Personal & Family Stability Indicators
Year
Teen Birth Rate (per 1,000 females aged 15-19 years)
Average Monthly Child & Family
Services Caseloads (per 100,000)
Suicide Rate (per 100,000)
Crisis Support Calls (per 100,000)
Divorce/Separation Rate
1993 31.4 433.33 18.5 5,128 ** 11.1%
1994 29.6 446.11 16.8 5,179 ** 11.4%
1995 28.1 509.86 16.1 4,625 ** 11.6%
1996 23.8 600.35 17.7 4,682 11.8%
1997 22.2 653.66 12.9 4,150 **11.4%
1998 23.1 672.86 15.5 3,537 **10.9%
1999 21.8 412.73 15.2 3,779 **10.5%
2000 19.6 446.10 13.5 3,528 **10.1%
2001 17.1 446.92 15.5 3,246 9.6%
2002 16.5 406.06 13.4 3,340 **9.6%
2003 17.1 468.20 13.0 3,134 **9.6%
2004 14.9 457.25 13.8 3,065 **9.6%
2005 16.5 401.30 13.1 3,032 **9.6%
2006 17.4 425.72 12.8 2,906 9.6%
2007 17.5 403.33 12.2 2,469 **9.2%
2008 16.8 370.44 13.7 2,324 **8.8%
2009 16.2 360.30 12.9 2,160 **8.5%
2010 15.4 365.60 13.2 2,322 **8.1%
2011 14.8 341.31 *11.8 2,312 7.8%
2012 12.9 *346.22 *11.5 2,333 5.7% 2013 *11.3 *335.47 *11.3 *1,719 *6.5%
[Sources: Alberta Children’s Services, Alberta Health Services, City of Edmonton, Edmonton Police Service &
The Support Network]
Data Tables|Part 2, Section A, cont’d...
* Projection based on existing data. Calculated using linear trend line (slope). ** Estimates. Calculated by dividing the difference between census years by the number of intervening years.
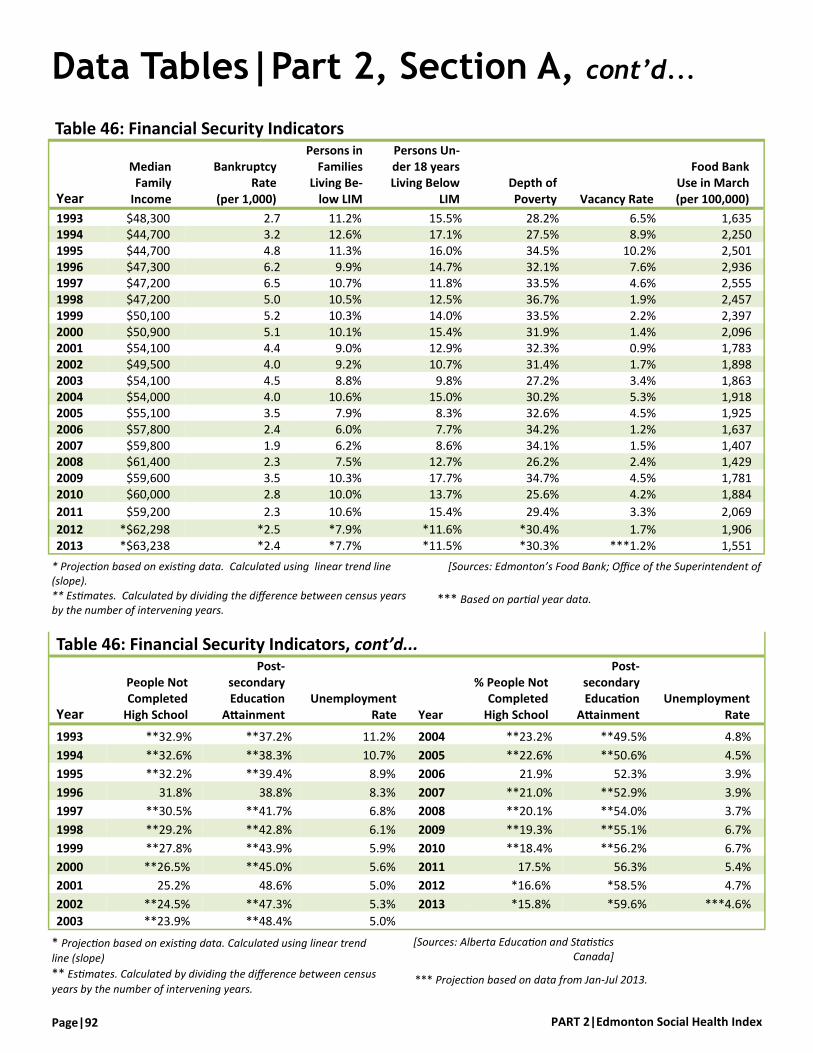
PART 2|Edmonton Social Health Index Page|92
Data Tables|Part 2, Section A, cont’d...
Table 46: Financial Security Indicators
Year
Persons in Families
Living Be-low LIM
Persons Un-der 18 years Living Below
LIM
Bankruptcy Rate
(per 1,000)
Median Family
Income Depth of Poverty Vacancy Rate
Food Bank Use in March (per 100,000)
1993 11.2% 15.5% 2.7 $48,300 28.2% 6.5% 1,635 1994 12.6% 17.1% 3.2 $44,700 27.5% 8.9% 2,250 1995 11.3% 16.0% 4.8 $44,700 34.5% 10.2% 2,501 1996 9.9% 14.7% 6.2 $47,300 32.1% 7.6% 2,936 1997 10.7% 11.8% 6.5 $47,200 33.5% 4.6% 2,555 1998 10.5% 12.5% 5.0 $47,200 36.7% 1.9% 2,457 1999 10.3% 14.0% 5.2 $50,100 33.5% 2.2% 2,397 2000 10.1% 15.4% 5.1 $50,900 31.9% 1.4% 2,096 2001 9.0% 12.9% 4.4 $54,100 32.3% 0.9% 1,783 2002 9.2% 10.7% 4.0 $49,500 31.4% 1.7% 1,898 2003 8.8% 9.8% 4.5 $54,100 27.2% 3.4% 1,863 2004 10.6% 15.0% 4.0 $54,000 30.2% 5.3% 1,918 2005 7.9% 8.3% 3.5 $55,100 32.6% 4.5% 1,925 2006 6.0% 7.7% 2.4 $57,800 34.2% 1.2% 1,637 2007 6.2% 8.6% 1.9 $59,800 34.1% 1.5% 1,407 2008 7.5% 12.7% 2.3 $61,400 26.2% 2.4% 1,429 2009 10.3% 17.7% 3.5 $59,600 34.7% 4.5% 1,781 2010 10.0% 13.7% 2.8 $60,000 25.6% 4.2% 1,884
2011 10.6% 15.4% 2.3 $59,200 29.4% 3.3% 2,069
2012 *7.9% *11.6% *2.5 *$62,298 *30.4% 1.7% 1,906 2013 *7.7% *11.5% *2.4 *$63,238 *30.3% ***1.2% 1,551
* Projection based on existing data. Calculated using linear trend line (slope). ** Estimates. Calculated by dividing the difference between census years by the number of intervening years.
[Sources: Edmonton’s Food Bank; Office of the Superintendent of
Table 46: Financial Security Indicators, cont’d...
Year
People Not Completed
High School Unemployment
Rate Year
% People Not Completed
High School Unemployment
Rate
Post-secondary Education
Attainment
Post-secondary Education
Attainment
1993 **32.9% 11.2% 2004 **23.2% 4.8% **37.2% **49.5%
1994 **32.6% 10.7% 2005 **22.6% 4.5% **38.3% **50.6%
1995 **32.2% 8.9% 2006 21.9% 3.9% **39.4% 52.3%
1996 31.8% 8.3% 2007 **21.0% 3.9% 38.8% **52.9%
1997 **30.5% 6.8% 2008 **20.1% 3.7% **41.7% **54.0%
1998 **29.2% 6.1% 2009 **19.3% 6.7% **42.8% **55.1%
1999 **27.8% 5.9% 2010 **18.4% 6.7% **43.9% **56.2%
2000 **26.5% 5.6% 2011 17.5% 5.4% **45.0% 56.3%
2001 25.2% 5.0% 2012 *16.6% 4.7% 48.6% *58.5%
2002 **24.5% 5.3% 2013 *15.8% ***4.6% **47.3% *59.6%
2003 **23.9% 5.0% **48.4%
* Projection based on existing data. Calculated using linear trend
line (slope)
** Estimates. Calculated by dividing the difference between census
years by the number of intervening years.
[Sources: Alberta Education and Statistics Canada]
*** Based on partial year data.
*** Projection based on data from Jan-Jul 2013.
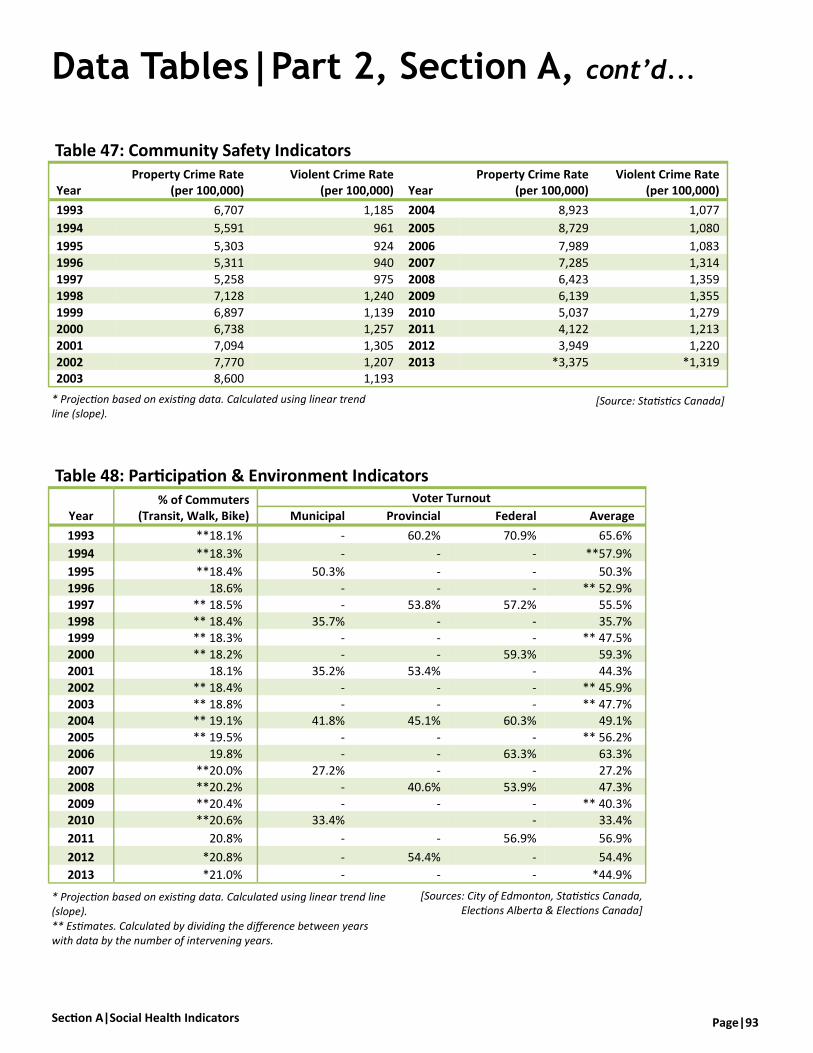
Section A|Social Health Indicators Page|93
Table 48: Participation & Environment Indicators
Year % of Commuters
(Transit, Walk, Bike)
Voter Turnout
Municipal Provincial Federal Average
1993 **18.1% - 60.2% 70.9% 65.6%
1994 **18.3% - - - **57.9%
1995 **18.4% 50.3% - - 50.3%
1996 18.6% - - - ** 52.9%
1997 ** 18.5% - 53.8% 57.2% 55.5%
1998 ** 18.4% 35.7% - - 35.7% 1999 ** 18.3% - - - ** 47.5%
2000 ** 18.2% - - 59.3% 59.3%
2001 18.1% 35.2% 53.4% - 44.3%
2002 ** 18.4% - - - ** 45.9%
2003 ** 18.8% - - - ** 47.7% 2004 ** 19.1% 41.8% 45.1% 60.3% 49.1%
2005 ** 19.5% - - - ** 56.2%
2006 19.8% - - 63.3% 63.3%
2007 **20.0% 27.2% - - 27.2%
2008 **20.2% - 40.6% 53.9% 47.3%
2009 **20.4% - - - ** 40.3% 2010 **20.6% 33.4% - 33.4%
2011 20.8% - - 56.9% 56.9%
2012 *20.8% - 54.4% - 54.4%
2013 *21.0% - - - *44.9%
Data Tables|Part 2, Section A, cont’d...
[Sources: City of Edmonton, Statistics Canada, Elections Alberta & Elections Canada]
* Projection based on existing data. Calculated using linear trend line (slope). ** Estimates. Calculated by dividing the difference between years with data by the number of intervening years.
Table 47: Community Safety Indicators
Year Property Crime Rate
(per 100,000) Violent Crime Rate
(per 100,000) Year Property Crime Rate
(per 100,000) Violent Crime Rate
(per 100,000)
1993 6,707 1,185 2004 8,923 1,077
1994 5,591 961 2005 8,729 1,080
1995 5,303 924 2006 7,989 1,083
1996 5,311 940 2007 7,285 1,314
1997 5,258 975 2008 6,423 1,359
1998 7,128 1,240 2009 6,139 1,355
1999 6,897 1,139 2010 5,037 1,279 2000 6,738 1,257 2011 4,122 1,213
2001 7,094 1,305 2012 3,949 1,220
2002 7,770 1,207 2013 *3,375 *1,319 2003 8,600 1,193
* Projection based on existing data. Calculated using linear trend line (slope).
[Source: Statistics Canada]
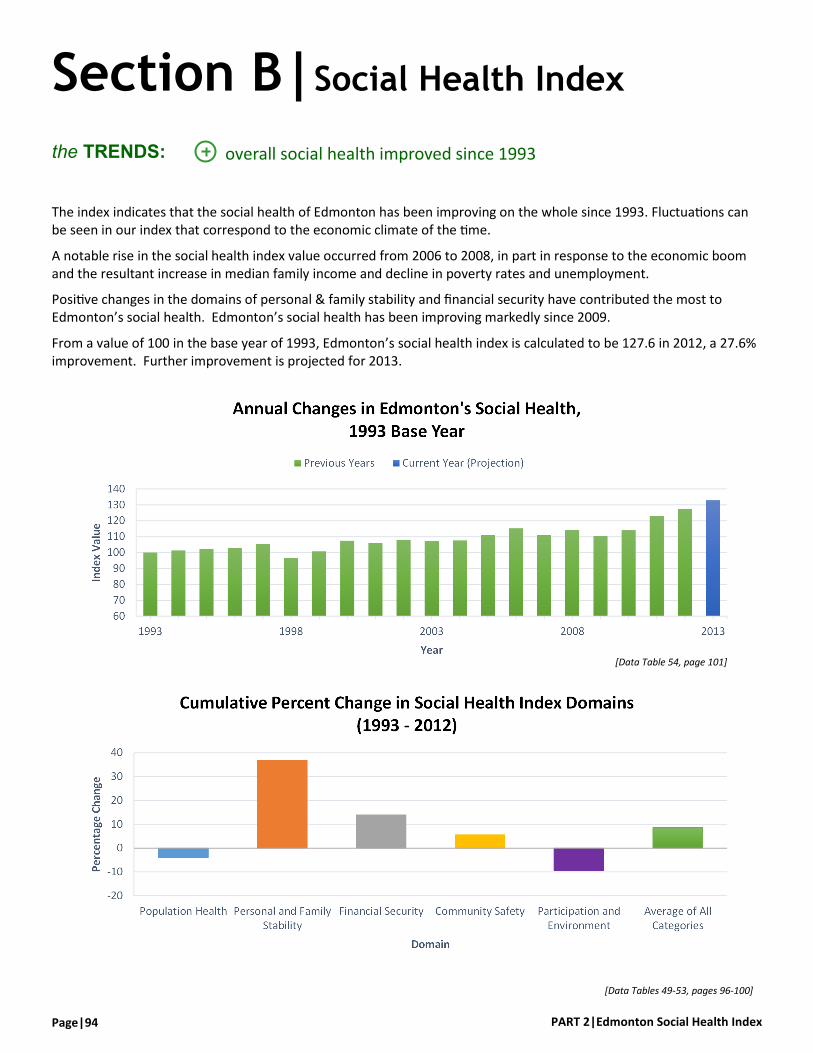
PART 2|Edmonton Social Health Index Page|94
Section B|Social Health Index
the TRENDS: overall social health improved since 1993
[Data Tables 49-53, pages 96-100]
The index indicates that the social health of Edmonton has been improving on the whole since 1993. Fluctuations can be seen in our index that correspond to the economic climate of the time.
A notable rise in the social health index value occurred from 2006 to 2008, in part in response to the economic boom and the resultant increase in median family income and decline in poverty rates and unemployment.
Positive changes in the domains of personal & family stability and financial security have contributed the most to Edmonton’s social health. Edmonton’s social health has been improving markedly since 2009.
From a value of 100 in the base year of 1993, Edmonton’s social health index is calculated to be 127.6 in 2012, a 27.6% improvement. Further improvement is projected for 2013.
[Data Table 54, page 101]

Page|95 Section B|Social Health Index
Section B|Social Health Index
[Data Table 54, page 101]
GDP per capita is a measure that is often used to reflect the progress of a society [Canadian Index of Wellbeing, 2011]. The problem with depending too heavily on this measure, however, is that it does not take into account the complexity of social wellbeing. The social health index provides a well-rounded picture of how Edmontonians are doing beyond their financial success. As the graph shows, Edmonton’s social health index value is more variable and consistently lower than its GDP. This is in keeping with the national trends.
In the graph below, numbers greater than 100 indicate an improvement in wellbeing whereas numbers below 100 represent a decline in wellbeing.
*2013 values based on projections and partial-year data
the TRENDS: economy, personal and family stability improved most since 1993
participation and environment, population health lagging
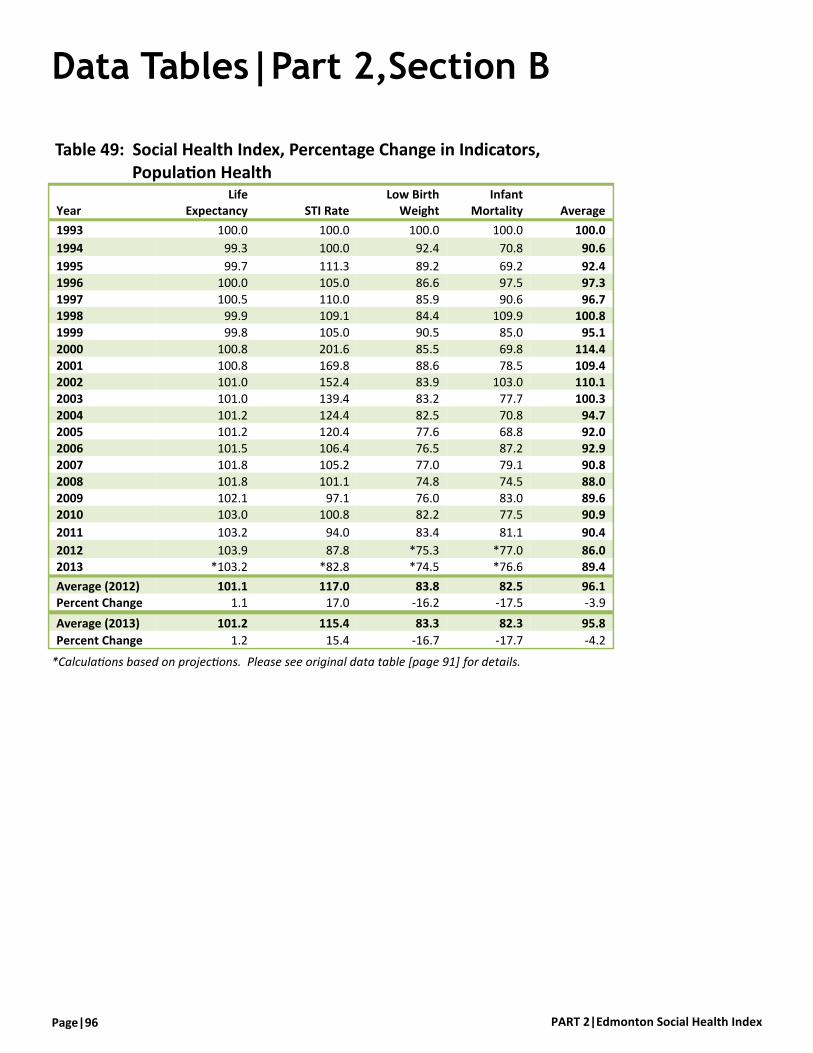
PART 2|Edmonton Social Health Index Page|96
Table 49: Social Health Index, Percentage Change in Indicators, Population Health
Year Life
Expectancy STI Rate Low Birth
Weight Infant
Mortality Average
1993 100.0 100.0 100.0 100.0 100.0
1994 99.3 100.0 92.4 70.8 90.6
1995 99.7 111.3 89.2 69.2 92.4
1996 100.0 105.0 86.6 97.5 97.3
1997 100.5 110.0 85.9 90.6 96.7 1998 99.9 109.1 84.4 109.9 100.8
1999 99.8 105.0 90.5 85.0 95.1
2000 100.8 201.6 85.5 69.8 114.4
2001 100.8 169.8 88.6 78.5 109.4 2002 101.0 152.4 83.9 103.0 110.1
2003 101.0 139.4 83.2 77.7 100.3
2004 101.2 124.4 82.5 70.8 94.7
2005 101.2 120.4 77.6 68.8 92.0 2006 101.5 106.4 76.5 87.2 92.9
2007 101.8 105.2 77.0 79.1 90.8
2008 101.8 101.1 74.8 74.5 88.0
2009 102.1 97.1 76.0 83.0 89.6 2010 103.0 100.8 82.2 77.5 90.9
2011 103.2 94.0 83.4 81.1 90.4
2012 103.9 87.8 *75.3 *77.0 86.0 2013 *103.2 *82.8 *74.5 *76.6 89.4
Average (2012) 101.1 117.0 83.8 82.5 96.1 Percent Change 1.1 17.0 -16.2 -17.5 -3.9
Average (2013) 101.2 115.4 83.3 82.3 95.8
Percent Change 1.2 15.4 -16.7 -17.7 -4.2
*Calculations based on projections. Please see original data table [page 91] for details.
Data Tables|Part 2,Section B
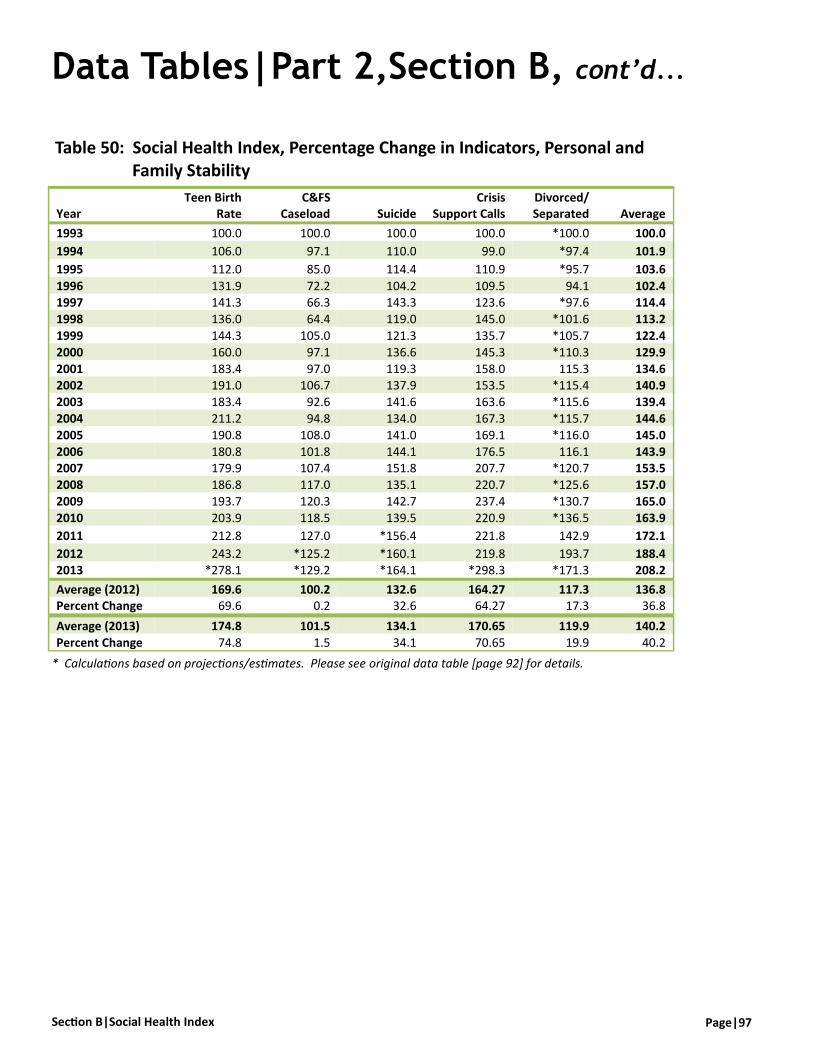
Page|97 Section B|Social Health Index
Table 50: Social Health Index, Percentage Change in Indicators, Personal and Family Stability
Year Teen Birth
Rate C&FS
Caseload Suicide Crisis
Support Calls Divorced/Separated Average
1993 100.0 100.0 100.0 100.0 *100.0 100.0
1994 106.0 97.1 110.0 99.0 *97.4 101.9
1995 112.0 85.0 114.4 110.9 *95.7 103.6
1996 131.9 72.2 104.2 109.5 94.1 102.4 1997 141.3 66.3 143.3 123.6 *97.6 114.4
1998 136.0 64.4 119.0 145.0 *101.6 113.2
1999 144.3 105.0 121.3 135.7 *105.7 122.4
2000 160.0 97.1 136.6 145.3 *110.3 129.9
2001 183.4 97.0 119.3 158.0 115.3 134.6 2002 191.0 106.7 137.9 153.5 *115.4 140.9
2003 183.4 92.6 141.6 163.6 *115.6 139.4
2004 211.2 94.8 134.0 167.3 *115.7 144.6
2005 190.8 108.0 141.0 169.1 *116.0 145.0
2006 180.8 101.8 144.1 176.5 116.1 143.9 2007 179.9 107.4 151.8 207.7 *120.7 153.5
2008 186.8 117.0 135.1 220.7 *125.6 157.0
2009 193.7 120.3 142.7 237.4 *130.7 165.0
2010 203.9 118.5 139.5 220.9 *136.5 163.9
2011 212.8 127.0 *156.4 221.8 142.9 172.1
2012 243.2 *125.2 *160.1 219.8 193.7 188.4 2013 *278.1 *129.2 *164.1 *298.3 *171.3 208.2
Average (2012) 169.6 100.2 132.6 164.27 117.3 136.8 Percent Change 69.6 0.2 32.6 64.27 17.3 36.8
Average (2013) 174.8 101.5 134.1 170.65 119.9 140.2
Percent Change 74.8 1.5 34.1 70.65 19.9 40.2
Data Tables|Part 2,Section B, cont’d...
* Calculations based on projections/estimates. Please see original data table [page 92] for details.

PART 2|Edmonton Social Health Index Page|98
Table 51: Social Health Index, Percentage Change in Indicators, Financial Security
Year Median Income Bankruptcy
All Persons Below LIM
Children Below LIM
Depth of Poverty
Vacancy Rate Food Bank
1993 100.0 100.0 100.0 100.0 100.0 100.0 100.0
1994 92.5 84.4 88.9 90.6 102.5 136.9 72.7
1995 92.5 56.3 99.1 96.9 81.7 156.9 65.4
1996 97.9 43.5 113.1 105.4 87.9 116.9 55.7 1997 97.7 41.5 104.7 131.4 84.2 70.8 64.0
1998 97.7 54.0 106.7 124.0 76.8 29.2 66.6
1999 103.7 51.9 108.7 110.7 84.2 33.8 68.2
2000 105.4 52.9 110.9 100.6 88.4 21.5 78.0
2001 112.0 61.4 124.4 120.2 87.3 13.8 91.7
2002 102.5 67.5 121.7 144.9 89.8 26.2 86.2 2003 112.0 60.0 127.3 158.2 103.7 52.3 87.8
2004 111.8 67.5 105.7 103.3 93.4 81.5 85.3
2005 114.1 77.1 141.8 186.7 86.5 69.2 85.0
2006 119.7 112.5 186.7 201.3 82.5 18.5 99.9
2007 123.8 142.1 180.6 180.2 82.7 23.1 116.2 2008 127.1 117.4 149.3 122.0 107.6 36.9 114.5
2009 123.4 77.1 108.7 87.6 81.3 69.2 91.8
2010 124.2 96.4 112.0 113.1 110.2 64.6 86.8
2011 122.6 117.4 105.7 100.6 95.9 50.8 79.0
2012 *129.0 *108.0 *141.8 *133.6 *92.9 26.2 85.8 2013 *130.9 *112.5 *145.5 *134.8 *93.2 *18.5 105.5
Average (2012) 110.5 79.5 121.9 125.6 91.0 59.9 84.0 Percent Change 10.5 -20.5 21.9 25.6 -9.0 -40.1 -16.0
Average (2013) 111.5 81.0 123.0 126.0 91.1 57.9 85.0
Percent Change 11.5 -19.0 23.0 26.0 -8.9 -42.1 -15.0
Data Tables|Part 2,Section B, cont’d...
* Calculations based on projections/estimates. Please see original data table [page 93] for details.

Page|99 Section B|Social Health Index
Data Tables|Part 2,Section B, cont’d...
Table 51 cont’d...
Year Post-secondary
Completion Unemployment Average Not Completed
High School
1993 *100.0 100.0 100.0 *100.0
1994 *103.0 104.7 97.7 *100.9
1995 *106.0 125.8 98.3 *102.2
1996 104.3 134.9 96.3 103.5
1997 *112.0 164.7 97.9 *107.9
1998 *115.1 183.6 96.6 *112.7
1999 *118.1 189.8 98.8 *118.3
2000 *121.1 200.0 100.3 *124.2 2001 130.7 224.0 109.6 130.6
2002 *127.1 211.3 111.1 *134.3
2003 *130.1 224.0 119.3 *137.7
2004 *133.1 233.3 115.7 *141.8
2005 *136.1 248.9 129.1 *145.6 2006 140.6 287.2 139.9 150.2
2007 *142.2 287.2 143.5 *156.7
2008 *145.2 302.7 138.6 *163.7
2009 *148.2 167.2 112.5 *170.5
2010 *151.2 167.2 120.5 *178.8
2011 151.4 207.4 121.9 188.0
2012 *157.2 238.3 131.1 *198.2 2013 *160.2 *245.8 135.5 *208.2
Average (2012) 138.3 128.6 200.1 115.0 Percent Change 38.3 28.6 100.1 15.0
Average (2013) 130.1 202.3 113.9 141.6
Percent Change 30.1 102.3 13.9 41.6
* Calculations based on projections/estimates. Please see original data table [page 93] for details.

PART 2|Edmonton Social Health Index Page|100
Table 52: Social Health Index, Percentage Change in Indicators, Community Safety
Year Property
Crime Violent
Crime Average
1993 100.0 100.0 100.0
1994 120.0 123.2 121.6
1995 126.5 128.2 127.3
1996 126.3 126.0 126.2
1997 127.6 121.5 124.5 1998 94.1 95.5 94.8
1999 97.2 104.0 100.6
2000 99.5 94.2 96.9
2001 94.5 90.8 92.7
2002 86.3 98.2 92.2 2003 78.0 99.3 88.7
2004 75.2 110.0 92.6
2005 76.8 109.7 93.3
2006 83.9 109.3 96.6
2007 92.1 90.1 91.1 2008 104.4 87.2 95.8
2009 109.3 87.4 98.3
2010 133.1 92.6 112.9
2011 162.7 97.7 130.2
2012 169.8 97.1 133.5 2013 *198.7 *89.8 144.5
Average (2012) 107.9 103.1 105.5 Percent Change 7.9 3.1 5.5
Average (2013) 112.2 102.5 107.3 Percent Change 12.2 2.5 7.3
Data Tables|Part 2,Section B, cont’d...
* Calculations based on projections/estimates. Please see original data table [page 94] for details.
Table 53: Social Health Index, Percentage Change in Indicators, Participation & Environment
Year Commuters Voter
Turnout Average
1993 *100.0 100.0 100.0
1994 *101.1 *88.4 94.7
1995 *101.7 76.7 89.2
1996 102.8 *80.7 91.7 1997 *102.2 84.7 93.4
1998 *101.7 54.5 78.1
1999 *101.1 *72.5 86.8
2000 *100.6 90.5 95.5
2001 100.0 67.6 83.8
2002 *101.7 *70.0 85.8 2003 *103.9 *72.8 88.3
2004 *105.5 74.8 90.2
2005 *107.7 *85.7 96.7
2006 109.4 96.6 103.0
2007 *110.5 41.5 76.0 2008 *111.6 72.1 91.8
2009 *112.7 *61.5 87.1
2010 *113.8 50.9 82.4
2011 114.9 86.8 100.9
2012 *114.9 83.0 98.9 2013 *116.0 *68.5 92.3
Average (2012) 105.9 75.6 90.7 Percent Change 5.9 -24.8 -9.3
Average (2013) 106.4 75.2 90.8 Percent Change 6.4 -24.8 -9.2
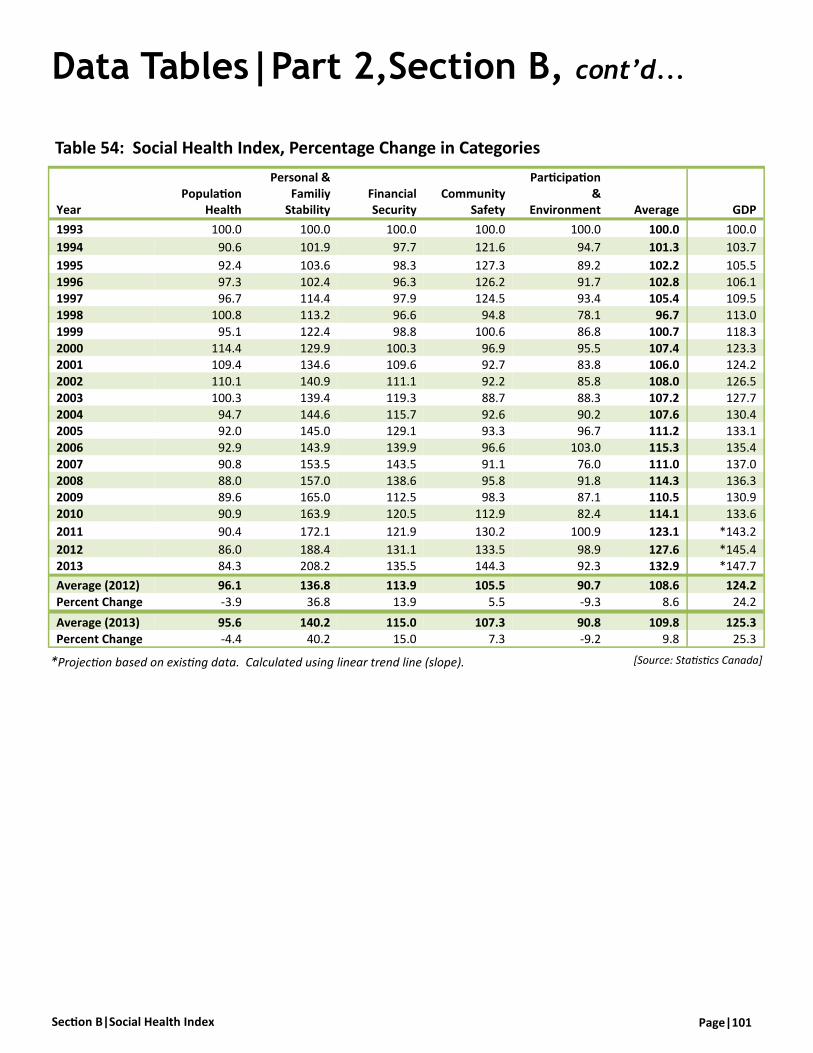
Page|101 Section B|Social Health Index
Data Tables|Part 2,Section B, cont’d...
*Projection based on existing data. Calculated using linear trend line (slope).
Table 54: Social Health Index, Percentage Change in Categories
Year Population
Health
Personal & Familiy
Stability Financial Security
Community Safety
Participation &
Environment Average GDP
1993 100.0 100.0 100.0 100.0 100.0 100.0 100.0
1994 90.6 101.9 97.7 121.6 94.7 101.3 103.7
1995 92.4 103.6 98.3 127.3 89.2 102.2 105.5
1996 97.3 102.4 96.3 126.2 91.7 102.8 106.1 1997 96.7 114.4 97.9 124.5 93.4 105.4 109.5
1998 100.8 113.2 96.6 94.8 78.1 96.7 113.0
1999 95.1 122.4 98.8 100.6 86.8 100.7 118.3
2000 114.4 129.9 100.3 96.9 95.5 107.4 123.3 2001 109.4 134.6 109.6 92.7 83.8 106.0 124.2
2002 110.1 140.9 111.1 92.2 85.8 108.0 126.5
2003 100.3 139.4 119.3 88.7 88.3 107.2 127.7
2004 94.7 144.6 115.7 92.6 90.2 107.6 130.4 2005 92.0 145.0 129.1 93.3 96.7 111.2 133.1
2006 92.9 143.9 139.9 96.6 103.0 115.3 135.4
2007 90.8 153.5 143.5 91.1 76.0 111.0 137.0
2008 88.0 157.0 138.6 95.8 91.8 114.3 136.3 2009 89.6 165.0 112.5 98.3 87.1 110.5 130.9
2010 90.9 163.9 120.5 112.9 82.4 114.1 133.6
2011 90.4 172.1 121.9 130.2 100.9 123.1 *143.2
2012 86.0 188.4 131.1 133.5 98.9 127.6 *145.4 2013 84.3 208.2 135.5 144.3 92.3 132.9 *147.7
Average (2012) 96.1 136.8 113.9 105.5 90.7 108.6 124.2
Percent Change -3.9 36.8 13.9 5.5 -9.3 8.6 24.2
Average (2013) 95.6 140.2 115.0 107.3 90.8 109.8 125.3 Percent Change -4.4 40.2 15.0 7.3 -9.2 9.8 25.3
[Source: Statistics Canada]
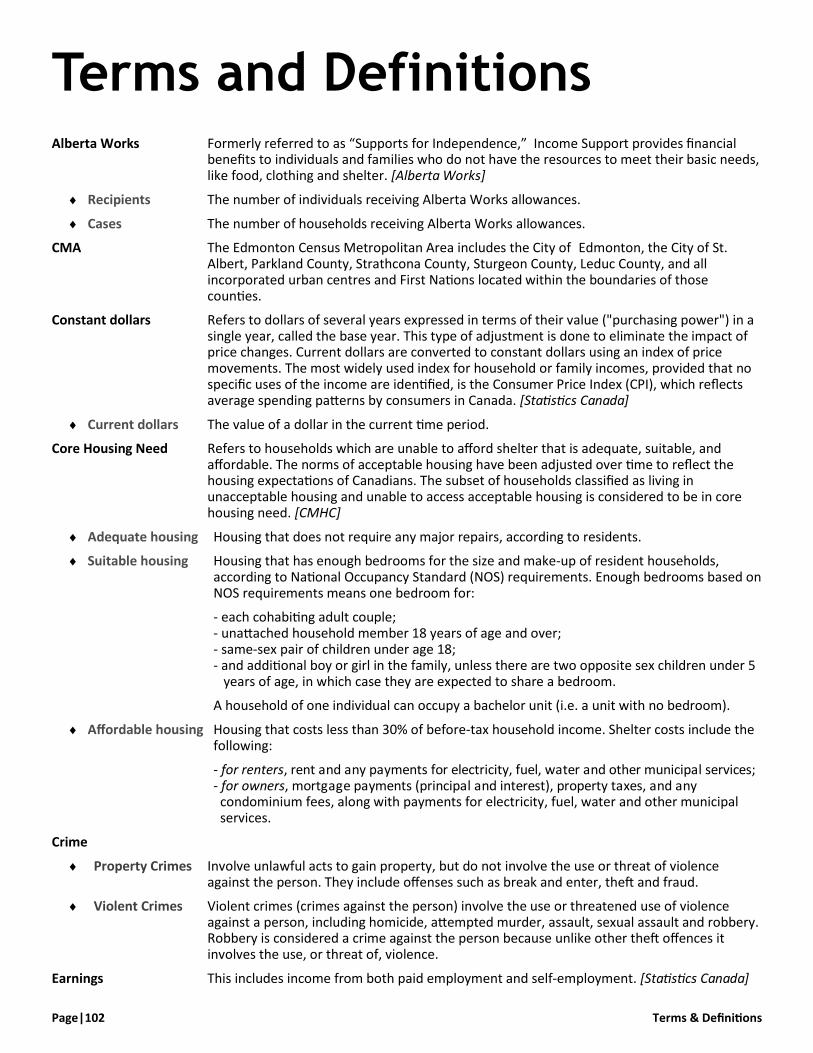
Terms & Definitions Page|102
Alberta Works Formerly referred to as “Supports for Independence,” Income Support provides financial benefits to individuals and families who do not have the resources to meet their basic needs, like food, clothing and shelter. [Alberta Works]
Recipients The number of individuals receiving Alberta Works allowances.
Cases The number of households receiving Alberta Works allowances.
CMA The Edmonton Census Metropolitan Area includes the City of Edmonton, the City of St. Albert, Parkland County, Strathcona County, Sturgeon County, Leduc County, and all incorporated urban centres and First Nations located within the boundaries of those counties.
Constant dollars Refers to dollars of several years expressed in terms of their value ("purchasing power") in a single year, called the base year. This type of adjustment is done to eliminate the impact of price changes. Current dollars are converted to constant dollars using an index of price movements. The most widely used index for household or family incomes, provided that no specific uses of the income are identified, is the Consumer Price Index (CPI), which reflects average spending patterns by consumers in Canada. [Statistics Canada]
Current dollars The value of a dollar in the current time period.
Core Housing Need Refers to households which are unable to afford shelter that is adequate, suitable, and affordable. The norms of acceptable housing have been adjusted over time to reflect the housing expectations of Canadians. The subset of households classified as living in unacceptable housing and unable to access acceptable housing is considered to be in core housing need. [CMHC]
Adequate housing Housing that does not require any major repairs, according to residents.
Suitable housing Housing that has enough bedrooms for the size and make-up of resident households, according to National Occupancy Standard (NOS) requirements. Enough bedrooms based on NOS requirements means one bedroom for:
- each cohabiting adult couple; - unattached household member 18 years of age and over; - same-sex pair of children under age 18; - and additional boy or girl in the family, unless there are two opposite sex children under 5 years of age, in which case they are expected to share a bedroom.
A household of one individual can occupy a bachelor unit (i.e. a unit with no bedroom).
Affordable housing Housing that costs less than 30% of before-tax household income. Shelter costs include the following:
- for renters, rent and any payments for electricity, fuel, water and other municipal services; - for owners, mortgage payments (principal and interest), property taxes, and any condominium fees, along with payments for electricity, fuel, water and other municipal services.
Crime
Property Crimes Involve unlawful acts to gain property, but do not involve the use or threat of violence against the person. They include offenses such as break and enter, theft and fraud.
Violent Crimes Violent crimes (crimes against the person) involve the use or threatened use of violence against a person, including homicide, attempted murder, assault, sexual assault and robbery. Robbery is considered a crime against the person because unlike other theft offences it involves the use, or threat of, violence.
Earnings This includes income from both paid employment and self-employment. [Statistics Canada]
Terms and Definitions
Page|103 Terms & Definitions
Paid Employment These are gross earnings from all jobs held as an employee, before payroll deductions such as income taxes, employment insurance contributions or pension plan contributions, etc. Wages and salaries include the earnings of owners of incorporated businesses, although some amounts may instead be reported as investment income. Commission income received by salespersons as well as occasional earnings for baby-sitting, for delivering papers, for cleaning, etc. are included. Overtime pay is included. Military personnel living in barracks are not part of the target population in the Survey of Labour and Income Dynamics (SLID).
Self-employment This is net self-employment income after deduction of expenses. Negative amounts (losses) are accepted. It includes income received from self-employment, in partnership in an unincorporated business, or in independent professional practice. Income from roomers and boarders (excluding that received from relatives) is included. Note that because of the various inclusions, receipt of self-employment income does not necessarily mean the person held a job.
Earnings Ratio, Female-to-Male Represents the value of average earnings of females relative to males, expressed as a
percentage. For example, a ratio of 78% means that females earn, on average, $78.00 for every $100.00 earned by males in the given year.
Ethnic Origin (2006 Census)
Ethnic Origin groupings differ slightly between the 2006 Census and 2011 National Household Survey. Visit the Statistics Canada website for a listing of ethnic origin groupings in the 2006 Census.
Ethnic Origin (2011—National Household Survey)
Refers to the ethnic or cultural origins of the respondent's ancestors. An ancestor is someone from whom a person is descended and is usually more distant than a grandparent. In the NHS, respondents are asked to specify as many ethnic origins as applicable and up to six ethnic origins are retained. Ethnic origin refers to a person's 'roots' and should not be confused with his or her citizenship, nationality, language or place of birth. [Statistics Canada] . Note: n.i.e = not included elsewhere.
North American Aboriginal: Inuit, Métis, First Nations (North American Indian).
Other North American: Acadian, American, Canadian, Newfoundlander, New Brunswicker, Nova Scotian, Ontarian, Quebecois, and other North American Origins.
Caribbean: Antiguan, Bahamian, Barbadian, Bermudan, Carib, Cuban, Dominican, Grenadian, Haitian, Jamaican, Kittitian/Nevsian, Martinican, Montserratian, Puerto Rican, St. Lucian, Trinidadian/Tobagonian, Vincentian/Grenadinian, West Indian, and Caribbean, n.i.e.
Latin, Central &South American: Aboriginal from Central/South America (except Maya), Argentinian, Belizean, Bolivian, Brazilian, Chilean, Colombian, Costa Rican, Ecuadorian, Guatemalan, Guyanese, Hispanic, Honduran, Maya, Mexican, Nicaraguan, Panamanian, Paraguayan, Peruvian, Salvadorean, Uruguayan, Venezuelan, Latin, Central or South American, n.i.e.
European
British Isles: Channel Islander, Cornish, English, Irish, Manx, Scottish, Welsh, and British Isles, n.i.e (not included elsewhere).
French: Alsatian, Breton and French.
Western European: Austrian, Belgian, Dutch, Flemish, Frisian, German, Luxembourger, Swiss, Western European, n.i.e.
Northern European: Finnish, Danish, Icelandic, Norwegian, Swedish, Northern European, n.i.e.
Eastern European: Estonian, Latvian, Lithuanian, Byelorussian, Bulgarian, Czech, Slovak, Czechoslovakian, Hungarian, Moldovan, Polish, Romanian, Russian, Ukrainian, Eastern European n.i.e.
Southern European: Albanian, Bosnian, Croatian, Cypriot, Greek, Italian, Kosovar, Macedonian, Maltese, Montenegrin, Portuguese, Serbian, Sicilian, Slovenian, Spanish, Yugoslav, Southern European Origins, `n.i.e.),
Other European: Basque, Roma (Gypsy), Jewish, Slavic, Other European Origins, n.i.e.).
African
Central and West African: Akan, Angolan, Ashanti, Beninese, Burkinabe, Cameroonian, Chadian, Congolese, Gabonese, Gambian, Ghanaian, Guinean, Ibo, Ivorian, Liberian, Malian, Nigerian, Peulh, Senegalese, Sierra Leonean, Togolese, Yoruba, Central and West African, n.i.e.
North African: Algerian, Beber, Coptic, Dinka, Egyptian, Libyan, Maure, Moroccan, Sudanese, Tunisian, North African, n.i.e.
Terms & Definitions Page|104
Southern and East African: Afrikaner, Amhara, Bantu, Burundian, Eritrean, Ethiopian, Harari, Kenyan, Malagasy, Mauritian, Oromo, Rwandan, Seychellois, Somali, South African, Tanzanian, Tigrian, Ugandan, Zambian, Zimbabwean, Zulu, Southern and East African, n.i.e.
Other African: Black, Other African, n.i.e.
Asian
West Central Asian and Middle Eastern: Afghan, Arab, Armenian, Assyrian, Azerbaijani, Georgian, Iranian, Iraqi, Israeli, Jordanian, Kazakh, Kurd, Kuwaiti, Lebanese, Palestinian, Pashtun, Saudi Arabian, Syrian, Tajik, Tatar, Turk, Uighur, Uzbek, Yemeni, West Central Asian and Middle Eastern, n.i.e.
South Asian: Bangladeshi, Bengali, East Indian, Goan, Gujarati, Kashmiri, Nepali, Pakistani, Punjabi, Sinhalese, Sri Lankan, Tamil, South East Asian, n.i.e.
East and Southeast Asian: Burmese, Cambodian (Khmer), Chinese, Filipino, Hmong, Indonesian, Japanese, Korean, Laotian, Malaysian, Mongolian, Singaporean, Taiwanese, Thai, Tibetan, Vietnamese, East and Southeast Asian, n.i.e.
Other Asian: Other Asian n.i.e.
Oceania Australian New Zealander
Pacific Islands: Fijian, Hawaiian, Maori, Polynesian, Samoan, Pacific Islands, n.i.e.
Family Type, Economic Refers to either economic families or unattached individuals. [Statistics Canada]
Economic Family A group of two or more persons who live in the same dwelling and are related to each other by blood, marriage, common law or adoption.
Unattached Individual A person living either alone or with others to whom he or she is unrelated, such as roommates or a lodger.
Family Type, Census Refers to either census families or persons not in census families. [Statistics Canada]
Census Family Commonly referred to as a “nuclear family” or “immediate family”. In general, it consists of a married couple or common-law couple with or without children, or a lone-parent with a child or children. Furthermore, each child does not have his or her own spouse or child living in the household. A “child” of a parent in a census family must be under the age of 25 and there must be a parent-child relationship (guardian relationships such as aunt or uncle are not sufficient). By definition, all persons who are members of a census family are also members of the same economic family.
Persons “not in census families” Includes persons living alone, living with unrelated individuals, or living with relatives but not in a husband-wife or parent-unmarried child (including guardianship-child) relationship.
Gini Coefficient The Gini Coefficient is a measure of income inequality where 0 represents complete income equality (every person has the exact same income) and 1 represents complete income inequality (where 1 person has all the income and everyone else has none).
Generation Status Refers to the generational status of a person (15 years and older). [Statistics Canada]
1st generation Persons born outside Canada. For the most part, these are people who are now, or have ever been, landed immigrants in Canada. Also included in the first generation includes people who are non-permanent residents (defined as people from another country living in Canada on Work or Study Permits or as refugee claimants, and any family members living with them in Canada.
2nd generation Persons born inside Canada with at least one parent born outside Canada. This includes (a) persons born in Canada with both parents born outside Canada and (b) persons born in Canada with one parent born in Canada and one parent born outside Canada (these persons may have grandparents born inside or outside Canada as well).
3rd generation Persons born inside Canada with both parents born inside Canada (these persons may have grandparents born inside or outside Canada as well).

Page|105 Terms & Definitions
Government Transfers Includes all direct payments from federal, provincial and municipal governments to individuals or families. [Statistics Canada] Government transfers include:
- Child tax benefits (Child tax benefits, Universal child care benefit) - Canada Pension Plan/Quebec Pension Plan benefits - Old Age Security and Guaranteed Income Supplement/Spouse’s Allowance - Employment Insurance benefits - Social assistance - Worker’s compensation benefits - GST/HST credits - Provincial/Territorial tax credits - Other government transfers - transfers not included elsewhere, mainly any other non- taxable transfers. This includes: training program payments not reported elsewhere, the Veteran's pension, pensions to the blind and the disabled, regular payments from provincial automobile insurance plans (excluding lump-sum payments), benefits for fishing industry employees, and the Working Income Tax Benefit (WITB).
It should be noted that many features of the tax system also carry out social policy functions but are not government transfers per se. The tax system uses deductions and non-refundable tax credits, for example, to reduce the amount of tax payable, without providing a direct income.
Implicit rate A way of showing the relative importance of transfers received or taxes paid for different families or individuals. This concept is similar, but not identical, to the effective rate of taxation. For a given individual or family, the effective rate is the amount of transfers/taxes expressed as a percentage of their market income, total income, or after-tax income. The implicit rate for a given population is the average (or aggregate) amount of transfers/taxes expressed as a percentage of their average (or aggregate) income.
Immigrants Persons born outside of Canada.
Income, After-Tax Equivalent of total income, which includes government transfers, less income tax.
Some government transfers are not taxable and are allocated to only one family member, depending on age, income, or gender. These include social assistance, child tax benefits, and seniors benefit. When looking at person-level data, users should be aware that these transfers are not equally divided amongst family members. [Statistics Canada]
Income, Average The mean or average income is computed as the total or "aggregate" income divided by the number of units in the population. It offers a convenient way of tracking aggregate income while adjusting for changes in the size of the population.
There are two drawbacks to using average income for analysis. First, since everyone’s income is counted, the mean is sensitive to extreme values: unusually high income values will have a large impact on the estimate of the mean income, while unusually low ones, i.e. highly negative values, will drive it down. Secondly, it does not give any insight into the allocation of income across members of the population. [Statistics Canada]
Income, Family The sum of income of each adult (16 years or older as of December 31st in the reference year) in the family. Family membership is defined at a particular point in time, while income is based on the entire calendar year. The family members or “composition” may have changed during the reference year, but no adjustment is made to family income to reflect this change. [Statistics Canada]
Income, Household The sum of income of each adult (16 years or older as of December 31st in the reference year) in the household. Household membership is defined at a particular point in time, while income is based on the entire calendar year. The household members or “composition” may have changed during the reference year, but no adjustment is made to family income to reflect this change. [Statistics Canada]
Income Inequality The Gini coefficient used to measure income inequality is a number between zero and one.
Terms & Definitions Page|106
The coefficient would register zero (minimum inequality) for a population in which everyone received the same family income. The coefficient would register one (maximum inequality) for a population in which one person received all the family income and the rest of the population received none. The higher the coefficient, the higher the inequality of income distribution.
Income, Market The sum of earnings (from employment and net self-employment), net investment income, (private) retirement income, and the items under “Other income”. It is equivalent to total income minus government transfers. It is also called income before taxes and transfers. [Statistics Canada]
Earnings See “Earnings”
Investment Income Includes interest received on bonds, deposits and savings certificates from Canadian or foreign sources, dividends received from Canadian and foreign corporate stocks, cash dividends received from insurance policies, net rental income from real estate and farms, interest received on loans and mortgages, regular income from an estate or trust fund and other investment income. Realized capital gains from the sale of assets are excluded. Negative amounts are accepted.
Retirement Income Includes retirement pensions from all private sources, primarily employer pension plans. Amounts may be received in various forms such as annuities, superannuation or RRIFs (Registered Retirement Income Funds). Withdrawals from RRSPs (Registered Retirement Savings Plans) are not included in retirement pensions. However, they are taken into account as necessary for the estimation of certain government transfers and taxes. For data obtained from administrative records, income withdrawn from RRSPs before the age of 65 is treated as RRSP withdrawals, and income withdrawn from RRSPs at ages 65 or older is treated as retirement pensions. Retirement pensions may also be called pension income.
Other income Includes, but is not restricted to, support payments received (also called alimony and child support), retirement allowances (severance pay/termination benefits), scholarships, lump- sum payments from pensions and deferred profit-sharing plans received when leaving a plan, the taxable amount of death benefits other than those from CPP (Canada Pension Plan) or QPP (Quebec Pension Plan), and supplementary unemployment benefits not included in wages and salaries.
Income, Median The value for which half of the units in the population have lower incomes and half has higher incomes. To derive the median value of income, units are ranked from lowest to highest according to their income and then separated into two equal-sized groups. The value that separates these groups is the median income (50th percentile).
Because the median corresponds exactly to the midpoint of the income distribution, it is not, contrary to the mean (average), affected by extreme income values. This is a useful feature of the median, as it allows one to abstract from unusually high values held by relatively few people. Since income distributions are typically skewed to the left – that is, concentrated at the low end of the income scale – median income is usually lower than mean income. [Statistics Canada]
Income, Total Refers to income from all sources including government transfers before deduction of federal and provincial income taxes. It may also be called income before tax (but after transfers). All sources of income are identified as belonging to either market income or government transfers. [Statistics Canada]
Income Tax The sum of federal and provincial income taxes payable (accrued) for the taxation year. Income taxes include taxes on income, capital gains and RRSP withdrawals, after taking into account exemptions, deductions, non-refundable tax credits, and the refundable Quebec abatement. [Statistics Canada]
Infant Mortality The number of infants who die before their first birthday out of every 1000 live born babies. [Alberta Health Services]

Page|107 Terms & Definitions
Labour Force Participation Rate Total labour force expressed as a percentage of the population aged 15 years and older. [Statistics Canada]
Low Income Cut-off (LICO) LICOs are established using data from the Survey of Household Spending. They convey the
income level at which a family may be in strained circumstances because it has to spend a greater proportion of its income on necessities than the average family of similar size. Specifically, the threshold is defined as the income below which a family is likely to spend 20 percentage points more of its income on food, shelter and clothing than the average family. There are separate cut-offs or seven sizes of family – from unattached individuals to families of seven or more persons – and for five community sizes – from rural areas to urban areas with a population of more than 500,000. After having calculated LICOs in the base year (currently 1992), cut-offs for other years are obtained by applying the corresponding Consumer Price Index (CPI) inflation rate to the cut-offs from the base year. [Statistics Canada]
Low Income Gap The amount that the family income falls short of the relevant low income cut-off. For
example, a family with an income of $15,000 and a low income cut-off of $20,000 would have a low income gap of $5,000. In percentage terms this gap would be 25%. The average gap for a given population, whether expressed in dollar or percentage terms, is the average of these values as calculated for each unit. For the calculation of this low income gap, negative incomes are treated as zero. [Statistics Canada]
Low Income Measure
(LIM) LIMs are established using data from the Survey of Labour and Income Dynamics. Like LICO, LIM gauges the well-being of Canadians based solely on income. Unlike LICO, however, which is based “on the relationship between the incomes and the consumption patterns of Canadian households as observed in 1992” [Statistics Canada], LIM is based “on the distribution of household income across the Canadian population” [Statistics Canada]. The LIM for a household of one person is 50% of the median adjusted household income. For larger households, this value is multiplied by the equivalent household size. Adjusted household incomes are derived by dividing household income by the square root of the number of persons in the household and applying this number to each individual in the population. This calculation ensures that household needs are adjusted according to household size. LIM is an international measure that can be used to make international comparisons, whereas LICO is a measure only used in Canada.
Low Income Rate The proportion of persons or families whose incomes are below the applicable Low Income Line (LIL). To determine whether a person (or family) is in low income, the appropriate LIL(given the family size and community size) is compared to the income of the person’s economic family. If the economic family income is below the line, all individuals in that family are considered to be in low income. Overall, the low income rate for persons can then be calculated as the number of persons in low income divided by the total population. The same can be done for families and various sub-groups of the population; for example, low income rates by age, sex, province or family types. [Statistics Canada]
Major Income Earner The person in each household and family with the highest income before tax, with one exception: a child living in the same census family as his/her parent(s) cannot be identified as the major income earner of the census family (this does not apply to economic families). For persons with negative total income before tax, the absolute value of their income is used, to reflect the fact that negative incomes generally arise from losses “earned” in the market-place which are not meant to be sustained. In the rare situations where two persons have exactly the same income, the older person is the major income earner. [Statistics Canada]

Terms & Definitions Page|108
Market Basket Measure (MBM) As defined by the MBM, a person in low income is someone whose disposable family income
falls below the cost of the goods and services in the Market Basket in their community or community size.
MBM disposable family income is the sum remaining after deducting from total family income the following: total income taxes paid; the personal portion of payroll taxes; other mandatory payroll deductions such as contributions to employer-sponsored pension plans, supplementary health plans and union dues; child support and alimony payments made to another family; out-of-pocket spending on child care; and non-insured but medically-prescribed health-related expenses such as dental and vision care, prescription drugs and aids for persons with disabilities. [HRSDC]
Market Poverty Rate The percentage of families whose market income (see “Income, Market”) falls below LICO (see “Low Income Cut-off (LICO)”). [Statistics Canada]
Minimum Wage The minimum amount employers must pay workers within the province of Alberta. The Government of Alberta outlines minimum wage within the Employment Standards Regulation. [Alberta Human Services]
Mother Tongue Refers to the first language learned at home in childhood and still understood by the individual at the time of the census. [Statistics Canada]
Net Worth (Wealth) The net worth of a family unit is defined as the difference between the value of its total asset holdings and the amount of total indebtedness. Assets and debts were reported for the family unit as a whole and not for each person in the family. [Statistics Canada]
Assets Total value of all financial assets, non-financial assets and equity in business. Includes:
- Private pension assets - RRSPs, LIRAs, RRIFs, other - Employer pension plans - Financial assets, non-pension - deposits in financial institutions, mutual/investment funds income trusts - stocks - bonds (savings and other) - other financial assets - Non-financial assets - principal residence - other real estate - vehicles - other non-financial assets - Equity in business
Debts Total value of all amounts owed in the following debt categories:
- Mortgage - principal residence - other real estate - Line of credit - home equity LOC - regular LOC - Credit card and installment debt - major credit cards, retail store cards, gasoline station cards, etc. - deferred payment of installment plans - Student loan - Canada/provincial student loan programs - loans from financial institutions taken directly to attend school - Vehicle loans - Other debt - other loans from financial institutions, unpaid bills, etc.
Non-official Languages In Canada, any languages other than English or French.
Percentiles Income (and net worth) percentiles are a convenient way of categorizing units of a given population from lowest income to highest income/net worth for the purposes of drawing conclusions about the relative situation of people at either end or in the middle of the scale. Rather than using fixed income/net worth ranges, as in a typical distribution of income/net worth, it is the fraction of each population group that is fixed.
Percentiles are calculated by first ranking all the units of the population, whether individuals or families, are from lowest to highest by the value of their income/net worth. Then the ranked population is divided into groups of equal numbers of units. [Statistics Canada]
Deciles The percentile produced when the ranked population is divided into ten groups. Each decile represents 10% of the population.

Page|109 Terms & Definitions
Quintiles The percentile produced when the ranked population is divided into five groups. Each quintile represents 20% of the population.
Permanent Residents People who have been given permanent resident status in Canada. Permanent residents must live in Canada for at least 730 days (two years) within a five-year period or risk losing their status. Permanent residents have all the rights guaranteed under the Canadian Charter of Rights and Freedoms such as equality rights, legal rights, mobility rights, freedom of religion, freedom of expression and freedom of association. They do not, however, have the right to vote in elections. [Citizenship and Immigration Canada]
Private Sector Includes all other employees working for businesses or the non-profit sector.
Public Sector Includes employees in public administration at the federal, provincial, territorial, municipal, First Nations and other Aboriginal levels as well as in Crown corporations, liquor control boards and other government institutions such as schools (including universities), hospitals and public libraries.
Temporary Residents Foreign nationals who are lawfully in Canada on a temporary basis under the authority of a valid document (i.e., a work permit, study permit, temporary resident permit, or a visitor record) issued for the purpose of entering Canada in compliance with the Immigration and Refugee Protection Act (or with the Immigration Act of 1976 prior to 2002), and individuals who make a refugee claim upon or after their arrival in Canada and remain in the country pending the outcome of processes relative to their claim. Temporary residents (as profiled in this publication) include foreign workers, foreign students, and the humanitarian population. [Citizenship and Immigration Canada]
Foreign Workers Temporary residents who entered Canada mainly to work and have been issued a work permit (with or without other types of permits). Foreign workers exclude temporary residents who have been issued a work permit but who entered Canada mainly for reasons other than work.
Foreign Students Temporary residents who entered Canada mainly to study and have been issued a study permit (with or without other types of permits). Foreign students exclude temporary residents who have been issued a study permit but who entered Canada mainly for reasons other than study.
Humanitarian Population Primarily refugee claimants, but this group also includes other foreign nationals allowed to remain in Canada on humanitarian or compassionate grounds under “special considerations."
Temporary Resident Initial Entries Temporary residents who enter Canada and who, for the first time, are subject to a refugee
claim or a valid document (i.e., a work permit, study permit, temporary resident permit, or a visitor record) issued in compliance with the Immigration and Refugee Protection Act (or with the Immigration Act of 1976 prior to 2002). The sum of initial entries and re-entries reflects the total entries of temporary residents to Canada in any given year of observation. [Citizenship and Immigration Canada]
Visible Minorities Persons, other than Aboriginal peoples, who are non-Caucasian in race or non-white in colour. The visible minority population consists mainly of the following groups: Chinese, South Asian, Black, Arab, West Asian, Filipino, Southeast Asian, Latin American, Japanese and Korean.

Page|110
Notes
Page|111 Sources
Sources Section A: Demographics Page 3 Citizenship and Immigration Canada. (2013). Facts and figures 2012 – Immigration overview: Permanent and
temporary residents. [Summary Tables: Canada – Permanent and temporary residents]. Retrieved from: http://www.cic.gc.ca/english/resources/statistics/facts2012-summary/index.asp
City of Edmonton. (2008). Aboriginal Edmonton: A Statistical Profile of the Aboriginal Population of the City of Edmonton. Retrieved from: http://www.edmonton.ca/city_government/documents/CityGov/StatisticalProfileAboriginalPopulation08.pdf
Statistics Canada. (2011). Report on the Demographic Situation in Canada. Retrieved from: http://www.statcan.gc.ca/bsolc/olc-cel/olc-cel?catno=91-209-X&lang=eng
Page 5 Aboriginal Affairs and Northern Development Canada. (2010). Fact Sheet—Urban Aboriginal Population in Canada. Retrieved from: http://www.aadnc-aandc.gc.ca/eng/1100100014298/1100100014302 (accessed 1 August 2013).
Page 6 Alberta Federation of Labour, Temporary Foreign Worker Advocate. (2009). Entrenching Exploitation. Retrieved from: http://www.afl.org/upload/TFWReport2009.pdf
Page 7 Statistics Canada. (2001). Visible Minorities in Canada. Catalogue Number 85F0033MI. Retrieved from: http://dsp-psd.pwgsc.gc.ca/Collection/Statcan/85F0033M/85F0033MIE2001009.pdf
Table 01 CMA population, 1981-2006: Canada West Foundation. Vander Ploeg, C. G. (2008). Big Cities and the Census: The Growing Importance of Big Cities on the Demographic Landscape. Retrieved from: http://www.cwf.ca/V2/cnt/publication_200801280932.php (accessed 26 July 2013).
City population 1981-2012: City of Edmonton. (2012). City of Edmonton Population History. Retrieved from: http://www.edmonton.ca/city_government/facts_figures/population-history.aspx (accessed 26 July 2013).
CMA population, 2008, 2009 & 2012: Statistics Canada. Table051-0046 - Estimates of population by census metropolitan area, sex and age group for July 1, based on the Standard Geographical Classification (SGC) 2006, annual (persons), CANSIM (database). (accessed: 26 July 2013).
CMA Population, 2011: Statistics Canada. (2011). Edmonton, Alberta (Code 835) and Alberta (Code 48) (table). Census Profile. 2011 Census. Statistics Canada Catalogue no. 98-316-XWE. Ottawa. Released October 24, 2012. http://www12.statcan.gc.ca/census-recensement/2011/dp-pd/prof/index.cfm?Lang=E (accessed 26 July 2013).
Table 02 Population by Age, 2012: City of Edmonton. (2012). Municipal Census, 2012, Summary of Results. Retrieved from: http://www.edmonton.ca/city_government/facts_figures/municipal-census-results.aspx (accessed July 26, 2013).
Population by Age, 2011: Statistics Canada. (2012). Edmonton, Alberta (Code 4811061) and Division No. 11, Alberta (Code 4811) (table). Census Profile. 2011 Census. Statistics Canada Catalogue no. 98-316-XWE. Ottawa. Released October 24, 2012. http://www12.statcan.gc.ca/census-recensement/2011/dp-pd/prof/index.cfm?Lang=E (accessed 26 July 2013).
Population by Age, 2009: City of Edmonton. (2009). 2009 Municipal Census, City-Wide Summary of Results. Retrieved from: http://www.edmonton.ca/city_government/municipal_census/2009-municipal-census-results.aspx (accessed 26 July 2013).
Table 03 Statistics Canada. (2013). Edmonton, CMA, Alberta (Code 835) (table).National Household Survey (NHS) Profile. 2011 National Household Survey. Statistics Canada Catalogue no. 99-004-XWE. Ottawa. Released June 26, 2013.http://www12.statcan.gc.ca/nhs-enm/2011/dp-pd/prof/index.cfm?Lang=E (accseed 10 July 2013).
Table 04 Citizenship and Immigration Canada. (2012). Facts and figures 2011 - Immigration Overview: Permanent and Temporary Residents. Retrieved from: http://www.cic.gc.ca/english/resources/statistics/menu-fact.asp (accessed 29 July 2013).
Citizenship and Immigration Canada. (2013). Preliminary Tables—Permanent and Temporary Residents, 2012. Retrieved from: http://www.cic.gc.ca/english/resources/statistics/facts2012-preliminary/index.asp (accessed 30 July 2013).
Table 05 Statistics Canada. (2013). Edmonton, CY, Alberta (Code 4811061) (table). National Household Survey (NHS) Profile. 2011 National Household Survey. Statistics Canada Catalogue no. 99-004-XWE. Ottawa. Released June 26, 2013.http://www12.statcan.gc.ca/nhs-enm/2011/dp-pd/prof/index.cfm?Lang=E (accessed 10 July 2013).
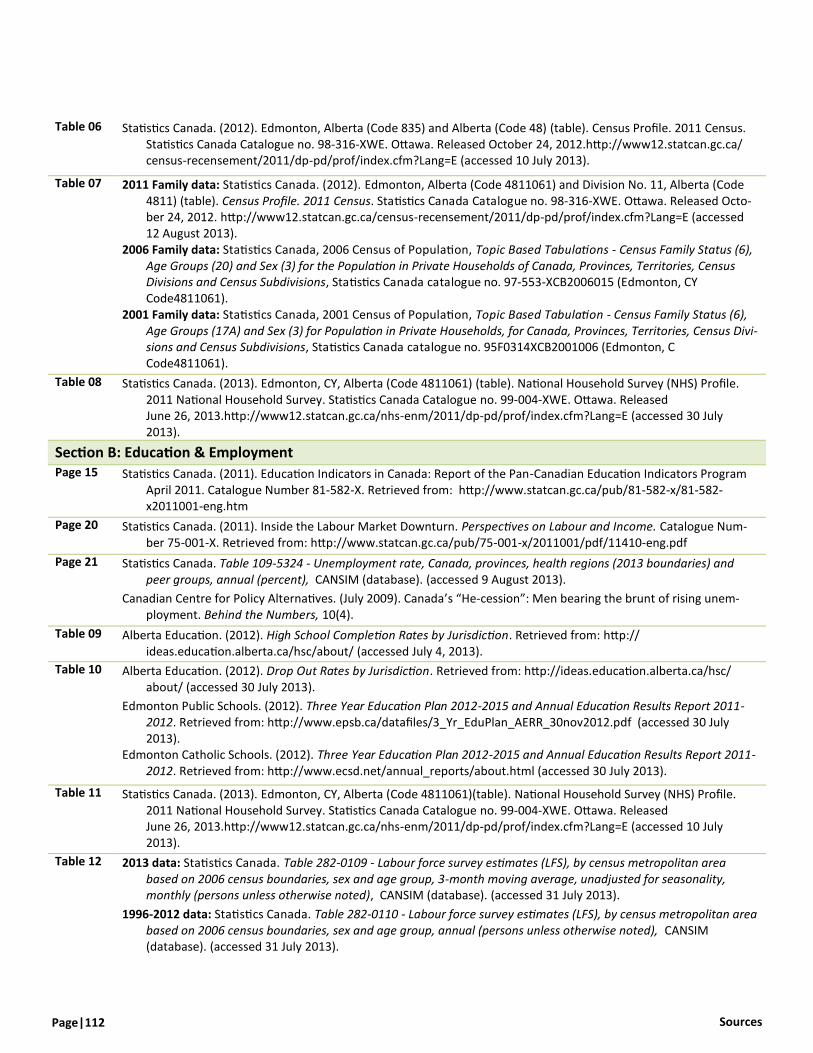
Sources Page|112
Table 06 Statistics Canada. (2012). Edmonton, Alberta (Code 835) and Alberta (Code 48) (table). Census Profile. 2011 Census. Statistics Canada Catalogue no. 98-316-XWE. Ottawa. Released October 24, 2012.http://www12.statcan.gc.ca/census-recensement/2011/dp-pd/prof/index.cfm?Lang=E (accessed 10 July 2013).
Table 07 2011 Family data: Statistics Canada. (2012). Edmonton, Alberta (Code 4811061) and Division No. 11, Alberta (Code 4811) (table). Census Profile. 2011 Census. Statistics Canada Catalogue no. 98-316-XWE. Ottawa. Released Octo-ber 24, 2012. http://www12.statcan.gc.ca/census-recensement/2011/dp-pd/prof/index.cfm?Lang=E (accessed 12 August 2013).
2006 Family data: Statistics Canada, 2006 Census of Population, Topic Based Tabulations - Census Family Status (6), Age Groups (20) and Sex (3) for the Population in Private Households of Canada, Provinces, Territories, Census Divisions and Census Subdivisions, Statistics Canada catalogue no. 97-553-XCB2006015 (Edmonton, CY Code4811061).
2001 Family data: Statistics Canada, 2001 Census of Population, Topic Based Tabulation - Census Family Status (6), Age Groups (17A) and Sex (3) for Population in Private Households, for Canada, Provinces, Territories, Census Divi-sions and Census Subdivisions, Statistics Canada catalogue no. 95F0314XCB2001006 (Edmonton, C Code4811061).
Table 08 Statistics Canada. (2013). Edmonton, CY, Alberta (Code 4811061) (table). National Household Survey (NHS) Profile. 2011 National Household Survey. Statistics Canada Catalogue no. 99-004-XWE. Ottawa. Released June 26, 2013.http://www12.statcan.gc.ca/nhs-enm/2011/dp-pd/prof/index.cfm?Lang=E (accessed 30 July 2013).
Section B: Education & Employment Page 15 Statistics Canada. (2011). Education Indicators in Canada: Report of the Pan-Canadian Education Indicators Program
April 2011. Catalogue Number 81-582-X. Retrieved from: http://www.statcan.gc.ca/pub/81-582-x/81-582-x2011001-eng.htm
Page 20 Statistics Canada. (2011). Inside the Labour Market Downturn. Perspectives on Labour and Income. Catalogue Num-ber 75-001-X. Retrieved from: http://www.statcan.gc.ca/pub/75-001-x/2011001/pdf/11410-eng.pdf
Page 21 Statistics Canada. Table 109-5324 - Unemployment rate, Canada, provinces, health regions (2013 boundaries) and peer groups, annual (percent), CANSIM (database). (accessed 9 August 2013).
Canadian Centre for Policy Alternatives. (July 2009). Canada’s “He-cession”: Men bearing the brunt of rising unem-ployment. Behind the Numbers, 10(4).
Table 09 Alberta Education. (2012). High School Completion Rates by Jurisdiction. Retrieved from: http://ideas.education.alberta.ca/hsc/about/ (accessed July 4, 2013).
Table 10 Alberta Education. (2012). Drop Out Rates by Jurisdiction. Retrieved from: http://ideas.education.alberta.ca/hsc/about/ (accessed 30 July 2013).
Edmonton Public Schools. (2012). Three Year Education Plan 2012-2015 and Annual Education Results Report 2011-2012. Retrieved from: http://www.epsb.ca/datafiles/3_Yr_EduPlan_AERR_30nov2012.pdf (accessed 30 July 2013).
Edmonton Catholic Schools. (2012). Three Year Education Plan 2012-2015 and Annual Education Results Report 2011-2012. Retrieved from: http://www.ecsd.net/annual_reports/about.html (accessed 30 July 2013).
Table 11 Statistics Canada. (2013). Edmonton, CY, Alberta (Code 4811061)(table). National Household Survey (NHS) Profile. 2011 National Household Survey. Statistics Canada Catalogue no. 99-004-XWE. Ottawa. Released June 26, 2013.http://www12.statcan.gc.ca/nhs-enm/2011/dp-pd/prof/index.cfm?Lang=E (accessed 10 July 2013).
Table 12 2013 data: Statistics Canada. Table 282-0109 - Labour force survey estimates (LFS), by census metropolitan area based on 2006 census boundaries, sex and age group, 3-month moving average, unadjusted for seasonality, monthly (persons unless otherwise noted), CANSIM (database). (accessed 31 July 2013).
1996-2012 data: Statistics Canada. Table 282-0110 - Labour force survey estimates (LFS), by census metropolitan area based on 2006 census boundaries, sex and age group, annual (persons unless otherwise noted), CANSIM (database). (accessed 31 July 2013).
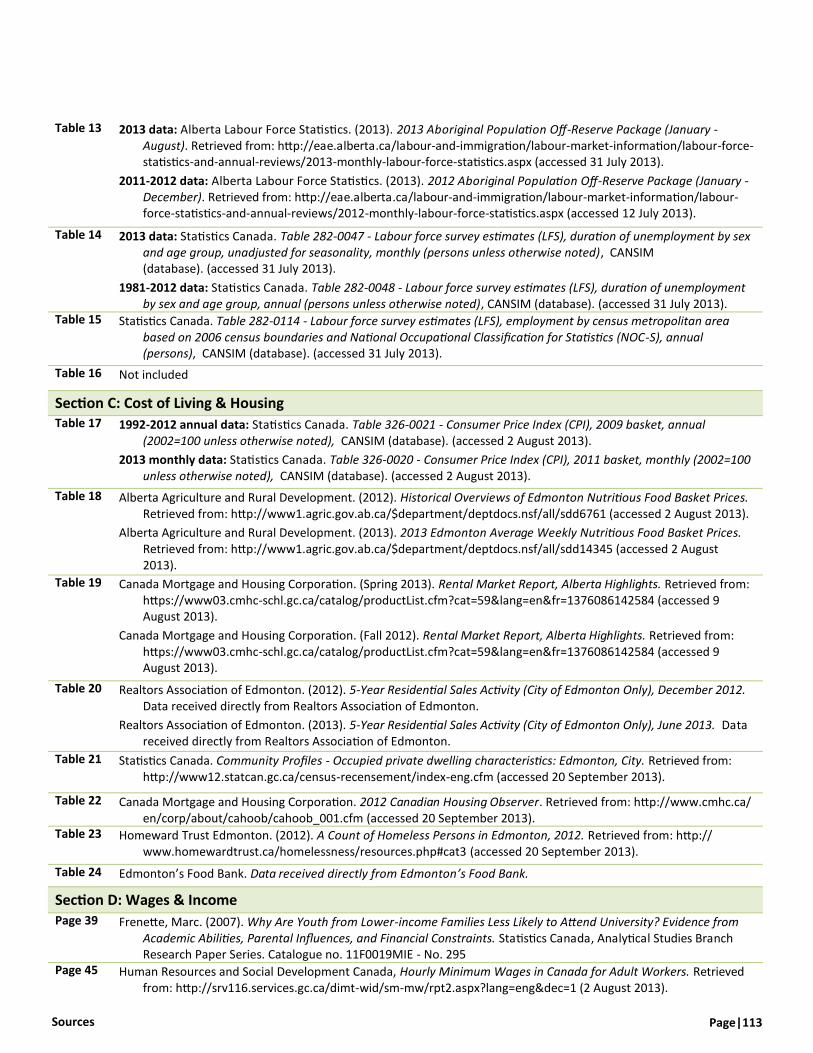
Page|113 Sources
Table 13 2013 data: Alberta Labour Force Statistics. (2013). 2013 Aboriginal Population Off-Reserve Package (January - August). Retrieved from: http://eae.alberta.ca/labour-and-immigration/labour-market-information/labour-force-statistics-and-annual-reviews/2013-monthly-labour-force-statistics.aspx (accessed 31 July 2013).
2011-2012 data: Alberta Labour Force Statistics. (2013). 2012 Aboriginal Population Off-Reserve Package (January - December). Retrieved from: http://eae.alberta.ca/labour-and-immigration/labour-market-information/labour-force-statistics-and-annual-reviews/2012-monthly-labour-force-statistics.aspx (accessed 12 July 2013).
Table 14 2013 data: Statistics Canada. Table 282-0047 - Labour force survey estimates (LFS), duration of unemployment by sex and age group, unadjusted for seasonality, monthly (persons unless otherwise noted), CANSIM (database). (accessed 31 July 2013).
1981-2012 data: Statistics Canada. Table 282-0048 - Labour force survey estimates (LFS), duration of unemployment by sex and age group, annual (persons unless otherwise noted), CANSIM (database). (accessed 31 July 2013).
Table 15 Statistics Canada. Table 282-0114 - Labour force survey estimates (LFS), employment by census metropolitan area based on 2006 census boundaries and National Occupational Classification for Statistics (NOC-S), annual (persons), CANSIM (database). (accessed 31 July 2013).
Table 16 Not included
Section C: Cost of Living & Housing Table 17 1992-2012 annual data: Statistics Canada. Table 326-0021 - Consumer Price Index (CPI), 2009 basket, annual
(2002=100 unless otherwise noted), CANSIM (database). (accessed 2 August 2013).
2013 monthly data: Statistics Canada. Table 326-0020 - Consumer Price Index (CPI), 2011 basket, monthly (2002=100 unless otherwise noted), CANSIM (database). (accessed 2 August 2013).
Table 18 Alberta Agriculture and Rural Development. (2012). Historical Overviews of Edmonton Nutritious Food Basket Prices. Retrieved from: http://www1.agric.gov.ab.ca/$department/deptdocs.nsf/all/sdd6761 (accessed 2 August 2013).
Alberta Agriculture and Rural Development. (2013). 2013 Edmonton Average Weekly Nutritious Food Basket Prices. Retrieved from: http://www1.agric.gov.ab.ca/$department/deptdocs.nsf/all/sdd14345 (accessed 2 August 2013).
Table 19 Canada Mortgage and Housing Corporation. (Spring 2013). Rental Market Report, Alberta Highlights. Retrieved from: https://www03.cmhc-schl.gc.ca/catalog/productList.cfm?cat=59&lang=en&fr=1376086142584 (accessed 9 August 2013).
Canada Mortgage and Housing Corporation. (Fall 2012). Rental Market Report, Alberta Highlights. Retrieved from: https://www03.cmhc-schl.gc.ca/catalog/productList.cfm?cat=59&lang=en&fr=1376086142584 (accessed 9 August 2013).
Table 20 Realtors Association of Edmonton. (2012). 5-Year Residential Sales Activity (City of Edmonton Only), December 2012. Data received directly from Realtors Association of Edmonton.
Realtors Association of Edmonton. (2013). 5-Year Residential Sales Activity (City of Edmonton Only), June 2013. Data received directly from Realtors Association of Edmonton.
Table 21 Statistics Canada. Community Profiles - Occupied private dwelling characteristics: Edmonton, City. Retrieved from: http://www12.statcan.gc.ca/census-recensement/index-eng.cfm (accessed 20 September 2013).
Table 22 Canada Mortgage and Housing Corporation. 2012 Canadian Housing Observer. Retrieved from: http://www.cmhc.ca/en/corp/about/cahoob/cahoob_001.cfm (accessed 20 September 2013).
Table 23 Homeward Trust Edmonton. (2012). A Count of Homeless Persons in Edmonton, 2012. Retrieved from: http://www.homewardtrust.ca/homelessness/resources.php#cat3 (accessed 20 September 2013).
Table 24 Edmonton’s Food Bank. Data received directly from Edmonton’s Food Bank.
Section D: Wages & Income Page 39 Frenette, Marc. (2007). Why Are Youth from Lower-income Families Less Likely to Attend University? Evidence from
Academic Abilities, Parental Influences, and Financial Constraints. Statistics Canada, Analytical Studies Branch Research Paper Series. Catalogue no. 11F0019MIE - No. 295
Page 45 Human Resources and Social Development Canada, Hourly Minimum Wages in Canada for Adult Workers. Retrieved from: http://srv116.services.gc.ca/dimt-wid/sm-mw/rpt2.aspx?lang=eng&dec=1 (2 August 2013).
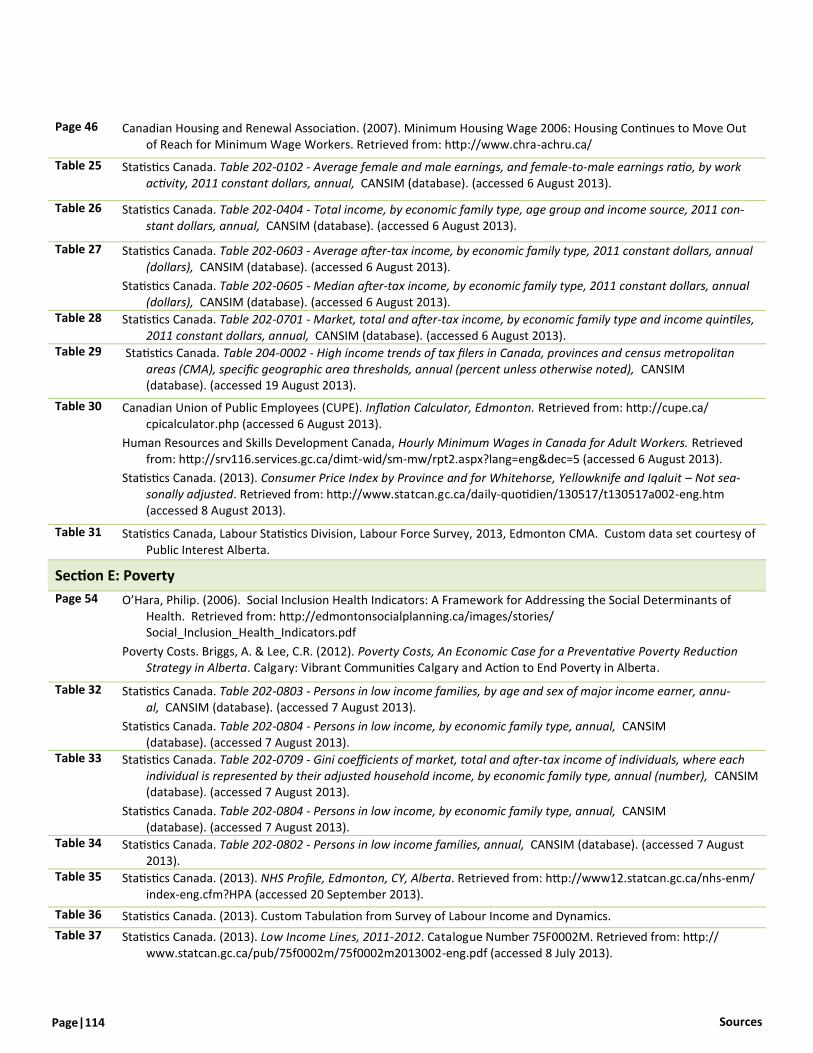
Sources Page|114
Page 46 Canadian Housing and Renewal Association. (2007). Minimum Housing Wage 2006: Housing Continues to Move Out of Reach for Minimum Wage Workers. Retrieved from: http://www.chra-achru.ca/
Table 25 Statistics Canada. Table 202-0102 - Average female and male earnings, and female-to-male earnings ratio, by work activity, 2011 constant dollars, annual, CANSIM (database). (accessed 6 August 2013).
Table 26 Statistics Canada. Table 202-0404 - Total income, by economic family type, age group and income source, 2011 con-stant dollars, annual, CANSIM (database). (accessed 6 August 2013).
Table 27 Statistics Canada. Table 202-0603 - Average after-tax income, by economic family type, 2011 constant dollars, annual (dollars), CANSIM (database). (accessed 6 August 2013).
Statistics Canada. Table 202-0605 - Median after-tax income, by economic family type, 2011 constant dollars, annual (dollars), CANSIM (database). (accessed 6 August 2013).
Table 28 Statistics Canada. Table 202-0701 - Market, total and after-tax income, by economic family type and income quintiles, 2011 constant dollars, annual, CANSIM (database). (accessed 6 August 2013).
Table 29 Statistics Canada. Table 204-0002 - High income trends of tax filers in Canada, provinces and census metropolitan areas (CMA), specific geographic area thresholds, annual (percent unless otherwise noted), CANSIM (database). (accessed 19 August 2013).
Table 30 Canadian Union of Public Employees (CUPE). Inflation Calculator, Edmonton. Retrieved from: http://cupe.ca/cpicalculator.php (accessed 6 August 2013).
Human Resources and Skills Development Canada, Hourly Minimum Wages in Canada for Adult Workers. Retrieved from: http://srv116.services.gc.ca/dimt-wid/sm-mw/rpt2.aspx?lang=eng&dec=5 (accessed 6 August 2013).
Statistics Canada. (2013). Consumer Price Index by Province and for Whitehorse, Yellowknife and Iqaluit – Not sea-sonally adjusted. Retrieved from: http://www.statcan.gc.ca/daily-quotidien/130517/t130517a002-eng.htm (accessed 8 August 2013).
Table 31 Statistics Canada, Labour Statistics Division, Labour Force Survey, 2013, Edmonton CMA. Custom data set courtesy of Public Interest Alberta.
Section E: Poverty
Page 54 O’Hara, Philip. (2006). Social Inclusion Health Indicators: A Framework for Addressing the Social Determinants of Health. Retrieved from: http://edmontonsocialplanning.ca/images/stories/Social_Inclusion_Health_Indicators.pdf
Poverty Costs. Briggs, A. & Lee, C.R. (2012). Poverty Costs, An Economic Case for a Preventative Poverty Reduction Strategy in Alberta. Calgary: Vibrant Communities Calgary and Action to End Poverty in Alberta.
Table 32 Statistics Canada. Table 202-0803 - Persons in low income families, by age and sex of major income earner, annu-al, CANSIM (database). (accessed 7 August 2013).
Statistics Canada. Table 202-0804 - Persons in low income, by economic family type, annual, CANSIM (database). (accessed 7 August 2013).
Table 33 Statistics Canada. Table 202-0709 - Gini coefficients of market, total and after-tax income of individuals, where each individual is represented by their adjusted household income, by economic family type, annual (number), CANSIM (database). (accessed 7 August 2013).
Statistics Canada. Table 202-0804 - Persons in low income, by economic family type, annual, CANSIM (database). (accessed 7 August 2013).
Table 34 Statistics Canada. Table 202-0802 - Persons in low income families, annual, CANSIM (database). (accessed 7 August 2013).
Table 35 Statistics Canada. (2013). NHS Profile, Edmonton, CY, Alberta. Retrieved from: http://www12.statcan.gc.ca/nhs-enm/index-eng.cfm?HPA (accessed 20 September 2013).
Table 36 Statistics Canada. (2013). Custom Tabulation from Survey of Labour Income and Dynamics.
Table 37 Statistics Canada. (2013). Low Income Lines, 2011-2012. Catalogue Number 75F0002M. Retrieved from: http://www.statcan.gc.ca/pub/75f0002m/75f0002m2013002-eng.pdf (accessed 8 July 2013).

Page|115 Sources
Section F: Government Income Supports
Page 64 Canadian Association for Community Living (2008). National report card 2008: inclusion of Canadians with intellectu-al disabilities. Retrieved from http://www.reducepoverty.ca/pdf/High-Risk%20Immigrants%20&%20Sustainable%20Employment%20-%20SR.pdf
Canadian Centre for Policy Alternatives (2009). Women’s poverty and the recession. Retrieved from http://www.policyalternatives.ca/
Doyle-Bedwell, Patti. With the appropriate qualifications: aboriginal people and employment equity. Canadian Woman Studies 26.3-4 (Winter-Spring 2008): 77-89.
Poverty Reduction Coalition (2007). Addressing labour market shortages: high-risk immigrants and sustainable em-ployment. Retrieved from http://www.reducepoverty.ca/
Poverty Reduction Coalition (2007). Addressing labour market shortages: lone-parents and sustainable employ-ment. Retrieved from http://www.reducepoverty.ca/
Table 38 Statistics Canada. Table 202-0301 - Government transfers, by economic family type and after-tax income quintiles, 2011 constant dollars, annual, CANSIM (database). (accessed 8 August 2013).
Table 39 Statistics Canada. Table 202-0301 - Government transfers, by economic family type and after-tax income quintiles, 2011 constant dollars, annual, CANSIM (database). (accessed 8 August 2013).
Table 40 Statistics Canada. (2010). Custom data provided by Campaign 2000.
Table 41 Alberta Human Services. (2012). Income Support, Training and Health Benefits Regulation, Schedule 5 - Core Income Support Tables. Retrieved from: http://humanservices.alberta.ca/AWonline/IESA/6435.html (accessed 8 July 2013).
Statistics Canada. (2013). Consumer Price Index by Province and for Whitehorse, Yellowknife and Iqaluit – Not sea-sonally adjusted. Retrieved from: http://www.statcan.gc.ca/daily-quotidien/130517/t130517a002-eng.htm (accessed 8 August 2013).
Canadian Union of Public Employees (CUPE). Inflation Calculator, Edmonton. Retrieved from: http://cupe.ca/cpicalculator.php (accessed 9 August 2013).
Edmonton Social Planning Council. (1993). The Other Welfare Manual: A Survival Guide to Supports for Independ-ence.
Edmonton Social Planning Council. (2002). Tracking the Trends: Social Health in Edmonton - 2002 Edition.
Potts, Karen. (1990). Social Allowance Comparisons: Poverty, Income Eligibility and Earnings Exemptions. Prepared for the Working Poor Committee (ISAC).
Table 42 AISH 2008-2012 Data: Alberta Human Services. (2012). AISH Announcements. Retrieved from: http://www.seniors.gov.ab.ca/aish/announcements.asp (accessed 14 August 2013).
AISH 1992-2007 Data: Alberta Disabilities Forum. (2007). The Importance of Annual Increases in the Assured In-come for the Severely Handicapped Benefit Rate. Retrieved from: http://webcache.googleusercontent.com/search?q=cache:W2p-dDLnWegJ:www.adforum.ca/publications/low-income/AISH_Position_Paper.doc+&cd=1&hl=en&ct=clnk&gl=ca (accessed 14 August 2013).
AISH 1993-2003 Data: Kneebone, Ronald D. (2005). IAPR Policy Brief - Assured Income for the Severely Handicapped: The Decline in Financial Benefits Since 1993. Institute for Advance Policy Research, University of Calgary. Re-trieved from: http://www.ucalgary.ca/iaprfiles/policybriefs/iapr-pb-0501.pdf (accessed 14 August 2013).
Canadian Union of Public Employees. (CUPE). Inflation Calculator, Edmonton. Retrieved from: http://cupe.ca/cpicalculator.php (accessed 14 August 2013).
Statistics Canada. (2013). Consumer Price Index by Province and for Whitehorse, Yellowknife and Iqaluit – Not sea-sonally adjusted. Retrieved from: http://www.statcan.gc.ca/daily-quotidien/130517/t130517a002-eng.htm (accessed 8 August 2013).

Sources Page|116
Table 43 Alberta Seniors and Community Supports. Annual AISH Caseloads for Edmonton CMA, received from Disability Sup-ports Division.
Alberta Works. (2011). Edmonton Income Supports – ETW/NETW Caseload Statistics, custom data table.
E.I. data, 1997-2012: Statistics Canada. Table 276-0009 - Employment Insurance Program (E.I.), beneficiaries by prov-ince, census metropolitan areas, census agglomerations and sex, monthly (persons), CANSIM (database). (accessed 23 July 2013).
E.I. data, 2013: Statistics Canada. Table 276-0031 - Employment Insurance program (EI), beneficiaries receiving regu-lar income benefits by province, census metropolitan area and census agglomeration, seasonally adjusted, monthly (persons), CANSIM (database). (accessed 9 August 2013).
Part 2 - Section A: Social Health Indicators & Section B: Social Health Index
Table 44 Alberta Health Services. (2013). Interactive Health Data Application, Z4 - Edmonton Zone. Retrieved from: http://www.ahw.gov.ab.ca/IHDA_Retrieval/ (accessed 21 August 2013).
Table 45 Alberta Human Services. (2012). Edmonton & Area Child & Family Services Authority, Region 6, Annual Reports. Re-trieved from: http://www.edmontonandareacfsa.gov.ab.ca/publish/509.cfm (accessed 21 August 2013).
Alberta Health Services. (2013). Interactive Health Data Application, Z4 - Edmonton Zone. Retrieved from: http://www.ahw.gov.ab.ca/IHDA_Retrieval/ (accessed 21 August 2013).
City of Edmonton. (2012). 2012 Municipal Census. Retrieved from: http://www.edmonton.ca/city_government/documents/Summary_Report_of_All_Questions_Edmonton_2012.pdf (accessed 21 August 2013).
Statistics Canada. (2012). Edmonton, Alberta (Code 4811061) and Alberta (Code 48) (table). Census Profile. 2011 Census. Statistics Canada Catalogue no. 98-316-XWE. Ottawa. Released October 24, 2012. http://www12.statcan.gc.ca/census-recensement/2011/dp-pd/prof/index.cfm?Lang=E (accessed 21 August 2013).
The Support Network. (2012). Annual Report 2012. Retrieved from: http://www.thesupportnetwork.com/images/uploads/2012_AnnualReport.pdf (accessed 21 August 2013).
Table 46 Statistics Canada. Table 202-0605 - Median after-tax income, by economic family type, 2011 constant dollars, annual (dollars), CANSIM (database). (accessed 5 July 2013).
Statistics Canada. Table 202-0804 - Persons in low income, by economic family type, annual, CANSIM (database). (accessed 8 July 2013) .
Office of the Superintendent of Bankruptcy Canada. (2013). Annual Consumer Insolvency Rates by Census Metropoli-tan Area. Retrieved from: http://www.ic.gc.ca/eic/site/bsf-osb.nsf/eng/br01823.html (accessed 21 August 2013).
Edmonton’s Food Bank. (2013). Data Received from Edmonton’s Food Bank.
Statistics Canada. (2013). Edmonton, CY, Alberta (Code 4811061)(table). National Household Survey (NHS) Profile. 2011 National Household Survey. Statistics Canada Catalogue no. 99-004-XWE. Ottawa. Released June 26, 2013.http://www12.statcan.gc.ca/nhs-enm/2011/dp-pd/prof/index.cfm?Lang=E (accessed 10 July 2013).
Alberta Education. (2013). Drop Out Rates by Jurisdiction. Retrieved from: http://ideas.education.alberta.ca/hsc/about/ (accessed 30 July 2013).
Statistics Canada. Table 282-0110 - Labour force survey estimates (LFS), by census metropolitan area based on 2006 census boundaries, sex and age group, annual (persons unless otherwise noted), CANSIM (database). (accessed 21 August 2013).
Table 47 1993-1997 Data: Statistics Canada. Table 252-0080 - Incident-based crime statistics, by detailed violations and police services, Alberta, annual (number unless otherwise noted), CANSIM (database). (accessed 21 August 2013).
1998-2012 Data: Statistics Canada. Table 252-0013 - Crime statistics, by detailed offences, annual (number unless otherwise noted), CANSIM (database). (accessed 21 August 2013).
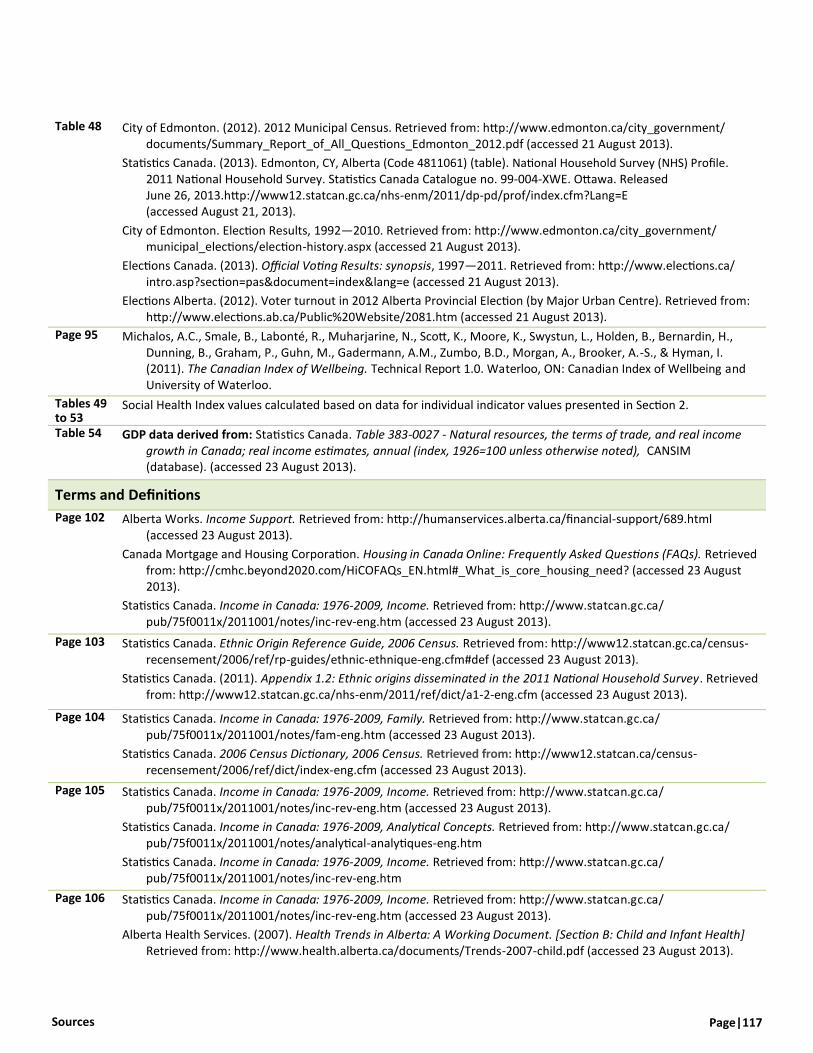
Page|117 Sources
Table 48 City of Edmonton. (2012). 2012 Municipal Census. Retrieved from: http://www.edmonton.ca/city_government/documents/Summary_Report_of_All_Questions_Edmonton_2012.pdf (accessed 21 August 2013).
Statistics Canada. (2013). Edmonton, CY, Alberta (Code 4811061) (table). National Household Survey (NHS) Profile. 2011 National Household Survey. Statistics Canada Catalogue no. 99-004-XWE. Ottawa. Released June 26, 2013.http://www12.statcan.gc.ca/nhs-enm/2011/dp-pd/prof/index.cfm?Lang=E (accessed August 21, 2013).
City of Edmonton. Election Results, 1992—2010. Retrieved from: http://www.edmonton.ca/city_government/municipal_elections/election-history.aspx (accessed 21 August 2013).
Elections Canada. (2013). Official Voting Results: synopsis, 1997—2011. Retrieved from: http://www.elections.ca/intro.asp?section=pas&document=index&lang=e (accessed 21 August 2013).
Elections Alberta. (2012). Voter turnout in 2012 Alberta Provincial Election (by Major Urban Centre). Retrieved from: http://www.elections.ab.ca/Public%20Website/2081.htm (accessed 21 August 2013).
Page 95 Michalos, A.C., Smale, B., Labonté, R., Muharjarine, N., Scott, K., Moore, K., Swystun, L., Holden, B., Bernardin, H., Dunning, B., Graham, P., Guhn, M., Gadermann, A.M., Zumbo, B.D., Morgan, A., Brooker, A.-S., & Hyman, I. (2011). The Canadian Index of Wellbeing. Technical Report 1.0. Waterloo, ON: Canadian Index of Wellbeing and University of Waterloo.
Tables 49 to 53
Social Health Index values calculated based on data for individual indicator values presented in Section 2.
Table 54 GDP data derived from: Statistics Canada. Table 383-0027 - Natural resources, the terms of trade, and real income growth in Canada; real income estimates, annual (index, 1926=100 unless otherwise noted), CANSIM (database). (accessed 23 August 2013).
Terms and Definitions
Page 102 Alberta Works. Income Support. Retrieved from: http://humanservices.alberta.ca/financial-support/689.html (accessed 23 August 2013).
Canada Mortgage and Housing Corporation. Housing in Canada Online: Frequently Asked Questions (FAQs). Retrieved from: http://cmhc.beyond2020.com/HiCOFAQs_EN.html#_What_is_core_housing_need? (accessed 23 August 2013).
Statistics Canada. Income in Canada: 1976-2009, Income. Retrieved from: http://www.statcan.gc.ca/pub/75f0011x/2011001/notes/inc-rev-eng.htm (accessed 23 August 2013).
Page 103 Statistics Canada. Ethnic Origin Reference Guide, 2006 Census. Retrieved from: http://www12.statcan.gc.ca/census-recensement/2006/ref/rp-guides/ethnic-ethnique-eng.cfm#def (accessed 23 August 2013).
Statistics Canada. (2011). Appendix 1.2: Ethnic origins disseminated in the 2011 National Household Survey. Retrieved from: http://www12.statcan.gc.ca/nhs-enm/2011/ref/dict/a1-2-eng.cfm (accessed 23 August 2013).
Page 104 Statistics Canada. Income in Canada: 1976-2009, Family. Retrieved from: http://www.statcan.gc.ca/pub/75f0011x/2011001/notes/fam-eng.htm (accessed 23 August 2013).
Statistics Canada. 2006 Census Dictionary, 2006 Census. Retrieved from: http://www12.statcan.ca/census-recensement/2006/ref/dict/index-eng.cfm (accessed 23 August 2013).
Page 105 Statistics Canada. Income in Canada: 1976-2009, Income. Retrieved from: http://www.statcan.gc.ca/pub/75f0011x/2011001/notes/inc-rev-eng.htm (accessed 23 August 2013).
Statistics Canada. Income in Canada: 1976-2009, Analytical Concepts. Retrieved from: http://www.statcan.gc.ca/pub/75f0011x/2011001/notes/analytical-analytiques-eng.htm
Statistics Canada. Income in Canada: 1976-2009, Income. Retrieved from: http://www.statcan.gc.ca/pub/75f0011x/2011001/notes/inc-rev-eng.htm
Page 106 Statistics Canada. Income in Canada: 1976-2009, Income. Retrieved from: http://www.statcan.gc.ca/pub/75f0011x/2011001/notes/inc-rev-eng.htm (accessed 23 August 2013).
Alberta Health Services. (2007). Health Trends in Alberta: A Working Document. [Section B: Child and Infant Health] Retrieved from: http://www.health.alberta.ca/documents/Trends-2007-child.pdf (accessed 23 August 2013).
Sources Page|118
Page 107 Statistics Canada. Guide to the Labour Force Survey. Retrieved from: http://www.statcan.gc.ca/pub/71-543-g/2011001/part-partie3-eng.htm (accessed 23 August 2013).
Statistics Canada. (2012). Low Income Lines, 2010-2011. Retrieved from: http://www.statcan.gc.ca/pub/75f0002m/75f0002m2012002-eng.htm (accessed 23 August 2013).
Statistics Canada. Income in Canada: 1976-2009, Income. Retrieved from: http://www.statcan.gc.ca/pub/75f0011x/2011001/notes/inc-rev-eng.htm (accessed 23 August 2013).
Page 108 Human Resources and Skills Development Canada. (2009). Low Income in Canada: 2000-2007 Using the Market Bas-ket Measure. Retrieved from: http://publications.gc.ca/collections/collection_2010/rhdcc-hrsdc/HS28-49-2009-eng.pdf (accessed 23 August 2013).
Alberta Human Services. (2013). Minimum Wage. Retrieved from: http://www.employment.alberta.ca/SFW/998.html (accessed 23 August 2013).
Statistics Canada. Languages Reference Guide, 2006 Census. Retrieved from: http://www12.statcan.ca/census-recensement/2006/ref/rp-guides/lang-eng.cfm (accessed 23 August 2013).
Statistics Canada. (2005). Pension and Wealth Surveys Section. The Wealth of Canadians: An Overview of the Survey of Financial Security 2005. Retrieved from: http://www.statcan.gc.ca/pub/13f0026m/13f0026m2006001-eng.pdf (accessed 23 August 2013).
Statistics Canada. Income in Canada: 1976-2009, Analytical Concepts. Retrieved from: http://www.statcan.gc.ca/pub/75f0011x/2011001/notes/analytical-analytiques-eng.htm (accessed 23 August 2013).
Page 109 Citizenship and Immigration Canada. (2009). Facts and Figures: Immigration Overview, Permanent and Temporary Residents. Retrieved from: http://www.cic.gc.ca/english/pdf/research-stats/facts2009.pdf (accessed 23 August 2013).