Trends and projections in Europe 2015 — Tracking progress ...
104
ISSN 1977-8449 EEA Report No 4/2015 Trends and projections in Europe 2015 Tracking progress towards Europe's climate and energy targets EEA Report No 4/2015
-
Upload
khangminh22 -
Category
Documents
-
view
1 -
download
0
Transcript of Trends and projections in Europe 2015 — Tracking progress ...

ISSN 1977-8449
EEA Report No 4/2015
Trends and projections in Europe 2015Tracking progress towards Europe's climate and energy targets
EEA Report No 4/2015


EEA Report No 4/2015
Trends and projections in Europe 2015Tracking progress towards Europe's climate and energy targets

Legal noticeThe contents of this publication do not necessarily reflect the official opinions of the European Commission or other institutions of the European Union. Neither the European Environment Agency nor any person or company acting on behalf of the Agency is responsible for the use that may be made of the information contained in this report.
Copyright notice© European Environment Agency, 2015Reproduction is authorised provided the source is acknowledged.
More information on the European Union is available on the Internet (http://europa.eu).
Luxembourg: Publications Office of the European Union, 2015
ISBN 978-92-9213-698-7ISSN 1977-8449doi:10.2800/985234
European Environment AgencyKongens Nytorv 61050 Copenhagen KDenmark
Tel.: +45 33 36 71 00Web: eea.europa.euEnquiries: eea.europa.eu/enquiries
Cover design: EEACover photo: © bjdlzx Right photo: © EEALeft photo: © EEALayout: EEA/Rosendahls

3
Contents
Trends and projections in Europe 2015
Contents
Acknowledgements .................................................................................................................... 7Executive summary .................................................................................................................... 8
1.1 Background ............................................................................................................................131.2 Data .........................................................................................................................................13
1 Introduction ......................................................................................................................... 131.3 Approach to assessing progress ........................................................................................141.4 Report structure ....................................................................................................................14
2 Overall progress towards the EU's '20‑20‑20' climate and energy targets ................... 162.1 EU progress towards its '20-20-20' climate and energy targets ......................................172.2 Progress towards EU mid- and long-term climate and energy objectives .....................182.3 Progress towards national 2020 climate and energy objectives .....................................192.4 Main drivers of GHG emission trends ................................................................................22
3 Progress towards GHG emission targets .......................................................................... 243.1 EU progress towards GHG emission targets......................................................................253.2 Trends and projections in GHG emissions, by sector .......................................................273.3 Emission trends (2013–2020) under the EU ETS ...............................................................293.4 Progress towards targets (2013–2020) under the ESD .....................................................313.5 Emission and removals from LULUCF ................................................................................363.6 GHG emission trends and projections in other EEA member countries ........................37
4 Progress towards renewable energy targets ................................................................... 394.1 EU progress towards its RES targets ...................................................................................394.2 Relativetrendsinfinalenergyconsumptionandrenewableenergy use ......................414.3 Trends in RES shares by sector ............................................................................................434.4 Member State progress towards national RES targets .....................................................45
5 Progress towards energy efficiency targets..................................................................... 485.1 EU progress towards its energy efficiency targets ............................................................495.2 EU policies for 2020 energy efficiency targets ...................................................................505.3 National 2020 energy efficiency targets vs the EU target ................................................525.4 Progress towards national 2020 energy efficiency targets ..............................................53
Acronyms, units and terms ..................................................................................................... 56References ................................................................................................................................. 61Annex 1 Climate and energy targets in the EU ..................................................................... 67
A1.1 International commitments of EU and EEA countries under the UNFCCC and the Kyoto Protocol .................................................................................................................67A1.2 First commitment period of the Kyoto Protocol, 2008–2012 ...........................................67
Contents
4 Trends and projections in Europe 2015
A1.3 Second commitment period of the Kyoto Protocol, 2013–2020 .....................................68A1.4 EU domestic climate and energy targets for 2020 ............................................................71A1.5 Overview of 2020 national climate and energy targets ....................................................76A1.6 2030 climate and energy targets .........................................................................................79
Annex 2 Data sources for GHG emissions, energy consumption and targets ................... 80A2.1 Legal reporting requirements for GHG data ......................................................................80A2.2 Historic GHG emission data .................................................................................................80A2.3 Projected GHG emissions .....................................................................................................81A2.4 Energy consumption data ....................................................................................................92
Annex 3 Detailed assessment results (progress under the ESD) ........................................ 93A3.1 Tracking progress towards targets under the ESD ...........................................................93A3.2 Current progress towards targets under the ESD .............................................................93A3.3 Projected progress towards ESD targets ............................................................................95A3.4 2005 ESD base-year emissions ............................................................................................96
Annex 4 Detailed assessment results (progress towards renewable energy targets) ..... 97Annex 5 Detailed assessment results (progress towards energy efficiency targets) ...... 99
A5.1 Progress achieved between 2005 and 2013: additional information .............................99
5
List of figures and tables
Trends and projections in Europe 2015
List of figures and tables
Figures
Figure ES.1 EU progress towards 2020 climate and energy targets ..............................................................................................8Figure ES.2 Progress of Member States towards 2020 climate and energy targets ....................................................................9Figure ES.3 EU greenhouse gas emission trends, projections and reduction targets.............................................................. 11Figure 2.1 EU progress towards 2020 climate and energy targets ........................................................................................... 18Figure 2.2 Contributions of drivers to GHG emission trends, 2005–2013 ............................................................................... 23Figure 2.3 Heating degree days in Europe, 2005–2013 .............................................................................................................. 23Figure 3.1 GHG emission trends, projections and targets in the EU, 1990–2050 ................................................................... 26Figure 3.2 GHG emission trends and projections by sector, 1990–2030 ................................................................................. 28Figure 3.3 Trends and projections of EU ETS emissions (stationary installations), ETS cap and available credits, 2005–2020 ........................................................................................................................................................ 30Figure 3.4 EU GHG emission trends and projections in sectors covered by the ESD............................................................. 31Figure 3.5 Total GHG emission trends and projections in other EEA member countries, 1990–2030 ................................. 38Figure 4.1 Trends and targets in the share of renewable energy sources in EU energy consumption, 2005–2050 .......... 40Figure4.2 Grossfinalenergyconsumptionofrenewableandnon-renewableenergysources(2005–2013), and approximated RES share, 2014 ........................................................................................................................... 41Figure4.3 Grossfinalenergyconsumption(totalandfromRES)andRESsharesinMemberStates,2005–2013 ............ 42Figure 4.4 Renewable energy shares by sector in the EU .......................................................................................................... 43Figure 4.5 Historic contributions from renewable energy technologies ................................................................................. 44Figure 4.6 Member States' RES shares (2013–2014), in relation to the indicative RED target (2013–2014) and 2013 NREAP target........................................................................................................................................................ 47Figure5.1 TrendsinEU'sprimaryandfinalenergyconsumption(2005–2014)andtargets,2020and2030 ..................... 50Figure5.2 Overallambitionlevelofnationaltargetsforprimaryandfinalenergyconsumptionby2020 ........................ 52Figure 5.3 Primary energy consumption (2013–2014) and 2020 national targets, relative to 2005 levels .......................... 53Figure 5.4 Distance between 2013 and 2014 primary energy consumption and linear target path ................................... 55Figure A1.1 National 2013 and 2020 GHG emission limits under the ESD, relative to 2005 emissions levels ...................... 73Figure A1.2 National targets for renewable energies for 2020 ................................................................................................... 74FigureA1.3 Nationalindicativeprimaryandfinalenergyconsumptiontargets ....................................................................... 76
Tables
Table 2.1 Progress of Member States towards 2020 climate and energy targets ................................................................. 20Table 3.1 Key EU policies supporting national achievements under the ESD ....................................................................... 29Table 3.2 Historic (2013–2014) and projected (2015–2020) annual absolute gaps to annual ESD targets ........................ 32Table 3.3 Minimum conditions expected for achieving the ESD budget for the period 2013 to 2020 ............................... 34Table 3.4 Historic (2013–2014) and projected (2015–2020) cumulated absolute gaps to annual ESD targets ................. 35Table A1.1 Emission reduction commitments by EU and EEA countries for the Kyoto Protocol's second commitment period, 2013–2020 ................................................................................................................................ 69Table A1.2 Main national climate and energy targets ................................................................................................................. 77Table A1.3 Technical details concerning EU climate-related targets ......................................................................................... 78Table A2.1 Projected emissions from Member States and Norway, WEM and WAM ............................................................. 82Table A3.1 Current progress towards 2013 and 2014 ESD targets ........................................................................................... 94

List of figures and tables
6 Trends and projections in Europe 2015
Table A3.2 Projected progress towards 2020 ESD targets ......................................................................................................... 95Table A3.3 ESD base-year emissions ............................................................................................................................................. 96Table A4.1 Current progress towards renewable energy targets .............................................................................................. 97Table A4.2 RES shares per sector, 2013 and 2014 ....................................................................................................................... 98TableA5.1 MemberStates'progresstowardstheir2020energyefficiencytargets ............................................................. 100

7
Acknowledgements
Trends and projections in Europe 2015
Acknowledgements
This report was prepared by the European Environment Agency (EEA) and its European Topic Centre for Air Pollution and Climate Change Mitigation (ETC/ACM). The ETC/ACM is a consortium of European institutes assisting the EEA in its support to European Union (EU) policy in the field of air pollution and climate change mitigation.
The overall coordination of the report was carried out by François Dejean (EEA) and the ETC/ACM task manager, Sabine Gores (Öko-Institut).
The authors were, in alphabetical order, Anca-Diana Barbu, François Dejean and Mihai Tomescu from the EEA; Hannes Böttcher, Johanna Cludius, Hannah Förster, Benjamin Greiner, Sabine Gores, Sean Healy, Katja Schumacher and Anne Siemons from Öko-Institut
(ETC/ACM partner, Germany), and Nele Renders from Vito (ETC/ACM partner, Belgium).
Additional EEA support for the preparation of this report was provided by John van Aardenne, Andreas Barkman, Ricardo Fernandez, Magdalena Jozwicka, Brendan Killeen, Paul McAleavey, Patrick McMullan, Spyridoula Ntemiri, David Simoens and Melanie Sporer.
The EEA would like to thank the national focal points and experts of the EEA member countries for their cooperation during the preparation of this report. The EEA also acknowledges the comments received on the draft report from the EEA member countries and the European Commission. These comments were included in the report as far as was practically feasible.
Trends and projections in Europe 20158
Executive summary
Executive summary
EU and Member States progress towards 2020 climate and energy targets
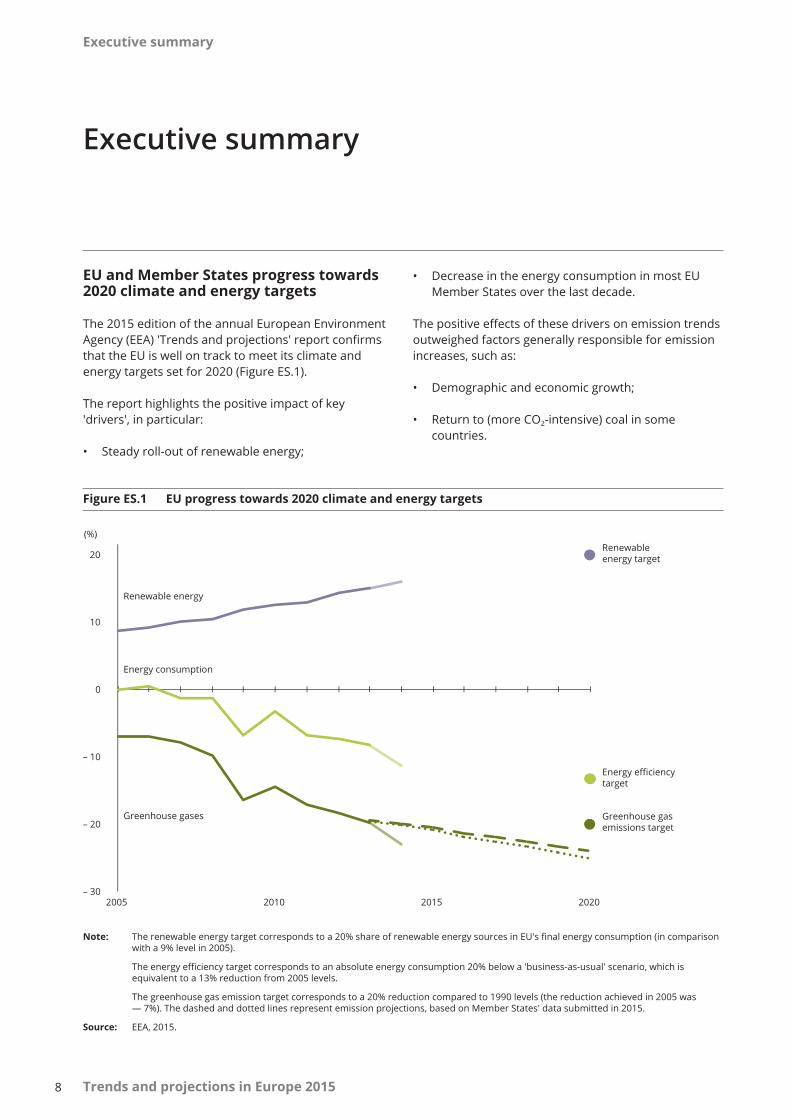
The 2015 edition of the annual European Environment Agency (EEA) 'Trends and projections' report confirms that the EU is well on track to meet its climate and energy targets set for 2020 (Figure ES.1).
The report highlights the positive impact of key 'drivers', in particular:
• Steady roll-out of renewable energy;
• Decrease in the energy consumption in most EU Member States over the last decade.
The positive effects of these drivers on emission trends outweighed factors generally responsible for emission increases, such as:
• Demographic and economic growth;
• Return to (more CO2-intensive) coal in some countries.
Figure ES.1 EU progress towards 2020 climate and energy targets
Note: Therenewableenergytargetcorrespondstoa20%shareofrenewableenergysourcesinEU'sfinalenergyconsumption(incomparisonwith a 9% level in 2005).
Theenergyefficiencytargetcorrespondstoanabsoluteenergyconsumption20%belowa'business-as-usual'scenario,whichisequivalent to a 13% reduction from 2005 levels.
The greenhouse gas emission target corresponds to a 20% reduction compared to 1990 levels (the reduction achieved in 2005 was — 7%).Thedashedanddottedlinesrepresentemissionprojections,basedonMemberStates'datasubmittedin2015.
Source: EEA, 2015.
– 30
– 20
– 10
0
10
20
2005 2010 2015 2020
Energy consumption
Renewable energy
Greenhouse gases
Renewable energy target
Energy efficiencytarget
Greenhouse gasemissions target
(%)

Executive summary
9Trends and projections in Europe 2015
On track
Not on track
2013 primaryenergy consumption
2013 GHG emissionsand 2013–2020 projections
under the Effort Sharing Decision
2013 share of renewables in final energy consumption
Luxembourg
Greece
Hungary
Sweden
Bulgaria
Germany
CzechRepublic
Portugal
Lithuania
Slovenia
United Kingdom
Cyprus
Finland
Estonia
Spain
Latvia
NetherlandsIreland
Austria
Croatia
Malta
Poland
Denmark
France
Slovakia
Italy
Belgium
Romania
Figure ES.2 Progress of Member States towards 2020 climate and energy targets
Note: TheEffortSharingDecisionsetsindividualbindingannualtargetsforGHGemissionsnotcoveredbytheEUETSforallMemberStatesfor the period from 2013 to 2020. The Renewable Energy Directive sets individual binding targets for the 2020 share of renewable energy sourcesingrossfinalenergyconsumption,aswellasindicativetrajectoriesupuntil2020.UndertheEnergyEfficiencyDirective,MemberStates set their own target on energy consumption for 2020.
See further methodological details in Table 2.1.
Source: EEA, 2015.

Executive summary
10 Trends and projections in Europe 2015
The report goes beyond these headline numbers and also looks at the progress of Member States towards their individual climate and energy objectives for 2020. Here the picture is nuanced: while the EU is on track, the situation differs significantly between Member States.
• 24 are on track to meet their GHG targets (all except Austria, Belgium, Ireland and Luxembourg);
• 20 are on track to achieve their renewable energy targets (all except Denmark, France, Ireland, Luxembourg, the Netherlands, Portugal, Spain and the United Kingdom);
• 20 are on track to achieve their energy efficiency targets (all except Belgium, Estonia, France, Germany, Malta, the Netherlands, Poland and Sweden);
• 13 Member States are on track to deliver on their national targets in all three areas.
This is an improvement on 2014, where 9 Member States were on track to deliver on their national targets in all three areas. Most Member States that were on track to their national target in 2014 remain on track in 2015 (Figure ES.2).
EU progress towards 2030 climate and energy targets
In 2014, the European Council agreed on the 2030 climate and energy policy framework for the EU and endorsed new targets on greenhouse gas emissions, renewable energy and energy efficiency for 2030. In 2015, the EU adopted an Energy Union Strategy to ensure that Europe has secure, affordable and climate-friendly energy and achieve its climate and energy goals for 2030.
The report shows that while projections show further decreases in EU GHG emissions beyond 2020, Member States project that the pace of these reductions will slow down. Planned reductions will only bring EU emissions between 27% and 30% below 1990 levels by 2030, which falls short of the 40% reduction target for 2030 (Figure ES.2).
However,therecentlyagreedreformoftheEU ETSand new policy proposals still being discussed in the EU (such as a post-2020 Effort Sharing Decision, measures to enhance energy efficiency and measures in the transport sector) have not yet been taken into account in projections. Discussions are also ongoing concerning the inclusion of land use and forestry into the2030 greenhousegasmitigationframework.
Sustaining the current pace of growth in renewable energy sources could enable the EU to achieve its target of a minimum 27% share by 2030. However, this will be challenging because market barriers persist, while support measures for renewable energy have been scaled back in various countries.
Furthermore, as economies pick up across Europe, further efforts will be necessary to ensure that energy consumption continues to decrease in order to reach the objective of reducing Europe's energy use by at least 27% by 2030 compared to a baseline scenario.
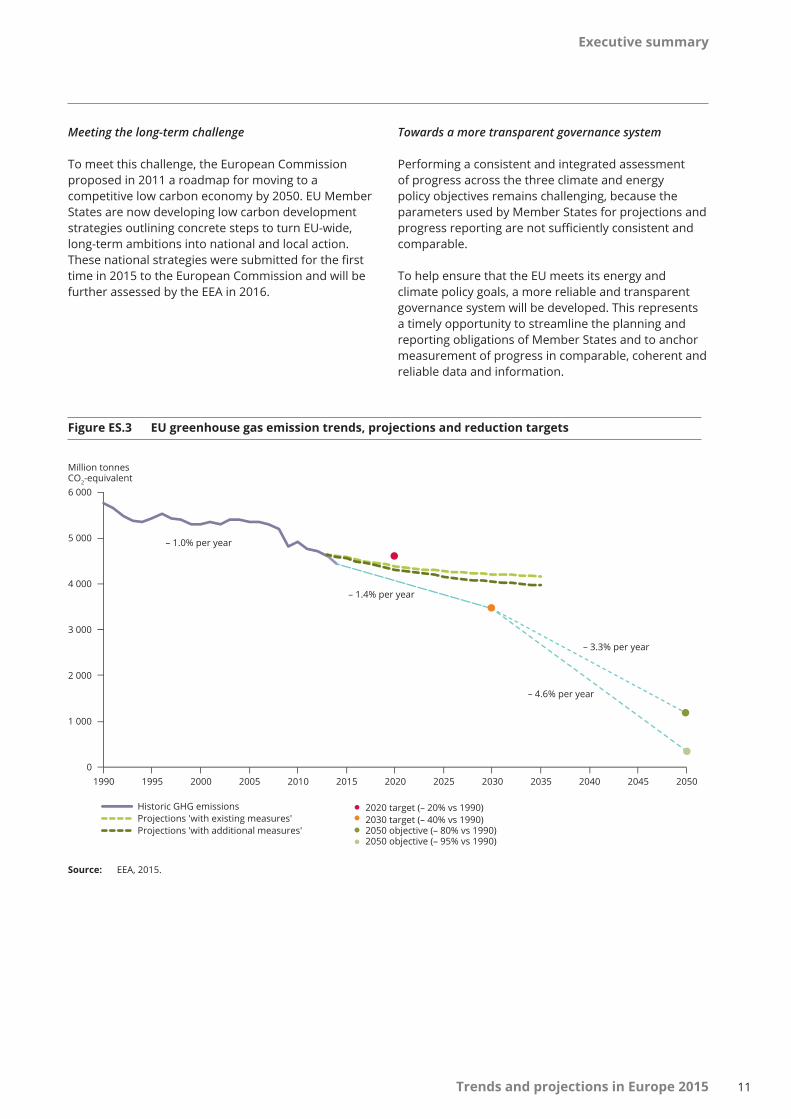
Outlook on greenhouse gas emission trends for 2050
The EU recently adopted new objectives for 2030, both domestically (through its 2030 climate and energy policy framework) and internationally (through its intended contribution to the UNFCCC), as part of a global effort to limit an average temperature increase below 2 °C compared to pre-industrial levels. These objectives are also consistent with a cost-effective pathway towards long term domestic emission reductions of 80% by 2050.
Although the EU and its Member States are making good progress towards their short-term goals on climate and energy, they will have to increase considerably their efforts to meet longer-term energy and decarbonisation objectives for 2050.
For example, the reduction in GHG emissions needed betweenthe2030targetlevel(– 40%below1990)and the 2050 EU objective (at least 80% below 1990) will have to be two to three times steeper than the necessary reduction between current levels and the 2030 target, which is itself steeper than the reductions achieved so far since 1990 (Figure ES.3).
Executive summary
11Trends and projections in Europe 2015
Meeting the long-term challenge
To meet this challenge, the European Commission proposed in 2011 a roadmap for moving to a competitive low carbon economy by 2050. EU Member States are now developing low carbon development strategies outlining concrete steps to turn EU-wide, long-term ambitions into national and local action. These national strategies were submitted for the first time in 2015 to the European Commission and will be further assessed by the EEA in 2016.
Towards a more transparent governance system
Performing a consistent and integrated assessment of progress across the three climate and energy policy objectives remains challenging, because the parameters used by Member States for projections and progress reporting are not sufficiently consistent and comparable.
To help ensure that the EU meets its energy and climate policy goals, a more reliable and transparent governance system will be developed. This represents a timely opportunity to streamline the planning and reporting obligations of Member States and to anchor measurement of progress in comparable, coherent and reliable data and information.
Figure ES.3 EU greenhouse gas emission trends, projections and reduction targets
0
1 000
2 000
3 000
4 000
5 000
6 000
1990 1995 2000 2005 2010 2015 2020 2025 2030 2035 2040 2045 2050
Million tonnes CO2-equivalent
Historic GHG emissions 2020 target (– 20% vs 1990) Projections 'with existing measures' 2030 target (– 40% vs 1990) Projections 'with additional measures' 2050 objective (– 80% vs 1990)
2050 objective (– 95% vs 1990)
– 1.0% per year
– 1.4% per year
– 3.3% per year
– 4.6% per year
Source: EEA, 2015.

Executive summary
12 Trends and projections in Europe 2015
About the Trends and projections report
The 2015 edition of the annual European Environment Agency (EEA) 'Trends and projections' report provides an updated assessment of the progress of the European Union (EU) and European countries towards their climate mitigation and energy targets.
The assessment of Member States’ progress towards their climate and energy targets is based on:
• National data on GHG emissions, renewable energy and energy consumption for 2013.
• Projections reported by Member States concerning expected trends in greenhouse gas emissions until 2035.
The report also presents preliminary ('approximated' or 'proxy') data for the year 2014. It is the first time that the report includes such proxy data for renewable energy and energy consumption (estimated by the EEA). Because the EEA has not yet been able to assess fully the level of uncertainty associated with these estimates, these data have not been used to assess countries’ performances towards their targets.
The report supports and complements the annual assessment, by the European Commission, of the progress of the EU and its Member States towards meeting the Kyoto and EU 2020 objectives, as required by EU regulation (the Monitoring Mechanism Regulation). This assessment is included in the 2015 European Union State of the Energy Union Report (forthcoming in November 2015).
EEA reports
This report is part of an annual package of EEA reports on climate change and energy. In particular this report is linked to:
• The EEA Technical report No 14/2015 Trends and projections in the EU ETS in 2015
• The EEA Technical report No 15/2015 Approximated EU GHG inventory: proxy GHG emission estimates for 2014
You can access all of our reports here: eea.europa.eu
About the EEA
The European Environment Agency (EEA) is an agency of the European Union. It aims to support sustainable development and to help achieve significant and measurable improvement in Europe's environment by providing timely, targeted, relevant and reliable information to policymaking agents and the public. It is supported in its work by the European environment information and observation network (Eionet), a network of 39 European countries.
13
Introduction
Trends and projections in Europe 2015
1 Introduction
1.1 Background
What is the 'Trends and projections' report?
The annual EEA 'Trends and projections' report provides an updated assessment of progress made by the European Union (EU) and European countries towards their climate mitigation and energy targets.
These objectives include:
• international commitments under the United Nations Framework Convention on Climate Change (UNFCCC) and its Kyoto Protocol;
• EU domestic policy targets consistent with the '20-20-20' objectives, which aim to achieve the following by 2020:
– 20% reduction of greenhouse gas (GHG) emissions (compared to 1990 levels),
– 20% share of renewables in energy consumption,
– 20% saving of the EU's primary energy consumption (compared to baseline projections).
Scope of the report
The report also presents some analysis of the progress made at EU level in meeting longer-term policy objectives, where relevant data are available.
The geographical scope of this assessment is limited tothe33EEAmembercountries (1) in the following contexts: the EU as a whole, its 28 individual Member States and the other EEA member countries.
Related reports
The report supports and complements the annual report of the European Commission to the European Parliament and the Council on the progress of the EUanditsMemberStatesinmeetingtheKyotoand EU 2020objectives,asrequiredbyArticle21oftheMonitoring Mechanism Regulation (MMR) (Regulation (EU) No 525/2013 on a mechanism for monitoring and reporting greenhouse gas emissions and for reporting other information at national and Union levelrelevant toclimatechangeandrepealingDecisionNo 280/2004/EC)(EU,2013a).Italsocomplementstheanalysis on information included in the EU 'State of the Energy Union' report (forthcoming, in November 2015).
1.2 Data
The report is based on several data sets for GHG emissions and energy, as described below.
• Unofficial GHG inventory data for the period from 1990 to 2013, reported by Member States to the EEAby31 August 2015:thesedatawillbefinalisedautumn 2015 and will be available in the EEA GHG data viewer (EEA, 2015a).
• Data related to the EU Emissions Trading System (EUETS)until2014,availablefromtheEEA'sEU ETSdata viewer (EEA, 2015b). Most of these data are sourced from the European Commission through the EU Transaction Log (EUTL).
• Energy statistics on energy production and energy consumption, as well as the share of energy from renewable sources, for the period from 2005 to 2013, available from the European Commission's
(1) The 33 member countries of the EEA are Austria, Belgium, Bulgaria, Croatia, Cyprus, the Czech Republic, Denmark, Estonia, Finland, France, Germany, Greece, Hungary, Iceland, Ireland, Italy, Latvia, Liechtenstein, Lithuania, Luxembourg, Malta, the Netherlands, Norway, Poland, Portugal, Romania, Slovakia, Slovenia, Spain, Sweden, Switzerland, Turkey and the United Kingdom. The European Environment Agency is not to be confused with the European Economic Area, which comprises 31 member countries.
Introduction
14 Trends and projections in Europe 2015
statistical services (Eurostat) and Eurostat's Short Assessment of Renewable Energy Sources (SHARES) tool (Eurostat, 2015a).
• Projections of GHG emissions until 2035, reported by MemberStatesuntil31 August 2015totheEuropeanCommission (EEA, 2015c). These projections are reported in two scenarios: a 'with existing measures' (WEM) scenario, similar to the 'Baseline Scenario' developed by the Commission; and a 'with additional measures' (WAM) scenario, which also takes into account measures planned but not yet adopted. Reported projections are disaggregated by the main emitting sector, including a division between emissions covered by the ETS and emissions covered by the Effort Sharing Decision (ESD) (Decision No 406/2009/EContheeffortofMemberStatestoreduce their greenhouse gas emissions to meet the Community's greenhouse gas emission reduction commitments up to 2020) (EU, 2009a).
• Approximated ('proxy') GHG emission data for 2014, reported by 23 Member States and Norway until 3 August 2015.ForthoseMemberStateswhichdidnot report proxy emissions, the EEA used its own proxy estimates (based on a methodology in use since 2010) (EEA, 2015d).
• Approximated data on the 2014 share of energy consumption from renewable sources in EU Member States, as estimated by the ETC/ACM (EEA, 2015e).
• Approximated data on 2014 levels for primary energy consumption in EU Member States, as estimated by the ETC/ACM (EEA, 2015f).
Detailed data and assessment results are provided in the annexes to this report.
1.3 Approach to assessing progress
The report employs a twofold approach for assessing progress towards 2020 climate and energy targets, as explained below.
• For energy and GHG emission targets, an assessment of current progress is presented. Such assessment is based on a comparison between the
latest historic trends until 2013 and the relevant levels for comparison, such as interim targets, indicative trajectories or relevant target paths (e.g. annualGHGemissiontargetsfor2013to2020 under the ESD, interim targets and indicative trajectories for the development of renewable energy, or linear trajectories for the reduction or limitation of energy consumption). The assessment is complemented by the outlook for the 2014 situation based on approximated estimates from Member States(GHG emissions)andtheEEA(energy).
• The assessment of progress towards GHG emission targets is complemented by an assessment of projected progress. This assessment is based on a comparison between projected emissions reported by Member States in 2015 and the relevant targets. In the case of renewable energy and energy efficiency, similar projections are not available from Member States in a scenario suitable for comparison with targets or trajectories (in particular, a WEM scenario which only takes existing measures into account). Therefore, the assessment of progress towards energytargetsonlyreliesonhistoricdata (2).
The 2014 ('approximated' or 'proxy') data on GHG emissions, renewable energy and energy consumption were used to assess countries’ performances towards their targets, because the EEA has not yet been able to assess the level of uncertainty associated with the proxy estimates for renewable energy and energy consumption, which are included for the time in this report.
1.4 Report structure
Following an integrated overview of the latest progress towards the '20-20-20' climate and energy targets for 2020 (Chapter 2), the report separately addresses progress towards each of the three policy objectives: GHG emissions, renewable energy and energy efficiency. Each of these chapters also includes the outlook for 2030 and 2050 policy objectives.
• Chapter 3 provides detailed information on current and projected progress towards GHG emission targets. This multilevel analysis covers overall EU progress towards its 20% reduction objective by 2020,progresswithintheEU ETStowardsEU-wide
(2) The projections, as reported by Member States, naturally imply a certain degree of uncertainty: they make predictions about developments in future which are likely to have different outcomes. According to the EEA (2015g), differences of over 10% can be found between projected values and existing developments, even over a limited time horizon. Projections in this report should thus be read and understood in this context.
Introduction
15Trends and projections in Europe 2015
emission caps, and Member States' progress towards their national annual targets set under the ESD. Such targets concern only those GHG emissionsnotcoveredbytheEU ETS.
• Chapter 4 tracks progress towards renewable energy targets under the Renewable Energy Directive (RED) (Directive 2009/28/EC on the promotion of the use of energy from renewable sources and amending and subsequently repealing Directives 2001/77/EC and 2003/30/EC) (EU, 2009b).
• Chapter 5 analyses progress made in the EU towards reducing energy consumption and achieving energy efficiency objectives for 2020 and national indicative targets set by Member States under the Energy Efficiency Directive (EED) (Directive 2012/27/EU on energy efficiency, amending Directives 2009/125/EC and 2010/30/EU and repealing Directives 2004/8/EC and 2006/32/EC) (EU, 2012).
The annexes provide detailed methodological and technical information.
Trends and projections in Europe 201516
Overall progress towards the EU's '20‑20‑20' climate and energy targets
2 Overall progress towards the EU's '20‑20‑20' climate and energy targets
EU and Member State progress
• The EU is on track to meet its 2020 climate and energy targets: a 20% reduction in GHG emissions compared to 1990, a 20% share of renewable energy sources (RES) in energy consumption and a 20% reduction in primary energy consumption compared to baseline projections.
• This assessment is based on national data on GHGs, renewable energy and energy consumption for 2013, and projections reported by Member States on expected trends in GHG emissions until 2035. It is also confirmed by preliminary data for the year 2014.
• While the EU as a whole is on target, the situation differs across individual Member States: 24 are expected to meet their GHG emission targets, 20 to achieve their renewable energy targets and 20 to achieve their energy efficiency targets.
• A total of 13 Member States are on track to deliver on their national targets in all three areas, an improvement on the 2014 assessment, where this was the case for only nine Member States. Most Member States that were on course to meet their national target in 2014 hold similar status in 2015.
• To ensure that the EU remains on a cost-effective track towards meeting its long-term climate objective, climate and energy targets for 2030 were endorsed in 2014. These include a 40% domestic reduction of EU GHG emissions compared to 1990 levels, a minimum 27% share of renewable energy consumption in the EU and a minimum 27% reduction in the EU's primary energy consumption, compared to baseline projections. Although the EU is expected to achieve its 2020 targets, current efforts need to be stepped up if it is to meet these more ambitious longer-term objectives. Policy proposals are under discussion at EU level. Once adopted, these will require swift and effective actions at national level.
Behind the numbers
• Between 2005 and 2013, the EU reduced its energy intensity (the use of energy to generate economic output). It also sped up the deployment of RES (resulting in a shift away from CO2-intensive fuels in electricity and heat production). These two factors contributed significantly to the decrease in GHG emissions — their effects on emission trends outweighed factors responsible for emission increases, such as demographic and economic growths and a switch back fromgastothemoreCO2-intensive coal.
• Weather conditions play a key role in annual changes in energy consumption and GHG emissions. For example, a particularlycoldwinterin2010wasakeyfactorintheincreaseinGHGemissionsobservedthatyear(theonlyincrease between 2005 and 2013). In contrast, warmer years such as 2013 and 2014 had the opposite effect.
• The significant variance in the parameters used by Member States for projections and progress reporting towards their 2020 climate and energy objectives represents an obstacle to carrying out a consistent, integrated assessment of progress based on information reported by countries. Amongst the three streams of reporting obligations (for GHG emissions,RESandenergyefficiency),themostcompleteandtransparentprovisionsareontheclimateside (GHGemissions).
• The setting up of a reliable and transparent governance of the Energy Union, including the monitoring of progress towards the 2030 climate and energy targets, represents a timely opportunity to establish a consistent reporting structure for these targets.
Overall progress towards the EU's '20‑20‑20' climate and energy targets
17Trends and projections in Europe 2015
2.1 EU progress towards its '20‑20‑20' climate and energy targets
Based on the analysis of data and information reported by Member States in 2014 and 2015, the EU is on course to meet each of its 2020 targets for GHG emissions, renewable energy and energy efficiency. Progress towards the GHG target is substantial and more pronounced than for the renewable energy and energy efficiency targets (Figure 2.1).
• GHG emissions. These were already 19.8% below 1990 levels in 2013, very close to the 20% reduction target set for 2020. The EU may achieve a GHG reduction of 24% below 1990 levels by 2020 with the current measures in place, according to the latest projections from Member States. Additional measures (currently planned by Member States) could further reduce emissions to 25% below 1990 levels. Most of the savings in GHG emissions areexpectedtotakeplaceundertheEU ETS,which today represents about 45% of total EU emissions. Approximated estimates of 2014 GHG emissions reported by Member States indicate that GHG emissions decreased significantly in 2014. Compared to 1990 levels, the reduction reached 23% (24% if international aviation is excluded). The year 2014 was exceptionally warm in almost all parts of Europe, resulting in a markedly low heating energy demand compared to 2013. This 2014 level is significantly lower than that anticipated by Member States in their projections.
• Renewable energy. The steady deployment of RES in the EU's energy mix continues. The consumption of renewable energy continued to increase in 2013, standing at 15% of gross final energy consumption and getting closer to the 20% target for 2020. The 2013 share is higher than indicative levels set for thatyearinboththeRED (3) and Member States' national renewable energy action plans (NREAPs). The 2020 target could be attained if Member States can sustain the speed at which they have been developing RES, so far. However, as we approach 2020, the trajectories for meeting the national targets become steeper, and more costly projects will have to be developed, while market barriers persist in several Member States. According to approximated estimates from the EEA, the EU RES share further increased in 2014 and remained above the indicative share set in the RED for the two-year period from 2013 to 2014.
• Energy efficiency. The EU is reducing its energy consumption. Since 2005, the EU's primary and final energy consumption has been decreasing at a pace which, if sustained until 2020, would be sufficient for the EU to meet its 20% energy efficiency target. Again, the pace might be difficult to sustain because European legislation implementation remains weak in several Member States. Considering EEA preliminary estimates, primary energy consumption further decreased in 2014 in most Member States. This decrease can be partly explained by the warmer temperatures in 2014, compared to 2013.
These results seem particularly consistent with the European Commission's 2011 communication A Roadmap for moving to a competitive low-carbon economy in 2050 (EC, 2011a): delivering on its commitment to reach 20% renewables and achieve 20% energy efficiency by 2020 would enable the EU to outperform the 20% emission reduction target, and achieve a 25% reduction by 2020.
This also underlines the interconnected and reciprocal nature of progress made towards each policy objective:
• lower energy consumption levels (encouraged in part by the energy efficiency target) and a less carbon-intensive fuel mix (encouraged in part by the renewables target) are two key drivers for reducing GHG emissions;
• an increasing share of RES helps meet the energy efficiency target, as a 100% transformation efficiency is assumed for renewables, which reduces levels of primary energy consumption (EEA, 2014f);
• measures primarily designed to deliver GHG emission reductions (i.e. establishing a carbon price signal through the EU ETS) may encourage investments in low-carbon energy sources and energy efficiency.
These interactions between the 2020 climate and energy targets are at the core of the EU's climate and energy package adopted in 2009. They underline the importance of using consistent assumptions to design policies and of reporting consistent information under different obligations, in order to improve the quality of future progress assessments (ETC/ACM, 2013).
The progress made to date by the EU towards its 2020 climate and energy targets reflects a collective
(3) The indicative RED targets are set as an average for two consecutive years. For the EU, the average of its real-life RES shares in 2013 and 2014 must be above 12.1%.

Overall progress towards the EU's '20‑20‑20' climate and energy targets
18 Trends and projections in Europe 2015
achievement by the EU and its Member States. They adopted a range of policies and measures to reduce GHG emissions, deployed renewable energy across Europe (through support measures such as premium or feed-in tariffs, quota systems, tax incentives and tender schemes) and improved energy efficiency through building regulations, product labelling and vehicle emissions standards, for example.
This progress was reinforced by the impacts of the economic crisis, during which lower levels of economic activity severely affected the EU's energy demand and related GHG emissions, in particular in 2009 (Figure 2.1). In turn, the lower demand for final energy (combined with an increase in renewable energy capacity) bolstered the increase in the share of renewable energy in energy consumption. As the effects of the economic recession slowly dissipate, it is important for the EU and its Member States to maintain or increase their efforts in implementing an adequate mix of policies, in order to further decouple economic growth from environmental impacts and achieve all the '20-20-20' targets.
2.2 Progress towards EU mid‑ and long‑term climate and energy objectives
The EU has articulated a long-term goal for 2050 of reducing Europe's GHG emissions by 80% to 95%, compared to 1990 levels. To ensure that the EU is on a cost-effective track towards meeting this long-term objective, EU heads of state or government agreed, in October 2014, on a climate and energy policy framework for the EU, and endorsed new climate and energy targets for 2030 (European Council, 2014).
The framework includes a binding target of a 40% (at least)domesticreductioninGHGemissions,compared to 1990. This target will be delivered through a 43% reduction in the ETS sectors and a 30% reduction in the non-ETS sectors by 2030, compared to 2005. According to current Member State projections, a reductionofEUGHGemissionsby27%(onthebasisof existing mitigation measures) up to 30% (accounting for planned national measures) could be achieved by 2030, compared to 1990 levels. The EU Reference
Figure 2.1 EU progress towards 2020 climate and energy targets
Note: Theenergyefficiencytargetfor2020isdefinedasanabsolutetarget,set20%belowthelevelinprimaryenergyconsumptionprojectedfor2020inthe2007EnergyBaselineScenariooftheEuropeanCommission.Inthisfigure,thistargetisexpressedasarelativechangecompared to 2005 levels of EU primary energy consumption, in order to show the required reduction in primary energy consumption over time. The year 2005 was chosen because it is used as a base year for GHG (in the EU ETS and under the ESD) and for renewable energy targets. It also corresponds to a peak in energy consumption in the EU.
Source: EEA, 2015a, 2015b, 2015c, 2015e and EEA, 2015f; Eurostat, 2015a and 2015b.
9%
16%
– 11%
– 7%
– 23% – 24%
– 25%
– 30
– 20
– 10
0
10
20
(%)
2005 2006 2007 2008 2009 2010 2011 2012 2013 2014 2015 2016 2017 2018 2019 2020
Energy efficiency Primary energy consumption reduction compared to 2005 levels
Renewable energy Share of renewable energy in gross final energy consumption
Greenhouse gases emissions reduction compared to 1990 level
Target: 20%
Target: – 13%
(– 20% vs baseline)
Trajectory from national action plans
Trajectory from Renewable Energy Directive
Linear target path
Projections - with existing measures Projections - with additional measures
Target: – 20%

Overall progress towards the EU's '20‑20‑20' climate and energy targets
19Trends and projections in Europe 2015
Scenario 2013(EC,2013a)reachedsimilarconclusions(32% GHG reduction in 2030, if no further policies are adopted). These projected levels are not sufficient to meet the 40% target by 2030, however the projections do not take into account new policy proposals, still being discussed in the EU to enable the achievement of this 2030 target.
The European Council also adopted a target of at least 27% for the share of renewable energy consumption for 2030. This target is binding at EU level, but with no fixed targets for the individual Member States. The target is intended to provide flexibility for Member States to set their own more ambitious national objectives for increased renewable energy, and to support them, in line with the state aid guidelines, while taking into account their degree of integration into the internal energy market. Maintaining the current pace of RES deployment across Europe would enable the EU to achieve RES shares above the 20% target in 2020 and the 27% target in 2030. However, it cannot be assumed that this will transpire, as the least costly options will become scarcer and current support mechanisms are being phased out. Moreover, even if the 2030 target is achieved, renewable energy would need to grow even faster until 2050 in order to attain the minimum levels consistent with the EU's long-term decarbonisation objectives. Growth between 2030 and 2050 will have to be two to three times faster than in the period from 2005 until 2013.
Finally, EU heads of state or government also adopted an indicative target at EU level of at least 27% for improving energy efficiency in 2030 compared to projections of future energy consumption (based on the European Commission's 2007 Energy Baseline Scenario (EC, 2008)). The target will be reviewed by 2020, with an EU level of 30% in mind. A 27% reduction target in 2030 compared to the 2007 Energy Baseline Scenario is equivalent to a reduction of primary energy consumption by about 20% below 2005 levels. For final energy consumption, the 2030 target would mean a 12%decreasefrom2005levels.Withthesetargets,the average reduction in energy consumption between 2020 and 2030 would be slightly lower than that needed between 2005 and 2020 to achieve the 2020 energy efficiency targets. In any case, achieving the 2030 targets requires not only a strong implementation of energy efficiency measures, but also a rapid change in consumer behaviour.
Although the EU and its Member States are making good progress towards their short-term goals
on climate and energy, they will have to increase considerably their efforts to meet longer-term energy and decarbonisation objectives for 2050. To meet this challenge, the European Commission proposed in 2011 a Roadmap for moving to a competitive low carbon economy by 2050. EU Member States are now developing low carbon development strategies outlining concrete steps to turn EU-wide, long-term ambitions into national and local action. These national strategies were submitted for the first time in 2015 to the European Commission and will be further assessed by the EEA in 2016.
2.3 Progress towards national 2020 climate and energy objectives
Overall, the EU is currently on track to meet its three climate and energy targets for 2020; however, Member States are not all individually performing well with respect to their national targets (Table 2.1). The projected overachievements of the majority of Member States offset the slower progress projected in a few Member States.
• A total of 24 Member States are on schedule to meet their national GHG targets. These differentiatedtargetsweresetundertheESD (4) and cover about 55% of total GHG emissions at EU level.
• A total of 20 Member States are on course concerning renewable energy targets. These differentiated targets were set under the RED, taking into account the large variety of national circumstances in relation to the potential for renewable energy growth.
• A total of 20 Member States are considered to be on target regarding energy efficiency. These indicative national targets, relative to primary or final energy consumption in 2020, were set by Member States under the EED.
As in the 2014 assessment (EEA, 2014a), several Member States are considered to be on track to meet their three climate and energy targets, while no Member State underperforms in all three domains. The number of Member States that are currently expected to achieve their national 2020 GHG emission targets increased from 14 to 24 compared to last year, while progress towards the renewables and energy efficiency target have remained relatively stable over thepast2 years.
(4) The targets set under the ESD relate to GHG emissions not covered by the EU ETS, e.g. emissions from sectors such as transport, buildings or agriculture.TheremainingGHGemissionsarecoveredbytheEU ETSandarethereforegovernedbyasinglecapsetatEUlevel.Emissionsandremovalsfromlanduse,land-usechangeandforestry(LULUCF)areneithercoveredbytheEU ETS,norincludedintheESD.

Overall progress towards the EU's '20‑20‑20' climate and energy targets
20 Trends and projections in Europe 2015
Table 2.1 Progress of Member States towards 2020 climate and energy targets
GHG emissions (Effort Sharing Decision) Renewable energy sources Energy efficiency
Member State
On
trac
k (g
reen
)/no
t on
trac
k
(yel
low
or
oran
ge)
Distance between
On
trac
k (g
reen
)/no
t on
trac
k
(yel
low
or
oran
ge)
Distance between
On
trac
k (g
reen
)/no
t on
trac
k
(ora
nge)
Distance between
2013 ESD emissions
projected 2020 ESD emissions
sum of projected 2013 to 2020 ESD emissions 2013 RES share 2013 PEC
WEM WAM WEM WAM
and and and
2013 ESD target
2020 ESD target
sum of 2013 to 2020 ESD targets
NREAP trajectory
RED trajectory
2005 to 2020 linear target path
Mt CO2-eq. Mt CO2-eq. Mt CO2-eq. Mt CO2-eq. Mt CO2-eq. Percentage points
Percentage points ktoe
Austria 2.9 – 2 3 0 18 0.8 6.1 177Belgium 4.3 – 4 NE 1 NE 2.1 2.5 – 42Bulgaria 3.8 6 NE 37 NE 7.6 7.6 1 536Croatia 2.6 4 5 27 31 2.2 3.2 2 679Cyprus 1.6 3 3 22 18 0.3 2.2 162Czech Republic 0.7 10 15 42 58 1.4 4.2 1 208
Denmark 3.4 0 16 NE – 0.1 6.3 662Estonia 0.5 1 1 6 7 2.3 5.5 – 553Finland 0.4 0 0 3 3 5.2 5.5 1 926France 22.4 14 NE 178 NE – 0.8 0.1 – 7 158Germany 5.0 4 NE 80 NE 0.4 2.9 – 6 970Greece 12.9 18 NE 116 NE 5.1 4.8 3 769Hungary 12.7 21 23 128 115 2.3 2.9 5 091Ireland 3.8 – 5 – 2 – 1 9 – 0.8 0.8 847Italy 37.4 18 31 232 286 6.8 8.0 14 069Latvia 0.9 1 2 7 8 2.4 2.3 619Lithuania 0.7 2 3 12 14 4.0 5.6 1 476Luxembourg 0.0 – 2 NE – 8 NE – 0.3 – 0.3 326Malta 0.1 0 0 2 2 0.0 0.8 – 12Netherlands 13.9 6 6 85 87 – 2.1 – 1.4 – 1 621Poland 4.6 13 NE 73 NE 0.3 1.8 – 886Portugal 9.6 13 13 88 89 – 1.4 2.1 2 361Romania 8.7 11 14 80 93 4.5 4.2 9 190Slovakia 2.2 4 5 24 28 0.9 0.9 837Slovenia 1.5 1 NE 11 NE 2.0 2.8 411Spain 31.0 6 14 149 178 – 0.2 3.3 13 542Sweden 6.6 5 NE 48 NE 6.5 9.5 – 1 195United Kingdom 10.3 11 15 85 95 0.1 – 0.3 4 147
EU 160 205 1 543 1 724 1.3 2.9 21 796
Note: Valuesrepresentthedifferencebetweenthetargetandtheparameterconsidered.Apositivevalueindicatesthata targetismet. For GHGs, Member States are considered to be: • on track (green) if GHG emissions in 2013 were below their respective annual ESD target and if emissions are expected to remain
below the annual ESD targets, any year between 2014 and 2020 (based on approximated estimates for 2014 and projections for 2015 to 2020);
• not on track, if: – (yellow) historic emissions in 2013 were below their 2013 ESD target, but projections in the WEM scenario show that 2020
emissions will be higher than the 2020 ESD target, – (orange) historic emissions in 2013 were above their 2013 ESD target, or projections (WEM and WAM) show that the emissions
for the whole period from 2013 to 2020 will be above the overall 2013–2020 emission budget under the ESD (this is equivalent to saying that the 2020 target will be missed, despite the carry-over of any surplus from previous years). These Member States canstillachievetheir2020targetWAMorbyusingflexibilityprovisionsundertheESD.
For RES, Member States are considered to be: • on track (green) if both interim targets (NREAP and RED) were exceeded in 2013; • not on track, if: – (yellow) the NREAP target was not met but the RED was met in 2013, – (orange) the RED target was not met in 2013. For energy efficiency: Member States are considered to be: • on track (green) if the primary energy consumption in 2013 remained below the linear 2005–2020 target path, • not on track (orange) if the primary energy consumption in 2013 was above the linear target path. NE: not estimated Forenergyefficiency,thedistancebetweenthe2013primaryenergyconsumptionandthelineartargetpathbetween2005andthe
2020targetatEUleveldiffersfromthesumofthedistancescalculatedforeachMemberState,becausethesumoftheMemberStates’targets on primary energy consumption is higher than the EU’s overall target.
Source: Based on analyses in individual chapters.

Overall progress towards the EU's '20‑20‑20' climate and energy targets
21Trends and projections in Europe 2015
In total, 13 Member States (Bulgaria, Croatia, Cyprus, the Czech Republic, Finland, Greece, Hungary, Italy, Latvia, Lithuania, Romania, Slovakia and Slovenia) are considered to be on course for meeting all three of their national climate and energy targets for 2020, based on their situations as observed in 2013(Table 2.1).Thisoutcomemayreflect,tosomeextent, the fact that some of the national targets to be achieved by 2020 do not actually require absolute reductions in GHG emissions or energy consumption, but only relative 'limitation' efforts, i.e. for some Member States, emissions or consumption are allowed to increase until 2020. In 10 of the countries mentioned above (i.e. all except Cyprus, Greece and Italy), at least one of the two 2020 targets on GHG emissions and on primary energy consumption for 2020 is higher than therespective2005level (5).
The share of energy-related GHG emissions covered by the ESD is lower than under the ETS. Therefore, the progress made by Member States towards their renewable targets, and to a lesser extent towards their energy efficiency targets, has a comparatively smaller effect on their ESD emissions (for which
they have a national target to achieve) than on their ETS emissions. The link between the three targets is therefore somewhat weaker at national level than at EU level (where all emissions are considered in the 20% reduction target). Renewable and energy efficiency policies nevertheless contribute to reduce emissions in the sectors covered by the ESD, in particular the transport and building sectors. Energy efficiency improvements and the development of RES have been playing different roles across Member States in helping them to make progress towards their national ESD targets. Two different examples of pathways followed in attaining ESD targets are presented in Box 2.1.
In the four Member States projected to have their ESD GHG emissions above their targets for the year 2020 (i.e. Austria, Belgium, Ireland and Luxembourg), current policies appear to be insufficiently effective at overcoming obstacles to generate sufficient emission reductions. Such obstacles might be technical, for example, a relatively low potential for RES, or economic, such as the low taxes on fuel sales compared to neighbouring countries (as is the case for Luxembourg).
(5) Under the ESD, the national GHG emission targets for 2020 were set on the basis of Member States' relative wealth (measured by GDP per capita per capita). Less wealthy countries are allowed emission increases in these sectors because their relatively higher economic growth is likely to be accompanied by higher emissions. This is particularly the case for Bulgaria, the Czech Republic, Hungary, Latvia, Lithuania, Slovakia, Slovenia and Romania. Furthermore, five Member States of the same group of countries performing well in all three policy objectives (Finland, Hungary, Latvia, Romania and Slovenia) have also voluntarily adopted positive limits (i.e. increase within a specified constraint) on primary energy consumption for 2020.
Box 2.1 Examples of contributions of energy efficiency and renewable energy towards ESD targets in Sweden and
the United Kingdom
SwedenandtheUnitedKingdomhavesimilarGHGemissiontargetsfor2020undertheESD(− 17%and− 16%,respectively),and are both making good progress towards these targets.
However, these countries' followed different pathways in energy consumption and renewable energy.
• Between 2005 and 2013, primary energy consumption declined by approximately 13% in the United Kingdom, while decreasing by only 3% in Sweden during that period. The introduction of policies and measures in the United Kingdom's transport sector (i.e. fuel efficiency standards, investments in public transport) may have contributed to a 9% reduction in final energy consumption between 2005 and 2013. The implementation of policies and measures in the residential sector (i.e. low-carbon building regulations) also contributed to a reduction in the final energy consumption of that sector during this period (Eurostat, 2015a). By contrast, despite government efforts, Sweden achieved a smaller reductioninfinalenergyconsumptioninboththetransportsector(− 3%)andtheresidentialsector(− 4%)duringthisperiod (Eurostat, 2015a).
• In 2013, the share of renewables used in the generation of residential heating and cooling was much higher in Sweden (67%) than in the United Kingdom (3%), reflecting the country's effective use of district heating networks (Eurostat, 2015f). Furthermore, the promotion of biofuels in Sweden contributed to this country overachieving on its renewable energy target for transport (10%), with well over 16% renewable energy use in the transport sector. This compares to only 4% in the United Kingdom. To achieve its ESD target, Sweden has therefore been relying more than the United Kingdom on reducing the carbon intensity of its energy consumption.
Overall progress towards the EU's '20‑20‑20' climate and energy targets
22 Trends and projections in Europe 2015
The different national circumstances of each Member State, with regard to their emission profile, may also play a role in making targets more or less difficult to attain. As a consequence of the economic recession, many Member States are also operating under stricter financial constraints that can limit the capacity of national governments to finance future investments in new technologies.
2.4 Main drivers of GHG emission trends
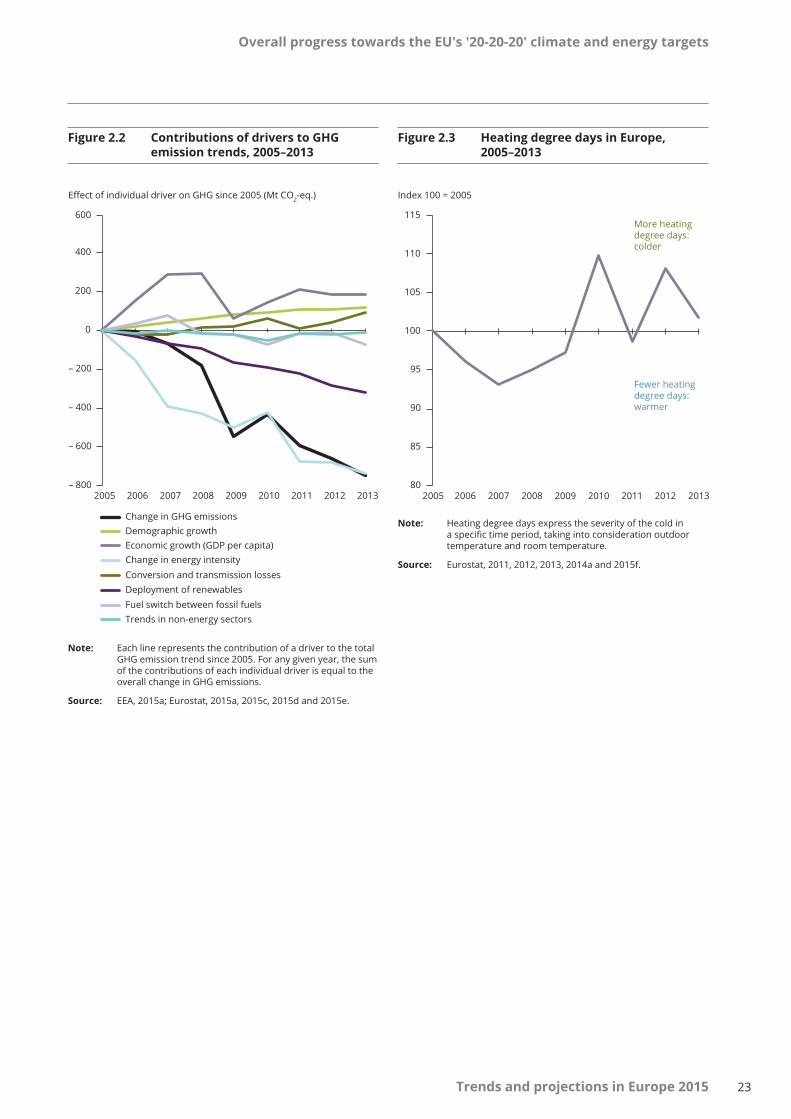
The drop in EU GHG emissions between 2005 and 2013 resulted from the combination of several driving forces (energy efficiency improvements, increase in the use of renewables, etc.). The relative effects of various drivers on emission trends during this period were quantified throughadecompositionanalysis (6). As this method does not allow for capturing all relevant factors at once, its results were complemented by an analysis of the effects of annual variations in weather conditions on GHG emission trends over this time period.
The EU is becoming decreasingly energy intensive over time: its economy is growing while it requires decreasingamountsofenergy (7). This trend is primarily responsible for the reductions in GHG emissions observedintheEUbetween2005and2013(Figure 2.2).Reductions in energy intensity occurred in all years during this period, except in 2010, following the recovery from the economic crisis and a particularly coldwinter(Figure2.2),whichwasreflectedbya sharpincrease in the number of heating degree days in 2010 compared to the previous year (Figure 2.3). The 14% reduction in the EU's energy intensity between 2005 and 2013 was driven by a number of factors including structural change and improvements in energy efficiency resulting from a range of policies and measures, such as stricter building regulations and energy product labelling.
Reductions in GHG emissions are also attributable to a changeinthefossilfuelmix,andtheincreasinguse
ofcarbon-freeenergysources,includingrenewables (8). The EU-wide use of fossil fuels such as hard coal and gas in gross electricity production declined by 12% and 23%, respectively, between 2005 and 2013, whereas the EU-wide use of renewables in gross electricity production increased by 73% over the same time period (Eurostat, 2015h). The increasing contribution of this driver to GHG reductions over time reflects the effects of policies and measures supporting the deployment of renewables (i.e. feed-in tariffs), the establishmentofacarbonpricethroughtheEU ETS,and more external factors such as fluctuations in fossil fuel prices.
The contributions of upward drivers on GHG emissions (such as economic and demographic growth) over the whole period from 2005 to 2013 were mainly offset by the GHG reductions associated with lower levels of energy intensity, and to a lesser extent, a shift to renewable energy (Figure 2.2). However, lower levels of activity following the economic recession also contributed to an overall reduction in GHG emissions over the time period, as represented by the lower contribution of GDP to emissions increases after 2010, compared to the pre-recession period.
Fossilfuel-switching (9) contributed to increases in GHG emissions for several years during the 2005 to 2013 time period. It is likely that cheaper coal prices following the economic recession, combined with exogenous developments such as the shale gas revolutionintheUnitedStates (10) (amongst other factors), contributed to fuel-switching towards more CO2 intensive fuels. At the same time, when the EU ETSdeliveredastrongEUApricesignalaboveEUR 20per tonne CO2 in the first half of 2008, this encouraged fuel-switching to lower CO2-intensive fuels (i.e. from coal to natural gas) and contributed to GHG emission reductions (Figure 2.2). While the price signal from the EU ETS weakened in subsequent years, GHG emission reductions were still influenced by fuel-switching in both 2010 and 2013 in response to other exogenous factors(i.e. differentialsinfossilfuelprices).
(6) The decomposition methodology followed the Logarithmic Mean Divisia Index (LMDI) approach (Ang, 2005). The drivers assessed are explained throughout the footnotes.
(7) Energy intensity is calculated by dividing gross inland energy consumption by gross domestic product.(8) The effect of this driver is reflected through the share of non-renewable fuels in gross final energy consumption, which is itself calculated by
dividing gross final energy consumption of energy from non-renewables by the total gross final energy consumption of energy.(9) Fuel-switching is calculated by dividing CO2 emissions from fossil fuel use by gross final energy consumption of energy from non-renewable
sources.(10) The shale gas revolution in the United States refers to the extraction of non-conventional sources of shale gas. The exploitation of cheaper
shale gas reserves reduced the demand for alternatives such as coal that impacted world energy prices and resulted in increased global exports of coal from the United States.
Overall progress towards the EU's '20‑20‑20' climate and energy targets
23Trends and projections in Europe 2015
Figure 2.2 Contributions of drivers to GHG emission trends, 2005–2013
Note: Each line represents the contribution of a driver to the total GHG emission trend since 2005. For any given year, the sum of the contributions of each individual driver is equal to the overall change in GHG emissions.
Source: EEA, 2015a; Eurostat, 2015a, 2015c, 2015d and 2015e.
Note: Heating degree days express the severity of the cold in aspecifictimeperiod,takingintoconsiderationoutdoortemperature and room temperature.
Source: Eurostat, 2011, 2012, 2013, 2014a and 2015f.
– 800
– 600
– 400
– 200
0
200
400
2005 2006 2007 2008 2009 2010 2011 2012 2013
Effect of individual driver on GHG since 2005 (Mt CO2-eq.)
Change in GHG emissions Demographic growth Economic growth (GDP per capita) Change in energy intensity Conversion and transmission losses Deployment of renewables Fuel switch between fossil fuels Trends in non-energy sectors
600
80
85
90
95
100
105
110
115
2005 2006 2007 2008 2009 2010 2011 2012 2013
Index 100 = 2005
Fewer heating degree days: warmer
More heating degree days: colder
Figure 2.3 Heating degree days in Europe, 2005–2013

Trends and projections in Europe 201524
Progress towards GHG emission targets
3 Progress towards GHG emission targets
Progress in figures
• The EU is on track to meet its target to reduce GHG emissions by 20% by 2020 under the UNFCCC; this corresponds to a 20% reduction compared to base-year levels for the second commitment period under the Kyoto Protocol (from 2013 until 2020).
• EU GHG emissions were 19.8% below 1990 levels in 2013. They are expected to decrease to levels between 24% and 25% below 1990 levels, by 2020 (national projections reported by Member States in 2015). EU GHG emissions may have decreased by 4% in 2014 and reached a level of 23% below 1990 (recent and preliminary estimates of 2014 levels). This level is lower than the levels anticipated by Member States in their projections for 2014.
• EU-15 (11) emissions were on average 11.8% below base-year emissions for the first commitment period of the Kyoto Protocol (from 2008 until 2012), well below the 8% reduction target (compared to base-year levels).
EU ETS sectors
• Between 2005 and 2014, emissions covered by the EU ETS (which represents about 45% of total EU emissions) decreased by 24%.
• 2014 ETS emissions were already below the 2020 cap. Between 2015 and 2020, ETS emissions are expected to decrease by a further 8%. Between 2005 and 2020, the overall emission reduction could reach at least 26%.
• The ETS has undergone a reform so as to address the current surplus of allowances and enhance the ability of the EU ETS to meet medium and long-term emission reduction targets cost-effectively.
Non-EU ETS sectors
• In sectors not covered by the ETS, GHG emissions decreased by 9.6% between 2005 and 2013. They are expected to further decrease between 2013 and 2020, and to remain lower than the target levels set under the ESD. Preliminary data for 2014 already indicate a 12.7% decrease compared to 2005.
• In 2013, national 'ESD emissions' (the difference between total emissions and ETS emissions) were below national ESD targets in all Member States. Preliminary data for 2014 seem to confirm this trend across the EU.
• National projections show that in most Member States, ESD emissions will remain below annual ESD targets until 2020. However, in four Member States (Austria, Belgium, Ireland and Luxembourg), emissions in 2020 could exceed the targets by 2020 if no additional measures are implemented. These countries could nevertheless achieve their ESD targets by using flexibility provisions under the ESD (using surplus compliance units (AEAs) accumulated in the early years of the 2013-to-2020 period to compensate for shortfalls in the later years of this period (Austria (WAM) and Belgium)). They could also buy compliance units from other countries. Altogether, based on the latest data available, a surplus of more than1 500millionAEAscouldaccumulateintheEUby2020.Thisissignificantlymorethanpreviouslyestimated.
(11) 15 EU Member States before 2004.

Progress towards GHG emission targets
25Trends and projections in Europe 2015
3.1 EU progress towards GHG emission targets
The EU is making good progress in meeting its target of reducing GHG emissions by 20% by 2020, compared to 1990. In 2013, its total GHG emissions were 19.8% below 1990 levels. According to the most recent approximated emission data, emissions in 2014 were already 23.0% below 1990 levels. This includes all emissions from aviation (including international flights), covered under the EU target.
According to national projections reported by Member States to the European Commission in 2015 and aggregated at EU level, GHG emissions are expected to further decrease between 2013 and 2020 (Figure 3.1).
By 2020, projected levels are expected to be:
• 24% below 1990 levels in the WEM scenario, which reflects the effects of all adopted and implemented measures at the time projections were prepared;
• 25% below 1990 levels in the WAM scenario, which takes also into account the measures at planning stageatthetimeprojectionswereprepared (12).
However, these projections do not reflect the latest EU-level policy developments aiming to meet the recently endorsed 2030 target of a 40% domestic reduction of EU emissions. This concerns, for example, the recent proposals on reforming the EU ETS, which include a more stringent cap reduction after 2020.
In fact, preliminary estimates of 2014 GHG emissions, reported by Member States after having submitted
their GHG projections, indicate that GHG emissions decreased significantly in 2014, with the reduction being much higher than projected levels. The reduction compared to 1990 levels reached 23% (24% when international aviation is excluded). The year 2014 was exceptionally warm in almost all parts of Europe, resulting in a considerably low heating energy demand compared to 2013. This 2014 proxy level is significantly lower than the 2014 levels consistent with Member States' projections.
The latest projections from Member States also indicate that the EU seems on track to reach its target for the second commitment period of the Kyoto Protocol. This target corresponds to emissions reductions of 20% below base-year level (i.e. similar to 1990) averagedovertheperiodbetween2013and2020 (13). Accordingly, total emissions for this period have to remain below the corresponding emissions budget. The scope of the EU's target under the Kyoto Protocol excludes emissions from international aviation, and includes emissions and removals from land use, land use change and forestry (LULUCF). Total GHG emissions (excluding LULUCF) were 21% below 1990 levels (14) in 2013. They are expected to decrease to levels between 23% and 24% below 1990 levels on average, during the second commitment period. The range of values corresponds to the two scenarios considered, i.e. the implementation of additional measures planned by Member States (WAM) or not (WEM).
For the first commitment period running from 2008 until 2012, the EU-15 (comprising the 15 pre-2004 EU Member States) had a common reduction target of − 8%fortheperiod,comparedtobase-yearlevels.This target was reached, as total GHG emissions in
(12) Not all Member States reported a WAM scenario, so the reduction might not take all planned measures into account and therefore be underestimated. For further information on reporting of projections, see Section A2.3 in Annex 2.
(13) ThistargetissimilarinambitionbutnotequivalentinscopetotheEUdomestictargetof− 20%fortheyear2020,becausethesetwotargetshave different scopes and are governed by different accounting rules (for details, see Section A1.3 in Annex 1).
(14) Under the Kyoto Protocol, emission targets and changes in emissions are normally expressed compared to base-year levels, which might differ from 1990 levels. The base-year values to be used for the second commitment period of the Kyoto Protocol will only be available in 2016.
Beyond 2020
• Projections beyond 2020 show further decreases in EU GHG emissions. However, Member States expect that the pace of these reductions will slow down, particularly in the ESD sectors. Planned reductions will only bring EU emissions between 27% and 30% below 1990 levels by 2030, which is insufficient to achieve the 40% reduction target set for 2030.
• However, new policy proposals, still being discussed in the EU to enable the achievement of this 2030 target, have not yet been taken into account in projections. Such proposals include a revision of the ETS, a post-2020 ESD, and measures to enhance energy efficiency as well as in the transport and land use sectors.
• Looking further ahead, the long-term decarbonisation objectives of the EU (in particular a reduction of EU GHG emissions by 80% to 95% by 2050, compared to 1990) will require even sharper emission cuts after 2030.

Progress towards GHG emission targets
26 Trends and projections in Europe 2015
the EU-15 were on average 11.8% below base-year emissions during that period (EEA, 2014b). While nine EU-15 Member States intend to make use of flexible mechanisms under the Kyoto Protocol to achieve their burden-sharing targets for the first commitment period, nine non-EU-15 Member States have reported on their intention to sell a net amount of Kyoto units to other parties (EEA, 2014b).
Looking towards 2030, projections from Member States show that both current measures in place and additional national measures at planning stage will not be sufficient to deliver enough savings for the EU to achieve the reduction target endorsed by the European Council (EU heads of state or government) inOctober2014of− 40%,comparedto1990levels(Figure 3.1). The pace of GHG emission reductions is actually projected to slow down after 2020, while mid and long-term targets will in fact require faster reductions. Existing policies and measures are expected to result in an emission reduction of 27% by 2030, compared to 1990 levels, and the implementation of additional measures could push this reduction down to 30% below 1990 levels. Because of this projected shortfall, new policies and measures are currently being developed at EU level to further reduce GHG emissions. These policy options include measures in
the transport and land use sector as well as the reform of the ETS. A post-2020 ESD and measures to enhance energy efficiency are based on the 2030 framework for climate and energy policies proposed by the European Commission in early 2014 (EC, 2014a), the subsequent conclusions of the European Council of October 2014, as well as the EU's Energy Union Strategy (EC, 2015a).
Assuming that the 2030 target will be achieved, even steeper emission reductions will be required for the EU to reach its long-term decarbonisation objective —a reductionofEUGHGemissionsby80%to95%compared to 1990, to be achieved by 2050. Such a reduction can only take place in the context of a major transformation of the EU's energy system. As the effects of policies and measures often take time to materialise (e.g. increases of energy efficiency in buildings), long-term action should not be delayed but is required now. While Member States tend to prioritise low-cost mitigation measures, they should also take into consideration the long-term mitigation potential of other measures, which are generally postponed due to high current costs or other types of difficulties related to their implementation. However, investments in these measures often make economic sense, even in the short term, as they significantly contribute to generate learning effects and thereby bring about future cost reductions.
Figure 3.1 GHG emission trends, projections and targets in the EU, 1990–2050
Note: ThescopeoftheGHGemissiontargetspresentedinthisfigureincludesemissionsfrominternationalaviation,andexcludesemissionsandremovalsfromtheLULUCFsector(carbonsinks)andnitrogentrifluoride(NF3) emissions. The WEM scenario takes currently adopted policiesintoaccount.TheWAMscenariotakesintoaccounttheadditionaleffectsofplannedmeasuresreportedby18MemberStates(no WAM scenario was available from Belgium, Bulgaria, Denmark, France, Germany, Greece, Luxembourg, Poland, Slovenia and Sweden) (see Section A2.3 in Annex 2). However, the projections do not take into account recent policy proposals such as the reform of the EU ETS and other measures in non-ETS sectors post 2020.
Source: EEA, 2015a, 2015c and 2015d.
– 19.8% – 20%
– 24% – 27%
– 40%
– 25% – 30%
2050 goal: – 80%
2050 goal: – 95%
0
1 000
2 000
3 000
4 000
5 000
6 000
1990 1995 2000 2005 2010 2015 2020 2025 2030 2035 2040 2045 2050
Mt CO2-eq.
Historic GHG emissions 2020 target Projections 'with existing measures' 2030 target Projections 'with additional measures'

Progress towards GHG emission targets
27Trends and projections in Europe 2015
3.2 Trends and projections in GHG emissions, by sector
Between 1990 and 2013, GHG emissions were reduced in all the main emitting sectors except transport. In this sector, emissions increased by 19.4% over the whole period (13.0% excluding emissions from international aviation), although they have been steadily decreasing since 2007. In 2013, the transport sector represented 22.1% of total GHG emissions intheEU(18.8% excludinginternationalaviation).Activities related to LULUCF represent a net carbon sink, removing every year the equivalent of 6% of the EU's total GHG emissions (the scope of EU target under the Kyoto Protocol). These removals are not taken into account in the EU's 2020 target under the climate and energy package, though.
The decrease in emissions which took place in the 1990s was mostly driven by the restructuring of eastern European economies across the energy, industry and agriculture sectors. The recent economic crisis also contributed to further emission reductions across the EU. Besides the predominant influence of economic factors shaping GHG emission trends, policies at national and EU levels have been playing an increasing role. After the early implementation of energy efficiency and air pollution mitigation policies in the 1990s and the gradual shift to less carbon-intensive fossil fuels (e.g. the fuel switch from coal to gas), more directly targeted climate and energy policies were implemented in the EU (EEA, 2011a). These policies, supporting the development of renewable energy and improvements in energy efficiency, have led to sustained emission cuts across the EU (EEA, 2014c and 2014d). According to previous EEA analysis, the economic downturn in the EU between 2008 and 2012 contributed to less than half of the emission reductions observed during that period. In fact, EU emissions have been decreasing every single year since 2003, except in 2010 when they slightly recovered from the 7% 'crisis drop' in 2009.
Since the introduction of the EU ETS in 2005, GHG emissions in the EU can be separated into two main categories: 'ETS emissions' and 'non-ETS emissions'.
• About 40% to 45% of EU GHG emissions are covered by the EU ETS. These emissions essentially come from industrial installations (point sources), a large part of which fall under the power generation sector. Other activities covered by the ETS include cement production, iron and steel production, and
oil refining. Since 2012, the EU ETS has also covered emissions from aviation. The mitigation of all ETS emissions is being addressed at EU level through an ETS-wideemissioncap (15).
• All other emissions, not covered by the EU ETS, come from a more diverse range of sectors or activities including road transport, energy consumption in buildings, agriculture (cattle and soils) and waste management. These emissions, except for emissions and removals from LULUCF, are now covered under the ESD, which sets annual targets for each Member State from 2013 until 2020. Mitigation actions therefore take place at national level, through a mix of EU-driven policies and measures and national initiatives (see Table 3.1 for an indicative list of key EU policies and measures supporting GHG emission reductions under the ESD).
GHG emissions in ETS sectors and in ESD sectors have beenfollowingmarkedlydifferenttrendssince1990 (16) (Figure 3.2) and projections reported by Member States also show significant differences between these two categories.
In the sectors now covered by the EU ETS, emissions have been decreasing significantly since 1990. Total ETS emissions decreased by 24% between 2005 and 2014, with most emission reductions being related to fossil fuel combustion for heat and electricity production (the power sector). Most future emission reductions in theEUareprojectedtotakeplaceundertheEU ETS.While emissions covered by the EU ETS represented about 42% of total EU emissions in 2013, the emission reductions in these sectors are expected to account for 63% of total emission reductions projected by Member States between 2013 and 2020, and Member States project further emission reductions until 2030. However, emissions from international aviation which already increased by 93% between 1990 and 2013 are expected to increase further by 2030.
In the sectors covered by the ESD, the only significant projected emission reductions are expected to take place in the building sector: an annual saving of 8 Mt CO2-eq.couldbereachedby2020(− 9% comparedto 2013 levels, corresponding to a total saving of 62 Mt CO2-eq.) on the basis of existing mitigation measures, including deep retrofits and energy-efficient new buildings. In the transport sector (excluding aviation), which is the largest contributor to GHG emissions under the ESD, emissions are projected to
(15) The cap has been set for all participants in the ETS, including the EU as well as Iceland, Liechtenstein and Norway.(16) Although the ETS was introduced in 2005 and the ESD in 2013 (i.e. no ETS or ESD emissions existed before 2005), it is possible to reconstruct a
time series dating back to 1990 by drawing up a correspondence between ETS/ESD emissions and the source categories used to officially report national GHG inventories under the UNFCCC.
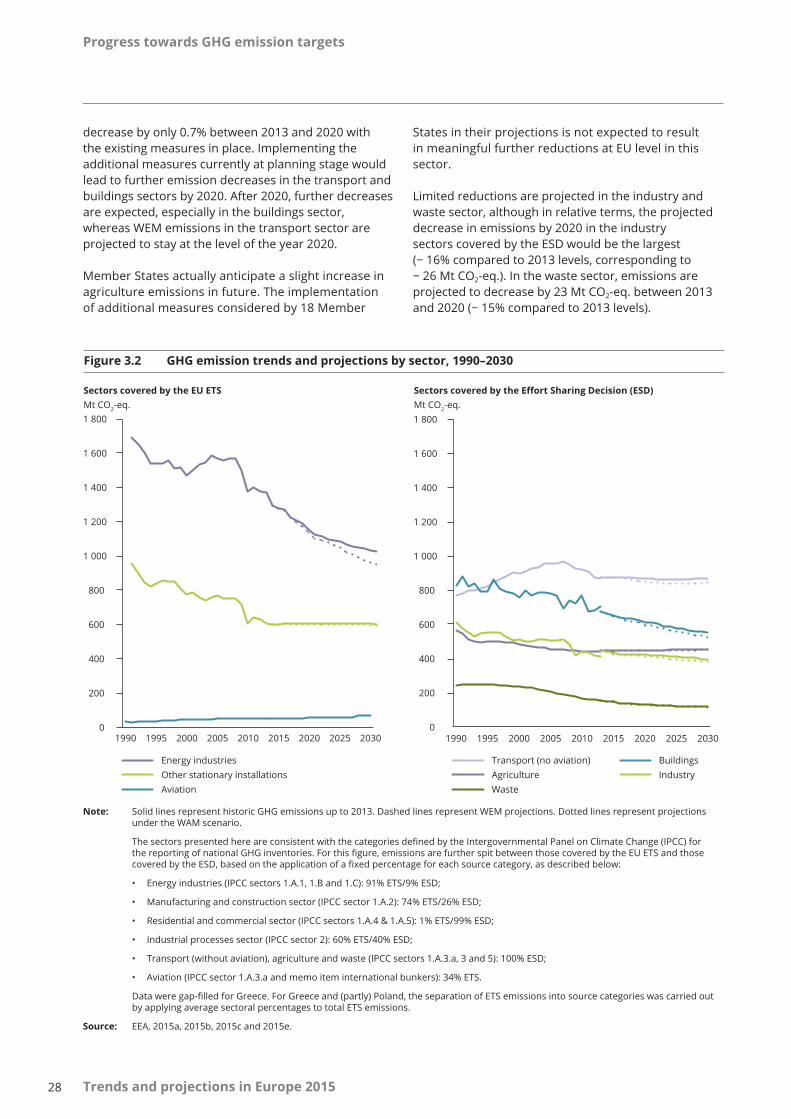
Progress towards GHG emission targets
28 Trends and projections in Europe 2015
decrease by only 0.7% between 2013 and 2020 with the existing measures in place. Implementing the additional measures currently at planning stage would lead to further emission decreases in the transport and buildings sectors by 2020. After 2020, further decreases are expected, especially in the buildings sector, whereas WEM emissions in the transport sector are projected to stay at the level of the year 2020.
Member States actually anticipate a slight increase in agriculture emissions in future. The implementation of additional measures considered by 18 Member
States in their projections is not expected to result in meaningful further reductions at EU level in this sector.
Limited reductions are projected in the industry and waste sector, although in relative terms, the projected decrease in emissions by 2020 in the industry sectors covered by the ESD would be the largest (− 16%comparedto2013levels,correspondingto− 26 Mt CO2-eq.). In the waste sector, emissions are projectedtodecreaseby23 Mt CO2-eq. between 2013 and2020(− 15%comparedto2013levels).
0
200
400
600
800
1 000
1 200
1 400
1 600
1 800
1990 1995 2000 2005 2010 2015 2020 2025 2030
Mt CO2-eq. Sectors covered by the EU ETS
Energy industries Other stationary installations Aviation
0
200
400
600
800
1 000
1 200
1 400
1 600
1 800
1990 1995 2000 2005 2010 2015 2020 2025 2030
Mt CO2-eq. Sectors covered by the Effort Sharing Decision (ESD)
Transport (no aviation) Buildings Agriculture Industry Waste
Figure 3.2 GHG emission trends and projections by sector, 1990–2030
Note: Solid lines represent historic GHG emissions up to 2013. Dashed lines represent WEM projections. Dotted lines represent projections under the WAM scenario.
ThesectorspresentedhereareconsistentwiththecategoriesdefinedbytheIntergovernmentalPanelonClimateChange(IPCC)forthereportingofnationalGHGinventories.Forthisfigure,emissionsarefurtherspitbetweenthosecoveredbytheEU ETSandthosecoveredbytheESD,basedontheapplicationofafixedpercentageforeachsourcecategory,asdescribedbelow:
• Energy industries (IPCC sectors 1.A.1, 1.B and 1.C): 91% ETS/9% ESD;
• Manufacturing and construction sector (IPCC sector 1.A.2): 74% ETS/26% ESD;
• Residential and commercial sector (IPCC sectors 1.A.4 & 1.A.5): 1% ETS/99% ESD;
• Industrial processes sector (IPCC sector 2): 60% ETS/40% ESD;
• Transport (without aviation), agriculture and waste (IPCC sectors 1.A.3.a, 3 and 5): 100% ESD;
• Aviation (IPCC sector 1.A.3.a and memo item international bunkers): 34% ETS.
Dataweregap-filledforGreece.ForGreeceand(partly)Poland,theseparationofETSemissionsintosourcecategorieswascarriedoutby applying average sectoral percentages to total ETS emissions.
Source: EEA, 2015a, 2015b, 2015c and 2015e.

Progress towards GHG emission targets
29Trends and projections in Europe 2015
3.3 Emission trends (2013–2020) under the EU ETS
In 2014, GHG emissions from Member States' stationary installationscoveredbytheEU ETSreachedtheirlowest level since the start of the scheme in 2005, at 1 786 Mt CO2-eq. This corresponds to a 24% decrease between2005and2014 (17). It also means that 2014 emissions were below the 2020 target set for the EU ETS.
In the two first trading periods (2005 to 2007 and 2008 to 2012), ETS emissions were lower than the ETS cap in every single year, with the exception of 2008 (Figure 3.3).Thiswasalsothecasein2013,thefirstyearof the third trading period (2013 to 2020). By the end of 2013, a surplus of more than 2 billion emission credits (allowances) had accumulated in the ETS. In 2014, ETS emissions exceeded the quantity of ETS allowances
(EUAs) which had been auctioned or freely allocated to operators in that year. It was the first time since 2008 that the demand for emission allowances was higher than the supply. This was a direct consequence of the decision to postpone the auctioning of 400 million EUAs for the year 2014 ('backloading'). Taking into account the net demand of allowances from the aviation sector observed in 2014 and the additional supply of allowances stemming from the use of international emission credits from the Kyoto Protocol, overall supply and demand of allowances appear to have been relatively balanced in 2014. The overall surplus of allowances (accumulated over recent years) therefore remainedatalevelofabout2.1 billionEUAs (18).
According to the projections submitted by Member States in 2015, with the existing measures in place, emissions from their stationary installations under
Source: EEA, 2015.
Main sector(s) targeted EU legislation Issue
Non-ETS; cross-cutting Directive 2006/32/EC End-use efficiency and energy services
Transport Directive 2003/30/EC Biofuels
Transport Directive 2006/28/EC Infrastructure charging for heavy goods
Transport Directive 2006/40/EC Mobile air conditioning
Transport Regulation (EC) No 443/2009 and Regulation (EU) No 333/2014
CO2 from cars
Transport Directive 2009/33/EC Clean and energy-efficient road transport
Transport Regulation (EU) No 510/2011 and Regulation (EU) No 253/2014
CO2 from vans
Residential, transport Directive 2009/28/EC Promotion of use of renewable energies in heating and transport
Residential, cross-cutting Directive 2012/27/EU Energy efficiency
Residential Directive 2010/31/EC Energy performance of buildings
Residential Regulation (EU) No 813/2013 Ecodesign legislation for space heaters and combination heaters
Residential Regulation (EU) No 814/2013 Ecodesign legislation for water heaters and storage tanks
Agriculture Directive 2000/60/EC Water Framework Directive
Agriculture Regulations related to Common Agricultural Policy (CAP)
Agricultural measures
Industrial processes Regulation (EC) No 842/2006 and Regulation (EU) No 517/2014
F-gas regulation
Waste Directive 1999/31/EC Landfill
Waste Directive 2000/76/EC Waste incineration
Waste Directive 2008/98/EC Waste
Table 3.1 Key EU policies supporting national achievements under the ESD
(17) These values were derived using scope-corrected emissions to account for the change in scope of the EU ETS since its inception.(18) When considering all ETS participating countries (including Iceland, Liechtenstein and Norway), supply and demand of allowances were
relatively balanced in 2014. When considering EU Member States only, the amount of available allowance including international credits was higher than ETS emissions. The aviation sector was short of allowances in 2012, 2013 and 2014. This is expected to represent a net demand for EUAsof37millioncreditsforthose3 years.

Progress towards GHG emission targets
30 Trends and projections in Europe 2015
theEU ETSwilldecreaseby8.2%between2015and2020, and by 6% between 2020 and 2030. Most of the projected reductions by 2020 and 2030 are expected to occur in the sector of energy industries, while emissions from other activities are envisaged to remain relatively stable during this period.
Calculating an overall reduction between 2005 and 2020 or 2030 is subject to a large uncertainty, because projected trends are not fully aligned with historic trends. With the current data available, 2020 ETS emissions could be at least 26% below 2005 levels, and 2030 ETS emissions could be at least 31% below 2005 levels. This reduction is not as large as the contribution of the ETS sectors (a 43% reduction) needed to achieve the EU's domestic GHG emissions by 40 % in 2030. However the latest ETS revision proposal, agreed but not yet adopted, is not completely reflected in national projections.
The surplus of allowances is expected to start declining in 2015 (Figure 3.3), since Member States' projections show that emissions are expected to exceed available allowances from that year onwards. This can be explained by the reduced supply of allowances and emission credits compared to previous years, itself due to several reasons, explained below.
• Most of international certificates which could be used in the years from 2008 to 2020 have been used by 2014, because the eligibility of many of these emission credits expired. Certified emission reduction (CER) were traded at less than EUR 1/CER by the end of the second trading period.
• The auctioning of 300 and 200 million allowances in 2015 and 2016, respectively, will be postponed ('backloading').
Figure 3.3 Trends and projections of EU ETS emissions (stationary installations), ETS cap and available credits, 2005–2020
Note: (a)Between2005and2013,thescopeoftheEU ETSincreasedintermsofbothcountriesandactivities.Tomakethetimeseriescomparable across the whole period being considered, a scope correction has been estimated and added to both ETS emission trends and allocated allowances for the period 2005 to 2012.
Projected ETS emissions are from the scenario 'with existing measures', which takes currently adopted policies into account but not recent policy proposals such as the reform of the EU ETS.
Projected ETS emissions are the sum of ETS projections for stationary installations reported by Member States. Greece did not report ETSprojections,thereforetheseemissionsweregapfilledonthebasisofthe2013ReferenceScenariooftheEuropeanCommission.Thesegap-filledprojectionsrepresent3%ofthetotalprojectedETSemissionsatEUlevel.
The MSR is assumed to start in January 2019. The MSR parameters used are consistent with EU, 2015.
Source: EEA, 2015b, 2015c and 2015f; EU, 2015; ETC/ACM, 2015.
0
500
1 000
1 500
2 000
2 500
3 000
2005 2006 2007 2008 2009 2010 2011 2012 2013 2014 2015 2016 2017 2018 2019 2020
First trading period
Second trading period
Third trading period
Million emission units/Mt CO2-eq.
Additional credits used (CERs and ERUs) EUAs auctioned or sold EUAs allocated free of charge (1)
ETS emissions (a) Projected ETS emissions by Member States

Progress towards GHG emission targets
31Trends and projections in Europe 2015
• The introduction of the Market Stability Reserve (MSR), whichissettobecomeoperationalin2019,is toserveas a long-term solution. The MSR, recently endorsed by the European Parliament and by the Council, adjusts the supply of allowances to be auctioned depending on the overall surplus, and is therefore expected to reduce the surplus of allowances and support carbon prices. As part of the agreement reached on the MSR, the 900 million backloaded allowances as well as remaining unallocated allowances will be placed into the reserve.
Aviation has been included in the EU ETS since 2012 (EU, 2008b), but the scope of aviation emissions covered by the ETS has been changing. In 2012, ETS emissions from aviationamountedto84 Mt CO2-eq., while they were equalto53 Mt CO2-eq.and55 Mt CO2-eq. in 2013 and 2014, respectively (EEA, 2015b).
3.4 Progress towards targets (2013–2020) under the ESD
Total emissions covered by the ESD at EU level amountedto2 586 Mt CO2-eq. in 2013. This level was 7.3% below the sum of the 28 national ESD targets for 2013. It was also 9.6% lower than the 2005 emissions in the sectors covered by the ESD. Preliminary estimates indicate that in 2014, ESD emissions further decreased to a level 12.7% below 2005 levels, which would be 9.9% below the sum of the 28 national ESD targets for 2014.
According to Member State projections, ESD emissions are expected to keep on decreasing until 2020 (Figure 3.4).AtEUlevel,ESDemissionswillremainbelow the sum of national ESD targets in every year between 2013 and 2020. In the WEM scenario, the annual gap between EU ESD emissions and aggregated targets is anticipated to slightly decrease every year, from7%oftotalESDtargets(204 Mt CO2-eq.) in 2013, to6%oftotalAEAsin2020(160 Mt CO2-eq.).
Since emissions are expected to remain below ESD targets throughout the whole period from 2013 to 2020, a surplus of ESD emission allowances (called annual emission allocations (AEAs)) is expected to build up between 2013 and 2020. This surplus, calculated as the sum of annual surplus AEAs, could reach a level between1 543 Mt CO2-eq.and1 724 Mt CO2-eq. by 2020, depending on the scenario considered (WEM only or WAM).
The comparison between ESD emissions and targets at EU level does not reflect the diversity of situations encountered by each individual Member State: while
the vast majority of Member States project that their ESD emissions will remain below their annual ESD targets during the whole compliance period from 2013 to 2020, emissions could exceed the quantity of annual emission allowances (i.e. annual ESD targets) in four Member States and for certain years.
Historic ESD emission levels
In 2013, all Member States exhibited ESD emissions which were below their 2013 targets. Member States with the largest overachievement in absolute termsin2013wereItaly(37.4 Mt CO2-eq.), Spain (31.0 Mt CO2-eq.)andFrance(22.4 Mt CO2-eq.). In relative terms 12 Member States achieved emission reductions of more than 10% above their targets (Bulgaria, Croatia, Cyprus, Greece, Hungary, Italy, the Netherlands, Portugal, Romania, Slovenia, Spain and Sweden).
Figure 3.4 EU GHG emission trends and projections in sectors covered by the ESD
Note: Emission projections for ESD sectors until 2030 take currently existing measures (WEM scenario) as well as currently planned measures (WAM scenario) into account. However,forthepost-2020period,finaldecisionsonpolicies to reduce GHG emissions remain to be adopted.
Source: EC, 2013c and 2013d; EEA, 2015a, 2015b, 2015c, 2015d and 2015g; EU, 2009a.
– 30 % vs 2005
0
500
1 000
1 500
2 000
2 500
3 000
3 500
2005 2010 2015 2020 2025 2030
Mt CO2-eq.
Historic ESD emissions
Projected ESD emissions ('with existing measures' scenario)
Projected ESD emissions ('with additional measures' scenario)
2013–2020 ESD targets
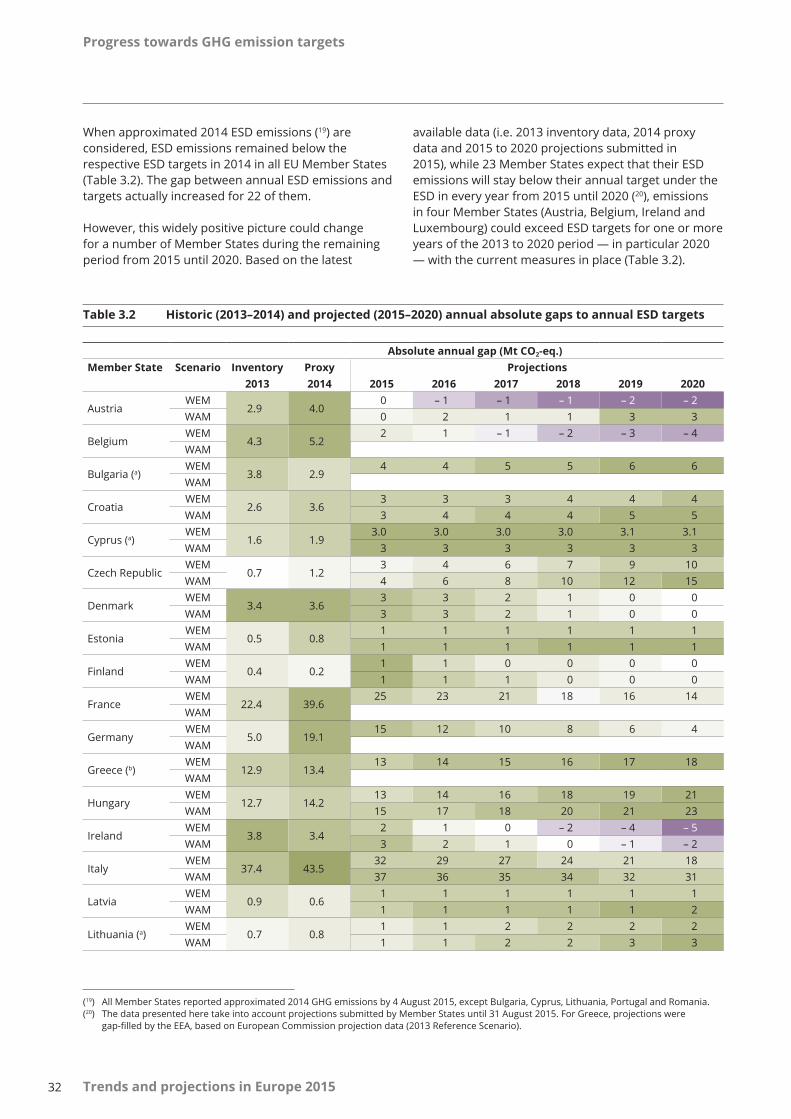
Progress towards GHG emission targets
32 Trends and projections in Europe 2015
Whenapproximated2014ESDemissions (19) are considered, ESD emissions remained below the respective ESD targets in 2014 in all EU Member States (Table 3.2). The gap between annual ESD emissions and targets actually increased for 22 of them.
However, this widely positive picture could change fora numberofMemberStatesduringtheremainingperiod from 2015 until 2020. Based on the latest
available data (i.e. 2013 inventory data, 2014 proxy data and 2015 to 2020 projections submitted in 2015), while 23 Member States expect that their ESD emissions will stay below their annual target under the ESDineveryyearfrom2015until2020 (20), emissions in four Member States (Austria, Belgium, Ireland and Luxembourg) could exceed ESD targets for one or more years of the 2013 to 2020 period — in particular 2020 — with the current measures in place (Table 3.2).
Table 3.2 Historic (2013–2014) and projected (2015–2020) annual absolute gaps to annual ESD targets
(19) All Member States reported approximated 2014 GHG emissions by 4 August 2015, except Bulgaria, Cyprus, Lithuania, Portugal and Romania.(20) The data presented here take into account projections submitted by Member States until 31 August 2015. For Greece, projections were
gap-filled by the EEA, based on European Commission projection data (2013 Reference Scenario).
Absolute annual gap (Mt CO2-eq.)Member State Scenario Inventory Proxy Projections
2013 2014 2015 2016 2017 2018 2019 2020
AustriaWEM
2.9 4.00 – 1 – 1 – 1 – 2 – 2
WAM 0 2 1 1 3 3
BelgiumWEM
4.3 5.22 1 – 1 – 2 – 3 – 4
WAM
Bulgaria (a)WEM
3.8 2.94 4 5 5 6 6
WAM
CroatiaWEM
2.6 3.63 3 3 4 4 4
WAM 3 4 4 4 5 5
Cyprus (a) WEM
1.6 1.93.0 3.0 3.0 3.0 3.1 3.1
WAM 3 3 3 3 3 3
Czech RepublicWEM
0.7 1.23 4 6 7 9 10
WAM 4 6 8 10 12 15
DenmarkWEM
3.4 3.63 3 2 1 0 0
WAM 3 3 2 1 0 0
EstoniaWEM
0.5 0.81 1 1 1 1 1
WAM 1 1 1 1 1 1
FinlandWEM
0.4 0.21 1 0 0 0 0
WAM 1 1 1 0 0 0
FranceWEM
22.4 39.625 23 21 18 16 14
WAM
GermanyWEM
5.0 19.115 12 10 8 6 4
WAM
Greece (b)WEM
12.9 13.413 14 15 16 17 18
WAM
HungaryWEM
12.7 14.213 14 16 18 19 21
WAM 15 17 18 20 21 23
IrelandWEM
3.8 3.42 1 0 – 2 – 4 – 5
WAM 3 2 1 0 – 1 – 2
ItalyWEM
37.4 43.532 29 27 24 21 18
WAM 37 36 35 34 32 31
LatviaWEM
0.9 0.61 1 1 1 1 1
WAM 1 1 1 1 1 2
Lithuania (a)WEM
0.7 0.81 1 2 2 2 2
WAM 1 1 2 2 3 3
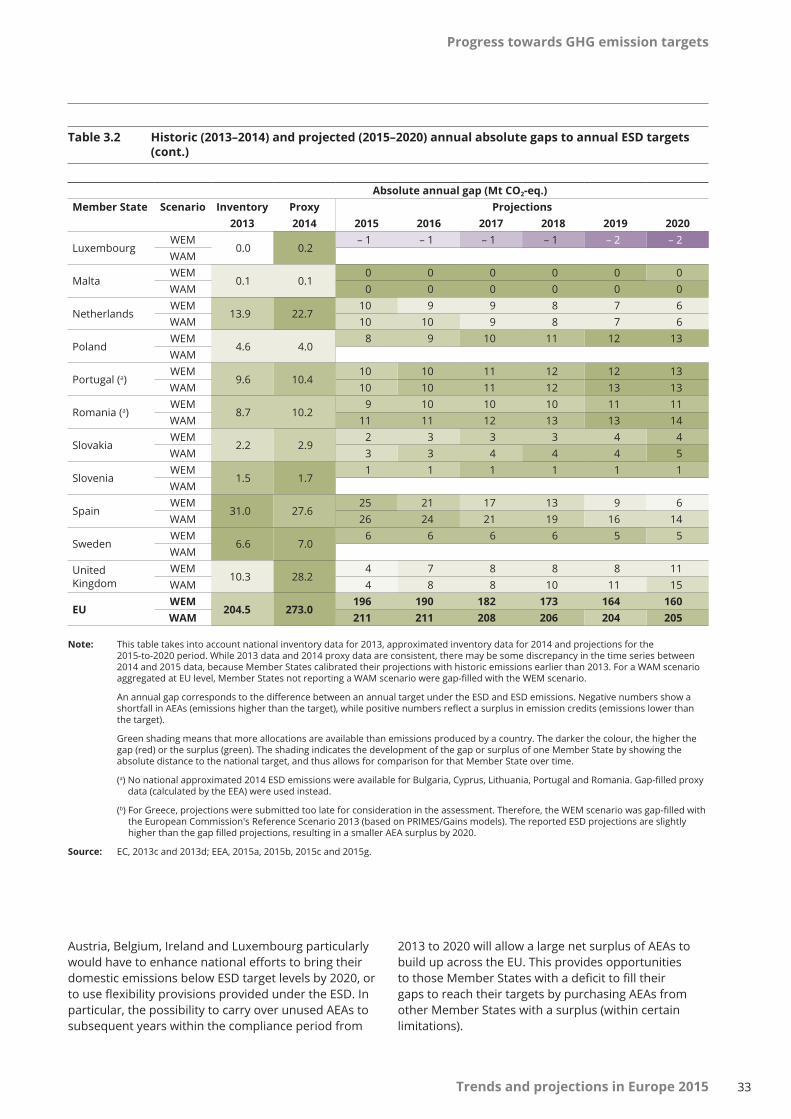
Progress towards GHG emission targets
33Trends and projections in Europe 2015
Austria, Belgium, Ireland and Luxembourg particularly would have to enhance national efforts to bring their domestic emissions below ESD target levels by 2020, or to use flexibility provisions provided under the ESD. In particular, the possibility to carry over unused AEAs to subsequent years within the compliance period from
Note: This table takes into account national inventory data for 2013, approximated inventory data for 2014 and projections for the 2015-to-2020 period. While 2013 data and 2014 proxy data are consistent, there may be some discrepancy in the time series between 2014 and 2015 data, because Member States calibrated their projections with historic emissions earlier than 2013. For a WAM scenario aggregatedatEUlevel,MemberStatesnotreportingaWAMscenarioweregap-filledwiththeWEMscenario.
AnannualgapcorrespondstothedifferencebetweenanannualtargetundertheESDandESDemissions.NegativenumbersshowashortfallinAEAs(emissionshigherthanthetarget),whilepositivenumbersreflectasurplusinemissioncredits(emissionslowerthanthe target).
Green shading means that more allocations are available than emissions produced by a country. The darker the colour, the higher the gap (red) or the surplus (green). The shading indicates the development of the gap or surplus of one Member State by showing the absolute distance to the national target, and thus allows for comparison for that Member State over time.
(a)Nonationalapproximated2014ESDemissionswereavailableforBulgaria,Cyprus,Lithuania,PortugalandRomania.Gap-filledproxydata (calculated by the EEA) were used instead.
(b)ForGreece,projectionsweresubmittedtoolateforconsiderationintheassessment.Therefore,theWEMscenariowasgap-filledwiththe European Commission's Reference Scenario 2013 (based on PRIMES/Gains models). The reported ESD projections are slightly higherthanthegapfilledprojections,resultinginasmallerAEAsurplusby2020.
Source: EC, 2013c and 2013d; EEA, 2015a, 2015b, 2015c and 2015g.
Absolute annual gap (Mt CO2-eq.)Member State Scenario Inventory Proxy Projections
2013 2014 2015 2016 2017 2018 2019 2020
LuxembourgWEM
0.0 0.2– 1 – 1 – 1 – 1 – 2 – 2
WAM
MaltaWEM
0.1 0.10 0 0 0 0 0
WAM 0 0 0 0 0 0
NetherlandsWEM
13.9 22.710 9 9 8 7 6
WAM 10 10 9 8 7 6
PolandWEM
4.6 4.08 9 10 11 12 13
WAM
Portugal (a)WEM
9.6 10.410 10 11 12 12 13
WAM 10 10 11 12 13 13
Romania (a)WEM
8.7 10.29 10 10 10 11 11
WAM 11 11 12 13 13 14
SlovakiaWEM
2.2 2.92 3 3 3 4 4
WAM 3 3 4 4 4 5
SloveniaWEM
1.5 1.71 1 1 1 1 1
WAM
SpainWEM
31.0 27.625 21 17 13 9 6
WAM 26 24 21 19 16 14
SwedenWEM
6.6 7.06 6 6 6 5 5
WAM
United Kingdom
WEM10.3 28.2
4 7 8 8 8 11WAM 4 8 8 10 11 15
EUWEM
204.5 273.0196 190 182 173 164 160
WAM 211 211 208 206 204 205
2013 to 2020 will allow a large net surplus of AEAs to build up across the EU. This provides opportunities to those Member States with a deficit to fill their gaps to reach their targets by purchasing AEAs from other Member States with a surplus (within certain limitations).
Table 3.2 Historic (2013–2014) and projected (2015–2020) annual absolute gaps to annual ESD targets (cont.)

Progress towards GHG emission targets
34 Trends and projections in Europe 2015
For these four Member States, a different picture emerges when looking at the gaps between ESD emissions and ESD targets over the whole period from 2013 until 2020, based on the latest available data.
• For Austria, deficits are projected for the years from 2016 until 2020, with an annual gap reaching 2.2 Mt CO2-eq. in 2020. Austria could close these annual gaps by implementing the additional measures currently at planning stage, in particular in the transport sector (e.g. efficiency improvements of vehicles, modal shift to public or non-motorised transport, charging for external effects on noise or air pollution, and tolls). If the planned additional measures are not sufficiently implemented, to achieve its annual ESD targets, Austria will have to use the flexibility provision allowed by the ESD; for compliance in the years 2016 to 2019 Austria could achieve its ESD targets by using the emission permits (AEAs) accumulated between 2013 and 2015 (21). This will not be sufficient to close the gap to ESD targets in 2020 (Table 3.4). Austria would have to buy additional certificates to comply in 2020, as explained below.
• For Belgium, the projected WEM emission levels would lead to deficits for the years between 2017 and2020,withanestimatedgapof4.5 Mt CO2-eq. in 2020. No WAM scenario is available. Belgium could achieve its ESD targets in the whole period by using surplus AEAs accumulated between 2013 and 2016.
• For Ireland, deficits are projected in every year between 2017 and 2020, with a gap of
(21) Under the ESD, within the Member State itself, any overachievement in a year of the period from 2013 to 2019 can be carried over ('banked') to subsequent years, up to 2020. It is also possible for a Member State to carry forward (i.e. 'borrow') an emission allocation of up to 5% from the following year, during the period from 2013 to 2019.
(22) The results published in Ireland's national report on GHG projections (Ireland Environmental Protection Agency, 2015) differ from the figures presented here, because the Irish report estimates revised ESD targets as a result of the use of the 2006 IPCC guidelines and UNFCCC methodologies for compiling the national GHG emissions inventory (1990–2013) and for preparing the latest projections. Under the MMR, by December 2016 the Commission shall examine if the impact of the use of the 2006 IPCC guidelines for national GHG inventories and may revise Member States’ annual emission allocations as provided in the ESD (see Section A1.4 in Annex 1).
(23) TheESDallowseachMemberStatetocarryforwardfromthefollowingyearaquantityofupto 5%ofitsAEA,inordertoguaranteecompliance(Article 3, EU, 2009b) At the same time, a Member State can carry over from a past year any surplus emission allocations. If it is not possible for a Member State to combine these two approaches to comply within a single year, it must make use of other flexible options under the ESD.
4.9 Mt CO2-eq. in 2020. Despite the implementation of additional measures, emissions would still remain higher than ESD targets in 2018, 2019 and 2020 (22)
• For Luxembourg, deficits are projected for the years ineveryyearbetween2015and2020,witha gapof2.1 Mt CO2-eq. in 2020. No WAM scenario is available.
For these countries, using surplus AEAs from earlier years would not be sufficient to reach all their annual ESD targets until 2020. They will therefore need to step up their mitigation measures to achieve further emission reductions through the impact of additional policies, or use other flexibility mechanisms, as described below.
• Member States may transfer up to 5% of their AEAs of the following year to other Member States, which may use this emission allocation until 2020 (ex ante). Any overachievement in a year of the period from 2013 to 2019 may also be transferred to other Member States, which may use this emission allocation until 2020 (ex post).
• Member States may also make limited use of international project-based emission credits, according to specific provisions.
According to WEM projections, Austria and Ireland would need to use these mechanisms only in 2020, while Luxembourg would need to do so between 2016 and 2020. In these years, the gap to its annual ESD targetsexceeds5%ofAEAsofthenextyear (23).
Table 3.3 Minimum conditions expected for achieving the ESD budget for the period 2013 to 2020
Use of flexibility mechanisms 'With existing measures' scenario 'With additional measures' scenario
No use of flexibility mechanisms 24MemberStates (a) 24 Member States and Austria
Transfer of AEAs between years (only) Belgium Ireland (b)
Other flexibility mechanisms needed Austria,Ireland,Luxembourg (b)
Note: (a) 24 Member States: Bulgaria, Croatia, Cyprus, the Czech Republic, Denmark, Estonia, Finland, France, Germany, Greece, Hungary, Italy, Latvia, Lithuania, Malta, the Netherlands, Poland, Portugal, Romania, Slovakia, Slovenia, Spain, Sweden and the United Kingdom.
(b) No WAM projection scenario is available for Belgium and Luxembourg.
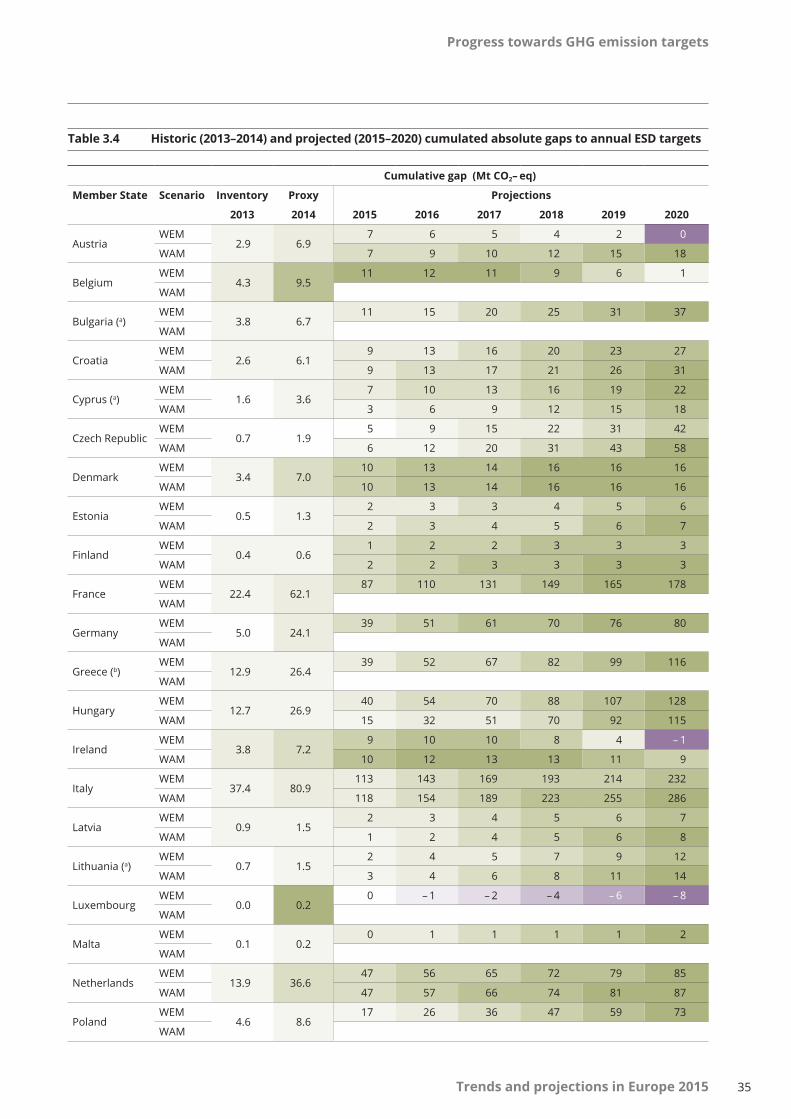
Progress towards GHG emission targets
35Trends and projections in Europe 2015
Table 3.4 Historic (2013–2014) and projected (2015–2020) cumulated absolute gaps to annual ESD targets
Cumulative gap (Mt CO2– eq)
Member State Scenario Inventory Proxy Projections
2013 2014 2015 2016 2017 2018 2019 2020
AustriaWEM
2.9 6.97 6 5 4 2 0
WAM 7 9 10 12 15 18
BelgiumWEM
4.3 9.511 12 11 9 6 1
WAM
Bulgaria (a)WEM
3.8 6.711 15 20 25 31 37
WAM
CroatiaWEM
2.6 6.19 13 16 20 23 27
WAM 9 13 17 21 26 31
Cyprus (a) WEM
1.6 3.67 10 13 16 19 22
WAM 3 6 9 12 15 18
Czech RepublicWEM
0.7 1.95 9 15 22 31 42
WAM 6 12 20 31 43 58
DenmarkWEM
3.4 7.010 13 14 16 16 16
WAM 10 13 14 16 16 16
EstoniaWEM
0.5 1.32 3 3 4 5 6
WAM 2 3 4 5 6 7
FinlandWEM
0.4 0.61 2 2 3 3 3
WAM 2 2 3 3 3 3
FranceWEM
22.4 62.187 110 131 149 165 178
WAM
GermanyWEM
5.0 24.139 51 61 70 76 80
WAM
Greece (b)WEM
12.9 26.439 52 67 82 99 116
WAM
HungaryWEM
12.7 26.940 54 70 88 107 128
WAM 15 32 51 70 92 115
IrelandWEM
3.8 7.29 10 10 8 4 – 1
WAM 10 12 13 13 11 9
ItalyWEM
37.4 80.9113 143 169 193 214 232
WAM 118 154 189 223 255 286
LatviaWEM
0.9 1.52 3 4 5 6 7
WAM 1 2 4 5 6 8
Lithuania (a)WEM
0.7 1.52 4 5 7 9 12
WAM 3 4 6 8 11 14
LuxembourgWEM
0.0 0.20 – 1 – 2 – 4 – 6 – 8
WAM
MaltaWEM
0.1 0.20 1 1 1 1 2
WAM
NetherlandsWEM
13.9 36.647 56 65 72 79 85
WAM 47 57 66 74 81 87
PolandWEM
4.6 8.617 26 36 47 59 73
WAM
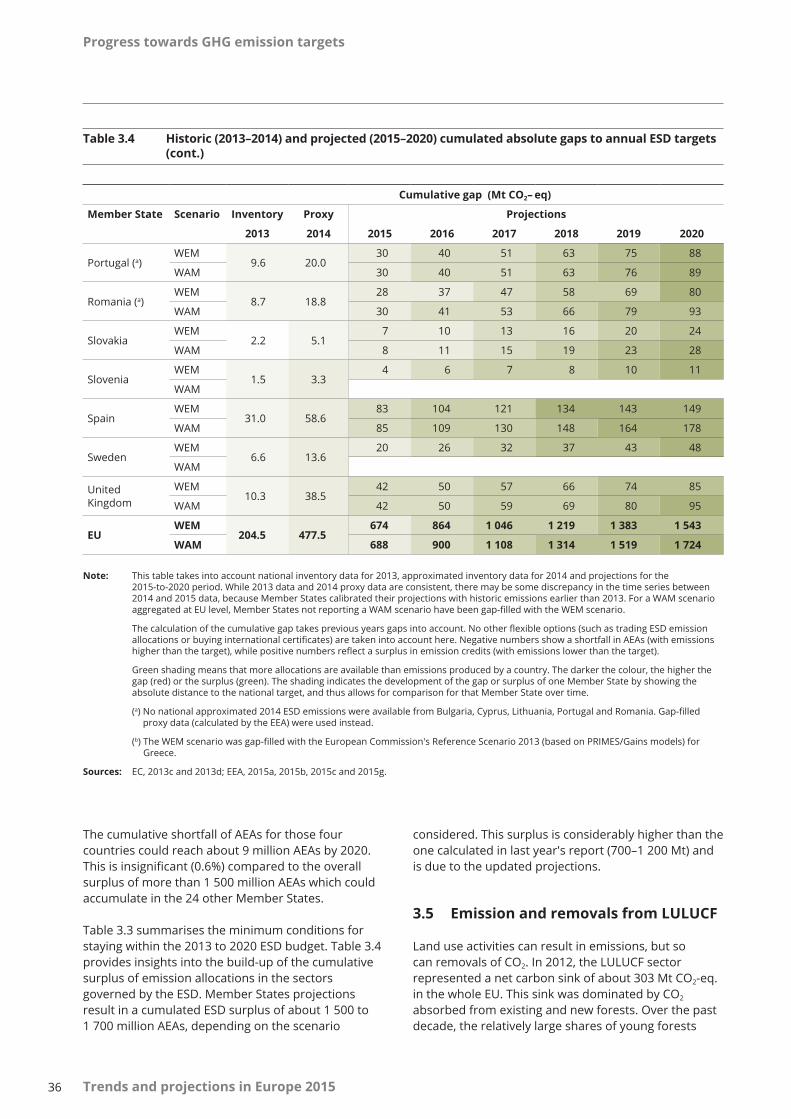
Progress towards GHG emission targets
36 Trends and projections in Europe 2015
Note: This table takes into account national inventory data for 2013, approximated inventory data for 2014 and projections for the 2015-to-2020 period. While 2013 data and 2014 proxy data are consistent, there may be some discrepancy in the time series between 2014 and 2015 data, because Member States calibrated their projections with historic emissions earlier than 2013. For a WAM scenario aggregatedatEUlevel,MemberStatesnotreportingaWAMscenariohavebeengap-filledwiththeWEMscenario.
Thecalculationofthecumulativegaptakespreviousyearsgapsintoaccount.Nootherflexibleoptions(suchastradingESDemissionallocationsorbuyinginternationalcertificates)aretakenintoaccounthere.NegativenumbersshowashortfallinAEAs(withemissionshigherthanthetarget),whilepositivenumbersreflectasurplusinemissioncredits(withemissionslowerthanthetarget).
Green shading means that more allocations are available than emissions produced by a country. The darker the colour, the higher the gap (red) or the surplus (green). The shading indicates the development of the gap or surplus of one Member State by showing the absolute distance to the national target, and thus allows for comparison for that Member State over time.
(a)Nonationalapproximated2014ESDemissionswereavailablefromBulgaria,Cyprus,Lithuania,PortugalandRomania.Gap-filledproxy data (calculated by the EEA) were used instead.
(b)TheWEMscenariowasgap-filledwiththeEuropeanCommission'sReferenceScenario2013(basedonPRIMES/Gainsmodels)forGreece.
Sources: EC, 2013c and 2013d; EEA, 2015a, 2015b, 2015c and 2015g.
The cumulative shortfall of AEAs for those four countries could reach about 9 million AEAs by 2020. This is insignificant (0.6%) compared to the overall surplusofmorethan1 500millionAEAswhichcouldaccumulate in the 24 other Member States.
Table 3.3 summarises the minimum conditions for staying within the 2013 to 2020 ESD budget. Table 3.4 provides insights into the build-up of the cumulative surplus of emission allocations in the sectors governed by the ESD. Member States projections resultinacumulatedESDsurplusofabout1 500 to1 700 million AEAs,dependingonthescenario
considered. This surplus is considerably higher than the onecalculatedinlastyear'sreport(700–1 200Mt)andis due to the updated projections.
3.5 Emission and removals from LULUCF
Land use activities can result in emissions, but so can removals of CO2. In 2012, the LULUCF sector representedanetcarbonsinkofabout303 Mt CO2-eq. in the whole EU. This sink was dominated by CO2 absorbed from existing and new forests. Over the past decade, the relatively large shares of young forests
Cumulative gap (Mt CO2– eq)
Member State Scenario Inventory Proxy Projections
2013 2014 2015 2016 2017 2018 2019 2020
Portugal (a)WEM
9.6 20.030 40 51 63 75 88
WAM 30 40 51 63 76 89
Romania (a)WEM
8.7 18.828 37 47 58 69 80
WAM 30 41 53 66 79 93
SlovakiaWEM
2.2 5.17 10 13 16 20 24
WAM 8 11 15 19 23 28
SloveniaWEM
1.5 3.34 6 7 8 10 11
WAM
SpainWEM
31.0 58.683 104 121 134 143 149
WAM 85 109 130 148 164 178
SwedenWEM
6.6 13.620 26 32 37 43 48
WAM
United Kingdom
WEM10.3 38.5
42 50 57 66 74 85
WAM 42 50 59 69 80 95
EUWEM
204.5 477.5674 864 1 046 1 219 1 383 1 543
WAM 688 900 1 108 1 314 1 519 1 724
Table 3.4 Historic (2013–2014) and projected (2015–2020) cumulated absolute gaps to annual ESD targets (cont.)
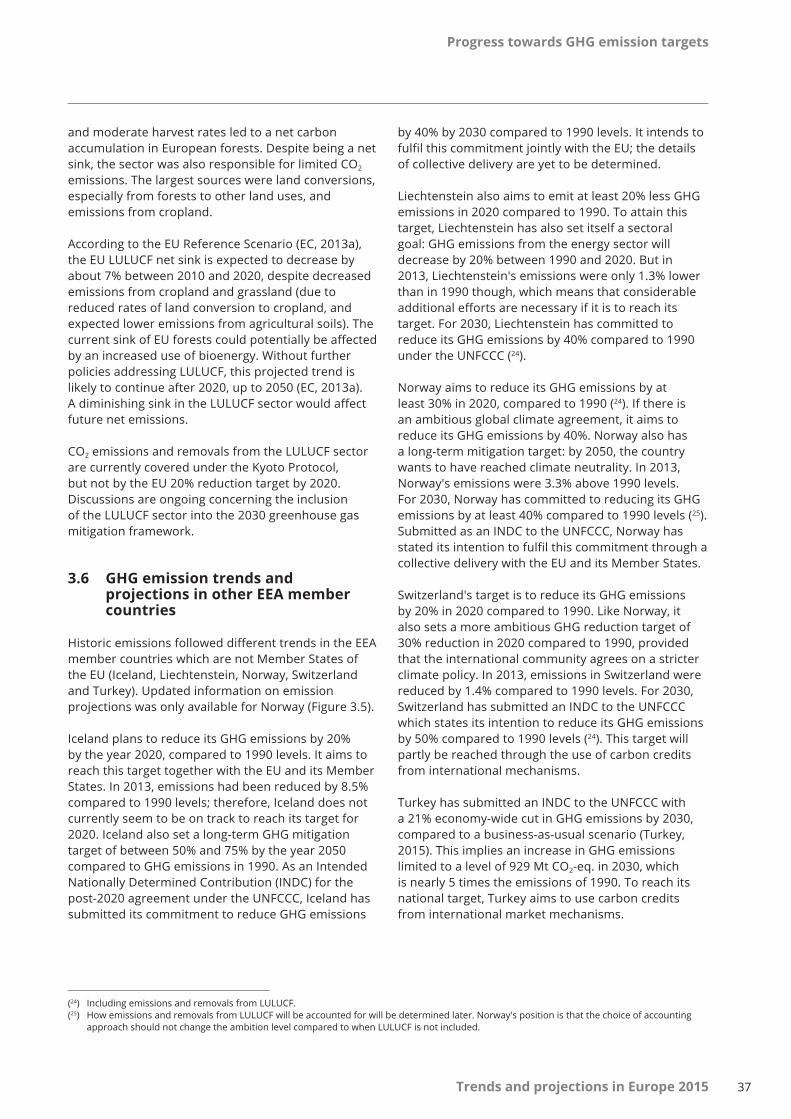
Progress towards GHG emission targets
37Trends and projections in Europe 2015
(24) Including emissions and removals from LULUCF.(25) How emissions and removals from LULUCF will be accounted for will be determined later. Norway's position is that the choice of accounting
approach should not change the ambition level compared to when LULUCF is not included.
and moderate harvest rates led to a net carbon accumulation in European forests. Despite being a net sink, the sector was also responsible for limited CO2 emissions. The largest sources were land conversions, especially from forests to other land uses, and emissions from cropland.
According to the EU Reference Scenario (EC, 2013a), the EU LULUCF net sink is expected to decrease by about 7% between 2010 and 2020, despite decreased emissions from cropland and grassland (due to reduced rates of land conversion to cropland, and expected lower emissions from agricultural soils). The current sink of EU forests could potentially be affected by an increased use of bioenergy. Without further policies addressing LULUCF, this projected trend is likely to continue after 2020, up to 2050 (EC, 2013a). A diminishing sink in the LULUCF sector would affect future net emissions.
CO2 emissions and removals from the LULUCF sector are currently covered under the Kyoto Protocol, but not by the EU 20% reduction target by 2020. Discussions are ongoing concerning the inclusion of the LULUCF sector into the 2030 greenhouse gas mitigation framework.
3.6 GHG emission trends and projections in other EEA member countries
Historic emissions followed different trends in the EEA member countries which are not Member States of the EU (Iceland, Liechtenstein, Norway, Switzerland and Turkey). Updated information on emission projections was only available for Norway (Figure 3.5).
Iceland plans to reduce its GHG emissions by 20% by the year 2020, compared to 1990 levels. It aims to reach this target together with the EU and its Member States. In 2013, emissions had been reduced by 8.5% compared to 1990 levels; therefore, Iceland does not currently seem to be on track to reach its target for 2020. Iceland also set a long-term GHG mitigation target of between 50% and 75% by the year 2050 compared to GHG emissions in 1990. As an Intended Nationally Determined Contribution (INDC) for the post-2020 agreement under the UNFCCC, Iceland has submitted its commitment to reduce GHG emissions
by 40% by 2030 compared to 1990 levels. It intends to fulfil this commitment jointly with the EU; the details of collective delivery are yet to be determined.
Liechtenstein also aims to emit at least 20% less GHG emissions in 2020 compared to 1990. To attain this target, Liechtenstein has also set itself a sectoral goal: GHG emissions from the energy sector will decrease by 20% between 1990 and 2020. But in 2013, Liechtenstein's emissions were only 1.3% lower than in 1990 though, which means that considerable additional efforts are necessary if it is to reach its target. For 2030, Liechtenstein has committed to reduce its GHG emissions by 40% compared to 1990 undertheUNFCCC (24).
Norway aims to reduce its GHG emissions by at least30%in2020,comparedto1990 (24). If there is an ambitious global climate agreement, it aims to reduce its GHG emissions by 40%. Norway also has a long-term mitigation target: by 2050, the country wants to have reached climate neutrality. In 2013, Norway's emissions were 3.3% above 1990 levels. For 2030, Norway has committed to reducing its GHG emissionsbyatleast40%comparedto1990levels (25). Submitted as an INDC to the UNFCCC, Norway has stated its intention to fulfil this commitment through a collective delivery with the EU and its Member States.
Switzerland's target is to reduce its GHG emissions by 20% in 2020 compared to 1990. Like Norway, it also sets a more ambitious GHG reduction target of 30% reduction in 2020 compared to 1990, provided that the international community agrees on a stricter climate policy. In 2013, emissions in Switzerland were reduced by 1.4% compared to 1990 levels. For 2030, Switzerland has submitted an INDC to the UNFCCC which states its intention to reduce its GHG emissions by50%comparedto1990levels (24). This target will partly be reached through the use of carbon credits from international mechanisms.
Turkey has submitted an INDC to the UNFCCC with a 21% economy-wide cut in GHG emissions by 2030, compared to a business-as-usual scenario (Turkey, 2015). This implies an increase in GHG emissions limitedtoalevelof929 Mt CO2-eq. in 2030, which is nearly 5 times the emissions of 1990. To reach its national target, Turkey aims to use carbon credits from international market mechanisms.

Progress towards GHG emission targets
38 Trends and projections in Europe 2015
Figure 3.5 Total GHG emission trends and projections in other EEA member countries, 1990–2030
Note: Projections display total GHG emissions excluding LULUCF and international aviation. Solid lines represent historic values, while dashed lines represent projections WEM.
Values shown for Iceland include inventory data, taking into account total CO2 emissions from industrial processes. Iceland may exclude theseemissionsforcomplianceinthefirstcommitmentperiodoftheKyotoProtocol.
Norway'sINDCincludesemissionsandremovalsfromLULUCF,whicharenotshowninthisfigure.
Source: EEA, 2015a and 2015d; Iceland, 2014; Liechtenstein, 2014; Switzerland, 2015; Turkey, 2014.
0
50
100
150
200
250
1990 1995 2000 2005 2010 2015 2020 2025 2030
Index 100 = 1990
Turkey Liechtenstein Iceland Norway Norway Switzerland

39
Progress towards renewable energy targets
Trends and projections in Europe 2015
4 Progress towards renewable energy targets
Progress in numbers
• With a 15.0% share of renewable energy in the EU's gross final energy consumption in 2013, the EU is currently on track to meet its 20% RES target for 2020.
• Preliminary estimates indicate a 2014 share of 16.0% at EU level, which confirms the EU's good progress towards its 2020 target.
• In 2013, 25 Member States (i.e. all except Luxembourg, the Netherlands and the United Kingdom) met or exceeded their indicative targets for 2013 to 2014 set under the RED, while 21 Member States (i.e. all except Denmark, France, Ireland, Luxembourg, the Netherlands, Portugal and Spain) exceeded the indicative trajectories set in their national action plans.
• Three Member States (Bulgaria, Estonia and Sweden) exhibited 2013 renewable energy shares that are already higher than their 2020 RED targets. Recent and preliminary data for 2014 indicate that this number could rise to nine Member States to include Austria, the Czech Republic, Finland, Italy, Lithuania and Romania.
• According to approximated RES shares for 2014, 27 Member States (i.e. all except the Netherlands) met or exceeded their indicative targets for 2013 to 2014 set under the RED, while 20 Member States (i.e. all except Cyprus, France, Ireland, Malta, the Netherlands, Portugal, Spain and the United Kingdom) exceeded their expected 2014 NREAP targets.
• Excessive RES capacity may be used for transfers to support those Member States having difficulty reaching their targets. The trading options provided for under the RED could provide benefits to involved countries and help the EU to achieve its 2020 RES target more cost-effectively.
Beyond 2020
• If the current pace of growth in RES is sustained until 2030, the EU will achieve a share higher than its target of a minimum 27% RES share in gross final energy consumption by 2030. However, this may not happen without additional efforts, because a number of regulatory changes have already affected investors' confidence in renewables, and market barriers and fragmentation still represent challenges for new entrants.
• In view of its longer-term energy and decarbonisation objectives for 2050, the EU will need to increase its efforts to support renewables.
4.1 EU progress towards its RES targets
The EU is well on track to meet its target of reaching, by 2020, a 20% share of RES in its gross final energy consumption (i.e. all final energy uses). In 2013, the EU's consumption of renewable energy continued its steady growth, standing at 15% of gross final energy consumption. This is an increase of 0.7 percentage points compared to 2012. According to preliminary estimates from the EEA, the share of renewables further increased in 2014, reaching a level of 16.0% in gross final energy consumption.
Both 2013 and 2014 levels are thus higher than the interim target set for the years 2013 and 2014 under the RED (12.1%). The 2013 and 2014 EU RES shares are also higher than the levels that Member States were expecting to achieve, according to their NREAPs reported in 2010. Aggregated, these amount to an expected EU-wide RES share of 13.7% in 2013 and 14.5% in 2014.
The EU 2020 target for renewable energy includes a 'sub-target', which is to reach a 10% share of renewable sources in the transport sector. Progress is here much slower. In 2013, RES represented only 5.4% of the

Progress towards renewable energy targets
40 Trends and projections in Europe 2015
energy consumption from this sector. According to preliminary estimates from the EEA, this share slightly increased to 5.6% in 2014 (EEA, 2015e).
Between 2005 and 2013, the share of renewable energy in gross final energy consumption increased by an average 0.8 percentage point every year. If this average annual increase is maintained until 2020, the EU will achieveits2020target(Figure 4.1).This,however,may prove more challenging, due to recent changes in national RES supporting polices, and persisting market barriers for new projects. Other complex factors are also at play, with uncertain outcomes. In particular, cheap RES development options are becoming scarcer as low hanging fruits are gradually being harvested, while at the same time, costs for new RES capacity are being reduced through economies of scale, better knowledge integration and growing experience.
Member States must regularly report on projected excess or deficit production of renewable energy in their biennial Progress Reports under the RED (26). However, they do not all report such RES projections or specify whether these RES projections are based on currently existing measures. This hampers the use of
such RES projections for assessing progress towards RES targets for all Member States in a consistent manner as is being done for GHG emissions.
In October 2014, EU heads of state or government agreed to a target of raising the EU-wide RES share to at least 27% by 2030. Unlike the 2020 target, the 2030 target will not be translated into mandatory targets for each Member State. No specific RES target for the transport sector is set for 2030 either. Instead, Member States will devise and agree upon national targets with the overall EU target in mind and coordinate their actions in a governance process, which will be designed at Union level (EC, 2014a and 2015a). Assuming that the current pace of renewable energy deployment in theEU( + 0.8 percentagepointsperyearonaverage)issustaineduntil2030,whichisnota given,the2030RESshareintheEUwouldbeabovethe2030 target(Figure 4.1).
Beyond 2030, the EU has no longer-term quantified objective on renewable energy. However, to achieve its goal of reducing its GHG emissions by 80% to 95% below 1990 levels and moving to a competitive low-carbon economy by 2050, the EU will have to raise significantly
Figure 4.1 Trends and targets in the share of renewable energy sources in EU energy consumption, 2005–2050
Source: EC, 2011b; EEA, 2011b; EU, 2009b; European Council, 2014; Eurostat, 2015f.
15% 2020 target: 20%
2030 target: 27%
EU Energy Roadmap minimum
RES share: 55%
EU Energy Roadmap maximum
RES share: 75%
0
10
20
30
40
50
60
70
80
2005 2010 2015 2020 2025 2030 2035 2040 2045 2050
Share of renewable energy sources (RES) in gross final energy consumption (%)
RES share in gross final energy consumption (%) Indicative trajectory from Member States' 2010 action plans Indicative trajectory from the Renewable Energy Directive
(26) For the years up to 2020, Member States have to report in their RED Progress Reports the estimated excess/deficit production of energy from renewable sources compared to their national indicative RED trajectory.
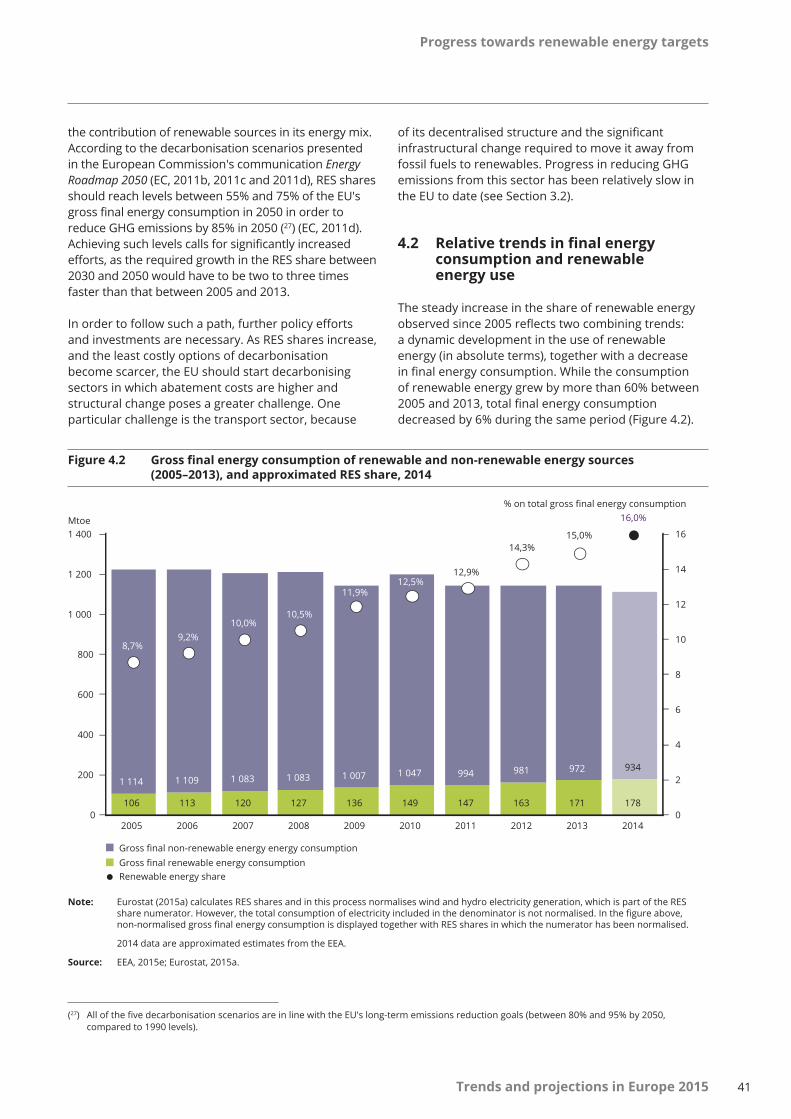
Progress towards renewable energy targets
41Trends and projections in Europe 2015
(27) All of the five decarbonisation scenarios are in line with the EU's long-term emissions reduction goals (between 80% and 95% by 2050, compared to 1990 levels).
the contribution of renewable sources in its energy mix. According to the decarbonisation scenarios presented in the European Commission's communication Energy Roadmap 2050 (EC, 2011b, 2011c and 2011d), RES shares should reach levels between 55% and 75% of the EU's gross final energy consumption in 2050 in order to reduceGHGemissionsby85%in2050 (27) (EC, 2011d). Achieving such levels calls for significantly increased efforts, as the required growth in the RES share between 2030 and 2050 would have to be two to three times faster than that between 2005 and 2013.
In order to follow such a path, further policy efforts and investments are necessary. As RES shares increase, and the least costly options of decarbonisation become scarcer, the EU should start decarbonising sectors in which abatement costs are higher and structural change poses a greater challenge. One particular challenge is the transport sector, because
of its decentralised structure and the significant infrastructural change required to move it away from fossil fuels to renewables. Progress in reducing GHG emissions from this sector has been relatively slow in the EU to date (see Section 3.2).
4.2 Relative trends in final energy consumption and renewable energy use
The steady increase in the share of renewable energy observed since 2005 reflects two combining trends: a dynamic development in the use of renewable energy (in absolute terms), together with a decrease in final energy consumption. While the consumption of renewable energy grew by more than 60% between 2005 and 2013, total final energy consumption decreased by 6% during the same period (Figure 4.2).
Figure 4.2 Gross final energy consumption of renewable and non‑renewable energy sources (2005–2013), and approximated RES share, 2014
Note: Eurostat (2015a) calculates RES shares and in this process normalises wind and hydro electricity generation, which is part of the RES sharenumerator.However,thetotalconsumptionofelectricityincludedinthedenominatorisnotnormalised.Inthefigureabove,non-normalisedgrossfinalenergyconsumptionisdisplayedtogetherwithRESsharesinwhichthenumeratorhasbeennormalised.
2014 data are approximated estimates from the EEA.
Source: EEA, 2015e; Eurostat, 2015a.
106 113 120 127 136 149 147 163 171 178
1 114 1 109 1 083 1 083 1 007 1 047 994 981 972 934
8,7%9,2%
10,0%10,5%
11,9%12,5%
12,9%
14,3%15,0%
16,0%
0
2
4
6
8
10
12
14
16
0
200
400
600
800
1 000
1 200
1 400 Mtoe
% on total gross final energy consumption
2005 2006 2007 2008 2009 2010 2011 2012 2013 2014
Gross final non-renewable energy energy consumption Gross final renewable energy consumption Renewable energy share

Progress towards renewable energy targets
42 Trends and projections in Europe 2015
The year 2010 alone saw the consumption of energy of all sources increase, including non-renewables — this was a combined result of a relatively cold winter and a rebound following the large drop observed in 2009 due to the economic crisis. In absolute terms, the continued development of renewables only marked a pause in 2011. Total energy consumption remained roughly constant in 2013 compared to 2012, while consumptionofrenewableenergyincreasedby8 Mtoe(from163 Mtoeto171 Mtoe),andconsumptionofnon-renewablesourcesfellfrom981 Mtoeto972 Mtoe.The 13% decrease in gross final energy consumption of non-renewable sources between 2005 and 2013 clearly
indicates a progressive substitution of fossil fuels by renewables. This trend persists when proxy estimates for RES shares in the year 2014 are taken into account.
In the period from 2005 until 2013, 25 Member States experienced a decline of gross final energy consumption. Combined with a growth in renewable energy use, this amplified the increase in their RES shares (Figure 4.3). Conversely, the increase in total gross final energy consumption observed in Estonia, Malta and Poland during this period somewhat mitigated the effect of the increase in RES use on the RESshare (28).
Figure 4.3 Gross final energy consumption (total and from RES) and RES shares in Member States, 2005–2013
Note: Maltaexhibitsstrikinggrowthinrenewablegrossfinalenergyconsumption(+ 3 172%).Duetoitsabsolutesmallsize,however,datamaynot be fully representative and are thus omitted above.
Source: Calculated from Eurostat (2015a).
Percentage points change 2005–2013
Austria 0% 35% 9%Belgium – 5% 220% 6%Bulgaria – 12% 79% 10%Croatia – 8% 29% 5%Cyprus – 11% 132% 5%
Czech Republic – 8% 89% 6%Denmark – 7% 62% 12%
Estonia 2% 49% 8%Finland – 1% 26% 8%France – 4% 42% 5%
Germany – 1% 84% 6%Greece – 26% 59% 8%
Hungary – 17% 82% 5%Ireland – 14% 136% 5%
Italy – 10% 158% 11%Latvia – 5% 9% 5%
Lithuania – 1% 33% 6%Luxembourg – 7% 136% 2%
Malta 33% 3 172% 4%Netherlands – 1% 92% 2%
Poland 8% 77% 4%Portugal – 16% 11% 6%Romania – 11% 21% 6%Slovakia – 7% 56% 4%Slovenia – 2% 32% 6%
Spain – 17% 51% 7%Sweden – 4% 23% 12%
United Kingdom – 10% 238% 4%
Norway 3% 13% 6%
Relative change 2005–2013 (%)
Gross final energy consumption Gross final energy consumption fromrenewable sources Renewable energy share
(28) RES shares may vary without any additional RES deployment due to changes in gross final energy consumption, ceteris paribus. If total gross final energy consumption between 2005 and 2013 declines, then RES shares may amplify the actual growth of renewable energy consumption. The opposite holds true should gross final energy consumption grow. Overall, by taking into account the change in growth of gross final energy consumption by RES, a positive change is visible, despite the potential amplification mentioned above.

Progress towards renewable energy targets
43Trends and projections in Europe 2015
4.3 Trends in RES shares by sector
RES are used in power generation, in the heating and cooling sector and in the transport sector. The development of RES shares throughout the period from 2005 to 2013 in these individual sectors at EU level, supplemented by approximated RES shares for the year 2014, is depicted in Figure 4.4.
Between 2005 and 2013, the RES share in electricity consumed in the EU grew at an average of 1.3 percentagepointsperyear.In2013,25.4%oftheelectricity consumed in the EU was generated from renewables, with about 38% of that share from variable renewable electricity (wind and solar power). For
2014, preliminary EEA estimates show that a total of 27.1% ofelectricityconsumedstemmedfromRES,with40% takenfromfluctuatingsources(EEA,2015e).
The EU RES share in the heating and cooling grew on average by 0.8 percentage points per year between 2005 and 2013. The share of renewables in this sector amounted to 16.5% in 2013, and is estimated at18.0% in2014(EEA,2015e).Renewableheatingisincreasingly being used as a cost-efficient and secure alternative to fossil fuels (mainly natural gas) in Member States for district heating and at local level.
Progress in the transport sector between 2005 and 2013 has been slowest: the RES share in this sector
Figure 4.4 Renewable energy shares by sector in the EU
Note: Percentagesindicatetheshareontotalgrossfinalenergyconsumptionofthecorrespondingsector.
Year 2014 data are approximated estimates from the EEA.
Source: EC, 2013b; EEA, 2015e; EurObserv'ER, 2015; Eurostat, 2014b and 2015a.
14.8% 15.3%
16.1% 17.0%
19.0% 19.6%
21.7%
23.5%
25.4%
27.1%
10.3% 10.9%
11.9% 12.0%
13.7% 14.1% 15.0%
16.1% 16.5%
18.0%
1.4% 2.1%
2.8% 3.5%
4.3% 4.8%
3.4%
5.1% 5.4% 5.6%
0
5
10
15
20
25
30
2005 2006 2007 2008 2009 2010 2011 2012 2013 2014
RES-E RES-H/C RES-T
%

Progress towards renewable energy targets
44 Trends and projections in Europe 2015
grew on average by 0.5 percentage points per year. In view of this sector being the only one which exhibits a specific RES share target for 2020 (10% share of renewable energy in all energy consumed in transport), speeding up progress seems crucial considering the distance to that target: the RES share in the transport sector was only 5.4% in 2013, and 5.6% in 2014 according to preliminary EEA estimates (EEA, 2015e).
Several reasons may explain the slow progress in the transport sector. Among others, these include uncertainty caused by delays in finalising the legislation limiting the risks of GHG emissions due
toindirectland-usechange(ILUC) (29), and relatively highabatementcostsrelatedtobiofuels (30), not least because progress in the deployment of second-generation biofuels remains rather slow.
Solid biomass for heating is by far the single largest contributing technology throughout the time series, atanequivalentof78 Mtoe(46%ofallRES (31)). With 30 Mtoe,hydropowerprovidedthesecondlargestcontribution in 2013 (18% of all RES) (Figure 4.5). Proxy estimates for the year 2014 show further steady increases. All sources are expected to continue to increase considerably until 2020, especially wind energy.
(29) A political agreement reached in 2012, was adopted in 2015 (EU, 2015b, EU, 2015c). This agreement sets a maximum limit of 7% of final energy consumption in transport in 2020 to the share of energy from biofuels produced from crops grown on agricultural land primarily for energy purposes (and which could be used for other purposes too). Some 18 months after the entry into force of the directive, each Member State is to set a national target for advanced biofuels (for example, made from waste or algae).
(30) Forexample,itisestimated(notconsideringILUCemissions)thatthemitigationcostsofbiodieselwouldbeintherangeofEUR 100toEUR 330per avoided tonne of CO2;forbioethanolfuelsfromsugarsandstraw,costswouldrangebetweenEUR 100andEUR 200pertonneofavoidedCO2 (JRC, 2015).
(31) For this analysis, only compliant biomass and normalised wind and hydro energy consumption have been considered.
Figure 4.5 Historic contributions from renewable energy technologies
Note: The group 'Other renewable energy technology' comprises heat and electricity from geothermal energy as well as electricity from tidal sources.
2014 data are approximated estimates from the EEA.
Source: EC, 2013b; EEA, 2015e; EurObserv'ER, 2015; Eurostat, 2014b and 2015a.
0
20
40
60
80
100
120
140
160
180
200
2005 2006 2007 2008 2009 2010 2011 2012 2013 2014
Mtoe
Other renewable energy technology
Bioliquids in transport
Heatpumps
Solar PV and thermal
Wind power
Bioenergy for electricity and heating
Hydropower

Progress towards renewable energy targets
45Trends and projections in Europe 2015
4.4 Member State progress towards national RES targets
In 2013, a large majority of Member States were on tracktoachievetheirnationalREStargetsfor2020 (32). These binding targets were set in the 2009 RED and are differentiated by Member State to reflect differing national circumstances and starting points (national targets range from 10% for Malta to 49% for Sweden).
Under the RED, Member States must ensure that the share of renewable energy sources equals or exceeds their indicative RED targets during the period between 2011 and 2020. They may reach their indicative RED targets domestically, by establishing adequate RES support measures, or through cooperation (between local, regional and national authorities; planned statistical transfers; or joint projects) with other Member States and with third countries.
In 25 Member States, the national RES shares in 2013 were higher than the indicative shares set in the RED for the two-year period from 2013 to 2014. These indicative targets are part of the 'minimum indicative RES trajectories' determined by the RED for the period from 2005 to 2020, in order to ensure the continued development of renewable energy in each Member State.
Some Member States exhibit 2013 RES shares significantly above their indicative RED target (Figure 4 6).InBulgaria,EstoniaandSweden,theRESshares recorded in 2013 were even higher than the national RED targets set for 2020; in Lithuania, the RES share matches the RED target exactly. However, in Luxembourg, the Netherlands and the United Kingdom, the 2013 RES shares were below their respective 2013 to 2014 indicative RED targets (33).
In 21 Member States, the national RES shares in 2013 were also higher than the 2013 level outlined in the NREAPstheysubmittedin2010 (34).These action plans concern the development of renewable energy at
national level, and include indicative trajectories as well as estimated future RES shares in transport (RES-T), heating and cooling (RES-H/C), and electricity (RES-E).
However, for seven Member States (Denmark, France, Ireland, Luxembourg, the Netherlands, Portugal and Spain), the 2013 RES shares were below the RES trajectories laid out by these Member States in their NREAPs. The RES trajectories in the NREAPs are generally more ambitious than the indicative RES trajectories setoutintheRED(Figure4.6) (35). For example, in the case of Denmark, the indicative RES level for the 2013 to 2014 period set out in the RED is 20.9%, while the expected level from the NREAP is 27.3%. By contrast, the trajectories set out in the national action plans of Greece, Latvia, Romania and the United Kingdom are actually lower than those set out in the RED.
In 2013, all Member States had achieved about a third or more of their 2020 RED targets:
• in four Member States (Luxembourg, Malta, the Netherlands and the United Kingdom), the 2013 RES shares were still below 40% of their 2020 RED target;
• six Member States (Belgium, Cyprus, France, Germany, Ireland and Slovakia) had a RES share of between 40% and 70% of their 2020 RED target;
• seven Member States (Croatia, Greece, Hungary, Poland, Portugal, Slovenia and Spain) had a share between 70% and 90% of their 2020 RED target;
• the other Member States exhibited a RES share either very close to their 2020 RED target (Austria 96%, the Czech Republic 95%, Denmark 91%, Finland 97%, Italy 98%, Latvia 93% and Romania 99%) or already on or above it (Bulgaria, Estonia, Lithuania and Sweden).
Approximated 2014 RES shares are higher than the indicative shares set in the RED for the two-year period from 2013 to 2014 for 27 Member States (i.e. all except theNetherlands (36)). With the approximated shares for
(32) In its 2015 'Renewable energy progress report' (EC, 2015b), the European Commission assessed the progress of the Member States towards their RES targets using historical RES developments for 2013 (data from Eurostat) and modelled data for 2014 and 2020 (Green-X modelling). By contrast, this report tracks progress using Eurostat data for 2013 and approximated estimates from the EEA for 2014 (EEA, 2015e). These different methods explain certain differences between the two reports.
(33) Nevertheless, these countries could still meet their respective 2013 to 2014 indicative RED targets if their RES share growth in 2014 proves strong enough to offset the lower RES share in 2013.
(34) Since 2011, Member States have had to submit biennial progress reports in pursuit of their NREAPs.(35) In its progress reports on the promotion and use of renewable energy from renewable sources submitted under Article 22 of the RED, Italy
presented an updated RES trajectory, due to the unexpected quick development of the use of the RES share compared to that expected in the NREAP submitted in 2010. This was a consequence of the reduction in total final energy consumption and of the increase in energy generation from renewable sources, which was greater than anticipated. Such development is expected to continue until 2020. For the present assessment, the original NREAP trajectory was taken into account.
(36) Under the RED, Member States must officially amended and re-submit their NREAPs, should their RES share fall below the indicative RED trajectory in the immediately preceding two-year period (RED Art.4.4). As shown in the 2014 'Trends and projections' report (EEA, 2014a), the Netherlands and other Member States recorded national RES shares in 2011 and 2012 below their respective indicative RED targets for this period.
Progress towards renewable energy targets
46 Trends and projections in Europe 2015
2014, six additional Member States now show higher shares than their indicative RED target for 2020 (Austria, the Czech Republic, Finland, Italy, Lithuania and Romania).
In 20 Member States, the approximated RES shares in 2014 were also higher than their 2014 level outlined in their NREAPs. In particular, the 2014 RES shares of Denmark and Luxembourg were higher than their NREAP indicative targets, not the case in 2013. Conversely, the 2014 RES shares of Cyprus and Malta are estimated to be lower than their respective indicative NREAP targets, while the United Kingdom stood exactly at the level of its 2014 NREAP target.
According to the currently available progress reports on renewable energy submitted by Member States in 2013, 16 Member States expect more production fromRESthanintheirindicativetrajectory (37) for at least 1 year until 2020. These Member States could, in principle, transfer excess amounts to other Member
States experiencing deficits. Such transfers would help more Member States attain their interim targets. The progress reports suggest that no statistical transfers had yet been made by 2013, but that Member States with excess production are willing and prepared to carry out such transfers in the future.
Norway and Sweden created a joint electricity certificate market in 2012, in which an electricity certificate issued in one country can be used to meet the quota obligation in the other country, and vice versa. Apart from this case, no other Member State reported having implemented such a joint project.
The specific target for renewable energy use in the transport sector is the same for all Member States (38). In 2013, only Sweden exhibited a RES shares in transport higher than 10% (39). The remaining Member States exhibited shares between 0.2% (Estonia) and 9.9% (Finland) (see also Table A4.2 in Annex 4).
(37) Excess and deficits are reported in Table 7 in the 'progress reports on the promotion and use of renewable energy from renewable sources' under Article 22 of the RED.
(38) At least 10% of energy consumption in the transport sector should stem from RES in 2020.(39) Sweden is currently a positive outlier with its high RES-T share of 16.7%: it stimulates fuel efficiency and renewable energy use in transport
through a number of tax incentives and blending. It has a very high share of flexi-fuel vehicles, with numerous public busses running on ethanol and biogas. Many municipalities produce biogas from separately collected food waste and sewage. In addition, Sweden has also a high share of non-road renewable electricity consumption in transport thanks to a well-developed and extensive rail system.
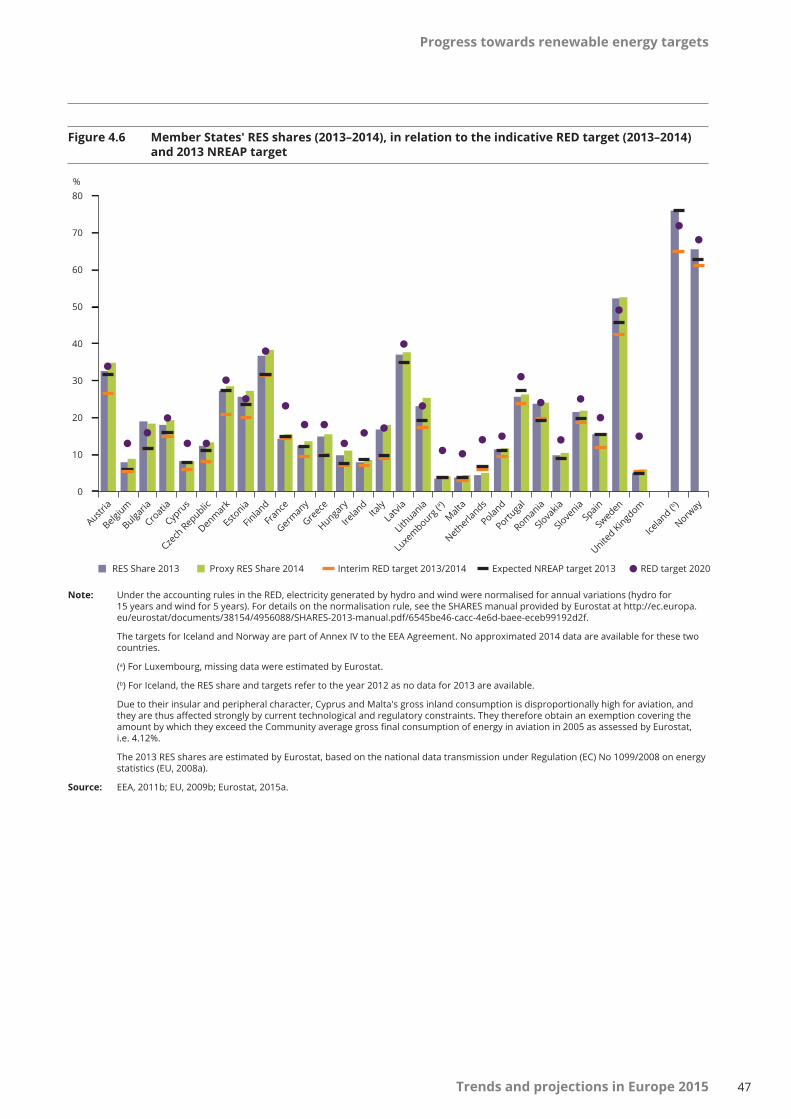
Progress towards renewable energy targets
47Trends and projections in Europe 2015
Figure 4.6 Member States' RES shares (2013–2014), in relation to the indicative RED target (2013–2014) and 2013 NREAP target
Note: Under the accounting rules in the RED, electricity generated by hydro and wind were normalised for annual variations (hydro for 15 yearsandwindfor5years).Fordetailsonthenormalisationrule,seetheSHARESmanualprovidedbyEurostatathttp://ec.europa.eu/eurostat/documents/38154/4956088/SHARES-2013-manual.pdf/6545be46-cacc-4e6d-baee-eceb99192d2f.
The targets for Iceland and Norway are part of Annex IV to the EEA Agreement. No approximated 2014 data are available for these two countries.
(a) For Luxembourg, missing data were estimated by Eurostat.
(b) For Iceland, the RES share and targets refer to the year 2012 as no data for 2013 are available.
Due to their insular and peripheral character, Cyprus and Malta's gross inland consumption is disproportionally high for aviation, and theyarethusaffectedstronglybycurrenttechnologicalandregulatoryconstraints.TheythereforeobtainanexemptioncoveringtheamountbywhichtheyexceedtheCommunityaveragegrossfinalconsumptionofenergyinaviationin2005asassessedbyEurostat,i.e. 4.12%.
The 2013 RES shares are estimated by Eurostat, based on the national data transmission under Regulation (EC) No 1099/2008 on energy statistics (EU, 2008a).
Source: EEA, 2011b; EU, 2009b; Eurostat, 2015a.
0
10
20
30
40
50
60
70
80
Austria
Belgium
Bulgaria
Croatia
Cypru
s
Czech
Republic
Denmark
Estonia
Finland
France
Germany
Greece
Hungary
Ireland
Italy
Latvi
a
Lithuania
Luxe
mbourg (a )
Malta
Netherla
nds
Poland
Portuga
l
Romania
Slova
kia
Slove
nia
Spain
Sweden
United Kingd
om
Iceland (b )
Norway
RES Share 2013 Proxy RES Share 2014 Interim RED target 2013/2014 Expected NREAP target 2013 RED target 2020
%

Trends and projections in Europe 201548
Progress towards energy efficiency targets
5 Progress towards energy efficiency targets
Progress in numbers
• The EU is currently on track to meet its 20% energy efficiency target for 2020. In 2013, its primary energy consumption was 8.3% below 2005 levels. Continuing this downward trend at the same pace until 2020 would be sufficient for the EU to achieve its absolute target on primary energy consumption, which is equivalent to a reduction by 13.2%, compared to 2005 levels.
• The overall ambition of Member States to reduce or limit their energy consumption by 2020 remains insufficient. Member States have set their own indicative national absolute targets on primary energy consumption for 2020, which are not binding. The sum of these 28 national targets is 3% higher than the absolute target for 2020 set at EU level. Therefore, Member States overall are not aiming at sufficient reductions in energy use.
• In 2013, energy consumption in 20 Member States had sufficiently decreased or been limited since 2005 for these countries to be considered on track to meet their 2020 target. Eight Member States had not achieved sufficient savings: Belgium, Estonia, France, Germany, Malta, the Netherlands, Poland and Sweden. For these countries, 2013 levels in energy consumption stood above the linear trajectories between 2005 levels and 2020 targets.
• To support the fulfilment of national energy efficiency targets, the EED requires Member States to save energy in end-use sectors, by at least 1.5% per year between 2014 and 2020. This should be done through energy efficiency obligation (EEO) schemes or other alternative policy measures. However, the overall impact of this requirement could be smaller than originally envisaged, because Member States make extensive use of exemptions to limit their commitments to achieve new energy savings, do not sufficiently account for possible overlap between measures, and do not sufficiently demonstrate how they will achieve new savings compared to savings from already existing measures.
• The reductions in EU's energy consumption between 2005 and 2013 were a result of energy efficiency policies implemented across the EU, as well as reflecting the effects of the economic recession on energy demand. As economies pick up again across Europe, further efforts will be necessary to ensure that energy consumption continues to decrease.
Box 5.1 Primary and final energy consumption
Primary energy consumption measures the total energy demand of a country. It covers consumption of the energy sector itself, losses during the transformation (for example, from oil or gas into electricity) and distribution of energy, and final consumption by end users. It excludes energy carriers used for non-energy purposes (such as petroleum used not for combustion but for producing plastics).
Final energy consumption means all energy supplied to industry, transport, households, services and agriculture. It excludesdeliveriestotheenergytransformationsectorandtheenergyindustriesthemselves.
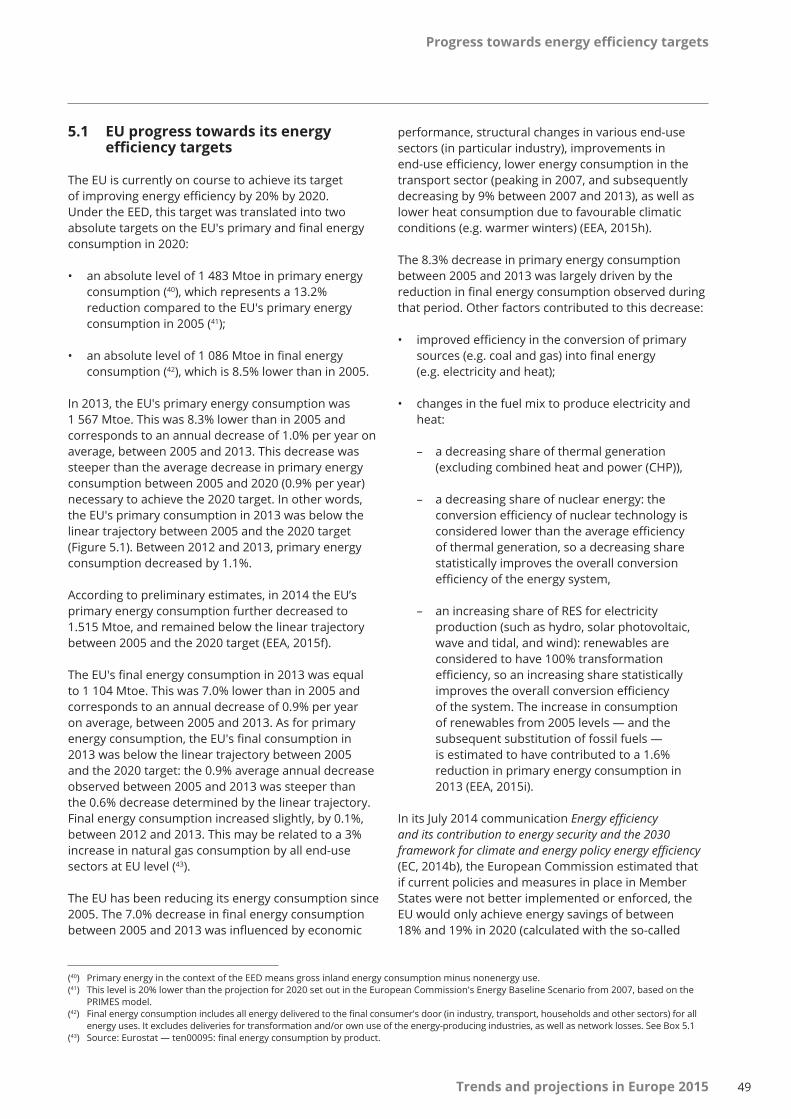
Progress towards energy efficiency targets
49Trends and projections in Europe 2015
5.1 EU progress towards its energy efficiency targets
The EU is currently on course to achieve its target of improving energy efficiency by 20% by 2020. Under the EED, this target was translated into two absolute targets on the EU's primary and final energy consumption in 2020:
• anabsolutelevelof1 483 Mtoeinprimaryenergyconsumption (40), which represents a 13.2% reduction compared to the EU's primary energy consumptionin2005 (41);
• anabsolutelevelof1 086 Mtoeinfinalenergyconsumption (42), which is 8.5% lower than in 2005.
In 2013, the EU's primary energy consumption was 1 567 Mtoe.Thiswas8.3%lowerthanin2005andcorresponds to an annual decrease of 1.0% per year on average, between 2005 and 2013. This decrease was steeper than the average decrease in primary energy consumption between 2005 and 2020 (0.9% per year) necessary to achieve the 2020 target. In other words, the EU's primary consumption in 2013 was below the linear trajectory between 2005 and the 2020 target (Figure 5.1). Between 2012 and 2013, primary energy consumption decreased by 1.1%.
According to preliminary estimates, in 2014 the EU’s primary energy consumption further decreased to 1.515 Mtoe, and remained below the linear trajectory between 2005 and the 2020 target (EEA, 2015f).
The EU's final energy consumption in 2013 was equal to1 104 Mtoe.Thiswas7.0%lowerthanin2005andcorresponds to an annual decrease of 0.9% per year on average, between 2005 and 2013. As for primary energy consumption, the EU's final consumption in 2013 was below the linear trajectory between 2005 and the 2020 target: the 0.9% average annual decrease observed between 2005 and 2013 was steeper than the 0.6% decrease determined by the linear trajectory. Final energy consumption increased slightly, by 0.1%, between 2012 and 2013. This may be related to a 3% increase in natural gas consumption by all end-use sectorsatEUlevel (43).
The EU has been reducing its energy consumption since 2005. The 7.0% decrease in final energy consumption between 2005 and 2013 was influenced by economic
performance, structural changes in various end-use sectors (in particular industry), improvements in end-use efficiency, lower energy consumption in the transport sector (peaking in 2007, and subsequently decreasing by 9% between 2007 and 2013), as well as lower heat consumption due to favourable climatic conditions (e.g. warmer winters) (EEA, 2015h).
The 8.3% decrease in primary energy consumption between 2005 and 2013 was largely driven by the reduction in final energy consumption observed during that period. Other factors contributed to this decrease:
• improved efficiency in the conversion of primary sources (e.g. coal and gas) into final energy (e.g. electricityandheat);
• changes in the fuel mix to produce electricity and heat:
– a decreasing share of thermal generation (excluding combined heat and power (CHP)),
– a decreasing share of nuclear energy: the conversion efficiency of nuclear technology is considered lower than the average efficiency of thermal generation, so a decreasing share statistically improves the overall conversion efficiency of the energy system,
– an increasing share of RES for electricity production (such as hydro, solar photovoltaic, wave and tidal, and wind): renewables are considered to have 100% transformation efficiency, so an increasing share statistically improves the overall conversion efficiency of the system. The increase in consumption of renewables from 2005 levels — and the subsequent substitution of fossil fuels — is estimatedtohavecontributedtoa1.6%reduction in primary energy consumption in 2013(EEA, 2015i).
In its July 2014 communication Energy efficiency and its contribution to energy security and the 2030 framework for climate and energy policy energy efficiency (EC, 2014b),theEuropeanCommissionestimatedthatif current policies and measures in place in Member States were not better implemented or enforced, the EU would only achieve energy savings of between 18% and 19% in 2020 (calculated with the so-called
(40) Primary energy in the context of the EED means gross inland energy consumption minus nonenergy use.(41) This level is 20% lower than the projection for 2020 set out in the European Commission's Energy Baseline Scenario from 2007, based on the
PRIMES model.(42) Final energy consumption includes all energy delivered to the final consumer's door (in industry, transport, households and other sectors) for all
energy uses. It excludes deliveries for transformation and/or own use of the energy-producing industries, as well as network losses. See Box 5.1(43) Source: Eurostat — ten00095: final energy consumption by product.
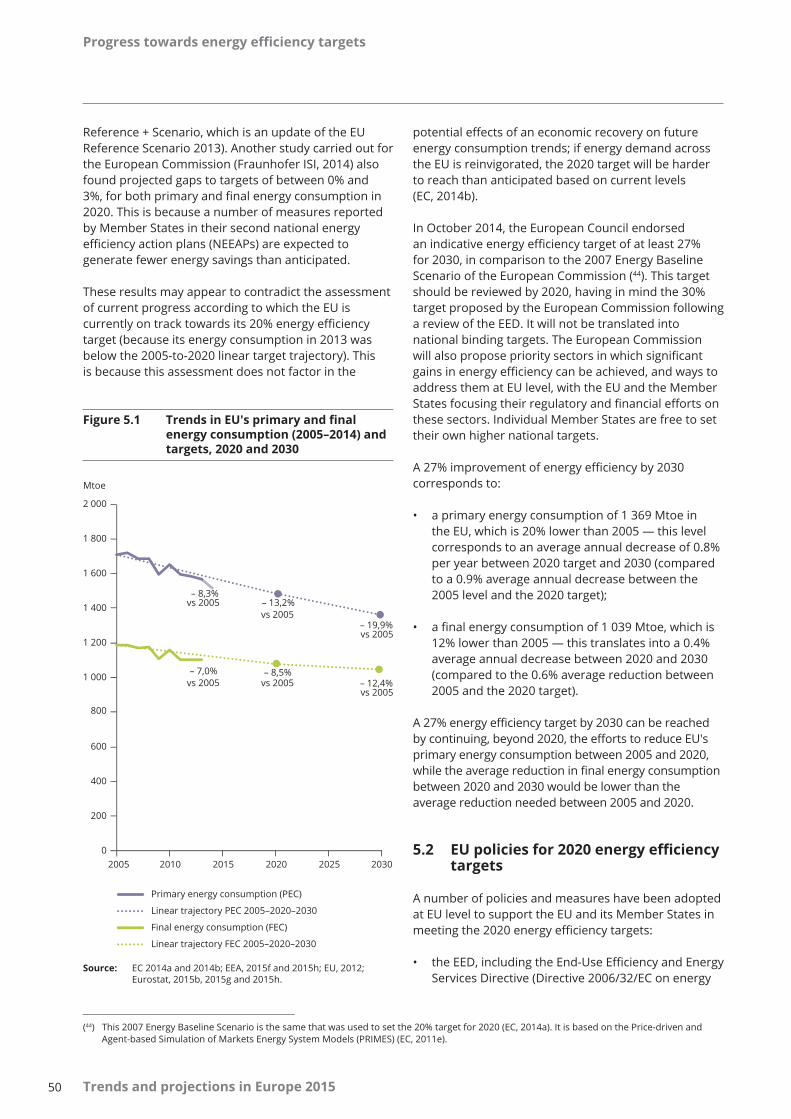
Progress towards energy efficiency targets
50 Trends and projections in Europe 2015
Reference + Scenario,whichisanupdateoftheEUReference Scenario 2013). Another study carried out for the European Commission (Fraunhofer ISI, 2014) also found projected gaps to targets of between 0% and 3%, for both primary and final energy consumption in 2020. This is because a number of measures reported by Member States in their second national energy efficiency action plans (NEEAPs) are expected to generate fewer energy savings than anticipated.
These results may appear to contradict the assessment of current progress according to which the EU is currently on track towards its 20% energy efficiency target (because its energy consumption in 2013 was below the 2005-to-2020 linear target trajectory). This is because this assessment does not factor in the
potential effects of an economic recovery on future energy consumption trends; if energy demand across the EU is reinvigorated, the 2020 target will be harder to reach than anticipated based on current levels (EC, 2014b).
In October 2014, the European Council endorsed an indicative energy efficiency target of at least 27% for 2030, in comparison to the 2007 Energy Baseline ScenariooftheEuropeanCommission (44). This target should be reviewed by 2020, having in mind the 30% target proposed by the European Commission following a review of the EED. It will not be translated into national binding targets. The European Commission will also propose priority sectors in which significant gains in energy efficiency can be achieved, and ways to address them at EU level, with the EU and the Member States focusing their regulatory and financial efforts on these sectors. Individual Member States are free to set their own higher national targets.
A 27% improvement of energy efficiency by 2030 corresponds to:
• aprimaryenergyconsumptionof1 369 Mtoeinthe EU, which is 20% lower than 2005 — this level corresponds to an average annual decrease of 0.8% per year between 2020 target and 2030 (compared to a 0.9% average annual decrease between the 2005 level and the 2020 target);
• afinalenergyconsumptionof1 039 Mtoe,whichis12% lower than 2005 — this translates into a 0.4% average annual decrease between 2020 and 2030 (compared to the 0.6% average reduction between 2005 and the 2020 target).
A 27% energy efficiency target by 2030 can be reached by continuing, beyond 2020, the efforts to reduce EU's primary energy consumption between 2005 and 2020, while the average reduction in final energy consumption between 2020 and 2030 would be lower than the average reduction needed between 2005 and 2020.
5.2 EU policies for 2020 energy efficiency targets
A number of policies and measures have been adopted at EU level to support the EU and its Member States in meeting the 2020 energy efficiency targets:
• the EED, including the End-Use Efficiency and Energy Services Directive (Directive 2006/32/EC on energy
Figure 5.1 Trends in EU's primary and final energy consumption (2005–2014) and targets, 2020 and 2030
Source: EC 2014a and 2014b; EEA, 2015f and 2015h; EU, 2012; Eurostat, 2015b, 2015g and 2015h.
– 8,3% vs 2005 – 13,2%
vs 2005 – 19,9% vs 2005
– 7,0% vs 2005
– 8,5% vs 2005 – 12,4%
vs 2005
0
200
400
600
800
1 000
1 200
1 400
1 600
1 800
2 000
2005 2010 2015 2020 2025 2030
Mtoe
Primary energy consumption (PEC)
Linear trajectory PEC 2005–2020–2030
Final energy consumption (FEC)
Linear trajectory FEC 2005–2020–2030
(44) This 2007 Energy Baseline Scenario is the same that was used to set the 20% target for 2020 (EC, 2014a). It is based on the Price-driven and Agent-based Simulation of Markets Energy System Models (PRIMES) (EC, 2011e).
Progress towards energy efficiency targets
51Trends and projections in Europe 2015
end-use efficiency and energy services repealing Council Directive 93/76/EEC);
• the Energy Performance of Buildings Directive (EPBD) (Directive 2010/31/EU of the European Parliament and of the Council of 19 May 2010 on theenergyperformanceofbuildings);
• product regulations laying down minimum energy performance standards and putting energy performance information on labels (the Ecodesign Directive (Directive 2009/125/EC of the European ParliamentandoftheCouncilof21 October 2009establishing a framework for the setting of ecodesign requirements for energy-related products)) and the Energy Labelling Directive (Directive 2010/30/EU of the European Parliament and of the Council of 19 May 2010 on the indication by labelling and standard product information of the consumption of energy and other resources by energy-related products)
• CO2 performance standards for cars and vans;
• increased financing through EU Structural and Investments (ESI) Funds, Horizon 2020, and dedicated facilities such as European Local ENergy Assistance (ELENA) and the European Energy Efficiency Fund;
• the roll-out of smart meters, following the Internal Electricity Market Directive (Directive 2009/72/EC of the European Parliament and of the Council of 13 July 2009 concerning common rules for the internal market in electricity and repealing Directive 2003/54/EC).
• the ESD, reducing emissions from non-ETS sectors;
• theEU ETS.
The 2012 EED (EU, 2012) contained a set of binding measures to help the EU reach its 20% energy efficiency target by 2020. Under the directive, Member States are required to use energy more efficiently at all stages of the energy chain: from its production to its final consumption. It is also under this directive that Member States are required to set their own indicative 2020 target in order to contribute to the achievement of the EU's 2020 energy efficiency target.
More than half of the required energy savings are expected to be delivered by Article 7 of the EED,
under which Member States must attain 1.5% of new energy savings from sales to final consumers for every year between 2014 and 2020. This is to be achieved by setting up EEO schemes or adopting other alternative policy measures. In the few countries or regions where they have been implemented (Denmark, France, Italy, Poland and the United Kingdom, as well as the Flanders region in Belgium), EEO schemes delivered significant savings in an efficient manner. Nevertheless, many countries seem to prefer alternative measures which build on existing measures to setting up EEOs. This may be happening because EEOs are a completely new type of instrument for most Member States. There is therefore little experience in designing, administering and adapting this type of policy. Furthermore, large differences exist across schemes in terms of number and types of obliged parties, eligible sectors, eligible projects, monitoring mechanisms, fund raising mechanisms and metrics used to set the targets. These differences may hamper experience sharing between Member States. Alternative measures are expected to contribute towards approximately 60% of the total energy saving target under Article 7 of the EED, while EEOs could contribute to the remaining 40% of target savings (ENSPOL, 2014).
The overall impact of Article 7 might be less important than initially expected. A recent evaluation for the European Commission of the national policies and measures reported under Article 7 indicates that total annual savings in primary energy will be smaller than initially estimated by the European Commission in 2011 (Ricardo AEA et al., 2015). This is mainly due to two reasons, as explained below.
• Almost all countries plan to use the maximum exemptions possible, which means that the 1.5% annualend-usesavingstargetsetunderArticle 7couldbereducedbyupto25%.
• Three quarters of all energy savings under Article 7 will be delivered by policy measures already in place before the directive came into force (Ricardo AEA et al., 2015). Most of these savings come from cross-cutting measures such as taxes or financial incentives. The residential sector is responsible for the largest share of the savings coming from measures targeting a single sector. Member States adoptdifferentapproachestobothadditionality (45) and double counting of policy measures, suggesting a general insufficient accounting for additionality for most Member States.
(45) The EED requires that energy savings be additional to the required minimum EU levels. Only savings above levels that are 'mandatory and applicable in Member States under the Union Law' may be counted towards the target.

Progress towards energy efficiency targets
52 Trends and projections in Europe 2015
Overall, calculation and reporting approaches for Article 7 measures are extremely diverse across Member States. Information on methodological aspects remains incomplete, and it is difficult to determine the most appropriate calculation method for energy savings, owing in large part to the variety of policy measures with broad technology and sectoral scopes (ENSPOL, 2014; Ricardo AEA et al., 2015).
5.3 National 2020 energy efficiency targets vs the EU target
There is an apparent overall lack of ambition in the primary energy targets which Member States have taken on under the EED. The sum of the latest Member States' 2020 absolute targets for primary energy consumption remains 3% higher than the EU targets adopted under the EED, in contrast to the final energy targets.
• The sum of all 2020 targets for primary energy consumption from 28 Member States is equal to 1 530 Mtoe.Thisishigher,by47 Mtoe(3%),thantheEUtargetof1 483 Mtoe.Between2014and2015, the gap remained constant, although Croatia also formulated a primary energy target for 2020 in its NEEAP 2014. The constant gap is explained by the lower targets as reported by different Member States in their national energy efficiency action plans (NEEAPs) of 2014, counterbalancing the Croatian target.
• For final energy consumption, the sum of all 2020 targetsfrom28MemberStatesis5 Mtoe(0.5%)belowtheEUtargetof1 086 Mtoe.
Therefore, if all Member States strictly achieve their national targets under the EED, the EU's primary and final energy consumption would decrease to levels
Figure 5.2 Overall ambition level of national targets for primary and final energy consumption by 2020
Note: The Member States grouped as 'Other Member States' are those which have a 2020 target on primary energy consumption lower than 20 Mtoeanda2020targetonfinalenergyconsumptionlowerthan15 Mtoe.Inorderofdecreasingmagnitudeof2020target,thesecountries are Denmark, Bulgaria, Slovakia, Ireland, Slovenia, Estonia, Lithuania, Latvia, Luxembourg, Cyprus, Malta and Croatia.
Source: Reported targets under Article 3 of the EED in 2013, including updates of Austria, Bulgaria, Croatia, Cyprus, France, Greece, Italy, Poland, Slovakia,Spain,SwedenandtheUnitedKingdombasedontheirthirdNEEAPssubmittedin2014(orbasedonseparatenotificationstothe Commission).
1 483
1 086
0
200
400
600
800
1 000
1 200
1 400
1 600
1 800
2 000
EU and national targets on primary energy consumption
EU and national targets on final energy consumption
Mtoe Baseline 2020 primary energy consumption
Baseline 2020 final energy consumption
– 20 % target
Sum of national targets: – 17 %
– 20 % target
Sum of national targets: – 20 %
Other Member States Portugal Greece Hungary Austria Finland Czech Republic Romania Sweden Belgium Netherlands Poland Spain Italy United Kingdom France Germany
EU target EU Baseline Scenario
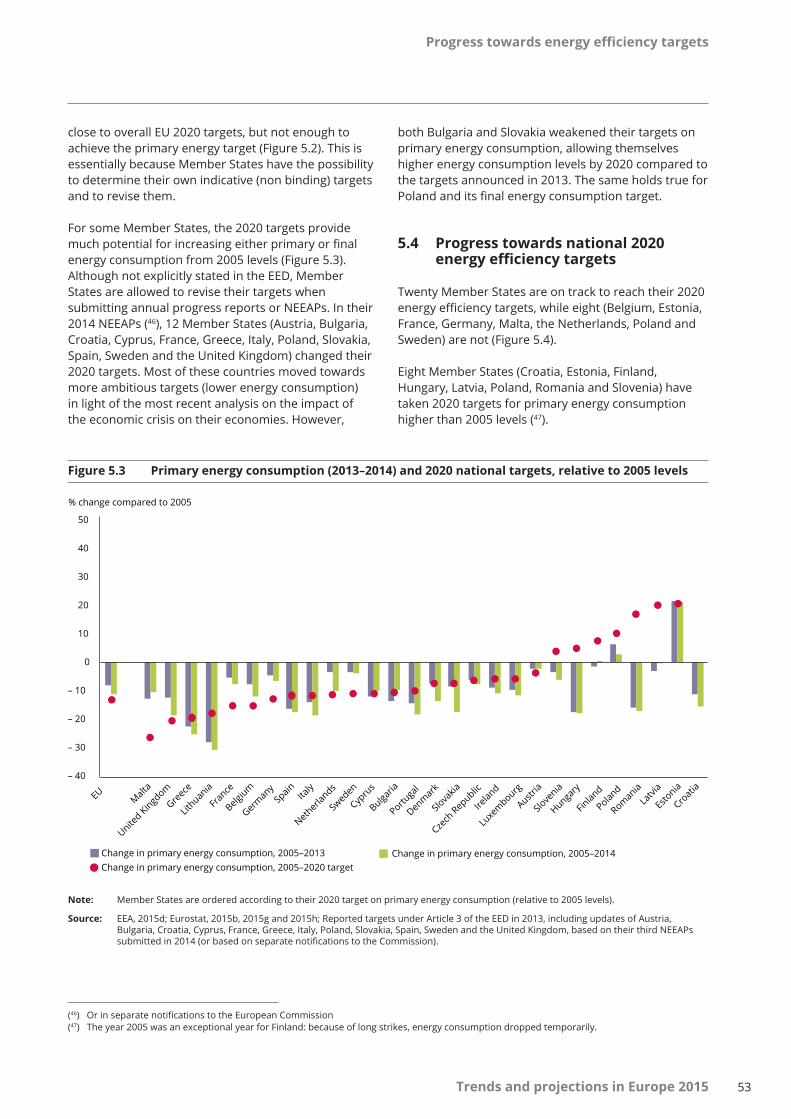
Progress towards energy efficiency targets
53Trends and projections in Europe 2015
Figure 5.3 Primary energy consumption (2013–2014) and 2020 national targets, relative to 2005 levels
Note: Member States are ordered according to their 2020 target on primary energy consumption (relative to 2005 levels).
Source: EEA, 2015d; Eurostat, 2015b, 2015g and 2015h; Reported targets under Article 3 of the EED in 2013, including updates of Austria, Bulgaria, Croatia, Cyprus, France, Greece, Italy, Poland, Slovakia, Spain, Sweden and the United Kingdom, based on their third NEEAPs submittedin2014(orbasedonseparatenotificationstotheCommission).
– 40
– 30
– 20
– 10
0
10
20
30
40
50
EU Malta
United Kingd
om
Greece
Lithuania
France
Belgium
Germany
Spain
Italy
Netherla
nds
Sweden
Cypru
s
Bulgaria
Portuga
l
Denmark
Slova
kia
Czech
Republic
Ireland
Luxe
mbourg
Austria
Slove
nia
Hungary
Finland
Poland
Romania
Latvi
a
Estonia
Croatia
% change compared to 2005
Change in primary energy consumption, 2005–2013 Change in primary energy consumption, 2005–2014 Change in primary energy consumption, 2005–2020 target
close to overall EU 2020 targets, but not enough to achieve the primary energy target (Figure 5.2). This is essentially because Member States have the possibility todeterminetheirownindicative(non binding)targetsand to revise them.
For some Member States, the 2020 targets provide much potential for increasing either primary or final energy consumption from 2005 levels (Figure 5.3). Although not explicitly stated in the EED, Member States are allowed to revise their targets when submitting annual progress reports or NEEAPs. In their 2014NEEAPs (46), 12 Member States (Austria, Bulgaria, Croatia, Cyprus, France, Greece, Italy, Poland, Slovakia, Spain, Sweden and the United Kingdom) changed their 2020 targets. Most of these countries moved towards more ambitious targets (lower energy consumption) in light of the most recent analysis on the impact of the economic crisis on their economies. However,
both Bulgaria and Slovakia weakened their targets on primary energy consumption, allowing themselves higher energy consumption levels by 2020 compared to the targets announced in 2013. The same holds true for Poland and its final energy consumption target.
5.4 Progress towards national 2020 energy efficiency targets
Twenty Member States are on track to reach their 2020 energy efficiency targets, while eight (Belgium, Estonia, France, Germany, Malta, the Netherlands, Poland and Sweden) are not (Figure 5.4).
Eight Member States (Croatia, Estonia, Finland, Hungary, Latvia, Poland, Romania and Slovenia) have taken 2020 targets for primary energy consumption higherthan2005levels (47).
(46) Or in separate notifications to the European Commission(47) The year 2005 was an exceptional year for Finland: because of long strikes, energy consumption dropped temporarily.
Progress towards energy efficiency targets
54 Trends and projections in Europe 2015
• Croatia, Finland, Hungary, Latvia, Romania and Slovenia managed to reduce their primary energy consumption between 2005 and 2013, thereby staying well below their linear trajectory between 2005 and the 2020 targets.
• Estonia and Poland are the only two Member States whose primary energy consumption increased between 2005 and 2013. Furthermore, these increases were too large for primary energy consumption to remain below the linear trajectories between 2005 levels and the 2020 targets( + 0.8%increaseperyearinprimaryenergyconsumptionforPolandand+ 2.7%annualincrease for Estonia between 2005 and 2013). Energy consumption in the residential sector as well as the services sector grew in both countries. Moreover, energy demand in the transport sector inPolandgrewsignificantly( + 30%between2005and 2013), which can be linked to economic growth and higher living standards. For example, the number of passenger cars per inhabitant increased by 50% between 2005 and 2012 (EEA, 2014e; Eurostat, 2015g).
Twenty Member States have taken a reduction target for 2020 for primary energy consumption.
• In 14 Member States, the pace of reductions in primary energy consumption between 2005 and 2013 was sufficient, and if maintained until 2020, should allow them to reach their 2020 target. In 11 of these Member States (Bulgaria, Cyprus, the Czech Republic, Greece, Ireland, Italy, Lithuania, Luxembourg, Portugal, Slovakia and Spain), the 2013 levels were actually already below the 2020 primary energy targets. These Member States are therefore in a situation where stabilising their energy consumption is crucial, especially as their economies recover from the crisis.
• The remaining six Member States (Belgium, France, Germany, Malta, the Netherlands and Sweden) have not been reducing their primary energy consumption fast enough between 2005 and 2013 to stay below their linear 2005 to 2020 trajectory. These countries have adopted targets for 2020 exceeding a 10% reduction of primary energy compared to 2005 (see Figure A1.3 in Annex 1). Malta, the Netherlands and Sweden made a good progress in 2013 compared to 2012: both countries
reduced their primary energy consumption in 2013 compared to 2012, and reduced the gap with their linear trajectory. By contrast, energy consumption increased in Belgium, France and Germany, therefore the distance to the linear trajectory and to the 2020 target increased. In Belgium, the deviation between the 2013 primary energy consumption and the 2005-to-2020 linear trajectory is very small(– 0.01%).InGermany,asaresponsetotheinsufficient progress observed so far, in December 2014 the government launched a new national action plan on energy efficiency (NAPE), which sets out the strategy on energy efficiency Strategy of the federal government for the 18th legislative term by laying down short-term measures and longer-term work processes (BMUB, 2014).
Preliminary estimates show that in 2014, primary energy consumption decreased in most Member States compared to 2013, except for Bulgaria, Cyprus, Finland, Malta and Latvia. This decrease can be partly explained by an exceptionally warm winter, which reduced energy demand for heating across Europe.
Member States have already put in place a wide range of energy efficiency measures that should go a long way towards meeting the 2020 energy efficiency objective, but the challenge remains to fully implement and enforce these measures at national level. Furthermore, Member States will need to achieve reductions beyond their targets in order to have the EU meet its overall 2020 energy efficiency target related to primary energy.
There is a risk that the economic crisis, which contributed to recent reductions in energy consumption levels across the EU, has sent a misleading signal: that energy efficiency targets might be achieved with limited efforts. In fact, Member States will need to continue to fully implement and enforce the agreed legislation, and to overcome common barriers associated with energy efficiency improvements. Such obstacles include lack of transparency, inadequate pricing of externalities and insufficient financing. Focus should be placed on the multiple benefits of energy efficiency, such as enhancing the sustainability of the energy system, supporting strategic objectives for economic and social development (e.g. job creation), increasing prosperity (e.g. retrofitting buildings for health and well-being) and promoting environmental goals (EEA, 2014b).

Progress towards energy efficiency targets
55Trends and projections in Europe 2015
Box 5.2 Progress towards 2016 targets under the Energy Services Directive
In 2006, the EU adopted a framework for energy end-use efficiency and energy services, the End-Use Efficiency and Energy Services Directive (EU, 2006). According to this directive, Member States must adopt and attain an indicative energy saving targetof9%offinalenergyconsumptionby2016.Basedonthe2014NEEAPsfrom20countries (48), most countries expect that they will meet or even exceed the 2016 target. However, progress made by Estonia, Italy, Lithuania and Slovakia is slower, and according to these Member States' estimates, a significant gap remains till the 2016 target is met. These Member States may therefore need to step up efforts in order to stay on track towards these targets.
(48) The NEEAPs from seven Member States (Austria, the Czech Republic, Hungary, Ireland, Latvia, Romania and Slovenia) were either not available at all, unavailable in English on the European Commission website (see https://ec.europa.eu/energy/en/topics/energy-efficiency/energy-efficiency-directive/national-energy-efficiency-action-plans) at the time of writing, or did not include information on the national target under the End-Use Efficiency and Energy Services Directive.
Figure 5.4 Distance between 2013 and 2014 primary energy consumption and linear target path
Note: The assessment is based on a comparison between the 2013 levels in primary energy consumption and the 2013 levels of the linear targetpathbetween2005andthe2020targetonprimaryenergyconsumption,foreachMemberState.Becausethisisonlythefirstyear that the EEA is able to estimate approximated primary energy consumption level for the year 'Y-1', the comparison between 2014 levels is provided as additional information only but is not used for the assessment (see Section 1.3).
Source: EEA, 2015f; Eurostat 2015b, 2015g and 2015h; Reported targets under Article 3 of the EED in 2013, including updates of Austria, Bulgaria, Croatia, Cyprus, France, Greece, Italy, Poland, Slovakia, Spain, Sweden and the United Kingdom, based on their third NEEAPs submitted in2014(orbasedonseparatenotificationstotheCommission).
– 10
-5
0
5
10
15
20
25
Austria
Belgium
Bulgaria
Croatia
Cypru
s
Czech
Republic
Denmark
Estonia
Finland
France
Germany
Greece
Hungary
Ireland
Italy
Latvi
a
Lithuania
Luxe
mbourg
Malta
Netherla
nds
Poland
Portuga
l
Romania
Slova
kia
Slove
nia
Spain
Sweden
United Kingd
om
ktoe
Gap to linear target path in 2013 Gap to linear target path in 2014

Trends and projections in Europe 201556
Acronyms, units and terms
Acronyms, units and terms
AAU Assigned amount unit. A Kyoto unit representing an allowance to emit 1 metric tonne of carbon dioxide equivalent (CO2-eq.) AAUs are created (issued) up to a level of a Party's initial assigned amount
AEA Annual emission allocation (allowances issued under the ESD)
Annex I The annex to the UNFCCC specifying which developed country Parties and other Parties to the UNFCCC have committed to limiting anthropogenic emissions and enhancing their GHG sinks and reservoirs
AR IPCC Assessment Report
ARD Afforestation, reforestation and deforestation
Assigned amount The total quantity of valid emission allowances (Kyoto units) held by a Party within its national registry. The initial assigned amount for a Party is determined by its base-year emissions,anditsemissionlimitationandreductionobjectivecontainedinAnnex BtotheKyoto Protocol. Any Kyoto units that the Party acquires through the Kyoto mechanisms, or issues for removals from LULUCF activities under Article 3, paragraphs 3 and 4, are added to the Party's assigned amount; any units that the Party transfers, or cancels for emissions from LULUCF activities under Article 3, paragraphs 3 and 4, are subtracted from the Party's assigned amount. At the end of the commitment period, each Party must ensure that its total emissions over the commitment period are less than or equal to its total assigned amount
Cancellation The transfer of a unit to a cancellation account. Such units may not be further transferred, and may not be used towards meeting a Party's Kyoto target
Carry-over The authorisation for a unit that was issued in one commitment period to be used in a subsequent commitment period. Individual unit types are subject to different rules for carry-over
CDM Clean Development Mechanism. A Kyoto Protocol mechanism that allows Annex I Parties to purchase emission allowances from projects in non-Annex I Parties that reduce or remove emissions. The emission allowances from CDM projects are CERs
CER Certified emission reduction. A Kyoto unit representing an allowance to emit 1 metric tonne of CO2-eq. CERs are issued for emission reductions from CDM project activities
CH4 Methane
CM Cropland management
CO2 Carbon dioxide
CO2-eq. Carbon dioxide equivalent
Acronyms, units and terms
57Trends and projections in Europe 2015
COP Conference of the Parties to the UNFCCC
CRF Common reporting format
Domestic Pertaining to a country's or group of countries' own emissions or internal action to reduce emissions
EEA European Environment Agency
EED Energy Efficiency Directive (Directive 2012/27/EU of the European Parliament and of the Councilof25 October 2012onenergyefficiency,amendingDirectives2009/125/ECand2010/30/EU and repealing Directives 2004/8/EC and 2006/32/EC)
EEO Energy efficiency obligation
EFTA countries European Free Trade Association countries: Iceland, Norway, Liechtenstein and Switzerland
ELENA European Local Energy Assistance
EPBD Energy Performance of Buildings Directive (Directive 2010/31/EU of the European ParliamentandoftheCouncilof19 May 2010ontheenergyperformanceofbuildings)
ERU Emission reduction unit. A Kyoto unit representing an allowance to emit 1 metric tonne of CO2-eq. ERUs are issued for emission reductions or emission removals from JI project activities by converting an equivalent quantity of the Party's existing AAUs or RMUs
ESD Effort Sharing Decision (Decision No 406/2009/EC of the European Parliament and of the Councilof23 April 2009ontheeffortofMemberStatestoreducetheirgreenhousegasemissions to meet the Community's greenhouse gas emission reduction commitments up to 2020)
ESI EU Structural and Investments
ETC/ACM European Topic Centre on Air Pollution and Climate Change Mitigation. The ETC/ACM is a consortium of European institutes contracted by the EEA to carry out specific tasks in the field of air pollution and climate change
EU ETS EuropeanUnionEmissionsTradingSystem
EU European Union (Austria, Belgium, Bulgaria, Croatia, Cyprus, the Czech Republic, Denmark, Estonia, Finland, France Germany, Greece, Hungary, Ireland, Italy, Latvia, Lithuania, Luxembourg, Malta, the Netherlands, Poland, Portugal, Romania, Slovenia, Slovakia, Spain, Sweden and the United Kingdom)
EU-15 Austria, Belgium, Denmark, Finland, France, Germany, Greece, Ireland, Italy, Luxembourg, the Netherlands, Portugal, Spain, Sweden and the United Kingdom
EUA European Union allowance
EUAA European Union aviation allowance
EUTL European Union Transaction Log
F-gas Fluorinated gas
FEC Final energy consumption
Acronyms, units and terms
58 Trends and projections in Europe 2015
FM Forest management
GAINS Greenhouse Gas and Air Pollution Interactions and Synergies. Model providing a consistent framework for the analysis of co-benefits reduction strategies from air pollution and greenhouse gas sources
GDP Gross domestic product
GHG Greenhouse gas
GM Grazing-land management
GWP Global warming potential
HFCs Hydrofluorocarbons
ICAO International Civil Aviation Organization
IED Industrial Emissions Directive (Directive 2010/75/EU of the European Parliament and of the Councilof24 November 2010onindustrialemissions(integratedpollutionpreventionandcontrol))
IET International emissions trading. One of the three Kyoto Protocol emissions trading mechanisms by which an Annex I Party may transfer Kyoto units to or acquire units from another Annex I Party. A Party must meet specific eligibility requirements to participate in emissions trading
IIEP Institute for European Environmental Policy
ILUC Indirect land-use change
INDC Intended Nationally Determined Contribution
IPCC Intergovernmental Panel on Climate Change
IPPU Industrial processes and product use
ITL International Transaction Log. An electronic data system, administered by the UNFCCC Secretariat, which monitors and tracks Parties' transactions of Kyoto units.
JI Joint implementation. A Kyoto Protocol mechanism that allows Annex I Parties to purchase emission allowances from projects of other Annex I Parties that reduce or remove emissions. The emission allowances from JI projects are ERUs
JRC Joint Research Centre
KP Kyoto Protocol
ktoe Kilotonne of oil equivalent
LDC Least developed country
LMDI Logarithmic Mean Divisia Index
LULUCF Land Use, Land Use Change and Forestry. A GHG inventory sector subject to specific accounting rules
Acronyms, units and terms
59Trends and projections in Europe 2015
MBM Market-based mechanism
MMD MonitoringMechanismDecision(Decision28/2004/ECof11 February 2004concerningamechanism for monitoring Community greenhouse gas emissions and for implementing the Kyoto Protocol)
MMR Monitoring Mechanism Regulation (Regulation (EU) No 525/2013 of the European ParliamentandoftheCouncilof21 May 2013onamechanismformonitoringandreporting greenhouse gas emissions and for reporting other information at national and Union level relevant to climate change and repealing Decision No 280/2004/EC)
MSR Market Stability Reserve
Mt Mega (million) tonne
Mtoe Million tonne of oil equivalent
N2O Nitrous oxide
NAPE National action plan on energy efficiency
NAT National allocation table
National registry An electronic database maintained by a Party, or group of Parties, for the transfer and tracking of units in line with Kyoto Protocol rules
NEEAP National energy efficiency action plan
NER 300 Funding programme, funded from the sale of 300 million allowances from the NER set upforthethirdphaseoftheEU ETS,fordemonstrationprojectsofenvironmentally-safecarbon capture and storage, and innovative RES technologies on a commercial scale within the EU
NER New entrants reserve
NF3 Nitrogen trifluoride
NIM National implementation measure
Non-Annex I Parties Parties not included in Annex I to the UNFCCC
NREAP National renewable energy action plan
PAM Policies and measures
Party A state (or regional economic integration organisation such as the EU) that agrees to be bound by a treaty and for which the treaty has entered into force.
PEC Primary energy consumption
PFCs Perfluorocarbons
Pledge Emission reduction expressed as a percentage reduction, relative to the base year, which has to be achieved by a given year in the future
Acronyms, units and terms
60 Trends and projections in Europe 2015
PPSR Previous Period Surplus Reserve. Account in a Party's national registry where the Party's AAU surplus under a commitment period of the Kyoto Protocol, is transferred to be carried over to the subsequent commitment period.
PRIMES Price-driven and Agent-based Simulation of Markets Energy System Models
PV Photovoltaics
QELRC Quantified Emission Limitation or Reduction Commitment, average level of anthropogenic carbon dioxide equivalent emissions of GHG expressed as a percentage in relation to the base year
RED Renewable Energy Directive (Directive 2009/28/EC of the European Parliament and of the Councilof23 April 2009onthepromotionoftheuseofenergyfromrenewablesourcesand amending and subsequently repealing Directives 2001/77/EC and 2003/30/EC)
RES Renewable energy sources
Retirement The transfer of a unit to a retirement account to be used towards meeting a Party's Kyoto commitment
RICE Regulation on International Credit Entitlements (European Commission Regulation (EU) No 1123/2013of8 November 2013ondetermininginternationalcreditentitlementspursuantto Directive 2003/87/EC of the European Parliament and of the Council)
RMU Removal unit. A Kyoto unit representing an allowance to emit 1 metric tonne of CO2-eq. RMUs are issued for emission removals from LULUCF activities under Article 3, paragraphs 3 and 4
RV Revegetation
SEF Standard electronic format for reporting Kyoto Protocol units
SF6 Sulphur hexafluoride
SHARES Short Assessment of Renewable Energy Sources. Tool developed by Eurostat and aimed at facilitating the calculation of the share of energy from renewable sources according to the RED
SIDS Small island developing state
TFEU Treaty on the Functioning of the European Union
True-up period A 100-day period after final emissions have been reported for the commitment period during which Parties have the opportunity to undertake final transactions necessary to achieve compliance with their Kyoto commitment
UNFCCC United Nations Framework Convention on Climate Change
WAM With additional measures
WEM With existing measures

61
References
Trends and projections in Europe 2015
References
Ang, B., 2005, 'The LMDI approach to decomposition analysis: a practical guide', Energy Policy, (33/7) 867–871.
BMUB, 2014, A good bit of work: Making more out of energy (NAPE), Federal Ministry for the Environment, Nature Conservation, Building and Nuclear Safety.
EC, 2006a, Action Plan for Energy Efficiency: Realising the Potential, Communication from the Commission (COM(2006)545 final) (http://eur-lex.europa.eu/legal-content/EN/TXT/HTML/?uri=CELEX:52006DC0545&from=EN)accessed8 September 2015.
EC,2006b,CommissionDecisionof14 December 2006determining the respective emission levels allocated to the Community and each of its Member States under the Kyoto Protocol pursuant to Council Decision 2002/358/EC (OJL358,14.12.2006,p. 87).
EC, 2007, Communication from the Commission to the Council, the European Parliament, the European Economic and Social Committee and the Committee of theRegions:Limitingglobalclimatechangeto2 degreesCelsius. The way ahead for 2020 and beyond. COM(2007) 2 final, Brussels (http://eur-lex.europa.eu/LexUriServ/LexUriServ.do?uri=COM:2007:0002:FIN:EN:PDF) accessed 30 June 2014.
EC, 2008, 'European energy and transport, Trends to 2030 — update 2007', European Commission (https://ec.europa.eu/energy/sites/ener/files/documents/trends_to_2030_update_2007.pdf)accessed17 September 2015.
EC, 2011a, Communication from the Commission to the European Parliament, the Council, the European Economic and Social Committee and the Committee of the Regions 'A Roadmap for moving to a competitive low carbon economy in 2050' (COM(2011) 112 final) (http://eur-lex.europa.eu/legal-content/EN/TXT/?uri=CELEX:52011DC0112)accessed17 September2015.
EC, 2011b, Communication from the Commission to the European Parliament, the Council, the European Economic and Social Committee and the Committee of theRegions'EnergyRoadmap2050'(COM(2011) 885/2)(https://ec.europa.eu/energy/sites/ener/files/
documents/2012_energy_roadmap_2050_en_0.pdf) accessed15 August 2014.
EC, 2011c, Impact assessment accompanying the document 'Communication from the Commission to the Council, the European Parliament, the European Economic and Social Committee and the Committee of the Regions. Energy roadmap 2050', Commission Staff Working Paper SEC(2011) 1565/2 Part 1/2, European Commission (https://ec.europa.eu/energy/sites/ener/files/documents/sec_2011_1565_part1.pdf) accessed 30 July 2015.
EC, 2011d, Impact assessment accompanying the document 'Communication from the Commission to the European Parliament, the Council, the European Economic and Social Committee and the Committee of the Regions. Energy Roadmap 2050', Commission Staff Working Paper SEC(2011) 1565 Part 2/2, European Commission (https://ec.europa.eu/energy/sites/ener/files/documents/sec_2011_1565_part2.pdf) accessed 30 July 2015.
EC, 2011e, Impact assessment accompanying the document 'Directive of the European Parliament and of the Council on energy efficiency and amending and subsequently repealing Directives 2004/8/EC and 2006/32/EC', Commission Staff Working Paper SEC(2011) 779 final, Brussels (http://ec.europa.eu/energy/efficiency/eed/doc/2011_directive/sec_2011_0779_impact_assessment.pdf)accessed30 July 2015.
EC, 2013a, EU Energy, Transport and GHG Emissions — Trends to 2050 (http://ec.europa.eu/transport/media/publications/doc/trends-to-2050-update-2013.pdf) accessed27 May 2015.
EC, 2013b, 'National Renewable Energy Action Plan (NREAP) data from Member States' (http://ec.europa.eu/energy/renewables/action_plan_en.htm) accessed 14 September 2015.
EC,2013c,CommissionDecisionof26 March 2013ondetermining Member States' annual emission allocations for the period from 2013 to 2020 pursuant to Decision No 406/2009/EC of the European Parliament and of the Council (notified under document C(2013) 1708)

References
62 Trends and projections in Europe 2015
(OJ L 90,26.03.2013,p. 106)(http://eur-lex.europa.eu/legal-content/EN/TXT/?uri=CELEX:32013D0162) accessed 30 September2015.
EC, 2013d, Commission Implementing Decision of 31 October 2013ontheadjustmentstoMemberStates'annual emission allocations for the period from 2013 to 2020 pursuant to Decision No 406/2009/EC of the European Parliament and of the Council (2013/634/EU) (OJL292,31.10.2013,p. 19)(http://eur-lex.europa.eu/legal-content/EN/TXT/?uri=CELEX:32013D0634) accessed 15 August 2014.
EC, 2013e, 'Questions & Answers on EU ratification of the second commitment period of the Kyoto Protocol' (http://europa.eu/rapid/press-release_MEMO-13-956_en.htm) accessed30 July 2015.
EC, 2014a, Communication from the Commission to the European Parliament, the Council, the European Economic and Social Committee and the Committee of the Regions: A policy framework for climate and energy in the period from 2020 up to 2030. COM(2014) 15 final (http://eur-lex.europa.eu/legal-content/EN/TXT/PDF/?uri=CELEX:52014DC0015&from=EN)accessed25 June 2014.
EC, 2014b, Impact assessment accompanying the document Communication from the Commission to the European Parliament and the Council: Energy efficiency and its contribution to energy security and the 2030 framework for climate and energy policy {SWD(2014) 255 final} {SWD(2014} 256 final} (COM(2014) 520 final) (https://ec.europa.eu/energy/sites/ener/files/documents/2014_eec_ia_adopted_part1_0.pdf) accessed 14 September 2015.
EC, 2014c, Commission delegated Regulation (EU) No 666/2014of12 March 2014establishingsubstantiverequirements for a Union inventory system and taking into account changes in the global warming potentials and internationally agreed inventory guidelines pursuant to Regulation (EU) No 525/2013 of the European Parliament andoftheCouncil(OJL 179,19.06.2014,p. 26)(http://eur-lex.europa.eu/legal-content/EN/TXT/PDF/?uri=CELEX:32014R0666&from=EN)accessed18 August 2014.
EC, 2014d, Commission implementing Regulation (EU) No749/2014of30 June 2014onstructure,format,submission processes and review of information reported by Member States pursuant to Regulation (EU) No 525/2013 of the European Parliament and of the Council (OJL203,11.07.2014,p. 23)(http://eur-lex.europa.eu/legal-content/EN/TXT/PDF/?uri=CELEX:32014R0749&from=EN)accessed18 August 2014.
EC, 2015a, Energy Union Package. A framework strategy for a resilient Energy Union with a forward-looking
climate change policy, Communication from the Commission to the European Parliament, the Council, the European Economic and Social Committee, the Committee of the Regions and the European Investment Bank COM(2015) 80 final (http://eur-lex.europa.eu/resource.html?uri=cellar:1bd46c90-bdd4-11e4-bbe1-01aa75ed71a1.0001.03/DOC_1&format=PDF) accessed 30 July 2015.
EC, 2015b, Renewable energy progress report (SWD(2015) 117 final) (https://ec.europa.eu/transparency/regdoc/rep/1/2015/EN/1-2015-293-EN-F1-1.PDF) accessed 14 September 2015.
EC, 2015c, 'Elements of the Union System for Policies and Measures and Projections and the Quality Assurance and Control (QA/QC) Programme as Required under Regulation(EU)No525/2013',DG ClimateAction(http://ec.europa.eu/clima/policies/strategies/progress/monitoring/docs/union_pams_projections_en.pdf) accessed30 September 2015.
EEA, 2011a, Greenhouse gas emissions in Europe: a retrospective trend analysis for the period 1990–2008, EEA Report No 6/2011, European Environment Agency (http://www.eea.europa.eu/publications/ghg-retrospective-trend-analysis-1990-2008)accessed17 June 2015.
EEA, 2011b, 'National Renewable Energy Action Plan (NREAP) data from Member States', European Environment Agency (http://www.eea.europa.eu/data-and-maps/figures/national-renewable-energy-action-plan)accessed17 September 2015.
EEA, 2014a, Trends and projections in Europe 2014, EEA Report No 6/2014, European Environment Agency (http://www.eea.europa.eu/publications/trends-and-projections-in-europe-2014)accessed17 June 2015.
EEA, 2014b, Progress towards 2008–2012 Kyoto targets in Europe, EEA Technical report No 18/2014, European Environment Agency (http://www.eea.europa.eu/publications/progress-towards-2008-2012-kyoto) accessed17 June 2015.
EEA, 2014c, Why did greenhouse gas emissions decrease in the EU between 1990 and 2012?, European Environment Agency (http://www.eea.europa.eu/publications/why-are-greenhouse-gases-decreasing) accessed 24 June 2015.
EEA, 2014d, Annual European Union greenhouse gas inventory 1990–2012 and inventory report 2014, EEA Technical report No 9/2014, European Environment Agency (http://www.eea.europa.eu/publications/european-union-greenhouse-gas-inventory-2014) accessedtobecompleted.accessed17 June 2015.
http://ec.europa.eu/clima/policies/strategies/progress/monitoring/docs/union_pams_projections_en.pdf
http://ec.europa.eu/clima/policies/strategies/progress/monitoring/docs/union_pams_projections_en.pdf

References
63Trends and projections in Europe 2015
EEA, 2014e, Focus on environmental pressures from long-distance transport. TERM report 2014: transport indicators tracking progress towards environmental targets in Europe, EEA Report No 7/2014, European Environment Agency (http://www.eea.europa.eu/publications/term-report-2014)accessed5 August 2015.
EEA, 2015a, 'EEA greenhouse gas data viewer' (http://www.eea.europa.eu/data-and-maps/data/data-viewers/greenhouse-gases-viewer)accessed17 June 2015.
EEA, 2015b, 'EU Emissions Trading System (ETS) data viewer' (http://www.eea.europa.eu/data-and-maps/data/data-viewers/emissions-trading-viewer) accessed 14 May 2015.
EEA, 2015c, 'Deliveries for projections and national programmes', European Environment Agency, Eionet (http://rod.eionet.europa.eu/obligations/385/deliveries;jsessionid=55DFD3286CEA348D4D5296F687A2632D?id=385&tab=deliveries&d-4014547-p=2&d-4014547-o=1&d-4014547-s=2)accessed14 September 2015.
EEA, 2015d, Approximated EU GHG inventory: proxy GHG emission estimates for 2014, EEA Technical report No 15/2015,EuropeanEnvironmentAgency(http://www.eea.europa.eu/publications/approximated-eu-ghg-inventory-2014).
EEA, 2015e, Renewable energy in Europe — recent growth and knock-on effects, EEA Technical report, forthcoming, European Environment Agency.
EEA, 2015f, Primary energy consumption by fuel (ENER026), European Environment Agency (http:// www.eea.europa.eu/data-and-maps/indicators/primary-energy-consumption-by-fuel-5).
EEA, 2015g, Projections in hindsight. An assessment of past emission projections reported by Member States under EU air pollution and GHG legislation, EEA Technical report No 4/2015, European Environment Agency (http://www.eea.europa.eu/publications/projections-in-hindsight/download)accessed11 September 2015.
EEA, 2015h, Final energy consumption by sector and fuel (ENER016), European Environment Agency (http://www.eea.europa.eu/data-and-maps/indicators/final-energy-consumption-by-sector-8)accessed17 September 2015.
EEA, 2015i, Renewable energy in Europe — approximated recent growth and knock-on effects, EEA Technical report No 1/2015, European Environment Agency (http://www.eea.europa.eu/publications/renewable-energy-in-europe-approximated)accessed17 June 2015.
EEA, 2015j, Trends and projections in the EU ETS in 2015, EEA Technical report No 14/2015, European Environment Agency (http://www.eea.europa.eu/publications/trends-and-projections-eu-ets-2015).
ENSPOL, 2014, 'ENSPOL Energy Saving Policies and Energy Efficiency Obligation Scheme — D3.1: Report on Alternative schemes to Energy Efficiency Obligations under Article 7 implementation', Energy Saving Polices.
ETC/ACM, 2013, Consistency of climate and energy projections for 2020, ETC/ACM Technical paper No 2013/19,EuropeanTopicCentreonAirpollutionand Climate change Mitigation (http://acm.eionet.europa.eu/reports/ETCACM_TP_2013_19_Consistency2020ClimateEnergyProjections), accessed 12 October2015.
ETC/ACM, 2015, Scope correction of EU ETS verified emissions for the period 2005–2012, ETC/ACM Technical paper, forthcoming, European Topic Centre on Air pollution and Climate change Mitigation (http://acm.eionet.europa.eu/reports/#tp).
EU, 2004, Decision No 280/2004/EC of the European Parliament and of the Council of 11 February 2004 concerning a mechanism for monitoring Community greenhouse gas emissions and for implementing the KyotoProtocol(OJL49,19.2.2004,p. 1–8)(http://eur-lex.europa.eu/legal-content/EN/TXT/?qid=1444569782935&uri=CELEX:32004D0280) accessed 17 September 2015.
EU, 2006, Directive 2006/32/EC of the European ParliamentandoftheCouncilof5 April 2006onenergyend-use efficiency and energy services repealing Council Directive93/76/EEC(OJL114,27.04.2006,p. 64)(http://eur-lex.europa.eu/legal-content/EN/TXT/PDF/?uri=CELEX:32006L0032&from=EN)accessed15 August 2014.
EU, 2008a, Regulation (EC) No 1099/2008 of the European Parliament and of the Council of 22 October 2008 on energy statistics (Text with EEA relevance) (OJ L 304, 14.11.2008,p. 1–62)(http://eur-lex.europa.eu/legal-content/EN/ALL/?uri=CELEX:32008R1099) accessed 30 September2015.
EU, 2008b, Directive 2008/101/EC of the European ParliamentandoftheCouncilof19 November 2008amending Directive 2003/87/EC so as to include aviation activities in the scheme for greenhouse gas emission allowance trading within the Community (OJ L 8, 13.01.2009,p. 3)(http://eur-lex.europa.eu/LexUriServ/LexUriServ.do?uri=OJ:L:2009:008:0003:0021:en:PDF) accessed15 August 2014.
EU, 2009a, Decision No 406/2009/EC of the European ParliamentandoftheCouncilof23 April 2009onthe

References
64 Trends and projections in Europe 2015
effort of Member States to reduce their greenhouse gas emissions to meet the Community's greenhouse gas emissionreductioncommitmentsupto2020(OJ L 140,05.06.2009,p. 136)(http://eur-lex.europa.eu/LexUriServ/LexUriServ.do?uri=OJ:L:2009:140:0136:0148:EN:PDF) accessed 5 August 2014.
EU, 2009b, Directive 2009/28/EC of the European ParliamentandoftheCouncilof23 April 2009onthepromotion of the use of energy from renewable sources and amending and subsequently repealing Directives 2001/77/ECand2003/30/EC(OJL140,05.06.2009,p. 16)(http://eur-lex.europa.eu/legal-content/EN/TXT/PDF/?uri=CELEX:32009L0028&from=EN)accessed15 August 2014.
EU, 2009c, Directive 2009/29/EC of the European ParliamentandoftheCouncilof23 April 2009amendingDirective 2003/87/EC so as to improve and extend the greenhouse gas emission allowance trading scheme of theCommunity(OJL140,05.06.2009,p. 63)(http://eur-lex.europa.eu/LexUriServ/LexUriServ.do?uri=OJ:L:2009:140:0063:0087:en:PDF)accessed15 August 2014.
EU, 2009d, Directive 2009/30/EC of the European Parliament and of the Council of 23 April 2009 amending Directive 98/70/EC as regards the specification of petrol, diesel and gas-oil and introducing a mechanism to monitor and reduce greenhouse gas emissions and amending Council Directive 1999/32/EC as regards the specification of fuel used by inland waterway vessels andrepealingDirective93/12/EEC(OJ L140,5.6.2009,p. 88–113)(http://eur-lex.europa.eu/legal-content/EN/TXT/?uri=celex:32009L0030) accessed 17 September 2015.
EU, 2009e, Directive 2009/31/EC of the European Parliament and of the Council of 23 April 2009 on the geological storage of carbon dioxide and amending Council Directive 85/337/EEC, European Parliament and Council Directives 2000/60/EC, 2001/80/EC, 2004/35/EC, 2006/12/EC, 2008/1/EC and Regulation (EC) No 1013/2006(OJL140,5.6.2009,p. 114–135)(http://eur-lex.europa.eu/legal-content/EN/TXT/?uri=celex:32009L0031)
EU, 2009f, Regulation (EC) No 443/2009 of the European ParliamentandoftheCouncilof23 April 2009settingemission performance standards for new passenger cars as part of the Community's integrated approach to reduceCO2emissionsfromlight-dutyvehicles(OJ L 140,05.06.2009, p. 1) (http://eur-lex.europa.eu/legal-content/EN/TXT/PDF/?uri=CELEX:32009R0443&from=EN) accessed15 August 2014.
EU, 2009e, Directive 2009/125/EC of the European Parliament and of the Council of 21 October 2009 establishing a framework for the setting of ecodesign requirements for energy-related products (recast)
(OJ L 285,31.10.2009,p.10)(http://eur-lex.europa.eu/ legal-content/EN/TXT/PDF/?uri=CELEX:32009L0 125&from=EN) accessed 15 August 2014.
EU, 2010a, Directive 2010/30/EU of the European Parliament and of the Council of 19 May 2010 on the indication by labelling and standard product information of the consumption of energy and other resources by energy-relatedproducts(recast)(OJ L 153,18.06.2010,p. 1)(http://eur-lex.europa.eu/legal-content/EN/TXT/PDF/?uri=CELEX:32010L0030 &from=EN) accessed 15 August2014.
EU, 2010b, Directive 2010/31/EU of the European Parliament and of the Council of 19 May 2010 on the energy performance of buildings (recast) (OJ L 153, 18.06.2010,p. 13)(http://eur-lex.europa.eu/LexUriServ/LexUriServ.do?uri=OJ:L:2010:153:00 13:0035:EN:PDF) accessed 14 August 2014.
EU, 2012, Directive 2012/27/EU of the European ParliamentandoftheCouncilof25 October 2012on energy efficiency, amending Directives 2009/125/EC and 2010/30/EU and repealing Directives 2004/8/ECand2006/32/EC(OJL315,14.11.2012,p. 1)(http://eur-lex.europa.eu/LexUriServ/LexUriServ.do?uri=CELEX:32012L0027:EN:NOT) accessed 25 June 2014.
EU, 2013a, Regulation (EU) No 525/2013 of the European ParliamentandoftheCouncilof21 May 2013onamechanism for monitoring and reporting greenhouse gas emissions and for reporting other information at national and Union level relevant to climate change and repealing Decision No 280/2004/EC (2013/162/EU) (OJ L 165,18.06.2013,p. 13)(http://eur-lex.europa.eu/legal-content/EN/TXT/PDF/?uri=CELEX:32013R0525&from=EN)accessed14 August 2014.
EU, 2013b, Decision No 529/2013/EU of the European ParliamentandoftheCouncilof21 May 2013onaccounting rules on greenhouse gas emissions and removals resulting from activities relating to land use, land-use change and forestry and on information concerningactionsrelatingtothoseactivities(OJL 165,18.06.2013,p. 80)(http://eur-lex.europa.eu/legal-content/EN/TXT/PDF/?uri=CELEX:32013D0529&from=EN) accessed25 June 2014.
EU, 2013c, Decision No 377/2013/EU of the European ParliamentandoftheCouncilof24 April 2013derogating temporarily from Directive 2003/87/EC establishing a scheme for greenhouse gas emission allowance trading within the Community (OJ L 113, 25.04.2013,p. 1)(http://eur-lex.europa.eu/legal-content/EN/TXT/PDF/?uri=CELEX:32013D0377&from=EN) accessed19 August 2014.

References
65Trends and projections in Europe 2015
EU, 2014a, Sixth National Communication and First Biennial Report from the European Union under the UN Framework Convention on Climate Change (UNFCCC) (https://unfccc.int/files/national_reports/annex_i_natcom_/application/pdf/eu_nc6.pdf) accessed 30 July 2015.
EU, 2014b, Regulation (EU) No 421/2014 of the European ParliamentandoftheCouncilof16 April 2014amendingDirective 2003/87/EC establishing a scheme for greenhouse gas emission allowance trading within the Community, in view of the implementation by 2020 of an international agreement applying a single global market-based measure to international aviation emissions (OJ L 129,30.04.2014,p. 1)(http://eur-lex.europa.eu/legal-content/EN/TXT/PDF/?uri=CELEX:32014R0421&from=EN) accessed25 June 2014.
EU, 2015a, Decision of the European Parliament and of the Council of concerning the establishment and operation of a market stability reserve for the Union greenhouse gas emission trading scheme and amending Directive 2003/87/EC (http://www.europarl.europa.eu/meetdocs/2014_2019/documents/envi/dv/ets_msr_annex_/ets_msr_annex_en.pdf)accessed5 August 2015.
EU, 2015b, Council Directive (EU) 2015/652 of 20 April 2015 laying down calculation methods and reporting requirements pursuant to Directive 98/70/EC of the European Parliament and of the Council relating to the quality of petrol and diesel fuels (http://eur-lex.europa.eu/legal-content/EN/TXT/?uri=CELEX:32015L0652) accessed 5 October 2015.
EU, 2015c, Directive (EU) 2015/1513 of the European Parliament and of the Council of 9 September 2015 amending Directive 98/70/EC relating to the quality of petrol and diesel fuels and amending Directive 2009/28/EC on the promotion of the use of energy from renewable sources (http://eur-lex.europa.eu/legal-content/EN/TXT/?uri=CELEX:32015L1513) accessed 5 October 2015.
European Council, 2007, Brussels European Council 8/9 March 2007,PresidencyConclusions,7224/1/07,Council of the European Union (http://www.consilium.europa.eu/ueDocs/cms_Data/docs/pressData/en/ec/93135.pdf)accessed29 September 2014.
European Council, 2014, Conclusions on 2030 Climate and Energy Policy Framework (EUCO 169/14) (http://www.consilium.europa.eu/uedocs/cms_data/docs/pressdata/en/ec/145397.pdf)accessed9 September 2015.
European Union, 2012, 'Submission by Denmark and the European Commission on behalf of the European Union and its Member States' (https://unfccc.int/files/meetings/
ad_hoc_working_groups/kp/application/pdf/awgkp_eu_19042012.pdf)accessed24 February 2015.
EurObserv'ER, 2015, 'EurObserv'ER' (http://www.eurobserv-er.org)accessed14 September 2015.
Eurostat, 2011, 'Heating degree days 2010, monthly' (http://ec.europa.eu/eurostat/documents/38154/43500/HDD_2010_20121214.xlsx/155af3c8-b928-4b72-934b-833b24c1218e)accessed5 August 2015.
Eurostat, 2012, 'Heating degree days 2011, monthly' (http://ec.europa.eu/eurostat/documents/38154/43500/HDD_2011_20130412.xlsx/e8e0e8fe-ecea-4fcd-a96b-86f39cc64045)accessed5 August 2015.
Eurostat, 2013, 'Heating degree days 2012, monthly' (http://ec.europa.eu/eurostat/documents/38154/43500/HDD_2012_20130412.xlsx/f6011473-06ac-4a4e-9c99-c0451f3fff6a)accessed5 August 2015.
Eurostat, 2014a, 'Heating degree days 2013, monthly' (http://ec.europa.eu/eurostat/documents/38154/4956229/HDD-2013.xlsx/51ddb6cb-2d64-4b07-8e5b-5f07908fdd63) accessed5 August 2015.
Eurostat, 2014b, 'Eurostat New Cronos Database — Energy' (http://ec.europa.eu/eurostat/data/database).
Eurostat, 2015a, 'SHARES 2013 results' (http://ec.europa.eu/eurostat/web/energy/data/shares) accessed 15 July 2015.
Eurostat, 2015b, 'Gross inland energy consumption by fuel type (code: tsdcc320)' (http://ec.europa.eu/eurostat/tgm/table.do?tab=table&init=1&language=en&pcode=tsdcc320&plugin=1)accessed30 July 2015.
Eurostat,2015c,'Populationon1 Januarybyageandsex(dataset: demo_pjan)' (http://appsso.eurostat.ec.europa.eu/nui/show.do?dataset=demo_pjan&lang=en) accessed 5 April 2015.
Eurostat, 2015d, 'Simplified energy balances — annual data (dataset: nrg_100a)' (http://appsso.eurostat.ec.europa.eu/nui/show.do?dataset=nrg_100a&lang=en) accessed5 August 2015.
Eurostat, 2015e, 'GDP and main components (output, expenditure and income) (dataset: nama_10_gdp)' (http://appsso.eurostat.ec.europa.eu/nui/show.do?dataset=nama_10_gdp)accessed5 August 2015.
Eurostat, 2015f, 'Heating degree-days by NUTS 2 regions — annual data (dataset nrg_esdgr_a)' (http://appsso.eurostat.ec.europa.eu/nui/show.do?dataset=nrg_esdgr_a) accessed5 August 2015.

References
66 Trends and projections in Europe 2015
Eurostat, 2015g, 'Final energy consumption by sector (code: tsdpc320)' (http://ec.europa.eu/eurostat/tgm/table.do?tab=table&init=1&language=en&pcode=tsdpc320&plugin=1)accessed30 July 2015.
Eurostat, 2015h, 'Supply, transformation and consumption by fuel — annual data (dataset: nrg_103a)' (http://appsso.eurostat.ec.europa.eu/nui/show.do?dataset=nrg_103a&lang=en)accessed5 August 2015.
Fraunhofer ISI, 2014, Study evaluating the current energy efficiency policy framework in the EU and providing orientation on policy options for realising the cost-effective energy efficiency/saving potential until 2020 and beyond, Fraunhofer ISI.
Groenenberg, H., 2012, 'Understanding the full impact of the Energy Efficiency Directive', Ecofys (http://www.ecofys.com/en/blog/the-energy-efficiency-directive-save-energy-create-jobs-and-compete) accessed 26 August 2014.
Ireland Environmental Protection Agency, 2015, 'Ireland's greenhouse gas emission projections 2014–2035' (http://www.epa.ie/pubs/reports/air/airemissions/irelandsghgemissions2014-2035.html#.VhEwkOyqpBc) accessed9 September 2015.
JRC, 2015, The impact of biofuels on transport and the environment, and their connection with agricultural development in Europe, Study (http://www.europarl.europa.eu/RegData/etudes/STUD/2015/513991/IPOL_STU(2015)513991_EN.pdf)accessed30 July 2015.
OECD, 2014b, Capturing the Multiple Benefits of Energy Efficiency, OECD Publishing, (https://www.iea.org/bookshop/475-Capturing_the_Multiple_Benefits_of_Energy_Efficiency) Paris.
Ricardo AEA, CE Delft and REKK, 2015, Study evaluating the national policy measures and methodologies to implement Article 7 of the Energy Efficiency Directive, Ricardo AEA; CE Delft; Regional Centre for Energy Policy Research (http://www.researchgate.net/publication/273136878_Study_evaluating_the_national_policy_measures_and_methodologies_to_implement_Article_7_of_the_Energy_Efficiency_Directive) accessed 30 September 2015.
Turkey, 2014, 'GHG inventory submission 2014, CRF data' (http://unfccc.int/files/national_reports/annex_i_ghg_inventories/national_inventories_submissions/application/zip/tur-2014-crf-15apr.zip) accessed 5 August 2015.
Turkey, 2015, Intended nationally determined contribution in accordance with decisions 1/CP.19 and 1/CP.20.
UNEP, 2014, The Emissions Gap Report 2014, United Nations Environmental Programme (http://www.unep.org/publications/ebooks/emissionsgapreport2014) accessed 17 September 2015.
UNFCCC, 1998, Kyoto Protocol to the United Nations Framework Convention on Climate Change, United Nations Framework Convention on Climate Change (http://unfccc.int/resource/docs/convkp/kpeng.pdf) accessed25 June 2014.
UNFCCC, 2006, Decision 16/CMP.1 Land use, land-use change and forestry, FCCC/KP/CMP/2005/8/Add.3, United Nations Framework Convention on Climate Change (http://unfccc.int/resource/docs/2005/cmp1/eng/08a03.pdf) accessed 29 September 2015.
UNFCCC, 2009, Decision 3/CP.15. Amendment to Annex I to the Convention, FCCC/CP/2009/11/Add.1, United Nations Framework Convention on Climate Change (http://unfccc.int/resource/docs/2009/cop15/eng/11a01.pdf)accessed25 June 2014.
UNFCCC, 2011, Decision 10/CP.17. Amendment to Annex I to the Convention, FCCC/CP/2011/9/Add.2, United Nations Framework Convention on Climate Change (http://unfccc.int/resource/docs/2011/cop17/eng/09a02.pdf) accessed 25 June 2014.
UNFCCC, 2012a, Decision 2/CMP.7: Land use, land-use change and forestry, FCCC/KP/CMP/2011/10/Add.1, United Nations Framework Convention on Climate Change (http://unfccc.int/resource/docs/2011/cmp7/eng/10a01.pdf)accessed25 June 2014.
UNFCCC, 2012b, Doha Amendment to the Kyoto Protocol, United Nations Framework Convention on Climate Change (http://unfccc.int/files/kyoto_protocol/application/pdf/kp_doha_amendment_english.pdf) accessed 25 June 2014.
UNFCCC, 2013a, 'Kyoto Protocol — Targets for the first commitment period', United Nations Framework Convention on Climate Change, Bonn (http://unfccc.int/kyoto_protocol/items/3145.php)accessed23 April 2014.
UNFCCC, 2013b, Quantified economy-wide emission reduction targets by developed country Parties to the Convention: assumptions, conditions, commonalities and differences in approaches and comparison of the level of emission reduction efforts, FCCC/TP/2013/7, United Nations Framework Convention on Climate Change.
UNFCCC, 2014, 'Parties & Observers', United Nations Framework Convention on Climate Change (https://unfccc.int/parties_and_observers/items/2704.php) accessed25 June 2014.
67
Climate and energy targets in the EU
Trends and projections in Europe 2015
Annex 1 ClimateandenergytargetsintheEU
Key points
• The European Council has endorsed the objective of reducing Europe's GHG emissions by between 80% and 95% by 2050, compared to 1990 levels, in the context of necessary reductions to be collectively achieved by developed countries, according to the IPCC.
• The EU, its Member States and EEA member countries are committed to limiting or reducing their GHG emissions under international commitments, in particular the UNFCCC and its Kyoto Protocol. For the first commitment period (2008to2012),theEU-15hadacommonreductiontargetof− 8%comparedtobase-yearlevels(closeto1990levels).For the second commitment period (2013 to 2020), the EU and Iceland committed to cutting their emissions by 2020 by 20%, compared to base-year levels.
• The EU also adopted, unilaterally, a set of three climate and energy targets for 2020: a 20% reduction of its GHG emissions compared to 1990, a 20% share of renewable energy in its gross final energy consumption (with a minimum 10% share in the transport sector), and a 20% saving of its energy consumption, compared to a hypothetical 2020 level in a business-as-usual scenario.
• To meet the 2020 GHG target, in 2009 the EU adopted a climate and energy package, a legislative set of binding targets. ThispackagesetonesingletargetforallEUemissionscoveredbytheEU ETS,andonesetofnationaltargetsforallotheremissionsnotcoveredbytheEU ETS.TheETStargetcorrespondstoareductionofabout21%ofETSemissionsby 2020 compared to 2005, while for the other emissions, an overall reduction of about 9% is to be achieved under the ESD, compared to 2005. The ESD sets annual national targets for each year of the period between 2013 and 2020.
• To meet the 2020 target on renewable energy, the RED sets differentiated binding targets for each Member State for 2020, and provides indicative trajectories for the period from 2011 to 2020.
• Concerning energy efficiency, Member States have set their own non-binding targets for energy consumption for 2020 under the EED. These targets take various forms, and some of them may be subject to later revision.
• In October 2014, the European Council agreed endorsed a binding EU target of an at least 40% domestic reduction in GHG emissions by 2030 compared to 1990. They also set a target, binding at EU level, of at least 27% for the share of renewable energy consumed in the EU in 2030, as well as an indicative target at EU level of at least 27% for improving energy efficiency in 2030 compared to projections of future energy consumption, based on the current criteria.
A1.1 International commitments of EU and EEA countries under the UNFCCC and the Kyoto Protocol
In 1992, countries across the globe adopted the UNFCCC to cooperatively consider options for limiting average global temperature increases and the resulting climate change. Under the UNFCCC, developed country parties(AnnexIparties) (49) are specifically obliged to commit to adopting national policies and to take
corresponding measures for mitigation of climate change.
A1.2 First commitment period of the Kyoto Protocol, 2008–2012
The Kyoto Protocol is the first international legally binding agreement signed under the UNFCCC that specifies mitigation obligations of Annex I Parties which
(49) A party is a state (or regional economic integration organisation such as the EU) that agrees to be bound by a treaty and for which the treaty has entered into force. Annex I parties are those listed in Annex I to the UNFCCC; they comprise industrialised countries that were members of the OECD in 1992 as well as countries with economies in transition (UNFCCC, 2014).

Climate and energy targets in the EU
68 Trends and projections in Europe 2015
have signed the agreement. It was signed in 1997 and entered into force in 2005.
The first commitment period of the Kyoto Protocol ran from 2008 until 2012. In this first period, 37 industrialisedcountriescommittedtoreduceGHG emissions by an average of 5% against 1990 levels. Under this commitment period, the 15 countries which were EU Member States at the time pledged to jointly reduce their GHG emissions by 8% compared to base-year levels (base year levels are roughlyequivalentto1990levels) (50). To determine the contribution of each Member State in meeting this overall target, differentiated emission limitation or reduction targets were agreed for each of the 15 pre-2004MemberStatesunderanEUaccordknown as the Burden-Sharing Agreement (Commission Decision determining the respective emission levels allocated to the Community and each of its Member States under the Kyoto Protocol pursuant to Council Decision 2002/358/EC) (EC, 2006b).
While the EU-15 (15 pre-2004 Member States) has a target under the Kyoto Protocol's first commitment period, the EU (28 Member States) does not, because the protocol was ratified before 13 countries became EU Member States in 2004, 2007 and 2013. Of these 13 Member States, 11 have individual targets under the Kyoto Protocol's first commitment period, while Cyprus and Malta do not have targets. These two latter countries became Annex I parties to the convention in 2013 and 2010, respectively (UNFCCC, 2009 and 2011).
Of the other country members of the EEA, Iceland, Liechtenstein, Norway and Switzerland have individual targets under the Kyoto Protocol's first commitment period. Turkey, which acceded to the Kyoto Protocol in February 2009, has no quantified emission reduction commitment. Despite being an Annex I party to the UNFCCC, Turkey is not included in the Kyoto Protocol's Annex B where individual targets for Annex I parties are listed, because it was not a party to the UNFCCC when theKyotoProtocolwasadopted (51).
The target under the Kyoto Protocol for the first commitment period was based on the following methodological assumptions and conditions:
• emissions or removals from LULUCF are included;
• the target refers to 1990 as a single base year, but is subject to the flexibility rules on fluorinated gases (F-gases) and economies in transition contained in Article 3(5) of the Kyoto Protocol;
• emissions from international aviation are excluded from the target; the sectors included are energy, industrial processes and product use (IPPU), agriculture and waste;
• the use of CERs, emission reduction units (ERUs) and possible recognition of units from new market-based mechanisms is possible to achieve thetarget(yettheEU ETSiscappedfortheuseofunits under EU domestic legislation);
• the target is based on the global warming potential (GWP) included in the IPCC Second Assessment Report;
• the target covers the gases carbon dioxide (CO2), methane (CH4), nitrous oxide (N2O), hydrofluorocarbons (HFCs), perfluorocarbons (PFCs) and sulphur hexafluoride (SF6), consistent with the GHGs covered under the reporting requirements under the UNFCCC.
A1.3 Second commitment period of the Kyoto Protocol, 2013–2020
In 2010, the EU submitted a pledge to reduce its GHG emissions by 2020 by 20% compared to 1990 levels, under the UNFCCC. The EU is also committed to raising this target to 30% emission reductions by 2020, compared with 1990 levels, provided that other countries step up their mitigation ambition as well. Overall, the targets currently submitted by parties to the UNFCCC would not be sufficient to make up the collective emission reductions needed to achieve the 2 °Cgoal(UNEP,2014).
In Doha in 2012 (COP 18/CMP 8), the second commitment period (2013–2020) was delineated; the Doha Amendment includes new quantified emission limitation and reduction commitments (QELRCs) for
(50) The target refers to 1990 as a single base year, but is subject to the flexibility rules regarding F-gases and economies in transition of Article 3(5) of the Kyoto Protocol. This paragraph stipulates that parties included in Annex I undergoing the process of transition to a market economy whose base year or period was established by Decision 9/CP.2 of the COP are to use that base year or period for the implementation of their commitments. Furthermore, 1995 may be used as a base year for HFCs, PFCs and SF6. Accordingly, 1990 is used as a base year for emissions of CO2, CH4 and N2O for all countries except Bulgaria (1988), Hungary (average of 1985 through 1987), Slovenia (1986), Poland (1988) and Romania (1989); and 1995 is used as a base year for F-gases (HFCs, PFCs and SF6) for all countries except Austria, Croatia, France, Italy and Slovakia (all 1990) and Romania (1989).
(51) See also UNFCCC's Kyoto Protocol target information online (UNFCCC, 2013a).
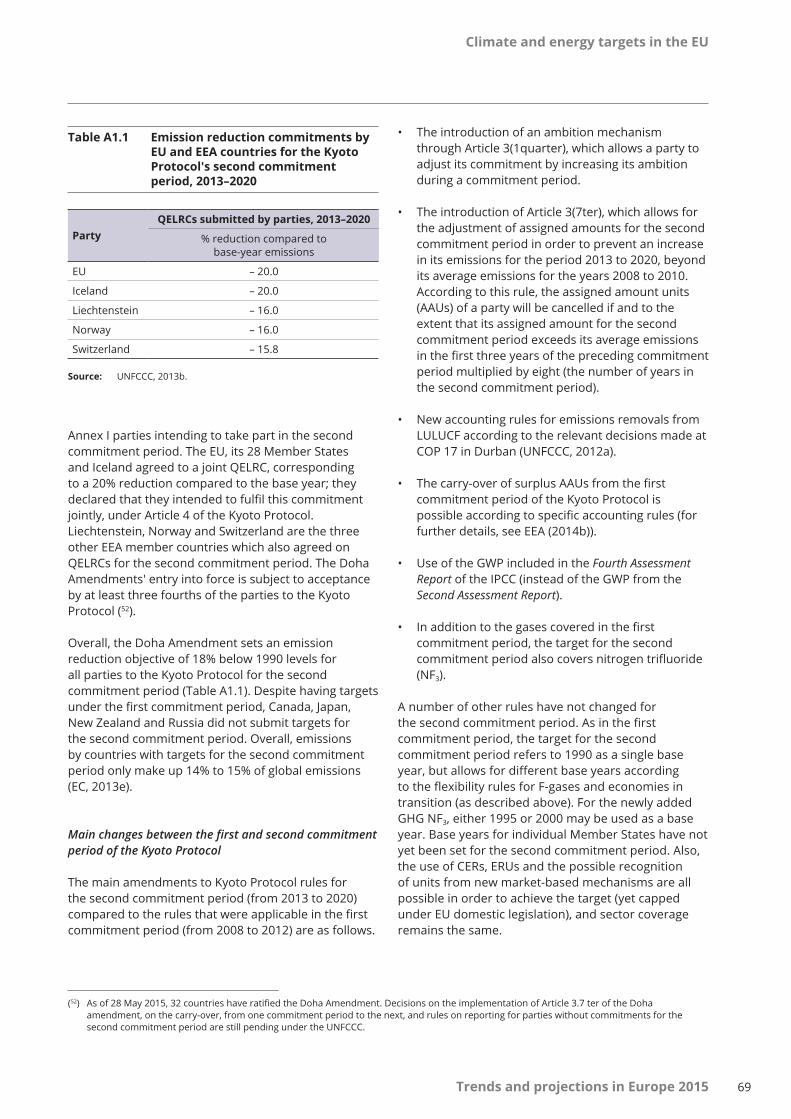
Climate and energy targets in the EU
69Trends and projections in Europe 2015
Annex I parties intending to take part in the second commitment period. The EU, its 28 Member States and Iceland agreed to a joint QELRC, corresponding to a 20% reduction compared to the base year; they declared that they intended to fulfil this commitment jointly,underArticle 4oftheKyotoProtocol.Liechtenstein, Norway and Switzerland are the three other EEA member countries which also agreed on QELRCs for the second commitment period. The Doha Amendments' entry into force is subject to acceptance by at least three fourths of the parties to the Kyoto Protocol (52).
Overall, the Doha Amendment sets an emission reduction objective of 18% below 1990 levels for all parties to the Kyoto Protocol for the second commitment period (Table A1.1). Despite having targets under the first commitment period, Canada, Japan, New Zealand and Russia did not submit targets for the second commitment period. Overall, emissions by countries with targets for the second commitment period only make up 14% to 15% of global emissions (EC, 2013e).
Main changes between the first and second commitment period of the Kyoto Protocol
The main amendments to Kyoto Protocol rules for the second commitment period (from 2013 to 2020) compared to the rules that were applicable in the first commitment period (from 2008 to 2012) are as follows.
• The introduction of an ambition mechanism through Article 3(1quarter), which allows a party to adjust its commitment by increasing its ambition during a commitment period.
• The introduction of Article 3(7ter), which allows for the adjustment of assigned amounts for the second commitment period in order to prevent an increase in its emissions for the period 2013 to 2020, beyond its average emissions for the years 2008 to 2010. According to this rule, the assigned amount units (AAUs) of a party will be cancelled if and to the extent that its assigned amount for the second commitment period exceeds its average emissions in the first three years of the preceding commitment period multiplied by eight (the number of years in the second commitment period).
• New accounting rules for emissions removals from LULUCF according to the relevant decisions made at COP 17 in Durban (UNFCCC, 2012a).
• The carry-over of surplus AAUs from the first commitment period of the Kyoto Protocol is possible according to specific accounting rules (for further details, see EEA (2014b)).
• Use of the GWP included in the Fourth Assessment Report of the IPCC (instead of the GWP from the Second Assessment Report).
• In addition to the gases covered in the first commitment period, the target for the second commitment period also covers nitrogen trifluoride (NF3).
A number of other rules have not changed for the second commitment period. As in the first commitment period, the target for the second commitment period refers to 1990 as a single base year, but allows for different base years according to the flexibility rules for F-gases and economies in transition (as described above). For the newly added GHG NF3, either 1995 or 2000 may be used as a base year. Base years for individual Member States have not yet been set for the second commitment period. Also, the use of CERs, ERUs and the possible recognition of units from new market-based mechanisms are all possible in order to achieve the target (yet capped under EU domestic legislation), and sector coverage remains the same.
Table A1.1 Emission reduction commitments by EU and EEA countries for the Kyoto Protocol's second commitment period, 2013–2020
PartyQELRCs submitted by parties, 2013–2020
% reduction compared to base-year emissions
EU – 20.0
Iceland – 20.0
Liechtenstein – 16.0
Norway – 16.0
Switzerland – 15.8
Source: UNFCCC, 2013b.
(52) As of 28 May 2015, 32 countries have ratified the Doha Amendment. Decisions on the implementation of Article 3.7 ter of the Doha amendment, on the carry-over, from one commitment period to the next, and rules on reporting for parties without commitments for the second commitment period are still pending under the UNFCCC.
Climate and energy targets in the EU
70 Trends and projections in Europe 2015
LULUCF activities under the Kyoto Protocol
In addition to policies and measures targeting sources of GHG emissions, countries can use policies and measures to protect their existing terrestrial carbon stocks (e.g. by reducing deforestation) and to further enhance terrestrial carbon stocks (e.g. by increasing the area or carbon density of forests).
The following LULUCF activities are included under the Kyoto Protocol.
• Afforestation, reforestation and deforestation (ARD) since 1990 (mandatory activities covered by Article 3.3 of the Kyoto Protocol), for land that has been subject to direct, human-induced conversion from a non-foresttoaforeststate,orviceversa.
• Forest management (FM), cropland management (CM), grazing-land management (GM) and revegetation (RV). Although CM, GM and RV are voluntary, since the second commitment period, FM has been a mandatory activity under Article 3.4 of the Kyoto Protocol). These activities pertain to land that has not undergone conversion since 1990, but is otherwise subject to a specific land activity. Parties account for net emissions or removals for each activity during the commitment period, by issuing removal units (RMUs) in the case of net GHG removals from LULUCF activities, or cancelling Kyoto units in the case of LULUCF activities being a net source of GHG emissions. LULUCF activities can therefore be used to offset emissions from other sources if removals are higher than emissions from this sector. In the first commitment period, the number of RMUs that could be issued by each party under FM was capped (UNFCCC, 2006). For the second commitment period, FM activities will be accounted against a 'FM reference level', i.e.a country-specificlevelofbusiness-as-usualemissions or removals. RMUs will be issued only if FM removals are higher or emissions are lower than the agreed FM reference level. Otherwise, Kyoto units will be cancelled.
RMUs can be accounted for at the end of a commitment period or annually. According to Decision 13/CMP.1,partiesmustindicatethefrequencyof accounting with their initial reports. For each activity under Article 3.3 and Article 3.4, parties have elected to account for emissions or removals either annually during the commitment period, or only once at the end of this period. The decision on frequency determines when parties may issue RMUs or cancel other units in the case of emissions from Article 3.3 and Article 3.4 activities.
For the second commitment period, new accounting rules apply for the accounting of emissions and removals in the LULUCF sector. In particular, additional activities for wetland management can be chosen to be accounted for on a voluntary basis. Guidelines for these new rules were developed by the IPCC and adopted by the UNFCCC. Subsequently, the rules were almost entirely transferred into EU law in form of the EU LULUCF Decision 529/2013/EU on accounting rules on greenhouse gas emissions and removals resulting from activities relating to land use, land-use change and forestry and on information concerning actions relating to those activities (EU, 2013b).
LULUCF emissions and removals are not included in the EU domestic 2020 target under the climate and energy package. The EU has adopted LULUCF DecisionNo 529/2013/EU(EU,2013b),legislationwhichharmonises EU LULUCF reporting with Kyoto Protocol requirements, but also goes beyond these requirements. Under EU rules, Member States have to also report on agricultural activities (CM and GM), irrespective of whether these activities are elected or not under the KP.
Emissions from aviation
While GHG emissions from domestic and international aviation have been partly included in the EU's target undertheUNFCCCsince2012aspartoftheEU ETS,onlyemissions from domestic aviation are included in its targets under the Kyoto Protocol. Domestic aviation from the EU Member States amounts to less than 0.5% of total GHG emissions without LULUCF, whereas international aviation of EU Member States totals about 3%.
Inprinciple,theEU ETScoversallflightsarrivingat,and departing from, airports in all EU Member States, Norway, Iceland and Liechtenstein and closely related territories. However, since 2012, flights to and from aerodromes from other countries have not been includedintheEU ETS.Thisexclusion,firstresultingfrom the 'stop the clock' decision (EU, 2013c) was made in order to facilitate negotiation of a global agreement on aviation emissions in autumn 2013 by the General Assembly of the International Civil Aviation Organization (ICAO). At its 38th meeting in autumn 2013, the ICAO decided on a roadmap for the development of a global market-based mechanism to tackle aviation emissions. By 2016, the body will decide on a mechanism to be implemented by 2020.
The EU decided to continue with a reduced scope in the period from 2013 to 2016 (EU, 2014b). Only flights between aerodromes located in countries in the European Economic Area are included. Flights to and

Climate and energy targets in the EU
71Trends and projections in Europe 2015
from outermost regions, as per Article 349 of the Treaty on the Functioning of the European Union (TFEU), are covered only if they occur in the same outermost region.
Morethan1 200aviationoperatorsarecurrentlyincludedintheEU ETS.ThecapforaviationintheEU ETSisbasedonaveragehistoricemissionsinthissectorbetween2004and2006(221.4 million t CO2 forallparticipatingcountries) (53). The cap for the 2013-to-2020 period equals 95% of baseline emissions (EU, 2008b). Whereas aircraft operators may use EU aviation allowances (EUAAs) as well as EU allowances (EUAs) from the stationary sectors, stationary installations are not permitted to use aviation allowances for compliance. In addition, some international credits can be used by aircraft operators: up to 14% of their verified emissions in 2012, and, from 2013 onwards, each aircraft operator is entitled to use international credits up to a maximum of 1.5% of its verified emissions during the period from 2013 to 2020, without prejudice to any residual entitlement from 2012 (EU, 2014b).
Comparison of accounting rules under the Convention target and under the Kyoto Protocol
The EU clarified that the accounting rules for its target under the UNFCCC are more ambitious than the current rules under the Kyoto Protocol, for example, including international aviation and adding an annual compliance cycle for emissions under the ESD or higher Clean Development Mechanism (CDM) quality standards under the ETS (UNFCCC, 2013b).
Accordingly, the following assumptions and conditions apply to the EU's 20% target under the UNFCCC.
• Emissions or removals from LULUCF are not included (but moving to the higher target of 30% would require some contribution from LULUCF).
• The target refers to 1990 as a single base year, not allowing for different base years for F-gases or economies in transition, as under the Kyoto Protocol.
• Emissions from international and domestic aviation are partly included in the target; furthermore, the target covers the IPCC sectors of energy, industrial processes and product use (IPPU), agriculture and waste.
• A limited number of CERs, ERUs and units from new market-based mechanisms may be used toachievethetarget:intheEU ETS,theuseofinternational credits is capped (up to 50% of thereductionrequiredfromEU ETSsectorsby2020 can be achieved through the use of carbon credits). Quality standards also apply to the use of international credits in the EU ETS, including a ban on credits from LULUCF projects and certain industrial gas projects. In the ESD sectors, the annual use of international credits is limited to up to 3% of each Member State's ESD emissions in 2005, with a limited number of Member States being permitted to use an additional 1% from projects in least developed countries (LDCs) and small island developing states (SIDS), subject to conditions. These caps thus define the concept of supplementary use of market-based mechanisms for the fulfilment of targets, and indicate that the EU applies more ambitious rules with regard to the use of market-based mechanisms to its target under the UNFCCC than in the context of the Kyoto Protocol.
• The carry-over of surplus AAUs from the first commitment period of the Kyoto Protocol is not possible (but surplus EU emissions allowances allocatedundertheEU ETScanbebankedfromthe2008-to-2012 period into subsequent periods).
• The target covers the gases CO2, CH4, N2O, HFCs, PFCs and SF6, consistent with the GHGs covered under the reporting requirements under the convention (UNFCCC, 2013b).
A1.4 EU domestic climate and energy targets for 2020
The '20-20-20' targets
In the context of its commitments and the negotiations at international level, the European Council in March 2007 committed the EU to becoming a highly energy-efficient, low-carbon economy, by achieving three domestic climate and energy objectives by 2020:
• reducing its GHG emissions by 20% from 1990 levels;
• raising to 20% the share of RES in the EU's gross final energy consumption;
• improving the EU's energy efficiency by 20%.
(53) The annual average of CO2 emissions in the years 2004, 2005 and 2006 forms the baseline for historical aviation emissions, based on data from the European Organisation for the Safety of Air Navigation (EUROCONTROL) and fuel consumption information provided by aircraft operators.
Climate and energy targets in the EU
72 Trends and projections in Europe 2015
To achieve these domestic commitments, in 2009 the EU adopted the climate and energy package, which is asetofvariouspiecesoflegislation (54). The package introduced a clear approach to achieving the 20% reduction of total GHG emissions from 1990 levels, which is equivalent to a 14% reduction compared to 2005 levels. This 14% reduction objective is to be achieved through a 21% reduction target compared to 2005 for emissions covered by the ETS, and a 10% reduction target for ESD sectors.
A revision of the ETS Directive (EU, 2009c) introduced a single 2020 target for all EU emissions covered by theEU ETS(aswellasETSemissionsfromthethreeparticipating non-Member States Norway, Iceland and Liechtenstein). The ETS essentially covers emissions from large industrial installations, as well as emissions from aviation. ETS emissions represent about 40% to 45% of EU total GHG emissions. The 2020 cap corresponds to a reduction of about 21% of ETS emissions by 2020, compared to 2005. The sectors coveredundertheEU ETSarethereforeexpectedtocontribute the largest share of emission reductions for meeting the EU's 2020 GHG target. For allowances allocatedtotheEU ETSsectors,annualcapshavebeenset for the period from 2013 to 2020, which decrease by1.74%annually.ForfurtherdetailsontheEU ETSinthe 2013-to-2020 period, see EEA (2015j).
ForallotheremissionsnotcoveredbytheEU ETS,theESD set binding annual targets for each year of the period between 2013 and 2020, for each Member State.
These EU-internal rules under the '2020 climate and energy package' underpin the EU implementation of the 2020 target under the Convention (see Section A1.3 inAnnex1).
National 2020 targets and compliance under the ESD
The ESD covers emissions from all sources outside theEU ETS,exceptforemissionsfrominternationalmaritime, domestic and international aviation (which wereincludedintheEU ETSfrom1 January2012)andemissions and removals from LULUCF. It includes a range of diffuse sources in a wide range of sectors such as transport (cars, trucks), buildings (in particular heating), services, small industrial installations, agriculture and waste. Such sources currently account for about 55% to 60% of total GHG emissions in the EU.
The ESD sets individual binding annual targets for GHG emissionsnotcoveredbytheEU ETSforallMemberStates for the period from 2013 to 2020 (AEAs) (EU, 2009a). In 2013, the European Commission determined the AEAs of Member States for the period from 2013 to 2020, using reviewed and verified emission data for the years 2005, 2008, 2009 and 2010 (EC, 2013c). The AEAs were later adjusted to reflect the change in ETS scope from2013onwards(EC,2013d) (55).
Each Member State will contribute to this effort, according to its relative wealth in terms of GDP per capita. The national emission targets range from a 20% reduction for the richest Member States to a 20% increase for poorer ones in 2020, compared with 2005 levels. At EU level, this will deliver an approximate 9% to 10% reduction of emissions in 2020 compared with 2005 levels, from those sectors covered by the decision. Less wealthy countries are allowed to increase emissions in these sectors because their relatively higher economic growth is likely to be accompanied by higher emissions. Nevertheless, their targets still represent a limit on emissions, and a reduction effort will be required in all Member States; they will need to introduce policies and measures to limit or lower their emissions in the various ESD sectors.
The ESD allows Member States to make use of flexibility provisions for meeting their annual targets, with certain limitations.
• Within the Member State itself, any overachievement in a year of the period from 2013 to 2019 can be carried over to subsequent years, up to 2020. An emission allocation of up to 5% during the period from 2013 to 2019 may be carried forward from the following year.
• Between Member States, Member States may transfer up to 5% of their AEAs to other Member States, which may use this emission allocation until 2020 (ex ante). Any overachievement in a year of the period from 2013 to 2019 may also be transferred to other Member States, which may use this emission allocation until 2020 (ex post).
Member States may use JI/CDM credits according to the following provisions.
• The use of project-based emission credits is capped on a yearly basis up to 3% of 2005 ESD emissions in Member State.
(54) See http://ec.europa.eu/clima/policies/package/index_en.htm for more details. The climate and energy package also included directives on fuel quality (EU, 2009d), carbon capture and storage technologies (EU, 2009e) and a regulation on CO2 emissions from cars (EU, 2009f).
(55) According to Article 27 (2) of Regulation (EU) 525/2013 the European Commission is to examine the impact of the use of the 2006 IPCC guidelines for national GHG inventories and significant changes brought about by the UNFCCC methodologies where by December 2016 and may revise Member States' AEAs as provided in the ESD accordingly.

Climate and energy targets in the EU
73Trends and projections in Europe 2015
• Member States that do not use their 3% limit for the use of project-based credits in any specific year can transfer their unused part for that year to other Member States, or bank it for their own use until 2020.
• Member States fulfilling additional criteria (Austria, Belgium, Cyprus, Denmark, Finland, Ireland, Italy, Luxembourg, Portugal, Slovenia, Spain and Sweden) may use credits from projects in LDCs and SIDS up to an additional 1% of their verified emissions in 2005. These credits are not bankable nor are they transferable.
Overall, a maximum of JI/CDM credits representing 750 Mt CO2 at EU level can be used during the period from 2013 to 2020. As most Member States are expected to meet their ESD targets (see Section 3.4) without the flexibility provisions, while other Member States can meet their ESD targets through intra-EU transfers of AEAs, the use of project credits is expected to be significantly smaller.
Any Member State exceeding its annual AEA, even after taking into account the flexibility provisions and the use of JI/CDM credits, will have to take corrective measures as laid down in the ESD and will be subject to the following consequences:
• deduction from the AEA for the next year of the excess non-ETS emissions multiplied by 1.08 (8% interestrate);
• development of a corrective action plan — the European Commission may issue an opinion, possibly taking into account comments from the Climate Change Committee;
• transfer of emission allocations and project-based credits from the account of that Member State will be temporarily suspended while the Member State is in a state of non-compliance with its ESD obligations.
Figure A1.1 National 2013 and 2020 GHG emission limits under the ESD, relative to 2005 emissions levels
Note: The 2013 targets are expressed against 2005 ESD base-year emissions. These base-year emissions calculated on the basis of relative and absolute 2020 targets (for details on ESD base-year emissions, see Section A3.4 in Annex 3).
The absolute 2020 and 2013 targets used for the calculations are consistent with the IPCC's Fourth Assessment Report (AR4) global warming values, and take into account the change in the scope of the ETS from the second to the third period (2013 to 2020).
Source: EC, 2013c and 2013d; EU, 2009a.
– 9%
– 20% – 17%
– 16% – 15% – 14% – 13%
– 10%
– 5% – 4%
1% 4% 5%
9% 10% 11% 13% 14% 15%
17% 19% 20%
– 30
– 20
– 10
0
10
20
30
EU
Denmark
Luxe
mbourg
Ireland
Sweden
Finland
United Kingd
om
Austria
Netherla
nds
Belgium
France
Germany
Italy
Spain
Cypru
s
Greece
Portuga
l
Slove
nia
Malta
Czech
Republic
Hungary
Croatia
Estonia
Slova
kia
Poland
Lithuania
Latvi
a
Romania
Bulgaria
ESD targets vs. 2005 ESD base-year emissions (%)
2020 ESD target 2013 ESD target

Climate and energy targets in the EU
74 Trends and projections in Europe 2015
2020 targets on renewable energy
In order to meet its target of raising the share of RES to 20% in its gross final energy consumption by 2020, the EU adopted the RED (EU, 2009b), as part of the climate and energy package.
The RED includes legally binding national renewable energy targets for 2020 consistent with a 20% EU-wide RES share in gross final energy consumption by 2020, and a 10% RES share in transport by the same year (EU, 2009b).TheREDalsosetsanindicativetrajectoryfor each Member State for the period from 2011 until 2018, intended to ensure that each Member State achieves its 2020 target. An interim indicative RED target for the EU can be derived from the minimum indicative trajectories of the Member States in the run-upto2020(RED,AnnexI,Part B).
Under the RED, Member States had to submit NREAPs in 2010 (EEA, 2011b). These plans outline the pathways
(i.e. the expected trajectories) which Member States anticipate using to reach their legally binding national renewable energy targets in 2020. In 2011 (and every 2 years thereafter), Member States had to report on national progress towards the interim RED and expected NREAP targets. The NREAPs adopted by Member States in 2010 outline expected trajectories for the share of RES in gross final energy consumption towards the legally binding national 2020 RES targets.
2020 targets on energy efficiency
In 2007, the European Council (European heads of state or government) stressed the need to increase energy efficiency so as to achieve a 20% energy savings target for 2020 in primary energy consumption, and agreed on binding targets for GHG emission reductions and renewable energy (European Council, 2007). The reduction of primary energy consumption by 20% by 2020 is a non-binding objective in the EU.
Figure A1.2 National targets for renewable energies for 2020
Note: The targets for Iceland and Norway, which are not EU Member States, were agreed and included in the Annex of the European Economic Area agreement. For the sake of simplicity, the report refers to these as RED targets.
Source: EU, 2009b.
20%
10% 11% 13% 14% 15% 16% 17% 18%
20% 23% 24% 25%
30% 31% 34%
38% 40%
49%
68%
72%
0
10
20
30
40
50
60
70
80
EU
Malta
Luxe
mbourg
Belgium
Cypru
s
Czech
Republic
Hungary
Netherla
nds
Slova
kia
United Kingd
om
Poland
Ireland
Bulgaria
Ita
ly
Germany
Greece
Spain
Croatia
France
Lithuania
Romania
Slove
nia
Estonia
Denmark
Portuga
l
Austria
Finland
Latvi
a
Sweden
Norway
Iceland
RES target 2020 as % of gross final energy consumption

Climate and energy targets in the EU
75Trends and projections in Europe 2015
The climate and energy package does not address the energy efficiency target directly, although the CO2 performance standards for cars and vans (Regulation (EU) No 333/2014 and Regulation (EC) No 443/2009), therevisedEU ETSDirectiveandtheESDallcontributeto fostering energy efficiency. Since the adoption of the package, the EU energy efficiency policy framework has advanced in line with the priorities identified in the Action Plan for Energy Efficiency 2006 (EC, 2006a). The energy efficiency action plan was reviewed in 2011, following revisions of several pieces of legislation:
• the Ecodesign Directive (EU, 2009g);
• the Energy Labelling Directive (EU, 2010a);
• the EPBD (EU, 2010b).
One of the key developments in the energy efficiency policy framework was the adoption of the EED in 2012 (EU, 2012). The EED establishes a common framework of measures for the promotion of energy efficiency within the Union and aims to help remove barriers and overcome market failures that impede efficiency in the supply and use of energy. The EED stipulates that primary energy consumption in the EU should notexceed1 483 Mtoein2020,andthatfinalenergyconsumptioninEUshouldnotexceed1 086 Mtoebythe same year. These absolute targets were set using the European Commission's 2007 Energy Baseline Scenario, based on the Price-driven and Agent-based Simulation of Markets Energy System Models (PRIMES) (EC, 2011e). Implementing the EED was expected to lead to a 15% reduction in primary energy consumption compared to the 2007 Energy Baseline Scenario, with an additional 2% reduction expected from the transport sector (Groenenberg, 2012).
Under the EED, Member States had to set indicative national targets and implement a set of mandatory
requirements, one of the most significant being the establishment of an EEO scheme, or the implementation of alternative measures.
Member States adopted different base years against which the progress towards national energy efficiency targets will be measured. Member States also chose different approaches when setting the national target. Ten Member States (Austria, Belgium, Cyprus, Denmark, Hungary, Ireland, Italy, Latvia, Malta and Poland) chose to focus the target on primary energy consumption, while 12 others (Croatia, Estonia, Finland, France, Greece, Lithuania, Luxembourg, the Netherlands, Spain, Slovakia, Slovenia and the United Kingdom) chose to focus their national target on gross final energy consumption; another two (Bulgaria and Sweden) focused on primary energy intensity. Each national target reflects the specific situation of the Member State which adopted it. As a consequence, ambition levels vary greatly. When comparing all targets to 2005 levels, 16 Member States have aimed for reduction of final as well as primary energy consumption; for 6 Member States, targets show an increase in final as well as primary energy consumption (including Malta, which has a 24% reduction target in primaryenergyconsumption,alongsidea+ 40%targetfor final energy consumption, compared to 2005). Five other Member States have placed a cap on the potential increase of either primary or final energy consumption over the period.
In some Member States, the targets may still be subject to change in the upcoming years. This is due to the fact that some countries are currently holding nationwide debates on the future of their energy systems. Depending on the outcome of these debates, energy efficiency targets might be modified. Twelve Member States (Austria, Bulgaria, Croatia, Cyprus, France, Greece, Italy, Poland, Slovakia, Spain, Sweden and the United Kingdom) revised their energy efficiency targets in their triennial NEEAPs, submitted under the EED.
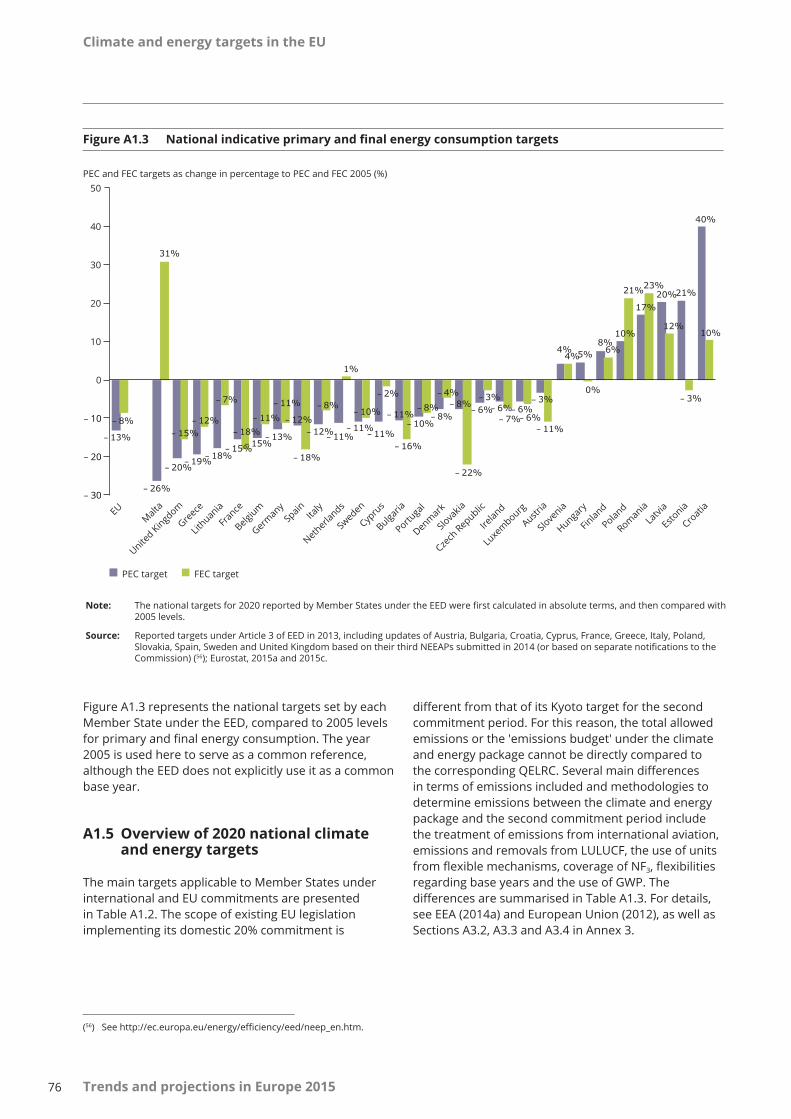
Climate and energy targets in the EU
76 Trends and projections in Europe 2015
Figure A1.3 represents the national targets set by each Member State under the EED, compared to 2005 levels for primary and final energy consumption. The year 2005 is used here to serve as a common reference, although the EED does not explicitly use it as a common base year.
A1.5 Overview of 2020 national climate and energy targets
The main targets applicable to Member States under international and EU commitments are presented in Table A1.2. The scope of existing EU legislation implementing its domestic 20% commitment is
different from that of its Kyoto target for the second commitment period. For this reason, the total allowed emissions or the 'emissions budget' under the climate and energy package cannot be directly compared to the corresponding QELRC. Several main differences in terms of emissions included and methodologies to determine emissions between the climate and energy package and the second commitment period include the treatment of emissions from international aviation, emissions and removals from LULUCF, the use of units from flexible mechanisms, coverage of NF3, flexibilities regarding base years and the use of GWP. The differences are summarised in Table A1.3. For details, see EEA (2014a) and European Union (2012), as well as Sections A3.2, A3.3 and A3.4 in Annex 3.
Figure A1.3 National indicative primary and final energy consumption targets
Note: Thenationaltargetsfor2020reportedbyMemberStatesundertheEEDwerefirstcalculatedinabsoluteterms,andthencomparedwith2005 levels.
Source: Reported targets under Article 3 of EED in 2013, including updates of Austria, Bulgaria, Croatia, Cyprus, France, Greece, Italy, Poland, Slovakia,Spain,SwedenandUnitedKingdombasedontheirthirdNEEAPssubmittedin2014(orbasedonseparatenotificationstotheCommission) (56); Eurostat, 2015a and 2015c.
– 13%
– 26%
– 20% – 19% – 18%
– 15% – 15% – 13%
– 12% – 12% – 11%
– 11% – 11%
– 11% – 10%
– 8% – 8%
– 6% – 6% – 6% – 3%
4% 5% 8%
10%
17% 20% 21%
40%
– 8%
31%
– 15% – 12%
– 7%
– 18% – 11%
– 11%
– 18%
– 8%
1%
– 10%
– 2%
– 16%
– 8%
– 4%
– 22%
– 3%
– 7% – 6% – 11%
4%
0%
6%
21% 23%
12%
– 3%
10%
– 30
– 20
– 10
0
10
20
30
40
50
EU
Malta
United Kingd
om
Greece
Lithuania
France
Belgium
Germany
Spain Ita
ly
Netherla
nds
Sweden
Cypru
s
Bulgaria
Portuga
l
Denmark
Slovakia
Czech
Republic
Ireland
Luxe
mbourg
Austria
Slovenia
Hungary
Finland
Poland
Romania
Latvi
a
Estonia
Croatia
PEC and FEC targets as change in percentage to PEC and FEC 2005 (%)
PEC target FEC target
(56) See http://ec.europa.eu/energy/efficiency/eed/neep_en.htm.
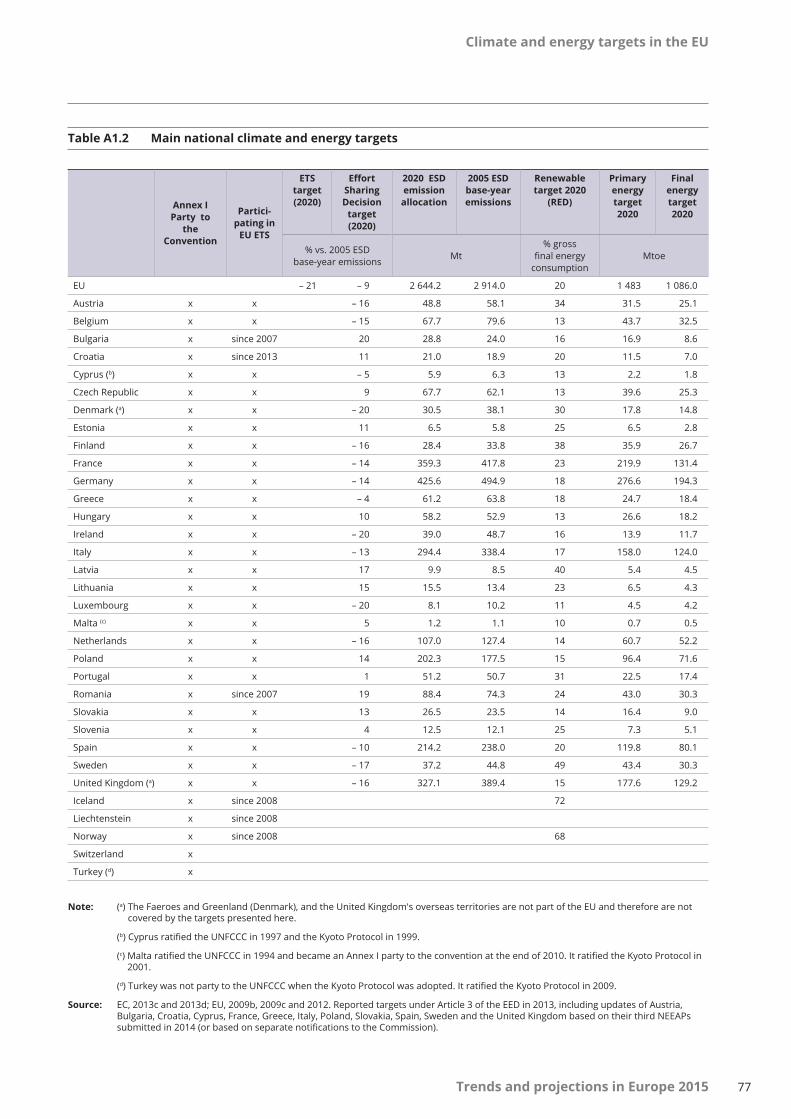
Climate and energy targets in the EU
77Trends and projections in Europe 2015
Table A1.2 Main national climate and energy targets
Note: (a) The Faeroes and Greenland (Denmark), and the United Kingdom's overseas territories are not part of the EU and therefore are not covered by the targets presented here.
(b)CyprusratifiedtheUNFCCCin1997andtheKyotoProtocolin1999.
(c)MaltaratifiedtheUNFCCCin1994andbecameanAnnexIpartytotheconventionattheendof2010.ItratifiedtheKyotoProtocolin2001.
(d)TurkeywasnotpartytotheUNFCCCwhentheKyotoProtocolwasadopted.ItratifiedtheKyotoProtocolin2009.
Source: EC, 2013c and 2013d; EU, 2009b, 2009c and 2012. Reported targets under Article 3 of the EED in 2013, including updates of Austria, Bulgaria, Croatia, Cyprus, France, Greece, Italy, Poland, Slovakia, Spain, Sweden and the United Kingdom based on their third NEEAPs submittedin2014(orbasedonseparatenotificationstotheCommission).
Annex I Party to
the Convention
Partici‑ pating in
EU ETS
ETS target (2020)
Effort Sharing Decision
target (2020)
2020 ESD emission allocation
2005 ESD base‑year emissions
Renewable target 2020
(RED)
Primary energy target 2020
Final energy target 2020
% vs. 2005 ESD base-year emissions Mt
% gross final energy
consumptionMtoe
EU – 21 – 9 2 644.2 2 914.0 20 1 483 1 086.0
Austria x x – 16 48.8 58.1 34 31.5 25.1
Belgium x x – 15 67.7 79.6 13 43.7 32.5
Bulgaria x since 2007 20 28.8 24.0 16 16.9 8.6
Croatia x since 2013 11 21.0 18.9 20 11.5 7.0
Cyprus (b) x x – 5 5.9 6.3 13 2.2 1.8
Czech Republic x x 9 67.7 62.1 13 39.6 25.3
Denmark (a) x x – 20 30.5 38.1 30 17.8 14.8
Estonia x x 11 6.5 5.8 25 6.5 2.8
Finland x x – 16 28.4 33.8 38 35.9 26.7
France x x – 14 359.3 417.8 23 219.9 131.4
Germany x x – 14 425.6 494.9 18 276.6 194.3
Greece x x – 4 61.2 63.8 18 24.7 18.4
Hungary x x 10 58.2 52.9 13 26.6 18.2
Ireland x x – 20 39.0 48.7 16 13.9 11.7
Italy x x – 13 294.4 338.4 17 158.0 124.0
Latvia x x 17 9.9 8.5 40 5.4 4.5
Lithuania x x 15 15.5 13.4 23 6.5 4.3
Luxembourg x x – 20 8.1 10.2 11 4.5 4.2
Malta (c) x x 5 1.2 1.1 10 0.7 0.5
Netherlands x x – 16 107.0 127.4 14 60.7 52.2
Poland x x 14 202.3 177.5 15 96.4 71.6
Portugal x x 1 51.2 50.7 31 22.5 17.4
Romania x since 2007 19 88.4 74.3 24 43.0 30.3
Slovakia x x 13 26.5 23.5 14 16.4 9.0
Slovenia x x 4 12.5 12.1 25 7.3 5.1
Spain x x – 10 214.2 238.0 20 119.8 80.1
Sweden x x – 17 37.2 44.8 49 43.4 30.3
United Kingdom (a) x x – 16 327.1 389.4 15 177.6 129.2
Iceland x since 2008 72
Liechtenstein x since 2008
Norway x since 2008 68
Switzerland x
Turkey (d) x

Climate and energy targets in the EU
78 Trends and projections in Europe 2015
International commitments Unilateral EU commitments
Kyoto Protocol UNFCCC Kyoto Protocol Climate and energy package 2030 framework on climate and energy policiesEU ETS ESD
Target year or period
First commitment period (2008–2012)
2020 Second commitment period (2013–2020)
2013–2020 2013–2020 2030
Emission reduction target
− 8% − 20% − 20% − 21%compared to 2005 for ETS emissions
Annual targets for Member States. In 2020, − 9%comparedto 2005 for ESD emissions
Atleast− 40%
Other targets
Conditional targetof− 30%if other parties take on adequate commitments
RED: 20% share of renewable energy of gross final energy consumption; EED: increase energy efficiency by 20%
At least 27% share of renewable energy consumption; at least 27% increase in energy efficiency
Base year 1990 Kyoto Protocol flexibility rules for F-gases and economies in transition
1990 1990, but subject to flexibility rules. 1995 or 2000 may be used as base year for F-gases or NF3
1990 for overall emission reduction target; 2005 targets broken down into ETS and non-ETS emissions
1990 for emission reduction target.
LULUCF Included ARD and other activities if elected
Excluded Included ARD and FM, other activities if elected (new accounting rules)
Excluded Included. Details to be finalised prior to 2020
Aviation Domestic aviation included. International aviation excluded
Domestic aviation included. International aviation partly included
Domestic aviation included. International aviation excluded
Domestic and international aviation (partly) included in EU ETS
Aviation generally excluded, some domestic aviation included (operators below ETS de minimis thresholds)
Not specified yet; expectation of market mechanisms for aviation under ICAO
Use of market mechanisms
Use of KP flexible mechanisms subject to KP rules
Subject to quantitative and qualitative limits
Use of KP flexible mechanisms subject to KP rules
Subject to quantitative and qualitative limits
Subject to quantitative and qualitative limits
None
Carry‑over of units from preceding periods
Not applicable Not applicable Subject to KP rules including those agreed in Doha Amendment
EU ETSallowances can be banked into subsequent ETS trading periods since the second trading period
No restriction of carry-over within the period from 2013 to 2020
Banking in the EU ETS is confirmed. The legislative proposal(s) for non-ETS emissions still pending
Gases covered
CO2, CH4, N2O, HFCs, PFCs, SF6,
CO2, CH4, N2O, HFCs, PFCs, SF6
CO2, CH4, N2O, HFCs, PFCs, SF6, NF3
CO2, CH4, N2O,HFCs, PFCs,SF6, NF3 not included
CO2, CH4, N2O, HFCs, PFCs, SF6, NF3
Sectors included
Energy, IPPU, agriculture, waste, LULUCF
Energy, IPPU, agriculture, waste, aviation
Energy, IPPU, agriculture, waste, LULUCF
Power and heat generation, energy-intensive industry sectors, aviation
Transport (except aviation), buildings, non-ETS industry, agriculture (except forestry) and waste
100%
Table A1.3 Technical details concerning EU climate‑related targets
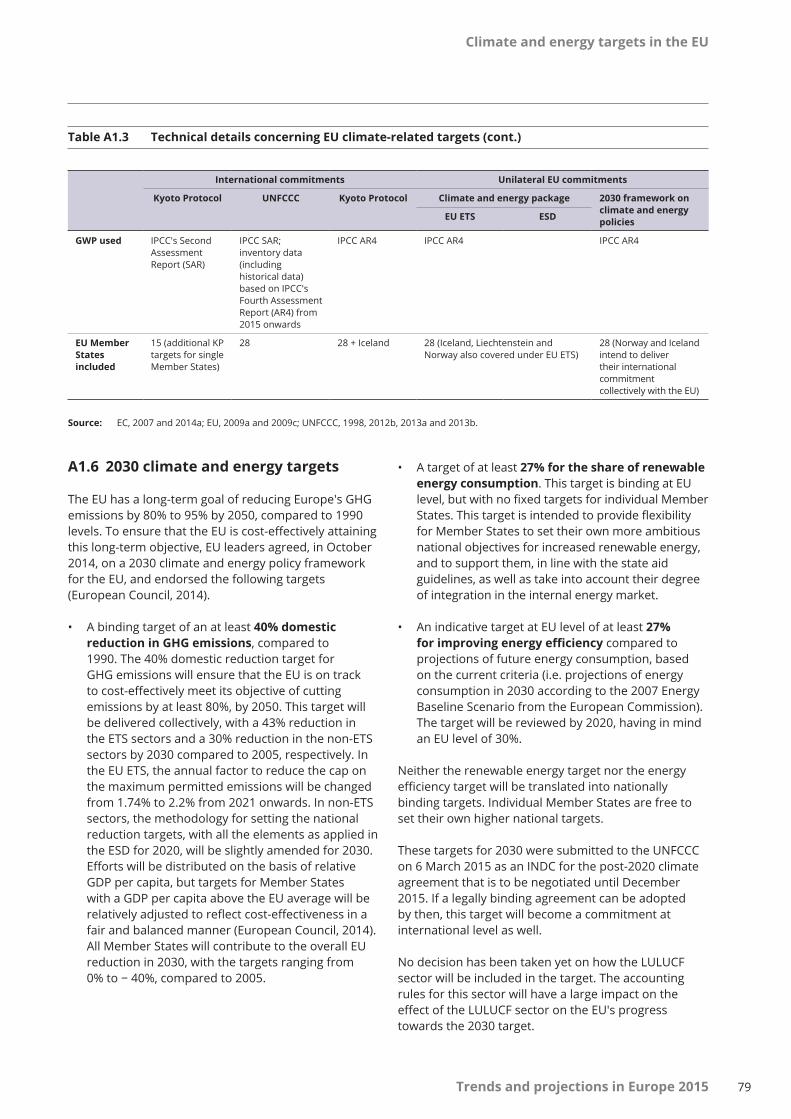
Climate and energy targets in the EU
79Trends and projections in Europe 2015
Source: EC, 2007 and 2014a; EU, 2009a and 2009c; UNFCCC, 1998, 2012b, 2013a and 2013b.
International commitments Unilateral EU commitments
Kyoto Protocol UNFCCC Kyoto Protocol Climate and energy package 2030 framework on climate and energy policiesEU ETS ESD
GWP used IPCC's Second Assessment Report (SAR)
IPCC SAR; inventory data (including historical data) based on IPCC's Fourth Assessment Report (AR4) from 2015 onwards
IPCC AR4 IPCC AR4 IPCC AR4
EU Member States included
15 (additional KP targets for single Member States)
28 28 + Iceland 28 (Iceland, Liechtenstein and Norway also covered under EU ETS)
28 (Norway and Iceland intend to deliver their international commitment collectively with the EU)
A1.6 2030 climate and energy targets
The EU has a long-term goal of reducing Europe's GHG emissions by 80% to 95% by 2050, compared to 1990 levels. To ensure that the EU is cost-effectively attaining this long-term objective, EU leaders agreed, in October 2014, on a 2030 climate and energy policy framework for the EU, and endorsed the following targets (European Council, 2014).
• A binding target of an at least 40% domestic reduction in GHG emissions, compared to 1990. The 40% domestic reduction target for GHG emissions will ensure that the EU is on track to cost-effectively meet its objective of cutting emissions by at least 80%, by 2050. This target will be delivered collectively, with a 43% reduction in the ETS sectors and a 30% reduction in the non-ETS sectors by 2030 compared to 2005, respectively. In theEU ETS,theannualfactortoreducethecaponthe maximum permitted emissions will be changed from 1.74% to 2.2% from 2021 onwards. In non-ETS sectors, the methodology for setting the national reduction targets, with all the elements as applied in the ESD for 2020, will be slightly amended for 2030. Efforts will be distributed on the basis of relative GDP per capita, but targets for Member States with a GDP per capita above the EU average will be relatively adjusted to reflect cost-effectiveness in a fair and balanced manner (European Council, 2014). All Member States will contribute to the overall EU reduction in 2030, with the targets ranging from 0% to− 40%,comparedto2005.
• A target of at least 27% for the share of renewable energy consumption. This target is binding at EU level, but with no fixed targets for individual Member States. This target is intended to provide flexibility for Member States to set their own more ambitious national objectives for increased renewable energy, and to support them, in line with the state aid guidelines, as well as take into account their degree of integration in the internal energy market.
• An indicative target at EU level of at least 27% for improving energy efficiency compared to projections of future energy consumption, based on the current criteria (i.e. projections of energy consumption in 2030 according to the 2007 Energy Baseline Scenario from the European Commission). The target will be reviewed by 2020, having in mind an EU level of 30%.
Neither the renewable energy target nor the energy efficiency target will be translated into nationally binding targets. Individual Member States are free to set their own higher national targets.
These targets for 2030 were submitted to the UNFCCC on6 March 2015asanINDCforthepost-2020climateagreement that is to be negotiated until December 2015. If a legally binding agreement can be adopted by then, this target will become a commitment at international level as well.
No decision has been taken yet on how the LULUCF sector will be included in the target. The accounting rules for this sector will have a large impact on the effect of the LULUCF sector on the EU's progress towards the 2030 target.
Table A1.3 Technical details concerning EU climate-related targets (cont.)
Trends and projections in Europe 201580
Data sources for GHG emissions, energy consumption and targets
Annex 2 DatasourcesforGHGemissions,energy consumption and targets
A2.1 Legal reporting requirements for GHG data
The assessments of progress towards GHG emission targets presented in this report are for the most part based on information submitted by Member States themselves under the MMR, which is the successor to the Monitoring Mechanism Decision (MMD) (Decision 28/2004/EC concerning a mechanism for monitoring Community greenhouse gas emissions and for implementing the Kyoto Protocol (EU, 2004)).
The initial purpose of the reporting requirements stipulated in the MMD was to enable the EU to complete its reporting commitments under the UNFCCC and to evaluate the projected progress of the EU and its Member States towards fulfilling their GHG mitigation commitments under the Kyoto Protocol in annual reports prepared by the European Commission and the EEA.
In 2015, Member States reported, for the first time, new information under the MMR adopted in 2013 (EU, 2013a).TheMMRsetsupaUnioninventorysystem(Article 6) and lays down the obligation for the Union and the Member States to yearly determine and report GHG inventories in line with reporting requirements of the UNFCCC (Article 7).
A delegated act (Commission delegated Regulation (EU) No 666/2014 establishing substantive requirements for a Union inventory system and taking into account changes in the global warming potentials and internationally agreed inventory guidelines pursuant to Regulation (EU) No 525/2013 of the European Parliament and of the Council) (EC, 2014c) has defined the substantive requirements for a Union inventory system in order to fulfil the obligations pursuant to Decision 19/CMP.1.
Implementing provisions (Commission implementing Regulation (EU) No 749/2014 on structure, format, submission processes and review of information reported by Member States pursuant to Regulation (EU) No 525/2013 of the European Parliament and of the Council) (EC, 2014d), adopted in June 2014, provide structure and format for the reporting of GHG inventories, approximated GHG inventories, information on policies and measures, GHG projections, and the use of auctioning revenue and project credits and for the purposes of the LULUCF Decision (EU, 2013b).
A2.2 Historic GHG emission data
The analysis presented in this report is based on the following.
• GHG emission data for the period from 1990 to 2013, as included in GHG inventory reports reported under the UNFCCC. From 2015 onwards, national inventories by Annex I countries are prepared according to 2006 IPCC guidelines. Due to the change in reporting obligations, the submission of emission inventories has been considerably delayed in 2015. A review of submitted inventories did not take place in 2015 before this report was produced. For this reason, emission numbers used for the analysis in this report are only preliminary.
• Early estimates of 2014 GHG emissions reported by Member States to the European Commission under the MMR.
• DatarelativetotheEU ETS,publiclyavailablefromtheEUTL (57) as well as the EEA ETS data viewer (EEA, 2015b).
(57) TheEUTLautomaticallychecks,recordsandauthorisesalltransactionsintheEU ETS.

Data sources for GHG emissions, energy consumption and targets
81Trends and projections in Europe 2015
A2.3 Projected GHG emissions
The report uses GHG projection data to 2030, as reported by Member States in 2015 under the MMR. All Member States reported updated GHG emission projections but Greece. Greek projections have been gap-filled, based on the results of the European Commission's 2013 Reference Scenario. In 2015, projections were reported in two separate scenarios: the mandatory WEM scenario, which considers the implementation of existing (already implemented) measures only; and WAM, which additionally considers the implementation of additional (at planning
stage) measures and is not a mandatory reporting requirement. WAM scenarios have been reported by 18 Member States (Austria, Croatia, Cyprus, the Czech Republic, Estonia, Finland, Hungary, Ireland, Italy, Latvia, Lithuania, Malta, the Netherlands, Portugal, Romania, Slovakia, Spain and the United Kingdom). Denmark reported a WAM scenario which is the same as the WEM scenario. For a WAM scenario aggregated at EU level, Member States not reporting a WAM scenario have been gap-filled with the WEM scenario. An overview of projected emissions for both scenarios is presented in Table A2.1 and Table A2.2.
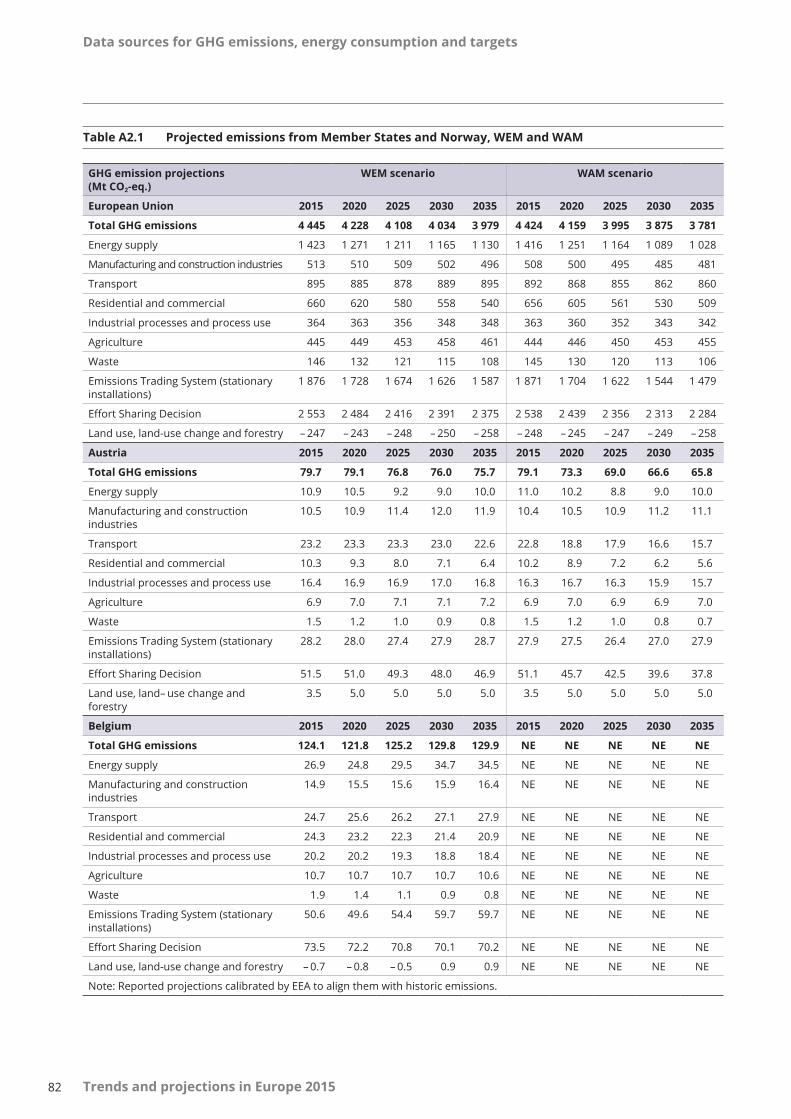
Data sources for GHG emissions, energy consumption and targets
82 Trends and projections in Europe 2015
Table A2.1 Projected emissions from Member States and Norway, WEM and WAM
GHG emission projections (Mt CO2-eq.)
WEM scenario WAM scenario
European Union 2015 2020 2025 2030 2035 2015 2020 2025 2030 2035
Total GHG emissions 4 445 4 228 4 108 4 034 3 979 4 424 4 159 3 995 3 875 3 781
Energy supply 1 423 1 271 1 211 1 165 1 130 1 416 1 251 1 164 1 089 1 028
Manufacturing and construction industries 513 510 509 502 496 508 500 495 485 481
Transport 895 885 878 889 895 892 868 855 862 860
Residential and commercial 660 620 580 558 540 656 605 561 530 509
Industrial processes and process use 364 363 356 348 348 363 360 352 343 342
Agriculture 445 449 453 458 461 444 446 450 453 455
Waste 146 132 121 115 108 145 130 120 113 106
Emissions Trading System (stationary installations)
1 876 1 728 1 674 1 626 1 587 1 871 1 704 1 622 1 544 1 479
Effort Sharing Decision 2 553 2 484 2 416 2 391 2 375 2 538 2 439 2 356 2 313 2 284
Land use, land-use change and forestry – 247 – 243 – 248 – 250 – 258 – 248 – 245 – 247 – 249 – 258
Austria 2015 2020 2025 2030 2035 2015 2020 2025 2030 2035
Total GHG emissions 79.7 79.1 76.8 76.0 75.7 79.1 73.3 69.0 66.6 65.8
Energy supply 10.9 10.5 9.2 9.0 10.0 11.0 10.2 8.8 9.0 10.0
Manufacturing and construction industries
10.5 10.9 11.4 12.0 11.9 10.4 10.5 10.9 11.2 11.1
Transport 23.2 23.3 23.3 23.0 22.6 22.8 18.8 17.9 16.6 15.7
Residential and commercial 10.3 9.3 8.0 7.1 6.4 10.2 8.9 7.2 6.2 5.6
Industrial processes and process use 16.4 16.9 16.9 17.0 16.8 16.3 16.7 16.3 15.9 15.7
Agriculture 6.9 7.0 7.1 7.1 7.2 6.9 7.0 6.9 6.9 7.0
Waste 1.5 1.2 1.0 0.9 0.8 1.5 1.2 1.0 0.8 0.7
Emissions Trading System (stationary installations)
28.2 28.0 27.4 27.9 28.7 27.9 27.5 26.4 27.0 27.9
Effort Sharing Decision 51.5 51.0 49.3 48.0 46.9 51.1 45.7 42.5 39.6 37.8
Landuse,land– usechangeandforestry
3.5 5.0 5.0 5.0 5.0 3.5 5.0 5.0 5.0 5.0
Belgium 2015 2020 2025 2030 2035 2015 2020 2025 2030 2035
Total GHG emissions 124.1 121.8 125.2 129.8 129.9 NE NE NE NE NE
Energy supply 26.9 24.8 29.5 34.7 34.5 NE NE NE NE NE
Manufacturing and construction industries
14.9 15.5 15.6 15.9 16.4 NE NE NE NE NE
Transport 24.7 25.6 26.2 27.1 27.9 NE NE NE NE NE
Residential and commercial 24.3 23.2 22.3 21.4 20.9 NE NE NE NE NE
Industrial processes and process use 20.2 20.2 19.3 18.8 18.4 NE NE NE NE NE
Agriculture 10.7 10.7 10.7 10.7 10.6 NE NE NE NE NE
Waste 1.9 1.4 1.1 0.9 0.8 NE NE NE NE NE
Emissions Trading System (stationary installations)
50.6 49.6 54.4 59.7 59.7 NE NE NE NE NE
Effort Sharing Decision 73.5 72.2 70.8 70.1 70.2 NE NE NE NE NE
Land use, land-use change and forestry – 0.7 – 0.8 – 0.5 0.9 0.9 NE NE NE NE NE
Note: Reported projections calibrated by EEA to align them with historic emissions.

Data sources for GHG emissions, energy consumption and targets
83Trends and projections in Europe 2015
GHG emission projections (Mt CO2-eq.)
WEM scenario WAM scenario
Bulgaria 2015 2020 2025 2030 2035 2015 2020 2025 2030 2035
Total GHG emissions 59.9 60.2 56.8 56.9 56.3 NE NE NE NE NE
Energy supply 31.8 32.7 29.0 28.1 27.2 NE NE NE NE NE
Manufacturing and construction industries
3.2 3.3 3.3 3.4 3.4 NE NE NE NE NE
Transport 8.0 7.1 6.6 6.2 6.3 NE NE NE NE NE
Residential and commercial 2.2 2.5 3.4 4.5 4.8 NE NE NE NE NE
Industrial processes and process use 4.4 4.3 4.3 4.3 4.0 NE NE NE NE NE
Agriculture 6.0 6.5 6.7 7.0 7.3 NE NE NE NE NE
Waste 4.4 3.8 3.5 3.4 3.3 NE NE NE NE NE
Emissions Trading System (stationary installations)
36.4 37.4 34.0 33.5 32.7 NE NE NE NE NE
Effort Sharing Decision 23.5 22.7 22.7 23.4 23.6 NE NE NE NE NE
Land use, land-use change and forestry – 8.2 – 9.3 – 5.4 – 5.5 – 5.5 NE NE NE NE NE
Note: Reported projections calibrated by EEA to align them with historic emissions.
Croatia 2015 2020 2025 2030 2035 2015 2020 2025 2030 2035
Total GHG emissions 24.9 26.6 28.4 30.2 31.4 24.9 24.1 24.5 25.0 25.7
Energy supply 6.6 7.9 8.9 9.6 10.1 6.6 6.2 6.0 5.8 6.0
Manufacturing and construction industries
2.4 2.4 2.4 2.5 2.5 2.4 2.4 2.4 2.5 2.5
Transport 5.4 5.4 5.9 6.3 6.8 5.4 5.1 5.5 5.8 6.2
Residential and commercial 3.0 2.9 3.0 3.1 3.2 3.0 2.4 2.4 2.3 2.3
Industrial processes and process use 2.4 2.6 2.8 2.9 3.1 2.4 2.6 2.8 2.9 3.1
Agriculture 3.9 4.3 4.5 4.7 4.9 3.9 4.3 4.5 4.7 4.9
Waste 1.2 1.1 1.0 0.9 0.8 1.2 1.1 1.0 0.9 0.8
Emissions Trading System (stationary installations)
8.2 9.4 10.4 11.2 11.7 8.2 8.1 8.0 8.0 8.3
Effort Sharing Decision 16.8 17.2 18.1 18.9 19.7 16.8 16.0 16.5 16.9 17.4
Land use, land-use change and forestry – 8.3 – 8.3 – 8.4 – 8.4 – 8.4 – 8.3 – 8.3 – 8.4 – 8.4 – 8.4
Note: Reported projections calibrated by EEA to align them with historic emissions.
Cyprus 2015 2020 2025 2030 2035 2015 2020 2025 2030 2035
Total GHG emissions 5.8 4.5 5.6 6.6 7.6 5.6 4.0 5.0 6.1 7.1
Energy supply 2.0 0.6 1.1 1.5 1.9 1.8 0.1 0.6 1.0 1.4
Manufacturing and construction industries
0.3 0.4 0.4 0.5 0.5 0.3 0.4 0.4 0.5 0.5
Transport 1.4 1.5 1.7 1.9 2.1 1.4 1.4 1.6 1.8 2.0
Residential and commercial 0.4 0.3 0.4 0.5 0.6 0.4 0.5 0.6 0.6 0.7
Industrial processes and process use 0.8 0.9 1.0 1.2 1.3 0.8 0.9 1.0 1.2 1.3
Agriculture 0.5 0.6 0.7 0.8 0.9 0.5 0.6 0.7 0.8 0.9
Waste 0.3 0.2 0.2 0.3 0.3 0.3 0.1 0.2 0.2 0.3
Emissions Trading System (stationary installations)
2.9 1.6 2.2 2.7 3.2 2.7 1.1 1.6 2.1 2.7
Effort Sharing Decision 2.9 2.9 3.4 3.9 4.5 2.9 2.9 3.4 3.9 4.5
Land use, land-use change and forestry – 0.1 – 0.1 – 0.1 – 0.1 – 0.1 – 0.1 – 0.1 – 0.1 – 0.1 – 0.1
Note: Reported projections calibrated by EEA to align them with historic emissions.
Table A2.1 Projected emissions from Member States and Norway, WEM and WAM (cont.)
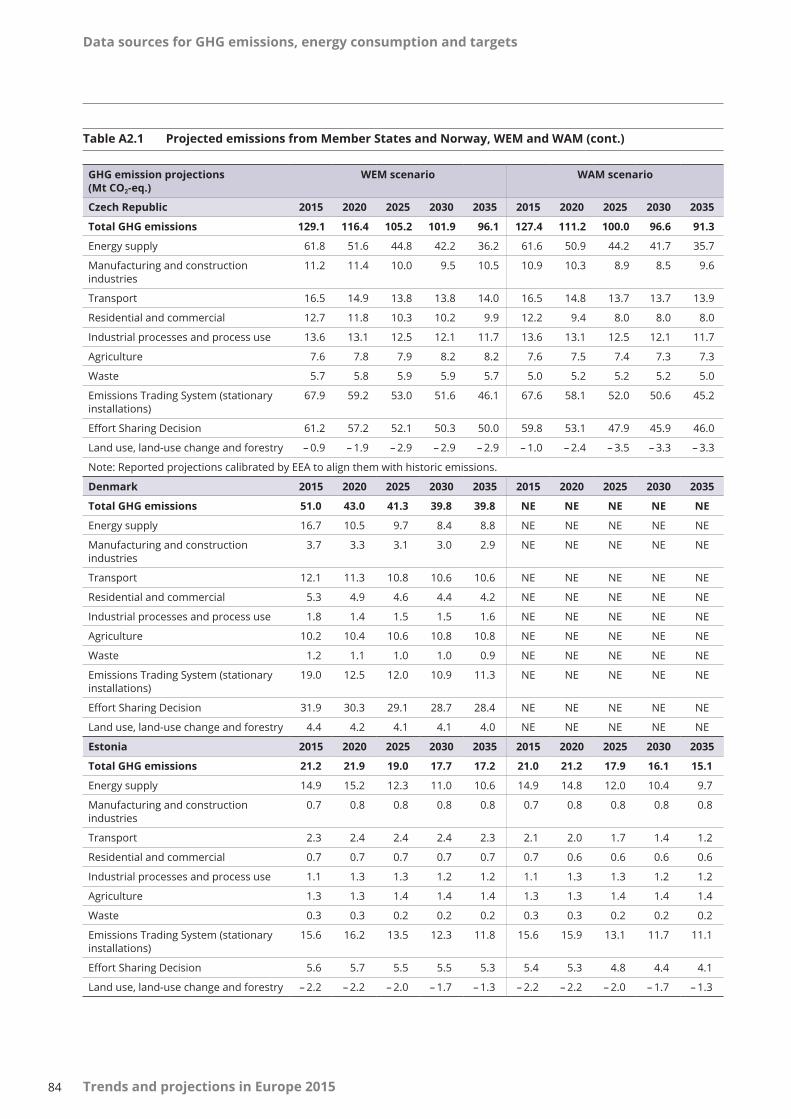
Data sources for GHG emissions, energy consumption and targets
84 Trends and projections in Europe 2015
GHG emission projections (Mt CO2-eq.)
WEM scenario WAM scenario
Czech Republic 2015 2020 2025 2030 2035 2015 2020 2025 2030 2035
Total GHG emissions 129.1 116.4 105.2 101.9 96.1 127.4 111.2 100.0 96.6 91.3
Energy supply 61.8 51.6 44.8 42.2 36.2 61.6 50.9 44.2 41.7 35.7
Manufacturing and construction industries
11.2 11.4 10.0 9.5 10.5 10.9 10.3 8.9 8.5 9.6
Transport 16.5 14.9 13.8 13.8 14.0 16.5 14.8 13.7 13.7 13.9
Residential and commercial 12.7 11.8 10.3 10.2 9.9 12.2 9.4 8.0 8.0 8.0
Industrial processes and process use 13.6 13.1 12.5 12.1 11.7 13.6 13.1 12.5 12.1 11.7
Agriculture 7.6 7.8 7.9 8.2 8.2 7.6 7.5 7.4 7.3 7.3
Waste 5.7 5.8 5.9 5.9 5.7 5.0 5.2 5.2 5.2 5.0
Emissions Trading System (stationary installations)
67.9 59.2 53.0 51.6 46.1 67.6 58.1 52.0 50.6 45.2
Effort Sharing Decision 61.2 57.2 52.1 50.3 50.0 59.8 53.1 47.9 45.9 46.0
Land use, land-use change and forestry – 0.9 – 1.9 – 2.9 – 2.9 – 2.9 – 1.0 – 2.4 – 3.5 – 3.3 – 3.3
Note: Reported projections calibrated by EEA to align them with historic emissions.
Denmark 2015 2020 2025 2030 2035 2015 2020 2025 2030 2035
Total GHG emissions 51.0 43.0 41.3 39.8 39.8 NE NE NE NE NE
Energy supply 16.7 10.5 9.7 8.4 8.8 NE NE NE NE NE
Manufacturing and construction industries
3.7 3.3 3.1 3.0 2.9 NE NE NE NE NE
Transport 12.1 11.3 10.8 10.6 10.6 NE NE NE NE NE
Residential and commercial 5.3 4.9 4.6 4.4 4.2 NE NE NE NE NE
Industrial processes and process use 1.8 1.4 1.5 1.5 1.6 NE NE NE NE NE
Agriculture 10.2 10.4 10.6 10.8 10.8 NE NE NE NE NE
Waste 1.2 1.1 1.0 1.0 0.9 NE NE NE NE NE
Emissions Trading System (stationary installations)
19.0 12.5 12.0 10.9 11.3 NE NE NE NE NE
Effort Sharing Decision 31.9 30.3 29.1 28.7 28.4 NE NE NE NE NE
Land use, land-use change and forestry 4.4 4.2 4.1 4.1 4.0 NE NE NE NE NE
Estonia 2015 2020 2025 2030 2035 2015 2020 2025 2030 2035
Total GHG emissions 21.2 21.9 19.0 17.7 17.2 21.0 21.2 17.9 16.1 15.1
Energy supply 14.9 15.2 12.3 11.0 10.6 14.9 14.8 12.0 10.4 9.7
Manufacturing and construction industries
0.7 0.8 0.8 0.8 0.8 0.7 0.8 0.8 0.8 0.8
Transport 2.3 2.4 2.4 2.4 2.3 2.1 2.0 1.7 1.4 1.2
Residential and commercial 0.7 0.7 0.7 0.7 0.7 0.7 0.6 0.6 0.6 0.6
Industrial processes and process use 1.1 1.3 1.3 1.2 1.2 1.1 1.3 1.3 1.2 1.2
Agriculture 1.3 1.3 1.4 1.4 1.4 1.3 1.3 1.4 1.4 1.4
Waste 0.3 0.3 0.2 0.2 0.2 0.3 0.3 0.2 0.2 0.2
Emissions Trading System (stationary installations)
15.6 16.2 13.5 12.3 11.8 15.6 15.9 13.1 11.7 11.1
Effort Sharing Decision 5.6 5.7 5.5 5.5 5.3 5.4 5.3 4.8 4.4 4.1
Land use, land-use change and forestry – 2.2 – 2.2 – 2.0 – 1.7 – 1.3 – 2.2 – 2.2 – 2.0 – 1.7 – 1.3
Table A2.1 Projected emissions from Member States and Norway, WEM and WAM (cont.)

Data sources for GHG emissions, energy consumption and targets
85Trends and projections in Europe 2015
GHG emission projections (Mt CO2-eq.)
WEM scenario WAM scenario
Finland 2015 2020 2025 2030 2035 2015 2020 2025 2030 2035
Total GHG emissions 66.6 63.8 56.8 49.8 53.7 66.5 63.6 56.5 49.3 53.0
Energy supply 27.6 26.0 20.4 14.7 19.6 27.6 26.0 20.4 14.7 19.6
Manufacturing and construction industries
8.2 8.1 7.8 7.6 7.3 8.2 8.1 7.8 7.6 7.3
Transport 12.4 11.7 11.1 10.5 9.8 12.4 11.7 11.1 10.5 9.8
Residential and commercial 4.9 4.3 3.9 3.6 3.5 4.9 4.3 3.9 3.6 3.5
Industrial processes and process use 5.5 5.9 6.0 6.1 6.3 5.5 5.8 5.8 5.8 5.7
Agriculture 6.1 6.3 6.4 6.4 6.4 6.1 6.2 6.2 6.2 6.3
Waste 2.0 1.5 1.2 1.0 0.8 2.0 1.5 1.2 1.0 0.8
Emissions Trading System (stationary installations)
36.5 35.1 29.5 23.6 28.3 36.5 35.1 29.5 23.6 28.3
Effort Sharing Decision 29.9 28.4 27.0 25.9 25.1 29.8 28.2 26.7 25.3 24.5
Land-use, land-use change and forestry – 10.0 – 9.5 – 3.8 – 3.4 – 3.4 – 10.1 – 9.9 – 4.2 – 3.8 – 3.9
France 2015 2020 2025 2030 2035 2015 2020 2025 2030 2035
Total GHG emissions 477.6 467.5 465.1 466.8 470.3 NE NE NE NE NE
Energy supply 61.7 65.9 73.6 82.9 88.4 NE NE NE NE NE
Manufacturing and construction industries
58.7 57.4 56.1 54.9 54.9 NE NE NE NE NE
Transport 132.2 129.7 129.5 129.3 131.3 NE NE NE NE NE
Residential and commercial 85.1 76.9 72.3 67.8 64.1 NE NE NE NE NE
Industrial processes and process use 41.6 41.1 38.3 37.2 37.6 NE NE NE NE NE
Agriculture 78.8 78.4 78.6 78.5 78.2 NE NE NE NE NE
Waste 19.5 18.1 16.8 16.2 15.6 NE NE NE NE NE
Emissions Trading System (stationary installations)
113.2 116.4 122.1 129.7 134.6 NE NE NE NE NE
Effort Sharing Decision 359.2 345.8 337.4 331.3 329.6 NE NE NE NE NE
Land use, land-use change and forestry – 53.8 – 61.6 – 68.1 – 74.4 – 78.7 NE NE NE NE NE
Germany 2015 2020 2025 2030 2035 2015 2020 2025 2030 2035
Total GHG emissions 900.8 833.2 782.6 707.3 642.9 NE NE NE NE NE
Energy supply 350.7 313.1 297.8 254.5 212.6 NE NE NE NE NE
Manufacturing and construction industries
119.2 114.8 108.8 104.1 100.3 NE NE NE NE NE
Transport 154.8 148.1 140.0 132.7 126.5 NE NE NE NE NE
Residential and commercial 134.1 119.3 105.3 93.7 83.2 NE NE NE NE NE
Industrial processes and process use 70.8 67.5 61.1 53.3 51.6 NE NE NE NE NE
Agriculture 60.3 61.3 61.7 62.1 62.5 NE NE NE NE NE
Waste 11.0 9.1 7.8 6.9 6.1 NE NE NE NE NE
Emissions Trading System (stationary installations)
454.4 409.8 386.5 336.4 290.1 NE NE NE NE NE
Effort Sharing Decision 444.6 421.7 394.3 369.3 351.2 NE NE NE NE NE
Land use, land-use change and forestry – 15.7 – 15.7 – 15.7 – 15.7 – 15.7 NE NE NE NE NE
Greece 2015 2020 2025 2030 2035 2015 2020 2025 2030 2035
Total GHG emissions 98.0 87.9 75.0 64.3 57.4 NE NE NE NE NE
Energy supply 47.6 40.7 29.9 20.3 13.3 NE NE NE NE NE
Table A2.1 Projected emissions from Member States and Norway, WEM and WAM (cont.)
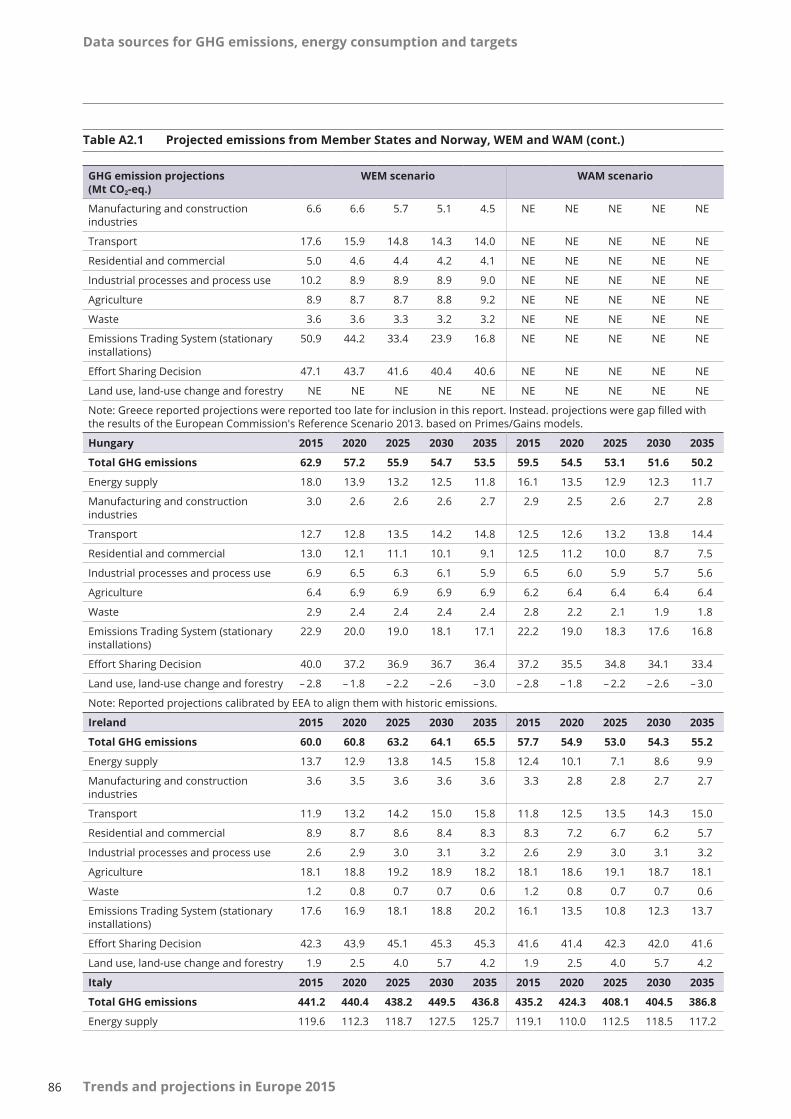
Data sources for GHG emissions, energy consumption and targets
86 Trends and projections in Europe 2015
GHG emission projections (Mt CO2-eq.)
WEM scenario WAM scenario
Manufacturing and construction industries
6.6 6.6 5.7 5.1 4.5 NE NE NE NE NE
Transport 17.6 15.9 14.8 14.3 14.0 NE NE NE NE NE
Residential and commercial 5.0 4.6 4.4 4.2 4.1 NE NE NE NE NE
Industrial processes and process use 10.2 8.9 8.9 8.9 9.0 NE NE NE NE NE
Agriculture 8.9 8.7 8.7 8.8 9.2 NE NE NE NE NE
Waste 3.6 3.6 3.3 3.2 3.2 NE NE NE NE NE
Emissions Trading System (stationary installations)
50.9 44.2 33.4 23.9 16.8 NE NE NE NE NE
Effort Sharing Decision 47.1 43.7 41.6 40.4 40.6 NE NE NE NE NE
Land use, land-use change and forestry NE NE NE NE NE NE NE NE NE NE
Note: Greece reported projections were reported too late for inclusion in this report. Instead. projections were gap filled with the results of the European Commission's Reference Scenario 2013. based on Primes/Gains models.
Hungary 2015 2020 2025 2030 2035 2015 2020 2025 2030 2035
Total GHG emissions 62.9 57.2 55.9 54.7 53.5 59.5 54.5 53.1 51.6 50.2
Energy supply 18.0 13.9 13.2 12.5 11.8 16.1 13.5 12.9 12.3 11.7
Manufacturing and construction industries
3.0 2.6 2.6 2.6 2.7 2.9 2.5 2.6 2.7 2.8
Transport 12.7 12.8 13.5 14.2 14.8 12.5 12.6 13.2 13.8 14.4
Residential and commercial 13.0 12.1 11.1 10.1 9.1 12.5 11.2 10.0 8.7 7.5
Industrial processes and process use 6.9 6.5 6.3 6.1 5.9 6.5 6.0 5.9 5.7 5.6
Agriculture 6.4 6.9 6.9 6.9 6.9 6.2 6.4 6.4 6.4 6.4
Waste 2.9 2.4 2.4 2.4 2.4 2.8 2.2 2.1 1.9 1.8
Emissions Trading System (stationary installations)
22.9 20.0 19.0 18.1 17.1 22.2 19.0 18.3 17.6 16.8
Effort Sharing Decision 40.0 37.2 36.9 36.7 36.4 37.2 35.5 34.8 34.1 33.4
Land use, land-use change and forestry – 2.8 – 1.8 – 2.2 – 2.6 – 3.0 – 2.8 – 1.8 – 2.2 – 2.6 – 3.0
Note: Reported projections calibrated by EEA to align them with historic emissions.
Ireland 2015 2020 2025 2030 2035 2015 2020 2025 2030 2035
Total GHG emissions 60.0 60.8 63.2 64.1 65.5 57.7 54.9 53.0 54.3 55.2
Energy supply 13.7 12.9 13.8 14.5 15.8 12.4 10.1 7.1 8.6 9.9
Manufacturing and construction industries
3.6 3.5 3.6 3.6 3.6 3.3 2.8 2.8 2.7 2.7
Transport 11.9 13.2 14.2 15.0 15.8 11.8 12.5 13.5 14.3 15.0
Residential and commercial 8.9 8.7 8.6 8.4 8.3 8.3 7.2 6.7 6.2 5.7
Industrial processes and process use 2.6 2.9 3.0 3.1 3.2 2.6 2.9 3.0 3.1 3.2
Agriculture 18.1 18.8 19.2 18.9 18.2 18.1 18.6 19.1 18.7 18.1
Waste 1.2 0.8 0.7 0.7 0.6 1.2 0.8 0.7 0.7 0.6
Emissions Trading System (stationary installations)
17.6 16.9 18.1 18.8 20.2 16.1 13.5 10.8 12.3 13.7
Effort Sharing Decision 42.3 43.9 45.1 45.3 45.3 41.6 41.4 42.3 42.0 41.6
Land use, land-use change and forestry 1.9 2.5 4.0 5.7 4.2 1.9 2.5 4.0 5.7 4.2
Italy 2015 2020 2025 2030 2035 2015 2020 2025 2030 2035
Total GHG emissions 441.2 440.4 438.2 449.5 436.8 435.2 424.3 408.1 404.5 386.8
Energy supply 119.6 112.3 118.7 127.5 125.7 119.1 110.0 112.5 118.5 117.2
Table A2.1 Projected emissions from Member States and Norway, WEM and WAM (cont.)
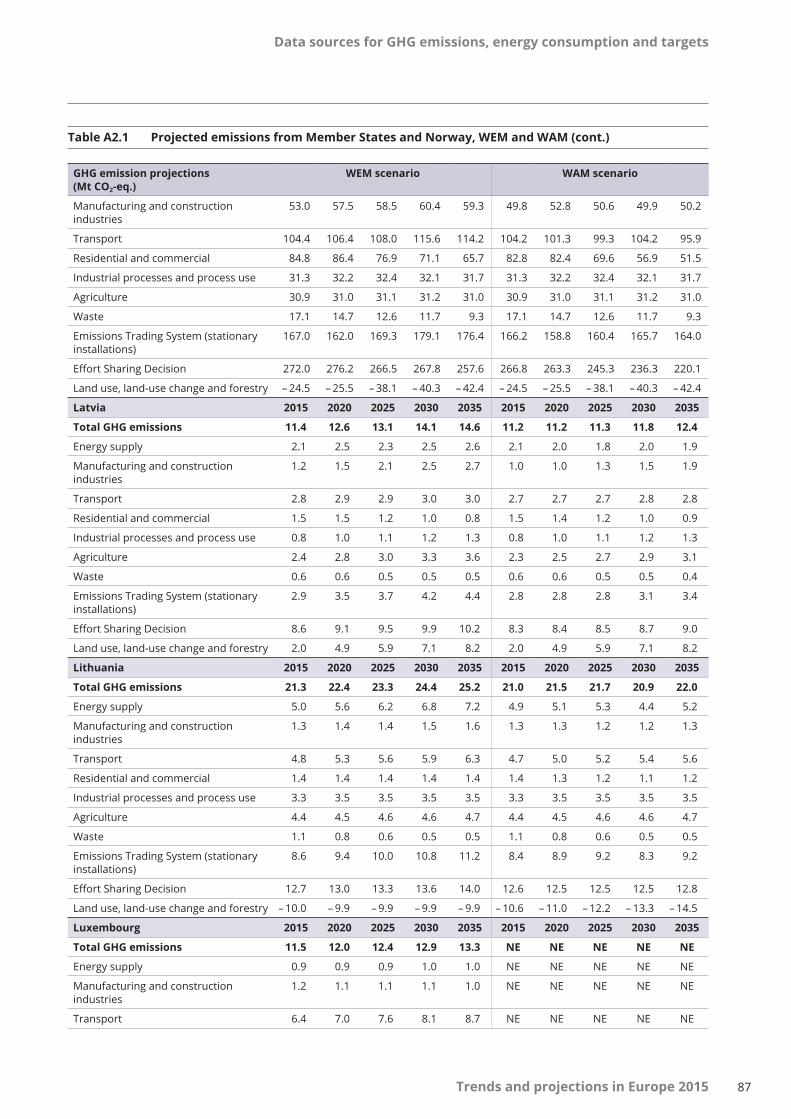
Data sources for GHG emissions, energy consumption and targets
87Trends and projections in Europe 2015
GHG emission projections (Mt CO2-eq.)
WEM scenario WAM scenario
Manufacturing and construction industries
53.0 57.5 58.5 60.4 59.3 49.8 52.8 50.6 49.9 50.2
Transport 104.4 106.4 108.0 115.6 114.2 104.2 101.3 99.3 104.2 95.9
Residential and commercial 84.8 86.4 76.9 71.1 65.7 82.8 82.4 69.6 56.9 51.5
Industrial processes and process use 31.3 32.2 32.4 32.1 31.7 31.3 32.2 32.4 32.1 31.7
Agriculture 30.9 31.0 31.1 31.2 31.0 30.9 31.0 31.1 31.2 31.0
Waste 17.1 14.7 12.6 11.7 9.3 17.1 14.7 12.6 11.7 9.3
Emissions Trading System (stationary installations)
167.0 162.0 169.3 179.1 176.4 166.2 158.8 160.4 165.7 164.0
Effort Sharing Decision 272.0 276.2 266.5 267.8 257.6 266.8 263.3 245.3 236.3 220.1
Land use, land-use change and forestry – 24.5 – 25.5 – 38.1 – 40.3 – 42.4 – 24.5 – 25.5 – 38.1 – 40.3 – 42.4
Latvia 2015 2020 2025 2030 2035 2015 2020 2025 2030 2035
Total GHG emissions 11.4 12.6 13.1 14.1 14.6 11.2 11.2 11.3 11.8 12.4
Energy supply 2.1 2.5 2.3 2.5 2.6 2.1 2.0 1.8 2.0 1.9
Manufacturing and construction industries
1.2 1.5 2.1 2.5 2.7 1.0 1.0 1.3 1.5 1.9
Transport 2.8 2.9 2.9 3.0 3.0 2.7 2.7 2.7 2.8 2.8
Residential and commercial 1.5 1.5 1.2 1.0 0.8 1.5 1.4 1.2 1.0 0.9
Industrial processes and process use 0.8 1.0 1.1 1.2 1.3 0.8 1.0 1.1 1.2 1.3
Agriculture 2.4 2.8 3.0 3.3 3.6 2.3 2.5 2.7 2.9 3.1
Waste 0.6 0.6 0.5 0.5 0.5 0.6 0.6 0.5 0.5 0.4
Emissions Trading System (stationary installations)
2.9 3.5 3.7 4.2 4.4 2.8 2.8 2.8 3.1 3.4
Effort Sharing Decision 8.6 9.1 9.5 9.9 10.2 8.3 8.4 8.5 8.7 9.0
Land use, land-use change and forestry 2.0 4.9 5.9 7.1 8.2 2.0 4.9 5.9 7.1 8.2
Lithuania 2015 2020 2025 2030 2035 2015 2020 2025 2030 2035
Total GHG emissions 21.3 22.4 23.3 24.4 25.2 21.0 21.5 21.7 20.9 22.0
Energy supply 5.0 5.6 6.2 6.8 7.2 4.9 5.1 5.3 4.4 5.2
Manufacturing and construction industries
1.3 1.4 1.4 1.5 1.6 1.3 1.3 1.2 1.2 1.3
Transport 4.8 5.3 5.6 5.9 6.3 4.7 5.0 5.2 5.4 5.6
Residential and commercial 1.4 1.4 1.4 1.4 1.4 1.4 1.3 1.2 1.1 1.2
Industrial processes and process use 3.3 3.5 3.5 3.5 3.5 3.3 3.5 3.5 3.5 3.5
Agriculture 4.4 4.5 4.6 4.6 4.7 4.4 4.5 4.6 4.6 4.7
Waste 1.1 0.8 0.6 0.5 0.5 1.1 0.8 0.6 0.5 0.5
Emissions Trading System (stationary installations)
8.6 9.4 10.0 10.8 11.2 8.4 8.9 9.2 8.3 9.2
Effort Sharing Decision 12.7 13.0 13.3 13.6 14.0 12.6 12.5 12.5 12.5 12.8
Land use, land-use change and forestry – 10.0 – 9.9 – 9.9 – 9.9 – 9.9 – 10.6 – 11.0 – 12.2 – 13.3 – 14.5
Luxembourg 2015 2020 2025 2030 2035 2015 2020 2025 2030 2035
Total GHG emissions 11.5 12.0 12.4 12.9 13.3 NE NE NE NE NE
Energy supply 0.9 0.9 0.9 1.0 1.0 NE NE NE NE NE
Manufacturing and construction industries
1.2 1.1 1.1 1.1 1.0 NE NE NE NE NE
Transport 6.4 7.0 7.6 8.1 8.7 NE NE NE NE NE
Table A2.1 Projected emissions from Member States and Norway, WEM and WAM (cont.)
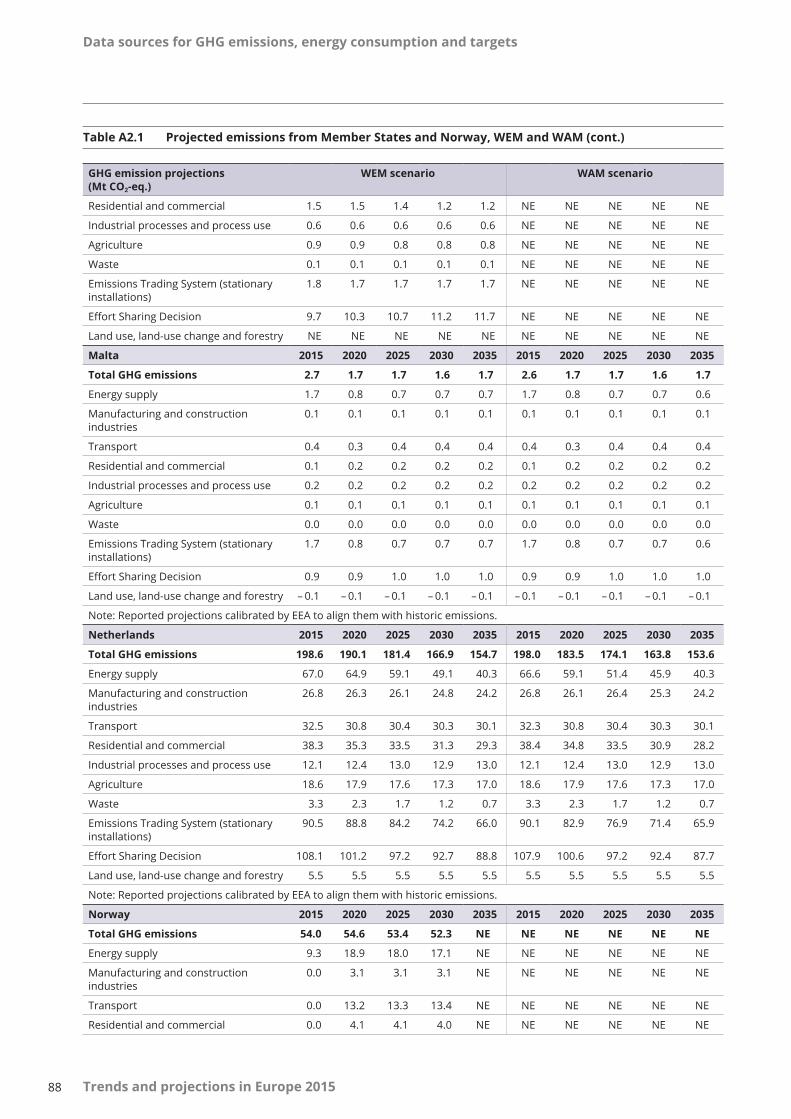
Data sources for GHG emissions, energy consumption and targets
88 Trends and projections in Europe 2015
GHG emission projections (Mt CO2-eq.)
WEM scenario WAM scenario
Residential and commercial 1.5 1.5 1.4 1.2 1.2 NE NE NE NE NE
Industrial processes and process use 0.6 0.6 0.6 0.6 0.6 NE NE NE NE NE
Agriculture 0.9 0.9 0.8 0.8 0.8 NE NE NE NE NE
Waste 0.1 0.1 0.1 0.1 0.1 NE NE NE NE NE
Emissions Trading System (stationary installations)
1.8 1.7 1.7 1.7 1.7 NE NE NE NE NE
Effort Sharing Decision 9.7 10.3 10.7 11.2 11.7 NE NE NE NE NE
Land use, land-use change and forestry NE NE NE NE NE NE NE NE NE NE
Malta 2015 2020 2025 2030 2035 2015 2020 2025 2030 2035
Total GHG emissions 2.7 1.7 1.7 1.6 1.7 2.6 1.7 1.7 1.6 1.7
Energy supply 1.7 0.8 0.7 0.7 0.7 1.7 0.8 0.7 0.7 0.6
Manufacturing and construction industries
0.1 0.1 0.1 0.1 0.1 0.1 0.1 0.1 0.1 0.1
Transport 0.4 0.3 0.4 0.4 0.4 0.4 0.3 0.4 0.4 0.4
Residential and commercial 0.1 0.2 0.2 0.2 0.2 0.1 0.2 0.2 0.2 0.2
Industrial processes and process use 0.2 0.2 0.2 0.2 0.2 0.2 0.2 0.2 0.2 0.2
Agriculture 0.1 0.1 0.1 0.1 0.1 0.1 0.1 0.1 0.1 0.1
Waste 0.0 0.0 0.0 0.0 0.0 0.0 0.0 0.0 0.0 0.0
Emissions Trading System (stationary installations)
1.7 0.8 0.7 0.7 0.7 1.7 0.8 0.7 0.7 0.6
Effort Sharing Decision 0.9 0.9 1.0 1.0 1.0 0.9 0.9 1.0 1.0 1.0
Land use, land-use change and forestry – 0.1 – 0.1 – 0.1 – 0.1 – 0.1 – 0.1 – 0.1 – 0.1 – 0.1 – 0.1
Note: Reported projections calibrated by EEA to align them with historic emissions.
Netherlands 2015 2020 2025 2030 2035 2015 2020 2025 2030 2035
Total GHG emissions 198.6 190.1 181.4 166.9 154.7 198.0 183.5 174.1 163.8 153.6
Energy supply 67.0 64.9 59.1 49.1 40.3 66.6 59.1 51.4 45.9 40.3
Manufacturing and construction industries
26.8 26.3 26.1 24.8 24.2 26.8 26.1 26.4 25.3 24.2
Transport 32.5 30.8 30.4 30.3 30.1 32.3 30.8 30.4 30.3 30.1
Residential and commercial 38.3 35.3 33.5 31.3 29.3 38.4 34.8 33.5 30.9 28.2
Industrial processes and process use 12.1 12.4 13.0 12.9 13.0 12.1 12.4 13.0 12.9 13.0
Agriculture 18.6 17.9 17.6 17.3 17.0 18.6 17.9 17.6 17.3 17.0
Waste 3.3 2.3 1.7 1.2 0.7 3.3 2.3 1.7 1.2 0.7
Emissions Trading System (stationary installations)
90.5 88.8 84.2 74.2 66.0 90.1 82.9 76.9 71.4 65.9
Effort Sharing Decision 108.1 101.2 97.2 92.7 88.8 107.9 100.6 97.2 92.4 87.7
Land use, land-use change and forestry 5.5 5.5 5.5 5.5 5.5 5.5 5.5 5.5 5.5 5.5
Note: Reported projections calibrated by EEA to align them with historic emissions.
Norway 2015 2020 2025 2030 2035 2015 2020 2025 2030 2035
Total GHG emissions 54.0 54.6 53.4 52.3 NE NE NE NE NE NE
Energy supply 9.3 18.9 18.0 17.1 NE NE NE NE NE NE
Manufacturing and construction industries
0.0 3.1 3.1 3.1 NE NE NE NE NE NE
Transport 0.0 13.2 13.3 13.4 NE NE NE NE NE NE
Residential and commercial 0.0 4.1 4.1 4.0 NE NE NE NE NE NE
Table A2.1 Projected emissions from Member States and Norway, WEM and WAM (cont.)
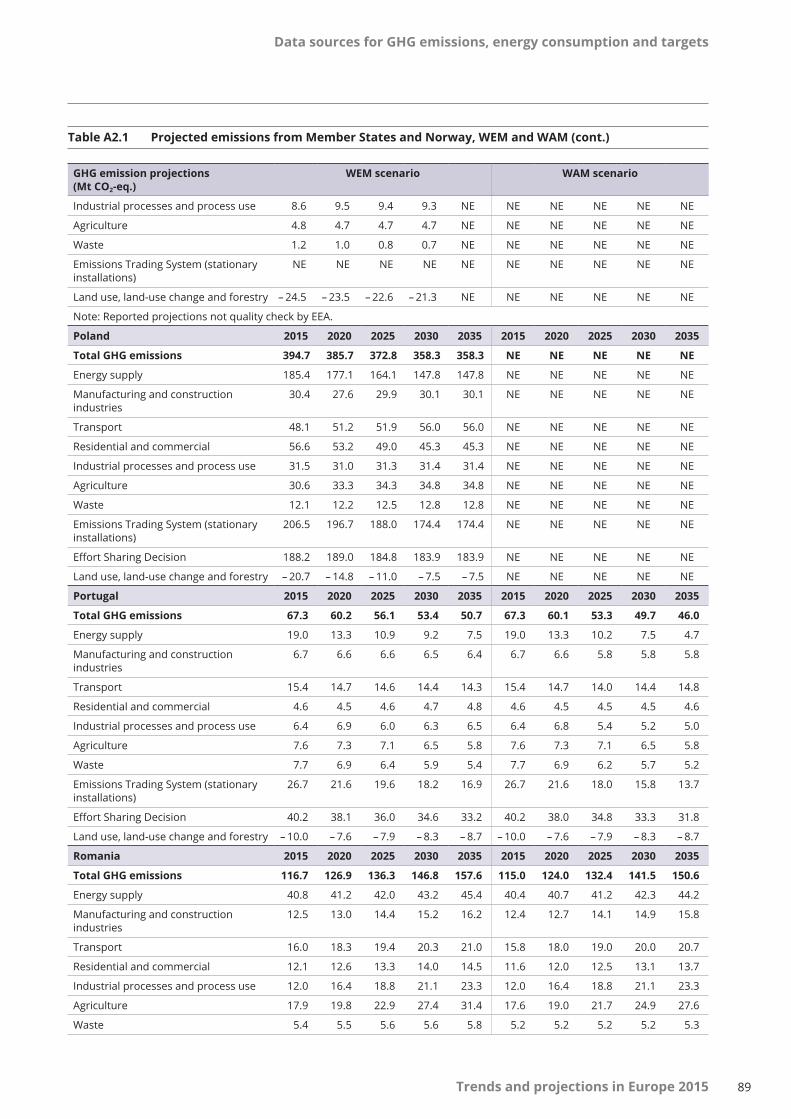
Data sources for GHG emissions, energy consumption and targets
89Trends and projections in Europe 2015
GHG emission projections (Mt CO2-eq.)
WEM scenario WAM scenario
Industrial processes and process use 8.6 9.5 9.4 9.3 NE NE NE NE NE NE
Agriculture 4.8 4.7 4.7 4.7 NE NE NE NE NE NE
Waste 1.2 1.0 0.8 0.7 NE NE NE NE NE NE
Emissions Trading System (stationary installations)
NE NE NE NE NE NE NE NE NE NE
Land use, land-use change and forestry – 24.5 – 23.5 – 22.6 – 21.3 NE NE NE NE NE NE
Note: Reported projections not quality check by EEA.
Poland 2015 2020 2025 2030 2035 2015 2020 2025 2030 2035
Total GHG emissions 394.7 385.7 372.8 358.3 358.3 NE NE NE NE NE
Energy supply 185.4 177.1 164.1 147.8 147.8 NE NE NE NE NE
Manufacturing and construction industries
30.4 27.6 29.9 30.1 30.1 NE NE NE NE NE
Transport 48.1 51.2 51.9 56.0 56.0 NE NE NE NE NE
Residential and commercial 56.6 53.2 49.0 45.3 45.3 NE NE NE NE NE
Industrial processes and process use 31.5 31.0 31.3 31.4 31.4 NE NE NE NE NE
Agriculture 30.6 33.3 34.3 34.8 34.8 NE NE NE NE NE
Waste 12.1 12.2 12.5 12.8 12.8 NE NE NE NE NE
Emissions Trading System (stationary installations)
206.5 196.7 188.0 174.4 174.4 NE NE NE NE NE
Effort Sharing Decision 188.2 189.0 184.8 183.9 183.9 NE NE NE NE NE
Land use, land-use change and forestry – 20.7 – 14.8 – 11.0 – 7.5 – 7.5 NE NE NE NE NE
Portugal 2015 2020 2025 2030 2035 2015 2020 2025 2030 2035
Total GHG emissions 67.3 60.2 56.1 53.4 50.7 67.3 60.1 53.3 49.7 46.0
Energy supply 19.0 13.3 10.9 9.2 7.5 19.0 13.3 10.2 7.5 4.7
Manufacturing and construction industries
6.7 6.6 6.6 6.5 6.4 6.7 6.6 5.8 5.8 5.8
Transport 15.4 14.7 14.6 14.4 14.3 15.4 14.7 14.0 14.4 14.8
Residential and commercial 4.6 4.5 4.6 4.7 4.8 4.6 4.5 4.5 4.5 4.6
Industrial processes and process use 6.4 6.9 6.0 6.3 6.5 6.4 6.8 5.4 5.2 5.0
Agriculture 7.6 7.3 7.1 6.5 5.8 7.6 7.3 7.1 6.5 5.8
Waste 7.7 6.9 6.4 5.9 5.4 7.7 6.9 6.2 5.7 5.2
Emissions Trading System (stationary installations)
26.7 21.6 19.6 18.2 16.9 26.7 21.6 18.0 15.8 13.7
Effort Sharing Decision 40.2 38.1 36.0 34.6 33.2 40.2 38.0 34.8 33.3 31.8
Land use, land-use change and forestry – 10.0 – 7.6 – 7.9 – 8.3 – 8.7 – 10.0 – 7.6 – 7.9 – 8.3 – 8.7
Romania 2015 2020 2025 2030 2035 2015 2020 2025 2030 2035
Total GHG emissions 116.7 126.9 136.3 146.8 157.6 115.0 124.0 132.4 141.5 150.6
Energy supply 40.8 41.2 42.0 43.2 45.4 40.4 40.7 41.2 42.3 44.2
Manufacturing and construction industries
12.5 13.0 14.4 15.2 16.2 12.4 12.7 14.1 14.9 15.8
Transport 16.0 18.3 19.4 20.3 21.0 15.8 18.0 19.0 20.0 20.7
Residential and commercial 12.1 12.6 13.3 14.0 14.5 11.6 12.0 12.5 13.1 13.7
Industrial processes and process use 12.0 16.4 18.8 21.1 23.3 12.0 16.4 18.8 21.1 23.3
Agriculture 17.9 19.8 22.9 27.4 31.4 17.6 19.0 21.7 24.9 27.6
Waste 5.4 5.5 5.6 5.6 5.8 5.2 5.2 5.2 5.2 5.3
Table A2.1 Projected emissions from Member States and Norway, WEM and WAM (cont.)
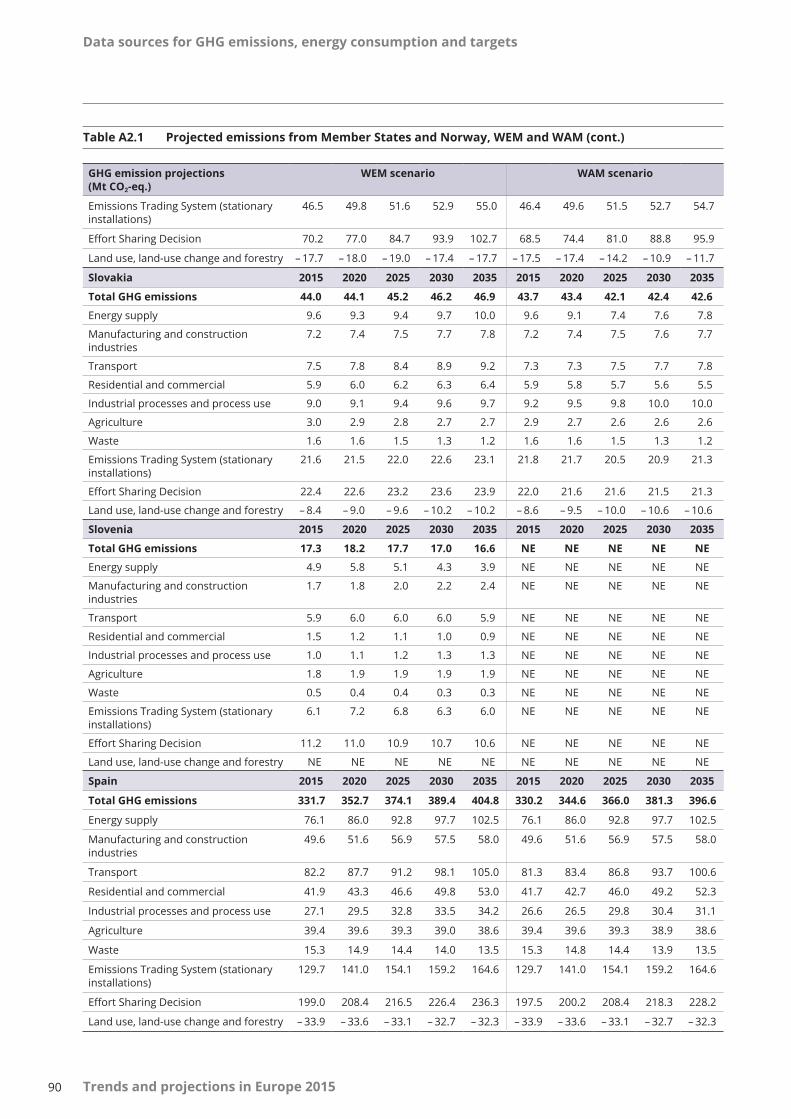
Data sources for GHG emissions, energy consumption and targets
90 Trends and projections in Europe 2015
GHG emission projections (Mt CO2-eq.)
WEM scenario WAM scenario
Emissions Trading System (stationary installations)
46.5 49.8 51.6 52.9 55.0 46.4 49.6 51.5 52.7 54.7
Effort Sharing Decision 70.2 77.0 84.7 93.9 102.7 68.5 74.4 81.0 88.8 95.9
Land use, land-use change and forestry – 17.7 – 18.0 – 19.0 – 17.4 – 17.7 – 17.5 – 17.4 – 14.2 – 10.9 – 11.7
Slovakia 2015 2020 2025 2030 2035 2015 2020 2025 2030 2035
Total GHG emissions 44.0 44.1 45.2 46.2 46.9 43.7 43.4 42.1 42.4 42.6
Energy supply 9.6 9.3 9.4 9.7 10.0 9.6 9.1 7.4 7.6 7.8
Manufacturing and construction industries
7.2 7.4 7.5 7.7 7.8 7.2 7.4 7.5 7.6 7.7
Transport 7.5 7.8 8.4 8.9 9.2 7.3 7.3 7.5 7.7 7.8
Residential and commercial 5.9 6.0 6.2 6.3 6.4 5.9 5.8 5.7 5.6 5.5
Industrial processes and process use 9.0 9.1 9.4 9.6 9.7 9.2 9.5 9.8 10.0 10.0
Agriculture 3.0 2.9 2.8 2.7 2.7 2.9 2.7 2.6 2.6 2.6
Waste 1.6 1.6 1.5 1.3 1.2 1.6 1.6 1.5 1.3 1.2
Emissions Trading System (stationary installations)
21.6 21.5 22.0 22.6 23.1 21.8 21.7 20.5 20.9 21.3
Effort Sharing Decision 22.4 22.6 23.2 23.6 23.9 22.0 21.6 21.6 21.5 21.3
Land use, land-use change and forestry – 8.4 – 9.0 – 9.6 – 10.2 – 10.2 – 8.6 – 9.5 – 10.0 – 10.6 – 10.6
Slovenia 2015 2020 2025 2030 2035 2015 2020 2025 2030 2035
Total GHG emissions 17.3 18.2 17.7 17.0 16.6 NE NE NE NE NE
Energy supply 4.9 5.8 5.1 4.3 3.9 NE NE NE NE NE
Manufacturing and construction industries
1.7 1.8 2.0 2.2 2.4 NE NE NE NE NE
Transport 5.9 6.0 6.0 6.0 5.9 NE NE NE NE NE
Residential and commercial 1.5 1.2 1.1 1.0 0.9 NE NE NE NE NE
Industrial processes and process use 1.0 1.1 1.2 1.3 1.3 NE NE NE NE NE
Agriculture 1.8 1.9 1.9 1.9 1.9 NE NE NE NE NE
Waste 0.5 0.4 0.4 0.3 0.3 NE NE NE NE NE
Emissions Trading System (stationary installations)
6.1 7.2 6.8 6.3 6.0 NE NE NE NE NE
Effort Sharing Decision 11.2 11.0 10.9 10.7 10.6 NE NE NE NE NE
Land use, land-use change and forestry NE NE NE NE NE NE NE NE NE NE
Spain 2015 2020 2025 2030 2035 2015 2020 2025 2030 2035
Total GHG emissions 331.7 352.7 374.1 389.4 404.8 330.2 344.6 366.0 381.3 396.6
Energy supply 76.1 86.0 92.8 97.7 102.5 76.1 86.0 92.8 97.7 102.5
Manufacturing and construction industries
49.6 51.6 56.9 57.5 58.0 49.6 51.6 56.9 57.5 58.0
Transport 82.2 87.7 91.2 98.1 105.0 81.3 83.4 86.8 93.7 100.6
Residential and commercial 41.9 43.3 46.6 49.8 53.0 41.7 42.7 46.0 49.2 52.3
Industrial processes and process use 27.1 29.5 32.8 33.5 34.2 26.6 26.5 29.8 30.4 31.1
Agriculture 39.4 39.6 39.3 39.0 38.6 39.4 39.6 39.3 38.9 38.6
Waste 15.3 14.9 14.4 14.0 13.5 15.3 14.8 14.4 13.9 13.5
Emissions Trading System (stationary installations)
129.7 141.0 154.1 159.2 164.6 129.7 141.0 154.1 159.2 164.6
Effort Sharing Decision 199.0 208.4 216.5 226.4 236.3 197.5 200.2 208.4 218.3 228.2
Land use, land-use change and forestry – 33.9 – 33.6 – 33.1 – 32.7 – 32.3 – 33.9 – 33.6 – 33.1 – 32.7 – 32.3
Table A2.1 Projected emissions from Member States and Norway, WEM and WAM (cont.)
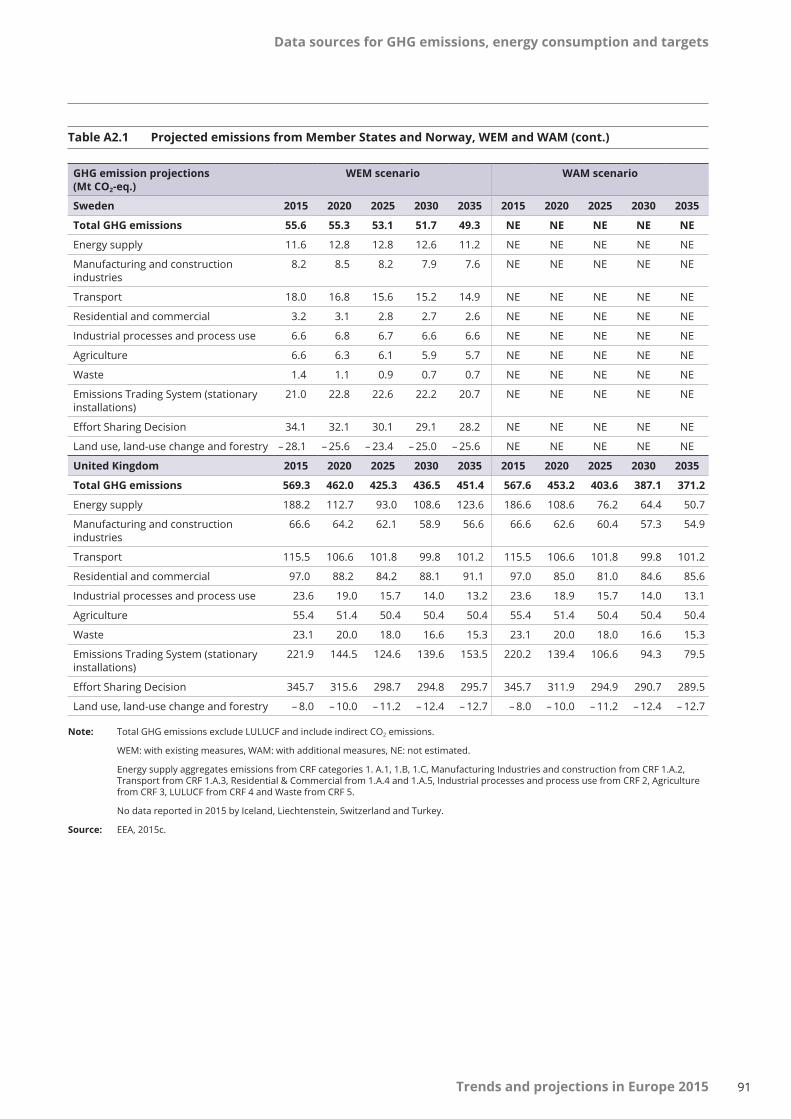
Data sources for GHG emissions, energy consumption and targets
91Trends and projections in Europe 2015
GHG emission projections (Mt CO2-eq.)
WEM scenario WAM scenario
Sweden 2015 2020 2025 2030 2035 2015 2020 2025 2030 2035
Total GHG emissions 55.6 55.3 53.1 51.7 49.3 NE NE NE NE NE
Energy supply 11.6 12.8 12.8 12.6 11.2 NE NE NE NE NE
Manufacturing and construction industries
8.2 8.5 8.2 7.9 7.6 NE NE NE NE NE
Transport 18.0 16.8 15.6 15.2 14.9 NE NE NE NE NE
Residential and commercial 3.2 3.1 2.8 2.7 2.6 NE NE NE NE NE
Industrial processes and process use 6.6 6.8 6.7 6.6 6.6 NE NE NE NE NE
Agriculture 6.6 6.3 6.1 5.9 5.7 NE NE NE NE NE
Waste 1.4 1.1 0.9 0.7 0.7 NE NE NE NE NE
Emissions Trading System (stationary installations)
21.0 22.8 22.6 22.2 20.7 NE NE NE NE NE
Effort Sharing Decision 34.1 32.1 30.1 29.1 28.2 NE NE NE NE NE
Land use, land-use change and forestry – 28.1 – 25.6 – 23.4 – 25.0 – 25.6 NE NE NE NE NE
United Kingdom 2015 2020 2025 2030 2035 2015 2020 2025 2030 2035
Total GHG emissions 569.3 462.0 425.3 436.5 451.4 567.6 453.2 403.6 387.1 371.2
Energy supply 188.2 112.7 93.0 108.6 123.6 186.6 108.6 76.2 64.4 50.7
Manufacturing and construction industries
66.6 64.2 62.1 58.9 56.6 66.6 62.6 60.4 57.3 54.9
Transport 115.5 106.6 101.8 99.8 101.2 115.5 106.6 101.8 99.8 101.2
Residential and commercial 97.0 88.2 84.2 88.1 91.1 97.0 85.0 81.0 84.6 85.6
Industrial processes and process use 23.6 19.0 15.7 14.0 13.2 23.6 18.9 15.7 14.0 13.1
Agriculture 55.4 51.4 50.4 50.4 50.4 55.4 51.4 50.4 50.4 50.4
Waste 23.1 20.0 18.0 16.6 15.3 23.1 20.0 18.0 16.6 15.3
Emissions Trading System (stationary installations)
221.9 144.5 124.6 139.6 153.5 220.2 139.4 106.6 94.3 79.5
Effort Sharing Decision 345.7 315.6 298.7 294.8 295.7 345.7 311.9 294.9 290.7 289.5
Land use, land-use change and forestry – 8.0 – 10.0 – 11.2 – 12.4 – 12.7 – 8.0 – 10.0 – 11.2 – 12.4 – 12.7
Note: Total GHG emissions exclude LULUCF and include indirect CO2 emissions.
WEM: with existing measures, WAM: with additional measures, NE: not estimated.
Energy supply aggregates emissions from CRF categories 1. A.1, 1.B, 1.C, Manufacturing Industries and construction from CRF 1.A.2, Transport from CRF 1.A.3, Residential & Commercial from 1.A.4 and 1.A.5, Industrial processes and process use from CRF 2, Agriculture from CRF 3, LULUCF from CRF 4 and Waste from CRF 5.
No data reported in 2015 by Iceland, Liechtenstein, Switzerland and Turkey.
Source: EEA, 2015c.
Table A2.1 Projected emissions from Member States and Norway, WEM and WAM (cont.)
Data sources for GHG emissions, energy consumption and targets
92 Trends and projections in Europe 2015
QA/QC activities
In order to ensure timeliness, completeness, consistency, comparability, accuracy and transparency of the reporting of projections by the EU and its Member States, the projections reported by Member States and used in the report underwent QA/QC procedures by the EEA.
The QA/QC procedure is described in 'Elements of the Union System for Policies and Measures and ProjectionsandtheQualityAssuranceandControl(QA/QC) Programme as Required under Regulation (EU) No 525/2013' (EC, 2015c). The activities include the recalibration of projected trends on the basis of GHG inventory data, where discrepancies between historic trends and projected trends are observed. When such calibration took place in 2015, national GHG inventory data as of 30 June 2015 were used. Calibrations performed in 2015 were performed against national GHGinventorydatafrom15 January 2014.
Projected ESD emissions
While projections of total emissions are relevant to the assessment of the EU's progress towards its 20% reduction target by 2020, the assessment of the projected progress of Member States towards their national 2020 targets, set under the ESD as part of the climate and energy package, is based on projection dataonemissionsnotcoveredbytheEU ETS,submitted by Member States on a voluntary basis.
All Member States who submitted projections presented separate projections for total GHG emissions, ETS emissions and ESD emissions. All Member States but Poland submitted a split between ETS and ESD emissions at the main source category level.
A2.4 Energy consumption data
The assessment of progress towards RES objectives and targets was for the most part based on information
reported by Member States to Eurostat under the Energy Statistics Regulation and under the RED, and published by Eurostat via its energy statistics database (Eurostat, 2014b) and Eurostat's SHARES tool (Eurostat, 2015a). Targets regarding the RES share in each Member State in 2020 were taken from Part A of Annex I of the RED; indicative trajectories for the 2011-to-2018 period were taken from Part B of Annex I of the RED. Expected national RES trajectories for the 2011-to-2012 period and until 2020 were derived from information submitted by Member States to the European Commission in 2010, in the context of their NREAPs. Additional data published by EurObserv'ER (EurObserv'ER, 2015) were used for the breakdown of the RES share by energy technologies to supplement, where necessary, the data sourced from Eurostat.
The assessment of progress towards energy efficiency objectives was based on the following:
• reported targets under Article 3 of the EED in 2013, including updates of Austria, Bulgaria, Croatia, Cyprus, France, Greece, Italy, Poland, Slovakia, Spain, Sweden and the United Kingdom based on the NEEAP3 submitted in 2014 (or based on separate notifications to the Commission);
• historic numbers are based on Eurostat (2015b, 2015g and 2015h) and EEA (2015f);
• national progress reports submitted by Member States in 2014 in compliance with requirements laid out in Article 24 of the EED;
• national reports prepared under the EU project 'Energy Efficiency Watch' and the final report assessing the quality of the second NEEAPs;
• national reports prepared under the ODYSSEE-MURE project by national experts;
• preliminary primary energy consumption data for the year 2014.
93
Detailed assessment results (progress under the ESD)
Trends and projections in Europe 2015
Annex 3 Detailedassessmentresults(progressundertheESD)
A3.1 Tracking progress towards targets under the ESD
Member States with historic emissions (2013 and 2014) below their annual ESD target and with projections (2015 to 2020) remaining below ESD targets until 2020 are considered to be on track towards their targets under the ESD.
By contrast, Member States with historic emissions (2013 and 2014) higher than their 2013 ESD target or with WEM projections higher than their 2020 target are considered to be not on track towards their targets.
A3.2 Current progress towards targets under the ESD
The assessment of current progress towards 2013 ESD targets is based on a comparison between domestic ESD emissions in 2013 and ESD targets (AEAs) for 2013. This assessment does not take into account the possible use of flexibility options as permitted under the ESD. All the data used for this assessment are consistentwiththescopeoftheEU ETSfortheperiodfrom 2013 to 2020.
The AEA values for the period from 2013 until 2020 were set out in Commission Decision No 2013/162/EU (EC, 2013c) and adjusted according to Commission Implementing Decision No 2013/634/EU (EC, 2013d).
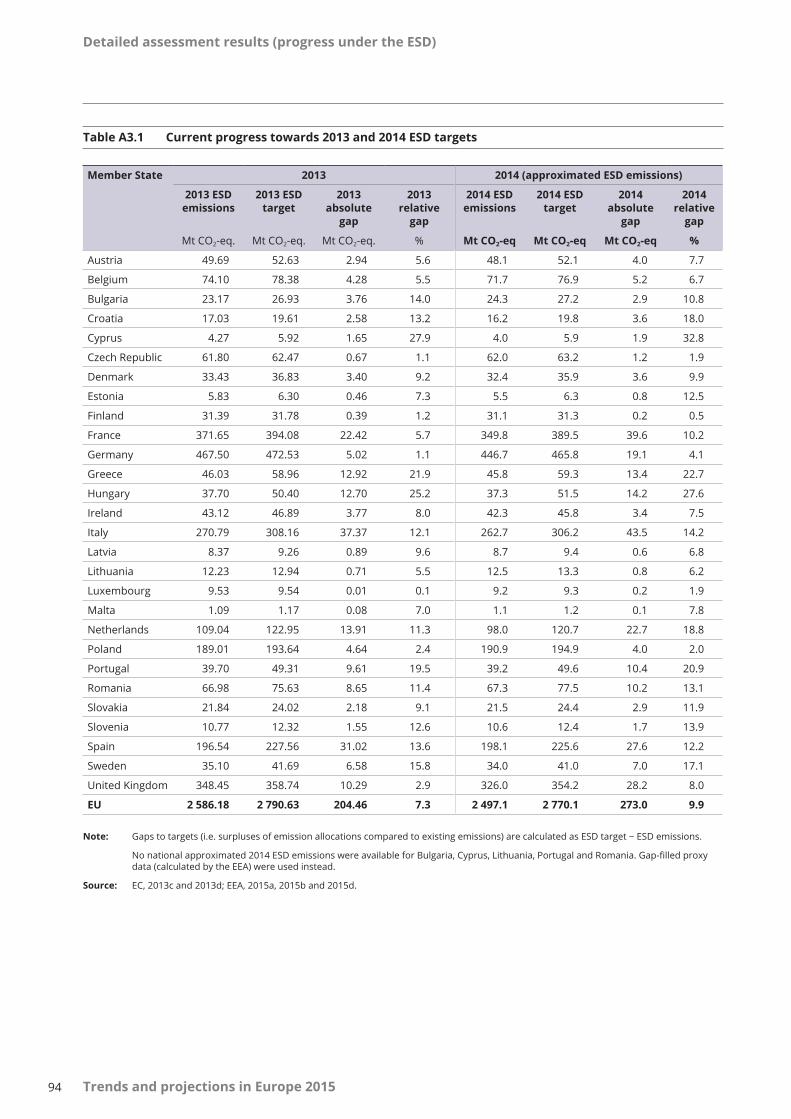
Detailed assessment results (progress under the ESD)
94 Trends and projections in Europe 2015
Table A3.1 Current progress towards 2013 and 2014 ESD targets
Note: Gapstotargets(i.e.surplusesofemissionallocationscomparedtoexistingemissions)arecalculatedasESDtarget − ESDemissions.
Nonationalapproximated2014ESDemissionswereavailableforBulgaria,Cyprus,Lithuania,PortugalandRomania.Gap-filledproxydata (calculated by the EEA) were used instead.
Source: EC, 2013c and 2013d; EEA, 2015a, 2015b and 2015d.
Member State 2013 2014 (approximated ESD emissions)
2013 ESD emissions
2013 ESD target
2013 absolute
gap
2013 relative
gap
2014 ESD emissions
2014 ESD target
2014 absolute
gap
2014 relative
gap
Mt CO2-eq. Mt CO2-eq. Mt CO2-eq. % Mt CO2‑eq Mt CO2‑eq Mt CO2‑eq %
Austria 49.69 52.63 2.94 5.6 48.1 52.1 4.0 7.7
Belgium 74.10 78.38 4.28 5.5 71.7 76.9 5.2 6.7
Bulgaria 23.17 26.93 3.76 14.0 24.3 27.2 2.9 10.8
Croatia 17.03 19.61 2.58 13.2 16.2 19.8 3.6 18.0
Cyprus 4.27 5.92 1.65 27.9 4.0 5.9 1.9 32.8
Czech Republic 61.80 62.47 0.67 1.1 62.0 63.2 1.2 1.9
Denmark 33.43 36.83 3.40 9.2 32.4 35.9 3.6 9.9
Estonia 5.83 6.30 0.46 7.3 5.5 6.3 0.8 12.5
Finland 31.39 31.78 0.39 1.2 31.1 31.3 0.2 0.5
France 371.65 394.08 22.42 5.7 349.8 389.5 39.6 10.2
Germany 467.50 472.53 5.02 1.1 446.7 465.8 19.1 4.1
Greece 46.03 58.96 12.92 21.9 45.8 59.3 13.4 22.7
Hungary 37.70 50.40 12.70 25.2 37.3 51.5 14.2 27.6
Ireland 43.12 46.89 3.77 8.0 42.3 45.8 3.4 7.5
Italy 270.79 308.16 37.37 12.1 262.7 306.2 43.5 14.2
Latvia 8.37 9.26 0.89 9.6 8.7 9.4 0.6 6.8
Lithuania 12.23 12.94 0.71 5.5 12.5 13.3 0.8 6.2
Luxembourg 9.53 9.54 0.01 0.1 9.2 9.3 0.2 1.9
Malta 1.09 1.17 0.08 7.0 1.1 1.2 0.1 7.8
Netherlands 109.04 122.95 13.91 11.3 98.0 120.7 22.7 18.8
Poland 189.01 193.64 4.64 2.4 190.9 194.9 4.0 2.0
Portugal 39.70 49.31 9.61 19.5 39.2 49.6 10.4 20.9
Romania 66.98 75.63 8.65 11.4 67.3 77.5 10.2 13.1
Slovakia 21.84 24.02 2.18 9.1 21.5 24.4 2.9 11.9
Slovenia 10.77 12.32 1.55 12.6 10.6 12.4 1.7 13.9
Spain 196.54 227.56 31.02 13.6 198.1 225.6 27.6 12.2
Sweden 35.10 41.69 6.58 15.8 34.0 41.0 7.0 17.1
United Kingdom 348.45 358.74 10.29 2.9 326.0 354.2 28.2 8.0
EU 2 586.18 2 790.63 204.46 7.3 2 497.1 2 770.1 273.0 9.9
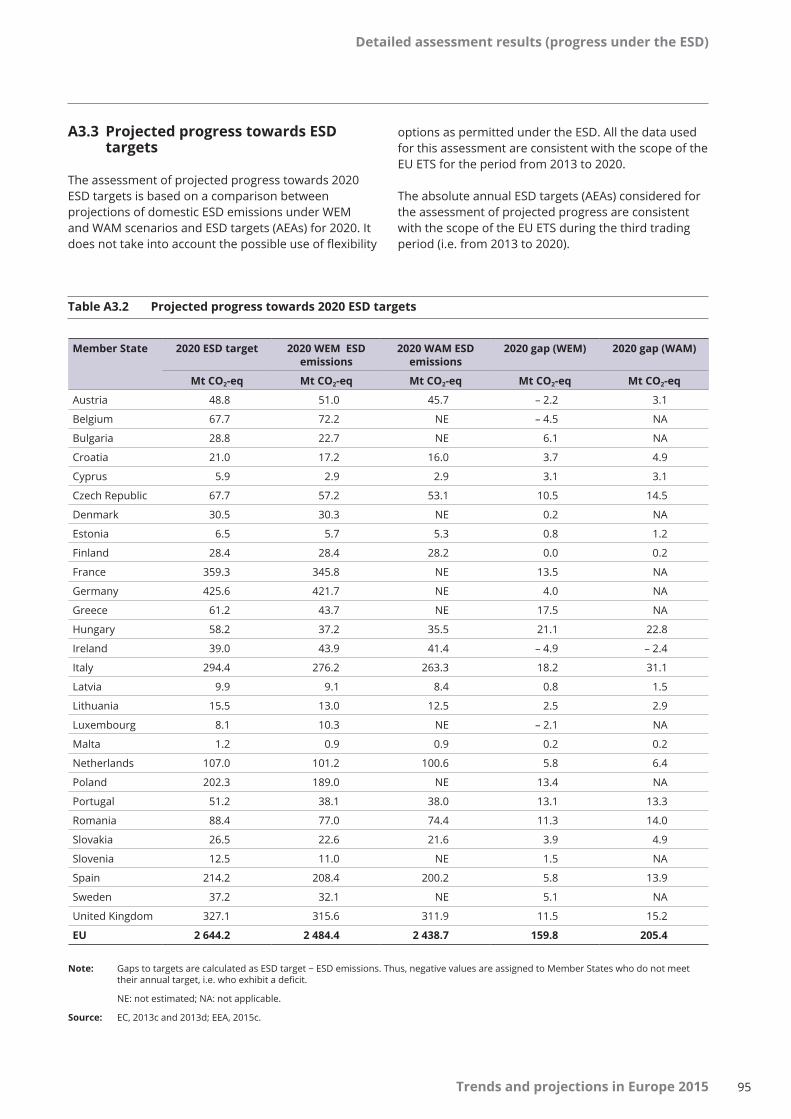
Detailed assessment results (progress under the ESD)
95Trends and projections in Europe 2015
A3.3 Projected progress towards ESD targets
The assessment of projected progress towards 2020 ESD targets is based on a comparison between projections of domestic ESD emissions under WEM and WAM scenarios and ESD targets (AEAs) for 2020. It does not take into account the possible use of flexibility
options as permitted under the ESD. All the data used for this assessment are consistent with the scope of the EU ETSfortheperiodfrom2013to2020.
The absolute annual ESD targets (AEAs) considered for the assessment of projected progress are consistent withthescopeoftheEU ETSduringthethirdtradingperiod (i.e. from 2013 to 2020).
Table A3.2 Projected progress towards 2020 ESD targets
Note: GapstotargetsarecalculatedasESDtarget − ESDemissions.Thus,negativevaluesareassignedtoMemberStateswhodonotmeettheirannualtarget,i.e.whoexhibitadeficit.
NE: not estimated; NA: not applicable.
Source: EC, 2013c and 2013d; EEA, 2015c.
Member State 2020 ESD target 2020 WEM ESD emissions
2020 WAM ESD emissions
2020 gap (WEM) 2020 gap (WAM)
Mt CO2‑eq Mt CO2‑eq Mt CO2‑eq Mt CO2‑eq Mt CO2‑eq
Austria 48.8 51.0 45.7 – 2.2 3.1
Belgium 67.7 72.2 NE – 4.5 NA
Bulgaria 28.8 22.7 NE 6.1 NA
Croatia 21.0 17.2 16.0 3.7 4.9
Cyprus 5.9 2.9 2.9 3.1 3.1
Czech Republic 67.7 57.2 53.1 10.5 14.5
Denmark 30.5 30.3 NE 0.2 NA
Estonia 6.5 5.7 5.3 0.8 1.2
Finland 28.4 28.4 28.2 0.0 0.2
France 359.3 345.8 NE 13.5 NA
Germany 425.6 421.7 NE 4.0 NA
Greece 61.2 43.7 NE 17.5 NA
Hungary 58.2 37.2 35.5 21.1 22.8
Ireland 39.0 43.9 41.4 – 4.9 – 2.4
Italy 294.4 276.2 263.3 18.2 31.1
Latvia 9.9 9.1 8.4 0.8 1.5
Lithuania 15.5 13.0 12.5 2.5 2.9
Luxembourg 8.1 10.3 NE – 2.1 NA
Malta 1.2 0.9 0.9 0.2 0.2
Netherlands 107.0 101.2 100.6 5.8 6.4
Poland 202.3 189.0 NE 13.4 NA
Portugal 51.2 38.1 38.0 13.1 13.3
Romania 88.4 77.0 74.4 11.3 14.0
Slovakia 26.5 22.6 21.6 3.9 4.9
Slovenia 12.5 11.0 NE 1.5 NA
Spain 214.2 208.4 200.2 5.8 13.9
Sweden 37.2 32.1 NE 5.1 NA
United Kingdom 327.1 315.6 311.9 11.5 15.2
EU 2 644.2 2 484.4 2 438.7 159.8 205.4

Detailed assessment results (progress under the ESD)
96 Trends and projections in Europe 2015
A3.4 2005 ESD base-year emissions
For the year 2005, several emission data can be considered, depending on their use.
For the purpose of analysing emission trends in the ESD, historic 2005 ESD emissions are calculated using the latest GHG inventory data, from which ETS emissions (including scope corrections) and CO2 emissions from domestic aviation are subtracted.
It may also be relevant to use 'ESD base-year emissions' (Table A3.3), consistent with the relative 2020 ESD target (in % of 2005 emissions) and the absolute 2020 target as published in the European Commission decisions mentioned above.
The EEA calculates 'ESD base-year emissions' as follows:
ESD base-year emissions = 2020 absolute target/ (1 + % 2020ESDtarget)
These ESD base-year emissions can be used to express, in percentage, changes in ESD emissions since 2005 or annual ESD targets (for any year between 2013 and 2020). Such percentage changes or ESD targets are then comparable with the 2020 targets expressed in percentageintheESD(seeforexampleonFigure A1.1in Annex A1.4). These emissions are different and not to be mistaken for actual 2005 emissions under the ESD, which are based on the latest GHG inventories, ETS verified emissions and ETS scope correction.
Table A3.3 ESD base-year emissions
Country (2005) ESD base-year emissions
Mt CO2-eq.
Austria 58.1
Belgium 79.6
Bulgaria 24.0
Croatia 18.9
Cyprus 6.3
Czech Republic 62.1
Denmark 38.1
Estonia 5.8
Finland 33.8
France 417.8
Germany 494.9
Greece 63.8
Hungary 52.9
Ireland 48.7
Italy 338.4
Latvia 8.5
Lithuania 13.4
Luxembourg 10.2
Malta 1.1
Netherlands 127.4
Poland 177.5
Portugal 50.7
Romania 74.3
Slovakia 23.5
Slovenia 12.1
Spain 238.0
Sweden 44.8
United Kingdom 389.4
EU 2 914.0
Note: The 2005 base-year emissions were estimated by the EEA based on the 2020 ESD targets published in the decision, determining Member States' AEAs, the adjustment to accountfortheEU ETSscopeof2013through2020andthepercentagereductiontargetsfor2020 setoutintheESD.
Source: EC, 2013c and 2013d; EU, 2009a
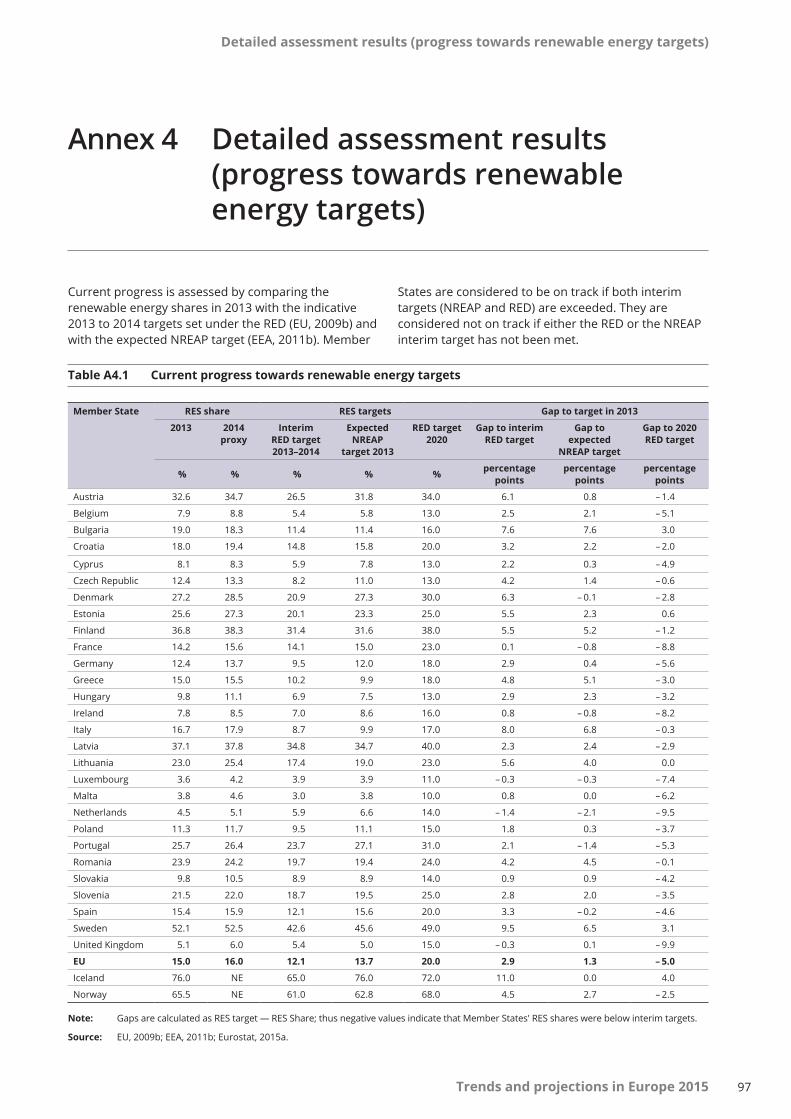
97
Detailed assessment results (progress towards renewable energy targets)
Trends and projections in Europe 2015
Annex 4 Detailedassessmentresults(progress towards renewable energytargets)
Current progress is assessed by comparing the renewable energy shares in 2013 with the indicative 2013 to 2014 targets set under the RED (EU, 2009b) and with the expected NREAP target (EEA, 2011b). Member
Member State RES share RES targets Gap to target in 2013
2013 2014 proxy
Interim RED target 2013–2014
Expected NREAP
target 2013
RED target 2020
Gap to interim RED target
Gap to expected
NREAP target
Gap to 2020 RED target
% % % % % percentage points
percentage points
percentage points
Austria 32.6 34.7 26.5 31.8 34.0 6.1 0.8 – 1.4
Belgium 7.9 8.8 5.4 5.8 13.0 2.5 2.1 – 5.1
Bulgaria 19.0 18.3 11.4 11.4 16.0 7.6 7.6 3.0
Croatia 18.0 19.4 14.8 15.8 20.0 3.2 2.2 – 2.0
Cyprus 8.1 8.3 5.9 7.8 13.0 2.2 0.3 – 4.9
Czech Republic 12.4 13.3 8.2 11.0 13.0 4.2 1.4 – 0.6
Denmark 27.2 28.5 20.9 27.3 30.0 6.3 – 0.1 – 2.8
Estonia 25.6 27.3 20.1 23.3 25.0 5.5 2.3 0.6
Finland 36.8 38.3 31.4 31.6 38.0 5.5 5.2 – 1.2
France 14.2 15.6 14.1 15.0 23.0 0.1 – 0.8 – 8.8
Germany 12.4 13.7 9.5 12.0 18.0 2.9 0.4 – 5.6
Greece 15.0 15.5 10.2 9.9 18.0 4.8 5.1 – 3.0
Hungary 9.8 11.1 6.9 7.5 13.0 2.9 2.3 – 3.2
Ireland 7.8 8.5 7.0 8.6 16.0 0.8 – 0.8 – 8.2
Italy 16.7 17.9 8.7 9.9 17.0 8.0 6.8 – 0.3
Latvia 37.1 37.8 34.8 34.7 40.0 2.3 2.4 – 2.9
Lithuania 23.0 25.4 17.4 19.0 23.0 5.6 4.0 0.0
Luxembourg 3.6 4.2 3.9 3.9 11.0 – 0.3 – 0.3 – 7.4
Malta 3.8 4.6 3.0 3.8 10.0 0.8 0.0 – 6.2
Netherlands 4.5 5.1 5.9 6.6 14.0 – 1.4 – 2.1 – 9.5
Poland 11.3 11.7 9.5 11.1 15.0 1.8 0.3 – 3.7
Portugal 25.7 26.4 23.7 27.1 31.0 2.1 – 1.4 – 5.3
Romania 23.9 24.2 19.7 19.4 24.0 4.2 4.5 – 0.1
Slovakia 9.8 10.5 8.9 8.9 14.0 0.9 0.9 – 4.2
Slovenia 21.5 22.0 18.7 19.5 25.0 2.8 2.0 – 3.5
Spain 15.4 15.9 12.1 15.6 20.0 3.3 – 0.2 – 4.6
Sweden 52.1 52.5 42.6 45.6 49.0 9.5 6.5 3.1
United Kingdom 5.1 6.0 5.4 5.0 15.0 – 0.3 0.1 – 9.9
EU 15.0 16.0 12.1 13.7 20.0 2.9 1.3 – 5.0
Iceland 76.0 NE 65.0 76.0 72.0 11.0 0.0 4.0
Norway 65.5 NE 61.0 62.8 68.0 4.5 2.7 – 2.5
Table A4.1 Current progress towards renewable energy targets
Note: Gaps are calculated as RES target — RES Share; thus negative values indicate that Member States' RES shares were below interim targets.
Source: EU, 2009b; EEA, 2011b; Eurostat, 2015a.
States are considered to be on track if both interim targets (NREAP and RED) are exceeded. They are considered not on track if either the RED or the NREAP interim target has not been met.
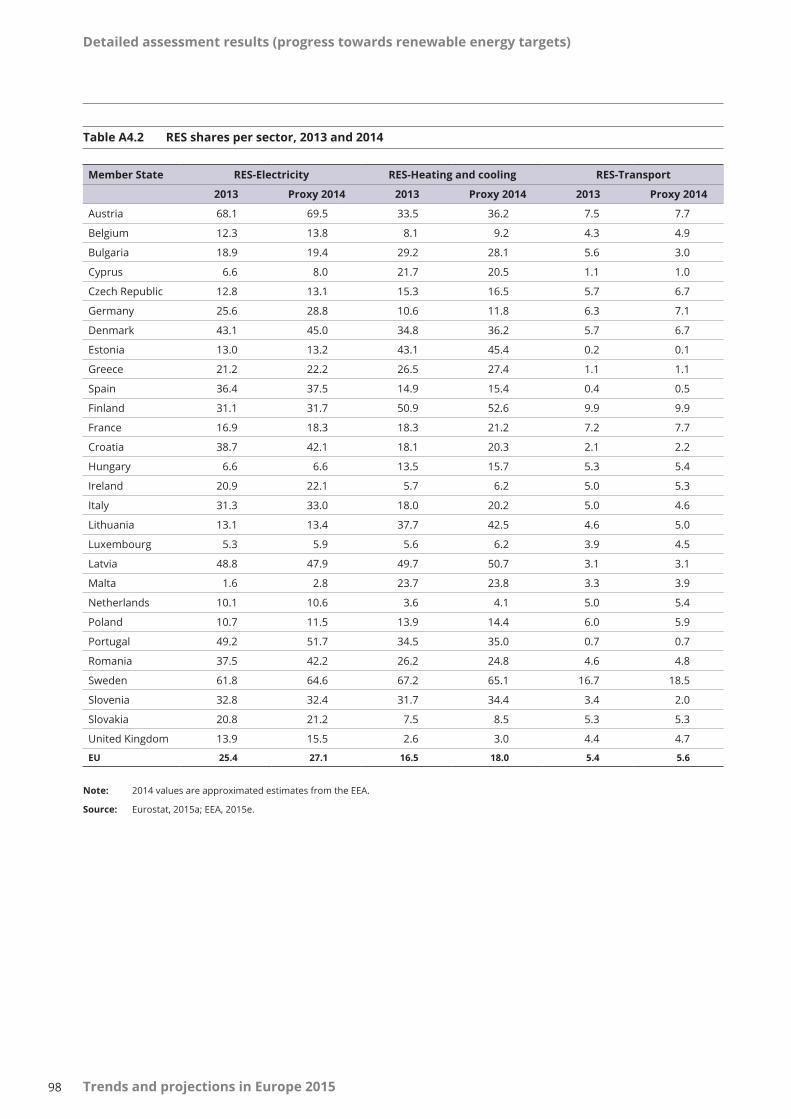
Detailed assessment results (progress towards renewable energy targets)
98 Trends and projections in Europe 2015
Table A4.2 RES shares per sector, 2013 and 2014
Note: 2014 values are approximated estimates from the EEA.
Source: Eurostat, 2015a; EEA, 2015e.
Member State RES-Electricity RES-Heating and cooling RES-Transport
2013 Proxy 2014 2013 Proxy 2014 2013 Proxy 2014
Austria 68.1 69.5 33.5 36.2 7.5 7.7
Belgium 12.3 13.8 8.1 9.2 4.3 4.9
Bulgaria 18.9 19.4 29.2 28.1 5.6 3.0
Cyprus 6.6 8.0 21.7 20.5 1.1 1.0
Czech Republic 12.8 13.1 15.3 16.5 5.7 6.7
Germany 25.6 28.8 10.6 11.8 6.3 7.1
Denmark 43.1 45.0 34.8 36.2 5.7 6.7
Estonia 13.0 13.2 43.1 45.4 0.2 0.1
Greece 21.2 22.2 26.5 27.4 1.1 1.1
Spain 36.4 37.5 14.9 15.4 0.4 0.5
Finland 31.1 31.7 50.9 52.6 9.9 9.9
France 16.9 18.3 18.3 21.2 7.2 7.7
Croatia 38.7 42.1 18.1 20.3 2.1 2.2
Hungary 6.6 6.6 13.5 15.7 5.3 5.4
Ireland 20.9 22.1 5.7 6.2 5.0 5.3
Italy 31.3 33.0 18.0 20.2 5.0 4.6
Lithuania 13.1 13.4 37.7 42.5 4.6 5.0
Luxembourg 5.3 5.9 5.6 6.2 3.9 4.5
Latvia 48.8 47.9 49.7 50.7 3.1 3.1
Malta 1.6 2.8 23.7 23.8 3.3 3.9
Netherlands 10.1 10.6 3.6 4.1 5.0 5.4
Poland 10.7 11.5 13.9 14.4 6.0 5.9
Portugal 49.2 51.7 34.5 35.0 0.7 0.7
Romania 37.5 42.2 26.2 24.8 4.6 4.8
Sweden 61.8 64.6 67.2 65.1 16.7 18.5
Slovenia 32.8 32.4 31.7 34.4 3.4 2.0
Slovakia 20.8 21.2 7.5 8.5 5.3 5.3
United Kingdom 13.9 15.5 2.6 3.0 4.4 4.7
EU 25.4 27.1 16.5 18.0 5.4 5.6

99
Detailed assessment results (progress towards renewable energy targets)
Trends and projections in Europe 2015
Annex 5 Detailedassessmentresults(progress towards energy efficiencytargets)
A5.1 Progress achieved between 2005 and 2013: additional information
The assessment of progress made towards achieving energy efficiency targets at national level is based on the following question: Are the historic efforts (average, annual change 2005 to 2013) to reduce or limit primary energy consumption progressing at least according to the linear trajectory for 2005 to 2020? If energy consumption is reduced/limited/less compared to the linear trajectory for 2005 to 2020, then Member States are considered to not be on track.
This linear assessment is applied when tracking energy efficiency progress, for the following reasons:
• unlike RES and GHG emissions, reliable projections and/or targets for interim years until 2020 on energy consumption are not available at Member State level;
• no other indicators/parameters/methodologies with a transparent, well-established and statistically known relation to primary energy consumption are available either.
Therefore, this assessment is based on the comparison between historic, linear evolutions with preferred evolutions. For the reason of maintaining consistency with the chapters on RES and GHG emissions, the year 2005 was chosen as a single base year, to allow for comparable assessment of trends across Member States. This methodology does not take into account the level of ambition of the national target (which varies significantly across the EU), nor does it capture the complexity of the national context (economic development, ability to attract financing for energy efficiency projects, etc.). Several Member States defined their 2020 targets in terms of final energy consumption (instead of primary energy consumption): Austria, Croatia, the Czech Republic, Estonia, Finland, France, Greece, Lithuania, Latvia, Slovakia and the United Kingdom. For the purpose of cross-country comparison, the officially reported target in primary energy consumption was taken into account in this assessment.
The numeric results of this assessment per Member State are shown in greater detail in Table A5.1 below.

Detailed assessment results (progress towards renewable energy targets)
100 Trends and projections in Europe 2015
Table A5.1 Member States' progress towards their 2020 energy efficiency targets
Source: EEA, 2015f; Eurostat, 2015b; Reported targets under Article 3 of the EED in 2013, including updates of Austria, Bulgaria, Croatia, Cyprus, France, Greece, Italy, Poland, Slovakia, Spain, Sweden and the United Kingdom, based on their third NEEAPs submitted in 2014 (or based onseparatenotificationstotheCommission).
Country Primary energy consumption
2005 2013 2014 (proxy) Linear target path (2013)
Linear target path (2014)
2020 target
Austria 32.6 31.9 31.9 32.0 32.0 31.5
Belgium 51.5 47.4 45.2 47.3 46.8 43.7
Bulgaria 18.9 16.3 17.0 17.8 17.7 16.9
Croatia 8.2 7.3 6.9 10.0 10.2 11.5
Cyprus 2.5 2.2 2.2 2.3 2.3 2.2
Czech Republic 42.2 39.6 38.9 40.8 40.6 39.6
Denmark 19.3 17.8 16.6 18.5 18.4 17.8
Estonia 5.4 6.5 6.5 6.0 6.1 6.5
Finland 33.4 32.8 33.5 34.7 34.9 35.9
France 260.0 245.8 240.0 238.6 235.9 219.9
Germany 317.2 302.5 295.5 295.6 292.9 276.6
Greece 30.6 23.7 22.9 27.5 27.1 24.7
Hungary 25.4 21.0 20.9 26.1 26.1 26.6
Ireland 14.7 13.4 13.1 14.3 14.2 13.9
Italy 178.9 153.7 145.6 167.7 166.3 158.0
Latvia 4.5 4.4 4.5 5.0 5.0 5.4
Lithuania 7.9 5.7 5.5 7.2 7.1 6.5
Luxembourg 4.8 4.3 4.2 4.6 4.6 4.5
Malta 1.0 0.8 0.9 0.8 0.8 0.7
Netherlands 68.5 65.9 61.4 64.3 63.8 60.7
Poland 87.7 93.2 90.0 92.3 92.9 96.4
Portugal 24.9 21.3 20.3 23.6 23.5 22.5
Romania 36.7 30.9 30.4 40.1 40.5 43.0
Slovakia 17.8 16.2 14.7 17.0 16.9 16.4
Slovenia 7.0 6.8 6.6 7.2 7.2 7.3
Spain 135.9 113.8 112.2 127.3 126.2 119.8
Sweden 48.7 47.1 46.8 45.9 45.5 43.4
United Kingdom 222.8 194.5 181.3 198.7 195.7 177.6
EU 1 708.8 1 566.6 1 515.2 1 588.4 1 573.3 1 483.0
Norway 24.9 31.3 NE NA NA NA
European Environment Agency
Trends and projections in Europe 2015Tracking progress towards Europe's climate and energy targets
2015 — 100 pp. — 21 x 29.7 cm
ISBN 978-92-9213-698-7doi:10.2800/985234
HOW TO OBTAIN EU PUBLICATIONS
Free publications:
• one copy: via EU Bookshop (http://bookshop.europa.eu);
• more than one copy or posters/maps: from the European Union’s representations (http://ec.europa.eu/represent_en.htm); from the delegations in non-EU countries (http://eeas.europa.eu/delegations/index_en.htm); by contacting the Europe Direct service (http://europa.eu/europedirect/index_en.htm) or calling 00 800 6 7 8 9 10 11 (freephone number from anywhere in the EU) (*).
(*) The information given is free, as are most calls (though some operators, phone boxes or hotels may charge you).
Priced publications:
• via EU Bookshop (http://bookshop.europa.eu).

TH-AL-15-004-EN
-Ndoi:10.2800/985234
European Environment AgencyKongens Nytorv 61050 Copenhagen KDenmark
Tel.: +45 33 36 71 00Web: eea.europa.euEnquiries: eea.europa.eu/enquiries