tracking the progress of language models - by extracting their ...
23
Under review as a conference paper at ICLR 2021 T RACKING THE PROGRESS OF LANGUAGE MODELS BY EXTRACTING THEIR UNDERLYING KNOWLEDGE GRAPHS Anonymous authors Paper under double-blind review ABSTRACT The state of the art of language models, previously dominated by pre-trained word embeddings, is now being pushed forward by large pre-trained contextual repre- sentations. This success has driven growing interest to understand what these models encode inside their inner workings. Despite this, understanding their se- mantic skills has been elusive, often leading to unsuccessful, non-conclusive, or contradictory results among different works. In this work, we define a probing classifier that we use to extract the underlying knowledge graph of nine of the cur- rently most influential language models, including word embeddings, context en- coders, and text generators. This probe is based on concept relatedness, grounded on WordNet. Our results show that this knowledge is present in all the models, but has several inaccuracies. Furthermore, we show that the different pre-training strategies and architectures lead to different model biases. We conduct a system- atic evaluation to discover specific factors that explain why some concepts are challenging for the different families of models. We hope our insights will moti- vate the future development of models that capture concepts more precisely. 1 I NTRODUCTION Natural language processing (NLP) encompasses a wide variety of applications such as summariza- tion (Kovaleva et al., 2019), information retrieval (Zhan et al., 2020), and machine translation (Tang et al., 2018), among others. Currently, the use of pre-trained language models has become the de facto starting point to tackle most of these applications. The usual pipeline consists of finetuning a pre-trained language model by using a discriminative learning objective to adapt the model to the requirements of each specific task. As key ingredients, these models are pre-trained using mas- sive amounts of unlabeled data that can include millions of documents, and may include billions of parameters. Massive data and parameters are supplemented with a suitable learning architecture, resulting in a highly powerful but also complex model, whose internal operation is hard to analyze. The success of pre-trained language models has driven the interest to understand how they manage to solve NLP tasks. As an example, in the case of BERT (Devlin et al., 2019), one of the most popular pre-trained models based on a Transformer architecture (Vaswani et al., 2017), several studies have attempted to access the knowledge encoded in its layers and attention heads (Tenney et al., 2019b; Devlin et al., 2019; Hewitt & Manning, 2019). In particular, (Jawahar et al., 2019) shows that BERT can solve tasks at a syntactic level by using Transformer blocks to encode a soft hierarchy of features at different levels of abstraction. Similarly, (Hewitt & Manning, 2019) shows that BERT is capable of encoding structural information from text. In particular, using a structural probe, they show that syntax trees are embedded in a linear transformation of the encodings provided by BERT. In general, previous efforts have provided strong evidence indicating that current pre-trained lan- guage models encode complex syntactic rules, however, relevant evidence about their abilities to capture semantic information remains still elusive. As an example, a recent study (Si et al., 2019) attempts to locate the encoding of semantic information as part of the top layers of Transformer architectures, however, results provide contradictory evidence. Similarly, (Kovaleva et al., 2019) fo- cuses on studying knowledge encoded by self-attention weights, however, results provide evidence for over-parameterization but not about language understanding capabilities. 1
-
Upload
khangminh22 -
Category
Documents
-
view
4 -
download
0
Transcript of tracking the progress of language models - by extracting their ...

Under review as a conference paper at ICLR 2021
TRACKING THE PROGRESS OF LANGUAGE MODELSBY EXTRACTING THEIR UNDERLYING KNOWLEDGEGRAPHS
Anonymous authorsPaper under double-blind review
ABSTRACT
The state of the art of language models, previously dominated by pre-trained wordembeddings, is now being pushed forward by large pre-trained contextual repre-sentations. This success has driven growing interest to understand what thesemodels encode inside their inner workings. Despite this, understanding their se-mantic skills has been elusive, often leading to unsuccessful, non-conclusive, orcontradictory results among different works. In this work, we define a probingclassifier that we use to extract the underlying knowledge graph of nine of the cur-rently most influential language models, including word embeddings, context en-coders, and text generators. This probe is based on concept relatedness, groundedon WordNet. Our results show that this knowledge is present in all the models,but has several inaccuracies. Furthermore, we show that the different pre-trainingstrategies and architectures lead to different model biases. We conduct a system-atic evaluation to discover specific factors that explain why some concepts arechallenging for the different families of models. We hope our insights will moti-vate the future development of models that capture concepts more precisely.
1 INTRODUCTION
Natural language processing (NLP) encompasses a wide variety of applications such as summariza-tion (Kovaleva et al., 2019), information retrieval (Zhan et al., 2020), and machine translation (Tanget al., 2018), among others. Currently, the use of pre-trained language models has become the defacto starting point to tackle most of these applications. The usual pipeline consists of finetuning apre-trained language model by using a discriminative learning objective to adapt the model to therequirements of each specific task. As key ingredients, these models are pre-trained using mas-sive amounts of unlabeled data that can include millions of documents, and may include billionsof parameters. Massive data and parameters are supplemented with a suitable learning architecture,resulting in a highly powerful but also complex model, whose internal operation is hard to analyze.
The success of pre-trained language models has driven the interest to understand how they manage tosolve NLP tasks. As an example, in the case of BERT (Devlin et al., 2019), one of the most popularpre-trained models based on a Transformer architecture (Vaswani et al., 2017), several studies haveattempted to access the knowledge encoded in its layers and attention heads (Tenney et al., 2019b;Devlin et al., 2019; Hewitt & Manning, 2019). In particular, (Jawahar et al., 2019) shows that BERTcan solve tasks at a syntactic level by using Transformer blocks to encode a soft hierarchy of featuresat different levels of abstraction. Similarly, (Hewitt & Manning, 2019) shows that BERT is capableof encoding structural information from text. In particular, using a structural probe, they show thatsyntax trees are embedded in a linear transformation of the encodings provided by BERT.
In general, previous efforts have provided strong evidence indicating that current pre-trained lan-guage models encode complex syntactic rules, however, relevant evidence about their abilities tocapture semantic information remains still elusive. As an example, a recent study (Si et al., 2019)attempts to locate the encoding of semantic information as part of the top layers of Transformerarchitectures, however, results provide contradictory evidence. Similarly, (Kovaleva et al., 2019) fo-cuses on studying knowledge encoded by self-attention weights, however, results provide evidencefor over-parameterization but not about language understanding capabilities.
1

Under review as a conference paper at ICLR 2021
In this work, we study to which extent pre-trained language models encode semantic information.As a key source of semantic knowledge, we focus on studying how precisely pre-trained languagemodels encode the concept relations embedded in the conceptual taxonomy of WordNet1 (Miller,1995). The ability to understand, organize, and correctly use concepts is one of the most remarkablecapabilities of human intelligence (Lake et al., 2017). Therefore, a quantification of the ability thata pre-trained language model can exhibit to encode the conceptual organization behind WordNet ishighly valuable. In particular, it can provide useful insights about the inner mechanisms that thesemodels use to encode semantic information. Furthermore, an analysis of concepts and associationsthat result difficult to these models can provide relevant insights about how to improve them.
In contrast to most previous works, we do not focus on a particular model, but target a large list ofthe most popular pre-trained language and text-embedding models. In this sense, one of our goalsis to provide a comparative analysis of the capacities of different types of approaches. FollowingHewitt & Manning (2019), we study semantic performance by defining a probing classifier basedon concept relatedness according to WordNet. Using this tool, we analyze the different models,enlightening how and where semantic knowledge is encoded. Furthermore, we explore how thesemodels encode suitable information to recreate the structure of WordNet. Among our main results,we show that the different pre-training strategies and architectures lead to different model biases.In particular, we show that contextualized word embeddings, such as BERT, encode high-level con-cepts and hierarchical relationships among them, creating a taxonomy. This finding corroboratesprevious work results (Reif et al., 2019) that claim that BERT vectors are stored in sub-spaces thathave correspondence with semantic knowledge. Our study also shows evidence about the limita-tions of current pre-trained language models, demonstrating that they all have difficulties encodingspecific concepts. As an example, all the models struggle with concepts related to “taxonomicalgroups”, performing worse than chance in some cases. Our results also reveal that models have verydistinctive patterns in terms of where they encode most of the semantic information. These patternsare dependant on architecture and not on model sizes.
2 RELATED WORK
The success of deep learning architectures in various NLP tasks has fueled a growing interest fromthe community to improve understanding of what these models encode. Several works have studiedthese models’ impact on downstream tasks at the syntactic or semantic level. Some studies (Tenneyet al., 2019b) claim that success in a specific task helps understand what type of information themodel encodes. Other studies have improved the understanding of what and where these models en-code information, by analyzing correlations between input-targets and specific architecture blocks,such as layers (Jawahar et al., 2019), encoded hidden states (Tang et al., 2018; Saphra & Lopez,2019), and attention heads (Michel et al., 2019).
Evidence of syntactic information: Using probing classifiers, Clark et al. (2019) claims that somespecific BERT’s attention heads show correspondence with syntactic tasks. Goldberg (2019) il-lustrates the capabilities that BERT has to solve syntactic tasks, such as subject-verb agreement.BERT’s success in these tasks fuels the belief that BERT can code the syntax of a language. Hewitt& Manning (2019) proposes a structural probe that evaluates whether syntax trees are encoded ina linear transformation of BERT embeddings. The study shows that such transformation exists inBERT, providing evidence that syntax trees are implicitly embedded in BERT’s vector geometry.Reif et al. (2019) has found evidence of syntactic representation in BERT’s attention matrices, withspecific directions in space representing particular dependency relations.
Evidence of semantic information: Reif et al. (2019) suggests that BERT’s internal geometry maybe broken into multiple linear subspaces, with separate spaces for different syntactic and semanticinformation. Despite this, previous work has not yet reached consensus about this topic. Whilesome studies show satisfactory results in tasks such as entity types (Tenney et al., 2019a), semanticroles (Rogers et al., 2020), and sentence completion (Ettinger, 2020), other studies show less favor-able results in coreference (Tenney et al., 2019b) and Multiple-Choice Reading Comprehension (Siet al., 2019), claiming that BERT’s performance may not reflect the model’s true ability of languageunderstanding and reasoning. Some works have studied which blocks of BERT are used to solve
1WordNet is a human-generated graph, where each one of its 117000 nodes (also called synsets) representa concept. In this work we use the hyponymy relations, which represent if a concept is a subclass of another.
2

Under review as a conference paper at ICLR 2021
tasks at the semantic level. Tenney et al. (2019b) proposes a set of edge probing tasks to test theencoded sentential structure of contextualized word embeddings. The study shows evidence that theimprovements that BERT and GPT-2 offer over non contextualized embeddings as GloVe is onlysignificant in syntactic-level tasks. Regarding static word embeddings, Yaghoobzadeh et al. (2019)shows that senses are well represented in single-vector embeddings if they are frequent, and that thisdoes not have a negative impact on NLP tasks whose performance depends on frequent senses.
Layer-wise or head-wise information: Tenney et al. (2019a) shows that the first layers of BERTfocus on encoding short dependency relationships at the syntactic level (e.g., subject-verb agree-ment) while top layers focus on encoding long-range dependencies (e.g., subject-object dependen-cies). Peters et al. (2018a) supports similar declarations for Convolutional, LSTM, and self-attentionarchitectures. While these studies also support that the top layers appear to encode semantic infor-mation, the evidence to support this claim is not conclusive or contradictory with other works. Asan example, Jawahar et al. (2019) could only identify one SentEval semantic task that topped at thelast layer. In terms of information flow, Voita et al. (2019a) reports that information about the past inleft-to-right language models gets vanished as the information flows from bottom to top BERT’s lay-ers. Hao et al. (2019) shows that the lower layers of BERT change less during finetuning, suggestingthat layers close to inputs learn more transferable language representations. In terms of architecturedesign, Press et al. (2020) provides evidence that increasing self-attention at the bottom and increas-ing feed-forward sub-layers at the top improves results in language modeling tasks using BERT.Other studies have focused on understanding how self-attention heads contribute to solving specifictasks (Vig, 2019). Kovaleva et al. (2019) shows a set of attention patterns that is repeated acrossdifferent heads when trying to solve GLUE tasks (Wang et al., 2018). Furthermore, Michel et al.(2019) and Voita et al. (2019b) show that several heads can be removed from trained Transformermodels without degradation in downstream tasks.
In summary, on the one hand, related work shows results that provide strong evidence conclud-ing that BERT and other Transformer-based models can encode information at the syntactic level.Furthermore, BERT uses this information to solve various benchmark NLP tasks. Working withambiguous words has allowed BERT to perform well on Machine Translation tasks (MT), and out-performing other architectures in word sense disambiguation (WSD). On the other hand, while somestudies claim that top layers are helpful to solve semantic tasks, the results are not conclusive. Ef-forts to locate which blocks of the Transformer architecture operate at the semantic level have beenunsuccessful. In this context, our work helps to fill the gap between the deeper understanding thatwe have now about how word embeddings and language models encode and work with syntax, andthe still shallow comprehension of their abilities to encode and work with semantics.
3 STUDY METHODOLOGY
Probing methods consist of using the representation of a frozen pre-trained model to train a classifierto achieve a particular task. If the probing classifier succeeds in this setting but fails using analternative model, it means that the source model encodes the knowledge needed to solve the task.Furthermore, the performance of the classifier can be used to measure how well the model capturesthis knowledge (Conneau et al., 2018). Following Hewitt & Manning (2019), we use a similarprobing method at the semantic level and apply it to the nine models presented in Section 3.1.Probing techniques have shown useful for NLP tasks (Saphra & Lopez, 2019), however, they havealso been questioned (Ravichander et al., 2020), as probe success does not guarantee that the modelrelies on that information to solve a target task. Consequently, our study limits to shed light onwhether the models under evaluation encode relevant knowledge to solve the task of predictingconcept relatedness in a semantic ontology such as Wordnet.
To study how precisely the models encode semantic information, we measure correctness in pre-dicted relations among concepts at two levels: (a) pair-wise-level by studying performance acrosssampled pairs of related or unrelated concepts, and (b) graph-level by using pair-wise predictions toreconstruct the actual graph. We describe these two approaches in Sections 3.2 and 3.3, respectively.They essentially study the same phenomenon as both share the exact same model predictions. Theyonly differ in the way they use these predictions.
3
Under review as a conference paper at ICLR 2021
3.1 WORD EMBEDDINGS MODELS
This study considers the most influential language models from recent years. We consider the essen-tial approaches of three model families: non contextualized word embeddings (NCE), contextualizedword embeddings (CE), and generative language models (GLM). We consider Word2Vec (Mikolovet al., 2013) and GloVe (Pennington et al., 2014) for the first family of approaches. For the CEfamily, we consider ELMo (Peters et al., 2018b), which is implemented on a bidirectional LSTMarchitecture, XLNet (Yang et al., 2019), and BERT (Devlin et al., 2019) and its extensions ALBERT(Lan et al., 2020) and RoBERTa (Liu et al., 2019), all of them based on the Transformer architecture.GPT-2 (Radford et al., 2018) and T5 (Raffel et al., 2019) are included in the study to incorporateapproaches based on generative language models.
3.2 SEMANTIC PROBING CLASSIFIER
We define an edge probing classifier that learns to identify if two concepts are semantically re-lated. To create the probing classifier, we retrieve all the glosses from the Princeton WordNet GlossCorpus2. This dataset provides WordNet’s synsets gloss sentences with annotations identifying oc-currences of concepts within different sentence contexts. The annotations provide a mapping of theused words to their corresponding WordNet node. We sample hypernym pairs A, B. Then, from anunrelated section of the taxonomy, we randomly sample a third synset C, taking care that C is notrelated to either A or B. Then, 〈A,B,C〉 forms a triplet that allows us to create six testing edgesfor our classifier. To train the probing classifier, we define a labeled edge {x, y, L}, with x and ysynsets in {A,B,C}, x 6= y. L ∈ {0, 1} is the target of the edge. If y is direct or indirect parentof x, L = 1, while L = 0 in other case. For each synset x, y, we sample one of its sentences S(x),S(y) from the dataset. LetM be a word embedding model. IfM belongs to the NCE family, x and yare encoded by M(x) and M(y), respectively. If M belongs to the CE or GLM families, then x andy are encoded by the corresponding token of M(S(x)) and M(S(y)), respectively. Accordingly,the context of each concept provides additional information for the creation of its word embedding.
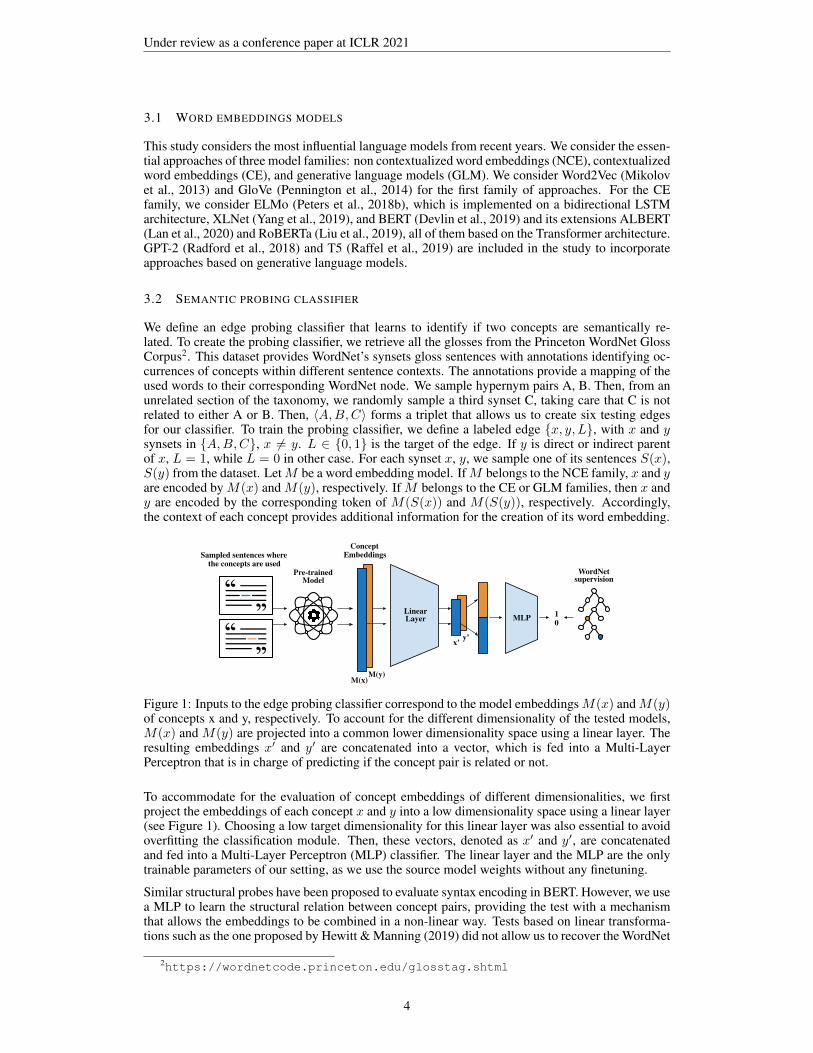
Figure 1: Inputs to the edge probing classifier correspond to the model embeddingsM(x) andM(y)of concepts x and y, respectively. To account for the different dimensionality of the tested models,M(x) and M(y) are projected into a common lower dimensionality space using a linear layer. Theresulting embeddings x′ and y′ are concatenated into a vector, which is fed into a Multi-LayerPerceptron that is in charge of predicting if the concept pair is related or not.
To accommodate for the evaluation of concept embeddings of different dimensionalities, we firstproject the embeddings of each concept x and y into a low dimensionality space using a linear layer(see Figure 1). Choosing a low target dimensionality for this linear layer was also essential to avoidoverfitting the classification module. Then, these vectors, denoted as x′ and y′, are concatenatedand fed into a Multi-Layer Perceptron (MLP) classifier. The linear layer and the MLP are the onlytrainable parameters of our setting, as we use the source model weights without any finetuning.
Similar structural probes have been proposed to evaluate syntax encoding in BERT. However, we usea MLP to learn the structural relation between concept pairs, providing the test with a mechanismthat allows the embeddings to be combined in a non-linear way. Tests based on linear transforma-tions such as the one proposed by Hewitt & Manning (2019) did not allow us to recover the WordNet
2https://wordnetcode.princeton.edu/glosstag.shtml
4
Under review as a conference paper at ICLR 2021
structure. This indicates that the sub-spaces where the language models encode this semantic infor-mation are not linear. The fact that syntactic information is linearly available with high accuracy,makes us believe that syntax trees might be a critical intermediate result needed for the languagemodeling task; whereas semantic information emerges as an indirect consequence of accurate lan-guage modeling and syntactic identification, but might not constitute information that the modelrelies on for the language modeling task, as postulated by Ravichander et al. (2020).
3.3 RECONSTRUCTING THE STRUCTURE OF A KNOWLEDGE GRAPH
The proposed probe classifier predicts if a pair of concepts 〈u, v〉 form a valid 〈parent, child〉 rela-tion according to WordNet, where h〈u,v〉 ∈ [0, 1] denotes the corresponding classifier output. It isimportant to note that valid 〈parent, child〉 relations include direct relations, as in 〈dog, poodle〉, andtransitive relations, as in 〈animal, poodle〉, and that the order of the items in the relation do matter.
To reconstruct the underlying knowledge graph, for each valid 〈parent, child〉 relation given byh〈u,v〉 > threshold, we need an estimation of how close are the corresponding nodes in the graph.To do this, we introduce the concept of “parent closeness” between a parent node u and a child nodev, that we define as de(u, v). We propose two alternative scores to estimate de:
i) Transitive Intersections Metric (TIM): we explore a metric grounded directly in the tree struc-ture of a knowledge graph. The key observations are that nodes u and v that form a parent-childrelation have some transitive connections in common. Specifically, all descendants of v are alsodescendants of u, and all the ancestors of u are also ancestors of v. Furthermore, the closer the linkbetween u and v in the graph, the bigger the intersection. With that in mind, for each candidate edgee = 〈u, v〉 we define the following metric for de:
de(u, v) = C −( ∑j∈N\{u,v}
h〈u,j〉h〈v,j〉 +∑
j∈N\{u,v}
h〈j,u〉h〈j,v〉
)∗ h〈u,v〉 (1)
where the first sum accounts for the similarity in the descendants of nodes u and v, and the secondsum accounts for the similarity in the ancestors of nodes u and v. The term h〈u,v〉 at the right-handside accounts for the direction of the edge. Constant C = maxui,vj d(ui, vj) is added to force de tobe positive. N denotes the set of all nodes (concepts).
ii) Model Confidence Metric (MCM): All nine models in this study capture close concept rela-tions more precisely than distant relations (supporting evidence can be found in Appendix C). Inpractice, this means that a concept like poodle will be matched with its direct parent node dog withhigher confidence than with a more distant parent node such as animal. Thus it is reasonable to usede(u, v) = 1− h〈u,v〉.Based on de, a natural choice to find the tree that comprises only the closest parent of each nodeis to obtain the minimum-spanning-arborescence (MSA) of the graph defined by de. The MSA isanalogous to the minimum-spanning-tree (MST) objective used in Hewitt & Manning (2019), butfor the specific case of directed graphs. For a mathematical formulation of the MSA optimizationproblem applied to our setting, we refer readers to Appendix A.3.
4 HOW ACCURATE IS THE SEMANTIC KNOWLEDGE?
4.1 SEMANTIC EDGE PROBING CLASSIFIER RESULTS
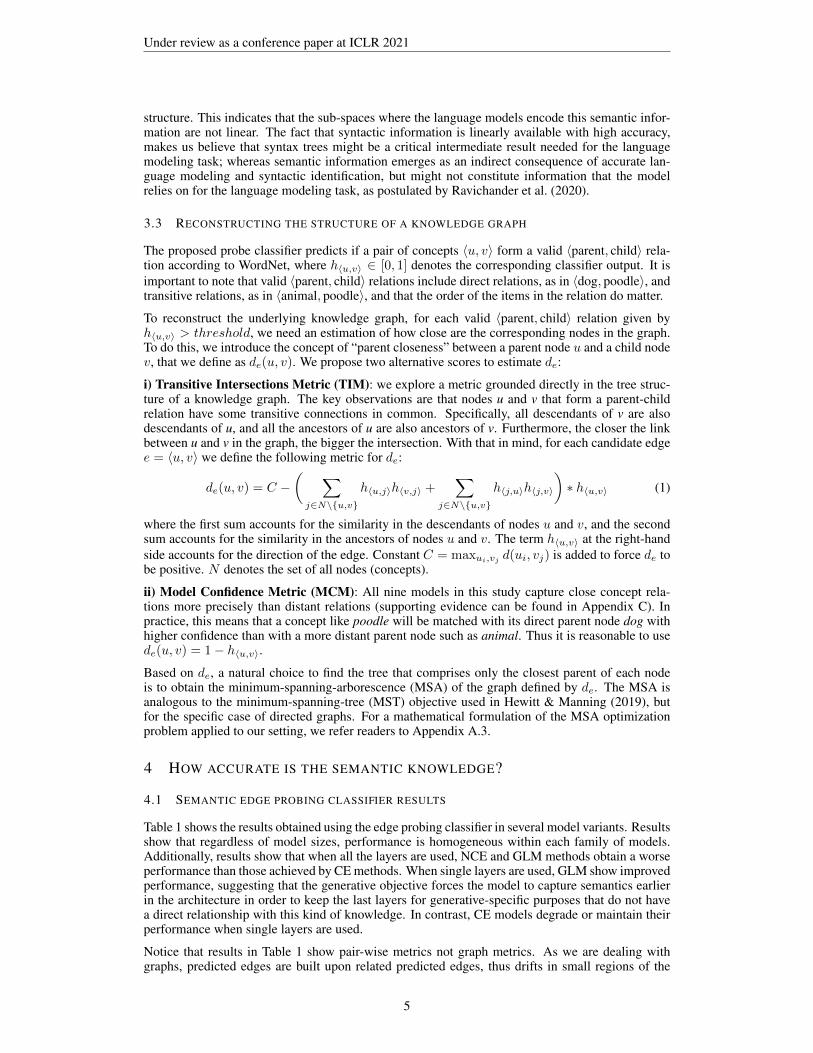
Table 1 shows the results obtained using the edge probing classifier in several model variants. Resultsshow that regardless of model sizes, performance is homogeneous within each family of models.Additionally, results show that when all the layers are used, NCE and GLM methods obtain a worseperformance than those achieved by CE methods. When single layers are used, GLM show improvedperformance, suggesting that the generative objective forces the model to capture semantics earlierin the architecture in order to keep the last layers for generative-specific purposes that do not havea direct relationship with this kind of knowledge. In contrast, CE models degrade or maintain theirperformance when single layers are used.
Notice that results in Table 1 show pair-wise metrics not graph metrics. As we are dealing withgraphs, predicted edges are built upon related predicted edges, thus drifts in small regions of the
5
Under review as a conference paper at ICLR 2021
Emb. Size Best F1-score F1-scoreFamily Model All/Best Layer Layer All Layers Best Layer
NCEWord2Vec (Mikolov et al., 2013) 300 / - - .7683 ± .0135 -GloVe-42B (Pennington et al., 2014) 300 / - - .7877 ± .0084 -
GLM
GPT-2 (Radford et al., 2018) 9984 / 768 6 .7862 ± .0132 .7921 ± .0108T5-small (Raffel et al., 2019) 7168 / 512 4 .8156 ± .0098 .8199 ± .0081GPT2-xl (Radford et al., 2018) 78400 / 1600 13 .7946 ± .0151 .8029 ± .0118T5-large (Raffel et al., 2019) 51200 / 1024 17 .8148 ± .0119 .8331 ± .0102
CE
ELMo-small (Peters et al., 2018b) 768 / 256 2 .7986 ± .0126 .7880 ± .0119BERT-base (Devlin et al., 2019) 9984 / 768 10 .8240 ± .0123 .8185 ± .0104RoBERTa-base (Liu et al., 2019) 9984 / 768 5 .8392 ± .0100 .8266 ± .0083XLNet-base (Yang et al., 2019) 9984 / 768 4 .8306 ± .0113 .8293 ± .0116ALBERT-base (Lan et al., 2020) 9984 / 768 12 .8184 ± .0222 .8073 ± .0102ELMo-large (Peters et al., 2018b) 3072 / 1024 2 .8311 ± .0090 .8330 ± .0083BERT-large (Devlin et al., 2019) 25600 / 1024 14 .8178 ± .0152 .8185 ± .0113RoBERTa-large (Liu et al., 2019) 25600 / 1024 13 .8219 ± .0159 .8314 ± .0082XLNet-large (Yang et al., 2019) 25600 / 1024 6 .8211 ± .0142 .8244 ± .0080ALBERT-xxlarge (Lan et al., 2020) 53248 / 4096 4 .8233 ± .0107 .8194 ± .0097
Table 1: Results obtained using the edge probing classifier. We study the performance in manymodel’s variants, considering small and large versions of several models. Results are shown groupedby the families of methods defined in Section 3.1.
graph may cause large drifts in downstream connections. Furthermore, our setup balances positive(links) and negative samples (not links), but the proportion of negative samples will be considerablylarger in a real reconstruction scenario. As a consequence, we emphasize that these numbers mustnot be considered in isolation, but together with the results reported in sections 4.2 and 5.
4.2 EXTRACTING THE UNDERLYING KNOWLEDGE GRAPH
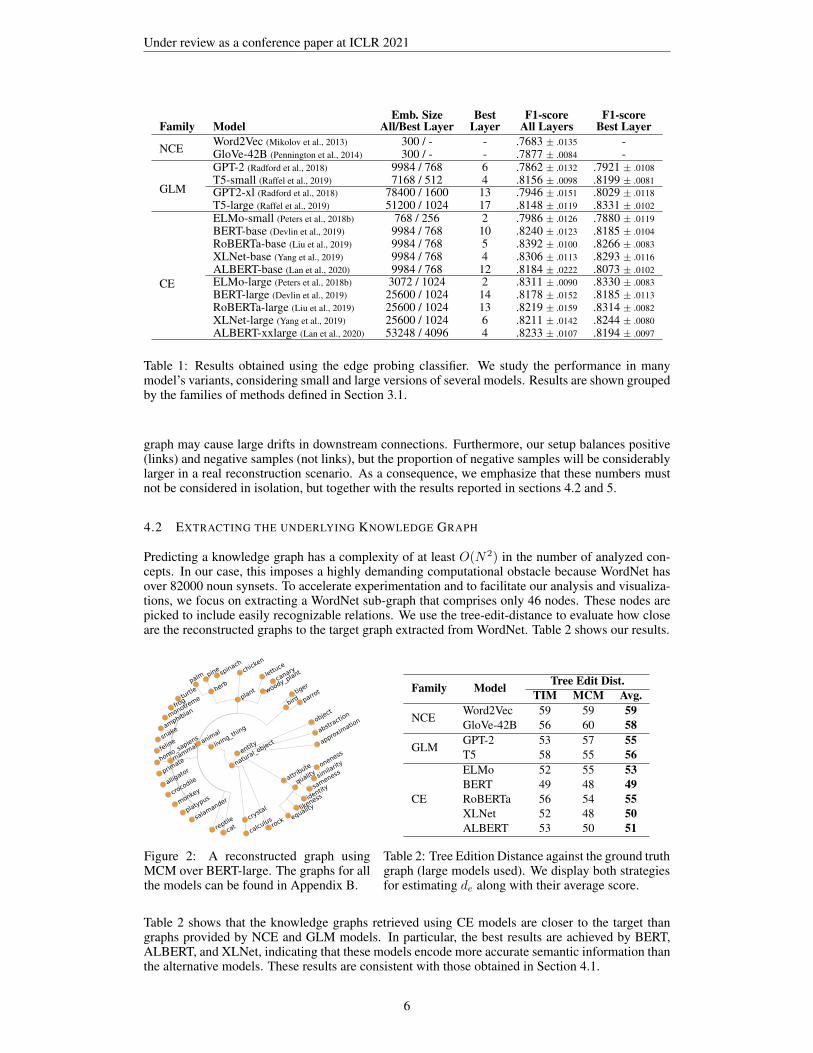
Predicting a knowledge graph has a complexity of at least O(N2) in the number of analyzed con-cepts. In our case, this imposes a highly demanding computational obstacle because WordNet hasover 82000 noun synsets. To accelerate experimentation and to facilitate our analysis and visualiza-tions, we focus on extracting a WordNet sub-graph that comprises only 46 nodes. These nodes arepicked to include easily recognizable relations. We use the tree-edit-distance to evaluate how closeare the reconstructed graphs to the target graph extracted from WordNet. Table 2 shows our results.
quality
oneness
similarity
sameness
identity
likeness
equality
herb
chicken
woody_p
lant
rockcry
stal
living_th
ing
animal
catreptile
mamm
al
plant
bird
entity
palm pin
e spinach
tiger
parro
t
natur
al_objec
t
objec
t
abstraction
appro
ximation
attribute
calculus
salam
ander
platyp
usmonkeycro
codileall
igatorpri
mateho
mo_sa
piens
feline
snake
amphibianmo
notre
mefrogtur
tle
lettuc
e
canary
Figure 2: A reconstructed graph usingMCM over BERT-large. The graphs for allthe models can be found in Appendix B.
Family Model Tree Edit Dist.TIM MCM Avg.
NCEWord2Vec 59 59 59GloVe-42B 56 60 58
GLMGPT-2 53 57 55T5 58 55 56
CE
ELMo 52 55 53BERT 49 48 49RoBERTa 56 54 55XLNet 52 48 50ALBERT 53 50 51
Table 2: Tree Edition Distance against the ground truthgraph (large models used). We display both strategiesfor estimating de along with their average score.
Table 2 shows that the knowledge graphs retrieved using CE models are closer to the target thangraphs provided by NCE and GLM models. In particular, the best results are achieved by BERT,ALBERT, and XLNet, indicating that these models encode more accurate semantic information thanthe alternative models. These results are consistent with those obtained in Section 4.1.
6
Under review as a conference paper at ICLR 2021
Visual inspection of the reconstructed graphs as the one found in Figure 2 reveals that models capturesome key categories but fail to map some fine-grained relations.
5 WHAT IS EASY OR HARD? WHAT ARE THESE MODELS LEARNING?
Section 4 shows that different model families differ in their errors. Furthermore, it shows that withinthe same family, models have similar biases. In this section, we elucidate which semantic factorshave an impact on the performance of these models and which ones do not affect their F1-score.
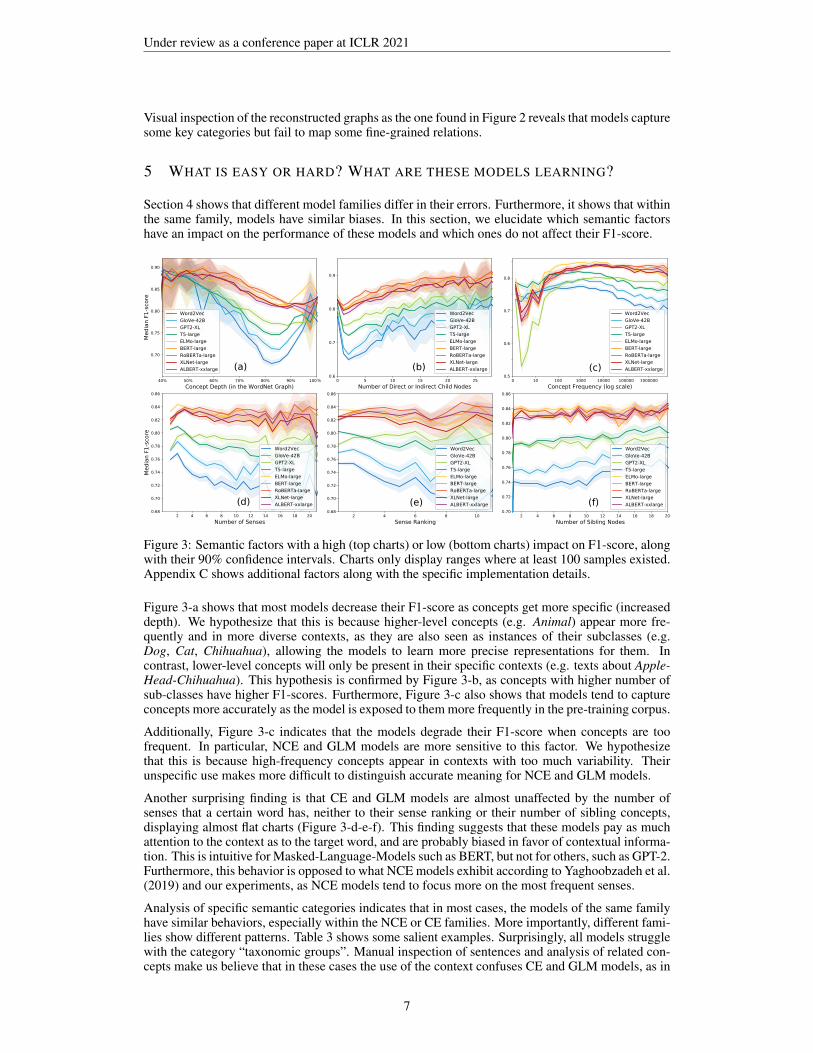
Figure 3: Semantic factors with a high (top charts) or low (bottom charts) impact on F1-score, alongwith their 90% confidence intervals. Charts only display ranges where at least 100 samples existed.Appendix C shows additional factors along with the specific implementation details.
Figure 3-a shows that most models decrease their F1-score as concepts get more specific (increaseddepth). We hypothesize that this is because higher-level concepts (e.g. Animal) appear more fre-quently and in more diverse contexts, as they are also seen as instances of their subclasses (e.g.Dog, Cat, Chihuahua), allowing the models to learn more precise representations for them. Incontrast, lower-level concepts will only be present in their specific contexts (e.g. texts about Apple-Head-Chihuahua). This hypothesis is confirmed by Figure 3-b, as concepts with higher number ofsub-classes have higher F1-scores. Furthermore, Figure 3-c also shows that models tend to captureconcepts more accurately as the model is exposed to them more frequently in the pre-training corpus.
Additionally, Figure 3-c indicates that the models degrade their F1-score when concepts are toofrequent. In particular, NCE and GLM models are more sensitive to this factor. We hypothesizethat this is because high-frequency concepts appear in contexts with too much variability. Theirunspecific use makes more difficult to distinguish accurate meaning for NCE and GLM models.
Another surprising finding is that CE and GLM models are almost unaffected by the number ofsenses that a certain word has, neither to their sense ranking or their number of sibling concepts,displaying almost flat charts (Figure 3-d-e-f). This finding suggests that these models pay as muchattention to the context as to the target word, and are probably biased in favor of contextual informa-tion. This is intuitive for Masked-Language-Models such as BERT, but not for others, such as GPT-2.Furthermore, this behavior is opposed to what NCE models exhibit according to Yaghoobzadeh et al.(2019) and our experiments, as NCE models tend to focus more on the most frequent senses.
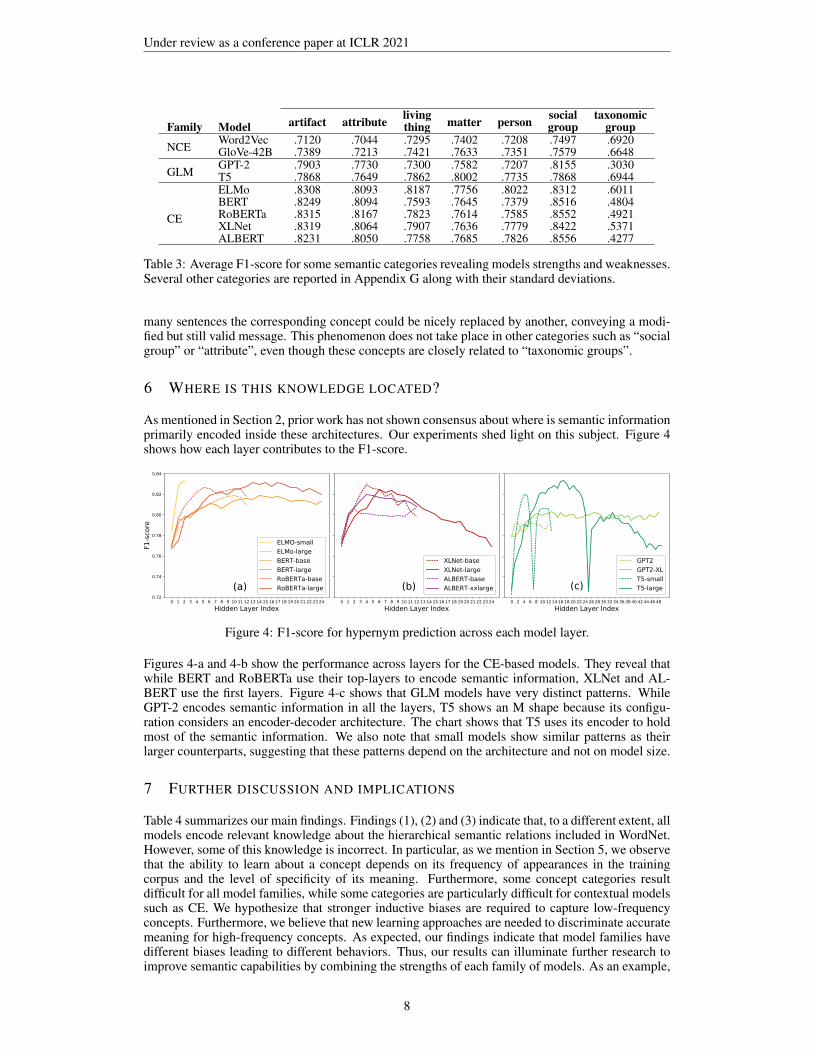
Analysis of specific semantic categories indicates that in most cases, the models of the same familyhave similar behaviors, especially within the NCE or CE families. More importantly, different fami-lies show different patterns. Table 3 shows some salient examples. Surprisingly, all models strugglewith the category “taxonomic groups”. Manual inspection of sentences and analysis of related con-cepts make us believe that in these cases the use of the context confuses CE and GLM models, as in
7
Under review as a conference paper at ICLR 2021
artifact attribute living matter person social taxonomicFamily Model thing group group
NCEWord2Vec .7120 .7044 .7295 .7402 .7208 .7497 .6920GloVe-42B .7389 .7213 .7421 .7633 .7351 .7579 .6648
GLMGPT-2 .7903 .7730 .7300 .7582 .7207 .8155 .3030T5 .7868 .7649 .7862 .8002 .7735 .7868 .6944
CE
ELMo .8308 .8093 .8187 .7756 .8022 .8312 .6011BERT .8249 .8094 .7593 .7645 .7379 .8516 .4804RoBERTa .8315 .8167 .7823 .7614 .7585 .8552 .4921XLNet .8319 .8064 .7907 .7636 .7779 .8422 .5371ALBERT .8231 .8050 .7758 .7685 .7826 .8556 .4277
Table 3: Average F1-score for some semantic categories revealing models strengths and weaknesses.Several other categories are reported in Appendix G along with their standard deviations.
many sentences the corresponding concept could be nicely replaced by another, conveying a modi-fied but still valid message. This phenomenon does not take place in other categories such as “socialgroup” or “attribute”, even though these concepts are closely related to “taxonomic groups”.
6 WHERE IS THIS KNOWLEDGE LOCATED?
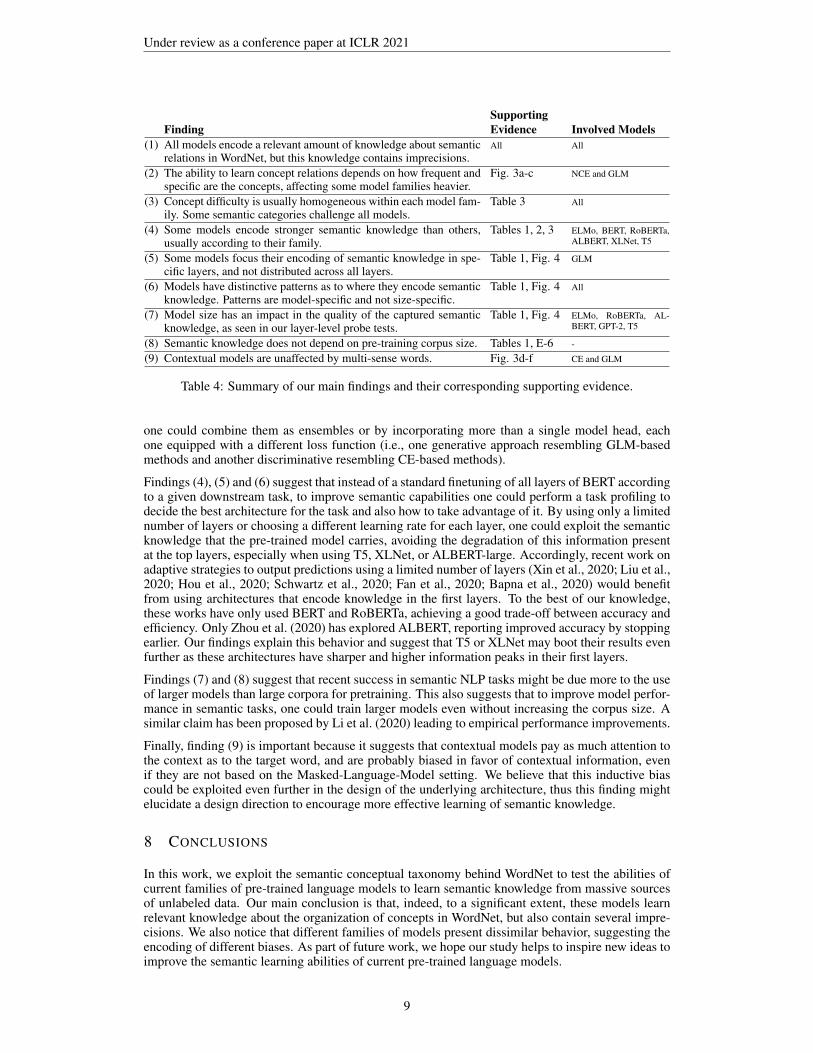
As mentioned in Section 2, prior work has not shown consensus about where is semantic informationprimarily encoded inside these architectures. Our experiments shed light on this subject. Figure 4shows how each layer contributes to the F1-score.
Figure 4: F1-score for hypernym prediction across each model layer.
Figures 4-a and 4-b show the performance across layers for the CE-based models. They reveal thatwhile BERT and RoBERTa use their top-layers to encode semantic information, XLNet and AL-BERT use the first layers. Figure 4-c shows that GLM models have very distinct patterns. WhileGPT-2 encodes semantic information in all the layers, T5 shows an M shape because its configu-ration considers an encoder-decoder architecture. The chart shows that T5 uses its encoder to holdmost of the semantic information. We also note that small models show similar patterns as theirlarger counterparts, suggesting that these patterns depend on the architecture and not on model size.
7 FURTHER DISCUSSION AND IMPLICATIONS
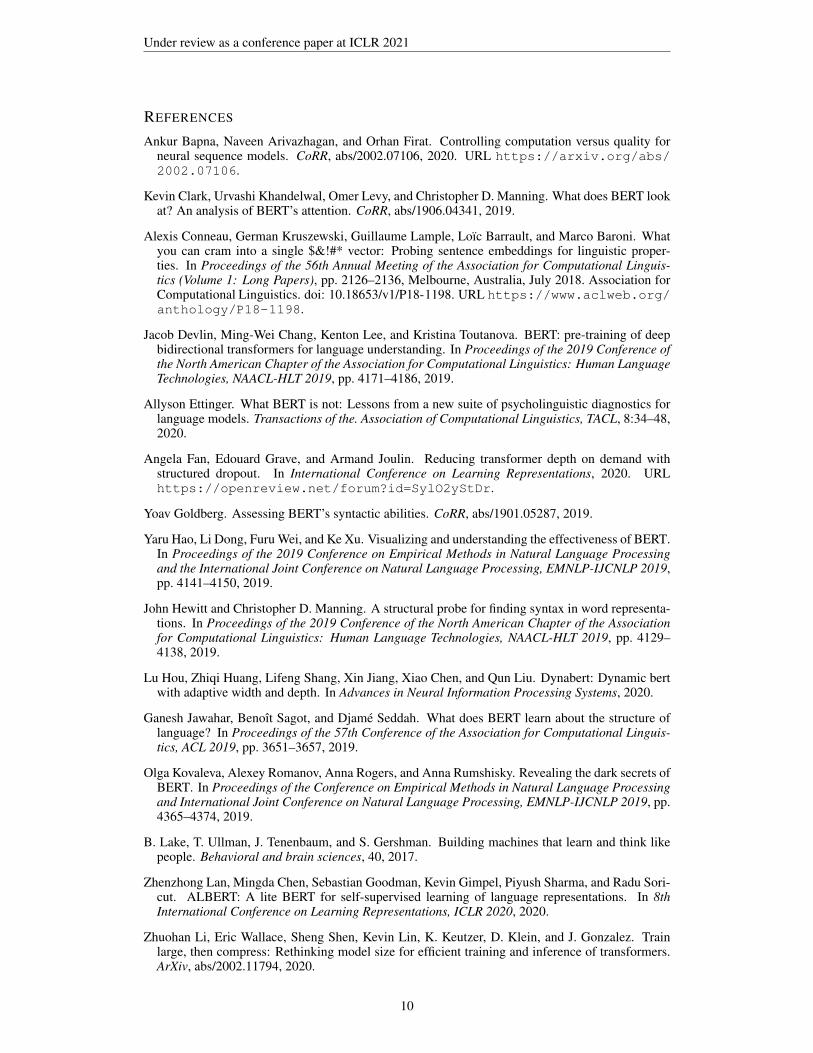
Table 4 summarizes our main findings. Findings (1), (2) and (3) indicate that, to a different extent, allmodels encode relevant knowledge about the hierarchical semantic relations included in WordNet.However, some of this knowledge is incorrect. In particular, as we mention in Section 5, we observethat the ability to learn about a concept depends on its frequency of appearances in the trainingcorpus and the level of specificity of its meaning. Furthermore, some concept categories resultdifficult for all model families, while some categories are particularly difficult for contextual modelssuch as CE. We hypothesize that stronger inductive biases are required to capture low-frequencyconcepts. Furthermore, we believe that new learning approaches are needed to discriminate accuratemeaning for high-frequency concepts. As expected, our findings indicate that model families havedifferent biases leading to different behaviors. Thus, our results can illuminate further research toimprove semantic capabilities by combining the strengths of each family of models. As an example,
8
Under review as a conference paper at ICLR 2021
SupportingFinding Evidence Involved Models
(1) All models encode a relevant amount of knowledge about semanticrelations in WordNet, but this knowledge contains imprecisions.
All All
(2) The ability to learn concept relations depends on how frequent andspecific are the concepts, affecting some model families heavier.
Fig. 3a-c NCE and GLM
(3) Concept difficulty is usually homogeneous within each model fam-ily. Some semantic categories challenge all models.
Table 3 All
(4) Some models encode stronger semantic knowledge than others,usually according to their family.
Tables 1, 2, 3 ELMo, BERT, RoBERTa,ALBERT, XLNet, T5
(5) Some models focus their encoding of semantic knowledge in spe-cific layers, and not distributed across all layers.
Table 1, Fig. 4 GLM
(6) Models have distinctive patterns as to where they encode semanticknowledge. Patterns are model-specific and not size-specific.
Table 1, Fig. 4 All
(7) Model size has an impact in the quality of the captured semanticknowledge, as seen in our layer-level probe tests.
Table 1, Fig. 4 ELMo, RoBERTa, AL-BERT, GPT-2, T5
(8) Semantic knowledge does not depend on pre-training corpus size. Tables 1, E-6 -
(9) Contextual models are unaffected by multi-sense words. Fig. 3d-f CE and GLM
Table 4: Summary of our main findings and their corresponding supporting evidence.
one could combine them as ensembles or by incorporating more than a single model head, eachone equipped with a different loss function (i.e., one generative approach resembling GLM-basedmethods and another discriminative resembling CE-based methods).
Findings (4), (5) and (6) suggest that instead of a standard finetuning of all layers of BERT accordingto a given downstream task, to improve semantic capabilities one could perform a task profiling todecide the best architecture for the task and also how to take advantage of it. By using only a limitednumber of layers or choosing a different learning rate for each layer, one could exploit the semanticknowledge that the pre-trained model carries, avoiding the degradation of this information presentat the top layers, especially when using T5, XLNet, or ALBERT-large. Accordingly, recent work onadaptive strategies to output predictions using a limited number of layers (Xin et al., 2020; Liu et al.,2020; Hou et al., 2020; Schwartz et al., 2020; Fan et al., 2020; Bapna et al., 2020) would benefitfrom using architectures that encode knowledge in the first layers. To the best of our knowledge,these works have only used BERT and RoBERTa, achieving a good trade-off between accuracy andefficiency. Only Zhou et al. (2020) has explored ALBERT, reporting improved accuracy by stoppingearlier. Our findings explain this behavior and suggest that T5 or XLNet may boot their results evenfurther as these architectures have sharper and higher information peaks in their first layers.
Findings (7) and (8) suggest that recent success in semantic NLP tasks might be due more to the useof larger models than large corpora for pretraining. This also suggests that to improve model perfor-mance in semantic tasks, one could train larger models even without increasing the corpus size. Asimilar claim has been proposed by Li et al. (2020) leading to empirical performance improvements.
Finally, finding (9) is important because it suggests that contextual models pay as much attention tothe context as to the target word, and are probably biased in favor of contextual information, evenif they are not based on the Masked-Language-Model setting. We believe that this inductive biascould be exploited even further in the design of the underlying architecture, thus this finding mightelucidate a design direction to encourage more effective learning of semantic knowledge.
8 CONCLUSIONS
In this work, we exploit the semantic conceptual taxonomy behind WordNet to test the abilities ofcurrent families of pre-trained language models to learn semantic knowledge from massive sourcesof unlabeled data. Our main conclusion is that, indeed, to a significant extent, these models learnrelevant knowledge about the organization of concepts in WordNet, but also contain several impre-cisions. We also notice that different families of models present dissimilar behavior, suggesting theencoding of different biases. As part of future work, we hope our study helps to inspire new ideas toimprove the semantic learning abilities of current pre-trained language models.
9
Under review as a conference paper at ICLR 2021
REFERENCES
Ankur Bapna, Naveen Arivazhagan, and Orhan Firat. Controlling computation versus quality forneural sequence models. CoRR, abs/2002.07106, 2020. URL https://arxiv.org/abs/2002.07106.
Kevin Clark, Urvashi Khandelwal, Omer Levy, and Christopher D. Manning. What does BERT lookat? An analysis of BERT’s attention. CoRR, abs/1906.04341, 2019.
Alexis Conneau, German Kruszewski, Guillaume Lample, Loıc Barrault, and Marco Baroni. Whatyou can cram into a single $&!#* vector: Probing sentence embeddings for linguistic proper-ties. In Proceedings of the 56th Annual Meeting of the Association for Computational Linguis-tics (Volume 1: Long Papers), pp. 2126–2136, Melbourne, Australia, July 2018. Association forComputational Linguistics. doi: 10.18653/v1/P18-1198. URL https://www.aclweb.org/anthology/P18-1198.
Jacob Devlin, Ming-Wei Chang, Kenton Lee, and Kristina Toutanova. BERT: pre-training of deepbidirectional transformers for language understanding. In Proceedings of the 2019 Conference ofthe North American Chapter of the Association for Computational Linguistics: Human LanguageTechnologies, NAACL-HLT 2019, pp. 4171–4186, 2019.
Allyson Ettinger. What BERT is not: Lessons from a new suite of psycholinguistic diagnostics forlanguage models. Transactions of the. Association of Computational Linguistics, TACL, 8:34–48,2020.
Angela Fan, Edouard Grave, and Armand Joulin. Reducing transformer depth on demand withstructured dropout. In International Conference on Learning Representations, 2020. URLhttps://openreview.net/forum?id=SylO2yStDr.
Yoav Goldberg. Assessing BERT’s syntactic abilities. CoRR, abs/1901.05287, 2019.
Yaru Hao, Li Dong, Furu Wei, and Ke Xu. Visualizing and understanding the effectiveness of BERT.In Proceedings of the 2019 Conference on Empirical Methods in Natural Language Processingand the International Joint Conference on Natural Language Processing, EMNLP-IJCNLP 2019,pp. 4141–4150, 2019.
John Hewitt and Christopher D. Manning. A structural probe for finding syntax in word representa-tions. In Proceedings of the 2019 Conference of the North American Chapter of the Associationfor Computational Linguistics: Human Language Technologies, NAACL-HLT 2019, pp. 4129–4138, 2019.
Lu Hou, Zhiqi Huang, Lifeng Shang, Xin Jiang, Xiao Chen, and Qun Liu. Dynabert: Dynamic bertwith adaptive width and depth. In Advances in Neural Information Processing Systems, 2020.
Ganesh Jawahar, Benoıt Sagot, and Djame Seddah. What does BERT learn about the structure oflanguage? In Proceedings of the 57th Conference of the Association for Computational Linguis-tics, ACL 2019, pp. 3651–3657, 2019.
Olga Kovaleva, Alexey Romanov, Anna Rogers, and Anna Rumshisky. Revealing the dark secrets ofBERT. In Proceedings of the Conference on Empirical Methods in Natural Language Processingand International Joint Conference on Natural Language Processing, EMNLP-IJCNLP 2019, pp.4365–4374, 2019.
B. Lake, T. Ullman, J. Tenenbaum, and S. Gershman. Building machines that learn and think likepeople. Behavioral and brain sciences, 40, 2017.
Zhenzhong Lan, Mingda Chen, Sebastian Goodman, Kevin Gimpel, Piyush Sharma, and Radu Sori-cut. ALBERT: A lite BERT for self-supervised learning of language representations. In 8thInternational Conference on Learning Representations, ICLR 2020, 2020.
Zhuohan Li, Eric Wallace, Sheng Shen, Kevin Lin, K. Keutzer, D. Klein, and J. Gonzalez. Trainlarge, then compress: Rethinking model size for efficient training and inference of transformers.ArXiv, abs/2002.11794, 2020.
10
Under review as a conference paper at ICLR 2021
Weijie Liu, Peng Zhou, Zhiruo Wang, Zhe Zhao, Haotang Deng, and Qi Ju. FastBERT: a self-distilling BERT with adaptive inference time. In Proceedings of the 58th Annual Meeting ofthe Association for Computational Linguistics, pp. 6035–6044, Online, July 2020. Associationfor Computational Linguistics. doi: 10.18653/v1/2020.acl-main.537. URL https://www.aclweb.org/anthology/2020.acl-main.537.
Yinhan Liu, Myle Ott, Naman Goyal, Jingfei Du, Mandar Joshi, Danqi Chen, Omer Levy, MikeLewis, Luke Zettlemoyer, and Veselin Stoyanov. RoBERTa: A robustly optimized BERT pre-training approach. CoRR, abs/1907.11692, 2019.
Paul Michel, Omer Levy, and Graham Neubig. Are sixteen heads really better than one? In Ad-vances in Neural Information Processing Systems 32: Annual Conference on Neural InformationProcessing Systems 2019, NeurIPS 2019, pp. 14014–14024, 2019.
Tomas Mikolov, Ilya Sutskever, Kai Chen, Gregory S. Corrado, and Jeffrey Dean. Distributed rep-resentations of words and phrases and their compositionality. In Advances in Neural InformationProcessing Systems 26, NIPS 2013, pp. 3111–3119, 2013.
George A. Miller. WordNet: A lexical database for english. Communications of the ACM, 38(11):39–41, 1995.
Jeffrey Pennington, Richard Socher, and Christopher D. Manning. GloVe: Global vectors for wordrepresentation. In Proceedings of the 2014 Conference on Empirical Methods in Natural Lan-guage Processing, EMNLP 2014, pp. 1532–1543, 2014.
Matthew Peters, Mark Neumann, Luke Zettlemoyer, and Wen-tau Yih. Dissecting contextual wordembeddings: Architecture and representation. In Proceedings of the 2018 Conference on Em-pirical Methods in Natural Language Processing, pp. 1499–1509, Brussels, Belgium, October-November 2018a. Association for Computational Linguistics. doi: 10.18653/v1/D18-1179. URLhttps://www.aclweb.org/anthology/D18-1179.
Matthew E. Peters, Mark Neumann, Mohit Iyyer, Matt Gardner, Christopher Clark, Kenton Lee,and Luke Zettlemoyer. Deep contextualized word representations. In Proceedings of the 2018Conference of the North American Chapter of the Association for Computational Linguistics:Human Language Technologies, NAACL-HLT 2018, pp. 2227–2237, 2018b.
Ofir Press, Noah A. Smith, and Omer Levy. Improving transformer models by reordering theirsublayers. In Proceedings of the 58th Annual Meeting of the Association for ComputationalLinguistics, ACL 2020, pp. 2996–3005, 2020.
Alec Radford, Jeffrey Wu, Rewon Child, David Luan, Dario Amodei, and Ilya Sutskever. Lan-guage models are unsupervised multitask learners. 2018. URL https://d4mucfpksywv.cloudfront.net/better-language-models/language-models.pdf.
Colin Raffel, Noam Shazeer, Adam Roberts, Katherine Lee, Sharan Narang, Michael Matena, YanqiZhou, Wei Li, and Peter J. Liu. Exploring the limits of transfer learning with a unified text-to-texttransformer. Journal of Machine Learning Research, 21:1–67, 2019.
Abhilasha Ravichander, Yonatan Belinkov, and E. Hovy. Probing the probing paradigm: Doesprobing accuracy entail task relevance? ArXiv, abs/2005.00719, 2020. URL https://arxiv.org/abs/2005.00719.
Emily Reif, Ann Yuan, Martin Wattenberg, Fernanda B. Viegas, Andy Coenen, Adam Pearce, andBeen Kim. Visualizing and measuring the geometry of BERT. In Advances in Neural InformationProcessing Systems 32: Annual Conference on Neural Information Processing Systems 2019,NeurIPS 2019, pp. 8592–8600, 2019.
Anna Rogers, Olga Kovaleva, and Anna Rumshisky. A primer in BERTology: What we know abouthow BERT works. CoRR abs/2002.12327, 2020.
Naomi Saphra and Adam Lopez. Understanding learning dynamics of language models with svcca.In NAACL-HLT (1), pp. 3257–3267, 2019. URL https://aclweb.org/anthology/papers/N/N19/N19-1329/.
11

Under review as a conference paper at ICLR 2021
Roy Schwartz, Gabriel Stanovsky, Swabha Swayamdipta, Jesse Dodge, and Noah A. Smith. Theright tool for the job: Matching model and instance complexities. In Proc. of ACL, 2020.
Chenglei Si, Shuohang Wang, Min-Yen Kan, and Jing Jiang. What does BERT learn from multiple-choice reading comprehension datasets? CoRR, abs/1910.12391, 2019.
Gongbo Tang, Rico Sennrich, and Joakim Nivre. An analysis of attention mechanisms: The case ofword sense disambiguation in neural machine translation. In Proceedings of the Third Conferenceon Machine Translation, WMT 2018, pp. 26–35, 2018.
Ian Tenney, Dipanjan Das, and Ellie Pavlick. BERT rediscovers the classical NLP pipeline. InProceedings of the 57th Conference of the Association for Computational Linguistics, ACL 2019,pp. 4593–4601, 2019a.
Ian Tenney, Patrick Xia, Berlin Chen, Alex Wang, Adam Poliak, R. Thomas McCoy, Najoung Kim,Benjamin Van Durme, Samuel R. Bowman, Dipanjan Das, and Ellie Pavlick. What do you learnfrom context? probing for sentence structure in contextualized word representations. In 7thInternational Conference on Learning Representations, ICLR 2019, 2019b.
Ashish Vaswani, Noam Shazeer, Niki Parmar, Jakob Uszkoreit, Llion Jones, Aidan N. Gomez,Lukasz Kaiser, and Illia Polosukhin. Attention is all you need. In Advances in Neural Infor-mation Processing Systems 30: Annual Conference on Neural Information Processing SystemsNIPS 2017, pp. 5998–6008, 2017.
Jesse Vig. A multiscale visualization of attention in the transformer model. In Proceedings of the57th Conference of the Association for Computational Linguistics, ACL 2019, pp. 37–42, 2019.
Elena Voita, Rico Sennrich, and Ivan Titov. The bottom-up evolution of representations in the trans-former: A study with machine translation and language modeling objectives. In Proceedings ofthe 2019 Conference on Empirical Methods in Natural Language Processing and the 9th Interna-tional Joint Conference on Natural Language Processing, EMNLP-IJCNLP 2019, pp. 4395–4405,2019a.
Elena Voita, David Talbot, Fedor Moiseev, Rico Sennrich, and Ivan Titov. Analyzing multi-headself-attention: Specialized heads do the heavy lifting, the rest can be pruned. In Proceedings ofthe 57th Conference of the Association for Computational Linguistics, ACL 2019, pp. 5797–5808,2019b.
Alex Wang, Amanpreet Singh, Julian Michael, Felix Hill, Omer Levy, and Samuel R. Bowman.GLUE: A multi-task benchmark and analysis platform for natural language understanding. InProceedings of the Workshop: Analyzing and Interpreting Neural Networks for NLP, Black-boxNLP@EMNLP 2018, pp. 353–355, 2018.
Ji Xin, Raphael Tang, Jaejun Lee, Yaoliang Yu, and Jimmy Lin. DeeBERT: Dynamic early exitingfor accelerating BERT inference. In Proceedings of the 58th Annual Meeting of the Associationfor Computational Linguistics, pp. 2246–2251, Online, July 2020. Association for ComputationalLinguistics. URL https://www.aclweb.org/anthology/2020.acl-main.204.
Yadollah Yaghoobzadeh, Katharina Kann, Timothy J. Hazen, Eneko Agirre, and Hinrich Schutze.Probing for semantic classes: Diagnosing the meaning content of word embeddings. In AnnaKorhonen, David R. Traum, and Lluıs Marquez (eds.), Proceedings of the 57th Conference of theAssociation for Computational Linguistics, ACL 2019, Florence, Italy, July 28- August 2, 2019,Volume 1: Long Papers, pp. 5740–5753. Association for Computational Linguistics, 2019. doi:10.18653/v1/p19-1574. URL https://doi.org/10.18653/v1/p19-1574.
Zhilin Yang, Zihang Dai, Yiming Yang, Jaime G. Carbonell, Ruslan Salakhutdinov, and Quoc V. Le.XLNet: Generalized autoregressive pretraining for language understanding. In Annual Confer-ence on Neural Information Processing Systems 2019, NeurIPS 2019, pp. 5754–5764, 2019.
Jingtao Zhan, Jiaxin Mao, Yiqun Liu, Min Zhang, and Shaoping Ma. An analysis of BERT indocument ranking. In Proceedings of the 43rd International ACM SIGIR conference on researchand development in Information Retrieval, SIGIR 2020, pp. 1941–1944, 2020.
Wangchunshu Zhou, Canwen Xu, Tao Ge, Julian McAuley, Ke Xu, and Furu Wei. Bert loses pa-tience: Fast and robust inference with early exit, 2020.
12

Under review as a conference paper at ICLR 2021
A IMPLEMENTATION DETAILS
A.1 EDGE PROBING CLASSIFIER DETAILS
To study the extent to which these Language Models deal with semantic knowledge, we extendthe methodology introduced by Tenney et al. (2019b). In that study, the authors defined a probingclassifier at the sentence level, training a supervised classifier with a task-specific label. The probingclassifier’s motivation consists of verifying when the sentence’s encoding help to solve a specifictask, quantifying these results for different word embeddings models. We cast this methodology todeal with semantic knowledge extracted from WordNet. Rather than working at the sentence level,we define an edge probing classifier that learns to identify if two concepts are semantically related.
To create the probing classifier, we retrieve all the glosses from the Princeton WordNet Gloss Cor-pus3. The dataset provides WordNet’s synsets gloss with manually matched words identifying thecontext-appropriate sense (see Figure 5). In WordNet, each sense is coded as one of the synsetsrelated to the concept (e.g., sense tendency.n.03 for the word tendency). Using a synset A and itsspecific sense provided by the tagged gloss, we retrieve from WordNet one of its direct or indirecthypernyms, denoted as B (see Figure 6). If WordNet defines two or more hypernyms for A, wechoose one of them at random. We sample a third synset C, at random from an unrelated section ofthe taxonomy, taking care that C is not related to either A or B (e.g., animal.n.01). Then, 〈A,B,C〉form a triplet that allows us to create six testing edges for our classifier: 〈A,B〉, which is com-pounded by a pair of related words through the semantic relation hypernym of, and five pairs ofunrelated words (〈A,C〉, 〈B,C〉, 〈B,A〉, 〈C,A〉, 〈C,B〉). We associate a label to each of thesepairs that show whether the pair is related or not (see Figure 6). Note that we define directed edges,meaning that the pair 〈A,B〉 is related, but 〈B,A〉 is unrelated to the relationship hypernym of.Accordingly, the edge probing classifier will need to identify the pair’s components and the order inwhich the concepts were declared in the pair.
“Having power or capacity or to absorb or soak up something”Gloss:
WordNet tag:
tendency
tendency.n.03
Figure 5: The Princeton WordNet Gloss Corpus provides sentences with manually annotated map-pings of words to their corresponding WordNet Synset (concept / sense).
< , > → < >< , > → < >< , > → < >< , > → < >< , > → < >< , > → < >tendency.n.03
disposition.n.04
animal.n.01
hypernym
A
B
C
nothypernym
nothypernym
not hypernym
not hypernym
not hypernym
A B
A C
B A
B C
C A
C Bpicked at random
100000
concept pairs labels
Figure 6: Each triplet is used to create related and unrelated pairs of words according to the relation-ship hypernym of. We create six edge probing pairs, and therefore, the edge probing classifier willneed to identify the pair’s components and the order in which the words were declared in the pair.
We create training and testing partitions ensuring that each partition has the same proportion ofleaves versus internal nodes. The latter is essential to identify related pairs. During training, weguarantee that each training synset is seen at least once by the probing classifier. To guarantee theabove, we sample each synset in the training set and sample some of its hypernyms at random.Then. we randomly sample some unrelated synset for each related pair that has no relation to any
3https://wordnetcode.princeton.edu/glosstag.shtml
13
Under review as a conference paper at ICLR 2021
of the words in the related pair. We create three partitions from this data on 70/15/15 for training,development, and testing foldings, respectively.
We train the MLP classifier using a weighted binary cross-entropy loss function. Since we have onepositive and five negative examples per triplet, we use a weighted loss function with weights 5 and1 for the positive and negative class, respectively. Accordingly, positive and negative examples havethe same relevance during training. We implemented the linear layer and the MLP classifier using afeed forward network with 384 hidden units. The MLP was trained using dropout at 0.425 and a L2
regularizer to avoid overfitting.
To create the vector representations for each of the word embeddings models considered in thisstudy, we concatenate the hidden state vectors of all the layers for each tagged synset. For bothCE and GLM-based models, each gloss was used as a context to build specific contextual wordembeddings. If the gloss has more than one tagged token, we take only the first of them for theanalysis.
A.2 WORDNET METRICS: DISTANCE
Formally, let dW (x, y) be the Wordnet distance between two synsets x, y, defined by:
dW (x, y) =
{dpath(x, y) if y is ancestor of x,dpath(x, z) + dpath(y, z) otherwise,
where dpath(x, y) is the length of the shortest path between x and y in WordNet, measured in numberof hops, and z is the closest common ancestor of x and y in the case that y is not an ancestor of x.
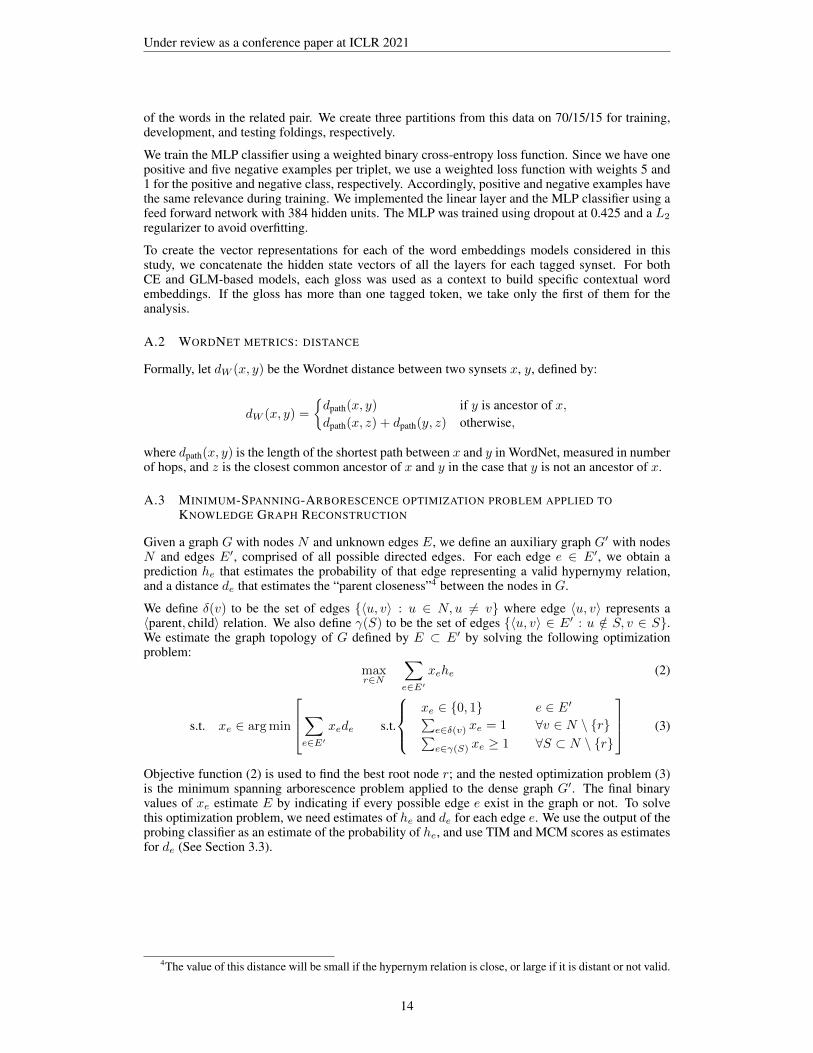
A.3 MINIMUM-SPANNING-ARBORESCENCE OPTIMIZATION PROBLEM APPLIED TOKNOWLEDGE GRAPH RECONSTRUCTION
Given a graph G with nodes N and unknown edges E, we define an auxiliary graph G′ with nodesN and edges E′, comprised of all possible directed edges. For each edge e ∈ E′, we obtain aprediction he that estimates the probability of that edge representing a valid hypernymy relation,and a distance de that estimates the “parent closeness”4 between the nodes in G.
We define δ(v) to be the set of edges {〈u, v〉 : u ∈ N, u 6= v} where edge 〈u, v〉 represents a〈parent, child〉 relation. We also define γ(S) to be the set of edges {〈u, v〉 ∈ E′ : u /∈ S, v ∈ S}.We estimate the graph topology of G defined by E ⊂ E′ by solving the following optimizationproblem:
maxr∈N
∑e∈E′
xehe (2)
s.t. xe ∈ argmin
∑e∈E′
xede s.t.
xe ∈ {0, 1} e ∈ E′∑e∈δ(v) xe = 1 ∀v ∈ N \ {r}∑e∈γ(S) xe ≥ 1 ∀S ⊂ N \ {r}
(3)
Objective function (2) is used to find the best root node r; and the nested optimization problem (3)is the minimum spanning arborescence problem applied to the dense graph G′. The final binaryvalues of xe estimate E by indicating if every possible edge e exist in the graph or not. To solvethis optimization problem, we need estimates of he and de for each edge e. We use the output of theprobing classifier as an estimate of the probability of he, and use TIM and MCM scores as estimatesfor de (See Section 3.3).
4The value of this distance will be small if the hypernym relation is close, or large if it is distant or not valid.
14
Under review as a conference paper at ICLR 2021
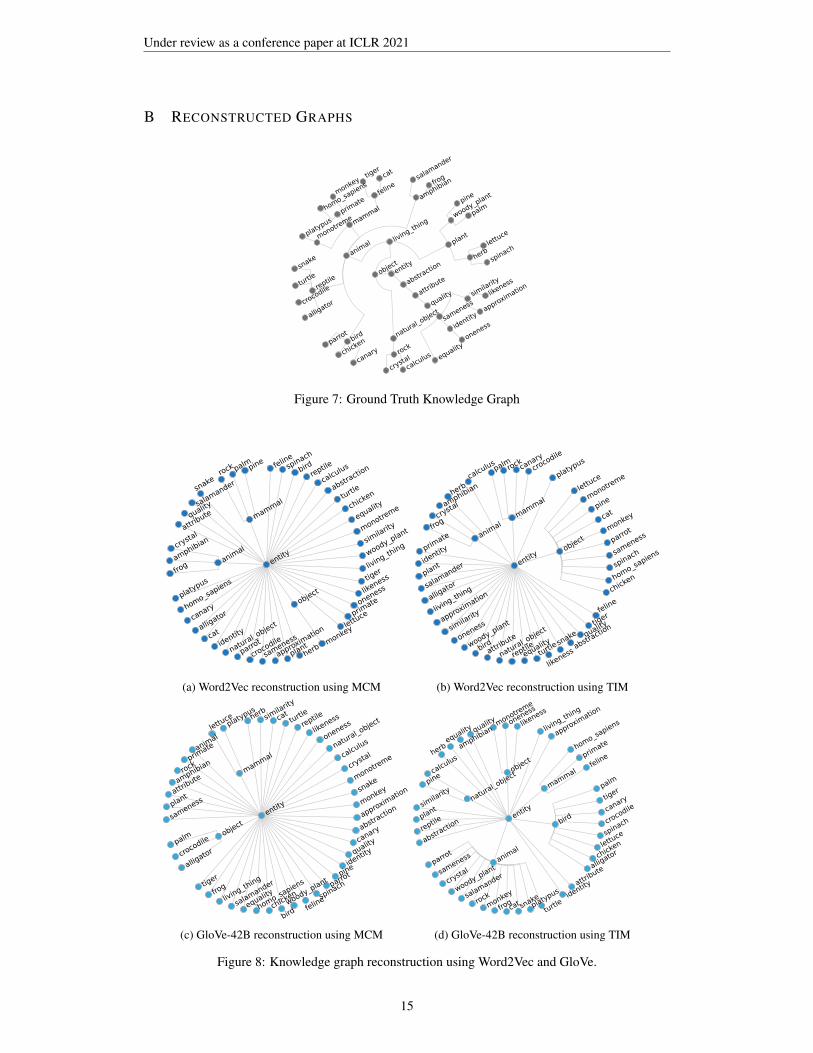
B RECONSTRUCTED GRAPHS
canarych
ickenpa
rrot
entity
likeness
appro
ximation
oneness
abstraction
objec
t
quality
alliga
torcro
codile
turtle
snake
pine
palm
lettuc
e
spinach
rock
calculus
crysta
l
sameness
platyp
us
animal pla
nt
salam
ander
frog
attribute
bird
reptile
mamm
al
amphibian
woody_p
lant
herb
homo
_sapie
nsmo
nkey
monotre
meprima
tefeline
similarity
identity
equality
tiger
cat
natur
al_objec
t
living_th
ing
Figure 7: Ground Truth Knowledge Graph
entity
frog
amphibiancry
stal
rock pa
lmpine
natur
al_objec
t
identitycat
alliga
torcanaryho
mo_sa
piens
platyp
us
animal
attributequalitysalam
ander
snake
mamm
al
felinespi
nach
birdrep
tile
calculus
abstraction
turtle
chicken
equality
monotre
me
similarity
woody_p
lant
living_th
ing
tiger
likeness
oneness
prima
te
lettuc
e
objec
t
herb
plant
appro
ximation
sameness
crocod
ile
parro
t monkey
(a) Word2Vec reconstruction using MCM
frogcry
stalamphibianhe
rb
palmroc
kcan
ary
crocod
ile
entity
lettuc
e
monotre
me
pine
cat
monkey
parro
t
sameness
spinach
homo
_sapie
ns
chicken
oneness
feline
appro
ximation
living_th
ingalliga
torsalam
ander
plant
identitypri
mate an
imal
calculus
mamm
al
platyp
us
objec
t
similarity
tiger
quality
abstraction
turtle
likenessna
tural_
objec
t
equality
reptile
snake
attribute
birdwo
ody_p
lant
(b) Word2Vec reconstruction using TIM
equality
salam
ander
living_th
ing
frogtig
er
objec
tsam
enesspla
ntatt
ributeamphibian
rockprima
teanimal
mamm
al
herbsim
ilarity
cat turtle
reptile
likeness
oneness
natur
al_objec
t
calculus
crysta
l
monotre
me
snake
monkey
appro
ximation
abstraction
canary
quality
identity
pine
parro
t
spinach
felinewo
ody_p
lant
bird
chicken
homo
_sapie
ns
alliga
torcrocod
ilepalm
lettuc
epla
typus
entity
(c) GloVe-42B reconstruction using MCM
monotre
me
oneness
likeness
homo
_sapie
ns
prima
te
feline
pine
calculus
entity
animal
abstraction
reptile
plant
similarity
natur
al_objec
t
herbequality
amphibianquality
objec
t
living_th
ing
appro
ximation
mamm
al
bird
attribute
identity
palm
tiger
canary
crocod
ile
spinach
lettuc
e
chicken
alliga
tor
turtlepla
typus
snake
catfrogmo
nkey
rocksal
amander
woody_p
lant
crysta
lsamenesspa
rrot
(d) GloVe-42B reconstruction using TIM
Figure 8: Knowledge graph reconstruction using Word2Vec and GloVe.
15

Under review as a conference paper at ICLR 2021
canary
plant
amphibian
bird
lettuc
e
woody_p
lant
reptile
platyp
us
catmonkey
herb
tiger
natur
al_objec
t
abstraction
animal
objec
t
attribute
entity
samenessap
proxim
ation
oneness
turtle
feline
homo
_sapie
ns
chicken
monotre
me
salam
ander
parro
t
prima
te
crocod
ile
spinach
palm
pine
alliga
tor
living_th
ingfrog
mamm
al
snake
crysta
lrock
calculus
likenesssim
ilarityide
ntityeq
uality
quality
(a) GPT-2-XL reconstruction using MCM
turtle
feline ide
ntity
appro
ximation
tigersal
amanderpa
lmprima
tesameness
oneness
similarity
equality
entity
likeness
lettuc
espinachwoody_p
lant
herb
rock
calculus
crysta
l
quality
objec
t
abstraction
natur
al_objec
t
animal
attribute
plant
bird
reptilecro
codile
canary
cat
alliga
torparro
t
pinech
icken
monotre
me
platyp
us
amphibian
snake
monkeyfrog
homo
_sapie
ns
mamm
al
living_th
ing
(b) GPT-2-XL reconstruction using TIM
tigerfel
inecry
stal
plant
natur
al_objec
tsamenessall
igatorprima
tewoody_p
lant
similarity
animal
monkey
parro
t
rock
crocod
ile
snake
frog
canary
cat
reptile
chicken
platyp
us
spinach
bird
oneness
monotre
meherb
calculus
qualitylike
ness
appro
ximation
abstraction
attribute
lettuc
e
living_th
ing
objec
t
entity
palm
equality
identity
amphibian
homo
_sapie
ns
turtlepin
esalam
ander
mamm
al
(c) T5-large reconstruction using MCM
monotre
mefrog
chickensnake
turtle
identity
equality
lettuc
ecat
feline
pine
monkey
amphibian
qualityab
straction
attributelike
ness
living_th
ing
objec
t
animalsim
ilarity
woody_p
lant
plantsam
eness
bird
crysta
l
appro
ximation
herb
reptile
rock
oneness
mamm
al
natur
al_objec
t
prima
te
alliga
tor
parro
t
tigercan
ary
crocod
ile
platyp
us
salam
ander
calculus
palmho
mo_sa
piens
spinach
entity
(d) T5-large reconstruction using TIM
Figure 9: Knowledge graph reconstruction using GPT-2 and T5.
16
Under review as a conference paper at ICLR 2021
amphibian
snake
monkey
alliga
tor
feline
frog
monotre
me
platyp
us
prima
te
parro
tbird
homo
_sapie
ns
reptile
spinach
palm
lettuc
e
crocod
ile
pine
rockcry
stal
animal
sameness
onenesseq
ualityab
straction
identitysim
ilaritylike
nessap
proxim
ation
herbch
icken
canary
woody_p
lant
natur
al_objec
t
tiger
turtlesal
amander
entity
attribute
living_th
ing
objec
t
cat
plant
mamm
al
quality
calculus
(a) ELMo-large reconstruction using MCM
attribute
canary
calculus
quality
turtle
feline
snake
reptile
prima
te
amphibian
monotre
me
bird
woody_p
lant
homo
_sapie
nsparro
t
monkey
similarityide
ntity
equalitylike
nessab
straction
appro
ximation
oneness
tiger
platyp
us
spinach
salam
ander
living_th
ingrock
crysta
l animal
objec
t
sameness
frog
chicken
palm
herb
pine
lettuc
e
entity
alliga
torcrocod
ile
mamm
al
plant
natur
al_objec
t
cat
(b) ELMo-large reconstruction using TIM
quality
oneness
similarity
sameness
identity
likeness
equality
herb
chicken
woody_p
lant
rockcry
stal
living_th
ing
animal
catreptile
mamm
al
plant
bird
entity
palm pin
e spinach
tiger
parro
t
natur
al_objec
t
objec
t
abstraction
appro
ximation
attribute
calculus
salam
ander
platyp
usmonkeycro
codileall
igatorpri
mateho
mo_sa
piens
feline
snake
amphibianmo
notre
mefrogtur
tle
lettuc
e
canary
(c) BERT-large reconstruction using MCM
abstraction
attributena
tural_
objec
t
objec
t
woody_p
lant
herb
monkey
snake
prima
te
chicken
similarity
crysta
l
living_th
ing
entity
calculus
homo
_sapie
ns
amphibian
lettuc
e
platyp
us
frog
feline
palm
pine tur
tle
likeness
equality
sameness
oneness
appro
ximation
alliga
torcanaryspi
nach
identity
animal
rock
bird
mamm
al
plant rep
tile
quality
salam
andertig
ercatparro
t
monotre
mecro
codile
(d) BERT-large reconstruction using TIM
quality
abstraction
likeness
entity
monotre
me
amphibian
monkey
homo
_sapie
ns
turtle
frog
feline
appro
ximation
equality
oneness
identity
similarity
sameness
crocod
iletiger
parro
tsalam
ander
alliga
tor
spinach
snake
chicken
mamm
al
herb
catrep
tile
prima
tepla
nt
woody_p
lant
bird
crysta
lcalculusroc
k
living_th
ing
objec
tnatur
al_objec
t
attribute
lettuc
ecanary
pinepa
lmanimal
platyp
us
(e) RoBERTa-large reconstruction using MCM
tiger
entity
abstraction
quality
similarity
mamm
al
reptile
bird
woody_p
lant
plant
herb
palm
lettuc
e
natur
al_objec
t
platyp
us
equality
identity
likeness
animal
canary
spinach
attribute
rock
crysta
l
objec
tcal
culus
living_th
ing
amphibian ap
proxim
ationtur
tle
chickenpine
frog
felinecat
monkey
monotre
meprima
tesna
ke
parro
talliga
tor
salam
ander
crocod
ile
homo
_sapie
ns
oneness
sameness
(f) RoBERTa-large reconstruction using TIM
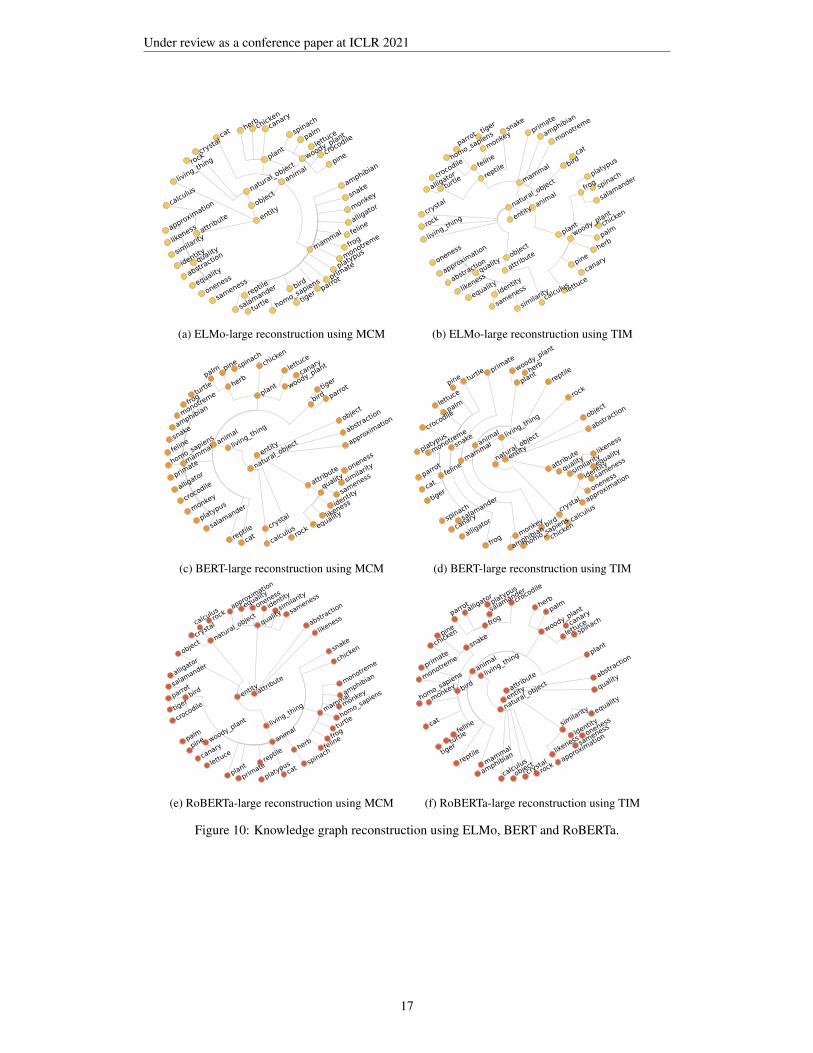
Figure 10: Knowledge graph reconstruction using ELMo, BERT and RoBERTa.
17
Under review as a conference paper at ICLR 2021
canaryfel
inesalam
ander
alliga
tormonkeytig
erparro
tplatyp
uscatfrog
crocod
ileturtle
chicken
entity
amphibian
prima
te
bird
reptile
plant
mamm
al snake
monotre
me
abstraction
quality
appro
ximation
spinach
palm he
rb
lettuc
epin
ewo
ody_p
lant
objec
t
natur
al_objec
t
attribute
living_th
ing
homo
_sapie
ns
similarity
likeness
identity
sameness
oneness
equality
animal
rock
calculus
crysta
l
(a) XLNet-large reconstruction using MCM
herb
woody_p
lant
cat
monotre
me
feline
canary
salam
ander
alliga
torspi
nachcro
codile
platyp
us
calculus
crysta
l
living_th
ing
animal
natur
al_objec
t
attribute
objec
t
tiger
homo
_sapie
ns
abstraction
quality
identity ap
proxim
ation
similarity
likeness
frogpa
lmpin
etur
tlechickenlet
tuce
entity
bird
rock
reptile
mamm
alpla
nt
prima
te
amphibian
parro
t
monkey
snake
samenesson
eness
equality
(b) XLNet-large reconstruction using TIM
entity
chicken
turtlefro
gpalmcro
codiletig
er
monotre
me
quality
woody_p
lant
herb
prima
terep
tile
platyp
us
amphibian
snakesal
amander
cat
calculus
rock
living_th
ingplant
crysta
l
animal
equality
oneness
abstraction
objec
tnatur
al_objec
t
attribute
canary
alliga
torpine
lettuc
e
likeness
identity
appro
ximation
sameness
similarity
spinach
homo
_sapie
ns
parro
tmonkey
bird
mamm
al
feline
(c) ALBERT-large reconstruction using MCM
similarity
attribute
quality
chicken
palm
sameness
identity cro
codile
pine
turtle
homo
_sapie
ns
likeness
equality
calculus
snake pa
rrot
monkey
cat
woody_p
lant
feline
reptile
prima
te
amphibian
planthe
rb
alliga
tor
lettuc
e
platyp
us
frog
tiger
salam
ander
natur
al_objec
tabstraction
canary
appro
ximation
oneness
monotre
me
bird
mamm
al
entity
spinach
objec
t
animal
rock
crysta
lliving_th
ing
(d) ALBERT-large reconstruction using TIM
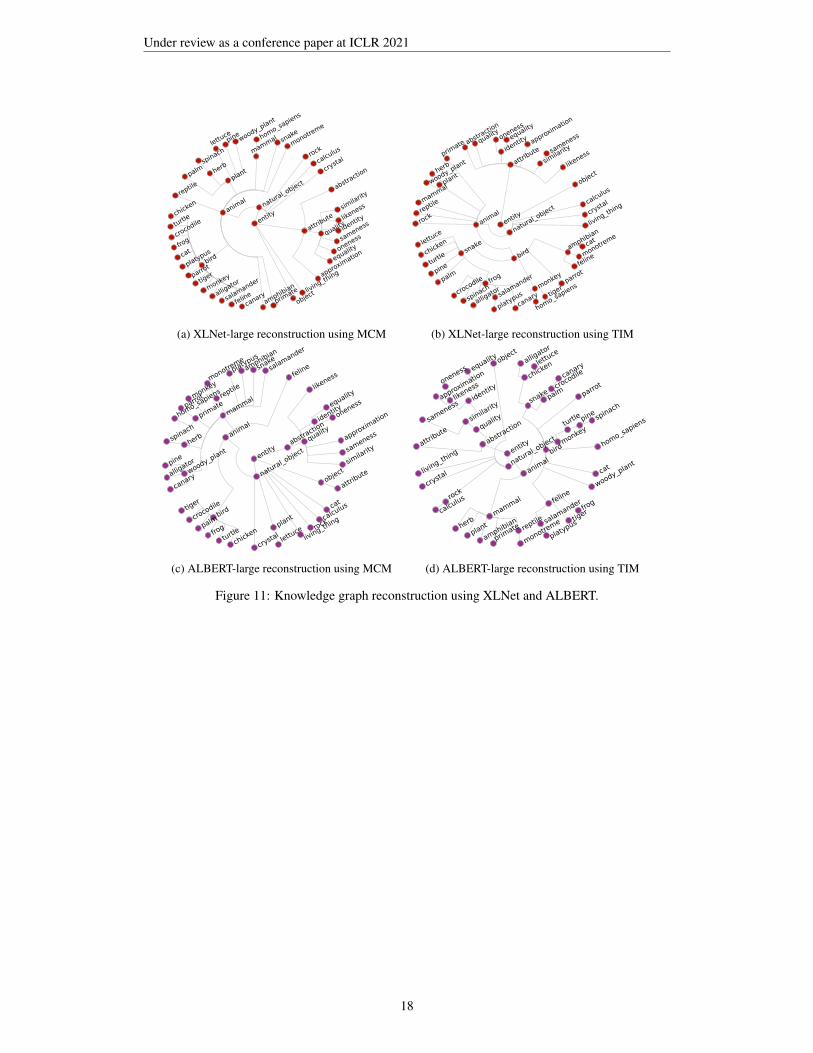
Figure 11: Knowledge graph reconstruction using XLNet and ALBERT.
18
Under review as a conference paper at ICLR 2021
C FURTHER ANALYSIS OF FACTORS’ IMPACT IN MODELS PERFORMANCE
40% 50% 60% 70% 80% 90% 100%Concept Depth (in the WordNet Graph)
0.70
0.75
0.80
0.85
0.90
Med
ian
F1-s
core
Word2VectorGloVe-42BGPT2-XLT5-largeELMo-largeBERT-largeRoBERTa-largeXLNet-largeALBERT-xxlarge
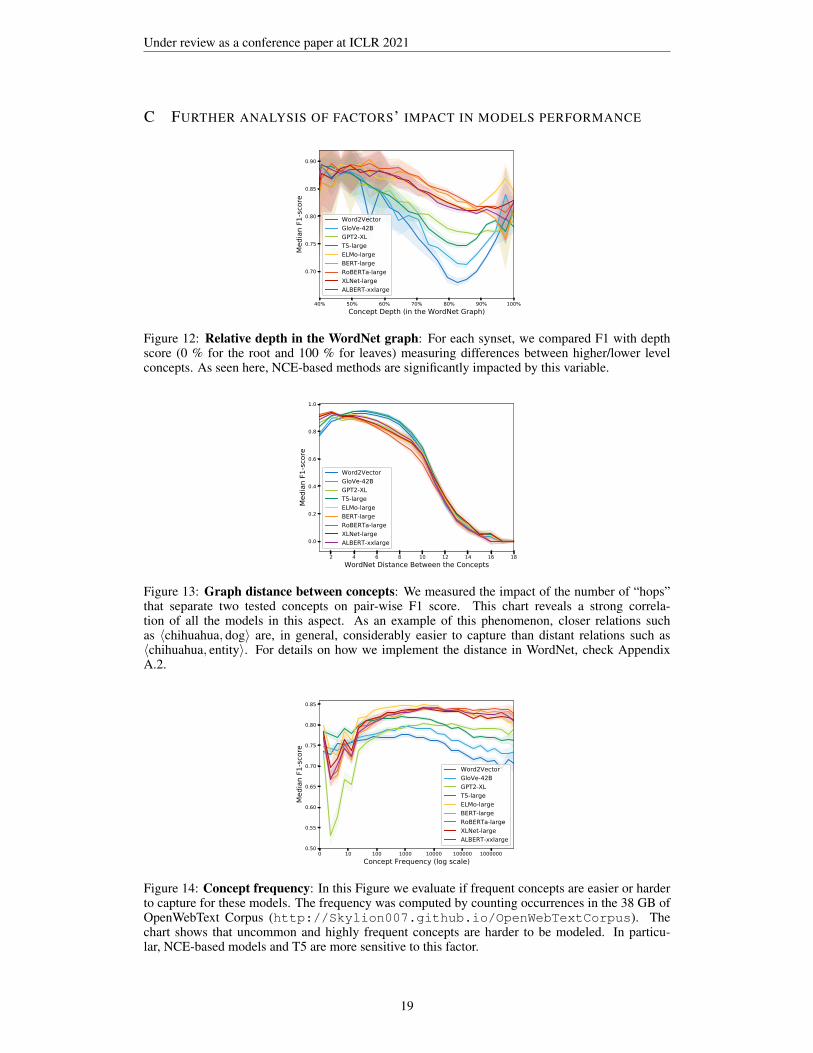
Figure 12: Relative depth in the WordNet graph: For each synset, we compared F1 with depthscore (0 % for the root and 100 % for leaves) measuring differences between higher/lower levelconcepts. As seen here, NCE-based methods are significantly impacted by this variable.
2 4 6 8 10 12 14 16 18WordNet Distance Between the Concepts
0.0
0.2
0.4
0.6
0.8
1.0
Med
ian
F1-s
core
Word2VectorGloVe-42BGPT2-XLT5-largeELMo-largeBERT-largeRoBERTa-largeXLNet-largeALBERT-xxlarge
Figure 13: Graph distance between concepts: We measured the impact of the number of “hops”that separate two tested concepts on pair-wise F1 score. This chart reveals a strong correla-tion of all the models in this aspect. As an example of this phenomenon, closer relations suchas 〈chihuahua, dog〉 are, in general, considerably easier to capture than distant relations such as〈chihuahua, entity〉. For details on how we implement the distance in WordNet, check AppendixA.2.
0 10 100 1000 10000 100000 1000000Concept Frequency (log scale)
0.50
0.55
0.60
0.65
0.70
0.75
0.80
0.85
Med
ian
F1-s
core
Word2VectorGloVe-42BGPT2-XLT5-largeELMo-largeBERT-largeRoBERTa-largeXLNet-largeALBERT-xxlarge
Figure 14: Concept frequency: In this Figure we evaluate if frequent concepts are easier or harderto capture for these models. The frequency was computed by counting occurrences in the 38 GB ofOpenWebText Corpus (http://Skylion007.github.io/OpenWebTextCorpus). Thechart shows that uncommon and highly frequent concepts are harder to be modeled. In particu-lar, NCE-based models and T5 are more sensitive to this factor.
19

Under review as a conference paper at ICLR 2021
2 4 6 8 10 12 14 16Number of Direct or Indirect Parent Nodes
0.60
0.65
0.70
0.75
0.80
0.85
Med
ian
F1-s
core
Word2VectorGloVe-42BGPT2-XLT5-largeELMo-largeBERT-largeRoBERTa-largeXLNet-largeALBERT-xxlarge
0 5 10 15 20 25Number of Direct or Indirect Child Nodes
0.60
0.65
0.70
0.75
0.80
0.85
0.90
0.95
Med
ian
F1-s
core
Word2VectorGloVe-42BGPT2-XLT5-largeELMo-largeBERT-largeRoBERTa-largeXLNet-largeALBERT-xxlarge
Figure 15: Number of parent and child nodes: We studied if the number of parents or child nodeshave an impact on F1-scores. The same phenomenons show up when we analyze only direct parentsor children.
2 4 6 8 10 12 14 16 18 20Number of Senses
0.68
0.70
0.72
0.74
0.76
0.78
0.80
0.82
0.84
0.86
Med
ian
F1-s
core
Word2VectorGloVe-42BGPT2-XLT5-largeELMo-largeBERT-largeRoBERTa-largeXLNet-largeALBERT-xxlarge
2 4 6 8 10Sense Ranking
0.68
0.70
0.72
0.74
0.76
0.78
0.80
0.82
0.84
0.86
Med
ian
F1-s
core
Word2VectorGloVe-42BGPT2-XLT5-largeELMo-largeBERT-largeRoBERTa-largeXLNet-largeALBERT-xxlarge
Figure 16: Number of Senses and Sense Ranking: We studied if models are impacted by multi-sense concepts such as “period”, and by their sense ranking (how frequent or rare those senses are).Surprisingly contextualized models, and specially CE models have no significant impact by thisfactor, suggesting that these models are very effective at deducing the correct sense based on theircontext. These charts also suggest that these models may be considering context even more than thewords themselves. This is intuitive for Masked-Language-Models such as BERT, but not for others,such as GPT-2. Non-contextualized models are impacted by this factor, as expected.
2 4 6 8 10 12 14 16 18 20Number of Sibling Nodes
0.70
0.72
0.74
0.76
0.78
0.80
0.82
0.84
0.86
Med
ian
F1-s
core
Word2VectorGloVe-42BGPT2-XLT5-largeELMo-largeBERT-largeRoBERTa-largeXLNet-largeALBERT-xxlarge
1 2 3 4 5 6 7Number of Synonyms
0.70
0.72
0.74
0.76
0.78
0.80
0.82
0.84
0.86
Med
ian
F1-s
core
Word2VectorGloVe-42BGPT2-XLT5-largeELMo-largeBERT-largeRoBERTa-largeXLNet-largeALBERT-xxlarge
Figure 17: Number of sibling nodes and number of synonyms: We discover that these factors havevery low impact on F1-scores. The fact that siblings are not confused leads to similar conclusionsas the ones provided in Figure 16.
20
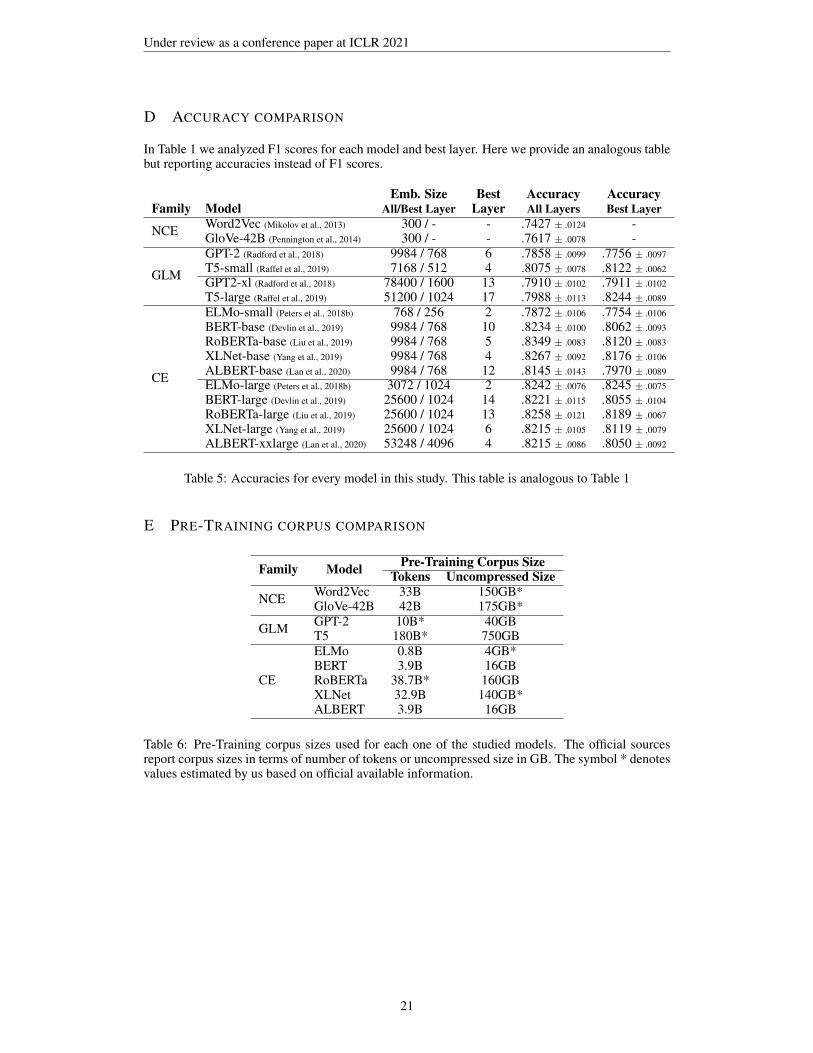
Under review as a conference paper at ICLR 2021
D ACCURACY COMPARISON
In Table 1 we analyzed F1 scores for each model and best layer. Here we provide an analogous tablebut reporting accuracies instead of F1 scores.
Emb. Size Best Accuracy AccuracyFamily Model All/Best Layer Layer All Layers Best Layer
NCE Word2Vec (Mikolov et al., 2013) 300 / - - .7427 ± .0124 -GloVe-42B (Pennington et al., 2014) 300 / - - .7617 ± .0078 -
GLM
GPT-2 (Radford et al., 2018) 9984 / 768 6 .7858 ± .0099 .7756 ± .0097
T5-small (Raffel et al., 2019) 7168 / 512 4 .8075 ± .0078 .8122 ± .0062
GPT2-xl (Radford et al., 2018) 78400 / 1600 13 .7910 ± .0102 .7911 ± .0102
T5-large (Raffel et al., 2019) 51200 / 1024 17 .7988 ± .0113 .8244 ± .0089
CE
ELMo-small (Peters et al., 2018b) 768 / 256 2 .7872 ± .0106 .7754 ± .0106
BERT-base (Devlin et al., 2019) 9984 / 768 10 .8234 ± .0100 .8062 ± .0093
RoBERTa-base (Liu et al., 2019) 9984 / 768 5 .8349 ± .0083 .8120 ± .0083
XLNet-base (Yang et al., 2019) 9984 / 768 4 .8267 ± .0092 .8176 ± .0106
ALBERT-base (Lan et al., 2020) 9984 / 768 12 .8145 ± .0143 .7970 ± .0089
ELMo-large (Peters et al., 2018b) 3072 / 1024 2 .8242 ± .0076 .8245 ± .0075
BERT-large (Devlin et al., 2019) 25600 / 1024 14 .8221 ± .0115 .8055 ± .0104
RoBERTa-large (Liu et al., 2019) 25600 / 1024 13 .8258 ± .0121 .8189 ± .0067
XLNet-large (Yang et al., 2019) 25600 / 1024 6 .8215 ± .0105 .8119 ± .0079
ALBERT-xxlarge (Lan et al., 2020) 53248 / 4096 4 .8215 ± .0086 .8050 ± .0092
Table 5: Accuracies for every model in this study. This table is analogous to Table 1
E PRE-TRAINING CORPUS COMPARISON
Family Model Pre-Training Corpus SizeTokens Uncompressed Size
NCE Word2Vec 33B 150GB*GloVe-42B 42B 175GB*
GLM GPT-2 10B* 40GBT5 180B* 750GB
CE
ELMo 0.8B 4GB*BERT 3.9B 16GBRoBERTa 38.7B* 160GBXLNet 32.9B 140GB*ALBERT 3.9B 16GB
Table 6: Pre-Training corpus sizes used for each one of the studied models. The official sourcesreport corpus sizes in terms of number of tokens or uncompressed size in GB. The symbol * denotesvalues estimated by us based on official available information.
21
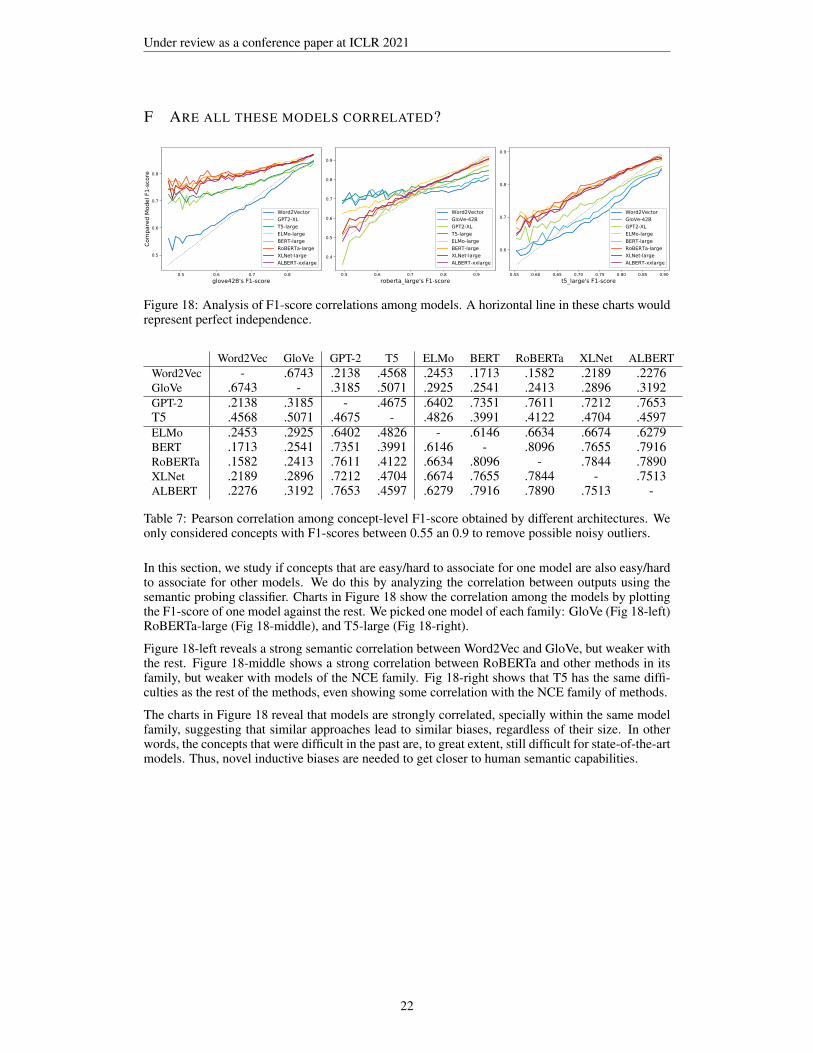
Under review as a conference paper at ICLR 2021
F ARE ALL THESE MODELS CORRELATED?
0.55 0.60 0.65 0.70 0.75 0.80 0.85 0.90
t5_large's F1-score
0.6
0.7
0.8
0.9
Word2Vector
GloVe-42B
GPT2-XL
ELMo-large
BERT-large
RoBERTa-large
XLNet-large
ALBERT-xxlarge
0.5 0.6 0.7 0.8 0.9
roberta_large's F1-score
0.4
0.5
0.6
0.7
0.8
0.9
Word2Vector
GloVe-42B
GPT2-XL
T5-large
ELMo-large
BERT-large
XLNet-large
ALBERT-xxlarge
0.5 0.6 0.7 0.8
glove42B's F1-score
0.5
0.6
0.7
0.8
Com
pare
d M
odel F1
-sco
re
Word2Vector
GPT2-XL
T5-large
ELMo-large
BERT-large
RoBERTa-large
XLNet-large
ALBERT-xxlarge
Figure 18: Analysis of F1-score correlations among models. A horizontal line in these charts wouldrepresent perfect independence.
Word2Vec GloVe GPT-2 T5 ELMo BERT RoBERTa XLNet ALBERTWord2Vec - .6743 .2138 .4568 .2453 .1713 .1582 .2189 .2276GloVe .6743 - .3185 .5071 .2925 .2541 .2413 .2896 .3192GPT-2 .2138 .3185 - .4675 .6402 .7351 .7611 .7212 .7653T5 .4568 .5071 .4675 - .4826 .3991 .4122 .4704 .4597ELMo .2453 .2925 .6402 .4826 - .6146 .6634 .6674 .6279BERT .1713 .2541 .7351 .3991 .6146 - .8096 .7655 .7916RoBERTa .1582 .2413 .7611 .4122 .6634 .8096 - .7844 .7890XLNet .2189 .2896 .7212 .4704 .6674 .7655 .7844 - .7513ALBERT .2276 .3192 .7653 .4597 .6279 .7916 .7890 .7513 -
Table 7: Pearson correlation among concept-level F1-score obtained by different architectures. Weonly considered concepts with F1-scores between 0.55 an 0.9 to remove possible noisy outliers.
In this section, we study if concepts that are easy/hard to associate for one model are also easy/hardto associate for other models. We do this by analyzing the correlation between outputs using thesemantic probing classifier. Charts in Figure 18 show the correlation among the models by plottingthe F1-score of one model against the rest. We picked one model of each family: GloVe (Fig 18-left)RoBERTa-large (Fig 18-middle), and T5-large (Fig 18-right).
Figure 18-left reveals a strong semantic correlation between Word2Vec and GloVe, but weaker withthe rest. Figure 18-middle shows a strong correlation between RoBERTa and other methods in itsfamily, but weaker with models of the NCE family. Fig 18-right shows that T5 has the same diffi-culties as the rest of the methods, even showing some correlation with the NCE family of methods.
The charts in Figure 18 reveal that models are strongly correlated, specially within the same modelfamily, suggesting that similar approaches lead to similar biases, regardless of their size. In otherwords, the concepts that were difficult in the past are, to great extent, still difficult for state-of-the-artmodels. Thus, novel inductive biases are needed to get closer to human semantic capabilities.
22
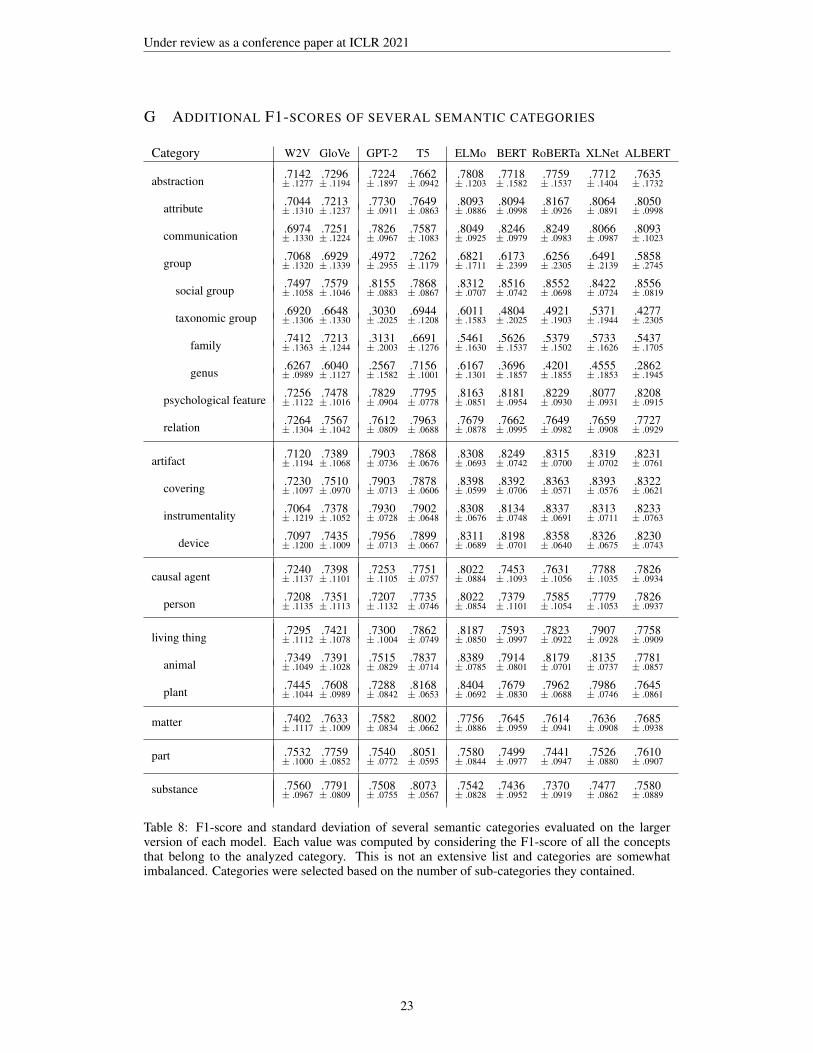
Under review as a conference paper at ICLR 2021
G ADDITIONAL F1-SCORES OF SEVERAL SEMANTIC CATEGORIES
Category W2V GloVe GPT-2 T5 ELMo BERT RoBERTa XLNet ALBERT
abstraction.7142 .7296 .7224 .7662 .7808 .7718 .7759 .7712 .7635± .1277 ± .1194 ± .1897 ± .0942 ± .1203 ± .1582 ± .1537 ± .1404 ± .1732
attribute.7044 .7213 .7730 .7649 .8093 .8094 .8167 .8064 .8050± .1310 ± .1237 ± .0911 ± .0863 ± .0886 ± .0998 ± .0926 ± .0891 ± .0998
communication.6974 .7251 .7826 .7587 .8049 .8246 .8249 .8066 .8093± .1330 ± .1224 ± .0967 ± .1083 ± .0925 ± .0979 ± .0983 ± .0987 ± .1023
group.7068 .6929 .4972 .7262 .6821 .6173 .6256 .6491 .5858± .1320 ± .1339 ± .2955 ± .1179 ± .1711 ± .2399 ± .2305 ± .2139 ± .2745
social group.7497 .7579 .8155 .7868 .8312 .8516 .8552 .8422 .8556± .1058 ± .1046 ± .0883 ± .0867 ± .0707 ± .0742 ± .0698 ± .0724 ± .0819
taxonomic group.6920 .6648 .3030 .6944 .6011 .4804 .4921 .5371 .4277± .1306 ± .1330 ± .2025 ± .1208 ± .1583 ± .2025 ± .1903 ± .1944 ± .2305
family.7412 .7213 .3131 .6691 .5461 .5626 .5379 .5733 .5437± .1363 ± .1244 ± .2003 ± .1276 ± .1630 ± .1537 ± .1502 ± .1626 ± .1705
genus.6267 .6040 .2567 .7156 .6167 .3696 .4201 .4555 .2862± .0989 ± .1127 ± .1582 ± .1001 ± .1301 ± .1857 ± .1855 ± .1853 ± .1945
psychological feature.7256 .7478 .7829 .7795 .8163 .8181 .8229 .8077 .8208± .1122 ± .1016 ± .0904 ± .0778 ± .0851 ± .0954 ± .0930 ± .0931 ± .0915
relation.7264 .7567 .7612 .7963 .7679 .7662 .7649 .7659 .7727± .1304 ± .1042 ± .0809 ± .0688 ± .0878 ± .0995 ± .0982 ± .0908 ± .0929
artifact.7120 .7389 .7903 .7868 .8308 .8249 .8315 .8319 .8231± .1194 ± .1068 ± .0736 ± .0676 ± .0693 ± .0742 ± .0700 ± .0702 ± .0761
covering.7230 .7510 .7903 .7878 .8398 .8392 .8363 .8393 .8322± .1097 ± .0970 ± .0713 ± .0606 ± .0599 ± .0706 ± .0571 ± .0576 ± .0621
instrumentality.7064 .7378 .7930 .7902 .8308 .8134 .8337 .8313 .8233± .1219 ± .1052 ± .0728 ± .0648 ± .0676 ± .0748 ± .0691 ± .0711 ± .0763
device.7097 .7435 .7956 .7899 .8311 .8198 .8358 .8326 .8230± .1200 ± .1009 ± .0713 ± .0667 ± .0689 ± .0701 ± .0640 ± .0675 ± .0743
causal agent.7240 .7398 .7253 .7751 .8022 .7453 .7631 .7788 .7826± .1137 ± .1101 ± .1105 ± .0757 ± .0884 ± .1093 ± .1056 ± .1035 ± .0934
person.7208 .7351 .7207 .7735 .8022 .7379 .7585 .7779 .7826± .1135 ± .1113 ± .1132 ± .0746 ± .0854 ± .1101 ± .1054 ± .1053 ± .0937
living thing.7295 .7421 .7300 .7862 .8187 .7593 .7823 .7907 .7758± .1112 ± .1078 ± .1004 ± .0749 ± .0850 ± .0997 ± .0922 ± .0928 ± .0909
animal.7349 .7391 .7515 .7837 .8389 .7914 .8179 .8135 .7781± .1049 ± .1028 ± .0829 ± .0714 ± .0785 ± .0801 ± .0701 ± .0737 ± .0857
plant.7445 .7608 .7288 .8168 .8404 .7679 .7962 .7986 .7645± .1044 ± .0989 ± .0842 ± .0653 ± .0692 ± .0830 ± .0688 ± .0746 ± .0861
matter .7402 .7633 .7582 .8002 .7756 .7645 .7614 .7636 .7685± .1117 ± .1009 ± .0834 ± .0662 ± .0886 ± .0959 ± .0941 ± .0908 ± .0938
part .7532 .7759 .7540 .8051 .7580 .7499 .7441 .7526 .7610± .1000 ± .0852 ± .0772 ± .0595 ± .0844 ± .0977 ± .0947 ± .0880 ± .0907
substance .7560 .7791 .7508 .8073 .7542 .7436 .7370 .7477 .7580± .0967 ± .0809 ± .0755 ± .0567 ± .0828 ± .0952 ± .0919 ± .0862 ± .0889
Table 8: F1-score and standard deviation of several semantic categories evaluated on the largerversion of each model. Each value was computed by considering the F1-score of all the conceptsthat belong to the analyzed category. This is not an extensive list and categories are somewhatimbalanced. Categories were selected based on the number of sub-categories they contained.
23