Tracking climate mitigation efforts in 30 major emitters
42
Tracking climate mitigation efforts in 30 major emitters OCTOBER 2021 Economy-wide projections and progress on key sectoral policies Leonardo Nascimento Takeshi Kuramochi Niklas Illenseer NewClimate Institute Nicklas Forsell Miroslav Batka IIASA Colin Subtil Nicolas Lancesseur FTSE Russell AUTHORS:
-
Upload
khangminh22 -
Category
Documents
-
view
1 -
download
0
Transcript of Tracking climate mitigation efforts in 30 major emitters

Tracking climate mitigation efforts in 30 major emitters
OCTOBER 2021
Economy-wide projections and progress on key sectoral policies
Leonardo Nascimento Takeshi Kuramochi Niklas Illenseer NewClimate Institute
Nicklas Forsell Miroslav Batka IIASA
Colin Subtil Nicolas Lancesseur FTSE Russell
AUTHORS:
Tracking climate mitigation efforts in 30 major emitters
Tracking climate mitigation efforts in 30 major emitters Economy-wide projections and progress on key sectoral policies
Project number 821016
© NewClimate Institute, IIASA and FTSE Russell 2021
Authors
Leonardo Nascimento, Takeshi Kuramochi, Niklas Illenseer (NewClimate Institute) Nicklas Forsell, Miroslav Batka (IIASA) Colin Subtil, Nicolas Lancesseur (FTSE Russell) Acknowledgments This report was co-developed by NewClimate Institute, IIASA and FTSE Russell. This analysis builds on the work by Nascimento et al. (2021) developed together with the Netherlands Environmental Assessment Agency (PBL). The project team would like to thank Niklas Höhne for his comments. We are also grateful to FTSE Russell for helping to fund this research. Suggested citation Nascimento, L., Forsell, N., Batka, M., Kuramochi, T., Illenseer, N., Subtil, C., & Lancesseur, N. (2021). Tracking climate mitigation efforts in 30 major emitters: Economy-wide projections and progress on key sectoral policies. Available at: https://newclimate.org/publications/ Cover picture: Jessica Moore via Getty Images Icons made by Freepik from flaticon.com
Download the report http://newclimate.org/publications/
Tracking climate mitigation efforts in 30 major emitters
NewClimate Institute | October 2021 i
Executive summary Reducing global greenhouse gas (GHG) emissions to zero is a crucial step to minimise the worst effects of climate change. The growing political consensus on the dangers of climate change and the increasing number of climate policies implemented is a sign for cautious optimism. Countries increasingly recognise the need to achieve net zero emissions globally by mid-century but still need to implement near-term policy actions and measures to ensure this long-term ambition trigger the transformation necessary to meet the collective goals of the Paris Agreement.
This report documents near-term climate policies and measures adopted in the 30 major economies and assesses resulting future GHG emissions trajectories up to 2030. The countries analysed jointly account for 80% of total GHG emissions in 2019.
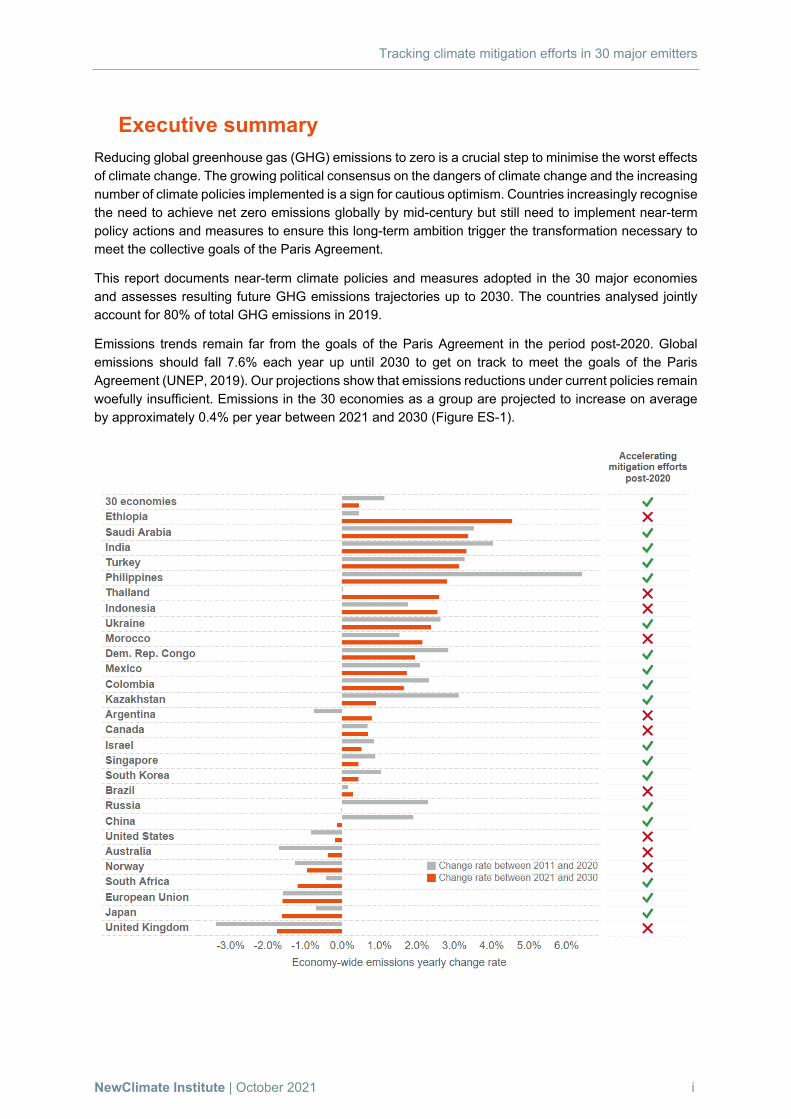
Emissions trends remain far from the goals of the Paris Agreement in the period post-2020. Global emissions should fall 7.6% each year up until 2030 to get on track to meet the goals of the Paris Agreement (UNEP, 2019). Our projections show that emissions reductions under current policies remain woefully insufficient. Emissions in the 30 economies as a group are projected to increase on average by approximately 0.4% per year between 2021 and 2030 (Figure ES-1).

Tracking climate mitigation efforts in 30 major emitters
NewClimate Institute | October 2021 ii
Almost two-thirds of the countries analysed will accelerate their efforts in the 2020s; countries with increasing emissions are expected to increase them slower and countries with decreasing emissions are projected to decrease them faster. Together, these countries are projected to cover 63% of the group’s emissions in 2030.
Our analysis shows that 2030 emissions in the large emitters are on track to stabilise but remain significantly above 2015 levels in several countries. Collectively, emissions under current policies in the group of 30 countries is expected to stay between a slight decrease of 1% to a moderate increase of 5% in comparison to 2015. This range is driven by the uncertainty in current policy projections, especially in fast growing economies. While large variation across countries is seen, the emissions reductions progress in some economies, like the EU, Japan, South Africa and the UK, is offset by increase in emissions elsewhere.
In the 30 economies analysed, sectors represent a key entry point to accelerate emissions reductions in the coming decade. These key policy interventions remain crucial short-term steps to keep the Paris Agreement goals within reach:
• Phase out coal in electricity supply • Significantly increase share of renewable electricity • Build only low-carbon installations in emissions-intensive industries • Significantly increase electric vehicle share in new sales • Stop sales of internal combustion vehicles • Build only near-zero energy buildings • Rollout of best practice approaches in agricultural production • Significantly reduce gross deforestation

Tracking climate mitigation efforts in 30 major emitters
NewClimate Institute | October 2021 iii
Table of Contents List of Figures .......................................................................................................................................... iv
List of Tables ........................................................................................................................................... iv
Abbreviations ............................................................................................................................................ v
1 Introduction ....................................................................................................................................... 1
1.1 Context and objective of this report ....................................................................................... 1
1.2 Summary of methods ............................................................................................................ 2
2 Cross-country findings ...................................................................................................................... 3
3 Economy-wide emissions projections ............................................................................................... 6
3.1 Europe (the EU, Norway and the United Kingdom)............................................................... 6
3.2 North America (Canada, Mexico and the USA) ..................................................................... 8
3.3 South America (Argentina, Brazil, Chile, Colombia) ........................................................... 10
3.4 China ................................................................................................................................... 12
3.5 High-income Asia Pacific countries (Australia, Japan, South Korea and Singapore) ......... 12
3.6 Fast-growing Asian countries (India, Indonesia, Malaysia, Thailand and the Philippines) . 14
3.7 Sub-Saharan Africa (Democratic Republic of the Congo, Ethiopia and South Africa) ........ 17
3.8 Former Soviet Union (Kazakhstan, Russia and Ukraine) .................................................... 19
3.9 Middle East and North Africa (Israel, Morocco, Saudi Arabia and Turkey) ......................... 21
4 Progress on key sectoral policy interventions ................................................................................ 23
4.1 Energy supply ...................................................................................................................... 24
4.2 Industry ................................................................................................................................ 26
4.3 Buildings .............................................................................................................................. 27
4.4 Transport ............................................................................................................................. 28
4.5 Agriculture and Forestry ...................................................................................................... 29
References ............................................................................................................................................ 31

Tracking climate mitigation efforts in 30 major emitters
NewClimate Institute | October 2021 iv
List of Figures Figure 1: Countries average emissions change rate per year .................................................................. i
Figure 2: Countries average emissions change rate per year. ............................................................... 3
Figure 3: Greenhouse emissions projections, including land use, in 2030 compared to 2015 levels..... 4
Figure 4: Sectoral emissions trends in the past three decades. ........................................................... 23
Figure 5: Share of renewables in electricity generation in the 30 economies analysed. ...................... 25
Figure 6: Number of low-carbon steel projects implemented in selected countries .............................. 26
List of Tables Table 1: Emissions projections under current policies for Europe. ......................................................... 7
Table 2: Emissions projections under current policies for North America. .............................................. 9
Table 3: Emissions projections under current policies for South America. ........................................... 10
Table 4: Emissions projections under current policies for China. ......................................................... 12
Table 5: Emissions projections under current policies for High-income Asia Pacific countries. ........... 13
Table 6: Emissions projections under current policies for Fast-growing Asian countries. .................... 16
Table 7: Emissions projections under current policies for Sub-Saharan Africa. ................................... 18
Table 8: Emissions projections under current policies for Former Soviet Union. .................................. 20
Table 9: Emissions projections under current policies for Middle East and North Africa. ..................... 21
Table 10: Selected policy interventions to accelerate emission reductions post-2020. ........................ 24
Table 11: National targets for phasing-out from sales of combustion-engine vehicles. ........................ 28

Tracking climate mitigation efforts in 30 major emitters
NewClimate Institute | October 2021 v
Abbreviations AFOLU Agriculture, Forestry and Other Land Use BAU business-as-usual CAT Climate Action Tracker CCS Carbon capture and storage CH4 Methane CO2 carbon dioxide CO2e carbon dioxide equivalent ETS emissions trading system G4M IIASA’s Global Forest Model GDP gross domestic product GHG greenhouse gas GLOBIOM IIASA's Global Biosphere Management Model GWP Global Warming Potential IPCC Intergovernmental Panel on Climate Change km/l kilometre per litre LULUCF land use, land-use change, and forestry MJ megajoule (million joules) Mt megatonne (million tonnes) Mtoe million tonnes of oil equivalent MW megawatt (million watts) NYDF NDC
New York Declaration on Forests nationally determined contribution
PBL Netherlands Environmental Assessment Agency (Planbureau voor de Leefomgeving) PV photovoltaic t tonne (thousand kilograms) TPES total primary energy supply TWh terawatt-hour UNFCCC United Nations Framework Convention on Climate Change

Tracking climate mitigation efforts in 30 major emitters
NewClimate Institute | October 2021 1
1 Introduction
1.1 Context and objective of this report The Paris Agreement established a framework where most countries agreed to “hold the increase in the global average temperature to well below 2°C above pre-industrial levels and pursue efforts to limit the temperature increase to 1.5°C above pre-industrial levels” by the end of the century (UNFCCC, 2015). To accomplish these goals, countries must collectively reduce global emissions to net-zero by mid-century (IPCC, 2018).
The adoption of short-term, ambitious climate- and energy-related policies, hereafter climate policies, is a crucial step to curb down emissions. The number of climate policies adopted has increased in the past twenty years and they have helped to reduce emissions (Eskander and Fankhauser, 2020; Nascimento, Kuramochi, Iacobuta, et al., 2021). To assess the effect of implemented climate policies on future emissions trajectories remains important to understand whether these policies are sufficient to meet the Paris Agreement temperature goals. It helps to hold countries accountable to their commitments and allows for timely course corrections.
However, models that estimate emission trajectories based on current policies may not always keep pace with fast changes on the ground. Several ambitious commitments have started to appear in countries across the globe (Höhne et al., 2020). To analyse the prevalence of key sector policy interventions can complement the analysis of emissions trajectories. It may show whether sufficient transformations, that could lead to acceleration of emission reductions, are in place.
In this report, we provide an overview of projected greenhouse gas emissions up to 2030, considering existing climate, energy and land use policies. We develop and analyse projections for 30 countries1: Argentina, Australia, Brazil, Canada, Chile, China, Colombia, Democratic Republic of the Congo, Ethiopia, the European Union (EU), India, Indonesia, Israel, Japan, Kazakhstan, South Korea, Malaysia, Mexico, Morocco, Norway, the Philippines, Russia, Saudi Arabia, Singapore, South Africa, Thailand, Turkey, Ukraine, the United Kingdom, and the United States. These 30 countries cover all of the G20 countries but exclude the three individual EU member states (i.e. Germany, France and Italy) and accounted for 80% of total global GHG emissions in 2019 (Olivier and Peters, 2020; FAOSTAT, 2021).
We also investigate recent developments in the analysed countries in terms of key sectoral policy interventions, that are considered important short-term policy benchmarks to meet the collective goals of the Paris Agreement. The adoption of these key policy interventions does not ensure emissions reductions in line with the Paris Agreement goals. However, their absence represents a clear opportunity for ambition raising. A gap in the coverage of these policies indicate that further emissions can be reduced in the countries analysed.
This research has been supported by funding from FTSE Russell. The data on current policies trajectories were used by FTSE Russell’s team to make an extensive assessment of sovereign issuers’ alignment with the Paris Agreement. These assessments are used in a report published in the context of COP26 (see Lancesseur et al., 2021)2. The implementation status of climate targets is a valuable information for investors both from Paris alignment and transition risk perspectives.
1 We use the term ‘country’ to refer to both the EU, excluding the UK, and the remaining 29 economies. 2 Lancesseur, N., Subtil, C., Cros, C., Kooroshy, K., Bourne, E. and Nicole, W., 2021, The COP26 Net Zero Atlas, 2021, FTSE Russell
Tracking climate mitigation efforts in 30 major emitters
NewClimate Institute | October 2021 2
1.2 Summary of methods In this report, the current policies scenario assumes that no additional mitigation action is taken beyond the currently implemented policies as of the end of 2020. Due the number of updated NDCs and net zero targets submitted in 2021, the cut-off date for these targets and announcements is October 2021. Country-specific tables might include policies adopted in 2021, but these are not included in the projections, unless stated otherwise. A more detailed description of the policies included in the quantification for each country is included in Nascimento et al. (2021).
Whenever possible, current policy trajectories reflect all implemented policies, which are defined here as legislative decisions, executive orders, or their equivalent. This excludes publicly announced plans or strategies but includes policy instruments to implement such plans or strategies. We do not assume that targets will be achieved even when they are enshrined in the form of a law or a strategy document. Ultimately, however, these definitions could be interpreted differently and involve some degree of subjective judgement. This definition of a current policies scenario is consistent with den Elzen et al. (2019) and Kuramochi et al. (2021).
NewClimate Institute and IIASA estimated the impact of the most effective current policies on future GHG emissions. IIASA developed projections for the LULUCF sector and NewClimate for the remaining sectors. The combined projections cover all relevant sectors and include the effect of COVID-19. LSEG, IIASA and NewClimate reviewed key sectoral trends and benchmarks that could reduce emissions beyond current policy projections. The main methods used in this report are presented in detail in the Methodological Annex and are described in detail elsewhere (Kuramochi, Fekete, et al., 2018; den Elzen et al., 2019; Fekete et al., 2021; Kuramochi et al., 2021). Policies adopted in 2021 are excluded from our projections, unless stated otherwise.

Tracking climate mitigation efforts in 30 major emitters
NewClimate Institute | October 2021 3
2 Cross-country findings Under the framework of the Paris Agreement, countries have agreed to make efforts to limit temperature increase to 1.5°C by the end of the century. This limit implies that greenhouse gas emissions need to be reduced to net zero by mid-century. In this Chapter, we analyse emissions trends across the 30 countries analysed, both in comparison to 2015 levels, the year the Paris Agreement was ratified, and the yearly change rate to assess the trend in the period post-2020.
Emissions trends remain far from the goals of the Paris Agreement in the period post-2020
Strong climate change mitigation action in the following decade is fundamental to keep the door open to reach the temperature goals of the Paris Agreement. Global emissions should fall 7.6% each year up until 2030 to get on track to meet the goals of the Paris Agreement (UNEP, 2019). However, our projections show that emissions growth under current policies remain woefully insufficient. Emissions in the 30 economies as a group are projected to increase approximately 0.4% per year between 2021 and 2030 (Figure 1).
Figure 1: Countries average emissions change rate per year in the 2010s compared to the projected change rate in the 2020s. The decadal growth rates exclude outliers, which may include the years 2020 and 2021 due to the short-term effect of COVID-19 and natural disturbances in land use emissions.

Tracking climate mitigation efforts in 30 major emitters
NewClimate Institute | October 2021 4
Urgent and strong short-term action is necessary in top emitters to show true climate leadership. Emissions in some major emitting countries are expected to decrease between 2021 and 2030. Ten countries, that are projected to correspond to 65% of the group’s emissions in 2030, present negative yearly change rates in the coming decade. Countries with the steepest emissions reductions per year are the UK (-1.7%), Japan (-1.6%) and the EU (-1.6%). However, annual emissions decrease in these climate frontrunners are expected to remain below what is necessary to meet the goals of the Paris Agreement.
Climate mitigation efforts are projected to accelerate but pace remains insufficient
By comparing the expected growth rate in two subsequent decades, we can identify countries that are expected to accelerate climate mitigation efforts in the period post-2020. The 30 economies’ group is projected to accelerate its mitigation efforts in the coming decade. The average growth rate will be reduced from 1.1% in the 2010s to 0.4% in the 2020s.
Almost two-thirds of the countries analysed will accelerate their efforts in the 2020s; countries with increasing emissions are expected to increase them slower and countries with decreasing emissions are projected to decrease them faster. Together, these countries are projected to cover 63% of the group’s emissions in 20303.
2030 emissions in major emitters are on track to stabilise but remain significantly above 2015 levels in most countries
Figure 2: Greenhouse gas emissions projections, including land use, in 2030 compared to 2015 levels.
The emissions reductions progress in some economies, like the EU, Japan, South Africa and the UK, is outweighed by increase in emissions elsewhere. Collectively, emissions under current policies in the 30 economies analysed is projected to stay between a slight decrease of 1% to an increase of 5% in comparison to 2015. Both ends of the range show insufficient emissions reductions lined up for the next
3 We cannot compare the growth rates for Chile and Malaysia due to high land use emissions variation in the 2010s.

Tracking climate mitigation efforts in 30 major emitters
NewClimate Institute | October 2021 5
decade. Additional policies are necessary in the group, which cover 80% of current global emissions (Olivier and Peters, 2020; FAOSTAT, 2021).
Even though overall emissions in the group do not show sufficient decrease in emissions, significant variation across countries exist. The five top performing countries, with emissions significantly below 2015 levels are: Norway (-33%), the UK (-29%), Japan (-26%), the EU (-26%) and South Africa (-22%). The worst five performing countries, with emissions significantly above 2015 levels are: the Philippines (+64%), the Democratic Republic of the Congo (+58%), Turkey (+58%), Saudi Arabia (+55%) and Malaysia (+53%). This spread in emissions growth has shrunk over time but emissions in 17 countries analysed are still projected to remain above 2015 levels.
Key sectoral policy interventions remain largely absent in the countries analysed and represent key entry points for ambition raising efforts
Economy-wide emissions reductions under current policies are expected to remain insufficient in the next decade to meet the collective goals of the Paris Agreement. The implementation of good practice sectoral policies advances climate change mitigation efforts and remains necessary to curb global emissions. We assess progress on a set of short-term policy interventions that can help to accelerate mitigation efforts.
In the 30 economies analysed, none of the sectors analysed are sufficiently advanced when compared to 1.5°C compatible sectoral benchmarks. These key policy interventions remain crucial short-term steps to keep the Paris Agreement goals within reach:
• Phase out coal in electricity supply • Significantly increase share of renewable electricity • Build only low-carbon installations in emissions-intensive industries • Significantly increase electric vehicle (EV) share in new sales • Stop sales of internal combustion vehicles • Build only near-zero energy buildings • Rollout of best practice approaches in agricultural production • Step net deforestation
We observe some progress on the energy supply and transport sectors, even though emissions in these sectors still trend up. Renewable electricity policies or targets are in force but need a stringency boost. Less than a third of the countries analysed have targets or policies in place to bring the share of renewables in electricity generation within a Paris compatible global range. Countries with coal-based energy supply are still projected to rely on coal for the coming decade. Only three of the analysed countries have set a coal phase out date. Support for low-carbon vehicles increased. Phase out dates for sales of combustion engine motors is set in a few of the analysed countries and electric vehicle sales have picked up speed but fall short of 1.5°C compatible benchmarks.
Progress in the other sectors – Industry, Buildings and Agriculture and Forestry – remain heterogenous and represent bottlenecks to accelerate emissions reductions in the coming decade. Very few full-scale, low-carbon projects exist in emissions-intensive industrial production. Taken together, these projects represent only a tiny fraction of the global industrial sector. A handful of the countries analysed to have net zero buildings targets and policies, but the implementation status remains universally poor. Policies, targets, and actions need to be implemented to ensure a peak and fast reduction of agriculture emissions and enforcement of net deforestation policies still need to be improved.

Tracking climate mitigation efforts in 30 major emitters
NewClimate Institute | October 2021 6
3 Economy-wide emissions projections In this Chapter, we present emissions trajectories under the current policies for the 30 analysed economies. We describe emissions trends in comparison to 2015, the year of adoption of the Paris Agreement, and in terms of the yearly emissions change rate in the coming decade. Global emissions should fall 7.6% each year up until 2030 to get on track to meet the goals of the Paris Agreement (UNEP, 2019).
We include emissions trajectories for each country, including land use emissions. Emissions and removals from land use are much more susceptible to year-to-year fluctuation due to aspects such as peat fires and natural disturbances. This is particularly relevant for countries with large areas of forest and peat (such as Brazil, Indonesia, Malaysia and the Democratic Republic of the Congo). However, due to methodological limitations, natural disturbances and peat fires are not included in these projections and thus only shown in the historical emissions trajectory, if included in the national reporting of greenhouse gas inventories.
Projections presented in this report are based on a larger set of currently implemented policies than the subset presented in the below. The policies presented do not constitute a comprehensive set but a selection of the most relevant, recent policies adopted. Emissions values, or percentage change compared to 2015, presented in the text are based on the average between the minimum and maximum of the emissions projection’s ranges.
For context, we also present country’s NDC targets, as presented in the official submissions. We also present net zero targets. Net zero targets are long-term targets that define the year when the country expects to reach carbon or climate neutrality – emissions and sinks balance each other out. Most net zero targets are not yet well defined in terms of their scope, architecture and transparency (Climate Action Tracker, 2021). We therefore only access whether the country has proposed or submitted a net zero target, the target year and whether the target is legally binding. We also include the date of submission of the long-term strategy (LTS), if any has been submitted to the UNFCCC. LTSs are not directly linked to net zero targets but indicate existing efforts to develop a long-term vision for the country’s mitigation efforts.
The regions used below group together countries i) in the same geographical region, ii) with similar economic profile, or iii) that have similar emissions trends. The regions defined in this report do not imply any association between the countries within the same group, except for analytical considerations.
3.1 Europe (the EU, Norway and the UK) The EU, Norway, and the UK together represented approximately 8% of global emissions in 2019. Emissions in this group are largely driven by the EU, the 4th biggest emitter in the world (Olivier and Peters, 2020; FAOSTAT, 2021). Emissions in the EU, Norway and the UK are declining since before the 90s, even though Norway’s historical emissions show much more fluctuation due to land use emissions. These three countries have targets that require emissions reductions below current levels and multiple policies to support them.
Emissions for the EU are projected to decrease by approximately 1.6% per year in the period post-2020 and to be 25% below 2015 levels in 2030. The EU submitted a stronger 2030 NDC target, committing to an emissions reduction of 55% below 1990 (previously 40%). As part of the Green Deal, the EU has also put forward a plan to reach climate neutrality by 2050 and provides sectoral plans for emissions reductions (European Commission, 2020).The uncertainty range in the EU projections mostly refer to the difference between aggregated member-state policies (upper range) and EU-level policies (lower range).

Tracking climate mitigation efforts in 30 major emitters
NewClimate Institute | October 2021 7
In Norway, emissions are expected to decrease by about 0.9% per year post-2020 and reach 33% below 2015 levels in 2030. Norway’s electricity generation is already almost entirely renewable – hydropower makes up about 95% of the electricity mix (Norwegian Ministry of Petroleum and Energy, 2019). Emissions from Norway’s industry sector in particular play a large role due to its large oil and gas extraction sector. However, the emissions intensity of Norwegian oil and gas extraction is much lower than the world average, in part because of Norway’s carbon tax already introduced in 1991.
Emissions for the UK are projected to decrease by approximately 1.7% per year post-2020 and current policy projections in 2030 are on average 29% below 2015 levels. In 2019, the UK adopted its net zero emissions target. With regard to energy-related emissions in particular, the UK has presented a myriad of measures to reduce emissions to diversify its energy mix and expects to phase out of coal by 2024 (UK Government, 2019). In the lead up to COP26, the UK has submitted an updated Long-term Strategy unpacking the nation’s path towards net zero (Government of the UK, 2021).
Table 1: Emissions projections under current policies for Europe.
EUROPEAN UNION
Emissions trajectories Additional information
NDC
Emissions reductions of at least 55% below 1990 levels by 2030
Long-term target
- Net zero target by 2050 - LTS submitted (2020)
Main policies (selected) - EU ETS Directive (2003/2018). Cap on emissions from electricity/heat
and industry to reduce emissions by 43% below 2005 levels by 2030. - Effort Sharing Legislation [2018/842] (2018). Establishes binding
annual emissions targets for Member States until 2030 covering sectors outside the EU ETS by 30% below 2005 levels by 2030.
- European Green Deal (2019). Roadmap of key policies to achieve a transition to a low-carbon and sustainable economy including the climate neutrality target by 2050.
- EU Farm to Fork Strategy (2019). Part of the European Green Deal, a strategy by the European Commission related to fair, healthy and environmentally friendly food systems. The strategy aims to accelerate the transition to a sustainable food system that helps mitigate climate change.
- EU LULUCF Regulation [2018/841] (2018). Provides updated accounting rules and a no-debit rule that all Member States have to ensure that the accounted GHG emissions from the LULUCF sector are balanced by at least equivalent removals.
NORWAY
Emissions trajectories Additional information
NDC
Emissions reductions of at least 50% and towards 55% below 1990 levels by 2030
Long-term target
- Net zero target by 2050 (not legally binding)
- LTS submitted (2020)
Main policies (selected) - Climate Action Plan (2021). Sets sectoral strategies of emissions
reductions, particularly transportation and the carbon tax. - National Transport Plan 2018-2029 (2017). This plan includes sectoral
emissions reductions targets, diversification of fuel mix, technological and infrastructure improvements.
- Climate Change Act (2017). Facilitates implementation of national climate targets, enshrines 2030 and 2050 reduction targets and frequent reviewing processes into law.

Tracking climate mitigation efforts in 30 major emitters
NewClimate Institute | October 2021 8
Table 1: Emissions projections under current policies for Europe (continued).
UNITED KINGDOM
Emissions trajectories Additional information
NDC
Emissions reductions of 68% below 1990 levels by 2030
Long-term target
- Net zero target by 2050 - LTS submitted (2018)
Main policies (selected) - Climate Change Act (2008/2019). Framework policy for climate change
mitigation. The 6th carbon budget proposed by the Committee on Climate Change (CCC) sets an emission reduction levels for 2030 of 68% compared with 1990 levels.
- Ten Point Plan for a Green Industrial Revolution (2020). Defines policy interventions in the energy, buildings, transport, nature, and technologies sectors.
- Climate Change Levy (2001/2018). Amended in 2018 to increase the tax levels over time. It taxes the supply of energy in the industry, commerce, and public sectors.
3.2 North America (Canada, Mexico and the USA) Canada, Mexico and the United States together are responsible for approximately 15% of global emissions in 2019. Emissions in this group are largely driven by the United States, the 2nd biggest emitter in the world (Olivier and Peters, 2020; FAOSTAT, 2021).
In Canada, emissions are expected to grow approximately 0.7% per year in the period post-2020 but ultimately plateau around 2015 values. This is especially due to the short-term effect of the COVID-19 pandemic and the enforcement of regulation to reduce fugitive emissions from fossil fuel exploration. Canada’s emissions are still projected to increase in the period between 2020 and 2030. The effect of COVID-19 is partially counterweighted by increased transport emissions projections. Canada’s fuel efficiency standards are linked to that of the United States and the roll backs of policies under the Trump administration also resulted in weakened and delayed standards in Canada.
Mexico is the only country in the region with emissions projected to be significantly higher in comparison to 2015 levels by 2030. Emissions are expected to grow approximately by 1.7% per year in the period post-2020 and reach 20% above 2015 levels by 2030. The effect of the pandemic delays emissions increase, which would otherwise reach higher values in 2030. This comes as recent policy development continue to annul and even backtrack progress on climate action. For example, a government decision from March 2021 will allow fossil-fuelled plants to obtain clean-energy certificates originally intended exclusively for renewable energy suppliers. Mexico is the only country in the region with an increasing land use sinks in the period post-2020.
Emissions in the United States are projected to decrease approximately 0.2% per year in the period post-2020 and be 8% lower in 2030 compared to 2015 levels. Policy developments since President Biden took office are not yet reflected in the country’s emissions projections. The Leaders’ Summit on Climate and Infrastructure Investment and Jobs Act indicate that the country will play a larger role in international climate policy and that emissions projections will likely be revised downwards. However, the effect of these recent developments on emissions remains to be seen.

Tracking climate mitigation efforts in 30 major emitters
NewClimate Institute | October 2021 9
Table 2: Emissions projections under current policies for North America.
CANADA
Emissions trajectories Additional information
NDC
Emissions reductions of 40-45% below 2005 levels by 2030
Long-term target
- No net zero target - LTS submitted (2016)
Main policies (selected) - Zero Emission Vehicle Infrastructure Deployment (2020). Aims for a
30% share of low-emissions vehicles in new light-duty vehicle sales by 2030 (10% by 2025 and 100% by 2040).
- Greenhouse Gas Pollution Pricing Act (2018). Establishes a federal price on emissions. It consists of a carbon levy on small emitters (under 50 ktCO2e/year) and a cap-and-trade system/output-based pricing system on industrial facilities (over 50 ktCO2e/year).
- Federal Greenhouse Gas Offset System [Under Development]. Would cover activities not covered by carbon pricing and initially focus on voluntary projects in agriculture, waste, and forestry.
- Regulations to address methane in the oil and gas sector (2018). Reduce CH4 emissions from oil and gas by 40-45% by 2025, relative to 2012.
MEXICO
Emissions trajectories Additional information
NDC
Unconditional emissions reductions of 22% (36% conditional) below business as usual by 2030
Long-term target
- No net zero target - LTS submitted (2016)
Main policies (selected) - Emissions Trading Scheme (2018). The pilot National emissions
trading started operation in 2020. The regulatory framework for the ETS is expected to be fully operational by 2023.
- Energy Transition Law (2015). A regulatory framework targeting clean energy, energy efficiency and emissions reductions. It includes a clean electricity supply target of 35% by 2024 (including efficient gas-fired cogeneration), and similar policy instruments, such as power auctions for wind and solar generation.
- Electric Industry Law (LIE, (+)) (2014/2021). A law which establishes a market regime in Mexico’s electricity industry. A 2021 amendment allows fossil plants to obtain tradeable clean energy certificates that were originally reserved for renewable electricity suppliers.
- National Forestry Programme – PRONAFOR (2014). Reduction of annual deforestation rate from 0.24% in 2010 to 0.2% by 2018.
UNITED STATES
Emissions trajectories Additional information
NDC
Emissions reductions of at 50-52% below 2005 levels by 2030
Long-term target
- Net zero target by 2050 (not legally binding)
- LTS submitted (2016)
Main policies (selected)
- Bipartisan Budget Act (2018). Provides a tax credit for carbon dioxide captured through CCS (section 45Q), including carbon dioxide used for enhanced oil recovery.
- Renewable Fuel Standards (2015). Requires a certain volume of renewable fuel to be blended into petroleum-based transportation fuel, heating oil or jet fuel (36 billion gallons by 2022).
- Methane waste prevention rule (2016). Specific standards for oil and gas production to reduce CH4 emissions by 35% from 2014 levels by 2025. The November 2018 amendment removed requirements of the 2016 rule.

Tracking climate mitigation efforts in 30 major emitters
NewClimate Institute | October 2021 10
3.3 South America (Argentina, Brazil, Chile, Colombia) Argentina, Brazil, Chile and Colombia together represented approximately 4% of global emissions in 2019 (Olivier and Peters, 2020; FAOSTAT, 2021).
Emissions in Argentina are not expected to increase in comparison to 2015. Our results show that while Argentina’s emissions are projected to grow approximately 0.8% per year post-2020, the emissions level will remain 3% below 2015 by 2030. This is partially a result of Argentina’s robust climate mitigation policy framework and the land use sector turning into a sink in the period post-2020. At the same time, current policies do not yet fully align with Argentina’s ambition. Its energy strategy, for example, still largely centres around exploiting gas reserves for exports as well as domestic consumption.
In Brazil, emissions are projected to slightly increase per year in the period post-2020, by about 0.3%, and on average, will be 7% below 2015 by 2030. However, emissions range from a 13% increase to a 27% decrease. This range is due to high uncertainty in land use policy implementation. Our current policies scenario projections are highly dependent on the enforcement of implemented policies related to land use. IIASA developed two scenarios for the LULUCF policies, i.e., full enforcement of implemented LULUCF policies (leading to lower emissions) and partial enforcement of LULUCF policies (leading to higher emissions). The scenario with partial enforcement relaxes the enforcement of illegal deforestation the Amazon and the Brazilian Forest Code. In recent years, deforestation levels have increased (INPE, 2019; SEEG, 2020). This suggests a high-emissions land use scenario is more likely. While Brazil’s updated NDC repeats the previous unconditional 2030 target of reducing emissions by 43% compared to 2015 levels (Government of Brazil, 2015, 2020), the updated NDC is based on a different inventory and consequently brings about higher absolute emissions levels.
Emissions in the other countries are projected to increase by 2030 and are also largely influenced by land use emissions. Emissions in Chile are projected to increase by 4.9% per year post-2020 and reach levels approximately 50% higher than 2015 values by 2030. Chile is the country analysed with highest projected emissions growth in the coming decade in the region. This development is largely influenced by land use emissions, specifically driven by a reduction in the emissions sink size.
In Colombia, the increase is lower but still significant, at 28% above 2015 levels by 2030 with an average annual growth rate of 1.6% post-2020. This increase is largely driven by an increase in land-use emissions. Although Colombia submitted a more ambitious and robust updated NDC in December 2020, it largely relies on emissions reductions in the land use sector.
Table 3: Emissions projections under current policies for South America.
ARGENTINA
Emissions trajectories Additional information
NDC
Absolute emissions level of 313 MtCO2e by 2030
Long-term target
- Net zero target by 2050 (not legally binding)
- No official LTS submitted
Main policies (selected) - Carbon tax on energy (2017). Starting at $10/tCO2 and adjusted every
trimester. The tax targets emissions from transport fuels and coal. The carbon tax excludes natural gas consumption and shale gas production.
- Renewable Energy Law 27.191 setting renewable targets (2016). Total electricity consumption to be substituted with non-conventional renewable sources (excl. hydro larger than 50 MW) given the following schedule: 18% by 2023 and 20% by 2025.
- Biofuels Law (2016). Blending mandate of 10% for biodiesel and 12% for ethanol in the gasoline from 2016.
- National plan for the restoration of native forests (2019). Restoration of 20 million hectares of native forests by 2030.

Tracking climate mitigation efforts in 30 major emitters
NewClimate Institute | October 2021 11
Table 3: Emissions projections under current policies for South America (continued).
BRAZIL
Emissions trajectories Additional information
NDC
Emissions reductions of 43% below 2005 levels by 2030
Long-term target
- Net zero target by 2060 (not legally binding),
- No official LTS submitted
Main policies (selected) - 10-Year National Energy Expansion Plan (PDE) (2011/2019). Projects
48% renewable share in total primary energy supply and 22% renewable share (excluding hydropower) in total electricity generation by 2029.
- RenovaBio (2017). Improve carbon intensity of biofuels by 7% between 2017 and 2028, reaching 66.8 gCO2/MJ in 2028.
- Biodiesel blending mandates (2020-2021). In March 2020, the Brazilian government raised the biodiesel blending mandate from 11% to 12% (target of 15% in 2023).
- National Plan on Climate Change (2008). Reducing deforestation rates in all Brazilian biomes to reach zero illegal deforestation.
- The Brazilian Forest Code (2012). Regulates the management of forests with a goal to restore 12 million hectares of forests by 2030.
CHILE
Emissions trajectories Additional information
NDC
Absolute emissions level of 95 MtCO2e by 2030
Long-term target
- Net zero target by 2050 (not legally binding)
- No official LTS submitted
Main policies (selected) - National Climate Change Action Plan (2017-2022) (2017). Road map
to systematise climate action. - Green tax [Law 20780] (2014/2020). Establishes green tax on fixed
sources of pollutants from thermal power generation. - Energy Route 2018-2022 (2018). Long-term strategy on national energy
policy that outlines seven lines of action including energy efficiency and low emissions energy generation.
- National Action Plan for Sustainable Consumption and Production 2017-2022 (2017). Facilitation a transition toward a low-carbon economy.
COLOMBIA
Emissions trajectories Additional information
NDC
Emissions reductions of 51% below BAU by 2030
Long-term target
- Net zero target by 2050 (not legally binding)
- No official LTS submitted
Main policies (selected) - Resolution No.1988 (2017) & Resolution No.585 (2017). Resolutions
to set environmental goals and design and enforce measures in the transportation, energy, industry, and buildings sectors, as described in the Indicative Action Plan on energy efficiency (PROURE) 2017–2022.
- Colombian Low-Carbon Development Strategy (ECDBC) (2012). Overarching strategy to reduce emissions based on eight Sectoral Mitigation Plans.
- The National Development Plan of Colombia (2015). Reduction of the annual deforestation rate from 121,000 hectares in 2013 to 90,000 hectares by 2018.
- Resolution to increase the area of protected forest land in the Amazon (2018). Increase Colombia’s protected forest area coverage to 30 million hectares to reach a total of 38 million hectares.

Tracking climate mitigation efforts in 30 major emitters
NewClimate Institute | October 2021 12
3.4 China China is the biggest global emitter; the country alone represented approximately a quarter of global emissions in 2019 (Olivier and Peters, 2020; FAOSTAT, 2021).
On average emissions in China are projected decrease by 0.1% per year between 2021 and 2030. Emissions are expected to remain approximately 9% above 2015 values by 2030, despite China’s land use sector sink increasing in the period post-2020. In the lower range of our scenario, emissions could decrease by an average of 0.6% instead of 0.1% per year and be only 3% above 2015 levels by 2030. In the upper range of the current policy scenario, emissions would increase by 3% per year and reach 14% above 2015 by 2030. China’s prolonged dependency on coal is expected to significantly shape China’s emissions trajectory.
China’s 14th Five-Year Plan does not indicate a departure from the continued focus on fossil energy sources and promotes both carbon-intensive and cleaner energy. While the plan reiterates the net zero target by 2060 and emphasises growth and storage of clean energy, it shows little sign of deviation from the current policy path, particularly in energy, and risks future coal lock-in. In terms of land-use, the 14th and the 15th Five-Year Plan continues a strong historical trend of improving the national forest carbon stocks and the forest area in China. China has a long history of implementing large scale and integrated programs land-use program to address sustainability issues, successful implementation of current projects are projected to further increase the land use sink by 2030 (Bryan et al., 2018).
Table 4: Emissions projections under current policies for China.
CHINA
Emissions trajectories Additional information
NDC
Lower carbon intensity by over 65% below 2005 levels by 2030
Long-term target
- Net zero target by 2060 (not legally binding)
- No official LTS submitted
Main policies (selected) - 14th Five-Year Plan [2021-2025] (2021). 20% non-fossil share in TPES
in 2025; energy intensity cut by 13.5% until 2025; carbon intensity cut by 18% until 2025.
- National Action Plan on Climate Change 2014-2020 (2014). Emissions reductions, increasing share of non-fossil fuels in primary energy consumption, increase forest area.
- Revision of Land Administration Law of the People's Republic of China (2019). The law, which became effective in January 2020, re-affirms a commitment to maintain a supply of at least 120 million ha of arable land designated as permanent basic farmland.
- 15-year plan [2021-2035] to protect ecosystems (2020). Tasks include the increase of forest cover to 26% by 2035, the increase of grassland vegetation cover to 60%, and the increase of nature reserve areas to 18% of national land area.
3.5 High-income Asia Pacific countries (Australia, Japan, Singapore and South Korea)
Australia, Japan, Singapore and South Korea represented approximately 5% of global emissions in 2019 (Olivier and Peters, 2020; FAOSTAT, 2021).
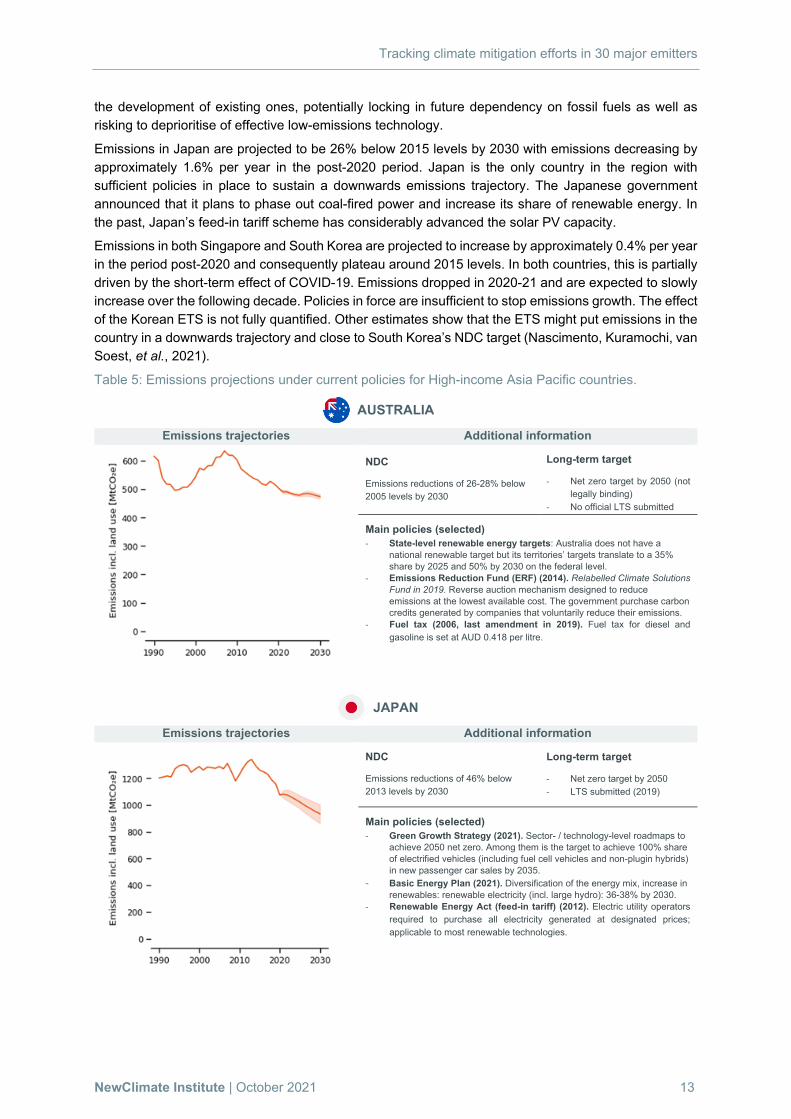
Emissions in Australia are expected to decrease by about 0.4% per year post-2020 and are projected to be 11% below 2015 levels by 2030. This emissions decrease is especially due to the short-term effect of the pandemic, which delayed emissions growth. Yet, current policies are insufficient to stop emissions growth. Australia did not increase its ambition since the first NDC in 2015, despite introducing new measures in the meantime. Australia has announced considerable investment in new gas basins and
Tracking climate mitigation efforts in 30 major emitters
NewClimate Institute | October 2021 13
the development of existing ones, potentially locking in future dependency on fossil fuels as well as risking to deprioritise of effective low-emissions technology.
Emissions in Japan are projected to be 26% below 2015 levels by 2030 with emissions decreasing by approximately 1.6% per year in the post-2020 period. Japan is the only country in the region with sufficient policies in place to sustain a downwards emissions trajectory. The Japanese government announced that it plans to phase out coal-fired power and increase its share of renewable energy. In the past, Japan’s feed-in tariff scheme has considerably advanced the solar PV capacity.
Emissions in both Singapore and South Korea are projected to increase by approximately 0.4% per year in the period post-2020 and consequently plateau around 2015 levels. In both countries, this is partially driven by the short-term effect of COVID-19. Emissions dropped in 2020-21 and are expected to slowly increase over the following decade. Policies in force are insufficient to stop emissions growth. The effect of the Korean ETS is not fully quantified. Other estimates show that the ETS might put emissions in the country in a downwards trajectory and close to South Korea’s NDC target (Nascimento, Kuramochi, van Soest, et al., 2021).
Table 5: Emissions projections under current policies for High-income Asia Pacific countries.
AUSTRALIA
Emissions trajectories Additional information
NDC
Emissions reductions of 26-28% below 2005 levels by 2030
Long-term target
- Net zero target by 2050 (not legally binding)
- No official LTS submitted
Main policies (selected) - State-level renewable energy targets: Australia does not have a
national renewable target but its territories’ targets translate to a 35% share by 2025 and 50% by 2030 on the federal level.
- Emissions Reduction Fund (ERF) (2014). Relabelled Climate Solutions Fund in 2019. Reverse auction mechanism designed to reduce emissions at the lowest available cost. The government purchase carbon credits generated by companies that voluntarily reduce their emissions.
- Fuel tax (2006, last amendment in 2019). Fuel tax for diesel and gasoline is set at AUD 0.418 per litre.
JAPAN
Emissions trajectories Additional information NDC
Emissions reductions of 46% below 2013 levels by 2030
Long-term target
- Net zero target by 2050 - LTS submitted (2019)
Main policies (selected) - Green Growth Strategy (2021). Sector- / technology-level roadmaps to
achieve 2050 net zero. Among them is the target to achieve 100% share of electrified vehicles (including fuel cell vehicles and non-plugin hybrids) in new passenger car sales by 2035.
- Basic Energy Plan (2021). Diversification of the energy mix, increase in renewables: renewable electricity (incl. large hydro): 36-38% by 2030.
- Renewable Energy Act (feed-in tariff) (2012). Electric utility operators required to purchase all electricity generated at designated prices; applicable to most renewable technologies.

Tracking climate mitigation efforts in 30 major emitters
NewClimate Institute | October 2021 14
Table 5: Emissions projections under current policies for High-income Asia Pacific countries (continued).
SINGAPORE
Emissions trajectories Additional information
NDC
Absolute emissions level of 65 MtCO2e by 2030
Long-term target
- No net zero target - Official LTS submitted (2020)
Main policies (selected)
- Climate Impact X Initiative (2021). Has two main platforms: a marketplace for nature-based projects, and an exchange where carbon credits can be freely traded in larger quantities.
- Million Tree Campaign (2020). Plan to plant 1 million trees in 10 years. - Carbon Pricing Act (2018). Requires reporting and payment of a tax
relating to GHG emissions. - Climate Action Plan (2016). Improving energy efficiency, reducing
emissions from power stations, promoting low-carbon technologies, facilitating collective action.
- National Climate Change Strategy (2012). Reducing carbon emissions in all sectors, facilitating adaption to climate change impacts, promoting green growth opportunities, forging international and regional partnerships.
SOUTH KOREA
Emissions trajectories Additional information
NDC
Emissions reductions of 40% below 2017 levels by 2030
Long-term target
- Net zero target by 2050 (not legally binding)
- LTS submitted (2020)
Main policies (selected)
- Emissions Trading System (2015). A system which covers 68% of the national GHG emissions involving nearly 600 companies from 23 sub-sectors. The current phase of emission caps (2021–2025) is set to be in line with the Government’s annual target emissions for 2030.
- Renewable energy targets/3rd Energy Master Plan (2019)/8th Basic Plan for Long-term Electricity Supply and Demand (2017). Share in total electricity generation: 20% by 2030 and 30–35% by 2040.
- Fuel efficiency standard (last update 2014). 140 gCO2/km (16.7 km/l) by 2015, 97 g CO2/km (24.1 km/l) by 2020.
- 2nd Comprehensive Plan for Improvement of Carbon Sinks (2018). This Plan sets a target of increasing national forest carbon stocks by 2.1 billion tCO2 by 2022, compared to 1.8 billion tCO2 in 2015. Expand carbon storage in domestic harvested wood products (HWP) by up to 36 Mt by 2022, compared to 23 Mt in 2017.
- 2nd Comprehensive Plan for Wood Use (2019). Increase domestic wood self-sufficiency rate by 22.4% by 2024, compared to 19% in 2019. Expand the size of timber industry to $40 billion by 2024 by utilizing currently unused domestic forest biomass resources.
3.6 Fast-growing Asian countries (India, Indonesia, Malaysia, Thailand and the Philippines)
India, Malaysia, Indonesia, Thailand, and the Philippines are responsible for approximately 13% of global emissions in 2019 (Olivier and Peters, 2020; FAOSTAT, 2021). Emissions in the region are driven by major emitting countries, India and Indonesia are the 3rd and 5th biggest world emitters, respectively.
In India, emissions are projected to grow by approximately 3.3% annually in the post-2020 period. Overall emissions are expected to increase by 50% between 2015 and 2030. India has been increasing its share of renewable energy and repeatedly modified its renewable energy targets to be more ambitious. Although India has reduced its focus on coal power development, the operation of existing
Tracking climate mitigation efforts in 30 major emitters
NewClimate Institute | October 2021 15
capacity remains uncertain as India has a considerable amount of both domestic and global coal-fired power plants in operation. Installed capacity could further increase over the coming years if all planned capacity was to be realised (Shearer, 2020).
Indonesia is the only country with emissions in 2030 below 2015 levels. Notably, 2015 was a year with high emissions, mainly due to peat fires, which are an emissions source with high annual fluctuations. Forest and peatland fires occur for three main reasons: various actors (companies, small-scale farmers) use fire to clear land for development and agriculture; fires are frequently used to stake claims to land in disputes between big companies and small farmers; and drained peatlands are highly flammable during the dry season, making small-scale clearing and campfires easily burn out of control. In 2015, emissions from peat fires were recorded at 803 MtCO2e and accounted for 52% of total emissions from Forest land and Other Land Use (FOLU). This can be compared with 2016, where emissions form peat fires were recorded at 90 MtCO2e and only accounted for 7% of total emissions from FOLU (Republic of Indonesia, 2018).
Indonesia’s emissions are projected to increase by about 2.5% per year post-2020 and be 15% below 2015 levels by 2030. The lower emissions level in comparison to 2015 is driven by high land use emissions associated with peat fires in 2015 and not by policy adoption. While Indonesia has some measures to facilitate a diversification of their energy mix, such as policies to foster rooftop PV, fossil fuels continue to play a large role. The latest national electricity supply plan does not indicate a significant reduction in Indonesia’s coal share (Republic of Indonesia, 2021). It also remains to be seen if Indonesia will continue its moratorium on the conversion of prime forest land underlain by peat and if stricter enforcement will be implemented concerning laws that make concession holders responsible for fires in their holdings.
In Malaysia, emissions are expected to increase on average by 80% between 2015 and 2030. Historically, removals and emissions from the LULUCF sector have shown high annual fluctuations mainly due to emissions related to Forest Land being converted to settlements4. However, such annual fluctuations have reduced in frequency and the associated emission have also been decreasing from 2005 onwards. Emissions in the energy and industry sectors are expected to almost double between 2015 and 2030. The growth is driven especially by the energy supply sector. Coal share in total primary energy supply is projected to increase up to 2030 (APERC, 2019). On average, emissions in Malaysia are expected to stabilise post-2020.
In Thailand, emissions are projected to grow by about 2.6% annually post-2020 and overall increase by approximately 50% between 2015 and 2030. In 2019, a new Power Development Plan was adopted. This plan anticipates a reduction of coal-fired power generation in exchange for increasing gas power generation.
The large drop in emissions observed in the Philippines is caused by a change in land use emissions sink in 2011. Between 2015 and 2030, emissions are projected to increase by 64% overall, growing approximately 2.8% per year in the post-2020 period. This growth is driven by an increase in energy and industry related emissions. Recent plans to build terminals for the import of liquified natural gas have underlined the Philippines’ continued reliance on fossil fuels for energy supply. Although resulting in less emissions than other fossil fuel, expanding the role of gas risks locking in a fossil fuel infrastructure that could impede efforts to decarbonising the energy sector in the future.
4 Settlements include all developed land, including transport infrastructures and human settlements of any size, graveyards, mining and golf courses. The term also includes areas occupied by abandoned development projects.

Tracking climate mitigation efforts in 30 major emitters
NewClimate Institute | October 2021 16
Table 6: Emissions projections under current policies for Fast-growing Asian countries
INDIA
Emissions trajectories Additional information NDC
Emissions intensity of GDP 33-35% below 2005 levels by 2030
Long-term target
- No net zero target - No official LTS submitted
Main policies (selected) - Clean energy cess (coal tax) (2010). Currently a tax of INR 400/tonne
is imposed on coal, lignite, and peat. - National Mission for Enhanced Energy Efficiency (2008). The
Mission helps to result in emissions reductions of 100 MtCO2e/year below government reference.
- National Electricity Plan (2018). The Plan forecasts demand reductions and presents capacity additions for various energy technologies, including a slowdown in installation of new coal fired power plants.
- Energy efficiency in industry (PAT scheme) (2011). Benchmarking of designated companies’ performance against best practice combined with a market mechanism to trade energy savings certificates.
INDONESIA
Emissions trajectories Additional information
NDC
Emissions reductions of 29% unconditional/41% conditional below BAU by 2030
Long-term target
- No net zero target - Official LTS submitted (2021)
Main policies (selected) - National Energy Policy (2014). An energy management policy that
aims to increase the share of new and renewable energy (including nuclear) to 23% of total primary energy supply by 2025.
- Electricity Supply Business Plan (RUPTL 2019–2028). Projects capacity additions over 2019–2028.
- Biofuel targets (2013). The policy aims for a 15% share of biofuels in all transportation fuels by 2025. The biodiesel blending rate was raised to 30% in 2020 with a plan to achieve 40% by 2022.
- Palm Oil Moratorium (2021). Formal ban on new palm oil permits in effect since 2018 expired on September 2021. The government indicated the policy would continue de-facto using other policy tools.
MALAYSIA
Emissions trajectories Additional information
NDC
Emissions reductions of 45% below 2005 levels by 2030
Long-term target
- No net zero target - No official LTS submitted
Main policies (selected) - Green Technology Master Plan 2017-2030 (2017). Framework to
facilitate uptake of green technologies, particularly by boosting energy efficiency and increasing share of renewable energy sources to reduce carbon emissions across sectors.
- 11th Malaysia plan 2016-2020 (2015). Five-year blueprint for socio-economic development along six core areas of actions, including green growth and the expansion of renewable energy capacity.
- National Policy on Climate Change (2012). Framework to guide overall climate policy and mainstream climate change action by integrating responses into national policies as well as strengthening institutional capacity.
- Malaysian Forestry Policy (2021). Unified forestry policy for all Malaysian states. Vaguely affirms policy to maintain minimum 50% forest cover.

Tracking climate mitigation efforts in 30 major emitters
NewClimate Institute | October 2021 17
Table 6: Emissions projections under current policies for Fast-growing Asian countries (continued).
THAILAND
Emissions trajectories Additional information
NDC
Emissions reductions of 20% below BAU by 2030
Long-term target
- No net zero target - No official LTS submitted
Main policies (selected) - Climate Change Master Plan (2015-2050) (2015). Share of at least
25% of the total energy consumption from renewable energy sources by 2021. Reduction of energy intensity by at least 25% compared to BAU by 2030.
- Energy Efficiency Plan 2015-2036 (2015). Reduction of energy intensity per GDP (in final energy terms) by 30% by 2036, as compared to 2010 baseline, with total savings of 90 TWh by 2036.
- Alternative Energy Development Plan and Power Development Plan (2015; 2018 rev. 1). Increase of renewable energy shares to 30% of total energy consumption, 20% of power generation (plus additional 9% from imported hydro), 35% of heat generation and 35% of transport fuels by 2037. The plans also project a reduction in coal-fired power generation (23% to 12%), an increase in gas-fired power generation (37% to 53%) and overall demand reduction of 6% in comparison to 2018.
PHILLIPINES
Emissions trajectories Additional information
NDC
Emissions reductions of 2.71% unconditional/75% conditional below BAU by 2030
Long-term target
- No net zero target - No official LTS submitted
Main policies (selected) - The Climate Change Act (2010). Framework for integrating the concept
of climate change in various policy formulations, development plans and strategies.
- Renewable Energy Act (2008). Instruments to encourage renewable energy production.
- Energy Efficiency and Conservation Act (2021). Plan to increase energy efficiency and reduce energy consumption by imposing responsibility across different government bodies, creating an inter-agency committee on energy efficiency, and creating performance labelling standards.
- Lifting of the Mining Permit Ban (2021). Lifting of the ban on issuing new mining permits that has been in place in 2017.
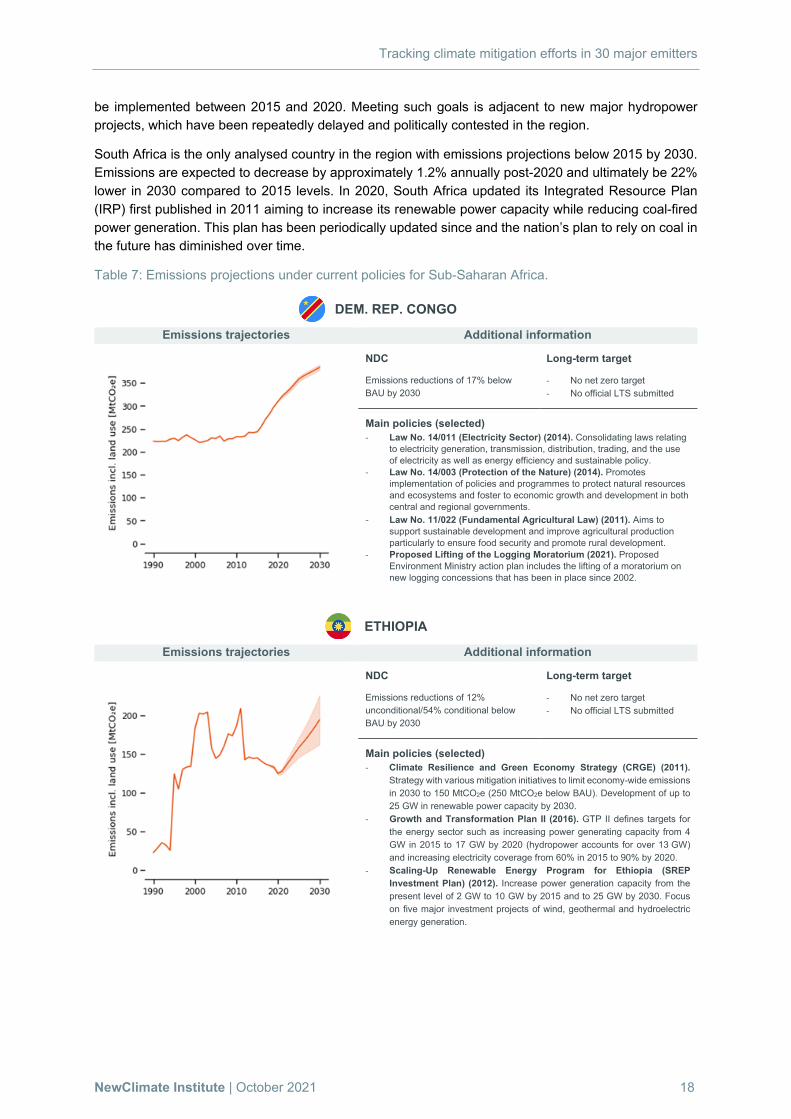
3.7 Sub-Saharan Africa (Democratic Republic of the Congo, Ethiopia and South Africa)
The Democratic Republic of the Congo, Ethiopia, and South Africa represented approximately 3% of global emissions in 2019 (Olivier and Peters, 2020; FAOSTAT, 2021).
Emissions in the Democratic Republic of the Congo are largely driven by trends in land use emissions, which are largely influenced by deforestation. Emissions including land use are projected to be 74% higher in 2030 in comparison to 2015 levels, and this is expected to grow by about 1.9% per year in the period post-2020. The Democratic Republic of the Congo is the country analysed with highest emissions increase in this fifteen-year period.
Emissions in Ethiopia are projected to increase by 4.5% per year in the period post-2020 and to be 34% above 2015 levels in 2030. Emissions are largely driven by energy and industry sectors. Ethiopia’s Second Growth and Transformation Plan (GTP II) set twelve key targets for the energy sector alone to
Tracking climate mitigation efforts in 30 major emitters
NewClimate Institute | October 2021 18
be implemented between 2015 and 2020. Meeting such goals is adjacent to new major hydropower projects, which have been repeatedly delayed and politically contested in the region.
South Africa is the only analysed country in the region with emissions projections below 2015 by 2030. Emissions are expected to decrease by approximately 1.2% annually post-2020 and ultimately be 22% lower in 2030 compared to 2015 levels. In 2020, South Africa updated its Integrated Resource Plan (IRP) first published in 2011 aiming to increase its renewable power capacity while reducing coal-fired power generation. This plan has been periodically updated since and the nation’s plan to rely on coal in the future has diminished over time.
Table 7: Emissions projections under current policies for Sub-Saharan Africa.
DEM. REP. CONGO
Emissions trajectories Additional information
NDC
Emissions reductions of 17% below BAU by 2030
Long-term target
- No net zero target - No official LTS submitted
Main policies (selected) - Law No. 14/011 (Electricity Sector) (2014). Consolidating laws relating
to electricity generation, transmission, distribution, trading, and the use of electricity as well as energy efficiency and sustainable policy.
- Law No. 14/003 (Protection of the Nature) (2014). Promotes implementation of policies and programmes to protect natural resources and ecosystems and foster to economic growth and development in both central and regional governments.
- Law No. 11/022 (Fundamental Agricultural Law) (2011). Aims to support sustainable development and improve agricultural production particularly to ensure food security and promote rural development.
- Proposed Lifting of the Logging Moratorium (2021). Proposed Environment Ministry action plan includes the lifting of a moratorium on new logging concessions that has been in place since 2002.
ETHIOPIA
Emissions trajectories Additional information
NDC
Emissions reductions of 12% unconditional/54% conditional below BAU by 2030
Long-term target
- No net zero target - No official LTS submitted
Main policies (selected) - Climate Resilience and Green Economy Strategy (CRGE) (2011).
Strategy with various mitigation initiatives to limit economy-wide emissions in 2030 to 150 MtCO2e (250 MtCO2e below BAU). Development of up to 25 GW in renewable power capacity by 2030.
- Growth and Transformation Plan II (2016). GTP II defines targets for the energy sector such as increasing power generating capacity from 4 GW in 2015 to 17 GW by 2020 (hydropower accounts for over 13 GW) and increasing electricity coverage from 60% in 2015 to 90% by 2020.
- Scaling-Up Renewable Energy Program for Ethiopia (SREP Investment Plan) (2012). Increase power generation capacity from the present level of 2 GW to 10 GW by 2015 and to 25 GW by 2030. Focus on five major investment projects of wind, geothermal and hydroelectric energy generation.

Tracking climate mitigation efforts in 30 major emitters
NewClimate Institute | October 2021 19
Table 7: Emissions projections under current policies for Sub-Saharan Africa (continued).
SOUTH AFRICA
Emissions trajectories Additional information
NDC
Absolute emissions level of 398-614 MtCO2e over 2025-2030
Long-term target
- Net zero target by 2050 (not legally binding)
- LTS submitted (2020)
Main policies (selected) - National Development Plan (2012). Among other targets: eliminate
poverty, reduce inequality, increase access to water and electricity. - Integrated Resource Plan for electricity (2011/2019). Nuclear to
remain stable at 1,860 MW throughout 2030. Renewable electricity generation capacity targets: hydropower to reach 4,600 MW by 2030 (adding 2,500 MW); solar photovoltaic to reach 8,288 MW by 2030 (adding 6,000 MW beyond already committed/contracted capacity); wind to reach 17,742 MW by 2030 (adding 14,400 MW); concentrated solar power to reach 600 MW by 2030 (adding 300 MW).
- Petroleum Products Act (Biofuels Industrial Strategy) (2007). Mandatory blending of biofuels. Concentration for blending: 2-10% for bioethanol and minimum 5% for biodiesel from 2015 onwards.
3.8 Former Soviet Union (Kazakhstan, Russia and Ukraine) Kazakhstan, Russia and Ukraine are responsible for approximately 5% of global emissions in 2019. Emissions in the region are largely driven by Russia, the 6th biggest global emitter in the world (Olivier and Peters, 2020; FAOSTAT, 2021).
Kazakhstan’s emissions are projected to grow 0.9% per year post-2020 and are expected to be 20% higher in 2030 compared to 2015 levels. An even steeper emissions increase is somewhat curtailed because of Kazakhstan’s land use sector increasing its sink potential in the period post-2020. Additionally, the effect of the COVID-19 pandemic delays the increase in emissions, which would otherwise reach higher values in 2030. Although some policies aimed at diversifying the energy mix, Kazakhstan’s economy and its own energy supply are expected to remain highly dependent on fossil fuels which make up most of its electricity generation.
In Russia, emissions are projected to remain at similar levels when compared to 2015. Notably, in the period of 1990-2000, there was a decrease of emissions in Russia associated with the general economic situation in the country. Since then, emissions have plateaued and are not expected to grow between 2021 and 2030. In the latest energy strategy approved in 2020, Russia focuses on the development of fossil fuel industries to expand the production of both coal and gas while only briefly discussing energy efficiency and renewable energy. With a new federal law passed in June 2021, Russia provides a framework for mandatory carbon reporting for companies as well as carbon offsetting schemes.
Emissions in Ukraine are projected to increase by 35% between 2015 and 2030, growing approximately 2.4% per year in the post-2020 period. A draft of the Ukraine Green Deal was presented in early 2020 and a new, more ambitious and detailed NDC was submitted. However, expectations for the emissions increase are strengthened by the dismissal of the former minister of Energy and Environmental Protection, leaving Ukraine with an interim minister and uncertain energy policy direction.

Tracking climate mitigation efforts in 30 major emitters
NewClimate Institute | October 2021 20
Table 8: Emissions projections under current policies for Former Soviet Union.
KAZAKHSTAN
Emissions trajectories Additional information
NDC
Emissions reductions of 15% unconditional (25% conditional) below 1990 levels by 2030
Long-term target
- Net zero target by 2060 (not legally binding)
- No official LTS submitted
Main policies (selected) - Law on the transition to green economy (2016). Aims to strengthen
sustainable practices, particularly renewable energy supply. - Law about Support of Use of Renewable Sources of Energy [Law
165-4] (2009). Elimination of previous barriers to developing new projects, access to energy grids, and regulating energy pricing.
- Law on Energy Saving (2011). Establishes a legal framework to regulate the market for energy consumption, e.g., by giving the government authority to establish energy efficiency minimums for mechanic equipment and buildings.
RUSSIA
Emissions trajectories Additional information
NDC
Emissions reductions of 30% below 1990 levels by 2030
Long-term target
- Net zero target by 2060 (not legally binding)
- No official LTS submitted
Main policies (selected) - Federal Law on Saving Energy and Increasing Energy Efficiency
[Law 261-F3] (2009). General framework for energy efficiency. It contains mandatory energy savings for companies, a ban of inefficient light bulbs, and incentives for companies to invest in energy efficiency.
- Renewable energy targets (Governmental resolution No. 512-r of 2013, 2015 amendment). 4.5% renewables share in total electricity generation by 2024 (excluding hydropower larger than 25 MW)
- Energy intensity targets (2008). 5% limit on associated gas flaring for 2012 and subsequent years.
- System of Green Project Financing (2021). Preparing to launch a system of financing green projects and initiatives in the field of sustainable development, reducing emissions of pollutants and greenhouse gases.
UKRAINE
Emissions trajectories Additional information
NDC
Emissions reductions of at 65% below 1990 levels by 2030
Long-term target
- Net zero target by 2060 (not legally binding)
- LTS submitted (2018)
Main policies (selected) - National Renewable Energy Action Plan 2020 (2014). 20% reduction
of CO2 emissions per final consumption of fuel by 2035 from 2010 levels (5% by 2030).
- Green Tariff (renewables feed-in-tariff) (2015 amendment). 5% premium for 30% of domestic equipment. 10% premium when using 50% of domestic equipment.
- Energy Strategy of Ukraine until 2035 (2017). Projects electricity mix by 2035: 13% from renewables excluding hydropower, 7% from hydropower, 48% from nuclear and 32% from thermal power plants.
- National Transport Strategy 2035 (2017). Aims for at least 50% share of electric cars in the car sales market by 2030.
- National Action Plan for Environmental Protection (2021). Contains a wide range of action items for new and updated regulation on forest and land management.

Tracking climate mitigation efforts in 30 major emitters
NewClimate Institute | October 2021 21
3.9 Middle East and North Africa (Israel, Morocco, Saudi Arabia and Turkey)
Israel, Morocco, Saudi Arabia and Turkey are responsible for approximately 3% of global emissions in 2019 (Olivier and Peters, 2020; FAOSTAT, 2021).
In Israel, emissions are expected to grow by approximately 0.5% per year in the post-2020 period and consequently plateau around 2015 values. This is partially due to the short-term effect of the COVID-19 pandemic. In the past, Israel has implemented some measures to promote renewable energies but currently lacks an overall and integrated strategy document or action plan. Israel has proposed policies that could curb its emissions downwards. However, the implementation and effect of these policies remain unclear.
Morocco’s emissions are projected to grow by approximately 2.1% per year in the post-2020 period increase by 16% in the period between 2020 and 2030. The comparatively low emissions increase reflects Morocco’s recently updated, more ambitious NDC with a stronger target and a myriad of measures to be implemented post-2020. However, Morocco risks to lock in a fossil reliance by planning to build additional gas infrastructure and continuing to heavily rely on coal in its energy mix.
Emissions in Saudi Arabia are projected to grow by 3.4% per year in the post-2020 period and increase by 54% between 2015 and 2030. Saudi Arabia’s renewable energy targets were updated under the Vision 2030 strategy in 2019, considerably increasing its previous target. Yet, as a leading oil exporter, Saudi Arabia’s economy as well as its own energy mix is expected to continue to heavily rely on fossil fuels.
Emissions in Turkey are projected to grow approximately 3.1% per year in the post-2020 period and expected to reach levels about 58% higher in 2030 compared to 2015 levels. This increase is driven by both an increase in land-use as well as industry and energy emissions. Turkey needs to implement substantial additional policies to slow down emissions growth. A feed-in tariff scheme has supported progress towards renewable energy targets, but mode of continuation post-2020 remains unclear. Recently, the country has indicated a possible shift in its climate policy. In October 2021, Turkey was the last G20 country to ratify the Paris Agreement. The country now has also set a net zero target by 2053.
Table 9: Emissions projections under current policies for Middle East and North Africa.
ISRAEL
Emissions trajectories Additional information NDC
Emissions reductions of 27% below 2015 levels by 2030
Long-term target
- No net zero target - No official LTS submitted)
Main policies (selected)
- Energy efficiency measures (2015-2016). Various grant and loan schemes have been implemented to enhance energy efficiency.
- Closure of four coal-fired power plants by 2022 (2016). 1,440 MW capacity will be replaced by gas-fired combined cycle plants.
- Tax exemptions and expansion of approved quotas for renewables (2016). Measures to achieve 17% renewable electricity share by 2030. Tax exemptions apply to small renewable energy installations biogas,

Tracking climate mitigation efforts in 30 major emitters
NewClimate Institute | October 2021 22
Table 9: Emissions projections under current policies for Middle East and North Africa (continued).
MOROCCO
Emissions trajectories Additional information
NDC
Emissions reductions of 18.3% unconditional (45.5% conditional) below BAU by 2030
Long-term target
- No net zero target - No official LTS submitted
Main policies (selected) - 2030 National Climate Plan (2019). Aim to increase installed renewable
electricity capacity to 52% by 2030. Reduce energy consumption by 15% by 2030. “Significantly” reduce fossil fuel subsidies. Support afforestation and reforestation.
- National Energy Strategy (2009/2012) & Morocco Integrated Wind Energy Program (2010) & Morocco Solar Plan (2009) & Morocco Hydroelectric Plan. Energy savings of 12–15% in 2020 and 20% in 2030. Supply 15–20% of the country's primary energy demand with renewable energy sources by 2030. It aims to extend the share of renewable electricity capacity to 42% by 2020 and to 52% by 2030
SAUDI ARABIA
Emissions trajectories Additional information
NDC
Absolute emissions reductions of up to 278 MtCO2e below BAU by 2030
Long-term target
- Net zero target by 2060 (not legally binding)
- No official LTS submitted
Main policies (selected) - Saudi Arabia's Vision 2030 (2016/2019). The “Vision 2030” strategy
aims to reform and diversify Saudi Arabia’s oil-dependent economy through measures such as by reducing fossil fuel subsidies. At its launch in 2016, the strategy called for 9.5 GW of renewable power capacity by 2023. In 2019, this target was revised to 58.7 GW by 2030.
- Saudi Green Initiative (2021). Initiative to combat climate change including plans to diversify the energy mix by raising the share of renewables by 50% by 2030.
- Fossil fuel price reform (2017). Fossil fuel price reform to slow down the pace of energy subsidy cuts in order to reach international gasoline parity prices, increase diesel prices up to 90% of international prices, and raise the price for other fuels between 2018 and 2025.
TURKEY
Emissions trajectories Additional information
NDC
Emissions reductions of at 21% below BAU by 2030
Long-term target
- Net zero target by 2053 - No official LTS submitted
Main policies (selected) - Energy Efficiency Law (2012). Reduce primary energy intensity by 20%
by 2023, compared to the 2008 level. - Energy Efficiency Action Plan (2018). Reduce primary energy
consumption by 14% compared to the BAU scenario in 2023. - 11th Development Plan (2019). Sets a target of 38.8% renewables in
electricity production by 2023. - Renewable capacity target (Renewable Energy Action Plan) (2014).
61 GW renewable capacity by 2023: 34 GW of hydro, 20 GW wind, 5 GW solar, 1 GW geothermal, 1 GW biomass.

Tracking climate mitigation efforts in 30 major emitters
NewClimate Institute | October 2021 23
4 Progress on key sectoral policy interventions In this Chapter, we evaluate the progress on selected short-term sectoral policy interventions, that can help accelerating emissions in the period post-2020. We assess the prevalence of these policy interventions in five sectors: ‘energy supply’, ‘industry’, ‘buildings’, ‘transport’ and ‘agriculture and forestry’. The interventions analysed do not constitute a comprehensive set but are sufficient to identify areas for improvement in the 30 economies analysed.
Economy-wide emissions reductions under current policies are expected to remain insufficient in the next decade to meet the collective goals of the Paris Agreement (Chapter 3). Historical trends across indicators show that even though emissions grow at a slower pace in some sectors, they are still increasing in all of them (Figure 3). Energy-related emissions, especially associated with industrial production, increased at an accelerated pace in the 2000s. This is partially driven by China’s entry into the World Trade Organisation and the subsequent industry relocations to the country (Ren et al., 2014).
Figure 3: Sectoral emissions trends in the past three decades. Source: Lamb et al. (2021).
The implementation of good practice sectoral policies advances climate change mitigation efforts and remains necessary to curb global emissions (Roelfsema et al., 2018; Fekete et al., 2021). We track a limited set of short-term policy interventions that can help to accelerate emissions in all relevant sectors (Table 10). These policy interventions, based on an assessment by the Climate Action Tracker (Kuramochi, Höhne, et al., 2018), are important short-term benchmarks to be taken by 2025 and 2030 to keep the door open to meet the temperature goals of the Paris Agreement.
These benchmarks result from a review of existing emissions scenarios, and the respective necessary transitions, to distil the most important short-term sectoral benchmarks for action in line the required global low-carbon transition. Several other studies that have set sector-level benchmarks have been published in recent years (Climate Action Tracker, 2020; Climate Transparency, 2020; Lebling et al., 2020; Rissman et al., 2020; Energy Transitions Commission, 2021; IEA, 2021c; UNFCCC, 2021). The

Tracking climate mitigation efforts in 30 major emitters
NewClimate Institute | October 2021 24
findings of these studies, which we refer to in the following sector-specific subsections, are generally in line with those of Kuramochi, Höhne et al. (2018).
We assess the prevalence of these policy interventions in the 30 analysed economies. This complements analyses based on current policy emissions trajectories by assessing sectoral developments, that often respond faster than emissions to market or policy signals. The absence of these policy interventions represents a clear opportunity to accelerate emissions reductions.
Table 10: Selected policy interventions to accelerate emission reductions post-2020. Kuramochi, Höhne et al. (2018).
4.1 Energy supply Prevalence of key policy interventions is most advanced in the energy supply sector but progress remains slow in the countries analysed
Energy supply is a major global emissions source. Upstream emissions alone (e.g. fugitive emissions and refining) were responsible for 11% of global emissions in 2018 (Lamb et al., 2021). If emissions from electricity and heat production are considered (indirect emissions), energy systems contribute to approximately 34% of global greenhouse gas emissions in 2018. In the past decades, emissions from this sector are trending up, albeit growing at a slower pace (Lamb et al., 2021).
The share of renewables in electricity generation globally need to reach 55-90% in 2030 to remain in line with 1.5°C compatible scenarios, from approximately 25% in 2018 (Climate Action Tracker, 2020; IEA, 2021c). In parallel, coal needs to phase out fast, from representing 38% of global electricity generation in 2018 to 0-3% by 2030 (Climate Action Tracker, 2020; IEA, 2021c).
Renewable electricity policies or targets are in force but need a stringency boost
Most countries analysed have renewable energy targets in place to support renewable energy uptake (Iacobuta et al., 2018). Support schemes for renewables are common. It usually takes the form of subsidies, tax credits, feed-in tariffs, or auction schemes. Complementary policies, such as grid infrastructure development, electricity storage support, or overarching carbon pricing schemes are

Tracking climate mitigation efforts in 30 major emitters
NewClimate Institute | October 2021 25
important to create a favourable environment for renewables growth and are also in place in at least most G20 countries (Nascimento, Kuramochi, Iacobuta, et al., 2021).
However, the past uptake of renewable energy in electricity supply shows that progress remains slow (Figure 4). As of 2019, all four biggest emitters, China, the United States, the EU and India, still supply less than 40% of their electricity by renewable sources. In terms of renewable percentage growth, the United Kingdom performed better than all other countries between 2009 and 2019 with a yearly increase of approximately 30 percentage points, compared to the global increase of 7 percentage points in the same period.
Less than a third of the analysed countries are expected to reach renewable electricity levels within the 55-90% range by 2030. Brazil, Canada, Colombia, Democratic Republic of the Congo, Ethiopia and Norway have share of hydro power within this range already today. Australia is expected to reach high levels of renewable energy but this is mostly driven by ambitious sub-national action. Chile is the only other country currently expected to generate more than 55% of its electricity with renewables by 2030. Other relevant countries rely on a combination of low-carbon options, such as Argentina and Ukraine. These countries would meet the benchmark if it were to include their nuclear power, which is not renewable but still a low-carbon energy source.
Figure 4: Share of renewables in electricity generation in 2009 and 2019 in the 30 economies analysed Source: IEA (2021d).
Coal phase-out in electricity is a clear opportunity to accelerate emission reductions

Tracking climate mitigation efforts in 30 major emitters
NewClimate Institute | October 2021 26
Several of the analysed countries still plan to expand their coal fleet. China, India, Japan, Kazakhstan, South Korea, the Philippines, Russia, South Africa and Turkey all have coal-fired power plants under construction (Global Energy Monitor, 2020). Expansion of coal-fired electricity generation is clearly misaligned with the goal of the Paris Agreement.
Only three of the analysed countries have set precise phase-out dates and two additional ones do not rely on coal for electricity already today. The United Kingdom (2024), Canada (2030) and Chile (2040) have set a target year to phase out coal in the electricity mix. Some member states of the EU have also made progress. Germany (2038), France (2022) and Italy (2025) have all set the last year for coal-fired power plants to keep running but there is no clear date for the EU as a whole. Ethiopia and the Democratic Republic of the Congo do not rely on coal for electricity supply. China intends to start phasing down coal use from 2026 onwards (Climate Transparency, 2020).
4.2 Industry Uptake of key benchmarks in industry is low even among most developed countries
Global GHG emissions from industry have increased since 1990, especially during the 2000s. The sector was responsible for 35% of global emissions in 2018 (Lamb et al., 2021). The global improvement in energy efficiency, observed especially in Europe and North America, was outweighed by rising demand for industrial goods particularly in emerging economies, especially due to the relocation of emission-intensive industries (Lamb et al., 2021).
Figure 5: Number of low-carbon steel projects implemented in selected countries (as of June 2021). Figures include fully operational plants (full scale) as well as small scale projects, such as pilot or demonstration projects, that allow for testing technologies and produces lower volumes than full scale plants. Source: (Green Steel Tracker, 2021)
To achieve net zero emissions within a timeline consistent with the Paris Agreement’s long-term temperature goal, measures on both supply and demand sides need to be implemented

Tracking climate mitigation efforts in 30 major emitters
NewClimate Institute | October 2021 27
together(Rissman et al., 2020). Key measures on the demand side include material-efficient design and reduced material waste, substitution of high-carbon materials with low-carbon ones as well as circular economy interventions (Rissman et al., 2020).
Key technologies on the supply-side include: energy efficiency, carbon capture and storage (CCS), electrification and zero-carbon hydrogen as both a heat source and chemical feedstock (Rissman et al., 2020). However, the deployment of low-carbon industrial production plants has been slow (Lebling et al., 2020). In the steel industry, for example, there are less than 50 ongoing low-carbon steel projects around the world with only one full scale project in China, which accounts more than half of global steel production (Figure 5) (Green Steel Tracker, 2021).
Suggested high-value policies based on an extensive literature review include carbon pricing with border adjustments, support for research, development and deployment (RD&D), as well as energy efficiency and emissions standards (Rissman et al., 2020). Among these, carbon border adjustments were seen until recently as too controversial, but this has changed as the countries have become under increasing pressure to take stronger climate action while addressing competitiveness and leakage concerns (World Bank, 2021). Several major emitting economies including the EU and the United States consider implementing border adjustments.
4.3 Buildings A handful of the countries analysed to have net zero buildings targets and policies, but the implementation status remains universally poor
Globally the building sector currently account for almost 6% of all direct emissions and 17% when including indirect emissions such as electricity and heat production (Lamb et al., 2021). Emissions from the buildings sector have globally increased by 0.9% per year since 2010 (Lamb et al., 2021). Emissions have decreased in developed regions in North America, Europe, and Asia-Pacific but have strongly increased in the rest of the world (Lamb et al., 2021).
For the building sector to be aligned with 1.5°C pathway, emissions need to be reduced by 40% in 2030 and by more than 95% in 2050, in compared to 2020 levels (IEA, 2021c). Furthermore, by 2030, around 20% of the existing building stock worldwide needs to be retrofitted and new buildings needs to comply with net-zero energy buildings standards by 2020 in OECD countries, and by 2025 in non-OECD countries (Climate Action Tracker, 2016; IEA, 2021c). A net-zero energy building minimises energy demand and produces enough renewable energy onsite to offset energy consumed from the grid.
Current building standards needs to be tightened and their coverage broadened
The United States, Australia, and Saudi Arabia have the highest building emissions per capita in the G20 and lack policies to significantly reduce emissions (Climate Transparency, 2020). China, Russia, and Indonesia have seen the sharpest emissions increase between 2014 and 2019. In China, continued urbanization and economic growth has led to a construction boom that has increased the Chinese building stock by 17% from 2011 to 2018 (Energy Foundation China, 2020a).
The EU and the state of California, in the United States, both defined targets for new residential buildings to be net zero energy by 2020, but standards are far behind globally (Fekete et al., 2021). The progress has been slow within the EU concerning implementation of the EU Energy Performance Building directive, that requires all new buildings to be nearly zero-energy by the end of 2020. In the period of 2014 to 2016, only 20-25% of the new and renovated buildings in the EU were constructed or renovated to nearly-zero energy building standards (Hermelink et al., 2019). Also, the standards corresponding to net zero buildings implemented by the Member States are less demanding than those required by the European Commission (D’Agostino et al., 2021).
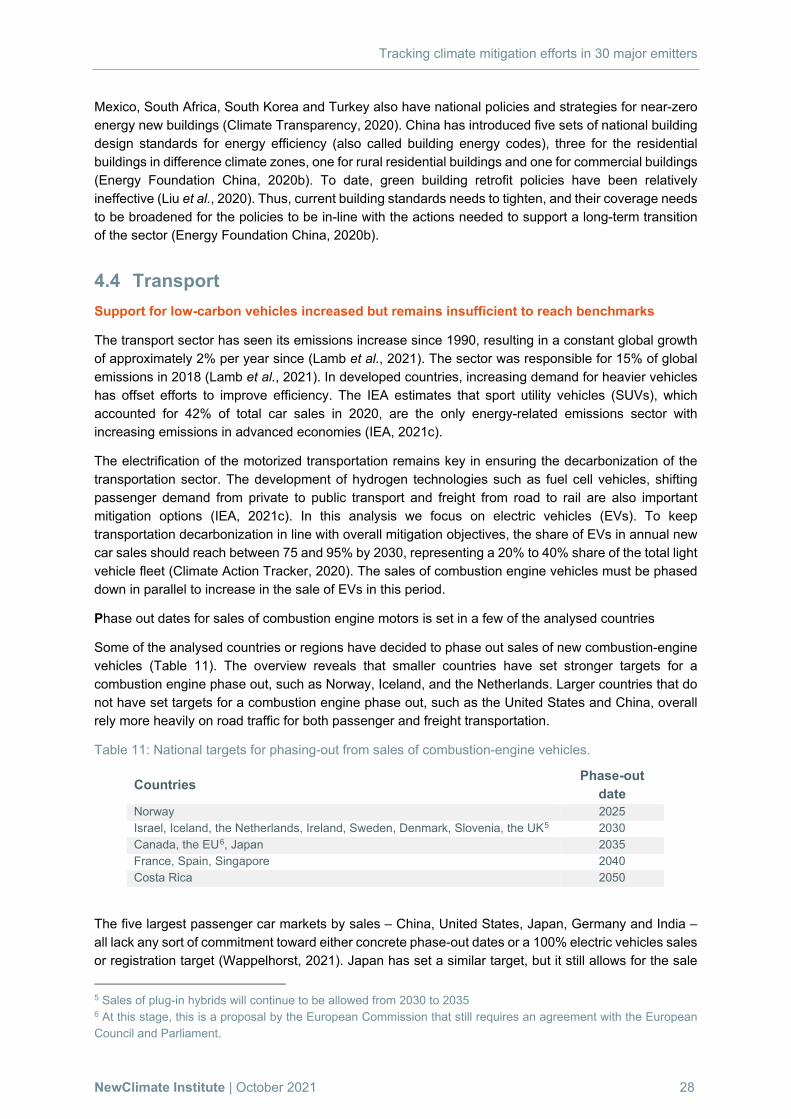
Tracking climate mitigation efforts in 30 major emitters
NewClimate Institute | October 2021 28
Mexico, South Africa, South Korea and Turkey also have national policies and strategies for near-zero energy new buildings (Climate Transparency, 2020). China has introduced five sets of national building design standards for energy efficiency (also called building energy codes), three for the residential buildings in difference climate zones, one for rural residential buildings and one for commercial buildings (Energy Foundation China, 2020b). To date, green building retrofit policies have been relatively ineffective (Liu et al., 2020). Thus, current building standards needs to tighten, and their coverage needs to be broadened for the policies to be in-line with the actions needed to support a long-term transition of the sector (Energy Foundation China, 2020b).
4.4 Transport Support for low-carbon vehicles increased but remains insufficient to reach benchmarks
The transport sector has seen its emissions increase since 1990, resulting in a constant global growth of approximately 2% per year since (Lamb et al., 2021). The sector was responsible for 15% of global emissions in 2018 (Lamb et al., 2021). In developed countries, increasing demand for heavier vehicles has offset efforts to improve efficiency. The IEA estimates that sport utility vehicles (SUVs), which accounted for 42% of total car sales in 2020, are the only energy-related emissions sector with increasing emissions in advanced economies (IEA, 2021c).
The electrification of the motorized transportation remains key in ensuring the decarbonization of the transportation sector. The development of hydrogen technologies such as fuel cell vehicles, shifting passenger demand from private to public transport and freight from road to rail are also important mitigation options (IEA, 2021c). In this analysis we focus on electric vehicles (EVs). To keep transportation decarbonization in line with overall mitigation objectives, the share of EVs in annual new car sales should reach between 75 and 95% by 2030, representing a 20% to 40% share of the total light vehicle fleet (Climate Action Tracker, 2020). The sales of combustion engine vehicles must be phased down in parallel to increase in the sale of EVs in this period.
Phase out dates for sales of combustion engine motors is set in a few of the analysed countries
Some of the analysed countries or regions have decided to phase out sales of new combustion-engine vehicles (Table 11). The overview reveals that smaller countries have set stronger targets for a combustion engine phase out, such as Norway, Iceland, and the Netherlands. Larger countries that do not have set targets for a combustion engine phase out, such as the United States and China, overall rely more heavily on road traffic for both passenger and freight transportation.
Table 11: National targets for phasing-out from sales of combustion-engine vehicles.
The five largest passenger car markets by sales – China, United States, Japan, Germany and India – all lack any sort of commitment toward either concrete phase-out dates or a 100% electric vehicles sales or registration target (Wappelhorst, 2021). Japan has set a similar target, but it still allows for the sale
5 Sales of plug-in hybrids will continue to be allowed from 2030 to 2035 6 At this stage, this is a proposal by the European Commission that still requires an agreement with the European Council and Parliament.
Countries Phase-out date
Norway 2025 Israel, Iceland, the Netherlands, Ireland, Sweden, Denmark, Slovenia, the UK5 2030 Canada, the EU6, Japan 2035 France, Spain, Singapore 2040 Costa Rica 2050

Tracking climate mitigation efforts in 30 major emitters
NewClimate Institute | October 2021 29
of hybrid electric vehicles beyond 2035. Some governments have set out their commitment in policy documents, but many are yet to publish more detailed plans on the respective implementation.
Although high-emitting countries such as the United States and China do not have domestic targets in place, there are some regional initiatives. For example, the state of California is set to phase out combustion engine vehicles by 2035 and the Chinese province Hainan by 2030. The operation of combustion-engine vehicles is also expected to be progressively banned in many cities, like Paris, Copenhagen and Amsterdam (Wappelhorst, 2020).
Electric vehicle sales have picked up speed in several countries
EV sales have increased over the past years, reaching a record global sale of about 3 million in 2020 (IEA, 2021b). Despite this 41% increase in registrations from 2019, electric cars only accounted for about 4.6% of global car sales as well as around 0.9% of global car stock in 2020. The global EV sales share is projected to reach between 17.3% (Stated Policies scenario) and 36% (Sustainable Development scenario) by 2030 (IEA, 2021a), significantly at odds with the benchmark of a sales share between 75 and 95% by 2030.
Countries generally fail to set clear targets for either EV sales or shares. Targets to end the sale of fossil-fuel burning cars effectively pose a 100% phase-in target for zero-emissions vehicles. However, most countries do not specify any further intermediate goals.
According to draft legislation, the EU aims to have 30 million zero-emissions vehicles on European road (Abnett, 2020), but no tangible policy has been published as of now. President Biden recently announced the target of achieving an EV market share of 50% by 2030 (The White House, 2021). The Ukraine aims for at least 50% share of electric cars in the car sales market by 2030. These targets are incompatible with Paris compatible sectoral benchmarks.
Countries that are most successful in the uptake of electric vehicles have combined several instruments to support the uptake of EVs (IEA, 2021b). Norway, for example, provides subsidies for vehicles or charging stations networks in addition to announcing future bans. In part, such structural policy approach signals a clear, long-term commitment to both consumers and car manufacturers.
Although governmental targets are insufficient or lacking altogether, an increasing number of manufacturers have signalled their intention to phase out the production of combustion engine vehicles in favour of electric vehicles. In a collective push in India, more than 25 companies have recently sought government support to set a firm target of 65% of EV sales share by 2030 (Shah, 2021).
4.5 Agriculture and Forestry Structural changes are key to realize forest and agricultural mitigation efforts
Global emissions from the Agriculture, Forestry and Other Land Use (AFOLU) sector have on average grown by 0.8% per year since 2000 (Lamb et al., 2021). The sector was responsible for 22% of global net emissions in 2018 (Lamb et al., 2021). Most of this growth is explained by expansion of cropland at the expense of tropical forests in Africa, Latin America and Southeast Asia. Diet change in emerging countries towards more emissions-intensive foods (meat, oils, etc.) and the development of bioenergy are also key drivers of the increasing pressure on land.
Policies, targets, and actions need to be implemented to ensure a peak and fast reduction of agriculture emissions
According to the FAO, emissions from agriculture increased by 2% between 2012 and 2019. This global trend of increasing emissions needs to be halted and reversed for the agricultural sector to be aligned with a 1.5°C pathway. By 2030, agricultural emissions need to be reduced by 22% compared to 2017 levels (Searchinger et al., 2019).

Tracking climate mitigation efforts in 30 major emitters
NewClimate Institute | October 2021 30
Mitigation in the sector consists mostly of the adoption of new technologies to ensure productivity improvements and changes in diet and consumption patterns, including the reduction of waste. New agricultural practices, such as agroecology, which limit or prohibit the use of fertilizers, are additional mitigation options that reduce emissions associated with fertilizers consumption. They can also provide other benefits, especially in terms of biodiversity conservation and ecosystem protection. Agroecological practices have been adopted to varying extents; some have been widely used for decades, others are more recent. The choice of specific practices also varies depending on the agroclimatic zone (HLPE, 2019).
Enforcement of deforestation policies and reforestation targets needs to be improved
Deforestation must be drastically reduced to limit emissions associated with the forestry sector. To align with a 1.5°C pathway, gross deforestation should fall by 70% by 2030 relative to the 2019 level (Lebling et al., 2020). Action on deforestation is important to reduce emissions, but also to preserve and enhance forest carbon sinks to offset emissions from other sectors that are difficult to mitigate.
Several of the countries analysed adopted policies to reduce deforestation (e.g., Brazil, Indonesia and Mexico) and to protect natural resources and key ecosystems (e.g., Colombia, China and Malaysia). However, erosion of existing forest protection regulations is observed in the case of the Democratic Republic of the Congo. Deforestation rates in key biomes7 such as the Brazilian Amazon have peaked and been significantly reduced but are yet again on an upward trend in countries such as Brazil (Silva Junior et al., 2021) and Colombia (Global Forest Watch, 2021). Thus, progress in reducing deforestation remains slow and successful actions that curbed forest lost in area such as the Brazilian Amazon must be urgently resumed.
Reforestation and afforestation commitments are also important and play a key role in the 1.5°C pathway as it’s commonly perceived that nature-based solution that provides the highest level of mitigation potential (Griscom et al., 2017). While estimates vary, 170 to 250 million hectares of new forest need to be planted globally to align with a 1.5°C pathway (IEA, 2021c). Many of the analysed countries have voluntary afforestation/reforestation targets (e.g., China, India, EU, Argentina) and have had success implementing such programs.
National policy implementation is assisted by global commitments such as the New York Declaration on Forests (NYDF) which offers a common, multi-stakeholder framework for forest action, consolidating various initiatives and objectives that drive forest protection, restoration, and sustainable use. The NYDF is a global commitment of ten goals, including halting natural forest loss by 2030 and restoring 350 million hectares of degraded forest landscapes. Significant progress has been made towards this goal in term of commitments by the entities (countries, subnational regions, companies, and NGOs) that have committed to the NYDF. Already as of 2016, entities had committed to restoring 124.3 million hectares of forest landscapes (Climate Focus, 2016). However, intensifying competition for land may hinder the implementation of these commitments and the successful completion of the commitments remains to be seen.
7 A biome can be defined as a ‘biogeographic province’. Brazil has six terrestrial biomes (Amazônia, Cerrado, Caatinga, Mata Atlântica, Pantanal, and Pampa) and one marine biome.
Tracking climate mitigation efforts in 30 major emitters
NewClimate Institute | October 2021 31
References Abnett, K. (2020) ‘EU to target 30 million electric cars by 2030 - draft’, Reuters.com, 4 December.
Available at: https://www.reuters.com/article/us-climate-change-eu-transport-idUSKBN28E2KM.
APERC (2019) APEC Energy Demand and Supply Outlook – 7th edition (Vol II). Tokyo, Japan: Asia Pacific Energy Research Centre, The Institute of Energy Economics, Japan. Available at: http://aperc.ieej.or.jp/file/2010/9/24/Outlook_Volume_II_4E.pdf.
Bryan, B. A. et al. (2018) ‘China’s response to a national land-system sustainability emergency’, Nature, 559(7713), pp. 193–204. doi: 10.1038/s41586-018-0280-2.
Climate Action Tracker (2016) ‘Constructing the future: Will the building sector use its decarbonisation tools? CAT Decarbonisation Series’. Available at: https://newclimate.org/2016/11/02/constructing-the-future/.
Climate Action Tracker (2020) Paris Agreement Compatible Sectoral Benchmarks: Elaborating the decarbonisation roadmap. Climate Action Tracker (Climate Analytics, NewClimate Institute). Available at: https://climateactiontracker.org/documents/753/CAT_2020-07-10_ParisAgreementBenchmarks_FullReport.pdf.
Climate Action Tracker (2021) ‘Evaluation methodology for national net zero targets’. Climate Action Tracker. Available at: https://climateactiontracker.org/documents/859/CAT_Evaluation-methodology-for-national-net-zero-targets.pdf.
Climate Focus (2016) Progress on the New York Declaration on Forests: Eliminating Deforestation from the Production of Agricultural Commodities–Goal 2 Assessment Report. Prepared by Climate Focus in cooperation with the NYDF Assessment Coalition with support from the Climate and Land Use Alliance and the Tropical Forest Alliance 2020. Available at: http://climatefocus.com/sites/default/files/2016-NYDF-Goal-2-Assessment-Report.pdf.
Climate Transparency (2020) Climate Transparency Report: Comparing G20 Climate Action and Responses to the COVID-19 Crisis. Berlin, Germany: Climate Transparency. Available at: https://www.climate-transparency.org/g20-climate-performance/the-climate-transparency-report-2020.
D’Agostino, D. et al. (2021) ‘Assessing Nearly Zero Energy Buildings (NZEBs) development in Europe’, Energy Strategy Reviews, 36, p. 100680. doi: https://doi.org/10.1016/j.esr.2021.100680.
den Elzen, M. et al. (2019) ‘Are the G20 economies making enough progress to meet their NDC targets?’, Energy Policy, 126, pp. 238–250. doi: 10.1016/j.enpol.2018.11.027.
Energy Foundation China (2020a) Synthesis Report 2020 on China’s Carbon Neutrality. Beijing, China. Available at: https://cgs.umd.edu/sites/default/files/2020-12/Full Report_Synthesis Report 2020 on China%27s Carbon Neutrality_EN.pdf.
Energy Foundation China (2020b) Synthesis Report 2020 on China’s Carbon Neutrality. Beijing, China.
Energy Transitions Commission (2021) Keeping 1.5°C Alive: Closing the Gap in the 2020s. Energy Transitions Commission. Available at: https://www.energy-transitions.org/wp-content/uploads/2021/09/ETC-Keeping-1.5C-Alive-Closing-the-Gap-in-the-2020s.pdf.
Eskander, S. M. S. U. and Fankhauser, S. (2020) ‘Reduction in greenhouse gas emissions from national climate legislation’, Nature Climate Change. doi: 10.1038/s41558-020-0831-z.
European Commission (2020) A European Green Deal - Striving to be the first climate-neutral continent, European Commission website. Available at: https://ec.europa.eu/info/strategy/priorities-2019-2024/european-green-deal_en (Accessed: 4 September 2020).
FAOSTAT (2021) Land use emissions. Food and Agriculture Organization of the United Nations. Available at: http://www.fao.org/faostat/en/#data/GL (Accessed: 10 May 2021).
Fekete, H. et al. (2021) ‘A review of successful climate change mitigation policies in major emitting economies and the potential of global replication’, Renewable and Sustainable Energy Reviews, 137, p. 110602. doi: 10.1016/j.rser.2020.110602.

Tracking climate mitigation efforts in 30 major emitters
NewClimate Institute | October 2021 32
Global Energy Monitor (2020) Global Coal Plant Tracker Database (July), Global Energy Monitor. Available at: https://endcoal.org/global-coal-plant-tracker/ (Accessed: 27 October 2020).
Global Forest Watch (2021) Colombia Interactive Forest Map & Tree Cover Change Data, Global Forest Watch. Available at: https://www.globalforestwatch.org/dashboards/country/COL/ (Accessed: 25 May 2021).
Government of Brazil (2015) Intended Nationally Determined Contribution towards achieving the objective of the United Nations Framework Convention on Climate Change. Federaltive Republic of Brazil. Available at: http://www4.unfccc.int/submissions/INDC/Published Documents/Brazil/1/BRAZIL iNDC english FINAL.pdf.
Government of Brazil (2020) Brazil’s Nationally Determined Contribution (NDC). Available at: https://www4.unfccc.int/sites/NDCStaging/pages/Party.aspx?party=BRA (Accessed: 29 March 2021).
Government of the UK (2021) Net Zero Strategy: Build Back Greener. Available at: https://unfccc.int/sites/default/files/resource/UK Net Zero Strategy - Build Back Greener.pdf.
Green Steel Tracker (2021) Dataset (version 6 June 2021). Green Steel Tracker. Available at: https://www.industrytransition.org/content/uploads/2021/08/green-steel-tracker-210606.xlsx (Accessed: 12 October 2021).
Griscom, B. W. et al. (2017) ‘Natural climate solutions’, Proceedings of the National Academy of Sciences, 114(44), pp. 11645–11650. doi: 10.1073/pnas.1710465114.
Hermelink, A. et al. (2019) Comprehensive study of building energy renovation activities and the uptake of nearly zero-energy buildings in the EU. European Commission. doi: 10.2833/14675.
HLPE (2019) ‘Agroecological and other innovative approaches for sustainable agriculture and food systems that enhance food security and nutrition’, A report by the High Level Panel of Experts on Food Security and Nutrition of the Committee on World Food Security, (July), pp. 1–162.
Höhne, N. et al. (2020) ‘Emissions: world has four times the work or one-third of the time’, Nature, 579(March), pp. 25–28. Available at: https://www.nature.com/articles/d41586-020-00571-x.
Iacobuta, G. et al. (2018) ‘National climate change mitigation legislation, strategy and targets: a global update’, Climate Policy, 18(9), pp. 1114–1132. doi: 10.1080/14693062.2018.1489772.
IEA (2021a) ‘Global EV Data Explorer: data behind the Global EV Outlook 2021’. Paris, France. Available at: https://www.iea.org/articles/global-ev-data-explorer (Accessed: 24 April 2021).
IEA (2021b) Global EV Outlook 2021: Accelerating ambitions despite the pandemic. Paris, France. Available at: https://iea.blob.core.windows.net/assets/ed5f4484-f556-4110-8c5c-4ede8bcba637/GlobalEVOutlook2021.pdf.
IEA (2021c) Net Zero by 2050: A Roadmap for the Global Energy Sector. Paris, France: International Energy Agency. Available at: https://www.iea.org/reports/net-zero-by-2050.
IEA (2021d) ‘World Energy Balances’. Paris, France: International Energy Agency (IEA).
INPE (2019) ‘Alertas do DETER na Amazônia em junho somam 2.072,03 km2’.
IPCC (2018) ‘Summary for Policymakers’, in Masson-Delmotte, V. et al. (eds) Global Warming of 1.5°C Summary for policy makers. Intergovernmental Panel on Climate Change (IPCC), p. 33. Available at: http://www.ipcc.ch/report/sr15/.
Kuramochi, T., Fekete, H., et al. (2018) Greenhouse gas mitigation scenarios for major emitting countries. Analysis of current climate policies and mitigation commitments: 2018 update. NewClimate Institute, PBL Netherlands Environmental Assessment Agency and International Institute for Applied Systems Analysis. Available at: https://newclimate.org/2018/12/05/greenhouse-gas-mitigation-scenarios-for-major-emitting-countries-analysis-of-current-climate-policies-and-mitigation-commitments-2018-update/.
Kuramochi, T., Höhne, N., et al. (2018) ‘Ten key short-term sectoral benchmarks to limit warming to 1.5°C’, Climate Policy, 18(3), pp. 287–305. doi: 10.1080/14693062.2017.1397495.

Tracking climate mitigation efforts in 30 major emitters
NewClimate Institute | October 2021 33
Kuramochi, T. et al. (2021) ‘Greenhouse gas emission scenarios in nine key non-G20 countries: An assessment of progress toward 2030 climate targets’, Environmental Science & Policy, 123, pp. 67–81. doi: https://doi.org/10.1016/j.envsci.2021.04.015.
Lamb, W. F. et al. (2021) ‘A review of trends and drivers of greenhouse gas emissions by sector from 1990 to 2018’, Environmental Research Letters, 16(7), p. 073005. doi: 10.1088/1748-9326/abee4e.
Lebling, K. et al. (2020) State of Climate Action Assessing Progress toward 2030 and 2050. Washington D.C: World Resources Institute. Available at: https://www.wri.org/publication/state-climate-action-assessing-progress-toward-2030-and-2050.
Liu, G. et al. (2020) ‘Building green retrofit in China: Policies, barriers and recommendations’, Energy Policy, 139, p. 111356. doi: https://doi.org/10.1016/j.enpol.2020.111356.
Nascimento, L., Kuramochi, T., van Soest, H., et al. (2021) Greenhouse gas mitigation scenarios for major emitting countries. Analysis of current climate policies and mitigation commitments: 2021 Update. NewClimate Institute, PBL Netherlands Environmental Assessment Agency and International Institute for Applied Systems Analysis. Available at: https://newclimate.org/2021/10/07/ghg-mitigation-scenarios-for-major-emitting-countries-analysis-of-current-climate-policies-2021-update/.
Nascimento, L., Kuramochi, T., Iacobuta, G., et al. (2021) ‘Twenty years of climate policy: G20 coverage and gaps’, Climate Policy. doi: 10.1080/14693062.2021.1993776.
Norwegian Ministry of Petroleum and Energy (2019) Taxes and emissions trading - Energifakta Norge. Available at: https://energifaktanorge.no/en/et-baerekraftig-og-sikkert-energisystem/avgifter-og-kvoteplikt/ (Accessed: 20 May 2019).
Olivier, J. G. J. and Peters, J. A. H. W. (2020) Trends in global CO2 and total greenhouse gas emissions: 2019 report. The Hague, Netherlands: PBL Netherlands Environmental Assessment Agency. Available at: https://www.pbl.nl/sites/default/files/downloads/pbl-2020-trends-in-global-co2-and-total-greenhouse-gas-emissions-2019-report_4068.pdf.
Ren, S. et al. (2014) ‘The impact of international trade on China׳s industrial carbon emissions since its entry into WTO’, Energy Policy, 69, pp. 624–634. doi: https://doi.org/10.1016/j.enpol.2014.02.032.
Republic of Indonesia (2018) Indonesia Second Biennial Update Report Under the United Nations Framework Convention on Climate Change. Jakarta, Indonesia: Directorate General of Climate Change, Ministry of Environment and Forestry, Government of Indonesia.
Republic of Indonesia (2021) ‘Rencana Usaha Penyediaan Tenaga Listrik (RUPTL) 2021-2030’. Available at: https://web.pln.co.id/statics/uploads/2021/10/ruptl-2021-2030.pdf.
Rissman, J. et al. (2020) ‘Technologies and policies to decarbonize global industry: Review and assessment of mitigation drivers through 2070’, Applied Energy, 266(March), p. 114848. doi: 10.1016/j.apenergy.2020.114848.
Roelfsema, M. et al. (2018) ‘Reducing global GHG emissions by replicating successful sector examples: the “good practice policies” scenario’, Climate Policy, 18(9), pp. 1103–1113. doi: 10.1080/14693062.2018.1481356.
Searchinger, T. et al. (2019) Creating a Sustainable Food Future: A Menu of Solutions to Feed Nearly 10 Billion People by 2050. Final report. Washington D.C. Available at: https://www.wri.org/research/creating-sustainable-food-future.
SEEG (2020) Total Emissions Data. Greenhouse Gas Emission and Removal Estimating System (SEEG).
Shah, A. (2021) ‘Indian businesses seek government support to meet 2030 EV target’. Available at: https://www.reuters.com/technology/indian-businesses-seek-government-support-meet-2030-ev-target-2021-10-14/.
Shearer, C. (2020) Analysis: The global coal fleet shrank for first time on record in 2020, Carbon Brief. Available at: https://www.carbonbrief.org/analysis-the-global-coal-fleet-shrank-for-first-time-on-record-in-2020 (Accessed: 17 August 2020).

Tracking climate mitigation efforts in 30 major emitters
NewClimate Institute | October 2021 34
Silva Junior, C. H. L. et al. (2021) ‘The Brazilian Amazon deforestation rate in 2020 is the greatest of the decade’, Nature Ecology and Evolution, 5(2), pp. 144–145. doi: 10.1038/s41559-020-01368-x.
The White House (2021) ‘President Biden Announces Steps to Drive American Leadership Forward on Clean Cars and Trucks’. Available at: https://www.whitehouse.gov/briefing-room/statements-releases/2021/08/05/fact-sheet-president-biden-announces-steps-to-drive-american-leadership-forward-on-clean-cars-and-trucks/.
UK Government (2019) Updated Energy and Emissions Projections: 2018 (Annex J: Total Electricity Generation by Source).
UNEP (2019) ‘Emissions Gap Report 2019’. United Nations Environment Programme. Available at: https://www.unep.org/resources/emissions-gap-report-2019.
UNFCCC (2015) Adoption of the Paris Agreement. FCCC/CP/2015/L.9/Rev.1. Paris, France: United Nations Framework Conventions on Climate Change. Available at: http://unfccc.int/resource/docs/2015/cop21/eng/l09r01.pdf.
UNFCCC (2021) Race to Zero Breakthroughs: Transforming Our Systems Together. A global challenge to accelerate sector breakthroughs for COP26 – and beyond. United Nations Framework Convention on Climate Change. Available at: https://racetozero.unfccc.int/wp-content/uploads/2021/02/Race-to-Zero-Breakthroughs-Transforming-Our-Systems-Together.pdf.
Wappelhorst, S. (2020) The end of the road? An overview of combustion-engine car phase-out announcements across Europe. ICCT. Available at: https://theicct.org/sites/default/files/publications/Combustion-engine-phase-out-briefing-may11.2020.pdf.
Wappelhorst, S. (2021) ‘Update on government targets for phasing out new sales of internal combustion engine passenger cars’. International Council on Clean Transportation (ICCT).
World Bank (2021) State and Trends of Carbon Pricing 2021. Washington DC, USA: World Bank. Available at: https://openknowledge.worldbank.org/handle/10986/35620.

NewClimate Institute Waidmarkt 11a 50676 Cologne Germany
International Institute for Applied Systems Analysis (IIASA) Schlossplatz 1 2361 Laxenburg Austria
FTSE Russell 10 Paternoster Square London EC4M 7LS United Kingdom