Battling Obesity: Efforts in preventing knee osteoarthritis
185
Battling besity Efforts in preventing knee osteoarthritis Bastiaan C. de Vos
-
Upload
khangminh22 -
Category
Documents
-
view
2 -
download
0
Transcript of Battling Obesity: Efforts in preventing knee osteoarthritis

Battling
besity
Efforts in preventingknee osteoarthritis
Bastiaan C. de Vos


Battling ObesityEfforts in preventing knee osteoarthritis
Bastiaan de Vos

The work in this thesis is supported by ZonMw, The Netherlands Organisation of Health Research and Development, the Dutch Arthritis Foundation and by the D-Board project, which has received funding from the European Union’s Seventh Framework Programme for research, technological development and demonstration.
Financial support for the publication of this thesis was kindly provided by the SBOH, employer of GP trainees.
© 2016 Bastiaan de VosAll rights reserved. No parts of this publication may be reproduced or transmitted, in any form or by any means, without permission of the author, or, when applicable, of the publishers of the scientific papers.
Lay-out and printing by Optima Grafische Communicatie, Rotterdam
ISBN 978-94-6169-991-6

Battling ObesityEfforts in preventing knee osteoarthritis
De strijd aangaan met obesitasInspanningen in de preventie van knie artrose
Proefschrift
ter verkrijging van de graad van doctor aan deErasmus Universiteit Rotterdam
op gezag van de rector magnificus
Prof.dr. H.A.P. Pols
en volgens het besluit van het College voor Promoties.
De openbare verdediging zal plaatsvinden opdinsdag 7 februari 2017 om 15: 30 uur
door
Bastiaan Cornelis de Vosgeboren te Sliedrecht

PrOmOtieCOmmissie
Promotor: Prof.dr. S.M.A. Bierma-Zeinstra
Overige leden: Prof.dr. O.H. Franco Duran Prof.dr. G. Kloppenburg Prof.dr. E.F.C. van Rossum
Copromotor: Dr. J. Runhaar

COntents
1. Introduction 7
2. Effectiveness of a tailor-made weight loss intervention in primary care 19
3. Latent class growth analysis successfully identified subgroups of participants during a weight loss intervention trial
37
4. Moderate weight loss prevents incident knee osteoarthritis in overweight and obese females.
47
5. Effect of weight change on progression of knee OA features assessed by MRI in high-risk overweight and obese women
61
6. The long-term effects of a randomized, controlled, tailor-made weight loss intervention in primary care on the health and lifestyle of overweight and obese women.
79
7. The long-term effects of a tailor-made lifestyle intervention and of oral glucosamine sulfate in primary care on incident knee OA in overweight and obese women.
97
8. Physical activity during and after a lifestyle intervention: a latent class growth analysis approach
115
9. General discussion 131
Summary 147
Nederlandse samenvatting 155
Dankwoord 163
Curriculum Vitae 169
PhD Portfolio 173


1
2
3
4
5
6
7
8
9
10
11
Chapter 1 Introduction

9
1
2
3
4
5
6
7
8
9
10
11
Knee OsteOarthritis
Just over 200 years ago, for the first time since Hippocrates, medicine started to aban-don the idea all arthritic diseases could be contributed to gout1. In 1805, one of the first physicians to describe osteoarthritis, John Haygarth, described very accurately the burden of osteoarthritis, greatly lowering quality of life, without shortening the lifespan of the patient, already urging his colleagues for awareness of this disease2:
“There is one distressful circumstance which distinguishes this disease. It has no intermis-sion, and but slight remissions. For during the remainder of the patient’s life, the nodes gradually enlarge, impeding more and more the motion of the limb. These nodes, in their gradual progress, sadly embitter the comforts of life; but I know of no instance in which they seemed to shorten its duration. The first patient whom I saw in this disease lived to about 93 years of age. The faithful picture drawn from nature is here exhibited to excite the compas-sion and exertion of my professional brethren to prevent, if possible, so distressful a malady at its commencement.”
John Haygarth, 1805Since then, the extent of the burden osteoarthritis has only increased and seems to
continue doing so3 4. Large epidemiological studies show osteoarthritis to be a very common disease, leading to substantial morbidity, physical and psychological disability and a considerable economic burden5 6. The Global Burden of Disease Study reported a higher burden than expected from previous studies and estimates that osteoarthritis accounts for 6.8% of Disability Adjusted Life Years (DALY’s) worldwide7. The World Health Organization (WHO) reports estimates of 9.6% for men and 18.0% for women aged over 60 years for symptomatic osteoarthritis. With an estimated 80% of all patients having limitations in movement and 25% experiencing limitations in daily life, osteoarthritis is considered one of the top ten most disabling diseases in developed countries8.
The interphalangeal joints of the hand are the most commonly affected joints in osteoarthritis, but very often asymptomatic. Knee osteoarthritis, the second most

10
commonly affected joint, is much more often symptomatic, making the impact of knee osteoarthritis the highest in this area of rheumatic diseases9. Knee osteoarthritis preva-lence rates vary between 2.8% and 4.8% for all ages, are higher in women and highest around patients’ 50th life year5. Knee osteoarthritis is characterized by knee pain, morn-ing stiffness and functional limitation and is considered to be a degenerative disease, caused by both mechanical and metabolic factors10 11.
Therapeutic options for knee osteoarthritis remain limited, most interventions aim to control symptoms and keep disability to a minimum9. Non-surgical management of knee osteoarthritis largely consists of pain control, exercise and weight management, intra-articular corticosteroids and biomechanical interventions, all contributing to managing the disease, more than actually curing it12. Naturally, only surgery removes the disease completely, but is however only applicable to a subset of patients meeting the criteria for major surgery. Moreover, studies show that large beneficial effects of total knee replacement in knee osteoarthritis are only to be expected in those patients with advanced osteoarthritis13.
When confronted with a disease causing high morbidity and limited therapeutic options, the highest benefits are to be expected from primary prevention. In order for primary prevention to be successful, risk factors need to be identified and a distinction needs to be made between modifiable and non-modifiable risk factors. The main risk factors for the development of knee osteoarthritis are ageing, obesity, female gender, knee injury in the past and heredity9 10. Self-evidently, ageing, female gender and he-redity are non-modifiable risk factors. Modifying knee injury in the past would require prevention of the risk factor in the first place. This would require prevention programs at very young age. The only modifiable risk factor in a middle-aged population, at high risk for developing knee osteoarthritis, seems to be obesity. A large study investigating the relationship between obesity and osteoarthritis found odds ratios of 6.2 for unilateral knee osteoarthritis and 18.0 for bilateral knee osteoarthritis for obese women aged 45-64 compared to women of the same age with a normal BMI14. Consequently, in literature many recommendations are made about prevention of knee osteoarthritis through modifying obesity15. In 1992 already, results from The Framingham Study suggested the design of a preventive trial in knee osteoarthritis and estimated that a reduction in body weight of approximately 5.1 kg could lead to a substantial decrease in incidence, espe-cially in a high risk population16. Unfortunately, available evidence on the prevention of clinical knee osteoarthritis through weight loss is still very scarce17-19. A few studies were designed to evaluate the preventive effect on intermediate outcome measures of knee osteoarthritis, such as cartilage thickness or knee pain20 21. These studies did find indica-tions of a preventive effect as suggested by The Framingham Study. However, in order to study the prevention of clinical knee osteoarthritis, a large, randomized controlled

11
1
2
3
4
5
6
7
8
9
10
11
trial is needed with long follow-up, conducted in a high-risk population, with outcome measures that combine clinical and radiographic data16-19.
OVerweight anD OBesity
Similar to osteoarthritis, obesity is an ancient problem with which physicians have been struggling for a long time. As early as the fifth century B.C. Hippocrates realized diet and exercise to be key factors in health and recommended moderation:
“If we could give every individual the right amount of nourishment and exercise, not too little and not too much, we would have found the safest way to health.”
Hippocrates, fifth century B.C.Of course, in modern times the problem of overweight and obesity has reached
enormous proportions. In 2005, 23.2% of the world’s population was overweight and 9.8% was obese. It was estimated that in 2030 these figures can be as high as 38% and 20%, respectively22. This problem is highest in developed countries, leading to a variety of comorbidities such as cardiovascular diseases, malignancies, osteoarthritis, diabetes and many more23. In the United States, already over 20% of all healthcare expenditures is spent on obesity and obesity-related diseases24.
In order to modify obesity as a risk factor for knee osteoarthritis, an effective inter-vention is needed that is capable of inducing a clinically significant amount of weight loss in large groups of overweight and obese individuals. The amount of 5 kg of weight loss estimated by The Framingham Study as sufficient to substantially decrease the odds of developing knee osteoarthritis, matches the amount of weight loss which is needed to improve cardiovascular risk factors, as estimated by a number of studies25-27. Consequently, when attempting to prevent knee osteoarthritis by promoting weight loss, physical health will be improved in general also. Moreover, the two key ingredients of weight loss, diet and exercise, have been separately associated with improvement of health outcomes as well, regardless of actual decrease in body weight28-30. When at-tempting to achieve a decrease in body weight however, the combination of these two factors has been proven to be most effective25 28 29 31.
Over the last few decades, numerous weight loss trials in overweight and obese patients have been conducted25 31. These trials are often confronted with a number of difficulties when attempting to achieve a clinically significant amount of weight loss in large groups of overweight and obese individuals. One of the often encountered problems is that of dropout. Naturally, in every clinical trial there is a proportion of par-ticipants that drops out of the study earlier than planned. However, in weight loss trials dropout rates are often among the highest of clinical trials, reporting a mean dropout of 40% in the first twelve months in obesity trials32. Factors that have been associated

12
with high dropout rates are: strict, intensive diet and exercise schemes, female gender, young age, poor lifestyle habits, long studies and poor initial response to treatment32 33. Low dropout rates are always preferable, but when high dropout rates are unavoidable, complex statistic techniques are needed to account for missing data34. Unfortunately, these techniques are not yet always applied, some even using very outdated techniques such as ‘last observation carried forward’34. As a result, study results cannot properly be translated to clinical practice. Another common problem encountered in many weight loss trials is the fact that weight lost during an intervention is often quickly regained afterwards35. Many trials end follow-up of their participants at the same moment the intervention ends, failing to observe the long-term effects of the intervention after it ended. When attempting to modify a risk factor of a slowly progressing disease such as osteoarthritis, naturally an intervention is needed that can achieve long-term behavioral changes, leading to sustainable weight loss.
the PrOOF stuDy
In 2005, the PROOF study (PRevention of knee Osteoarthritis in Overweight Females) was launched. This trial was designed to be the first randomized controlled trial in the prevention of clinical and radiographic knee osteoarthritis. Naturally, a weight loss intervention was designed. To meet recommendations from literature, the weight loss intervention was tailor-made, meaning no predefined scheme of diet and exercise was determined. Instead, a dietician, or lifestyle coach, trained in motivational interview-ing, made in dialogue with each participant an individual plan regarding both diet and exercise, aimed at achieving a clinically significant amount of weight loss and moreover, aimed at maintaining their lower body weight. It was expected this approach would lead to lower dropout rates than comparable weight loss interventions, prescribing a strict diet and exercise scheme. Moreover, motivational interviewing is aimed especially at promoting long-term, sustainable behavioral changes36. In addition to being random-ized to this lifestyle intervention or to a control group, participants were randomized to oral glucosamine sulfate or placebo. At the time of commencement of the PROOF study, in addition to recommendations on weight loss, there were recommendations in literature regarding the effect of pharmacological substances when designing a trial aimed at preventing knee osteoarthritis37. Glucosamine had shown promising beneficial effects in patients with established knee osteoarthritis, side effects similar to placebo and findings from studies suggest greater effects in earlier stages of the disease, making a preventive effect plausible38 39.
Individuals at high-risk of developing knee osteoarthritis were the population of main interest. Incidence of knee osteoarthritis spikes at the age of fifty, more in women than

13
1
2
3
4
5
6
7
8
9
10
11
in men. Therefore, only women aged 50 - 60 without knee osteoarthritis were included. The glucosamine intervention lasted for 2.5 years. The tailor-made character of the lifestyle intervention resulted in a duration that was different for each individual, but was maximized at 2.5 years. During this period, every six months biometrical data was collected, questionnaires were completed and radiographic data was collected. In order to evaluate long-term intervention effects, measurements and questionnaires were repeated 4 years after the end of the intervention, resulting in a total follow-up time of 6.5 years. Primary outcome of the PROOF Study was incidence of knee osteoarthritis after 2.5 years. The main outcome of interest after 6.5 years was knee osteoarthritis, assessed by ACR (American College of Rheumatology) criteria, using both clinical and radiographic data40.
In conclusion, the high burden of knee osteoarthritis can best be addressed by prevention. Prevention of knee osteoarthritis could be achieved by weight loss in a high-risk population. Women from the age of 50 with overweight or obesity are those individuals most at risk of developing knee osteoarthritis. The PROOF Study was the first randomized controlled trial in the prevention of knee osteoarthritis, incorporating recommendations from literature to induce long-term behavioral changes in order to in-duce a clinically significant amount of weight loss, which in turn could lead to decreased odds of developing knee osteoarthritis. Additionally, the PROOF Study investigated the preventive effect of oral glucosamine sulfate on incident knee osteoarthritis.
aims anD Outline OF this thesis
The main aims of this thesis are to describe:1. The effectiveness of a tailor-made lifestyle intervention in achieving a clinically
significant amount of weight loss in middle-aged, overweight women2. The effect of this achieved weight loss on the incidence of knee osteoarthritis3. The long-term intervention effects of the PROOF study on both health outcomes and
incident knee osteoarthritisChapter 2 reports on the effectiveness of the lifestyle intervention of the PROOF Study in achieving a clinically significant amount of weight loss, during the first 2.5 year in which the intervention took place. All body weight data collected in this first period was used in a secondary analysis, in which particular patterns of weight change over time were studied, as described in Chapter 3. Both Chapter 4 and Chapter 5 report on the effect of weight loss on measures of knee osteoarthritis. The first of these two chapters evaluates the effect of a moderate amount of weight loss on the development of clinical knee osteoarthritis. The second chapter describes the effect of particular weight change trajectories, as identified in Chapter 3, on knee osteoarthritis features

14
assessed by MRI. Chapter 6 and Chapter 7 report on the long-term effects of the PROOF study, the first chapter reporting on the health and lifestyle of participants, the second chapter reporting on the long-term effects on incident knee osteoarthritis. Lastly, in Chapter 8, particular patterns of long-term change in physical activity during and after the intervention were studied, using the same technique as in Chapter 3. Chapter 9 covers the discussion of the main findings in this thesis and reports on implications for clinical practice and future research.

15
1
2
3
4
5
6
7
8
9
10
11
reFerenCes
1. Dequeker J, Luyten FP. The history of osteoarthritis-osteoarthrosis. Ann Rheum Dis 2008; 67(1): 5-10.
2. Haygarth J. A clinical history of the nodosity of the joints. A clinical History of Diseases Cadell and Davies, London 1805.
3. Murray CJL, Vos T, Lozano R. Disability-adjusted life years (DALYs) for 291 diseases and injuries in 21 regions, 1990-2010: a systematic analysis for the Global Burden of Disease Study 2010 (vol 380, pg 2197, 2012). Lancet 2014; 384(9943): 582-82.
4. Felson DT, Zhang YQ, Hannan MT, et al. The Incidence and Natural-History of Knee Osteoarthritis in the Elderly - the Framingham Osteoarthritis Study. Arthritis Rheum 1995; 38(10): 1500-05.
5. Cross M, Smith E, Hoy D, et al. The global burden of hip and knee osteoarthritis: estimates from the Global Burden of Disease 2010 study. Ann Rheum Dis 2014; 73(7): 1323-30.
6. Bitton R. The economic burden of osteoarthritis. Am J Manag Care 2009; 15(8 Suppl): S230-5. 7. Lozano R, Naghavi M, Foreman K, et al. Global and regional mortality from 235 causes of death
for 20 age groups in 1990 and 2010: a systematic analysis for the Global Burden of Disease Study 2010 (vol 380, pg 2095, 2012). Lancet 2013; 381(9867): 628-28.
8. Lee R, Kean WF. Obesity and knee osteoarthritis. Inflammopharmacology 2012; 20(2): 53-58. 9. Breedveld FC. Osteoarthritis - the impact of a serious disease. Rheumatology 2004; 43: I4-I8. 10. Zhang W, Doherty M, Peat G, et al. EULAR evidence-based recommendations for the diagnosis of
knee osteoarthritis. Ann Rheum Dis 2010; 69(3): 483-89. 11. Felson DT. Does excess weight cause osteoarthritis and, if so, why? Ann Rheum Dis 1996; 55(9):
668-70. 12. McAlindon TE, Bannuru RR, Sullivan MC, et al. OARSI guidelines for the non-surgical management
of knee osteoarthritis. Osteoarthr Cartilage 2014; 22(3): 363-88. 13. Ferket BS, Feldman Z, Zhou J, et al. The value of total knee replacement revisited: A comparative
analysis of its effectiveness and impact on healthcare costs using data from the osteoarthritis initiative. Osteoarthr Cartilage; 24: S39.
14. Hart DJ, Spector TD. The relationship of obesity, fat distribution and osteoarthritis in women in the general population: the Chingford Study. J Rheumatol 1993; 20(2): 331-5.
15. Silverwood V, Blagojevic-Bucknall M, Jinks C, et al. Current evidence on risk factors for knee osteoarthritis in older adults: a systematic review and meta-analysis. Osteoarthr Cartilage 2015; 23(4): 507-15.
16. Felson DT, Zhang YQ, Anthony JM, et al. Weight-Loss Reduces the Risk for Symptomatic Knee Osteoarthritis in Women - the Framingham-Study. Ann Intern Med 1992; 116(7): 535-39.
17. Jordan JM, Sowers MF, Messier SP, et al. Methodologic issues in clinical trials for prevention or risk reduction in osteoarthritis. Osteoarthritis Cartilage 2011; 19(5): 500-8.
18. Powell A, Teichtahl AJ, Wluka AE, et al. Obesity: a preventable risk factor for large joint osteoarthri-tis which may act through biomechanical factors. Br J Sports Med 2005; 39(1): 4-5.
19. Neogi T, Zhang Y. Osteoarthritis prevention. Curr Opin Rheumatol 2011; 23(2): 185-91. 20. Anandacoomarasamy A, Leibman S, Smith G, et al. Weight loss in obese people has structure-
modifying effects on medial but not on lateral knee articular cartilage. Ann Rheum Dis 2012; 71(1): 26-32.
21. White DK, Neogi T, Rejeski WJ, et al. Can an intensive diet and exercise program prevent knee pain among overweight adults at high risk? Arthritis Care Res (Hoboken) 2015; 67(7): 965-71.

16
22. Kelly T, Yang W, Chen CS, et al. Global burden of obesity in 2005 and projections to 2030. Int J Obes (Lond) 2008; 32(9): 1431-7.
23. Obesity: preventing and managing the global epidemic. Report of a WHO consultation. World Health Organ Tech Rep Ser 2000; 894: i-xii, 1-253.
24. Lehnert T, Sonntag D, Konnopka A, et al. Economic costs of overweight and obesity. Best Pract Res Clin Endocrinol Metab 2013; 27(2): 105-15.
25. Douketis JD, Macie C, Thabane L, et al. Systematic review of long-term weight loss studies in obese adults: clinical significance and applicability to clinical practice. Int J Obes (Lond) 2005; 29(10): 1153-67.
26. Anderson JW, Konz EC. Obesity and disease management: effects of weight loss on comorbid conditions. Obes Res 2001; 9 suppl 4: 326S-34S.
27. Glazer G. Long-term pharmacotherapy of obesity 2000: a review of efficacy and safety. Arch Intern Med 2001; 161(15): 1814-24.
28. Shaw K, Gennat H, O’Rourke P, et al. Exercise for overweight or obesity. Cochrane Database Syst Rev 2006(4): CD003817.
29. Johns DJ, Hartmann-Boyce J, Jebb SA, et al. Diet or exercise interventions vs combined behavioral weight management programs: a systematic review and meta-analysis of direct comparisons. J Acad Nutr Diet 2014; 114(10): 1557-68.
30. Gow ML, Ho M, Burrows TL, et al. Impact of dietary macronutrient distribution on BMI and car-diometabolic outcomes in overweight and obese children and adolescents: a systematic review. Nutr Rev 2014; 72(7): 453-70.
31. Wadden TA, Butryn ML, Hong PS, et al. Behavioral treatment of obesity in patients encountered in primary care settings: a systematic review. JAMA 2014; 312(17): 1779-91.
32. Colombo O, Ferretti VVV, Ferraris C, et al. Is drop-out from obesity treatment a predictable and preventable event? Nutrition Journal 2014; 13(1): 1-7.
33. Kelley GA, Kelley KS. Dropouts and compliance in exercise interventions targeting bone min-eral density in adults: a meta-analysis of randomized controlled trials. J Osteoporos 2013; 2013: 250423.
34. Elobeid MA, Padilla MA, McVie T, et al. Missing data in randomized clinical trials for weight loss: scope of the problem, state of the field, and performance of statistical methods. PLoS One 2009; 4(8): e6624.
35. Barte JC, ter Bogt NC, Bogers RP, et al. Maintenance of weight loss after lifestyle interventions for overweight and obesity, a systematic review. Obes Rev 2010; 11(12): 899-906.
36. Teixeira PJ, Silva MN, Coutinho SR, et al. Mediators of weight loss and weight loss maintenance in middle-aged women. Obesity (Silver Spring) 2010; 18(4): 725-35.
37. Bijlsma JW, Knahr K. Strategies for the prevention and management of osteoarthritis of the hip and knee. Best Pract Res Clin Rheumatol 2007; 21(1): 59-76.
38. Towheed TE, Maxwell L, Anastassiades TP, et al. Glucosamine therapy for treating osteoarthritis. Cochrane Database Syst Rev 2005(2): CD002946.
39. Bruyere O, Reginster JY. Glucosamine and chondroitin sulfate as therapeutic agents for knee and hip osteoarthritis. Drugs Aging 2007; 24(7): 573-80.
40. Altman R, Asch E, Bloch D, et al. Development of Criteria for the Classification and Reporting of Osteoarthritis - Classification of Osteoarthritis of the Knee. Arthritis Rheum 1986; 29(8): 1039-49.


1
2
3
4
5
6
7
8
9
10
11
Chapter 2 Effectiveness of a tailor-made weight loss intervention in primary care
Bastiaan C. de VosJos RunhaarSita M.A Bierma-Zeinstra
Eur J Nutr. 2014 Feb;53(1):95-104.

20
aBstraCt
introduction
Weight loss interventions have been studied extensively, but methodological limita-tions negatively affecting applicability in everyday clinical practice are a very common problem in these studies. Despite the fact that obesity is treated mostly in a primary care setting, studies that investigate weight loss interventions in a primary care setting are scarce. Our objective was to assess the effectiveness of a tailor-made weight loss intervention in achieving a clinically significant weight loss in overweight (BMI ≥ 27) women aged 50 – 60 years in a primary care setting.
methods
As part of a randomized controlled trial on the effects of a tailor-made weight loss inter-vention and oral glucosamine sulfate on the incidence of osteoarthritis of the knee in 407 overweight women aged 50 – 60 years, we analyzed the effectiveness of the weight loss intervention in achieving clinically relevant weight loss.
results
At baseline, the mean body weight for all participants was 88.7 ± 13.2 kg, and the mean BMI was 32.4 ± 4.3 kg/m². At 6 months, the percentage of participants that lost 5 kg or 5% of their baseline body weight was 11.6% in the intervention group, versus 5.5% in the control group (p=0.04). At 6 months, the mean weight gain was 0.9 kg in the control group, versus -0.9 kg in the intervention group (p<0.001). At 12 months, the mean weight gain was 0.6 kg and -0.6 kg respectively (p=0.01). At 30 months of follow-up, no significant differences were found between both groups.
Conclusions
This weight loss intervention, which, at short notice, is easily applicable in everyday clinical practice, is effective in achieving clinically significant weight loss in overweight women aged 50 – 60 over a 12 month period. Magnitude of the effect is comparable to that achieved in many other, more intensive weight loss interventions.

21
1
2
3
4
5
6
7
8
9
10
11
intrODuCtiOn
Numerous studies have investigated the health benefits of weight loss in obese individu-als. 1-3 A systematic review of long-term weight loss interventions reported that, besides surgical interventions, dietary and lifestyle therapy as well as drug therapy have the potential to provide modest weight loss and may improve cardiovascular risk factors.4 However, drop-out rates were as high as 31-64% and only two of the 44 eligible studies presented intention to treat results.1 5 The other 42 studies based their conclusions on per protocol results, which lead to overestimation of the effects and hence, makes the results less applicable in everyday clinical practice.4 Besides, because of high drop-out rates, all other studies based their outcomes only on ‘study-completers’, or used methods such as ‘last observation carried forward’ or ‘baseline observation carried forward’ meth-ods. This may overestimate the total weight loss because study completers may have lost more weight than participants who quit the intervention earlier.4 Because of these limitations, these studies have shown that particular interventions, when completed, have the potential to result in clinical relevant weight loss, but have failed to investigate whether an intervention would be applicable in everyday clinical practice.4
In the past year, there have been some trials published reporting on weight loss interventions in a primary care setting. A weight loss intervention study by Wadden et al.6, for example, included counselling with pharmacotherapy, while the study by Appel et al.7 tested an intervention which was delivered by care providers other than primary care providers. The latter solely played a supporting role.
The majority of weight loss trials conducted in the last few decades used a pre-defined scheme of dieting, exercise or psychological treatment to apply to all participants, re-gardless of their age, sex, baseline body mass index (BMI), etc.8 However, a systematic review reported that the most effective way to promote weight loss in large groups of overweight and obese individuals is to offer a ‘tailor-made’ intervention with diet and exercise. This could reduce the high drop-out rates.9
Motivational Interviewing, a method of consulting patients based on Self Determi-nation Theory, claims to be effective especially in promoting long-term weight loss maintenance.10 A systematic review clearly stated motivational interviewing as being superior in lowering BMI compared to traditional methods of consulting.11
The purpose of the present study was to analyze whether a tailor-made weight loss intervention with diet and exercise, based on motivational interviewing, would be effec-tive in achieving 5 kg or 5% of baseline body weight in a group of overweight women in a primary care setting. Several studies found this amount of weight loss to be associated with health benefits, including improvement of cardiovascular risk factors and reduced risk of incident diabetes and hypertension.1-3 Douketis et al. reported that this amount of weight loss improves lipid levels and glycemic and blood pressure control, especially

22
in people with cardiovascular risk factors.4 Our expectation was that by offering a tailor-made intervention, instead of dictating the participants on the quantity and quality of their diet and exercises, our drop-out rates would be much lower than in comparable studies.
methODs
PrOOF study
The intervention we studied was part of a randomized controlled trial that investigated the preventive effect of a weight reduction program and oral glucosamine sulfate versus placebo on the development of knee osteoarthritis, in a 2x2 factorial design in over-weight women, called the PROOF Study (ISRCTN 42823086).12 This trial was approved by the local Medical Ethical Committee of Erasmus University Rotterdam and all par-ticipants provided written informed consent. The PROOF Study was open labelled for the tailor-made intervention to reduce weight, and double blinded for the intervention with crystalline glucosamine sulfate. For the present study, all data was derived from the complete dataset of the PROOF Study. Only the data concerning the tailor-made intervention to reduce body weight was used.
recruitment
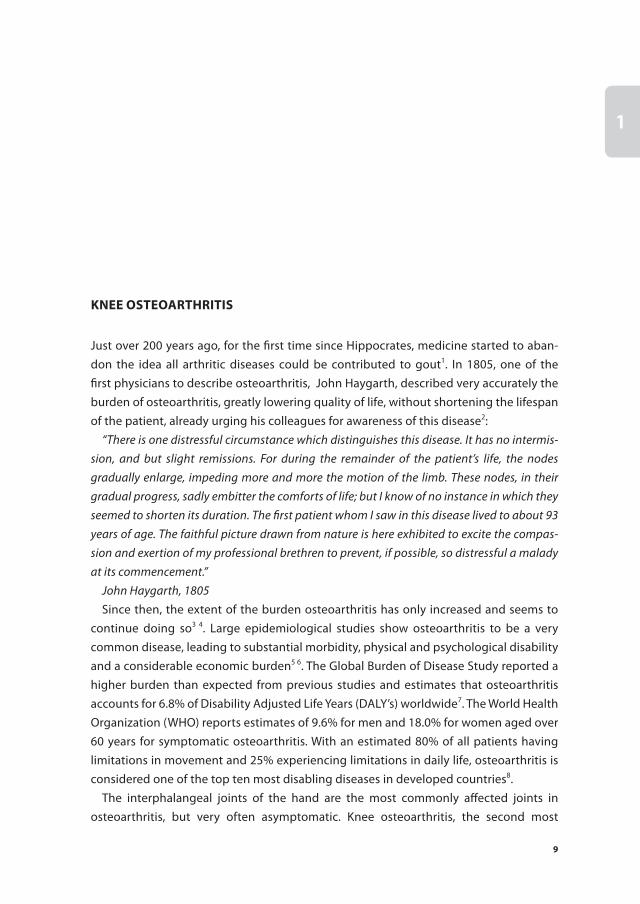
A detailed description of the recruitment and measurements of the PROOF study can be found elsewhere12. In short, 50 general practitioners recruited participants, by sending an information letter to all women between 50 and 60 years registered at their practice. All interested women with a self-reported BMI ≥ 27 received additional information by mail. Subsequently these women were checked for inclusion criteria by phone. Inclusion criteria were: female gender, age 50 to 60 years, overweight (BMI ≥ 27 ), free of knee osteoarthritis according to the ACR criteria13, free of contraindications to MRI, free of rheumatic diseases, and not using oral glucosamine during the past six months. There-after all eligible women were invited to the research center for physical examination and X-rays as well as MRI scans of both knees. Exclusion criteria were: already consulted a physician, a physical therapist or an alternative health provider for knee pain possibly indicating osteoarthritis of the knee, presence of radiologic signs indicating knee osteo-arthritis (Kellgren-Lawrence index of 2 or more), not being able to communicate in the Dutch language, presence of severely disabling co-morbidity. Figure 1 shows the study selection process.
23
1
2
3
4
5
6
7
8
9
10
11
intervention
The PROOF Study conducted a weight loss intervention and an intervention with glucosamine versus placebo. Since our study is only concerned with the weight loss intervention, the intervention with glucosamine versus placebo will not be described in detail here. The relevant intervention consists of an individual tailor-made intervention to reduce weight, which has been constructed in cooperation with the Dutch Society of Dieticians. As said, literature suggests the focus of any weight loss intervention should be on changing food patterns and habits in physical activity. The Health Council of the Netherlands also emphasizes the importance of these components.14
To make the intervention easily applicable in everyday clinical practice, all participants were given the opportunity to visit a dietician and a physical therapist nearby their home address. All dieticians were trained in Motivational Interviewing.11 At baseline, the participant discussed nutritional habits and physical activity patterns with a dietician. Based on the goal setting theory of Strecher15 and the specific implement technique16, they agreed on the intentions. Subsequently, the dietician composed the individual tailor-made strategy to accomplish these goals. Primarily, a tailor-made advice was given for a low fat or a low calorie diet, or both, as well as for physical activity. During the first month the participant had an appointment with the dietician once in every two weeks; during the consecutive period the frequency of appointments was determined in dia-logue by the dietician and the participant. These appointments were used to evaluate
50 general practitioners contacted all women between 50 and 60 years registered at their practice (6691 women)
3094 women (46%) returned the reply-card to the research institute
1358 women (44%) were not interested
1736 women (56%) were interested
847 women (49%) were excluded (reported BMI
was below 27 kg/m2
889 women (51%) with BMI ≥ 27 kg/m² were send
additional information
After screening on all in- and exclusion criteria by phone, 407 women (46%) were eligible and were invited for baseline
measurements
Figure 1 Study selection process

24
the plan, and if indicated, to adjust the plan. The total duration of these sessions was limited to a total of four hours per year. No limit was set on the total period during which they were under treatment.
Besides, the participants in the intervention group were given the opportunity to participate in physical activity classes. In these classes (groups of 12-16 persons) they tried a broad range of different low-intensive sport activities under the supervision of a physical therapist, such as Nordic walking, volleyball, bowling, salsa dancing, tai chi, softball, belly dance, modern dance. The aim of these lessons was to regain pleasure in physical activity and to find an activity which they could maintain for themselves for long-term continuation. Twenty group activities, one lesson of one hour weekly, were spread over a period of half a year. Because participants in every group were recruited per general practice and lived in the same neighborhood, continuation of activities together was stimulated in case they were interested. Both the dietician appointments and the physical activity lessons were free of cost to the participants in the intervention group.
The participants in the control group did not receive this active (i.e. initiated by the research group) intervention to reduce body weight, but were free to undertake any actions to lose weight at their own initiative.
Physical examination
At baseline and after two and a half years of follow-up, physical examination was per-formed at the research center to measure body weight, body height, blood pressure, abdominal circumference and skin folds. Fat percentage was calculated using the fol-lowing formula: body fat percentage = (0.730 * BMI) + (0.548 * triceps skin fold) + (0.270 * age) – 5.9. According to Lean et al., this is the most reliable method of assessing body fat percentage based on simple anthropometric measurements in women.17 Skin folds were measured using The Harpenden Skinfold Caliper HSK-BI. BMI was calculated as height in meters divided by the body weight in kilograms squared. Additionally, serum samples were taken to measure serum HbA1C and total cholesterol.
Questionnaire
At baseline, the participants filled out a questionnaire to record characteristics such as smoking status, educational level, co morbidity, menopausal status, quality of life, social participation, physical activity level and nutritional habits. Every sixth month the participant was visited by the research assistant to fill out a shorter questionnaire to determine compliance to the interventions, physical activity level, nutritional habits, co-interventions, medical consumption and quality of life. In addition, body weight was measured during these visits.

25
1
2
3
4
5
6
7
8
9
10
11
Quality of life was measured using the EQ-5D Euroqol questionnaire, which has been thoroughly validated.18 Physical activity level was measured using the validated SQUASH questionnaire.19 20 Intensity scores of Ainsworth were used to calculate the activity score of the participants.21-23 To calculate the total activity score, each physical activity in Ain-sworth’s compendium received an intensity score ranging from 1 to 9.19 These intensity scores were based on the Metabolic Equivalent Tasks (MET’s), which are the ratios of a person’s metabolic rate while performing the activity and their metabolic rate while seated and resting.21 22 Total activity scores were calculated by multiplying total minutes of activity per week and the intensity score. The sum of all activity scores formed the total score.20 Nutritional habits were assessed with a validated questionnaire24, which we adjusted to meet our study requirements.
assessment of compliance to the intervention
Dieticians kept record of participant’s body weight and gave them two scores each visit; one to indicate to what extent they had reached their set goals concerning physical activity, the other to indicate to what extent they had reached their set goals concerning nutritional habits.
Physical therapists solely recorded presence of participants during the physical activ-ity classes.
statistical analyses
Analysis was performed using SPSS PASW statistics version 17.0 (SPSS Inc., Chicago, IL). Baseline characteristics were presented using descriptive statistics as mean ± standard deviation (SD). Body weight data was presented as mean ± standard error of the mean. The primary objective was to assess the number of participants that lost ≥5 kg or 5% of their baseline body weight. Secondary objectives were to evaluate differences between the intervention and the control group in fat percentage, BMI, quality of life, physical activity level and nutritional habits. All results presented are intention-to-treat results.
The relationship between assignment to the intervention group and chance of suc-cess, which was defined as losing 5 kg or 5% of baseline body weight, was calculated using Generalized Estimating Equations (GEE), taking into account the correlation of re-peated measurements within one participant. This analysis is the most reliable, because it does not require imputation and, moreover, it does not take only the completers into account, but all measurements of the complete dataset. Furthermore, this analysis is widely recommended in literature 25 26. All covariates, which included physical activity level, nutritional habits and quality of life, were tested for being mediators of the inter-vention effect using Sobel’s test.27 28 Also, following the recommendations by Kraemer et al.29, all baseline characteristics were tested for being moderators of the intervention effect, using the GEE analysis.

26
Group differences at set times were analyzed using 2-tailed independent t-tests for scale variables, and 2-tailed chi-squared tests for categorical variables. For categorical variables, significance was calculated with Fisher’s exact test. For each outcome multiple linear or binary logistic regression models were conducted to identify what the inter-vention effect on each outcome was. Also, logistic regression was used to determine which variables were correlated with the primary outcome (≥5 kg or 5% of baseline body weight reduction). In all analyses, a 5% significance level for testing was used.
Since data were derived from a RCT on the preventive effects of a diet and exercise program on the development of knee osteoarthritis, the corresponding power calcula-tion was done on incidence figures, rather than on weight loss. In retrospect, we calcu-lated a power of more than 80% to detect a significant difference between both groups in losing ≥5 kg or % of their baseline body weight.
results
Participants
Of the 6691 women who were contacted by their general practitioners, 3094 women (46%) returned the reply-card to the research institute, of which 1736 women (56% of the repliers) were interested in participating. 847 women (49% of interested women) were excluded because calculated BMI, based on reported body weight and height, was below 27.0. 889 women (51% of interested women) with BMI of 27.0 or higher were sent additional study information. After screening on all inclusion criteria by phone, 407 women (46%) were eligible and were invited for baseline measurements and random-ized to either the intervention or the control group. Of these participants, 70% were postmenopausal at baseline, 93% were of European or North-American origin. Mean age was 55.7 (SD=3.2) and mean baseline BMI was 32.36 (SD=4.29). table 1 shows all baseline characteristics. There were no significant differences between the intervention group and the control group.

27
1
2
3
4
5
6
7
8
9
10
11Participation rates
Since no pre-defined scheme of dieting or exercising was presented, but instead par-ticipants decided together with the dietician on their diet, exercise pattern and goals, the participation rates vary widely. Of the 203 participants randomized to the interven-tion, 181(89.2%) went at least once to the dietician. 50.8% of the participants had 6 appointments or more. The mean period between the first and the last visit was 36.3
table 1 Baseline characteristics1
Control group Intervention group
Age, years 55.7 ± 3.2 55.7 ± 3.2
Body weight, kg 89.2 ± 13.6 88.2 ± 12.9
Body Mass Index, kg/m² 32.5 ± 4.5 32.2 ± 4.1
Fat %2 44 ± 5.5 44 ± 5.1
Abdominal circumference, cm 106 ± 10 105 ± 9
Approximate body weight 1 year ago, kg 87 ± 15 86 ± 15
Approximate body weight around 40th year, kg 76 ± 12 74 ± 14
Smoking status Non smoker 77% 87%
Smoker 23% 13%
Education level Low 35% 32%
Mid-low 45% 51%
Mid-high 17% 16%
High 3% 2%
Co morbidity3 34% 35%
Menopausal status4 Premenopausal 29% 31%
Quality of Life (Dutch Euroqol EQ-5D) .89 ± .13 .89 ± .13
Range: 0-1 16
Social participation5 9.00 ± 2.18 9.10 ± 2.06
Ethnicity European/North American 92.6% 94.2%
South American 1.1% 1.2%
African .6% .6%
Asian 1.1% 1.8%
Other 4.5% 2.3%
SQUASH score17 7094 ± 3817 6525 ± 3608
Blood HbA1C, % 5.8 ± .7 5.8 ± .8
Blood total cholesterol, mmol/L 6.1 ± 1.2 6.0 ± 1.1
[1] All variables except age, weight, BMI, fat percentage, abdominal circumference, blood glucose and cho-lesterol were self-reported.2 Fat percentage calculated with formula by Lean et al. 15
3 Co morbidity defined as ≥1 condition currently under treatment.4 Postmenopausal defined as ≥ 1 year since last menstruation.5 Social participation defined as hours per week spent on paid/voluntary/household work or studying.

28
weeks (SD=31.4). 50.8% of the participant was less than half a year under treatment by a dietician, and 22.0% was under treatment for more than a year. Mean weight loss from first to last consult recorded by the dieticians was 1.89 kg (SD=3.93). Of these 203 participants, 79% attended at least one physical activity lesson. 57% of the participants attended 7 classes or more. Mean attended lessons were 8 (SD 6).
weight loss
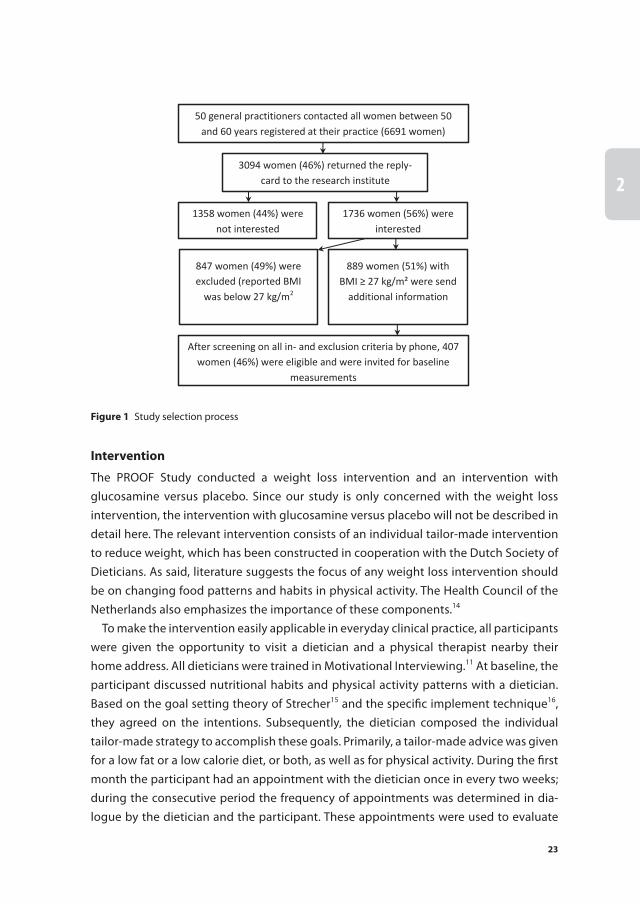
After randomization, body weight was recorded at 6 months for 371 participants (91.1%), at 12 months for 368 participants (90.4%) and at 30 months for 361 participants (88.7%). At 6 months, mean change (± standard error (SE)) from baseline in body weight was 0.9 ± 0.3 kg in the control group, and -0.9 ± 0.3 kg in the intervention group (p<0.001). At 12 months, the mean body weight change was 0.6 ± 0.4 in the control group, and -0.6 ± 0.4 in the intervention group (p=0.014). At 18, 24 and at 30 months, there were no significant differences between both groups. Figure 2 shows all weight change data.
Primary objective
table 2 shows the percentages of participants who lost body weight or retained their baseline body weight, and the percentages of participants who lost ≥5 kg or ≥ 5% of their baseline body weight. At 6 months, significantly more people in the intervention group lost weight or retained their baseline body weight (58.2% vs. 37.4%, p<0.001) and there was a higher percentage of people in the intervention group who lost ≥5 kg or ≥ 5% of their baseline body weight (11.6% vs. 5.5%, p=0.042). At 12 months, only the
-2
-1
0
1
2
3
0 months 6 months 12 months 18 months 24 months 30 monthsWei
ght c
hang
e (k
g)
Months since randomization
Intervention group Control group
Figure 2 Mean body weight change in kilograms (95% CI) compared to baseline body weight according to randomized group.

29
1
2
3
4
5
6
7
8
9
10
11
percentage of participants who lost weight or retained their baseline body weight was significantly higher in the intervention group (51.9% vs. 39.2%, p=0.016). No significant difference was seen in the percentage of participants who lost ≥5 kg or ≥ 5% of their baseline body weight. At 18, 24 and at 30 months, there were no significant differences for both outcomes. The overall intervention effect on the primary outcome of losing ≥5 kg or ≥ 5% of baseline body weight, taking into account all measurements, was not significant (OR 1.12, 95% CI 0.70-1.80).
secondary objectives
Secondary objectives were to evaluate differences between the intervention and the control group in fat percentage, BMI, quality of life, physical activity level, the percent-age of participants who measure up to the Dutch Physical Activity Guideline30 and nutritional habits.
In the overall study population, fat percentage declined from 43.5% to 42.6% respec-tively (p<0.001) from baseline to 2.5 years of follow-up. There was no significant differ-ence between both groups in decline in fat percentage. For BMI, the same pattern is found as in body weight change; at 6 months, BMI change in the intervention group was -0.3 against 0.3 in the control group (p<0.001) and at 12 months, BMI change was -0.2 against 0.3, respectively (p=0.007). With binary regression analysis, we have identified baseline BMI to be a positive predictor of the chance of losing 5 kg or 5% of baseline body weight (OR 1.08; 95% CI 1.02 – 1.15), although no interaction of this effect and the intervention effect was found. There were no significant differences between both groups in quality of life at any of the time points. At 6 months the change in physical ac-
table 2 Primary objective achievement among randomized groups
Criterion All Intervention group Control group Exact Sig. (2-tailed)
Criterion Intervention vs. control group
No. of participants (%)
≤ baseline body weight
6 months 178/371 (48) 110/189 (58) 68/182 (37) <0.001
1 year 168/368 (46) 97/187 (52) 71/181 (39) 0.02
2.5 year 169/361 (47) 95/184 (52) 74/177 (42) 0.07
Lost ≥5 kg or ≥5% of baseline body weight
6 months 40/371 (10.8) 28/189 (14.8) 12/182 (6.3) 0.012
1 year 55/368 (14.9) 35/187 (18.7) 20/181 (11.0) 0.027
2.5 year 63/361 (17.5) 27/184 (14.7) 36/177(20.3) 0.10
Figures presented as number of participants who comply to criterion/total participants at that time (per-centage of total). Exact significance calculated with Chi-squared tests and Fisher’s exact test.
30
tivity compared to baseline, measured with the SQUASH questionnaire, was significantly higher in the intervention group. Change of score was 117.3 (1.8% of baseline score) in the intervention group against -682.7 (9.6% of baseline score) in the control group (p=0.03). The percentage of participants who complied with the Dutch Physical Activity Guideline, was higher at 6 months in the intervention group (58.5% against 46.1% in the control group, p=0.019); not at 12 and 30 months. Regarding nutritional habits, the amount of snacks consumed at 6 months was significantly lower in the intervention group. Participants in the intervention group consumed on average 7.0 snacks per week, against 8.1 in the control group (p=0.034). The other secondary objective measurements at other measurement times in the follow-up showed no significant differences between both groups. Change in serum HbA1C and total cholesterol also showed no significant difference between both groups. No significant differences were found at 2.5 years of follow-up. table 3 summarizes the results of primary and secondary objectives.
None of the covariates were identified as being mediators of the intervention effect. In addition, the GEE analysis showed that none of the baseline characteristics were identi-fied as being moderators of the intervention effect on weight loss. Also, it was found that after controlling for various covariates, the odds of losing 5 kg or 5% of baseline weight was not affected by any of the covariates, such as age, smoking status, educational level or ethnicity.
table 3 Differences between both groups at set times for primary and secondary outcome measures
6 months 12 months 2.5 years
Percentage of participants who lost ≥5 kg or ≥5% of baseline body weight
8.5%* 7.7% -5.6%
Body weight change compared to baseline body weight, kg -1.8*** -1.3* -0.5
Change in fat percentage n.m. n.m. 0.2
Change in body mass index, kg/m² -0.1*** -0.2** -0.4
Change in quality of life, Dutch Euroqol EQ-5D n.m. n.m. 0.2%
Change in physical activity, SQUASH-score17 800* 600 392
Percentage of participants that comply to Dutch Guideline28
12%* -2% -0.3%
Snacks eaten per week, no. -1.1* -0.5 -0.2
Figures represent the difference between the intervention group and the control group. Differences which were not significantly different from 0 are not shown. *P<0.05. **P<0.01. ***P<0.001. n.m. not measured

31
1
2
3
4
5
6
7
8
9
10
11
DisCussiOn
In this effectiveness study, a tailor-made intervention to reduce body weight was proven to be effective in short term. After 6 months, the percentage of participants who lost 5 kg or 5% or more of their baseline body weight was twice as large in the intervention group compared to the control group. This amount of weight loss has been associated with improvement in cardiovascular risk factors by numerous studies.1-4 In addition, mean weight loss, reduction in BMI, increase in physical activity and reduction in snacks consumed per week was significantly greater in the intervention group at 6 months. At 12 months, the difference between both groups in the primary objective slightly declined. Still, the weight loss and reduction in BMI were significantly greater in the intervention group at this point. The intervention proved to have no long-term effect; after 2.5 years of follow-up, no significant differences between both groups were found.
In contrast to other weight loss intervention studies, we did not dictate the partici-pants how and to what extent they should exercise and diet. Instead, we offered them the possibility of attending physical activity lessons and dietician appointments, in or-der to reach, in dialogue, an individual tailor-made scheme.4 This approach was chosen to minimize the drop-out rates, in order to obtain results which are more applicable to everyday clinical practice than results from many other weight loss intervention studies.4 Our drop-out rates of 9.4% at one year of follow-up and 11.1% at 2.5 years of follow-up were considerably lower than the mean drop-out rates of many comparable intervention studies.4 It is a very pragmatic approach, much more accessible and easier to prescribe to large groups than most weight loss interventions with stricter diet and exercise schemes.4 Moreover, this approach was recommended in literature as being superior to more traditional methods.9 The inevitable consequence of this method is that the duration of the intervention itself, the dietician appointments and physical activity lessons, is subject to great variation. In our study, we have seen that only 22% of the participants were under treatment by a dietician for more than a year. Furthermore, 51% of the participants quit seeing a dietician within half a year from baseline. Results in primary and secondary objectives reflected this pattern; the largest intervention effect is seen at 6 months of follow-up, at 12 months of follow-up there is still a small interven-tion effect observable, but after this intervention effects are levelled out. Weight loss only seems to occur during the intervention, despite the fact this intervention was designed to promote long-term weight loss maintenance.
One of the reasons that may have caused underestimation of the intervention effect is the fact that in our control group also a substantial amount of weight loss has occurred. This could have been caused by the recruiting process. Since the participants were re-cruited for participation in the PROOF Study, the participants who were randomized to the control group had already received information regarding the increased risk of knee

32
arthritis, due to their overweight. This information could have motivated a substantial proportion of the people randomized to the control group to lose weight at their own initiative. Another explanation as to why weight loss maintenance has occurred in such small rates is the limitation imposed on dieting by insurance companies. Just four hours per year was reimbursed. Participants who wished to visit the dietician for more than four hours in one year, had to pay for this themselves. Also, in this intervention the par-ticipants were offered a maximum of 20 physical activity lessons, assuming this would be enough to stimulate the participants to continue physical activities themselves after seizure of the lessons. A final factor that could have contributed to an underestimation of the intervention effect is the mean baseline body weight and BMI of our participants. We have identified baseline BMI to be a positive predictor of the chance of losing 5 kg or 5% of baseline body weight. The higher the baseline BMI is, the higher the chance of suc-cess is, an effect also found in many other studies.31 In comparison to other weight loss studies, the baseline BMI and baseline body weight of our participants is relatively low.4
Very few trials were designed to test the effectiveness of weight loss interventions, rather than the efficacy.4 The facilities used in the present trial are already available in everyday clinical practice. Besides, few trials were conducted in a primary care setting.32 Moreover, most studies dictated a very restrictive diet and exercise scheme, whereas our study let the participants decide on their scheme themselves.4 Nevertheless, the amount of weight loss occurred in the first year of follow-up in our pragmatic weight reduction intervention was similar to the amount of weight loss achieved in many efficacy studies.4
This trial has several limitations. Firstly, the participants got the opportunity to attend only 20 exercise lessons for free. Secondly, due to the inclusion criteria of the PROOF study, the results are only applicable to women aged 50-60, without knee complaints. Thirdly, the well-established relationship between weight loss and improvement of car-diovascular risk factors was not confirmed in our study. Literature suggests a follow-up time of at least four years to examine any effect on these factors.4 Therefore effects might be found, when prolonging follow-up. The fact that both the dietician appointments and the physical activity lessons were free of cost to the participants in the intervention group could have caused an overestimation of the intervention effect. However, during the trial, insurance covered the costs for the dietician appointments, also for the partici-pants in the control group, in case they decided to visit a dietician on their own initiative.
Since the objective of this study was not to show superiority of our intervention to traditional pre-defined interventions, but to assess the effectiveness of the intervention in itself, we did not compare our tailor-made weight loss intervention to a traditional pre-defined intervention. Therefore, from this study, it cannot be determined whether this intervention is more effective in achieving clinically significant weight loss than a traditional intervention. Several strengths of this trial are the low drop-out rates, the design which makes this intervention easily applicable in everyday clinical practice, the
33
1
2
3
4
5
6
7
8
9
10
11
intention-to-treat data, which make a much more valid estimate of the intervention effect in everyday clinical practice than per protocol analyses and, finally, our design including motivational interviewing as a basis for promoting adherence, as has been recommended.9 31
In conclusion, despite the fact that the diet and exercise schemes in our study are less restrictive than in most weight loss interventions, our tailor-made intervention to reduce body weight is effective to induce clinically significant weight loss in one year in an amount which is comparable to that achieved in most other weight loss trials.4 This effect is not overestimated, since our drop-out rates were relatively low, and we conducted an intention-to-treat analysis. Since the facilities for this intervention are already accessible and it is easy to prescribe to large groups, this intervention could be a realistic option to implement in primary care. In future research, long-term weight loss maintenance, which has occurred marginally in our study, might be achieved by prolonging the intervention or follow-up time, offering more physical activity lessons and dieting consults, and by designing a more representative control group. Also, the use of electronically delivered interventions, such as internet and telephone counselling could help to increase participation rates.33 Additional studies are needed to provide general practitioners with an effective tool to achieve especially long-term weight loss maintenance in overweight women.

34
reFerenCes
1. Knowler WC, Barrett-Connor E, Fowler SE, et al. Reduction in the incidence of type 2 diabetes with lifestyle intervention or metformin. N Engl J Med 2002; 346(6): 393-403.
2. Neter JE, Stam BE, Kok FJ, et al. Influence of weight reduction on blood pressure: a meta-analysis of randomized controlled trials. Hypertension 2003; 42(5): 878-84.
3. Wing RR. Long-term effects of a lifestyle intervention on weight and cardiovascular risk factors in individuals with type 2 diabetes mellitus: four-year results of the Look AHEAD trial. Arch Intern Med 2010; 170(17): 1566-75.
4. Douketis JD, Macie C, Thabane L, et al. Systematic review of long-term weight loss studies in obese adults: clinical significance and applicability to clinical practice. Int J Obes (Lond) 2005; 29(10): 1153-67.
5. Torgerson JS, Lissner L, Lindroos AK, et al. VLCD plus dietary and behavioural support versus sup-port alone in the treatment of severe obesity. A randomised two-year clinical trial. Int J Obes Relat Metab Disord 1997; 21(11): 987-94.
6. Wadden TA, Volger S, Sarwer DB, et al. A two-year randomized trial of obesity treatment in primary care practice. N Engl J Med 2011; 365(21): 1969-79.
7. Appel LJ, Clark JM, Yeh HC, et al. Comparative effectiveness of weight-loss interventions in clinical practice. N Engl J Med 2011; 365(21): 1959-68.
8. Franz MJ, VanWormer JJ, Crain AL, et al. Weight-loss outcomes: a systematic review and meta-analysis of weight-loss clinical trials with a minimum 1-year follow-up. J Am Diet Assoc 2007; 107(10): 1755-67.
9. Miller WC. Effective diet and exercise treatments for overweight and recommendations for inter-vention. Sports Med 2001; 31(10): 717-24.
10. Teixeira PJ, Silva MN, Coutinho SR, et al. Mediators of weight loss and weight loss maintenance in middle-aged women. Obesity (Silver Spring) 2010; 18(4): 725-35.
11. Rubak S, Sandbaek A, Lauritzen T, et al. Motivational interviewing: a systematic review and meta-analysis. Br J Gen Pract 2005; 55(513): 305-12.
12. Runhaar JvM, M. Steens, R. Vroegindeweij, D. van Osch, G. Reijman, M. Koes, B. Bierma-Zeinstra S. Prevention of knee osteoarthritis in overweight females; from feasibility trial to full-scale trial. Osteoarthritis and Cartilage 2008; 16(Supplement 4): S141.
13. Altman R, Asch E, Bloch D, et al. Development of criteria for the classification and reporting of osteoarthritis. Classification of osteoarthritis of the knee. Diagnostic and Therapeutic Criteria Committee of the American Rheumatism Association. Arthritis Rheum 1986; 29(8): 1039-49.
14. Gezondheidsraad. Overgewicht en obesitas. Den Haag: Gezondheidsraad; publicatie nr 2003/07 2003.
15. Strecher VJ, Seijts GH, Kok GJ, et al. Goal setting as a strategy for health behavior change. Health Educ Q 1995; 22(2): 190-200.
16. Gollwitzer PM. Implementation intentions - Strong effects of simple plans. Am Psychol 1999; 54(7): 493-503.
17. Lean ME, Han TS, Deurenberg P. Predicting body composition by densitometry from simple anthropometric measurements. Am J Clin Nutr 1996; 63(1): 4-14.
18. Group E. EQ-5D Value Sets: Inventory, Comparative Review and User Guide. 2007(Dordrecht: Springer).
19. Wendel-Vos GC, Schuit AJ, Saris WH, et al. Reproducibility and relative validity of the short ques-tionnaire to assess health-enhancing physical activity. J Clin Epidemiol 2003; 56(12): 1163-9.

35
1
2
3
4
5
6
7
8
9
10
11
20. Ellen L. de Hollander LZ, Sanne I. de Vries, Wanda Wendel-Vos. The SQUASH was a more valid tool than the OBiN for categorizing adults according to the Dutch physical activity and the combined guideline. Journal of Clinical Epidemiology 2011.
21. Ainsworth BE, Haskell WL, Leon AS, et al. Compendium of physical activities: classification of energy costs of human physical activities. Med Sci Sports Exerc 1993; 25(1): 71-80.
22. Ainsworth BE, Haskell WL, Whitt MC, et al. Compendium of physical activities: an update of activ-ity codes and MET intensities. Med Sci Sports Exerc 2000; 32(9 Suppl): S498-504.
23. Figard-Fabre H, Fabre N, Leonardi A, et al. Physiological and perceptual responses to Nordic walk-ing in obese middle-aged women in comparison with the normal walk. Eur J Appl Physiol 2010; 108(6): 1141-51.
24. van Assema P, Brug J, Ronda G, et al. The relative validity of a short Dutch questionnaire as a means to categorize adults and adolescents to total and saturated fat intake. J Hum Nutr Diet 2001; 14(5): 377-90.
25. Thabane L, Chu R, Cuddy K, et al. What is the quality of reporting in weight loss intervention stud-ies? A systematic review of randomized controlled trials. Int J Obes (Lond) 2007; 31(10): 1554-9.
26. DeSouza CM, Legedza AT, Sankoh AJ. An overview of practical approaches for handling missing data in clinical trials. J Biopharm Stat 2009; 19(6): 1055-73.
27. Soper DS. Sobel Test Calculator for the Significance of Mediation (Online Software). http: //ww-wdanielsopercom/statcalc3 2012.
28. Sobel ME. Asymptotic confidence intervals for indirect effects in structural equation models. Sociological Methodology 1982; 13: 290-312.
29. Kraemer HC, Wilson GT, Fairburn CG, et al. Mediators and moderators of treatment effects in randomized clinical trials. Arch Gen Psychiatry 2002; 59(10): 877-83.
30. Kemper HCG OW, Stiggelbout M. Consensus about the Dutch Physical Activity Guideline. Tijdschr Soc Geneeskd 2000(78; 180-3.[in Dutch]).
31. Finkler E, Heymsfield SB, St-Onge MP. Rate of Weight Loss Can Be Predicted by Patient Character-istics and Intervention Strategies. J Am Diet Assoc 2011.
32. Tsai AG, Wadden TA. Treatment of obesity in primary care practice in the United States: a system-atic review. J Gen Intern Med 2009; 24(9): 1073-9.
33. Arem H, Irwin M. A review of web-based weight loss interventions in adults. Obes Rev 2011; 12(5): e236-43.


1
2
3
4
5
6
7
8
9
10
11
Chapter 3 Identifying latent classes of different weight loss trajectories in participants of a weight loss intervention trial
Bastiaan C. de VosJos RunhaarSaskia P.J. VerkleijSita M.A. Bierma-Zeinstra
J Clin Epidemiol. 2014 Aug;67(8):947-51.

38
aBstraCt
introduction
Weight loss interventions often present small mean weight changes over time, despite the fact that a substantial proportion of the participants lost more weight. This effect is often leveled out by the substantial proportion of participants who gained weight during the trial. The aim of this study is to identify and describe distinct subgroups of participants with different weight change trajectories during and after a weight loss intervention.
methods
We used data from a weight loss intervention that was part of a randomized controlled trial on the preventive effect of a tailor-made weight loss intervention and oral glucos-amine sulfate on the incidence of osteoarthritis of the knee in 407 overweight women aged 50 – 60 years. Latent class growth analysis (LCGA) was used to identify subgroups of participant with different weight change trajectories over time.
results
LCGA revealed three latent classes of participants, one large group (n=298) with very small weight changes over time close to zero, and two smaller groups (n=48), of which one represents participants who steadily gained weight over time, while the other repre-sents participants who steadily lost weight over time. Participants that had relatively low body weight around their 40th year of life, and that gained weight in the year preceding the study, were most likely to be assigned to the group that lost weight.
Conclusions
Participants with a low body weight at their 40th year of life, with a high baseline body weight, and who gained weight in the year preceding the study, were the most likely to be assigned to the subgroup that lost weight. It seems weight loss that occurred during this weight loss intervention was mostly recently gained weight.
39
1
2
3
4
5
6
7
8
9
10
11
intrODuCtiOn
Numerous studies on weight loss interventions have proved efficacy of interventions that consist of diet and exercise.1 Longitudinal trajectories of weight data within such trials often show high heterogeneity, making the results hard to interpret.
When assessing mean body weight changes, often the overall mean of the study population is relatively low1, despite the fact that a substantial proportion of partici-pants did lose weight. This is often leveled out by the proportion of participants that gained weight during the study. As a solution to this problem, studies often present the proportion of people who lost 5% of their baseline weight, an amount of weight loss which has been associated with clinically significant improvement in cardiovascular risk factors, including lipid levels, glycemic and blood pressure control and reduced risk of incident diabetes and hypertension.1-4 This way, a distinction is made between partici-pants who lost a clinically significant amount of weight, and participants who did not or even gained weight. However, there is no distinction between participants who re-mained stable or who gained weight this way, despite the fact this could have important clinical consequences. In addition, in many weight loss intervention trials participants that lost 5% of their baseline weight at the end of the follow-up period were considered to be compliant, regardless of their weight changes preceding the end of the follow-up period. This way, participants with widely varying weight changes are not distinguished from participants who steadily lost weight during the entire follow-up period.5 6
In a study aiming to identify patterns of weight loss strategies in a sample of 197 women, using latent class analysis, Lanza et al. classified participants into four subgroups based on self-reported strategies they had used.7 With this approach, variation within groups is smaller than between groups.8 This method yields more reliable results than simply choosing subgroups based on self-selected parameters, because this methods allows for testing the reliability of different models based on objective parameters.8 Literature refers to this method as a ‘person-centered’ approach, instead of a ‘variable-centered’ approach, which means the focus is on relationships among individuals, instead of how variables are related to one another.8
Identifying subgroups of participants with different longitudinal trajectories of body weight changes during weight loss interventions would be useful to identify patients who are likely to benefit the most from a particular intervention. This way, a tailor-made strategy could be offered to overweight and obese patients prone to certain trajectories. Therefore, the present study aimed to identify distinct subgroups of participants with different longitudinal trajectories of body weight changes during and after a weight re-duction intervention, using latent class growth analysis (LCGA), and to describe relations between participant’s characteristics, compliance to the intervention and subgroup assignment.

40
methODs
study design and aim
The present study used data from the PROOF Study (ISRCTN 42823086), a randomized controlled trial that investigated in a 2x2 factorial design the preventive effect of a weight reduction program and oral glucosamine sulfate versus placebo on the develop-ment of knee osteoarthritis in 407 overweight women.9 For this study, only the weight change data were used, the data regarding knee osteoarthritis were disregarded. The follow-up time was 2.5 years; participants’ body weight was recorded every 6 months. Because the aim of the present study is solely to identify distinct subgroups of a population, undergoing a weight loss intervention, and to describe them, details on the aforementioned study will not be presented here. Obviously, these are published elsewhere.9 10 To describe the different subgroups, we tested for significant differences between the subgroups in baseline characteristics, as measured in the PROOF Study. Also, we determined the intervention effect on the outcome of assignment to one of the subgroups. Finally, we tested whether baseline characteristics or certain aspects of the intervention had an effect on the outcome, assignment to one of the subgroups.
statistical analyses
To identify distinct subgroups of participants with different longitudinal trajectories, latent class growth analysis (LCGA) was used. This analysis is capable to identify ho-mogeneous subgroups in a larger heterogeneous population.8 11 As recommended in literature, several indices of how well the fit of the model was, were used: the Bayesian Information Criterion (BIC), the Vuong-Lo-Mendell-Rubin Likelihood Ratio Test (LRT) and entropy indices.8 12 Improvements of fit of the models were assessed for two to six trajectory classes. Each model was tested with linear, quadratic and cubic trajectories. In addition to the fit of the model, the usefulness of the latent classes was assessed. Especially, the shape of the trajectories of the different latent classes and the number of participants in each class were evaluated in order to identify the most optimal model.12
Characteristics of participants and body weight data in each latent class were presented as means ± standard deviation (SD). Analysis of variance was used to test whether significant differences existed between the groups. Bonferroni and Fisher’s least significant difference post hoc tests were used to reveal between which particular groups significant differences existed. The intervention effect on the probability of assignment to one of the latent classes was determined using univariate multinomial regression analysis. Multivariate multinomial regression analysis was used first to test the effect of the baseline characteristics of the participants on the primary outcome, that is, probability of assignment to one of the latent classes, and second to test the effect of characteristics of the intervention, that is, the period of time they were under

41
1
2
3
4
5
6
7
8
9
10
11
treatment by the dietician and the amount of goals they met, on the outcome. In the first regression analysis, we adjusted for the intervention effect, as determined in the univariate multinomial regression analysis mentioned previously, because the aim was to determine the effect of the baseline characteristics in itself. In addition, we tested if any of the baseline characteristics showed a significant interaction with the intervention effect, using multivariate multinomial regression analysis, to identify success factors that increased the odds to benefit from the intervention. The second analysis solely included participants that were assigned to the intervention group, because the aim here was to determine the effect of certain aspects of the intervention.
Mplus version 6.12 (sixth edition; Muthén and Muthén, Los Angeles, CA, USA) (1998-2010) was used for the LCGA. SPSS PASW statistics version 17.0 (SPSS Inc., Chicago, IL, USA) was used for description of characteristics, testing differences and multinomial regression analyses. A significance level of 0.05 was used in all analyses.
results
three group linear model
After evaluating the BIC, LRT, and entropy scores of the models, two models showed the best fit. The first model was a three-group linear model; the second one was a five-group quadratic model. The BIC value of the latter was lower (10,550.628 vs. 10,260.052), and the LRT was more significant (P = 0.09 vs. P = 0.003), which represents a better fit. In
-15
-10
-5
0
5
10
15
BL 6 months 12 months 18 months 24 months 30 months
Wei
ght c
hang
e (k
g, m
ean,
95%
CI)
Steadies
Gainers
Losers
Fig. 1. Mean weight changes during and after the weight loss intervention. Figures presented as mean body weight in kilograms and error bars present 95% confidence intervals. CI, confidence interval.

42
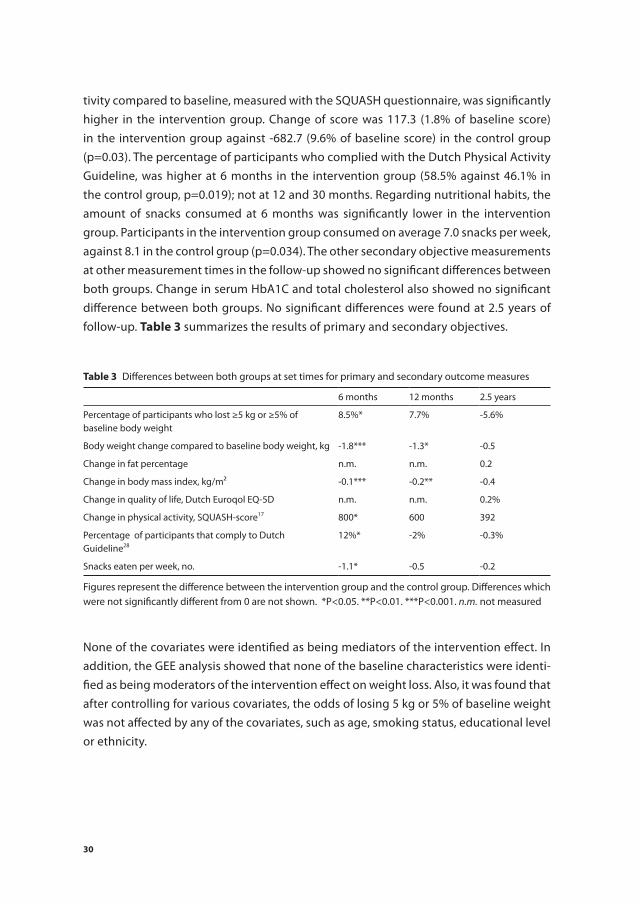
addition, entropy indices showed the five-group model to be the most reliable (0.897 vs. 0.875). However, in the five-group model, two groups consisted each of 10 participants. These two groups had very similar weight change trajectories over time. Our goal was to determine subgroups with different weight change trajectories over time. Therefore, the three-group linear model, which yielded three distinguishable groups, was chosen as the most optimal model. For all participants, the probability of belonging to their sub-group was 88% or higher, suggesting the allocation of the majority of the participants was done correctly. Figure 1 shows the mean weight change trajectories of the three subgroups.
The largest subgroup (n = 298, 73.2%) represented participants who were classified as ‘‘steadies’’ because their weight changes were minimal (0.6 ± 3.4 kg over 30 months) and the slope of this trajectory was close to zero. Participants in the second class (n = 48, 11.8%) were classified as ‘‘gainers’’ because their weight changes were mostly positive (7.2 = 4.1 kg over 30 months) and the slope of this trajectory was positive. Participants in the third class (n = 48, 11.8%) were classified as ‘‘losers’’ because their weight changes were mostly negative (-7.7 ± 6.3 kg over 30 months) and the slope of this trajectory was negative. The three groups were significantly different from each other, regarding weight change data on 6, 12, 18, 24, and 30 months, on a significance level of P < 0.001.
The intervention effect is estimated by the odds ratio (OR) of 0.4 (95% CI: 0.2, 0.7) for becoming a ‘‘gainer’’ over a ‘‘steady’’. This OR represents that participants in the interven-tion group, compared with participants in the control group, were less likely to become a ‘‘gainer’’ than to become a ‘‘steady’’. The OR for becoming a ‘‘loser’’ against becoming a ‘‘steady’’ was 1.2 (95% CI: 0.7, 2.3) for the intervention group compared with the control group. These results are not shown in tables.
Baseline characteristics
The first multivariate multinomial regression analysis (table 1) showed that participants with a high baseline body weight were significantly more likely to become a ‘‘loser’’ than to become a ‘‘steady’’. In addition, there is a trend (P 5 0.07) that participants who gained more weight in the year preceding baseline measurements, are more likely to become a ‘‘loser’’ than to become a ‘‘steady’’. Also, the participants who gained more weight in the year preceding baseline measurements were significantly less likely to become a ‘‘gainer’’ than to become a ‘‘steady’’. Participants that had a high reported body weight around their 40th year of age were significantly less likely to become a ‘‘loser’’ than of becoming a ‘‘steady’’. There were no significant differences found between the three groups in the remaining baseline characteristics, such as age, ethnicity, and educational level. Therefore, we did not adjust for these characteristics. No interactions of any of the baseline characteristics and the intervention effect were found.

43
1
2
3
4
5
6
7
8
9
10
11
intervention characteristics
The second multivariate multinomial regression showed that participants who were under treatment by a dietician for a longer period of time were significantly more likely to become a ‘‘loser’’ than to become a ‘‘steady’’. In addition, participants who met more of their goals set by their dietician were significantly more likely to become a ‘‘loser’’ than to become a ‘‘steady’’. table 2 shows the ORs acquired with this analysis.
DisCussiOn
In this study we classified 407 overweight women who entered a weight reduction trial into three different subgroups based on their weight changes during and after the weight reduction intervention, using an objective method of classifying participants into a number of groups. LCGA revealed three distinct subgroups of individuals. We found that most participants remained relatively stable over time, and there were two smaller groups of which one represented participants who steadily gained weight over time, while the other represented participants who steadily lost weight over time. Addition-ally, we found a significant intervention effect lowering the odds of becoming “a gainer”, when assigned to the intervention group. When controlling for the intervention effect, participants with higher baseline weight and with a lower body weight around their 40th year of age were more likely to become “a loser” than to become “a steady”. In addition, there is a trend (p=0.07) that participants who gained more weight in the year preceding
table 1 Odds ratios from multinomial regression analysis for effects of baseline characteristics on latent class membership, “steadies” was used as reference class. Adjustment for the intervention effect was ap-plied.
Losers Gainers
Or 95 % Ci Or 95 % Ci
Baseline weight, kg 1.06 1.02-1.09 1.00 0.96-1.04
Weight change in year preceding baseline, kg 1.06 1.00-1.13 0.90 0.85-0.95
Reported body weight around 40th year, kg 0.96 0.92-1.00 1.00 0.96-1.04
table 2 Odds ratios from multinomial regression analysis for effects of intervention characteristics on la-tent class membership, “steadies” is used as reference class.
Losers Gainers
Or 95 % Ci Or 95 % Ci
Period under treatment, months 1.06 1.01-1.12 0.90 0.79-1.04
Percentage of achieved goals in dietician’s treatment, scale 0-100%
1.02 1.01-1.04 0.99 0.97-1.01

44
baseline measurements, are more likely to become “a loser” than to become “a steady”. These participants, who gained weight in the year preceding baseline measurements, were less likely to become “a gainer” than to become “a steady”. Most ORs are very close to 1.0. This is a consequence of the independent variables in the model, being linear. This means the OR of, for instance, baseline weight in Table 2 represents the change in odds of a 1-kg increase in baseline weight.
In short, the participants who had low body weight around their 40th year of age, who gained weight in the year preceding baseline measurements, and who had a high baseline weight were most likely to become “losers”. It therefore seems to be that the weight loss recorded during the trial mostly is recently gained weight. In future research, the developments of body weight changes in the years preceding the study should be better assessed, to correctly understand the interaction between these developments and the intervention effect, instead of simply asking participants whether they are cur-rently on a diet or not, which is customary in weight loss trials.6
To our knowledge, this is the first study to apply latent class analysis to weight data from a weight loss intervention trial. One previous study investigated latent classes of weight loss strategies among women, but based their subgroups on strategies the participants used.7 We based our subgroups on the actual weight changes in reaction to the intervention, to identify subgroups of patients who are likely to benefit from an intervention such as described in this study. When a general practitioner would have a guideline of which intervention is likely to be effective in which subgroups of patients, a tailor-made advice could be given to each patient after assessing a number of characteristics. In this study, we solely found predictors of success, independent of the intervention effect. No interactions of predictors and the intervention effect were found.
This study solely evaluates the effect of a weight loss intervention on weight changes. In addition, subgroups of people that change their nutritional habits or that change their physical activity patterns would be useful too, because either one of these can be a specific goal. Therefore, in addition to the analysis done in the present study, LCGA should be used to recognize patterns in change in nutritional habits or physical activity as well.
In conclusion, LCGA is a useful approach to assess weight loss data in weight loss inter-vention trials, because it makes it possible to identify patients who are likely to benefit from a particular intervention. In this study, we identified three distinct subgroups of participants with different weight change trajectories during and after a weight loss intervention. Using this model, we found out that a certain amount of the weight loss that occurred during this weight loss intervention was in fact recently put on weight. Success factors that increased the probability to benefit from the intervention were not found, but predictors of success, independent of the intervention effect, were identified. More studies are needed to externally validate these findings.

45
1
2
3
4
5
6
7
8
9
10
11
reFerenCes
1. Douketis JD, Macie C, Thabane L, et al. Systematic review of long-term weight loss studies in obese adults: clinical significance and applicability to clinical practice. Int J Obes (Lond) 2005; 29(10): 1153-67.
2. Knowler WC, Barrett-Connor E, Fowler SE, et al. Reduction in the incidence of type 2 diabetes with lifestyle intervention or metformin. N Engl J Med 2002; 346(6): 393-403.
3. Neter JE, Stam BE, Kok FJ, et al. Influence of weight reduction on blood pressure: a meta-analysis of randomized controlled trials. Hypertension 2003; 42(5): 878-84.
4. Wing RR. Long-term effects of a lifestyle intervention on weight and cardiovascular risk factors in individuals with type 2 diabetes mellitus: four-year results of the Look AHEAD trial. Arch Intern Med 2010; 170(17): 1566-75.
5. Wadden TA, Volger S, Sarwer DB, et al. A two-year randomized trial of obesity treatment in primary care practice. N Engl J Med 2011; 365(21): 1969-79.
6. Appel LJ, Clark JM, Yeh HC, et al. Comparative effectiveness of weight-loss interventions in clinical practice. N Engl J Med 2011; 365(21): 1959-68.
7. Lanza ST, Savage JS, Birch LL. Identification and prediction of latent classes of weight-loss strate-gies among women. Obesity (Silver Spring) 2010; 18(4): 833-40.
8. Jung T, Wickrama, KA. An introduction to latent class growth analysis and growth mixture model-ing. Social and personality psychology compass 2008; 2: 302-17.
9. Runhaar JvM, M. Steens, R. Vroegindeweij, D. van Osch, G. Reijman, M. Koes, B. Bierma-Zeinstra S. Prevention of knee osteoarthritis in overweight females; from feasibility trial to full-scale trial. Osteoarthritis and Cartilage 2008; 16(Supplement 4): S141.
10. de Vos BC, Runhaar, J., Bierma-Zeinstra, S.M.A. . Effectiveness of a tailor made weight loss inter-vention in a primary care setting. Eur J Nutr. 2014 Feb; 53(1): 95-104.
11. Verkleij SP, Hoekstra T, Rozendaal RM, et al. Defining discriminative pain trajectories in hip osteo-arthritis over a 2-year time period. Ann Rheum Dis 2012; 71(9): 1517-23.
12. Nylund KL, Asparoutiov T, Muthen BO. Deciding on the number of classes in latent class analysis and growth mixture modeling: A Monte Carlo simulation study. Struct Equ Modeling 2007; 14(4): 535-69.


1
2
3
4
5
6
7
8
9
10
11
Chapter 4 Moderate weight loss prevents incident knee osteoarthritis in overweight and obese females.
Jos RunhaarBastiaan C. de VosMarienke van MiddelkoopDammis VroegindeweijEdwin H.G. OeiSita M.A. Bierma-Zeinstra
Arthritis Care Res (Hoboken). 2016 Feb 11. doi: 10.1002/
acr.22854. [Epub ahead of print]

48
aBstraCt
Objective
The present study evaluated the effect of a moderate amount of weight loss on the incidence of knee osteoarthritis (OA) in middle-aged, overweight and obese women, without clinical and radiological knee OA at baseline.
methods
A total of 353 women (87%) with follow-up data available were selected from the PROOF study (ISRCTN 42823086), which evaluated the preventive effect of a diet and exercise intervention and of oral glucosamine sulfate on the incidence of knee osteoarthritis. As an exploratory proof of concept analysis, incidence of knee OA was compared between women who reached the clinically relevant weight loss (WL) target of 5 kg or 5% of body weight after 30 months and those who did not reach this target (N-WL).
results
The WL group showed a significantly lower incidence of knee OA according to the pri-mary outcome measure, composed of knee OA according to ACR criteria (clinical and radiographic), K&L grades and joint space narrowing ≥ 1.0 mm (15% vs. 20%; OR 0.5, 95% CI 0.3 – 0.9). Moreover, the weight loss also positively affected several health measures, such as blood glucose level, fat percentage and blood pressure.
Conclusion
A reduction ≥ 5 kg or 5% of body weight over a 30 month period reduces the risk for the onset of radiographic knee OA in middle-aged, overweight and obese women. Due to the slow progression of the disease, a longer follow-up period will be necessary before the number of prevented cases of knee OA by moderate weight loss becomes clinically more relevant.
significance and innovations
For the first time, the preventive effect of a moderate amount of weight loss (5 kg or 5% of body weight) on incident knee osteoarthritis has been studied.
This study serves as a proof of concept that a moderate amount of weight loss can, in fact, prevent incident knee osteoarthritis in a high-risk population of overweight and obese women.
This paper contributes to preventive studies in osteoarthritis, which are lacking, espe-cially in a primary care setting.

49
1
2
3
4
5
6
7
8
9
10
11
intrODuCtiOn
The worldwide prevalence of obesity nearly doubled between 1980 and 2008 1. Accord-ing to the most recent estimations by the World Health Organization, 35% of all adults are overweight (BMI ≥ 25 kg/m2) and more than 12% is obese (BMI ≥ 30 kg/m2) 1. A high BMI is a strong risk factor for the onset of knee osteoarthritis (OA) 2-4 and has been associ-ated with the incidence of both clinical 5-7 and structural features 8-13 of knee OA. Given the high medical costs, productivity costs, morbidity and disability associated with knee OA, there is an increasing need for preventive measures.14
In trials among subjects with and without established knee OA, weight loss was shown to have advantageous structure modifying, systemic and clinical effects 15-21. In a system-atic review on the effects of weight loss on knee OA patients, a weight loss of at least 5% body weight was indicated for symptomatic relief 22. Losing 5 kg or 5% body weight has also been indicated as minimal weight loss for a positive and clinically relevant ef-fect on the cardiovascular risk profile, including significant reduction of blood pressure and improved glucose tolerance 23. In subjects without knee OA but with overweight or obesity, and hence at high risk for developing knee OA, the preventive effect of such a clinically relevant weight reduction has never been studied. In the Framingham Study it has been estimated that moderate weight loss (± 5 kg) could reduce the onset of knee OA in overweight and obese subjects 24 25.
Recently, the first preventive trial in OA research, the PROOF study (PRevention of knee Osteoarthritis in Overweight Females)26, was undertaken. In this randomized clini-cal trial among middle-aged women with a BMI ≥ 27 kg/m2 without knee OA at baseline, the effects of a diet and exercise program on incidence of knee OA over 2.5 years was studied. The diet and exercise program did show favorable effects on body weight fig-ures in the intervention group during the first year of the intervention and indications of a preventive effect among subjects compliant to the intervention were found26. The objective of the diet and exercise intervention was a structural weight reduction of 5 kg or 5% of baseline body weight.
The primary objective of the present study is to evaluate the effects of a clinically rel-evant reduction in body weight (≥ 5 kg or 5%), irrespective of the original interventions, on the incidence of clinical and radiological knee OA after 2.5 years in middle-aged overweight and obese women.
Patients anD methODs
For this study we used data from the PROOF study (ISRCTN 42823086). A full descrip-tion of the study protocol can be found elsewhere26. In short, this 2.5 year follow-up

50
study aimed to evaluate the preventive effect of a diet and exercise program and oral glucosamine sulfate (double-blind, placebo controlled) on the onset of knee OA in a 2x2 factorial design. Study protocol was approved by the Medical Ethical Committee of Erasmus MC. This manuscript was prepared according to the STROBE statement.27 For the present study, the predefined hypothesis was tested, stating that losing 5 kg or 5% of baseline body weight had a preventive effect on knee OA.
Fifty general practitioners in the area of Rotterdam, the Netherlands, contacted all women aged between 50 and 60 years registered at their practice. All women that returned the reply-card, reported a BMI ≥ 27 kg/m2, and were interested in participation, were sent additional information. One week later, inclusion criteria were screened by phone. Inclusion criteria were: age between 50 and 60 years, BMI ≥ 27 kg/m2, free of ACR criteria 28, no contra-indications for MRI, no rheumatic diseases, not using a walking aid, not under treatment for knee complaints, mastering the Dutch language, and not using oral glucosamine during the past 6 months. Here, ACR criteria concerned the clinical cri-teria only, since screening at this stage was done by phone. All other references to ACR criteria in the present paper refer to those measured with clinical and radiographic data. All women eligible and willing to participate were invited to visit the research institute for informed consent procedure and baseline measurements. The period of recruitment ran from July 2006 until May 2009.
At baseline, body weight and height, waist circumference, and blood pressure were measured. Skin folds of the triceps were measured and used to calculate fat percentage using the formula by Lean et al 29, that was defined as the most reliable method based on simple anthropometric measurements in women (fat percentage = [0.73xBMI]+[0.548*triceps skin fold]+[0.27xage]-5.9). A blood sample was taken to as-sess total blood cholesterol and HbA1c concentration and Heberden’s nodes on both hands were assessed. A standardized semi-flexed PA radiograph of both knees was taken according to the MTP protocol 30. All subjects filled in a questionnaire that included questions on knee complaints, number of days with knee pain, past knee injuries, and postmenopausal status. Knee complaints were defined as having any knee pain in the past 12 months. All measurements were repeated after 2.5 years of follow-up.
All tibiofemoral compartments of all knees were scored for knee OA by a researcher blinded for clinical outcomes (baseline and follow-up images at once with known se-quence), using Kellgren & Lawrence (K&L) criteria 31 (kappa 0.6). Also, alignment of the knee was assessed and varus alignment was defined as having an angle of less than 178 degrees on the baseline radiograph. Minimal joint space width (intraclass correlation 0.67-0.76) was measured digitally on each radiograph in each tibiofemoral compart-ment by two blinded researchers independently, according to the method of Lequesne 32. Scores with a difference between both readers ≥ 2.0 mm were re-evaluated by both readers at a consensus meeting. Joint space narrowing (JSN) was calculated for each

51
1
2
3
4
5
6
7
8
9
10
11
tibiofemoral compartment by subtracting the mean score of both assessors at baseline from the mean score at follow-up.
For the analyses, all subjects with the primary outcome measure and follow-up data on body weight available were selected. Baseline characteristics were tested for signifi-cant difference between WL and N-WL group using independent t-test (linear measures) and Chi2 test (dichotomous measures). Using Generalized Estimating Equations (GEE), which takes into account the association between knees within subjects, incidence of knee OA in subjects that reached the weight loss (WL) target of 5 kg or 5% body weight reduction at 2.5 years was compared to subjects that did not fulfil the target (N-WL). The predefined primary outcome measure was the incidence of knee OA, defined as incidence of either K&L ≥ 2 or ACR criteria (clinical + radiographic) or JSN ≥1.0 mm in the medial or lateral tibiofemoral compartment. A JSN of 1.0 mm was chosen as cut-off point, because the population concerned is a population without knee OA and there-fore, with healthy cartilage thickness. We hypothesized that less than 1.0 mm would be of questionable clinical interest in this population. Since initial screening was done by phone, we anticipated a proportion of participants would meet the criteria of one of the components of the primary outcome measure at baseline. These participants would be included in the analysis, defining development of knee OA during the follow-up period as meeting the criteria of one of the other components of the primary outcome measure. As a sensitivity analysis, we also analyzed differences between WL and N-WL for the separate items of the primary outcome measure. For these analyses, participants that met criteria of that specific outcome measure at baseline, were excluded. All GEE analyses were adjusted for the randomized groups of the initial PROOF study and their interaction, K&L grade at baseline (0 vs. ≥ 1) ; since it was shown to be related to the incidence of knee OA26, and those factors that were significantly different between WL and N-WL groups at baseline. Results from these analyses were presented in odds ratios (ORs) with 95% confidence intervals (CI). Baseline differences between WL and N-WL groups were tested using Student’s t-tests for continuous variables and Pearson Chi-square test for categorical variables. To evaluate the magnitude of the changes in clinical outcomes after a weight reduction of 5 kg or 5% body weight, changes over the 2.5 year follow-up period on total cholesterol, HbA1c level, fat percentage, waist circumference and blood pressure between WL and N-WL were assessed using Student’s t-tests. All statistical analyses were performed using performed using SPSS 20.0 (Chicago, IL) with a p-value < 0.05 regarded as statistically significant.

52
results
After 2.5 years, the primary outcome measure and follow-up data on body weight was available for 353 women (87 %). The reasons the remaining 54 participants were lost to follow up were as follows: one was unattainable, one had no radiograph at baseline, 9 had no radiograph at follow-up, 38 were unwilling and dropped-out during follow-up, 2 dropped-out due to side effects of the glucosamine, one had no questionnaire data at follow-up, two died during the course of the study. The participants that were lost to follow up had a slightly lower BMI (32.3 ± 4.1 vs. 33.1 ± 5.0) and more often had a history of knee injury (14 % vs. 6%). Both of these differences were significant differences (p<0.05). The other variables showed no significant differences between the participants that were lost to follow up and those that completed the study. From these women, 61 subjects (17%) fulfilled the weight loss target of 5 kg or 5% body weight. This group was defined as the ‘weight loss group’, which we compared to the other 292 participants, called the ‘non weight loss group’. Baseline characteristics of both groups are presented in table 1.
As expected, there was a proportion of participants with knee OA at baseline, due to the initial screening by phone. 3.9% of the participants met ACR criteria at baseline and 6.6% had K&L grade 2 or higher. As described in the methods section, these participants were not excluded from the analysis. However, as a sensitivity analyses, these participants
table 1. Baseline characteristics (mean ± st.dev.).
Non weight loss group Weight loss group p-values
N – subjects 292 61
Age (yr) 55.8 ± 3.2 55.5 ± 3.2 0.42
BMI (kg/m2) 32.0 ± 4.1 33.4 ± 4.3 <0.01
Postmenopausal status (yes) 69% 73% 0.33
Heberden’s nodes (in ≥ 1 finger) 28% 25% 0.58
N – knees 584 122
K&L grade 0 52% 43% 0.11
K&L grade ≥ 1 48% 57%
History of knee injury (yes) 12% 21% 0.01
Knee OA symptoms* (yes) 31% 33% 0.75
Varus alignment** (yes) 39% 43% 0.36
* Knee OA symptoms defined as having knee pain in the last 12 months.** Varus alignment of the knee defined as an angle of less than 178 degrees on the baseline radiograph.

53
1
2
3
4
5
6
7
8
9
10
11
were excluded from the analyses with the separate components of the primary outcome measure as outcome measure.
At baseline, the mean BMI (p = 0.01) and the number of knees with an injury in the past (p = 0.01) were significantly higher in the WL group. Hence, the analyses were ad-ditionally adjusted for these variables. The weight change in the WL group over the 2.5 years of follow-up was -9.9 ± 5.7 kg on average, ranging from -4.2 kg to -24.7 kg. In the N-WL group, subjects gained 1.8 ± 4.0 kg on average, ranging from -4.8 to +21.2 kg. Mean change in BMI was -3.6 kg/m2 in the WL group and +0.7 kg/m2 in the N-WL group.
Incidence figures of knee OA according to the primary outcome and the separate items and corresponding ORs for the WL group relative to the N-WL group are presented in table 2. Incidence according to the primary outcome measure was 20% in N-WL and 15% in the WL group (OR 0.50; 95% CI 0.27 – 0.93). Also the difference in incidence of K& L ≥ 2 between N-WL (6%) and the WL-group (3%) showed to be statistically significant (OR 0.28; 95% CI 0.08 – 0.90). The other outcome measures showed no significant differ-ence between both groups.
Subjects in the WL group had a significant reduction of HbA1c level (-1.4 vs 0.4 mmol/mol, P=0.03), fat percentage (-4.7 vs -0.1%, P<0.01), waist circumference (-7.3 vs 1.5 cm,
table 2. Incidence of knee OA for weight loss and non-weight loss groups.
Outcome Group Incidence Adjusted Odds Ratio**
(95% CI)
Knee OA* WL group 18/122 (15%) (0.27-0.93)
(primary outcome measure)
WL group 18/122 (15%) (0.27-0.93)
N-WL group 117/584 (20%) 1
K&L ≥ 2 WL group 3/118 (3%) 0.27 (0.08-0.90)
N-WL group 33/545 (6 %) 1
ACR criteria WL group 6/122 (5%) 0.34
(0.09-1.32)
N-WL group 41/584 (7 %) 1
Medial JSN WL group 6/122 (5%) 0.65
(0.26-1.67)
N-WL group 34/583 (6%) 1
Lateral JSN WL group 7/122 (6%) 0.74
(0.32-1.70)
N-WL group 40/583 (7%) 1
WL group: weight loss group (≥5 kg or 5% weight loss). N-WL group: non weight loss group (<5 kg or 5% weight loss). K&L: Kellgren & Lawrence criteria. JSN: joint space narrowing (≥1.0 mm). *Defined as incidence of K&L ≥ 2 or the ACR criteria(clinical and radiographic) or JSN ≥1.0 mm. **Analyses adjusted for random-ized groups of PROOF study and their interaction, K&L grade and BMI at baseline, and past injury. N-WL group served as reference group.

54
P<0.01) and systolic (-5.3 vs 0.2 mmHg, P=0.04) and diastolic (-7.9 vs -2.8 mmHg, P<0.01) blood pressure over the 2.5 year follow-up compared to subjects in the N-WL group.
DisCussiOn
For the first time, the preventive effect of moderate weight reduction on incident knee OA in a high risk group of middle-aged women with a BMI ≥ 27 kg/m2 has been studied. Previously, one study reported a preventive effect of weight loss on cartilage thickness of the knee18. However, this was an observational study without validated clinical or radiological osteoarthritis outcomes, making the results less applicable in clinical practice. Recently, a study reported on the preventive effect of an intensive diet and exercise program on knee pain and showed evidence of a preventive effect of a weight loss intervention on knee pain.33 However, knee OA figures were not presented, since no radiographs were taken. Moreover, the present study reports on an effect of moderate weight loss, which makes it more applicable in primary care.
The intention to treat analysis of the original PROOF study showed no significant main effects of the diet-and-exercise program or the glucosamine vs placebo intervention on incidence of knee osteoarthritis over 2.5 years. The present study, as a proof of concept, shows that a clinically relevant weight reduction of 5 kg or 5% body weight or more leads to significantly less incident cases of knee OA in overweight and obese women.
The PROOF study used a combined outcome measure of radiographic and clinical knee OA features in order to make a preventive randomized trial feasible over a relative short follow-up time26. In the N-WL group, 6% of all knees had incident radiographic knee OA (K&L ≥ 2) over the follow-up period. This annual incidence of 2,4% is at the high end of the range found in population based cohorts using the same criterion, such as the Framingham Study (2% in women) 34, the Rotterdam Study (1.4% in men and women with a BMI > 27.5 kg/m2), the Chingford Women’s Study (2,3% in women aged 45-64) 35, and the Road Study (3,6% in women aged 50-59) 36. Only the latter reported higher incidence numbers than in our study, but these were calculated on a subject level rather than knee level. On a subject level, an annual incidence of 4% was found in the N-WL group. Incidence of clinical knee OA (clinical + radiographic) found in the present study (2.8% in N-WL group) was higher than numbers reported in other studies (1% in women of the Framingham Study 34 and 0.3% in middle-aged women 37). This might be explained by the fact that our study was conducted in overweight and obese subjects, who are at higher risk for the onset of knee OA than normal weight individuals 2 3.
There is an obvious overlap between incidence of JSN and incidence of K&L ≥ 2, given the fact that JSN is part of the definition of K&L ≥ 2. Nevertheless, we did not find a similar association between weight loss and incident JSN like we found for the incidence of K&L

55
1
2
3
4
5
6
7
8
9
10
11
≥ 2. In addition to JSN, K&L ≥ 2 requires definite osteophytes in the tibiofemoral joint. Previously, surplus fat mass has been linked to osteophyte formation, possibly through circulating leptin levels 38. Since circulating leptin level decrease after weight loss 38, it could be supposed that a clinically relevant weight loss would lead to less osteophyte formation. Less osteophyte formation could explain why we did find an effect of weight loss on incidence of K&L ≥ 2, which was not found for JSN.
At baseline, the WL group had a significantly higher BMI and reported a higher num-ber of knees with a history of knee injury. The first was to be expected since a high BMI is a predictor for greater weight loss 39 40. Probably, the higher prevalence of knees with a history of injury in the WL group was also linked through BMI; baseline BMI was significantly higher in subjects with a previously injured knee than in subjects without and a history of injury showed to have a non-significant effect on all outcome measures when adjusted for BMI at baseline (data not shown). Perhaps the former injury led to a less active lifestyle and hence, a higher body weight.
Besides effects on the onset of knee OA, moderate weight loss also positively affected several health measures, such as blood glucose level, fat percentage, waist circumfer-ence and blood pressure. Positive alterations in these features have been linked to lower risk of diabetes mellitus type 2, cardiovascular morbidity and mortality 41. However, the magnitude of the changes found was not high enough to reduce the 10-year risk of fatal cardiovascular disease 41. Maintenance of the body weight in the WL group over a prolonged period will possibly lead to greater reductions in these health measures. Other limitations of this study include the observational design, making the results less applicable in clinical practice, since the intervention effect of the original randomized controlled trial was adjusted for in the analyses, making this article a ‘proof of concept’. In addition, a limitation of this study is that solely an association is found between sig-nificant weight loss and the development of knee OA. This does not necessarily mean a causal relation between these two variables exists. Confounding factors could distort this association. For example, a secondary analysis on data derived from the PROOF study, showed, among other things, that participants with a relatively low body weight around their fortieth life year, were more likely to lose weight during the study.42 This could mean that the group that lost 5 kg or 5% of their body weight is, in fact, a group of participants with an overall healthier lifestyle, which could account for the better health outcomes. However, the changes in health outcomes were measured during the period in which the participants lost weight. It is not expected that their blood pressure and HbA1c would lower spontaneously.
In conclusion, a reduction of ≥ 5 kg or 5% of body weight over a 30 month period is associated with a reduced risk for the onset of (radiographic) knee OA in middle-aged, overweight and obese women. Also, several health measures were positively altered af-ter this moderate weight loss. Due to the slow progress of the disease, a longer follow-up

56
period will be necessary before the number of prevented cases of knee OA by moderate weight loss becomes clinically relevant.

57
1
2
3
4
5
6
7
8
9
10
11
reFerenCes
1. Biesalski HK, Grune T, Tinz J, et al. Reexamination of a meta-analysis of the effect of antioxidant supplementation on mortality and health in randomized trials. Nutr 2010; 2(9): 929-49.
2. Bierma-Zeinstra SM, Koes BW. Risk factors and prognostic factors of hip and knee osteoarthritis. Nat Clin Pract Rheumatol 2007; 3(2): 78-85.
3. Blagojevic M, Jinks C, Jeffery A, et al. Risk factors for onset of osteoarthritis of the knee in older adults: a systematic review and meta-analysis. Osteoarthritis and cartilage / OARS, Osteoarthritis Research Society 2010; 18(1): 24-33.
4. Wills AK, Black S, Cooper R, et al. Life course body mass index and risk of knee osteoarthritis at the age of 53 years: evidence from the 1946 British birth cohort study. Ann Rheum Dis 2012; 71(5): 655-60.
5. Soni A, Kiran A, Hart DJ, et al. Prevalence of reported knee pain over twelve years in a community-based cohort. Arthritis and rheumatism 2012; 64(4): 1145-52.
6. Zhai G, Blizzard L, Srikanth V, et al. Correlates of knee pain in older adults: Tasmanian Older Adult Cohort Study. Arthritis and rheumatism 2006; 55(2): 264-71.
7. Mork PJ, Holtermann A, Nilsen TI. Effect of body mass index and physical exercise on risk of knee and hip osteoarthritis: longitudinal data from the Norwegian HUNT Study. J Epidemiol Commu-nity Health 2012; 66(8): 678-83.
8. Ding C, Stannus O, Cicuttini F, et al. Body fat is associated with increased and lean mass with decreased knee cartilage loss in older adults: a prospective cohort study. Int J Obes (Lond) 2012.
9. Niu J, Zhang YQ, Torner J, et al. Is obesity a risk factor for progressive radiographic knee osteoar-thritis? Arthritis and rheumatism 2009; 61(3): 329-35.
10. Roemer FW, Zhang Y, Niu J, et al. Tibiofemoral joint osteoarthritis: risk factors for MR-depicted fast cartilage loss over a 30-month period in the multicenter osteoarthritis study. Radiology 2009; 252(3): 772-80.
11. Toivanen AT, Heliovaara M, Impivaara O, et al. Obesity, physically demanding work and traumatic knee injury are major risk factors for knee osteoarthritis--a population-based study with a follow-up of 22 years. Rheumatology (Oxford) 2010; 49(2): 308-14.
12. Reijman M, Pols HA, Bergink AP, et al. Body mass index associated with onset and progression of osteoarthritis of the knee but not of the hip: the Rotterdam Study. Ann Rheum Dis 2007; 66(2): 158-62.
13. Lim YZ, Wang Y, Wluka AE, et al. Association of obesity and systemic factors with bone marrow lesions at the knee: A systematic review. Semin Arthritis Rheum 2014; 43(5): 600-12.
14. Hermans J, Koopmanschap MA, Bierma-Zeinstra SM, et al. Productivity costs and medical costs among working patients with knee osteoarthritis. Arthritis Care Res (Hoboken) 2012; 64(6): 853-61.
15. Bliddal H, Leeds AR, Stigsgaard L, et al. Weight loss as treatment for knee osteoarthritis symptoms in obese patients: 1-year results from a randomised controlled trial. Ann Rheum Dis 2011; 70(10): 1798-803.
16. Christensen R, Astrup A, Bliddal H. Weight loss: the treatment of choice for knee osteoarthritis? A randomized trial. Osteoarthritis and cartilage / OARS, Osteoarthritis Research Society 2005; 13(1): 20-7.
17. Richette P, Poitou C, Garnero P, et al. Benefits of massive weight loss on symptoms, systemic inflammation and cartilage turnover in obese patients with knee osteoarthritis. Ann Rheum Dis 2011; 70(1): 139-44.

58
18. Anandacoomarasamy A, Leibman S, Smith G, et al. Weight loss in obese people has structure-modifying effects on medial but not on lateral knee articular cartilage. Ann Rheum Dis 2012; 71(1): 26-32.
19. Riddle DL, Stratford PW. Body weight changes and corresponding changes in pain and function in persons with symptomatic knee osteoarthritis: a cohort study. Arthritis Care Res (Hoboken) 2013; 65(1): 15-22.
20. Messier SP, Mihalko SL, Legault C, et al. Effects of intensive diet and exercise on knee joint loads, inflammation, and clinical outcomes among overweight and obese adults with knee osteoarthri-tis: the IDEA randomized clinical trial. JAMA 2013; 310(12): 1263-73.
21. Gudbergsen H, Boesen M, Lohmander LS, et al. Weight loss is effective for symptomatic relief in obese subjects with knee osteoarthritis independently of joint damage severity assessed by high-field MRI and radiography. Osteoarthritis Cartilage 2012; 20(6): 495-502.
22. Christensen R, Bartels EM, Astrup A, et al. Effect of weight reduction in obese patients diagnosed with knee osteoarthritis: a systematic review and meta-analysis. Ann Rheum Dis 2007; 66(4): 433-9.
23. Bray GA, Ryan DH, Harsha DW. Diet, Weight Loss, and Cardiovascular Disease Prevention. Curr Treat Options Cardiovasc Med 2003; 5(4): 259-69.
24. Felson DT. Weight and osteoarthritis. The Journal of rheumatology 1995; 43: 7-9. 25. Felson DT. Does excess weight cause osteoarthritis and, if so, why? Ann Rheum Dis 1996; 55(9):
668-70. 26. Runhaar J, van Middelkoop M, Reijman M, et al. Prevention of Knee Osteoarthritis in Overweight
Females: The First Preventive Randomized Controlled Trial in Osteoarthritis. Am J Med 2015; 128(8): 888-95 e4.
27. von Elm E, Altman DG, Egger M, et al. The Strengthening the Reporting of Observational Stud-ies in Epidemiology (STROBE) statement: guidelines for reporting observational studies. Lancet 2007; 370(9596): 1453-7.
28. Altman R, Asch E, Bloch D, et al. Development of criteria for the classification and reporting of osteoarthritis. Arthritis and rheumatism 1986; 29(8): 1039 - 49.
29. Lean ME, Han TS, Deurenberg P. Predicting body composition by densitometry from simple anthropometric measurements. Am J Clin Nutr 1996; 63(1): 4-14.
30. Buckland-Wright JC, Wolfe F, Ward RJ, et al. Substantial superiority of semiflexed (MTP) views in knee osteoarthritis: a comparative radiographic study, without fluoroscopy, of standing ex-tended, semiflexed (MTP), and schuss views. J Rheumatol 1999; 26(12): 2664-74.
31. Kellgren JH, Lawrence JS. Radiological assessment of osteo-arthrosis. Ann Rheum Dis 1957; 16(4): 494-502.
32. Lequesne M. Quantitative measurements of joint space during progression of osteoarthritis: chondrometry. In: Kuettner K, Goldberg V, eds. Osteoarthritic disorders. Rosemont: American Academy of Orthopaedic Surgeons, 1995: 427–44.
33. White DK, Neogi T, Rejeski WJ, et al. Can an Intensive Diet and Exercise Program Prevent Knee Pain Among Overweight Adults at High Risk? Arthrit Care Res 2015; 67(7): 965-71.
34. Felson DT, Zhang Y, Hannan MT, et al. The incidence and natural history of knee osteoarthritis in the elderly. The Framingham Osteoarthritis Study. Arthritis and rheumatism 1995; 38(10): 1500-5.
35. Leyland KM, Hart DJ, Javaid MK, et al. The natural history of radiographic knee osteoarthritis: a fourteen-year population-based cohort study. Arthritis and rheumatism 2012; 64(7): 2243-51.
36. Yoshimura N, Muraki S, Oka H, et al. Accumulation of metabolic risk factors such as overweight, hypertension, dyslipidaemia, and impaired glucose tolerance raises the risk of occurrence and

59
1
2
3
4
5
6
7
8
9
10
11
progression of knee osteoarthritis: a 3-year follow-up of the ROAD study. Osteoarthritis Cartilage 2012; 20(11): 1217-26.
37. Oliveria SA, Felson DT, Reed JI, et al. Incidence of symptomatic hand, hip, and knee osteoarthritis among patients in a health maintenance organization. Arthritis and rheumatism 1995; 38(8): 1134-41.
38. Teichtahl AJ, Wluka AE, Proietto J, et al. Obesity and the female sex, risk factors for knee osteoar-thritis that may be attributable to systemic or local leptin biosynthesis and its cellular effects. Med Hypotheses 2005; 65(2): 312-5.
39. Finkler E, Heymsfield SB, St-Onge MP. Rate of Weight Loss Can Be Predicted by Patient Character-istics and Intervention Strategies. J Am Diet Assoc 2011.
40. de Vos BC, Runhaar J, Bierma-Zeinstra SM. Effectiveness of a tailor-made weight loss intervention in primary care. Eur J Nutr 2014; 53(1): 95-104.
41. Graham I, Atar D, Borch-Johnsen K, et al. European guidelines on cardiovascular disease preven-tion in clinical practice: executive summary: Fourth Joint Task Force of the European Society of Cardiology and Other Societies on Cardiovascular Disease Prevention in Clinical Practice (Constituted by representatives of nine societies and by invited experts). Eur Heart J 2007; 28(19): 2375-414.
42. de Vos BC, Runhaar J, Verkleij SPJ, et al. Latent class growth analysis successfully identified sub-groups of participants during a weight loss intervention trial. J Clin Epidemiol 2014; 67(8): 947-51.


1
2
3
4
5
6
7
8
9
10
11
Chapter 5 Effect of weight change on progression of knee OA features assessed by MRI in high-risk overweight and obese women
Marieke L.A. LandsmeerBastiaan C. de VosPeter van der PlasMarienke van MiddelkoopDammis VroegindeweijPatrick J.E. BindelsEdwin H.G. OeiSita M.A. Bierma-ZeinstraJos Runhaar
Submitted

62
aBstraCt
Objective
To evaluate the effects of weight change on progression of magnetic resonance imag-ing (MRI) features of knee osteoarthritis (OA) in overweight and obese women without clinical and radiographic knee OA.
methods
Women with available outcome (83%) were selected from the PROOF study (ISRCTN 42823086) and classified with latent class growth analysis into a group with steady weight (n = 254), a group that gained weight (n = 38) and a group that lost weight (n = 44) over 2.5 years follow-up. Baseline and follow-up MRIs were scored with MRI Osteoarthritis Knee Score (MOAKS) to assess progression of bone marrow lesions (BMLs), cartilage defects, osteophytes, meniscal abnormalities and meniscal extrusion in the tibiofemoral and patellofemoral joint. Associations between weight change and MRI progression were performed on knee level using adjusted Generalized Estimating Equations.
results
640 knees from 336 women with mean age 55.7±3.2 years and mean BMI 32.3±4.1 kg/m2 were analyzed. Baseline prevalence ranged from 11% for osteophytes to 65% for meniscal abnormalities. Progression ranged from 6% for osteophytes to 27% for menis-cal abnormalities and 30% for cartilage defects. Despite a mean weight reduction of 9.0 ± 7.2kg in the weight loss group and an 8.2 ± 3.6kg increase in the weight gain group, there were no significant effects of the weight change subgroups on the progression of MOAKS features.
Conclusion
In overweight and obese middle-aged women without knee OA, prevalence of MOAKS features was high. Neither weight loss nor weight gain did affect progression of the features over 2.5 years.

63
1
2
3
4
5
6
7
8
9
10
11
intrODuCtiOn
The epidemic of obesity is one of the most important health problems worldwide1. As described by the World Health Organization, the global prevalence of obesity has nearly doubled since 1980. In 2014, 11% of men and 15% of women aged 18 years and older were classified as obese (BMI ≥ 30 kg/m2) and 39% of adults as overweighed (BMI ≥ 25 kg/m2 )2. They are established risk factors for incident clinical and radiographic knee osteoarthritis (OA)3-5 and there is evidence that BMI is associated with progression of clinical knee OA6. High prevalence of knee OA has important negative health, social and economic consequences7. As important modifiable risk factors for knee OA, overweight and obesity are key targets in knee OA management and prevention8.
As the symptomatic treatment of first choice, weight reduction can reduce pain and physical disability in overweight persons with knee OA9, but beneficial effects on struc-tural OA have not been identified10-13. It is important to know whether instead weight loss as a preventive measurement in overweighed subjects without knee OA has benefi-cial effects on articular structures. Evidence from existing studies is limited and studies have evaluated in particular cartilage or its biochemical composition14 15. The effects of substantial weight loss in high-risk populations on other OA MRI features, such as bone marrow lesions (BMLs), osteophytes and meniscal damages, have not been assessed yet.
A common method to assess weight loss is the percentage weight change over time relative to baseline. Weight loss of ≥ 10% is recommended to use in OA research, in order to provide significant pain reductions16. A disadvantage of this is that subjects with fluctuations in BMI during follow-up are not distinguished from those with steady weight loss. Subjects could have lost 10% of their baseline weight at the end of follow-up, regardless of weight changes preceding this period. A summary measure which takes into account weight changes over time would be more appropriate. Latent Class Growth Analysis (LCGA) can provide such a summary measure with the use of objective parameters to classify participants in subgroups17. Recently, this method successfully identified three latent classes of participants within the PROOF Study, a preventive RCT among overweight and obese middle-aged women free of clinical knee OA18 19. The latent classes represented three subgroups with different weight changes over time, with higher inter-group variability than intra-group variability19. Using the assignment to these groups as summary measure, less information is lost in contrast to using the weight change at the end of the follow-up time. This method might give us more de-tailed information about the effect of weight change on MRI features.
The aim of the present study was to compare 2.5 years changes in different OA MRI features using three distinct weight change subgroups among middle-aged overweight and obese women without clinical and radiographic knee OA.

64
Patients anD methODs
study design, setting and population
For the present study, we used data from the PROOF study (Prevention of knee Osteoar-thritis in Overweight Females, ISRCTN 42823086). The description of the trial design and first results have been published previously18 20. In short, this 2.5 year follow-up study evaluated the preventive effects of a diet and exercise program and of oral crystalline glucosamine sulfate (double-blind and placebo-controlled) on the development of knee OA in a 2x2 factorial design. All women aged between 50 and 60 years and with a BMI ≥ 27 kg/m2 were contacted by their general practitioner (GP). They had to be free of knee OA according to the clinical criteria of the American College of Rheumatology (ACR)21. They had to master the Dutch language and had to be free of major co-morbidities, free of inflammatory rheumatic diseases, not under treatment of a physical therapist or GP for knee complaints, not using walking aids, not using oral glucosamine for the last 6 months and free of contraindications for MRI. The description of the diet and exercise program, aimed to achieve weight loss in the intervention group, has been presented elsewhere20. The Institutional Review Board of Erasmus MC University Medical Center Rotterdam approved the study. All participants gave written informed consent prior to baseline measurements. We used three weight change subgroups, identified previously with LCGA using six-monthly weight data19. By using the mean over these time points as a summary measure, participants with highly fluctuating weight changes around zero
-15
-10
-5
0
5
10
15
BL 6 months 12 months 18 months 24 months 30 months
Wei
ght c
hang
e (k
g, m
ean,
95%
CI)
Steadies
Gainers
Losers
Fig. 1. Mean weight changes during and after the weight loss intervention. Figures presented as mean body weight in kilograms and error bars present 95% confidence intervals. CI, confidence intervals. Figure from de Vos et al., with approval of the authors19.

65
1
2
3
4
5
6
7
8
9
10
11
were treated similarly to participants who remained steady around zero. The women were classified into a subgroup of relatively unchanged weight participants (‘steadies’), a subgroup representing subjects who steadily gained weight (‘gainers’) and a subgroup of women who steadily lost weight over time (‘losers’) (Figure 1)19.
Clinical and radiographic assessment
At baseline all subjects filled in a questionnaire to record demographics, self-reported body weight around their 40th year of age, history of knee injury of age and mild knee symptoms (defined as having knee pain in the last 12 months). Baseline body weight and height were assessed with a standardized physical examination by a research as-sistant at the research center. Posterior-anterior radiographs of both knees were taken using the semi-flexed standing metatarsophalangeal (MTP) view22. The Kellgren and Lawrence (K&L) classification23 and the medial anatomical knee alignment angle were assessed on all knee radiographs24. Varus alignment was defined as an angle <182° 25. All measurements were repeated after 2.5 years of follow-up, body weight was recorded every six months.
mri assessment
An MRI of both knees was made at baseline and 2.5 years on a 1.5 Tesla scanner (Siemens or GE Healthcare). The MRI protocol included coronal and sagittal non-fat suppressed proton density weighted sequences (slice thickness 3.0 mm/slice gap 0.3 mm), a coronal T2 weighted Spectral Presaturation by Inversion Recovery (SPIR) sequence (slice thick-ness 5.0 mm/slice gap 0.5 mm), an axial dual spin-echo sequence (slice thickness 4.5mm/slice gap 0.5 mm), and a sagittal 3D water selective (WATS) sequence with fat saturation (slice thickness 1.5 mm). Baseline and follow-up MRIs were scored at once (sequence known) by two trained and blinded researchers (JR human movement scientist, PvdP radiology trainee) using the semi-quantitative MRI Osteoarthritis Knee Score (MOAKS)26. The following OA-features were evaluated: bone marrow lesions (BMLs), cartilage de-fects, osteophytes, meniscal abnormalities and meniscal extrusion. We defined meniscal abnormalities, separately from meniscus extrusion, as meniscal morphologic abnormali-ties (tears, maceration, hypertrophy and cysts) and (degenerative) signal abnormalities. For the purpose of adequate implementation of MOAKS, an extensive training for the two researchers was organized under supervision of an experienced musculoskeletal radiologist (EO: 10 years of experience with musculoskeletal MRI in clinical and research settings)27. The change of the individual features over 2.5 years was scored using the recently proposed definitions for longitudinal evaluation of MOAKS, in which the average prevalence adjusted bias adjusted kappa (PABAK) values per feature showed ‘substantial’ to ‘nearly perfect’ agreement (range 0.77 – 0.88, observed agreement 89% - 94%)27. Appendix table 1 shows the definitions of change, which we applied to the

66
present study27. We summed the subregional change scores into an overall score per feature and dichotomized this into progression versus no progression (change score ≥ 1 = progression, change score < 1 = no progression).
Outcome measures
The primary outcome measure was defined as the progression over 2.5 years of the fol-lowing OA MRI features: BMLs, cartilage defects, osteophytes, meniscal abnormalities and meniscal extrusion. BMLs, cartilage defects and osteophytes were assessed in the tibiofemoral (TF) and patellofemoral (PF) joint separately. Meniscal abnormalities and meniscal extrusion were assessed for the medial and lateral meniscus together. The secondary outcome measure was defined as the progression over 2.5 years of BMLs, cartilage defects and osteophytes in the medial and lateral TF joint separately and the progression of meniscal abnormalities and meniscal extrusions for the medial and lat-eral meniscus separately.
statistical analysis
Participants with available body weight data and available MRI of one or both knees at baseline and 2.5 years were included. Knees with K&L ≥ 2 were excluded and the analyses were performed on knee level. Descriptive data were presented as mean ± standard deviation (SD) or as numbers (percentages). First, unadjusted associations between the weight change subgroups and the primary outcome were analyzed with binomial logistic regression using generalized estimating equations (GEE), which takes the association between knees within subjects into account. The subgroup of ‘steadies’ was defined as reference group. Next, the associations were adjusted for baseline BMI, injury and mild knee symptoms, covariates which are likely to affect both weight change and MRI feature progression. In addition, for each MRI feature outcome, adjustment was made for the presence of that MRI feature at baseline. Also, the analyses were adjusted for K&L classification (0 vs. 1) and performed irrespective of the original trial interven-tions of the PROOF study and therefore adjusted for the randomization groups. Results from the GEE analyses were presented in odds ratios (ORs) with 95% confidence inter-vals (CI). As an explorative analysis, we evaluated the progression rates within the three weight change subgroups for the medial and lateral TF joint and the medial and lateral meniscus separately. Analyses were performed with SPSS 21.0 (Chicago, IL). P values less than 0.05 were considered statistically significant.

67
1
2
3
4
5
6
7
8
9
10
11
results
Characteristics of the study population
71 of 407 (17%) women were not available for current analyses. The main reason was no further time available or interest in the study (47 women, 66%). 12 women (17%) had K&L ≥ 2 in both knees. Other reasons (17%) were claustrophobia (3 women), unattain-ability (6 women) and insufficient MRI quality (1 woman). Two persons deceased during follow-up. Additionally, 34 unilateral knees were excluded for analysis due to baseline K&L ≥ 2 (n = 28), a recent severe knee trauma (n = 2) or the inability or unwillingness to continue MRI scanning of the second knee (n = 4). This resulted in the analysis of 640 knees of 336 women. Comparison of the baseline characteristics between included and non-included knees showed a significant higher prevalence of K&L score 1 (98/170 (58%) vs. 300/640 (47%), p = 0.01), varus alignment (83/170 (48%) vs 240/636 (38%), p = 0.01), meniscus extrusion (96/143 (67%) vs 317/637 (50%), p = < 0.001), PF osteophytes (30/142 (21%) vs 73/639 (11%), p = 0.02) and TF osteophytes (49/144 (34%) vs 95/639 (15%), p = < 0.001) in knees that were excluded. With LCGA, 254 of 336 women were classified as ‘steadies’, 38 women as ‘gainers’ and 44 as ‘losers’19. The weight change in the ‘steadies’ was minimal with 0.1 ± 4.0 kg weight gain. Weight change in the ‘gainers’ was 8.2 ± 3.6 kg weight gain, in the ’losers’ this was 9.0 ± 7.2 kg weight loss. These changes were significantly different between groups (p < 0.001). table 1 shows the distribution and means of baseline characteristics among the subgroups. Mean age was 55.7 ± 3.2
table 1. Baseline characteristics (mean ± SD) of the study participants.
All Steadies Gainers Losers
N - subjects 336 254 38 44
Age (years) 55.7 ± 3.2 55.8 ± 3.3 55.0 ± 2.8 55.6 ± 2.9
BMI (kg/m²) 32.3 ± 4.1 32.0 ± 4.0 31.7 ± 3.8 34.0 ± 4.3
BMI (kg/m2) at age 40 years (self-reported)
27.3 ± 4.1 27.3 ± 4.1 27.7 ± 3.3 27.1 ± 4.2
DEP control + placebo 82 (25%) 62 (24%) 13 (34%) 10 (23%)
DEP control + glucosamine 79 (24%) 59 (23%) 12 (32%) 8 (18%)
DEP intervention + placebo 84 (25%) 63 (25%) 7 (18%) 14 (32%)
DEP intervention + glucosamine\ 88 (26%) 70 (28%) 6 (16%) 12 (27%)
N - knees 640 488 70 82
K&L grade 0 340 (53%) 259 (53%) 39 (56%) 42 (51%)
K&L grade 1 300 (47%) 229 (47%) 31 (44%) 40 (49%)
Varus alignment (yes) 240 (38%) 171 (35%) 35 (50%) 34 (41%)
Mild knee symptoms* (yes) 189 (30%) 142 (29%) 17 (24%) 30 (37%)
History of knee injury (yes) 79 (12%) 53 (11%) 11 (16%) 15 (18%)

68
years, mean BMI was 32.3 ± 4.1 kg/m2 and mean BMI at 40 year of age was 27.3 ± 4.1 kg/m2. Of the 640 knees, 30% were classified as having ‘mild knee symptoms’. K&L 1 was present in 47% of the knees. Prevalence of OA MRI features ranged from 11% for PF os-teophytes to 65% for meniscal pathologies. For BMLs and cartilage defects, prevalence was higher in the PF joint than in the TF joint.
effect of weight change subgroups on progression of Oa mri features in the tF and PF joint and the meniscus
Progression rates of the OA MRI features for the TF, PF joint and meniscus with corre-sponding ORs for the weight change subgroups are presented in table 2. Progression ranged from 6% in the ‘steadies’ for PF osteophytes, to 30% in the ‘gainers’ for PF cartilage defects. There was no significant effect of weight loss compared to stable weight on the progression of any of the different OA MRI features. Also, the effect of weight gain did not differ significantly from stable weight.
table 1. Baseline characteristics (mean ± SD) of the study participants. (continued)
All Steadies Gainers Losers
BMLs
TF joint 198 (31%) 155 (32%) 15 (21%) 28 (34%)
PF joint 315 (49%) 242 (50%) 35 (50%) 38 (46%)
Cartilage defects
TF joint 251 (39%) 201 (41%) 15 (21%) 35 (43%)
PF joint 370 (58%) 291 (60%) 41 (59%) 38 (46%)
Osteophytes
TF joint 95 (15%) 76 (16%) 8 (11%) 11 (13%)
PF joint 73 (11%) 55 (11%) 3 (4%) 15 (18%)
Meniscal pathologies
Medial and/or lateral 413 (65%) 323(66%) 44 (63%) 46 (56%)
Meniscal extrusions
Medial and/or lateral 317 (50%) 244 (50%) 32 (46%) 41 (50%)
BMI = body mass index; DEP = Diet and Exercise Program; K&L = Kellgren and Lawrence classification; TF = tibiofemoral; PF = patellofemoral; * Mild knee symptoms defined as having knee pain in the last 12 months.

69
1
2
3
4
5
6
7
8
9
10
11
table 2. Progression of OA MRI features of the tibiofemoral (TFJ) and patellofemoral joint (PFJ) over 30 months for the weight change subgroups. Subjects with steady weight (‘steadies’) were used as reference.
Group N (%) OR 95% CI aOR* 95% CI
Bone marrow lesions and cysts
TFJ Steadies (n = 488) 61 (13) 1 Reference 1 Reference
Gainers (n = 70) 7 (10) 0.78 0.35 – 1.70 0.88 0.40 – 1.96
Losers (n = 82) 10 (12) 0.98 0.47 – 2.07 0.93 0.43 – 2.02
PFJ Steadies 102 (21) 1 Reference 1 Reference
Gainers 20 (29) 1.55 0.84 – 2.87 1.63 0.90 – 2.97
Losers 18 (22) 1.11 0.60 – 2.07 1.04 0.56 – 1.95
Cartilage defects
TFJ Steadies 58 (12) 1 Reference 1 Reference
Gainers 6 (9) 0.69 0.29 – 1.60 0.81 0.33 – 1.96
Losers 8 (10) 0.84 0.39 – 1.82 0.73 0.35 – 1.53
PFJ Steadies 108 (22) 1 Reference 10 Reference
Gainers 21 (30) 1.50 0.85 – 2.67 1.63 0.92 – 2.91
Losers 14 (17) 0.74 0.42 - 1.29 0.76 0.43 – 1.35
Osteophytes
TFJ Steadies 53 (11) 1 Reference 1 Reference
Gainers 9 (13) 1.20 0.54 – 2.68 1.41 0.65 – 3.07
Losers 11 (13) 1.31 0.54 – 3.15 1.14 0.47 – 2.79
PFJ Steadies 28 (6) 1 Reference 1 Reference
Gainers 5 (7) 1.29 0.48 – 3.46 1.65 0.58 – 4.74
Losers 8 (10) 1.81 0.74 – 4.45 1.14 0.37 – 3.44
Meniscal abnormalities
Medial and/or lateral
Steadies 132 (27) 1 Reference 1 Reference
Gainers 19 (27) 1.00 0.54 – 1.83 1.00 0.54 – 1.84
Losers 20 (24) 0.92 0.48 – 1.76 0.91 0.47 – 1.74
Meniscal extrusions
Medial and/or lateral
Steadies 84 (17) 1 Reference 1 Reference
Gainers 12 (17) 0.98 0.50 – 1.92 0.98 0.49 – 1.96
Losers 10 (12) 0.67 0.32 – 1.39 0.71 0.33 – 1.50
N = number of knees with progression; aOR = adjusted odds ratio. Adjustments are made for baseline body mass index (kg/m2), mild knee symptoms, injury, Kellgren & Lawrence score (0 vs. 1), presence of MRI feature at baseline and randomized groups of the PROOF study.

70
explorative analysis
table 3 presents the progression rates for the weight change subgroups in the medial and lateral TF joint and the medial and lateral meniscus. Progression rates ranged from 4% for lateral meniscal extrusion to 21% for medial meniscal pathologies. Overall, pro-gression rates were highest in the medial TF joint and medial meniscus. Since absolute progression numbers per weight change group were low, no further analysis was per-formed to assess the effect of weight change on progression of medial and lateral MRI features.
DisCussiOn
summary
Three weight change subgroups within a high-risk group of middle-aged overweight and obese women without clinical and radiographic knee OA were analyzed for the effects on the progression of different OA MRI features. This study showed that weight change over 2.5 years, either gain or loss, did not have a statistically significant effect on the 2.5 years progression of different OA MRI features.
table 3. Progression of OA MRI features for the three weight change subgroups in the medial and lateral tibiofemoral (TF) joint and for the medial and lateral meniscus over 30 months
All Steadies Gainers Losers
N knees 640 488 70 82
Progression BMLs
Medial TF joint (%) 51 (8) 39 (8) 4(6) 8 (10)
Lateral TF joint (%) 37 (5) 29 (6) 3 (4) 5 (6)
Progression cartilage defects
Medial TF joint (%) 48 (6) 40 (8) 4 (6) 4 (5)
Lateral TF joint (%) 33 (5) 26 (5) 2 (3) 5 (6)
Progression osteophytes
Medial TF joint (%) 62 (10) 47 (10) 7 (10) 8 (10)
Lateral TF joint (%) 24 (5) 16 (3) 3 (4) 5 (6)
Progression meniscal pathologies
Medial 132 (21) 101 (21) 17 (24) 14 (17)
Lateral 67 (9) 56 (11) 4 (6) 7 (9)
Progression meniscal extrusions
Medial 92 (14) 73 (15) 12 (17) 7 (9)
Lateral 21 (4) 14 (3) 3 (4) 4 (5)

71
1
2
3
4
5
6
7
8
9
10
11
Context and comparison with existing literature
Although the women in the present study were free of clinical and radiographic knee OA, there was a substantial amount of baseline OA MRI features. High prevalence of structural features are also seen in other studies that evaluated high-risk populations28-31. In our study, a high prevalence of cartilage defects (39% in TF and 58% in PF) and menis-cal lesions (65% abnormalities and 50% extrusions) was found, which might be due to the overweight and obese participants (mean BMI 32.1kg/m2). The association between BMI and prevalence and severity of cartilage and meniscal lesions in pre-radiographic subjects have previously been shown by data of the OAI32-34. In addition, we also found a considerable amount of BMLs (prevalence of 31% in the TF joint and 49% in the PF joint). This might be related to the high prevalence of malalignment (38% varus alignment), as there is evidence for the association between increased mechanical loading by knee malalignment and incidence and progression of BMLs35. The prevalence and progres-sion rates of cartilage defects and BMLs in the present study were the highest in the PF joint. Although the TF joint is the joint most studied in OA research, the importance of the PF joint in OA research has already been shown in the early ’90s36 and more recently by the Framingham Osteoarthritis study 37. When assessing the medial and lateral com-partment separately, more progression was found in the medial compartment. This is likely attributable to varus malalignment and differences in load distribution; the high-est compressive loads during daily activity are transmitted to the medial compartments of the knee38 39.
With the use of LCGA, we were able to classify individuals into groups based on individual response patterns over time, yielding more reliable results than choosing subgroups based on self-selected groups17 19. Although estimated as the most appro-priate method, no significant effects of weight change were found, neither of weight loss nor of weight gain. The ‘steadies’ were intuitively chosen as reference group. When the ‘gainers’ were the reference, results did nog change, except for the progression of cartilage defects in the PF joint, showing a significant difference between ‘losers’ and ‘gainers’ (aOR 0.47, 95% CI 0.22 – 0.98, p-value 0.04). Due to the large number of analyses performed (16 tests), the probability of a type-I-error was increased and a Bonferroni correction resulted in a non-significant p-value. On the other hand, PF joint cartilage damage has been found to be associated with quadriceps weakness40. The women that reduced weight were possibly more active, resulting in increased quadriceps strength and less cartilage progression.
The absence of a preventive effect of weight loss might be due to the study popu-lation, which was overweight or obese for many years as demonstrated by the self-reported weight data at age 40. Since the ‘losers’ had a mean BMI of 27.1 ± 4.2 kg/m2 at age 40, high weight exposure time was at least ± 15 years. The effect of prolonged exposure to high BMI on development of knee OA has been previously described41. The

72
authors found that the risk on midlife knee OA was mostly influenced by the duration of exposure to high weight during adult life. The association between BMI and midlife knee OA in women was already detectable around adolescence. Although we found a mean weight loss of 9.0 ± 7.2 kg in the ‘losers’, they might be well beyond the possibil-ity of minimizing the articular damage by weight loss and disease processes might be ongoing. Weight loss can be helpful to prevent or reduce joint pain, but the prevention of structural knee OA might be more effective when weight loss is initiated at young adulthood or adolescence.
Studies that found preventive effects of weight loss on articular cartilage did not use LCGA to obtain objective weight change subgroups, but used a pre-defined percentage of weight loss as cut-off to generate two groups14 15. Besides, when the biochemical composition of the cartilage was assessed no conclusions could be drawn about later development of structural cartilage defects15. In previous data of the PROOF study, the effect of weight loss on radiographic knee OA was evaluated42. Also in this study the authors did not use LCGA. The authors suggested that a weight reduction of ≥ 5 kg or ≥ 5% body weight reduced the risk on incidence of Kellgren & Lawrence (K&L) grade ≥ 2 over 30 months. However, this result should be interpreted with caution as absolute numbers were low, which reduced statistical power. Moreover, no differences were found for the incidence of the clinical and radiographic ACR criteria nor for joint space narrowing (JSN).
Although counterintuitive, no significant detrimental effects were found of 2.5 years weight gain. This might be due to the high prevalence of baseline MRI features, leaving little room for more progression. However, it might be well possible that within a longer follow-up time, detrimental effects could have been found, which is also suggested when comparing our results with a recent study of the Osteoarthritis Initiative34. Weight gain over 4-years follow-up (mean 15.2% +/- 7.8%) in an overweighed population was associated with increased progression of cartilage, meniscal and bone marrow lesions compared to stable weight.
strengths and limitations
This study assessed weight changes on multiple OA MRI features in women without clinical and radiographic knee OA. Up to now, weight loss studies have mainly focused on cartilage 14 15. Weight gain has been studied on different structures, but as far as we know, osteophytes have never been included34. Also, this is the first study in OA research that used LCGA to obtain distinct and most objectively acquired subgroups of weight change in relation to structural progression.
This study has also some imitations. The lack of effect of weight loss and gain might be due to the small samples in these groups, reducing statistical power. Only in the case of PF cartilage defects and meniscal abnormalities, the ‘gainers’ and ‘losers showed

73
1
2
3
4
5
6
7
8
9
10
11
opposite effects, with higher ORs for ‘gainers’ and lower for ‘losers’. Larger studies are necessary to draw definite conclusions about these results.
Secondly, when using LCGA, the different subgroups have to fit well to the observed data. One might argue whether the obtained subgroups are representative of the dif-ferent weight change trajectories. However, the subgroups were obtained from a model with high goodness of fit indices19. Also, the participants had a probability of belonging to their particular subgroup of 90% or higher, which suggests that classification of the majority of the participants was correct.
Further, the original MOAKS scoring system has been developed for the assessment of disease status and the definition for change over time was not described in the original paper. We applied a recently proposed definition for the longitudinal change of the different MOAKS features, but it has not been validated yet against clinical and other structural outcomes27. However, it is the only available definition for longitudinal changes in MOAKS scores.
Certain grades of the structural features of MOAKS reflect a wide range of severity. For instance, grade 2 for size and thickness of cartilage loss is defined as 10-75% loss of the subregion26. As a result, within-grade progression may remain unnoticed when using the proposed progression definitions of MOAKS features.
Furthermore, our data showed that the prevalence of K&L 1, varus alignment , menis-cus extrusion, PF osteophytes and TF osteophytes was higher in the in the knees that were excluded from analyses, partly due to the exclusion of knees with K&L ≥ 2. Less healthy knees might benefit less from the original trial interventions, but since we cor-rected for these interventions, results will not have been influenced much.
Conclusion and implications
A high prevalence of OA MRI features is found in a high-risk group of middle-aged women, without clinical and radiographic knee OA. Neither 2.5 years weight loss nor weight gain influenced progression of different OA MRI features. The lack of a preventive effect of weight loss suggests that damage to the articular structures in this particular population is beyond salvation of weight loss. No detrimental effects of weight gain on progression of MRI features was found, which warrants further research with longer follow-up. The lack of any preventive effect of weight loss on MRI structures is concern-ing and emphasizes the importance of weight control throughout entire life, which may constitute a more effective primary prevention measurement for knee OA.
Key messagesThere is a high prevalence of OA MRI features in overweight and obese middle-aged women without clinical and radiographic knee OA.

74
Weight change at middle-age, either gain or loss, did not change progression of OA MRI features over a follow-up of 2.5 years.

75
1
2
3
4
5
6
7
8
9
10
11
reFerenCes
1. Caballero B. The global epidemic of obesity: an overview. Epidemiol Rev 2007; 29: 1-5. 2. WHO. Global status report on noncommunicable diseases, 2014. 3. Blagojevic M, Jinks C, Jeffery A, et al. Risk factors for onset of osteoarthritis of the knee in older
adults: a systematic review and meta-analysis. Osteoarthritis Cartilage 2010; 18(1): 24-33. 4. Reijman M, Pols HA, Bergink AP, et al. Body mass index associated with onset and progression of
osteoarthritis of the knee but not of the hip: the Rotterdam Study. Ann Rheum Dis 2007; 66(2): 158-62.
5. Felson DT, Lawrence RC, Dieppe PA, et al. Osteoarthritis: new insights. Part 1: the disease and its risk factors. Ann Intern Med 2000; 133(8): 635-46.
6. Bastick AN, Runhaar J, Belo JN, et al. Prognostic factors for progression of clinical osteoarthritis of the knee: a systematic review of observational studies. Arthritis Res Ther 2015; 17: 152.
7. Lehnert T, Sonntag D, Konnopka A, et al. Economic costs of overweight and obesity. Best Pract Res Clin Endocrinol Metab 2013; 27(2): 105-15.
8. Roos EM, Arden NK. Strategies for the prevention of knee osteoarthritis. Nat Rev Rheumatol 2015. 9. Christensen R, Bartels EM, Astrup A, et al. Effect of weight reduction in obese patients diagnosed
with knee osteoarthritis: a systematic review and meta-analysis. Ann Rheum Dis 2007; 66(4): 433-9.
10. Messier SP, Loeser RF, Miller GD, et al. Exercise and dietary weight loss in overweight and obese older adults with knee osteoarthritis: the Arthritis, Diet, and Activity Promotion Trial. Arthritis Rheum 2004; 50(5): 1501-10.
11. Hunter DJ, Beavers DP, Eckstein F, et al. The Intensive Diet and Exercise for Arthritis (IDEA) trial: 18-month radiographic and MRI outcomes. Osteoarthritis Cartilage 2015; 23(7): 1090-8.
12. Henriksen M, Christensen R, Hunter DJ, et al. Structural changes in the knee during weight loss maintenance after a significant weight loss in obese patients with osteoarthritis: a report of secondary outcome analyses from a randomized controlled trial. Osteoarthritis Cartilage 2014; 22(5): 639-46.
13. Gudbergsen H, Boesen M, Christensen R, et al. Changes in bone marrow lesions in response to weight-loss in obese knee osteoarthritis patients: a prospective cohort study. BMC Musculoskelet Disord 2013; 14: 106.
14. Anandacoomarasamy A, Leibman S, Smith G, et al. Weight loss in obese people has structure-modifying effects on medial but not on lateral knee articular cartilage. Ann Rheum Dis 2012; 71(1): 26-32.
15. Serebrakian AT, Poulos T, Liebl H, et al. Weight loss over 48 months is associated with reduced progression of cartilage T2 relaxation time values: Data from the osteoarthritis initiative. J Magn Reson Imaging 2015; 41(5): 1272-80.
16. Bliddal H, Leeds AR, Christensen R. Osteoarthritis, obesity and weight loss: evidence, hypotheses and horizons - a scoping review. Obes Rev 2014; 15(7): 578-86.
17. Jung T, Wickrama KAS. An Introduction to Latent Class Growth Analysis and Growth Mixture Modeling. Social and Personality Psychology Compass 2008; 2(1): 302-17.
18. Runhaar J, van Middelkoop M, Reijman M, et al. Prevention of knee osteoarthritis in overweight females; the first preventive randomized controlled trial in osteoarthritis. Am J Med 2015.
19. de Vos BC, Runhaar J, Verkleij SP, et al. Latent class growth analysis successfully identified sub-groups of participants during a weight loss intervention trial. J Clin Epidemiol 2014; 67(8): 947-51.

76
20. de Vos BC, Runhaar J, Bierma-Zeinstra SM. Effectiveness of a tailor-made weight loss intervention in primary care. Eur J Nutr 2014; 53(1): 95-104.
21. Altman R, Asch E, Bloch D, et al. Development of criteria for the classification and reporting of osteoarthritis. Classification of osteoarthritis of the knee. Diagnostic and Therapeutic Criteria Committee of the American Rheumatism Association. Arthritis Rheum 1986; 29(8): 1039-49.
22. Buckland-Wright JC, Wolfe F, Ward RJ, et al. Substantial superiority of semiflexed (MTP) views in knee osteoarthritis: a comparative radiographic study, without fluoroscopy, of standing ex-tended, semiflexed (MTP), and schuss views. J Rheumatol 1999; 26(12): 2664-74.
23. Kellgren JH, Lawrence JS. Radiological assessment of osteo-arthrosis. Ann Rheum Dis 1957; 16(4): 494-502.
24. Kraus VB, Vail TP, Worrell T, et al. A comparative assessment of alignment angle of the knee by radiographic and physical examination methods. Arthritis Rheum 2005; 52(6): 1730-5.
25. Brouwer GM, van Tol AW, Bergink AP, et al. Association between valgus and varus alignment and the development and progression of radiographic osteoarthritis of the knee. Arthritis Rheum 2007; 56(4): 1204-11.
26. Hunter DJ, Guermazi A, Lo GH, et al. Evolution of semi-quantitative whole joint assessment of knee OA: MOAKS (MRI Osteoarthritis Knee Score). Osteoarthritis Cartilage 2011; 19(8): 990-1002.
27. Runhaar J, Schiphof D, van Meer B, et al. How to define subregional osteoarthritis progression using semi-quantitative MRI Osteoarthritis Knee Score (MOAKS). Osteoarthritis Cartilage 2014; 22(10): 1533-6.
28. Sharma L, Chmiel JS, Almagor O, et al. Significance of preradiographic magnetic resonance imag-ing lesions in persons at increased risk of knee osteoarthritis. Arthritis Rheumatol 2014; 66(7): 1811-9.
29. Javaid MK, Lynch JA, Tolstykh I, et al. Pre-radiographic MRI findings are associated with onset of knee symptoms: the most study. Osteoarthritis Cartilage 2010; 18(3): 323-8.
30. Englund M, Guermazi A, Gale D, et al. Incidental meniscal findings on knee MRI in middle-aged and elderly persons. N Engl J Med 2008; 359(11): 1108-15.
31. Guermazi A, Niu J, Hayashi D, et al. Prevalence of abnormalities in knees detected by MRI in adults without knee osteoarthritis: population based observational study (Framingham Osteoarthritis Study). Bmj 2012; 345: e5339.
32. Laberge MA, Baum T, Virayavanich W, et al. Obesity increases the prevalence and severity of focal knee abnormalities diagnosed using 3T MRI in middle-aged subjects--data from the Osteoarthri-tis Initiative. Skeletal Radiol 2012; 41(6): 633-41.
33. Baum T, Joseph GB, Nardo L, et al. Correlation of magnetic resonance imaging-based knee carti-lage T2 measurements and focal knee lesions with body mass index: thirty-six-month followup data from a longitudinal, observational multicenter study. Arthritis Care Res (Hoboken) 2013; 65(1): 23-33.
34. Bucknor MD, Nardo L, Joseph GB, et al. Association of cartilage degeneration with four year weight gain--3T MRI data from the Osteoarthritis Initiative. Osteoarthritis Cartilage 2015; 23(4): 525-31.
35. Hayashi D, Englund M, Roemer FW, et al. Knee malalignment is associated with an increased risk for incident and enlarging bone marrow lesions in the more loaded compartments: the MOST study. Osteoarthritis Cartilage 2012; 20(11): 1227-33.
36. McAlindon TE, Snow S, Cooper C, et al. Radiographic patterns of osteoarthritis of the knee joint in the community: the importance of the patellofemoral joint. Ann Rheum Dis 1992; 51(7): 844-9.

77
1
2
3
4
5
6
7
8
9
10
11
37. Stefanik JJ, Niu J, Gross KD, et al. Using magnetic resonance imaging to determine the compart-mental prevalence of knee joint structural damage. Osteoarthritis Cartilage 2013; 21(5): 695-9.
38. Morrison JB. The mechanics of the knee joint in relation to normal walking. J Biomech 1970; 3(1): 51-61.
39. Mundermann A, Dyrby CO, D’Lima DD, et al. In vivo knee loading characteristics during activities of daily living as measured by an instrumented total knee replacement. J Orthop Res 2008; 26(9): 1167-72.
40. Stefanik JJ, Guermazi A, Zhu Y, et al. Quadriceps weakness, patella alta, and structural features of patellofemoral osteoarthritis. Arthritis Care Res (Hoboken) 2011; 63(10): 1391-7.
41. Wills AK, Black S, Cooper R, et al. Life course body mass index and risk of knee osteoarthritis at the age of 53 years: evidence from the 1946 British birth cohort study. Ann Rheum Dis 2012; 71(5): 655-60.
42. Runhaar J, de Vos BC, van Middelkoop M, et al. Moderate weight loss prevents incident knee osteoarthritis in overweight and obese females. Arthritis Care Res (Hoboken) 2016.


1
2
3
4
5
6
7
8
9
10
11
Chapter 6 The long-term effects of a randomized, controlled, tailor-made weight loss intervention in primary care on the health and lifestyle of overweight and obese women.
Bastiaan C. de VosJos RunhaarMarienke van MiddelkoopMarjolein KrulSita M.A. Bierma-Zeinstra
Am J Clin Nutr. 2016 Jul;104(1):33-40. doi: 10.3945/
ajcn.116.133512. Epub 2016 Jun 15.

80
aBstraCt
Background
Maintenance of weight loss after a diet and exercise intervention is often low. Moreover, short follow-up periods and high attrition rates often impede translation of study results to clinical practice.
Objectives
The present study evaluated the long-term effectivity of a randomized, tailor-made lifestyle intervention, consisting of diet and exercise, on the health and lifestyle of over-weight, middle-aged women in primary care.
Design
The intervention was part of a randomized controlled trial on the prevention of knee osteoarthritis (PROOF Study, ISRCTN 42823086). The intervention lasted for 2.5 years and consisted of visits to the dietician and participation in physical activity classes, supervised by a physiotherapist. The outcome of main interest of the present study was weight change in kilograms 6-7 years after randomization. Additionally, the intervention effect on change in physical activity was investigated.
results
After six months, weight loss was significantly higher in the intervention group (adjusted difference 1.34 kg, 95% CI: 0.46, 2.22). Over time, this difference decreased and became non-significant after 24 months. Per protocol analyses showed similar results. After six months, change in physical activity was significantly higher in the intervention group (15.2%, 95% CI: 28.6, 1.7). Over time, this difference increased up to 29.8% (95% CI: 2.3, 57.2) after 6.6 years of follow-up. Per protocol analyses showed no significant differences in change in physical activity.
Conclusions
A long lasting intervention effect on change in physical activity was found, which in-creased over time. For weight change, smaller differences were found, which decreased over time. In future research, greater intervention effects on weight change are expected when higher compliance rates can be reached. The present study provides important recommendations for future research.

81
1
2
3
4
5
6
7
8
9
10
11
intrODuCtiOn
In medicine, the elaborately investigated subject of weight loss in overweight and obese people often is accompanied by the reporting of a multitude of limitations and chal-lenges. Reviews report the current lack of long-term trials, making the true effects of weight loss interventions hard to determine 1-3. It is generally expected that a substantial portion of the study population often afterwards regains the weight, which was lost dur-ing the intervention 2 4. It was therefore recommended to extend the follow-up time, in order to ensure that the proportion of participants that regained their lost weight after the intervention ended is taken into account 3 5 6. In addition, high attrition rates are very often encountered in weight loss intervention studies 1 2 7. Consequently, the methods used for handling missing data are diverse and seen as an important cause of bias 8-10.
Several reviews have identified specialized interventions, such as bariatric surgery or pharmacologic therapy, as the most effective methods in achieving a significant amount of weight loss 2 11. However, when attempting to address the worldwide problem over-weight has become, an intervention needs to be large-scale applicable to the general population 12. Primary care is therefore regarded as an optimal setting for the prevention and management of overweight and obesity 13 14.
Interventions available for the general population in primary care settings mostly consist of a combination of diet and exercise 1 2 7. It has been shown that in order to achieve a clinically significant amount of weight loss over a relatively short period of time, intensive and restrictive diet and exercise schemes are most effective 7 11. However, more recently it has been suggested that a less restrictive and intensive intervention, making use of higher autonomous motivation, self-efficacy and flexible eating restraint, contribute to better maintenance of diet and exercise outcomes in the long term 15. Motivational interviewing is a method widely used by a variety of health care workers, which particularly focusses on obtaining long-term, sustainable changes in behavioral patterns 16 17. Based on manipulating intrinsic motivational patterns, motivational inter-viewing is identified as an effective method to contribute to long term maintenance of behavioral changes and, in particular, long term maintenance of weight loss and physi-cal activity 15. Moreover, it is recommended to tailor an intervention to specific targets per person, in contrast to dictating a strict, predetermined regime 15.
Efforts in determining whether diet or exercise contributes most to the success of weight loss interventions, often lead to inconclusive results 18 19. However, literature suggests that separate components of weight loss interventions, especially physical exercise, can in itself induce improvement of health outcomes without affecting actual body weight 1. Therefore, when attempting to improve the health of overweight and obese people, improved dietary habits or heightened physical activity can be goals in itself too.

82
The objective of the present study was to evaluate the long-term effectiveness of a tailor-made weight loss intervention, consisting of diet and exercise, based on motiva-tional interviewing, on the health and lifestyle of overweight and obese women.
methODs
PrOOF study
The present study evaluates the long-term effectiveness of a weight loss intervention that was part of a randomized controlled trial on the prevention of knee osteoarthritis (OA) 20. The short-term effectiveness has been published elsewhere 21. The PROOF study (Prevention of knee Osteoarthritis in Overweight Females), ISRCTN 42823086 (Interna-tional Standard Randomized Controlled Trial Number) received approval from the Medi-cal Ethics Committee of Erasmus University Medical Centre Rotterdam in 2005 and all participants provided informed consent. The preventive effects of a weight loss program and of oral glucosamine sulfate versus placebo on the incidence of knee osteoarthritis were investigated in a 2 x 2 factorial design with a follow-up time of 6.6 years. 1:1 block randomization was used, using block size 20 and for the weight loss intervention, the PROOF study was open labelled. A detailed description of the methods of the weight loss intervention has been published elsewhere 21. Below, methods will be described concisely. The present study focusses on the effectiveness of the diet and exercise in-tervention on health and lifestyle. No effects of glucosamine on these outcomes were expected or detected. Therefore, the glucosamine intervention will be disregarded in the present manuscript. This manuscript has been prepared according to the CONSORT Statement guidelines 22.
recruitment
All women between 50 and 60 years registered at the 50 general practitioners who cooperated with the study, received an information letter about the PROOF study and a reply card. All interested women with a self-reported body mass index (BMI) of 27 or higher received additional information about the purpose and the setting of the study. Inclusion criteria were: female gender, age 50-60 years, overweight (BMI ≥ 27), free of knee osteoarthritis according to the clinical American College of Rheumatology (ACR) criteria 23, free of contraindications to MRI, free of rheumatic diseases and not using oral glucosamine during the past six months. Exclusion criteria were: already consulted a physician, a physiotherapist or an alternative health provider for knee pain possibly in-dicating knee osteoarthritis, presence of radiologic signs indicating knee osteoarthritis (Kellgren Lawrence index 2 or more), not being able to communicate in the Dutch lan-
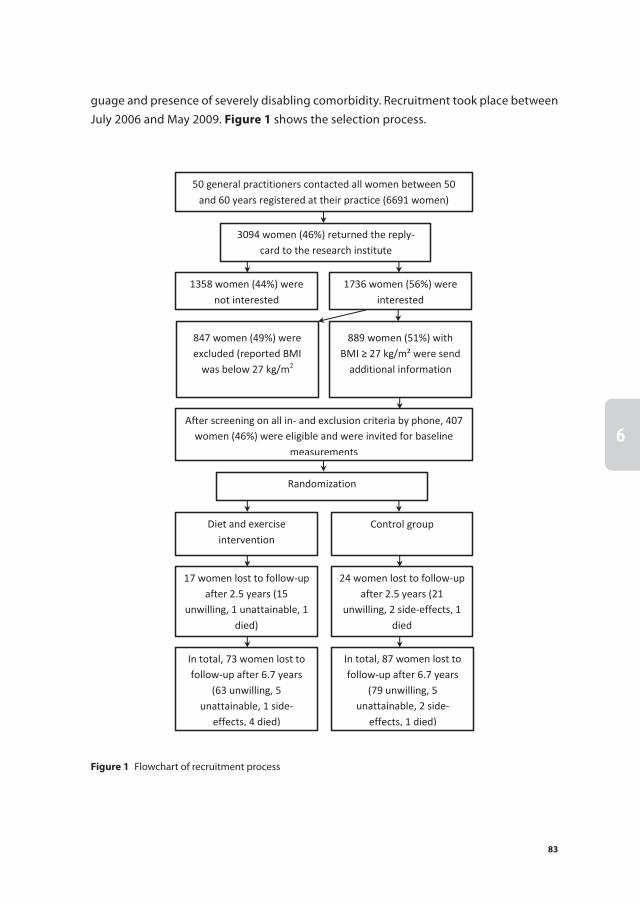
83
1
2
3
4
5
6
7
8
9
10
11
guage and presence of severely disabling comorbidity. Recruitment took place between July 2006 and May 2009. Figure 1 shows the selection process.
50 general practitioners contacted all women between 50 and 60 years registered at their practice (6691 women)
3094 women (46%) returned the reply-card to the research institute
1358 women (44%) were not interested
1736 women (56%) were interested
847 women (49%) were excluded (reported BMI
was below 27 kg/m2
889 women (51%) with BMI ≥ 27 kg/m² were send
additional information
After screening on all in- and exclusion criteria by phone, 407 women (46%) were eligible and were invited for baseline
measurements
Randomization
Diet and exercise intervention
Control group
17 women lost to follow-up after 2.5 years (15
unwilling, 1 unattainable, 1 died)
24 women lost to follow-up after 2.5 years (21
unwilling, 2 side-effects, 1 died
In total, 73 women lost to follow-up after 6.7 years
(63 unwilling, 5 unattainable, 1 side-
effects, 4 died)
In total, 87 women lost to follow-up after 6.7 years
(79 unwilling, 5 unattainable, 2 side-
effects, 1 died)
Figure 1 Flowchart of recruitment process

84
intervention
As stated above, details on the diet and exercise intervention are published elsewhere 21. In short, participants in the intervention group met with a dietician. After evaluating the current nutritional and physical activity habits, in mutual agreement goals were set, using motivational interviewing 16. These goals were individually tailored and concerned both diet and physical activity. The first three appointments were biweekly, after that the frequency of visits was determined by mutual agreement.
These meetings were limited to a total duration of four hours per calendar year. Additionally, participants were invited to attend 20 weekly physical activity classes, supervised by a physiotherapist. These classes served as an exploration of low-intensive sport activities, in order to find a sport the participants could enjoy and maintain until after the intervention. The dietician, the physiotherapist and the facilities to engage in sports were available close to the participants’ homes, in order to make the intervention more approachable and to stimulate mutual involvement between participants living in the same neighborhood. The dietician and physiotherapist sessions were free of charge for the participants. The intervention lasted for 2.5 years.
The participants in the control group did not receive an intervention, but were free to undertake any health promoting activities at their own initiative.
Questionnaires and measurements
At baseline, all participants filled out an extensive questionnaire recording baseline characteristics. For the first 2.5 years, all participants were home visited every six months by a research assistant to fill in a shorter questionnaire to assess compliance to the diet and exercise, physical activity level, nutritional habits, co-interventions, menopausal status, comorbidities and quality of life. Additionally, body weight was measured dur-ing these visits. In addition, skin folds were measured at baseline and after 2.5 years of follow-up. After 6.6 years, participants were visited once more for measurements and a questionnaire. In all questionnaires, quality of life was measured using the validated EQ-5D Euroqol questionnaire24 and physical activity was measured using the validated SQUASH questionnaire 25 26. Nutritional habits were measured using an adapted version of a validated questionnaire 27. Fat percentage was calculated with the formula by Lean et al 28. The physiotherapists kept record of attendance to the classes and the dieticians kept record of frequency of meetings and of the percentage of set goals the participants met, regarding both diet and exercise.
Outcome measures
For the present analysis, the outcome of main interest was weight change in kilograms, relative to participants’ baseline body weight, 6-7 years after randomization. Addition-ally, the proportion of participants that lost 5 kg or 5% of their baseline body weight

85
1
2
3
4
5
6
7
8
9
10
11
was examined. Evidence has shown this amount of weight loss to be associated with improvement of several health outcomes, including cardiovascular risk factors, glucose tolerability and hypertension 2 29-31. Secondary outcomes were change in physical activ-ity, change in nutritional habits, change in fat percentage and change in quality of life. These outcome measures were presented as percentage change relative to baseline measurement. Since the questionnaire used for nutritional habits did not allow calculat-ing a total caloric intake, separate components of this questionnaire were investigated, focusing mostly on snacks eaten per week.
statistical analyses
At set times, unadjusted differences in weight change between both groups were tested using 2-tailed independent t tests. Differences in categorical outcome measures were cal-culated using Fisher’s exact test. A linear mixed model estimated by restricted maximum likelihood was fitted to estimate adjusted differences in continuous outcomes between randomized groups. This method takes all available data into account instead of only cases that completed the study 8 9 32. The model included time in months as a random effect and a time by treatment interaction. This model was also used to test all baseline characteristics for confounding. Adjusted effect sizes (Cohen’s d) were calculated by dividing the adjusted difference in mean between both groups by the pooled standard deviation 33. The same analyses were performed for the predefined per-protocol analy-sis. For categorical outcome measures, Generalized Estimating Equations were used to estimate differences between randomized groups and to test for confounding. These models also included time in months and a time by treatment interaction.
Beforehand, it was clear that compliance would be difficult to determine, as a result of the tailor-made strategy, which included individually tailored goals. Therefore, we chose to determine a cutoff value in number of appointments with the dietician and number of attended physical activity classes at the point where dichotomizing resulted in the largest difference in effect on weight loss between the two resulting groups. This approach resulted in a definition of compliance of attendance of ≥ 6 dietician visits and ≥ 7 physical activity classes. For the per protocol analyses, these participants were compared to all participants in the control group.
In order to characterize the participants that completed the study and to compare them to the participants that did not complete the study, logistic regression analysis was used to identify factors that increased the likelihood to complete the follow-up time of 6.6 years. First, univariate logistic regression analysis was used to identify possible fac-tors. All baseline characteristics were tested respectively. Second, multivariate logistic regression analysis was used, including all factors with a P-value < 0.1 in the univariate regression analyses, to identify factors with a significant association with completing the

86
follow-up time of 6.6 years. These factors were presented as odds ratios (OR) with 95% confidence intervals (CI).
A ≤5% significance level for testing was used for all analyses. Descriptive analyses were performed using SPSS PASW statistics version 21 (SPSS Inc., Chicago, IL). All other analyses were performed using R Statistical Software version 3.2.3 (R Foundation for Statistical Computing, Vienna, Austria).34
results
A detailed description of the selection process is published elsewhere 21. In short, 6691 women were contacted by their general practitioners, of which eventually 407 were randomized. Figure 1 shows the selection process. Of the randomized women, 35% was overweight (BMI 25 – 29.9 kg/m²), while 6% met class III obesity (BMI ≥ 40 kg/m²). Mean age was 55.7 years and mean BMI was 32.4 kg/m². Baseline characteristics per random-ized group are presented in table 1. Smoking status was the only variable that showed a significant difference between the randomized groups (23% in the control group versus
table 1 Baseline characteristics in Mean (SD) or proportion among randomized groups
Control group Intervention group
(n=204) (n=203)
Obesity (kg/m²)
BMI 25-29.9 33% 36%
BMI 30-34.9 42% 44%
BMI 35-39.9 18% 15%
BMI ≥ 40 7% 5%
Age (years) 55.7 (3.2) 55.7 (3.2)
Body weight (kg) 89.2 (13.6) 88.2 (12.9)
BMI (kg/m²) 32.5 (4.5) 32.2 (4.1)
Fat percentage (%)¹ 43.9 (5.5) 43.6 (5.0)
Abdominal circumference (cm) 106.3 (9.8) 105.5 (9.4)
Approximate body weight one year before study (kg) 86.3 (14.6) 85.7 (14.5)
Approximate body weight around 40th year of age (kg) 75.7 (11.8) 74.4 (13.5)
Ethnicity
European/North American 93% 94%
South American 1% 1%
African 1% 1%
Asian 1% 1%
Other 5% 2%

87
1
2
3
4
5
6
7
8
9
10
11
13% in the intervention group, p=0.014). However, smoking status had no association with any of the outcome measures, so no adjustment was performed. All other baseline characteristics showed no significant difference between the groups, so no adjustment for confounders was made in the linear mixed model.
Follow-up
After 2.5 years, 10.1% of the participants were lost to follow-up. After 6.6 years, 247 participants (60.7%) agreed to additional measurements and questionnaire. Reasons for lost to follow-up are mentioned in Figure 1. No significant difference in attrition rate was found between the randomized groups. In univariate analyses, nine baseline characteristics were associated with completing the follow-up time of 6.6 years. The majority of these associations were in favor of the completers. On average, this group had a lower incidence of hypertension, lower baseline body weight and BMI, lower fat percentage, lower proportion of participants with an active smoking status, higher social participation, higher physical activity level, lower blood HbA1c, but higher blood
table 1 Baseline characteristics in Mean (SD) or proportion among randomized groups (continued)
Control group Intervention group
(n=204) (n=203)
Educational level
Low 35% 32%
Medium 62% 66%
High 3% 2%
Postmenopausal status² 71% 69%
Comorbidity³ 34% 34%
Active smoking status 23% 13%4
Quality of life (range 0-1) 5 0.89 (0.1) 0.89 (0.1)
Social participation6 9.0 (2.2) 9.1 (2.1)
Physical activity 7 7136 (3785) 6556 (3522)
Blood HbA1C (mmol/L) 5.8 (0.7) 5.8 (0.8)
Blood total cholesterol (mmol/L) 6.1 (1.2) 6.0 (1.1)
Snacks consumed per week 10.0 (0.8) 9.4 (0.8)
Hypertension8 74.3% 68.4%
1 Fat percentage calculated with formula by Lean et al. (28)2 Postmenopausal status defined as ≥ one year since last menstruation3 Comorbidity defined as ≥1 condition currently under treatment4 P=0.014 (Fisher’s exact test)5 Quality of life measured with validated Dutch Euroqol questionnaire(24)6 Social participation defined as hours per week spent on paid/voluntary/household work or studying7 Physical activity measured with validated SQUASH questionnaire(25, 26)8 Hypertension defined as a systolic blood pressure > 130 mmHg or a diastolic blood pressure > 90 mmHg

88
total cholesterol. In addition, more participants in the group completers were compliant to the diet and exercise intervention. In a multivariate analysis, hypertension, HbA1c and blood total cholesterol were associated with completing the follow-up time. Re-spectively, odds ratios and 95% confidence intervals for these variables were: 0.61 (0.37, 0.99), 0.72 (0.52, 0.99), 1.25 (1.03, 1.52).
Compliance rates
As a result of the study design, which described a tailor-made weight loss intervention, the participation rates of visits to the dietician and attendance to the physical activity classes varied widely. 11% of participants randomized to the intervention, never visited the dietician, while 51% visited the dietician at least six times. 21% of the participants randomized to the intervention, did not attend any of the physical activity classes. 57% of these participants attended at least seven classes. 32% of the participants in the intervention group complied with both criteria and were considered compliant to the intervention.
intervention effects
After 6.6 years of follow-up, 51% of all women with available follow-up data had a body weight below their baseline body weight, while 19% were 5 kg or 5% below their baseline body weight. The intervention group lost significantly more weight than the control group at six and twelve months of follow-up. Thereafter, no significant unad-justed differences were found between both groups, although a trend was seen that in the long term, the intervention group, on average, maintained a body weight below their baseline weight, whereas the control group, on average, exceeded their baseline weight. The proportion of participants that lost 5 kg or 5% of their baseline body weight was significantly different between both groups only at six months of follow-up, in favor of the intervention group. Figure 2 shows the trajectories of weight loss over time for both groups and the proportions of participants that reached the 5 kg/5 % goal. Physical activity was significantly higher in the intervention group than in the control group at all of the measurement time points, except at 12 months after randomization. Figure 3 shows the change in physical activity over time for the randomized groups. Adjusted differences at set times showed a decreasing intervention effect over time on weight change, a significant difference in losing 5 kg or 5% baseline weight in favor of the intervention group before 24 months, but in favor of the control group after 24 months. An increasing intervention effect over time was found on change in physical activity. table 2 shows the adjusted differences in weight change over time. table 3 shows the adjusted differences in physical activity over time.

89
1
2
3
4
5
6
7
8
9
10
11
-3
-2
-1
0
1
2
3
4
-30
-20
-10
0
10
20
30
40W
eigh
t cha
nge,
kg
(line
s)
Perc
enta
ge th
at lo
st 5
kg
or 5
% o
f the
ir ba
selin
e bo
dy w
eigh
t (ba
rs)
Time, months
Control groupIntervention group
*
40
30
20
10
0
4
3
2
1
0
-1
-2
-3
6 12 18 24 30
Figure 2 Weight change presented as means ± SEM, proportion of participants that lost 5 kg or 5% base-line weight presented in percentages, n= 407* Significant unadjusted difference in weight change and in proportion of participants that lost 5 kg or 5% baseline weight (P<0.05), calculated using Student’s T-test and Fisher’s exact test, respectively† Significant difference in weight change only (P<0.05), calculated using Student’s T-test
-20
-10
0
10
20
30
40
50
Rela
tive
chan
ge in
phy
sical
act
ivity
from
bas
elin
e, %
Time, months
Control group
Intervention group
6 12 18 24 30 80
*
*
* * *
Figure 3 Change in physical activity from baseline, measured using SQUASH questionnaire, presented as means ± SEM, n = 407* Significant unadjusted difference at set time point: P<0.05, calculated using Fisher’s exact test† No significant difference, but trend: P<0.1, calculated using Fisher’s exact test

90
table 2 Estimated differences in weight change between randomized groups at set times
Weight change (kg) Proportion that lost 5 kg or 5% (%)
Difference 95% CI Effect size1 OR 95% CI Effect size1
intention to treat analysis
6 months 1.34 0.46, 2.22 0.22 2.10 1.30, 3.35 0.22
12 months 1.22 0.35, 2.09 0.20 1.62 1.14, 2.31 0.20
18 months 1.11 0.22, 1.99 0.18 1.26 0.96, 1.65 0.13
24 months 0.99 0.07, 1.91 0.16 0.98 0.75, 1.27 -0.01
30 months 0.87 -0.10, 1.84 0.13 0.76 0.54, 1.06 -0.12
80 months -0.11 -2.00, 1.77 -0.01 0.59 0.37, 0.92 -0.21
Per protocol analysis
6 months 2.18 0.93, 3.43 0.25 3.90 2.19, 6.89 0.34
12 months 2.08 0.85, 3.31 0.24 2.70 1.77, 4.14 0.34
18 months 1.98 0.73, 3.23 0.23 1.87 1.34, 2.60 0.28
24 months 1.88 0.58, 3.18 0.22 1.29 0.92, 1.83 0.11
30 months 1.78 0.40, 3.16 0.19 0.90 0.57, 1.42 -0.04
80 months 0.95 -1.76, 3.66 0.06 0.62 0.34, 0.87 -0.141Effect size presented as Cohen’s D: adjusted mean difference divided by the pooled standard deviation.Differences in weight change were estimated using a linear mixed model with treatment, time in months and a treatment by time interaction as independent variables. Odds ratios were calculated with General-ized Estimating Equations with the same independent variables.
table 3 Estimated differences in physical activity between randomized groups at set times
Change in physical activity1 (%)
Difference 95% CI Effect size2
intention to treat analysis
6 months 15.15 1.65, 28.64 0.16
12 months 16.33 2.83, 29.84 0.17
18 months 17.52 3.70, 31.33 0.19
24 months 18.70 4.30, 33.10 0.19
30 months 19.89 4.66, 35.11 0.19
80 months 29.76 2.32, 57.19 0.19
Per protocol analysis
6 months 6.20 7.83, 20.24 0.06
12 months 6.84 6.80, 20.48 0.07
18 months 7.48 5.94, 20.90 0.08
24 months 8.11 5.28, 21.50 0.09
30 months 8.75 4.80, 22.30 0.09
80 months 14.05 6.40, 34.51 0.121 Measured using the SQUASH questionnaire (25, 26), in percentage change relative to baseline measure-ment2Effect size presented as Cohen’s D: adjusted mean difference divided by the pooled standard deviation.Differences were estimated using a linear mixed model with treatment, time in months and a treatment by time interaction as independent variables.

91
1
2
3
4
5
6
7
8
9
10
11
Per protocol analyses showed greater effects on weight change over time, but the changes in physical activity were not significant in the per protocol analyses. None of the other outcome measures showed significant differences between the randomized groups.
DisCussiOn
The present study provides evidence that a tailor-made weight loss intervention con-tributes to long-term behavioral changes. Physical activity was significantly higher in the intervention group until the end of follow-up time. Weight loss was overall higher in the intervention group, but no significant difference was found at the end of follow-up.
Analyses showed that the group of participants that completed the study was in fact a selective group with more favorable health parameters. This indicates that the group ‘completers’ was a healthier group, making it possibly easier for them to lose weight. This could have resulted in overestimation of the intervention effect, especially the long-term effect, since the time interval between 2.5 years and 6.6 years only contained these participants. However, the association of total cholesterol was different in direction than hypertension and HbA1c, making it less obvious this group was in fact significantly healthier than the other. Moreover, the linear mixed model was fitted using all data available, instead of only data from completers. Using this method, overestimation of the intervention effect due to the fact that the ‘completers’ might have been a healthier group, is less likely to have occurred.
A pragmatic approach with a tailor-made intervention was chosen for this interven-tion, in contrast to many weight loss interventions that describe strict regimes for diet and exercise. This choice was made because of implementation reasons and because high compliance rates and low attrition rates were expected as a result of this method 7 11. Moreover, it was expected that this approach was more likely to induce long-term maintenance of weight loss. Attrition rates were indeed low in the first 2.5 years. How-ever, for the last measurement just 60.7% of the participants were available. Since very few to none weight loss interventions in literature present a follow-up time beyond 30 months, we cannot compare this rate to others 3 7.
Compliance rates were comparable to those of many weight loss and lifestyle inter-ventions 35. Seemingly, the pragmatic approach of the present study, using motivational interviewing and a tailor-made intervention, has not led to higher adherence to the intervention. A possible explanation for these disappointing figures is the fact the study population was already highly motivated to lose weight; at baseline, 88% of all participants indicated to prefer being randomized to the intervention group. Possibly

92
motivational interviewing has more success increasing compliance rates in a less moti-vated population.
Due to ethical reasons, the control group was free to undertake any measures to re-duce weight on their own. Naturally, all participants were informed of the higher risk of knee osteoarthritis due to their overweight and the possible preventive effect of weight loss, which was the main objective of the PROOF study. The mean weight changes over time in the control group were not as expected. The first 30 months mean weight change fluctuated, but at 2.5 and at 6.6 years, mean weight changes were close to zero. Fildes et al. showed that the probability of an overweight or obese person to remain stable in weight over time is low 36. We expected the control group to gain weight steadily over time. In addition, there was a substantial proportion of participants in the control group that reached the goal of losing 5 kg or 5% of their baseline weight, up to 22% at 6.6 years of follow-up. It is likely that participation in this study has influenced weight course over time positively in the control group and consequently caused underestimation of the intervention effect.
Despite the low compliance rates in the intervention group and the relatively high weight loss in the control group, significant differences in weight change were observ-able and for change in physical activity, this effect lasted for the total follow-up time and even increased over time. The magnitude of these effects are comparable to those of many lifestyle interventions with considerably shorter follow-up periods 2 3 7. Moreover, per protocol analyses showed greater intervention effects on weight change, confirm-ing the efficacy of the intervention. Because of the lack of weight loss studies reporting on a follow-up period of more than 30 months, we cannot compare this effect with other studies.
Regarding secondary outcome measures, only change in physical activity showed a significant intervention effect. It is remarkable that mean physical activity in the in-tervention group rose 28% in the first six months pertaining to the baseline physical activity, before remaining quite stable at that level, while the control group remained quite stable until 2.5 years, before declining to –13% at 6.6 years. This shows that the intervention had its effect on physical activity in the first six months, which endured for the subsequent six years, resulting in a difference at 6.6 years which was still significant. Additionally, the estimated differences at set times show an increasing intervention ef-fect over time on change in physical activity. However, in the per protocol analysis we did not find a significant intervention effect on physical activity level. This indicates the participants that were randomized to the intervention became on average more physi-cally active, but this was not due to their visits to the dietician or the physical activity classes. No intervention effect was found on nutritional habits. However, only separate components of the questionnaire assessing nutritional habits could be assessed, since no total caloric intake could be calculated from the results. In conclusion, this study de-

93
1
2
3
4
5
6
7
8
9
10
11
scribes the effectiveness of a tailor-made weight loss intervention conducted in primary care with a follow-up period of 6.6 years. A long lasting intervention effect on change in physical activity was seen over this period of time. Differences in weight change were small, and not significant after 24 months, but the literature suggests an increase in physical activity alone can also improve health outcomes, without affecting actual body weight 1. Since this intervention was especially aimed at long-term maintenance of lifestyle changes, it can be considered effective and provides proof that a tailor-made weight loss intervention can, in fact, induce lifestyle changes which endure over a long period of time.
Recommendations for future research include long follow-up periods, including post-intervention follow-up, in order to make comparison between long-term weight loss maintenance figures possible. In addition, motivational interviewing seems effective in promoting long-term behavioral changes, but careful considerations should be made regarding the specific approach of the intervention 13 14. In the present study, the inter-vention effect found on physical activity could not be attributed to compliance to the intervention. This warrants more research regarding the most effective approach and, more specifically, the most optimal setting to deliver the intervention. Unfortunately, to-tal caloric intake could not be calculated in the present study, impeding the possibilities of assessing intervention effects on dietary intake and habits. Future research should thoroughly investigate possibilities to measure these parameters reliably. Since the per protocol analyses showed greater effects on weight change than the intention to treat analyses, it is expected that higher compliance rates could result in greater effects. Therefore, optimizing compliance rates should be given high priority in future studies.

94
reFerenCes
1. Shaw K, Gennat H, O’Rourke P, et al. Exercise for overweight or obesity. Cochrane Db Syst Rev 2006(4).
2. Douketis JD, Macie C, Thabane L, et al. Systematic review of long-term weight loss studies in obese adults: clinical significance and applicability to clinical practice. Int J Obesity 2005; 29(10): 1153-67.
3. Booth HP, Prevost TA, Wright AJ, et al. Effectiveness of behavioural weight loss interventions delivered in a primary care setting: a systematic review and meta-analysis. Fam Pract 2014; 31(6): 643-53.
4. Barte JCM, ter Bogt NCW, Bogers RP, et al. Maintenance of weight loss after lifestyle interventions for overweight and obesity, a systematic review. Obes Rev 2010; 11(12): 899-906.
5. Holzapfel C, Cresswell L, Ahern AL, et al. The challenge of a 2-year follow-up after intervention for weight loss in primary care. Int J Obesity 2014; 38(6): 806-11.
6. Mastellos N, Gunn LH, Felix LM, et al. Transtheoretical model stages of change for dietary and physical exercise modification in weight loss management for overweight and obese adults. Cochrane Db Syst Rev 2014(2).
7. Wadden TA, Butryn ML, Hong PS, et al. Behavioral Treatment of Obesity in Patients Encountered in Primary Care Settings A Systematic Review. Jama-J Am Med Assoc 2014; 312(17): 1779-91.
8. Batterham MJ, Tapsell LC, Charlton KE. Analyzing weight loss intervention studies with missing data: Which methods should be used? Nutrition 2013; 29(7-8): 1024-29.
9. Elobeid MA, Padilla MA, McVie T, et al. Missing Data in Randomized Clinical Trials for Weight Loss: Scope of the Problem, State of the Field, and Performance of Statistical Methods. Plos One 2009; 4(8).
10. Hartmann-Boyce J, Johns DJ, Jebb SA, et al. Behavioural weight management programmes for adults assessed by trials conducted in everyday contexts: systematic review and meta-analysis. Obes Rev 2014; 15(11): 920-32.
11. LeBlanc ES, O’Connor E, Whitlock EP, et al. Effectiveness of Primary Care-Relevant Treatments for Obesity in Adults: A Systematic Evidence Review for the US Preventive Services Task Force. Ann Intern Med 2011; 155(7): 434-U71.
12. Flegal KM, Carroll MD, Kit BK, et al. Prevalence of Obesity and Trends in the Distribution of Body Mass Index Among US Adults, 1999-2010. Jama-J Am Med Assoc 2012; 307(5): 491-97.
13. Moyer VA, Force UPST. Screening for and Management of Obesity in Adults: US Preventive Ser-vices Task Force Recommendation Statement. Ann Intern Med 2012; 157(5): 373-U126.
14. Dietz WH, Baur LA, Hall K, et al. Management of obesity: improvement of health-care training and systems for prevention and care. Lancet 2015; 385(9986): 2521-33.
15. Teixeira PJ, Carraca EV, Marques MM, et al. Successful behavior change in obesity interventions in adults: a systematic review of self-regulation mediators. Bmc Med 2015; 13.
16. Rubak S, Sandboek A, Lauritzen T, et al. Motivational interviewing: a systematic review and meta-analysis. Brit J Gen Pract 2005; 55(513): 305-12.
17. Teixeira PJ, Silva MN, Coutinho SR, et al. Mediators of Weight Loss and Weight Loss Maintenance in Middle-aged Women. Obesity 2010; 18(4): 725-35.
18. Hartmann-Boyce J, Johns DJ, Jebb SA, et al. Effect of behavioural techniques and delivery mode on effectiveness of weight management: systematic review, meta-analysis and meta-regression. Obes Rev 2014; 15(7): 598-609.

95
1
2
3
4
5
6
7
8
9
10
11
19. Johns DJ, Hartmann-Boyce J, Jebb SA, et al. Diet or Exercise Interventions vs Combined Behavioral Weight Management Programs: A Systematic Review and Meta-Analysis of Direct Comparisons. J Acad Nutr Diet 2014; 114(10): 1557-68.
20. Runhaar J, van Middelkoop M, Reijman M, et al. Prevention of Knee Osteoarthritis in Overweight Females: The First Preventive Randomized Controlled Trial in Osteoarthritis. Am J Med 2015; 128(8): 888-+.
21. de Vos BC, Runhaar J, Bierma-Zeinstra SMA. Effectiveness of a tailor-made weight loss interven-tion in primary care. Eur J Nutr 2014; 53(1): 95-104.
22. Schulz KF, Altman DG, Moher D, et al. CONSORT 2010 Statement: Updated Guidelines for Report-ing Parallel Group Randomized Trials. Ann Intern Med 2010; 152(11): 726-W293.
23. Altman R, Asch E, Bloch D, et al. Development of Criteria for the Classification and Reporting of Osteoarthritis - Classification of Osteoarthritis of the Knee. Arthritis Rheum-Us 1986; 29(8): 1039-49.
24. Xie F, Gaebel K, Perampaladas K, et al. Comparing EQ-5D Valuation Studies: A Systematic Review and Methodological Reporting Checklist. Med Decis Making 2014; 34(1): 8-20.
25. Wendel-Vos GCW, Schuit AJ, Saris WHM, et al. Reproducibility and relative validity of the Short Questionnaire to Assess Health-enhancing physical activity. J Clin Epidemiol 2003; 56(12): 1163-69.
26. de Hollander EL, Zwart L, de Vries SI, et al. The SQUASH was a more valid tool than the OBiN for categorizing adults according to the Dutch physical activity and the combined guideline. J Clin Epidemiol 2012; 65(1): 73-81.
27. van Assema P, Brug J, Ronda G, et al. The relative validity of a short Dutch questionnaire as a means to categorize adults and adolescents to total and saturated fat intake. J Hum Nutr Diet 2001; 14(5): 377-90.
28. Lean MEJ, Han TS, Deurenberg P. Predicting body composition by densitometry from simple anthropometric measurements. Am J Clin Nutr 1996; 63(1): 4-14.
29. Knowler WC, Barrett-Connor E, Fowler SE, et al. Reduction in the incidence of type 2 diabetes with lifestyle intervention or metformin. New Engl J Med 2002; 346(6): 393-403.
30. Neter JE, Stam BE, Kok FJ, et al. Influence of weight reduction on blood pressure - A meta-analysis of randomized controlled trials. Hypertension 2003; 42(5): 878-84.
31. Wing RR, Bahnson JL, Bray GA, et al. Long-term Effects of a Lifestyle Intervention on Weight and Cardiovascular Risk Factors in Individuals With Type 2 Diabetes Mellitus Four-Year Results of the Look AHEAD Trial. Arch Intern Med 2010; 170(17): 1566-75.
32. Dallal RM, Quebbemann BB, Hunt LH, et al. Analysis of Weight Loss After Bariatric Surgery Using Mixed-Effects Linear Modeling. Obes Surg 2009; 19(6): 732-37.
33. Cohen J. Statistical Power Analysis for the Behavioral-Sciences - Cohen,J. Percept Motor Skill 1988; 67(3): 1007-07.
34. Team RDC. R: A language and environment for statistical computing. R Foundation for Statistical Computing, Vienna, Austria 2008; isBn 3-900051-07-0.
35. Fappa E, Yannakoulia M, Pitsavos C, et al. Lifestyle intervention in the management of metabolic syndrome: could we improve adherence issues? Nutrition 2008; 24(3): 286-91.
36. Fildes A, Charlton J, Rudisill C, et al. Probability of an Obese Person Attaining Normal Body Weight: Cohort Study Using Electronic Health Records. Am J Public Health 2015; 105(9): E54-E59.


1
2
3
4
5
6
7
8
9
10
11
Chapter 7 The long-term effects of a tailor-made lifestyle intervention and of oral glucosamine sulfate in primary care on incident knee OA in overweight and obese women.
Bastiaan C. de VosMarieke L.A. LandsmeerMarienke van MiddelkoopEdwin H.G. OeiMarjolein KrulSita M.A. Bierma-ZeinstraJos Runhaar
Submitted

98
aBstraCt
Background
The present study aimed to evaluate the effect of a lifestyle intervention aimed to re-duce body weight and of oral glucosamine sulfate on the incidence of knee OA after 6 - 7 years in a population of middle-aged, overweight women, without knee OA at baseline.
methods and Findings
The PROOF study (PRevention of knee Osteoarthritis in Overweight Females, ISRCTN 42823086) was a randomized controlled trial with a 2 x 2 factorial design. 407 women aged 50 - 60 years with a BMI of ≥27 kg/m² and free of knee osteoarthritis were ran-domized. 477 knees from 245 participants were available after a mean follow-up time of 6.6 years. 19% of all knees showed incident knee OA. Both interventions showed no significant preventive effect on incident knee OA. Despite the fact per protocol analyses showed greater differences between both groups for the lifestyle intervention, signifi-cance was not reached. A significant effect of losing ≥ 5 kg or ≥ 5% of baseline weight in the first 12 months on the incidence of knee OA according to the primary outcome was found (OR 0.10; 95% CI, 0.02-0.41).
Conclusions
No significant preventive effect on incident knee OA of either the lifestyle intervention or the glucosamine intervention was found. As a proof of concept, the preventive effect of moderate weight loss in one year on the incidence of clinical knee OA is demonstrated. This trial provides important insights for future studies on the prevention of knee OA, which are currently lacking.

99
1
2
3
4
5
6
7
8
9
10
11
intrODuCtiOn
The association between obesity and knee osteoarthritis (OA) has been extensively described in literature.1 The majority of these studies have focussed on obesity as a risk factor or weight loss as a treatment for knee OA in individuals with obesity.1-4 Consider-ing the increasing body of evidence stating that obesity is an important risk factor for knee OA, the options of primary prevention by weight loss should be investigated.5 As early as 1992, results from The Framingham Study suggested a preventive approach to knee OA by weight loss.6 Thereafter, few trials were specifically designed to study the preventive effect of weight loss on knee OA, despite recommendations in literature to design preventive trials.6-9 Recent results of trials investigating the effect of weight loss on intermediate outcomes, such as cartilage thickness or chronic pain, 10 11 support the hypothesis that weight loss can prevent the development of knee OA, as suggested by Felson et al. in 1992.6 Recommendations made in literature regarding the design of a trial investigating the preventive effect of weight loss on knee OA often include: a random-ized design, a high-risk population of overweight, middle-aged participants without knee OA, a long follow-up period and clinical and radiographic outcome measures.6-9 12
In addition, recommendations have been made to study the efficacy of pharmaco-logical substances, such as glucosamine.13 A large review found an overall significant beneficial effect of glucosamine on pain and function of the knee in participants with established knee OA.14 However, the heterogeneity of the included studies was very high. In fact, pooled results from high quality studies failed to show a significant effect of glucosamine.14 Literature suggests that in patients in an earlier stage of disease, larger effects could be found.15 Furthermore, glucosamine has been shown to modify disease progression, raising the question whether it would be more effective as a preventive in-tervention rather than as a treatment.5 15 The above mentioned review found the safety of glucosamine to be equal to placebo, making a trial investigating the preventive effect of glucosamine on the development of knee OA feasible.14
The objective of the present study was to evaluate the long-term effectiveness of a tailor-made weight loss intervention, using diet and exercise, and of oral glucosamine on the incidence of knee OA in a high risk population of overweight, middle aged women without knee OA at baseline. Previously, short-term results of the trial were published, showing no significant preventive intervention effects on knee OA.16 17 It was hypoth-esized that prolonging the follow-up time could possible result in greater effects. The present study focusses on the long-term effectiveness 6-7 years after randomization.
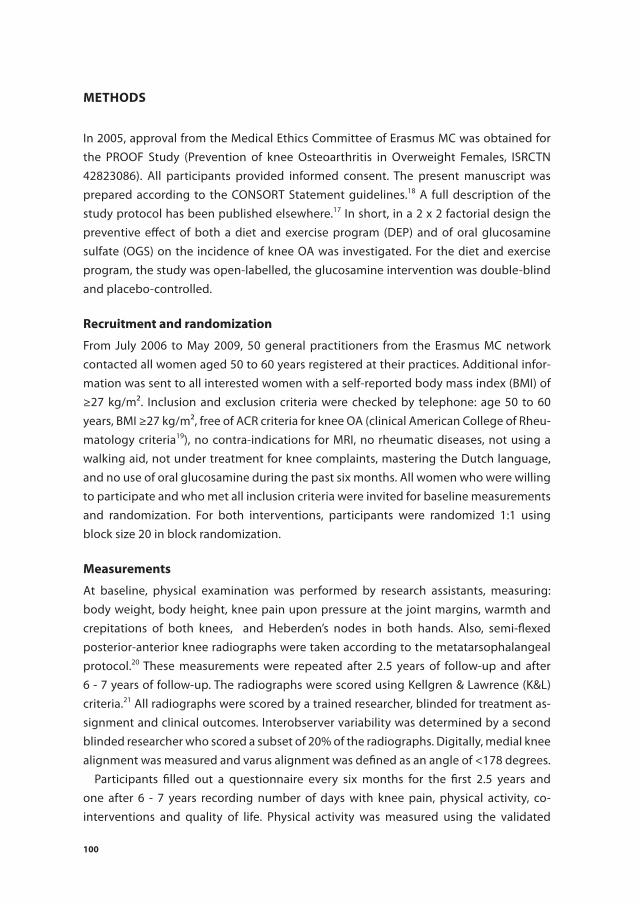
100
methODs
In 2005, approval from the Medical Ethics Committee of Erasmus MC was obtained for the PROOF Study (Prevention of knee Osteoarthritis in Overweight Females, ISRCTN 42823086). All participants provided informed consent. The present manuscript was prepared according to the CONSORT Statement guidelines.18 A full description of the study protocol has been published elsewhere.17 In short, in a 2 x 2 factorial design the preventive effect of both a diet and exercise program (DEP) and of oral glucosamine sulfate (OGS) on the incidence of knee OA was investigated. For the diet and exercise program, the study was open-labelled, the glucosamine intervention was double-blind and placebo-controlled.
recruitment and randomization
From July 2006 to May 2009, 50 general practitioners from the Erasmus MC network contacted all women aged 50 to 60 years registered at their practices. Additional infor-mation was sent to all interested women with a self-reported body mass index (BMI) of ≥27 kg/m². Inclusion and exclusion criteria were checked by telephone: age 50 to 60 years, BMI ≥27 kg/m², free of ACR criteria for knee OA (clinical American College of Rheu-matology criteria19), no contra-indications for MRI, no rheumatic diseases, not using a walking aid, not under treatment for knee complaints, mastering the Dutch language, and no use of oral glucosamine during the past six months. All women who were willing to participate and who met all inclusion criteria were invited for baseline measurements and randomization. For both interventions, participants were randomized 1:1 using block size 20 in block randomization.
measurements
At baseline, physical examination was performed by research assistants, measuring: body weight, body height, knee pain upon pressure at the joint margins, warmth and crepitations of both knees, and Heberden’s nodes in both hands. Also, semi-flexed posterior-anterior knee radiographs were taken according to the metatarsophalangeal protocol.20 These measurements were repeated after 2.5 years of follow-up and after 6 - 7 years of follow-up. The radiographs were scored using Kellgren & Lawrence (K&L) criteria.21 All radiographs were scored by a trained researcher, blinded for treatment as-signment and clinical outcomes. Interobserver variability was determined by a second blinded researcher who scored a subset of 20% of the radiographs. Digitally, medial knee alignment was measured and varus alignment was defined as an angle of <178 degrees.
Participants filled out a questionnaire every six months for the first 2.5 years and one after 6 - 7 years recording number of days with knee pain, physical activity, co-interventions and quality of life. Physical activity was measured using the validated

101
1
2
3
4
5
6
7
8
9
10
11
SQUASH questionnaire (Short Questionnaire to Assess Health-enhancing physical activ-ity).22 23 Quality of life was measured using the validated EQ-5D EuroQol questionnaire.24 In addition, participants filled in questions on knee complaints, menopausal status, comorbidities and filled in the Knee injury and Osteoarthritis Outcome Score (KOOS) questionnaire at baseline, 12 months, 2.5 years and 6 - 7 years.25 Mild knee symptoms were defined as having any knee pain in the past 12 months.
Participants were visited at home every six months for the first 2.5 years to measure body weight, to check the questionnaire for unanswered questions and to replace the batch of study drugs with a new one. The retrieved batch was used for objective calcula-tion of compliance.
interventions
Both interventions are described in detail elsewhere.16 17 In short, participants random-ized to the DEP were referred to a local dietitian, agreements were made on frequency of visits, and personal goals regarding nutritional patterns and physical activity were set. All dietitians were trained in motivational interviewing in order to tailor the intervention to the participant’s individual needs and possibilities.26 In addition, participants were invited to participate in a series of 20 weekly physical exercise classes. These 1-hour classes were supervised by a physiotherapist, were offered near participants’ homes and were conducted in small groups of 12-15 participants. The goal of these classes was to regain pleasure in physical exercise and to find activities suited for long-term continua-tion. A wide variety of low-impact sports were offered. Participants in the control group did not receive this intervention, but were free to independently take any actions to improve their health.
Participants randomized to OGS were prescribed 1500 mg of oral crystalline glucos-amine sulfate per day for 2.5 years. Participants in the control group received placebo. All study drugs were provided by Rottapharm Madaus. There was no involvement of Rot-tapharm Madaus in study design, data collection or statistical analyses. All participants and research staff were blinded for allocation during these 2.5 years. After the interven-tion ended, observation of participants continued for four years.
statistical analyses
Baseline characteristics were presented as means ± standard deviation (SD) for numeri-cal variables and proportions for categorical variables. Baseline differences were tested using 2-tailed independent t-tests for numerical variables and Fisher’s exact test for categorical variables. Incidence figures on knee OA were presented per knee.
Primary outcome measure for the present study was the incidence of knee OA after 6 - 7 years, according to the combined clinical and radiological ACR criteria. Secondary outcome measure was the incidence of knee OA after 6 - 7 years, defined as K&L grade

102
2 or higher. Analyses were performed on knee level. OA was considered an irreversible process. Therefore, all knees that met ACR criteria at 2.5 years of follow-up or at 6 - 7 years of follow-up were considered positive for knee OA for the primary outcome. Because initial screening of inclusion criteria was done by phone, it was expected there would be a proportion of participants that met ACR criteria or showed K&L grade ≥2 for one or two knees at baseline already. These knees were excluded from the analysis.
Intention to treat (ITT) analysis served as primary analysis. The intervention effect on the primary and secondary outcome measures was tested using Generalized Estimating Equations (GEE), since this method takes the correlation of both knees of one participant into account. Effects were reported as odds ratios (OR) with 95% confidence intervals (CI). First, the associations between known prognostic variables and the outcome were tested with univariate GEE analyses. Age, K&L grade ≥1 versus 0, varus alignment, mild knee symptoms, BMI, a history of knee injury, Heberden nodes and postmenopausal status were tested accordingly. Next, all variables with a P-value <0.2 were analysed using multivariate GEE analysis. All variables with a P-value <0.05 in the multivariate model were adjusted for in the analyses testing the intervention effects. This was done separately for the primary and secondary outcome measures. Additionally, all analyses were adjusted for follow-up duration in months, since follow-up time was not equal for all participants, due to the large period of recruitment (July 2006 to May 2009). Using the GEE model, interaction between both interventions was assessed. In case of significant interaction, all four groups would be assessed separately.
For the pre-defined per protocol (PP) analyses, participants that were compliant to the intervention were compared to the participants that were randomized to the control group. Compliance to the DEP intervention was defined as having visited the dietitian at least six times and having attended at least seven physical activity classes. Regarding the OGS intervention, an objective compliance calculation of ≥75% was used, which was assessed using the retrieved study drugs batches.
As an explanatory analysis, incident knee OA was compared between participants that lost 5 kg or 5% of their baseline weight at one year of follow-up and participants that did not meet this pre-defined goal in the first year of the study. This outcome served as primary outcome of the weight loss intervention and was chosen for its associations with improvement of cardiovascular risk factors.16 We hypothesized that achieving this goal in the period of one year could possibly be an easily achievable goal to recommend patients in primary care in the context of preventing knee OA. Adjusting for follow-up duration and confounding factors, as in the ITT and the PP analyses, GEE was used for this analysis.
To estimate the effect of the missing data, multiple imputation was performed, as recommended in literature.27 50 imputed datasets were used, method was set to auto-mated selection of linear regression or predictive mean matching, maximum iterations

103
1
2
3
4
5
6
7
8
9
10
11
was set to 20 and a maximum of 150 parameters per variable was used. All variables used in the GEE, including the outcome variables, were imputed and used as predictors. Both baseline characteristics and follow-up data were used as auxiliary variables.
As a sensitivity analysis, a worst case scenario was explored according to literature recommendations.28 We hypothesized that no intervention effect at all would be the worst case scenario. Therefore, in all participants with missing data, the outcome was imputed evenly distributed over the two groups that were compared, resulting in an equal incidence of knee OA in both groups in all participants with missing data. The incidence found in the completers’ analysis was used to impute these variables. Missing values in covariates used in the GEE model were imputed by the average value of the completers. The results of the sensitivity analysis were used to check the plausibility of the results produced by the multiple imputation model.
All analysis were performed using IBM SPSS statistics version 21 (SPSS Inc, Chicago, IL). In all analysis, a P-value < 0.05 was defined as statistically significant.
results
407 women were randomized after 50 general practitioners contacted 6691 women. Full description of the selection process is published elsewhere.17Figure 1 shows the selection process and participants lost to follow-up with reasons. At baseline, knee OA data were available for 405 participants with 810 knees (99.5%). After 2.5 years, there were 356 participants for whom knee OA data was available on 712 knees (87.5%). After 6.6 years, 260 participants supplied knee OA data on 508 knees (62.4%). At baseline, 32 knees (4.0%) met ACR criteria and were excluded from analyses, concerning the primary outcome. In addition, 51 knees (6.3%) showed K&L grade ≥2 and were excluded from analyses, concerning the secondary outcome. As a result, knee OA data were available on 477 knees (58.9%) for the primary outcome measure and for the secondary outcome measure knee OA data on 452 knees (55.8%) was available. Attrition rates were similar between both randomized groups of the DEP intervention: 27% in the intervention group versus 31% in the control group. For the OGS intervention, attrition rates were higher in the placebo group: 35% versus 18% in the intervention group. Participants that completed the long-term follow-up had a lower baseline BMI (32.0 versus 33.0) and more Heberden’s nodes (18% versus 15%). Baseline knee OA incidence figures were similar between participants that completed the follow-up time and those that did not: 4% versus 4% for the primary outcome and 5% versus 8% for the secondary outcome.

104
table 1 shows baseline characteristics on the 508 knees from 260 participants that were available after complete follow-up. Mean follow-up time was 6.6 ± 0.7 years. There were no significant differences in baseline characteristics between both groups for both inter-ventions. In the multivariate analysis, three baseline characteristics were associated with the primary outcome: BMI, K&L grade ≥1 versus 0 and mild knee symptoms. Regarding the secondary outcome, BMI, K&L grade ≥1 versus 0 and a history of knee injury were as-sociated with the outcome in a multivariate model. Consequently, adjustment of these variables was performed in all analyses.
50 general practitioners contacted all women between 50 and 60 years registered at their practice (6691 women)
3094 women (46%) returned the reply-card to the research institute
1358 women (44%) were not interested
1736 women (56%) were interested
847 women (49%) were excluded because BMI, based on reported body weight and
height was < 27 kg/m²
889 women (51%) with BMI ≥ 27 kg/m² were sent additional
information
After screening on all in- and exclusion criteria by phone, 407 women (46%) were eligible and were invited for baseline
measurements
Randomization
DEP + placebo N=101
DEP + OGS N=102
Control + placebo N=102
Control + OGS N=102
36 women lost to follow-up
after 6.6 years (32 unwilling, 3
died, 1 unattainable)
37 lost to follow-up after 6.6 years (31
unwilling, 4 unattainable, 1
side-effects, 1 died)
45 lost to follow-up after 6.6 years (39 unwilling, 4
unattainable, 2 side-effects)
42 lost to follow-up after 6.6 years (40 unwilling, 1
unattainable, 1 died)
8 knees excluded (met ACR criteria at
baseline)
4 knees excluded (met ACR criteria at
baseline)
2 knees excluded (met ACR criteria at
baseline)
7 knees excluded (met ACR criteria at
baseline)
125 knees analysed in
primary analysis
129 knees analysed in
primary analysis
112 knees analysed in
primary analysis
111 knees analysed in
primary analysis
Figure 1 Flowchart of recruitment processDEP: diet and exercise programme, OGS: oral glucosamine sulfate
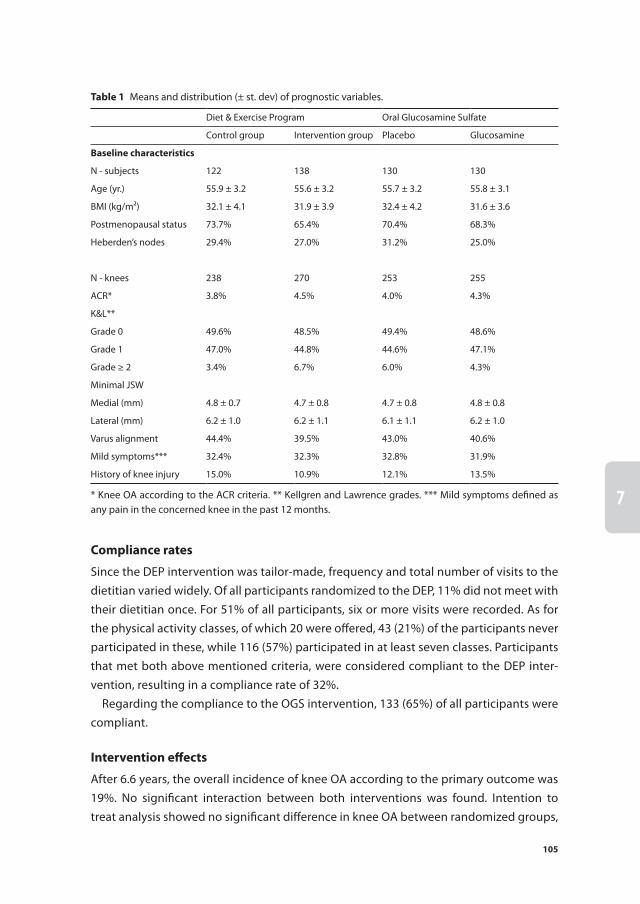
105
1
2
3
4
5
6
7
8
9
10
11
Compliance rates
Since the DEP intervention was tailor-made, frequency and total number of visits to the dietitian varied widely. Of all participants randomized to the DEP, 11% did not meet with their dietitian once. For 51% of all participants, six or more visits were recorded. As for the physical activity classes, of which 20 were offered, 43 (21%) of the participants never participated in these, while 116 (57%) participated in at least seven classes. Participants that met both above mentioned criteria, were considered compliant to the DEP inter-vention, resulting in a compliance rate of 32%.
Regarding the compliance to the OGS intervention, 133 (65%) of all participants were compliant.
intervention effects
After 6.6 years, the overall incidence of knee OA according to the primary outcome was 19%. No significant interaction between both interventions was found. Intention to treat analysis showed no significant difference in knee OA between randomized groups,
table 1 Means and distribution (± st. dev) of prognostic variables.
Diet & Exercise Program Oral Glucosamine Sulfate
Control group Intervention group Placebo Glucosamine
Baseline characteristics
N - subjects 122 138 130 130
Age (yr.) 55.9 ± 3.2 55.6 ± 3.2 55.7 ± 3.2 55.8 ± 3.1
BMI (kg/m²) 32.1 ± 4.1 31.9 ± 3.9 32.4 ± 4.2 31.6 ± 3.6
Postmenopausal status 73.7% 65.4% 70.4% 68.3%
Heberden’s nodes 29.4% 27.0% 31.2% 25.0%
N - knees 238 270 253 255
ACR* 3.8% 4.5% 4.0% 4.3%
K&L**
Grade 0 49.6% 48.5% 49.4% 48.6%
Grade 1 47.0% 44.8% 44.6% 47.1%
Grade ≥ 2 3.4% 6.7% 6.0% 4.3%
Minimal JSW
Medial (mm) 4.8 ± 0.7 4.7 ± 0.8 4.7 ± 0.8 4.8 ± 0.8
Lateral (mm) 6.2 ± 1.0 6.2 ± 1.1 6.1 ± 1.1 6.2 ± 1.0
Varus alignment 44.4% 39.5% 43.0% 40.6%
Mild symptoms*** 32.4% 32.3% 32.8% 31.9%
History of knee injury 15.0% 10.9% 12.1% 13.5%
* Knee OA according to the ACR criteria. ** Kellgren and Lawrence grades. *** Mild symptoms defined as any pain in the concerned knee in the past 12 months.

106
for both the DEP intervention (OR 0.86, 95% CI: 0.47, 1.54) and the OGS intervention (OR 1.58, 95% CI: 0.86, 2.89). Regarding the secondary outcome, knee OA incidence was 14%, with also no differences between both groups for both interventions.
Per protocol analysis showed greater intervention effects for the DEP than the inten-tion to treat analysis, though did not reach statistical significance with odds ratios of 0.55 (95% CI: 0.23, 1.33) for the primary outcome and 0.39 (95% CI: 0.12, 1.29) for the secondary outcome. For the OGS intervention, effects in the PP were not consistently greater. The intervention effect on the primary outcome did not change significantly, while the intervention effect on the secondary outcome changed in direction. Odds ratios for the secondary outcome were 0.96 (95% CI: 0.48, 1.92) for the PP and 1.26 (0.67, 2.39) for the ITT. All incidence numbers and odds ratios obtained from ITT and PP analyses are presented in table 2.
table 2 Incidence figures and odds ratios on knee OA from intention to treat and per protocol analyses
Incident knee OA
Incident knee OA intervention group
Incident knee OA control group
OR (adjusted)† 95% CI
intention to treat analyses
Diet and exercise program ( n=477: 254 vs 223)
ACR criteria* 19% 18% 19% 0.86 0.47-1.54
K&L grades** 15% 14% 16% 0.91 0.48-1.72
Oral glucosamine sulfate (n=477: 240 vs 237)
ACR criteria 19% 20% 17% 1.58 0.86-2.89
K&L grades 15% 15% 14% 1.26 0.67-2.39
Per protocol analyses
Diet and exercise program (n=305: 82 vs 223)
ACR criteria 18% 13% 19% 0.55 0.23-1.33
K&L grades 14% 8% 16% 0.39 0.12-1.29
Oral glucosamine sulfate (n=413: 176 vs 237)
ACR criteria 18% 19% 17% 1.64 0.86-3.14
K&L grades 13% 12% 14% 0.96 0.48-1.92
exploratory analysis††
Lost 5 kg or 5% in one year (n=477: 69 vs 408)
ACR criteria 19% 7% 21% 0.10 0.02-0.41
K&L grades 15% 6% 16% 0.28 0.08-0.94
* Knee OA according to the ACR criteria. ** Knee OA, defined as K&L grade ≥ 2. † GEE adjusted for baseline differences and confounding factors. †† Comparing the incidence of knee OA between participants that lost 5 kg or 5% of their baseline weight in the first year of follow-up versus all participants that did not lose this amount of body weight in the first year of follow-up. NB. Numbers are numbers of knees.

107
1
2
3
4
5
6
7
8
9
10
11
exploratory analysis
69 participants achieved the goal of losing 5 kg or 5% of their baseline body weight after one year of follow-up. These participants showed a lower incidence of knee OA after 6.6 years than participants that did not achieve this goal at one year of follow-up (7% versus 21%). Adjusted odds ratio for the primary outcome was 0.10 (95% CI 0.02, 0.41) and 0.28 (95% CI: 0.08, 0.94) for the secondary outcome. Table 2 shows these odds ratios.
multiple imputation
Pooled odds ratios obtained from the imputed datasets showed no significant interven-tion effects. Incidence numbers were markedly higher than in the original data. In these analyses, both interventions showed greater effects in the PP analyses compared with the ITT analyses. The association between losing 5 kg or 5% baseline weight became
table 3 Incidence figures and odds ratios after multiple imputation
Incident knee OA
Incident knee OA intervention group
Incident knee OA control group
OR (adjusted)† 95% CI
intention to treat analyses
Diet and exercise program
ACR criteria* 31% 29% 33% 0.84 0.49-1.44
K&L grades** 28% 26% 31% 0.83 0.45-1.53
Oral glucosamine sulfate
ACR criteria 31% 32% 30% 1.07 0.63-1.81
K&L grades 28% 28% 29% 0.92 0.56-1.52
Per protocol analyses
Diet and exercise program
ACR criteria 30% 22% 33% 0.57 0.27-1.22
K&L grades 27% 18% 31% 0.47 0.19-1.19
Oral glucosamine sulfate
ACR criteria 28% 25% 30% 0.81 0.44-1.51
K&L grades 25% 20% 29% 0.61 0.34-1.10
exploratory analysis††
Lost 5 kg or 5% in one year
ACR criteria 31% 22% 32% 0.54 0.23-1.31
K&L grades 28% 20% 30% 0.56 0.22-1.43
* Knee OA according to the ACR criteria. ** Knee OA, defined as K&L grade ≥ 2. †GEE adjusted for baseline differences and confounding factors. †† Comparing the incidence of knee OA between participants that lost 5 kg or 5% of their baseline weight in the first year of follow-up versus all participants that did not lose this amount of body weight in the first year of follow-up.

108
less strong and non-significant. table 3 shows all incidence numbers and odds ratios obtained from the multiple imputation datasets.
sensitivity analysis
Odds ratios obtained from the worst case scenario were very similar to the completers’ analysis. Naturally, all effects decreased; all odds ratios moved closer to one. Regarding the DEP intervention, the OR for the primary outcome changed from 0.86 (0.47, 1.54) to 0.97 (0.65, 1.45) and OR for the secondary outcome changed from 0.91 (0.48, 1.72) to 0.95 (0.60, 1.49). Regarding the OGS intervention, OR for the primary outcome changed from 1.58 (0.86, 2.89) to 1.07 (0.71, 1.60) and OR for the secondary outcome changed from 1.26 (0.67, 2.39) to 1.03 (0.67, 1.60). None of the associations changed in direction and none of the confidence intervals which included one in the completers’ analysis
table 4 Incidence figures and odds ratios after worst case scenario
Incident knee OA
Incident knee OA intervention group
Incident knee OA control group
OR (adjusted)† 95% CI
intention to treat analyses
Diet and exercise program
ACR criteria* 19% 19% 19% 0.97 0.65-1.45
K&L grades** 14% 14% 14% 0.95 0.60-1.49
Oral glucosamine sulfate
ACR criteria 19% 20% 18% 1.07 0.71-1.60
K&L grades 14% 15% 14% 1.03 0.67-1.60
Per protocol analyses
Diet and exercise program
ACR criteria 18% 14% 19% 0.68 0.35-1.33
K&L grades 13% 10% 14% 0.55 0.24-1.27
Oral glucosamine sulfate
ACR criteria 19% 21% 18% 1.19 0.74-1.89
K&L grades 13% 12% 13% 0.99 0.57-1.69
exploratory analysis††
Lost 5 kg or 5% in one year
ACR criteria 19% 11% 20% 0.45 0.23-0.90
K&L grades 14% 8% 15% 0.43 0.20-0.93
* Knee OA according to the ACR criteria. ** Knee OA, defined as K&L grade ≥ 2. †GEE adjusted for baseline differences and confounding factors. †† Comparing the incidence of knee OA between participants that lost 5 kg or 5% of their baseline weight in the first year of follow-up versus all participants that did not lose this amount of body weight in the first year of follow-up.
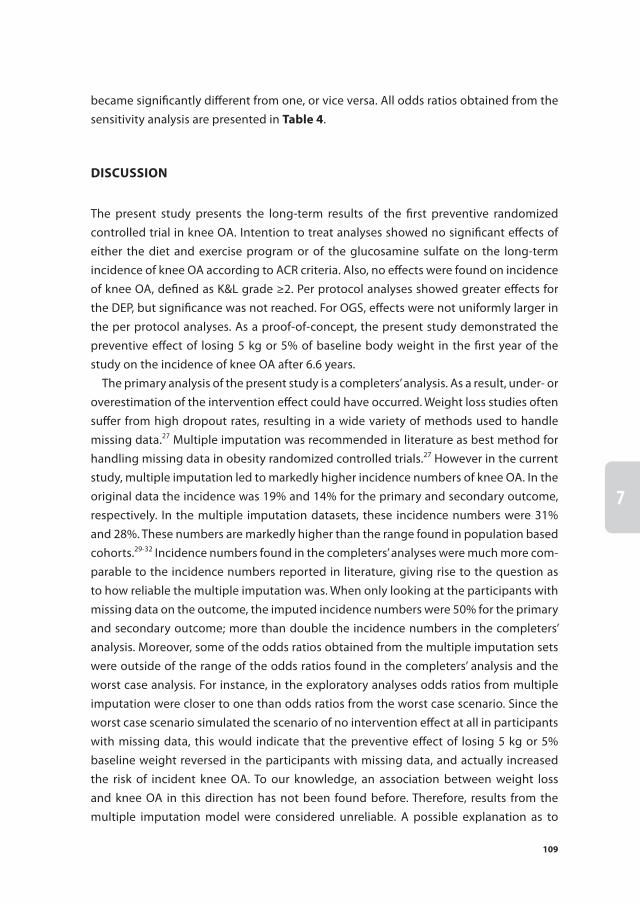
109
1
2
3
4
5
6
7
8
9
10
11
became significantly different from one, or vice versa. All odds ratios obtained from the sensitivity analysis are presented in table 4.
DisCussiOn
The present study presents the long-term results of the first preventive randomized controlled trial in knee OA. Intention to treat analyses showed no significant effects of either the diet and exercise program or of the glucosamine sulfate on the long-term incidence of knee OA according to ACR criteria. Also, no effects were found on incidence of knee OA, defined as K&L grade ≥2. Per protocol analyses showed greater effects for the DEP, but significance was not reached. For OGS, effects were not uniformly larger in the per protocol analyses. As a proof-of-concept, the present study demonstrated the preventive effect of losing 5 kg or 5% of baseline body weight in the first year of the study on the incidence of knee OA after 6.6 years.
The primary analysis of the present study is a completers’ analysis. As a result, under- or overestimation of the intervention effect could have occurred. Weight loss studies often suffer from high dropout rates, resulting in a wide variety of methods used to handle missing data.27 Multiple imputation was recommended in literature as best method for handling missing data in obesity randomized controlled trials.27 However in the current study, multiple imputation led to markedly higher incidence numbers of knee OA. In the original data the incidence was 19% and 14% for the primary and secondary outcome, respectively. In the multiple imputation datasets, these incidence numbers were 31% and 28%. These numbers are markedly higher than the range found in population based cohorts.29-32 Incidence numbers found in the completers’ analyses were much more com-parable to the incidence numbers reported in literature, giving rise to the question as to how reliable the multiple imputation was. When only looking at the participants with missing data on the outcome, the imputed incidence numbers were 50% for the primary and secondary outcome; more than double the incidence numbers in the completers’ analysis. Moreover, some of the odds ratios obtained from the multiple imputation sets were outside of the range of the odds ratios found in the completers’ analysis and the worst case analysis. For instance, in the exploratory analyses odds ratios from multiple imputation were closer to one than odds ratios from the worst case scenario. Since the worst case scenario simulated the scenario of no intervention effect at all in participants with missing data, this would indicate that the preventive effect of losing 5 kg or 5% baseline weight reversed in the participants with missing data, and actually increased the risk of incident knee OA. To our knowledge, an association between weight loss and knee OA in this direction has not been found before. Therefore, results from the multiple imputation model were considered unreliable. A possible explanation as to

110
why the multiple imputation model did not result in more plausible incidence rates, is the possibility that not all of the assumptions underlying multiple imputation were met, such as the missing data mechanism being random.33 Additionally, large amounts of missing data, especially on the outcome variable, can result in unreliable results and can introduce bias not present in a completers’ analysis.34
The present study pioneered in the prevention of knee OA and is to our knowledge the first to investigate the prevention of knee OA with incidence of knee OA as primary outcome.17 Results presented by trials investigating the preventive effect of weight loss on intermediate outcomes indicated a high possibility of a preventive effect of weight loss on knee OA.10 11 The present study however, failed to find a significant interven-tion effect. Two possible mechanisms could have caused underestimation of the intervention effect. First, weight loss in the control group was considerably higher than expected, possibly caused by a high baseline motivation to participate in a diet and exercise programme.35 As a result, the difference in weight loss between both groups was smaller than expected. Second, compliance rates were lower than expected. Just 32% of all participants randomized to the intervention group were compliant to the intervention. Considering these possible reasons for underestimation of the interven-tion effect, in addition to the fact that per protocol analyses showed greater effects than intention to treat analyses, a true preventive effect of weight loss on incident knee OA should be considered, despite the lack of significant findings in the present study. For this reason, as a proof of concept, the exploratory analysis was undertaken, which did show a significant effect of losing 5 kg or 5% of baseline body weight on incident knee OA in the completers’ analysis. This finding is consistent with intervention effects found on weight loss and physical activity.35
In conclusion, no long-term effectiveness in preventing incident knee OA of the DEP or of the OGS was found in the present study. However, the PP effects of the DEP intervention were greater than the ITT effects, indicating a possibility of a significant ef-fect, would there have been higher compliance rates and a more representative control group. Exploratory analyses showed an association between losing 5 kg or 5% baseline weight and a considerable decrease in incident knee OA. This association indicates that weight loss could be a successful strategy in preventing knee OA in an overweight population, but needs further study. For the OGS, no indications of a preventive effect were found. Additionally, PP analyses did not show greater effects than ITT analyses. However, these conclusions should be interpreted with caution, since the large amount of missing data resulted in high uncertainty of the results. As illustrated in the present study, this problem cannot always be reliably mitigated through multiple imputation.
The present study provides important insights in the possibilities of preventing knee OA. A follow-up time of 6.6 years seems to be sufficient to study the development in knee OA, given the large differences in knee OA incidence between groups in the ex-

111
1
2
3
4
5
6
7
8
9
10
11
ploratory analyses. Future research should further investigate the preventive effect of weight loss on incident knee OA. Adherence rates should be of the utmost importance when designing trials investigating prevention of knee OA. The present study illustrates the large consequences of missing data, resulting in high uncertainty about the validity and usefulness of conclusions drawn. Additionally, higher compliance rates should be given high priority, in order to achieve a clinically significant amount of weight loss in a considerable proportion of the study population. Weight loss remains challenging in the present population, but this study provides proof that the concept of preventing knee OA through weight loss is viable.

112
reFerenCes
1. Bliddal H, Leeds AR, Christensen R. Osteoarthritis, obesity and weight loss: evidence, hypotheses and horizons - a scoping review. Obes Rev 2014; 15(7): 578-86.
2. Fransen M, McConnell S, Harmer AR, et al. Exercise for osteoarthritis of the knee. Cochrane Db Syst Rev 2015(1).
3. Regnaux JP, Lefevre-Colau MM, Trinquart L, et al. High-intensity versus low-intensity physical activity or exercise in people with hip or knee osteoarthritis. Cochrane Database Syst Rev 2015; 10: CD010203.
4. Beckwee D, Vaes P, Cnudde M, et al. Osteoarthritis of the knee: why does exercise work? A qualita-tive study of the literature. Ageing Research Reviews 2013; 12(1): 226-36.
5. Hunter DJ. Lower extremity osteoarthritis management needs a paradigm shift. Brit J Sport Med 2011; 45(4): 283-88.
6. Felson DT, Zhang YQ, Anthony JM, et al. Weight-Loss Reduces the Risk for Symptomatic Knee Osteoarthritis in Women - the Framingham-Study. Ann Intern Med 1992; 116(7): 535-39.
7. Jordan JM, Sowers MF, Messier SP, et al. Methodologic issues in clinical trials for prevention or risk reduction in osteoarthritis. Osteoarthr Cartilage 2011; 19(5): 500-08.
8. Powell A, Teichtahl AJ, Wluka AE, et al. Obesity: a preventable risk factor for large joint osteoarthri-tis which may act through biomechanical factors. Brit J Sport Med 2005; 39(1): 4-5.
9. Neogi T, Zhang YQ. Osteoarthritis prevention. Curr Opin Rheumatol 2011; 23(2): 185-91. 10. Anandacoomarasamy A, Leibman S, Smith G, et al. Weight loss in obese people has structure-
modifying effects on medial but not on lateral knee articular cartilage. Ann Rheum Dis 2012; 71(1): 26-32.
11. White DK, Neogi T, Rejeski WJ, et al. Can an Intensive Diet and Exercise Program Prevent Knee Pain Among Overweight Adults at High Risk? Arthrit Care Res 2015; 67(7): 965-71.
12. Rannou F, Poiraudeau S. Non-pharmacological approaches for the treatment of osteoarthritis. Best Pract Res Cl Rh 2010; 24(1): 93-106.
13. Bijlsma JWJ, Knahr K. Strategies for the prevention and management of osteoarthritis of the hip and knee. Best Pract Res Cl Rh 2007; 21(1): 59-76.
14. Towheed TE, Maxwell L, Anastassiades TP, et al. Glucosamine therapy for treating osteoarthritis - art. no. CD002946.pub2. Cochrane Db Syst Rev 2005(2).
15. Bruyere O, Reginster JY. Glucosamine and chondroitin sulfate as therapeutic agents for knee and hip osteoarthritis. Drug Aging 2007; 24(7): 573-80.
16. de Vos BC, Runhaar J, Bierma-Zeinstra SMA. Effectiveness of a tailor-made weight loss interven-tion in primary care. Eur J Nutr 2014; 53(1): 95-104.
17. Runhaar J, van Middelkoop M, Reijman M, et al. Prevention of Knee Osteoarthritis in Overweight Females: The First Preventive Randomized Controlled Trial in Osteoarthritis. Am J Med 2015; 128(8): 888-+.
18. Schulz KF, Altman DG, Moher D, et al. CONSORT 2010 Statement: Updated Guidelines for Report-ing Parallel Group Randomized Trials. Ann Intern Med 2010; 152(11): 726-W293.
19. Altman R, Asch E, Bloch D, et al. Development of Criteria for the Classification and Reporting of Osteoarthritis - Classification of Osteoarthritis of the Knee. Arthritis Rheum-Us 1986; 29(8): 1039-49.
20. Buckland-Wright JC, Wolfe F, Ward RJ, et al. Substantial superiority of semiflexed (MTP) views in knee osteoarthritis: A comparative radiographic study, without fluoroscopy, of standing ex-tended, semiflexed (MTP), and schuss views. J Rheumatol 1999; 26(12): 2664-74.

113
1
2
3
4
5
6
7
8
9
10
11
21. Kellgren JH, Lawrence JS. Radiological assessment of osteo-arthrosis. Ann Rheum Dis 1957; 16(4): 494-502.
22. Wendel-Vos GCW, Schuit AJ, Saris WHM, et al. Reproducibility and relative validity of the Short Questionnaire to Assess Health-enhancing physical activity. J Clin Epidemiol 2003; 56(12): 1163-69.
23. de Hollander EL, Zwart L, de Vries SI, et al. The SQUASH was a more valid tool than the OBiN for categorizing adults according to the Dutch physical activity and the combined guideline. J Clin Epidemiol 2012; 65(1): 73-81.
24. Xie F, Gaebel K, Perampaladas K, et al. Comparing EQ-5D Valuation Studies: A Systematic Review and Methodological Reporting Checklist. Med Decis Making 2014; 34(1): 8-20.
25. Roos EM, Toksvig-Larsen S. Knee injury and Osteoarthritis Outcome Score (KOOS) - validation and comparison to the WOMAC in total knee replacement. Health Qual Life Outcomes 2003; 1: 17.
26. Rubak S, Sandboek A, Lauritzen T, et al. Motivational interviewing: a systematic review and meta-analysis. Brit J Gen Pract 2005; 55(513): 305-12.
27. Elobeid MA, Padilla MA, McVie T, et al. Missing Data in Randomized Clinical Trials for Weight Loss: Scope of the Problem, State of the Field, and Performance of Statistical Methods. Plos One 2009; 4(8).
28. Higgins JPT, White IR, Wood AM. Imputation methods for missing outcome data in meta-analysis of clinical trials. Clin Trials 2008; 5(3): 225-39.
29. Felson DT, Zhang YQ, Hannan MT, et al. The Incidence and Natural-History of Knee Osteoarthritis in the Elderly - the Framingham Osteoarthritis Study. Arthritis Rheum-Us 1995; 38(10): 1500-05.
30. Reijman M, Pols HA, Bergink AP, et al. Body mass index associated with onset and progression of osteoarthritis of the knee but not of the hip: the Rotterdam Study. Ann Rheum Dis 2007; 66(2): 158-62.
31. Leyland KM, Hart DJ, Javaid MK, et al. The natural history of radiographic knee osteoarthritis: A fourteen-year population-based cohort study. Arthritis Rheum-Us 2012; 64(7): 2243-51.
32. Yoshimura N, Muraki S, Oka H, et al. Accumulation of metabolic risk factors such as overweight, hypertension, dyslipidaemia, and impaired glucose tolerance raises the risk of occurrence and progression of knee osteoarthritis: a 3-year follow-up of the ROAD study. Osteoarthr Cartilage 2012; 20(11): 1217-26.
33. Schafer JL, Olsen MK. Multiple imputation for multivariate missing-data problems: A data ana-lyst’s perspective. Multivar Behav Res 1998; 33(4): 545-71.
34. Lee KJ, Carlin JB. Recovery of information from multiple imputation: a simulation study. Emerg Themes Epidemiol 2012; 9(1): 3.
35. de Vos BC, Runhaar J, van Middelkoop M, et al. The long-term effects of a randomised, controlled, tailor-made weight loss intervention in primary care on the health and lifestyle of overweight and obese women. Am J Clin Nutr: Accepted for publication.


1
2
3
4
5
6
7
8
9
10
11
Chapter 8 Physical activity during and after a lifestyle intervention: a latent class growth analysis approach
Bastiaan C. de VosJos RunhaarMarienke van MiddelkoopMarjolein KrulEdwin H.G. OeiDammis VroegindeweijSita M.A. Bierma-Zeinstra
Submitted

116
aBstraCt
Background
The present study aimed to identify and describe subgroups of participants with differ-ent longitudinal evolutions of physical activity over time following a lifestyle interven-tion.
methods
Long-term data on physical activity from the PROOF study (PRevention of knee Osteo-arthritis in Overweight Females, ISRCTN 42823086), a randomized controlled trial on the prevention of knee osteoarthritis through a lifestyle intervention, was analysed using latent class growth analysis. Additionally, the effect of changes in physical activity on incident knee osteoarthritis was assessed.
results
Two groups were identified with distinctly different trajectories of change in physical activity over time. A group of 42 participants showed a more favourable pattern of change in physical activity over time than the remaining 345 participants. Low baseline physical activity and low social participation increased the odds to benefit from the lifestyle intervention, regarding their physical activity; odds ratios for one point increase in physical activity score or one hour per week increase in social participation were 0.50 (95% CI: 0.27, 0.93) and 0.69 (95% CI: 0.49, 0.99) respectively.
Conclusions
A lifestyle intervention aimed to increase physical activity has highest success in par-ticipants with low physical activity and low social participation. An increase in physical activity in this group may lead to an increase in pain of the knees. These findings empha-size the need to personalize lifestyle interventions to patients’ individual characteristics.

117
1
2
3
4
5
6
7
8
9
10
11
intrODuCtiOn
The beneficial effects of increased physical activity on health outcomes, such as car-diovascular risk factors, have been extensively described in literature1. Physical exercise even proved to have beneficial effects on health outcomes without affecting actual body weight2. Therefore, trials investigating lifestyle interventions often record participants’ physical activity level3-5. A large variety of instruments is used in literature to quantify this measure of interest, such as accelerometers or questionnaires6-8. Questionnaires are often used due to their relatively low costs and general usability for participants7 9.
Many interventional and observational studies that measure physical activity report on the cross-sectional relationships between physical activity and various variables, such as body weight, pain or quality of life2 10. However, very few studies investigate the longitudinal evolutions of physical activity over time11. Longitudinal trials that are avail-able often focus on change in physical activity and often aim to increase the physical activity of their participants10 12. Mostly, the difference in physical activity between the end of the study and the baseline measurement is used as outcome measure2 10 12. How-ever, changes in physical activity in between those two measurements could provide additional information. For example, a steady, consistent increase in physical activity over time could provide other health benefits than a highly fluctuating evolution of physical activity with relapses over time. Therefore, it would be useful to study the lon-gitudinal evolutions of change in physical activity over time of participants of a lifestyle intervention. Certain baseline characteristics could be identified that increase the odds to follow a favorable pattern of change over time. These findings could aid in estimating prognoses and in specific targeting of participants for a particular intervention. In addi-tion, the effect of particular patterns of change over time on several outcome measures could be assessed.
Latent class growth analysis (LCGA) is a technique that uses an objective method to identify homogeneous subgroups in a heterogeneous population13. Using this method, subgroups can be identified which are based on objective measures, instead of choos-ing subgroups on self-chosen criteria. When applying LCGA to longitudinal data with repeated measurements, these subgroups each represent a particular pattern over time. This method has been proven to reliably classify participants into homogeneous subgroups when analyzing longitudinal data14 15.
All data used in the present study was derived from the PROOF Study (PRevention of knee Osteoarthritis in Overweight Females, ISRCTN 42823086), a randomized controlled trial on the prevention of knee osteoarthritis through a lifestyle intervention16. During this trial, physical activity level was measured repeatedly over time. Longitudinal data from the above mentioned randomized controlled trial was used earlier to successfully classify participants in different subgroups based on their body weight changes over
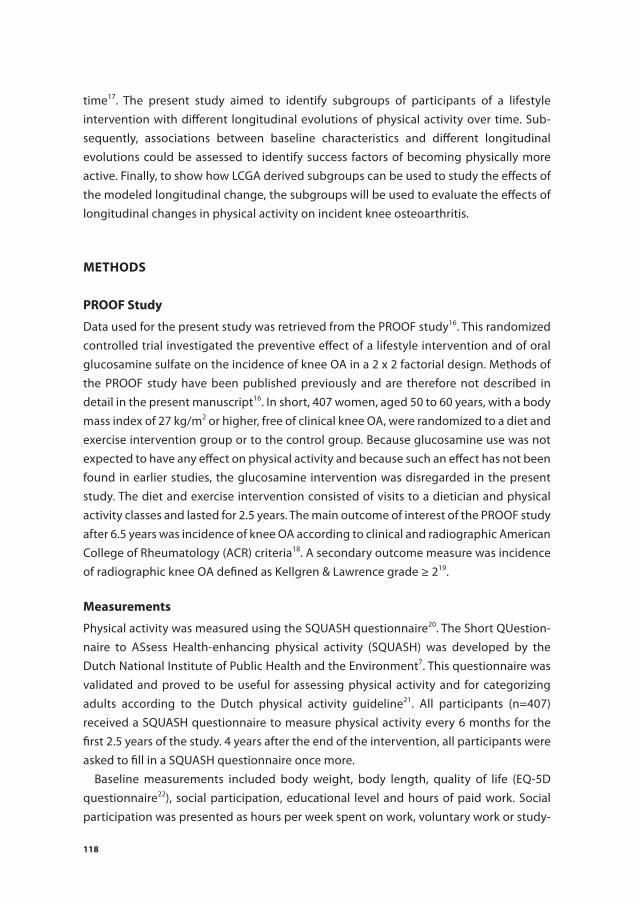
118
time17. The present study aimed to identify subgroups of participants of a lifestyle intervention with different longitudinal evolutions of physical activity over time. Sub-sequently, associations between baseline characteristics and different longitudinal evolutions could be assessed to identify success factors of becoming physically more active. Finally, to show how LCGA derived subgroups can be used to study the effects of the modeled longitudinal change, the subgroups will be used to evaluate the effects of longitudinal changes in physical activity on incident knee osteoarthritis.
methODs
PrOOF study
Data used for the present study was retrieved from the PROOF study16. This randomized controlled trial investigated the preventive effect of a lifestyle intervention and of oral glucosamine sulfate on the incidence of knee OA in a 2 x 2 factorial design. Methods of the PROOF study have been published previously and are therefore not described in detail in the present manuscript16. In short, 407 women, aged 50 to 60 years, with a body mass index of 27 kg/m2 or higher, free of clinical knee OA, were randomized to a diet and exercise intervention group or to the control group. Because glucosamine use was not expected to have any effect on physical activity and because such an effect has not been found in earlier studies, the glucosamine intervention was disregarded in the present study. The diet and exercise intervention consisted of visits to a dietician and physical activity classes and lasted for 2.5 years. The main outcome of interest of the PROOF study after 6.5 years was incidence of knee OA according to clinical and radiographic American College of Rheumatology (ACR) criteria18. A secondary outcome measure was incidence of radiographic knee OA defined as Kellgren & Lawrence grade ≥ 219.
measurements
Physical activity was measured using the SQUASH questionnaire20. The Short QUestion-naire to ASsess Health-enhancing physical activity (SQUASH) was developed by the Dutch National Institute of Public Health and the Environment7. This questionnaire was validated and proved to be useful for assessing physical activity and for categorizing adults according to the Dutch physical activity guideline21. All participants (n=407) received a SQUASH questionnaire to measure physical activity every 6 months for the first 2.5 years of the study. 4 years after the end of the intervention, all participants were asked to fill in a SQUASH questionnaire once more.
Baseline measurements included body weight, body length, quality of life (EQ-5D questionnaire22), social participation, educational level and hours of paid work. Social participation was presented as hours per week spent on work, voluntary work or study-

119
1
2
3
4
5
6
7
8
9
10
11
ing. Educational level was separated in low (intermediate vocational training or lower) and high (high vocational training or academically educated). Additionally, the propor-tion of participants that complied with the Dutch Activity Guideline was determined (at least five times 30 minutes of moderately intense physical activity per week)23.
statistiCal analyses
latent class growth analysis
Change in physical activity was calculated using the difference between each SQUASH score at a given time point and the baseline SQUASH score for that particular partici-pant. Subsequently, this difference was divided by the baseline score of that particular participant, obtaining a relative change in SQUASH score, relative to the baseline score, which was used in the LCGA. Using LCGA, models with 2 to 6 trajectory classes were tested, using linear, quadratic and cubic transformations of time, as well as taking a fixed variance over time into account versus a free variance. As recommended in literature, a number of indices of fit were used to identify the most optimal model: entropy, the Bayesian Information Criterion (BIC), the Akaike Information criterion (AIC), the Vuong-Lo-Mendell-Rubin likelihood ratio test (VLMR-LRT) and the likelihood ratio test (LRT)13. Additionally, the shape of the trajectories and number of participants in each class was taken into consideration for the final decision on the optimal model13 24.
evaluation of success factors
Unadjusted differences in baseline characteristics between the identified subgroups were tested using one way ANOVA tests for continuous variables and Fisher’s exact tests for categorical variables. If LCGA identified just two subgroups, t-tests and Fisher’s exact test were used. Second, relationships between baseline characteristics, that could theo-retically be associated with changes in physical activity, and assignment to one of the identified groups were tested using univariate multinomial regression. Here, posterior class membership probabilities were used as weights, as recommended in literature25 26. If LCGA identified just two subgroups, logistic regression was used. In these analyses, interactions between all baseline characteristics and the effect of the lifestyle interven-tion were tested additionally.
effect of longitudinal change in physical activity on osteoarthritis development
As a post-hoc exploratory analysis, the effect of the identified trajectories on knee osteo-arthritis development was studied. For this analysis, the relationship between the dif-ferent longitudinal trajectories of change in physical activity and incidence of knee OA was tested using logistic regression with incidence of knee OA as dependent variable

120
and the variable indicating the subgroups identified by LCGA as independent variable. These analyses were adjusted for confounding factors. All baseline variables that theo-retically could be associated with incidence of knee OA were tested on this relationship using logistic regression. Baseline variables that showed a significant association with the incidence of knee OA and all baseline variables that differed significantly between the identified groups were identified as possible confounders. Additional baseline characteristics were tested for this purpose, namely: WOMAC pain, WOMAC function and WOMAC stiffness27, a history of knee injury and mild knee symptoms. Mild knee symptoms were defined as having any knee pain in the past 12 months. These analyses were performed for knee OA according to ACR criteria and K&L grades separately. To assess the outcome of radiographic knee OA, knee radiographs were taken according to the metatarsophalangeal protocol28. The scoring of these radiographs was done using Kellgren & Lawrence criteria19.
Mplus version 7.3 (Muthén & Muthén, Los Angeles, CA, USA) was used for the LCGA. SPSS software version 21 (Windows, Chicago, IL, USA) was used for the remaining analy-ses.
results
Full details of the inclusion and the results of the PROOF study have been published elsewhere16 20. Of the 407 participants randomized, 390 participants had available data on physical activity on at least two time points and were included in the LCGA. Of these 390 participants, all available data on physical activity was taken into account. Three participants clearly stood out of the rest of the participants regarding their trajectories of change in physical activity over time. These three participants all had a SQUASH score of > 5 standard deviations above the average for the study population at >80% of their measurements. After evaluating the individual questionnaires for these three partici-pants, the research group decided to exclude these participants from the analysis, since the scores were considered impossible. Consequently, 387 participants were included in the final analysis.
latent class growth analysis
A cubic model with free variance and two subgroups was selected as the optimal model. Both the BIC and AIC were smallest of all models tested. The VLMR-LRT and the LRT both indicated no better fit of the data when one subgroup was added. Entropy of the selected model was 0.93, indicating good discriminative properties13 24. The first group of this model consisted of 42 participants, that showed a steep increase in change in physical activity up to 18 months after randomization, followed by a slight decrease un-

121
1
2
3
4
5
6
7
8
9
10
11
til remaining stable between 2.5 years and 6.5 years after randomization, still well above twice their baseline score. The second group of this model consisted of 345 participants that showed very little changes in physical activity, relative to their baseline score. At each set time point, the change in physical activity was significantly higher in the first group. Figure 1 shows the trajectories over time for the two identified groups. When looking at the absolute SQUASH scores, in contrast to the change in physical activity, it is shown that group 1 had a remarkably lower baseline physical activity than group 2, catches up with the latter in the first year of the study and after that, no significant changes between both groups are observed. Figure 2 shows these patterns.
-50
0
50
100
150
200
Rela
tive
chan
ge in
phy
sical
act
ivity
from
bas
elin
e, %
Time, months
Group 1, n=42
Group2, n=345
6 12 18 24 30 80
Figure 1 Change in physical activity over time, means ± SEM
0
1000
2000
3000
4000
5000
6000
7000
8000
9000
10000
Abso
lute
phy
sical
act
ivity
, SQ
UAS
H sc
ore
Time, months Group 1, n=42
Group2, n=345
6 12 18 24 30 80
Figure 2 Absolute physical activity in SQUASH score over time, means ± SEM

122
success factors
Several baseline characteristics differed between the two identified groups. The most notable differences were as follows: participants in group 1 had, on average, a lower baseline SQUASH score (2987 versus 7419), lower level of social participation (7.8 versus 9.3 hours per week) and a lower educational level (98% low versus 80% low). table 1 shows all baseline characteristics for the two identified groups. Intervention group membership of the diet and exercise intervention of the original study was evenly distributed over the two identified groups (52% versus 50%).
The weighted analyses using the posterior class membership probabilities, showed the following baseline characteristics to be significantly associated with class membership: baseline SQUASH score, proportion of participants that complied with the Dutch Activ-ity Guideline, quality of life, social participation, having a paid job and educational level. Of these variables, the baseline SQUASH score and social participation showed a sig-nificant interaction with the lifestyle intervention effect of the original trial. Both these variables showed a negative correlation with the outcome of membership to group 1. In the intervention group, these effects were stronger than in the control group. table 2 shows the results of these analyses. Of the tested interactions, only those with a p-value < 0.05 are shown.
table 1 Baseline characteristics, proportions and means (standard deviation)
Improved group (n=42) Stable group (n=345)
Lifestyle intervention (% intervention group) 52% 50%
Age (years) 55.2 (3.0) 55.8 (3.2)
Body Mass Index (kg/m²) 33.1 (5.0) 32.2 (4.1)
Baseline physical activity (SQUASH score)* 2987 (1608) 7419 (3532)
Compliance with Dutch Activity Guideline (% yes)** 31% 52%
Quality of life (EQ-5D, 0-1)** 0.85 (0.14) 0.90 (0.13)
Social participation (hours/week)* 7.8 (1.9) 9.3 (2.0)
Paid job (% yes)* 46% 75%
Educational level*
Low 98% 80%
High 2% 20%
* p < 0.002, ** P < 0.03, Dutch Activity Guideline recommending at least 5 times 30 minutes a week of mod-erately intense physical activity, social participation defined as hours per week spent on work, voluntary work or studying, educational level was separated in low (intermediate vocational training or lower) and high (high vocational training or academically educated). Mild knee symptoms were defined as having any knee pain in the past 12 months.

123
1
2
3
4
5
6
7
8
9
10
11
effect of longitudinal change in physical activity on osteoarthritis development
Participants in group 1 showed a higher chance of developing knee OA than participants in group 2, regarding ACR knee OA (adjusted odds ratio: 7.67, 95% CI: 1.99, 29.47). Re-garding the secondary outcome, Kellgren & Lawrence grade ≥ 2, no significant effect of the identified longitudinal evolutions was found (adjusted odds ratio: 1.63, 95% CI: 0.37, 7.25). These analyses were adjusted for all possible confounding variables, including the intervention effects of the original interventions (here, also the glucosamine interven-tion effect was adjusted for). Identified baseline variables that showed a significant association with the outcome were: BMI, mild knee symptoms and Kellgren & Lawrence score. In addition to the variables that differed significantly between the identified groups, as presented in Table 1, these variables were considered potential confounders and were adjusted for.
DisCussiOn
In this study, longitudinal evolutions of change in physical activity over time during and after a lifestyle intervention were studied. LCGA successfully identified two subgroups, representing two different trajectories in change in physical activity over time. 42 of the 387 participants with available data showed a more advantageous evolution over
table 2 Results of weighted univariate logistic regression analysis on improved group membership (refer-ence group is the stable group, group 2)
Odds ratio 95% confidence interval
p-value
Lifestyle intervention group 1.18 0.61, 2.28 0.633
Age 0.94 0.85, 1.05 0.250
Body Mass Index 1.04 0.97, 1.12 0.265
Baseline physical activity (SQUASH score) 0.39 0.30, 0.51 <0.001
Compliance with Dutch Activity Guideline 0.42 0.21, 0.85 0.016
Quality of life (EQ-5D) 0.10 0.01, 0.80 0.031
Social participation 0.70 0.59, 0.83 <0.001
Paid job 0.28 0.14, 0.55 <0.001
Educational level (ref = low) 0.06 0.01, 0.80 0.033
SQUASH score x intervention effect 0.50 0.27, 0.93 0.027
Social participation x intervention effect 0.69 0.49, 0.99 0.041
Dutch Activity Guideline recommending at least 5 times 30 minutes a week of moderately intense physical activity, social participation defined as hours per week spent on work, voluntary work or studying, edu-cational level was separated in low (intermediate vocational training or lower) and high (high vocational training or academically educated). Mild knee symptoms were defined as having any knee pain in the past 12 months.

124
time than the 345 participants that showed little change in physical activity over time. These 42 participants more than doubled their physical activity, up to 160% above their baseline score 18 months after randomization, before remaining quite stable after that. Their physical activity level at baseline was in fact more than two times lower than the reference group. After these 42 participants increased their physical activity level up to the level of the reference group in the first year, no significant differences in physical activity between the two identified subgroups were observed. It turned out that the participants in the group that started lower and increased their physical activity had less favorable baseline characteristics: they had, on average, a lower baseline SQUASH score, a lower quality of life, a lower social participation and a lower educational level. The proportion of participants that complied with the Dutch Activity Guideline and the proportion that had a paid job were both lower in the group with the more advanta-geous evolution of change in physical activity over time.
The significant interactions of the intervention effect of the original study with two baseline characteristics, namely baseline SQUASH score and social participation, showed that participants who scored high on these variables, were less likely to show the more favorable evolution of change in physical activity over time due to the inter-vention. These findings indicate that a lifestyle intervention such as the diet and exercise intervention of the described original study, most likely has the greatest effects in those participants that are less physically and socially active. These findings could help when conducting future trials, to specifically target a population in which the probability of success of a particular intervention is high. In addition, these findings could be useful in clinical practice, to guide general practitioners in decision making, knowing which pa-tients are more likely to increase their physical activity. It also showed that participants who report on their own physical activity as being high, are very unlikely to increase their physical activity, as shown in Figure 2. The intervention aimed to increase physi-cal activity in all participants randomized to the intervention group. Perhaps it is more sensible to offer coaching on increasing physical activity only to those participants who report low physical activity at baseline. Additionally, the intervention was designed to encourage social interaction between participants: dieticians and sports activities were offered close to participants’ homes and physical activity classes were given in groups. This approach seems most successful in participants with low social participation, as is shown by the significant interaction effect.
A limitation of this study is the fact that participants randomized to the intervention group were equally distributed over the two identified groups. Apart from the found interaction effects with the intervention effect, this makes our conclusions based on ob-servational data. As a result, the baseline characteristics that were found to increase the odds of following a favorable pattern of change in physical activity over time, increase these odds regardless of any intervention. Only the two variables with a significant

125
1
2
3
4
5
6
7
8
9
10
11
interaction with the intervention effect are success factors that increase the odds to benefit from a lifestyle intervention. Another limitation of the present study is the low amount of participants that followed a favorable pattern of change in physical activity over time, limiting the power of all applied tests. Therefore, found associations with a p-value between 0.01 and 0.05 should be interpreted with caution.
The findings of the effects of different longitudinal evolutions of change in physical activity on the incidence of knee OA are to be interpreted with caution. Although an increase in the odds of developing ACR knee OA was found in group 1, this finding could not be confirmed when looking at radiographic evaluations. Available evidence on the effect of increased physical activity on incident knee OA is not uniform. Some trials sug-gest no effect, some report a similar effect as found in the present study, while other trials suggest an effect opposite to the effect found in present study, although these findings are mostly based on cross sectional data29-32. A possible explanation for the fact that the present study found increased physical activity to be associated with a higher odds of developing knee OA could be that in this high risk population with up to 29% mild knee symptoms at baseline, an increase in physical activity in those participants that were not used to higher levels of physical activity, could have led to pain, which is a key factor in the ACR definition of knee OA. This finding has been found before in other populations33. Since no effect of the change in physical activity on K&L grades was found, no structural damage seems to have occurred in this group. However, MRI findings could provide more sensitive information on this matter. Nonetheless, these findings emphasize the importance of good supervision during a lifestyle intervention. When starting to encourage overweight participants who report low physical activity to increase their physical activity, an increase in knee complaints is to be expected. There-fore, in future trials but also in clinical practice, these patients should be supervised closely and informed accurately about the expected consequences.
The findings of an effect of the different longitudinal patterns of change in physical activity on incident knee OA could be biased by different a priori chances of develop-ing knee OA. As shown in Figure 2, group 1 started at a much lower level of physical activity than the reference group. It is possible that the a priori chance of developing knee OA was higher for this group, because of limited physical activity and other found less favorable baseline characteristics. However, this analysis was adjusted for baseline physical activity and all other possible measured confounders. However, unmeasured confounding could still have biased these results.
In conclusion, this is the first study to report on longitudinal evolutions of change in physical activity over time and successfully identified two subgroups with different trajectories over time during and after a lifestyle intervention. Participants with low physical activity and low social participation at baseline were more likely to increase their physical activity due to the intervention. Therefore, in future studies, but also in

126
clinical practice, lifestyle interventions aimed to increase physical activity should target these patients in particular. In addition, this study showed that in a population at high risk for knee OA, increased physical activity may lead to increased pain of the knees, but fortunately not to structural changes, a finding which has been found before in other populations. Therefore, careful supervision and education about this problem should be considered when promoting increased physical activity in this population. These con-clusions emphasize the need to personalize lifestyle interventions to patients’ individual characteristics, as recommended in literature before34.
127
1
2
3
4
5
6
7
8
9
10
11
reFerenCes
1. Warburton DER, Nicol CW, Bredin SSD. Health benefits of physical activity: the evidence. Can Med Assoc J 2006; 174(6): 801-09.
2. Shaw K, Gennat H, O’Rourke P, et al. Exercise for overweight or obesity. Cochrane Db Syst Rev 2006(4).
3. Pronk NP, Remington PL, Serv CP. Combined Diet and Physical Activity Promotion Programs for Prevention of Diabetes: Community Preventive Services Task Force Recommendation Statement. Ann Intern Med 2015; 163(6): 465-+.
4. Volger S, Wadden TA, Sarwer DB, et al. Changes in eating, physical activity and related behaviors in a primary care-based weight loss intervention. Int J Obesity 2013; 37: S12-S18.
5. Pace WD, Lanigan AM, Staton EW, et al. Effectiveness of 2 Methods of Promoting Physical Activity, Healthy Eating, and Emotional Well-Being With the Americans in Motion-Healthy Interventions Approach. Ann Fam Med 2013; 11(4): 371-80.
6. Tudor-Locke CE, Myers AM. Challenges and opportunities for measuring physical activity in sedentary adults. Sports Med 2001; 31(2): 91-100.
7. Wendel-Vos GCW, Schuit AJ, Saris WHM, et al. Reproducibility and relative validity of the Short Questionnaire to Assess Health-enhancing physical activity. J Clin Epidemiol 2003; 56(12): 1163-69.
8. Harris T, Kerry SM, Victor CR, et al. Does a complex intervention by primary care nurses increase walking in older people? Outcomes at 3 and 12 months in the PACE-Lift (Pedometer Accelerom-eter Consultation Evaluation-Lift) cluster-randomised controlled trial. Lancet 2014; 384: 3-3.
9. Helmerhorst HJF, Brage S, Warren J, et al. A systematic review of reliability and objective criterion-related validity of physical activity questionnaires. Int J Behav Nutr Phy 2012; 9.
10. Douketis JD, Macie C, Thabane L, et al. Systematic review of long-term weight loss studies in obese adults: clinical significance and applicability to clinical practice. Int J Obes (Lond) 2005; 29(10): 1153-67.
11. Reiner M, Niermann C, Jekauc D, et al. Long-term health benefits of physical activity - a systematic review of longitudinal studies. Bmc Public Health 2013; 13.
12. Wadden TA, Butryn ML, Hong PS, et al. Behavioral treatment of obesity in patients encountered in primary care settings: a systematic review. JAMA 2014; 312(17): 1779-91.
13. Jung T, Wickrama KAS. An introduction to latent class growth analysis and growth mixture model-ing. Social and Personality Psychology Compass 2008; .2(1): pp.
14. Clark SL, Muthén B. Relating latent class analysis results to variables not included in the analysis. Submitted for publication 2009.
15. Wraith D, Wolfe R. Classifying patients by their characteristics and clinical presentations; the use of latent class analysis. Respirology 2014; 19(8): 1138-48.
16. Runhaar J, van Middelkoop M, Reijman M, et al. Prevention of Knee Osteoarthritis in Overweight Females: The First Preventive Randomized Controlled Trial in Osteoarthritis. Am J Med 2015; 128(8): 888-+.
17. de Vos BC, Runhaar J, Verkleij SPJ, et al. Latent class growth analysis successfully identified sub-groups of participants during a weight loss intervention trial. J Clin Epidemiol 2014; 67(8): 947-51.
18. Altman R, Asch E, Bloch D, et al. Development of criteria for the classification and reporting of osteoarthritis. Classification of osteoarthritis of the knee. Diagnostic and Therapeutic Criteria Committee of the American Rheumatism Association. Arthritis Rheum 1986; 29(8): 1039-49.

128
19. Kellgren JH, Lawrence JS. Radiological assessment of osteo-arthrosis. Ann Rheum Dis 1957; 16(4): 494-502.
20. de Vos BC, Runhaar J, van Middelkoop M, et al. Long-term effects of a randomized, controlled, tailor-made weight-loss intervention in primary care on the health and lifestyle of overweight and obese women. Am J Clin Nutr 2016.
21. de Hollander EL, Zwart L, de Vries SI, et al. The SQUASH was a more valid tool than the OBiN for categorizing adults according to the Dutch physical activity and the combined guideline. J Clin Epidemiol 2012; 65(1): 73-81.
22. Xie F, Gaebel K, Perampaladas K, et al. Comparing EQ-5D Valuation Studies: A Systematic Review and Methodological Reporting Checklist. Med Decis Making 2014; 34(1): 8-20.
23. Hildebrandt VH, Ooijendijk WTM, Stiggelbout M. Trendrapport bewegen en gezondheid 1998/1999. Koninklijke vermande, Lelystad 1999.
24. Nylund KL, Asparoutiov T, Muthen BO. Deciding on the number of classes in latent class analysis and growth mixture modeling: A Monte Carlo simulation study. Struct Equ Modeling 2007; 14(4): 535-69.
25. Vermunt JK. Latent Class Modeling with Covariates: Two Improved Three-Step Approaches. Polit Anal 2010; 18(4): 450-69.
26. Asparouhov T, Muthen B. Auxiliary Variables in Mixture Modeling: Three-Step Approaches Using Mplus. Struct Equ Modeling 2014; 21(3): 329-41.
27. Illingworth KD, El Bitar Y, Siewert K, et al. Correlation of WOMAC and KOOS scores to tibiofemoral cartilage loss on plain radiography and 3 Tesla MRI: data from the osteoarthritis initiative. Knee Surg Sport Tr A 2014; 22(7): 1649-58.
28. Buckland-Wright JC, Wolfe F, Ward RJ, et al. Substantial superiority of semiflexed (MTP) views in knee osteoarthritis: a comparative radiographic study, without fluoroscopy, of standing ex-tended, semiflexed (MTP), and schuss views. J Rheumatol 1999; 26(12): 2664-74.
29. Barbour KE, Hootman JM, Helmick CG, et al. Meeting Physical Activity Guidelines and the Risk of Incident Knee Osteoarthritis: A Population-Based Prospective Cohort Study. Arthrit Care Res 2014; 66(1): 139-46.
30. Felson DT, Niu J, Yang T, et al. Physical activity, alignment and knee osteoarthritis: data from MOST and the OAI. Osteoarthr Cartilage 2013; 21(6): 789-95.
31. Lo GH, McAlindon TE, Driban J, et al. Recent leisure physical activity level is not associated with increased odds of incident knee osteoarthritis - data from the Osteoarthritis Initiative. Osteoarthr Cartilage; 21: S248.
32. Sutton AJ, Muir KR, Mockett S, et al. A case-control study to investigate the relation between low and moderate levels of physical activity and osteoarthritis of the knee using data collected as part of the Allied Dunbar National Fitness Survey. Ann Rheum Dis 2001; 60(8): 756-64.
33. Wideman TH, Finan PH, Edwards RR, et al. Increased sensitivity to physical activity among indi-viduals with knee osteoarthritis: Relation to pain outcomes, psychological factors, and responses to quantitative sensory testing. Pain 2014; 155(4): 703-11.
34. Gay C, Chabaud A, Guilley E, et al. Educating patients about the benefits of physical activity and exercise for their hip and knee osteoarthritis. Systematic literature review. Annals of Physical and Rehabilitation Medicine.


1
2
3
4
5
6
7
8
9
10
11
Chapter 9 General Discussion


133
1
2
3
4
5
6
7
8
9
10
11
Therapeutic options in knee osteoarthritis which are applicable to and cost-effective for large groups of patients are unfortunately still limited and fall short in alleviating the high and increasing global burden of this disease1-3. Current evidence emphasizes the need for preventive strategies in knee osteoarthritis, both primary and secondary3 4. However, despite literature recommendations to shift focus from therapy to prevention, trials investigating primary prevention of clinical knee osteoarthritis are still scarce5 6. In order to effectively prevent a disease, to lower its incidence, a modifiable risk factor needs to be identified. Trials investigating risk factors for knee osteoarthritis identified obesity as an important and prevalent factor in the etiology and a promising target for primary prevention3 7 8. This thesis evolves around the relationship between obesity and knee osteoarthritis, the role of this relationship in primary prevention and the translation of this concept into clinical practice. Data from the PROOF study, the first randomized controlled trial in the prevention of clinical knee osteoarthritis, was used to investigate these concepts. To recapitulate, the main aims of this thesis were to describe:1. The effectiveness of a tailor-made lifestyle intervention in achieving a clinically
significant amount of weight loss in middle-aged, overweight women2. The effect of this achieved weight loss on the incidence of knee osteoarthritis3. The long-term intervention effects of the PROOF study on both health outcomes and
incident knee osteoarthritis
main FinDings
The tailor-made lifestyle intervention of the PROOF study, consisting of diet and exer-cise and aimed to reduce body weight, proved to be effective in achieving a clinically significant amount of weight loss in the short term, with twice as many participants in the intervention group that achieved the goal of losing 5 kg or 5% baseline body weight after 6 months. However, as reported in Chapter 2, at the end of the intervention, 2.5 years after randomization, no significant differences between the randomized groups were found. Secondary outcome measures, such as physical activity and nutritional habits, showed the same response pattern. Low compliance to the intervention and unexpectedly high figures of weight loss in the control group may have contributed to the absence of a significant difference in weight loss between the randomized groups at the end of the intervention. Secondary analyses of all body weight data collected in these first 2.5 years showed that weight that was lost during this period, was in fact, to a large extent, recently gained weight. Chapter 3 shows that weight gain in the year preceding randomization and a low body weight around the fortieth life year of the participants was predictive of higher odds to lose weight during the intervention. No factors were found that increased the odds to benefit from the lifestyle intervention. As

134
an exploratory analysis, Chapter 4 shows that the group of participants that reached the goal of losing 5 kg or 5% or their baseline body weight at the end of the intervention, in fact had a significantly lower incidence of knee osteoarthritis 2.5 years after randomiza-tion (15% versus 20%, adjusted odds ratio: 0.5, 95% CI: 0.3, 0.9). Despite limitations of this analysis, a proof-of-concept is provided that the association between weight loss in a high risk, overweight population and the development of knee osteoarthritis is at least plausible. However, this finding could not be confirmed by a secondary analysis using the subgroups identified in Chapter 3. The analysis described in Chapter 5 could not find a significant association between weight change trajectories and progression of MRI features of knee osteoarthritis, such as bone marrow lesions, meniscal extrusion and osteophytes. A possible explanation for the absence of such an association is the finding that at baseline, prevalence of the above mentioned MRI features were already very high, possibly indicating that these participants already passed a ‘point of no return’ regarding articular damage assessed by MRI, which continued to deteriorate despite changes in body weight. Additionally, the period of 2.5 years could be too short to bring about changes in the ongoing process of structural decline in knee osteoarthritis. In the long-term, the PROOF study did prove to have an effect on behavioral changes. As described in Chapter 6, the intervention group showed a significant increase in daily physical activity, a sustainable effect that even increased over time. However, changes in body weight decreased over time and were not significant at the end of the total follow-up time, 6.5 years after randomization. Per protocol analyses showed greater effects for weight changes, but not for changes in physical activity, giving rise to the question as to how participants were motivated to increase their physical activity. Unfortunately, long-term intervention effects on incident knee osteoarthritis were not found. Chapter 7 shows no significant intervention effects on incident knee osteoarthritis after 6.5 years, despite the fact per protocol effects were greater than intention-to-treat effects for the lifestyle intervention. Such a trend was not seen for the glucosamine intervention. As a proof-of-concept, the incidence of knee osteoarthritis was compared between partici-pants that lost 5 kg or 5% of their baseline body weight after the first year of follow-up and participants that did not reach this goal, indicating again beneficial effects of reach-ing this goal on incident knee osteoarthritis, as found in Chapter 4. Lastly, Chapter 8 studies in detail the evolutions over time of change in physical activity, using the same technique as used in Chapter 3. A group of 42 participants was identified with a favor-able evolution of change in physical activity over the total follow-up time, compared to the other participants, that showed little change in physical activity over time. The group with the favorable changes was a group with less favorable baseline characteris-tics, such as baseline physical activity, social participation and educational level. These findings suggest that careful selection of participants for specific interventions could

135
1
2
3
4
5
6
7
8
9
10
11
contribute to efficiency and cost-effectiveness of such interventions, yielding highest benefits in specifically targeted populations, i.e. to apply personalized medicine.
health anD liFestyle OutCOmes
For centuries, weight loss has been the subject of many studies in virtually all cultures around the world. The last few decades many systematic reviews were published reporting on the efficacy and effectiveness of interventions aimed to lose weight in overweight and obese populations9 10. Many of these lifestyle interventions took place in primary care, which is often considered the most apt environment to study such inter-ventions11 12. For an intervention to have an impact on the worldwide burden of obesity, it needs to be applicable on a very large scale13. Conducting trials in primary practice makes the translation from study results to clinical practice easiest, since populations in primary practice are more representative for the general population than specialist settings. In order for the results of the weight loss intervention of the PROOF study to be easily translated to clinical practice, it was important to minimize dropout rates. The tailor-made character of the lifestyle intervention and the motivational interviewing techniques of the dieticians were expected to contribute to low dropout rates, high compliance rates and sustainability of the achieved behavioral changes14. A recently published review identified these two factors, a tailored intervention and motivational interviewing, as predictors of success in achieving long-term obesity-related lifestyle changes15. Dropout rates after one and after 2.5 years of follow-up were indeed markedly lower than average dropout rates reported in obesity trials: Chapter 2 reports a dropout rate of 9.6% after one year and 11.3% after 2.5 years. Reviews estimate average dropout rates in obesity trials to be as high as approximately 40% in the first twelve months16 17. However, as described in Chapter 6, after 6.5 years of follow-up, data was available for just 60.7% of all participants. 2.5 years after randomization, at the end of the interven-tion, all participants were requested permission to contact them 4 years later for these additional measurements. Despite the fact such a ‘post-intervention’ follow-up time was recommended in literature18, in order to take weight regain after the end of the inter-vention into account, very few trials reported this in their results14 19. In fact, very few trials reported follow-up times beyond 30 months altogether. Therefore, it is difficult to compare this dropout rate with other lifestyle interventions. Based on the low dropout rates in the first 2.5 years of follow-up, we expect this rate not to be among the high-est of dropout rates, when more lifestyle trials would follow their participants for such a long time, including follow-up time after the end of the intervention. Nonetheless, such high amounts of missing data cause high uncertainty and make it difficult to draw conclusions, as best illustrated in Chapter 7. Therefore, it is of the utmost importance
136
to consider additional means to minimize dropouts, when designing lifestyle interven-tion trials with long follow-up periods. We expect electronic tools could be of assistance here, such as mobile apps and online questionnaires.
Compliance rates were expected to be higher than in comparable trials, because of the pragmatic design with the tailor-made intervention and the motivational interview-ing skills all dieticians were trained in. For the diet and exercise intervention, compliance was difficult to determine, because every participant had different goals. However, as described in Chapter 6, there were few participants with high compliance figures for both diet and exercise. A proposed reason for these low compliance rates despite efforts in the design to maximize these, is the high level of motivation at baseline: 88% of all participants preferred to be randomized to the intervention group. Possibly motivational interviewing would have greater effects in a less motivated population. Moreover, the intervention could have been tailored to the individual needs more. In the PROOF study, all participants were offered counselling on both nutritional habits and physical exercise, as recommended in literature. However, as illustrated in Chapter 8, participants that reported a high baseline physical activity, showed very little changes in physical activity over time. Perhaps higher effectiveness could be achieved when participants were only offered counselling in what they need, in their own opinion. As said before, personalized medicine seems to be the key here.
Sustainable behavioral changes were expected when designing the PROOF study. Re-garding physical activity, Chapter 6 shows long-term effects indeed. However, the sec-ondary analysis described in Chapter 8 shows the group of participants that increased their physical activity significantly was in fact a small group. Also, these long-term behavioral changes did not seem to have a large effect on body weight, as illustrated by small changes in weight change over time that seemed to decrease over time as well. Furthermore, the changes in physical activity over time were not attributable to compliance to the intervention. In Chapter 6 this is shown by the fact that per protocol analyses showed no greater effects on change in physical activity than intention-to-treat effects. For weight change, per protocol effects were greater than intention-to-treat effects. Additionally, the proportion of participants randomized to the intervention group was not significantly different in the two groups identified in Chapter 8, which represented different longitudinal evolutions of change in physical activity. Taking this into consideration, the question come to mind as to what caused the participants in the intervention group to increase, on average, their physical activity markedly more than the participants in the control group did. In Chapter 8, it is shown that participants with a low baseline physical activity level and a low social participation were more likely to benefit from the intervention, regarding their physical activity. The relatively small group of participants that increased their physical activity accordingly, caused for a large part the mean differences between the randomized groups. Possibly, when targeting

137
1
2
3
4
5
6
7
8
9
10
11
participants with particular characteristics such as these, lifestyle interventions could yield more benefits and be more efficient in improving health.
An additional argument to specifically target participants for a lifestyle intervention, is to be found in the findings of Chapter 3. Here, it becomes clear that a large part of the relatively small group of participants that lost a clinically significant amount of weight during the trial, were in fact participants that were lower in body weight earlier in life, than they were at commencement of the intervention. Naturally, when address-ing obesity as a whole, an intervention is needed that achieves weight loss in as large a group of individuals as possible. But when the aim of an intervention is to prevent knee osteoarthritis, highest yields are to be expected when selecting those individuals that were not high in body weight their entire lives, thus creating a group with high prob-ability of successfully losing weight. The disadvantage of such an approach is that such an intervention would not be applicable to all overweight individuals or to all patients at high risk of knee osteoarthritis, but the upside would be that with less resources, weight loss in more individuals could be achieved, thus achieving higher cost-effectiveness. Maybe one lifestyle intervention that is applicable to large groups of individuals is a utopian endeavor and a more realistic picture of the future would be a variety of avail-able interventions from which a general practitioner for instance, could choose the most appropriate for each individual. This approach seems successful in other areas of behavioral changes, such as smoking cessation20 21.
In conclusion, the lifestyle intervention of the PROOF study was capable of achieving long-term behavioral changes, however only in a small proportion of participants. More-over, these changes did not result in significant changes in body weight in the long-term. Compliance and dropout rates remain difficult issues and careful consideration of minimizing these problems is essential. Personalized medicine seems promising in contributing to successful lifestyle interventions and in achieving a clinically significant amount of weight loss in an as large as possible proportion of participants, lowering the numbers needed to treat and improving cost-effectiveness.
PreVentiOn OF Knee OsteOarthritis
The PROOF study was the first randomized controlled trial in the prevention of clinical knee osteoarthritis22. Previously published studies on the prevention of knee osteoar-thritis often reported promising results on intermediate outcome measures, such as cartilage thickness or knee pain23 24. In the PROOF study, no significant intervention effects on incident knee osteoarthritis were found after 2.5 years of both the diet and exercise program and the glucosamine22. Prolonging the follow-up time was expected to result in greater effects. However, as described in Chapter 7, the high dropout rate

138
impeded straightforward interpretation of the results. A completers’ analysis showed no significant intervention effects, but was undoubtedly biased, since this analysis only results in accurate estimates when the missing mechanism is missing at random, which is very rare in clinical trials25. According to literature recommendations, multiple impu-tation was performed. However, unrealistically high estimates of knee osteoarthritis incidence and reversed effects for participants with missing data led to questions about the reliability of the results of the multiple imputation. Reports from literature confirm that high amounts of missing data, especially on the outcome, and the mechanism of missing data, especially missing not at random, can cause biased results from multiple imputation and even introduce bias that was not present in the completers’ analysis26 27. A third analysis was performed in Chapter 7, estimating the effects when no interven-tion effect at all would be present in all participants with missing data. This analysis showed similar results as the completers’ analysis: no significant intervention effects, but greater effects for the diet and exercise intervention in the per protocol analysis than in the intention-to-treat analysis, indicating a possible effect, would compliance have been higher. For glucosamine, such a trend was not found. Which of these three analyses provided reliable estimates, remains a difficult issue. Probably, all three analyses were biased. However, assuming that reversed intervention effects in participants with miss-ing data with respect to participants with complete follow-up data are very unlikely to occur, the third analysis shows the most pessimistic results. Assuming that it is very unlikely that intervention effects in participants with missing data were more favorable than in participants with complete follow-up data, the completers’ analysis shows the most optimistic results. Under these assumptions, the true estimates lie somewhere in between estimates from the completers’ analysis and the third analysis, the sensitivity analysis. Since these two analyses lead to the same conclusions, these conclusions seem reliable, provided that the aforementioned assumptions are met.
Regardless of the intervention effects, we wanted to investigate whether weight loss in itself could prevent incident knee osteoarthritis. Because actual differences in weight loss between the randomized groups were smaller than expected, we concluded that above described analyses did not answer this question. For this reason, the exploratory analysis in Chapter 7 was performed where all participants that achieved the goal of losing 5 kg or 5% of their body weight in the first year of the study were compared with all participants that did not reach this goal. Losing this amount in the period of one year seemed like an achievable goal and possibly a goal that can be used in clinical practice as recommendation to individuals at high risk for knee osteoarthritis. All three analyses showed preventive effects of achieving this goal, the completers’ analysis and the worst case analysis showing significant results. However, this group of participants had different baseline characteristics than participants that did not reach this goal and therefore, not the same a priori odds of developing knee osteoarthritis. Adjustment

139
1
2
3
4
5
6
7
8
9
10
11
of confounding variables obviated this problem to a certain extent, but unmeasured confounding could have still caused bias.
The association between actual weight loss and incident knee osteoarthritis has been studied in several ways using data from the PROOF study. In Chapter 4 an association was found using cross-sectional data from 2.5 years after randomization. The same conclusion was reached: the results suggest a preventive effect of losing 5 kg or 5% body weight on incident knee osteoarthritis, however, unmeasured confounding could have biased these results. No significant association could be found when comparing incidence numbers of MRI features of knee osteoarthritis between the identified latent classes representing different evolutions of weight change over time, as described in Chapter 5. Here, it is found that incidence of these MRI features was already very high at baseline, and it was suggested that in order for weight loss to have an effect on these features, an intervention should aim at younger individuals at risk of knee osteoarthritis.
In summary, no long-term preventive effects on incident knee osteoarthritis of both the diet and exercise intervention or the glucosamine were found. Indications of an ef-fect of the diet and exercise program were found, but not for the glucosamine. To study the direct effect of weight loss on incident knee osteoarthritis proved to be difficult, since randomization is broken that way. Two studies found a preventive effect of losing 5 kg or 5% baseline weight on incident knee osteoarthritis, but this was not confirmed by a third study, investigating the association between longitudinal weight changes and incidence of MRI features of knee osteoarthritis. To truly investigate the effect of weight loss on incident knee osteoarthritis, greater differences in weight change between the randomized groups would be needed, or perhaps propensity score matching could provide better controlling of confounding variables28.
imPliCatiOns FOr CliniCal PraCtiCe anD Future stuDies
The findings presented in this thesis could be of assistance in clinical practice to the general practitioner in a number of ways. First of all, it is illustrated that achieving a moderate amount of weight loss in a substantial proportion of a group of overweight women aged 50 to 60 seems to be a Herculean task. 88% of all participants enrolled in the study indicated to prefer being randomized to the diet and exercise intervention, all participants randomized to the lifestyle intervention were offered dietician counselling and physiotherapist guidance for free, goals were moderate and determined in dialogue and all participants were offered the additional incentive of preventing knee osteoar-thritis, next to other well-known incentives for weight loss, regarding cardiovascular, malignant and degenerative diseases. Despite all these facts, average weight loss figures and proportions of participants that achieved the goal of losing 5 kg or 5% baseline

140
weight, were disappointing. The latter is illustrated in Figure 1, a Venn diagram show-ing all participants who were 5 kg or 5% below their baseline body weight at a given time point and the overlap of the groups of participants that had achieved this goal at the indicated time points. It becomes very clear that overlap is low, indicating that very few participants that achieved this goal at some point during the study, actually maintained their lower body weight from that point on. The PROOF study is the first interventional study showing weight changes over a period of more than 30 months14. What this means for the general practitioner, and for his or her patient with a request for help with their overweight, is that they both realize the chance of success is low and the required dedication should be high. The proportions of participants that succeeded in achieving the goal of losing 5 kg or 5% baseline weight in the PROOF study were comparable to proportions of people that generally succeed in the cessation of smoking (approximately 15-20%)29. Maybe an approach used commonly in smoking cessation, the stages of change model, could be of assistance in guiding the general practitioner to advice and coach his or her overweight patients, as has been suggested in literature30. Taking into consideration the level of motivation of the patient, in addition to the low chance of success, could aid the general practitioner in counselling and in targeting spe-cific patients for specific interventions, what brings us back to personalized medicine.
6 months
12 months
24 months
30 months
18 months80 months
10
5
3 22
5
18
2
5 0
0 1
0
1
2
6
6
1
0
0
5
0
0 2
0 1
0 0
0 1
0 1
0
0 3
3 6
3 0 0
0
0
1 0
6 0
1 4 1 0
0 0
0
0
0
0 0 0
0
2
0
2
1
3
(42)
(47)(45)
(61)
(53)
(39)
Figure 1 Venn diagram showing groups of participants that achieved the goal of losing 5 kg or 5% of their baseline body weight at each given time point after baseline and their overlapVenn diagram made using a web-based tool from Heberle et al31.

141
1
2
3
4
5
6
7
8
9
10
11
As mentioned earlier in this chapter, subgroup analyses show that specific targeting of participants for specific interventions could increase efficacy and cost-effectiveness of lifestyle interventions. Personally, I believe that the upside of this approach, higher yields of weight loss in groups of overweight individuals, outweighs the downside of interventions not being applicable to all overweight individuals. This way, the largest group of overweight individuals could be helped with the smallest amount of required resources. Searching for an intervention that yields high success rates in large, hetero-geneous groups of individuals seems inefficient, even if the intervention is tailor-made, as was the case in the PROOF study. A tailor-made intervention still offers the same key ingredients of a lifestyle intervention to all participants, namely diet and exercise. Rapid developments in genetic mapping and molecular epidemiology could make it possible to offer personalized advice about what specific approaches should be considered by every specific patient32. Different types of diet and different physical activity schemes would expand the tool kit of the general practitioner. Additionally, specialist interven-tions such as bariatric surgery or pharmacological intervention should be considered33 34. Therefore, in future studies on the prevention of osteoarthritis through weight loss, we recommend to offer a highly personalized intervention strategy, with a wide range of interventional options or specialist referral available, in order to achieve sustainable life-style changes. Another strategy could be to offer a less personalized intervention, but to select eligible participants with a high chance of benefit from that specific intervention. Naturally, this would be a choice at the expense of generalizability. However, the true preventive effects of weight loss on incident knee osteoarthritis could be studied more reliably this way.
The recommendation of increased physical activity in lifestyle interventions involves certain difficulties. As shown in Chapter 8, increased physical activity can lead to an in-crease of knee complaints. Findings in earlier research on increased physical activity and knee osteoarthritis were not uniform, were often based on cross-sectional data and often involved patients already suffering from osteoarthritis, as opposed to the participants in the PROOF study35-37. Therefore, based on the findings in this thesis, it is recommended to inform overweight patients without knee osteoarthritis, of this possibility, when they want to increase their physical activity. Since no effect of increased physical activity on structural damage was found, and because such an effect has not been found before in literature, it seems justifiable to inform patients that this increase in pain does not neces-sarily indicate damage or progression of osteoarthritis. Consequently, education could motivate participants to maintain their increased physical activity, resulting in all known benefits, when they would cease otherwise. Naturally, careful accompaniment should be offered in lifestyle intervention studies in the prevention of knee osteoarthritis, thus increasing compliance.
142
The recruitment of participants in the PROOF study took place in primary care and implications consequently also concern primary care. However, the method used for inclusion was actually similar to open population inclusion. Cooperating general prac-titioners sent all women aged 50-60 registered at their practices a letter to inform them about the study and to consider participation when the self-reported BMI was 27 or higher. In contrast to inclusion during consultation, the initiative to make contact lay with the general practitioner, resulting in a population of participants that might not have consulted the general practitioner for their overweight on their own initiative. Data from the NIVEL Primary Care Database show registered prevalence numbers of 5.8% for overweight and 7.9% for obesity38.
Estimates of prevalence numbers are much higher than that, indicating that a large number of overweight patients do not consult their general practitioner for this reason39. Therefore, careful consideration is warranted before translating the conclusions in this thesis to the patient consulting the general practitioner for their overweight. The group of patients that actually consults the general practitioner for this reason, might be a selective sample of the population the participants of the PROOF study represent. Logi-cally, these patients would be more motivated and possibly already have some health complaints due to their overweight. It seems plausible to assume this higher motivation would lead to higher odds of benefit from a diet and exercise intervention. However, as is shown in Chapter 3 and Chapter 8, participants’ characteristics highly influence their odds of achieving sustainable behavioral changes. Taking all these factors into ac-count, I believe long-term behavioral changes are attainable for a large group of these patients. Certainly, when applying personalized medicine, a higher chance of success is to be expected than the chance of 15%-20% to achieve a clinically significant amount of weight loss that was found in the PROOF study.
In conclusion, findings of this thesis warrant more research on the preventive effect of weight loss on incident knee osteoarthritis, emphasizing the difficulties associated with achieving a significant amount of weight loss in a group of overweight individuals. Accomplishing higher efficiency of lifestyle interventions asks for a paradigm shift from designing interventions applicable to as many overweight individuals as possible to a strategy where the choice of intervention is dependent on certain characteristics of the individual, that determine the individual’s chance of success of a particular intervention.

143
1
2
3
4
5
6
7
8
9
10
11
reFerenCes
1. McAlindon TE, Bannuru RR, Sullivan MC, et al. OARSI guidelines for the non-surgical management of knee osteoarthritis. Osteoarthritis Cartilage 2014; 22(3): 363-88.
2. Breedveld FC. Osteoarthritis--the impact of a serious disease. Rheumatology (Oxford) 2004; 43 suppl 1: i4-8.
3. Roos EM, Arden NK. Strategies for the prevention of knee osteoarthritis. Nat Rev Rheumatol 2016; 12(2): 92-101.
4. Bijlsma JW, Knahr K. Strategies for the prevention and management of osteoarthritis of the hip and knee. Best Pract Res Clin Rheumatol 2007; 21(1): 59-76.
5. Kerkhof HJ, Bierma-Zeinstra SM, Arden NK, et al. Prediction model for knee osteoarthritis incidence, including clinical, genetic and biochemical risk factors. Ann Rheum Dis 2014; 73(12): 2116-21.
6. Jordan JM, Sowers MF, Messier SP, et al. Methodologic issues in clinical trials for prevention or risk reduction in osteoarthritis. Osteoarthritis Cartilage 2011; 19(5): 500-8.
7. Felson DT, Zhang Y, Anthony JM, et al. Weight loss reduces the risk for symptomatic knee osteoar-thritis in women. The Framingham Study. Ann Intern Med 1992; 116(7): 535-9.
8. Coggon D, Reading I, Croft P, et al. Knee osteoarthritis and obesity. Int J Obes Relat Metab Disord 2001; 25(5): 622-7.
9. Williams RL, Wood LG, Collins CE, et al. Effectiveness of weight loss interventions--is there a differ-ence between men and women: a systematic review. Obes Rev 2015; 16(2): 171-86.
10. Pronk NP, Remington PL, Community Preventive Services Task F. Combined Diet and Physical Activity Promotion Programs for Prevention of Diabetes: Community Preventive Services Task Force Recommendation Statement. Ann Intern Med 2015; 163(6): 465-8.
11. Moyer VA, Force USPST. Screening for and management of obesity in adults: U.S. Preventive Services Task Force recommendation statement. Ann Intern Med 2012; 157(5): 373-8.
12. Dietz WH, Baur LA, Hall K, et al. Management of obesity: improvement of health-care training and systems for prevention and care. Lancet 2015; 385(9986): 2521-33.
13. Flegal KM, Carroll MD, Kit BK, et al. Prevalence of obesity and trends in the distribution of body mass index among US adults, 1999-2010. JAMA 2012; 307(5): 491-7.
14. Wadden TA, Butryn ML, Hong PS, et al. Behavioral treatment of obesity in patients encountered in primary care settings: a systematic review. JAMA 2014; 312(17): 1779-91.
15. Teixeira PJ, Carraca EV, Marques MM, et al. Successful behavior change in obesity interventions in adults: a systematic review of self-regulation mediators. BMC Med 2015; 13: 84.
16. Moroshko I, Brennan L, O’Brien P. Predictors of dropout in weight loss interventions: a systematic review of the literature. Obes Rev 2011; 12(11): 912-34.
17. Dansinger ML, Gleason JA, Griffith JL, et al. Comparison of the Atkins, Ornish, Weight Watchers, and Zone diets for weight loss and heart disease risk reduction: a randomized trial. JAMA 2005; 293(1): 43-53.
18. Holzapfel C, Cresswell L, Ahern AL, et al. The challenge of a 2-year follow-up after intervention for weight loss in primary care. Int J Obes (Lond) 2014; 38(6): 806-11.
19. Booth HP, Prevost TA, Wright AJ, et al. Effectiveness of behavioural weight loss interventions delivered in a primary care setting: a systematic review and meta-analysis. Fam Pract 2014; 31(6): 643-53.

144
20. Chen YF, Madan J, Welton N, et al. Effectiveness and cost-effectiveness of computer and other electronic aids for smoking cessation: a systematic review and network meta-analysis. Health Technol Assess 2012; 16(38): 1-205, iii-v.
21. Westover AN, Kashner TM, Winhusen TM, et al. A systematic approach to subgroup analyses in a smoking cessation trial. Am J Drug Alcohol Abuse 2015; 41(6): 498-507.
22. Runhaar J, van Middelkoop M, Reijman M, et al. Prevention of knee osteoarthritis in overweight females: the first preventive randomized controlled trial in osteoarthritis. Am J Med 2015; 128(8): 888-95 e4.
23. Anandacoomarasamy A, Leibman S, Smith G, et al. Weight loss in obese people has structure-modifying effects on medial but not on lateral knee articular cartilage. Ann Rheum Dis 2012; 71(1): 26-32.
24. White DK, Neogi T, Rejeski WJ, et al. Can an intensive diet and exercise program prevent knee pain among overweight adults at high risk? Arthritis care & research 2015; 67(7): 965-71.
25. Elobeid MA, Padilla MA, McVie T, et al. Missing data in randomized clinical trials for weight loss: scope of the problem, state of the field, and performance of statistical methods. PLoS One 2009; 4(8): e6624.
26. Schafer JL, Olsen MK. Multiple Imputation for Multivariate Missing-Data Problems: A Data Ana-lyst’s Perspective. Multivariate Behav Res 1998; 33(4): 545-71.
27. Lee KJ, Carlin JB. Recovery of information from multiple imputation: a simulation study. Emerg Themes Epidemiol 2012; 9(1): 3.
28. Peikes DN, Moreno L, Orzol SM. Propensity Score Matching. The American Statistician 2008; 62(3): 222-31.
29. Hajek P, McRobbie H, Myers K. Efficacy of cytisine in helping smokers quit: systematic review and meta-analysis. Thorax 2013; 68(11): 1037-42.
30. Mastellos N, Gunn LH, Felix LM, et al. Transtheoretical model stages of change for dietary and physical exercise modification in weight loss management for overweight and obese adults. Cochrane Database Syst Rev 2014(2): CD008066.
31. Heberle H, Meirelles GV, da Silva FR, et al. InteractiVenn: a web-based tool for the analysis of sets through Venn diagrams. BMC Bioinformatics 2015; 16: 169.
32. Nicholson JK. Global systems biology, personalized medicine and molecular epidemiology. Mol Syst Biol 2006; 2: 52.
33. Douketis JD, Macie C, Thabane L, et al. Systematic review of long-term weight loss studies in obese adults: clinical significance and applicability to clinical practice. Int J Obes (Lond) 2005; 29(10): 1153-67.
34. Leblanc ES, O’Connor E, Whitlock EP, et al. Effectiveness of primary care-relevant treatments for obesity in adults: a systematic evidence review for the U.S. Preventive Services Task Force. Ann Intern Med 2011; 155(7): 434-47.
35. Barbour KE, Hootman JM, Helmick CG, et al. Meeting physical activity guidelines and the risk of incident knee osteoarthritis: a population-based prospective cohort study. Arthritis care & research 2014; 66(1): 139-46.
36. Felson DT, Niu J, Yang T, et al. Physical activity, alignment and knee osteoarthritis: data from MOST and the OAI. Osteoarthritis Cartilage 2013; 21(6): 789-95.
37. Lo GH, McAlindon TE, Driban J, et al. Recent leisure physical activity level is not associated with increased odds of incident knee osteoarthritis - data from the Osteoarthritis Initiative. Osteoar-thritis and Cartilage; 21: S248.

145
1
2
3
4
5
6
7
8
9
10
11
38. MMJ N, I S, R D, et al. Incidentie en prevalentie van gezondheidsproblemen in de Nederlandse hui-sartsenpraktijk in 2014. Uit: NIVEL Zorgregistraties eerste lijn [internet]. . wwwnivelnl/node/4309 2015.
39. James WP. WHO recognition of the global obesity epidemic. Int J Obes (Lond) 2008; 32 suppl 7: S120-6.


1
2
3
4
5
6
7
8
9
10
11
Summary


149
1
2
3
4
5
6
7
8
9
10
11
Knee osteoarthritis (OA) is a degenerative condition which is characterized by knee pain, morning stiffness, functional limitation and bony enlargement. The cause of osteoarthri-tis is not yet entirely clear, but probably mechanical loading and metabolic processes are the most important factors. Knee OA is a very common and disabling disease, resulting in a high burden worldwide. Unfortunately, therapeutic options for knee osteoarthritis are limited. Non-surgical management can contribute to less pain and better manage-ment of the disease, but surgery is the only option in which the disease is removed altogether. However, surgery remains only available for a subset of patients, and is only effective in those patients with advanced osteoarthritis. Moreover, knee replacement surgery often does not result in a totally pain free and disability free situation.
When therapeutic options are limited and the burden of a disease is high, highest benefits are to be expected from primary prevention. In order to prevent a disease, risk factors need to be identified that can be modified before the disease starts to manifest. The main risk factors for knee OA are ageing, obesity, female gender, knee injury in the past and heredity. Obviously, obesity and knee injury are the only modifiable risk fac-tors. To investigate the effect of decreasing knee injury on the development of knee OA would require following participants of a study for as long as 30-40 years, because knee OA develops later in life and most knee injuries occur early on in life. Obesity on the other hand, can be modified at any given moment in a participant’s life. Therefore, modifying obesity seems the most eligible choice when studying the prevention of knee OA.
Obesity of course, is very common in developed countries and there are ample strate-gies to lower its incidence. The combination of diet and exercise often proved to be more effective than the sum of its components. The most important problem in losing weight is regain of the weight that was lost. In order to modify obesity as a strategy to prevent knee OA, long-term behavioural changes and sustainable weight loss should be accomplished.
The PROOF study (PRevention of knee Osteoarthritis in Overweight Females) was the first randomized controlled trial in the prevention of knee OA. The aim of this trial was to study the preventive effects of a diet and exercise intervention and of oral glucosamine sulfate. The diet and exercise intervention consisted of frequent appointments with a dietician and attendance of physical activity lessons, supervised by a physiotherapist. Participants were women aged 50-60 with a BMI ≥ 27 kg/m2 without knee OA. These cri-teria were chosen, because the incidence of knee OA peaks around the fiftieth life year and is highest in women. Half of all participants were randomized to a tailor-made diet and exercise program, the other half did not receive this active intervention. Indepen-dently of this lifestyle intervention, half of all participants were randomized to receive oral glucosamine sulfate, while the other half received placebo, without knowledge of what they received. This way, four different groups of participants were created, as il-

150
lustrated in Figure 1. The outcome of the PROOF study was incidence of knee OA, which was assessed 2.5 years after randomization and 6.5 years after randomization.
Chapter 2 focusses on the diet and exercise intervention and its effectiveness in achiev-ing a clinically significant amount of weight loss in the first 2.5 years of follow-up. The intervention proved to be effective in achieving weight loss in the short term, resulting in twice as many participants in the intervention group that achieved the goal of losing 5 kg or 5% of their baseline weight than in the control group six months after random-ization. The amount of weight loss achieved was comparable to that achieved in other studies dictating stricter, more intensive regimes of diet and exercise. However, mean weight changes were small and after 2.5 years, no significant differences were found between both groups. Probably, low compliance to the intervention contributed to the lack of any significant differences after 2.5 years. Participants attended the dietician and the offered physical activity lessons in low numbers and few of them achieved the goal of losing 5 kg or 5% of their baseline body weight.
When presenting mean weight changes, a common problem is that the proportion of participants that lost weight are leveled out by a proportion of participants that actually gained weight during the intervention. As a result, mean weight changes are often very low. To investigate the group of participants that did lose weight, a secondary analysis was performed on the weight data of the first 2.5 year. This analysis is described in Chapter 3. A technique called latent class growth analysis revealed three groups with distinctly different trajectories of weight change over time. It was found that assignment to the diet and exercise intervention lowered the chance to show a trajectory of weight gain over time. Moreover, the participants that showed a trajectory of weight loss over
randomization.
Figure 1. Randomization of participants over both interventions
DEP: diet and exercise program
Chapter 2
significant amount of weight loss in the first 2.5 years of follow-
No
DE
P
DE
PGlucosamine
Placebo
Figure 1. Randomization of participants over both interventionsDEP: diet and exercise program

151
1
2
3
4
5
6
7
8
9
10
11
time, were more likely to be high in baseline weight, low in body weight around their 40th life year and high in weight gain in the year preceding the study. Consequently, it was concluded that a large part of the weight change that was observed during the intervention, was in fact recently put on weight.
To further investigate the direct effect of weight loss on incident knee OA, a secondary analysis on the 2.5 year data was performed. In Chapter 4 the group of participants that achieved the goal of losing 5 kg or 5% baseline weight after 2.5 years was compared with all participants that did not achieve this amount of weight loss, regarding their incidence of knee OA. The primary outcome in this analysis consisted of three com-ponents: ACR (American College of Rheumatology) criteria, K&L (Kellgren & Lawrence) grades and joint space narrowing. ACR criteria are internationally regarded as standard in diagnosing clinical knee OA and make use of both clinical and radiographic data, K&L grades are radiographic evaluations and joint space narrowing was measured on plain radiographs. This composed outcome was used in order to make an analysis on incident knee OA over a relative short period of time feasible, since knee OA is a very slowly progressing disease. It was found that the group of participants that lost the defined amount of weight had a significantly lower incidence of knee OA. Additionally, blood glucose level, fat percentage and blood pressure were favorable in this group.
In Chapter 5 a different approach is used to investigate the direct relationship be-tween weight loss and knee OA. Progression of MRI features of knee OA was compared between participants with different weight changes during the first 2.5 years. For this analysis, the three groups that were identified in Chapter 3 were used. No differences in progression of MRI features were found between the groups. At baseline, prevalence of MRI features was very high in all groups. Possibly this high prevalence indicates that these high-risk participants were already at a point beyond salvation regarding articular damage assessed by MRI. Apparently the changes in body weight over 2.5 years were not enough to bring about noticeable changes in MRI features, which were probably already progressing for a long period of time.
The long-term effects of the PROOF Study were assessed 6.5 years after randomization. In Chapter 6 and Chapter 7 these results are presented and discussed. It was found that in the long-term, the difference in weight change between both randomized groups declined over time to no significant difference. Changes in physical activity however, increased over time, proving the effectiveness of the intervention to bring about long-term behavioural changes. However, these changes in behavioural patterns did not result in decreased incidence of knee OA. For both the diet and exercise intervention and the glucosamine intervention, no significant long-term intervention effects were found. For the diet and exercise intervention a trend was found that indicates a possible preventive effect on incident knee OA, that would be more noticeable when compliance would have been higher. For the glucosamine intervention, no such trend was found.

152
The group of participants that achieved the goal of losing 5 kg or 5% of their baseline body weight in the first year of the study did have a lower odds of developing knee OA. This finding served as a proof of principle that prevention of knee OA through weight loss is viable.
Finally, to further investigate the changes in physical activity during and after the lifestyle intervention, Chapter 8 reports on subgroups with different longitudinal evolu-tions of change in physical activity over time. The same technique was used as described in Chapter 3. It was found that a group of 42 participants showed a distinctly different pattern of physical activity than the remaining 345 participants. These 42 participants started at a considerably lower level of physical activity, showed a steep increase in the first 12 months, up to the level of the remaining participants, and remained quite stable after that. Low physical activity and low social participation at baseline increased the odds to show this pattern of change in physical activity. Therefore, it was concluded that an intervention aimed at increasing participants’ physical activity, is best offered to those individuals with low physical activity and social participation. Additionally, it was found that an increase in physical activity in this group can cause an increase in knee complaints. Therefore, careful supervision and education should be considered when promoting increased physical activity in this population. Chapter 9 discusses all main findings in the light of existing research and reports on recommendations for clinical practice and future research. In short, the difficulties of achieving a significant amount of weight loss in a population of overweight, middle-aged women are discussed, em-phasizing the need for higher efficiency of lifestyle interventions. A paradigm shift from interventions that are effective in as many overweight individuals as possible to a strat-egy where a number of different interventions could create an extensive toolkit to the general practitioner and where the choice of a particular intervention is dependent on certain individual characteristics could heighten overall efficiency of lifestyle interven-tions. This way, the search for the most effective lifestyle intervention in the treatment of obesity transforms in a search for which particular individuals benefit most from which intervention. Consequently, prevention of knee OA through weight loss could come one step closer through personalized medicine.


1
2
3
4
5
6
7
8
9
10
11
Samenvatting

156

157
1
2
3
4
5
6
7
8
9
10
11
Knie artrose is een degeneratieve aandoening die wordt gekenmerkt door knie pijn, ochtendstijfheid, functionele beperking en benige verdikking. De precieze oorzaak is nog niet helemaal duidelijk, maar mechanische belasting en metabole processen zijn waarschijnlijk de meest belangrijke factoren. Knie artrose is een zeer vaak voorkomende en invaliderende aandoening, wat resulteert in een hoge ziektelast wereldwijd. Helaas zijn de therapeutische opties voor knie artrose nog steeds beperkt. Conservatieve be-handeling kan bijdragen aan minder pijn en beter leren leven met de aandoening, maar chirurgie is de enige optie waarbij de ziekte echt wordt verwijderd. Chirurgie is echter al-leen een optie voor een beperkte groep patiënten en is alleen effectief bij patiënten met ver gevorderde artrose. Bovendien resulteert knie vervanging vaak niet in een pijnvrij en volledig functionerend gewricht.
Als therapeutische opties beperkt zijn en de ziektelast van een aandoening hoog is, resulteert primaire preventie vaak in de hoogste opbrengst. Om een aandoening te voorkomen, moeten risicofactoren geïdentificeerd worden die aangepast kunnen worden voordat de aandoening zich manifesteert. De belangrijkste risicofactoren voor het ontwikkelen van knie artrose zijn: hoge leeftijd, overgewicht, vrouwelijk geslacht, knieletsel in het verleden en erfelijke belasting. Overgewicht en knieletsel in het ver-leden zijn duidelijk de enige risicofactoren die zijn aan te passen. Om het preventieve effect te onderzoeken van een vermindering van knieletsel op het ontwikkelen van knie artrose, zou een onderzoek nodig zijn die de deelnemers 30 tot 40 jaar volgt, omdat knie artrose zich pas op latere leeftijd openbaart, terwijl de meeste knie letsels zich op jonge leeftijd voordoen. Overgewicht echter kan op elk willekeurig moment aangepast worden. Daarom is overgewicht de meest geschikte risicofactor bij onderzoek naar de preventie van knie artrose.
Het is alom bekend dat overgewicht zeer veel voorkomt in ontwikkelde landen en dat er veel strategieën ontwikkeld zijn om hier iets aan te doen. De combinatie van dieet en beweging blijkt vaak effectiever dan de som van zijn delen. Het belangrijkste probleem bij gewichtsverlies is het jojo-effect: gewicht dat verloren is, komt vaak snel weer terug. Om knie artrose te voorkomen door gewichtsverlies, zijn echter duurzame gedragsver-anderingen nodig en gewichtsverlies dat op de lange termijn volgehouden wordt.
De PROOF studie (PRevention of knee Osteoarthritis in Overweight Females) was de eerste gerandomiseerde gecontroleerde studie naar de preventie van knie artrose. Het doel van deze studie was om de preventieve effecten van een dieet en beweeg interventie en van oraal glucosamine sulfaat op de incidentie van knie artrose te onder-zoeken. De dieet en beweeg interventie bestond uit frequente afspraken bij een diëtiste en het bijwonen van fysieke activiteit lessen, gesuperviseerd door een fysiotherapeut. De interventie was in het bijzonder gericht op het bereiken van lange termijn gedrags-veranderingen en behoud van gewichtsverlies. Deelneemsters waren vrouwen van 50 tot 60 jaar met een BMI van 27 of hoger zonder knie artrose. Deze criteria zijn gekozen,

158
omdat de incidentie van knie artrose op zijn hoogst is rond het 50ste levensjaar en hoger is bij vrouwen dan bij mannen. Na randomisatie werd de helft van alle deelneemsters ingedeeld in de dieet en beweeg groep, de andere helft ontving geen actieve leefstijl-interventie. Onafhankelijk van deze randomisatie, werd nogmaals gerandomiseerd over het ontvangen van glucosamine of placebo. De deelneemsters en onderzoekers waren tijdens de studie niet op de hoogte wie glucosamine of placebo ontving. Op deze ma-nier ontstonden 4 groepen, zoals weergegeven in Figuur 1. De uitkomst van de PROOF studie was incidentie van knie artrose, wat werd bepaald na 2.5 jaar en na 6.5 jaar.
hoofstuk 2 evalueert specifiek de effectiviteit van de leefstijl interventie in het bereiken van een klinisch significante hoeveelheid gewichtsverlies in de eerste 2.5 jaar na rando-misatie. De interventie bleek effectief in het bereiken van gewichtsverlies op de korte termijn, wat resulteerde in twee keer zoveel deelneemsters in de interventiegroep dan in de controlegroep die het doel haalden om 5 kg of 5% van hun startgewicht af te vallen na 6 maanden. De hoeveelheid gewichtsverlies die werd bereikt was vergelijkbaar met vele andere studies die striktere, intensievere dieet en beweeg interventies voorschre-ven. De gemiddelde gewichtsveranderingen waren echter klein en na één jaar follow-up werden er geen significante verschillen meer gevonden tussen beide groepen. Waar-schijnlijk heeft een lage compliantie aan de interventie bijgedragen aan het ontbreken van significante verschillen na één jaar follow-up. De deelneemsters hebben de diëtiste maar weinig bezocht en weinig fysieke activiteit lessen bijgewoond. Bovendien heeft slechts een klein deel het doel bereikt om 5 kg of 5% van hun uitgangsgewicht af te vallen.
Figuur 1. Randomisatie van deelneemsters over beide interventies
DBP: dieet en beweeg programma
Hoofstuk 2
hun startgewicht af te vallen na 6 maanden. De hoe
werden er geen signif
jaar follow-up. De deelneemsters hebben de diëtiste maar weinig bezocht en
uitgangsgewicht af te vallen.
erg klein
Gee
n D
BP
DB
PGlucosamine
Placebo
Figuur 1. Randomisatie van deelneemsters over beide interventiesDBP: dieet en beweeg programma

159
1
2
3
4
5
6
7
8
9
10
11
Een veel voorkomend probleem bij studies naar gewichtsverlies is dat groepsgemid-delden vaak erg klein zijn, doordat het effect van de deelnemers die afvallen vaak teniet wordt gedaan door deelnemers die juist aankomen tijdens de studie. Om de groep deelneemsters van de PROOF studie die wel zijn afgevallen tijdens de studie nader te onderzoeken, is een secundaire analyse gedaan op de gewichtsdata van de eerste 2.5 jaar. Deze analyse is in hoofdstuk 3 beschreven. Een techniek genaamd ‘Latent Class Growth Analysis’ heeft drie subgroepen geïdentificeerd die een duidelijk van elkaar te onderscheiden beloop van gewichtsverandering in de tijd lieten zien. Deelneemsters gerandomiseerd in de leefstijl interventie hadden een lagere kans om een beloop van gewichtstoename te laten zien. De deelneemsters die een beloop van gewichtsafname lieten zien hadden een hogere kans om een hoog uitgangsgewicht te hebben, een relatief laag gewicht rond het veertigste levensjaar en gewichtstoename in het jaar voorafgaande aan de studie. Hieruit bleek dat een groot deel van het gewichtsverlies dat was geobserveerd tijdens de studie, in feite recent aangekomen gewicht was.
Om het directe effect van gewichtsverlies op de incidentie van knie artrose nader te onderzoeken, is een secundaire analyse gedaan met de data die in de eerste 2.5 jaar zijn verzameld. In hoofdstuk 4 worden alle deelneemsters die aan het eind van 2.5 jaar follow-up het doel hadden bereikt om 5 kg of 5% af te vallen vergeleken met alle deelneemsters die dit doel niet hadden bereikt. De incidentie van knie artrose na 2.5 jaar werd vergeleken tussen deze groepen. Omdat 2.5 jaar relatief kort is om de langzaam progressieve ziekte knie artrose te bestuderen, werd een samengestelde uitkomstmaat gebruikt in deze analyse. Deze uitkomstmaat bestond uit drie com-ponenten: ACR criteria (American College of Rheumatology), K&L scores (Kellgren & Lawrence) en gewrichtsspleet versmalling. ACR criteria worden internationaal gezien as standaard in het diagnosticeren van klinische knie artrose en maken gebruik van klinische en radiografische gegevens, K&L scores zijn radiografische beoordelingen en gewrichtsspleetversmalling werd gemeten op röntgen foto’s. De groep deelneemsters die waren afgevallen hadden een significant lagere incidentie van knie artrose. Ook had deze groep een lagere bloeddruk en glucose gehalte en een lager vetpercentage.
In hoofdstuk 5 wordt een andere benadering gebruikt om de relatie tussen gewichts-verlies en de incidentie van knie artrose te bestuderen. Progressie van kenmerken van knie artrose op MRI scans werd vergeleken tussen groepen met een verschillend beloop in gewichtsverandering tijdens de eerste 2.5 jaar. Voor deze analyse werden de drie groepen gebruikt die waren geïdentificeerd in hoofdstuk 3. Er werden geen signifi-cante verschillen in kenmerken van knie artrose gevonden tussen deze drie groepen. Bij de aanvang van de studie, was de prevalentie van eerder genoemde kenmerken op MRI scans al zeer hoog in alle groepen. Deze hoge prevalentie bij aanvang betekent mogelijk dat deze populatie van vrouwen met een hoog risico op knie artrose al op een ‘point of no return’ waren, wat betreft gewrichtsschade op MRI. Het blijkt dat de veranderingen

160
in lichaamsgewicht in 2.5 jaar niet genoeg waren om meetbare veranderingen in MRI kenmerken teweeg te brengen. Waarschijnlijk waren deze kenmerken al lang aanwezig.
De lange termijn resultaten van de PROOF studie zijn 6.5 jaar na aanvang van de studie geëvalueerd. Deze resultaten worden besproken in hoofdstuk 6 en hoofdstuk 7. Op de lange termijn blijkt het verschil tussen beide gerandomiseerde groepen in gewichtsverandering af te nemen tot geen significant verschil. Het verschil tussen beide groepen in verandering in fysieke activiteit neemt echter toe in de tijd. De leefstijlin-terventie bleek dus wel duurzame gedragsveranderingen teweeg te kunnen brengen. Deze gedragsveranderingen hebben echter niet geleid tot een lagere incidentie van knie artrose. Voor beide interventies, de leefstijl interventie en de glucosamine, werden geen significante interventie effecten gevonden. Voor de leefstijl interventie werd wel een trend gevonden, wat indiceert dat er mogelijk wel een significant effect zou kun-nen zijn gevonden, wanneer de compliantie hoger was geweest. Voor de glucosamine interventie werd een dergelijke trend niet gevonden. De groep deelneemsters die in het eerste jaar van de studie het doel bereikten om 5 kg of 5% af te vallen, had wel een lagere kans op het ontwikkelen van knie artrose. Deze bevinding toont aan dat het voorkomen van knie artrose door gewichtsverlies in principe wel mogelijk is.
Tot slot worden de veranderingen in fysieke activiteit tijdens en na de interventie bestudeerd in hoofdstuk 8. Voor deze analyse werd dezelfde techniek gebruikt als in hoofdstuk 3. Een groep van 42 deelneemsters werd geïdentificeerd die een duidelijk ander beloop in verandering van fysieke activiteit in de tijd liet zien dan de overige 345 deelneemsters. Deze 42 deelneemsters hadden een aanzienlijk lager niveau van fysieke activiteit bij aanvang van de studie, stegen snel in de eerste twaalf maanden tot het niveau van de overige deelneemsters, om daarna stabiel te blijven. Een laag niveau van fysieke activiteit en een laag niveau van sociale participatie verhoogde de kans om dit beloop in de tijd te volgen. Daarom werd geconcludeerd dat een leefstijl interventie, gericht op het verhogen van fysieke activiteit, het beste aangeboden kan worden aan mensen met een lage fysieke activiteit en sociale participatie. Daarnaast bleek uit deze analyse dat een verhoging van fysieke activiteit in deze groep kan leiden tot een toe-name van knie klachten. Daarom is het belangrijk om vrouwen van deze leeftijd met overgewicht die hun fysieke activiteit willen gaan verhogen, goed te begeleiden en te informeren over dit mogelijke effect.
In hoofdstuk 9 worden alle bevindingen in dit proefschrift besproken in het licht van bestaande literatuur en worden aanbevelingen gedaan voor de kliniek en onderzoek in de toekomst. Kort samengevat worden de obstakels besproken in het bereiken van een klinisch significante hoeveelheid gewichtsverlies in een populatie vrouwen van mid-delbare leeftijd met overgewicht, waarbij benadrukt wordt dat er efficiëntere leefstijl interventies nodig zijn. Er is een paradigmaverschuiving nodig van leefstijl interventies die effectief zijn bij zoveel mogelijk mensen naar een uitgebreid arsenaal van verschil-

161
1
2
3
4
5
6
7
8
9
10
11
lende interventies waarbij de keuze voor de meest geschikte interventie wordt genomen op basis van individuele persoonskenmerken, die de kans op succes zo groot mogelijk maken. Op deze manier wordt niet gezocht naar de meest effectieve interventie voor een grote groep mensen met overgewicht, maar wordt gezocht naar welke mensen de hoogste kans op succes hebben van welke interventie. Op deze manier komt de preven-tie van knie artrose door gewichtsverlies een stap dichterbij.


163
1
2
3
4
5
6
7
8
9
10
11
Dankwoord


165
1
2
3
4
5
6
7
8
9
10
11
Rond december 2009 mocht ik mij oriënteren op het keuze-onderzoek waarmee het eerste deel van mijn geneeskunde opleiding zou worden afgesloten, voordat ik aan mijn coschappen zou gaan beginnen. Een fase waarin ik getrokken werd naar de spe-cialistische opleidingen, deed mij een plan opstellen bij de afdeling maag- darm- en leverziekten. Onderzoek leek mij saai, maar ik hoopte mijn opleidingskansen hiermee te vergroten.
Er werd echter anders voor mij besloten. Ik moest eerst mijn coschappen gaan lopen, voordat ik toestemming kreeg om aan mijn keuze-onderzoek te beginnen. Dit besluit heeft mij gedwongen wat tijd ter bezinning te nemen over het onderzoek, wat heeft geleid tot een zeer bewuste switch naar de huisartsgeneeskunde. Als gevolg hiervan mocht ik in de periode van oktober 2011 tot maart 2012 een glimp opvangen van wat het was om onderzoek te doen bij de huisartsafdeling van het Erasmus MC. In deze periode begon ik onderzoek onverwachts erg leuk te vinden…
Donderdag 15 maart 2012, ‘des ochtends te 10:30 uur’, woonde ik een openbare verdediging van een proefschrift bij in Utrecht. Het was niet de eerste promotie die ik bijwoonde. Desalniettemin was het wel een plechtigheid die veel indruk op mij maakte. Het betrof namelijk de promotie van mijn zwager Bart, die promoveerde op het onderwerp ‘Ontaardingen van kubische viervouden en holomorfe symplectische meet-kunde.’ Na de plechtigheid was mijn begrip van het onderwerp niet noemenswaardig gegroeid, wat mijn fascinatie voor het fenomeen promotieonderzoek alleen maar deed toenemen. De timing van deze promotie was wat mij betreft perfect; ik rondde juist mijn keuze-onderzoek af, had er onverwachts heel veel plezier in gehad en begon mij te verdiepen in wat promotieonderzoek precies inhield. Bart, hartelijk dank voor deze uitstekende timing van het afronden van jouw promotietraject waarmee je, wellicht ten dele onbewust, mij hebt gestimuleerd tot wetenschappelijke vorming. Ik ben nog steeds diep onder de indruk.
Jos, jij was er vanaf het allereerste begin bij. Jij hebt mij op een heel leuke en leerzame manier wegwijs gemaakt in de wereld van onderzoek. Ik was onder de indruk van je ken-nis en kunde en had er plezier in hier zoveel mogelijk van te leren. Hartelijk dank voor de intensieve begeleiding tijdens mijn keuze-onderzoek, maar ook voor het onderhouden van contact daarna, wat uiteindelijk heeft geleid tot dit proefschrift. Ook in de periode van mijn promotieonderzoek ben ik onder de indruk gebleven en heb je me op een zeer prettige manier begeleid. Je creatieve ideeën over wat er allemaal wel niet mogelijk was met de data van de PROOF studie, je zeer laagdrempelige, bijna 24/7 bereikbaarheid en je stimulerende vragen hebben de fundering gevormd van mijn wetenschappelijke vorming. Zeer veel dank daarvoor.
Sita, ook jij hebt me vanaf het begin al gesteund met je advies en ideeën. Jouw cre-ativiteit heeft aan de basis van de PROOF studie en dus van dit proefschrift gestaan. Al gauw bleek jij onmisbaar bij het onderzoek wat ik deed; niet zelden was mijn to do

166
lijstje volledig op zijn kop gekeerd na overleg en gevuld met nieuwe ideeën waar ik zelf nooit op was gekomen. Deze verrijkende ideeën hebben samen met jouw persoonlijke betrokkenheid mijn wetenschappelijke vorming verdiept en daarmee dit proefschrift tot een hoger niveau getild. Hartelijk dank hiervoor.
Ik wil graag alle deelneemsters, huisartsen, fysiotherapeuten, diëtisten en onderzoek medewerkers van de PROOF studie bedanken. Jullie inspanningen hebben geleid tot een prachtig resultaat, wat heeft geleid tot nieuwe inzichten op het gebied van preven-tie van knie artrose.
In het bijzonder wil ik Diana bedanken voor al het harde werk dat zij in de PROOF studie heeft gestoken. Diana, vanaf het begin was mij al duidelijk dat jij een niet te verwaarlozen bijdrage aan de PROOF studie hebt geleverd. Op een recent congres in Amerika ontving ik nog complimenten over de uitstekende follow-up van de PROOF studie. Deze complimenten komen geheel toe aan jou.
Op de afdeling huisartsgeneeskunde heb ik mij zeer thuis gevoeld. De prettige, open sfeer heeft ervoor gezorgd dat ik met veel plezier naar mijn werk ging. Ik wil iedereen die aan deze sfeer heeft bijgedragen bedanken, maar in het bijzonder mijn kamergenoten: Carolien, Nynke, Marieke, Nadine, Anke, Toke, Marco, Kevin, Helen, Mirthe, Yvonne, Mohammed, Jos, Dieke, Wendy, Kelly en Rianne. Bijzondere dank gaat ook uit naar Saskia, dankjewel dat je mij hebt geleerd om Mplus te gebruiken. Ahlam, bedankt voor je bijdrage aan het onderzoek middels je keuze-onderzoek, ik vond het erg leuk om van elkaar te leren. Hanneke, dank voor je begeleiding bij het geven van onderwijs. Adinda, Carolien en Patrick, veel dank voor de gezellige trip naar Colorado Springs. Ik ben zeer dankbaar dat mij de kans is gegeven om een jaar lang op deze prachtige afdeling rond te lopen. Iedereen hartelijk bedankt daarvoor en voor de fijne sfeer!
Mijn familie en mijn vrienden ben ik ook veel dank verschuldigd. Dank jullie allemaal voor de getoonde interesse, maar vooral voor de nodige afleiding en relativering. Ik voel me oprecht heel gezegend en kan me geen fijnere familie en vriendenkring voorstellen!
Lieve Marieke, allereerst heel veel dank voor je eeuwige geduld met mij. Je hebt jarenlang alle verhalen aangehoord over analyses, artikelen en publicaties. Je hebt mijn zenuwen voor congressen en andere dingen verdragen, mijn getwijfel over wat ik wilde, je hebt het allemaal liefdevol ondergaan. Maar wat heb je dat goed gedaan, ik heb me oprecht gesteund gevoeld door jou, je hebt me altijd gestimuleerd, maar ook afleiding geboden in de perfecte verhouding. Marieke, ik hou van jou, ik heb je nodig en ben vereerd dat ik de rol van man in jouw leven op me heb mogen nemen!

167
1
2
3
4
5
6
7
8
9
10
11


1
2
3
4
5
6
7
8
9
10
11
Curriculum vitae


171
1
2
3
4
5
6
7
8
9
10
11
Bastiaan de Vos is geboren op 2 mei 1988 te Sliedrecht. In 2006 behaalde hij zijn gymna-sium diploma aan het Lyceum Oudehoven te Gorinchem. Daaropvolgend begon hij aan de Erasmus universiteit aan de opleiding geneeskunde, die hij in 2012 afrondde. Tijdens zijn afstudeerproject maakte hij kennis met de onderzoeksafdeling van de huisartsge-neeskunde en met de PROOF studie, waarover ook zijn afstudeerscriptie ging.
Na het behalen van zijn artsdiploma in 2012 heeft Bastiaan een jaar gewerkt als arts op de kinderafdeling van het Sint Franciscus Gasthuis te Rotterdam. Vervolgens is hij in 2013 gestart aan de huisartsopleiding te Rotterdam. Tijdens zijn huisartsopleiding bleef hij betrokken bij de onderzoeksafdeling en de PROOF studie en volgde de mogelijkheid om de huisartsopleiding te combineren met een promotietraject.
Op dit moment werkt Bastiaan in Waddinxveen als huisarts in opleiding. Hij hoopt in de zomer van 2017 zijn huisartsopleiding af te ronden. In de toekomst hoopt hij zijn huisarts carrière te kunnen combineren met betrokken blijven bij de onderzoeksafdel-ing van de huisartsgeneeskunde.
Bastiaan is in 2015 getrouwd met Marieke en zij wonen in Berkel en Rodenrijs.


1
2
3
4
5
6
7
8
9
10
11
Phd portfolio


175
1
2
3
4
5
6
7
8
9
10
11
PhD POrtFOliO
name PhD student: Bastiaan de Vos Promotor: Prof. dr. S.M.A. Bierma-Zeinstra
erasmus mC Department: General Practice supervisor: Dr. Jos Runhaar
research school: NIHES PhD period: 2013-2016
1. Vocational training year
GP Training, Department of General Practice, Erasmus MC, Rotterdam
2013-present
2. PhD training year workload (eCts)
Courses / training
Courses for the quantitative researcher 2016 1.4 ECTS
Biostatistics for clinicians 2016 0.7 ECTS
Principles of epidemiologic data-analysis 2016 0.7 ECTS
Repeated measurements 2016 1.4 ECTS
Missing values in clinical research 2016 0.7 ECTS
Scientific integrity 2016 0.3 ECTS
Oral presentations
NHG Wetenschapsdag, Rotterdam 2015 1 ECTS
NHG Wetenschapsdag, Amsterdam (two presentations) 2016 2 ECTS
RCGP Annual Primary Care Conference, Harrogate, UK 2016 1 ECTS
NAPCRG Annual Meeting, Colorado, USA (two presentations) 2016 2 ECTS
Poster presentations
Osteoarthritis Research Society International (OARSI) World Congress, Amsterdam
2016 1 ECTS
RCGP Annual Primary Care Conference, Harrogate, UK 2016 1 ECTS
3. teaching year workload (hours)
Lecturing
Lecturing basic statistics to general practitioners in training, development of teaching programme
2015-2016 80 hours
Lecturing principles of evidence based medicine to medical specialists
2016 40 hours
Lecturing principles of evidence based medicine to general practitioners in training
2016 16 hours
Lecturing basic statistics to medical students 2016 16 hours
Supervising practicals and excursions, Tutoring
Supervising writing and publication of letter to the editor by medical students
2016 16 hours
Supervising Master’s theses
Supervising medical student 2016 80 hours
Other
Oral presentation at weekly work discussion meetings 2016 8 hours
Oral presentation at monthly interdisciplinary research group meetings
2016 8 hours

176
Reviewing article for PLOS ONE 2016 8 hours
Reviewing article for BMC Musculoskeletal Disorders 2016 8 hours
Reviewing article for Arthritis Care & Research 2016 8 hours
Reviewing article for Osteoarthritis and Cartilage 2016 8 hours
Writing “Practical Evidence About Real Life Situations” for general practitioners attending staff training
2016 8 hours
total (28 hours = 1 eCts) 24.1 eCts


1
2
3
4
5
6
7
8
9
10
11
List of publications


181
1
2
3
4
5
6
7
8
9
10
11
Hoeven TA, de Vos BC. Weight loss in a commercial setting. Lancet. 2012 Mar 17;379(9820):1003; author reply 1003.
de Vos BC, van de Wouw E. Comments on “Effect of three weeks of continuous airway pressure treatment on mood in patients with obstructive sleep apnoea: a randomized placebo-controlled trial”. Sleep Med. 2012 Aug;13(7):965-6; author reply 966-7.
de Vos BC, Runhaar J, Bierma-Zeinstra SM. Effectiveness of a tailor-made weight loss intervention in primary care. Eur J Nutr. 2014 Feb;53(1):95-104.
de Vos BC, Runhaar J, Verkleij SP, van Middelkoop M, Bierma-Zeinstra SM. Latent class growth analysis successfully identified subgroups of participants during a weight loss intervention trial. J Clin Epidemiol. 2014 Aug;67(8):947-51.
Runhaar J, de Vos BC, van Middelkoop M, Vroegindeweij D, Oei EH, Bierma-Zeinstra SM. Prevention of Incident Knee Osteoarthritis by Moderate Weight Loss in Overweight and Obese Females. Arthritis Care Res (Hoboken). 2016 Feb 11. [Epub ahead of print].
de Vos BC, Runhaar J, van Middelkoop M, Krul M, Bierma-Zeinstra SM. Long-term effects of a randomized, controlled, tailor-made weight-loss intervention in primary care on the health and lifestyle of overweight and obese women. Am J Clin Nutr. 2016 Jul;104(1):33-40.
Marieke L.A. Landsmeer, Bastiaan C. de Vos, Peter van der Plas, Marienke van Middelkoop, Dammis Vroegindeweij, Patrick J.E. Bindels, Edwin H.G. Oei, Sita M.A. Bierma-Zeinstra, Jos Runhaar. Effect of weight change on progression of knee OA features assessed by MRI in high-risk overweight and obese women. Submitted.
Bastiaan C. de Vos, Marieke L.A. Landsmeer, Marienke van Middelkoop, Edwin H.G. Oei, Marjolein Krul, Sita M.A. Bierma-Zeinstra, Jos Runhaar. The long-term effects of a tailor-made lifestyle intervention and of oral glucosamine sulfate in primary care on incident knee OA in overweight and obese women. Submitted
Bastiaan C. de Vos, Jos Runhaar, Marienke van Middelkoop, Marjolein Krul, Edwin H.G. Oei, Dammis Vroegindeweij, Sita M.A. Bierma-Zeinstra. Physical activity during and after a lifestyle intervention: a latent class growth analysis approach. Submitted