Evaluating Obesity Prevention Efforts - Multiple Chronic ...
463
Visit the National Academies Press online and register for... Instant access to free PDF downloads of titles from the Distribution, posting, or copying of this PDF is strictly prohibited without written permission of the National Academies Press. Unless otherwise indicated, all materials in this PDF are copyrighted by the National Academy of Sciences. Request reprint permission for this book Copyright © National Academy of Sciences. All rights reserved. 10% off print titles Custom notification of new releases in your field of interest Special offers and discounts NATIONAL ACADEMY OF SCIENCES NATIONAL ACADEMY OF ENGINEERING INSTITUTE OF MEDICINE NATIONAL RESEARCH COUNCIL This PDF is available from The National Academies Press at http://www.nap.edu/catalog.php?record_id=18334 ISBN 978-0-309-28527-8 464 pages 8 1/2 x 11 PAPERBACK (2013) Evaluating Obesity Prevention Efforts: A Plan for Measuring Progress Lawrence W. Green, Leslie Sim, and Heather Breiner, Editors; Committee on Evaluating Progress of Obesity Prevention Efforts; Food and Nutrition Board; Institute of Medicine
-
Upload
khangminh22 -
Category
Documents
-
view
1 -
download
0
Transcript of Evaluating Obesity Prevention Efforts - Multiple Chronic ...

Visit the National Academies Press online and register for...
Instant access to free PDF downloads of titles from the
Distribution, posting, or copying of this PDF is strictly prohibited without written permission of the National Academies Press. Unless otherwise indicated, all materials in this PDF are copyrighted by the National Academy of Sciences. Request reprint permission for this book
Copyright © National Academy of Sciences. All rights reserved.
10% off print titles
Custom notification of new releases in your field of interest
Special offers and discounts
NATIONAL ACADEMY OF SCIENCES
NATIONAL ACADEMY OF ENGINEERING
INSTITUTE OF MEDICINE
NATIONAL RESEARCH COUNCIL
This PDF is available from The National Academies Press at http://www.nap.edu/catalog.php?record_id=18334
ISBN978-0-309-28527-8
464 pages8 1/2 x 11PAPERBACK (2013)
Evaluating Obesity Prevention Efforts: A Plan for Measuring Progress
Lawrence W. Green, Leslie Sim, and Heather Breiner, Editors; Committee on Evaluating Progress of Obesity Prevention Efforts; Food and Nutrition Board; Institute of Medicine

Copyright © National Academy of Sciences. All rights reserved.
Evaluating Obesity Prevention Efforts: A Plan for Measuring Progress
Committee on Evaluating Progress of Obesity Prevention Efforts
Food and Nutrition Board
Lawrence W. Green, Leslie Sim, Heather Breiner, Editors
EVALUATING OBESITY PREVENTION EFFORTS
A Plan for Measuring Progress

Copyright © National Academy of Sciences. All rights reserved.
Evaluating Obesity Prevention Efforts: A Plan for Measuring Progress
THE NATIONAL ACADEMIES PRESS 500 Fifth Street, NW Washington, DC 20001
NOTICE: The project that is the subject of this report was approved by the Governing Board of the National Research Council, whose members are drawn from the councils of the National Academy of Sciences, the National Academy of Engineering, and the Institute of Medicine. The members of the committee responsible for the report were chosen for their special competences and with regard for appropriate balance.
This study was supported by a grant between the National Academy of Sciences and the Michael & Susan Dell Foundation. Any opinions, findings, conclusions, or recommenda-tions expressed in this publication are those of the author(s) and do not necessarily reflect the views of the organizations or agencies that provided support for the project.
International Standard Book Number-13: 978-0-309-28527-8International Standard Book Number-10: 0-309-28527-5
Additional copies of this report are available for sale from the National Academies Press, 500 Fifth Street, NW, Keck 360, Washington, DC 20001; (800) 624-6242 or (202) 334-3313; http://www.nap.edu.
For more information about the Institute of Medicine, visit the IOM home page at: www.iom.edu.
Copyright 2013 by the National Academy of Sciences. All rights reserved.
Printed in the United States of America
The serpent has been a symbol of long life, healing, and knowledge among almost all cul-tures and religions since the beginning of recorded history. The serpent adopted as a logo-type by the Institute of Medicine is a relief carving from ancient Greece, now held by the Staatliche Museen in Berlin.
Suggested citation: IOM (Institute of Medicine). 2013. Evaluating obesity prevention efforts: A plan for measuring progress. Washington, DC: The National Academies Press.

Copyright © National Academy of Sciences. All rights reserved.
Evaluating Obesity Prevention Efforts: A Plan for Measuring Progress
“Knowing is not enough; we must apply. Willing is not enough; we must do.”
—Goethe
Advising the Nation. Improving Health.
Copyright © National Academy of Sciences. All rights reserved.
Evaluating Obesity Prevention Efforts: A Plan for Measuring Progress
The National Academy of Sciences is a private, nonprofit, self-perpetuating society of distin-guished scholars engaged in scientific and engineering research, dedicated to the furtherance of science and technology and to their use for the general welfare. Upon the authority of the charter granted to it by the Congress in 1863, the Academy has a mandate that requires it to advise the federal government on scientific and technical matters. Dr. Ralph J. Cicerone is president of the National Academy of Sciences.
The National Academy of Engineering was established in 1964, under the charter of the National Academy of Sciences, as a parallel organization of outstanding engineers. It is autonomous in its administration and in the selection of its members, sharing with the National Academy of Sciences the responsibility for advising the federal government. The National Academy of Engineering also sponsors engineering programs aimed at meeting national needs, encourages education and research, and recognizes the superior achievements of engineers. Dr. C. D. Mote, Jr., is president of the National Academy of Engineering.
The Institute of Medicine was established in 1970 by the National Academy of Sciences to secure the services of eminent members of appropriate professions in the examination of policy matters pertaining to the health of the public. The Institute acts under the responsibility given to the National Academy of Sciences by its congressional charter to be an adviser to the federal government and, upon its own initiative, to identify issues of medical care, research, and education. Dr. Harvey V. Fineberg is president of the Institute of Medicine.
The National Research Council was organized by the National Academy of Sciences in 1916 to associate the broad community of science and technology with the Academy’s purposes of furthering knowledge and advising the federal government. Functioning in accordance with general policies determined by the Academy, the Council has become the principal operating agency of both the National Academy of Sciences and the National Academy of Engineering in providing services to the government, the public, and the scientific and engineering communities. The Council is administered jointly by both Academies and the Institute of Medicine. Dr. Ralph J. Cicerone and Dr. C. D. Mote, Jr., are chair and vice chair, respectively, of the National Research Council.
www.national-academies.org

Copyright © National Academy of Sciences. All rights reserved.
Evaluating Obesity Prevention Efforts: A Plan for Measuring Progress
v
COMMITTEE ON EVALUATING PROGRESS OF OBESITY PREVENTION EFFORTS
LAWRENCE W. GREEN (Chair), Professor, Epidemiology and Biostatistics, School of Medicine, University of California, San Francisco
CHRISTINA BETHELL, Professor, Pediatrics, School of Medicine, Oregon Health and Science Center, Child and Adolescent Health Measurement Initiative, Portland
RONETTE R. BRIEFEL, Senior Fellow, Mathematica Policy Research, Washington, DCROSS C. BROWNSON, Professor, Epidemiology, Brown School and School of Medicine, Washington
University in St. LouisJAMIE F. CHRIQUI, Senior Research Scientist, Health Policy Center, Institute for Health Research and
Policy, University of Illinois at ChicagoSTEPHEN FAWCETT, Professor, Applied Behavioral Science, Director, Work Group for Community
Health and Development, University of Kansas, LawrenceBRIAN R. FLAY, Professor, Public Health, Co-Director, Promise Neighborhoods Research Consortium,
Oregon State University, CorvallisDEANNA M. HOELSCHER, Director and Professor, Michael & Susan Dell Center for Healthy Living,
The University of Texas School of Public Health, Austin Regional Campus, TXJAMES W. KRIEGER, Chief, Chronic Disease and Injury Prevention, Public Health–Seattle & King
County, WALAURA C. LEVITON, Senior Advisor for Evaluation, Robert Wood Johnson Foundation, Princeton, NJK. M. VENKAT NARAYAN, Professor, Global Health and Epidemiology, The Rollins School of Public
Health, Emory University, GANICO P. PRONK, Vice President & Chief Science Officer, HealthPartners, Inc., Bloomington, MNLORRENE RITCHIE, Director of Research, Atkins Center for Weight and Health, University of California,
BerkeleyELSIE TAVERAS, Chief, Division of General Pediatrics, Director, Pediatric Population Health Management,
Massachusetts General Hospital and Associate Professor, Department of Pediatrics and Population Medicine, Harvard Medical School, Boston, MA
Study Staff
LESLIE J. SIM, Senior Program OfficerLYNN PARKER, ScholarHEATHER BREINER, Associate Program Officer SARAH SIEGEL, Senior Project Assistant (from October 2012)ELENA OVAITT, Senior Project Assistant (until August 2012)SARAH SLIWA, Mirzayan Policy Fellow (September to November 2012)FAYE HILLMAN, Financial AssociateANTON L. BANDY, Senior Financial OfficerGERALDINE KENNEDO, Administrative AssistantLINDA D. MEYERS, Director, Food and Nutrition Board (until May 2013)CLYDE J. BEHNEY, Acting Director, Food and Nutrition Board (from May 2013)

Copyright © National Academy of Sciences. All rights reserved.
Evaluating Obesity Prevention Efforts: A Plan for Measuring Progress
Copyright © National Academy of Sciences. All rights reserved.
Evaluating Obesity Prevention Efforts: A Plan for Measuring Progress
vii
Reviewers
This report has been reviewed in draft form by individuals chosen for their diverse perspectives and technical expertise, in accordance with procedures approved by the National Research Council’s
Report Review Committee. The purpose of this independent review is to provide candid and critical com-ments that will assist the institution in making its published report as sound as possible and to ensure that the report meets institutional standards for objectivity, evidence, and responsiveness to the study charge. The review comments and draft manuscript remain confidential to protect the integrity of the deliberative process. We wish to thank the following individuals for their review of this report:
David B. Allison, University of Alabama at BirminghamCheryl Aspy, University of Oklahoma Jay Bernhardt, University of FloridaDon Bishop, Minnesota Department of HealthJon Blitstein, RTI InternationalJan L. Breslow, The Rockefeller UniversityKelly Evenson, University of North Carolina, Chapel HillMary Kay Fox, MathematicaTracy Fox, Food, Nutrition, and Policy, ConsultantsRobert Hiatt, University of California, San FranciscoPam Schwartz, Kaiser PermanenteGlorian Sorensen, Harvard UniversityAdolfo Valadez, AetnaKaren Webb, University of California, BerkeleyJean Wiecha, RTI International
Although the reviewers listed above have provided many constructive comments and suggestions, they were not asked to endorse the conclusions or recommendations nor did they see the final draft of the report before its release. The review of this report was overseen by Eileen T. Kennedy, Tufts University,

Copyright © National Academy of Sciences. All rights reserved.
Evaluating Obesity Prevention Efforts: A Plan for Measuring Progress
viii Reviewers
and Caswell A. Evans, University of Illinois at Chicago. Appointed by the Institute of Medicine; they were responsible for making certain that an independent examination of this report was carried out in accordance with institutional procedures and that all review comments were carefully considered. Responsibility for the final content of this report rests entirely with the authoring committee and the institution.

Copyright © National Academy of Sciences. All rights reserved.
Evaluating Obesity Prevention Efforts: A Plan for Measuring Progress
ix
Preface
The history of successful public health progress in confronting and controlling complex threats to popu-lation health has been marked most significantly by the ability and agreement to conduct assessments
of the outbreak, conduct surveillance of the movement of the threat over time and between places and populations, and to conduct evaluations of efforts to interrupt or control those threats. Effective evalua-tions have depended on the development of consensus on the specific indicators and measures for compar-isons in time and space and between jurisdictions with their varied policies, programs, services, cultures, as well as distinct physical and social environments. This report attempts to offer a degree of consensus on these essential ingredients for successful monitoring and evaluation of progress on obesity in America.
We wish to thank the Michael & Susan Dell Foundation for sponsoring this study. We begin by thanking in particular Aliya Hussaini for her encouragement. The Foundation’s support and vision for the role that evaluation must play in accelerating progress toward obesity prevention offered inspiration. Its full support for urging common use of specific indicators in such evaluation was significant.
The Committee deeply appreciates the extensive contributions of Debra Haire-Joshu, Ph.D., Washington University in St. Louis, who was commissioned to provide practical recommendations on disparities, health equity, and obesity prevention to inform the decisions of the Committee. Also, the Committee benefited greatly from the invaluable and illuminating assistance on evaluating the effective-ness of community-wide obesity prevention initiatives and on common measures provided by Carol Cahill, M.L.S., Group Health Cooperative; Diana Charbonneau, M.I.T., Group Health Cooperative; Allen Cheadle, Ph.D., Group Health Cooperative; Elena Kuo, Ph.D., Group Health Cooperative; Suzanne Rauzon, M.P.H., University of California, Berkeley; and Lisa Schafer, M.P.H., Group Health Cooperative.
The opportunity for discussion with the individuals who made presentations and attended the Committee’s public session (see Appendix I) was critical to the Committee’s work. We also gained expe-rience and insight from discussions with individuals from a variety of perspectives and sectors, includ-ing Philip Bors, Healthy Kids, Healthy Communities; Richard Conlin, Seattle City Council; Tracy Fox, Food, Nutrition, and Policy Consultants, LLC; Casey Korba, America’s Health Insurance Plans; Punam Ohri-Vachaspati, Arizona State University; Mary Ann Scheirer, Scheirer Consulting; Pam Schwartz, Kaiser Permanente; Nancy Sherwood, HealthPartners Institute for Education and Research; Sarah Strunk, Healthy Kids, Healthy Communities; and Michael Yedidia, Rutgers University.

Copyright © National Academy of Sciences. All rights reserved.
Evaluating Obesity Prevention Efforts: A Plan for Measuring Progress
x Preface
The Committee could not have done its work without the outstanding guidance and support pro-vided by the Institute of Medicine staff Leslie Sim, study director; Heather Breiner, associate program officer; and Lynn Parker, scholar. Sarah Siegel and Elena Ovaitt provided highly skilled logistical support. Linda Meyers’ guidance and counsel were invaluable throughout our deliberations. And last but not least, the report greatly benefited from the copyediting skills of Cori Vanchieri.
Lawrence W. Green, ChairCommittee on Evaluating Progress of Obesity Prevention Efforts

Copyright © National Academy of Sciences. All rights reserved.
Evaluating Obesity Prevention Efforts: A Plan for Measuring Progress
xi
Contents
SUMMARY 1
1 Introduction 152 Improving the Usefulness of Obesity Evaluation Information to Potential Users 433 Framework for Evaluation 734 Indicators for the Evaluation Plans 955 Evaluating Progress in Promoting Health Equity: A Review of Methods and Tools for
Measurement 1156 National Obesity Evaluation Plan 1337 Community Obesity Assessment and Surveillance 1838 Monitoring and Summative Evaluation of Community Interventions 2239 Systems and Evaluation: Placing a Systems Approach in Context 25510 Taking Action: Recommendations for Evaluating Progress of Obesity Prevention Efforts 273
APPENDIXES
A Acronyms 297B Glossary 303C Guiding Principles for Evaluation 309D Table of Indicator Data Sources 321E Disparities Tables 331F National Plan Resources 401G Community Health Assessment and Surveillance Resources 413H Community Intervention Resources 421I Panel Agenda 441J Committee Biographies 443

Copyright © National Academy of Sciences. All rights reserved.
Evaluating Obesity Prevention Efforts: A Plan for Measuring Progress

Copyright © National Academy of Sciences. All rights reserved.
Evaluating Obesity Prevention Efforts: A Plan for Measuring Progress
1
Summary1
The obesity epidemic in the United States has serious health, economic, and social consequences for individuals and society at large. The recognition of these consequences has accelerated efforts to char-
acterize and understand the problem more fully, to take evidence-based and innovative actions, and to assure progress in obesity prevention. Recognition of the large number and variety of environmental and policy strategies being implemented across the country, and the need to understand whether the actions are having an impact in preventing obesity, have created a demand for timely and meaningful data to inform and improve these efforts.
Rigorous scientific evaluation can offer this information to various stakeholders—legislators respon-sible for amending or creating policies; funders deciding where to invest; elected local officials develop-ing a blueprint for change; and administrators accountable for the stewardship of resources, program management, and policy implementation. Evaluation can provide information on how well programs and policies are being implemented, on which interventions work best in varied real-world contexts, and for rapid course correction. Evaluation can also offer longer-term evidence that interventions are achieving the intended outcomes, and identify emerging issues to investigate.
This report aims to increase the likelihood that (1) obesity prevention efforts will be evaluated appropriately; (2) the results of these evaluations will inform and improve decision making in all sectors; (3) progress will be made in monitoring the adoption, implementation, and maintenance of tested inter-ventions; and (4) the most promising approaches for accelerating the prevention of obesity will be dis-seminated widely.
STUdY APPROACh ANd SCOPE
With funding from the Michael & Susan Dell Foundation, the Institute of Medicine (IOM) Committee on Evaluating Progress of Obesity Prevention Efforts was formed to develop a concise and actionable plan for measuring progress in obesity prevention efforts for the nation. The Committee was asked to focus the scope of its evaluation plan on assessment of the policy and environmental strate-gies recommended in the IOM report Accelerating Progress in Obesity Prevention: Solving the Weight
1 This summary does not include references. Citations to support statements made herein are given in the body of the report.

Copyright © National Academy of Sciences. All rights reserved.
Evaluating Obesity Prevention Efforts: A Plan for Measuring Progress
Evaluating Obesity Prevention Efforts2
BOX S-1 A Note on Terminology
• Assessment is an effort to use data on the community or other jurisdiction to characterize the prob-lem, its distribution, and efforts to address it.
• Monitoring is the tracking of the implementation of interventions* compared to standards of performance.
• Surveillance is the ongoing systematic collection, analysis, and interpretation of data tracked over time to detect patterns, disparities, and changes that may be associated with interventions or other causes.
• Summative Evaluation is the effort to detect changes in output, outcomes, and impacts associated with interventions and to attribute those changes to the interventions.
• Evaluation refers to all four or various combinations of these functions (assessment, monitoring, sur-veillance, and summative evaluation).
* In this report, interventions refer to programs, systems, policies, environmental changes, services, products, or any combina-
tion of these multifaceted initiatives.
of the Nation (APOP) (IOM, 2012a), rather than on clinical interventions for individuals. The charge to the Committee was further delineated as follows: (1) develop a plan for evaluating national obesity prevention efforts; (2) develop a community-level measurement plan that adds detail and support to the national-level plan; and (3) identify measurement ideas that can determine the specific impact of the Home Box Office (HBO)/IOM campaign The Weight of the Nation (TWOTN). The intended audiences for the plans and measurement ideas in this report are simple: individuals with an interest in obesity prevention. These “evaluation users” include policy makers, government agency staff, nongovernmental organizations at all levels, advocates, local coalitions, researchers and evaluators, businesses, media, and the public.
A note on terminology: within the literature, terms such as assessment, surveillance, monitoring, and evaluation are often used interchangeably or with different meanings that vary among professions, disciplines, and settings. For consistency throughout this report the Committee uses these terms as described in Box S-1. Within this collection of terms, evaluation is widely, and sometimes in this report, used to refer to all four or some combinations of these functions. Additionally, the objects of evaluations can encompass programs, systems, policies, environmental changes, services, products, or any combina-tion of these multifaceted aspects of initiatives. The Committee will refer to these collectively and in their various combinations as interventions.

Copyright © National Academy of Sciences. All rights reserved.
Evaluating Obesity Prevention Efforts: A Plan for Measuring Progress
3Summary
The report contains (1) a conceptual evaluation framework to consider when evaluating progress of obesity prevention efforts; (2) broad conclusions from discussion with evaluation users of their needs and a review of existing evaluation efforts and infrastructure; (3) model (flexible) evaluation plans (i.e., a framework and suggested approaches and methods) for national, state, and community stakeholders; (4) indicators of progress and existing data sources for measuring these indicators to complement targeted new evaluations; (5) recommendations for evaluation infrastructure changes to encourage and enhance the extent and effectiveness of obesity prevention evaluations; and (6) measurement ideas to determine the impact of the HBO/IOM TWOTN campaign.
In developing the tools, guides, and recommendations found in the report, the Committee consid-ered the following key material: (1) recommended environmental and policy strategies outlined in the APOP report; (2) the components and evaluation efforts to date of the HBO/IOM TWOTN campaign; (3) a review of literature on stakeholder perspectives and evaluation approaches and methods; (4) views of representatives from selected evaluation stakeholder/user groups at a public workshop on October 12, 2012, and through interviews; and (5) the context (i.e., What to evaluate?, How to evaluate?, Who will be doing the evaluation?, and By what timing or interval should the evaluation be done?) and resources that are available for evaluating interventions.
More specifically the APOP report identifies 20 environmental and policy strategies that hold the most promise for accelerating progress in preventing obesity. The strategies are organized into five envi-ronments: (1) the physical activity environment, which includes the built environment as well as norms and processes that increase opportunities for, access to, and social reinforcement of physical activity; (2) the food and beverage environment, including support for increased availability and affordability of healthful foods; (3) the message environment that encompasses media and marketing; (4) the health care and worksite environments in which promotion of healthful foods and physical activity can be supported and arranged; and (5) acknowledgment of the school environment as an important hub of health promo-tion. The APOP report stresses that the recommended strategies are interrelated and that, consistent with a systems science approach, successful implementation of the strategies will require engagement across all levels and sectors of society. These APOP strategies serve as the focus of the Committee’s evaluation plans and recommended actions for implementing the plan in this report.
AN EVALUATION FRAMEwORk
To guide future obesity evaluation efforts, the Committee developed a vision statement and a frame-work of an evaluation process that can lead to the achievement of this vision. This evaluation framework lays out the needs, inputs, resources, activities, outputs, outcomes, and impacts that need to be considered when planning and implementing the evaluation of progress in obesity prevention efforts (see Figure S-1). The Committee’s vision is to assure collection and analysis of timely and meaningful data or informa-tion to inform and improve obesity prevention efforts at national, state, and community levels. The Committee’s evaluation framework especially highlights the context, activities, and intended outcomes of obesity prevention efforts and provides guidance for assuring the availability of data to inform progress in these efforts from the community to the national levels.

Copyright © National Academy of Sciences. All rights reserved.
Evaluating Obesity Prevention Efforts: A Plan for Measuring Progress
Evaluating Obesity Prevention Efforts4
FIGURE S-1 Framework to guide the work of assuring collection and analysis of data to inform progress of obesity prevention efforts.a Evaluation refers to assessment, monitoring, surveillance, and summative evaluation activities.
CONCLUSIONS
Based on its review of existing evaluation efforts, the Committee identified key findings on dimen-sions of national and community-level evaluation. This includes aspects of information/data needs of those interested in obesity prevention and its results, indicators that can act as markers for assessing the progress of obesity prevention efforts recommended in the APOP report, the infrastructure and capacity to support evaluation of APOP recommended strategies, and methods and protocols for conducting evaluation.
Evaluation users operate at federal, state, and community levels in at least three contexts: the policy making process; dissemination and diffusion of obesity prevention strategies; and local implementation, quality improvement, and sustainability of policies and programs. Across all of the information sources and the various kinds of users the Committee consulted, the highest-priority questions were (1) “Why is
Figures S-1, 4-1 and 10-1.eps
1. Inputs
• User/Stakeholder Needs• Existing Objectives Strategies• Context for Evaluationa
• Guiding Principles for Evaluationa
• Resources
2. Activities
• Identify Indicators/Measures of Success• Develop Evaluationa Plans and
Infrastructure• Develop Resources for Training, Technical
Assistance, and Dissemination
3. Outputs
• Core Indicators and Measures• Recommendations and Guidance• Support for Implementation
4. Outcomes
• Short-term: Improved Evaluationa
Capacity and Training• Intermediate-term: Increased
Evaluationa Activities• Long-term: Enhanced Data Use
5. Intended Impacts/ Improvements
• Partnerships, Environments, Policies, Behaviors, Norms
• Energy Expenditure/Intake• Overweight/Obesity• Population Health and Well-Being; Equity
Evaluation Framework

Copyright © National Academy of Sciences. All rights reserved.
Evaluating Obesity Prevention Efforts: A Plan for Measuring Progress
5Summary
obesity prevention important to me?” (2) “What works to prevent obesity?” and (3) “How are we doing in preventing obesity?” In obesity prevention program development and implementation, evaluation is most commonly used to clarify the dimensions of the problem of obesity, inform the operation of a pro-gram or policy, and better understand the mechanisms of the effects of the intervention. The current col-lection, packaging, and dissemination of data and information, then, often is not responsive to the second and third priority questions posed by evaluation users.
Indicators that measure the progress of obesity prevention efforts recommended in the APOP report can be found in a wide variety of existing data sources (government, academia, private sector, commer-cial). However these indicators are not compiled in one easily accessible place. A list of indicators from available and ongoing data sources can provide a menu of possible indicators for use by evaluators, be a starting point for identifying a set of common core indicators for use at the national and community level, and identify gaps in the current collective data and information system. Although a large number of indicators exist related to strategies recommended in the APOP report, data and information gaps remain. There is a need for indicators that assess partnerships, leadership, health equity issues, and more generally data that can be used at the community level.
The current national monitoring and surveillance system (infrastructure) for obesity and related risk factors provides a history of tracking key impact indicators, valid and reliable measures, and sample sizes that provide population-level estimates for various subgroups. Healthy People 2020, the U.S. Dietary Guidelines, and Physical Activity Guidelines for Americans provide a framework of key indicators to inform assessment, monitoring, surveillance, and summative evaluation efforts related to APOP strategies. The majority of these indicators have data available at the national level, but little available at the com-munity level. However current monitoring and surveillance systems that sample selected regions allow the use and comparison of national, state, and some city/county levels for selected communities. The cur-rent collective system for measuring progress of APOP strategies: (1) lacks focus on monitoring of policy, environmental, and systems-level efforts important for obesity prevention, for a variety of settings, and for certain populations; (2) lacks dedicated leadership for coordinating efforts; and (3) lacks resources for assessment, monitoring, surveillance, and summative evaluation, and timely reporting of results. Additionally, common guidance for relevant core indicators, common measures, methods, and protocols to use in obesity prevention evaluation has not been agreed upon for use at the national and community levels. And there is an evident need to assure a competent workforce to collect and use evaluation data.
The seven broad conclusions that emerged from these findings (see Box S-2) serve as context for the development and guidance provided in the recommended plans, supporting actions, and measurement ideas that follow.
OBESITY EVALUATION PLANS
Based on its review of current evaluation efforts and infrastructure and the components identified in the evaluation framework, the Committee developed national and community evaluation plans for mea-suring the progress of obesity prevention efforts identified in the APOP report. These evaluation plans—among the key actions to improving evaluation efforts—contain guidance for organizing and implement-ing evaluation-related efforts (a framework and suggested approaches and methods) to achieve the plan’s intended outcomes.

Copyright © National Academy of Sciences. All rights reserved.
Evaluating Obesity Prevention Efforts: A Plan for Measuring Progress
Evaluating Obesity Prevention Efforts6
BOX S-2 Broad Conclusions Regarding Existing Evaluation Efforts
• There is a pressing need to act on the problem of obesity, but there are gaps in the certainty of the effectiveness of actions or mixture of actions being implemented across the country. Systematic and comprehensive evaluations along with more routine assessments, monitoring, and surveillance offer valuable guidance for improving the quality and outcomes (or impact) of the actions being implement-ed and for defining the direction of further basic and implementation research.
• Information generated from current obesity prevention evaluation efforts, other than assessment of needs at the national and state levels, does not always address the needs and interests of the users of this information, often because of limited or outdated data (especially at the community level) and few presentations of the data in useful and timely formats.
• Current data (monitoring) systems do not adequately track progress of environmental and policy-related obesity prevention actions or systems changes recommended in the Accelerating Progress in Obesity Prevention report (IOM, 2012a). Such monitoring is needed at both the national and communi-ty levels, especially for populations at greatest risk for obesity. These limitations exist primarily because monitoring systems have traditionally focused on measuring individual behaviors, energy expenditure/energy intake, and overweight and obesity.
• Current investment in evaluation is too low and sporadic, presenting serious barriers to understanding the impact of and need for future investments in implementing interventions.
• A systems science approach (i.e., interactions and connectedness of components in a whole system) to evaluation can help evaluation users identify and select combinations of actions and strategies to implement in multiple sectors, and at multiple levels, with available resources.
• Although many data systems exist, the current national systems for monitoring progress of recommend-ed obesity prevention actions and for surveillance of their effects on obesity lack adequate leadership, coordination, infrastructure, guidance, accountability, and capacity.
• Communities lack adequate guidance, capacity, data, and resources necessary for assessing the status of obesity and its determinants, identifying prevention needs, monitoring obesity prevention actions, evaluating their short-term outcomes, and tracking (through surveillance) their long-term association with obesity reduction in the aggregate and differences among population segments.
The National Obesity Evaluation Plan
U.S. efforts lag behind international efforts to provide common guidance, support, and the appro-priate infrastructure to nurture evaluation of obesity prevention efforts. The recommended National Obesity Evaluation Plan (see Box S-3) is designed to organize the planning, implementation, and evalu-ation of obesity prevention and related policies and programs recommended in the APOP report at the national level. The National Obesity Evaluation Plan integrates existing national surveys, evaluation

Copyright © National Academy of Sciences. All rights reserved.
Evaluating Obesity Prevention Efforts: A Plan for Measuring Progress
7Summary
BOX S-3 Core Components of the National Obesity Evaluation Plan
Purpose: To evaluate the progress at the national level in implementing strategies in the Institute of Medicine Accelerating Progress in Obesity Prevention report and in achieving its intended outputs, out-comes, and impacts.
1. Identify leadership, infrastructure, resources, priorities, and timeline for implementing the plan.
2. Identify current national efforts for evaluation, including indicators, and incorporate them selectively into national monitoring, surveillance, and summative evaluation data systems that are responsive to the needs of data users.
3. Propose data and infrastructure to add to existing monitoring and surveillance systems to fill gaps and facilitate community obesity evaluation plans.
4. Propose additional assessment, monitoring, surveillance, and summative evaluation activities; new measures and innovative strategies to implement in the future.
5. Outline mechanisms for feedback to data users, assuring accessibility, privacy, and cost-efficiency.
6. Detail adaptations of the plan at the state level, with further applications at the regional level.
studies, and monitoring and surveillance systems that currently focus primarily on individual-level mea-sures with recommendations for new infrastructure, indicators, and data that would capture environ-mental and policy changes. The evaluation plan is intentionally broad to provide the flexibility necessary for meeting the needs and resources of the evaluators. Framed in a systems approach, the evaluation plan includes implementation across multiple sectors and use of variables that address health equity. It can also be used as a model for state and multi-state regional evaluations.
In this report, the Committee provides detailed activities, support, and guidance for addressing each component identified in the National Obesity Evaluation Plan. The Committee stresses the need to pri-oritize the activities of the National Obesity Evaluation Plan to leverage existing resources that maximize efficiency of data collection and avoid duplication of efforts.
The Community Obesity Evaluation Plan
The Community Obesity Evaluation Plan provides an actionable framework for evaluation at the community level that can be adapted for local needs and resources. It includes suggested indicators avail-able for measuring progress of APOP-related strategies. The Community Obesity Evaluation Plan includes two distinct sets of activities—community assessment and surveillance (see Box S-4) and community pro-gram and initiative (or intervention) monitoring and summative evaluation (see Box S-5). For purposes of this report, community assessments describe the current state of obesity-related and contextual indicators

Copyright © National Academy of Sciences. All rights reserved.
Evaluating Obesity Prevention Efforts: A Plan for Measuring Progress
Evaluating Obesity Prevention Efforts8
BOX S-4 Components of a Community Obesity Assessment and Surveillance Plan
Purpose: To provide accurate and timely knowledge of local obesity-related conditions and relevant changes or trends over time as a result of implementing strategies in the Institute of Medicine Accelerating Progress in Obesity Prevention report.
1. Define community boundaries.
2. Engage community members and other key stakeholders in as many of these steps as feasible.
3. Plan assessment/surveillance.
4. Collect data.
5. Analyze and make sense of the data.
6. Disseminate findings.
BOX S-5 Components of a Community-Level Obesity Intervention Monitoring and Summative Evaluation Plan
Purpose: To guide local action and to inform national choices about the most effective and cost-effective strategies in the Institute of Medicine Accelerating Progress in Obesity Prevention report for funding, dis-semination, and uptake by other communities.
1. Design stakeholder involvement.
2. Identify resources for the monitoring and summative evaluation.
3. Describe the intervention’s framework, logic model, or theory of change.
4. Focus the monitoring and summative evaluation plan.
5. Plan for credible methods.
6. Synthesize and generalize.

Copyright © National Academy of Sciences. All rights reserved.
Evaluating Obesity Prevention Efforts: A Plan for Measuring Progress
9Summary
and tracks them over time (surveillance). Community intervention evaluations seek to establish and share what is being implemented (monitoring) and “what works” (summative evaluation). Together, these activ-ities provide baseline data and “diagnostic” data on the state of obesity and related “determinants” or conditions in the community (e.g., community assessment) and then measure progress in accelerating the reduction of obesity and its determinants (e.g., community program initiative summative evaluation).
Box S-3 and Box S-4 identify key components for developing and implementing community-specific obesity assessment/surveillance and intervention monitoring/summative evaluation, respectively. Although not shown in the boxes here, the report provides detailed support and guidance for implementing each component, including recommended indicators and methods for collecting and reporting on progress for APOP strategy–focused community assessment/surveillance and intervention monitoring/summative evalu-ation that can be applied to communities with varying skills and resources.
Considerations for Implementing the Obesity Evaluation Plans
Most community health efforts are under resourced, and current support and resources for evalua-tions are limited. This means that some of the Committee’s recommendations to support implementation of the evaluation plans call for leadership and expenditures that will require government, organizations, and the private sector to make trade-off decisions. To be mindful of available resources, address the cur-rent status of APOP strategies, and provide baseline data for future evaluation activities, the Committee’s recommendations for supporting the obesity evaluation plans would ideally be implemented with short-, intermediate-, and long-term perspectives and astute use of existing resources and prioritization of other necessary actions.
The recommended national and community evaluation plans provide a framework for obtaining end-user input; for choosing indicators, measures, and designs focused on APOP strategies; for data col-lection and analysis; and ultimately for improving the evaluation infrastructure to support evaluation efforts. To support these actions, the Committee (1) summarized the needs of a diverse set of stakeholders/users of evaluation information; (2) identified existing indicators of progress for APOP-related strategies that can be incorporated into the recommended plans, help to identify gaps in existing data and informa-tion systems, and be used as examples of indicators for evaluators of obesity prevention interventions; and (3) recommended actions that will improve leadership and coordination, guidance, capacity, infrastruc-ture, systems orientation, and help to prioritize actions for evaluation efforts.
These actions to support the implementation of the plans will improve evaluation capacities for all users in the short term (e.g., use of a core set of existing indicators), increase evaluation activities in the intermediate term (e.g., improve capacity and guidance), and enhance data use in the long term to assess the population-level changes and improvements that can result from widespread implementation of evidence-based obesity prevention interventions (i.e., intended outcomes).
Finally, the National Obesity Evaluation Plan and the Community Obesity Evaluation Plan are interdependent. The two plans have the potential to provide essential support and feedback to each other. Successful implementation of the Community Plan is supported by the components of the National Plan, using indicators, sources of data, resources, and methodologies coordinated and developed with leader-ship at the national level. However, the Community Plan also provides an additional level of detail and

Copyright © National Academy of Sciences. All rights reserved.
Evaluating Obesity Prevention Efforts: A Plan for Measuring Progress
Evaluating Obesity Prevention Efforts10
local context-specific information that the National Plan cannot measure, including the appropriate mix-ture of strategies to implement, their feasibility, and ease of their implementation.
INdICATORS OF PROGRESS
One clear gap in evaluation efforts is a lack of recognition and consensus among users and evalua-tors about a set of core indicators that could be used at the national and community levels for measuring progress in obesity prevention. Consensus is needed to assure a degree of uniformity of measurement that would enable comparative analyses of evaluation across jurisdictions and time periods. These indicators can guide the collection of baseline data to more comprehensively and comparatively assess the obesity prevention actions already being implemented. As a key first step in identifying this core set, the Committee identified indicators that currently exist. Based on available and ongoing data sources, the Committee identified 83 indicators that were best aligned with the recommendations in the APOP report. These indicators provide a menu of possible indicators for use by evaluators and offer a starting point for the development of core indicators and related measures. This process also enabled the identification of gaps in existing data systems to be filled and provide a focus for the Committee’s proposed evaluation plans (national and community levels) and of potential improvements to long-term evaluation infrastruc-ture and capacities. In the short-term, evaluators of obesity prevention programs, policies, and environ-ments can use the indicators identified by the Committee.
Of particular importance to the Committee was recognition that evaluating progress for the nation as a whole, and for regions and communities, requires special attention to the disparities that appear to be associated with the obesity epidemic. Although numerous challenges remain, the Committee found a small yet growing literature on tools and methodologies for monitoring progress toward obesity prevention among racial and ethnically diverse and disadvantaged populations.
TAkING ACTION TO SUPPORT ThE NATIONAL ANd COMMUNITY OBESITY EVALUATION PLANS
Using the considerable number of indicators identified in this report, and guided by methodolo-gies and protocols outlined in the plans, stakeholders can take immediate action to begin comprehen-sive assessment of the obesity prevention efforts recommended in the APOP report and already under way. The Committee realizes that its obesity evaluation plans will not be fully implemented without organizational changes across multiple federal, state, and local government agencies and departments in collaboration with other nonfederal partners responsible for obesity prevention–related activities. Implementation of the plans will require adequate resources, but expenditure decisions should consider leveraging of existing resources and prioritization of necessary actions. The following recommenda-tions support the successful implementation of all of the components of the obesity evaluation plans. (Potential actions and actors to guide the implementation of recommendations are detailed in the report.)
Improve Leadership and Coordination for Evaluation
The Committee believes that centralized leadership is necessary to coordinate the planning, imple-mentation, and evaluation of obesity prevention efforts across the country. Most of the existing data

Copyright © National Academy of Sciences. All rights reserved.
Evaluating Obesity Prevention Efforts: A Plan for Measuring Progress
11Summary
collection and support for evaluation exists across multiple federal agencies.2 The current de centralized structure provides limited authority, responsibility, support, and coordination for these efforts at the national level. The Committee views the lack of empowered leadership to coordinate resources at the fed-eral level as a major obstacle to measuring obesity prevention efforts. Progress could be made if a federal entity would take a leadership position in this coordination effort.
A number of relevant entities could serve in this coordination role. The Committee believes that one or a combination of these entities would be the best option for overseeing and implementing the National Obesity Evaluation Plan and reporting to whatever agency is leading these coordination efforts. Alternatively, the appointment of a new task force could also successfully address the need for improved leadership and coordination of evaluation, but the Committee does not view it as necessary. It was not in the Committee’s charge or in its expertise to analyze various options and then recommend a specific entity to take on this responsibility.
Recommendation 1: An obesity evaluation task force or another entity should oversee and implement the National Obesity Evaluation Plan and provide support for the Community Obesity Evaluation Plan and should coordinate with federal, state, and local public- and private-sector groups and other stake holders who support, use, or conduct evaluations. The taskforce/entity could be a new or existing entity or a combination of existing entities.
Improve data Collection for Evaluation
Recommendation 2: Using the recommended indicators and gaps identified in this report as guides (i.e., related to Accelerating Progress in Obesity Prevention report strategies), all federal agencies3 and state and local health departments responsible for collecting data relevant to obesity prevention efforts, in coordination with relevant private partners, should identify, coordinate, and maximize current efforts for ongoing collection of recommended indicators and, according to the priorities identified, should address existing evaluation gaps at the national and local levels.
Provide Common Guidance for Evaluation
Recommendation 3: Relevant federal agencies (e.g., in the U.S. Departments of Agriculture, Commerce, Health and Human Services, Labor, and Transportation) and state and local health departments, in collaboration with nonfederal partners, should standardize the collection and analysis of data, including common indicators, measures, methods, and outcomes used for assessment, monitoring, surveillance, and summative evaluation to assure aggregation among localities and back to the National Obesity Evaluation Plan.
2 Includes, but is not limited to, the following federal agencies: Corporation for National and Community Service; Domestic Policy Council; Environmental Protection Agency; Federal Trade Commission; General Services Administration; Office of Management and Budget; and U.S. Departments of Agriculture, Commerce, Defense, Education, Health and Human Services, Interior, Labor, Transportation, and Veteran Affairs.
3 Agricultural Research Service, Economic Research Service, and Food and Nutrition Service of the U.S. Department of Agriculture; Census Bureau of the U.S. Department of Commerce; Agency for Healthcare Research and Quality, Centers for Disease Control and Prevention, Health Resources and Services Administration, and National Institutes of Health of the U.S. Department of Health and Human Services; Bureau of Labor Statistics of the U.S. Department of Labor; and Federal Highway Administration of the U.S. Department of Transportation.

Copyright © National Academy of Sciences. All rights reserved.
Evaluating Obesity Prevention Efforts: A Plan for Measuring Progress
Evaluating Obesity Prevention Efforts12
Improve Access to and dissemination of Evaluation data
Recommendation 4: Relevant federal agencies (e.g., in the U.S. Departments of Agriculture, Commerce, Health and Human Services, Labor, and Transportation), in collaboration with academics, non-governmental organizations, and state and local health departments, should coordinate existing efforts to ensure that federal, state, and local assessment, monitoring, surveillance, and summative evaluation sys-tems include a mechanism for feedback to users of evaluation data. In addition, local evaluations should continue to build the evidence base for the Accelerating Progress in Obesity Prevention report strategies; be stored, curated, synthesized, and shared to improve generalizable knowledge about implementation barriers and opportunities; and clarify “what works” in different contexts.
Improve workforce Capacity for Evaluation
Recommendation 5: The Centers for Disease Control and Prevention, National Institutes of Health, and the U.S. Department of Agriculture, through the National Collaborative on Child Obesity Research4 and other nongovernmental and professional organizations, should build on their existing evaluation resources to assure support for the diverse and interdisciplinary workforce engaged in conducting assess-ments, surveillance, monitoring, and summative evaluation activities.
Improve Evaluations to Address disparities and health Equity
Recommendation 6: The U.S. Department of Health and Human Services, in collaboration with other federal and nonfederal partners, should increase its capacity to address health equity by practicing partici-patory and culturally competent evaluation, and it should standardize the collection, analysis, and report-ing of data targeting disparities and health equity and improve the accessibility of tools and methods for measuring social determinants that place populations at elevated risk for obesity.
Support a Systems Approach in Evaluation
Recommendation 7: Evaluators, government, and private funders should incorporate a systems approach to evaluating obesity prevention efforts into their research-related activities through leadership, funding, and training support.
ThE wEIGhT OF ThE NATION MEASUREMENT IdEAS
Finally, the Committee identified ways to evaluate the impact of the HBO/IOM TWOTN campaign, launched in 2012. This multi-media, multi-organizational campaign was designed to help create aware-ness, inform, and motivate action to combat obesity. The Committee reviewed the campaign’s components and evaluation efforts to date, and it offered ideas for future measurement for both the national- and community-level components of the campaign.
After reviewing the evaluation literature and current national- and community-level evaluation efforts of TWOTN, the Committee concludes that further national-level evaluation of this specific cam-
4 One of the goals of the National Collaborative on Childhood Obesity Research, a private-public collaboration, is to improve the ability of obesity researchers and program evaluators to conduct research and program evaluation.

Copyright © National Academy of Sciences. All rights reserved.
Evaluating Obesity Prevention Efforts: A Plan for Measuring Progress
13Summary
paign is not warranted at this time. In this report, the Committee presents some methods for national evaluation of future campaigns, but it concludes that it would be unproductive to disentangle the effects of media campaign activities from other national and community activities that have employed policy and environmental strategies to raise awareness and engage stakeholders in obesity prevention. Further sum-mative evaluations of community-level interventions related to this campaign should emphasize (1) the use of strong theoretical or logic models; (2) the assessment of reach or dosage, which is a critical step in the logic model for any health promotion program or mass media campaign; and (3) the use of multiple waves of measurement preferably before, during, and after a campaign.
FINAL ThOUGhTS
The Committee offers an evaluation framework to guide future efforts to inform and improve obesity prevention efforts at national, state, and community levels. The national and community Obesity Evaluation Plans, stakeholder perspectives, indicators of progress, and existing data sources will provide guidance for improving targeted new evaluations of the collective strategies recommended in the APOP report. From the beginning recommendation for national leadership and infrastructure to the last recom-mendation for innovation in developing a systems approach to obesity prevention in general and in spe-cific communities, the Committee’s recommendations offer a series of logical and cyclical paths to support the implementation of its Obesity Evaluation Plans. The recommendations range from federal to local and back, from use of selected existing indicators to consensus on a set of expanded indicators, from suc-cesses for whole populations to successes in populations facing health disparities, and from development of evidence from existing projects to dissemination, adaptation, and evaluation of the strategies in other communities.

Copyright © National Academy of Sciences. All rights reserved.
Evaluating Obesity Prevention Efforts: A Plan for Measuring Progress

Copyright © National Academy of Sciences. All rights reserved.
Evaluating Obesity Prevention Efforts: A Plan for Measuring Progress
15
1Introduction
Few dispute obesity is a significant and growing public health issue, but no one has identified a single or simple solution. The overweight and obesity1 epidemic cannot await the completion of all the rigorous
research studies that would lend greater certainty to the efficacy of interventions and their applicability to varied populations. Instead, some carefully selected interventions can and must proceed on a trial-and-error basis to build a responsible response to the epidemic in an evidence-informed and theory-inspired manner. Evaluation builds on the body of science aimed at better understanding the complex biology of obesity, and on efficacy-tested interventions to combat the epidemic. Evaluation also recognizes that even the best scientific evidence of efficacy does not guarantee that an intervention will be effective when applied in specific populations and within community contexts.
Evaluation offers evidence on the need for, and the quality and effectiveness of, a range of interven-tions aimed at preventing obesity (interventions include policies, programs, services, and environmental changes). It can offer (1) assessment of the distribution of the problem and need for intervention; (2) monitori ng of interventions, a source of quality assurance on how well those responsible for imple-menting programs or enforcing policies are performing their functions; (3) through surveillance, a long-term assurance that the implementation of interventions is achieving intended outcomes or impact; and (4) summative evaluation providing judgment of a program’s or policy’s merit and worth. Evaluation is central and essential to a “learning organization,” to responsible legislators in amending or changing policies, to advocates in making their case, and to administrators in their stewardship of resources and programs.
PURPOSE OF ThE REPORT
The purpose of this report, developed by the Institute of Medicine’s (IOM’s) Committee on Evaluating Progress of Obesity Prevention efforts, is to develop a concise and actionable plan for measur-ing progress in obesity prevention efforts for the nation and adaptable guidelines for community assess-ments and evaluation. The Committee was tasked to
1 Overweight and obesity are defined in Appendix B.

Copyright © National Academy of Sciences. All rights reserved.
Evaluating Obesity Prevention Efforts: A Plan for Measuring Progress
Evaluating Obesity Prevention Efforts16
1. draw on the recommendations and recommended indicators of progress from the preceding IOM Committee and report Accelerating Progress in Obesity Prevention: Solving the Weight of the Nation (APOP); consider currently used and new tools and metrics (e.g., trend analysis, community/local measures) to measure progress; and develop a plan for a national-level evalua-tion of obesity prevention efforts by sector and, if appropriate, across sectors;
2. develop a community-level evaluation plan that adds detail and support to the national-level evaluation plan; and
3. identify measurement ideas that can determine the specific impact of the Home Box Office (HBO)/IOM campaign The Weight of the Nation (TWOTN).
The audience for the report includes decision makers, community members, researchers, and evalua-tors at all levels and across all sectors. The report’s recommendations are not expected to be implemented or even relevant to every level of evaluation from community and organizational to national, but report users can build on available monitoring and surveillance data and evaluations to aggregate up to com-munity and even state and national evaluations of specific components of obesity control efforts, and they draw on the Committee’s recommended resources to strengthen their capacity for evaluation.
This chapter sets the stage by articulating the Committee’s vision for evaluating progress of obesity prevention efforts at national, state, and community levels, and introducing a framework for evaluation. The chapter then describes how the Committee approached its task by (1) providing an overview of the needs of important users of evaluation, (2) describing the scope and use of existing objectives and strate-gies (as defined by its task), and (3) reviewing the current context of surveillance and summative evalua-tion. This chapter offers a brief introduction and background to the Committee’s task and how it will be particularly relevant and useful to evaluation users, helping to establish an infrastructure for monitoring progress of obesity prevention efforts at national, state, and community levels.
Much of this report’s guidance for evaluation plans may seem like generic methodological con-vention to the research-minded reader, so it is helpful to describe some ways in which the evaluation of progress in obesity prevention is similar to, and different from, evaluation of other prevention efforts. The fields of evaluation, policy analysis, surveillance, and community health assessment are hardly new, and this background knowledge contributed greatly to the Committee’s ability to anticipate issues, relate them to other prevention experience, and where necessary, differentiate the evaluation of obesity prevention from that experience.
EVALUATING OBESITY PREVENTION COMPAREd TO OThER PREVENTION EFFORTS
The prevention field generally, and obesity prevention in particular, need to engage in surveillance of diseases and related conditions and assess the relative importance and trends in prevalence of factors associated with diseases and related conditions (see Chapters 3 through 8). In evaluating interventions, prevention efforts need to focus not only on implementation and outcomes but also on the reach of inter-ventions—their ability to influence large numbers of people to achieve population-level benefits (Gaglio and Glasgow, 2012; Glasgow et al., 1999; Green and Glasgow, 2006). The ecological model of prevention identifies many potential influences on health, and evaluation permits prevention practitioners to select the most powerful levers for change among the multiple ecological levels. National monitoring of preven-
Copyright © National Academy of Sciences. All rights reserved.
Evaluating Obesity Prevention Efforts: A Plan for Measuring Progress
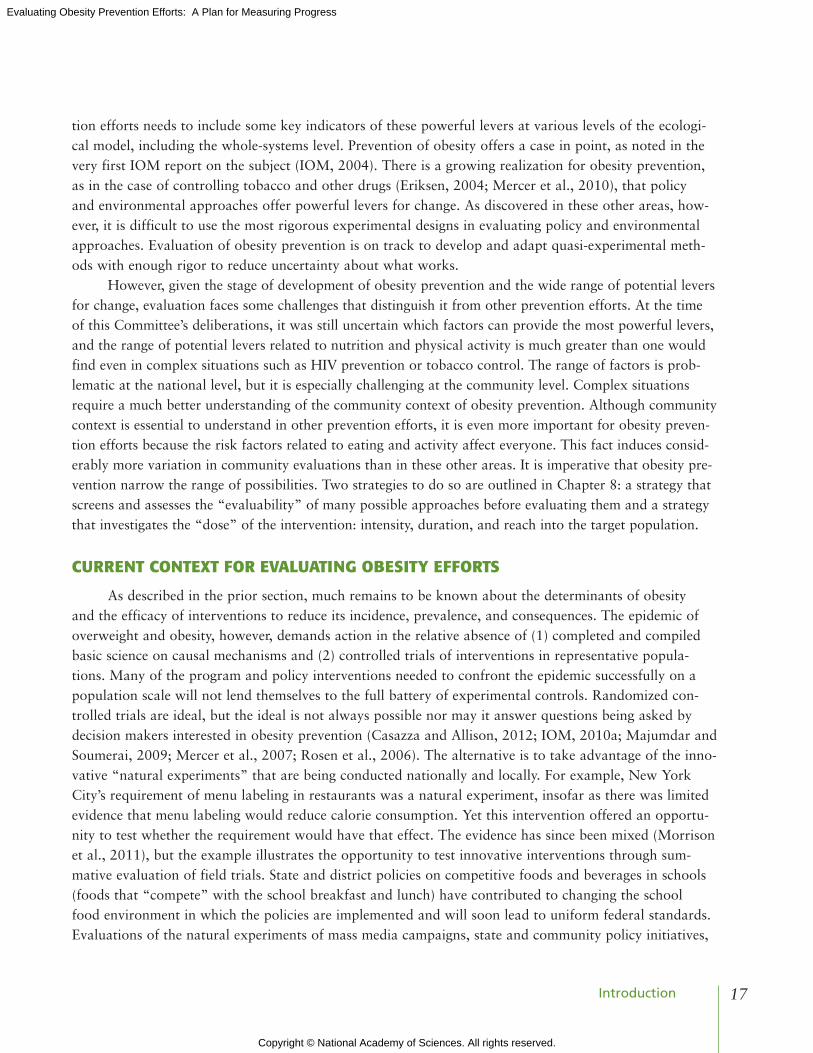
17Introduction
tion efforts needs to include some key indicators of these powerful levers at various levels of the ecologi-cal model, including the whole-systems level. Prevention of obesity offers a case in point, as noted in the very first IOM report on the subject (IOM, 2004). There is a growing realization for obesity prevention, as in the case of controlling tobacco and other drugs (Eriksen, 2004; Mercer et al., 2010), that policy and environmental approaches offer powerful levers for change. As discovered in these other areas, how-ever, it is difficult to use the most rigorous experimental designs in evaluating policy and environmental approaches. Evaluation of obesity prevention is on track to develop and adapt quasi-experimental meth-ods with enough rigor to reduce uncertainty about what works.
However, given the stage of development of obesity prevention and the wide range of potential levers for change, evaluation faces some challenges that distinguish it from other prevention efforts. At the time of this Committee’s deliberations, it was still uncertain which factors can provide the most powerful levers, and the range of potential levers related to nutrition and physical activity is much greater than one would find even in complex situations such as HIV prevention or tobacco control. The range of factors is prob-lematic at the national level, but it is especially challenging at the community level. Complex situations require a much better understanding of the community context of obesity prevention. Although community context is essential to understand in other prevention efforts, it is even more important for obesity preven-tion efforts because the risk factors related to eating and activity affect everyone. This fact induces consid-erably more variation in community evaluations than in these other areas. It is imperative that obesity pre-vention narrow the range of possibilities. Two strategies to do so are outlined in Chapter 8: a strategy that screens and assesses the “evaluability” of many possible approaches before evaluating them and a strategy that investigates the “dose” of the intervention: intensity, duration, and reach into the target population.
CURRENT CONTExT FOR EVALUATING OBESITY EFFORTS
As described in the prior section, much remains to be known about the determinants of obesity and the efficacy of interventions to reduce its incidence, prevalence, and consequences. The epidemic of overweight and obesity, however, demands action in the relative absence of (1) completed and compiled basic science on causal mechanisms and (2) controlled trials of interventions in representative popula-tions. Many of the program and policy interventions needed to confront the epidemic successfully on a population scale will not lend themselves to the full battery of experimental controls. Randomized con-trolled trials are ideal, but the ideal is not always possible nor may it answer questions being asked by decision makers interested in obesity prevention (Casazza and Allison, 2012; IOM, 2010a; Majumdar and Soumerai, 2009; Mercer et al., 2007; Rosen et al., 2006). The alternative is to take advantage of the inno-vative “natural experiments” that are being conducted nationally and locally. For example, New York City’s requirement of menu labeling in restaurants was a natural experiment, insofar as there was limited evidence that menu labeling would reduce calorie consumption. Yet this intervention offered an opportu-nity to test whether the requirement would have that effect. The evidence has since been mixed (Morrison et al., 2011), but the example illustrates the opportunity to test innovative interventions through sum-mative evaluation of field trials. State and district policies on competitive foods and beverages in schools (foods that “compete” with the school breakfast and lunch) have contributed to changing the school food environment in which the policies are implemented and will soon lead to uniform federal standards. Evaluations of the natural experiments of mass media campaigns, state and community policy initiatives,

Copyright © National Academy of Sciences. All rights reserved.
Evaluating Obesity Prevention Efforts: A Plan for Measuring Progress
Evaluating Obesity Prevention Efforts18
and programs in communities and organizations become sources of evidence for national and state initia-tives and models to be emulated in other communities and organizations if and when these natural experi-ments are evaluated with sufficient attention to a common framework and the comparable indicators suggested in this report.
The APOP report (IOM, 2012a) makes using “natural experiments” as the main source of evalu-ation all the more compelling. The APOP report, to which this report is sequenced, framed obesity pre-vention by targeting policies, systems, and environments, rather than emphasizing changes in individual behavior, as many previous recommendations and published evaluations had done. Actions through such policies, systems, and environments are under way across the country in multiple forms, and surveillance systems exist to compare their effects over time and between jurisdictions. Much of what this report rec-ommends, then, is a more systematic application of these natural experiments to bring their results to scale and to the aid of states, communities, and organizations.
This report is about how all societal sectors and levels can increase the likelihood that adopted obesity prevention interventions will be (1) matched to the assessed needs of populations, (2) monitored for their progress in adopting, implementing, and maintaining tested interventions, (3) evaluated in light of program/policy objectives, and (4) widely disseminated. The use of existing surveillance systems to maximize comparability of results across interventions, populations, and jurisdictions has provided much of the inspiration and role modeling of promising practices from one setting to another, and it can con-tinue to expand the reach of such interventions with the addition of recommended indicators of need and effectiveness.
“Promising practices” have taken on new meaning in obesity control as the relative paucity and dubious representativeness, time intensiveness, or applicability of rigorously tested practices have forced national organizations and communities to innovate and apply ideas from public health successes and community projects (Brennan et al., 2011). The evaluation results of those public health successes (e.g., the National High Blood Pressure Education Program, the National Cholesterol Education Program, and tobacco control) and community projects, however, might not be applicable to the varied obesogenic circumstances of communities of varied ethnicity, resources, and socioeconomic conditions (Green and Glasgow, 2006). Evaluation of promising interventions, then, becomes more important for each commu-nity to test the intervention’s applicability there, and then cumulatively important for its broader applica-bility or adaptability across a wider variety of communities.
A NOTE ON TERMINOLOGY
In the literature, terms such as assessment, surveillance, monitoring, and evaluation are often used interchangeably or with meanings that vary among professions, disciplines, and settings. In this report the Committee uses these terms as described in Box 1-1, which may mean that the Committee’s usage in this report will sometimes not match the usage elsewhere. In this report, the Committee uses the term evaluation to refer to combinations or culmination of all four of these functions from needs to processes to outcomes. The Committee uses the term summative evaluation, as in the evaluation literature where a distinction is needed, to refer to the addition of experimental or quasi-experimental design features that provide greater certainty that the outcomes or impact can be attributed to the interventions. All of these forms of evaluation can apply to any combination of programs or components of programs, systems,

Copyright © National Academy of Sciences. All rights reserved.
Evaluating Obesity Prevention Efforts: A Plan for Measuring Progress
19Introduction
BOX 1-1 A Note on Terminology
• Assessment is an effort to use data on the community or other jurisdiction to characterize the prob-lem, its distribution, and efforts to address it.
• Monitoring is the tracking of the implementation of interventions* compared to standards of performance.
• Surveillance is the ongoing systematic collection, analysis, and interpretation of data tracked over time to detect patterns, disparities, and changes that may be associated with interventions or other causes.
• Summative Evaluation is the effort to detect changes in output, outcomes, and impacts associated with interventions and to attribute those changes to the interventions.
• Evaluation refers to all four or various combinations of these functions (assessment, monitoring, sur-veillance, and summative evaluation).
* In this report, interventions refer to programs, systems, policies, environmental changes, services, products, or any combina-
tion of these multifaceted initiatives.
policies, environmental changes, services, and products. The Committee will refer to these objects of eval-uation collectively and in their various combinations as interventions.
VISION
Several IOM committees have given prominence in their reports to the importance and challenges of evaluating and measuring the progress of obesity prevention in terms of (1) assessment and monitor-ing of progress in implementing efforts and actions (interventions) to prevent obesity and (2) surveillance of changes and summative evaluation of progress in obesity control as a result of those interventions. For example, the 2004 IOM report Preventing Childhood Obesity: Health in the Balance grappled with the use of body mass index as the most common measure of overweight and obesity and evaluation of out-comes in obesity prevention efforts (IOM, 2004). It also addressed the growing expectation for commu-nity engagement in participatory studies, funding issues, and various design issues. In 2007, IOM released Progress in Preventing Childhood Obesity: How Do We Measure Up? That report concluded “evaluation serves to foster collective learning, accountability, responsibility, and cost-effectiveness to guide improve-ments in . . . obesity prevention policies and programs,” and it identified surveillance, monitoring, and research as fundamental components of these evaluation efforts (IOM, 2007, p. 8). The Committee refers the reader to previous reports, especially those on the linkage of research and summative evalua-

Copyright © National Academy of Sciences. All rights reserved.
Evaluating Obesity Prevention Efforts: A Plan for Measuring Progress
Evaluating Obesity Prevention Efforts20
tion (IOM, 1997), issues of cost, cost-effectiveness, and cost-benefit in community evaluation, and the weighing of trade-offs between benefits and harms of interventions (IOM, 2012b). The 2010 IOM report Bridging the Evidence Gap in Obesity Prevention: A Framework to Inform Decision Making addressed the need for development and integration of various sources of evidence and offered a framework for locating, assessing, and applying evidence to guide decision making (IOM, 2010a). This report builds on these other reports to offer an evaluation framework depicting resources, inputs, strategies, actions, and a range of outcomes important to prevention, all amenable to documentation, measurement, and evaluation (see Figure 1-1). As did previous committees, this Committee stresses the necessity of engaging multiple sectors and stakeholders in evaluations to assess and stimulate progress in obesity prevention over the short, intermediate, and long terms.
To provide a vision of how and where this report should begin and where it should lead, the Committee developed a graphic representation, or framework, of the scope of inputs or people, resources, activities, outputs, outcomes, and, ultimately, impacts, that would need to be encompassed by the cumu-lative evaluation efforts, if not the individual strategies and methods of each project applying the recom-
Figure 1-1.eps
1. Inputs
• User/Stakeholder Needs• Existing Objectives Strategies• Context for Evaluationa
• Guiding Principles for Evaluationa
• Resources
2. Activities
• Identify Indicators/Measures of Success• Develop Evaluationa Plans and
Infrastructure• Develop Resources for Training, Technical
Assistance, and Dissemination
3. Outputs
• Core Indicators and Measures• Recommendations and Guidance• Support for Implementation
4. Outcomes
• Short-term: Improved Evaluationa
Capacity and Training• Intermediate-term: Increased
Evaluationa Activities• Long-term: Enhanced Data Use
5. Intended Impacts/ Improvements
• Partnerships, Environments, Policies, Behaviors, Norms
• Energy Expenditure/Intake• Overweight/Obesity• Population Health and Well-Being; Equity
Vision: Assure timely and meaningful collection and analysis of data and information to inform and improve obesity prevention efforts at national, state, and community levels.
FIGURE 1-1 Framework for evaluating progress of obesity prevention efforts.a Evaluation refers to assessment, monitoring, surveillance, and summative evaluation activities.

Copyright © National Academy of Sciences. All rights reserved.
Evaluating Obesity Prevention Efforts: A Plan for Measuring Progress
21Introduction
mendations (see Figure 1-1). The Committee aims to assure timely and meaningful collection and analysis of data to inform and improve obesity prevention efforts at national, state, and community levels. This framework addresses the full spectrum of resources or inputs to consider, activities to undertake, and the expected outputs, outcomes, and impacts that would result in fully realizing this vision. As such, the framework seeks to inform a systems perspective on the full range of influences on obesity and their rela-tionships to each other. The Committee used this framework to inform its approach to developing the national, state, and community obesity evaluation planning and measurement ideas and recommenda-tions. This framework and its components are fully described in Chapter 3. The Committee approached its tasks by searching for methods and indicators that would contribute to a model of evaluation that emphasizes its value as a professional or community learning tool to not only improve efforts, but also to prove their generalizable effectiveness (e.g., Green et al., 2009; Kottke et al., 2008). The Committee framed the evaluation not as an event, but as a continuous process of assessing community needs, plan-ning services, programs or policies, and environmental changes, and monitoring their implementation and summatively evaluating their effectiveness.
USERS OF EVALUATION
Detailed in Chapter 2, key audiences for the report’s recommended plans and indicators are deci-sion makers, community members, researchers, and evaluators at all levels and across all sectors, and the organizations that mandate or fund them. The Committee consisted of representatives from many of these stakeholders, and it reached out to representatives of other “end users” of this report’s recommendations to understand their needs and expected applications of evaluation ideas and measures. These consulta-tions included representatives from the Centers for Disease Control and Prevention (CDC) and National Institutes of Health (NIH), the main federal funders of evaluation of obesity prevention and the research that informs it, and agencies that need evaluation to accomplish their missions and objectives related to obesity prevention.
ExISTING OBjECTIVES ANd STRATEGIES OF OBESITY PREVENTION EFFORTS
The most recent among the several IOM obesity committee reports, referred to in this report as the APOP report (IOM, 2012a), supported the growing consensus of public health science and practice experts that environmental and policy strategies hold the most promise to accelerate progress in prevent-ing obesity over the next decade. Unlike the more central role of clinical and pharmaceutical strategies central to the National High Blood Pressure and National Cholesterol Control programs, the 20 APOP strategies were organized around five environments:
1. the physical activity environment, which includes the aspects of the physical and built environ-ment2 as well as norms and processes that increase access to, opportunities for, and social rein-forcement of activity and decrease barriers to engaging in physical activity;
2 Aspects related to the physical and built environment include transportation infrastructure, land use patterns, and urban design.

Copyright © National Academy of Sciences. All rights reserved.
Evaluating Obesity Prevention Efforts: A Plan for Measuring Progress
Evaluating Obesity Prevention Efforts22
2. the food and beverage environment, which seeks to increase the availability, attractiveness, and affordability of healthful foods and make unhealthful foods less available, attractive, and affordable;
3. the message environment that encompasses media and marketing that often promotes unhealth-ful foods and sedentary lifestyles but can be harnessed to counter those messages and promote healthful food and active lifestyles;
4. the health care and worksite environments in which promotion of healthful foods and physical activity can be arranged and promotion of unhealthful foods and sedentary lifestyles discour-aged, with referrals of patients or employees to existing community resources for support and guidance; and
5. the school environment as a hub of health promotion, given the daily hours spent there by chil-dren and youth, with potential for incorporating opportunities for healthful food and physical activity as well as health education and promotion, as well as for reducing access to unhealthful foods and sedentary lifestyles.3
Table 1-1 itemizes the specific APOP strategies by major level or sector for action, for which this report’s recommended obesity plans and supporting recommended actions are intended to apply. The APOP report supported the inclusion of these strategies using the best available evidence and implementation research.
The APOP report stressed that the recommended strategies identified in the five key environments are interrelated and their collective implementation would have the most promise to accelerate obesity prevention over the next decade. Importantly, the report declared that successful implementation of the strategies will require engagement across all levels and sectors of society and leadership. This systems approach to obesity prevention, featured in Chapter 9 of this report, would coordinate the messages and environmental changes across multiple sectors and levels to provide maximum impact with minimal resources.
The APOP report also identified extant and promising “indicators of progress” that could be mea-sured and analyzed to assess the impact of the APOP strategies. The APOP committee stressed that “it will be essential to monitor and track progress in the implementation” of the most promising strategies, “as well as to conduct sustained research on the magnitude and nature of their impact” (IOM, 2012a, p. 9). This Committee emphasized conclusions from prior reports that, although each strategy has the potential to accelerate progress, the system of large-scale transformative approaches that they recom-mended will be successful only if all stakeholders commit to a sustained effort in implementation and evaluation of these strategies.
ThE wEIGhT OF ThE NATION CAMPAIGN
Concurrent with the publication of the APOP report, HBO’s documentary film division and the IOM launched a coordinated, multi-media, multi-organizational campaign called TWOTN in May 2012. Presented in association with CDC and NIH, and in partnership with the Michael & Susan Dell Foundation and Kaiser Permanente, the campaign was designed to help create awareness, inform, and motivate action to slow, arrest, and reverse the trend of obesity across the country. The campaign includes
3 Strategies related to child care fall under physical activity, food and beverage, worksite, and health care environments.

Copyright © National Academy of Sciences. All rights reserved.
Evaluating Obesity Prevention Efforts: A Plan for Measuring Progress
23Introduction
TABLE 1-1 Accelerating Progress in Obesity Prevention Report Recommended Policy and Environmental Strategies by Level or Sector of Action
Major Levels (Sectors) of Action
Accelerating Progress in Obesity Prevention Report Recommended Strategies (abbreviated topic version)*
Systems level • Development, implementation, and coordination of common messages, processes, and strategies
National (public sector)
• Physical education and physical activity in schools• Physical activity in child care centers• Science and practice of physical activity• Sugar-sweetened beverages• Nutritional standards for all food and beverages• U.S. agriculture policy and research• Social marketing program• Food and beverage marketing standards for children• Nutrition labeling system• Nutrition education policies• Food literacy in schools• Weight gain and breastfeeding• School food and beverage standards
State (public sector)
• Physical education and physical activity in schools• Physical activity in child care centers• Science and practice of physical activity• Sugar-sweetened beverages• Nutritional standards for all food and beverages• Food and beverage retailing and distribution policies• Food literacy in schools
Community (citizens and civic organization)
• Enhancing the physical and built environments• Physical activity-related community programs• Sugar-sweetened beverages• Nutritional standards for all food and beverages• Food and beverage retailing and distribution policies• Social marketing program• Weight gain and breastfeeding
Schools (public sector)
• Physical education and physical activity in schools• Physical activity in child care centers• Sugar-sweetened beverages• Nutritional standards for all food and beverages• Food literacy in schools• School food and beverage standards
Worksite • Sugar-sweetened beverages• Coverage of access to and incentives for obesity prevention, screening, diagnosis, and treatment• Healthy living and active living at work• Weight gain and breastfeeding
continued

Copyright © National Academy of Sciences. All rights reserved.
Evaluating Obesity Prevention Efforts: A Plan for Measuring Progress
Evaluating Obesity Prevention Efforts24
Major Levels (Sectors) of Action
Accelerating Progress in Obesity Prevention Report Recommended Strategies (abbreviated topic version)*
Health care • Sugar-sweetened beverages• Nutritional standards for all food and beverages• Health care and advocacy• Coverage of access to and incentives for obesity prevention, screening, diagnosis, and treatment• Healthy living and active living at work• Weight gain and breastfeeding
Business community/private sector
• Sugar-sweetened beverages• Food and beverage options for children in restaurants• Nutritional standards for all food and beverages• Food and beverage retailing and distribution policies• Food and beverage marketing standards for children• Nutrition labeling system
* There are a total of 20 recommended strategies. Strategies are duplicated in the table if more than one level or sector of action can support the implementation of the strategy. SOURCE: IOM, 2012a.
TABLE 1-1 Continued
a four-part television documentary series for a national audience (aired May 2012, but available for download or on CD without charge to communities for community screenings) and a set of activities for use by individual communities, including a series of bonus video shorts on specific topics related to obesity, a companion trade publication for a broad adult audience, three other documentaries for chil-dren and families (to be released May 2013), and a book and action guide geared to elementary school students and their teachers. The campaign is supported by a national-level information- and video-rich website4 and an extensive presence on social networks. Thus, TWOTN has both national (primarily the HBO series and associated website) and community components (e.g., community screenings, school ini-tiatives). Chapters 6 (national) and 8 (community) will address the potential evaluation of TWOTN in response to the Committee’s charge to identify “measurement ideas” to determine the reach, implementa-tion, outcomes, and impact of the overall campaign. Given the range of social media and advocacy efforts involved in TWOTN, it can serve as an illustrative example of some of the challenges and opportunities that are inherent in evaluation of similar obesity prevention initiatives. Box 1-2 provides background on the importance of the evaluation of TWOTN and other large-scale programs or campaigns.
OBESITY-RELATEd RESEARCh PRIORITIES
Once established, obesity is difficult to reverse, and obese children are much more likely to become obese adults (American Dietetic Association, 2006; Bao et al., 1995; Bouchard, 1997; Freedman et al., 1999; Serdula et al., 1993; Thompson et al., 2007). Childhood obesity and weight gain may be associated with higher mortality and morbidity in adulthood, including cardiovascular disease, cancer, diabetes, sleep apnea, gout, and orthopedic problems (IOM, 2012a). Obese children also face social problems, such as
4 See http://theweightofthenation.hbo.com (accessed November 11, 2013).

Copyright © National Academy of Sciences. All rights reserved.
Evaluating Obesity Prevention Efforts: A Plan for Measuring Progress
25Introduction
BOX 1-2 Importance of Evaluating The Weight of the Nation and Other Large-Scale Social Media and Advocacy Efforts
The Weight of the Nation (TWOTN) is an example of one of many initiatives that have been undertaken to raise awareness and promote the rationale behind and recommendations of the Accelerating Progress in Obesity Prevention report (IOM, 2012a). Evaluation is one way to determine the effects TWOTN has on awareness of obesity and other outcomes, whether these effects were related to how the information was presented (e.g., through the television broadcast, website, or community events), and what potential actions were taken as a result. Evaluation results can then be used to guide future dissemination efforts for TWOTN, as well as for similar programs/campaigns.
Careful formative evaluation increases the chances of success of programs/campaigns (Worden et al., 1988). Unfortunately too few studies have investigated uses of mass media for changing social networks, commu-nities, and places to fully understand how effective they can be (Abroms and Maibach, 2008).
How effective are small-scale community programs/campaigns? Unfortunately most small-scale, community, mass media programs alone have not been effective (Noar, 2006; Snyder and Hamilton, 2002). One exception is long-term campaigns designed to increase advocacy for community policy changes that are framed on the themes of children’s health and social justice (Freudenberg et al., 2009). Most community-level campaign effects are small in size; Snyder and Hamilton’s (2002) meta-analysis of 48 mass media health campaigns found an average effect size (mean of correlations, Mr) of only 0.09. Moreover, the average effect size for purely persuasive campaigns were about half (Mr=0.05), whereas the average effect size for campaigns that promoted behaviors that were enforceable by law (e.g., seat-belt use) were almost double (Mr=0.17).
How effective are national programs/campaigns? It is clear that national programs that have clear objec-tives, are intensive and focused, and are long term can achieve greater effects than those that do not (e.g., the Legacy truth® campaign) (Farrelly et al., 2005, 2009). Furthermore, adding community activities can help to increase reach and effectiveness (e.g., the VERBTM campaign, see Bauman et al., 2008; Berkowitz et al., 2008; Huhman and Patnode, 2013; Huhman et al., 2010); but sustained resources and funding are necessary.
How can TWOTN or similar programs be evaluated? First, the objectives of a program/campaign need to be very clear—concise, well understood, and widely communicated. An important component is the socio- ecological levels at which the effects are expected to occur, that is, on individuals (awareness, attitudes, or behavior), social networks (peer pressure or social support), or communities/institutions (community action/advocacy or policy) (Maibach et al., 2007). Equally important, what kinds of changes are expected? Some or all of the following may be in play: increased awareness of health issues or their social determinants (Clarke et al., 2012), individual-level antecedents to behavior (e.g., knowledge, attitudes, perceptions, self-efficacy, or intentions) (Fishbein and Ajzen, 2009), improved behavior of individuals, changed peer pressures, or social support within social networks (Rogers, 2003; Valente and Saba, 2001), community action/advocacy toward policy development/change (Freudenberg et al., 2009), or changes in characteristics of places (Maibach et al., 2007). To design an appropriate evaluation, evaluators need to understand the socio-ecological levels and the nature of the expected effects of the program or campaign they will be evaluating. Evaluations also need to be planned well ahead of the campaign so that appropriate control or comparison sites/data can be identified and pretest data can be collected. See Chapter 6 for detailed suggestions and considerations for evaluating the national-level objectives, Chapter 8 for evaluating the community-level objectives of TWOTN, and Chapter 10 for a summary of the challenges and opportunities inherent in evaluation of similar obesity prevention initiatives.

Copyright © National Academy of Sciences. All rights reserved.
Evaluating Obesity Prevention Efforts: A Plan for Measuring Progress
Evaluating Obesity Prevention Efforts26
exclusion and victimization, and are more likely to have psychological problems, such as depression and low self-esteem (Eisenberg et al., 2003).
The impact of obesity has been estimated in direct costs as well as nondollar metrics such as days lost at work, years of life lost, excess fuel use, and level of education completed—the costs related to remedial spending, productivity, transportation, military readiness, and human capital (Hammond and Levine, 2010). Economic growth across the past few decades has shifted concern from issues of under-weight to issues of overweight. Community factors have created environments that have changed the physical activity patterns and food consumption in people’s daily lives in directions that produce obesity. Although recent prevalence data may suggest that interventions aimed at obesity for the past several years are beginning to have a cumulative effect, obesity levels remain high and, in some populations, significant increases continue (Howard, 2012; IOM, 2012a).
Obesity poses one of the biggest public health challenges of the 21st century, and yet several ques-tions about the epidemic and its basic biology and pathophysiology and the effectiveness of behavioral, clinical, and public health interventions remain perplexing. Therefore, while taking action to contain the epidemic and to test and evaluate interventions is inescapably necessary, focused effort to address the research gaps also remains imperative. Indicators of progress toward obesity prevention need to embrace measures that can chart the application and progress of research to tackle the epidemic from a strong sci-ence and evidence base. This attention would seek to bridge the gap between what is known or presumed from research to be widely effective and what is being adopted and applied, with what degree of fidelity or type of adaptation, and with what relative success in varied populations and circumstances (Green, 2001; IOM, 2010a). Part of the problem of bridging the gaps lies in the scientific pipeline of vetting and publishing the research in ways that anticipate end-user needs for implementation. These include report-ing of null or negative results, selectivity of and attrition from study samples, and sufficient detail about the interventions to enable researchers to understand and compare them, and practitioners to replicate or adapt them (Briss et al., 2004; Colditz et al., 2012; Green et al., 2009; IOM, 1997). The gaps discovered in this part of the evaluation efforts would help the scientific enterprise to circle back and reconsider the more basic and applied research on which assumptions of wide applicability had their origins (Garfield et al., 2003).
Although recommendations on basic research are beyond the scope of this report, the Committee deemed it important to acknowledge the limitations of basic research foundations in areas identified in the next few paragraphs. Also needed in linking evaluation with gaps in the research base is a better analysis of the age-period-cohort effect of the obesity epidemic over long periods of time. The gaps in the research base for obesity reqiure attention along several fronts concomitant with the evaluation of the progress of efforts to control the epidemic. For example, although national survey data indicate a high prevalence of obesity, recent data indicate that the rise in prevalence may be plateauing in adults and children (Flegal et al., 2012; Ogden et al., 2012a,b). In addition to national prevalence data based on measured overweight and obesity, a better grasp of what is going on with the obesity epidemic will also require national data on incidence (i.e., new cases) and its trends over time and in specific age-sex-ethnic groups, in particular among adults. Incidence could be a more sensitive indicator of success in primary prevention than preva-lence in adults insofar as it measures with greater sensitivity new cases of overweight or obesity rather than the combination of new and continuing cases. Continuing cases measure success or failure of weight-reduction treatment rather than prevention, or duration rather commencement of the problem.

Copyright © National Academy of Sciences. All rights reserved.
Evaluating Obesity Prevention Efforts: A Plan for Measuring Progress
27Introduction
Although obesity has varied impacts on each of several aspects of health (mortality; incidence and prevalence of diabetes, cardiovascular disease, and cancers; and disability), epidemiological data suggest that the association between body weight and mortality is U-shaped, while those between body weight and other outcomes are linear. These seemingly contradictory relationships warrant careful future investi-gation and raise questions about the trade-off between avoiding mortality and preventing morbidity when it comes to obesity prevention interventions (Flegal et al., 2013). For example, maintaining “normal” weight ranges in the early and middle adult years is generally protective in the older years. Yet, a degree of overweight may be protective when some illnesses arise, although the issue of reverse causality in the U-shaped association between obesity and the diseases causing mortality cannot be ruled out. In fact, robust evidence from randomized controlled trials on clinical interventions have so far been limited to the effectiveness of weight loss on diabetes incidence among people with prediabetes (Garfield et al., 2003; Knowler et al., 2002) and on disability among people with prediabetes or diabetes (Look AHEAD5), while some trials of cardiovascular prevention have produced null findings (e.g., MRFIT6). Trials of bariatric surgery to induce weight loss have demonstrated positive benefits on health outcomes, however, these data apply to special clinical situations and are less applicable to public health approaches (Shea et al., 2010). On the other hand, recent evidence from a randomized controlled trial indicates the positive benefits of a high- quality diet (i.e., rich in fruits and vegetables, whole grain, and monosaturated fat; low in red meat and saturated fat) on health outcomes, including cardiovascular disease incidence, even when weight loss is not achieved (Estruch et al., 2013). A recent analysis by CDC (Flegel et al., 2013) indicates that the widespread assumption of a linear relationship between overweight or obesity and mortality does not hold in analyses of large national samples, which is particularly significant to the conduct and evalua-tion of efforts to prevent obesity.
Even more challenging is that affecting and maintaining weight loss are often difficult. Weight gain is accompanied by impressive changes in neuroendocrine hormones (e.g., leptin, ghrelin), and these hor-monal changes seem to persist and fight to restore the body’s pre-weight-loss homeostasis for several months following significant weight loss (Sumithran et al., 2011). Thus, weight loss is affected by not only the socio-behavioral-cultural-environmental determinants on which interventions are acting, com-plex as these are, but also biological processes and interventions. Better understanding of the biological basis of weight gain and weight loss, including determinants of eating preferences and cultural norms for feeding in early childhood, is needed, so that effective interventions can be developed and tested within the context of the environments and lifespan in which they would be applied. Considerable investment in rigorous, high-quality research therefore is needed to (a) understand more fully the biology of overweight and obesity and (b) test interventions to prevent overweight and obesity in individuals and populations in various settings (e.g., home, work, school) and at various developmental levels (e.g., toddler, child, adolescent, adult). The IOM report Bridging the Evidence Gap in Obesity Prevention identified ways to “locate, evaluate, and assemble evidence to inform decisions” for evidence-based practice while generat-ing more practice-based evidence that would contribute to building a strong evidence base to identify,
5 Look AHEAD (Action for Health in Diabetes) is a multicenter randomized clinical trial to examine the effects of a lifestyle intervention on weight loss over the long term. Look AHEAD is focusing on type 2 diabetes and cardiovascular disease (http://www2.niddk.nih.gov/Research/ScientificAreas/Obesity/ClinicalStudies/AHEAD.htm, accessed November 11, 2013).
6 MRFIT (Multiple Risk Factor Intervention Trial for the Prevention of Coronary Heart Disease) was a special intervention program consisting of stepped-care treatment for hypertension, counseling for cigarette smoking, and dietary advice for lowering blood cholesterol levels (http://www.trialresultscenter.org/study7914-MRFIT.htm, accessed November 11, 2013).

Copyright © National Academy of Sciences. All rights reserved.
Evaluating Obesity Prevention Efforts: A Plan for Measuring Progress
Evaluating Obesity Prevention Efforts28
improve, and refine promising obesity prevention practices for different sectors, populations, and settings (IOM, 2010a).
CONTExT FOR ASSESSMENT, MONITORING, SURVEILLANCE, ANd SUMMATIVE EVALUATION NEEdS
In its deliberations and recommendation development, the Committee held paramount the over-arching principles of an ecological and systems understanding of the obesity problem in society overall and in specific populations. The Committee’s remit was to recommend evaluation plans to address the APOP-recommended interventions, which were concentrated on environmental and population, rather than clinical, domains. This focus meant a search for and a commitment to indicators that would mea-sure social and policy determinants of obesity and health, as well as an understanding of the interaction of these with organizational, family, and individual determinants and outcomes. The latter would include clinical interventions that are not the focus of this report, although the Committee recognizes the impor-tance and the promise of clinical interventions within the ecology of obesity. The Committee viewed policies and policy changes relating to the environment as key leverage points at the broad population, organization, community environment, and individual levels. These changes include specific environmen-tal, economic, and behavioral restraints on or incentives for the manufacturers, vendors, and marketers of obesity-related products and services; and influencing organizations, families, and social groups that influ-ence individual behavior. The chapters that follow lay out the considerations and the recommendations on each of the foregoing aspects of evaluating progress in obesity prevention. Some aspects of evaluation remain necessarily incomplete or underdeveloped given the gaps in scientific knowledge of the determi-nants of overweight and obesity and of the relative effectiveness of interventions for various population groups and settings. Some of the strategies for evaluating obesity prevention efforts considered, therefore, draw on the notable public health successes in the past (CDC, 2007; Isaacs and Schroeder, 2001; Ward and Warren, 2006), for example in reducing mortality from and prevalence of cardiovascular diseases (e.g., coronary heart disease and stroke) and some of the risk factors associated with them, such as smok-ing, total cholesterol, and hypertension.
Societies have gradually associated overweight, obesity, inadequate physical activity, and unhealth-ful dietary habits (e.g., low fruit and vegetable consumption, high intake of refined grains and foods high in fats and/or sugars and low in nutrients, and excessive calorie intake), individually and collectively, with the characteristics of an epidemic (or set of converging epidemics). The United States, among other coun-tries, faced the rude awakening that few tools were at hand to deal with the behaviors: no immunization, limited pharmaceutical or surgical options, and no simple or single environmental or behavioral change to prevent obesity’s relentless rise and spread across the nation, indeed the world. Furthermore, the scientific understanding of the biological basis of obesity, and how genes and changes in the environment affect it, remain rudimentary and often unclear or mixed. If a multitude of strategies to understand the causes (biological, behavioral, and societal, and their interactions) of obesity and strategies to prevent or control it need to be pursued and coordinated, then they need to be evaluated, as well. Such strategies cannot be pursued with confidence that the prior evidence for their presumed effectiveness is generalizable to dif-ferent settings and populations (Garfield et al., 2003; Green, 2001; Green and Glasgow, 2006; Green et
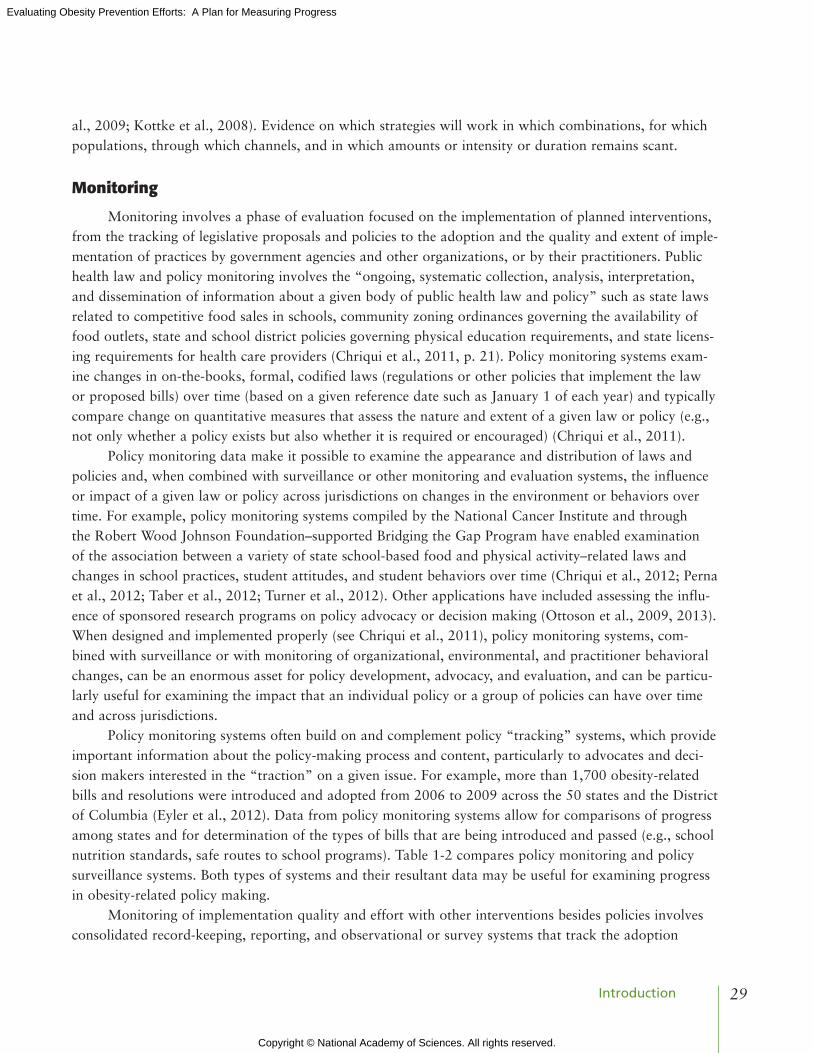
Copyright © National Academy of Sciences. All rights reserved.
Evaluating Obesity Prevention Efforts: A Plan for Measuring Progress
29Introduction
al., 2009; Kottke et al., 2008). Evidence on which strategies will work in which combinations, for which populations, through which channels, and in which amounts or intensity or duration remains scant.
Monitoring
Monitoring involves a phase of evaluation focused on the implementation of planned interventions, from the tracking of legislative proposals and policies to the adoption and the quality and extent of imple-mentation of practices by government agencies and other organizations, or by their practitioners. Public health law and policy monitoring involves the “ongoing, systematic collection, analysis, interpretation, and dissemination of information about a given body of public health law and policy” such as state laws related to competitive food sales in schools, community zoning ordinances governing the availability of food outlets, state and school district policies governing physical education requirements, and state licens-ing requirements for health care providers (Chriqui et al., 2011, p. 21). Policy monitoring systems exam-ine changes in on-the-books, formal, codified laws (regulations or other policies that implement the law or proposed bills) over time (based on a given reference date such as January 1 of each year) and typically compare change on quantitative measures that assess the nature and extent of a given law or policy (e.g., not only whether a policy exists but also whether it is required or encouraged) (Chriqui et al., 2011).
Policy monitoring data make it possible to examine the appearance and distribution of laws and policies and, when combined with surveillance or other monitoring and evaluation systems, the influence or impact of a given law or policy across jurisdictions on changes in the environment or behaviors over time. For example, policy monitoring systems compiled by the National Cancer Institute and through the Robert Wood Johnson Foundation–supported Bridging the Gap Program have enabled examination of the association between a variety of state school-based food and physical activity–related laws and changes in school practices, student attitudes, and student behaviors over time (Chriqui et al., 2012; Perna et al., 2012; Taber et al., 2012; Turner et al., 2012). Other applications have included assessing the influ-ence of sponsored research programs on policy advocacy or decision making (Ottoson et al., 2009, 2013). When designed and implemented properly (see Chriqui et al., 2011), policy monitoring systems, com-bined with surveillance or with monitoring of organizational, environmental, and practitioner behavioral changes, can be an enormous asset for policy development, advocacy, and evaluation, and can be particu-larly useful for examining the impact that an individual policy or a group of policies can have over time and across jurisdictions.
Policy monitoring systems often build on and complement policy “tracking” systems, which provide important information about the policy-making process and content, particularly to advocates and deci-sion makers interested in the “traction” on a given issue. For example, more than 1,700 obesity-related bills and resolutions were introduced and adopted from 2006 to 2009 across the 50 states and the District of Columbia (Eyler et al., 2012). Data from policy monitoring systems allow for comparisons of progress among states and for determination of the types of bills that are being introduced and passed (e.g., school nutrition standards, safe routes to school programs). Table 1-2 compares policy monitoring and policy surveillance systems. Both types of systems and their resultant data may be useful for examining progress in obesity-related policy making.
Monitoring of implementation quality and effort with other interventions besides policies involves consolidated record-keeping, reporting, and observational or survey systems that track the adoption

Copyright © National Academy of Sciences. All rights reserved.
Evaluating Obesity Prevention Efforts: A Plan for Measuring Progress
Evaluating Obesity Prevention Efforts30
and implementation of evidence-based or mandated practices in or across jurisdictions or organizations or sub-organizational units. It is helpful to know which kinds of organizations are adopting and imple-menting policies and new practices and at what rate. This can inform the plans for intensification and allocation of dissemination efforts and technical assistance to increase adoption, implementation, and maintenance of practices (Brownson et al., 2012). Within organizations, practitioners sometimes take up a self-study or continuous quality improvement process to monitor their implementation of new practices recommended by new evidence of effectiveness (Mittman, 2012). Across public health organizations, per-formance monitoring has developed around “rapid-cycle improvement techniques” associated with a core set of services (IOM, 2010b; Jacobson and Lotstein, 2013).
Summative Surveillance
Surveillance7 is a cornerstone of public health (McQueen and Puska, 2003; Teutsch and Churchill, 2000), and its importance is illustrated in the adage “what gets measured, gets done” (Thacker, 2007; Thacker and Berkelman, 1988). Public health surveillance, including the ongoing, systematic collection, analysis, and interpretation of outcome-specific data is essential to the planning, implementation, and evaluation of public health interventions. These functions are closely integrated with timely dissemina-tion and utilization of these data by those responsible for prevention and control (Goodman et al., 2000; Ottoson and Wilson, 2003; Thacker and Berkelman, 1988).
A surveillance system includes a functional capacity for data collection, analysis, and dissemination linked to public health programs. Three features of a public health surveillance system are critical. First, its activities must be ongoing with systematic periodicity; one-time surveys and sporadic epidemiologic studies are not sufficient. Second, the system must be integrated with public health activities (e.g., pro-
7 In a community context, collecting baseline data of status is commonly referred to as an “assessment.” Surveillance provides repeated or continuous assessments of progress or change over time.
TABLE 1-2 Comparison of the Concepts of Surveillance and Summative Evaluation
Characteristic Surveillance Summative Evaluation
Goals • Set public health priorities• Detect outbreaks and epidemics• Track behavioral changes over time• Evaluate programs• Track environmental changes• Provide data for research and evaluation
• Measure effectiveness• Improve programs by making course
corrections• Adjust funding, effort, and
sustainability• Disseminate knowledge
Design More comparability to other jurisdictions and national Flexible
Focus Consistency of data for comparisons over time and between jurisdictions
Internal validity of associating interventions with outcomes
Type of data Mainly quantitative Both qualitative and quantitative
Controlling entity Stakeholders/practitioners Stakeholders/practitioners
Time frame Ongoing Usually episodic*
* Sometimes follows a specific time frame based on funding or the objective of the summative evaluation.

Copyright © National Academy of Sciences. All rights reserved.
Evaluating Obesity Prevention Efforts: A Plan for Measuring Progress
31Introduction
vides early warning of health problems to guide control measures) (Thacker et al., 1989). Third, the use of the disseminated data must be regularly evaluated (German et al., 2001). The key characteristics of sur-veillance and how they differ for summative evaluation are shown in Table 1-2.
The origins of public health surveillance are rooted in infectious disease control, dating back to tracking the bubonic plague in the 14th century (Thacker and Stroup, 2006). The early systems for sur-veillance followed the discovery of the agents responsible for infectious diseases such as smallpox, typhus, and yellow fever. Langmuir and colleagues extended the definition of surveillance from tracking afflicted persons to tracking populations in the 1940s (Langmuir, 1963). The expansion of surveillance to include chronic diseases and risk factors (including obesity) began in the 1970s and continued with the push in the early 1980s to gather surveillance data relevant to evaluating progress in relation to the first round of the Healthy People objectives for the nation (Green et al., 1983). More recently, global behavioral risk factor surveillance has gathered momentum (McQueen and Puska, 2003; Warren et al., 2000) and, partic-ularly relevant for this report, the definition of obesity-related surveillance has been expanded to include environments and policies (Ottoson et al., 2009).
Measuring Prevalence and Incidence of Obesity
Today, numerous useful surveillance systems exist in the health sector for tracking obesity and obesity risk factors (e.g., diet, physical activity) and in other sectors for tracking changes in risk condi-tions such as the built environment and transportation systems and their utilization; sports participation; park and recreational area availability and use; school lunch and playground policies; and agricultural food supply, manufacture, and distribution (e.g., Hallal et al., 2012). National datasets (e.g., BRFSS, NHANES, NHIS8) permit the surveillance of overweight/obesity prevalence by age, gender, and race/eth-nicity over time (described in more detail in Chapter 4). International datasets are emerging for physical activity surveillance (e.g., Bauman et al., 2011; Rutten et al., 2003). As described in Chapters 5, 6, and 8, however, precise estimates for some particular U.S. populations (e.g., Asians and Pacific Islanders) are often challenging and require preferential sampling in national surveys. Only the BRFSS, which collects self-reported data on weight and height, can provide subnational estimates (state level or county level for some localities, or by synthetic estimates from state data) of obesity prevalence. The United States has no national system to measure incidence of obesity directly to enable analysis of trends in rates of appearance of new cases of obesity. A national system could be helpful, at least for data on adults. A few regional and community cohort studies, such as the Bogalusa Heart Study, the Framingham Heart Study, the Pima Indian Study, and the Hispanic Community Health Study/Study of Latinos may permit measurement of incidence of obesity for selected populations (see Chapter 7 for community surveillance and “community health assessment” examples).
Newer Types of Surveillance
Sufficient epidemiologic data now exist for estimating which population groups and which regions of the country are affected by obesity and how prevalence patterns are changing over time with respect to the epidemic. To supplement these data, however, we need better information on a broad array of envi-ronmental (e.g., commercial, recreational, and built environments) and policy factors (e.g., state laws) that
8 BRFSS = Behavioral Risk Factor Surveillance System; NHANES = National Health and Nutrition Examination Survey; NHIS = National Health Interview Survey.

Copyright © National Academy of Sciences. All rights reserved.
Evaluating Obesity Prevention Efforts: A Plan for Measuring Progress
Evaluating Obesity Prevention Efforts32
determine these patterns (Chriqui et al., 2011; Ottoson et al., 2009), as well as better understanding of how and how well surveillance data are being used (Ottoson and Wilson, 2003).
Environmental surveillance relevant to obesity includes national, state, and small area (e.g., county, municipality, school district, zip code) measures of the physical environment that influence individuals’ and families’ decision making relative to their energy intake and energy expenditure. Environmental data may be obtained from geographic information systems (GIS) that depict land uses (e.g., parks, streets, bike paths, buildings), commercial or other data sources that contain information on the existence of spe-cific types of facilities and outlets (e.g., recreational facilities, fast food, farmers’ markets, and other food retail), or through audit-type evaluations that document characteristics of the physical, food, school, child care, worksite, and other related environments (Brownson et al., 2009; McKinnon et al., 2009). For these data to be useful for surveillance purposes, however, they need to be publicly available and consistently compiled over time (Lee et al., 2010). Environmental surveillance efforts exist to some extent nation-ally (e.g., at the census block group or zIP code levels) but only for limited measures of land use. Many individual research and evaluation studies and individual communities have compiled data on the physi-cal environment, but few exist nationwide, statewide, or consistently across small geographic areas (e.g., counties, municipalities, school districts, zip codes, etc.). National and community obesity prevention–related evaluation studies would benefit from consistent compilation and tracking of environmental data across geographic areas and over time. Environmental sensors in new wireless communication technolo-gies hold promise for more data of this kind becoming publicly available (e.g., Bravo et al., 2012), which could be combined with GIS data to measure physical activity or obesogenic environments (Frank et al., 2012; Kerr et al., 2011).
Evaluation
The culmination of the series of assessment, surveillance, and monitoring strategies and systems just described leads to summative evaluation. Evaluation lies in using interventions selectively or collectively, together with summative evaluation designs for comparison (over time or between groups of organiza-tions, communities, or people exposed or not exposed to an intervention) and measures based on common indicators to associate the intervention(s) with the outputs, outcomes, or impacts. This report will use the term evaluation to encompass the collectivity of the assessment, monitoring, and surveillance methods or systems and the summative evaluation designs to relate interventions to their outputs, outcomes, and impacts.
The overriding purpose of summative evaluation is to be able to attribute, with a known degree of certainty, whatever outputs, outcomes, or impacts (effects) are found to the interventions presumed to have caused them. Such attribution depends on controlling with experimental and statistical methods the competing explanations for the effects. The degree of certainty is the statistical notion of “significance,” that is, the probability that a given observed and measured effect could have been caused by chance. Summative evaluations require at a minimum some pairing of pretest and post-test measures of the desired effects, or another method to compare a population exposed to one not exposed to the interven-tion. The variations in experimental and quasi-experimental designs to control for threats to the validity of the cause-and-effect attribution are widely established in the literature and textbooks of experimental research and program evaluation (e.g., Campbell and Stanley, 1966; Shadish et al., 2002).

Copyright © National Academy of Sciences. All rights reserved.
Evaluating Obesity Prevention Efforts: A Plan for Measuring Progress
33Introduction
Indicators of Progress
As detailed in Chapter 3, an overriding factor in the Committee’s selection of indicators for evalu-ation (assessment, monitoring, surveillance, and summative evaluation) relates to balancing the tension between comprehensiveness and selectivity. The Committee favored the latter. The nine guiding principles for indicator selection include accuracy, comparability, feasibility, health disparities/equity, parsimony, priority setting, relevance, scalability, and sustainability (see Appendix C). The portfolio of indicators presented in Chapter 4 balances measures of structure (e.g., inputs, resources), process (e.g., actions), and outcomes (e.g., incidence and prevalence of obesity, changes in diet and activity behaviors). For all indica-tors, the Committee paid careful attention to end-user relevance, so that the measurement is not simply an academic exercise but rather a process to stimulate conversations among various stakeholders and to facilitate evidence-based action. In accordance with its task, the Committee selected of indicators that align with the APOP strategies and that focus on policy, behavioral, and environmental changes related to food and physical activity. As discussed in Chapter 4, sleep, endocrine disruptors, and other physi-ological functions may be important areas to measure to address broader population health and obesity prevention–related issues that do not directly link to APOP report topics (Keith et al., 2006). Finally, dif-ferences between evaluation of interventions with children and evaluation of interventions with adults have been considered in the selection of indicators.
Promoting health Equity and Reducing disparities
Of particular concern to the Committee from the outset of its discussions was the growing recog-nition that evaluating progress for the nation as a whole, or even for regions of the United States, will need to pay special attention to the disparities that have accompanied the obesity epidemic. This central concern is driven in part by the commitment of the Healthy People 2020 disease prevention and health promotion objectives for the nation, which focus on the social determinants of health and the elimination of disparities in health a centerpiece (Koh et al., 2011b). The concern for reducing disparities/promoting health equity is also driven by the growing recognition that the nation’s progress on several other health promotion objectives has been impressive in the aggregate, but often at the expense of widening rather than narrowing the disparities between segments of the population that are grouped by income, educa-tion, and sometimes ethnicity or race. Chapter 5 more fully addresses these issues, together with issues of representativeness of the survey samples and the periodicity and oversampling of key population segments in the NHANES.
Recently, the World Health Organization Commission on Social Determinants of Health (Solar and Irwin, 2010) postulated three mechanisms by which health inequities are produced: (1) differential expo-sure to intermediary factors (e.g., poor material circumstances such as inadequate housing, hazards, and harsh living conditions); (2) differential vulnerability to health-compromising conditions (e.g., through limited education, income, and associated lower socioeconomic position); and (3) differential conse-quences (e.g., poor-quality services or no access to services). In Chapter 8, the Committee seeks to provide framing and support for summative evaluation of interventions and tracking of progress across popula-tions at greater risk of obesity.
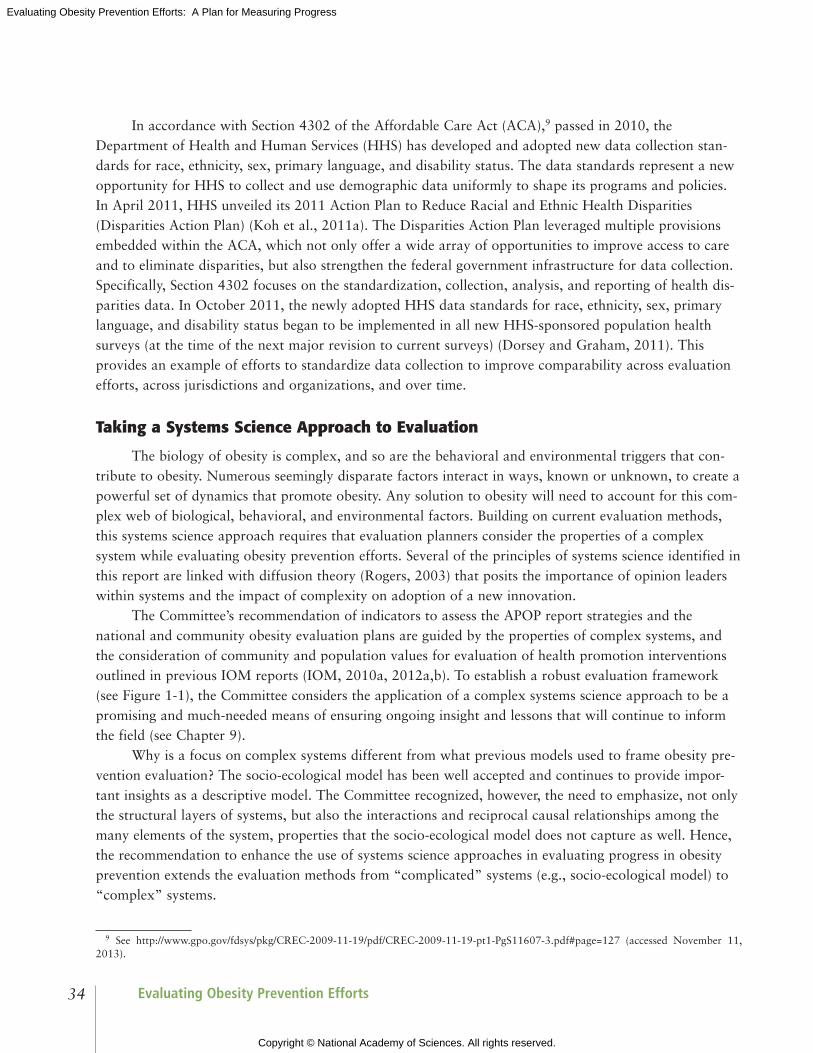
Copyright © National Academy of Sciences. All rights reserved.
Evaluating Obesity Prevention Efforts: A Plan for Measuring Progress
Evaluating Obesity Prevention Efforts34
In accordance with Section 4302 of the Affordable Care Act (ACA),9 passed in 2010, the Department of Health and Human Services (HHS) has developed and adopted new data collection stan-dards for race, ethnicity, sex, primary language, and disability status. The data standards represent a new opportunity for HHS to collect and use demographic data uniformly to shape its programs and policies. In April 2011, HHS unveiled its 2011 Action Plan to Reduce Racial and Ethnic Health Disparities (Disparities Action Plan) (Koh et al., 2011a). The Disparities Action Plan leveraged multiple provisions embedded within the ACA, which not only offer a wide array of opportunities to improve access to care and to eliminate disparities, but also strengthen the federal government infrastructure for data collection. Specifically, Section 4302 focuses on the standardization, collection, analysis, and reporting of health dis-parities data. In October 2011, the newly adopted HHS data standards for race, ethnicity, sex, primary language, and disability status began to be implemented in all new HHS-sponsored population health surveys (at the time of the next major revision to current surveys) (Dorsey and Graham, 2011). This provides an example of efforts to standardize data collection to improve comparability across evaluation efforts, across jurisdictions and organizations, and over time.
Taking a Systems Science Approach to Evaluation
The biology of obesity is complex, and so are the behavioral and environmental triggers that con-tribute to obesity. Numerous seemingly disparate factors interact in ways, known or unknown, to create a powerful set of dynamics that promote obesity. Any solution to obesity will need to account for this com-plex web of biological, behavioral, and environmental factors. Building on current evaluation methods, this systems science approach requires that evaluation planners consider the properties of a complex system while evaluating obesity prevention efforts. Several of the principles of systems science identified in this report are linked with diffusion theory (Rogers, 2003) that posits the importance of opinion leaders within systems and the impact of complexity on adoption of a new innovation.
The Committee’s recommendation of indicators to assess the APOP report strategies and the national and community obesity evaluation plans are guided by the properties of complex systems, and the consideration of community and population values for evaluation of health promotion interventions outlined in previous IOM reports (IOM, 2010a, 2012a,b). To establish a robust evaluation framework (see Figure 1-1), the Committee considers the application of a complex systems science approach to be a promising and much-needed means of ensuring ongoing insight and lessons that will continue to inform the field (see Chapter 9).
Why is a focus on complex systems different from what previous models used to frame obesity pre-vention evaluation? The socio-ecological model has been well accepted and continues to provide impor-tant insights as a descriptive model. The Committee recognized, however, the need to emphasize, not only the structural layers of systems, but also the interactions and reciprocal causal relationships among the many elements of the system, properties that the socio-ecological model does not capture as well. Hence, the recommendation to enhance the use of systems science approaches in evaluating progress in obesity prevention extends the evaluation methods from “complicated” systems (e.g., socio-ecological model) to “complex” systems.
9 See http://www.gpo.gov/fdsys/pkg/CREC-2009-11-19/pdf/CREC-2009-11-19-pt1-PgS11607-3.pdf#page=127 (accessed November 11, 2013).

Copyright © National Academy of Sciences. All rights reserved.
Evaluating Obesity Prevention Efforts: A Plan for Measuring Progress
35Introduction
SUMMARY
The solution to the obesity crisis depends on finding what is working to affect the causes of obe-sity. This will require evaluation, which will depend on developing agreement on the use of (a) common indicators in assessing the status of communities; (b) surveillance to track changes in the status of commu-nities, regions, and the nation; (c) monitoring of the policies, programs, and other interventions associated with changes; and (d) summative evaluation of the extent to which interventions and combinations of interventions result in changes in outcomes. These essential ingredients to tracking progress in the nation’s efforts to prevent and control obesity are detailed in the chapters that follow. This iterative process begins with an assessment of the needs of the users of evaluation products and development of a framework that places the ingredients and products in relation to each other in a cycle of cause-effect assessments. This process ends with examinations of the implications of evaluation, from the perspective of populations experiencing disparities in overweight and obesity and from the perspective of whole systems. Although it would be ideal to approach evaluation from a complex multilevel framework and to adopt the evalu-ation plans found in this report, the Committee acknowledges that in several situations funding or logistical constraints may preclude such a full approach. Nevertheless, acquiring scaling evaluation data through more feasible means, such as “practice-based evidence” methods or grassroots-driven evaluation, may provide valuable insights and inform programs on how innovations might diffuse through systems (Brownson et al., 2012; Rogers, 2003).
OVERVIEw OF ThE REPORT
Adapting the framing presented in the 2010 IOM report Bridging the Evidence Gap in Obesity Prevention, this report suggests ways to answer three questions in evaluation: Why, What, and How (see Figure 1-2). The answers seek to make the assessment, monitoring, surveillance, or summative evalua-tion procedures undertaken in given settings productive of evidence that will be relevant and useful to the evaluation users (reviewed in Chapter 2) and help to establish an infrastructure for monitoring progress of obesity prevention efforts at national, state, and community levels.
This report answers the following questions:
• Why? Describing why the proposed methods, procedures, or indicators for assessment, monitor-ing, surveillance, and summative evaluation need to be considered sequentially;
• What? Describing what has been or can be accomplished through assessment, monitoring, sur-veillance, and summative evaluation, including
— describing the prevalence/incidence and trends of obesity and its determinants; — describing the prevalence/incidence and trends of obesity prevention activities; — understanding the effectiveness of the delivery and implementation of obesity prevention
interventions; and — identifying what plans to implement and improvements to make given a particular user’s
context; and • How? Describing how to implement the “what” in a concrete and actionable way.

Copyright © National Academy of Sciences. All rights reserved.
Evaluating Obesity Prevention Efforts: A Plan for Measuring Progress
Evaluating Obesity Prevention Efforts36
The Committee recognizes that a myriad of responses can be offered to the why, what, and how. In developing this report, the Committee sought to build on the APOP report and to apply state-of-the-art principles in evaluation, stakeholder engagement, and systems science.
The next two chapters provide background on and fundamental concepts of evaluation. Chapter 2 focuses on the main stakeholders’ preferences and needs for evaluation information, including those of policy makers, advocates for interventions, community coalitions, and program managers. Chapter 3 pres-ents the framework for realizing the Committee’s vision—the inputs, activities, outputs, outcomes, and impacts necessary to improve assessment, monitoring, surveillance, summative evaluation, and enhanced data use to reduce obesity and improve population health and health equity. Chapters 2 and 3 are particu-larly geared toward a better understanding of how the Committee’s recommendations contribute toward closing evidence-to-practice gaps to improve and inform obesity prevention efforts.
In Chapter 4 the Committee identifies readily available indicators that can be used at the national, and sometimes at the state and community levels, to measure progress in obesity prevention. Chapter 5 focuses on tools and research methods for measuring progress that are appropriate for populations with health disparities that are closely linked with social, economic, and environmental disadvantage. Chapter 6 details a National Obesity Evaluation Plan with suggested adaptations for state and regional plans. Chapter 7 presents a plan for community health assessments and surveillance and Chapter 8 presents a plan for monitoring of implementation and summative evaluations of the effects of community-level interventions. Chapter 9 offers a systems perspective for evaluating progress in obesity prevention. Measurement ideas for the HBO/IOM TWOTN campaign can be found in Chapters 6 (its national
FIGURE 1-2 Questions that guide evaluation research efforts.
Figure 1-2.eps
Assessment, Surveillance, Monitoring, and Evaluation
WHY are the methods, procedures, or indicators important?
WHAT has been or can be accomplished through evaluation?
HOW do we implement evaluation in a concrete and actionable way?

Copyright © National Academy of Sciences. All rights reserved.
Evaluating Obesity Prevention Efforts: A Plan for Measuring Progress
37Introduction
components) and 8 (its community components) and are offered as examples of opportunities and chal-lenges inherent in evaluation, considering the respective national and community obesity evaluation plans. Chapter 10 concludes the report by presenting recommended plans, action-oriented recommendations to support the implementation of the recommended plans, and measurement ideas for the HBO/IOM TWOTN campaign.
REFERENCES
Abroms, L. C., and E. W. Maibach. 2008. The effectiveness of mass communication to change public behavior.
Annual Review of Public Health 29:219-234.
American Dietetic Association. 2006. Position of the American Dietetic Association: Individual-, family-, school-,
and community-based interventions for pediatric overweight. Journal of the American Dietetic Association
106(6):925-945.
Bao, W., S. R. Srinivasan, W. A. Wattigney, and G. S. Berenson. 1995. The relation of parental cardiovascular disease
to risk factors in children and young adults. The Bogalusa Heart Study. Circulation 91(2):365-371.
Bauman, A., H. R. Bowles, M. Huhman, C. D. Heitzler, N. Owen, B. J. Smith, and B. Reger-Nash. 2008. Testing
a hierarchy-of-effects model: Pathways from awareness to outcomes in the VERB campaign 2002-2003.
American Journal of Preventive Medicine 34(6 Suppl):S249-S256.
Bauman, A., B. E. Ainsworth, J. F. Sallis, M. Hagstromer, C. L. Craig, F. C. Bull, M. Pratt, K. Venugopal, J. Chau,
M. Sjostrom, and International Prevalence Study Group. 2011. The descriptive epidemiology of sitting. A
20-country comparison using the International Physical Activity Questionnaire (IPAQ). American Journal of
Preventive Medicine 41(2):228-235.
Berkowitz, J. M., M. Huhman, C. D. Heitzler, L. D. Potter, M. J. Nolin, and S. W. Banspach. 2008. Overview
of formative, process, and outcome evaluation methods used in the VERB campaign. American Journal of
Preventive Medicine 34(6 Suppl):S222-S229.
Bouchard, C. 1997. Obesity in adulthood—the importance of childhood and parental obesity. New England Journal
of Medicine 337(13):926-927.
Bravo, J., V. Villarreal, R. Hervas, and G. Urzaiz. 2012. Using a communication model to collect measurement data
through mobile devices. Sensors 12:9253-9272.
Brennan, L., S. Castro, R. C. Brownson, J. Claus, and C. T. Orleans. 2011. Accelerating evidence reviews and broad-
ening evidence standards to identify effective, promising, and emerging policy and environmental strategies for
prevention of childhood obesity. Annual Review of Public Health 32:199-223.
Briss, P. A., R. C. Brownson, J. E. Fielding, and S. zaza. 2004. Developing and using the guide to community
preventive services: Lessons learned about evidence-based public health. Annual Review of Public Health
25:281-302.
Brownson, R. C., C. M. Hoehner, K. Day, A. Forsyth, and J. F. Sallis. 2009. Measuring the built environment for
physical activity: State of the science. American Journal of Preventive Medicine 36(4 Suppl):S99-S123, e112.
Brownson, R. C., G. A. Colditz, and E. K. Proctor, eds. 2012. Dissemination and implementation research in health:
Translating science to practice. New York: Oxford University Press.
Campbell, D. T., and J. C. Stanley. 1966. Experimental and quasi-experimental designs for research. Chicago, IL:
Rand McNally.
Casazza, K., and D. B. Allison. 2012. Stagnation in the clinical, community, and public health domain of obesity:
The need for probative research. Clinical Obesity 2(3/4):83-85.

Copyright © National Academy of Sciences. All rights reserved.
Evaluating Obesity Prevention Efforts: A Plan for Measuring Progress
Evaluating Obesity Prevention Efforts38
CDC (Centers for Disease Control and Prevention). 2007. Best practices for comprehensive tobacco control
programs—October 2007. Atlanta, GA: U.S. Department of Health and Human Services, Centers for Disease
Control and Prevention, National Center for Chronic Disease Prevention and Health Promotion, Office on
Smoking and Health.
Chriqui, J. F., J. C. O’Connor, and F. J. Chaloupka. 2011. What gets measured, gets changed: Evaluating law and
policy for maximum impact. Journal of Law, Medicine and Ethics 39(Suppl 1):21-26.
Chriqui, J. F., D. R. Taber, S. J. Slater, L. Turner, K. M. Lowrey, and F. J. Chaloupka. 2012. The impact of state
safe routes to school-related laws on active travel to school policies and practices in U.S. elementary schools.
Health Place 18(1):8-15.
Clarke, C. E., J. Niederdeppe, and H. C. Lundell. 2012. Narratives and images used by public communication cam-
paigns addressing social determinants of health and health disparities. International Journal of Environmental
Research and Public Health 9(12):4254-4277.
Colditz, G. A., K. Y. Wolin, and S. Gehlert. 2012. Applying what we know to accelerate cancer prevention. Science
Translational Medicine 4(127):127rv.
Dorsey, R., and G. Graham. 2011. New HHS data standards for race, ethnicity, sex, primary language, and disability
status. Journal of the American Medical Association 306(21):2378-2379.
Eisenberg, M. E., D. Neumark-Sztainer, and M. Story. 2003. Associations of weight-based teasing and emotional
well-being among adolescents. Archives of Pediatrics and Adolescent Medicine 157(8):733-738.
Eriksen, M. 2004. Lessons learned from public health efforts and their relevance to preventing childhood obesity.
Appendix D. In Preventing childhood obesity: Health in the balance, edited by IOM (Institute of Medicine).
Washington, DC: The National Academies Press. Pp. 343-375.
Estruch, R., E. Ros, J. Salas-Salvado, M. I. Covas, D. Corella, F. Aros, E. Gomez-Gracia, V. Ruiz-Gutierrez, M.
Fiol, J. Lapetra, R. M. Lamuela-Raventos, L. Serra-Majem, X. Pinto, J. Basora, M. A. Munoz, J. V. Sorli,
J. A. Martinez, M. A. Martinez-Gonzalez, and PREDIMED Study Investigators. 2013. Primary prevention of
cardio vascular disease with a Mediterranean diet. New England Journal of Medicine 368(14):1279-1290.
Eyler, A. A., L. Nguyen, J. Kong, Y. Yan, and R. Brownson. 2012. Patterns and predictors of enactment of
state childhood obesity legislation in the United States: 2006-2009. American Journal of Public Health
102(12):2294-2302.
Farrelly, M. C., K. C. Davis, M. L. Haviland, P. Messeri, and C. G. Healton. 2005. Evidence of a dose-response rela-
tionship between “Truth” antismoking ads and youth smoking prevalence. American Journal of Public Health
95(3):425-431.
Farrelly, M. C., K. C. Davis, J. Duke, and P. Messeri. 2009. Sustaining “truth”: Changes in youth tobacco attitudes and
smoking intentions after 3 years of a national antismoking campaign. Health Education Research 24(1):42-48.
Fishbein, M., and I. Ajzen. 2009. Predicting and changing behavior. New York: Psychology Press, Taylore & Francis
Group.
Flegal, K. M., M. D. Carroll, B. K. Kit, and C. L. Ogden. 2012. Prevalence of obesity and trends in the distri-
bution of body mass index among US adults, 1999-2010. Journal of the American Medical Association
307(5):491-497.
Flegal, K. M., B. K. Kit, H. Orpana, and B. I. Graubard. 2013. Association of all-cause mortality with overweight
and obesity using standard body mass index categories: A systematic review and meta-analysis. Journal of the
American Medical Association 309(1):71-82.
Frank, L. D., B. E. Saelens, J. Chapman, J. F. Sallis, J. Kerr, K. Glanz, S. C. Couch, V. Learnihan, C. zhou, T.
Colburn, and K. L. Cain. 2012. Objective assessment of obesogenic environments in youth: Geographic infor-
mation system methods and spatial findings from the Neighborhood Impact on Kids Study. American Journal
of Preventive Medicine 42(5):e47-e55.

Copyright © National Academy of Sciences. All rights reserved.
Evaluating Obesity Prevention Efforts: A Plan for Measuring Progress
39Introduction
Freedman, D. S., W. H. Dietz, S. R. Srinivasan, and G. S. Berenson. 1999. The relation of overweight to cardio vascular
risk factors among children and adolescents: The Bogalusa Heart Study. Pediatrics 103(6 Pt 1):1175-1182.
Freudenberg, N., S. P. Bradley, and M. Serrano. 2009. Public health campaigns to change industry practices that
damage health: An analysis of 12 case studies. Health Education and Behavior 36(2):230-249.
Gaglio, B., and R. Glasgow. 2012. Evaluation approaches for dissemination and implementation research. In
Dissemination and implementation research in health: Translating science to practice, edited by R. C.
Brownson, G. A. Colditz, and E. K. Proctor. New York: Oxford University Press. Pp. 327-356.
Garfield, S. A., S. Malozowski, M. H. Chin, K. M. Narayan, R. E. Glasgow, L. W. Green, R. G. Hiss, and H. M.
Krumholz. 2003. Considerations for diabetes translational research in real-world settings. Diabetes Care
26(9):2670-2674.
German, R. R., L. M. Lee, J. M. Horan, R. L. Milstein, C. A. Pertowski, and M. N. Waller. 2001. Updated guide-
lines for evaluating public health surveillance systems: Recommendations from the guidelines working group.
MMWR Recommendations and Reports 50(RR-13):1-35; quiz CE31-CE37.
Glasgow, R. E., T. M. Vogt, and S. M. Boles. 1999. Evaluating the public health impact of health promotion inter-
ventions: The RE-AIM framework. American Journal of Public Health 89(9):1322-1327.
Goodman, R. A., P. L. Remington, and D. N. Klaucke. 2000. Communicating information for action with the public
health system. In Principles and practice of public health surveillance, edited by S. M. Teutsch and R. E.
Churchill. New York: Oxford University Press. Pp. 168-175.
Green, L. W. 2001. From research to “best practices” in other settings and populations. American Journal of Health
Behavior 25(3):165-178.
Green, L. W., and R. E. Glasgow. 2006. Evaluating the relevance, generalization, and applicability of research: Issues
in external validation and translation methodology. Evaluation and the Health Professions 29(1):126-153.
Green, L. W., R. W. Wilson, and K. G. Bauer. 1983. Data requirements to measure progress on the objectives for the
nation in health promotion and disease prevention. American Journal of Public Health 73(1):18-24.
Green, L. W., R. E. Glasgow, D. Atkins, and K. Stange. 2009. Making evidence from research more relevant, use-
ful, and actionable in policy, program planning, and practice: Slips “twixt cup and lip.” American Journal of
Preventive Medicine 37(6 Suppl 1):S187-S191.
Hallal, P. C., L. B. Andersen, F. C. Bull, R. Guthold, W. Haskell, and U. Ekelund. 2012. Global physical activity
levels: Surveillance progress, pitfalls, and prospects. Lancet 380(9838):247-257.
Hammond, R. A., and R. Levine. 2010. The economic impact of obesity in the United States. Diabetes, Metabolic
Syndrome, and Obesity: Targets and Therapy 3:285-295.
Howard, C. 2012 (December 15). The big picture. The world is getting wider, says Charlotte Howard. What can be
done about it? The Economist.
Huhman, M., and C. D. Patnode. 2013. Communities leveraging the assets of a national social marketing campaign:
Experiences with VERB™. It’s what you do! In Advances in communication research to reduce childhood
obesity, edited by J. D. Williams, K. E. Pasch, and C. A. Collins. New York: Springer Science+Business Media.
P. 439.
Huhman, M. E., L. D. Potter, M. J. Nolin, A. Piesse, D. R. Judkins, S. W. Banspach, and F. L. Wong. 2010. The
influence of the VERB campaign on children’s physical activity in 2002 to 2006. American Journal of Public
Health 100(4):638-645.
IOM (Institute of Medicine). 1997. Linking research and public health practice: A review of CDC’s program of cen-
ters for research and demonstration of health promotion and disease prevention. Washington, DC: National
Academy Press.
IOM. 2004. Preventing childhood obesity: Health in the balance. Washington, DC: The National Academies Press.

Copyright © National Academy of Sciences. All rights reserved.
Evaluating Obesity Prevention Efforts: A Plan for Measuring Progress
Evaluating Obesity Prevention Efforts40
IOM. 2007. Progress in preventing childhood obesity: How do we measure up? Washington, DC: The National
Academies Press.
IOM. 2010a. Bridging the evidence gap in obesity prevention: A framework to inform decision making. Washington,
DC: The National Academies Press.
IOM. 2010b. For the public’s health: The role of measurement in action and accountability. Washington, DC: The
National Academies Press.
IOM. 2012a. Accelerating progress in obesity prevention: Solving the weight of the nation. Washington, DC: The
National Academies Press.
IOM. 2012b. An integrated framework for assessing the value of community-based prevention. Washington, DC:
The National Academies Press.
Isaacs, S. L., and S. A. Schroeder. 2001. Where the public good prevailed. Lessons from success stories in health.
American Prospect. June 4.
Jacobson, D. M., and D. Lotstein. 2013. Performance improvement: Using rapid-cycle improvement techniques
to improve public health services. In Public health practice: What works, edited by J. E. Fielding and S. M.
Teutsch. New York: Oxford University Press. Chapter 7.
Keith, S. W., D. T. Redden, P. T. Katzmarzyk, M. M. Boggiano, E. C. Hanlon, R. M. Benca, D. Ruden, A. Pietrobelli,
J. L. Barger, K. R. Fontaine, C. Wang, L. J. Aronne, S. M. Wright, M. Baskin, N. V. Dhurandhar, M. C. Lijoi,
C. M. Grilo, M. DeLuca, A. O. Westfall, and D. B. Allison. 2006. Putative contributors to the secular increase
in obesity: Exploring the roads less traveled. International Journal of Obesity (London) 30(11):1585-1594.
Kerr, J., S. Duncan, and J. Schipperijn. 2011. Using global positioning systems in health research: A practical
approach to data collection and processing. American Journal of Preventive Medicine 41(5):532-540.
Knowler, W. C., E. Barrett-Connor, S. E. Fowler, R. F. Hamman, J. M. Lachin, E. A. Walker, D. M. Nathan, and
Diabetes Prevention Program Research Group. 2002. Reduction in the incidence of type 2 diabetes with life-
style intervention or metformin. New England Journal of Medicine 346(6):393-403.
Koh, H. K., G. Graham, and S. A. Glied. 2011a. Reducing racial and ethnic disparities: The action plan from the
Department of Health and Human Services. Health Affairs 30(10):1822-1829.
Koh, H. K., J. J. Piotrowski, S. Kumanyika, and J. E. Fielding. 2011b. Healthy People: A 2020 vision for the social
determinants approach. Health Education and Behavior 38:551-557.
Kottke, T. E., L. I. Solberg, A. F. Nelson, D. W. Belcher, W. Caplan, L. W. Green, E. Lydick, D. J. Magid, S. J.
Rolnick, and S. H. Woolf. 2008. Optimizing practice through research: A new perspective to solve an old
problem. Annals of Family Medicine 6(5):459-462.
Langmuir, A. D. 1963. The surveillance of communicable diseases of national importance. New England Journal of
Medicine 268:182-192.
Lee, L. M., S. M. Teutsch, S. B. Thacker, and M. E. St. Louis, eds. 2010. Principles & practice of public health sur-
veillance. 3rd ed. New York: Oxford University Press.
Maibach, E. W., L. C. Abroms, and M. Marosits. 2007. Communication and marketing as tools to cultivate the
public’s health: A proposed “people and places” framework. BMC Public Health 7:88.
Majumdar, S. R., and S. B. Soumerai. 2009. The unhealthy state of health policy research. Health Affairs
28(5):w900-w908.
McKinnon, R. A., J. Reedy, M. A. Morrissette, L. A. Lytle, and A. L. Yaroch. 2009. Measures of the food envi-
ronment: A compilation of the literature, 1990-2007. American Journal of Preventive Medicine 36(4
Suppl):S124-S133.
McQueen, D. V., and P. Puska, eds. 2003. Global behavioral risk factor surveillance. New York: Klewer Academic/
Plenum Publishers.

Copyright © National Academy of Sciences. All rights reserved.
Evaluating Obesity Prevention Efforts: A Plan for Measuring Progress
41Introduction
Mercer, S. L., B. J. DeVinney, L. J. Fine, L. W. Green, and D. Dougherty. 2007. Study designs for effectiveness and
translation research: Identifying trade-offs. American Journal of Preventive Medicine 33(2):139-154.
Mercer, S. L., L. Kettel Khan, L. W. Green, A. C. Rosenthal, R. Nathan, C. G. Husten, and W. H. Dietz. 2010.
Drawing possible lessons for obesity prevention and control from the tobacco control experience. In Obesity
epidemiology: From aetiology to public health, edited by D. Crawford, R. W. Jeffery, K. Ball, and J. Brug.
Oxford Scholarship Online.
Mittman, B. S. 2012. Implementation science in health care. In Dissemination and implementation research in health:
Translating science to practice, edited by R. C. Brownson, G. A. Colditz, E. K. Proctor. New York: Oxford
University Press. Pp. 400-418.
Morrison, R. M., L. Mancino, and J. N. Vairyam. 2011. Will calorie labeling in restaurants make a difference?
Amber Waves 9(1):10-17.
Noar, S. M. 2006. A 10-year retrospective of research in health mass media campaigns: Where do we go from here?
Journal of Health Communication 11(1):21-42.
Ogden, C. L., M. D. Carroll, B. K. Kit, and K. M. Flegal. 2012a. Prevalence of obesity and trends in body mass
index among US children and adolescents, 1999-2010. Journal of the American Medical Association
307(5):483-490.
Ogden, C. L., M. D. Carroll, B. K. Kit, and K. M. Flegal. 2012b. Prevalence of obesity in the United States, 2009-
2010. NCHS Data Brief (82):1-8.
Ottoson, J. M., and D. H. Wilson. 2003. Did they use it? Beyond the collection of surveillance information. In
Global behavioral risk factor surveillance, edited by D. McQueen and P. Puska. New York: Kluwer Academic/
Plenum Publishers. Pp. 119-131.
Ottoson, J. M., L. W. Green, W. L. Beery, S. K. Senter, C. L. Cahill, D. C. Pearson, H. P. Greenwald, R. Hamre, and
L. Leviton. 2009. Policy-contribution assessment and field-building analysis of the Robert Wood Johnson
Foundations Active Living Research Program. American Journal of Preventive Medicine 36(2 Suppl):S34-S43.
Ottoson, J. M., A. G. Ramirez, L. W. Green, and K. J. Gallion. 2013. Exploring potential research contributions to
policy: The Salud America! Experience. American Journal of Preventive Medicine 44(3 Suppl 3):S282-S289.
Perna, F. M., A. Oh, J. F. Chriqui, L. C. Masse, A. A. Atienza, L. Nebeling, T. Agurs-Collins, R. P. Moser, and K. W.
Dodd. 2012. The association of state law to physical education time allocation in US public schools. American
Journal of Public Health 102(8):1594-1599.
Rogers, E. M. 2003. Diffusion of innovations. 5th ed. New York: The Free Press.
Rosen, L., O. Manor, D. Engelhard, and D. zucker. 2006. In defense of the randomized controlled trial for health
promotion research. American Journal of Public Health 96(7):1181-1186.
Rutten, A., R. Rzewnicki, H. ziemainz, W. T. M. Ooijendij, F. Schena, T. Stahl, Y. Vanden Auweele, and J.
Welshman. 2003. Towards a European health monitoring system. Results of a pilot study on physical activ-
ity. In Global behavioral risk factor surveillance, edited by D. McQueen and P. Puska. New York: Kluwer
Academic/Plenum Publishers. Pp. 73-93.
Serdula, M. K., D. Ivery, R. J. Coates, D. S. Freedman, D. F. Williamson, and T. Byers. 1993. Do obese children
become obese adults? A review of the literature. Preventive Medicine 22(2):167-177.
Shadish, W. R., T. D. Cook, and D. T. Campbell. 2002. Experimental and quasi-experimental designs for generalized
causal inference. 2nd ed. Boston, MA: Houghton Mifflin.
Shea, M. K., D. K. Houston, B. J. Nicklas, S. P. Messier, C. C. Davis, M. E. Miller, T. B. Harris, D. W. Kitzman, K.
Kennedy, and S. B. Kritchevsky. 2010. The effect of randomization to weight loss on total mortality in older
overweight and obese adults: The adapt study. Journals of Gerontology. Series A, Biological Sciences and
Medical Sciences 65(5):519-525.

Copyright © National Academy of Sciences. All rights reserved.
Evaluating Obesity Prevention Efforts: A Plan for Measuring Progress
Evaluating Obesity Prevention Efforts42
Snyder, L. B., and M. A. Hamilton. 2002. Meta-analysis of U.S. health campaign effects on behavior: Emphasize
enforcement, exposure, and new information, and beware the secular trend In Public health communications:
Evidence for behavior change, edited by R. C. Hornik. Mahwah, NJ: Lawrence Erlbaum Associates, Inc.
Pp. 357-383.
Solar, O., and A. Irwin. 2010. A conceptual framework for action on social determinants of health. Social determi-
nants of health discussion paper 2 (policy and practice). Geneva: World Health Organization.
Sumithran, P., L. A. Prendergast, E. Delbridge, K. Purcell, A. Shulkes, A. Kriketos, and J. Proietto. 2011. Long-term
persistence of hormonal adaptations to weight loss. New England Journal of Medicine 365(17):1597-1604.
Taber, D. R., J. F. Chriqui, and F. J. Chaloupka. 2012. Differences in nutrient intake associated with state laws
regarding fat, sugar, and caloric content of competitive foods. Archives of Pediatrics and Adolescent Medicine
166(5):452-458.
Teutsch, S. M., and R. E. Churchill, eds. 2000. Principles and practice of public health surveillance. 2nd ed. New
York: Oxford University Press.
Thacker, S. B. 2007. Public health surveillance and the prevention of injuries in sports: What gets measured gets
done. Journal of Athletic Training 42(2):171-172.
Thacker, S. B., and R. L. Berkelman. 1988. Public health surveillance in the United States. Epidemiologic Reviews
10:164-190.
Thacker, S. B., and D. F. Stroup. 2006. Public health surveillance. In Applied epidemiology: Theory to practice,
edited by R. C. Brownson and D. B. Petitti. New York: Oxford University Press. Pp. 30-67.
Thacker, S. B., R. L. Berkelman, and D. F. Stroup. 1989. The science of public health surveillance. Journal of Public
Health Policy 10(2):187-203.
Thompson, D. R., E. Obarzanek, D. L. Franko, B. A. Barton, J. Morrison, F. M. Biro, S. R. Daniels, and R. H.
Striegel-Moore. 2007. Childhood overweight and cardiovascular disease risk factors: The National Heart,
Lung, and Blood Institute Growth and Health Study. Journal of Pediatrics 150(1):18-25.
Turner, L., J. F. Chriqui, and F. J. Chaloupka. 2012. Healthier fundraising in U.S. elementary schools: Associations
between policies at the state, district, and school levels. PLoS ONE 7(11):e49890.
Valente, T. W., and W. P. Saba. 2001. Campaign exposure and interpersonal communication as factors in contracep-
tive use in Bolivia. Journal of Health Communication 6(4):303-322.
Ward, J. W., and C. Warren. 2006. Silent victories: The history and practice of public health in twentieth-century
America. Oxford: Oxford University Press.
Warren, C. W., L. Riley, S. Asma, M. P. Eriksen, L. Green, C. Blanton, C. Loo, S. Batchelor, and D. Yach. 2000.
Tobacco use by youth: A surveillance report from the global youth tobacco survey project. Bulletin of the
World Health Organization 78(7):868-876.
Worden, J. K., B. S. Flynn, B. M. Geller, M. Chen, L. G. Shelton, R. H. Secker-Walker, D. S. Solomon, L. J. Solomon,
S. Couchey, and M. C. Costanza. 1988. Development of a smoking prevention mass media program using
diagnostic and formative research. Preventive Medicine 17(5):531-558.

Copyright © National Academy of Sciences. All rights reserved.
Evaluating Obesity Prevention Efforts: A Plan for Measuring Progress
43
2Improving the Usefulness of Obesity Evaluation Information to Potential Users
This chapter asks first what evaluation users require from evidence, specifically their preferences and needs for information. “Evaluation users” are the customers for data and information on progress in
preventing obesity. The potential users are termed “stakeholders,” because they have an interest in evalu-ation and its results (Scriven, 1991). The Institute of Medicine (IOM) report Accelerating Progress in Obesity Prevention (IOM, 2012a) called on specific groups to take action on the problem: most notably federal and state policy makers (officials in executive, legislative, and increasingly judicial branches), fed-eral and state government agency staff that manage programs and resources, nongovernmental organiza-tions at all levels, advocates of policy changes at all levels, opponents of such advocacy, local coalitions, local officials and local program managers, researchers and evaluators, employers, and health care provid-ers and insurers. Table 2-1 summarizes the roles and needs of the users of obesity evaluation information that are detailed in this chapter.
The table does not provide an all-inclusive list—for example, media are not included although they interpret and report on evaluations from time to time. Other stakeholders might emerge that are engaged and influential; good tools are available to identify such stakeholders (Preskill and Jones, 2009). Moreover, stakeholder roles can shift and blend into each other; both employers and community program managers can be part of community coalitions; mayors can serve both as decision makers and managers. What matters is the role that a potential user is playing in context. For example, any of the stakeholders described in this chapter could serve the role of advocate for obesity prevention; however certain stakeholders are identified primarily in this role through their activities in lobbying, blogging, op-ed pages, and other formats.
Evaluations need to be useful; that is their primary if not their only justification (Patton, 2008; Shadish et al., 1990; Yarbrough et al., 2011). Usefulness and utilization are a decades-long preoccupation for applied research, policy analysis, and program evaluation (Dunn, 2011; Lindblom and Cohen, 1979; Ottoson, 2009; Weiss, 1988), so it is familiar territory for the IOM (IOM, 2010, 2012b; NRC, 2012).

Copyright © National Academy of Sciences. All rights reserved.
Evaluating Obesity Prevention Efforts: A Plan for Measuring Progress
Evaluating Obesity Prevention Efforts44
TABLE 2-1 Users of Obesity Evaluation Information and Their Roles and Needs
Evaluation User Role Needs
Community partners or coalitions
• provide differing perspectives and priorities
• efforts depend on partnerships for sustainability
• to know why it is important to take action on obesity prevention compared to other problems
• knowledge of which strategies are effective for their specific situation
• information about implementation and lessons learned from other places
• clear communication strategies to convey information effectively
• to know options for action• often require some guidance about how to
implement options
Local decision makers and managers
• may lead or be part of formal community coalitions
• often are drivers for change• innovate and share information
about how to institute and implement relevant policies
• to track progress to know when to apply course corrections, manage implementation, and emphasize or de-emphasize a course of action
• timely and accessible data at the local level • a good sense of “what works”• assess strategies recommended by decision makers
to determine whether the strategies are feasible, acceptable, and likely effective
• be responsive and accountable to constituents and external funders
Health care providers and health insurance plans
• health care providers: opportunity to guide patients about healthful diet and physical activity
• health insurance plans: interest in the evaluation to manage the financial risk related to health consequences of excess weight
• health care providers: better information on “what works” for them to recommend, in the specific context of their communities and health care settings
• nonprofit hospitals: knowledge of “what works” at a community level to assure good use of resources
• health insurance plans: cost-effectiveness of various strategies for building the business case for employers and consumers
• health insurance plans: standardized data collection• health insurance plans: information on community
program resources• health insurance plans: data to target and refine
communication
Employers • control access to the workplace, an important and pervasive setting for health promotion
• confidence that wellness programs will reduce not only health care costs, but also absenteeism and health-related productivity losses
• knowledge to create the best program for their workforce

Copyright © National Academy of Sciences. All rights reserved.
Evaluating Obesity Prevention Efforts: A Plan for Measuring Progress
45Improving the Usefulness of Obesity Evaluation Information to Potential Users
Evaluation User Role Needs
Federal and state policy makers
• power to greatly influence obesity prevention in government, business, and nonprofit organizations
• make and administer policy at federal and state levels
• comparative effectiveness of alternative strategies along with cost and cost-effectiveness
• geopolitical jurisdiction comparisons• best way to define issues• funder organizations: need to hold grantee
organizations accountable for the use of funds• clear and easily digestible information to help frame
choices and correctly interpret evidence
Advocates • essential to the policy development process, particularly for public health
• often serve as knowledge brokers
• be visible and persistent • decide on which prevention strategies to focus• information from the research community
to support claims about “what works” and applicability to the populations at greatest risk
• information on what similar communities and states are doing
• knowledge of whether specific advocacy appeals or framing of the issues and stratagems work in different contexts
• information on policy progress and the needs for improvement
Federal and state agency administrators
• oversee accountability and reporting requirements for funds distributed to state and local levels for initiatives
• dissemination, translation, and local implementation
• a variety of data elements that are not always available
• indicators such as changes in programs, policies, or environments for planning and mid-course corrections
• best available evidence of effectiveness• external validity and generalizability
Funder Organizations
• keep the policy conversation going • champion continued social and
system changes• educate to encourage advocacy for
change at all levels• publicize progress
• see indicators of progress on the way to health and social changes
• tangible signs of progress both in interventions and outcomes to retain the interest of leadership and boards of trustees
• evidence about what works in community-level initiatives to invest resources
TABLE 2-1 Continued

Copyright © National Academy of Sciences. All rights reserved.
Evaluating Obesity Prevention Efforts: A Plan for Measuring Progress
Evaluating Obesity Prevention Efforts46
Obesity prevention, however, is a relatively new area of inquiry, so the committee reviewed and synthesized findings from several available sources, including (1) studies of the users of obesity prevention data and their information needs, preferences, and use of evaluations; (2) several IOM reports on obesity prevention (IOM, 2009a,b, 2010); (3) basic texts on political science, government agencies, and nongov-ernmental organizations, and the dissemination and implementation of prevention strategies; and (4) a lit-erature search on the use of evaluation. In addition, the committee held a public workshop (see Appendix I) and conducted interviews with evaluation users (see list of those interviewed in the Preface, p. ix). The workshop presenters were identified as experienced representatives of certain user groups: community decision makers (mayor), funders, health plans and employers, federal agencies, community practitioners, and advocates. Interviews were selective to fill in gaps in the Committee’s understanding, for example, in how community coalitions or federal policy advocates would use the information. The workshop and interviews were helpful to understand the concrete reality of these roles and the uncertainties about obe-sity prevention that needed to be addressed. They also confirmed and updated what the Committee had learned from other sources.
In framing what users need to know, the Committee endorsed the L.E.A.D. framework (IOM, 2010) which stands for Locate evidence, Evaluate it, Assemble it, and inform Decisions. The framework starts by specifying the question the users want to answer. The content and methods of evaluation should derive from that question, not from some ideal of how evaluation should happen. The best available evaluation methods need to be used, consistent with current knowledge and the level of resources available. In the words of Rossi et al. (2004, p. 25), evaluation quality should be “good enough” for the question that is posed. And for each user group described in this chapter, quite a bit of information is available on what likely works and how to implement it, even while knowledge is still emerging.
COMMUNITY COALITIONS AS EVALUATION USERS
why Community Coalitions?
All obesity intervention is or eventually becomes local, especially for changes in educational or behavior-change programs, environment, and many policy initiatives. Community obesity prevention efforts generally involve an initiating organization, but frequently involve partnerships or coalitions of individuals and organizations with differing perspectives and priorities. The efforts depend on these part-nerships for sustainability.
what do Community Partners Need?
Community organizations and partnerships first need to know why it is important to take action on obesity prevention compared to other problems they are facing. For this purpose, community assess-ments are helpful (see Chapter 7). Once obesity prevention is established as a priority, the particular issues and problems that a community is facing can be revealed through further community assessments and surveillance.
According to our interviews, once community partners or coalitions are motivated to do some-thing about obesity prevention, they need to know which strategies are effective and what they should do in their specific situation, given the strengths and limitations revealed by the community assessments

Copyright © National Academy of Sciences. All rights reserved.
Evaluating Obesity Prevention Efforts: A Plan for Measuring Progress
47Improving the Usefulness of Obesity Evaluation Information to Potential Users
and other planning exercises. In particular, stakeholders cannot necessarily visualize in advance how to implement interventions, policies, and environmental strategies to prevent obesity. Programmatic or direct-service strategies are more familiar to them. As described in one interview: “They need off-the-shelf models and also implementation support—direct, hands on translation of the evidence into what needs to be done.” The implication is that, beyond “what works,” they need information about implementa-tion and lessons learned from other places. However, evaluation in their own communities also benefits coalitions in several ways. Because prevention is a long-term goal, community members may be reluctant to continue participation because they see no progress toward the goal (IOM, 2012c). Evaluations help to maintain participation if they include shorter-term indicators of progress. Evaluations of implementa-tion (“monitoring”) and of outcomes provide coalitions with a basis for improvements, better training or supervision, as well as the ability to press for additional changes in interventions or environments or for the enforcement of agreed-upon policies.
To convey information effectively, clear communication is essential. Visual presentations of data, such as maps from geographic information systems (GIS), or the Supermarket Need Index, are powerful tools for sharing research (Smith et al., 2011b). Visual presentations can also inform program design and engage policy makers and stakeholders—including community members (IOM, 2009a). Such presenta-tions, however, are not sufficient by themselves; at a minimum, people need to know their options for action and they often require some guidance about how to implement those options. Community leaders often benefit from lessons learned in other localities and appreciate when evaluation results are framed in terms of comparisons to other situations and locations and of knowledge of community conditions (IOM, 2012c; Kirkpatrick and McIntyre, 2009; Lebel et al., 2011).
how Can Communities develop Capacity to Use Evaluation?
Now that guided tools and specific data such as GIS and community assessments are required activ-ities for health departments and nonprofit hospitals, they offer opportunities for community leaders and community coalitions to focus their obesity prevention efforts. However, no one knows how much these tools are used. Some jurisdictions require Health Impact Assessments (HIAs) of proposed interventions in other sectors. These requirements provide opportunities to work with other sectors on improving the posi-tive impact and minimizing the negative impact on health of their proposed interventions. Several HIAs have influenced decisions and, at a minimum, helped to frame policy debates (Henderson et al., 2011; Kids Safe & Healthful Foods Project, 2012). Yet, again, it is unclear how much community partnerships actually use such tools. Chapters 7 and 8 include these and other tools and strategies that may increase their use, such as community-based participatory research and policy mandates.
American Public Health Association (2006) and the Council of State and Territorial Epidemiologists Executive Committee (2007) have called for evaluation of the impact of community assessments, yet only five studies of communities’ use of community assessments have been found as of 2012. The evidence for use appears to be mixed. Two surveys of health departments found an impressively high level of use: 100 percent of community health departments in Kansas reported using community assessments to iden-tify health priorities (Curtis, 2002) while 73 percent of community assessments conducted by local health departments in Washington state were used this way (Spice and Snyder, 2009). Community assessments also facilitated better communication among community groups, helped with the development of new

Copyright © National Academy of Sciences. All rights reserved.
Evaluating Obesity Prevention Efforts: A Plan for Measuring Progress
Evaluating Obesity Prevention Efforts48
partnerships, and facilitated understanding of problems (Curtis, 2002; Solet et al., 2009; Spice and Snyder, 2009). In Kansas, 72 percent of the communities completing community assessments reported starting efforts to address the identified health priorities (Curtis, 2002). In Washington, community assessments were used to develop health programs, strategies, or services (42 percent); develop or modify health poli-cies (21 percent); influence budget decisions (23 percent); and establish or modify agency strategy (26 percent) (Spice and Snyder, 2009). Yet, in New York State, researchers piloting and field-testing an evalua-tion instrument had difficulty identifying community stakeholders outside of health departments who were knowledgeable about community assessments (Myers and Stoto, 2006; Stoto et al., 2009). Coalitions for community substance abuse control have been found to make little use of other technical assistance tools, resources, or consultation, even when offered without cost (Hallfors et al., 2002). The tools exist, and many are described in Chapter 7 and 8. There are certainly opportunities to increase their utility among community groups.
COMMUNITY dECISION MAkERS ANd MANAGERS AS EVALUATION USERS
why Community decision Makers and Managers?
Community decision makers include mayors, city planners and managers, city councils, health departments, parks and recreation directors, transportation directors, school administrators, and school boards and other policy bodies. Administrators at this level may directly manage activities related to obesity prevention. They may lead or be part of formal community coalitions, or they may not, but they are often the drivers for change. (The needs of state policy and management actors are addressed later in Chapter 2.)
Policies, interventions, and environmental changes instituted by community decision makers are burgeoning (IOM, 2012c; Ross et al., 2010). Community and state governments sometimes serve as labo-ratories that may innovate, implement, evaluate, and pave the way for federal policies. State and com-munity public health departments and community coalitions are taking an increasing interest and role in the use, or potential use, of evaluative information about such policies (IOM, 2009a). Learning commu-nities and practitioner networks are beginning to emerge as policy makers innovate and share informa-tion about how to institute and implement relevant policies. Following on principles from Diffusion of Innovations (Rogers, 2003), several of the examples in this chapter relate to early adopters, often opinion leaders, who are taking actions to address obesity and often provide lessons to others. In many cases, com-munity actions are taking place in light of limited research-tested evidence on what works to prevent obe-sity, thus highlighting the need for strong evaluation resulting in so-called practice-based evidence (Green and Glasgow, 2006).
Media attention to community or regional evaluations of innovations can accelerate their adoption and spread. This dynamic has important implications for innovations that need testing (Leviton et al., 2010a) and for generalizing about innovations that are promising (Leviton, 2001). For all these reasons, community and state policy agendas are quite advanced compared to the federal agendas on obesity pre-vention: examples include instituting incentives and disincentives for healthful eating; reconstructing built environments; and encouraging child care, health care, worksite, and school policies. As in the case of tobacco, bold innovations in policy and environmental change appear to be coming first from community and state levels. As in the case of tobacco, lobbying by forces opposed to these policies may be less effec-

Copyright © National Academy of Sciences. All rights reserved.
Evaluating Obesity Prevention Efforts: A Plan for Measuring Progress
49Improving the Usefulness of Obesity Evaluation Information to Potential Users
tive at state and community levels than at the national level because the multiplicity of community initia-tives can outrun the lobbyists who are organized primarily to work with state and federal lawmakers.
what do Community decision Makers and Managers Need?
According to the Committee’s interviews and workshop, community decision makers need to track progress in preventing obesity so they know when to apply course corrections, manage implementation, and emphasize or de-emphasize a course of action. Yet, the data necessary to do so are often unavailable at the community level or not available in a timely or accessible manner. Community body mass index data in particular are often not available, although they are valued by the public and by school adminis-trators (Haboush et al., 2011).
Like community coalitions, community decision makers also need a good sense of “what works” and what they should do given the situation of their particular community. They need to assess the strat-egies that might be recommended by federal and state decision makers to determine whether they are feasible for the cost, acceptable, and likely to be effective in their particular setting, with their particular population to be served (CDC, 2013c).
Community policy makers and managers also need to be responsive and accountable to constituents and external funders. Yet accountability often takes the form of an evaluation report to government or private funders, which can impair stakeholders’ learning (about what works, about implementation, and about assumptions). Community program managers tend to regard evaluation as something they do for others, not for themselves (Patton, 2008; interviews), although evaluation has been associated with pro-gram sustainability (RWJF, 2009b). When practitioners and managers have an interest in or use for what is reported, the quality and relevance of the information is almost always higher. Community stakeholders are more likely to be interested in and have use for the evaluation results if they were engaged in posing the evaluation questions (Rossi et al., 2004).
how Can Useful Evaluations Be Produced for Community decision Makers and Managers?
It is important to assure that those who are actually planning and implementing obesity preven-tion have a stake in evaluation as well. Too often, evaluations are not requested by community coalitions, decision makers, or managers, but are rather imposed on them by funders or by higher levels of govern-ment. Those imposing evaluation from outside feel urgency to do so in order to hold community efforts accountable for the use of funds or the implementation of law. Accountability is an important function of evaluation, and users at the federal and state levels need better information for this purpose. Unfortunately, the accountability focus tends to be incompatible with optimal learning and program improvement (Chelimsky, 1997; Patton, 2008). Certainly if outsiders pose evaluation questions that are unimportant to communities, make erroneous or even dangerous assumptions about community context, or select incom-plete data sources, it should come as no surprise if communities see the reports as irrelevant. These prob-lems have occurred regularly throughout the history of modern program evaluation (Shadish et al., 1990).
For this reason, a variety of participatory approaches to community assessment and summative evaluation have emerged to balance the accountability focus and offer practitioners and community pro-gram managers something of value from evaluation. These approaches include community-based par-

Copyright © National Academy of Sciences. All rights reserved.
Evaluating Obesity Prevention Efforts: A Plan for Measuring Progress
Evaluating Obesity Prevention Efforts50
ticipatory evaluation for affected community members and community coalitions (Green and Glasgow, 2006; Israel et al., 2012; Jagosh et al., 2012), empowerment evaluation geared primarily toward those implementing programs (Fetterman and Wandersman, 2005), and utilization-focused evaluation for all stakeholders (Patton, 2008). As noted in Chapter 7, these methods do not replace the importance of sys-tematic measurement to reveal needs; however, they assure that relevant perspectives and information are included. Community situations are complex; those conducting community assessments and summative evaluations will have a better chance of understanding that complexity and applying existing knowledge about “what works.” They will also have a better chance of educating community users about the com-plexities of obesity prevention in context.
The capacity to use evaluation information, let alone conduct evaluations, is limited in many com-munity prevention settings. This issue appears to be a function both of the organizations themselves and of the relevance and quality of evaluative information (IOM, 2012c; Labin et al., 2012; Ohri-Vachaspati and Leviton, 2010). Also, in obesity prevention, many agencies cannot afford to collect recommended measures at the state or community levels (IOM, 2012c). “Knowledge brokers” become resources to help organizations apply the findings of evaluative reports. Such knowledge brokers at the community level can include the staff of health departments, universities or colleges, and nonprofit organizations that are organized for this purpose. State health departments and the more than 2,800 community health depart-ments in the United States have the potential to play a special and sustainable role in implementing com-munity obesity prevention, and in particular in the conduct and use of community obesity prevention evaluations (Blanck and Kim, 2012). However, their evaluation capacity is often limited (Cousins et al., 2011). Certain national websites and guides can help to serve the knowledge broker role for community users. For example, the Community Tool Box website,1 a public service of the University of Kansas, had more than 800,000 unique users in 2012, indicating its value to practitioners and planners (see Chapter 6) (personal communication, S. W. Fawcett, University of Kansas, October 9, 2012). Online data resources provide similar value. One example is the Data Resource Center for Child and Adolescent Health, which provides hands-on support to community and state policy makers across the country (The Child and Adolescent Health Measurement Initiative, 2012).
hEALTh CARE PROVIdERS ANd hEALTh INSURANCE PLANS AS EVALUATION USERS
why health Care Providers and health Insurance Plans?
Nonprofit hospitals can participate in community initiatives for obesity prevention as part of their community benefit requirements under the Patient Protection and Affordable Care Act, Public Law 111-148, 111th Cong. (March 23, 2010). The Act revised the tax-exempt status of nonprofit hospitals to make their required “community benefit” activities transparent, concrete, measurable, and responsive to identified community needs. For this purpose they need to conduct community assessments and adopt an implementation strategy. Health insurance plans have an interest in the evaluation of obesity preven-tion because of their need to manage the financial risk related to the costly health consequences of excess weight, such as diabetes and hypertension. Reimbursement policies could be highly influential in deter-mining how much high-quality, effective individual counseling health providers give.
1 See http://ctb.ku.edu/en/default.aspx (accessed November 11, 2013).

Copyright © National Academy of Sciences. All rights reserved.
Evaluating Obesity Prevention Efforts: A Plan for Measuring Progress
51Improving the Usefulness of Obesity Evaluation Information to Potential Users
Individual health care providers can be strong advocates for policy and environmental changes to give their patients a better chance to control weight (McPherson et al., 2012). Health care providers have the opportunity to guide adult patients and parents of pediatric patients about healthful diet and physical activity, although knowledge of energy balance guidelines and the assessment and behavioral management of overweight and obesity by primary care providers remain at a relatively low level considering the mag-nitude of the problem (Pronk et al., 2012; Smith et al., 2011a). In particular well child care offers oppor-tunities to address obesity prevention in the context of other advice on child rearing (National Initiative on Children’s Healthcare Quality, 2013). In other areas such as smoking cessation, provider advice to quit is effective at a population level (Stead et al., 2008). Providers, however, raise the issue of weight control with patients much less frequently than needed (Smith et al., 2011a).
what do health Care Providers and health Insurance Plans Need?
Nonprofit hospitals want to know “what works” at a community level to assure good use of com-munity resources (IOM, 2012c). Based on their conduct of community assessments, they should be inter-ested in knowing what should be done, and given the nature of their bottom line, they are likely to be interested in cost. Health insurance plans see a challenge in accurately translating how reduction in risk factors can translate into improved health status and overall cost-savings. In particular, health insurance plans see a need for cost-effectiveness of various strategies for building the business case for employers and consumers. The Committee’s workshop revealed that users see a lack of standardized data collection as a major challenge to this goal (IOM, 2012c).
Health insurance plans note that employers increasingly want their workers to have access to com-munity programs and are asking for information on those resources. Tracking the use of those resources is a challenge, and for health insurance plans the biggest obstacle is motivating participation and commit-ment by consumers to complete all aspects of prevention programs, especially if the benefits are slow to be realized. Health care providers and health plans also give a high priority to the measurement of, and improvements in, racial and ethnic disparities in health. Some health insurance plans are able to use “real-time” data to show participation and utilization of health care and community resources. Outcome data are helpful for targeting and refining communications to current and potential participants in programs.
Individual health care providers need better information on “what works” to better enable them to make recommendations, in the specific context of their communities and health care settings (Green et al., 2012). Some evidence suggests that they believe most weight control interventions are ineffective and that family, cultural, social, and community factors are largely responsible (Leverence et al., 2007). Recent data from the National Survey of Energy Balance Related Care among Primary Care Physicians indicates that knowledge levels of energy balance guidelines (i.e., physical activity, diet, and weight) among primary care physicians who treat children are low. Among primary care physicians who treat adults, knowledge levels appear high for overweight and obesity guidelines but less so for physical activity and dietary guide-lines (Pronk et al., 2012). Hence, additional training and guidelines that may be integrated into clinical care delivery processes appear warranted.

Copyright © National Academy of Sciences. All rights reserved.
Evaluating Obesity Prevention Efforts: A Plan for Measuring Progress
Evaluating Obesity Prevention Efforts52
how Can Evaluations Be More Useful for health Care Providers and health Insurance Plans?
The most important added value of evaluations for health care providers and health insurance plans is that they give specific evidence of the applicability and effectiveness of interventions as imple-mented under normal circumstances in the real-life, real-time context in which they are conducted. An evaluation’s utility is enhanced if the users of the evaluation evidence are actively engaged as participants in planning the evaluation, in analyzing and interpreting the results, and in incorporating the results into the planning of program adaptations and extensions.
Across communities, health insurance plans are uniquely positioned to align stakeholder inter-ests and generate outcomes of mutual interest. Key stakeholders include the health care providers, the purchasers of health benefits, and the insured people. To position obesity prevention evaluation as a valued and relevant activity, the incentives to pursue evaluations need to be aligned with the interests of each stakeholder (Pronk and Kottke, 2013). For the health insurance plan, the interest is an economic rationale. For the other listed stakeholders, interests include a quality-of-care rationale, a cost-savings and productivity rationale, and a function and health experience rationale, respectively. Making those inter-ests explicit and tangible through the use of evaluation may be of significant interest to any or all of these stakeholders.
EMPLOYERS AS EVALUATION USERS
why Employers?
Employers control access to the workplace, an important and pervasive setting for health promotion (Green and Kreuter, 2005). Employers show increasing interest in wellness programs because they attract competitive employees, have potential for cost savings, and are perceived as an important benefit and the right thing to do (Berry et al., 2010). With passage of the Patient Protection and Affordable Care Act, wellness programs are likely to expand further as more employers start to self-insure and begin to see pre-vention savings accrue directly to their bottom line. A RAND Employer Survey indicates that 51 percent of all employers offer wellness programs, and 79 percent of firms employing 50 or more employees pro-vide access to a wellness program (Mattke et al., 2013). The percentage of employers offering access to a wellness program increases markedly with the number of employees (39 percent for firms with 50-100 employees; 85 percent for firms with 1,001 or more). Obesity prevention and treatment for employees is a major focus, including body mass index screening at 69 percent of firms offering clinical screenings in their wellness programs. Incentives for workplace wellness programs may include reduced insurance pre-miums or waiver of copay and deductible or increased benefits. Of employers offering wellness programs, 25 percent and 28 percent offer incentives for employee participation in weight management programs and fitness programs respectively. Three percent of employers provide incentives for reaching a target body weight and 6 percent for reaching target fitness levels. Incentives for reaching these targets may become more pervasive because the Patient Protection and Affordable Care Act will increase the permitted limits on such incentives from 20 to 30 percent of the total cost of coverage in 2014 (Mattke et al., 2013).

Copyright © National Academy of Sciences. All rights reserved.
Evaluating Obesity Prevention Efforts: A Plan for Measuring Progress
53Improving the Usefulness of Obesity Evaluation Information to Potential Users
what do Employers Need?
Employers express confidence that wellness programs will reduce not only health care costs, but also absenteeism and health-related productivity losses (Mattke et al., 2013). Certainly the clinical benefit from obesity treatment supports employer optimism (Powell et al., 2007), and a variety of analyses indi-cate savings from some, but not all, wellness activities (Mattke et al., 2013). Yet only about half of these employers surveyed by RAND had evaluated program impacts, and only 2 percent reported actual savings estimates (Mattke et al., 2013). The limitations in the data collected matters greatly because for preven-tion of obesity both impacts and savings depend on the design of the wellness programs. The employers’ version of the “what works?” question is about designing the best program for their employees.
how Can Evaluations Be More Useful for Employers?
Because so many claims have been made for employee wellness programs, employers can be skepti-cal of the benefits. Evaluations are more useful to employers when they provide insights about the best program design. For example, a systematic review indicated that environmental and policy changes by themselves are not effective in changing employee behavior; health education and other interventions are still needed (Kahn-Marshall and Gallant, 2012). The employee incentive component of wellness program design also needs evaluation. Because participation, retention, and adherence rates vary across worksites and segments of the employee population, employers might want to target incentives to prob-lem areas, such as dropouts from smoking cessation or sedentary lifestyles (Berry et al., 2010; Leviton, 1987). In general, strategies to increase participation are likely to be needed. The RAND Employer Survey indicates that among firms offering weight management programs, an average of only 11 percent of targeted employees participated, and, among firms offering fitness programs, only 21 percent of targeted employees participated (Mattke et al., 2013).
Another way to make evaluations more useful to employers is to make explicit the cost and cost-effectiveness of different program options. In the RAND Employer Survey, the principal reason that employers gave for not providing wellness programs was the cost—yet some programs may be highly affordable (Mattke et al., 2013). Screenings range from free to costly; Mattke et al. (2013) concluded that for every $10 of incentive for weight loss, the average adult male employee would lose an additional 0.03 pounds or would increase exercise by more than 20 minutes for an additional 0.01 days.
A final way to make evaluations more useful is to extend the evaluation of wellness programs to the families of employees, for whom employers also bear the cost of health coverage. Yet there is a surpris-ing lack of information about employer-based wellness programs for families—RAND’s 2013 report does not mention it at all (Mattke et al., 2013). Although the advantage of convenient access may be less in a family-based program, family-based approaches to weight management are strongly supported by research (Epstein et al., 2007; Gruber and Haldeman, 2009).
FEdERAL ANd STATE POLICY MAkERS AS EVALUATION USERS
why Federal and State Policy Makers?
Policy makers fill essential roles in government, business, and nonprofit organizations and have power to greatly influence obesity prevention. An example of the pervasive importance of federal agency

Copyright © National Academy of Sciences. All rights reserved.
Evaluating Obesity Prevention Efforts: A Plan for Measuring Progress
Evaluating Obesity Prevention Efforts54
BOX 2-1 The National Prevention Council Action Plan
The Patient Protection and Affordable Care Act (Public Law 111-148, 111th Cong., March 23, 2010) requires coordination and leadership from 17 federal departments, agencies, and offices to implement the National Prevention Strategy, in which all sectors work together on evidence-based prevention, wellness, and health promotion. Obesity prevention is not an explicit focus of the Action Plan for the National Prevention Strategy, but the related issues of healthful diet and increased physical activity are pervasive in the Plan. The various agencies approach the Plan in ways that align with their own missions. For example, the Department of Transportation focuses on health in terms of encouraging active transportation such as bike lanes and Safe Routes to School. To guide their activities, the agencies need to know “what works” to promote health. Also, much of the research on health promotion focuses on individual behavior change, but several agencies regard structural changes as outcomes. Comparable data across federal agencies would help with policy development and alignment of federal activities.
SOURCES: Summary of the comments of Corrinne Graffunder (IOM, 2012c) and the National Prevention Council at http://www.surgeongeneral.gov/initiatives/prevention (accessed Noveber 11, 2013).
policies for obesity prevention can be seen in Boxes 2-1 and 2-2. Government officials make and admin-ister policy at federal and state levels. For example, more than half the state health agencies have at least some regulatory powers and can influence policies related to obesity (Blanck and Kim, 2012).
Leadership of nongovernmental organizations also sets policy. For example, the YMCA and accred-iting and licensing bodies like the National Association for Family Child Care set standards for physical activity in their programs based on best evidence and what is feasible (National Association for Family Child Care, 2013; YMCA, 2011). Businesses set policies for foods served in their cafeterias and for physi-cal activity at the workplace. To inform this process, the Alliance of Community Health Plans and the National Business Group on Health rely on research and evaluation to assist them in discovering “what works” for obesity prevention at the workplace, as well as determining the reach and “dose” of a needed strategy, and documenting implementation (IOM, 2012c).
what do Federal and State Policy Makers Need?
For policy makers, the most pressing questions are, “What is the comparative effectiveness of alternative strategies? What is their cost and cost-effectiveness? How does one geopolitical jurisdiction compare with others? How do trends inform us about the need for obesity prevention and the best way to define issues?” For funder organizations, the “How are we doing?” question often takes the form of a need to hold grantee organizations accountable for the use of funds, as in the case of the Centers for Disease Control and Prevention’s (CDC’s) Communities Putting Prevention to Work (CPPW) and Community Transformation Grants (CTGs) (CDC, 2013a,b). The accountability function is important, but it introduces problems for learning as described below.

Copyright © National Academy of Sciences. All rights reserved.
Evaluating Obesity Prevention Efforts: A Plan for Measuring Progress
55Improving the Usefulness of Obesity Evaluation Information to Potential Users
Federal and state lawmakers and their staff are driven by the calendar for consideration and reauthorization of various policies and programs. The types of information that can be presented and absorbed depend critically on this cycle. Actual decisions are made within a relatively small window of time. Yet, evaluation evidence can influence decisions over a longer time period than this tight window (see Boxes 2-1 and 2-2 for examples). Information can play a role in setting the agenda for policy: as the time to make decisions nears, information can help to frame the choices; after policy enactment, it can assist implementation, help motivate adjustments, or provide a rationale for policy abandonment (Dunn, 2011; Ottoson et al., 2013). Box 2-2 illustrates this process for the federal school meals programs.
Like lawmakers, federal and state agency officials are often driven by the policy development cycle; unlike lawmakers, they often draw on a broad portfolio of research, policy, and evaluation information and experience to inform the process (Ginsburg and Rhett, 2003). In policy areas where research and evaluation are more fully developed than for obesity prevention, and more strategies have received ade-quate testing, federal managers oversee the process of vetting strategies for effectiveness such that they can be endorsed or financially supported for implementation at state and community levels (CDC, 2013c,d; NIH, 2013). For obesity prevention and physical activity, the Community Preventive Services Task Force
BOX 2-2 Policy Evaluation Improves Foods Sold and Served in Schools
Research and evaluation have long helped to shape policy for the federally funded child nutrition programs. Two examples illustrate this impact. First, the Healthy Hunger-Free Kids Act of 2010 (Public Law 111-296, 111th, Cong., 2nd sess. [December 13, 2010], 124, 3183) for the first time provided federal authority to regulate the sale of competitive foods (those that “compete” with the school lunch and breakfast). Prior to 2010, federal authority to regulate foods outside the school meals was limited to restrictions on the sale of “foods of minimal nutritional value” (e.g., carbonated beverages and certain candies). Analyses by the University of Illinois at Chicago’s Bridging the Gap Program found that both state and local district policies limiting these competitive foods and beverages were weak and inconsistent (Hirschman and Chriqui, 2012). In addition, these analyses demonstrated that strong policies limiting competitive foods have positive effects on student food consumption. These and other findings point to the need for the kinds of improvements incorporated into the law and the recently proposed federal rule governing competitive foods (USDA, 2013).
In the second example, since 1980, the U.S. Department of Agriculture has used research and evaluation studies to set standards and requirements for the school meals programs. For example, four separate waves of the School Nutrition Dietary Assessment Study (SNDA) have collected nationally representative data on meals offered and served, and two collected dietary intake information at school and over 24 hours on school days. SNDA-III, conducted in school year 2004-2005, was cited heavily in an Institute of Medicine report (IOM, 2008) that recommended updates to the dietary requirements for school meals. The 2008 IOM report provided the scientific basis for new regulations of school meals, requiring more whole grains, fruits, and vegetables; less sodium; only fat-free or low-fat milk; and age-appropriate calorie intake.

Copyright © National Academy of Sciences. All rights reserved.
Evaluating Obesity Prevention Efforts: A Plan for Measuring Progress
Evaluating Obesity Prevention Efforts56
recommends several evidence-based strategies,2 and CDC has promoted additional policy and environ-mental changes to prevent obesity along with measures to assess those changes (Kettel Khan et al., 2009). However, the federal level does not yet drive the translation process for obesity prevention because, as seen in the systematic reviews conducted for the Community Preventive Services Task Force, most of the suggested policy and environment changes for obesity prevention are “evidence-informed” or “promising” rather than “evidence-based” at this time (The Community Guide, 2012). These ratings of the evidence and the occasional finding of “insufficient evidence” are sometimes interpreted by practitioners incorrectly as “ineffective.” They do not indicate ineffective interventions, but interventions for which the level of certainty of effectiveness and applicability do not permit a stronger recommendation.
how Can Evaluation Be More Useful to Federal and State Policy Makers?
Politicians have a markedly different frame of reference from scientists. To bridge this gap, repeated calls have been made for knowledge brokers who can translate research into policy, such as national experts, congressional agencies such as the Congressional Research Service or the U.S. Government Accountability Office, or advocates (Brownson et al., 2006; Choi et al., 2005; Lindblom and Cohen, 1979). The evaluations with the greatest documented effect on policy have systematically bridged this divide (Chelimsky, 1991; Leviton and Boruch, 1983). Lawmakers prefer very short jargon-free briefs with graphics and maps, but need substantiation by longer reports to verify the information if necessary (Grob, 2010; IOM, 2012c; Personal communication, M. Gutman, Gutman Research Associates, July 23, 2012). Examples include the state-by-state childhood obesity report cards developed to inform policy makers at the state level using data from the National Survey of Children’s Health in combination with state policy summaries (Childhood Obesity Action Network, 2009). Lawmakers view as useful information that contributes to a body of other evidence about programs (Dunn, 2011; Ginsburg and Rhett, 2003) and captures comparative effects and cost-effectiveness (IOM, 2012c). Maps and charts are particularly use-ful when they depict health effects about elected officials’ own constituents (IOM, 2012c). Policy makers are highly sensitive to media, and many prefer that personal interest stories accompany data (Sorian and Baugh, 2002). Evaluation findings need to be presented with clear and specific policy recommendations (Dodson et al., 2009; Grob, 2010). Unfortunately most presentations do not meet these criteria. In a recent review of 100 obesity-themed policy briefs, the majority had no tables and few fıgures, and only 36 percent included photos (Dodson et al., 2012). The average reading level was high, and data on evalu-ation of dissemination efforts and utilization were sparse. Box 2-3 provides a summary of recommenda-tions to make policy briefs more effective.
AdVOCATES FOR OBESITY PREVENTION AS EVALUATION USERS
why Advocates?
Advocates are essential to the policy development process, particularly for public health (Dorfman, 2013). They often serve as knowledge brokers: for example, in their window of opportunity to set the agenda and frame the issues, advocates will make “educational visits” with policy makers. Advocates need to be visible and persistent; legislators in states with less policy action are not as likely to identify
2 See http://www.thecommunityguide.org/CG-in-Action/table.html (accessed November 11, 2013).

Copyright © National Academy of Sciences. All rights reserved.
Evaluating Obesity Prevention Efforts: A Plan for Measuring Progress
57Improving the Usefulness of Obesity Evaluation Information to Potential Users
BOX 2-3 Writing and Using Policy Briefs to Convey Evaluation Findings
A policy brief can best communicate research and evaluation by persuading the audience of the urgency of a problem and the need to adopt one of several viable alternatives. An effective policy brief should (1) make the evidence concise and understandable; (2) explain why the evidence is significant; and (3) describe evidence-informed policy options as suitable actions.
• The title should be catchy, informative, and encourage the reader to read on;
• The information in the brief should be clear and concise;
• Include information on the scale/importance of the problem and benefits of intervention;
• Aim for one to two pages, including tables, fıgures, and photos;
• When a brief is being tailored to a specific policy maker or region, include a compelling story;
• Include some action-oriented, “bottom-line” policy recommendation;
• Include a short list of references and contact information for follow-up;
• Authors of a policy brief should use active, targeted means of dissemination; and
• Dissemination of a brief should be monitored and evaluated.
SOURCES: Dodson et al., 2012; International Development Research Centre, 2008; Stamatakis et al., 2010.
the champions of obesity policy than those with more action (Jones et al., 2012). Yet counties and states ranked as having the lowest indicators of health would be happy to hear from advocates and would be responsive to their concerns (IOM, 2012c).
what do Advocates Need?
Of course advocates rely on evaluation to persuade, but in the case of obesity, they also need to choose prevention strategies to focus on. As one advocate put it, “The range of possible ways to intervene is overwhelming. The socio-ecological model offers a multitude of different levels on which to intervene and numerous potential targets for intervention within those levels. Where do we start? Obviously, first recourse is with the things that have some support in the evaluation literature. But which ones are most relevant and culturally appropriate to the population at hand, and how many of them need to be done together or in tandem?” The Committee’s interviews and workshops also indicated that political opposi-tion to many of the suggested strategies demands that advocates rely on the research community to be able to support claims about “what works” and their particular applicability to the populations at great-

Copyright © National Academy of Sciences. All rights reserved.
Evaluating Obesity Prevention Efforts: A Plan for Measuring Progress
Evaluating Obesity Prevention Efforts58
est risk. Cost and cost-effectiveness findings help to make the business case for obesity prevention (IOM, 2012b). Also helpful is information on what similar communities and states are doing, because there is a desire not to be left behind on important health initiatives.
Advocates also need to know how specific advocacy appeals or framing of the issues and stratagems work in different contexts. Evaluative information can help advocates to track the supports, the allies and opposition, and the opportunities to frame the issues (Beer et al., 2012; RWJF, 2009a). Such tracking also provides intermediate outcomes that can be reported to funders and helps to identify strategic targets. Is advocacy best focused now on federal, state, or community issues? Which policies should be tracked, and at what points in time? How is the opposition framing the issues, and how might they be reframed?
Shifting the focus from obesity by itself to workforce productivity and health costs helps to capture policy maker attention (IOM, 2012c; interviews). Casting light on health inequities may help to advance action, particularly in communities of color and in low-income areas (Kirkpatrick and McIntyre, 2009).
Later in the policy process, when policies must be implemented, advocates rely on monitoring of enforcement to make the case for improvements. For example, ongoing work from the Robert Wood Johnson Foundation–supported Bridging the Gap Program fuels advocacy by providing a repository of information about problems in school implementation of wellness policies for obesity prevention (Chriqui et al., 2013). The Sarah Samuels Center for Public Health Research & Evaluation and University of California, Berkeley, Atkins Center for Weight and Health also fueled advocacy by monitoring food offer-ings in California schools after landmark legislation restricting competitive foods and beverages was passed (Samuels et al., 2009, 2010). Information on progress and the needs for improvement can also help to preserve the policies themselves, as described in Box 2-4.
how Can Evaluation Be More Useful to Advocates?
Because “all politics is local,” advocates try to rely on community assessment, surveillance, and evaluation data when they can get them. Research articles and even policy briefs must be boiled down to emails or one-page fact sheets. One advocate expressed unease about her ability to appraise a research study critically and her need to rely on a “middleman” (or knowledge broker) to do so. She said she uses the “arsenal of studies” provided by research programs funded by the Robert Wood Johnson Foundation to fuel the arguments for improving the school meals programs through legislation and regulation. Recognizing the need for such support, knowledge brokers such as the Data Resource Center for Child and Adolescent Health provide hands-on consultation to family advocates who want to integrate data findings quickly into their efforts around childhood obesity and related topics (The Child and Adolescent Health Measurement Initiative, 2012).
FEdERAL ANd STATE AGENCY AdMINISTRATORS AS EVALUATION USERS
why Agency Administrators?
Agency administrators oversee accountability and reporting requirements for funds distributed to state and community levels for initiatives such as the Communities Putting Prevention to Work initiative and the Community Transformation Grants (CDC, 2013a,b). Yet, they are also charged with dissemina-tion, translation, and community implementation of “evidence-based,” “evidence-informed,” or “best”
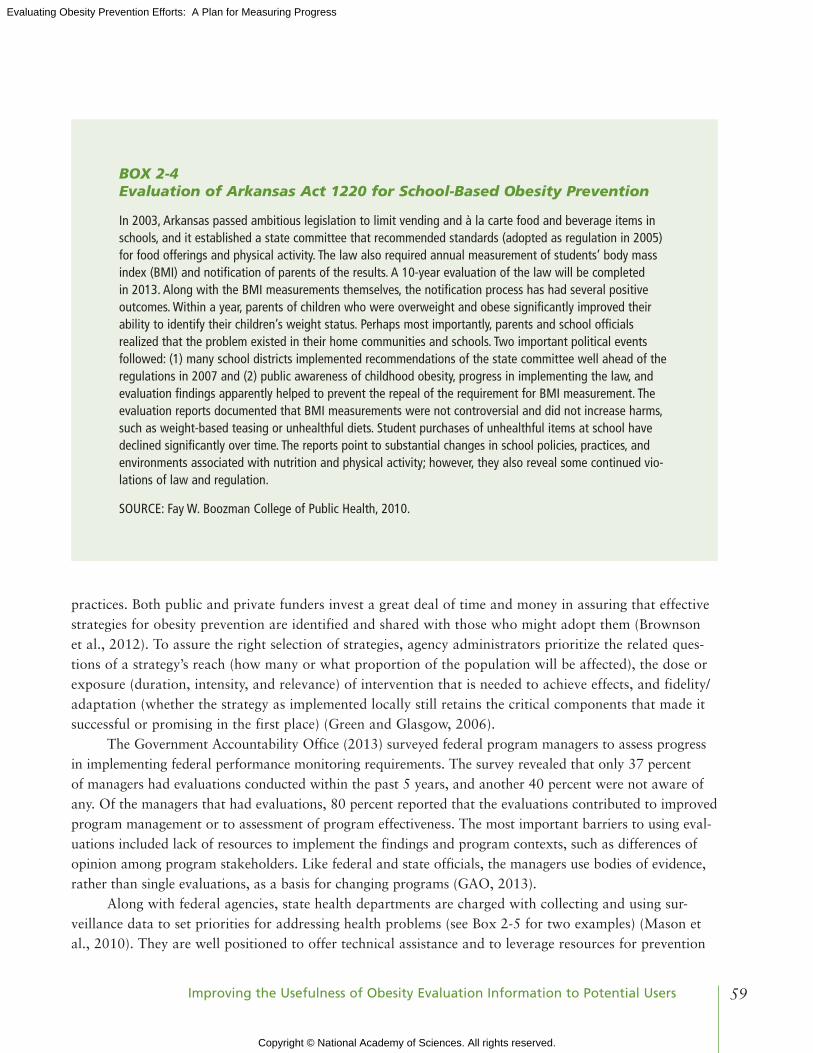
Copyright © National Academy of Sciences. All rights reserved.
Evaluating Obesity Prevention Efforts: A Plan for Measuring Progress
59Improving the Usefulness of Obesity Evaluation Information to Potential Users
practices. Both public and private funders invest a great deal of time and money in assuring that effective strategies for obesity prevention are identified and shared with those who might adopt them (Brownson et al., 2012). To assure the right selection of strategies, agency administrators prioritize the related ques-tions of a strategy’s reach (how many or what proportion of the population will be affected), the dose or exposure (duration, intensity, and relevance) of intervention that is needed to achieve effects, and fidelity/adaptation (whether the strategy as implemented locally still retains the critical components that made it successful or promising in the first place) (Green and Glasgow, 2006).
The Government Accountability Office (2013) surveyed federal program managers to assess progress in implementing federal performance monitoring requirements. The survey revealed that only 37 percent of managers had evaluations conducted within the past 5 years, and another 40 percent were not aware of any. Of the managers that had evaluations, 80 percent reported that the evaluations contributed to improved program management or to assessment of program effectiveness. The most important barriers to using eval-uations included lack of resources to implement the findings and program contexts, such as differences of opinion among program stakeholders. Like federal and state officials, the managers use bodies of evidence, rather than single evaluations, as a basis for changing programs (GAO, 2013).
Along with federal agencies, state health departments are charged with collecting and using sur-veillance data to set priorities for addressing health problems (see Box 2-5 for two examples) (Mason et al., 2010). They are well positioned to offer technical assistance and to leverage resources for prevention
BOX 2-4 Evaluation of Arkansas Act 1220 for School-Based Obesity Prevention
In 2003, Arkansas passed ambitious legislation to limit vending and à la carte food and beverage items in schools, and it established a state committee that recommended standards (adopted as regulation in 2005) for food offerings and physical activity. The law also required annual measurement of students’ body mass index (BMI) and notification of parents of the results. A 10-year evaluation of the law will be completed in 2013. Along with the BMI measurements themselves, the notification process has had several positive outcomes. Within a year, parents of children who were overweight and obese significantly improved their ability to identify their children’s weight status. Perhaps most importantly, parents and school officials realized that the problem existed in their home communities and schools. Two important political events followed: (1) many school districts implemented recommendations of the state committee well ahead of the regulations in 2007 and (2) public awareness of childhood obesity, progress in implementing the law, and evaluation findings apparently helped to prevent the repeal of the requirement for BMI measurement. The evaluation reports documented that BMI measurements were not controversial and did not increase harms, such as weight-based teasing or unhealthful diets. Student purchases of unhealthful items at school have declined significantly over time. The reports point to substantial changes in school policies, practices, and environments associated with nutrition and physical activity; however, they also reveal some continued vio-lations of law and regulation.
SOURCE: Fay W. Boozman College of Public Health, 2010.

Copyright © National Academy of Sciences. All rights reserved.
Evaluating Obesity Prevention Efforts: A Plan for Measuring Progress
Evaluating Obesity Prevention Efforts60
BOX 2-5 Evaluation of Policies to Address Health Problems
The Nutrition and Obesity Policy Research and Evaluation Network (NOPREN), which is sponsored by the Centers for Disease Control and Prevention (CDC), evaluates policies to improve food and beverage environ-ments. NOPREN identifies research gaps; develops common evaluative tools; and improves the evidence on reach, equity, cost-effectiveness, and sustainability of such policies. NOPREN works through six of CDC’s Prevention Research Centers as well as affiliates and collaborative members. For example, three local health departments in Washington State partner with the University of Washington to address policies for menu labeling, including developing lessons for working with restaurants and strategies to inform customer food selection (Blanck and Kim, 2012). Seattle-King County health department works with NOPREN to improve policies for child care and schools. Harvard University works with Boston’s Public Health Commission to pro-vide access to water in Boston’s public schools, and it collaborates with the Massachusetts Department of Public Health and a range of local agencies to test both policy and practice for obesity prevention.
Another example of policy evaluation is the Physical Activity Policy Research Network (PAPRN), which was created by CDC to study the implementation and effectiveness of health policies related to increasing physi-cal activity in communities. The network consists of one coordinating center, Prevention Research Center member centers, CDC technical advisors, and university members who collaborate on a variety of projects. The PAPRN works to identify policies that affect population physical activity, what determines policy success, what is the process of implementing policies, and finally what is the outcome of the policies. For example, PAPRN members at the University of Colorado, Denver, led a study of what makes a successful physical activity coalition or partnership by asking groups located across the country about their mission, history, process, success, and sustainability (Litt et al., 2013). The University of North Carolina, Chapel Hill, evaluated the National Physical Activity Plan to determine the extent to which states pursue and act upon recommen-dations in the plan and whether the plan is helping states to develop their own state physical activity plan (Evenson et al., 2013; Kohl et al., 2013).
efforts by other state organizations and community agencies or coalitions. State health departments some-times have good capacity for providing evaluation and interpreting it to decision makers (Cousins et al., 2011). Some state health departments, however, suffer from the same evaluation capacity problems seen among community coalitions and decision makers.
what do Agency Administrators Need?
Program administrators need a variety of data elements that are not always available for obesity prevention. Intermediate indicators such as changes in programs, policies, or environments are helpful for planning and mid-course corrections (see Box 2-6 for an example). To endorse best or evidence-based practices and provide meaningful technical assistance, agency administrators need the best evidence of effectiveness available. Such evidence sometimes comes not from evaluations, but from research studies that provide more experimental controls on threats to validity or alternative explanations. As noted later

Copyright © National Academy of Sciences. All rights reserved.
Evaluating Obesity Prevention Efforts: A Plan for Measuring Progress
61Improving the Usefulness of Obesity Evaluation Information to Potential Users
in this report, however, the standard of evidence for such endorsement is difficult to discern in the area of comprehensive community initiatives on obesity prevention, as well as many policy and environ mental changes (although there are notable exceptions [e.g., Wagenaar et al., 2010]). At the same time, external validity and generalizability is an emerging need (Glasgow et al., 2006; Green and Glasgow, 2006; Green and Nasser, 2012).
To offer optimal technical assistance, the “What works?” question becomes “Which strategies work, in what settings, with what resources, at what cost, and for what populations?” First posed decades ago in the context of mental health services and education, this is the classsic evaluation’s challenge to exter-nal validity (Cronbach and Shapiro, 1982). Yet, for obesity prevention, very little information is avail-able about strategies most likely to be effective in the particular situation of a prospective user, much less about classes of situations for which particular strategies are optimal. How can federal program managers offer optimal technical assistance and training, or facilitate networking, when so little is known about prevalent patterns—types of settings and populations where particular strategies are more or less likely to be effective? How can community program managers choose optimal strategies for their own situation, when so little is known about what will work especially well in their context?
how Can Evaluation Be More Useful to Agency Administrators?
Federal and state administrators have a fiduciary responsibility to the public to assure that resources are used correctly, and they also are charged with making sure that the law is obeyed. Yet the legitimate
BOX 2-6 Use of the Community Dashboard by the Healthy Kids, Healthy Communities Program
Healthy Kids, Healthy Communities is funded by the Robert Wood Johnson Foundation (RWJF) to support policy and environmental changes in 49 communities nationwide. Program staff work with communities to identify targets for improvement, provide technical assistance on advocacy and resource development, and monitor progress in each community. The Dashboard, a tool that allows the community partners to network and share resources including assessment guides and policy examples, assists them in their efforts. Modeled on previous work by Francisco et al. (1993), each community agrees with program staff in advance about milestones for accomplishment and provides information about these milestones over time. Where progress has slowed, the staff can engage in problem solving with community coalitions. In addition, the Dashboard conveys to funders and to the coalitions themselves the amount of progress that is made, year by year. For example, the Dashboard permits a coalition to display the resources leveraged over time, the number of poli-cies altered, or physical environments changed. This has been enormously helpful to the RWJF in its overall expectations about how quickly certain policies and environments can be expected to change.
SOURCE: Healthy Kids, Healthy Communities (Personal communication, August 2, 2012).

Copyright © National Academy of Sciences. All rights reserved.
Evaluating Obesity Prevention Efforts: A Plan for Measuring Progress
Evaluating Obesity Prevention Efforts62
concern over accountability often impairs, threatens, or crowds out important opportunities for learning and program improvement, for both the funder and the funding recipient (Chelimsky, 1997; Patton, 2008). In spite of the Government Accountability Office survey (2013) indicating that managers do use evaluation for program improvement, it is still reasonable to ask whether evaluation for accountability has either the structure or content for optimal national or state program manager learning, except perhaps to point to prevalent implementation problems. The answer, however, is not to abandon account ability, but to enhance the process of evaluation so that it helps to improve, not merely prove, intervention effectiveness.
FUNdER ORGANIzATIONS AS USERS OF EVALUATION
why Focus on Funder Organizations?
Governmental and philanthropic organizations across the United States have become concerned about the obesity problem, as seen in funding for the Department of Health and Human Services CPPW Initiative by American Relief and Reinvestment Act of 2009 (CDC, 2013a), CTG by the Patient Protection and Affordable Care Act’s Prevention and Public Health Fund (CDC, 2013b), Racial and Ethnic Approaches to Community Health (REACH) by the 2012 Prevention and Public Health Fund (CDC, 2012), and the activities of the IOM Standing Committee on Childhood Obesity by the Robert Wood Johnson Foundation, the California Endowment, the Michael & Susan Dell Foundation, and Kaiser Permanente. Other philanthropic funders include the W.K. Kellogg Foundation in the area of food sys-tems, the Kresge Foundation in the area of health disparities, and a variety of state and community foun-dations. These private and nonprofit funders can keep the policy conversation going in ways that federal and state agencies cannot. They can champion continued social and system changes conducive to healthy weight, and they can educate to encourage advocacy for change at all levels (although they cannot lobby). They also can publicize progress, as in the recent case of “obesity bright spots” reporting by the media (e.g., Harper, 2013).
what do Funder Organizations Need to know?
Funders of obesity prevention aim at health and social change, so they need to see indicators of progress on the way to such changes. They want to build social movements so that their limited dollars can stimulate sustained change by others. The public and key influential individuals generally believe that personal responsibility is to blame for rising obesity rates. Funders believe that this perception is an obstacle to progress and attempt to reframe the cause of obesity as due to policy and environmental fac-tors (Brownell et al., 2010). Funders, like other users, need to see tangible signs of progress in obesity prevention both in the interventions and in the outcomes to retain the interest of leadership and boards of trustees.
Both public and private funders have invested heavily in multi-component, complex community ini-tiatives to obesity prevention. As seen in Chapter 8, however, evaluation of these initiatives is particularly challenging, because of the dynamics of community coalitions, the range of program, environmental, and policy components, and the limitations of available designs. The evidence base is limited, and yet Institute of Medicine reports since 2003 have concluded that this approach is needed (IOM, 2004, 2009b, 2010, 2012a,b). The stakes are high. Funders include W.K. Kellogg Foundation’s Food and Fitness Initiative

Copyright © National Academy of Sciences. All rights reserved.
Evaluating Obesity Prevention Efforts: A Plan for Measuring Progress
63Improving the Usefulness of Obesity Evaluation Information to Potential Users
(USDA, 2010); the Robert Wood Johnson Foundation’s Healthy Kids; Healthy Communities initiative (RWJF, 2013); the Kaiser Permanente Community Health initiative (Cheadle et al., 2010); the federal CPPW, CTG, and REACH initiatives; the First Lady Michelle Obama’s Let’s Move Campaign (Let’s Move, 2013); and the White House Task Force on Childhood Obesity (The White House, 2010). Indeed, federal funding priorities recognize the major importance of place-based initiatives and have included significant funding for CPPW, CTG, REACH, and others (CDC, 2012, 2013a,b). Therefore, all of these funders feel a pressing need to accumulate evidence about what works in community-level initiatives so that they can invest resources wisely and secure the best possible return on investment.
how Can Evaluations Be More Useful for Funder Organizations?
Funders respond to the same kinds of information as community and federal policy makers. They rely on trusted experts to advise them about investments, so linking them with the best scientists is criti-cal. Those scientists, however, also need to be able to translate research into feasible and relevant actions, another role for the “knowledge broker.” Evaluation can help bridge the research-to-action gap by testing the applicability of the research to the particular settings, populations, and circumstances in which the interventions recommended by the research would be applied or adapted. Funders can then assure their leadership and boards of trustees that their resources are having the intended impact. Evaluation can also be used to identify evidence gaps and testable hypotheses to be addressed through formal research. Such gaps in what is known may inform the next rounds of funding portfolios.
GENERAL FACTORS AFFECTING USEFULNESS OF EVALUATION ACROSS TYPES OF USERS
A variety of factors affecting the utilization of evaluation and policy analysis have been identi-fied in the literature and appear to generalize across types of users. These are particularly important considerations for improving the usefulness of evaluation information on progress in preventing obe-sity. As summarized by Dunn (2011) and Johnson et al. (2009) , these factors may concern character-istics of the evaluation, decision context, and user involvement. Evaluator competence and hence the quality of the evaluation is often paramount; poor quality evaluations may be used, but they are likely to be regarded as less trustworthy. In addition, the quality of communications is critical: have findings been conveyed in jargon-free language that is action oriented? Credibility depends on evaluation quality, but also on whether the findings are surprising or in line with other information from the body of evidence and experience on the topic, such as representativeness of the situation, population, and resources that were used. The particular findings and their relevance to decisions, as well as whether the information is on time for the window of opportunity, matter a great deal.
Yet, timeliness is also a function of context and of user involvement. As described by Dunn (2011), findings need to be relevant to the particular activities of the policy development process. In the same way, community and state capacity matters: if program managers are not ready or able to receive infor-mation about what works, not willing to commit resources to, or capable of, implementing something that works, or have no capacity to improve their existing programs, evaluation findings from other set-tings can fall on deaf ears, and evaluation will not be undertaken in the absence of intervention in their own setting.

Copyright © National Academy of Sciences. All rights reserved.
Evaluating Obesity Prevention Efforts: A Plan for Measuring Progress
Evaluating Obesity Prevention Efforts64
Personal characteristics of the users matter, including whether they are accustomed to using data or to thinking analytically about programs and policies. In addition, their commitment to the evalua-tion, and the organization’s commitment or receptiveness to evaluation, will affect whether it is used. Characteristics of the decision, including feasibility of implementing recommendations based on evalua-tion findings, are factors in utilization. So is the political acceptability of potential solutions: if, for exam-ple, political sentiment is opposed to government regulation of food and physical activity environments, than it will greatly affect the interventions selected and the interpretation of evaluations. The information needs of the users, as well as competing or complementary information, all affect whether and how the information will be used.
Clearly, all these factors can be enhanced in a particular intervention setting by the degree to which evaluation users in that setting can be engaged in planning and making sense of the evaluation. Their needs must be addressed. Consideration of the wide variety of evaluation users is critical to taking a sys-tems science approach to better understand the complexity of obesity prevention (see Box 2-7). A policy maker can facilitate access to information about timeliness, relevance, other information, and the basis for assessing credibility. A program manager committed to the evaluation is more likely to use evaluation results, feasibility and context permitting (Patton, 2008).
CONCLUSIONS
what Are the Priority Questions?
Across the workshop, the interviews, and the literature, the various kinds of evaluation users identified a set of highest-priority questions: (1) “Why is this important?,” (2) “What works to prevent
BOX 2-7 Evaluation Users as Part of a Systems Approach to Evaluation
Chapter 9 deals with the complexity of obesity prevention and outlines a systems approach. Consideration of the wide variety of evaluation users is integral to this approach. Emergent properties of complex systems force an evaluation approach to obesity prevention efforts to deal with reality as it unfolds. As a result, eval-uation efforts that focus too much on internal validity, and thereby lack generalizability, will suffer in their relevance to application. A complex systems approach will provide insights into the complex web of inter-relationships among multiple levels of activity, multiple sectors across communities or the nation, multiple stakeholder groups, multiple programmatic options, and other factors. It will also consider feedback loops and provide updates on progress based on the whole picture rather than a single element. As an example of consideration of the multiple interrelationships among many factors that affect obesity, the Committee refers to the 2012 Institute of Medicine report on valuing community-based prevention (IOM, 2012b) as well as to the obesity systems map in the Foresight report by the Government Office for Science in the United Kingdom (Vandenbroeck et al., 2007). As the obesity prevention field moves from research into practice, sys-tems approaches provide a realistic set of insights and learnings.

Copyright © National Academy of Sciences. All rights reserved.
Evaluating Obesity Prevention Efforts: A Plan for Measuring Progress
65Improving the Usefulness of Obesity Evaluation Information to Potential Users
obesity?,” (3) “What should we do?,” and (4) “How are we doing?” (Farley and VanWye, 2012; IOM, 2012c; interviews; Rodgers and Collins, 2012). In addition, several potential user groups identified better cost information as important. Evaluation users operate at federal, state, and community levels, and in at least three contexts: the policy-making process (Dunn, 2011; Kingdon, 2011); dissemination and diffusion of obesity prevention strategies (Brownson et al., 2012; Rogers, 2003); and community-level implemen-tation, quality improvement, and sustainability of policies and programs (Fetterman and Wandersman, 2005; Ottoson, 2009; Scheirer and Dearing, 2011).
what Actually Gets Used?
An underlying assumption is that data “should” be used in policy and program development and implementation. Yet, the use of research, policy analysis, and evaluation is a process, not a discrete event, just as program planning and policy making are themselves processes that combine scientific evidence with other considerations. Evaluation requires users to interpret and draw out the implications of findings for action, considering both the purpose of the evaluation and the context within which the evaluation occurs (Dunn, 2011; Henry and Mark, 2003; Kirkhart, 2000; Leviton, 2003). Researchers and evalua-tors are often disappointed when their findings are not used immediately and concretely for funding or implementation decisions (Leviton and Hughes, 1981; Weiss, 1977). Although users sometimes act on findings in this immediate, instrumental way, the process depends on a host of other factors (Brownson et al., 2006; Johnson et al., 2009). Researchers can also become disillusioned when their findings are used to justify decisions that would have been made anyway, or in ways that go beyond the findings or without “fidelity” to the intervention as they had developed and tested it. Yet, their disappointment ignores the legitimate process of political persuasion that requires martialing a variety of arguments for or against a position, as well as the necessity of adapting some tested interventions to the very different people, set-tings, or circumstances in which they would be applied (Leviton and Hughes, 1981). Most commonly, findings are used conceptually along with other information, such as the experience of implementers, to better understand the nature of a problem, the operation of a program or policy, or the assumptions underlying a logic model or theory of change (Dunn, 2011; Weiss, 1977). Finally, users are often affected by their own participation in research, policy analysis, or evaluation to think more analytically—not necessarily linked to any specific finding (Patton, 1997). The impact of their participation should not be underrated, because it can improve policy through simulations at the national or international levels (Gortmaker et al., 2011) and it can improve logic models and implementation in community obesity pre-vention programs (Leviton et al., 2010b).
ways to Improve Usefulness
The literature, workshops, and interviews pointed to several areas for improvement in evaluating progress of efforts to prevent obesity. First, the field needs to develop better and more comparable data, especially at community levels, for indicators relevant to obesity. Also, data collection needs to be feasible for health departments and other organizations that are unlikely to have the resources for elaborate mea-surement of populations, policies, and environments. Better data will mean better comparisons across time and geo political areas, and may lead to better benchmarks or standards for progress. Good intermediate indicators need to be agreed upon to help stakeholders to assess progress in achieving policy, environ-

Copyright © National Academy of Sciences. All rights reserved.
Evaluating Obesity Prevention Efforts: A Plan for Measuring Progress
Evaluating Obesity Prevention Efforts66
mental, and behavioral changes in ways that will be most credible. “Knowledge brokers” can fill several roles, including providing brief, cogent summaries of available research, assisting researchers in making the implications of their findings for action clear and concrete, assessing applicability of the research and evaluations elsewhere to the community situation, drawing conclusions and options for action for stake-holders, and assisting them to envision what change would look like. More needs to be known about external validity as well as “what works.” The single-minded emphasis on requiring evaluations for accountability, however, may limit the potential of those reports to provide generalized knowledge about the populations, settings, and resources needed to adequately implement obesity prevention strategies. Structured differently, requirements for producing and presenting evaluative reports could be an enabling process and rich resource to more fully understand external validity.
REFERENCES
APHA (American Public Health Association). 2006. Policy statement database: Conduct research to build an
evidence-base of effective community health assessment practice. http://www.apha.org/advocacy/policy/
policysearch/default.htm?id=1330 (accessed September 28, 2012).
Beer, T., P. S. Ingargiola, and M. F. Beer. 2012. Advocacy & public policy grantmaking: Matching process to purpose.
Washington, DC: The Colorado Trust.
Berry, L. L., A. M. Mirabito, and W. B. Baun. 2010. What’s the hard return on employee wellness programs?
Harvard Business Review 88(12):104-112, 142.
Blanck, H. M., and S. A. Kim. 2012. Creating supportive nutrition environments for population health impact and
health equity: An overview of the nutrition and obesity policy research and evaluation network’s efforts.
American Journal of Preventive Medicine 43(3 Suppl 2):S85-S90.
Brownell, K. D., R. Kersh, D. S. Ludwig, R. C. Post, R. M. Puhl, M. B. Schwartz, and W. C. Willett. 2010. Personal
responsibility and obesity: A constructive approach to a controversial issue. Health Affairs 29(3):379-387.
Brownson, R. C., C. Royer, R. Ewing, and T. D. McBride. 2006. Researchers and policymakers: Travelers in parallel
universes. American Journal of Preventive Medicine 30(2):164-172.
Brownson, R. C., G. A. Colditz, and E. K. Proctor, eds. 2012. Dissemination and implementation research in health:
Translating science to practice. New York: Oxford University Press.
CDC (Centers for Disease Control and Prevention). 2012. Racial and ethnic approaches to community health
(REACH). http://www.cdc.gov/reach/about.htm (accessed April 10, 2013).
CDC. 2013a. Communities Putting Prevention to Work. http://www.cdc.gov/communitiesputtingpreventiontowork
(accessed April 4, 2013).
CDC. 2013b. Community Transformation Grants (CTGs). http://www.cdc.gov/communitytransformation/index.htm
(accessed April 4, 2013).
CDC. 2013c. What is the Community Guide? http:// www.thecommunityguide.org/about/index.html (accessed
May 24, 2013).
CDC. 2013d. Replicating effective programs plus. http://www.cdc.gov/hiv/topics/prev_prog/rep/index.htm (accessed
May 24, 2013).
Cheadle, A., P. M. Schwartz, S. Rauzon, W. L. Beery, S. Gee, and L. Solomon. 2010. The Kaiser Permanente
Community Health Initiative: Overview and evaluation design. American Journal of Public Health
100(11):2111-2113.
Chelimsky, E. 1991. On the social science contribution to governmental decision-making. Science 254(5029):226-231.
Chelimsky, E. 1997. The coming transformations in evaluation. In Evaluation for the 21st century: A handbook,
edited by E. Chelimsky and W. R. Shadish. Thousand Oaks, CA: Sage Publications. Pp. 1-26.

Copyright © National Academy of Sciences. All rights reserved.
Evaluating Obesity Prevention Efforts: A Plan for Measuring Progress
67Improving the Usefulness of Obesity Evaluation Information to Potential Users
Childhood Obesity Action Network. 2009. State obesity profiles. National Initiative for Children’s Healthcare
Quality Child Policy Research Center, and Child and Adolescent Health Measurement Initiative. http://www.
childhealthdata.org/browse/snapshots/obesity-2007 (accessed May 28, 2013).
Choi, B. C. K., T. Pang, V. Lin, P. Puska, G. Sherman, M. Goddard, M. J. Ackland, P. Sainsbury, S. Stachenko,
and H. Morrison. 2005. Can scientists and policy makers work together? Journal of Epidemiology and
Community Health 59(8):632-637.
Chriqui, J., E. Resnick, L. Schneider, R. Schermbeck, T. Adcock, V. Carrion, and F. Chaloupka. 2013. School district
wellness policies: Evaluating progress and potential for improving children’s health five years after the federal
mandate. School years 2006-07 through 2010-11. Chicago, IL: Bridging the Gap Program, Health Policy
Center, Institute for Health Research and Policy, University of Illinois at Chicago.
Council of State and Territorial Epidemiologists Executive Committee. 2007. Research to study and disseminate
evidence of effective community health assessments. http://c.ymcdn.com/sites/www.cste.org/resource/resmgr/
PS/07-EC-01.pdf (accessed May 24, 2013).
Cousins, J. M., S. M. Langer, L. K. Rhew, and C. Thomas. 2011. The role of state health departments in supporting
community-based obesity prevention. Preventing Chronic Disease 8(4):A87.
Cronbach, L. J., and K. Shapiro. 1982. Designing evaluations of educational and social programs. San Francisco,
CA: Jossey-Bass.
Curtis, D. C. 2002. Evaluation of community health assessment in Kansas. Journal of Public Health Management
and Practice 8(4):20-25.
Dodson, E. A., C. Fleming, T. K. Boehmer, D. Haire-Joshu, D. A. Luke, and R. C. Brownson. 2009. Preventing child-
hood obesity through state policy: Qualitative assessment of enablers and barriers. Journal of Public Health
Policy 30:S161-S176.
Dodson, E. A., A. A. Eyler, S. Chalifour, and C. G. Wintrode. 2012. A review of obesity-themed policy briefs.
American Journal of Preventive Medicine 43(3 Suppl 2):S143-S148.
Dorfman, L. 2013. Talking about sugar sweetened-beverage taxes: Will actions speak louder than words? American
Journal of Preventive Medicine 44(2):194-195.
Dunn, W. N. 2011. Public policy analysis: An introduction. 5th ed. Upper Saddle River, NJ: Pearson Prentice Hall.
Epstein, L. H., R. A. Paluch, J. N. Roemich, and M. D. Beecher. 2007. Family-based obesity treatment, then and
now: Twenty-five years of pediatric obesity treatment. Health Psychology 26(4):381-391.
Evenson, K. R., R. C. Brownson, S. B. Satinsky, A. A. Eyler, and H. W. Kohl 3rd. 2013. The U.S. National Physical
Activity Plan: Dissemination and use by public health practitioners. American Journal of Preventive Medicine
44(5):431-438.
Farley, T. A., and G. Van Wye. 2012. Reversing the obesity epidemic: The importance of policy and policy research.
American Journal of Preventive Medicine 43(3 Suppl 2):S93-S94.
Fay W. Boozman College of Public Health. 2010. Year six evaluation: Arkansas Act 1220 of 2003 to combat child-
hood obesity. Little Rock: University of Arkansas for Medical Sciences.
Fetterman, D. M., and A. Wandersman. 2005. Empowerment evaluation principles in practice. New York: Guilford
Press.
Francisco, V. T., A. L. Paine, and S. B. Fawcett. 1993. A methodology for monitoring and evaluating community
health coalitions. Health Education Research 8(3):403-416.
GAO (Government Accountability Office). 2013. Program evaluation: Strategies to facilitate agencies’ use of evalua-
tion in program management and policy making. Washington, DC: GAO-13-570.
Ginsburg, A., and N. Rhett. 2003. Building a better body of evidence: New opportunities to strengthen evaluation
utilization. American Journal of Evaluation 24(4):489-498.

Copyright © National Academy of Sciences. All rights reserved.
Evaluating Obesity Prevention Efforts: A Plan for Measuring Progress
Evaluating Obesity Prevention Efforts68
Glasgow, R. E., L. W. Green, L. M. Klesges, D. B. Abrams, E. B. Fisher, M. G. Goldstein, L. L. Hayman, J. K.
Ockene, and C. Tracy Orleans. 2006. External validity: We need to do more. Annals of Behavioral Medicine
31(2):105-108.
Gortmaker, S. L., B. A. Swinburn, D. Levy, R. Carter, P. L. Mabry, D. T. Finegood, T. Huang, T. Marsh, and M. L.
Moodie. 2011. Changing the future of obesity: Science, policy, and action. Lancet 378(9793):838-847.
Green, L. W., and R. E. Glasgow. 2006. Evaluating the relevance, generalization, and applicability of research: Issues
in external validation and translation methodology. Evaluation and the Health Professions 29(1):126-153.
Green, L. W., and M. W. Kreuter. 2005. Health promotion planning: An educational and ecological approach.
4th ed. New York: McGraw-Hill.
Green, L. W., and M. Nasser. 2012. Attention to external validity. In Dissemination and implementation research in
health: Translating science to practice, edited by R. Brownson, G. Colditz, and E. Parker. New York: Oxford
University Press. Pp. 305-326.
Green, L. W., F. L. Brancati, and A. Albright. 2012. Primary prevention of type 2 diabetes: Integrative public health
and primary care opportunities, challenges and strategies. Family Practice 29(Suppl 1):i13-i23.
Grob, G. F. 2010. Writing for impact. In Handbook of practical program evaluation, 3rd ed., edited by J. S. Wholey,
H. P. Hatry, and K. E. Newcomber. San Francisco, CA: Jossey-Bass. Pp. 594-619.
Gruber, K. J., and L. A. Haldeman. 2009. Using the family to combat childhood and adult obesity. Preventing
Chronic Disease 6(3):A106.
Haboush, A., T. Phebus, D. Tanata Ashby, H. zaikina-Montgomery, and K. Kindig. 2011. Still unhealthy 2009:
Building community research to identify risk factors and health outcomes in childhood obesity. Journal of
Community Health 36(1):111-120.
Hallfors, D., H. Cho, D. Livert, and C. Kadushin. 2002. Fighting back against substance abuse: Are community
coalitions winning? American Journal of Preventive Medicine 23(4):237-245.
Harper, M. 2013. Teaming up against obesity. Boston Globe, January 14, 2013.
Henderson, T., M. Rader, B. Sorte, M. M. Ratcliffe, A. Lawrence, J. Lucky, and C. Harris. 2011. Health impact
assessment: Farm to school and school garden policy, HB 2800. Upstream Public Health and the Health
Impact Project.
Henry, G. T., and M. M. Mark. 2003. Beyond use: Understanding evaluation’s influence on attitudes and actions.
American Journal of Evaluation 24(3):293-314.
Hirschman, J., and J. F. Chriqui. 2012. School food and nutrition policy, monitoring and evaluation in the USA.
Public Health Nutrition 16(6):982-998.
International Development Research Centre. 2008. The two-pager: Writing a policy brief. In The RM knowledge
translation toolkit: A resource for researchers. Ottawa, Canada: International Development Research Centre.
Chapter 8.
IOM (Institute of Medicine). 2004. Preventing childhood obesity: Health in the balance. Washington, DC: The
National Academies Press.
IOM. 2008. School meals: Building blocks for healthy children. Washington, DC: The National Academies Press.
IOM. 2009a. Community perspectives on obesity prevention in children: Workshop summaries. Washington, DC:
The National Academies Press.
IOM. 2009b. Local government actions to prevent childhood obesity. Washington, DC: The National Academies
Press.
IOM. 2010. Bridging the evidence gap in obesity prevention: A framework to inform decision making. Washington,
DC: The National Academies Press.
IOM. 2012a. Accelerating progress in obesity prevention: Solving the weight of the nation. Washington, DC: The
National Academies Press.

Copyright © National Academy of Sciences. All rights reserved.
Evaluating Obesity Prevention Efforts: A Plan for Measuring Progress
69Improving the Usefulness of Obesity Evaluation Information to Potential Users
IOM. 2012b. An integrated framework for assessing the value of community-based prevention. Washington, DC:
The National Academies Press.
IOM. 2012c. Evaluating progress of obesity prevention efforts: What does the field need to know? Public Session
of the Committee on Evaluating Progress of Obesity Prevention Efforts. October 12, 2012, Washington,
DC. Audio available at: http://www.iom.edu/Activities/Nutrition/EvaluatingProgressObesityPrevention/2012-
OCT-12.aspx (accessed November 11, 2013).
Israel, B. A., E. Eng, A. J. Schulz, and E. A. Parker. 2012. Methods for community-based participatory research for
health. 2nd ed. San Francisco, CA: Jossey-Bass.
Jagosh, J., A. C. Macaulay, P. Pluye, J. Salsberg, P. L. Bush, J. Henderson, E. Sirett, G. Wong, M. Cargo, C. P.
Herbert, S. D. Seifer, L. W. Green, and T. Greenhalgh. 2012. Uncovering the benefits of participatory research:
Implications of a realist review for health research and practice. Milbank Quarterly 90(2):311-346.
Johnson, K., L. O. Greenseid, S. A. Toal, J. A. King, F. Lawrenz, and B. Volkov. 2009. Research on evaluation use. A
review of the empirical literature from 1986 to 2005. American Journal of Evaluation 30(3):377-410.
Jones, E., A. A. Eyler, L. Nguyen, J. Kong, R. C. Brownson, and J. H. Bailey. 2012. It’s all in the lens: Differences in
views on obesity prevention between advocates and policy makers. Childhood Obesity 8(3):243-250.
Kahn-Marshall, J. L., and M. P. Gallant. 2012. Making healthy behaviors the easy choice for employees: A review
of the literature on environmental and policy changes in worksite health promotion. Health Education and
Behavior 39(6):752-776.
Kettel Khan, L. K., K. Sobush, D. Keener, K. Goodman, A. Lowry, J. Kakietek, and S. zaro. 2009. Recommended
community strategies and measurements to prevent obesity in the United States. MMWR Recommendations
and Reports 58(RR-7):1-26.
Kids’ Safe & Healthful Foods Project. 2012. Health impact assessment: National nutrition standards for snack and
a la carte foods and beverages sold in schools. http://www.pewhealth.org/uploadedFiles/PHG/Content_Level_
Pages/Reports/KS%20HIA_FULL%20Report%20062212_WEB%20FINAL-v2.pdf (accessed June 27, 2013).
Kingdon, J. 2011. Agendas, alternatives, and public policies. New York: Longman Publishing Group.
Kirkhart, K. E. 2000. Reconceptualizing evaluation use: An integrated theory of influence. New Directions for
Evaluation (88):5-23.
Kirkpatrick, S. I., and L. McIntyre. 2009. The Chief Public Health Officer’s report on health inequalities: What are the
implications for public health practitioners and researchers? Canadian Journal of Public Health 100(2):93-95.
Kohl, H. W., 3rd, S. B. Satinsky, G. P. Whitfield, and K. R. Evenson. 2013. All health is local: State and local
planning for physical activity promotion. Journal of Public Health Management and Practice 19(3 Suppl
1):S17-S22.
Labin, S. N., J. L. Duffy, D. C. Meyers, A. Wandersman, and C. A. Lesesne. 2012. A research synthesis of the evalua-
tion capacity building literature. American Journal of Evaluation 33(3):307-338.
Lebel, A., M. Cantinotti, R. Pampalon, M. Theriault, L. A. Smith, and A. M. Hamelin. 2011. Concept mapping of
diet and physical activity: Uncovering local stakeholders perception in the Quebec City region. Social Science
and Medicine 72(3):439-445.
Let’s Move. 2013. Let’s Move. America’s move to raise a healthier generation of kids. http://www.letsmove.gov
(accessed June 3, 2013).
Leverence, R. R., R. L. Williams, A. Sussman, and B. F. Crabtree. 2007. Obesity counseling and guidelines in primary
care: A qualitative study. American Journal of Preventive Medicine 32(4):334-339.
Leviton, L. C. 1987. The yield from cardiovascular risk reduction at the work place. Journal of Occupational
Medicine 29(12):931-936.
Leviton, L. C. 2001. External validity. In International encyclopedia of the social and behavioral sciences. 1st ed,
edited by N. J. Smelser and P. B. Baltes. Oxford: Elsevier.

Copyright © National Academy of Sciences. All rights reserved.
Evaluating Obesity Prevention Efforts: A Plan for Measuring Progress
Evaluating Obesity Prevention Efforts70
Leviton, L. C. 2003. Evaluation use: Advances, challenges and applications. American Journal of Evaluation
24(4):525-535.
Leviton, L. C., and R. F. Boruch. 1983. Contributions of evaluation to education programs and policy. Evaluation
Review 7(5):563-598.
Leviton, L. C., and E. F. X. Hughes. 1981. Research on the utilization of evaluations. A review and synthesis.
Evaluation Review 5(4):525-548.
Leviton, L. C., L. Kettel Khan, and N. Dawkins. 2010a. Editors notes. In The systematic screening and assessment
method: Finding innovations worth evaluating, edited by L. C. Leviton, L. Kettel Khan, and N. Dawkins. New
Directions in Evaluation 2010(125):1-5.
Leviton, L. C., L. K. Khan, D. Rog, N. Dawkins, and D. Cotton. 2010b. Evaluability assessment to improve public
health policies, programs, and practices. Annual Review of Public Health 31(1):213-233.
Lindblom, C. E., and D. K. Cohen. 1979. Usable knowledge: Social science and social problem solving. New Haven,
CT: Yale University.
Litt, J., H. Reed, S. G. zieff, R. G. Tabak, A. A. Eyler, N. O. Tompkins, R. Lyn, J. Gustat, K. V. Goins, and
D. Bornstein. 2013. Advancing environmental and policy change through active living collaboratives:
Compositional and stakeholder engagement correlates of group effectiveness. Journal of Public Health
Management and Practice 19(3 Suppl 1):S49-S57.
Mason, M., R. Schmidt, C. Gizzi, and S. Ramsey. 2010. Taking improvement action based on performance results:
Washington State’s experience. Journal of Public Health Management and Practice 16(1):24-31.
Mattke, S., H. Liu, J. P. Caloyeras, C. Y. Huang, K. R. Van Busum, D. Khodyakov, and V. Shier. 2013. Workplace
wellness programs study: Final report. Santa Monica, CA: RAND.
McPherson, M. E., R. Mirkin, P. N. Heatherley, and C. J. Homer. 2012. Educating health care professionals in advo-
cacy for childhood obesity prevention in their communities: Integrating public health and primary care in the
Be Our Voice project. American Journal of Public Health 102(8):e37-e43.
Myers, S., and M. A. Stoto. 2006. Criteria for assessing the usefulness of community health assessments: A literature
review. Santa Monica, CA: RAND Corporation.
National Association for Family Child Care. 2013. Quality standards for NAFCC accreditation update 2013. http://
nafcc.org/media/pdf/accreditation/QS-date2013.pdf (accessed May 24, 2013).
National Initiative for Children’s Healthcare Quality. 2013. Obesity. http://www.nichq.org/areas_of_focus/childhood_
obesity_topic.html (accessed March 12, 2013).
NIH (National Institutes of Health). 2013. NIH roadmap for medical research. http://www.nei.nih.gov/funding/
roadmap.asp (accessed January 2, 2013).
NRC (National Research Council). 2012. Using science as evidence in public policy. Washington, DC: The National
Academies Press.
Ohri-Vachaspati, P., and L. C. Leviton. 2010. Measuring food environments: A guide to available instruments.
American Journal of Health Promotion 24(6):410-426.
Ottoson, J. M. 2009. Knowledge-for-action theories in evaluation: Knowledge utilization, diffusion, implementa-
tion, transfer, and translation. In Knowledge utilization, diffusion, implementation, transfer, and translation:
Implications for evaluation. New Directions for Evaluation 124:7-20.
Ottoson, J. M., A. G. Ramirez, L. W. Green, and K. J. Gallion. 2013. Using a wider lens than legislation when evalu-
ating whether a public health research or advocacy project has contributed to policy: The Salud America!
Experience. American Journal of Preventive Medicine 44(3):S282-S289.
Patton, M. Q. 1997. Utilization-focused evaluation: The new century text. 3rd ed. Thousand Oaks, CA: Sage
Publications.
Patton, M. Q. 2008. Utilization-focused evaluation. 4th ed. Thousand Oaks, CA: Sage Publications.

Copyright © National Academy of Sciences. All rights reserved.
Evaluating Obesity Prevention Efforts: A Plan for Measuring Progress
71Improving the Usefulness of Obesity Evaluation Information to Potential Users
Powell, L. H., J. E. Calvin 3rd, and J. E. Calvin, Jr. 2007. Effective obesity treatments. American Psychologist
62(3):234-246.
Preskill, H., and N. A. Jones. 2009. Practical guide for engaging stakeholders in developing evaluation questions.
Princeton, NJ: Robert Wood Johnson Foundation.
Pronk, N. P., and T. E. Kottke. 2013. Health promotion in health systems. In Lifestyle medicine. 2nd ed, edited by
J. M. Ripper. Hoboken, NJ: CRC Press. Pp. 1311-1326.
Pronk, N. P., S. M. Krebs-Smith, D. A. Galuska, B. Liu, R. F. Kushner, R. P. Troiano, S. B. Clauser, R. Ballard-
Barbash, and A. W. Smith. 2012. Knowledge of energy balance guidelines and associated clinical care prac-
tices: The U.S. National Survey of Energy Balance Related Care among Primary Care Physicians. Preventive
Medicine 55(1):28-33.
Rodgers, G. P., and F. S. Collins. 2012. The next generation of obesity research: No time to waste. Journal of the
American Medical Association 308(11):1095-1096.
Rogers, E. M. 2003. Diffusion of innovations. 5th ed. New York: The Free Press.
Ross, R. K., R. J. Baxter, M. Standish, L. S. Solomon, M. K. Jhawar, P. M. Schwartz, G. R. Flores, and J. Nudelman.
2010. Community approaches to preventing obesity in California. American Journal of Public Health
100(11):2023-2025.
Rossi, P. H., M. W. Lipsey, and H. E. Freeman. 2004. Evaluation: A systematic approach. 7th ed. Newbury Park,
CA: Sage Publications.
RWJF (Robert Wood Johnson Foundation). 2009a. Evaluation of communities creating healthy environments. http://
www.rwjf.org/en/research-publications/find-rwjf-research/2009/09/evaluation-of-communities-creating-healthy-
environments.html (accessed March 21, 2013).
RWJF. 2009b. Evaluation of local funding partnerships: Analyzing the factors that influence sustainability and rep-
lication of projects after funding ends. http://www.rwjf.org/pr/product.jsp?id=38411 (accessed September 7,
2012).
RWJF. 2013. Healthy kids, healthy communities. http://www.healthykidshealthycommunities.org (accessed April 10,
2013).
Samuels, S. E., S. Lawrence Bullock, G. Woodward-Lopez, S. E. Clark, J. Kao, L. Craypo, J. Barry, and P. B.
Crawford. 2009. To what extent have high schools in California been able to implement state-mandated nutri-
tion standards? Journal of Adolescent Health 45(3):S38-S44.
Samuels, S. E., K. S. Hutchinson, L. Craypo, J. Barry, and S. L. Bullock. 2010. Implementation of California state
school competitive food and beverage standards. Journal of School Health 80(12):581-587.
Scheirer, M. A., and J. W. Dearing. 2011. An agenda for research on the sustainability of public health programs.
American Journal of Public Health 101(11):2059-2067.
Scriven, M. 1991. Evaluation thesaurus. Newbury Park, CA: Sage Publications.
Shadish, W. R., T. D. Cook, and L. C. Leviton. 1990. Foundations of program evaluation: Theories of practice.
Newbury Park, CA: Sage Publications.
Smith, A. W., L. A. Borowski, B. Liu, D. A. Galuska, C. Signore, C. Klabunde, T. T. Huang, S. M. Krebs-Smith, E.
Frank, N. Pronk, and R. Ballard-Barbash. 2011a. U.S. primary care physicians diet-, physical activity-, and
weight-related care of adult patients. American Journal of Preventive Medicine 41(1):33-42.
Smith, L., C. Goranson, J. Bryon, B. Kerker, and C. Nonas. 2011b. Developing a supermarket need index. In
Geospatial analysis of environmental health, edited by J. A. Maantay and S. McLafferty. Geotechnologies and
the environment, Springer Vol. 4. Pp. 205-221.
Solet, D., S. Ciske, R. Gaonkar, K. Horsley, M. McNees, P. Nandi, and J. W. Krieger. 2009. Effective commu-
nity health assessments in King County, Washington. Journal of Public Health Management and Practice
15(1):33-40.

Copyright © National Academy of Sciences. All rights reserved.
Evaluating Obesity Prevention Efforts: A Plan for Measuring Progress
Evaluating Obesity Prevention Efforts72
Sorian, R., and T. Baugh. 2002. Power of information: Closing the gap between research and policy. Health Affairs
21(2):264-273.
Spice, C., and K. Snyder. 2009. Reviewing self-reported impacts of community health assessment in local health juris-
dictions. Journal of Public Health Management and Practice 15(1):18-23.
Stamatakis, K. A., T. D. McBride, and R. C. Brownson. 2010. Communicating prevention messages to policy makers:
The role of stories in promoting physical activity. Journal of Physical Activity and Health 7(Suppl 1):S99-S107.
Stead, L. F., G. Bergson, and T. Lancaster. 2008. Physician advice for smoking cessation. Cochrane Database of
Systematic Reviews (2):CD000165.
Stoto, M. A., S. G. Straus, C. Bohn, and P. Irani. 2009. A web-based tool for assessing and improving the usefulness
of community health assessments. Journal of Public Health Management and Practice 15(1):10-17.
The Child and Adolescent Health Measurement Initiative. 2012. Data Resource Center for Child and Adolescent
Health. http://www.childhealthdata.org (accessed April 4, 2013).
The Community Guide. 2012. Obesity prevention and control. http://www.thecommunityguide.org/obesity/index.
html (accessed May 24, 2013).
The White House Office. 2010. Presidential memorandum: Establishing a task force on childhood obesity. http://
www.whitehouse.gov/the-press-office/presidential-memorandum-establishing-a-task-force-childhood-obesity
(accessed June 3, 2013).
USDA (U.S. Department of Agriculture). 2010. Food and Fitness Initiative. http://www.nifa.usda.gov/nea/food/
in_focus/health_if_food_fitness_initiative.html (accessed April 10, 2013).
USDA. 2013. National school lunch program and school breakfast program: Nutrition standards for all foods
sold in school as required by the Healthy, Hunger-Free Kids Act of 2010, proposed rule. Federal Register
78(27):9530-9567.
Vandenbroeck, P., J. Goossens, and M. Clemens. 2007. Foresight tackling obesities: Future choices—building the
obesity system map. London, UK: Government Office for Science.
Wagenaar, A. C., A. L. Tobler, and K. A. Komro. 2010. Effects of alcohol tax and price policies on morbidity and
mortality: A systematic review. American Journal of Public Health 100(11):2270-2278.
Weiss, C. 1977. Research for policy’s sake: The enlightenment function of social research. Policy Analysis
3(4):531-545.
Weiss, C. H. 1988. Evaluation for decisions: Is anybody there? Does anybody care? Evaluation Practice 9(1):5-19.
Yarbrough, D. B., L. M. Shulha, R. K. Hobson, and F. A. Caruthers. 2011. The program evaluation standards. A
guide for evaluators and evaluation users. 3rd ed. Thousand Oaks, CA: Sage Publications.
YMCA. 2011. First-ever national healthy eating and physical activity standards developed for afterschool programs.
http://www.ymca.net/news-releases/20110809-afterschool-standards.html (accessed May 24, 2013).

Copyright © National Academy of Sciences. All rights reserved.
Evaluating Obesity Prevention Efforts: A Plan for Measuring Progress
73
3Framework for Evaluation
Why: Why is a framework important to evaluation? A framework offers signposts for guiding the complex work of evaluation. It highlights the context, activities, and intended outcomes of evaluating progress in obesity prevention efforts.
What: What can be accomplished through this evaluation framework? The framework can help to guide the collection and analysis of data to inform progress and links these data to the planning and implementation of policies and programs.
How: How will the components of the evaluation framework be implemented? Of the components outlined in the framework, the Committee report recommends guiding principles, indicators of success, plans for national, state, and community evaluation, and improvements to the evaluation infrastructure.
The vision for evaluating progress in obesity prevention is clear: Assure timely and meaningful col-lection and analysis of data to inform progress in obesity prevention efforts at national, state, and
community levels. However, realizing that vision requires hard choices: who will measure what, under what conditions, by what methods, at what costs, and for which user of evaluation information. Assets exist to build on, for example, our understanding of user needs, existing health objectives for the nation, an extensive literature and experience in program evaluation methods, and prior studies on accelerating progress in obesity prevention. The Committee identified several gaps, including a lack of guidance for core indicators and measures of success and lack of support systems for implementing evaluation activities at community, state, and national levels. In this chapter the term evaluation (or evaluation activities or efforts) will be used to include assessment, monitoring, surveillance, and summative evaluation.
Others have identified and reviewed models linking program and policy planning, implementation, and the various forms of evaluation associated with them (Gaglio and Glasgow, 2012; Green and Kreuter, 2005; IOM, 2010, 2012b; Tabak et al., 2012). The common element in these examples is their inclusion of or explicit focus on evaluation to inform decision making. Reviewing these and other models, in this

Copyright © National Academy of Sciences. All rights reserved.
Evaluating Obesity Prevention Efforts: A Plan for Measuring Progress
Evaluating Obesity Prevention Efforts74
chapter, the Committee presents a framework for getting from here to there: from our current context of unmet user and end user needs to desired outcomes—improved evaluation activities and data use in efforts to reduce obesity and improve population health and health equity. Figure 3-1 depicts the iterative and interactive process by which we can improve the nature and contribution of evaluation efforts. In the sections that follow, key issues and stepping stones for realizing that vision are outlined in these compo-nents of the framework: Inputs, Activities, Outputs, Outcomes, and Impacts.
COMPONENTS OF ThE EVALUATION FRAMEwORk
Inputs
Inputs are the resources used to accomplish a set of activities and are considerations influencing the choice of interventions or activities. They are discovered, described, and quantified through the assess-ment phase of evaluation, and are the activities tracked through their implementation during the moni-toring phase of evaluation. Inputs can include needs, priorities, and other contextual factors, such as demographics and available resources, relevant to the activities. To realize the vision of timely and mean-ingful collection and analysis of data for informing and improving obesity prevention efforts, key inputs include attention to (1) user/stakeholder needs and those of the population served (see Chapter 2 on user needs, and Chapter 7 on community assessment and surveillance); (2) existing objectives and strategies; (3) the context for evaluation; (4) guiding principles for evaluation; and (5) resources to support the activ-ities (see Figure 3-1).
User/Stakeholder Needs
As detailed in Chapter 2, users and stakeholders refer to a broad and diverse group: essentially, anyone working at any level (federal, state, or community) who is involved in funding, recommending, legislating, mandating, designing, implementing, or evaluating obesity prevention policies or programs, or applying the information that comes from these evaluations. Their expressed needs and interests must be considered throughout the evaluation process to determine what to measure and how to implement, adapt, and use the data from the evaluation.
To more fully understand user needs, the Committee consulted a range of end users representing various sectors engaged in obesity prevention efforts, including those working in health organizations, government at multiple levels, business, health care, schools, communities, and academia (see Preface, Chapter 2, and workshop agenda in Appendix I for an acknowledgment of individuals consulted). The need most commonly endorsed was to know “what works” in preventing obesity: which programs and policies, singly and in combination, show evidence of effectiveness in changing behaviors and outcomes. Obesity is a complex problem, affecting the full range of age, socioeconomic, and racial/ethnic groups. As such, a single simple solution to fit all contexts will not be found.
End users, therefore, want three things: (1) evidence-based guidance in selecting the combina-tion of interventions to have a greater collective impact, (2) evidence-based guidance that is informed by diffusion principles (e.g., an intervention’s complexity, relative advantage, or cost [Rogers, 2003]), and (3) processes for adding, adapting, and evaluating other promising interventions where evidence is not so firm or generalizable. These are important insofar as evidence-based practices were typically

Copyright © National Academy of Sciences. All rights reserved.
Evaluating Obesity Prevention Efforts: A Plan for Measuring Progress
75
Fig
ure
3-1.
eps
broa
dsid
e
Eva
luat
ing
Pro
gres
s of
Obe
sity
Pre
vent
ion
Effo
rts
Vis
ion
: A
ssur
e tim
ely
and
mea
ning
ful c
olle
ctio
n an
d an
alys
is o
f dat
a to
info
rm a
nd im
prov
e ob
esity
pre
vent
ion
effo
rts
at n
atio
nal,
stat
e, a
nd c
omm
unity
leve
ls.
INP
UT
SIM
PA
CT
S
Long
-Ter
m
Shor
t-Ter
m
OU
TP
UT
SO
UT
CO
ME
S
Exis
ting
Obj
ectiv
es &
Stra
tegi
es:
•H
ealth
y Pe
ople
202
0•
Acce
lera
ting
Prog
ress
in O
besi
ty P
reve
ntio
n•
Rec
omm
ende
d St
rate
gies
(e.g
., C
OC
OM
O,
Com
mun
ity G
uide
to P
reve
ntiv
e Se
rvic
es)
•N
atio
nal P
reve
ntio
n St
rate
gy•
Oth
ers
AC
TIV
ITIE
S
Inte
rmed
iate
-Ter
m
User
/Sta
keho
lder
Nee
ds:
•Se
lect
wha
t to
mea
sure
•D
eter
min
e w
hat w
orks
•Im
plem
ent w
hat w
orks
•H
ow to
eva
luat
e•
How
to u
se d
ata
Deve
lop
Eval
uatio
na Pla
ns a
nd In
frast
ruct
ure:
•N
atio
nal a
nd s
tate
leve
l •
Loca
l com
mun
ity le
vel
Deve
lop
Reso
urce
s fo
r Tra
inin
g, T
echn
ical
As
sist
ance
, and
Dis
sem
inat
ion:
•C
urric
ula
•Pr
oduc
ts/p
roto
cols
/tem
plat
es•
Web
-bas
ed s
uppo
rt an
d tra
inin
g•
Cle
arin
ghou
ses
for m
easu
res
•C
omm
unic
atio
ns
Impr
oved
Phy
sica
l an
d So
cial
En
viro
nmen
ts a
nd
Polic
ies:
•Phy
sica
l act
ivity
•Foo
d an
d be
vera
ge•M
essa
ge•H
ealth
car
e/W
orks
ites
•Sch
ool/C
hild
car
e•S
yste
ms-
leve
l Prev
alen
ce a
nd In
ciden
ce
Impr
oved
Pop
ulat
ion
Heal
th a
nd W
ell-B
eing
Incr
ease
d Ev
alua
tiona A
ctiv
ities
:•
Syst
em-w
ide
use
of e
vide
nce
and
prac
tice-
base
d in
terv
entio
ns a
nd p
olic
ies
•Ti
mel
y an
d us
eful
eva
luat
ions
•Ed
ucat
ion
of w
orkf
orce
for e
valu
atio
n•
Mon
itorin
g of
cha
nges
in p
olic
ies,
pro
gram
s, b
uilt
envi
ronm
ent,
and
syst
ems
•M
onito
ring
of im
plem
enta
tion
and
inte
nsity
of
com
mun
ity p
rogr
ams/
polic
ies
(e.g
., st
reng
th,
dura
tion,
reac
h, s
usta
inab
ility)
Impr
oved
Eva
luat
iona C
apac
ity a
nd
Infra
stru
ctur
e:•
Awar
enes
s of
val
ue a
nd u
ses
of
asse
ssm
ent/s
urve
illanc
e/ev
alua
tion
•Ad
optio
n of
reco
mm
ende
d co
re m
easu
res
•U
sefu
l dat
a (lo
cal,
trend
s, c
ompa
rabl
e)
•En
gage
men
t of s
take
hold
ers
•R
esou
rces
dev
oted
to
asse
ssm
ent/s
urve
illanc
e/ev
alua
tion
•U
se o
f web
-bas
ed s
uppo
rts fo
r im
plem
enta
tion
Impr
oved
Hea
lthEq
uity
Incr
ease
d En
ergy
Exp
endi
ture
and
Decr
ease
d En
ergy
Inta
ke
Enha
nced
Dat
a Us
e:•
Wid
er a
dopt
ion
and
mor
e ef
fect
ive
use
of
surv
eilla
nce
and
eval
uatio
n da
ta a
t nat
iona
l, st
ate,
an
d lo
cal c
omm
unity
leve
ls•
Use
kno
wle
dge
to u
nder
stan
d an
d im
prov
e ob
esity
pr
even
tion
effo
rts
Impr
oved
Be
havi
ors:
•Phy
sica
l ac
tivity
/inac
tivity
•Die
t•O
ther
obe
sity
-rela
ted
beha
vior
s an
d so
cial
no
rms
Iden
tify
Indi
cato
rs/M
easu
res
of S
ucce
ss:
•As
sess
gap
s in
indi
cato
rs/m
easu
res
and
sour
ces/
syst
ems
•D
evel
op s
et o
f cor
e in
dica
tors
•St
anda
rdiz
e m
easu
res
for a
sses
sing
pr
ogre
ss a
nd in
equi
ties
Cont
ext f
or E
valu
atio
na :•
Indi
cato
rs/m
easu
res
of v
aryi
ng q
ualit
y an
d ut
ility
•Un
conn
ecte
d da
ta s
yste
ms
•M
ulti-
com
pone
nt, m
ulti-
sect
or, a
nd m
ulti-
leve
l in
terv
entio
ns•
Lim
ited
mea
sure
s of
ineq
uity
•Ac
adem
ic, c
omm
unity
, and
fund
ing
partn
ers
•Va
ryin
g ca
paci
ty, c
apab
ilitie
s, le
ader
ship
, and
re
sour
ces
Redu
ced
Ove
rwei
ght/O
besit
y
Mul
ti-se
ctor
/-lev
el
Partn
ersh
ips
Gui
ding
Prin
cipl
es fo
r Eva
luat
iona
Reso
urce
s
Reco
mm
enda
tions
and
Gui
danc
e:•
Surv
eilla
nce
met
hods
•Pr
otoc
ols
for c
omm
unity
and
sys
tem
s-le
vel
eval
uatio
n•
Mea
sure
s of
hea
lth e
quity
•C
onte
xt-/s
ettin
g-sp
ecifi
c m
easu
res
•Ev
alua
tion
crite
ria a
nd d
ecis
ion
tree
Supp
ort f
or Im
plem
enta
tion:
•U
sing
dat
a to
info
rm in
terv
entio
n an
d po
licy
desi
gn
and
deci
sion
mak
ing
•U
sing
dat
a to
mon
itor i
nter
vent
ion/
polic
y im
plem
enta
tion
and
prog
ress
•U
sing
dat
a to
mea
sure
a c
ontin
uum
of
outc
omes
/impa
cts
•Pa
rtici
pato
ry e
valu
atio
n to
eng
age
stak
ehol
ders
•
Cas
e ex
ampl
es in
div
erse
con
text
s
Core
Indi
cato
rs a
nd M
easu
res:
•En
viro
nmen
tal c
hang
es (e
.g.,
prog
ram
s, p
olic
ies,
sy
stem
s, in
frast
ruct
ure)
•Be
havi
ors
•W
eigh
t/obe
sity
•
Res
ourc
es/in
vest
men
t
FIG
URE
3-1
Fra
mew
ork
for e
valu
atin
g pr
ogre
ss o
f obe
sity
pre
vent
ion
effo
rts.
NOT
E: C
OCO
MO
= C
omm
on C
omm
unity
Mea
sure
s fo
r Obe
sity
Pre
vent
ion.
a Ev
alua
tion
refe
rs to
ass
essm
ent,
mon
itorin
g, s
urve
illan
ce, a
nd s
umm
ativ
e ev
alua
tion
activ
ities
.

Copyright © National Academy of Sciences. All rights reserved.
Evaluating Obesity Prevention Efforts: A Plan for Measuring Progress
Evaluating Obesity Prevention Efforts76
demonstrated to be effective under high-resourced conditions of scientific studies, not the low-resourced conditions typically present in communities and settings where they would be implemented (Green and Glasgow, 2006).
To increase the chances for achieving and detecting success in their context, users also need informa-tion on how to track essential components and elements of the intervention (what to implement and how to do so) and how to measure the continuum of outcomes and impacts relevant to their work. Finally, users also expressed the need to understand how to obtain and use evaluation-related data more strategi-cally to inform and justify their obesity prevention efforts (see Chapter 2).
In addition to the expressed needs of those evaluation users who are serving existing programs nationally and some locally, the Committee addresses in Chapter 7 the processes by which community-level efforts in obesity control can undertake a community assessment of the status of their obesity-related problems, assets, and resources, and to put in place surveillance measures of progress to assess trends and progress in meeting their needs.
Existing Objectives and Strategies
Recommended, ideally quantified, objectives for obesity prevention provide clarity and specificity in what to expect from the obesity prevention interventions (policies, programs, services, or environmen-tal changes) as they are evaluated. The Committee focused on sources of national and community health efforts, including Healthy People 2020 (HHS, 2010b), the Institute of Medicine’s (IOM’s) Accelerating Progress in Obesity Prevention (APOP) report (IOM, 2012a), the associated Measuring Progress in Obesity Prevention: Workshop Report (IOM, 2012d) and the Bridging the Evidence Gap in Obesity Prevention report (IOM, 2010). It also drew on the Centers for Disease Control and Prevention’s (CDC’s) work on the Common Community Measures for Obesity Prevention Project (the Measure Project) (Kettel Khan et al., 2009) and on the periodically updated Guide to Community Preventive Services1 from sys-tematic reviews and recommendations of the Community Preventive Services Task Force. It consulted Bright Futures Guidelines (AAP, 2008) and the National Prevention Strategy (NPC, 2011) for well child care. Many of these quantitative goals can be regarded as “stretch objectives”; that is, they reflect what could be accomplished nationally or locally if what is already known is applied. An additional task for evaluation and measurement of progress is to discover needs, reasonable objectives, and promising interventions from innovations emerging in states and communities as they scramble to address the obe-sity epidemic in the absence of complete scientific evidence of the needs, problems, and effectiveness of interventions.
Healthy People 2020, the result of a federal interagency effort led by the Department of Health and Human Services, with voluntary, private, state, and community government input, outlines national objec-tives for improving the health of Americans, including those related to physical activity, nutrition, weight status, and maternal and child health (HHS, 2010b). The IOM Committee report (2012a) on APOP provided more specific system-wide goals and strategies to prevent obesity as well as guidance about indicators of progress in implementing the recommended actions at national and community levels. Five critical, cross-cutting areas of focus were identified for intervention: physical activity environments; food
1 For more information about the Guide to Community Preventive Services, see http://www.thecommunityguide.org (accessed November 11, 2013).

Copyright © National Academy of Sciences. All rights reserved.
Evaluating Obesity Prevention Efforts: A Plan for Measuring Progress
77Framework for Evaluation
and beverage environments; message environments; health care and workplace environments; and school environments.
In 2009, the Measures Project, led by CDC, released recommendations for 24 community-based strategies for obesity prevention along with an associated indicator, data collection questions, and poten-tial data sources to track progress on each strategy (Kettel Khan et al., 2009). Strategies were grouped into six categories: food and beverage availability; healthful food and beverage options; breastfeeding support; physical activity promotion and limiting sedentary activity among children and youth; commu-nity safety to support physical activity; and community coalitions for creating change in the key environ-ments. Also, CDC’s Guide to Community Preventive Services provides timely updates to evidence-based recommendations for action on an array of public health issues, including nutrition, physical activity, and obesity prevention (Task Force on Community Preventive Services, 2005, 2011; Truman et al., 2000).
The National Prevention Council, under the direction of the Surgeon General, published the National Prevention Strategy (NPC, 2011); priority strategies include healthful eating and active living. For each priority, the Strategy recommends target actions, key indicators, and 10-year goals. Grounded in a science base, the Dietary Guidelines for Americans (HHS, 2010a) and Physical Activity Guidelines for Americans (HHS, 2008) offer similar guidance. Other scientific and professional associations, such as the American Heart Association and the Academy of Nutrition and Dietetics, also provide recommendations for obesity prevention.
Context for Evaluation Activities
Another consideration for evaluation activities is the context in which the interventions to be evaluated will occur. Context closely links with the concept of assessment (baseline data characterizing the problem) and surveillance (ongoing or periodic data collection, analysis, and interpretation). At the national or state levels, assessment might include surveillance to assess changes in obesity rates and moni-toring of policy changes, and summative evaluation assessing the association of the two. At the commu-nity level, assessment might take the form of a system to monitor changes in interventions and the built environment over time.
The context for evaluation activities includes the how much of what, how, by whom, and by when stated in the objectives for each intervention or strategy. The “how much” is stated as a target percent-age, mean, or rate. “What” may be singular or complex, often referring to multiple-component, multi-sector, and multi-level interventions to assure conditions for healthful eating and physical activity (IOM, 2012a). Comprehensive interventions provide challenges for “what” and “how” to evaluate. For a single intervention strategy (e.g., improve the quality of foods and beverages consumed), numerous indicators exist (e.g., consumption of sugar-sweetened beverages, fruits, vegetables, whole grains, lower-fat dairy, etc.). Furthermore, for a single indicator (e.g., consumption of sugar-sweetened beverages or fried foods), many potential measurement methods exist, including review of archival records (e.g., of sales), observa-tions (e.g., food disappearance, plate waste), and behavioral surveys (e.g., food frequency questionnaire, 24-hour recall). Each indicator and its associated measurement vary in quality (accuracy, sensitivity, speci-ficity), utility, and resource requirements. These factors must be considered when offering guidance for how to evaluate. The “by when” aspect of the health objective informs the timing of the evaluation activi-ties, for example, whether annually or at some other time interval, and the anticipated prospect of observ-ing progress after a given interval of time.

Copyright © National Academy of Sciences. All rights reserved.
Evaluating Obesity Prevention Efforts: A Plan for Measuring Progress
Evaluating Obesity Prevention Efforts78
Efficiencies in evaluation activities can be achieved by connecting existing data systems to enable users to share data. For example, when such data are available and there are data sharing agreements, schools collecting weights and heights of children can make body mass index (BMI) data available to communities to help gauge progress in obesity prevention. Similarly, existing vendor sales data can some-times be made publicly available for analysis of the purchase of foods and beverages targeted by interven-tions. A common gap is the lack of data specific to the level at which important intervention or policy decisions need to be made. For instance, there may be useful data at the state level, but not at the county, city, or neighborhood levels in which interventions are occurring and policies are emerging.
Finally, who conducts the evaluation activities is an important aspect of context. The workforce for obesity prevention is as diverse as the sectors engaged in this work; for example, it may include policy makers, urban planners, educators, as well as public health professionals. Academic, community, prac-titioner, and funding partners vary in capacity, capabilities, incentives, leadership, and resources, all of which must be considered in designing and assuring implementation of evaluation plans. Funders of programs and evaluation have called for participatory research and collaborative evaluation in recent years, recognizing the added value of evaluation when those who design and conduct programs and those who have the additional theoretical and measurement skills to interpret the evaluation evidence jointly produce the program and evaluation.
Guiding Principles for Evaluation Activities
The Committee identified Guiding Principles, a key consideration in the activities outlined in the proposed evaluation framework. These principles identify factors to consider when implementing national, state, and community evaluation plans and may be useful to evaluators as they seek to develop and implement their own evaluation studies. As one example, it is important to consider and develop a systematic and effective approach to communicate and provide information about the obesity-related indicators/ measures to the priority population and end users/stakeholders. Consideration of this “dissemi-nation” principle can improve reach, clarity, effectiveness, and timeliness of the results to the appropriate users/stakeholders.
In developing the Guiding Principles, the Committee reviewed existing evaluation principles, includ-ing those developed by the American Evaluation Association (2004), Joint Committee on Standards for Educational Evaluation (JCSEE, 2011), World Health Organization (WHO, 2010), prior IOM reports (IOM, 2009, 2010, 2012b), CDC (CDC, 1999), Glasgow et al. (1999), Fawcett (2002), and Green and Glasgow (2006). As a result of this review given the elements identified in the evaluation framework (see Figure 3-1), the Committee identified the following Guiding Principles (listed alphabetically for ease of presentation):
• Accuracy• Capacity Building• Comparability• Context• Coordination and Partnership• Dissemination• Feasibility

Copyright © National Academy of Sciences. All rights reserved.
Evaluating Obesity Prevention Efforts: A Plan for Measuring Progress
79Framework for Evaluation
• Health Disparities/Equity• Impact• Implementation• Parsimony• Priority Setting• Relevance• Scalability • Surveillance/Assessment• Sustainability• Systems-oriented• Transparency• Utility• Value
Appendix C contains a detailed table of the Guiding Principles, including plain language definitions and examples of end user questions for evaluators to consider relative to each principle.
The Committee deemed it important to recognize that each evaluation is unique and that there is no “one-size-fits-all” approach to incorporating or utilizing the principles for every evaluation planning effort. Rather, in its deliberations related to the national, state, and community plans and its recommenda-tions to evaluators who will implement such plans, the Committee believed it important to balance these principles based on context, end user needs, available resources, and other constraints that may appear. Thus, although important, the principles still need to be adapted to each evaluation’s specific context and needs.
Resources
Human and financial resources, and related supports, for evaluations are currently quite limited (IOM, 2012c). Although 10 to 15 percent of an intervention budget is the recommended set-aside for evaluation by funders of prevention initiatives,2 the percentage very much depends on the context. For example, allocating resources for state or national surveillance systems differs from examining the effects of a grant-funded initiative to promote physical activity and healthy nutrition. Technical support is typi-cally needed for evaluation, including for the core tasks of obtaining end-user input; choosing indicators, measures, and designs; collecting and analyzing data; and ultimately improving the evaluation infrastruc-ture and necessary inputs to support evaluation efforts. Because most evaluations are currently under-resourced and under-supported, the Committee’s recommendations call for expenditures for evaluation that would often result in trade-off decisions by governments and organizations (i.e., between interven-tions with greater reach or dose or stronger evaluations) and with astute use of existing resources and prioritization of other necessary actions implemented with short-, intermediate-, and long-term time perspectives.
2 The 10 to 15 percent set-aside for evaluation resources is a general range found in public and private grant mandates or average operation budgets (nrepp.samhsa.gov/LearningModules.aspx, accessed November 13, 2013).

Copyright © National Academy of Sciences. All rights reserved.
Evaluating Obesity Prevention Efforts: A Plan for Measuring Progress
Evaluating Obesity Prevention Efforts80
Activities
Identify Indicators/Measures of Success
The Committee conducted an exhaustive review of more than 322 potential indicators to identify ways to measure progress in obesity prevention efforts. Each potential indicator was assessed to determine alignment with the Committee’s evaluation framework and the APOP goals and strategies. Furthermore, preference was given to indicators previously reported or recommended by leading national health com-mittees that have undertaken substantial vetting processes prior to development, with priority given to Healthy People 2020 recommended indicators where available. Because Healthy People 2020 indicators do not cover all of the APOP goals and strategies, the Committee also relied on national data sources and recommendations of national advisory committees (e.g., the Community Preventive Services Task Force). When deciding on indicators for inclusion, the Committee gave preference to those that were (1) relevant and closely aligned to the APOP goals and strategies, (2) readily available from existing data sources, (3) measured on a regular basis over time (ideally every 3 years or more frequently), (4) already computed or could be easily computed based on the available data, (5) understandable to evaluators and other deci-sion makers, and (6) associated with objectives that would galvanize action among communities and other stake holders. Ultimately, the Committee recommended 82 indicators of progress.
The evaluation framework also notes the importance of identifying specific measures that evaluators could use to assess progress on a given indicator that is tailored to their evaluation needs. For example, a community evaluator might benefit from guidance on how to adapt a national indicator for use at the community level. Such adaptations may be necessary to fulfill an end user’s interest in seeing a longitudinal indicator of progress for a defined community. Using an example from Healthy People 2020, BMI (self-reported or independently measured) is the specific measure used to monitor the health indicator “reduce the proportion of adults who are obese” and to determine the degree to which the intended outcome—healthy weight in adults—is being met. The Committee saw a pressing need to identify or develop appro-priate measures for each indicator, yet was unable to do so systematically. Instead, the Committee identified examples of measures that are tailored to the national, state, and community plans in Chapters 6, 7, and 8.
Develop Evaluation Plans and Infrastructure
From the outset, in accordance with its statement of task, the Committee aimed to develop two sets of evaluation plans that could serve as guideposts for evaluators and decision makers responsible for developing or funding evaluations to measure progress in obesity prevention. The first evaluation plan, described in detail in Chapter 6, focuses on national evaluations (which may be included in or adapted to state and regional evaluations). The second evaluation plan, described in detail in Chapters 7 and 8, focuses on the community level. The Committee’s rationale for distinguishing national-level evaluations from community-level evaluations rested on several considerations: the nature and extent of surveillance data readily available at the national/state vs. community levels; the resources required to conduct evalua-tions at each level; the likely end users and participants involved in planning, executing, and acting on the evaluation results; and the unique needs of varied communities that would require tailoring or customiza-tion of the evaluation.

Copyright © National Academy of Sciences. All rights reserved.
Evaluating Obesity Prevention Efforts: A Plan for Measuring Progress
81Framework for Evaluation
BOX 3-1 Core Functions of an Infrastructure for Evaluation of Obesity Prevention Efforts
1. Assessment and surveillance of healthy weight prevalence to identify and solve national and commu-nity health problems related to obesity.
2. Diagnose and investigate obesity-promoting conditions and related health problems in the community.
3. Inform, educate, and empower people to use data to take action to promote physical activity, healthful nutrition, and healthy weight.
4. Use participatory methods to monitor and improve community partnerships and collaborative action to promote physical activity and healthful nutrition and to prevent obesity.
5. Evaluate the summative effects of interventions that aim to prevent obesity and promote healthy weight.
6. Monitor enforcement of laws and regulations that promote healthful eating and physical activity and that protect against obesity-promoting conditions.
7. Assure a competent workforce to implement evaluation activities at national and local levels.
8. Monitor and evaluate the effectiveness, accessibility, and quality of programs and policies to promote healthy weight.
9. Support research efforts to gain new insights and innovative approaches to monitor and evaluate efforts to prevent obesity.
10. Support efforts to disseminate new learnings and optimize wide adoption and implementation of the most efficient and effective evaluation methods.
SOURCE: Adapted from CDC, 2010.
Evaluation activities would benefit from an infrastructure to make this work easier and more effec-tive. Consistent with the CDC National Public Health Performance Standards Program,3 core functions and essential services for an evaluation infrastructure for obesity prevention might include capabilities to monitor, diagnose, and investigate (which in this report encompasses assessment and surveillance of the needs and monitoring of the interventions to address them); inform and educate; mobilize; develop poli-cies and plans; enforce; link; assure; evaluate; and research (see Box 3-1 for details).
3 See http://www.cdc.gov/nphpsp (accessed November 11, 2013).

Copyright © National Academy of Sciences. All rights reserved.
Evaluating Obesity Prevention Efforts: A Plan for Measuring Progress
Evaluating Obesity Prevention Efforts82
Enhance Resources for Training, Technical Assistance, and Dissemination of Evaluation Methods
Additional resources and supports for their widespread use are needed to help prepare the workforce for collecting and using data to assess progress in obesity prevention efforts. These include, for example, enhanced curricula in methods of assessment/surveillance and community-based participatory monitoring/summative evaluation. To reflect the diversity of those individuals who conduct and use evaluations, cur-riculum modules on these topics would be offered through multiple relevant disciplines including public health, public administration, education, community nursing, and behavioral and social sciences.
Field-tested protocols for monitoring/summative evaluation, such as CDC’s framework for program evaluation in public health (CDC, 1999), should be more widely available. Chapter 8 presents an adapta-tion of this framework for community monitoring/summative evaluation of obesity prevention efforts. Guiding principles and standards for evaluators, such as those of the American Evaluation Association (2004), also need to be promulgated.
Web-based supports can help to assure free access to practical guidance for developing and imple-menting an evaluation plan; note a further case for this in Chapter 7 and included as a recommended action to improve access to and dissemination of evaluation data in Chapter 10 (Recommendation 4). For example, the open-source Community Tool Box4 offers more than 30 sections on evaluation efforts, each with how-to steps, examples, and PowerPoint presentations that can be adapted for training. These and other Web-based supports could be combined in a “basket of tools” for community assessment/surveil-lance and monitoring/summative evaluation—free and accessible through the Internet, mobile phones, and other means to reach a diverse audience with just-in-time supports for this work.
Clearinghouses for evaluation measures, such as the measures registry of the National Collaborative on Childhood Obesity Research (NCCOR, 2013), offer promise in increasing evaluation capacity in the field. Media communications and case examples of how evaluation activities were used to target and improve obesity prevention efforts can help to enhance their perceived value and widespread use.
In addition, knowledge brokers (Ward et al., 2009)—those whose specialized expertise in assess-ment, monitoring, surveillance, and summative evaluation, communications, and other critical practices in the field—can bridge the gap between what is known about evaluation-related activities and how activi-ties are implemented. Research, training, and consulting groups can serve as critical intermediary orga-nizations to help support state and community efforts to create timely information and use it to inform obesity prevention efforts.
Outputs
To help assure outputs related to these activities, the Committee identified key tasks that govern-mental and other organizations need to engage in to support the assessment, development of consensus on, and more uniform application of a set of core indicators and common measures (see Chapter 4). The Committee also provided recommendations and guidance on methods and protocols for evaluation (see Chapters 5 through 9) and associated supports for the implementation and enhanced data use (see Chapter 10). The following presents an overview of recommended outputs and why they are important to the success of this framework to inform and improve obesity prevention efforts.
4 Available online at http://ctb.ku.edu/en/default.aspx (accessed November 11, 2013).

Copyright © National Academy of Sciences. All rights reserved.
Evaluating Obesity Prevention Efforts: A Plan for Measuring Progress
83Framework for Evaluation
Core Indicators and Common Measures
As part of the National Evaluation Plan proposed in Chapter 6 and using the indicator list identified in Chapter 4, the Committee advises on the need to identify a core set of indicators to evaluate progress at the national level in implementing the APOP strategies. As described in a prior IOM report, four levels of indicators can be used to assess progress: overarching (incidence and prevalence of overweight and obesity), primary (energy expenditure/intake), process (related to policy and environmental strategies), and foundational (disparities, advocacy, coalition building) (IOM, 2012a). Core indicators are intended to help to standardize the target used to assess progress on obesity prevention across the nation, states, and localities. Obesity prevention efforts can be enhanced by the development of core indicators that reflect the continuum of outcomes relevant to obesity prevention, including environmental changes, behaviors, and weight/obesity. The Committee recognized a need in the field to identify or develop related quantifi-able measures for each core indicator.
The Committee found that evaluation users have numerous individual behavioral indicators, but they need guidance on a core set of environmental change outcomes that influence access and availabil-ity of healthful food, beverages, and activity. Guidance for evaluators or evaluation users is particularly needed for
• identifying, prioritizing, or selecting common quantifiable measures sensitive to goals/objectives;• identifying core types and attributes of environmental changes to be measured; • documenting and analyzing the contribution of multiple changes in programs and policies for
collective impact; • accounting for analysis at the level of communities and broader systems; • gauging the type of infrastructure necessary to support monitoring and summative evaluation
activities; • assessing changes in the level of investments that reflect the engagement in and support for
obesity prevention activities; • leveraging networks, identifying leaders, and enabling continuous learning to advance best prac-
tices in obesity prevention; and• identifying and promoting the contributions that institutions, workplaces, and health care can
make to enhance physical activity, nutrition, and healthy weight.
Assessing environmental changes can help evaluation users to identify progress with conditions that influ-ence individual and family choices about diet and physical activity.
Evaluation users need guidance in choosing a core set of indicators and related measures that assess changes in key behaviors of individuals or populations that affect their weight and enhance health in their settings. These behaviors include diet, physical activity, sedentary behavior, and other obesity-related behav-iors and social norms that affect energy balance and risk for obesity. Finally, a core set of indicators and related measures that assess changes in weight and related obesity outcomes (e.g., incidence and prevalence of obesity) will inform and improve obesity prevention efforts. Assessing changes to this type of outcome, whether by individuals or populations, can help to detect progress in reducing risk of developing specific health conditions. These important outputs are included in the evaluation plans recommended in the report.
Copyright © National Academy of Sciences. All rights reserved.
Evaluating Obesity Prevention Efforts: A Plan for Measuring Progress
Evaluating Obesity Prevention Efforts84
Recommendations and Guidance
Throughout the report, the Committee offers recommendations and guidance on priorities for the most appropriate methods and protocols for evaluating obesity prevention efforts (Chapters 4, indicators; Chapter 5, methods and tools for evaluating progress in health equity; Chapter 6, protocols and methods for national efforts; Chapters 7 and 8, protocols and methods for community efforts). These can serve the field by setting priorities for methodological development and strengthening of available data sources. These recommendations also offer guidance on enabling and facilitating ongoing assessment and research at all levels (community, state, national), for varied populations, and in multiple settings and diverse contexts. Consistency in such measurement across settings and over time, with potential for record link-ages, would not only serve the needs of communities for evaluation of their own efforts, but also allow for comparisons between and among jurisdictions, institutions, and populations, to identify the relative effectiveness of their respective policies and programs. Consistency, however, must give way to adapted measures in some settings, populations, and circumstances. Guidance is needed for assuring consistency of appropriate methods of assessments and surveillance; appropriate adaptations for monitoring and summative evaluations at the community and systems levels; and measurement of health equity and the conditions that produce it. Variations in context require adaptation to fit the situations. Decision trees could help to guide choices in implementing protocols for evaluation activities in the face of community resource limitations and differences in context.
Effective assessment and surveillance is necessary for the successful targeting and management of obesity prevention efforts. Choosing the appropriate assessment method depends on the outcome of inter-est. Factors to consider include what information is needed (e.g., is the information relevant to a policy choice), how often does it need to be assessed, and what duration between measurements is necessary to see changes (e.g., short term, intermediate term, long term). In addition, communities have different assets and resources, so each locality must be able to monitor and evaluate obesity prevention activities within those limitations and use the resultant information to inform the broader field. Community-level evalua-tion users need protocols to help to guide evaluation, to make it practical for low-resource environments and to inform the broader effort across the nation. Additionally, consistent with systems science, evalu-ations need to consider the complicated relationships among the outcomes of interest, the diverse set of factors at multiple ecological levels that can influence the outcomes, and the benefits and harms beyond obesity and health that programs and policies might produce (IOM, 2012b).
Although a systems approach is in the early stages of implementation, evaluation users need guid-ance for evaluation and tracking of possible synergies and feedback among obesity prevention activities across multiple sectors and levels (see Chapters 9 and 10). Because of the complexity of identifying, measuring, and monitoring the continuum of outcomes relevant to obesity prevention, it is especially challenging to reach a consensus about assessing progress in reducing health disparities among socially dis advantaged groups. Interactions among social and environmental determinants of health need spe-cific attention to better track and accelerate progress in promoting health equity (see Chapters 5 and 9). Similarly, evaluation users need specific guidance to monitor and evaluate the setting or context-specific conditions of obesity prevention activities. Improved documentation and characterization of broader envi-ronmental conditions (e.g., political, social, organizational) in which the activity is being implemented can help to inform practice in other settings. Finally, general evaluation criteria and decision trees would pro-

Copyright © National Academy of Sciences. All rights reserved.
Evaluating Obesity Prevention Efforts: A Plan for Measuring Progress
85Framework for Evaluation
vide a common resource for practitioners and decision makers attempting to collect and use assessment, monitoring, or surveillance information in their contexts. These criteria can also provide a way to assess the quality and impact of the outcomes achieved in obesity prevention efforts. Evaluation may appear dif-ficult to grasp and plan for when initiating, developing, and implementing obesity prevention activities; accordingly, this guidance can provide support for the systematic collection and effective use of evaluation information as diagnostic data during the initial assessment stages of planning, as quality control data during the monitoring of activities during implementation, and ultimately as baseline data for summative evaluation (Green and Kreuter, 2005).
Support for Implementation
Evaluations are complex and require a prepared workforce to be responsive to the many and varied needs and interests of end users (see Chapter 2 for more details). Participatory evaluation—engaging end users in developing the evaluation and all phases of its implementation and related sense making—is an important way to support implementation and effective use of evaluation information. Recommended supports for implementation include selecting individuals with related experience, training in core com-petencies of evaluation (e.g., developing a logic model and questions of interest to stakeholders, imple-menting assessments, measuring change), and coaching during implementation of the evaluation plan (e.g., in adapting core competencies to the context, such as identifying evaluation questions and imple-menting methods). In addition, performance feedback can help to assure implementation consistent with the agreed-upon plan for assessment or evaluation (Fixsen et al., 2009). Well-supported evaluations can provide end users with information about specific conditions that make a program’s implementation and impact more successful and can inform decisions for adjustments in implementation for a particular situa-tion or other contexts.
Outcomes
Inputs, activities, and outputs as described above all have their ultimate lines of presumed causal relationship to specific outcomes. Each is a support for the combined convergence of efforts to achieve obesity prevention. Parallel with these desired behavioral, environmental, and health (weight- and obesity-related) outcomes are improved intervention capacities in the short-term, increased evaluation activities in the intermediate-term, and enhanced data use in the long-term. Combined, these intended outcomes repre-sent enhanced capacity for evaluation activities needed to understand and improve progress in preventing obesity and achieving population health and health equity.
Short-Term: Improved Capacity and Infrastructure of Evaluation Activities
Evaluation users need resources and infrastructure to build and maintain capacity for successful evaluations. End-user needs must be clearly aligned with evaluation methods, key measures, and resources for implementation. Therefore, the Committee calls attention to several key conditions to assure success-ful evaluation activities:
Awareness of value and uses of evaluation activities. To ensure continued support and sustained commit-ment to obesity prevention evaluation efforts, broad awareness of the value of evaluation is paramount.

Copyright © National Academy of Sciences. All rights reserved.
Evaluating Obesity Prevention Efforts: A Plan for Measuring Progress
Evaluating Obesity Prevention Efforts86
Value of such efforts is defined here as the ability of evaluation efforts to show the benefits minus the costs (and harms) to obesity prevention initiatives (IOM, 2012b).
Adoption of recommended core indicators. It will be nearly impossible to show the value of obesity pre-vention efforts without collecting the right common measures. A critical short-term outcome is the inte-gration of recommended core indicators with related measures into data collection tools and activities.
Useful data (community, trends, comparable). To optimize the relevance of evaluation efforts, the findings need to be meaningful to the intended audiences. End users note important attributes of useful evalua-tions, including the capacity to show change over time in local jurisdictions and comparability to other comparison communities, places, or groups.
Engagement of end users. The early involvement and continued engagement of those who have a vested interest in the evaluation are paramount. Benefits include the assurance of a collaborative approach, like-lihood that the results will be used, continued support for programs, and acceptance of the evaluation results as credible (CDC, 2011).
Resources devoted to evaluation activities. Resources are not limited to money. They include time, energy, people, and innovative approaches to evaluation. They also include support systems for assuring the fidelity or appropriate adaptation of evaluation procedures and protocols to make them fit or to incorpo-rate the knowledge and experience of practitioners in the community settings (Gaglio and Glasgow, 2012; Green and Glasgow, 2006; IOM, 2010; Kottke et al., 2012).
Use of Web-based supports for implementation. Internet-based resources can provide widespread access to training materials and supports for implementing evaluation activities. For instance, the Healthy People 2020 website5 features an “Implement” tab with links to resources to “Track” progress on objectives including links to the Community Tool Box and other Web-based resources. In participatory evaluation contexts, Internet-based platforms have been used to support data collection, graphic feedback, systematic reflection on accomplishments, and adjustments in practice (Fawcett et al., 2003). Internet-based tools can make implementation of updated evaluation methods and protocols easier and more effective.
Intermediate-Term: Increased Evaluation Activities
Intermediate-term outcomes relate to the widespread adoption and effective use of evaluation to understand and support obesity prevention initiatives. Key aspects include the following:
System-wide use of evidence-based interventions. Widespread use of what works in obesity prevention requires a market for effective prevention strategies. Broad adoption, translation, and application of evidence-based strategies are essential to accelerating progress in obesity prevention. Evaluation can assist by extending evidence of the generality of programs and policies shown to be effective elsewhere to new contexts and with new groups, including those affected by health disparities (Green and Glasgow, 2006).
5 See http://www.healthypeople.gov (accessed November 11, 2013).

Copyright © National Academy of Sciences. All rights reserved.
Evaluating Obesity Prevention Efforts: A Plan for Measuring Progress
87Framework for Evaluation
Use of effective prevention interventions can help to reduce health care spending, reduce illness burden, and increase longevity (Task Force on Community Preventive Services, 2011).6
Timely and useful evaluations. To optimize the relevance of evaluation efforts, the data need to be pre-sented in as meaningful and timely a manner as possible to the intended audiences (Brownson et al., 2006). Regardless of whether the audience is national, state, or community level, the data need to be pre-sented in a way that is appropriate, useful, and applicable to the interests of end users (Pronk, 2012).
Workforce education for evaluation activities. The ability to monitor and evaluate progress is a required capability of the workforce in obesity prevention. This capability would apply to evaluation professionals and professionals working in the multiple sectors, such as government, health, and education who make up the broad obesity-prevention workforce. There is a need for both generalized and specialized knowl-edge in evaluation methods, perhaps as taught in undergraduate, graduate, and continuing education courses in multiple disciplines including public health, public administration, education, and behavioral and social sciences.
Periodic assessment and surveillance of obesity-related behaviors and outcomes. Government and orga-nizations need to support the development, maintenance, and proper use of systems for obesity-related surveillance. Although national surveillance is mainly adequate, there are numerous gaps in timing and coverage of indicators and populations as attention moves from the national to state to community levels. Public health agencies—at federal, state, and community levels—need to take a lead role in developing these systems to assure adequate tracking of rates of risk behaviors and obesity and its determinants.
Monitoring of changes in policies, programs, built environment, and systems. Evaluation of progress in obesity prevention requires careful monitoring of the environment—especially those community programs, policies, features of the built environment, and aspects of broader systems that can affect physical activity and healthful nutrition. For example, it is possible to reliably document instances of community/systems change—new or modified programs, policies, and practices—that define the unfolding of comprehensive community interventions in different sectors (Fawcett et al., 1995, 2001). A monitoring infrastructure—at community and system levels—could help to document and detect changes in the environment that might accelerate (or impede) progress in obesity prevention efforts at various levels (IOM, 2012b).
Monitoring of implementation and intensity of community programs/policies. To assess the intensity of community efforts to prevent obesity, evaluators can systematically document community programs and policies and characterize key attributes that might affect their collective impact on population health and health equity (Fawcett et al., 2010). Evaluation researchers have documented and characterized community programs and policies of chronic disease prevention efforts by attributes, such as strength of change strategy and duration, thought to be associated with collective impact in groups experiencing health disparities (Cheadle et al., 2010, 2013; Collie-Akers et al., 2007; Fawcett et al., 2013). Progress in obesity prevention in a given community is likely to be associated with both the amount and kind of
6 See http://www.thecommunityguide.org (accessed November 11, 2013).
Copyright © National Academy of Sciences. All rights reserved.
Evaluating Obesity Prevention Efforts: A Plan for Measuring Progress
Evaluating Obesity Prevention Efforts88
environmental changes, including their strength, duration, reach, and sustainability (Glasgow et al., 1999; Pronk, 2003).
Long-Term: Enhanced Data Use
Long-term outcomes of evaluation capacity include data-driven adjustments and improvements to programs and policies over time. Enhancements in the use of data also include systematic reflection on knowledge that has been generated as a result of the short- and intermediate-term evaluations:
Wider adoption and more effective use of evaluation-related data at national, state, and community levels. An intended outcome of evaluation capacity is widespread adoption and effective use of data by decision makers in multiple settings and at multiple levels. Data on progress need to be readily accessible so their utility in quality improvement and sustainability of interventions is optimal (Ottoson and Hawe, 2009; Ottoson and Wilson, 2003). The effectiveness of the use of these data will be reflected in innova-tions that emerge from ongoing use of accessible data on progress (similar to examples in crime mapping,7 etc.) (Crime Mapping, 2012). Similarly, a surveillance infrastructure can assure monitoring of impact vari-ables to help to detect improved (and worsening) behaviors and environments related to obesity preven-tion and improved population health.
Knowledge utilization to understand and improve obesity prevention efforts. Once data on environmental change and outcomes are generated, they are available for systematic reflection and use in making adjust-ments. For example, an empirical study of data uses by decision makers in a prevention effort showed that data were more frequently used for reviewing progress of the initiative, communicating successes or needed improvement to staff, and communicating accomplishments to end users (Collie-Akers et al., 2010). Ready availability of data on progress to end users can enhance understanding of and adjustments to obesity prevention efforts.
Impacts
The impacts section of the framework outlines the population-level changes and improvements that can result from widespread implementation of evidence-based interventions to prevent obesity. These represent the ultimate goals, objectives, and cumulative impact—including benefits and harms—of these strategies (IOM, 2012b). The guidance from the previous sections of the framework are intended to sup-port and enable assessment, monitoring, surveillance, and summative evaluation that detect merit, assure accountability, and promote quality improvement of obesity prevention efforts.
Intended impact is mirrored in the process of collaborative public health action in which activities of multi-sector/multi-level partnerships lead to improved physical and social environments, behaviors, and population-level outcomes (Collie-Akers and Fawcett, 2008; IOM, 2003). These impact variables have a reciprocal relationship, in which changes in one impact or sector can influence and change the other impacts or sectors. For example, providing sidewalks and adequate crossing guards for schools (improved physical environment) can lead to increased physical activity because more children can walk to school (improved behaviors), which was brought about by engagement of different sectors of the community
7 “Crime mapping” provides crime data visually on a map to help to analyze crime patterns.
Copyright © National Academy of Sciences. All rights reserved.
Evaluating Obesity Prevention Efforts: A Plan for Measuring Progress
89Framework for Evaluation
(systems-level changes). If more children begin walking to school, then this change could prompt further collaborative action among schools, county government, and community leaders to build more and better sidewalks and bike paths that connect home and school.
Changes in environments and systems are intended to result in changes in behaviors leading to increased energy expenditure (through increased physical activity) and decreased energy intake (through dietary changes); these changes in turn lead to decreased incidence and prevalence of overweight and/or obesity.8 With a population-level reduction in overweight and obesity, morbidity and mortality levels from obesity-related conditions will also decrease, leading to improved population health.
Multi-Sector/Multi-Level Partnerships
Collaborative action to promote healthful living and prevent obesity often takes the form of multi-sector partnerships or coalitions that form within and across various sectors (see Chapters 9 and 10). How much and in what forms such partnerships and coalitions achieve or enhance health outcomes remains a subject of theoretical and empirical debate (Butterfoss et al., 2008; Kreuter et al., 1990). But practical experience suggests ways in which they facilitate community-level action and systems change. For example, as described above, schools and county governments can form partnerships to promote active transport to schools that benefit each partner in different ways. Processes that influence the amount and kind of system change brought about by collaborative partnerships include analyzing information about the problem, developing strategic and action plans, providing technical support for implement-ing effective strategies, documenting progress, using feedback, and making outcomes matter (Fawcett et al., 2010).
Improved Physical and Social Environments
As described in Chapter 1, the Accelerating Progress in Obesity Prevention report (IOM, 2012a) focused on improving physical and social environments to make better food and activity choices the default, or the “opt out” choices (Novak and Brownell, 2012). Physical and social environments can have significant influence on food and activity patterns. Presently these environments promote unhealthful rather than healthful choices, and the conditions and effects of these environments are significantly worse for socially disadvantaged groups (IOM, 2012a).
The past few years have seen significant progress in the development of tools and instruments for assessing health-promoting (or -inhibiting) aspects of the environment as related to obesity (NCCOR, 2013; Ottoson et al., 2009; Sallis and Glanz, 2009). As new methods are developed and used, baseline standards can be set to measure progress. With increasing implementation of evidence-based strategies, it is necessary to fully document the fidelity of implementation and efficacy of interventions, including mea-surement of changes in environmental factors.
Improved Behaviors and Social Norms
Changes in the physical and social environments, as well as programmatic and educational efforts, can lead to improved dietary intake and physical activity. Dietary intake and physical activity can be mea-
8 There can also be unintended consequences. For example, harms associated with changes in social norms may increase social disapproval and discrimination against those who are overweight.

Copyright © National Academy of Sciences. All rights reserved.
Evaluating Obesity Prevention Efforts: A Plan for Measuring Progress
Evaluating Obesity Prevention Efforts90
sured using a variety of methods, which range from self-administered survey-type questions for epidemio-logic applications to more sophisticated physical measures as described below.
In addition to measuring the physical environment, documenting the social environment by mea-suring changes in norms, self-efficacy, beliefs, outcome expectations, and other psychosocial factors can help to identify influences on healthful eating and activity behaviors (Flay et al., 2009). Recent studies have found that social influences are associated with obesity, as demonstrated through social networks, in which group beliefs and normative behaviors can affect the behaviors of peers (Hammond, 2010). Norms allow for social constraints and/or permissions to occur, and, as a result, they have the potential to influ-ence the behavior of individuals of the group. Such changes in social norms or other related psychosocial factors can be difficult to measure across a population, because many of the constructs are specific to a particular program, behavior, and/or environment. Development of standard indicators of changes in social norms could lead to better understanding of how they may influence population-level behavior.
Increased Energy Expenditure and Decreased Energy Intake
As environments and behaviors change through multi-sector and multi-level interventions, a logical conclusion is that increased energy expenditure and decreased energy intake will result. Current methods of quantifying energy expenditure in individuals include self-reported surveys, direct observations, and of motion-capturing devices such as accelerometers and calorimetry (Levine, 2005). Energy intake can be measured using standard techniques such as doubly labeled water method9 or newer tools such as com-puter imaging (Hu, 2008). Limitations in the use of self-reported techniques for measuring energy intake (i.e., 24-hour dietary recalls) have been identified (Schoeller et al., 2013), and therefore evaluations done in low-resource contexts should consider alternate methods.
Reduced Overweight/Obesity
The primary physiologic measure of impact noted in this framework (see Figure 3-1) is reduction in overweight and obesity. At the most basic level, overweight and obesity result from an imbalance between energy expenditure and energy intake. The factors that influence energy expenditure and energy intake are diverse and have varying influence in different contexts. Assessing overweight and obesity is relatively straightforward, and population-level progress can be measured through both incidence—new cases—and prevalence or existing cases (see Chapter 4 for suggested list of indicators). For children, who are grow-ing and developing rapidly, measurement of changing overweight/obesity prevalence is the best population indicator of impact (although a direct measure of incidence would be preferable). For adults, the measure-ment of prevalence of overweight and obesity can also be a practical approach to assessing progress in obesity-related initiatives. Yet, as described in Chapter 1 overweight/obesity may not be the most sensitive measure because excess weight has been shown to be extremely intractable in adults, and weight loss is not easily maintained over time. Where feasible to collect, the appearance in a population of new cases of overweight and obesity in adults (i.e., changes in incidence) may be more responsive to recent changes in the environment and associated changes in behaviors.
9 The “doubly labeled water method” measures energy expenditure, body composition, and water flux in individuals.

Copyright © National Academy of Sciences. All rights reserved.
Evaluating Obesity Prevention Efforts: A Plan for Measuring Progress
91Framework for Evaluation
Ultimate Intended Impact
The final intended impact of monitoring progress in obesity prevention is improved population health or well-being and health equity, two of the primary overarching objectives of Healthy People 2020 (HHS, 2010b). These impact variables are logical consequences of decreased incidence and prevalence of overweight/obesity and associated obesity-related morbidity and mortality. Decreases in obesity-related medical chronic diseases such as type 2 diabetes, hypertension, cardiovascular disease, and cancer, and their costs, will lead to a healthier nation and economy. In addition, the mental health effects and bullying that are associated with excess body weight and poor body image may be attenuated, leading to further medical cost savings and increased well-being. Insofar as overweight/obesity and related conditions dis-proportionately affect low-income and socially disadvantaged populations, a significant impact of imple-menting recommended strategies for obesity prevention would be improved health equity. The science and practice of assuring health equity would benefit from improved understanding of how these hypothesized mechanisms of social determinants—differential exposures, vulnerabilities, and consequences—work to affect disparities in weight and health outcomes.
REFERENCES
AAP (American Academy of Pediatrics). 2008. The Bright Futures: Guidelines for health supervision of infants, chil-
dren, and adolescents. Elk Grove Village, IL: American Academy of Pediatrics.
American Evaluation Association. 2004. Guiding principles for evaluators. http://www.eval.org/Publications/
GuidingPrinciples.asp (accessed January 13, 2013).
Brownson, R. C., C. Royer, R. Ewing, and T. D. McBride. 2006. Researchers and policymakers: Travelers in parallel
universes. American Journal of Preventive Medicine 30(2):164-172.
Butterfoss, F. D., M. C. Kegler, and V. T. Francisco. 2008. Mobilizing organizations for health promotion: Theories
of organizational change. In Health behavior and health education: Theory, research and practice. 4th ed,
edited by K. Glanz, B. K. Rimer and K. Viswanath. San Francisco, CA: Jossey-Bass. Pp. 335-362.
CDC (Centers for Disease Control and Prevention). 1999. Framework for program evaluation in public health.
Morbidity and Mortality Weekly Report 48(RR11):1-40.
CDC. 2010. 10 essential public health services. http://www.cdc.gov/nphpsp/essentialservices.html (accessed March 20,
2013).
CDC. 2011. Developing an effective evaluation plan. Atlanta, GA: National Center for Chronic Disease Prevention
and Health Promotion, Office on Smoking and Health; Division of Nutrition, Physical Activity, and Obesity.
Cheadle, A., S. E. Samuels, S. Rauzon, S. C. Yoshida, P. M. Schwartz, M. Boyle, W. L. Beery, L. Craypo, and L.
Solomon. 2010. Approaches to measuring the extent and impact of environmental change in three California
community-level obesity prevention initiatives. American Journal of Public Health 100(11):2129-2136.
Cheadle, A., P. M. Schwartz, S. Rauzon, E. Bourcier, S. Senter, B. Spring, and W. L. Beery. 2013. Using the concept of
“population dose” in planning and evaluating community-level obesity prevention activities. American Journal
of Evaluation 34(1):71-84.
Collie-Akers, V., and S. B. Fawcett. 2008. Preventing childhood obesity through collaborative public health action in
communities. In Handbook of child and adolescent obesity, edited by E. Jelalian and R. G. Steele. New York:
Springer Science. Pp. 351-368.
Collie-Akers, V. L., S. B. Fawcett, J. A. Schultz, V. Carson, J. Cyprus, and J. E. Pierle. 2007. Analyzing a community-
based coalition’s efforts to reduce health disparities and the risk for chronic disease in Kansas City, Missouri.
Preventing Chronic Disease 4(3):A66.

Copyright © National Academy of Sciences. All rights reserved.
Evaluating Obesity Prevention Efforts: A Plan for Measuring Progress
Evaluating Obesity Prevention Efforts92
Collie-Akers, V. L., J. Watson-Thompson, J. A. Schultz, and S. B. Fawcett. 2010. A case study of use of data for
participatory evaluation within a statewide system to prevent substance abuse. Health Promotion & Practice
11(6):852-858.
Crime Mapping. 2012. Building safer communities. http://www.crimemapping.com (accessed November 19, 2012).
Fawcett, S. B. 2002. Evaluating comprehensive community initiatives: A bill of rights and responsibilities. In
Improving population health: The California Wellness Foundation’s health improvement initiative, edited by
S. Isaacs. San Francisco, CA: Social Policy Press. Pp. 229-233.
Fawcett, S. B., T. Sterling, A. L. Paine-Andrews, K. J. Harris, V. T. Francisco, K. P. Richter, R. K. Lewis, and
T. Schmid. 1995. Evaluating community efforts to prevent cardiovascular diseases. Atlanta, GA: U.S. Centers
for Disease Control and Prevention, National Center for Chronic Disease Prevention and Health Promotion.
Fawcett, S. B., A. Paine-Andrews, V. T. Francisco, J. A. Schultz, K. P. Richter, J. Berkley-Patton, J. L. Fisher, R. K.
Lewis, C. M. Lopez, S. Russos, E. L. Williams, K. J. Harris, and P. Evensen. 2001. Evaluating community ini-
tiatives for health and development. In Evaluation in health promotion: Principles and perspectives, edited by
I. Rootman, M. Goodstadt, B. Hyndman, D. V. McQueen, L. Potvin, J. Springett and E. ziglio. Copenhagen,
Denmark: World Health Organization. Pp. 341-370.
Fawcett, S. B., J. A. Schultz, V. L. Carson, V. A. Renault, and V. T. Francisco. 2003. Using internet-based tools to
build capacity for community-based participatory research and other efforts to promote community health and
development. In Community-based participatory research for health, edited by M. Minkler and N. Wallerstein.
San Francisco, CA: Jossey-Bass. Pp. 155-178.
Fawcett, S. B., J. Schultz, J. Watson-Thompson, M. Fox, and R. Bremby. 2010. Building multisectoral partnerships
for population health and health equity. Preventing Chronic Disease 7(6):A118.
Fawcett, S. B., V. Collie-Akers, J. A. Schultz, and P. Cupertino. 2013. Community-based participatory research within
the Latino Health for All Coalition. Journal of Prevention and Intervention in the Community 41(3):142-154.
Fixsen, D., K. Blase, S. Naoom, and F. Wallace. 2009. Core implementation components. Research on Social Work
Practice 19:531-540.
Flay, B. R., F. J. Snyder, and J. Petraitis. 2009. The theory of triadic influence. In Emerging theories in health pro-
motion practice and research. 2nd ed, edited by R. J. DiClemente, M. C. Kegler, and A. Crosby. New York:
Jossey-Bass. Pp. 451-510.
Gaglio, B., and R. Glasgow. 2012. Evaluation approaches for dissemination and implementation research. In
Dissemination and implementation research in health: Translating science to practice, edited by R. C.
Brownson, G. A. Colditz, and E. K. Proctor. New York: Oxford University Press. Pp. 327-356.
Glasgow, R. E., T. M. Vogt, and S. M. Boles. 1999. Evaluating the public health impact of health promotion inter-
ventions: The RE-AIM framework. American Journal of Public Health 89(9):1322-1327.
Green, L. W., and R. E. Glasgow. 2006. Evaluating the relevance, generalization, and applicability of research: Issues
in external validation and translation methodology. Evaluation and the Health Professions 29(1):126-153.
Green, L. W., and M. W. Kreuter. 2005. Health program planning: An educational and ecological approach. 4th ed.
New York: McGraw-Hill.
Hammond, R. A. 2010. Social influence and obesity. Current Opinion in Endocrinology, Diabetes, and Obesity
17(5):467-471.
HHS (Department of Health and Human Services). 2008. 2008 Physical activity guidelines for Americans. 7th ed.
Washington, DC: U.S. Department of Health and Human Services.
HHS. 2010a. Dietary guidelines for Americans. Washington, DC: U.S. Government Printing Office.
HHS. 2010b. Healthy People 2020. http://www.healthypeople.gov/2020/default.aspx (accessed January 31, 2013).
Hu, F. B. 2008. Dietary assessment methods. In Obesity epidemiology, edited by F. B. Hu. New York: Oxford
University Press. Pp. 84-118.

Copyright © National Academy of Sciences. All rights reserved.
Evaluating Obesity Prevention Efforts: A Plan for Measuring Progress
93Framework for Evaluation
IOM (Institute of Medicine). 2003. The future of the public’s health in the 21st century. Washington, DC: The
National Academies Press.
IOM. 2009. Local government actions to prevent childhood obesity. Washington, DC: The National Academies
Press.
IOM. 2010. Bridging the evidence gap in obesity prevention: A framework to inform decision making. Washington,
DC: The National Academies Press.
IOM. 2012a. Accelerating progress in obesity prevention: Solving the weight of the nation. Washington, DC: The
National Academies Press.
IOM. 2012b. An integrated framework for assessing the value of community-based prevention. Washington, DC:
The National Academies Press.
IOM. 2012c. Evaluating progress of obesity prevention efforts: What does the field need to know? Paper read at
Public Session of the Committee on Evaluating Progress of Obesity Prevention Efforts, October 12, 2012,
Washington, DC.
IOM. 2012d. Measuring progress in obesity prevention: Workshop report. Washington, DC: The National Academies
Press.
JCSEE (Joint Committee on Standards for Educational Evaluation). 2011. The program evaluation standards: A
guide for evaluators and evaluation users. 3rd ed. Thousand Oaks, CA: Sage.
Kettel Khan, L., K. Sobush, D. Keener, K. Goodman, A. Lowry, J. Kakietek, and S. zaro. 2009. Recommended com-
munity strategies and measurements to prevent obesity in the United States. MMWR Recommendations and
Reports 58(RR-7):1-26.
Kreuter, M. W., N. Lezin, and L. Young. 1990. Evaluating community-based collaborative mechanisms: Implications
for practitioners. Health Promotion and Practice 1(1):49-63.
Kottke, T. E., N. P. Pronk, and G. J. Isham. 2012. The simple health system rules that create value. Preventing
Chronic Disease 9:E49.
Levine, J. A. 2005. Measurement of energy expenditure. Public Health Nutrition 8(7A):1123-1132.
NCCOR (National Collaborative on Childhood Obesity Research). 2013. NCCOR Measures Registry. http://nccor.
org/projects/measures/index.php (accessed June 15, 2012).
Novak, N. L., and K. D. Brownell. 2012. Role of policy and government in the obesity epidemic. Circulation
126(19):2345-2352.
NPC (National Prevention Council). 2011. National Prevention Strategy. Washington, DC: Office of the Surgeon
General, U.S. Department of Health and Human Services.
Ottoson, J. M., and P. Hawe, eds. 2009. Knowledge utilization, diffusion, implementation, transfer, and translation:
Implications for evaluation. Hoboken, NJ: Wiley.
Ottoson, J. M., and D. H. Wilson. 2003. Did they use it? Beyond the collection of surveillance information. In
Global behavioral risk factor surveillance, edited by D. McQueen and P. Puska. New York: Kluwer Academic/
Plenum Publishers. Pp. 119-131.
Ottoson, J. M., L. W. Green, W. L. Beery, S. K. Senter, C. L. Cahill, D. C. Pearson, H. P. Greenwald, R. Hamre, and
L. Leviton. 2009. Policy-contribution assessment and field-building analysis of the Robert Wood Johnson
Foundation’s Active Living Research Program. American Journal of Preventive Medicine 36(2 Suppl):S34-S43.
Pronk, N. P. 2003. Designing and evaluating health promotion programs: Simple rules for a complex issue. Disease
Management and Health Outcomes 11(3):149-157.
Pronk, N. P. 2012. The power of context: Moving from information and knowledge to practical wisdom for improv-
ing physical activity and dietary behaviors. American Journal of Preventive Medicine 42(1):103-104.
Rogers, E. M. 2003. Diffusion of innovations. 5th ed. New York: The Free Press.

Copyright © National Academy of Sciences. All rights reserved.
Evaluating Obesity Prevention Efforts: A Plan for Measuring Progress
Evaluating Obesity Prevention Efforts94
Sallis, J. F., and K. Glanz. 2009. Physical activity and food environments: Solutions to the obesity epidemic. Milbank
Quarterly 87(1):123-154.
Schoeller, D. A., D. Thomas, E. Archer, S. B. Heymsfield, S. N. Blair, M. I. Goran, J. O. Hill, R. L. Atkinson, B. E.
Corkey, J. Foreyt, N. V. Dhurandhar, J. G. Kral, K. D. Hall, B. C. Hansen, B. L. Heitmann, E. Ravussin, and
D. B. Allison. 2013. Self-report-based estimates of energy intake offer an inadequate basis for scientific conclu-
sions. American Journal of Clinical Nutrition 97(6):1413-1415.
Tabak, R. G., E. C. Khoong, D. A. Chambers, and R. C. Brownson. 2012. Bridging research and practice: Models
for dissemination and implementation research. American Journal of Preventive Medicine 43(3):337-350.
Task Force on Community Preventive Services. 2005. The Guide to Community Preventive Services: What works to
promote health?, edited by S. zaza, P. A. Briss, and K. W. Harris. New York: Oxford University Press.
Task Force on Community Preventive Services. 2011. First annual report to Congress and to agencies related to the
work of the task force. Atlanta, GA: The Community Guide.
Truman, B. I., C. K. Smith-Akin, A. R. Hinman, K. M. Gebbie, R. Brownson, L. F. Novick, R. S. Lawrence,
M. Pappaioanou, J. Fielding, C. A. Evans, Jr., F. A. Guerra, M. Vogel-Taylor, C. S. Mahan, M. Fullilove, and
S. zaza. 2000. Developing the Guide to Community Preventive Services—overview and rationale. The Task
Force on Community Preventive Services. American Journal of Preventive Medicine 18(1 Suppl):18-26.
Ward, V. L., A. O. House, and S. Hamer. 2009. Knowledge brokering: Exploring the process of transferring knowl-
edge into action. BMC Health Services Research 9:12.
WHO (World Health Organization). 2010. Population-based prevention strategies for childhood obesity. Report of
a WHO forum and technical meeting, Geneva, 15-17 December 2009. Geneva, Switzerland: World Health
Organization.

Copyright © National Academy of Sciences. All rights reserved.
Evaluating Obesity Prevention Efforts: A Plan for Measuring Progress
95
4Indicators for the Evaluation Plans
Why: Why develop indicators? The Statement of Task called for the Committee to draw on the recommen-dations and indicators included in the Institute of Medicine (IOM) report Accelerating Progress in Obesity Prevention (IOM, 2012). In its framework, the Committee included indicator development as a key activity and sought to identify indicators that are aligned with the recommendations in the IOM report (IOM, 2012).
What: What can the indicators be used for? The indicators of progress can serve multiple purposes: (1) to be incorporated into the national, state, and community plans (Chapters 6, 7, and 8); (2) to identify gaps in existing surveillance systems (where future indicators could be developed); and (3) to be used as examples by evaluators of obesity prevention programs, policies, and environments.
How: How were the indicators developed? The Committee identified the indicators of progress through a comprehensive review of existing indicator sources (drawing heavily on those included in Healthy People 2020 [HHS, 2010]) and national surveillance systems, as well as recognition of existing gaps in these sources compared to recommendations in the IOM report.
The Committee was charged to identify and develop indicators that could be used at the national and community levels for measuring progress of obesity prevention efforts. The Statement of Task called
for the Committee to draw from the indicators included in the Institute of Medicine (IOM) Accelerating Progress in Obesity Prevention (APOP) report (IOM, 2012), as well as currently used indicators not included in the APOP report, and to identify areas where new indicators are needed. The Committee sought to align the indicators with its framework by focusing on developing indicators related to the items included in box 5 of Figure 4-1, “Intended Impacts/Improvements.”

Copyright © National Academy of Sciences. All rights reserved.
Evaluating Obesity Prevention Efforts: A Plan for Measuring Progress
Evaluating Obesity Prevention Efforts96
Figures S-1, 4-1 and 10-1.eps
1. Inputs
• User/Stakeholder Needs• Existing Objectives Strategies• Context for Evaluationa
• Guiding Principles for Evaluationa
• Resources
2. Activities
• Identify Indicators/Measures of Success• Develop Evaluationa Plans and
Infrastructure• Develop Resources for Training, Technical
Assistance, and Dissemination
3. Outputs
• Core Indicators and Measures• Recommendations and Guidance• Support for Implementation
4. Outcomes
• Short-term: Improved Evaluationa
Capacity and Training• Intermediate-term: Increased
Evaluationa Activities• Long-term: Enhanced Data Use
5. Intended Impacts/ Improvements
• Partnerships, Environments, Policies, Behaviors, Norms
• Energy Expenditure/Intake• Overweight/Obesity• Population Health and Well-Being; Equity
Evaluation Framework
FIGURE 4-1 Framework for evaluating progress of obesity prevention efforts.a Evaluation refers to assessment, monitoring, surveillance, and summative evaluation activities.
METhOdOLOGY
The Committee defined the terms environment, strategy, indicator, objective, and measure. Environment refers to the five environments emphasized in the APOP report (IOM, 2012): physical activity, food and beverage, messaging, health care and worksite, and school and child care (outside the home) (with child care added by this Committee). Strategy refers to the APOP report’s 20 recommended strategies related to policy, systems, and environmental changes across the five environments (IOM, 2012). Interventions refer to the specific combination of policy, educational, mass media, organizational, and economic changes being evaluated in relation to specific APOP strategies and intended impacts (see Figure 4-1). For this report, the Committee adapted more recent definitions provided by the IOM’s Committee on Leading Health Indicators for Healthy People 2020 (IOM, 2011). Herein, an indicator is defined as a measurement related to a criterion of success or standard of acceptability, for example, the prevalence of obesity or the proportion of states with strong nutritional standards for foods and beverages sold or provided in schools. An objective is a statement of movement in an indicator toward a quantita-

Copyright © National Academy of Sciences. All rights reserved.
Evaluating Obesity Prevention Efforts: A Plan for Measuring Progress
97Indicators for the Evaluation Plans
tive target, usually by a specified time, e.g., among children aged 2-11 reduce by 10 percent the preva-lence of obesity by 2020. A measure refers to the actual survey item or set of items, assessment method, observational technique, etc., that is used to quantify an indicator. For example, 24-hour dietary recall or observational methods could be used to assess intake of sugar-sweetened beverages or accelerometers could be used to assess physical activity levels.
For the indicators and objectives that were directly drawn from Healthy People 2020, such targets already exist (HHS, 2013). In Table 4-1 below, the Committee identifies all such indicators and objectives with a reference to Healthy People 2020 as the source and refers the reader to the Healthy People 2020 website (www.healthypeople.gov) for the most up-to-date baseline and target information. As additional surveillance systems are developed or exising systems incorporate additional indicators and objectives not currently included in Healthy People 2020, baseline and target data will be more readily available for a broader range of the indicators and objectives noted below. The Committee was unable to identify specific measures for each indicator and objective noted in Table 4-1; however, the reader is referred to examples of such measures in national, state, and community plans presented in Chapters 6, 7, and 8.
The Committee used the following criteria to select the indicators and objectives:
1. The indicator/objective specifically relates to the Committee’s framework—that is, partnerships, changes to the physical and/or social environments through policy or environmental changes (e.g., infrastructure, resources, systems, programs, pricing), improved energy intake and energy expenditure behaviors, or improved weight outcomes;
2. The indicator/objective directly relates to the overarching goal of preventing obesity and over-weight or one of the five APOP environments and the related strategies;
3. The indicator/objective was a. drawn from an existing Healthy People 2020 (HHS, 2013) indicator (particularly the
Leading Health Indicators1), an APOP indicator, or existing nationally recognized or state-based data systems (e.g., National Survey of Children’s Health [CAHMI, 2013]);
b. a strategy specifically recommended by a nationally recognized scientific advisory panel (e.g., the Community Preventive Services Task Force [CDC, 2013]); or
c. identified by the Committee as part of its review. To decide between a Healthy People 2020 objective versus a similar objective from another
source, the Committee gave preference to the Healthy People 2020 objective wording; and,4. The indicator/objective has the following properties:
a. The indicator/objective is relevant and closely linked to the overarching goal of a strategy included within the APOP report (IOM, 2012);
b. Data for the indicator/objective are readily and currently available for at least one of the jurisdictional levels of interest (i.e., national, regional, territories, state, county, municipal, and/or school district levels);
c. The indicator/objective is measured on a regular basis over time (e.g., where possible, every 3 years or more frequently). Measurement over time will reflect results of action; that is, if action is taken, then tangible results will indicate improvements in various aspects of the
1 Leading Health Indicators are a subset of the Healthy People 2020 indicators selected for priority health issues (www.healthypeople.gov).

Copyright © National Academy of Sciences. All rights reserved.
Evaluating Obesity Prevention Efforts: A Plan for Measuring Progress
Evaluating Obesity Prevention Efforts98
nation’s health. In some cases, sources that provided data every 1 to 3 years were not avail-able; as such, the Committee included the indicator/objective but, in the spirit of accelerat-ing progress in obesity prevention, also included recommendations to increase the frequency with which such data are compiled;
d. The indicator/objective is already computed from the available data source or can be easily computed based on the available data;
e. Indicators/objectives can be understood by people who need to act, that is, they have face validity and suggest what can be done to accelerate progress in obesity prevention; and
f. The objective will galvanize action, that is, the objectives are of such a nature that stake-holders (e.g., decision makers at the national, regional, state, county, municipal, school dis-trict, school, child care, worksite, etc. levels) can take action, whether they are individuals or part of organized groups and public and private agencies. This action can in part come from mobilization across multiple sectors.
The universe of potential indicators was based on a scan of data sources and indicators including those available from or identified by
• Healthy People 2020 (HHS, 2013); • APOP report (IOM, 2012); • Community Commons GIS (geographic information system) (Community Commons, 2013);• Childhood Obesity GIS System (CARES-University of Missouri, 2013); • U.S. Department of Agriculture (USDA) Food Environment Atlas (USDA, 2013); • National Survey of Children’s Health (CAHMI, 2013);• national data surveillance systems available from U.S. federal agencies, including the depart-
ments of Agriculture, Education, Health and Human Services, and Transportation or state-based data systems (e.g., state birth registries); and
• private-sector and/or commercial data sources (e.g., the National Consumer Panel [National Consumer Panel, 2013], Employee Benefits Research Institute [EBRI, 2013]).
Additionally, the Committee reviewed the data systems catalogued in the National Collaborative on Childhood Obesity Research’s Catalogue of Surveillance Systems (NCCOR, 2013). Appendix D includes a full list of indicator data sources. While many of the sources consulted reflected a repository or com-pilation of data from several primary data sources (e.g., the USDA Food Environment Atlas or the Community Commons), the Committee chose to refer to the original data source as the source for a given indicator and objective rather than referring to compiled data systems.
INdICATORS
The scan of potential data sources yielded 322 initial indicators, which the Committee pared down to 206 by eliminating duplicates. The 206 indicators were organized as (1) overarching/system-level indi-cators focused on obesity, overweight, and early life years (e.g., birth weight, and perinatal and pregnancy weight) and (2) goal-area indicators that specifically addressed each of the APOP (IOM, 2012) goal

Copyright © National Academy of Sciences. All rights reserved.
Evaluating Obesity Prevention Efforts: A Plan for Measuring Progress
99Indicators for the Evaluation Plans
TABLE 4-1 Potential Indicator Topics and Objectives by APOP Goal and Strategy Areas*
Indicator Topic Objectivea
OVERARCHING/SYSTEM-LEVEL INDICATORS
1 Obesity-adult Reduce the proportion of adults who are obese (body mass index [BMI] ≥30)a
2 Obesity-adolescent Reduce the proportion of adolescents aged 12-19 who are considered obesec
3 Obesity-child Reduce the proportion of children aged 6-11 who are considered obeseb,c
4 Obesity-preschool age Reduce the proportion of children aged 2-5 who are considered obeseb,c
5 Overweight-adult Reduce the proportion of adults who are considered overweight (BMI 25-29.9)d
6 Overweight-adolescent Reduce the proportion of adolescents aged 12-19 who are considered overweightd
7 Overweight-child Reduce the proportion of children aged 6-11 who are considered overweightd
8 Overweight-preschool age Reduce the proportion of children aged 2-5 who are considered overweightd
9 Overweight-infant Reduce the proportion of infants aged 0-2 with weight-for-length greater than the 95th percentile based on the Centers for Disease Control and Prevention recommendation to use the World Health Organization growth charts standard for birth to age 24 months
10 Gestational weight gain Reduce gestational weight gain to meet the Institute of Medicine (IOM) (2009) recommendations for total and rate of weight gain based on pre-pregnancy BMI
11 Birth weight Increase the number of children with a birth weight that is appropriate for their gestational age
12 Maternal pre-pregnancy weight Reduce the proportion of women whose pre-pregnancy weight is considered obese or overweight
13 Maternal post-pregnancy weight Reduce the proportion of women who are considered obese or overweight post-pregnancy
APOP GOAL AREA 1: PHYSICAL ACTIVITY ENVIRONMENT
14 Adult physical activity Increase the proportion of adults who meet current federal physical activity guidelines for aerobic physical activity and for muscle-strengthening activityb,c
15 Adolescent physical activity Increase the proportion of adolescents who meet current federal physical activity guidelines for aerobic physical activityb
16 Child and adolescent daily vigorous physical activity
Increase the proportion of children aged 6-17 who engage in at least 20 minutes per day of vigorous physical activity
Strategy 1-1: Enhance the physical and built environment
17 Joint/shared use of community facilities
Increase the proportion of the nation’s public and private schools that provide access to their physical activity spaces and facilities for all persons outside of normal school hours (i.e., before and after the school day, on weekends, and during summer and other vacations)b
18 Policies that promote physical activity and the built environment
Increase legislative policies for the built environment (i.e., community-scale, street-scale, and transportation and travel) that enhance access to and availability of physical activity opportunitiesb(developmental)
19 Adult active transport by walking
Increase the proportion of walking trips made by adults for leisure or commuting to workb(developmental)
continued
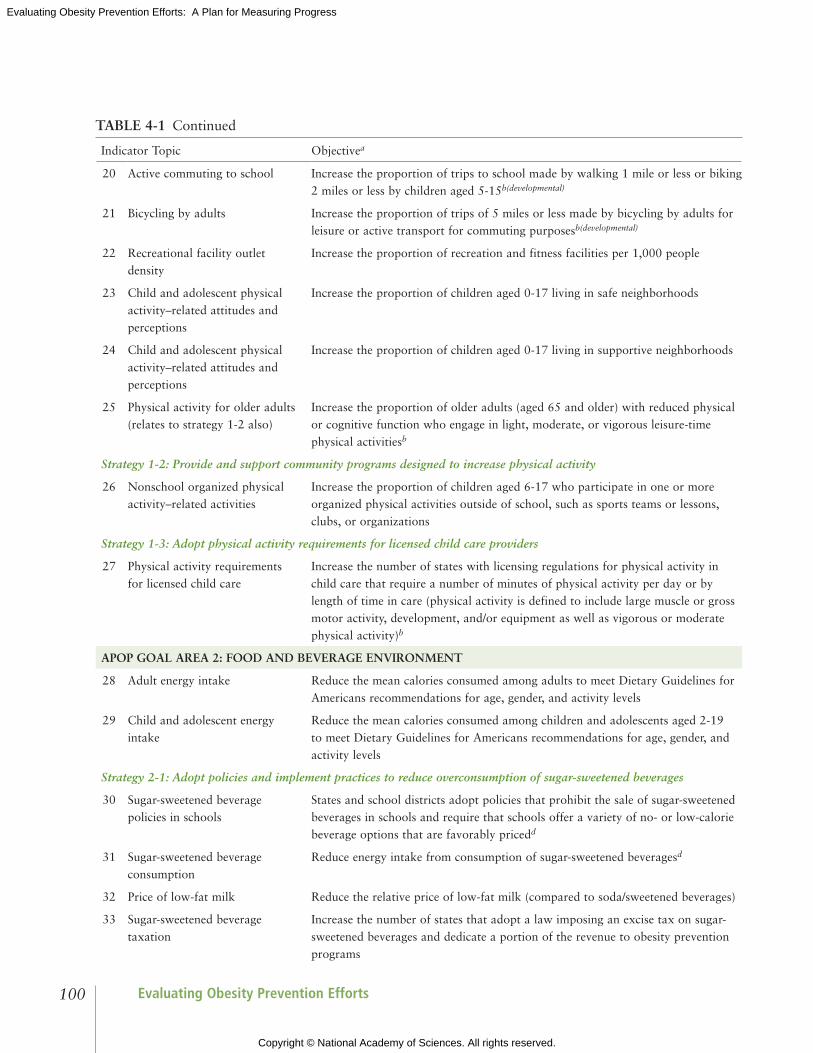
Copyright © National Academy of Sciences. All rights reserved.
Evaluating Obesity Prevention Efforts: A Plan for Measuring Progress
Evaluating Obesity Prevention Efforts100
Indicator Topic Objectivea
20 Active commuting to school Increase the proportion of trips to school made by walking 1 mile or less or biking 2 miles or less by children aged 5-15b(developmental)
21 Bicycling by adults Increase the proportion of trips of 5 miles or less made by bicycling by adults for leisure or active transport for commuting purposesb(developmental)
22 Recreational facility outlet density
Increase the proportion of recreation and fitness facilities per 1,000 people
23 Child and adolescent physical activity–related attitudes and perceptions
Increase the proportion of children aged 0-17 living in safe neighborhoods
24 Child and adolescent physical activity–related attitudes and perceptions
Increase the proportion of children aged 0-17 living in supportive neighborhoods
25 Physical activity for older adults (relates to strategy 1-2 also)
Increase the proportion of older adults (aged 65 and older) with reduced physical or cognitive function who engage in light, moderate, or vigorous leisure-time physical activitiesb
Strategy 1-2: Provide and support community programs designed to increase physical activity
26 Nonschool organized physical activity–related activities
Increase the proportion of children aged 6-17 who participate in one or more organized physical activities outside of school, such as sports teams or lessons, clubs, or organizations
Strategy 1-3: Adopt physical activity requirements for licensed child care providers
27 Physical activity requirements for licensed child care
Increase the number of states with licensing regulations for physical activity in child care that require a number of minutes of physical activity per day or by length of time in care (physical activity is defined to include large muscle or gross motor activity, development, and/or equipment as well as vigorous or moderate physical activity)b
APOP GOAL AREA 2: FOOD AND BEVERAGE ENVIRONMENT
28 Adult energy intake Reduce the mean calories consumed among adults to meet Dietary Guidelines for Americans recommendations for age, gender, and activity levels
29 Child and adolescent energy intake
Reduce the mean calories consumed among children and adolescents aged 2-19 to meet Dietary Guidelines for Americans recommendations for age, gender, and activity levels
Strategy 2-1: Adopt policies and implement practices to reduce overconsumption of sugar-sweetened beverages
30 Sugar-sweetened beverage policies in schools
States and school districts adopt policies that prohibit the sale of sugar-sweetened beverages in schools and require that schools offer a variety of no- or low-calorie beverage options that are favorably pricedd
31 Sugar-sweetened beverage consumption
Reduce energy intake from consumption of sugar-sweetened beveragesd
32 Price of low-fat milk Reduce the relative price of low-fat milk (compared to soda/sweetened beverages)
33 Sugar-sweetened beverage taxation
Increase the number of states that adopt a law imposing an excise tax on sugar-sweetened beverages and dedicate a portion of the revenue to obesity prevention programs
TABLE 4-1 Continued

Copyright © National Academy of Sciences. All rights reserved.
Evaluating Obesity Prevention Efforts: A Plan for Measuring Progress
101Indicators for the Evaluation Plans
Indicator Topic Objectivea
Strategy 2-2: Increase the availability of lower-calorie and healthier food and beverage options for children in restaurants
34 Child and adolescent caloric intake in restaurants
Reduce caloric intake by children and adolescents in chain and quick-service restaurantsd
Strategy 2-3: Utilize strong nutritional standards for all foods and beverages sold or provided through the government, and ensure that these healthy options are available in all places frequented by the public
35 Consumption of solid fats and added sugars
Reduce consumption of calories from solid fats and added sugars in the population aged 2 years and olderb
36 Consumption of solid fats Reduce consumption of calories from solid fatsb
37 Consumption of added sugars Reduce consumption of calories from added sugarsb
38 School policies to facilitate access to clean drinking water
Increase the proportion of states and school districts with policies that require schools to provide access to free, clean, potable water throughout the school settingd
39 Consumption of fruits Increase the contribution of fruits to the diets of the population aged 2 years and olderb
40 Consumption of vegetables Increase the variety and contribution of total vegetables to the diets of the population aged 2 years and olderb,c
41 Consumption of whole grains Increase the contribution of whole grains to the diets of the population aged 2 years and olderb
42 Healthy vending policies in federal buildings and worksites
The federal government expands its healthy vending/concession guidelines to include all federal government-owned, -operated, and -occupied buildings, worksites, and facilitiesd
43 Nutrition standards in child care Increase the number of states with nutrition standards for foods and beverages provided to preschool-aged children in child careb
Strategy 2-4: Introduce, modify, and utilize health-promoting food and beverage retailing and distribution policies
44 Food retail incentive policies Increase the number of states that have state-level policies that incentivize food retail outlets to provide foods that are encouraged by the Dietary Guidelines for Americansb
45 Fast food outlet density Reduce the density of fast-food restaurants (per 100,000 population)
46 Healthy food outlet density Increase the proportion of healthy food outlets in communities across the United States
47 Price of fruit and vegetables Decrease the relative price of fruit and vegetables (compared to snack items)
APOP GOAL AREA 3: MESSAGING ENVIRONMENT
Strategy 3-1: Develop and support a sustained, targeted physical activity and nutrition social marketing program
48 Funding for national social marketing program
Federal funding for sustained, targeted physical activity and nutrition social marketing campaign, and designation of a lead federal agency to oversee itd
Strategy 3-2: Implement common standards for marketing foods and beverages to children and adolescents
49 Television marketing of foods and beverages to children and adolescents
Increase the proportion of foods and beverages marketed to children and adolescents that are recommended by the Dietary Guidelines for Americans and reduce the proportion of foods and beverages marketed that are not recommended by the Dietary Guidelines for Americans
TABLE 4-1 Continued
continued

Copyright © National Academy of Sciences. All rights reserved.
Evaluating Obesity Prevention Efforts: A Plan for Measuring Progress
Evaluating Obesity Prevention Efforts102
Indicator Topic Objectivea
Strategy 3-3: Ensure consistent nutrition labeling for the front of packages, retail store shelves, and menus and menu boards that encourages healthier food choices
50 Purchase of foods and beverages recommended in Dietary Guidelines for Americans
Increase purchases of reformulated foods that meet the definition in the Dietary Guidelines for Americans of foods and beverages people should consume in greater quantities and reduce purchases of items not recommended by the Dietary Guidelines for Americans
Strategy 3-4: Adopt consistent nutrition education policies for federal programs with nutrition education components
51 Nutrition education policies for federal nutrition programs
Increase the proportion of states that adopt Supplementation Nutrition Assistance Program (SNAP) education component (SNAP-Ed) curricula that note which foods and beverages to increase (i.e., those recommended by the Dietary Guidelines for Americans) and which to decrease (e.g., solid fats and added sugars)d
52 Purchase by SNAP participants of foods and beverages recommended in Dietary Guidelines for Americans
Increase the proportion of foods and beverages purchased by SNAP participants that are recommended by the Dietary Guidelines for Americans and decrease the proportion of foods and beverages purchased that are not recommended by the Dietary Guidelines for Americans
APOP GOAL AREA 4: HEALTH CARE AND WORKSITES
Strategy 4-1: Provide standardized care and advocate for healthy community environments
53 Community-based primary prevention nutrition-related services
Increase the number of community-based organizations (including local health departments, tribal health services, nongovernmental organizations, and state agencies) providing population-based primary prevention services in the following area: nutritionb
54 Community-based primary prevention physical activity-related services
Increase the number of community-based organizations (including local health departments, tribal health services, nongovernmental organizations, and state agencies) providing population-based primary prevention services in the following area: physical activityb
55 BMI measurement by physicians Increase the proportion of primary care physicians who regularly measure the body mass index of their patientsb
56 Nutrition and weight counseling by physicians
Increase the proportion of physician office visits that include counseling or education related to nutrition or weightb
57 Physical activity-related counseling by physicians
Increase the proportion of physician office visits that include counseling or education related to physical activity
Strategy 4-2: Ensure coverage of, access to, and incentives for routine obesity prevention, screening, diagnosis, and treatment
58 Insurance incentives for healthful lifestyles
Increase the number of health plans that include incentives for maintaining healthful lifestylesd
59 Obesity screening and promotion strategies offered by health plans
Increase the number of health plans that promote obesity screening and preventiond
60 Obesity screening and prevention reimbursement strategies offered by health plans
Increase the number of health care plans that use innovative reimbursement strategies for screening and obesity prevention servicesd
TABLE 4-1 Continued

Copyright © National Academy of Sciences. All rights reserved.
Evaluating Obesity Prevention Efforts: A Plan for Measuring Progress
103Indicators for the Evaluation Plans
continued
Indicator Topic Objectivea
61 Obesity screening and prevention metrics
Increase the number of health plans reporting and achieving obesity prevention and screening metrics, including universal BMI assessment, weight assessment, and counseling on physical activity and nutrition for children, adolescents, and adultsd
Strategy 4-3: Encourage active living and healthy eating at work
62 Employee health promotion programs
Increase the proportion of worksites that offer an employee health promotion program to their employeesb(developmental)
63 Employee participation in health promotion programs
Increase the proportion of employees who participate in employer-sponsored health promotion activitiesb(developmental)
64 Employee participation in exercise programs
Increase the proportion of employed adults who have access to and participate in employer-based exercise facilities and exercise programsb(developmental)
Strategy 4-4: Encourage healthy weight gain during pregnancy and breastfeeding and promote breastfeeding-friendly environments
65 Exclusive breastfeeding Increase the proportion of children between the ages of 6 months and 5 years who were exclusively breastfed or given breast milk for their first 6 months
66 Hospital breastfeeding policies Increase the percentage of U.S. hospitals with policies and practices to support breastfeedingd
67 Employer lactation-support programs
Increase the proportion of employers that have worksite lactation-support programsb
68 Breastfeeding disparities Reduce disparities in breastfeeding initiation and maintenanced
APOP GOAL AREA 5: SCHOOLS AND CHILD CARE ENVIRONMENTSe
Strategy 5-1: Require quality physical education and opportunities for physical activity in schools
69 Daily school physical education Increase the proportion of adolescents who participate in daily school physical educationb
70 Daily school physical education Increase the proportion of public and private schools that require daily physical education for all studentsb
71 School recess—state Increase the number of states that require regularly scheduled elementary school recessb
72 School recess—school district Increase the proportion of school districts that require regularly scheduled elementary school recessb
73 School recess time Increase the proportion of school districts that require or recommend elementary school recess for an appropriate period of timeb
Strategy 5-2: Ensure strong nutritional standards for all foods and beverages sold or provided through schools
74 Availability of healthy food options in schools
Increase the proportion of school districts that require schools to make fruits or vegetables available whenever other food is offered or soldb
75 School Breakfast Program in schools
Increase the proportion of schools with a School Breakfast Programb
76 Child dietary intake in school Increase the proportion of children and adolescents aged 5-18 who consume foods and beverages at school recommended by the Dietary Guidelines for Americansd
TABLE 4-1 Continued

Copyright © National Academy of Sciences. All rights reserved.
Evaluating Obesity Prevention Efforts: A Plan for Measuring Progress
Evaluating Obesity Prevention Efforts104
Indicator Topic Objectivea
77 Federal school meal standards Increase the proportion of schools offering meals that meet the 2012 federal nutrition standards for school meals.
78 Child dietary intake of solid fats and added sugars in school
Decrease the proportion of children and adolescents aged 5-18 who consume foods and beverages at school not recommended by the Dietary Guidelines for Americans such as those containing solid fats and added sugarsd
79 Farm-to-School programs Increase the number of schools with Farm-to-School programs
Strategy 5-3: Ensure food literacy in schools
80 National Health Education Standards
Increase the proportion of schools that require cumulative instruction in health education that meet the National Health Education Standards for elementary, middle, and senior high schoolsb
81 Nutrition professional development for teachers
Increase the proportion of required health education classes or courses taught by a teacher who has had professional development related to nutrition and dietary behavior within the past 2 years
GOAL AREA 5: RELATED AND RELEVANT INDICATORS
82 College physical education Increase the proportion of college and university students who receive information from their institution on the priority health risk behavior area: inadequate physical activityb
83 College nutrition education Increase the proportion of college and university students who receive information from their institution on the priority health risk behavior area: unhealthy dietary patternsb
* The indicators in Table 4-1 are best aligned with the recommendations included in the IOM’s Accelerating Progress in Obesity Prevention report (IOM, 2012) based on available and ongoing data sources.NOTE: Physical activity is defined to include large muscle or gross motor activity, development, and/or equipment as well as vigorous or moderate physical activity. A healthy food outlet is defined as a grocery store or produce stand/farmers’ market. A supportive neighborhood is usually or always an area where neighbors help each other and watch each other’s children, where parents feel children are safe at school, and where trusted adults are nearby. a Objective wording based on wording available from data source and/or from Healthy People 2020 (HHS, 2010), if applicable. See Table 4-2 for data sources associated with each indicator.b Healthy People 2020 indicator (HHS, 2010). “Developmental” indicates that there were no baseline data available for the indicator and therefore it did not have a set target at the time of the Committee’s work.c Leading Health Indicators are a subset of the Healthy People 2020 indicators selected on priority health issues (HHS, 2010).d Accelerating Progress in Obesity Prevention indicator (IOM, 2012).e Additional indicators in this table of interest related to the school and child care environment include school (#30 and #38) and child care (#27 and #43).
TABLE 4-1 Continued
areas and strategies. Using the four criteria for choosing indicators and objectives described above, the Committee consolidated the list into 83 indicators and concomitant objectives—13 overarching and 70 goal-area indicators and objectives.
Table 4-1 presents the 83 indicators identified by the Committee to (1) inform the national, state, and community plans; (2) to recommend items for strengthening surveillance systems with indicators that would have comparability across jurisdictions; and (3) as examples of indicators that could be used by independent evaluators who wish to design their own obesity prevention evaluation studies. The list of

Copyright © National Academy of Sciences. All rights reserved.
Evaluating Obesity Prevention Efforts: A Plan for Measuring Progress
105Indicators for the Evaluation Plans
indicators is intentionally broad, providing a menu of possible indicators for use by policy makers, plan-ners, and evaluators. Because the indicators and objectives were drawn from existing, readily available data sources and because priority was given to indicators and objectives that had been previously vetted (e.g., those from Healthy People 2020), the wording of the Committee’s objectives (see Table 4-1) matches the wording of the individual data source or the existing Healthy People 2020 objective.
Across these multiple data sources, there is variable information available on the reliability and validity of the systems and measures. For example, at the national level, the burden of obesity can be accurately assessed for various subgroups because large national surveys (e.g., National Health and Nutrition Examination Survey [NHANES]) take actual measures of the weight and height of the respon-dents. Generally at the state and community levels, however, only self-reported information on weight and height is available for adults through systems such as the Behavioral Risk Factor Surveillance System (BRFSS) or the Youth Risk Behavioral Surveillance System. Estimates based on self-reported weight and height will differ from, and be potentially biased compared to, estimates based on objective measurements (Gillum and Sempos, 2005; Yun et al., 2006). Estimation may be biased across various socio-demographic groups and across time periods (where body mass index underestimation may be increasing over time) (Le et al., 2013; Shiely et al., 2013; Yun et al., 2006).
The list of indicators is intended to illustrate the range of indicators that may be considered by eval-uators based on currently available data sources, but in no way is it intended to be exhaustive, nor does it necessarily include the best indicators for a given strategy or goal. The Committee was not able to assess which indicators might be the “best” in every case or which combination(s) of indicators might be ideal for the national and/or community plans or for individual obesity prevention evaluation studies. Rather, the Committee identified a range of overarching/system-level and goal area–specific indicators that were best aligned with the APOP recommendations (IOM, 2012) based on available and ongoing data sources. The discussion below provides recommendations for future work on indicator development.
Although obesity rates in the United States may have plateaued in some population subgroups, overall rates remain stubbornly high, and disparities across multiple levels, including race/ethnicity, income, and gender appear to be increasing. Many factors contribute to the intractability of disparities in the prevalence of obesity, ranging from the social, built, policy, and economic environments to individual behaviors, physiology, and epigenetics. Thus, tracking and monitoring of differential rates of exposures to these factors and their subsequent influence on obesity incidence and prevalence is important. Rather than developing a separate set of indicators specifically for disadvantaged populations, the Committee recom-mends that available indicators, such as those included in Table 4-1, be used broadly, expanded as needed, and include traditionally disadvantaged groups in an effort to evaluate progress on obesity efforts among populations most affected. In Chapter 5 of this report, the Committee provides context for obesity pre-vention in disadvantaged populations, related challenges, and a summary of the methods and tools that are likely to be useful.
dATA SOURCES
In the United States, several monitoring surveys and surveillance systems have been used to docu-ment weight status and related measures using nationally representative samples, including NHANES, the National Health Interview Survey, and periodic evaluations of nutrition program participants.

Copyright © National Academy of Sciences. All rights reserved.
Evaluating Obesity Prevention Efforts: A Plan for Measuring Progress
Evaluating Obesity Prevention Efforts106
Evaluations that collect data representative of state populations include the Centers for Disease Control and Prevention’s BRFSS and the Youth Risk Behavior Surveillance System, and others. These surveys and surveillance systems differ according to the geographic level of data (e.g., national, state, regional, county, municipal, school district, etc.); types of measures (e.g., objective versus subjective [self-report]), including nutrition and physical activity–related behaviors; periodicity; population (e.g., adults, children, program participants, etc.); and purpose (e.g., monitoring, policy making, regulatory, safety, evaluation). Surveillance systems in the United States focus more on nutrition-related measures than on physical activ-ity. Additionally, current national surveillance and monitoring efforts lack surveillance/summative evalu-ations of obesity-related policies and environ mental features, probably because of the relatively recent focus on policies and the environment as levers for intervention activities (see Chapter 1). Furthermore, as indicated in Table 4-2, most of the indicators included in Table 4-1 are available from large, national data systems providing data estimates at the national or state levels primarily, with only a few systems provid-ing data estimates below the state level. Appendix D provides detailed information on each of the data sources listed in Table 4-2, including the sponsoring organization, study design, periodicity, and popula-tions studied. Tables 6-3 and 7-2 list specific indicator topics and data sources at the national and state levels and at the community level, respectively.
TABLE 4-2 Data Sources for Recommended Indicator Topics* and Available Level of Estimates
Data Source Indicator Topic(s) Level of Estimates Available
1 American Community Survey (ACS)
• Adult active transport by walking• Bicycling by adults
• National, state, county, city, zIP code, selected American Indian/Alaskan Native areas
2 Behavioral Risk Factor Surveillance System (BRFSS)
• Adult physical activity• Consumption of fruit (adults)• Consumption of vegetables (adults)• Obesity (adult)• Overweight (adult)
• National, state, selected metropolitan/micropolitan statistical areas, selected counties
3 Bridging the Gap (BTG) • Availability of healthy food options in schools
• Daily school physical education• School Breakfast Program in schools • School policies to facilitate access to
clean drinking water• School recess—state• School recess—school district• School recess time• Sugar-sweetened beverage policies in
schools• Sugar-sweetened beverage taxation
• National, state
4 Centers for Disease Control and Prevention (CDC) Chronic Disease State Policy Tracking System
• Policies that promote physical activity and the built environment
• Sugar-sweetened beverage taxation
• State

Copyright © National Academy of Sciences. All rights reserved.
Evaluating Obesity Prevention Efforts: A Plan for Measuring Progress
107Indicators for the Evaluation Plans
Data Source Indicator Topic(s) Level of Estimates Available
5 CDC State Indicator Report on Fruits and Vegetables
• Food retail incentive policies • National, state
6 Classification of Laws Associated with School Students (CLASS)
• School policies to facilitate access to clean drinking water
• Sugar-sweetened beverage policies in schools
• National, state
7 County and zIP Code Business Patterns (CzCBP)
• Fast-food outlet density• Healthy food outlet density• Recreational facility outlet density
• National, state, county, metropolitan/micropolitan statistical areas, zIP code
8 Federal appropriations laws • Funding for national social marketing program
• National
9 General Services Administration (GSA)
• Healthy vending policies in federal buildings, worksites, and facilities
• National
10 Healthcare Effectiveness Data and Information Set (HEDIS)
• Obesity screening and prevention metrics
• National, regional, state
11 Infant Feeding Practices Study II (IFPS-II)
• Employer lactation support programs • Gestational weight gain• Maternal post-pregnancy weight• Maternal pre-pregnancy weight
• National
12 National Ambulatory Medical Care Survey (NAMCS)
• Insurance incentives for healthy lifestyles
• Nutrition and weight counseling by physicians
• Obesity screening and prevention reimbursement strategies
• Obesity screening and promotion strategies offered by health plans
• Physical activity-related counseling by physicians
• National
13 National College Health Assessment (NCHA)
• College nutrition education• College physical education
• National
14 National Compensation Survey–Benefits (NCS)
• Employer lactation support programs • National, selected metropolitan/micropolitan statistical areas, census regions, census division
15 National Consumer Panel (formerly known as A.C. Nielsen Homescan)
• Purchase of foods and beverages recommended in Dietary Guidelines for Americans
• National
16 National Farm-to-School Network
• Farm-to-School programs • National, state
continued
TABLE 4-2 Continued

Copyright © National Academy of Sciences. All rights reserved.
Evaluating Obesity Prevention Efforts: A Plan for Measuring Progress
Evaluating Obesity Prevention Efforts108
Data Source Indicator Topic(s) Level of Estimates Available
17 National Health and Nutrition Examination Survey (NHANES)
• Adolescent physical activity• Adult energy intake • Adult physical activity• Child and adolescent daily vigorous
physical activity• Child and adolescent energy intake• Child school dietary intake• Child school dietary intake of solid fats
and added sugars (SoFAS)• Consumption of added sugars• Consumption of fruits• Consumption of solid fats• Consumption of solid fats and added
sugars (SoFAS)• Consumption of vegetables• Consumption of whole grains• Obesity (adult, adolescent, child, and
preschool age)• Overweight (adult, adolescent, child,
preschool age, and infant)• Physical activity for older adults• Purchase by Supplemental Nutrition
Assistance Program (SNAP) participants of foods and beverages recommended in Dietary Guidelines for Americans
• Sugar-sweetened beverage consumption
• National
18 National Health Interview Survey (NHIS)
• Adult physical activity• Employee participation in exercise
programs • Physical activity for older adults
• National, selected state estimates w/ years combined
19 National Household Travel Survey (NHTS)
• Active commuting to school• Bicycling by adults
• National, selected states (if they choose to add on)
20 National Immunization Survey (NIS)
• Breastfeeding disparities • National, state, selected large urban areas
21 National Profile of Local Health Departments
• Community-based primary prevention nutrition-related services
• Community-based primary prevention physical activity–related services
• National
22 National Resource Center for Health and Safety in Child Care and Early Education—State Licensing Information
• Nutrition standards in child care• Physical activity requirements for
licensed child care
• State
TABLE 4-2 Continued

Copyright © National Academy of Sciences. All rights reserved.
Evaluating Obesity Prevention Efforts: A Plan for Measuring Progress
109Indicators for the Evaluation Plans
Data Source Indicator Topic(s) Level of Estimates Available
23 National Survey of Children’s Health (NSCH)
• Child and adolescent daily vigorous physical activity
• Child and adolescent physical activity–related attitudes and perceptions
• Exclusive breastfeeding• Nonschool organized physical activity–
related activities
• National, state, Health Resources and Services Administration (HRSA) region
24 National Survey of Employer-Sponsored Health Plans
• Employee health promotion programs• Employee participation in health
promotion programs
• National
25 National Survey of Maternity Practices in Infant Nutrition and Care (mPINC)
• Hospital breastfeeding policies • National, state
26 National Survey on Energy Balance-related Care among Primary Care Physicians
• Body mass index measurement by physicians
• Insurance incentives for healthy lifestyles
• Nutrition and weight counseling by physicians
• Obesity screening and prevention reimbursement strategies
• Obesity screening and promotion strategies offered by health plans
• Physical activity–related counseling by physicians
• National
27 National Vital Statistics System • Birth weight• Gestational weight gain• Maternal pre-pregnancy weight
• National, state
28 Nielsen Media Research • Television marketing of foods and beverages to children and adolescents
• National, metropolitan, market groups (constructed by Nielsen)
29 NPD Group • Child and adolescent caloric intake in restaurants
• National
30 Pregnancy Risk Assessment Monitoring System (PRAMS)
• Gestational weight gain• Maternal pre-pregnancy weight
• State
31 Quarterly Food-at-Home Price Database (QFAHPD)
• Price of fruit and vegetables• Price of low-fat milk
• Community
TABLE 4-2 Continued
continued

Copyright © National Academy of Sciences. All rights reserved.
Evaluating Obesity Prevention Efforts: A Plan for Measuring Progress
Evaluating Obesity Prevention Efforts110
Data Source Indicator Topic(s) Level of Estimates Available
32 School Health Policies and Practices Survey (SHPPS)
• Availability of healthy food options in schools
• Daily school physical education• Joint/shared use of community facilities• National Health Education Standards• Nutrition professional development for
teachers• School Breakfast Program in schools• School policies to facilitate access to
clean drinking water• School recess• Sugar-sweetened beverage policies in
schools
• National, state, selected large districts
33 School Nutrition Dietary Assessment Study (SNDA)
• Availability of healthy food options in schools
• Farm-to-School programs• Federal school meal standards • School Breakfast Program in schools• Sugar-sweetened beverage policies in
schools
• National
34 State Birth Registries/Birth Records Databases
• Birth weight• Exclusive breastfeeding• Gestational weight gain (for states using
2003 revised live birth certificates)• Maternal pre-pregnancy weight
• State
35 State SNAP-Ed Plans (available from the U.S. Department of Agriculture) andSNAP Policy Database
• Nutrition education policies for federal nutrition programs
• State
36 Yale Rudd Center for Food Policy and Obesity—Legislative Database
• Sugar-sweetened beverage taxation • National, state, selected large metropolitan areas
37 Youth Risk Behavior Surveillance System (YRBSS)
• Adolescent physical activity• Consumption of fruit (adolescent)• Consumption of vegetables (adolescent)• Daily school physical education• Daily vigorous physical activity
(adolescent)• Obesity (adolescent)• Overweight (adolescent)• Sugar-sweetened beverage consumption
(adolescent)
• National, state, community
* Recommended Indicator Topics identified in Table 4-1.NOTE: Appendix D provides detailed information on each of the data sources listed in Table 4-2, including the sponsoring organization, study design, periodicity, and populations studied.
TABLE 4-2 Continued

Copyright © National Academy of Sciences. All rights reserved.
Evaluating Obesity Prevention Efforts: A Plan for Measuring Progress
111Indicators for the Evaluation Plans
Broader Population health and Obesity Prevention–Related Indicator Topics
In addition to indicators that could align with the APOP (IOM, 2012) goal areas and strategies, the Committee considered it equally important to identify a menu of additional indicator categories addressing broader population health and well-being. These obesity prevention–related indicators do not directly link to APOP topics, but they are important for the Committee’s national and community plans, as well as for independent obesity prevention–related evaluation studies. Such broader, population health and preven-tion indicators would offer perspective to obesity prevention efforts and would help to relate grassroots priorities and action to achievement of community and national improvements in health outcomes. These broader indicators should be viewed as complementary to the APOP indicators. Although not an exhaus-tive list, Table 4-3 provides examples of major categories of additional indicators that would be worthwhile to include in obesity prevention–related evaluation studies at the national and community levels.
GAPS IN ExISTING INdICATORS
Consistent with the APOP (IOM, 2012) strategies, the proposed goal-area indictors are heavily focused on policy, environment, and behavior changes with very few, if any, indicators addressing part-nerships and leadership or health equity issues. Although the Committee wanted to include indicators on each of these gap areas, it could not find any widely uniform data sources that address these categories of the framework, measured at regular intervals, or that were already or could be computed from the available data. As noted above, the vast majority of the indicators were compiled from sources provid-ing national- and state-level data, with only a limited number of sources providing readily available and repeated data below the state level. In Table 4-4 the Committee identifies examples of key national- and community-level surveillance gaps. Although not exhaustive, the list illustrates a range of data that if ful-filled would facilitate monitoring and evaluation of the implementation and impact of the full spectrum
TABLE 4-3 Categories of Broader Population Health and Well-Being Issues for Consideration in an Evaluation Plan
• Child feeding practices• Complementary feeding* (infants)• Food insecurity• Neighborhood safety/environment• Obesity-related chronic conditions (e.g., coronary heart disease, diabetes, gestational diabetes, hypertension)• Overall reported health status• Participation in federal nutrition assistance programs (WIC, NSLP, SBP, SNAP, etc.)• Participation in organized physical activities outside of school• Physical activity of mother/father• Physical inactivity and sedentary behaviors (e.g., time spent playing electronic video games or watching television)• Safe school environments• Sleep duration and quality
* Complementary feeding is defined as the feeding of solid foods.NOTE: NSLP = National School Lunch Program; SBP = School Breakfast Program; SNAP = Supplemental Nutrition Assistance Program; WIC = Special Supplemental Nutrition Program for Women, Infants, and Children.

Copyright © National Academy of Sciences. All rights reserved.
Evaluating Obesity Prevention Efforts: A Plan for Measuring Progress
Evaluating Obesity Prevention Efforts112
TABLE 4-4 Examples of Surveillance Needs Related to the Recommended APOP* Goals
Overarching/System-level• Communitya-level estimates of dietary- and physical activity–related environments, policies, programs, partnerships,
leadership, and social norms• Individual exposure to obesity prevention–related policies and programs on a daily basis (ideally at the state and
community levels as well as nationwide)• Data on social determinant variables (e.g., living and working conditions, stress, and social support)• National- and community-level data obtained from medical records including but not limited to:
— Gestational diabetes — Gestational weight gain — Maternal smoking during pregnancy — Overweight among young children (<2 years of age) based on World Health Organization growth charts
Goal Area 1: Physical Activity Environments (and Related Behaviors)• Adult walking activity• Community or shared-use agreements for physical activity/recreational purposes• Community-based physical activity programs such as those offered by Young Men’s Christian Associations and Boys
and Girls Clubs• Individual exposure to physical activity–related programs and policies on a daily basis (ideally at the state and
community levels as well as nationwide)• Land use and urban planning efforts aimed at facilitating walkable communities• Muscle- and bone-strengthening activity levels for children• Physical activity by young children aged 2-5• Physical activity/inactivity by location (e.g., domestic, leisure time, occupational, transportation [not work-related])• Readily compiled and accessible national and community-level geographic information system (GIS) data related to
the physical environment (e.g., sidewalks, trails, parks, playgrounds, etc.)
Goal Area 2: Food and Beverage Environments (and Related Behaviors)• Availability of sugar-sweetened beverages in stores, vending machines, and other outlets selling beverages outside of
school environments (ideally data at both the community and national levels) and data on individual-level purchasing of such items
• Commercial or private-sector food- and beverage-related policies, and programs as well as food and beverage availability and portion size data (ideally data would be available at the community and national levels)
• Community-level data on food and beverage pricing and promotion practices and the relative availability of healthy options as compared to unhealthy options in food outlets
• Community-level surveillance of food- and beverage-related policies, including zoning related to food outlets, taxation of sugar-sweetened beverages, and incentive programs to encourage development of outlets selling fruits and vegetables
• Individual-level snacking behavior• Individual exposure to nutrition-related policies and programs on a daily basis (ideally at the state and community
levels as well as nationwide)• Institutional-level interactions and collaborations such as farm-to-institution collaborations, industry and government
purchasers, and collaborations between developers, governments, and major chain supermarkets• Readily compiled and accessible nationwide and community-level GIS data related to the food and beverage
environment (e.g., food outlet density)• Availability of free easily accessible potable water• Surveillance of local policies on sugar-sweetened beverages• Surveillance of local policies on nutrition standards for foods and beverages provided to preschool-aged children in
child care

Copyright © National Academy of Sciences. All rights reserved.
Evaluating Obesity Prevention Efforts: A Plan for Measuring Progress
113Indicators for the Evaluation Plans
Goal Area 3: Messaging Environment• Nationwide and community-level data on child, adolescent, and adult exposure to obesity-related social marketing
campaigns• Community-level data on child, adolescent, and adult exposure to food and beverage advertising and sedentary
activity advertising
Goal Area 4: Health Care and Worksite Environments• Counseling on diet and physical activity by health care providers (as documented in electronic medical records)• National and community-level data on worksites with health promotion programs and policies and nutrition or
weight management counseling or classes• National and community-level data on the proportion of the workforce with sedentary jobs• National and community-level data on hospitals and worksites promoting healthy eating and active living • Proportion of states with health education classes or courses for health care providers that focus on nutrition and
physical activity
Goal Area 5: School and Child Care Environments• Individual-level data compiled at the national and community levels related to
— Child and adolescent knowledge of the Dietary Guidelines for Americans and Physical Activity Guidelines for
Americans
• National-, state-, and community-level data on policies, programs, and/or practices related to — Community use of school facilities for recreational purposes — Elementary, middle, and high schools providing sequential, comprehensive school health education, including
components related to unhealthy dietary behaviors and inadequate physical activity — All foods and beverages sold/served in early child care and school settings meet the recommendations of the
Dietary Guidelines for Americans or federal nutrition standards — Physical activity–related programs in child care and early childhood education settings
• Nutrition- and physical activity–related policies and programs on college campuses• Proportion of states with health education classes or courses for child care providers that focus on nutrition and
physical activity
* Accelerating Progress in Obesity Prevention (IOM, 2012).a For all items referring to “community-” level data, data are needed nationwide. The Committee intends that the surveillance activities would provide community-level information nationwide and not be limited to or necessarily nationally representative data.
TABLE 4-4 Continued
of the APOP strategies (IOM, 2012). As a key activity in the proposed National Obesity Evaluation Plan (see Chapter 6), the gaps identified in this chapter can provide guidance for improving the infrastructure for continuous, nationwide monitoring and surveillance of progress in implementing the APOP strategies. Chapter 10 provides recommendations and potential actions to improve existing surveillance and moni-toring systems and to address these gaps (see Recommendation 2).
SUMMARY
This chapter identifies a broad spectrum of indicators and data systems that could be used to evalu-ate progress in achieving the strategies recommended by the Committee to Accelerate Progress in Obesity Prevention (IOM, 2012). Although the list of existing indicators is vast, there are several gaps in existing surveillance systems and a limited number of indicators and surveillance systems that provide data below the national or state levels. Such issues are further addressed in the chapters that follow.

Copyright © National Academy of Sciences. All rights reserved.
Evaluating Obesity Prevention Efforts: A Plan for Measuring Progress
Evaluating Obesity Prevention Efforts114
REFERENCES
CAHMI (The Child and Adolescent Health Measurement Initiative). 2013. The National Survey of Children’s
Health. http://www.childhealthdata.org/learn/NSCH (accessed January 29, 2013).
CARES-University of Missouri. 2013. Childhood obesity GIS. http://www.childhoodobesitygis.org (accessed February
3, 2013).
CDC (Centers for Disease Control and Prevention). 2013. The Community Guide. http://www.thecommunityguide.
org/index.html (accessed January 30, 2013).
Community Commons. 2013. Community Commons. Together for the common good. http://www.
communitycommons.org (accessed April 19, 2013).
EBRI (Employee Benefits Research Institute). 2013. Employee data book on health benefits. http://ebri.org/
publications/books/?fa=databook (accessed February 3, 2013).
Gillum, R. F., and C. Sempos. 2005. Ethnic variation in validity of classification of overweight and obesity using
self-reported weight and height in American women and men: The third National Health and Nutrition
Examination Survey. Nutrition Journal 4(1):1-8.
HHS (Department of Health and Human Services). 2010. Healthy People 2020. http://www.healthypeople.gov/2020/
default.aspx (accessed January 31, 2013).
HHS. 2013. 2020 topics & objectives. http://www.healthypeople.gov/2020/topicsobjectives2020/default.aspx
(accessed May 28, 2013).
IOM (Institute of Medicine). 2009. Weight gain during pregnancy. Reexamining the guidelines. Washington, DC: The
National Academies Press.
IOM. 2011. Leading health indicators for Healthy People 2020: Letter report. Washington, DC: The National
Academies Press.
IOM. 2012. Accelerating progress in obesity prevention: Solving the weight of the nation. Washington, DC: The
National Academies Press.
Le, A., S. E. Judd, D. B. Allison, R. Oza-Frank, O. Affuso, M. M. Safford, V. J. Howard, and G. Howard. 2013. The
geographic distribution of obesity in the US and the potential regional differences in misreporting of obesity.
Obesity (Silver Spring) [March 20 Epub].
National Consumer Panel. 2013. National Consumer Panel. http://www.ncppanel.com/content/ncp/ncphome.html
(accessed March 20, 2013).
NCCOR (National Collaborative on Childhood Obesity Research). 2013. NCCOR Catalogue of Surveillance
Systems. http://tools.nccor.org/css (accessed February 3, 2013).
Shiely, F., K. Hayes, I. J. Perry, and C. C. Kelleher. 2013. Height and weight bias: The influence of time. PLoS ONE
8(1):e54386.
USDA (U.S. Department of Agriculture). 2013. Food Environment Atlas. http://www.ers.usda.gov/data-products/
food-environment-atlas.aspx (accessed February 3, 2013).
Yun, S., B. P. zhu, W. Black, and R. C. Brownson. 2006. A comparison of national estimates of obesity prevalence
from the Behavioral Risk Factor Surveillance System and the National Health and Nutrition Examination
Survey. International Journal of Obesity 30(1):164-170.

Copyright © National Academy of Sciences. All rights reserved.
Evaluating Obesity Prevention Efforts: A Plan for Measuring Progress
115
5Evaluating Progress in Promoting health Equity: A Review of Methods and Tools for Measurement
1
1 This summary does not include references. Citations to support statements made herein are given in the body of the report.
Why: Why promote equity in access to health-promoting resources and environments and reduce dispari-ties in health outcomes when evaluating obesity prevention efforts? Avoidable disparities exist in various populations (defined by economic, racial/ethnic, regional, or other strata) across the United States. Achieving health equity is critical to addressing obesity disparities insofar as it assures that everyone has a fair oppor-tunity to attain their full health potential with equal access to available care and community resources for equal need, equal utilization for equal need, and equal quality of care for all.
What: What can be done through evaluation to promote health equity? To address these challenges, mea-surement tools and research methods for assessing individual, diet, physical activity, and the environments should be culturally appropriate and include variables characterizing social advantage and disadvantage. Additionally surveillance systems need to take into account the varied environments for obesity preven-tion and control. One opportunity to do so is available via the National Collaborative on Childhood Obesity Research (NCCOR), which has developed a registry (NCCOR-R) to encourage the consistent use of common tools and research methods across childhood obesity research and prevention programs at the individual, community, and population levels. This chapter provides a detailed review of NCCOR-R tools and avail-able methods and identifies gaps in the current surveillance systems, with particular attention to obesity disparities.

Copyright © National Academy of Sciences. All rights reserved.
Evaluating Obesity Prevention Efforts: A Plan for Measuring Progress
Evaluating Obesity Prevention Efforts116
How: How should effective evaluation and surveillance be accomplished to track progress in promoting health equity? Obesity disparities can be addressed across the five environments recommended in the Accelerating Progress of Obesity Prevention report (IOM, 2012). Although the indicators to measure are the same (see Chapter 4), there are gaps that need to be addressed including a paucity of tools and evaluation methods tailored to specific racial ethnic groups, a lack of consistency in defining and operationalizing core variables that are associated with social advantage and disadvantage, and a variety of surveillance chal-lenges (small numbers, lack of attention to language and culture, and lack of surveillance infrastructure).
Although the general population has seen increases in obesity, increases have been most pronounced across various racial/ethnic groups and socially disadvantaged populations, beginning in early child-
hood and continuing into adulthood (Dixon et al., 2012). These disparities, as defined by Whitehead (1992), are unnecessary and avoidable and are also considered unfair and unjust. Disparities are further defined by Braveman (2006) as “potentially avoidable differences in health (or in health risks that policy can influence) between groups of people who are more and less advantaged socially; these differences systematically place socially disadvantaged groups at further disadvantage on health” (Braveman, 2006, p. 180). Achieving health equity is critical to addressing obesity disparities insofar as it assures that every-one has a fair opportunity to attain their full health potential with equal access to available care and community resources for equal need, equal utilization for equal need, and equal quality of care for all (Braveman et al., 2011a,c; Whitehead and Popay, 2010).
Achieving health equity is a goal of Healthy People 2020 (HHS, 2010), which tracks the elimination of health disparities in the U.S. population in relation to several demographic factors: race and ethnicity, age, sex, sexual identity and orientation, disability status or special health care needs, and geographic location (rural and urban) (Koh, 2010; Koh et al., 2011; Riegelman and Garr, 2011). Tracking obesity rates among populations at risk also requires an understanding of how dimensions of disparities (e.g., sociocultural, socioeconomic, living conditions, life course) might impact obesity progression. Tools and methodologies that accurately capture these influences need to be relevant to the specific environments targeted for obesity prevention and control (e.g., physical activity, food and beverage, message, health care/worksite, school/early childhood environments2) (IOM, 2012).
The National Collaborative on Childhood Obesity Research (NCCOR) developed a registry to encourage “the consistent use of common (tools) and research methods across childhood obesity preven-tion and research at the individual, community, and population levels” (NCCOR, 2013). The NCCOR Registry (NCCOR-R), which was launched in 2011, includes a searchable database of obesity-related measurement tools and methodologies used in published papers that enable researchers to select instru-ments based on population, environment, and other descriptive properties. The description of the mea-surement tools and methodologies is derived from information abstracted from the published papers.
2 Child care was not an environment explicitly identified by the Accelerating Progress in Obesity Prevention report (IOM, 2012), but strate-gies related to child care were included within the five environments. This Committee added aspects related to the child care environment to the school environment.

Copyright © National Academy of Sciences. All rights reserved.
Evaluating Obesity Prevention Efforts: A Plan for Measuring Progress
117Evaluating Progress in Promoting Health Equity
These tools and research methods from the NCCOR-R assess individual diet and physical activity, as well as the environments in which these behaviors occur. It is the only existing registry related to measuring obesity and related environments, programs, and systems (developed with a focus on children).3
This chapter builds on the indicators identified in Chapter 4 and underscores the importance of the methods and tools for assessing individual behaviors and changes to diet, physical activity, and the environments should be culturally tailored and include variables that characterize social advantage and dis advantage (called in this chapter “dimensions of disparities”). Although the indicators of progress identified in Chapter 4 do not differ for various populations, the methods and tools for assessing popula-tions with disparities should. The rest of this chapter (1) assesses the NCCOR-R for tools and methods appropriate to track and evaluate disparities in rates of obesity between population subgroups; (2) reviews the extent to which these tools and methods address social and other environmental influences of health disparities, in addition to behavioral determinants; and (3) identifies existing gaps in capacity to track progress in preventing obesity among disadvantaged groups. This chapter offers a compilation of tools and methods available for use, with particular attention paid to obesity disparities, and calls attention to the opportunities that exist with the NCCOR-R to encourage the use of common tools research methods and the gaps that remain.
dEFINING whO, whAT, ANd whERE: ESSENTIAL dEFINITIONS
The pathways for addressing modifiable factors across environments targeted for obesity prevention require an understanding of two important concepts: robust measurement tools and research methods appropriate for disadvantaged populations, and knowledge of the multiple social influences on obesity-related disparities (Braveman et al., 2011c; Lovasi et al., 2009). The following sections define three of these components, designed to answer who to assess (the disadvantaged populations at risk for obesity disparities); what to assess (dimensions and constructs of health disparities, equity); and where to assess (environments targeting obesity prevention). Figure 5-1 depicts a model for organizing, identifying, and assessing tools and methods of disparity and health equity identified in the NCCOR-R and depicts the relationships and interactions among and across these components. It offers a way to understand and organize the “who” (populations at risk for disparities), the “what” (the dimensions that can be improved and evaluated), and the “where” (environments that target obesity prevention efforts, as recommended in the Institute of Medicine (IOM) Accelerating Progress of Obesity Prevention (APOP) report (IOM, 2012). These components are detailed in this section.
who to Assess: disadvantaged Populations at Risk for Obesity disparities
This section reviews targeted populations at risk for obesity, as defined by Healthy People 2020 cri-teria (HHS, 2010). Each of these populations and their relevance to obesity disparities and health equity is described below.
3 See limitations of this review in Appendix E.

Copyright © National Academy of Sciences. All rights reserved.
Evaluating Obesity Prevention Efforts: A Plan for Measuring Progress
Evaluating Obesity Prevention Efforts118
Figure 5-1.eps
Message Environments
Physical Activity
Environments
SchoolEnvironments
Food and Beverage
Environments
Health Careand Work
Environments
Dimensions of Disparities
• Sociocultural Influences
• Socio-economic Influences
• Life-course Exposure
• Living and Working Conditions in Homes and Communities
Populations at Risk for Disparities
• Racial/Ethnic Groups
• Gender• Sexual Identity
and Orientation
• Disability Status or Special Health Care Needs
• Geographic Location
FIGURE 5-1 Model for understanding the relationship and interaction among and across those who are at risk for disparities and environmental, policy, and social determinants (environments, dimensions) of disparity, health equity, and risk of obesity.
Racial Ethnic Disparities
Racial and ethnic disparities in obesity are well documented (IOM, 2012). Racial and ethnic dispari-ties begin in early childhood, as evidenced by the fact that in 2009-2010 Hispanic (21 percent) and non-Hispanic black (24 percent) children and adolescents had higher rates of obesity than non-Hispanic white children and adolescents (14 percent) (Ogden et al., 2012). In 2010, the highest prevalence in children aged 2-4 years was among American Indian or Alaska Natives (21.1 percent) and Hispanic (17.6 percent) children (Dalenius et al., 2012). Other studies among Hawaiian-Pacific Islanders report Samoan children also have a high prevalence of obesity (17.5 percent in 1-year-olds and 27 percent among 2- to 4-year-olds vs. 2.3 percent in 1-year-old Asians and 7.3 percent among black 2- to 4-year-olds) (Wang, 2011). These obesity disparities track into adulthood: non-Hispanic black adults exhibit the highest age-adjusted rates of obesity (49.5 percent) compared with Mexican Americans (40.4 percent), all Hispanics (39.1 percent), and whites (34.3 percent) (Flegal et al., 2012).
Sex Disparities
Between 1988-1994 and 2007-2008, obesity increased more among boys than girls (Wang, 2011). Among boys aged 2-19 in 2003-2009, Mexican Americans had the highest combined prevalence (40.5 per-cent vs. 34.5 percent in whites and 32.1 percent in African Americans) (Wang, 2011). In girls, African Americans had the highest prevalence (44.5 percent vs. 31.7 percent in whites and 37.1 percent in Mexican Americans) (Wang, 2011). Among children grades 3-5 in seven American Indian communities, 26.8 percent of American Indian boys and 30.5 percent of American Indian girls were found to be obese (Caballero et

Copyright © National Academy of Sciences. All rights reserved.
Evaluating Obesity Prevention Efforts: A Plan for Measuring Progress
119Evaluating Progress in Promoting Health Equity
al., 2003). Although in 2009-2010 there were no differences in age-adjusted mean body mass index (BMI) between U.S. men and women, the rate of increase over the 12-year period since 1999 was significant only for men (Flegal et al., 2012).
Sexual Identity and Orientation
Some studies have documented disparities in overweight adversely affecting lesbian women (Boehmer et al., 2007). Boehmer and colleagues (2007) reported higher rates of overweight and obesity when comparing lesbian to heterosexual women (69.5 percent to 50.3 percent, respectively), but not among bisexual women (51.5 percent). However, in the Nurses’ Health Study, Jun and colleagues reported both lesbian and bisexual women were more likely than heterosexual women to experience adverse-weight-gain trajectories (Jun et al., 2012). Other studies among gay men reported more than 50 percent being either overweight or obese and cite a need to address these health concerns among this high per-centage risk group (Guadamuz et al., 2012).
Disability Status or Special Health Care Needs
Obesity rates for children with disabilities are 38 percent higher than for children without dis-abilities (NCBDDD, 2012). Among youth, there is a higher prevalence of being overweight among chil-dren and adolescents with spina bifida, cerebral palsy, Down syndrome, and autism (Hurvitz et al., 2008; Matson et al., 2011; Rimmer et al., 2011; Simeonsson et al., 2002). For example, adolescents with autism and Down syndrome were two to three times more likely to be obese than adolescents in the general pop-ulation; obesity among adolescents with physical and cognitive disabilities (17.5 percent) is significantly higher than among adolescents without disabilities (13.0 percent) (Rimmer et al., 2010, 2011). Obesity among adults with disabilities is higher among women than among men (46.9 percent vs. 35.2 percent) (Armour et al., 2012).
Geographic Location (Rural/Urban)
Overweight and obesity varies by urban versus rural geographic location: 9 of the 10 states with the highest rates of obese children are in the South (Bethell et al., 2009; Levi et al., 2012). There is also evidence that rural children are more likely than urban children to be obese; more than one-third of chil-dren in both large (34.6 percent) and small rural areas (35.2 percent) had a BMI at or above the 85th per-centile for their age and sex, compared to 30.9 percent of urban children (National Survey of Children’s Health, 2011). Among children in large rural areas, 46.3 percent of those in poverty were overweight or obese, compared to 23.7 percent of those with household incomes above poverty level (National Survey of Children’s Health, 2011). National studies of adults show similar urban-rural differences in obesity prevalence (Befort et al., 2012; Jackson et al., 2005; Patterson et al., 2004).
what to Assess: dimensions of health disparities, Equity, and Obesity
Measurement tools and methods to describe the dimensions of disparity are important to under-standing obesity prevalence among disadvantaged populations. Braveman and colleagues pointed to upstream dimensions that characterize social advantage and disadvantage, and have particular rel-evance in assessing and understanding obesity disparities among high-risk populations (Braveman et al.,

Copyright © National Academy of Sciences. All rights reserved.
Evaluating Obesity Prevention Efforts: A Plan for Measuring Progress
Evaluating Obesity Prevention Efforts120
2011a,b). Sociocultural and socioeconomic influences, living and working conditions, and timing or life course exposure to disadvantage, described below and represented in Figure 5-1, are important to opera-tionalize and to measure if they are to explain accurately the behavioral pathways to obesity disparities such as differential food consumption and physical activity patterns.
Sociocultural Influences
For this section, relevant markers of the sociocultural domain include racism and dis crimination, stress and social support, culture and acculturation (Braveman, 2006, 2009; Chakraborty and Chakraborty, 2010). Racism is defined by intentionally discriminatory actions and attitudes as well as those embedded in societal structures that systematically constrain opportunities and resources based on race or ethnic group (Flaskerud and DeLilly, 2012; Williams and Sternthal, 2010). Racial discrimination can influence health through pathways causing lower levels of socioeconomic status, residential segrega-tion, and chronic stress related to racial/ethnic bias (Flaskerud and DeLilly, 2012; Williams and Sternthal, 2010). In contrast, social support and cohesion are assets that may ameliorate stress, promote resilience, buffer negative sequelae, and improve health outcomes (Davies et al., 2011; Gee and Payne-Sturges, 2004). Issues of culture and acculturation are also important given the rise in U.S. immigration and obesity prevalence. Oza-Frank and Cunningham (2010) found a significant, positive relationship between BMI and duration of residence of immigrants in the United States. Perspectives of body image and weight also vary by culture (Bennett and Wolin, 2006). Acculturation, the process by which immigrant popu-lations adopt the attitudes, values, customs, beliefs, and behaviors of a new culture, may also explain obesity disparities among certain racial ethnic groups (Chakraborty and Chakraborty, 2010; Das, 2013; Perez-Escamilla, 2011; Perez-Escamilla and Putnik, 2007).
Socioeconomic Influences
Several studies show that education or occupation, as markers of economic resources and of prestige or social standing, define numerous risks for obesity (Kawachi et al., 2005; Williams and Sternthal, 2010). Income (monetary earnings during a specified time period) and wealth (accumulated material assets such as ownership or the value of one’s home) also have important influences to consider. Racial/ethnic differ-ences in income may markedly underestimate differences in wealth as important to understanding dispari-ties (Wolff et al., 2010; Woolf and Braveman, 2011). Tools and methodologies that address these con-structs with detail and sensitivity are needed to adequately understand the depth of economic influences on disparities.
Food insecurity may mediate socioeconomic influences on obesity. A household is “food secure” if it has access at all times to enough food and “food insecure” if it has difficulty getting enough food because of a lack of resources. As the rate of poverty in the United States has increased in recent years (DeNavas-Walt et al., 2012), so too has the proportion of households experiencing severe food insecurity (Coleman-Jensen et al., 2012). Low-income, ethnic-minority, and female heads of households experience the great-est risk of food insecurity (Nord et al., 2009). Food insecurity may provoke changes in dietary habits: reduced food intake, reduced diet quality, and increased meal skipping (USDA, 2013). Paradoxically, food insecurity also may increase obesity risk, particularly among women; research has less consistently shown a relationship between food insecurity and weight status among children, adolescents, and men (Franklin et al., 2012; Larson and Story, 2011).

Copyright © National Academy of Sciences. All rights reserved.
Evaluating Obesity Prevention Efforts: A Plan for Measuring Progress
121Evaluating Progress in Promoting Health Equity
Living and Working Conditions
The availability and quality of services such as medical care, schools, or employment opportunities, can reinforce socioeconomic and racial/ethnic disparities in obesity (Braveman, 2012). Disparities can also be affected by physical conditions related to adequate housing, air and water quality, public trans-portation, and street connectivity or density (Braveman et al., 2011a,b; Lovasi et al., 2009; Woolf and Braveman, 2011). For this section, the quality of the built environment, and physical form of communi-ties, are assessed as having direct influence on physical activity and other behaviors associated with the prevention and control of obesity. Functional markers include elements of walking surface, streets, traffic; safety, characterized by personal elements; aesthetic, characterized by traffic streetscape; and destination, characterized by views and facilities (Brownson et al., 2009).
Exposure Over the Life Course
The duration of time one spends growing up in deprived physical environments, with poor access to food and activity, is likely to have significant impact on obesity outcomes (Dixon et al., 2012). Childhood disadvantage has been associated with increased risk of obesity from childhood through adulthood, and those who are disadvantaged across the life course are at highest risk (Coogan et al., 2012). The concept of weathering, defined as the cumulative burden of adverse psychosocial and economic circumstances on the physical health of minority populations, has been associated repeatedly with adverse health risks among African American women and men (Das, 2013; Love et al., 2010). Historical trauma endured by American Indian and Alaskan Native populations over multiple generations is also associated with nega-tive physical and health consequences (Evans-Campbell, 2008). Measurement of life course exposure to disadvantage is needed to understand and intervene on pathways that will help to promote health equity (Evans-Campbell, 2008; Huff and Kline, 1999).
where to Assess: Environments Targeting Obesity Prevention
The five critical environments for policy and related interventions identified in the APOP report (IOM, 2012) reflect a systems perspective in recognition of where people spend their time and how that can influence their intake, activity, and weight. These five environments, abbreviated in Figure 5-1, serve as the basis for tracking progress in meeting recommendations, goals, and actions to address obesity, pre-vent disparities, and promote health equity.
Physical Activity Environment
Identification of any inequitable distortion of resources that may be promoting disparities in physi-cal activity requires tools and research methods to measure the physical environment and is important for public policy (Gordon-Larsen et al., 2006). For this chapter, the physical activity environment as an indi-cator was defined by community or home settings, reflecting key tools and methods defined by Brownson et al. (2009). These are summarized across three categories: (1) perceived tools and methods obtained by telephone interview or self-administered questionnaires; (2) observational tools and methods obtained using systematic observational methods (audits); and (3) archival data sets that are often layered and ana-lyzed with geographic information systems (GIS).

Copyright © National Academy of Sciences. All rights reserved.
Evaluating Obesity Prevention Efforts: A Plan for Measuring Progress
Evaluating Obesity Prevention Efforts122
Food and Beverage Environment
Access and availability to healthful foods is an important component of a quality food environment and may contribute to obesity disparities (Glanz et al., 2005, 2007). McKinnon and colleagues (2009) suggest the importance of tools and methods that assess places where food can be purchased including food stores, restaurants, worksite cafeterias, and schools. In addition, this chapter assesses methods of measuring quality of foods within the community and home setting.
Message Environment
Marketing strategies that encourage excess consumption of food or discourage physical activity may contribute to disparities in the predisposition of people to gain weight (Glanz et al., 2012; Grier and Kumanyika, 2008). For this chapter, indicators of the message environment are measured by duration and frequency of exposure to marketing/advertisements and by packaging (including the effects of package design and package-based claims) (Chandon and Wansink, 2012).
Health Care and Work Environments
Health care and work environments affect most people, are often interconnected, and can directly influence disparities among populations with obesity (Archer et al., 2011). For this review, methods for measuring the health care and work environments focused on settings that include opportunities for health screenings, intervention by health care providers, the presence of employer-based wellness pro-grams, and other components of a supportive food and physical activity environment in the worksite.
School and Early Child Care Environments
Schools and early child care settings provide venues for reaching nearly all children across the coun-try. Structuring these educational environments to assure access to healthy food and adequate physical activity is crucial to preventing and controlling childhood obesity among high-risk populations (Gittelsohn and Rowan, 2011). For this review, the Committee evaluated tools and methods targeting the school and child care settings.
Tools and Methods for Assessing Progress in Obesity Prevention Targeting Populations with health disparities
The following table (see Table 5-1) presents findings for tools and methods for populations of risk or sources of social influence organized by the five environments targeting obesity prevention. The meth-odology for reviewing and identifying the tools and methods is summarized in Box 5-1. A summary of the findings and more detailed information for each individual tool and method is provided by environment in Appendix E.

Copyright © National Academy of Sciences. All rights reserved.
Evaluating Obesity Prevention Efforts: A Plan for Measuring Progress
123Evaluating Progress in Promoting Health Equity
TABLE 5-1 Summary of the Number of National Collaborative on Childhood Obesity Research Registry (NCCOR-R) Tools and Methodsa by Environment Targeting Obesity Prevention Efforts for Populations at Risk of Obesity and Social Influences
Environment Number of NCCOR-R Tools and Methods by SubpopulationPopulation/Social Influence
Physical Activity
Food and Beverage
Message and Media
Worksite/ Health Care
School/Early Childhood
Racial/EthnicAfrican American 1 13 3 0b 1 18AI/AN only 1 0 0 0 2 3Hispanic only 2 1 1 0 0 4Hawaiian/Pacific only 0 0 0 0 0 0Asian only 0 0 0 0 2 2Multi-ethnic 1 2 0 0 1 4Multi-ethnic (Caucasian and other
ethnic populations)59 31 3 2 21 116
SexFemale only 6 4 0 0 4 14Male only 0 1 0 0 0 1Male/Female 47 14 2 1 13 138
Sexual Identity/Orientation 0 0 0 0 0 0Disability/Special Health Care Needs 1 0 0 0 0 1Geographic Location
Rural only 0 1 0 0 0 1Urban only 36 30 8 2 15 91Rural and urban 10 7 0 0 0 17
Social InfluencesSociocultural variables 1 1 1 0 4 7Socioeconomic variables 0 10 0 0 0 10Living and working conditions 53 45 7 2 16 123Duration of exposure 1 0 0 0 0 1
Total Number of NCCOR-R Tools and Methods Identified by Environmentc
65 51 8 2 48 Total: 174
a NCCOR-R contained 893 tools and methods at the time of review (January 2013). Exclusionary criteria applied: prior to 1998; individual tools and methods of dietary intake or physical activity; surveillance tools and methods. After applying exclusionary criteria, each tool and method was categorized by targeted population(s) (e.g., race/ethnicity, sex, sexual identity, disability, geographic location) and social deter-minants (e.g., sociocultural variables, socioeconomic variables, living and working conditions, duration of exposure). Each tool or method could apply to multiple populations at risk of obesity and social influences (e.g., one tool or method could apply to African American women in urban areas).b All 0 indicates factor was not reported in tools and methods found in the registry.c Total number of tools and methods identified for populations at risk of obesity, characterized by environment.NOTE: AI/AN = American Indian/Alaskan Native.SOURCE: National Collaborative on Childhood Obesity Research Registry (http://www.nccor.org/projects/measures/index.php, accessed November 11, 2013), as of January 2013.

Copyright © National Academy of Sciences. All rights reserved.
Evaluating Obesity Prevention Efforts: A Plan for Measuring Progress
Evaluating Obesity Prevention Efforts124
BOX 5-1 Methodology of Review of National Collaborative on Childhood Obesity Research Registry (NCCOR-R) for Identifying Tools and Methods for Assessing Progress in Obesity Prevention Targeting Populations with Health Disparities
Overview: NCCOR-R is a Web-based tool updated on an ongoing basis. At the time of this review, it contained 893 tools and methods. The tools and methods can be categorized around four filter options: domains (indi-vidual dietary behavior, food environment, individual physical activity behavior, physical activity environment); type (geographic information systems, 24-hour dietary recall or food frequency, electronic monitor, environ-mental observation, questionnaire, record or log, other); age (2-5 years, 6-11 years, 12-18 years); and context (metro/urban, small town/rural) (NCCOR, 2013). NCCOR-R focuses only on tools and methods relevant to chil-dren but notes if one also pertained to adults.
Exclusionary/Inclusionary criteria for identifying tools and methods within NCCOR-R target-ing populations with health disparities: exclusionary criteria included individual tools and methods of dietary intake or physical activity (e.g., 24-hour dietary recalls, food frequency tools and methods, or actigraph) and surveillance tools and methods because Accelerating Progress in Obesity Prevention (APOP) recommenda-tions focus on environmental and policy changes. [Individual tools and methods are the focus of other reviews (Brownson et al., 2004, 2009; McKinnon et al., 2009)]. Inclusionary criteria included domestic and global tools and methods from 1998 to the present. Individual tools and methods that focused on individual perceptions related to sociocultural influences (e.g., perceptions of culture, body image) were included. A secondary search was performed using key words for dimensions of influence (e.g., sociocultural and socioeconomic influences) to identify any tools and methods that may have been missed.
GAP ANALYSIS4
Evaluation Challenges
The Committee identified several gaps in measurement tools and methods that limit the ability of evaluation users to monitor and evaluate progress in preventing obesity among disadvantaged groups:
1. Tools and methods combining racial ethnic groups comprise the majority of available instru-ments. These tools and methods, analyzed by subpopulation of interest, are not sensitive to differences in language and culture and may result in inaccurate data collection and/or interpretation of findings. As a result, few NCCOR-R tools and methods are tailored to specific
4 This summary does not include references. Citations to support statements made herein are given in the body of the report.

Copyright © National Academy of Sciences. All rights reserved.
Evaluating Obesity Prevention Efforts: A Plan for Measuring Progress
125Evaluating Progress in Promoting Health Equity
Tools and methods meeting inclusionary criteria were
1. Identified for the five environments as recommended in the APOP report (physical activity, food and bever-age, message, health care and work, school). Each tool and method was placed in only one of the critical environments (priority of focus) to avoid duplication.
2. Assessed for use with populations at risk for disparities. Key words were used for each racial ethnic group (African American, Hispanic, American Indian and Alaskan Natives, Asian Americans, Hawaiian and Pacific Islanders), sex (female, male), disability, sexual identity of orientation, or geographic region (rural, urban).
3. Reviewed (based on provided descriptive information found on NCCOR-R website) using these questions:
• What is the level of focus of the tool or method (e.g., individual, community, policy)?
• What is the purpose of the tool or method?
• What is the population of focus?
• Did the tool or method include variables reflecting dimensions of disparities as defined in this chapter?
• What are the properties of the tool or method (e.g., number of items, method of delivery)?
• What is the sample size with which the tool or method was used?
• What were the psychometric properties?*
4. Detailed and summary tables were populated with the relevant information (see Appendix E). Two inde-pendent reviewers verified the coding of information.
* Psychometric properties are quantifiable attributes that relate to the statistical strength or weakness of data collected.
racial and ethnic groups, despite risks for obesity disparities. There are no tools or methods identified for Hawaiian Islanders and few specific to the cultural differences of Hispanics, American Indians/Alaskan Natives, and Asian Americans. A majority of tools and methods for African Americans are derived from one study conducted a decade ago (Story et al., 2003).
2. Most available tools and methods fail to identify the importance of male-female differences (sex and gender) as a distinguishing factor in obesity.
3. Tools and methods commonly available for urban populations often have little relevance to rural populations, a population for whom NCCOR-R contains few specific tools and methods.
4. Of significant concern is the paucity of appropriate tools and methods found in NCCOR-R for populations with disabilities or special needs, or sensitive to sexual identity or orientation.

Copyright © National Academy of Sciences. All rights reserved.
Evaluating Obesity Prevention Efforts: A Plan for Measuring Progress
Evaluating Obesity Prevention Efforts126
These gaps in measurement instruments limit the ability to interpret or understand causes of obesity dis-parities among these high-risk populations, suggesting they are at continued risk of an obesity burden. To understand the independent and interacting factors contributing to obesity in these high-risk popu-lations, we must ensure availability of sensitive and relevant tools and methods for all disadvantaged populations that recognize and seek to understand these differences.
Another gap is the lack of consistency in defining and operationalizing core constructs associated with disparities. The extensive literature available on disparities and health equity provides broad con-ceptual perspectives from which to derive constructs and definitions (Braveman et al., 2011c; Koh, 2010; Koh et al., 2011; Whitehead and Popay, 2010). The Committee’s review of measurement tools and methods built on constructs and indicators identified and operationalized from the literature and from the APOP and other IOM reports (see Chapter 4). This approach is critical to understanding the con-text within which obesity disparities and other health disparities develop and are perpetuated. The vast majority of tools and methods found addressed the construct of living and working conditions, defined by attributes of the physical environment and reflecting the work of several published reviews of the area (Brownson et al., 2009; McKinnon et al., 2009). In contrast, few tools and methods targeted disparities in relation to socioeconomic (e.g., wealth) or sociocultural influences (e.g., racial discrimination, accul-turation), at least as defined by our review. It was more likely that these constructs were identified as study covariates, that is, confounding variables to be controlled in the design or analysis, but not often as sensitive content included in tools and methods of interest in analyzing causal influence or evaluating dif-ferential outputs, outcomes, or impact of interventions. Of particular concern was the lack of tools and methods or content describing life course exposure to social and economic advantage and dis advantage, a critical element in understanding disparities. This inconsistency in what to measure, and how to measure, further complicates and confuses interpretation of findings relevant to understanding and assessing prog-ress in obesity disparities. Systematic inclusion of consistently defined variables is needed to better identify tools and methods, interpret findings, and understand the pathways to preventing disparities and achiev-ing health equity.
Additional work is needed to assure the psychometric quality of disparities-related tools and methods. Reports of psychometric testing varied across the current NCCOR-R tools and methods. Among those reporting psychometric properties, few cited tools and methods with both reliability and validity testing. This requires further caution in interpretation of any results, particularly related to tracking of obesity-related disparities.
The majority of the NCCOR-R instruments reflected quantitative approaches in measuring influ-ences on disparities or equity. Self-report methods and questionnaires were more common than objective methods. GIS was a frequently used approach to assess environmental quality and behavior. Alternatively, qualitative methods, which can provide a comprehensive and nuanced understanding of the causes of dis-parities and obesity as defined by the target population, were rarely used. Qualitative methods and tools should be promoted and included as a particularly important strategy for developing and adapting instru-ments for use with disadvantaged populations.
As described in Chapters 1, 3, 6, and 7, surveillance systems have progressed for obesity and obesity risk factors, and there is growing attention to environmental and policy factors. However, surveillance data are still often lacking for populations with disparities. Often, surveillance data are too sparse to address specific groups and concerns (e.g., risk factors among racial/ethnic subgroups) (Andresen et al.,

Copyright © National Academy of Sciences. All rights reserved.
Evaluating Obesity Prevention Efforts: A Plan for Measuring Progress
127Evaluating Progress in Promoting Health Equity
2004). For example, national data systems (e.g., National Health and Nutrition Examination Survey) do not adequately sample or provide data on Alaska Natives, Native Hawaiians, or on other U.S.-affiliated Pacific Islanders (Personal communication, Rachel Novotny, University of Hawaii, December 24, 2012; Novotny et al., 2013). The surveillance challenges for populations with disparities fall into three broad categories:
1. Small numbers: The large inflation of the relative standard error occurs with a numerator of less than 30, which is often required by the National Center for Health Statistics (Klein et al., 2002).
2. Limited attention to language and culture: Surveillance systems show lower participation rates for racial/ethnic minority groups and for individuals who do not speak English (Link et al., 2006).
3. Limited surveillance infrastructure: Often agencies that have the highest rates of disparities also lack resources, making it difficult to maintain adequate surveillance systems.
CONCLUSION
Identifying indicators aligned with the APOP report (IOM, 2012) are important for developing a common way forward for measuring progress toward obesity prevention for all populations (see Chapter 4). Yet, tools and research methods that are appropriately tailored and include variables that characterize social advantage and disadvantage are similarly important to evaluation efforts to understand how to pro-mote equity in access to health-promoting resources and environments. A small yet growing literature is developing on the tools and methods for monitoring progress on obesity prevention between populations with disparities in obesity prevalence. These issues are of high importance to both researchers and prac-titioners. Although the Committee identified limitations for all types of tools and methods appropriate for use with particular attention to obesity disparities, the NCCOR-R provides a useful starting point for several populations and settings or environments related to obesity prevention. As described here and in other chapters in this report, numerous challenges remain, such as continually improving tools and meth-ods, strengthening surveillance systems to sample these populations adequately, ensuring the relevant tools and methods for diverse population groups, and integrating tools and methods into public health surveil-lance and monitoring systems with criteria of need, effectiveness, and quality of services that are relevant to the various populations.
REFERENCES
Andresen, E. M., P. H. Diehr, and D. A. Luke. 2004. Public health surveillance of low-frequency populations. Annual
Review of Public Health 25:25-52.
Archer, W. R., M. C. Batan, L. R. Buchanan, R. E. Soler, D. C. Ramsey, A. Kirchhofer, and M. Reyes. 2011.
Promising practices for the prevention and control of obesity in the worksite. American Journal of Health
Promotion 25(3):e12-e26.
Armour, B. S., E. Courtney-Long, V. A. Campbell, and H. R. Wethington. 2012. Estimating disability prevalence
among adults by body mass index: 2003-2009 National Health Interview Survey. Preventing Chronic Disease
9:E178; quiz E178.
Befort, C. A., N. Nazir, and M. G. Perri. 2012. Prevalence of obesity among adults from rural and urban areas of the
United States: Findings from NHANES (2005-2008). Journal of Rural Health 28(4):392-397.

Copyright © National Academy of Sciences. All rights reserved.
Evaluating Obesity Prevention Efforts: A Plan for Measuring Progress
Evaluating Obesity Prevention Efforts128
Bennett, G. G., and K. Y. Wolin. 2006. Satisfied or unaware? Racial differences in perceived weight status.
International Journal of Behavioral Nutrition and Physical Activity 3:40.
Bethell, C., D. Read, E. Goodman, J. Johnson, J. Besl, J. Cooper, and L. A. Simpson. 2009. Consistently inconsis-
tent: A snapshot of across- and within-state disparities in the prevalence of childhood overweight and obesity.
Pediatrics 123(Suppl 5):S277-S286.
Boehmer, U., D. J. Bowen, and G. R. Bauer. 2007. Overweight and obesity in sexual-minority women: Evidence from
population-based data. American Journal of Public Health 97(6):1134-1140.
Braveman, P. 2006. Health disparities and health equity: Concepts and measurement. Annual Review of Public
Health 27:167-194.
Braveman, P. 2009. A health disparities perspective on obesity research. Preventing Chronic Disease 6(3):A91.
Braveman, P. 2012. Health inequalities by class and race in the US: What can we learn from the patterns? Social
Science and Medicine 74(5):665-667.
Braveman, P., S. Egerter, and D. R. Williams. 2011a. The social determinants of health: Coming of age. Annual
Review of Public Health 32:381-398.
Braveman, P. A., S. A. Egerter, and R. E. Mockenhaupt. 2011b. Broadening the focus: The need to address the social
determinants of health. American Journal of Preventive Medicine 40(1 Suppl 1):S4-S18.
Braveman, P. A., S. Kumanyika, J. Fielding, T. Laveist, L. N. Borrell, R. Manderscheid, and A. Troutman. 2011c.
Health disparities and health equity: The issue is justice. American Journal of Public Health 101(Suppl 1):
S149-S155.
Brownson, R. C., J. J. Chang, A. A. Eyler, B. E. Ainsworth, K. A. Kirtland, B. E. Saelens, and J. F. Sallis. 2004.
Measuring the environment for friendliness toward physical activity: A comparison of the reliability of 3 ques-
tionnaires. American Journal of Public Health 94(3):473-483.
Brownson, R. C., C. M. Hoehner, K. Day, A. Forsyth, and J. F. Sallis. 2009. Measuring the built environment for
physical activity: State of the science. American Journal of Preventive Medicine 36(4 Suppl):S99-S123, e112.
Caballero, B., J. H. Himes, T. Lohman, S. M. Davis, J. Stevens, M. Evans, S. Going, and J. Pablo. 2003. Body com-
position and overweight prevalence in 1704 schoolchildren from 7 American Indian communities. American
Journal of Clinical Nutrition 78(2):308-312.
Chakraborty, B. M., and R. Chakraborty. 2010. Concept, measurement and use of acculturation in health and dis-
ease risk studies. Collegium Antropologicum 34(4):1179-1191.
Chandon, P., and B. Wansink. 2012. Does food marketing need to make us fat? A review and solutions. Nutrition
Reviews 70(10):571-593.
Coleman-Jensen, A., M. Nord, M. Andrews, and S. Carlson. 2012. Household food security in the United States in
2011. Washington, DC: U.S. Department of Agriculture, Economic Research Service.
Coogan, P. E., L. A. Wise, Y. C. Cozier, J. R. Palmer, and L. Rosenberg. 2012. Lifecourse educational status in rela-
tion to weight gain in African american women. Ethnicity and Disease 22(2):198-206.
Dalenius, K., E. Borland, B. Smith, B. Polhamus, and L. Grummer-Strawn. 2012. Pediatric Nutrition Surveillance
2010 report. Atlanta, GA: U.S. Department of Health and Human Services, Centers for Disease Control and
Prevention.
Das, A. 2013. How does race get “under the skin”?: Inflammation, weathering, and metabolic problems in late life.
Social Science and Medicine 77:75-83.
Davies, S. L., H. R. Thind, S. D. Chandler, and J. A. Tucker. 2011. Enhancing resilience among young people: The
role of communities and asset-building approaches to intervention. Adolescent Medicine: State of the Art
Reviews 22(3):402-440.

Copyright © National Academy of Sciences. All rights reserved.
Evaluating Obesity Prevention Efforts: A Plan for Measuring Progress
129Evaluating Progress in Promoting Health Equity
DeNavas-Walt, C., B. D. Proctor, and J. C. Smith. 2012. Income, poverty, and health insurance coverage in the
United States: 2011. Current Population Reports, No. 60-243. Washington, DC: U.S. Government Printing
Office.
Dixon, B., M. M. Pena, and E. M. Taveras. 2012. Lifecourse approach to racial/ethnic disparities in childhood obe-
sity. Advances in Nutrition 3(1):73-82.
Evans-Campbell, T. 2008. Historical trauma in American Indian/native Alaska communities: A multilevel frame-
work for exploring impacts on individuals, families, and communities. Journal of Interpersonal Violence
23(3):316-338.
Flaskerud, J. H., and C. R. DeLilly. 2012. Social determinants of health status. Issues in Mental Health Nursing
33(7):494-497.
Flegal, K. M., M. D. Carroll, B. K. Kit, and C. L. Ogden. 2012. Prevalence of obesity and trends in the distribution of
body mass index among US adults, 1999-2010. Journal of the American Medical Association 307(5):491-497.
Franklin, B., A. Jones, D. Love, S. Puckett, J. Macklin, and S. White-Means. 2012. Exploring mediators of food inse-
curity and obesity: A review of recent literature. Journal of Community Health 37(1):253-264.
Gee, G. C., and D. C. Payne-Sturges. 2004. Environmental health disparities: A framework integrating psychosocial
and environmental concepts. Environmental Health Perspectives 112(17):1645-1653.
Gittelsohn, J., and M. Rowan. 2011. Preventing diabetes and obesity in American Indian communities: The potential
of environmental interventions. American Journal of Clinical Nutrition 93(5):1179S-1183S.
Glanz, K., J. F. Sallis, B. E. Saelens, and L. D. Frank. 2005. Healthy nutrition environments: Concepts and measures.
American Journal of Health Promotion 19(5): ii, 330-333.
Glanz, K., J. F. Sallis, B. E. Saelens, and L. D. Frank. 2007. Nutrition environment measures survey in stores
(NEMS-S): Development and evaluation. American Journal of Preventive Medicine 32(4):282-289.
Glanz, K., M. D. Bader, and S. Iyer. 2012. Retail grocery store marketing strategies and obesity: An integrative
review. American Journal of Preventive Medicine 42(5):503-512.
Gordon-Larsen, P., M. C. Nelson, P. Page, and B. M. Popkin. 2006. Inequality in the built environment underlies key
health disparities in physical activity and obesity. Pediatrics 117(2):417-424.
Grier, S. A., and S. K. Kumanyika. 2008. The context for choice: Health implications of targeted food and beverage
marketing to African Americans. American Journal of Public Health 98(9):1616-1629.
Guadamuz, T., S. Lim, M. Marshal, M. Friedman, R. Stall, and A. Silvestre. 2012. Sexual, behavioral, and quality of
life characteristics of healthy weight, overweight, and obese gay and bisexual men: Findings from a prospective
cohort study. Archives of Sexual Behavior 41(2):385-389.
HHS (Department of Health and Human Services). 2010. Healthy People 2020. http://www.healthypeople.gov/2020/
default.aspx (accessed January 31, 2013).
Huff, R. M., and M. V. Kline, eds. 1999. Promoting health in multicultural populations: A handbook for practitio-
ners. Thousand Oaks, CA: Sage Publications, Inc.
Hurvitz, E. A., L. B. Green, J. E. Hornyak, S. R. Khurana, and L. G. Koch. 2008. Body mass index measures in chil-
dren with cerebral palsy related to gross motor function classification: A clinic-based study. American Journal
of Physical Medicine and Rehabilitation 87(5):395-403.
IOM (Institute of Medicine). 2012. Accelerating progress in obesity prevention: Solving the weight of the nation.
Washington, DC: The National Academies Press.
Jackson, J. E., M. P. Doescher, A. F. Jerant, and L. G. Hart. 2005. A national study of obesity prevalence and trends
by type of rural county. Journal of Rural Health 21(2):140-148.
Jun, H. J., H. L. Corliss, L. P. Nichols, M. J. Pazaris, D. Spiegelman, and S. B. Austin. 2012. Adult body mass index
trajectories and sexual orientation: The Nurses Health Study II. American Journal of Preventive Medicine
42(4):348-354.

Copyright © National Academy of Sciences. All rights reserved.
Evaluating Obesity Prevention Efforts: A Plan for Measuring Progress
Evaluating Obesity Prevention Efforts130
Kawachi, I., N. Daniels, and D. E. Robinson. 2005. Health disparities by race and class: Why both matter. Health
Affairs 24(2):343-352.
Klein, R. J., S. E. Proctor, M. A. Boudreault, and K. M. Turczyn. 2002. Healthy People 2010 criteria for data sup-
pression. Healthy People 2010 Statistical Notes (24):1-12.
Koh, H. K. 2010. A 2020 vision for healthy people. New England Journal of Medicine 362(18):1653-1656.
Koh, H. K., J. J. Piotrowski, S. Kumanyika, and J. E. Fielding. 2011. Healthy People: A 2020 vision for the social
determinants approach. Health Education & Behavior: The official publication of the Society for Public
Health Education 38(6):551-557.
Larson, N. I., and M. T. Story. 2011. Food insecurity and weight status among U.S. children and families: A review
of the literature. American Journal of Preventive Medicine 40(2):166-173.
Levi, J., L. Segal, R. St. Laurent, A. Lang, and J. Rayburn. 2012. F as in fat: How obesity threatens Americas future
2012. Washington, DC: Trust for America’s Health/Robert Wood Johnson Foundation.
Link, M. W., A. H. Mokdad, H. F. Stackhouse, and N. T. Flowers. 2006. Race, ethnicity, and linguistic isolation as
determinants of participation in public health surveillance surveys. Preventing Chronic Disease 3(1):A09.
Lovasi, G. S., M. A. Hutson, M. Guerra, and K. M. Neckerman. 2009. Built environments and obesity in disadvan-
taged populations. Epidemiologic Reviews 31:7-20.
Love, C., R. J. David, K. M. Rankin, and J. W. Collins, Jr. 2010. Exploring weathering: Effects of lifelong economic
environment and maternal age on low birth weight, small for gestational age, and preterm birth in African-
American and white women. American Journal of Epidemiology 172(2):127-134.
Matson, M. L., J. L. Matson, and J. S. Beighley. 2011. Comorbidity of physical and motor problems in children with
autism. Research in Developmental Disabilities 32(6):2304-2308.
McKinnon, R. A., J. Reedy, M. A. Morrissette, L. A. Lytle, and A. L. Yaroch. 2009. Measures of the food environment:
A compilation of the literature, 1990-2007. American Journal of Preventive Medicine 36(4 Suppl):S124-S133.
National Survey of Children’s Health. 2011. The health and well-being of children in rural areas: A portrait of the
nation 2007. Rockville, MD: U.S. Department of Health and Human Services, Health Resources and Services
Administration, Maternal and Child Health Bureau.
NCBDDD (National Center on Birth Defects and Developmental Disabilities). 2012. Strategic plan—disabilities &
disparities. http://www.cdc.gov/ncbddd/aboutus/disabilities.html (accessed June 24, 2013).
NCCOR (National Collaborative on Childhood Obesity Research). 2013. NCCOR Measures Registry. http://nccor.
org/projects/measures/index.php (accessed June 15, 2013).
Nord, M., M. Andrews, and S. Carlson. 2009. Household food security in the United States, 2008. Washington, DC:
U.S. Department of Agriculture, Economic Research Service.
Novotny, R., C. Nigg, K. McGlone, G. Renda, N. Jung, M. Matsunaga, and N. Karanja. 2013. Pacific Tracker 2—
Expert System (PacTrac2-ES) behavioural assessment and intervention tool for the Pacific Kids DASH for
health (PacDASH) study. Food Chemistry 140(3):471-477.
Ogden, C. L., M. D. Carroll, B. K. Kit, and K. M. Flegal. 2012. Prevalence of obesity and trends in body mass index
among US children and adolescents, 1999-2010. Journal of the American Medical Association 307(5):483-490.
Oza-Frank, R., and S. A. Cunningham. 2010. The weight of US residence among immigrants: A systematic review.
Obesity Reviews 11(4):271-280.
Patterson, P. D., C. G. Moore, J. C. Probst, and J. A. Shinogle. 2004. Obesity and physical inactivity in rural
America. Journal of Rural Health 20(2):151-159.
Perez-Escamilla, R. 2011. Acculturation, nutrition, and health disparities in Latinos. American Journal of Clinical
Nutrition 93(5):1163S-1167S.
Perez-Escamilla, R., and P. Putnik. 2007. The role of acculturation in nutrition, lifestyle, and incidence of type 2 dia-
betes among Latinos. Journal of Nutrition 137(4):860-870.
Copyright © National Academy of Sciences. All rights reserved.
Evaluating Obesity Prevention Efforts: A Plan for Measuring Progress
131Evaluating Progress in Promoting Health Equity
Riegelman, R. K., and D. R. Garr. 2011. Healthy People 2020 and education for health: What are the objectives?
American Journal of Preventive Medicine 40(2):203-206.
Rimmer, J. H., K. Yamaki, B. M. Lowry, E. Wang, and L. C. Vogel. 2010. Obesity and obesity-related secondary con-
ditions in adolescents with intellectual/developmental disabilities. Journal of Intellectual Disability Research
54(9):787-794.
Rimmer, J. H., K. Yamaki, B. M. Davis, E. Wang, and L. C. Vogel. 2011. Obesity and overweight prevalence among
adolescents with disabilities. Preventing Chronic Disease 8(2):A41.
Simeonsson, R. J., J. S. McMillen, and G. S. Huntington. 2002. Secondary conditions in children with disabili-
ties: Spina bifida as a case example. Mental Retardation and Developmental Disabilities Research Reviews
8(3):198-205.
Story, M., N. E. Sherwood, J. H. Himes, M. Davis, D. R. Jacobs, Jr., Y. Cartwright, M. Smyth, and J. Rochon. 2003.
An after-school obesity prevention program for African-American girls: The Minnesota GEMS pilot study.
Ethnicity and Disease 13(1 Suppl 1):S54-S64.
USDA (U.S. Department of Agriculture). 2013. SNAP food security in-depth interview study, edited by K. Edin, M.
Boyd, J. Mabli, J. Ohls, J. Worthington, S. Greene, N. Redel, and S. Sridharan. Washington, DC: USDA.
Wang, Y. 2011. Disparities in pediatric obesity in the United States. Advances in Nutrition 2(1):23-31.
Whitehead, M. 1992. The concepts and principles of equity and health. International Journal of Health Services
22(3):429-445.
Whitehead, M., and J. Popay. 2010. Swimming upstream? Taking action on the social determinants of health
inequalities. Social Science and Medicine 71(7):1234-1236; discussion 1254-1258.
Williams, D. R., and M. Sternthal. 2010. Understanding racial-ethnic disparities in health: Sociological contributions.
Journal of Health and Social Behavior 51(Suppl):S15-S27.
Wolff, L. S., D. Acevedo-Garcia, S. V. Subramanian, D. Weber, and I. Kawachi. 2010. Subjective social status, a
new measure in health disparities research: Do race/ethnicity and choice of referent group matter? Journal of
Health Psychology 15(4):560-574.
Woolf, S. H., and P. Braveman. 2011. Where health disparities begin: The role of social and economic determinants—
and why current policies may make matters worse. Health Affairs 30(10):1852-1859.

Copyright © National Academy of Sciences. All rights reserved.
Evaluating Obesity Prevention Efforts: A Plan for Measuring Progress

Copyright © National Academy of Sciences. All rights reserved.
Evaluating Obesity Prevention Efforts: A Plan for Measuring Progress
133
6National Obesity Evaluation Plan
Why: Why develop a National Obesity Evaluation Plan? A National Obesity Evaluation Plan is essential for documenting progress, informing future direction on policy and environmental change at the national level, and providing support to state and community assessments, monitoring, surveillance, and summative evaluations.
What: What is a National Obesity Evaluation Plan? A National Obesity Evaluation Plan is a framework for evaluating progress in achieving the strategies recommended in the Accelerating Progress in Obesity Prevention report (IOM, 2012a) at a national level and serves as a model, template, or framework for state and regional evaluations. Much of the National Obesity Evaluation Plan, as distinguished from the evalu-ations of progress on more local efforts, centers on components and activities related to the development and maintenance of the infrastructure for continuous, nationwide monitoring and surveillance that regional, state, and community evaluations can use in their status assessments and progress evaluations.
How: How should the National Obesity Evaluation Plan be implemented? The National Obesity Evaluation Plan includes eight core activities: (1) establish key leadership, infrastructure, priorities, and timeline for implementation of the plan; (2) identify current federal monitoring, surveillance, and summative evaluation efforts; (3) harmonize and expand current federal monitoring, surveillance, and summative evaluation data collection; (4) develop new data collection instruments and systems to address gaps; (5) increase national and state capacity for monitoring, surveillance, and summative evaluation; (6) provide timely and relevant feedback from federal data; (7) ensure that federally funded programs include recommended indicators and common measures; and (8) encourage development and testing of new methodologies.
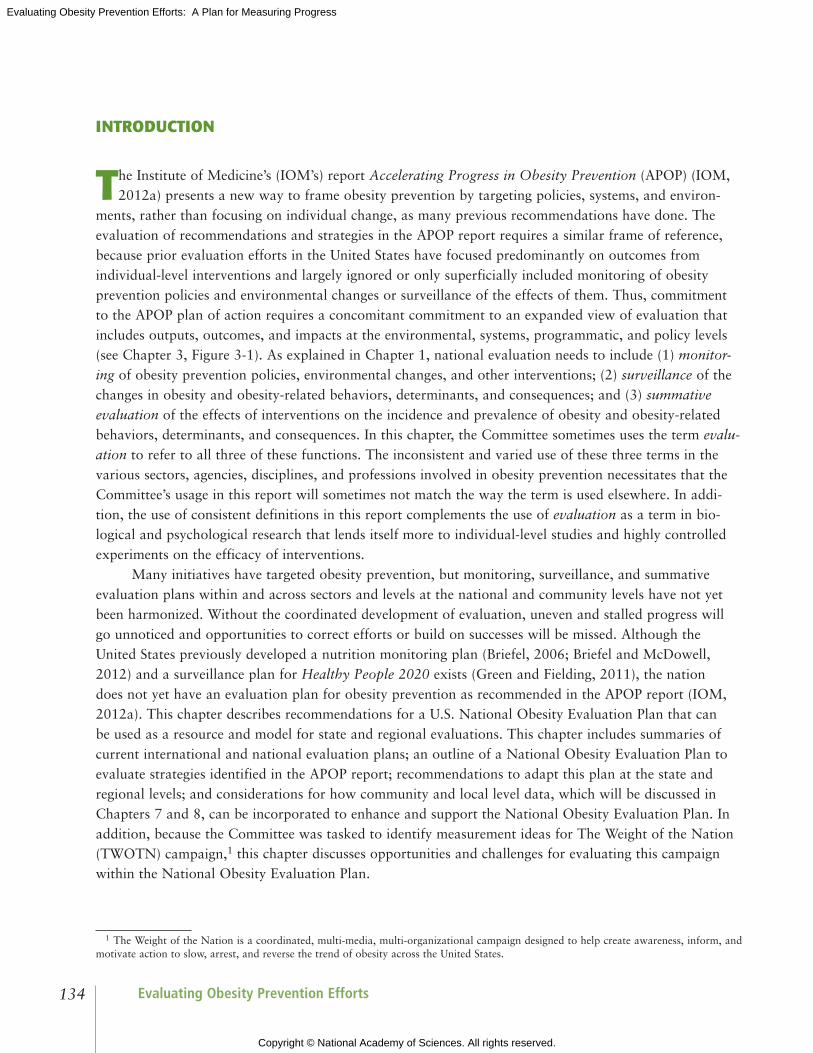
Copyright © National Academy of Sciences. All rights reserved.
Evaluating Obesity Prevention Efforts: A Plan for Measuring Progress
Evaluating Obesity Prevention Efforts134
INTROdUCTION
The Institute of Medicine’s (IOM’s) report Accelerating Progress in Obesity Prevention (APOP) (IOM, 2012a) presents a new way to frame obesity prevention by targeting policies, systems, and environ-
ments, rather than focusing on individual change, as many previous recommendations have done. The evaluation of recommendations and strategies in the APOP report requires a similar frame of reference, because prior evaluation efforts in the United States have focused predominantly on outcomes from individual-level interventions and largely ignored or only superficially included monitoring of obesity prevention policies and environmental changes or surveillance of the effects of them. Thus, commitment to the APOP plan of action requires a concomitant commitment to an expanded view of evaluation that includes outputs, outcomes, and impacts at the environmental, systems, programmatic, and policy levels (see Chapter 3, Figure 3-1). As explained in Chapter 1, national evaluation needs to include (1) monitor-ing of obesity prevention policies, environmental changes, and other interventions; (2) surveillance of the changes in obesity and obesity-related behaviors, determinants, and consequences; and (3) summative evaluation of the effects of interventions on the incidence and prevalence of obesity and obesity-related behaviors, determinants, and consequences. In this chapter, the Committee sometimes uses the term evalu-ation to refer to all three of these functions. The inconsistent and varied use of these three terms in the various sectors, agencies, disciplines, and professions involved in obesity prevention necessitates that the Committee’s usage in this report will sometimes not match the way the term is used elsewhere. In addi-tion, the use of consistent definitions in this report complements the use of evaluation as a term in bio-logical and psychological research that lends itself more to individual-level studies and highly controlled experiments on the efficacy of interventions.
Many initiatives have targeted obesity prevention, but monitoring, surveillance, and summative evaluation plans within and across sectors and levels at the national and community levels have not yet been harmonized. Without the coordinated development of evaluation, uneven and stalled progress will go unnoticed and opportunities to correct efforts or build on successes will be missed. Although the United States previously developed a nutrition monitoring plan (Briefel, 2006; Briefel and McDowell, 2012) and a surveillance plan for Healthy People 2020 exists (Green and Fielding, 2011), the nation does not yet have an evaluation plan for obesity prevention as recommended in the APOP report (IOM, 2012a). This chapter describes recommendations for a U.S. National Obesity Evaluation Plan that can be used as a resource and model for state and regional evaluations. This chapter includes summaries of current international and national evaluation plans; an outline of a National Obesity Evaluation Plan to evaluate strategies identified in the APOP report; recommendations to adapt this plan at the state and regional levels; and considerations for how community and local level data, which will be discussed in Chapters 7 and 8, can be incorporated to enhance and support the National Obesity Evaluation Plan. In addition, because the Committee was tasked to identify measurement ideas for The Weight of the Nation (TWOTN) campaign,1 this chapter discusses opportunities and challenges for evaluating this campaign within the National Obesity Evaluation Plan.
1 The Weight of the Nation is a coordinated, multi-media, multi-organizational campaign designed to help create awareness, inform, and motivate action to slow, arrest, and reverse the trend of obesity across the United States.

Copyright © National Academy of Sciences. All rights reserved.
Evaluating Obesity Prevention Efforts: A Plan for Measuring Progress
135National Obesity Evaluation Plan
Chapters 1 and 2 focus primarily on “why” evaluation should be conducted. Chapters 3, 4, and 5 tackle “what” needs to be done and for “whom.” This chapter addresses the “how” of evaluation at the national level by proposing a concrete National Obesity Evaluation Plan, as well as recommendations for its implementation across multiple sectors (see Chapter 1), framed in a systems-level approach (see Chapter 9) that addresses health equity (see Chapter 5 and see Box 6-1).
RELATIONShIP OF NATIONAL OBESITY EVALUATION PLAN TO PROPOSEd EVALUATION FRAMEwORk
The Committee designed the evaluation framework offered in Chapter 3 (see Figure 3-1) to provide a logic model, including inputs, activities, outputs, outcomes, and impacts that can be easily applied to evaluation plans assuring timely and meaningful collection and analysis of data to inform and improve obesity prevention efforts at national, state, and community levels (Committee vision, Chapter 1). Aligning the National Obesity Evaluation Plan, as well as state- and community-level plans, with the evaluation framework provides context for the rationale and measurement components underlying the Committee’s recommendations (see Chapter 10).
The National Obesity Evaluation Plan is outlined in Box 6-2. The plan was conceptualized to include an overarching purpose that is directly related to the strategies from the APOP report (IOM, 2012a) and the evaluation framework; a list of broad objectives that detail the steps that must be followed; and a list of more specific activities that result from operationalizing the objectives. The Committee understands that the activities, in particular, are ambitious and will likely be implemented over several years; however, to adequately determine the effectiveness of the APOP strategies and current efforts in obesity prevention, significant and bold changes in the current U.S. system for evaluation of progress in obesity prevention must be put into place.
BOX 6-1 Addressing Health Inequalities as Part of a Systems Approach in the National Obesity Evaluation Plan
As documented in Chapter 5, obesity-related disparities exist across various racial and ethnic groups and socially disadvantaged populations. Patterns of association among a multitude of factors, particularly those upstream that denote social advantage or disadvantage, may provide important insights for addressing health equity and obesity disparities. The ability to measure such factors is central to the characterization of patterns of association. Braveman et al. (2011) identify sociocultural and socioeconomic determinants, timing of exposure, and living and working conditions as central constructs to measure. As such, a National Obesity Evaluation Plan will need to include indicators to address these determinants. In addition to a national pattern of associations among these factors and health, a connection to state and community determinants will allow for comparison of these indicators at different levels, identification of emerging issues or trends that should be incorporated into the National Obesity Evaluation Plan, and relationships that address the multiple levels of this systems perspective.

Copyright © National Academy of Sciences. All rights reserved.
Evaluating Obesity Prevention Efforts: A Plan for Measuring Progress
Evaluating Obesity Prevention Efforts136
BOX 6-2 Core Components and Activities of the National Plan for Evaluating Progress in Obesity Prevention
Purpose: To evaluate progress at the national level in implementing strategies from the IOM Accelerating Progress in Obesity Prevention (APOP) report (IOM, 2012a) and in achieving intended impacts as described in the evaluation framework (#5 in Figure 3-1).
Components:
1. Identify leadership, infrastructure, resources, priorities, and timeline for implementing the plan.
2. Identify current national efforts for evaluation, including indicators (Chapter 4), and incorporate them selectively into national monitoring, surveillance, and summative evaluation data systems that are respon-sive to the needs of data users.
3. Propose data and infrastructure to add to existing monitoring and surveillance systems to fill gaps and facilitate community obesity evaluation plans.
4. Propose additional assessment, monitoring, surveillance, and summative evaluation activities; new mea-sures; and innovative strategies to implement in the future.
5. Outline mechanisms for feedback to data users, assuring accessibility, privacy, and cost-efficiency.
6. Detail adaptations of the plan at the state level, with further applications at the regional level.
Activities:
1. Designate a federal obesity evaluation task force/entity to oversee the implementation of the National Obesity Evaluation Plan and coordinate with relevant federal, state, local, and private-sector entities.
a. Identify and obtain the infrastructure necessary for implementing the plan and coordinate with appro-priate partners.
b. Ensure adequate benchmarks/goals, including a schedule for updates.
c. Establish a process for prioritization, accountability, and adaptation of plan activities including an annual report to the agency responsible for leading the effort.
d. Identify priorities and create an ongoing timeline for implementing the plan.
i. Short-term objectives achievable within 1-3 years.
ii. Intermediate-term objectives achievable within 3-5 years.
iii. Long-term objectives achievable in 5 years or longer.

Copyright © National Academy of Sciences. All rights reserved.
Evaluating Obesity Prevention Efforts: A Plan for Measuring Progress
137National Obesity Evaluation Plan
2. Identify current national evaluation efforts, including indicators for monitoring and surveillance systems to minimize duplication, maximize use of data already being collected, and identify priorities to address evaluation gaps in a coordinated fashion.
a. Use the indicator list (Chapter 4) as a starting point to identify a core set of indicators.
b. Match indicators as much as possible for common measurement across jurisdictions.
c. Examine existing links to the Leading Health Indicators and other recommendations as consistent with APOP.
d. Promote use of common measures through the National Collaborative on Childhood Obesity Research (NCCOR) (see Chapter 5) to facilitate harmonization of data across data collection systems.
e. Expand School Health Policies and Practices Study to include measures of additional settings such as worksite, child care centers, and schools on a rolling basis every 3 years rather than of current set-tings every 6 years.
f. Expand National Health and Nutrition Examination Survey (NHANES) sampling, analyses, and/or reporting to address gaps in developmental levels of children birth to 1 year, 2 to 5 years, 6 to 10 years, 11 to 13 years, and 14 to 19 years.
g. Expand NHANES to oversample populations that are underserved or at greater risk for obesity.
h. Standardize currently collected data and planned systems, such as electronic health records, for data aggregation.
i. Incorporate data from birth certificates, Special Supplemental Nutrition Program for Women, Infants, and Children (WIC), Early Head Start, and Head Start into the National Obesity Evaluation Plan.
j. Expand current monitoring and surveillance structures into existing data-collection systems at the national or state levels.
3. Develop new data-collection infrastructure or systems, indicators, and measures to address gaps identified as priorities in areas such as policy and environment, physical activity, child care centers, worksites, health plans, federally qualified health centers, and community health centers/WIC clinics.
4. Increase national and state capacity for assessment, monitoring, surveillance, and summative evaluation.
a. Standardize and provide training on measurement protocols (e.g., body mass index, waist circumfer-ence) and data-collection methods.
b. Provide technical support for data utilization, statistical analysis, and reporting.
i. Assess the impact of the data loss that resulted from discontinuation of the Centers for Disease Control and Prevention’s Pediatric Nutrition Surveillance System and Pregnancy Nutrition Surveillance System (state- and county-level data) and provide ongoing technical assistance to states that use existing data.
continued

Copyright © National Academy of Sciences. All rights reserved.
Evaluating Obesity Prevention Efforts: A Plan for Measuring Progress
Evaluating Obesity Prevention Efforts138
c. Create lists of recommended standardized tools and methods for measurement.
i. Expand and maintain the NCCOR Surveillance System and Measures Registry.
5. Ensure that all relevant data systems include a mechanism for relevant and timely feedback to data users.
a. Expand Health Indicators Warehouse and other interactive sources of federal-level data.
b. Expand and maintain Community Commons.
c. Develop additional “dashboards” and “federal report card” formats that can be interactive and display data in easily understood infographics and tables.
6. Ensure that evaluation plans in federally funded obesity-related grants and programs include common indicators and measures that can be aggregated across communities and inform the plan.
7. Encourage development and testing of alternative and emergent methods of collecting data, including
a. Real-time access of data from community-based organizations,
b. Capitalization on the “quantified-self” movement, and
c. Use of new technologies and geospatial modeling.
BOX 6-2 Continued
For a national evaluation plan, differing population needs demand inputs of varied data collection. Context is also varied, spanning urban to rural geographies and affluent to poorer communities, so a national evaluation plan must be broad, adaptable, and culturally sensitive to cover various environments, languages, contexts, and populations.
Inputs also include objectives and goals that serve as evaluation benchmarks; they often link to national health goals, such as Healthy People 2020 (HHS, 2010b), and include specific populations (Green and Fielding, 2011). State objectives tend to be patterned after national obesity, diet, and physical activity objectives; many have been developed or adapted from the Healthy People 2020 template with Centers for Disease Control and Prevention (CDC) funding and guidance (CDC, 2012b).
Development of an evaluation plan aligned with a core set of national-level indicators is one of the primary activities outlined in the evaluation framework. State-specific indicators can provide further con-text and focus on individual issues that are likely to arise in localized areas. Infrastructure development is necessary as well, and it can range from the broader and more complicated infrastructure at the national level to smaller and more limited infrastructures at the state level. Available funding, workforce capacity, political will, and the perceived need for obesity prevention can affect infrastructure for collecting, analyz-ing, and reporting data.

Copyright © National Academy of Sciences. All rights reserved.
Evaluating Obesity Prevention Efforts: A Plan for Measuring Progress
139National Obesity Evaluation Plan
The recommendations of the National Obesity Evaluation Plan outlined in this chapter represent one of the major outputs of the evaluation framework. The plan organizes designated indicators from Chapter 4, with comparisons and benchmarks for impact variables, using appropriate methodology and feedback opportunities to assess progress in obesity prevention. The recommendations and guidance for the evaluation can inform adaptation and implementation of the plan.
With implementation of the plan, several outcomes can be realized. Capacity and infrastructure for evaluation at both national and state levels will improve, leading to increased numbers and complexity of monitoring, surveillance, and evaluation activities. As well, data gleaned from these efforts can be dissemi-nated back to stakeholders and consumers for use in informing decisions about resource allocation and intervention efforts.
Implementation of the plan will provide data from various sectors to document progress in obesity prevention. Although a variety of impacts are important, for obesity prevention the impacts of the plan reflect a multi-level and multi-sector focus that targets various interventions through a lens of health equity and includes changes in both environments and behaviors, mirroring the guidelines provided in the APOP report (IOM, 2012a).
NATIONAL OBESITY EVALUATION PLANS
International Examples
Obesity is a worldwide problem, and, as such, world and regional organizations, as well as other countries, have proposed monitoring, surveillance, and evaluation plans for obesity prevention and con-trol. To develop the National Obesity Evaluation Plan for the United States, the Committee examined international efforts as models to determine which components were applicable to the United States and consistent with APOP strategies (IOM, 2012a). Of particular interest were indicators or methodologies that could later be used across countries to facilitate cross-country comparisons. Comparing data from different countries can highlight innovative policy or programmatic efforts and outcomes and contribute to the body of evidence regarding effective obesity prevention strategies. A brief review of prominent international obesity plans follows.
The World Health Organization (WHO), International Agency for Research on Cancer, the European Commission, and the Ensemble Prévenons l’Obésité Des Enfants (or EPODE, Together Let’s Prevent Childhood Obesity) European Network have produced plans for monitoring, surveillance, and evaluation of obesity prevention and control (Riboli et al., 2002; WHO, 2008). Single countries—Australia, the United Kingdom, and others—have documented obesity prevention evaluation plans (Australian Government Department of Health and Aging, 2010; WHO, 2007). In these countries, evalu-ation plans have built on existing national nutrition monitoring/surveillance systems and data infrastruc-tures, many of which are more thoroughly and universally linked across record systems in those countries than in the United States because of the national health systems in those countries. Many of these plans include goals consistent with several APOP strategies, making them useful models for informing the U.S. National Obesity Evaluation Plan and enabling comparisons of progress with other countries and regions of the world.
The WHO has a framework that can be adapted by countries to evaluate the components of the WHO Global Strategy on Diet, Physical Activity and Health (DPAS) (WHO, 2008). DPAS, proposed in

Copyright © National Academy of Sciences. All rights reserved.
Evaluating Obesity Prevention Efforts: A Plan for Measuring Progress
Evaluating Obesity Prevention Efforts140
2004, focuses on the worldwide increases in noncommunicable diseases as a result of poor dietary intake and activity levels (WHO, 2004). DPAS includes a strong emphasis on the role of government in provid-ing leadership in these efforts. It calls for development of national dietary and physical activity guidelines and policies, coordination of agricultural policies, educational and health literacy efforts, multi-sectorial policies for physical activity, school-based policies to promote healthful diet and activity, and preven-tion efforts through health care or health services (WHO, 2004). The related WHO evaluation strat-egy (WHO, 2008) also calls for a monitoring, surveillance, and evaluation plan. The WHO European Database on Nutrition, Obesity, and Physical Activity (WHO, 2011) contains information on national and subnational surveillance data, policies, and actions to implement policies.
The WHO evaluation plan proposes that countries set up a process to ensure that monitoring, sur-veillance, and evaluation activities are included in all intervention plans, by identifying existing relevant activities and suitable partners, selecting appropriate indicators, and carrying out the monitoring, sur-veillance, and evaluation activities periodically in a consistent manner (WHO, 2008). The WHO recom-mends the development and tailoring of process, output, and outcome indicators by each country with consideration of national characteristics or culture, policy, settings, and available scientific evidence. The agency encourages evaluations of programs and initiatives that draw on existing monitoring and surveil-lance activities in each country (WHO, 2008). Key outcome indicators are grouped by periodicity/time scale, with short-, intermediate-, and long-term indicators. Indicators range from awareness of dietary and physical activity goals in the short term to physiologic factors, and dietary and physical activity behaviors in the intermediate term. Long-term outcomes, referred to as “impacts” in Figure 3-1, relate to over-weight and obesity goals, as well as morbidity and mortality. The intent is that countries are encouraged to use these comprehensive strategic pillars to develop national evaluation plans with robust monitoring, surveillance, and evaluation components. Appendix F (Table F-1) presents other examples of international evaluation plans and activities.
Strengths and weaknesses of the Current U.S. National Obesity Evaluation
Advantages and Strengths of the Current U.S. Surveillance System for Obesity Prevention
The current U.S. national surveillance systems for obesity and related risk factors have many advan-tages, including a historical record that provides tracking of key impact measures, validated and reliable measures, biologic measures, and sample sizes that provide population-level estimates for various sub-groups, focused on individual-level data. In addition, Healthy People 2020 (HHS, 2010b) and Physical Activity Guidelines for Americans (HHS, 2010a) provide a framework of objectives and key indicators that inform national evaluation efforts and influence the items available in the National Health and Nutrition Examination Survey (NHANES), National Health Interview Survey (NHIS), Behavioral Risk Factor Surveillance System (BRFSS), Youth Risk Behavior Surveillance System (YRBSS), and other sur-veillance systems. Although the majority of data are available at the national level, sampling of selected regions by the BRFSS—Selected Metropolitan/Micropolitan Area Risk Trends (SMART) allows the use and comparison of national, state, and some city/county variables at representative levels for selected communities. Several of these factors are also consistent with the WHO framework to monitor and evalu-ate obesity prevention efforts (WHO, 2004). Finally, the expanded use of technology has allowed for rapid collection and analysis of some types of data to provide tools that can potentially be replicated at

Copyright © National Academy of Sciences. All rights reserved.
Evaluating Obesity Prevention Efforts: A Plan for Measuring Progress
141National Obesity Evaluation Plan
other levels and could provide data on incidence of obesity and related outcome indicators, in addition to the usual prevalence estimates.
Gaps and Weaknesses in Current National Obesity Surveillance
The current national monitoring/surveillance system can track obesity prevention efforts and their effects, and it has several strengths as detailed above; however, gaps in the current system exist. These gaps include a lack of data to enable monitoring of key policy, systems, and environmental strategies that are highlighted in the APOP report (IOM, 2012a); a decentralized leadership with limited authority, responsibility, or support and coordination at the national level;2 a paucity of physical activity and envi-ronmental indicators to enable surveillance of nutrition and obesity measures; a lack of data for certain populations or child developmental levels; gaps by time period or region; a lack of measurement of the incidence of obesity; a lack of resources and infrastructure for surveillance and timely reporting of results; and a lack of data for use at the community level.
Lack of monitoring of policy and environmental data. To date, the majority of monitoring and program summative evaluation data have used individual-level measures, because those have been the focus of most intervention efforts, programs, and government recommendations in the past (Green et al., 1974; Marketing Economics Division, 1972; Wang and Ephross, 1970; Wang et al., 1972). The APOP report (IOM, 2012a), however, frames obesity prevention efforts ecologically in terms of policy, systems-level, and environmental approaches, which require new evaluation approaches and measures. In particular, comprehensive monitoring, surveillance, and summative evaluation systems are needed for all settings, including early child care, schools, worksites, and health care. These systems can be difficult to implement and maintain, mostly because of the lack of an overall national organizational structure and incentives for obesity prevention in these settings. Finally, databases and methods to track exposure to media messages about diet or physical activity are needed to monitor progress in improving the messaging environment (APOP Goal Area 3, IOM, 2012a).
Lack of data for certain populations. Many existing national monitoring and surveillance plans are designed to oversample various subgroups of the population, such as low-income persons and minorities, but data remain limited for some segments of the population, such as the homeless, and certain racial/ethnic groups, such as Native Americans, Latino/Hispanic subgroups, and Asian Pacific Islander popula-tions (Koh et al., 2012; Wang and Beydoun, 2007). Special subnational studies offer the most economical way to cover these and other minority groups as part of a National Obesity Evaluation Plan, as outlined in Chapter 5.
In addition to expanded coverage of population subgroups, improved geographic coverage is needed to provide obesity data at state and community levels. The CDC surveillance systems (e.g., BRFSS, YRBSS) provide data for participating states that are complementary to national data, but there is increasing inter-est in collecting state data to address local health and welfare concerns, as well as to collect data on state-
2 Includes but not limited to efforts in the following federal agencies: Corporation for National and Community Service; Departments of Agriculture, Commerce, Defense, Education, Health and Human Services, Interior, Labor, Transportation, and Veteran Affairs; Domestic Policy Council; Environmental Protection Agency; Federal Trade Commission; General Services Administration; and Office of Management and Budget.

Copyright © National Academy of Sciences. All rights reserved.
Evaluating Obesity Prevention Efforts: A Plan for Measuring Progress
Evaluating Obesity Prevention Efforts142
level policies and environments and enhanced sample sizes in selected local populations. For example, the California Health Interview Survey3 provides data on specific racial/ethnic populations such as Latinos living within California. Another example is the Lower Mississippi Delta Nutrition Intervention Research Initiative funded by U.S. Department of Agriculture (USDA), which uses evaluation and community partici-patory methods to assess diet and chronic disease in a three-state region (Ndirangu et al., 2010).
Overlap of existing data collection efforts. The current U.S. monitoring/surveillance efforts include some overlap of data collected by different monitoring/surveillance systems. For example, similar school policy and environmental measures are collected in School Health Policies and Practices Study (SHPPS), School Nutrition Dietary Assessment Survey (SNDA), and Bridging the Gap assessments. By coordinating efforts and having a designated task force/entity to oversee this process, duplication of activities could be mini-mized and resources could be better leveraged.
Gaps in monitoring and surveillance by periodicity, setting, or region. Although some systems for collec-tion of data about policies and environments exist, such as the SHPPS survey, the data are not collected at regular enough intervals to inform and provide adequate feedback on actions to prevent obesity or to improve the implementation of existing policies and interventions. In addition, with longer time periods between data collection, it is difficult to maintain consistent funding and infrastructure over time, resulting in duplication of effort and loss of institutional knowledge about the surveys. For example, SHPPS data are collected every 6 years, which is helpful for long-term trends but does not provide real-time data for deci-sion makers. The APOP report (IOM, 2012a) recommended that SHPPS data collection be adjusted to once every 2 years. Modifying that to include different settings such as worksite, child care centers and schools, a 3-year measurement period could be instituted. Data could be collected on a rolling basis with alternate surveys in different environments in different years so that, for example, schools could be surveyed one year, child care settings could be surveyed the following year, and worksites surveyed the third year.
Lack of infrastructure at regional and state levels. The current national monitoring and surveillance sys-tems have evolved to use sophisticated and systematic measures and technology infrastructure to support data collection, cleaning, analysis, and reporting, as well as specialized knowledge and technical expertise. Often, the infrastructure or capacity for this type of data collection is lacking or not as well developed at the regional or state levels; this capacity is also lacking at local health departments as addressed in Chapters 7 and 8. In addition, although the knowledge and expertise for sampling methods and mea-surement theory may exist in the state, this type of expertise might not be found at the state health department or in state government. To increase workforce capacity for monitoring, surveillance, and summative evaluation, it is essential to incorporate elements of public health and surveillance into health professionals’ education (Drehobl et al., 2012).
Lack of standard indicators and measures. Although relatively standard methods of collecting individual-level data are available and frequently used (e.g., body mass index), there is less standardization of policy, systems, and environmental indicators and measures. Recently, efforts to develop measures for policies
3 See http://healthpolicy.ucla.edu/Pages/Home.aspx (accessed November 11, 2013).

Copyright © National Academy of Sciences. All rights reserved.
Evaluating Obesity Prevention Efforts: A Plan for Measuring Progress
143National Obesity Evaluation Plan
and environments for food and physical activity have been spearheaded primarily by the Robert Wood Johnson Foundation through the Bridging the Gap, Active Living Research, and Healthy Eating Research programs (Ottoson et al., 2009; RWJF, 2013a,b; University of Illinois at Chicago, 2013a). Many of these measures have been evaluated for psychometric properties such as validity and reliability and are now being used consistently in research studies. Along with the physical and policy environment, the behav-ioral environment should also be assessed, including social norms for diet, physical activity, and obesity.
Components and Guidance for Implementing the National Obesity Evaluation Plan
The National Obesity Evaluation Plan for assessing progress in obesity prevention builds on the cur-rent strengths and infrastructure of the existing monitoring and surveillance systems in the United States, including Healthy People 2020 (HHS, 2010b), but it proposes the incorporation of new infrastructure (i.e., surveys and sources of data) to measure policy, systems, and environmental indicators (see Box 6-2), as well as integration with international efforts. The plan includes many of the proposed methods and indicators outlined in the WHO Global Strategy on Diet, Physical Activity and Health: A Framework to Monitor and Evaluate Implementation (WHO, 2008) and thus will be consistent with similar evaluation efforts internationally. Insofar as APOP strategies (IOM, 2012a) focus largely on policy, systems, and environmental approaches, while existing assessment, monitoring, surveillance, and summative evalua-tion efforts primarily focus on individual-level outcomes, the plan needs to align the newer intervention approaches with appropriate indicators.
Components of the plan are tied to proposed activities, including identification of overall leader-ship, infrastructure, resources, and timeline for the plan; identification of current federal efforts and data gaps; proposals for additional and new measures, infrastructure, and data collection systems to address these gaps; mechanisms for feedback to data users; and adaptations of the plan to state and regional applications (see summary Table 6-1). Plan activities need to prioritize and leverage existing resources to maximize efficiency of data collection, as well as to avoid duplication of efforts. Several of the proposed activities could be implemented relatively easily and with little cost as, for example, new questionnaire items added to the BRFSS or the YRBSS. Other recommendations, such as decreasing the time period for SHPPS from 6 years to 3 years are relatively expensive, and therefore must be balanced with other priori-ties. Other considerations when prioritizing recommendations include
• Which sectors to target with priority? Are the appropriate stakeholders and potential users
involved in setting these priorities and providing feedback (see Chapter 2)? • What is the appropriate time frame for each measurement? Does this fit within the time frame
needed to evaluate obesity prevention efforts?• How precise do the measures for the indicator need to be? Can a survey tool be used, or is a
more objective or precise measure required?• Which populations need to be measured? Do survey planners need to oversample certain racial
and ethnic groups, such as pregnant women or Native American populations?
To be relevant, as well as to address the current status of APOP strategies (IOM, 2012a), evaluation activities for the National Obesity Evaluation Plan should follow the steps outlined in Chapter 8 (see

Copyright © National Academy of Sciences. All rights reserved.
Evaluating Obesity Prevention Efforts: A Plan for Measuring Progress
Evaluating Obesity Prevention Efforts144
TABLE 6-1 Summary of Potential Activities and Examples of Implementation Steps for Addressing Components of the National Obesity Evaluation Plan
National Obesity Evaluation Plan Components Potential Activities Examples of Implementation Steps
Identify leadership, infrastructure, resources, priorities, and timeline for implementing the plan.
Designate a federal obesity evaluation task force/entity to oversee the implementation of the National Obesity Evaluation Plan and coordinate with relevant federal entities.• Identify and obtain the infrastructure necessary
for implementing the plan and coordinate with appropriate partners.
• Ensure adequate benchmarks/goals, including a schedule for updates.
• Establish a process for prioritization, accountability, and adaptation of plan activities including an annual report to the agency responsible for leading the effort.
• Identify priorities and create an ongoing timeline for implementing the plan.
— Short-term objectives achievable within 1-3 years.
— Intermediate-term objectives achievable within 3-5 years.
— Long-term objectives achievable in 5 years or longer.
Examine existing federal coordinating groups for obesity (e.g., Department of Health and Human Services Healthy Weight Task Force or the National Prevention Council) to see if this charge could be incorporated into the current committee.• If existing federal coordinating groups
for obesity cannot assume task, then appoint a separate unit.
Designate charge for federal obesity evaluation task force/entity that includes• Determining benchmarks/goals for
indicators• Prioritizing plan activities
— Set a timeline for implementation• Setting up accountability
— Setting up an Annual Report to lead agency of the effort.

Copyright © National Academy of Sciences. All rights reserved.
Evaluating Obesity Prevention Efforts: A Plan for Measuring Progress
145National Obesity Evaluation Plan
National Obesity Evaluation Plan Components Potential Activities Examples of Implementation Steps
Identify current national efforts for evaluation, including indicators, and incorporate them selectively into national monitoring, surveillance, and summative evaluation data systems that are responsive to the needs of data users.
Detail adaptations of the plan at the state level, with further applications at the regional level.
Identify current national evaluation efforts, including indicators for monitoring and surveillance systems to minimize duplication, maximize use of data already being collected, and priorities to address evaluation gaps in a coordinated fashion.• Use the indicator list (Chapter 4) as a starting
point to identify a core set of indicators.• Match indicators as much as possible for
common measurement across jurisdictions. • Examine existing links to the Leading Health
Indicators and other recommendations as consistent with Accelerating Progress in Obesity
Prevention report.• Promote use of common measures through
National Collaborative on Childhood Obesity Research (NCCOR) (see Chapter 5) to facilitate harmonization of data across data collection systems.
• Expand School Health Policies and Practices Study (SHPPS) to include measures of additional settings such as worksite, child care settings, and schools on a rolling basis every 3 years rather than of current settings every 6 years.
• Expand National Health and Nutrition Examination Survey (NHANES) sampling, analyses, and/or reporting to address gaps in developmental levels of children birth to 1 year, 2 to 5 years, 6 to 10 years, 11 to 13 years, and 14 to 19 years.
• Expand NHANES to oversample populations that are underserved or at greater risk for obesity.
• Standardize currently collected data and planned systems, such as electronic health records (EHRs), for data aggregation.
• Incorporate data from birth certificates, Special Supplemental Nutrition Program for Women, Infants, and Children (WIC), Early Head Start, and Head Start into the National Obesity Evaluation Plan.
• Expand current monitoring and surveillance structures into existing data collection systems at the national or state levels.
Using the indicator list in this report (Chapter 4), begin the process of harmonization of current data systems and measures.• Determine a process to eliminate
duplication of measures across systems.• Harmonize the measures across
systems.Examine the feasibility of conducting the SHPPS every 3 years.• Examine the feasibility of combining
SHPPS with similar surveys in child care centers and worksites.
Examine the feasibility of expanding NHANES to address more age categories for children.Determine priority populations for oversampling in NHANES.• Examine feasibility of oversampling
for these populations.Work with existing initiatives, such as Integrating the Healthcare Enterprise, to accelerate the standardization of EHR.Examine feasibility of using data from birth certificate, Head Start, and WIC.• Convene an expert panel to examine
where data are collected. • Examine the feasibility of
incorporating a standardization data collection procedure.
• Coordinate with National Center for Health Statistics (NCHS) to incorporate these data.
Provide state infrastructure funding through Centers for Disease Control and Prevention (CDC) to develop standard methods of data collection.• Develop an integrated website for
collection of state data.• Standardize monitoring and
surveillance activities so that data can be collected at the state level.
TABLE 6-1 Continued
continued

Copyright © National Academy of Sciences. All rights reserved.
Evaluating Obesity Prevention Efforts: A Plan for Measuring Progress
Evaluating Obesity Prevention Efforts146
National Obesity Evaluation Plan Components Potential Activities Examples of Implementation Steps
Propose data and infrastructure to add to existing monitoring and surveillance systems to fill gaps and facilitate community obesity evaluation plans.
Propose additional assessment, monitoring, surveillance, and evaluation activities; new measures; and innovative strategies to implement in the future.
Develop new data-collection infrastructure or systems, indicators, and measures to address gaps identified as priorities in areas such as policy and environment, physical activity, child care centers, worksites, health plans, federally qualified health centers (FQHCs), and community health centers/WIC clinics.
Examine gaps in data collection systems identified in this report.• Propose new systems as appropriate,
e.g., for child care centers.• Examine feasibility of incorporating
these new systems into existing systems, e.g., SHPPS.
Examine gaps in indicators identified in this report.• Propose new indicators as appropriate.
— Use NCCOR as a resource for new measures of indicators.
• Examine the feasibility of incorporating these new indicators into existing data systems, e.g., NHANES, SHPPS.
TABLE 6-1 Continued

Copyright © National Academy of Sciences. All rights reserved.
Evaluating Obesity Prevention Efforts: A Plan for Measuring Progress
147National Obesity Evaluation Plan
National Obesity Evaluation Plan Components Potential Activities Examples of Implementation Steps
Identify current national efforts for evaluation, including indicators (Chapter 4), and incorporate them selectively into national monitoring, surveillance, and summative evaluation data systems that are responsive to the needs of data users.
Propose data and infrastructure to add to existing monitoring and surveillance systems to fill gaps and facilitate community obesity evaluation plans.
Propose additional assessment, monitoring, surveillance, and summative evaluation activities; new measures; and innovative strategies to implement in the future.
Detail adaptations of the plan at the state level, with further applications at the regional level.
Increase national and state capacity for assessment, monitoring, surveillance, and summative evaluation.• Standardize and provide training on
measurement protocols (e.g., body mass index, waist circumference) and data-collection methods.
• Provide technical support for data utilization, statistical analysis, and reporting.
— Assess the impact of the data loss that resulted from discontinuation of the CDC’s Pediatric Nutrition Surveillance System and Pregnancy Nutrition Surveillance System (state- and county-level data) and find ways to provide ongoing technical assistance to states that use existing data.
• Create lists of recommended standardized tools and methods for measurement.
— Expand and maintain the NCCOR Surveillance System and Registry.
Designate a current governmental entity, such as NCCOR, as a coordinator for standard measures and training.• Develop a process for identifying
standard measures and measurement protocols.
• Develop a repository for standard measures and measurement protocols.
• Develop training materials for standard measures, including videos, webinars, and toolkits.
Designate a current governmental entity as a training center. • Provide training materials on a
website.• Offer training sessions at professional
meetings.• Offer webinars. • Offer seminars or short courses on
standard measures and protocols.Designate a governmental entity, such as CDC, to provide technical support for measurement for states and regions.• Determine staff and resources that will
provide technical support, including websites, toolkits, a clearinghouse for measures and protocols, and a hotline or e-mail to answer questions.
TABLE 6-1 Continued
continued

Copyright © National Academy of Sciences. All rights reserved.
Evaluating Obesity Prevention Efforts: A Plan for Measuring Progress
Evaluating Obesity Prevention Efforts148
National Obesity Evaluation Plan Components Potential Activities Examples of Implementation Steps
Outline mechanisms for feedback to data users, assuring accessibility, privacy, and cost-efficiency.
Ensure that all relevant data systems include a mechanism for relevant and timely feedback to data users. • Expand Health Indicators Warehouse (HIW) and
other interactive sources of federal-level data.• Expand and maintain Community Commons.• Develop additional “dashboards” and “federal
report card” formats that can be interactive and display data in easily understood infographics and tables.
Examine feasibility of expanding HIW to include additional data. • Develop templates for presentation of
data for evaluation users.Examine feasibility of expanding Community Commons. Develop dashboard formats for data.• Survey evaluation users to determine
appropriate formats for presenting data.
• Evaluate usefulness of dashboard or report card formats using focus groups.
Examine new methods of data presentation, e.g., interactive infographics.Develop appropriate measures to ensure data privacy.
Propose additional assessment, monitoring, surveillance, and summative evaluation activities; new measures; and innovative strategies to implement in the future.
Ensure that evaluation plans in federally funded obesity-related grants and programs include common indicators and measures that can be aggregated across communities and inform the plan.
Coordinate with federal granting agencies (e.g., National Institutes of Health [NIH], CDC, Department of Defense) to develop a policy that will require federal grants to collect additional data for obesity-related measures.• Develop or adapt appropriate
measures for this policy.• Implement policy for grants.• Develop a process for aggregating
and effectively using data from this method.
Propose additional assessment, monitoring, surveillance, and summative evaluation activities; new measures; and innovative strategies to implement in the future.
Encourage development and testing of alternative and emergent methods of collecting data, including• Real-time access of data from community-based
organizations,• Capitalization on the “quantified-self”
movement, and• Use of new technologies and geospatial
modeling.
Designate a federal agency, e.g., NCHS, to set a research agenda for use of emerging methods of data collection.• Work with NIH to fund research
examining alternative and emerging methods of data collection.
TABLE 6-1 Continued

Copyright © National Academy of Sciences. All rights reserved.
Evaluating Obesity Prevention Efforts: A Plan for Measuring Progress
149National Obesity Evaluation Plan
Figure 8-1 and Table 8-1), using existing monitoring and surveillance systems as data sources. Briefly, this process includes setting appropriate intervention goals and time frame based on the specific APOP strat-egy and intervention being measured. As well, a logic model or theoretical framework detailing the inputs, outputs, and outcomes/impacts (short-term, long-term, and ultimate) should be developed. When possible, these evaluation activities should be planned to coincide with existing monitoring/surveillance activities and dates. Alternately, a separate and more intensive evaluation could be conducted during an “off year” for a national survey to provide additional data, additional questionnaire items could be added to an existing surveillance system, or priority populations (e.g., Supplemental Nutrition Assistance Program [SNAP] recipients) could be oversampled.
To illustrate, a few concrete scenarios on how the National Obesity Evaluation Plan might initially take shape are provided in Table 6-2. A separate example was developed for each level of the social eco-logical model as proposed by the IOM (2007b) and in the APOP report (IOM, 2012a) (see Figure 3-2).
Leadership and Oversight of the National Obesity Evaluation Plan
The implementation of the National Obesity Evaluation Plan calls for strong commitment and coor-dination at the federal level, with establishment of an obesity task force or other federal entity to oversee plan activities. Leadership activities include providing an effective national leadership structure for these activities; ensuring adequate benchmarks and guidelines for the plan; setting processes for prioritization, funding, accountability, and adaptation; and creating a timeline and management structure for activities, as proposed in the WHO framework (WHO, 2008).
Convening a federal obesity evaluation task force/entity to oversee the National Obesity Evaluation Plan would be an appropriate first step to guide its development. This task force could be part of an exist-ing committee, such as the Department of Health and Human Services (HHS) Healthy Weight Task Force or the National Prevention Council or could be a newly organized committee that would coordinate with appropriate partners, such as the HHS Healthy Weight Task Force; the National Prevention Council4 and multi-agency representation; National Collaborative on Childhood Obesity Research (NCCOR); the Interagency Committee on Human Nutrition Research; the President’s Council on Fitness, Sports, and Nutrition; and other appropriate national committees. Representatives on the task force or entity would include federal agencies involved in coordinating existing assessments, such as the CDC (NHANES, NHIS, BRFSS, YRBSS, Pregnancy Risk Assesssment Monitoring System [PRAMS], SHPPS), USDA, NCCOR (CDC, National Institutes of Health [NIH]/National Cancer Institute [NCI], Robert Wood Johnson Foundation [RWJF], and USDA), and Health Resources and Services Administration’s commu-nity health centers, as well as other sectors that are involved in dietary and physical activity policies, such as the Departments of Education and Transportation. In addition, representatives from other groups that are conducting extensive monitoring, surveillance, or summative evaluations, and representatives from major stakeholder groups, such as child care settings, schools, worksites, local and state government, pub-lic health departments, and communities ideally would be included, either as committee members, or as part of an Advisory Committee. Examples of organizations that might be represented include the Nielsen Corporation and the National Restaurant Association, as well as advisors from the WHO or other coun-tries where similar plans have been implemented. Creation of a task force to oversee the plan is a model
4 See http://www.surgeongeneral.gov/initiatives/prevention/about/index.html (accessed November 11, 2013).
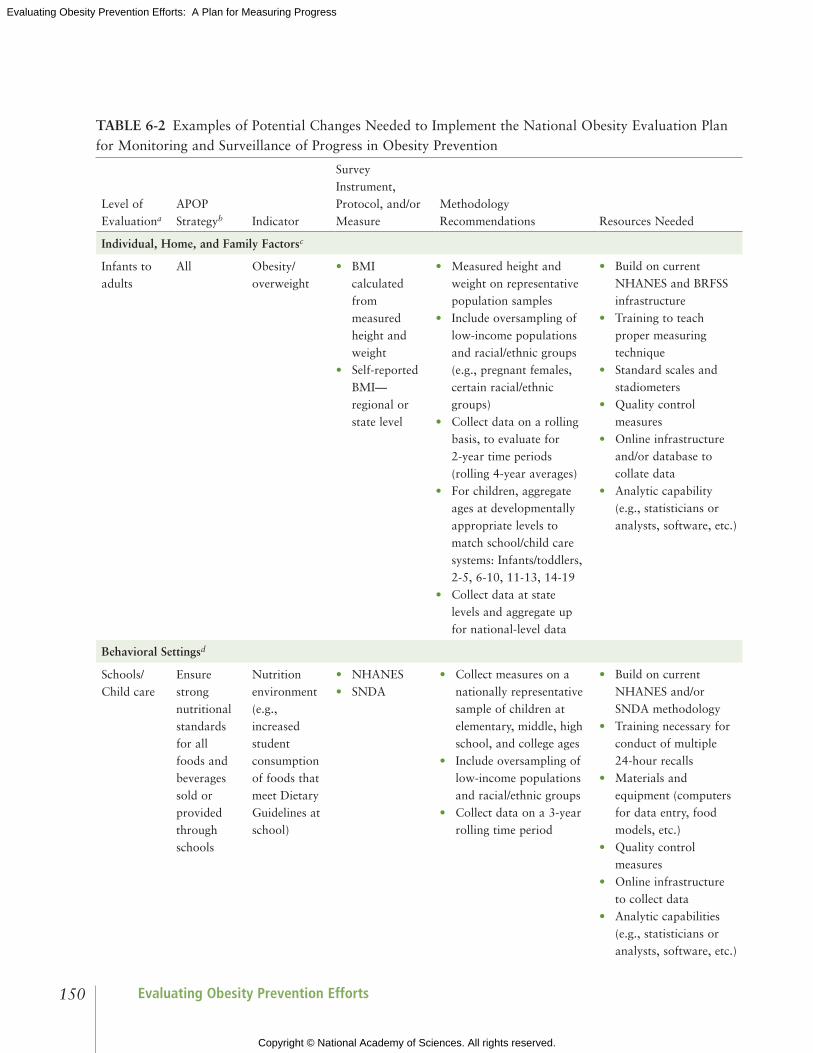
Copyright © National Academy of Sciences. All rights reserved.
Evaluating Obesity Prevention Efforts: A Plan for Measuring Progress
Evaluating Obesity Prevention Efforts150
TABLE 6-2 Examples of Potential Changes Needed to Implement the National Obesity Evaluation Plan for Monitoring and Surveillance of Progress in Obesity Prevention
Level of Evaluationa
APOP Strategyb Indicator
Survey Instrument, Protocol, and/or Measure
Methodology Recommendations Resources Needed
Individual, Home, and Family Factorsc
Infants to adults
All Obesity/ overweight
• BMI calculated from measured height and weight
• Self-reported BMI— regional or state level
• Measured height and weight on representative population samples
• Include oversampling of low-income populations and racial/ethnic groups (e.g., pregnant females, certain racial/ethnic groups)
• Collect data on a rolling basis, to evaluate for 2-year time periods (rolling 4-year averages)
• For children, aggregate ages at developmentally appropriate levels to match school/child care systems: Infants/toddlers, 2-5, 6-10, 11-13, 14-19
• Collect data at state levels and aggregate up for national-level data
• Build on current NHANES and BRFSS infrastructure
• Training to teach proper measuring technique
• Standard scales and stadiometers
• Quality control measures
• Online infrastructure and/or database to collate data
• Analytic capability (e.g., statisticians or analysts, software, etc.)
Behavioral Settingsd
Schools/ Child care
Ensure strong nutritional standards for all foods and beverages sold or provided through schools
Nutrition environment (e.g., increased student consumption of foods that meet Dietary Guidelines at school)
• NHANES• SNDA
• Collect measures on a nationally representative sample of children at elementary, middle, high school, and college ages
• Include oversampling of low-income populations and racial/ethnic groups
• Collect data on a 3-year rolling time period
• Build on current NHANES and/or SNDA methodology
• Training necessary for conduct of multiple 24-hour recalls
• Materials and equipment (computers for data entry, food models, etc.)
• Quality control measures
• Online infrastructure to collect data
• Analytic capabilities (e.g., statisticians or analysts, software, etc.)

Copyright © National Academy of Sciences. All rights reserved.
Evaluating Obesity Prevention Efforts: A Plan for Measuring Progress
151National Obesity Evaluation Plan
Level of Evaluationa
APOP Strategyb Indicator
Survey Instrument, Protocol, and/or Measure
Methodology Recommendations Resources Needed
Sectors of Influencee
National policy
Provide support for the science and practice of physical activity
Physical activity guidelines
Survey of Physical Activity
Guidelines for
Americans
• Obesity task force appoints a committee to oversee development of guidelines
• Codify revision of physical activity guidelines every 5 years
• Put revisions into rule or regulation
• Funding for convening committee, overseeing task of revision, review of literature, etc.
Social Norms and Values
Children and adults
Provide and support community programs designed to increase physical activity
Social norms regarding physical activity
Survey questionnaire items
• Adapt from similar questionnaire items in NCHS/NHIS or related surveys from NCCOR
• May need to develop and/or adapt additional questionnaire items
• Information may differ by age group
• Resources to include questions on surveys
• Resources for analysis of survey items
NOTE: APOP = Accelerating Progress in Obesity Prevention report; BMI = body mass index; BRFSS = Behavioral Risk Factor Surveillance System; NCCOR = National Collaborative on Child Obesity Research; NCHS/NHIS = National Center for Health Statistics/National Health Interview Survey; NHANES = National Health and Nutrition Examination Survey; SNDA = School Nutrition Dietary Assessment.a Relates to levels of the social ecological framework as operationalized in the APOP report (IOM, 2012a, Figure 3-2, page 90).b IOM, 2012a.c Family factors include demographics, energy balance, psychosocial factors, and gene-environment.d Behavioral settings include communities, worksites, health care, and school and child care.e Sectors of influence include government, public health, health care, agriculture, education, media, land use and transportation, communities, foundations, businesses, food and beverage companies, retail food stores and restaurants, leisure and recreation, entertainment, and other businesses.
TABLE 6-2 Continued
followed not only in the WHO guidelines, but also in other national surveillance program plans. For example, in 2003, the National Forum for Heart Disease and Stroke Prevention, a collaborative of more than 80 organizations committed to the elimination of cardiovascular disease, created A Public Health Action Plan to Prevent Heart Disease and Stroke (CDC, 2003; National Forum for Heart Disease and Stroke Prevention, 2008). Central to its action plan is the creation of a comprehensive national and state cardio vascular disease surveillance program to provide accurate and timely information to accelerate progress in cardiovascular disease prevention. The recommended initial step in creating the cardiovascular disease surveillance system in the Public Health Action Plan to Prevent Heart Disease and Stroke report is similar to what is proposed in the current report: establish leadership through a national coordination unit (National Forum for Heart Disease and Stroke Prevention, 2008).

Copyright © National Academy of Sciences. All rights reserved.
Evaluating Obesity Prevention Efforts: A Plan for Measuring Progress
Evaluating Obesity Prevention Efforts152
Identify Current National Obesity Intervention Efforts for Evaluation
To provide benchmarks and guidelines for indicators for the National Obesity Evaluation Plan, it is necessary to have current national goals and objectives. The United States has robust national goals for health (Healthy People 2020, HHS, 2010b), diet (Dietary Guidelines for Americans, HHS, 2010a), and physical activity (Physical Activity Guidelines for Americans, HHS, 2008). By mandate, Healthy People and the Dietary Guidelines are updated on a periodic basis; unfortunately, the Physical Activity Guidelines do not have the same mandate, and thus, it is recommended that regular updates to the Physical Activity Guidelines for Americans mirror the periodicity of the Dietary Guidelines (e.g., every 5 years). In addition to the national recommendations listed, the APOP strategies for prevention of obesity (IOM, 2012a) guide the indicators and measurement systems proposed in the National Obesity Evaluation Plan.
An initial assignment for the obesity evaluation task force would be to provide a process for priori-tization of plan recommendations, accountability, and adaptability or revision, including a review of the existing national obesity reports and objectives. In light of federal budget realities, recommendations will need to be prioritized, with rapid implementation of relatively easy and low-cost provisions, followed by long-term planning for more difficult or less developed indicators and systems. Accountability is crucial to measuring progress and will entail an annual report to whatever agency is leading this effort on priori-tization of recommendations, plans, and progress. A timeline for implementation of the National Obesity Evaluation Plan would provide for short-term objectives achievable within 1-3 years, intermediate-term objectives achievable within 3-5 years, and long-term objectives for 5 years or more (see Box 6-2).
The APOP efforts that would be evaluated in the National Obesity Evaluation Plan would also need to be prioritized, based on current policy initiatives, media programs, national or multi-state programs under way, or potential significant environmental changes such as voluntary industry-initiated changes in food marketing or formulation. Ideally, the federal obesity evaluation task force would oversee this activity and would be responsible for soliciting stakeholder input to help to guide the process. Use of the evaluation framework presented in Chapter 3 would provide a roadmap for identifying inputs for the specific intervention or APOP strategy, the outputs as a result of the change or the initiative, and the outcomes/impacts. To determine the effects of national obesity prevention interventions, data from U.S. monitoring/surveillance systems could be used to determine changes in specific outcomes such as BMI over time (pre/post or time series), or, alternately, U.S. data, intervention efforts, and trends could be com-pared to similar countries. Cross-country comparisons have been previously used to document changes in secular national trends in lifestyle behaviors such as nutrition and cardiovascular disease outcomes in the Seven Countries Study (Menotti et al., 1993).
Evaluating nationally based or federal interventions can be challenging. Because these programs or policies are wide-reaching by design, it is difficult to use a more rigorous controlled trial or study design; these interventions are often implemented together with other initiatives, so it is difficult to determine the relative contributions of each component to measured outcomes; and existing surveillance systems may not adequately assess program outcomes or impacts. When federal initiatives are rolled out over a speci-fied time period, it is often possible to compare outcomes in states that are early adopters to outcomes in states that are more likely to be laggards. Collection of process evaluation data, such as program reach, fidelity, and dose, can also provide useful evidence for effectiveness of obesity prevention interventions in state-level comparisons. Because of these limitations, at the national level it is advantageous to use moni-
Copyright © National Academy of Sciences. All rights reserved.
Evaluating Obesity Prevention Efforts: A Plan for Measuring Progress
153National Obesity Evaluation Plan
toring and surveillance data to observe trends over time, for both implementation of interventions and APOP strategies, as well as for intended outcomes and impacts.
Identify Current National Obesity-Related Efforts for Measurement and Data Collection
In the National Obesity Evaluation Plan, many of the proposed monitoring and surveillance activi-ties are consistent with current U.S. efforts, as well as other national and international recommenda-tions and surveillance/data systems, such as the WHO evaluation framework (WHO, 2008). Evaluation activities at the federal level often consist of reports examining results of existing surveillance systems, or specifically designated surveys, such as the SNDA. The SNDA provides monitoring of the nutritional con-tent of school meals and the school nutrition environment and of student intake over time in response to changing school meal guidelines and rules (Briefel et al., 2009; Fox et al., 2009).
Additionally, obesity prevention interventions that are implemented nationally cannot necessarily be evaluated using a rigorous study design or controlled trial. For example, at an IOM workshop, Robert C. Hornik described five approaches often taken when a randomized controlled trial is not possible for evaluating mass media campaigns: long-term cohort studies, geographic cross-community comparisons, interrupted time series studies, associational time series studies, and other study designs (e.g., quasi- experimental) (IOM, 2012b). Hornik (IOM, 2012b) and Sanson-Fisher et al. (2007) discuss the strengths and weakness of each of these approaches. Hawkins et al. (2007) and Mercer et al. (2007) weigh in on the trade-offs among them in public health campaigns (see Table 6-3). Chapter 8 provides further resources and guidance on the diverse study designs and methods for tracking interventions.
To conduct these types of studies nationally, it is often advantageous or feasible to draw on data derived from monitoring and surveillance systems, rather than to mount ad hoc original surveys. As with cross-state comparison, cross-country comparisons can be conducted using quasi-experimental designs, but again, these comparisons often rely on surveillance systems that use consistent indicators, measures, and methodologies across countries and over time. Therefore, much of the focus of the National Obesity Evaluation Plan is on existing and proposed surveillance activities, from which data can be derived for evaluation efforts, at the national level, and potentially at the state and local levels.
The Committee’s assessment of current monitoring and surveillance activities in the United States found that several potential components of a national evaluation plan for obesity prevention exist, but there are challenges and barriers to improving national gaps in indicators, methodology, and reach. For example, the national nutrition surveillance systems are designed to meet the specific data needs of mul-tiple stakeholders. There are competing priorities for collecting information to meet data needs, and improvements in design, coordination, and data collection recommended by expert groups (Briefel and McDowell, 2012; NRC, 2005; Woteki et al., 2002) have been hampered by insufficient funding and a centralized coordinating body for obesity. To fully understand the current challenges and barriers to fully implementing a National Obesity Evaluation Plan, it is useful to understand the pertinent history and structure underlying the current systems for data collection to draw on “lessons learned” to justify the proposed plan objectives and activities. In addition, examination of past and current evaluation efforts are needed to effectively use existing resources and data sets, to minimize duplication and unnecessary response burden on the practitioners and public asked to provide data, and to anticipate potential resis-tance to changes in survey or other surveillance system items or wording that might make their results less useful in comparison with past data. Below is a brief legislative history of U.S. surveillance efforts related

Copyright © National Academy of Sciences. All rights reserved.
Evaluating Obesity Prevention Efforts: A Plan for Measuring Progress
Evaluating Obesity Prevention Efforts154
TABLE 6-3 Five Approaches to Evaluating Large-Scale Communication Programs
Design Description Examples Comments
Long-term cohort studies
Follow a cohort over multiple years and link early exposure to later behavior.
National Youth Anti-Drug Media Campaign (Hornik et al., 2008)
VERBTM physical activity campaign (Huhman et al., 2007)
Requires large-sample cohorts
Geographic cross-community comparisons
Use planned or natural variation in exposure and link to behaviors.
Wakefield et al. (2008) compared media markets with different volumes of anti-smoking commercials
Farrelly et al. (2009) used same approach to examine effects of positive images of smoking in the truth® campaign
Appropriate when roughly comparable media markets are likely to receive different levels of exposure to a message or campaign
Interrupted time-series studies
Collect observations at multiple points both before and after a campaign (the “interruption”).
Palmgreen et al. (2002) evaluated an anti-drug campaign in Kentucky
Williams et al. (2002) evaluated North Carolina’s Click It or Ticket seatbelt campaign
Kincaid et al. (2002) evaluated a vasectomy campaign in Brazil
Useful when the timing of a campaign is precise and it is designed to cause a sharp change
Associated time series
Document changes in behavior that coincide with the “accumulating presence” of the message. Compare regions with different timing or levels.
National High Blood Pressure Education Program (Roccella, 2002)
California Tobacco Control Program (Pierce et al., 2002)
Can be used to evaluate longer-term campaigns with less discrete time frames
Small-scale quasi-experiments
Compare a small number of treatment and control areas over time to see whether trajectories of change are different.
Stanford Five-City Project compared two treatment communities with two nontreatment communities (Farquhar et al., 1990)
Worden and Flynn (2002) compared communities that had a school anti-smoking program with communities that had such a program plus a media campaign
Most useful when there is little risk that differences unrelated to the intervention will affect outcomes
SOURCE: Summarized by IOM, 2012b.
to nutrition, physical activity, and obesity and how these efforts have evolved to meet increasing needs for other types of data.
History of Obesity-Related Surveillance in the United States
Nutrition surveillance. National nutrition surveillance activities began in the late 1890s with the devel-opment of food composition databases. The first national dietary surveys were conducted in the 1930s.

Copyright © National Academy of Sciences. All rights reserved.
Evaluating Obesity Prevention Efforts: A Plan for Measuring Progress
155National Obesity Evaluation Plan
Body mass or corpulence status based on measured height and weight has been measured since the first National Health Examination Survey in 1960-1962, the predecessor of today’s NHANES. Since then, more than 35 national surveys, surveillance systems, and databases have been developed to meet the varied and changing information needs of federal agencies, researchers, and data users (Briefel, 2006; Briefel and McDowell, 2012; Life Sciences Research Office, 1995).
The U.S. nutrition surveillance system was formally established with passage of the Food and Agriculture Act of 1977 (Public Law 95-113, 95th Cong., September 29, 1977), leading to federal efforts to coordinate nutrition surveys and other national health surveys in the late 1970s and 1980s (Green et al., 1983) and the passage of the National Nutrition Monitoring and Related Research Act of 1990 (Public Law 101-445, October 22, 1990). A Ten-Year Comprehensive Plan guided federal actions for nutrition surveillance from 1992 to 2002 (HHS and USDA, 1993) and identified three national objectives critical to the success of a coordinated, comprehensive nutrition surveillance program:
1. a comprehensive program through continuous and coordinated data collection; 2. comparability and quality of data across the program; and 3. improvement of the research base for nutrition surveillance.
The Ten-Year Plan provided the framework for (1) the integration of the two national dietary sur-veys, HHS’s NHANES, and the USDA’s Continuing Survey of Food Intakes by Individuals (Murphy, 2003; Woteki, 2003); (2) the expansion of specialized databases for food composition and food access; and (3) quality-control mechanisms and studies to evaluate nutrition assistance programs and nutrition standards through monitoring of interventions. Monitoring data from these activities has often been used to assess ongoing changes in school meals as a result of new legislation (e.g., reauthorization of child nutrition programs). Despite support from the scientific community (Woteki et al., 2002), the nutrition monitor-ing/surveillance legislation was not renewed in 2002. Surveillance activities are continuing in the United States, but without the formal, coordinated guidance of an interagency board or legislative mandate. This lack of a designated task force to coordinate monitoring and surveillance data to evaluate obesity progress is a barrier to coordination of collecting data on new indicators, creating or expanding data systems, and reducing duplication of effort.
The current nutrition monitoring system and activities provide a foundation to build on for the national obesity evaluation plan. The most widely used and cited U.S. national survey for the surveillance of obesity and related behaviors is the NHANES, which includes objective measures of height and weight, diet,5 and physical activity risk factors, and other chronic conditions associated with obesity. NHANES data are collected at the individual level, which means that information to monitor environments and policies is not included systematically in the same data systems. Continuous since 1999, NHANES has an annual sample design that includes over-sampling of racial/ethnic groups, low-income white persons and, at times, pregnant women. NHANES provides nationally representative data and is not designed to provide state- or community-level estimates. However a representative sample of New York City adult residents participated in the New York City Health and Nutrition Examination Survey (NYC HANES)
5 In NHANES, diet is assessed by 24-hour recall, which is the gold standard for assessing population-level intake of calories, macro-nutrients, micronutrients, and foods/food groups, as opposed to other monitoring and surveillance systems, which generally rely on food frequency–type questions about select foods/food groups.

Copyright © National Academy of Sciences. All rights reserved.
Evaluating Obesity Prevention Efforts: A Plan for Measuring Progress
Evaluating Obesity Prevention Efforts156
in 2004, and a second NYC HANES was scheduled for 2013 (NYC Department of Health and Mental Hygiene, 2013). Similarly in 2011, the Department of Public Health for the County of Los Angeles begun a pilot project to establish a local health profile description of adult obesity and related cardio vascular disease risk factors called the Los Angeles County Health and Examination Survey (Fielding, 2011). These efforts may serve as a model for other cities or communities that have the resources to replicate NHANES protocols to collect objective obesity and related health measures for surveillance or summative evaluation purposes.
The NHIS provides large sample sizes and information on self-reported height, weight, and comor-bid conditions commonly associated with obesity. National and state nutrition surveys have provided surveillance data on topics such as knowledge, attitudes, and behavior about diet and nutrition; food shopping practices; weight loss practices; and breastfeeding practices. Data from these surveys have been used to evaluate the effects of national nutrition policies, programs, and practices on special populations, such as Special Supplemental Nutrition Program for Women, Infants, and Children (WIC) or SNAP par-ticipants (see Table 4-2, Appendix Tables D-1 and F-2).
State surveillance systems have historically been an integral part of past national activities to track nutrition at the state level and more broadly at the national level if all or most states participate to assess progress in meeting obesity-relevant national health objectives. The BRFSS and the YRBSS pro-vide self-reported weight and height and limited measures of diet and physical activity behaviors every 2 years. Both systems can provide data at multiple representative levels (national, state). Further details can be found later in this chapter’s section on Surveillance Systems and in Appendix Table D-1. CDC has traditionally administered other data systems that could be used for obesity-related measures, such as the Pediatric Nutrition Surveillance System (PedNSS) and the Pregnancy Nutrition Surveillance System (PNSS). Both of these state-level surveillance systems began in the 1970s and 1980s to focus on young, low-income children and their mothers, because sample sizes for these high-risk groups in NHANES were fairly small. Despite the utility of these data to provide information on key populations of interest, both programs were discontinued in 2012, with the last data collected in 2011 (NCCOR, 2013). The deci-sion to move data collection for selected indicators from these surveillance systems to WIC eliminates the technical assistance to states and local agencies to obtain data previously collected through PedNSS and PNSS;6 federal budgets are not sufficient to do new and continuing data systems.7
Physical activity surveillance. Although physical activity is a key determinant of obesity and chronic dis-ease, surveillance of physical activity in the United States has not been as robust as for diet or obesity. For surveillance of physical activity among adults and adolescents, the NHIS and the YRBSS have been used to track Healthy People 2020 progress (Carlson et al., 2010; HHS, 2010b). Accelerometers, introduced to measure physical activity in the 2003-2004 NHANES, improved physical activity measurement, which had previously relied on self-report or parental reports for children. Efforts have also been made to devel-op measures of inactivity (e.g., the number of hours of screen time or time spent sleeping) and physical activity environments at child care centers, schools, and in communities (NCCOR, 2013).
6 Appendix Table F-2 includes the PRAMS, a potential data source for information on diet and activity during pregnancy and pre-pregnancy weight.
7 Selected indicators, such as breastfeeding and maternal BMI, that may have been collected in PNSS, can be collected from parents through the information collected from the 2003 proposed birth certificate changes (CDC, 2012a; Martin et al., 2012).

Copyright © National Academy of Sciences. All rights reserved.
Evaluating Obesity Prevention Efforts: A Plan for Measuring Progress
157National Obesity Evaluation Plan
The lack of adequate physical activity surveillance may be related to the only recent attention to and development of national physical activity guidelines. For example, the Dietary Guidelines for Americans have been mandated since 1977 (HHS, 2010a), but the Physical Activity Guidelines for Americans have existed only since 2008 (HHS, 2008). A National Physical Activity Plan—“a comprehensive set of poli-cies, programs, and initiatives that aim to increase physical activity in all segments of the American population” was developed recently by a private-/public-sector collaborative (Coordinating Committee and Working Group for the Physical Activity Plan, 2010), but as of 2013 only one state had developed a plan that specifically addresses physical activity (Duke, 2009; Kohl et al., 2013). An initial evaluation of the National Physical Activity Plan has been funded by CDC and includes assessment of implementa-tion reports from each of the identified sectors, case studies of several states implementing aspects of the plan, and a survey of members of the National Society of Physical Activity Practitioners in Public Health (Bornstein et al., 2013; Evenson et al., 2013a,b; Kohl et al., 2013).
The relative early field-building status of physical activity in health and the lack of benchmarks for surveillance and summative evaluation of physical activity, and of consensus on validated measures of envi-ronmental determinants, at the national, state, and community levels likely contribute to the paucity of sur-veillance data on physical activity (Ottoson et al., 2009). The relatively recent acknowledgement of physical inactivity as a separate health risk may be another contributing reason (Kohl et al., 2012; Lee et al., 2012).
National obesity-related policy monitoring, surveillance, and summative evaluation. Currently, the only national obesity-related public policy monitoring/surveillance systems focus on state laws and school dis-trict wellness policies and on food and beverage taxation (see Appendix Table D-1). The monitoring of policy implementation is useful for tracking progress and changes in codified public policies over time and across jurisdictions, for assessing their implementation, and for examining factors influencing policy adoption. Policy surveillance is useful for examining the reach and impact of public policies on changes in related outcomes or impacts at the national, state, community, and individual levels.
The NCI’s Classification of Laws About School Students (CLASS) (NCI, 2013) and the Robert Wood Johnson Foundation–supported Bridging the Gap (BTG) program (University of Illinois at Chicago, 2013a) both include quantitative measures of the strength and comprehensiveness of codified state statutory (legislative) and administrative (regulatory) laws for each of the 50 states and the District of Columbia related to school-based nutrition and physical activity. The CLASS and BTG systems are complementary and assess similar topics, but the state laws are analyzed using different analytic coding schemes and different time points (December 31 of each year for CLASS and the beginning of each school year for BTG). BTG also conducts the largest, ongoing, nationwide evaluation of the con gressionally mandated school district wellness policies (University of Illinois at Chicago, 2013b). BTG also compiles annual quantitative data on codified state safe routes to school-related laws, farm-to-school laws, and food and beverage taxation (Chriqui et al., 2012; National Association of State Boards of Education, 2013; University of Illinois at Chicago, 2013a).
In addition to the policy monitoring and surveillance systems, several organizations maintain bill-level tracking systems for monitoring the introduction, adoption, and/or repeal of individual-level bills and/or session laws across the 50 states and the District of Columbia: CDC’s Chronic Disease State Policy Tracking System, the National Conference of State Legislatures, the School Nutrition Association, and the Rudd Center for Food Policy and Obesity (CDC, 2013c; National Conference of State Legislatures, 2013;

Copyright © National Academy of Sciences. All rights reserved.
Evaluating Obesity Prevention Efforts: A Plan for Measuring Progress
Evaluating Obesity Prevention Efforts158
Rudd Center for Food Policy and Obesity, 2013; School Nutrition Association, 2011). Although these sys-tems do not provide quantitative data on the current status of state laws, they provide useful information for evaluating policy activity and related advocacy efforts.
Related Monitoring Surveys/Systems in the United States
In addition to previously described national and state surveys, other indicators drawn from current studies (see Appendix Table D-1) are proposed as part of the National Obesity Evaluation Plan based on the specific measures, target population, and level of the data desired (see Appendix Table F-2) for indica-tors. For example, evaluations of USDA nutrition assistance programs periodically provide information on the dietary intakes and on the nutrition and health behaviors of program participants, who are often low-income and/or disadvantaged populations (e.g., National Household Food Acquisition and Purchase Survey; Studies of Child and Adult Care Food Program; Studies of WIC Participants; see Appendix Table F-2). Some of these studies collect height and weight and obesity-related behaviors from participants at WIC clinics (NCCOR, 2012) or public schools. Data from the SNDA help to monitor progress in school nutrition policies. Data from the SNDA have been instrumental in addressing changes to competitive food policies and school meal regulations to increase dietary quality and reduce excess calories in light of child-hood obesity (IOM, 2004, 2007a), and they have been used to assess the relationship between school nutri-tion policies and students’ diet and weight status (Briefel et al., 2009; Fox et al., 2009).
Other school-level environmental data can be obtained from the SHPPS, which provides data on health-related policies and practices at the school level, some of which include diet and physical activity. These data are often used for state-by-state comparisons to measure progress in implementation of state policies across the United States (CDC, 2006). Unfortunately, SHPPS is administered only every 6 years, and similar surveys are not available in other settings, such as child care, worksites, and health care clin-ics, probably because of the heterogeneous structure of these settings and the lack of definitive “umbrella” agencies that collect data for these entities analogous to the National Center for Education Statistics (Institute of Education Services, 2013), which collects data related to schools, and USDA, which collects data on school meal programs. Although some states might provide information for these types of orga-nizations, the lack of a central organizational structure at the federal level is a barrier to identification of individual units for a sampling frame, as well as to accountability for conduct of the surveys. SHPPS might provide a useful model for data collection in these other settings.
One recent effort to measure the messaging environment was outlined in a recent updated report by the Federal Trade Commission on food marketing to children and adolescents (FTC, 2012). These reports, though laborious and expensive, if done regularly would provide excellent monitoring of the nutritional profile of foods marketed to youth, marketing activities directed to youth, and other marketing initia-tives undertaken by food manufacturers. For example, the Healthy Weight Commitment Foundation—a voluntary effort by retailers, food and beverage manufacturers, restaurants, sporting goods and insurance companies, trade associations, nongovernmental organizations, and professional sports organizations to promote ways to achieve a healthy weight—provides additional data opportunities for evaluation efforts (Healthy Weight Commitment Foundation, 2013). Several proprietary databases, including the National Consumer Panel (formerly known as A.C. Neilsen’s Homescan), collect information on household food purchases based on consumers transmitting data on scanned purchases, including fresh foods, weekly through a telephone line. Other proprietary databases include scanner data, food prices, and household

Copyright © National Academy of Sciences. All rights reserved.
Evaluating Obesity Prevention Efforts: A Plan for Measuring Progress
159National Obesity Evaluation Plan
purchases, but they are limited in that they include only foods purchased at retail stores and not foods purchased at restaurants (NRC, 2005; see Appendix Table F-2). These kinds of data sources, if made pub-licly available, could provide excellent surveillance of consumer behavior.
As previously stated in Chapter 4, indicators for the National Obesity Evaluation Plan are based on existing surveys and surveillance systems, such as NHANES, NHIS, National Survey of Children’s Health, BRFSS, YRBSS, and SHPPS (see Table 4-2). Table 6-4 outlines indicators for the National Obesity Evaluation Plan based on available data sources, and indicates, by color coding, which indicators are in place (green), which are relatively easy to adapt to existing systems8 or are partially in place9 (yellow), or which will require further development and/or implementation (red) at the national and state levels. In addition, Table 6-4 maps these indicators to those outlined in the WHO diet, physical activity, and health evaluation plan (WHO, 2008), as categorized by the APOP goal areas. Key overarching or systems-level indicators such as adult and child prevalence of obesity and incidence of obesity are also included. Based on the initial work done for this report, gaps in indicators collected from/on representative samples are especially evident for assessment of early childhood education settings, worksites, health care groups, policies, and food marketing.
The WHO report also identifies process-level indicators necessary for the infrastructure, coordi-nation, and accountability of an integrated evaluation plan. The Committee recommends the addition of similar process-oriented indicators in the National Obesity Evaluation Plan and state plans, such as (1) establishment of a coordinating and oversight federal obesity evaluation task force; (2) establishment of benchmarks, guidelines, and/or any related legislation for diet and physical activity; (3) establishment of an advisory committee to the oversight obesity evaluation task force with stakeholder input; (4) designation of a training and technical assistance center; (5) coordination of the monitoring and evaluation system; and (6) development of a standardized system for data feedback to stakeholders.
Harmonization and Expansion of Existing Surveillance and Evaluation Efforts
Maximizing use of current monitoring/surveillance and summative evaluation efforts is important, because many of these systems are already in place, have existing resources, and answer to designated constituencies. To accomplish this, it is necessary to harmonize metrics across systems and coordinate and expand existing systems after priorities are identified. Coordination of efforts across current surveil-lance and evaluation structures can minimize duplication of effort, leverage resources, and maximize use of data, as well as prioritize data to address strategies addressed in the APOP report (IOM, 2012a). The coordination of these efforts would require planning and additional resources, but building on exist-ing frameworks and field experience is practical and would involve leveraging of existing funds (see Recommendation 2 in Chapter 10).
Harmonization also includes enhanced data collection through standardization of current metrics and coordination of different data systems, which is a more intermediate step in the process. For example, electronic health records (EHRs) can be standardized to facilitate aggregation of data across different health care plans across the United States. Initiatives such as Integrating the Healthcare Enterprise10 are examining ways to promote and coordinate established standards for sharing of electronic health infor-
8 Existing regional, county data could be aggregated, or sampling could be improved.9 For example, YRBSS does not collect data for all states.10 See http://www.ihe.net (accessed November 11, 2013).

Copyright © National Academy of Sciences. All rights reserved.
Evaluating Obesity Prevention Efforts: A Plan for Measuring Progress
Evaluating Obesity Prevention Efforts160
TABLE 6-4 Indicators Currently Available for Use at the National and State Levels, with Comparison to World Health Organization (WHO) Proposed Indicators
Indicator Topica
Data Source or Documentationb
National Planc
State Plansc
WHO Proposed Indicatorsd
Overarching/System Level
1 Obesity-adult BRFSS; NHANES Core
2 Obesity-adolescent NHANES; YRBSS Core
3 Obesity-child NHANES Core
4 Obesity-preschool age NHANES; WIC (for low-income children)
Core
5 Overweight-adult BRFSS; NHANES Core
6 Overweight-adolescent NHANES; YRBSS Core
7 Overweight-child NHANES Core
8 Overweight-preschool age NHANES; WIC (for low-income children)
NA
9 Overweight–infant NHANES; WIC (for low-income children)
NA
10 Gestational weight gain IFPS-II; National Vital Statistics System and birth certificates; PRAMS
NA
11 Birth weight National Vital Statistics System and birth certificatese
NA
12 Maternal pre-pregnancy weight IFPS-II; National Vital Statistics System and birth certificatese; PRAMS
NA
13 Maternal post-pregnancy weight IFPS-II NA
Goal Area 1: Physical Activity Environment
14 Adult physical activity BRFSS; NHANES; NHIS Core
15 Adolescent physical activity NHANES; YRBSS Expanded
16 Child and adolescent daily vigorous physical activity
NHANES; NSCH; YRBSS Expanded
17 Joint/shared use of community facilities (school) SHPPS NA
18 Policies that promote physical activity and the built environment
CDC Chronic Disease State Policy Tracking System
NA
19 Adult active transport by walking ACS Expanded
20 Active commuting to school NHTS Expanded
21 Bicycling by adults ACS, NHTS Expanded
22 Recreational facility outlet density CzCBP NA
23 Child/adolescent physical activity–related attitudes and perceptions (safe neighborhoods)
NSCH NA
24 Child/adolescent physical activity–related attitudes and perceptions (supportive neighborhoods)
NSCH NA

Copyright © National Academy of Sciences. All rights reserved.
Evaluating Obesity Prevention Efforts: A Plan for Measuring Progress
161National Obesity Evaluation Plan
Indicator Topica
Data Source or Documentationb
National Planc
State Plansc
WHO Proposed Indicatorsd
25 Physical activity for older adults BRFSS; NHANES; NHIS NA
26 Nonschool organized physical activity–related activities
NSCH Expanded
27 Physical activity requirements for licensed child care
National Resource Center for Health and Safety in Child Care and Early Education
Core
Leisure physical activity—adultsf BRFSS; NHANES Core
Sedentary activity—adultsf BRFSS; NHANES Expanded
Sedentary activity—adolescentsf NHANES; YRBSS Expanded
Goal Area 2: Food and Beverage Environment
28 Adult energy intake NHANES Expanded
29 Child and adolescent energy intake NHANES Expanded
30 Sugar-sweetened beverage policies in schools BTG; CLASS; SHPPS; SNDA Expanded
31 Sugar-sweetened beverage consumption NHANES; YRBSS (only adolescents)
Expanded
32 Price of low-fat milk Quarterly Foods-at-Home Price Database
NA
33 Sugar-sweetened beverage taxation BTG; CDC Chronic Disease State Policy Tracking System; Yale Rudd Center for Food Policy and Obesity—Legislative Database
Expanded
34 Child and adolescent caloric intake in restaurants NPD Group NA
35 Consumption of solid fats and added sugars NHANES Expanded
36 Consumption of solid fats NHANES Expanded
37 Consumption of added sugars NHANES Expanded
38 School policies to facilitate access to clean drinking water
BTG; CLASS; SHPPS Expanded
39 Consumption of fruits BRFSS (adults); NHANES; YRBSS (adolescents)
Core
40 Consumption of vegetables BRFSS (adults); NHANES; YRBSS (adolescents)
Core
41 Consumption of whole grains NHANES NA
42 Healthy vending policies in federal buildings and worksites
General Services Administration
NA
43 Nutrition standards in child care National Resource Center for Health and Safety in Child Care and Early Education
Core
44 Food retail incentive policies CDC State Indicator Report on Fruits and Vegetables
NA
TABLE 6-4 Continued
continued

Copyright © National Academy of Sciences. All rights reserved.
Evaluating Obesity Prevention Efforts: A Plan for Measuring Progress
Evaluating Obesity Prevention Efforts162
Indicator Topica
Data Source or Documentationb
National Planc
State Plansc
WHO Proposed Indicatorsd
45 Fast food outlet density CZCBP NA
46 Healthy food outlet density CZCBP NA
47 Price of fruit and vegetables Quarterly Foods-at-Home Price Database
NA
Goal Area 3: Messaging Environment
48 Funding for national social marketing program Federal appropriations and HHS budgets; State budgets
Core
49 Television marketing of foods and beverages to children and adolescents (Dietary Guidelines)
Nielson advertising data Core
50 Purchase of foods and beverages recommended in Dietary Guidelines for Americans
National Consumer Panel NA
51 Nutrition education policies for federal nutrition programs
State SNAP-Ed plans Expanded
52 Purchase by SNAP participants of foods and beverages recommended in Dietary Guidelines
for Americans
NHANES NA
Goal Area 4: Health Care and Worksites
53 Community-based primary prevention nutrition-related services
National Profile of Local Health Departments
NA
54 Community-based primary prevention physical activity–related services
National Profile of Local Health Departments
NA
55 BMI measurement by physicians National Survey on Energy Balance Related Care among Primary Care Physicians
NA
56 Nutrition and weight counseling by physicians NAMCS; National Survey on Energy Balance Related Care among Primary Care Physicians
Core
57 Physical activity–related counseling by physicians NAMCS; National Survey on Energy Balance Related Care among Primary Care Physicians
Core
58 Insurance incentives for healthy lifestyles NAMCS; National Survey on Energy Balance Related Care among Primary Care Physicians
NA
59 Obesity screening and promotion strategies offered by health plans
NAMCS; National Survey on Energy Balance Related Care among Primary Care Physicians
NA
60 Obesity screening and prevention reimbursement strategies by health plans
NAMCS; National Survey on Energy Balance Related Care among Primary Care Physicians
NA
61 Obesity screening and prevention metrics Healthcare Effectiveness Data and Information Set
NA
TABLE 6-4 Continued

Copyright © National Academy of Sciences. All rights reserved.
Evaluating Obesity Prevention Efforts: A Plan for Measuring Progress
163National Obesity Evaluation Plan
Indicator Topica
Data Source or Documentationb
National Planc
State Plansc
WHO Proposed Indicatorsd
62 Employee health promotion programs National Survey of Employer-Sponsored Health Plans
Core
63 Employee participation in health promotion programs
National Survey of Employer-Sponsored Health Plans
NA
64 Employee participation in exercise programs NHIS Core
65 Exclusive breastfeeding NSCH; State Birth Registries/Birth Records Databases
NA
66 Hospital breastfeeding policies mPINC NA
67 Employer lactation-support programs IFPS-II; NCS NA
68 Breastfeeding disparities National Immunization Survey NA
Goal Area 5: Schools and Child Care Environments
69 Daily school physical education (adolescent participation)
SHPPS; YRBSS (for adolescents only)
Expanded
70 Daily school physical education (school requirement)
BTG; SHPPS Core
71 School recess—state BTG; SHPPS Expanded
72 School recess—school district BTG; SHPPS Expanded
73 School recess time BTG; SHPPS Expanded
74 Availability of healthy food options in schools BTG; SHPPS; SNDA Expanded
75 School Breakfast Program in schools BTG; SHPPS; SNDA NA
76 Child dietary intake in school NHANES NA
77 Federal school meal standards SNDA
78 Child dietary intake of solid fats and added sugars (SoFAS) in school
NHANES NA
79 Farm-to-School programs National Farm to School Network (for states); SNDA
Expanded
80 National Health Education Standards SHPPS Core
81 Nutrition professional development for teachers SHPPS Expanded
82 College physical education NCHA Core
83 College nutrition education NCHA Core
NOTE: ACS = American Community Survey; BRFSS = Behavioral Risk Factor Surveillance System; BTG = Bridging the Gap; CDC = Centers for Disease Control and Prevention; CLASS = Classification of Laws About School Students; CZCBP = County and ZIP Code Business Patterns; IFPS-II = Infant Feeding Practices Study II; mPINC = National Survey of Maternity Practices in Infant Nutrition and Care; NAMCS = National Ambulatory Medical Care Survey; NCHA = National College Health Assessment; NCS = National Compensation Survey-Benefits; NHANES = National Health and Nutrition Examination Survey; NHIS = National Health Interview Survey; NHTS = National Household Travel Survey; NSCH = National Survey of Children’s Health; PRAMS = Pregnancy Risk Assessment Monitoring System; SHPPS = School Health Policies and Practices Survey; SNAP-Ed = Supplemental Nutrition Assistance Program Education; SNDA = School Nutrition Dietary Assessment Study; WIC = Special Supplemental Nutrition Program for Women, Infants, and Children; YRBSS = Youth Risk Behavior Surveillance System.a Indicator topics identified in Chapter 4 of this report, i.e., from available ongoing data sources related to strategies recommended in the Accelerating Progress in Obesity Prevention (APOP) report (IOM, 2012a).b Source is in alphabetical order; NHANES is preferred source at the national level.
TABLE 6-4 Continued
continued

Copyright © National Academy of Sciences. All rights reserved.
Evaluating Obesity Prevention Efforts: A Plan for Measuring Progress
Evaluating Obesity Prevention Efforts164
c Green = indicator currently in place; yellow = indicator is partially in place (e.g., YRBSS does not have data for all states), or could be adapted from existing systems (e.g., regional, county data could be aggregrated or sampling could be improved); red = indicator requires extensive further development and/or implementation.d WHO (2008). Core = core indicator from WHO framework indicating “most critical items to be analyzed”; Expanded = expanded indicator from WHO framework indicating “additional indicators … (to) consider”; NA = not identified in WHO framework (WHO, 2008). e 2003 proposed birth certificate.f Indicator not related to strategies recommended in the APOP report (IOM, 2012a).
TABLE 6-4 Continued
mation. Similar standardization and aggregation can occur with data from WIC and Head Start and the proposed revision of birth certificates.11 Common tools and methods for measuring indicators can be specified through NCCOR and promoted for community- and grant-level work, building on the indica-tors proposed in Table 6-4.
The Committee found several areas to expand on existing monitoring/surveillance systems, such as SHPPS and NHANES, by increasing frequency of measurements, or by collecting data on specific popula-tions or developmental age groups. These changes could be prioritized as first steps, but should be bal-anced with other priority issues. For example, NHANES data collection could be expanded to include populations at increased risk for development of obesity/overweight, such as pregnant women, to collect specific information on perinatal obesity-related correlates. Another important addition would be to pro-vide expanded age groups for children and adolescents that more closely correspond with stages of devel-opment, so that intervention efforts can be tailored to more effectively address pubertal and cognitive changes, as well as school level (e.g., middle school versus high school). Currently, adolescents aged 12 through 19 are grouped together, despite large differences in factors such as developmental level, school setting, and mobility. Further, college-age youth are not separately examined although colleges were iden-tified in APOP as a setting of interest.
New Data Collection Infrastructure and Measures
The final areas of enhancement will require additional resources and may be considered more long-term goals. These include the development of new data survey tools and infrastructure to address gaps in settings such as early childhood education, worksites, and health care. Some of these systems can be patterned after existing data collection methods. However, others will need more careful thought and planning, new sampling methods and enhanced sample sizes for local evaluations, development of infrastructure to support data collection and analysis, and new partners. Infrastructure development can include distributed data systems, and data collection using tablets or cell phones, with the capability to aggregate into a nationally representative sample.
Because the APOP report emphasizes both the built and the social environment, public perceptions, norms, and other social environmental measures will need to be derived from or added to existing surveil-lance systems, such as NHANES. In addition, indicators for physical activity and inactivity need to be included or strengthened in many of the existing monitoring/surveillance systems. Benchmarks for physi-
11 The Department of Health and Human Services proposed changes to the birth certificates in 2003.

Copyright © National Academy of Sciences. All rights reserved.
Evaluating Obesity Prevention Efforts: A Plan for Measuring Progress
165National Obesity Evaluation Plan
cal activity measures also are needed, which require scheduled and regular updates to the Physical Activity Guidelines for Americans (HHS, 2008).
Training and Technical Assistance
A well-trained workforce is necessary for continued monitoring, surveillance, and summative evalu-ation activities (Drehobl et al., 2012). Unfortunately, although it is estimated that there is an impending lack of public health workers to meet national demands, an exact accounting of the workforce in training and what skills will be needed has not been done. The National Obesity Evaluation Plan calls for acceler-ated expansion and development of this workforce through increased training and technical assistance, as well as increased emphasis on courses in public health and practical experiences for health professionals (Drehobl et al., 2012). Funding evaluator positions in national, state, and regional agencies is also neces-sary, and this can be accomplished through creative means such as academic health department linkages, where university-public partnerships produce data both for the use of the health department and for peer-reviewed publications (see Chapters 2, 7, and 8 for further discussion of training and technical assistance for those at the community level).
Training and technical assistance for those who would implement and use data systems are crucial for quality control of measurements. They need to be conducted at all levels (national, state, local) to ensure data integrity and to facilitate standard methods and data. The National Obesity Evaluation Plan includes trainings on standardized measurement protocols for anthropometric and other measures. It also calls for creation of a list of recommended measures for all indicators. Expansion and maintenance of NCCOR, which includes many measurement instruments, can be a first step toward development of a list of standard measures. Training sessions can be conducted via webinars, videos, in-person sessions, and PowerPoint presentations. All training sessions to implement the National Obesity Evaluation Plan would include criteria for achievement of appropriate skill levels and be linked to continuing education credits for various professions (e.g., registered dietitians, certified health education specialists).
Technical assistance, which includes assistance for selection of appropriate measures, development of study designs or logic models, or troubleshooting of problems in the field can be administered through one or several training centers and provided to federal, state, territorial, and local groups. CDC has a man-dated role and long history of providing technical assistance to the states on monitoring and surveillance (Drehobol et al., 2012). Expansion of its programs, perhaps through the Prevention Research Center net-work, would leverage current resources and expertise. In addition, the National Center for Health Statistics could be expanded to provide more technical assistance, especially to replicate NHANES-type measures more broadly or at the state level. Other existing resources for training that can be leveraged include the NIH’s Training Institute for Dissemination and Implementation Research in Health and other existing resources for ongoing measurement and evaluation supported by organizations like RWJF (e.g., Healthy Eating Research, Active Living Research) (NIH, 2013; RWJF, 2013a,b).
Relevant Feedback to Evaluation Users
As detailed in Chapter 2, evaluation users need timely and relevant feedback of information from monitoring, surveillance, and summative evaluation efforts to evaluate and promote incremental prog-ress in achievement of intervention goals (Garney et al., 2013). A recent survey of CDC’s Surveillance Science Advisory Group (SurvSAG) and scientists on their distribution list found that only one-third of

Copyright © National Academy of Sciences. All rights reserved.
Evaluating Obesity Prevention Efforts: A Plan for Measuring Progress
Evaluating Obesity Prevention Efforts166
respondents agreed that data are analyzed and disseminated in a timely fashion (Thacker et al., 2012). The federal government developed the Health Indicators Warehouse (HIW) (National Center for Health Statistics, 2013) to facilitate access to and use of data associated with Healthy People 2020 indicators and other related health indicators. Data from the HIW are categorized by topic, geography, and initiative, and reports can be generated via a Web-based, interactive system. Ideally the HIW could be expanded to include more features and data, as well as efforts to decrease duplication of data systems.
Another potential method of providing feedback to data users is through the Community Commons, which links geographic information systems data to provide an interactive mapping and net-working platform (Community Commons, 2013). Although the Community Commons primarily focuses on communities (see Chapter 7) and place-based initiatives, it does have the capacity to produce federal-level mapping. This model for data utilization includes easy-to-understand maps and graphics that can be used as discussion points for communities and organizations. This concept can be further expanded by the use of federal or community “dashboards” that provide information for the jurisdiction or community compared to a benchmark or goal metric. Metrics can also be illustrated at the federal and/or state level through “report card”-type maps, such as those on the website of the Data Resource Center for Child and Adolescent Health (The Child and Adolescent Health Measurement Initiative, 2012), in which state levels of selected indicators are color coded.
At the national level, information from the National Obesity Evaluation Plan should be used to refine programmatic initiatives, assess effectiveness of policies and other interventions, identify any unin-tended consequences, and determine cost-effective strategies to prevent obesity. Data from the National Obesity Evaluation Plan could help to further elucidate the evidence base for the APOP recommendations and suggest new environmental and policy strategies or directions for future obesity prevention efforts.
Standardization of Key Indicators for Federally Funded Grants and Programs
Federally funded grants, initiatives, and programs through NIH, CDC, USDA, and other govern-mental agencies can provide additional data for the National Obesity Evaluation Plan. For example, com-petitive programs for obesity prevention, such as the Communities Putting Prevention to Work (CPPW) (Bunnell et al., 2012; CDC, 2013d) and Community Transformation Grants initiatives (CDC, 2013e) can provide data that reveal the impact of intervention strategies from APOP. The CPPW included programs in 50 communities from 2010 in 2-year initiatives; of these programs, 28 focused on obesity preven-tion, 11 focused on smoking prevention, and 11 focused on both obesity and tobacco use (Bunnell et al., 2012). A national evaluation of the programs after 12 months indicated a mean reach for obesity- prevention initiatives of 35 percent of the population, with progress on approximately one-third of the proposed obesity and tobacco prevention strategies. Although data on reach and progress on proposed goals have been collected, further summary data are not available, largely because of the lack of stan-dardized measures for policy, systems, and environmental interventions, as well as the variety of program efforts proposed. A recent funding opportunity announcement12 by CDC provides a wealth of opportu-nity for funding, guidance, and support that could create evaluation results that are more comparable with identical indicators. The State Public Health Actions to Prevent and Control Diabetes, Heart Disease, Obesity, and Associated Risk Factors and Promote School Health Programs13 provides an outline of
12 See http://www.cdc.gov/chronicdisease/about/statepubhealthactions-prevCD.htm (accessed November 11, 2013).13 See http://www.cdc.gov/chronicdisease/about/foa/docs/Combined_FOA_Logic_Model_DP13-13051.pdf (accessed November 11, 2013).

Copyright © National Academy of Sciences. All rights reserved.
Evaluating Obesity Prevention Efforts: A Plan for Measuring Progress
167National Obesity Evaluation Plan
activities and strategies (using a logic model approach) to prevent and reduce risk factors associated with childhood and adult obesity, diabetes, heart disease, and stroke. The use of standardized protocols and measures for a key set of indicators (see Tables 6-2 and 6-4) could provide aggregation of data to inform larger dissemination or policy interventions.
Develop and Test New, Alternative, and Emerging Methods of Data Collection
An innovative and evolving National Obesity Evaluation Plan will need a provision for develop-ment, testing, and incorporation of new, alternative, and emerging methods of data collection that have the potential to capture data in real-time with greater precision. These contributions will necessarily, or at least most usefully, come from actual evaluations of national, state, and local programs as they attempt to use the existing surveillance systems and to adapt them to emerging programs and evaluation needs. In the CDC survey of the SurvSAG members, only about 20 percent agreed that CDC had the ability to adopt new surveillance methods in a flexible and competitive manner (Thacker et al., 2012). Emerging trends in data collection include use of the “quantified self,” in which participants track their own health informa-tion (Swan, 2009); the use of cameras and related equipment to determine food intake (Sun et al., 2010) and document food and physical activity environments; and real-time data capture through smart phone technology (Freifeld et al., 2010; Matic et al., 2011). Social media may also be a platform for surveillance: a recent study found an association between neighborhoods where a higher proportion of the population documented interest in television shows on Facebook and obesity prevalence (Chunara et al., 2013).
Challenges and Barriers to Implementation of the National Obesity Evaluation Plan
Enacting a comprehensive National Obesity Evaluation Plan will require considerable resources. None of the activities detailed in the Plan (see Box 6-2) can be accomplished without considerable and concerted effort. Acknowledging the need for cost containment, the Committee sought to identify poten-tial efficiencies when developing the Plan, including
1. Use of an existing federal-level obesity task force/entity or combination of existing ones if possi-
ble, rather than formation of a new group to oversee and coordinate implementation of the plan; 2. Focus on maximizing and coordinating existing surveillance systems, when possible, to leverage
resources; 3. Use of available indicators that can have multiple uses and stakeholders (e.g., fruit and vegetable
intake as an indicator for obesity as well as cancer prevention); and4. Identification and elimination of duplication in surveillance systems or indicators.
Despite attempts to minimize costs, the Committee realizes that adequate evaluation efforts require serious commitments of political will, coordination, and resources. Evaluating the progress of obesity prevention must be prioritized over other national health issues and interests. Federal institutions leading national surveillance systems, each with their own purposes and stakeholders—but none with a singu-lar focus on obesity—must prioritize obesity-related indicators above other long-held interests. Decision makers must make difficult choices and champion some indicators over others, so that respondent burden is not excessive and survey administration costs are not prohibitive. Newly developed indicators must

Copyright © National Academy of Sciences. All rights reserved.
Evaluating Obesity Prevention Efforts: A Plan for Measuring Progress
Evaluating Obesity Prevention Efforts168
be rigorously tested and compared in order to identify those most valid and reliable. Finally, this plan is meant to be iterative with a feedback loop which involves sharing evaluation results, stakeholder feed-back, and implementation of changes based on the evolving data. This process itself can lead to a more streamlined evaluation process, where indicators that are intractable or already achieved may be culled to focus on indicators and surveillance systems that are more sensitive to change and have better relations with outcome/impact measures.
The APOP report (IOM, 2012a), TWOTN videos,14 and Chapter 1 of this report all clearly docu-ment the devastating current and future economic and health effects of the high prevalence of overweight and obesity in the United States. Implementation of the National Obesity Evaluation Plan requires that decision makers and the general public are aware of the magnitude of the problem, the economic conse-quences, the relationship of obesity to other chronic diseases and disability, and the role that evaluation will play in monitoring progress in efforts for obesity prevention. It will also be important to adequately disseminate these messages to all stakeholders and to obtain adequate buy-in at the national level, as well as at a grassroots level.
Some of the challenges and opportunities for measuring progress in obesity prevention can be illus-trated using a case study for the evaluation of TWOTN (see Box 6-3). In this example, the existence of a more robust national infrastructure for evaluation would have allowed for better baseline measures, can-vassing of other social media campaigns, and measurement of impacts for TWOTN. TWOTN is offered here as the example of challenges and opportunities for measuring progress to address the Committee’s charge of identifying measurement ideas that can determine the impact of the national aspects of the cam-paign (see Chapter 1 for background on the purpose and components of the campaign).
STATE OBESITY EVALUATION PLANS
Almost all states have individual plans for obesity prevention and control, physical activity, and/or diet (see Appendix Table F-3). The comprehensiveness of these plans varies, as do the resources and infra-structure for monitoring and summative evaluation. Several states have established various levels of state evaluations, many as a result of CDC funding (CDC, 2012b).
Surveillance Systems
At the state level, the most significant and well-established surveillance systems are BRFSS, YRBSS, and PRAMS (see Appendix Tables D-1 and F-2), and, until 2012, PedNSS and PNSS conducted by CDC. The BRFSS relies on random-digit dialing and telephone interviews for self-reported data on adults’ weight and height, diet, and physical activity, among other health-risk data (CDC, 2013b). BRFSS data are available every 2 years by state level and can be aggregated to the national level. BRFSS data are also available at selected city and county levels, through SMART regions, which have at least 500 respondents in approximately 170 areas (CDC, 2011).
The YRBSS includes national school-based surveys of high school students (grades 9-12) as well as state, territorial, and local school-based surveys conducted by health and education agencies (CDC, 2013a). As with the BRFSS, data are self-reported, which can be problematic, especially for height and
14 See http://theweightofthenation.hbo.com (accessed November 11, 2013).

Copyright © National Academy of Sciences. All rights reserved.
Evaluating Obesity Prevention Efforts: A Plan for Measuring Progress
169National Obesity Evaluation Plan
BOX 6-3 Opportunities for Putting the National Obesity Evaluation Plan into Practice: Evaluating the National Components of The Weight of the Nation Campaign
One way to evaluate the national component of The Weight of the Nation (TWOTN) campaign (see Chapter 1 for campaign description) or similar initiatives would be to measure it within a long-term National Obesity Evaluation Plan to prevent obesity through policy and environmental changes. Treating TWOTN as a contributor to a national movement provides context for the Home Box Office (HBO) documentaries and their expected impact. Along with many other events and vehicles, TWOTN attempts to make people aware of the problem, raise their consciousness about policy and environmental forces that give rise to obesity, and, potentially, engage them in strategies to address the problem. By no means is TWOTN the only driver of this movement. Consider the experience of tobacco control: many forces gave rise to awareness of the difficulties of smoking cessation, awareness of environmental factors affecting tobacco use, the success of state and federal policies to control youth access to tobacco, raising the price of tobacco through taxes, and requiring clean indoor air (Grob, 2011; Rogers, 2010). The full emergence of the movement took decades.
Given the range of social media and advocacy efforts involved in TWOTN, it is a challenge to assess its con-tribution among other components of the national efforts, let alone attribute early or ultimate indications of change to TWOTN. Other media-based forces attempting to raise awareness and increase support for policy and environmental changes to enable obesity prevention include Moms Rising, a popular blogging site that develops materials for advocacy and then identifies grassroots advocates among its readers; Salud America!, which is developing advocacy efforts specific to Latino communities; the YMCA through its local chapters; and PreventObesity.com, another such blogging and social network site run by the American Heart Association.
It is possible to determine how well TWOTN is valued by various stakeholders, to what degree, and for what purposes. In Chapter 1, the Committee defines summative evaluation as detecting and attributing changes in output, outcomes, and impacts associated with obesity prevention interventions. In the case of TWOTN, such indicators of value include the following: viewers on the HBO platforms and streaming of content; media impressions; social media impressions; and “commitments.” Where these events and activi-ties have potential national significance, such evaluation relates to the National Obesity Evaluation Plan; where follow-on activities are local in nature, summative evaluation pertains to Chapter 8, and suggested approaches will be presented there.
For TWOTN, three evaluation activities were planned, of which one was at the national level. HBO tracked national-level counts of viewers at its own screening, media impressions from paid and donated media, Facebook likes, tweets and follows, and “take action” commitments/pledges for progress. Most of these can be considered measures of “reach” or “exposure,” rather than measures of effectiveness, but reach is a major added value of mass media efforts within a broader program plan or national strategy. In terms of the logic model presented in Chapter 8 (see Figure 8-1), these measures are considered outputs. Telephone or web-based surveys of nationally representative samples of the target population would have provided more information on the linkage between exposure to the HBO segments and subsequent behavior. National evaluations of the Legacy truth® campaign (Farrelly et al., 2005, 2009) and the Centers for Disease Control and Prevention’s VERBTM campaign (Huhman et al., 2005, 2007, 2010) are good examples of this approach.

Copyright © National Academy of Sciences. All rights reserved.
Evaluating Obesity Prevention Efforts: A Plan for Measuring Progress
Evaluating Obesity Prevention Efforts170
weight (Morrissey et al., 2006; Stommel and Schoenborn, 2009). YRBSS information is also collected on students’ health risk behaviors, which include dietary habits, weight loss practices, and physical activity.
CDC provides funding and infrastructure for core indicators of the BRFSS and the YRBSS, plus technical assistance, to every state. States can elect to oversample certain populations, add additional populations, or expand the core indicators with other cores or individualized assessments; however, these enhancements can be costly. Nevertheless, if resources are available, then this model may be useful for development of State Obesity Evaluation Plans, as the data collection infrastructure allows for state-level data, as well as the capability to aggregate up to the national level.
Examples of State-Level Evaluations
Several states have developed their own surveillance and summative evaluation systems. These vary in infrastructure, methodology, and focus. For example, larger states often need to rely on probability-based sampling to collect population-level data, while collection of data at a census level is feasible in smaller states. Several of the surveillance systems in place address obesity and related risk factors in school-aged children, but not necessarily in preschool children or adults. A quantification of states who conduct surveillance and summative evaluation activities for obesity prevention efforts is difficult, because there is no central data repository for these measures, and most state data are found in state reports or online, rather than in peer-reviewed journals.
California is one state that has developed its own obesity prevention plan that includes an evalu-ation component. Developed through legislative mandate, the 5-year plan, run by the California Department of Public Health, focuses on environmental and policy initiatives to achieve the following population-level behaviors: increase intake of fruits and vegetables, decrease intake of sugar-sweetened beverages and energy-dense foods, increase physical activity, reduce television viewing time, and increase breastfeeding (California Obesity Prevention Program, 2010). The overarching evaluation goal is to create and implement a statewide monitoring, surveillance, and summative evaluation system. The 5-year objective is to measure progress toward obesity prevention in California by assessing overall health, health behaviors, and policy and environmental change. Ongoing efforts are focusing on identifying California- and county-specific data sources and indicators of progress in obesity prevention available since the late 1990s, such as the California Department of Education’s FITNESSGRAM® data on BMI and physical fitness collected annually from 5th, 7th, and 9th grade students15 and the annual California Healthy Kids Survey on nutrition and physical activity behaviors collected from 5th, 7th, 9th, and 11th grade students,16 the biennially administered California Department of Public Health surveys17 on dietary practices and physical activity assessment in adults (California Dietary Practices Survey), adolescents (California Teen Eating, Exercise, and Nutrition Survey), and children (California Children’s Healthy Eating and Exercise Practices Survey), which also include questions about school and home food and activity environments, and the ongoing California Health Interview Survey administered by the University of California, Los Angeles, on select dietary behaviors in children, adolescents, and adults.18
15 See http://www.cde.ca.gov (accessed November 11, 2013).16 See http://chks.wested.org (accessed November 11, 2013).17 See http://www.cdph.ca.gov (accessed November 11, 2013).18 See http://www.chis.ucla.edu (accessed November 11, 2013).

Copyright © National Academy of Sciences. All rights reserved.
Evaluating Obesity Prevention Efforts: A Plan for Measuring Progress
171National Obesity Evaluation Plan
Texas conducted a statewide evaluation of school-based child obesity, nutrition, and physical activ-ity through the School Physical Activity and Nutrition (SPAN) survey (Hoelscher et al., 2004). Survey instruments for SPAN were developed and evaluated for psychometric properties through funding from CDC and USDA (Hoelscher et al., 2003; Penkilo et al., 2008; Thiagarajah et al., 2008). Conducted in 2000-2002, 2004-2005, and 2009-2011, SPAN provides state and state-regional estimates of child over-weight and obesity for children and adolescents in grades 4, 8, and 11; these grades were selected to represent approximately pre-pubertal, pubertal, and post-pubertal time periods. Evaluation at the regional level within the state provided data that supported the effectiveness of community-wide obesity prevention initiatives in El Paso (Hoelscher et al., 2010), as well as associated diet and activity patterns (Ezendam et al., 2011). SPAN data also includes surveys on school programs, environmental factors related to nutri-tion and physical activity, and school-level policies.
Arkansas also has implemented a statewide evaluation of obesity prevention policy efforts in schools (see Chapter 2).
Advantages and Strengths of State-Level Evaluations
The advantages of the state monitoring, surveillance, and summative evaluation systems include an existing infrastructure through the BRFSS and the YRBSS, the possibility of measurement and data for state- and regional-level stakeholders, the ability to focus on state-specific context or constructs, using core indicators that can be compared to federal benchmarks, and the “natural experiment” afforded by the comparison of state population changes in relation to state variations in policies and other inter-ventions. In many states, lawmakers are more likely to respond to data derived from local sources, as opposed to more global national-level data, and to respond to invidious or favorable comparisons between their state and some others.
Three more benefits of using state-level surveys or data collection infrastructures are (1) they often can be implemented more quickly than federal-level assessments; (2) they can be used to guide the devel-opment of national surveillance and summative evaluation efforts, besides serving as inspiration or stimuli for action in other states; and (3) probably most important, state-level data can often be a bellwether for national trends and provide early indicators of progress or backsliding that might not show up in national data trends for years. Paying attention earlier in the development of trends is a lesson learned from the lag between the early outbreaks and gathering signs of the obesity epidemic in the 1970s and national action that did not gain traction until the 1990s (Gortmaker et al., 1990; IOM, 2004).
Gaps in Current State Obesity Evaluations
The state-level evaluation plans have several disadvantages, including the cost, and consequent lack of objective data; a relative paucity of methods comparable to the National Obesity Evaluation Plan; and a relative lack of resources and infrastructure to develop and maintain state systems comparable to the national monitoring/surveillance systems. As mentioned previously, states vary greatly in size, avail-able resources, political climate, and prioritization of health surveillance needs and obesity as a problem. Effective data collection requires state-level benchmarks, coordination at the state level, resources to col-lect the data, and resources/infrastructure to report results back in a timely manner.

Copyright © National Academy of Sciences. All rights reserved.
Evaluating Obesity Prevention Efforts: A Plan for Measuring Progress
Evaluating Obesity Prevention Efforts172
Guidance for State Obesity Evaluation Plans
In general, evaluation of progress in obesity prevention at the state level ideally would be modeled after the National Obesity Evaluation Plan (see Box 6-2), which would allow states to compare state-level data to national data and guidelines (e.g., state adult obesity prevalence compared to the national adult obesity prevalence). Although patterning state evaluation plans after the National Obesity Evaluation Plan may be an appropriate and efficient first step, state monitoring/surveillance systems will likely need to include questions that address specific indicators or issues in specific state priority populations. Because states tend to be more nimble than the federal systems, and because states often have distinct populations that require changes in measurement protocols or instruments, it is anticipated that exemplars at the state level might serve as a resource or “pilot” for addressing gaps at the federal level identified in the National Obesity Evaluation Plan. These new protocols or instruments can provide new indicators or measurement techniques that can later be adapted for national monitoring/surveillance systems.
As with the National Obesity Evaluation Plan, states would ideally identify an obesity task force that would reside in the state health department and report directly to the state commissioner of health, or even to the governor as a multi-agency state task force. This task force needs to be comprised of state department heads and stakeholders inclusive of all geographic areas of the state. State health goals would provide benchmarks and guidelines for indicators, although most state obesity plans likely will model these after federal recommendations. Detailing a process to establish priorities and a timeline for imple-mentation would further strengthen the plan.
An assessment of current monitoring, surveillance, and other summative evaluation efforts at the state level would be the next step in the State Obesity Evaluation Plan; this is expected to be a less inten-sive undertaking than detailed in the National Obesity Evaluation Plan. While conducting an inventory of state evaluation methods and systems, it is important to determine if state-level indicators are consistent with those at the federal level (see Table 6-4). Thus, harmonization of indicators and data collection sys-tems would include comparisons with both federal and state measures and infrastructure.
Some states will need to develop capacity to implement a State Obesity Evaluation Plan. In addi-tion to consistent funding to support evaluation activities, states will need to cultivate a workforce with expertise in sampling, statistical analysis, and public health. Partnering with local state universities may be a potential solution for addressing workforce needs. In addition, new questionnaires and survey items may need to be developed to address special state populations, and technical assistance may be required as well. CDC has traditionally provided technical assistance to states for surveillance and other summative evaluation efforts through the Division of Adolescent and School Health, Prevention Research Centers, the BRFSS, and the YRBSS.
An important part of the State Obesity Evaluation Plan is the timely feedback to state stake holders. Again, the resources at the state health agency, as well as state mandates, may determine how quickly data can be collected, analyzed, and disseminated. At the state level, newer methods such as crowd sourcing or individual data collection might be easier to implement than at a national level and may pro-vide local data; however, for this to be viable, it will be necessary to develop more “off the shelf” utility products that can be easily implemented with more limited staff and resources.
One limitation of state-level data is the inconsistency of monitoring/surveillance activities due to fluctuations in state budgets and unfunded mandates. For example, measurements that are obtained

Copyright © National Academy of Sciences. All rights reserved.
Evaluating Obesity Prevention Efforts: A Plan for Measuring Progress
173National Obesity Evaluation Plan
through schools, such as Fitnessgram®,19 can be difficult to sustain consistently over time without alloca-tion of resources.
ExAMPLES OF REGIONAL OBESITY EVALUATION PLANS
Regional efforts related to evaluating progress in obesity prevention may be defined as those that are applied to a discrete area of common interest, such as the service area of a health plan, a geographic area across multiple states where an employer has worksites or a stream of migrant workers travel, or aggregations of counties with population characteristics in common (e.g., the Appalachian region across North Carolina, West Virginia, and Pennsylvania). Regions may not be confined by state borders or geography and may be defined by industry market interest, by health disparities, or by other health- or disease- related factors. As a result, evaluation efforts for a regional audience may differ from national- or state-specific efforts.
One efficient and relatively low-cost method of obtaining good quality data on obesity prevention efforts and outcomes is through health plans. A health plan is likely to be interested in knowing the prev-alence or incidence of obesity among its members and whether they vary in obesity-related care by sub-regions across its service area, by care delivery systems among its contracted network, or even by clinic where members receive their care. Whereas a health plan may be informed by state-specific data, such data may not be specific to its membership. Plan-specific data may come from a variety of sources, includ-ing EHRs, clinical screenings, health impact assessments, the National Committee for Quality Assurance (NCQA) Healthcare Effectiveness Data and Information Set (HEDIS), and member surveys. For example, HEDIS consists of 75 measures across 8 domains of care and is used by more than 90 percent of U.S. health plans; these data could be useful for obesity prevention efforts if aggregated across regions (NCQA, 2013).
The America’s Health Insurance Plans provides updates on obesity for its member plans and includes recommendations on addressing obesity (America’s Health Insurance Plans, 2008). Similarly, the Alliance of Community Health Plans provides its member plans with obesity-related updates and applica-tions (ACHP, 2013).
BMI data can be efficiently collected via EHR and, when collected this way, have been shown to be as accurate as other population-based surveys, such as the BRFSS (Arterburn et al., 2010). Health plans also use membership surveys to document a variety of health- and care-related variables, including obe-sity, as well as the relationship of obesity to health care costs, disease diagnoses, and pharmacy-related concerns (Pronk, 2003). Often, these data are publicly displayed on health plans’ websites (e.g., see HealthPartners, 2011). NCQA, through HEDIS, reports on obesity-related metrics (NCQA, 2012). Also, health assessment may be used to monitor obesity-related data on subgroups of health plan members. Additional information related to health plans and information that can be used to evaluate obesity pre-vention interventions can be found in Chapter 2. In essence, with coordination, health plans can serve as efficient and relatively low-cost regional surveillance data sources.
In the context of the worksite setting, employers increasingly use workplace screening programs to document and monitor BMI and obesity, as well as related health risks (Framer and Chikamoto, 2008; Goetzel and Ozminkowski, 2008). In addition, obesity-related claims may be used to gain a better under-
19 See http://www.cde.ca.gov/ta/tg/pf (accessed November 11, 2013).

Copyright © National Academy of Sciences. All rights reserved.
Evaluating Obesity Prevention Efforts: A Plan for Measuring Progress
Evaluating Obesity Prevention Efforts174
standing of the costs and disease burden associated with excess weight (Colditz, 1992; Finkelstein et al., 2009), locally or regionally.
SUMMARY
Implementation of a National Obesity Evaluation Plan to assess the APOP strategies would enhance the ability of the United States to demonstrate progress in obesity prevention efforts, provide guidance on gaps in the extant programs and policies, and redirect use of resources. Elements of the National Obesity Evaluation Plan were developed to maximize existing monitoring/surveillance systems and incorporate metrics that are similar to those in other plans, such as the WHO framework. Objectives of the plan include the appointment of a federal obesity evaluation task force with accountability to coordinate a monitoring, surveillance, and summative evaluation system with rapid feedback and utilization by stake-holders, increased resources for monitoring/surveillance and summative evaluation, and creation of new and innovative methods to take advantage of current technological capacity. Settings that were identified as key areas of focus in the APOP report, such as worksites and child care centers, should be included in current monitoring/surveillance systems. Physical activity measures should be added or strengthened in the U.S. monitoring/surveillance systems, and new measures to assess social and built environments should be included as well.
Barriers to the implementation of the plan include costs, competing priorities, and the efforts involved with coordinating the separate components of the evaluation systems into a harmonized whole. Addressing the barriers will require that both decision makers and evaluation users are aware of the con-sequences of obesity, as well as acknowledgment of the role of evaluation in the assessment and develop-ment of obesity prevention interventions.
Implementation of the State Obesity Evaluation Plans will need to be aligned with the National Obesity Evaluation Plan to allow for comparability; however, state-level evaluation activities should be flexible enough to adapt to unique populations and state characteristics. Regional evaluations can take advantage of new initiatives to coordinate electronic health data to provide estimates for specific groups that extend across states.
Implementation of a National Obesity Evaluation Plan is an essential part of the implementation of recommendations in the APOP report. A coordinated monitoring/surveillance system would greatly enhance the ability of the United States to track intervention efforts across different environments, as well as to determine if our current efforts are preventing obesity or if a different direction is warranted. Chapter 10 provides seven recommendations (and a set of potential actions and actors) to support the implementation of the components of the National Obesity Evaluation Plan.
REFERENCES
ACHP (Alliance of Community Health Plans). 2013. Pediatric obesity: Addressing a national challenge at a local
level. http://www.achp.org/for-the-public/achp-plans-are-innovating-to-achieve-the-industrys-triple-aim/
pediatric-obesity-addressing-a-national-challenge-at-a-local-level (accessed April 4, 2013).
America’s Health Insurance Plans. 2008. Facing the challenge of unhealthy weight: Recommendations for the health
care community. Washington, DC: America’s Health Insurance Plans.

Copyright © National Academy of Sciences. All rights reserved.
Evaluating Obesity Prevention Efforts: A Plan for Measuring Progress
175National Obesity Evaluation Plan
Arterburn, D. E., G. L. Alexander, J. Calvi, L. A. Coleman, M. W. Gillman, R. Novotny, V. P. Quinn, M. Rukstalis,
V. J. Stevens, E. M. Taveras, and N. E. Sherwood. 2010. Body mass index measurement and obesity prevalence
in ten U.S. health plans. Clinical Medical Research 8(3-4):126-130.
Australian Government Department of Health and Aging. 2010. Indigenous Chronic Disease Package monitoring
and evaluation framework. http://www.health.gov.au/internet/ctg/publishing.nsf/Content/ICDP-monitoring-
and-evaluation-framework (accessed November 1, 2012).
Bornstein, D. B., C. Carnoske, R. Tabak, J. Maddock, S. P. Hooker, and K. R. Evenson. 2013. Factors related to
partner involvement in development of the US National Physical Activity Plan. Journal of Public Health
Management and Practice 19(3 Suppl 1):S8-S16.
Braveman, P., S. Egerter, and D. R. Williams. 2011. The social determinants of health: Coming of age. Annual
Reviews of Public Health 32:381-398.
Briefel, R. R. 2006. Nutrition monitoring in the United States. In Present knowledge in nutrition. 9th ed, edited by B.
Bowman and R. Russell. Washington, DC: ILSI Press. Pp. 838-858.
Briefel, R. R., and M. A. McDowell. 2012. Nutrition monitoring in the United States. In Present knowledge in
nutrition. 10th ed, edited by J. W. Erdman, I. A. Macdonald, and S. H. ziesel. Sumerset, NJ: Wiley-Blackwell.
Pp. 1082-1109.
Briefel, R. R., M. K. Crepinsek, C. Cabili, A. Wilson, and P. M. Gleason. 2009. School food environments and
practices affect dietary behaviors of US public school children. Journal of the American Dietetic Association
109(2 Suppl):S91-S107.
Bunnell, R., D. O’Neil, R. Soler, R. Payne, W. H. Giles, J. Collins, and U. Bauer. 2012. Fifty communities put-
ting prevention to work: Accelerating chronic disease prevention through policy, systems and environmental
change. Journal of Community Health 37(5):1081-1090.
California Obesity Prevention Program. 2010. California Obesity Prevention Plan: A vision for tomorrow, strategic
actions for today. Sacramento, CA: California Department of Public Health.
Carlson, S. A., J. E. Fulton, C. A. Schoenborn, and F. Loustalot. 2010. Trend and prevalence estimates based on the
2008 Physical Activity Guidelines for Americans. American Journal of Preventive Medicine 39(4):305-313.
CDC (Centers for Disease Control and Prevention). 2003. A public health action plan to prevent heart disease and
stroke. Washington, DC: U.S. Government Printing Office.
CDC. 2006. State-level school health policies and practices. A state-by-state summary from the School Health
Policies and Programs Study 2006. Washington, DC: U.S. Government Printing Office.
CDC. 2011. SMART: BRFSS city and county data. Selected metropolitan/micropolitan area risk trends. http://www.
cdc.gov/brfss/smart/technical_infodata.htm (accessed April 4, 2013).
CDC. 2012a. 2003 revisions of the U.S. standard certificates of live birth and death and the fetal death report. http://
www.cdc.gov/nchs/nvss/vital_certificate_revisions.htm (accessed April 4, 2013).
CDC. 2012b. Overweight and obesity. State and community programs. http://www.cdc.gov/obesity/stateprograms/
index.html (accessed April 4, 2013).
CDC. 2013a. Adolescent and school health. Youth Risk Behavior Surveillance System. http://www.cdc.gov/
HealthyYouth/yrbs/index.htm (accessed April 4, 2013).
CDC. 2013b. Behavioral Risk Factor Surveillance System. http://www.cdc.gov/brfss (accessed April 4, 2013).
CDC. 2013c. Chronic Disease State Policy Tracking System. http://apps.nccd.cdc.gov/CDPHPPolicySearch/Default.
aspx# (accessed April 4, 2013).
CDC. 2013d. Communities Putting Prevention to Work. http://www.cdc.gov/communitiesputtingpreventiontowork
(accessed April 4, 2013).
CDC. 2013e. Community Transformation Grants (CTG). http://www.cdc.gov/communitytransformation/index.htm
(accessed April 4, 2013).

Copyright © National Academy of Sciences. All rights reserved.
Evaluating Obesity Prevention Efforts: A Plan for Measuring Progress
Evaluating Obesity Prevention Efforts176
Chriqui, J. F., D. R. Taber, S. J. Slater, L. Turner, K. M. Lowrey, and F. J. Chaloupka. 2012. The impact of state
safe routes to school-related laws on active travel to school policies and practices in U.S. Elementary schools.
Health Place 18(1):8-15.
Chunara, R., L. Bouton, J. W. Ayers, and J. S. Brownstein. 2013. Assessing the online social environment for surveil-
lance of obesity prevalence. PLoS ONE 8(4):e61373.
Colditz, G. A. 1992. Economic costs of obesity. American Journal of Clinical Nutrition 55(2 Suppl):503S-507S.
Community Commons. 2013. Community Commons. Together for the common good. http://www.
communitycommons.org (accessed April 4, 2013).
Coordinating Committee and Working Groups for the Physical Activity Plan. 2010. U.S. National Physical Activity
Plan. http://www.physicalactivityplan.org (accessed June 10, 2013).
Drehobl, P. A., S. W. Roush, B. H. Stover, and D. Koo. 2012. Public health surveillance workforce of the future.
Morbidity Mortality Weekly Reports 61:25-29.
Duke, H. P. 2009. Active Texas 2020. Taking action to promote physical activity. Directors of Health Promotion and
Education.
Evenson, K. R., R. G. Brownson, S. B. Satinsky, A. A. Eyler, and H. W. Kohl 3rd. 2013a. The United States National
Physical Activity Plan: Dissemination and use by public health practitioners. American Journal of Preventive
Medicine 44(5):431-438.
Evenson, K. R., S. B. Satinsky, C. Valko, J. Gustat, I. Healy, J. S. Litt, S. P. Hooker, H. L. Reed, and N. O. Tompkins.
2013b. In-depth interviews with state public health practitioners on the United States National Physical
Activity Plan. International Journal of Behavioral Nutrition and Physical Activity 10:72.
Ezendam, N. P., A. E. Springer, J. Brug, A. Oenema, and D. H. Hoelscher. 2011. Do trends in physical activity,
sedentary, and dietary behaviors support trends in obesity prevalence in 2 border regions in Texas? Journal of
Nutrition Education and Behavior 43(4):210-218.
Farquhar, J. W., S. P. Fortmann, J. A. Flora, C. B. Taylor, W. L. Haskell, P. T. Williams, N. Maccoby, and P. D. Wood.
1990. Effects of communitywide education on cardiovascular disease risk factors. The Stanford Five-City
Project. Journal of the American Medical Association 264(3):359-365.
Farrelly, M. C., K. C. Davis, M. L. Haviland, P. Messeri, and C. G. Healton. 2005. Evidence of a dose-response rela-
tionship between “Truth” antismoking ads and youth smoking prevalence. American Journal of Public Health
95(3):425-431.
Farrelly, M. C., K. C. Davis, J. Duke, and P. Messeri. 2009. Sustaining ‘truth’: Changes in youth tobacco attitudes
and smoking intentions after 3 years of a national antismoking campaign. Health Education and Research
24(1):42-48.
Fielding, J. 2011. Los Angeles County Health and Examination Survey. http://file.lacounty.gov/bc/q1_2011/
cms1_156102.pdf (accessed June 10, 2013).
Finkelstein, E. A., J. G. Trogdon, J. W. Cohen, and W. Dietz. 2009. Annual medical spending attributable to obesity:
Payer-and service-specific estimates. Health Affairs (Millwood) 28(5):w822-w831.
Fox, M. K., A. Gordon, R. Nogales, and A. Wilson. 2009. Availability and consumption of competitive foods in US
public schools. Journal of the American Dietetic Association 109(2 Suppl):S57-S66.
Framer, E. M., and Y. Chikamoto. 2008. The assessment of health and risk. In ACSM’s worksite health handbook.
2nd ed., edited by N. P. Pronk. Champaign, IL: Human Kinetics, Inc. Pp. 140-150.
Freifeld, C. C., R. Chunara, S. R. Mekaru, E. H. Chan, T. Kass-Hout, A. Ayala Iacucci, and J. S. Brownstein.
2010. Participatory epidemiology: Use of mobile phones for community-based health reporting. PLoS Med
7(12):e1000376.
FTC (Federal Trade Commission). 2012. A review of food marketing to children and adolescents. Follow-up report.
Washington, DC: FTC.

Copyright © National Academy of Sciences. All rights reserved.
Evaluating Obesity Prevention Efforts: A Plan for Measuring Progress
177National Obesity Evaluation Plan
Garney, W. R., K. Drake, M. L. Wendel, K. McLeroy, H. R. Clark, and B. Ryder. 2013. Increasing access to care
for Brazos Valley, Texas: A rural community of solution. Journal of the American Board of Family Medicine
26(3):246-253.
Goetzel, R. z., and R. J. Ozminkowski. 2008. The health and cost benefits of work site health-promotion programs.
Annual Reviews of Public Health 29:303-323.
Gortmaker, S. L., W. H. Dietz, Jr., and L. W. Cheung. 1990. Inactivity, diet, and the fattening of America. Journal of
the American Dietetic Association 90(9):1247-1252, 1255.
Green, L. W., and J. Fielding. 2011. The U.S. Healthy People initiative: Its genesis and its sustainability. Annual
Review of Public Health 32:451-470.
Green, L. W., V. L. Wang, and P. Ephross. 1974. A 3-year, longitudinal study of the impact of nutrition aides
on the knowledge, attitudes, and practices of rural poor homemakers. American Journal of Public Health
64(7):722-724.
Green, L. W., R. W. Wilson, and K. G. Bauer. 1983. Data requirements to measure progress on the objectives for the
nation in health promotion and disease prevention. American Journal of Public Health 73(1):18-24.
Grob, G. 2011. The tobacco campaigns of the Robert Wood Johnson Foundation and collaborators, 1991-2010.
Princeton, NJ: Robert Wood Johnson Foundation.
Hawkins, N. G., R. W. Sanson-Fisher, A. Shakeshaft, C. E’Este, and L. W. Green. 2007. The multiple-baseline design
for evaluating population-based research. American Journal of Preventive Medicine 33(2):162-168.
HealthPartners. 2011. 2011 clinical indicators report. 2010/2011 results. Minneapolis, MN: HealthPartners.
Healthy Weight Commitment Foundation. 2013. Food and beverage companies surpass 2015 goal of reducing
calories in the U.S. three years ahead of schedule. http://www.healthyweightcommit.org/news/food_and_
beverage_companies_surpass_2015_goal_of_reducing_calories_in_the_u (accessed June 10, 2013).
HHS (Department of Health and Human Services). 2008. Physical activity guidelines for Americans. Washington,
DC: Department of Health and Human Services.
HHS. 2010a. Dietary guidelines for Americans. Washington, DC: U.S. Government Printing Office.
HHS. 2010b. Healthy People 2020. http://www.healthypeople.gov/2020/default.aspx (accessed January 31, 2013).
HHS and USDA (U.S. Department of Agriculture). 1993. Ten-year comprehensive plan for the national nutrition
monitoring and related research program. Federal Register 58:32752-32806.
Hoelscher, D. M., R. S. Day, S. H. Kelder, and J. L. Ward. 2003. Reproducibility and validity of the secondary
level school-based nutrition monitoring student questionnaire. Journal of the American Dietetic Association
103(2):186-194.
Hoelscher, D. M., R. S. Day, E. S. Lee, R. F. Frankowski, S. H. Kelder, J. L. Ward, and M. E. Scheurer. 2004.
Measuring the prevalence of overweight in Texas schoolchildren. American Journal of Public Health
94(6):1002-1008.
Hoelscher, D. M., S. H. Kelder, A. Perez, R. S. Day, J. S. Benoit, R. F. Frankowski, J. L. Walker, and E. S. Lee. 2010.
Changes in the regional prevalence of child obesity in 4th, 8th, and 11th grade students in Texas from 2000-
2002 to 2004-2005. Obesity (Silver Spring) 18(7):1360-1368.
Hornik, R., L. Jacobsohn, R. Orwin, A. Piesse, and G. Kalton. 2008. Effects of the National Youth Anti-Drug Media
Campaign on youths. American Journal of Public Health 98(12):2229-2236.
Huhman, M., L. D. Potter, F. L. Wong, S. W. Banspach, J. C. Duke, and C. D. Heitzler. 2005. Effects of a mass
media campaign to increase physical activity among children: Year-1 results of the VERB campaign. Pediatrics
116(2):e277-e284.
Huhman, M. E., L. D. Potter, J. C. Duke, D. R. Judkins, C. D. Heitzler, and F. L. Wong. 2007. Evaluation of
a national physical activity intervention for children: VERB campaign, 2002-2004. American Journal of
Preventative Medicine 32(1):38-43.

Copyright © National Academy of Sciences. All rights reserved.
Evaluating Obesity Prevention Efforts: A Plan for Measuring Progress
Evaluating Obesity Prevention Efforts178
Huhman, M. E., L. D. Potter, M. J. Nolin, A. Piesse, D. R. Judkins, S. W. Banspach, and F. L. Wong. 2010. The
influence of the VERB campaign on children’s physical activity in 2002 to 2006. American Journal of Public
Health 100(4):638-645.
Institute of Education Sciences. 2013. National center for education statistics. http://nces.ed.gov (accessed April 5,
2013).
IOM (Institute of Medicine). 2004. Preventing childhood obesity: Health in the balance. Washington, DC: The
National Academies Press.
IOM. 2007a. Nutrition standards for foods in schools: Leading the way toward healthier youth. Washington, DC:
The National Academies Press.
IOM. 2007b. Progress in preventing childhood obesity: How do we measure up? Washington, DC: The National
Academies Press.
IOM. 2012a. Accelerating progress in obesity prevention: Solving the weight of the nation. Washington, DC: The
National Academies Press.
IOM. 2012b. Measuring progress in obesity prevention: Workshop report. Washington, DC: The National Academies
Press.
Kincaid, D. L., A. P. Merritt, L. Nickerson, S. Buffington de Castro, M. P. P. de Castro, and B. Martin de Castro.
2002. Impact of a mass media vasectomy promotion campaign in Brazil. In Public health communication:
Evidence for behavior change, edited by R. C. Hornik. Mahwah, NJ: Lawrence Erlbaum Associates. Pp. 73-84.
Koh, K. A., J. S. Hoy, J. J. O’Connell, and P. Montgomery. 2012. The hunger-obesity paradox: Obesity in the home-
less. Journal of Urban Health 89(6):952-964.
Kohl, H. W., 3rd, S. B. Satinsky, G. P. Whitfield, and K. R. Evenson. 2013. All health is local: State and local planning
for physical activity promotion. Journal of Public Health Management and Practice 19(3 Suppl 1):S17-S22.
Lee, I. M., E. J. Shiroma, F. Lobelo, P. Puska, S. N. Blair, P. T. Katzmarzyk, and G. Lancet Physical Activity Series
Working. 2012. Effect of physical inactivity on major non-communicable diseases worldwide: An analysis of
burden of disease and life expectancy. Lancet 380(9838):219-229.
Life Sciences Research Office. 1995. Third report on nutrition monitoring in the United States. Washington, DC: U.S.
Government Printing Office.
Marketing Economics Division. 1972. Impact of the expanded food and nutrition education program on low-
income families: An in-depth analysis. Report No. 200. Washington, DC: Economic Research Division, U.S.
Department of Agriculture.
Martin, J. A., B. E. Hamilton, S. J. Ventura, M. J. K. Osterman, E. C. Wilson, and T. J. Mathews. 2012. Births: Final
data for 2010. National Vital Statistics Reports 61(1).
Matic, A., V. Osmani, A. Popleteev, and O. Mayora-Ibarra. 2011. Smart phone sensing to examine effects of
social interactions and non-sedentary work time on mood changes. In Modeling and using context, edited
by M. Beigl, H. Christiansen, T. Roth-Berghofer, A. Kofod-Petersen, K. Coventry and H. Schmidtke. Berlin-
Heidelberg. Pp. 200-213.
Menotti, A., A. Keys, D. Kromhout, H. Blackburn, C. Aravanis, B. Bloemberg, R. Buzina, A. Dontas, F. Fidanza,
S. Giampaoli, M. Karvonen, M. Canti, I. Mohacek, S. Nedeljovic, A. Nissinen, J. Pekkanen, S. Punsar, F.
Seccareccia, and H. Toshima. 1993. Inter-cohort differences in coronary heart disease mortality in the 25-year
follow-up of the Seven Countries Study. European Journal of Epidemiology 9(5):527-536.
Mercer, S. L., B. J. DeVinney, L. J. Fine, L. W. Green, and D. Dougherty. 2007. Study designs for effectiveness and
translation research: Identifying trade-offs. American Journal of Preventive Medicine 33(2):139-154.
Morrissey, S. L., L. M. Whetstone, D. M. Cummings, and L. J. Owen. 2006. Comparison of self-reported and mea-
sured height and weight in eighth-grade students. Journal of School Health 76(10):512-515.

Copyright © National Academy of Sciences. All rights reserved.
Evaluating Obesity Prevention Efforts: A Plan for Measuring Progress
179National Obesity Evaluation Plan
Murphy, S. P. 2003. Collection and analysis of intake data from the integrated survey. Journal of Nutrition
133(2):585S-589S.
National Association of State Boards of Education. 2013. State school health policy database. http://www.nasbe.org/
healthy_schools/hs/index.php (accessed April 5, 2013).
National Center for Health Statistics. 2013. Health indicators warehouse. http://healthindicators.gov (accessed
April 5, 2013).
National Conference of State Legislatures. 2013. NCSL 50-state searchable bill databases. http://www.ncsl.org/ issues-
research/telecom/ncsl-50-state-searchable-bill-tracking-databases.aspx (accessed April 5, 2013).
National Forum for Heart Disease and Stroke Prevention. 2008. An overview of a public health action plan to pre-
vent heart disease and stroke 2008 update. Washington, DC: U.S. Government Printing Office.
NCCOR (National Collaborative of Childhood Obesity Research). 2012. Catalogue of surveillance systems. http://
nccor.org/projects/catalogue/index.php (accessed April 4, 2013).
NCCOR. 2013. NCCOR measures registry. http://nccor.org/projects/measures/index.php (accessed June 15, 2012).
NCI (National Cancer Institute). 2013. Classification of laws associated with school students. http://class.cancer.gov
(accessed April 5, 2013).
NCQA (National Committee for Quality Assurance). 2012. Annual quality study finds increased attention to obesity,
improvement among Medicare plans. http://www.ncqa.org/Portals/0/State%20of%20Health%20Care/2012/
NCQA%20SOHQ%20National%20Release%20FINAL.pdf (accessed April 5, 2013).
NCQA. 2013. HEDIS & performance measurement. http://www.ncqa.org/HEDISQualityMeasurement.aspx
(accessed July 11, 2013).
Ndirangu, M., Yadrick, K., S. Graham-Kresge, B. Hales, A. Avis, and M. Bogle. 2010. Community and academia
partnerships: A description of the Lower Mississippi Delta Nutrition Intervention Research Initiative project.
International Public Health Journal 2(SI):231-242.
NIH (National Institutes of Health). 2013. Dissemination and implementation. http://obssr.od.nih.gov/scientific_
areas/translation/dissemination_and_implementation/index.aspx (accessed July 11, 2013).
NRC (National Research Council). 2005. Improving data to analyze food and nutrition policies. Washington, DC:
The National Academies Press.
NYC Department of Health and Mental Hygiene. 2013. New York City health and nutrition examination survey.
http://www.nyc.gov/html/doh/html/data/nyc-hanes.shtml (accessed April 5, 2013).
Ottoson, J. M., L. W. Green, W. L. Beery, S. K. Senter, C. L. Cahill, D. C. Pearson, H. P. Greenwald, R. Hamre, and
L. Leviton. 2009. Policy-contribution assessment and field-building analysis of the Robert Wood Johnson
Foundation’s Active Living Research Program. American Journal of Preventive Medicine 36(2 Suppl):S34-S43.
Palmgreen, P., L. Donohew, E. P. Lorch, R. H. Hoyle, and M. T. Stephenson. 2002. Television campaigns and
sensation seeking targeting of adolescent marijuana use: A controlled time series approach. In Public health
communication: Evidence for behavior change, edited by R. C. Hornik. Mahwah, NJ: Lawrence Erlbaum
Associates. Pp. 73-84.
Penkilo, M., G. C. George, and D. M. Hoelscher. 2008. Reproducibility of the school-based nutrition monitor-
ing questionnaire among fourth-grade students in Texas. Journal of Nutrition Education and Behavior
40(1):20-27.
Pierce, J. P., S. Emery, and E. Gilpin. 2002. The California Tobacco Control Program: A long-term health com-
munication project. In Public health communication: Evidence for behavior change, edited by R. C. Hornik.
Mahwah, NJ: Lawrence Erlbaum Associates.
Pronk, N. P. 2003. Economic aspects of obesity: A managed care perspective. In Obesity: Etiology, assessment, treat-
ment, and prevention, edited by R. E. Andersen. Champaign, IL: Human Kinetics Publishers, Inc. Pp. 33-42.

Copyright © National Academy of Sciences. All rights reserved.
Evaluating Obesity Prevention Efforts: A Plan for Measuring Progress
Evaluating Obesity Prevention Efforts180
Riboli, E., K. J. Hunt, N. Slimani, P. Ferrari, T. Norat, M. Fahey, U. R. Charrondiere, B. Hemon, C. Casagrande,
J. Vignat, K. Overvad, A. Tjonneland, F. Clavel-Chapelon, A. Thiebaut, J. Wahrendorf, H. Boeing, D.
Trichopoulos, A. Trichopoulou, P. Vineis, D. Palli, H. B. Bueno-De-Mesquita, P. H. Peeters, E. Lund, D.
Engeset, C. A. Gonzalez, A. Barricarte, G. Berglund, G. Hallmans, N. E. Day, T. J. Key, R. Kaaks, and R.
Saracci. 2002. European prospective investigation into cancer and nutrition (EPIC): Study populations and
data collection. Public Health Nutrition 5(6B):1113-1124.
Rocella, E. J. 2002. The contribution of public education toward the reduction of CVD mortality: Experiences from
the National High Blood Pressure Education Program. In Public health communication: Evidence for behavior
change, edited by R. C. Hornik. Mahwah, NJ: Lawrence Erlbaum Associates. Pp. 73-84.
Rogers, T. 2010. The California tobacco control program: Introduction to the 20-year retrospective. Tobacco
Control 19(Suppl 1):i1-i2.
Rudd Center for Food Policy and Obesity. 2013. Legislation database. http://www.yaleruddcenter.org/legislation
(accessed April 5, 2013).
RWJF (Robert Wood Johnson Foundation). 2013a. Active living research. Using evidence to prevent childhood obe-
sity and create active communities. http://www.activelivingresearch.org (accessed April 5, 2013).
RWJF. 2013b. Healthy eating research: Building evidence to prevent childhood obesity. http://www.
healthyeatingresearch.org (accessed April 5, 2013).
Sanson-Fisher, R. W., B. Bonevski, L. W. Green, and C. D’Este. 2007. Limitations of the randomized controlled trial
in evaluating population-based health interventions. American Journal of Preventive Medicine 33(2):155-161.
School Nutrition Association. 2011. State policy index. http://docs.schoolnutrition.org/childnutrition/govtaffairs/
statutes (accessed April 5, 2013).
Stommel, M., and C. A. Schoenborn. 2009. Accuracy and usefulness of BMI measures based on self-reported weight
and height: Findings from the NHANES & NHIS 2001-2006. BMC Public Health 9:421.
Sun, M., J. D. Fernstrom, W. Jia, S. A. Hackworth, N. Yao, Y. Li, C. Li, M. H. Fernstrom, and R. J. Sclabassi. 2010.
A wearable electronic system for objective dietary assessment. Journal of the American Dietetic Association
110(1):45-47.
Swan, M. 2009. Emerging patient-driven health care models: An examination of health social networks, consumer
personalized medicine and quantified self-tracking. International Journal Environmental Research Public
Health 6(2):492-525.
Thacker, S. B., J. R. Qualters, and L. M. Lee. 2012. Public health surveillance in the United States: Evolution and
challenges. Morbidity Mortality Weekly Reports 61:3-9.
The Child and Adolescent Health Measurement Initiative. 2012. Data Resource Center for Child and Adolescent
Health. http://www.childhealthdata.org (accessed April 4, 2013).
Thiagarajah, K., A. D. Fly, D. M. Hoelscher, Y. Bai, K. Lo, A. Leone, and J. A. Shertzer. 2008. Validating the food
behavior questions from the elementary school span questionnaire. Journal of Nutrition Education and
Behavior 40(5):305-310.
University of Illinois at Chicago. 2013a. Bridging the gap: Research informing policies and practices for healthy
youth. http://www.bridgingthegapresearch.org (accessed April 5, 2013).
University of Illinois at Chicago. 2013b. District wellness policies. http://www.bridgingthegapresearch.org/research/
district_wellness_policies (accessed April 5, 2013).
Wakefield, M.A., S. Durkin, M. Spittal, M. Siahpush, M. Scollo, J. A. Simpson, S. Chapman, V. White, and D. Hill.
2008. Impact of tobacco control policies and mass media campaigns on monthly adult smoking prevalence.
American Journal of Public Health 98(8):1443-1450.
Wang, V. L., and P. H. Ephross. 1970. Poor but not forgotten. Monograph 1. College Park: University of Maryland,
Cooperative Extension Service.

Copyright © National Academy of Sciences. All rights reserved.
Evaluating Obesity Prevention Efforts: A Plan for Measuring Progress
181National Obesity Evaluation Plan
Wang, V. L., L. W. Green, and P. H. Ephross. 1972. Not forgotten but still poor. Monograph 2. College Park:
University of Maryland, Cooperative Extension Service.
Wang, Y., and M. A. Beydoun. 2007. The obesity epidemic in the United States—gender, age, socioeconomic, racial/
ethnic, and geographic characteristics: A systematic review and meta-regression analysis. Epidemiologic
Reviews 29(1):6-28.
WHO (World Health Organization). 2004. Global strategy on diet, physical activity, and health. Geneva: World
Health Organization.
WHO. 2007. Nutrition, physical activity, and the prevention of obesity: Policy developments in the WHO European
region. Copenhagen: World Health Organization.
WHO. 2008. Global strategy on diet, physical activity, and health: A framework to monitor and evaluate implemen-
tation. Geneva: World Health Organization.
WHO. 2011. WHO European database on nutrition, obesity, and physical activity (NOPA). http://data.euro.who.int/
nopa (accessed April 5, 2013).
Williams, A. F., J. K. Wells, and D. W. Reinfurt. 2002. Increasing seat belt use in North Carolina. In Public health
communication: Evidence for behavior change, edited by R. C. Hornik. Mahwah, NJ: Lawrence Erlbaum
Associates. Pp. 85-96.
Worden, J. K., and B. S. Flynn. 2002. Using mass media to prevent cigarette smoking. In Public health communica-
tion: Evidence for behavior change, edited by R. C. Hornik. Mahwah, NJ: Lawrence Erlbaum Associates.
Pp. 23-34.
Woteki, C. E. 2003. Integrated NHANES: Uses in national policy. Journal of Nutrition 133(2):582S-584S.
Woteki, C. E., R. R. Briefel, C. J. Klein, P. F. Jacques, P. M. Kris-Etherton, J. A. Mares-Perlman, and L. D. Meyers.
2002. Nutrition monitoring: Summary of a statement from an American Society for Nutritional Sciences work-
ing group. Journal of Nutrition 132(12):3782-3783.

Copyright © National Academy of Sciences. All rights reserved.
Evaluating Obesity Prevention Efforts: A Plan for Measuring Progress
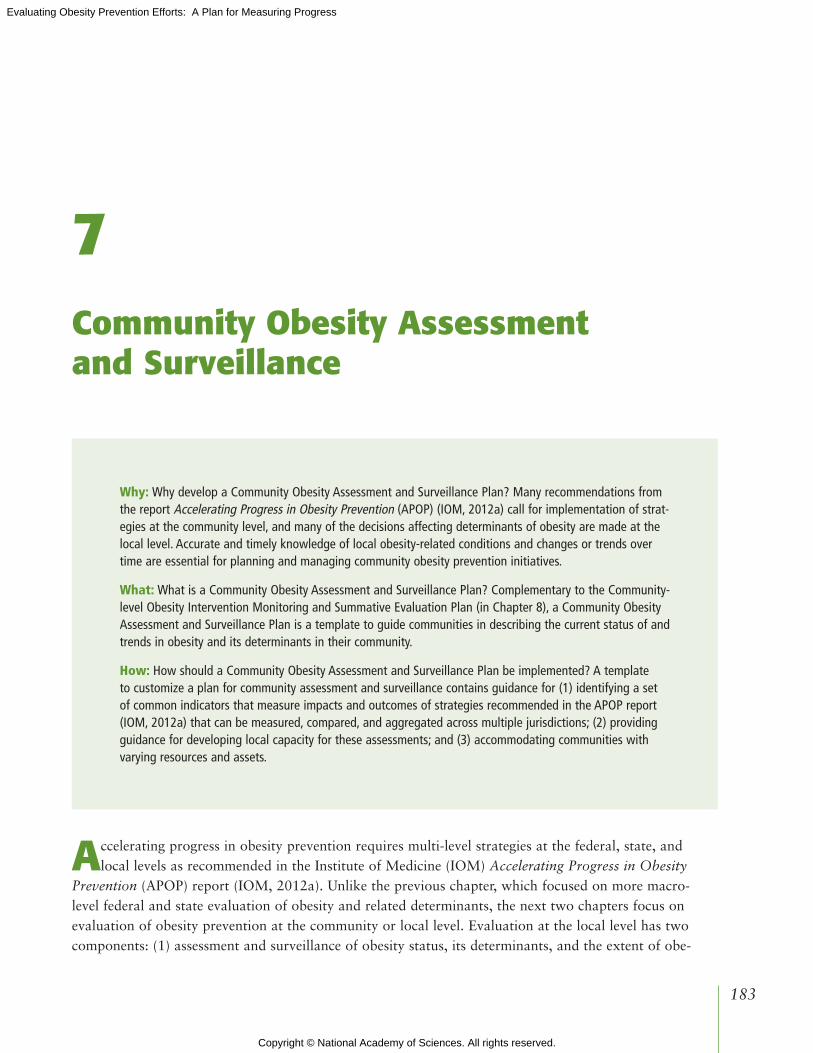
Copyright © National Academy of Sciences. All rights reserved.
Evaluating Obesity Prevention Efforts: A Plan for Measuring Progress
183
7Community Obesity Assessment and Surveillance
Accelerating progress in obesity prevention requires multi-level strategies at the federal, state, and local levels as recommended in the Institute of Medicine (IOM) Accelerating Progress in Obesity
Prevention (APOP) report (IOM, 2012a). Unlike the previous chapter, which focused on more macro-level federal and state evaluation of obesity and related determinants, the next two chapters focus on evaluation of obesity prevention at the community or local level. Evaluation at the local level has two components: (1) assessment and surveillance of obesity status, its determinants, and the extent of obe-
Why: Why develop a Community Obesity Assessment and Surveillance Plan? Many recommendations from the report Accelerating Progress in Obesity Prevention (APOP) (IOM, 2012a) call for implementation of strat-egies at the community level, and many of the decisions affecting determinants of obesity are made at the local level. Accurate and timely knowledge of local obesity-related conditions and changes or trends over time are essential for planning and managing community obesity prevention initiatives.
What: What is a Community Obesity Assessment and Surveillance Plan? Complementary to the Community-level Obesity Intervention Monitoring and Summative Evaluation Plan (in Chapter 8), a Community Obesity Assessment and Surveillance Plan is a template to guide communities in describing the current status of and trends in obesity and its determinants in their community.
How: How should a Community Obesity Assessment and Surveillance Plan be implemented? A template to customize a plan for community assessment and surveillance contains guidance for (1) identifying a set of common indicators that measure impacts and outcomes of strategies recommended in the APOP report (IOM, 2012a) that can be measured, compared, and aggregated across multiple jurisdictions; (2) providing guidance for developing local capacity for these assessments; and (3) accommodating communities with varying resources and assets.

Copyright © National Academy of Sciences. All rights reserved.
Evaluating Obesity Prevention Efforts: A Plan for Measuring Progress
Evaluating Obesity Prevention Efforts184
sity prevention activities and (2) monitoring and summative evaluation of the quality and effectiveness of obesity prevention interventions. The prominence of local prevention activities implies that evaluating progress in obesity prevention must include knowledge of changes in obesity and its determinants at the local level and of the effectiveness of locally implemented strategies (IOM, 2007). Therefore, local evalu-ation includes both community assessment and surveillance (CAS)1 and community program and initia-tive monitoring and summative evaluation (e.g., evaluation of interventions, including programs, systems, policies, environmental changes, services, products). This chapter addresses the former. The subsequent chapter (Chapter 8) focuses on community program and initiative (or intervention) monitoring and sum-mative evaluation.
GOALS OF CAS COMPAREd TO INTERVENTION MONITORING ANd SUMMATIVE EVALUATION
Community assessment, surveillance, and intervention monitoring and summative evaluation are distinct sets of activities with complementary goals. The goal of community assessments is usually a first-time assessment of status or trends overall. Surveillance provides repeated or continuous assessments of progress over time, whereas intervention monitoring and summative evaluation seeks to establish and share “what works.” The combination of first-time assessment and ongoing surveillance (or CAS) can document, at the local level, associations of the status or trends in obesity prevalence with behaviors, social factors, environments, or interventions. Linking these with the monitoring of implementation of interventions becomes the main sources of data for evaluation. Intervention summative evaluations seek to move beyond association to determine whether observed changes in outcomes can be associated with and, ideally, attributed to the intervention or combination of interventions.
These two purposes—assessing status or progress and evaluating whether interventions are working—require different types or levels of evidence. When assessing status or progress, evidence of cur-rent levels or trends in obesity and its determinants (e.g., behaviors, environments, programs, systems, and policies) can be sufficient, without necessarily attributing cause. Causal assumptions will be inevitable because some determinants are found to be above state or national averages, suggesting that interventions need to be developed with those determinants as targets. For implementers of community initiatives, this information can help them to decide whether their approaches are on target or need adjustment. For local efforts that need to show progress to constituents or funders, evidence of progress may be sufficient for accountability. In contrast, when evaluating interventions, the strongest evidence possible is desirable, and this means place-based experiments usually including a comparison or control condition, or the strongest feasible quasi- experiments (see Chapter 8).
CAS and intervention monitoring and summative evaluation interact and share some similarities. Intervention monitoring and summative evaluation can use data generated by CAS and can suggest topics for inclusion in data collection and vice versa. Combining CAS data across communities can contribute data to multi-site assessment designs. Both can incorporate community engagement and participatory research methods.
1 This chapter focuses on a plan for conducting community assessments and surveillance for obesity prevention efforts as defined. The Committee deliberately uses community assessments or CAs when referring to this aspect only and uses community assessments and surveil-lance or CAS when referring collectively to both aspects.

Copyright © National Academy of Sciences. All rights reserved.
Evaluating Obesity Prevention Efforts: A Plan for Measuring Progress
185Community Obesity Assessment and Surveillance
whY MEASURE STATUS OR PROGRESS AT ThE COMMUNITY LEVEL
Many of the factors that determine obesity rates—and the decisions to change those factors—are local and, therefore, so are many of the APOP strategies (IOM, 2003, 2012a). In communities, for example:
• planning and land use decisions create built environments that support walking and biking and increase access to better food choices and limit exposure to unhealthful foods;
• schools provide better food choices and more opportunities for physical activity; • organizations provide and support community programs designed to increase physical activity; • local governments, organizations, and institutions adopt comprehensive strategies to reduce
overconsumption of sugar-sweetened beverages and to implement nutritional standards for foods and beverages available at government and public sites;
• health care providers improve practices for prevention, screening, diagnosis, and treatment of overweight and obesity; and
• employers encourage active living and healthful eating at work.
At the local level, people can be more creative and innovative than at the federal or state level. Local communities, in short, can provide direct services, implement policy, change environments, and create systems changes.
LOCALITY-SPECIFIC ANd dIVERSE dATA
Not every strategy enumerated by APOP’s recommendations (IOM, 2012a) can be expected to be appropriate to the specific circumstances of each community. Because local challenges and assets vary widely across America’s communities, selection and adaptation of evidence-based strategies may be most appropriately decided in each community. Local communities across the nation vary widely with respect to population size; cultural, racial and ethnic diversity; and impact of obesity. Local capacities for assess-ment and surveillance are also highly variable, with a wide range of skills and resources for developing and using health and other data. The Committee tried to account for this heterogeneity by developing a tiered set of guidance suitable to diverse communities and initiatives of varying scales and intensities with differing levels of resources for community assessment and surveillance. Because it is possible for local assessors to connect directly with community organizations, and in some cases residents, the potential for community engagement and use of community-based participatory research (CBPR) methods is greater for CAS than for assessment of progress nationally.
OVERVIEw OF COMMUNITY ASSESSMENT ANd SURVEILLANCE
Community assessment2 is a process that involves the systematic collection of data over time at the community level for the purposes of describing current health status and determinants of health at points in time and trends over time (Cibula et al., 2003). Community assessment and surveillance may be global
2 Community assessment as defined by this chapter is focused on assessments of obesity prevention efforts. Community health assessment is commonly used in the field as a way to assess overall health of a community, which can include obesity.
Copyright © National Academy of Sciences. All rights reserved.
Evaluating Obesity Prevention Efforts: A Plan for Measuring Progress
Evaluating Obesity Prevention Efforts186
assessments of the health of a community or focus specifically on chronic diseases, or more specifically on obesity. An obesity-focused community assessment and surveillance can draw attention to obesity as a priority health concern and include more obesity-related information than a broader CAS. In both cases, they should include indicators that assess progress in obesity prevention, such as obesity prevalence3; obesity-related behaviors such as physical activity and food and beverage consumption; features of the environment that influence behaviors such as accessibility of healthful foods, walkability, or places for physical activity; policies that shape environments and behaviors, nutrition, and physical activity pro-grams; other interventions such as media campaigns or food retail promotion of healthier foods; levels of funding for obesity prevention initiatives; transportation systems; and social assets (e.g., groups with a history of working together to promote health, community leadership and champions, and political will). CAS also may include information on community contextual factors that influence obesity (Fawcett et al., 2011), such as demographics of the community, and social determinants of health leading to differential exposure and vulnerabilities (e.g., education and unemployment, income inequality, racism/discrimination, social norms, social capital, residential proximity to walkable areas, and “food deserts”). Ideally, they also describe policies that shape environments and behaviors such as menu labeling or pedestrian master plans, as well as the interactions of sectors and institutions in addressing obesity from a systems analysis perspective, although data and methods for these domains are just emerging (see Chapter 9). CAS displays and disseminates data through reports, presentations, and websites using a variety of data description and visualization methods (e.g., maps of available community parks and supermarkets).
The general tasks of CAS in the context of this report are to describe the current state of obesity-related and contextual indicators and track them over time. The information gathered from CAS can identify areas that need improvement, monitor the implementation or emergence of policies, programs, or other interventions, and track changes in contextual influences. These provide various forms of data to facilitate planning for future actions and to examine the effects of interventions over time. CAS systems can range from simple reports of generally available indictors easily accessed on the Web to intensive projects that involve a combination of primary and secondary data collection, sophisticated qualitative and quantitative data analysis, and advanced dissemination and visualization techniques. This chapter describes uses of CAS in the context of this report, commonly used indicators and some innovative ones, sources of data for these indicators, methods for conducting CAS, examples of typical and exemplary CAS, gaps in current CAS indicators and methods, and recommendations for obesity-focused CAS. Box 7-1 provides an actionable plan to implement a community obesity assessment. The rest of the chapter provides support and guidance for implementing each step with specific attention to different needs for larger and smaller communities. This support and guidance includes where possible the identi-fication of existing tools, resources, and methods for consideration framed around assessing the environ-mental and policy strategies recommended in the APOP report (IOM, 2012a).
dEFINE COMMUNITY BOUNdARIES
The Committee defines community level as activities conducted by local governmental units (e.g., cities, counties), school districts, quasi-governmental bodies (e.g., regional planning authorities, housing authorities) and private-sector organizations (e.g., hospitals, businesses, after school programs). In this
3 Incidence data would be preferable, but these are generally not available at the local level.

Copyright © National Academy of Sciences. All rights reserved.
Evaluating Obesity Prevention Efforts: A Plan for Measuring Progress
187Community Obesity Assessment and Surveillance
context, community is defined as people sharing a common place (e.g., city, neighborhood); they may also share a common experience (e.g., living in a neighborhood with few grocery stores or parks or living in poverty) or interest (e.g., working together to promote better nutrition or active living) (IOM, 2012b). A community may also be defined as a group of people who identify themselves as sharing a common inter-est or culture, but this interpretation is only applicable here to the extent that such a common-interest community is local.
Geographic community definitions can be based on jurisdictional boundaries (e.g., city, county, school district, hospital district), census-defined boundaries (e.g., census places or metropolitan/ micropolitan statistical areas), or customized boundaries (e.g., aggregations of census tracts or zIP codes). The choice of geographic boundaries often depends on availability of data for the area of interest.
CAS can describe and track health inequities among different groups; for example, those sharing race/ethnicity, gender, sexual orientation, income, and geography. By displaying indicators stratified by demographic and geographic strata, it becomes apparent whether progress in preventing obesity is occur-ring equitably (see Figures 7-1 and 7-2 for examples). The boundaries of the community must be explicit to help to clarify the conditions of that particular community and to identify the appropriate set of indica-tors (McIntyre and Ellaway, 2000).
ENGAGE COMMUNITY MEMBERS ANd OThER kEY STAkEhOLdERS
Collaborative approaches to CAS involving government, community organizations, and private-sector stakeholders have gained recent recognition for addressing the complex set of factors associated with popu-lation health. Engaging community members and private-sector stakeholders in planning and sense-making is essential to understanding, implementing, and sustaining community assessments and surveillance and health improvement efforts (IOM, 2003). Interested stakeholders include community organizations and coalitions, hospitals, local public health agencies, human service agencies, schools, business, and commu-nity health centers. Meaningful participation extends beyond physical presence of community members to include their active engagement in generating ideas, contributing to decision making, and sharing responsi-bility for taking action (NIH, 2011). Stakeholders can engage during some or all phases of CAS, including
• Review/revise community definition, participating stakeholders;• Assess stakeholder priorities for focus/topics, for assessment/surveillance, and to engage in plan-
ning the assessment;• Determine resources and capacities among participants (e.g., staff, technical skills, data, fund-
ing, etc.) available for conducting assessment/surveillance;• Make community participation and involvement easier (i.e., enhance access by arranging meet-
ings at times and places convenient for community members, with language/physical access, transportation, child care, and other necessary accommodations); and
• Include community members in data collection and interpretation of results, and disseminate findings (detailed throughout this chapter).
The extent and type of end-user engagement should be appropriate to the scale and scope of each specific community assessment or development of surveillance capacity.

Copyright © National Academy of Sciences. All rights reserved.
Evaluating Obesity Prevention Efforts: A Plan for Measuring Progress
Evaluating Obesity Prevention Efforts188
The principles and methods developed for conducting CBPR are well-suited for promoting commu-nity engagement in assessment and surveillance of the assets of the community; identifying local concerns; designing and conducting the assessment/surveillance; interpreting, disseminating, and translating the find-ings; and sustaining and evaluating partnerships that act on the assessment/surveillance findings (Fawcett et al., 2003; Israel et al., 2013; Minkler and Wallerstein, 2008). CBPR methods can contribute to assuring accurate findings that describe true conditions in the community because they bring diverse perspectives and knowledge bases into the assessment/surveillance process. CBPR contributes to bringing together
BOX 7-1 Components of a Community Obesity Assessment and Surveillance Plan
Purpose: To provide accurate and timely knowledge of local obesity-related conditions and relevant changes or trends over time as a result of implementing strategies in the Institute of Medicine Accelerating Progress in Obesity Prevention (APOP) report (IOM, 2012a).
1. Define community boundaries.
a. Create specific geographic areas that reflect jurisdictions, key stakeholders, and community members’ perceptions of geographic boundaries.
2. Engage community members and other key stakeholders.
a. Include stakeholders, to the extent possible, in defining community, identifying priorities, planning assessments, collecting data, interpreting and sense-making of results, and disseminating the findings.
3. Plan assessment/surveillance and include stakeholders and community members.
a. Identify lead agency or agencies responsible for conducting assessment/surveillance.
b. Clarify goals of assessment/surveillance.
c. Define audience and the information that will move it to action.
d. Define topics to include in assessment/surveillance.
e. Identify sub-populations and small areas disproportionately affected by obesity, and develop approach to collecting information about them.
f. Select local data to be included about context, assets, interventions, barriers, and social determinants, and which data to schedule for ongoing surveillance.

Copyright © National Academy of Sciences. All rights reserved.
Evaluating Obesity Prevention Efforts: A Plan for Measuring Progress
189Community Obesity Assessment and Surveillance
4. Collect data.
a. Obtain existing data from web-based platforms or published reports.
b. As resources permit, add other sources of data.
c. Create an inventory of local obesity prevention interventions.
5. Analyze and interpret the data.
a. Include trends over time.
b. Present data for infants, children, adolescents, adults, and special populations.
c. Describe variation in indicators (e.g., across race/ethnicity/socioeconomic status/small areas).
d. Include comparison to benchmarks, state rates, and peer communities.
e. Compare extent of existing interventions identified to those recommended in the APOP report (IOM, 2012a).
f. Share data with community members and other stakeholders for their interpretations and suggested implications for action.
g. Visualize, or illustrate, data (see Figures 7-1 and 7-2).
6. Disseminate findings.
a. Prepare reports, websites, infographics, and other dissemination tools.
b. Share findings with stakeholders and engage them in interpretation of findings.
c. Present findings at community meetings for further interpretation.
d. Implement a media advocacy strategy to gain media coverage.
e. Consider using social media to further increase awareness of findings.
assessment/surveillance professionals and the community “to establish trust, share power, foster co-learn-ing, enhance strengths and resources, build capacity, and examine and address community-identified needs and health problems” (Israel et al., 2013, p. 14), especially in communities affected by health inequities. Box 7-2 summarizes some key aspects.
An example of the application of participatory methods to community obesity assessment and surveillance comes from the work of Faith Leaders for Environmental Justice in New York City (see Box 7-3).

Copyright © National Academy of Sciences. All rights reserved.
Evaluating Obesity Prevention Efforts: A Plan for Measuring Progress
Evaluating Obesity Prevention Efforts190
FIGURE 7-1 Example of illustrating community health indicator data—map.SOURCE: Used with permission from Public Health–Seattle & King County (King County, 2013b).
FIGURE 7-2 Examples of illustrating community health indicator data—bar chart.NOTE: AN = Alaskan Native; PI = Pacific Islander.SOURCE: Used with permission from Public Health–Seattle & King County (King County, 2013c).
Figure 7-2.eps2 bitmaps, titles retyped
Obese by Household Annual Incomeamong King County adults age 18+
2006-2010 Combined
Obese by Race/Ethnicityamong King County adults age 18+
2006-2010 Combined
Indicator: Percent of Adults Who Are Obese,
Health Reporting Areas,King County, 2007-2011
LegendAdult obesity rate
29% - 35%
23% - 28%
17% - 22%
10% - 16%
0 3 6 9 121.5Miles
Source: Washington State Department of Health, Center for Health Statistics, Behavioral Risk Factor Surveillance System supported in part by Centers for Disease Control and PreventionCooperative AgreementProduced by: Public Health-Seattle & King CountyAssessment, Policy Development & Evaluation3/13/2013
Path: S:\WORK\CoreIndicators\2011-2012\HRAdata for maps\Obese Map 3.mxd
Rate = Percent of adults with Body Mass Index >=30

Copyright © National Academy of Sciences. All rights reserved.
Evaluating Obesity Prevention Efforts: A Plan for Measuring Progress
191Community Obesity Assessment and Surveillance
BOX 7-2 Increasing Participation in Community Assessment and Surveillance (CAS)
1. Identify those community members and groups, including those experiencing health disparities, that have a stake in community health improvement and conducting a CAS.
2. Invite members of the community to participate through public announcements and connectors—those with trusting relationships and credibility with members of diverse communities.
3. Make community participation and involvement easier by addressing logistical and cultural barriers to participation.
4. Make community participation and involvement more rewarding
• Assure that the “6 Rs” are incorporated into the group’s meetings and activities, including
— Recognition—Recognize people for their contributions.
— Respect—Respect and consider people’s values, culture, ideas, and time.
— Role—Give each person a clear and meaningful role through which they can contribute.
— Relationships—Provide opportunities for people to establish relationships and build networks.
— Reward—Ensure that the rewards of participating in the group outweigh the costs.
— Results—Work to achieve results that are linked to outcomes of importance to the community.
5. Assess and enhance the cultural competence of the community assessment/surveillance initiative by considering the local customs and values of the community, designing the assessment/surveillance with the participation of people from diverse cultures within the community, and assuring that minority groups have the power and voice to express their concerns and ideas.
6. Assure open communication of draft plans/findings and opportunities for review and feedback from the whole community.
SOURCE: Adapted from Fawcett et al., 2011.
Plan assessment/sURVeIllanCe
Planning a CAS includes identifying a lead agency responsible for conducting it; clarifying its goals; defining the target audience and what information will move them to action; defining topics to include in the assessment/surveillance; identifying sub-populations and small areas disproportionately affected by obesity; developing approaches to collecting information about them; and selecting local data about con-text, assets, interventions, barriers, and social determinants.

Copyright © National Academy of Sciences. All rights reserved.
Evaluating Obesity Prevention Efforts: A Plan for Measuring Progress
Evaluating Obesity Prevention Efforts192
BOX 7-3 Community-Based Participatory Research: The Faith Leaders for Environmental Justice
The Faith Leaders for Environmental Justice (FLEJ), a group of individuals and organizations in New York City with interest in mobilizing communities around environmental justice issues, was interested in influencing public policy focused on the issue of food access. This group brought together community residents to help to identify priority problems in their communities, document problems associated with the food environ-ments, elicit experiences on the Supplemental Nutrition Assistance Program and other food access–related policies, and identify existing policies that may relate to their policy goals and interests. The work of this group illustrates the utility of a community-based participatory approach and to policy advocacy work.
The FLEJ used the Everyday Democracy’s “dialogue-to-change” process (http://www.everyday-democracy.org, accessed November 11, 2013), which involved bringing together a cross-section of community resi-dents to share their views and experiences through structured facilitated conversations in small groups. For this dialogue process, local food and health experts and Everyday Democracy developed a guide. Trained individuals facilitated “dialogue circles” during a 2-day summit, with the materials helping to guide the conversation. Each circle was tasked to identify three action ideas. The information collected from the group conversations identified a list of the most popular ideas and helped form working groups in which the com-munity residents would participate in developing the necessary data and interventions. The working groups were Business Outreach; Community Engagement; Farm Bill; Food; Voter Education; and Healthy Incentives. These working groups then developed a targeted approach to tackling their particular issue.
SOURCE: Tsui et al., 2013.
Valuable resources are available for conducting CAS. The Community Tool Box, Centers for Disease Control and Prevention (CDC), National Association of County and City Health Officials, state health departments, and others offer guidance on methods for conducting CAS. Box 7-4 provides a list of exam-ple tools and resources that are available for planning CAS.
Identifying a Lead Agency Responsible for Conducting the Assessment and Surveillance
Identifying a lead agency (or agencies) for the assessment promotes accountability for completing the CAS. The choice of which agency or agencies are best suited to lead the CAS depends on community context and agency assets. A lead agency should have the capacity to convene and manage the CAS process, access to the data needed for the assessment, skills in data analysis, and resources for communicating and dissemi-nating findings. If a lead agency does not have these assets, then collaboration with others is an alternative. In participatory CAS, the engaged stakeholders choose or endorse the lead agency early in the process. In other cases, such as the production of routine assessments as part of a local health department’s responsibili-ties, the lead agency may initiate and conduct the CAS, engaging stakeholders in a more limited capacity.

Copyright © National Academy of Sciences. All rights reserved.
Evaluating Obesity Prevention Efforts: A Plan for Measuring Progress
193Community Obesity Assessment and Surveillance
BOX 7-4 Example Tools and Resources for Planning Community Assessment/Surveillance
National Resources
• Association for Community Health Improvement: Community Health Assessment Toolkit—http://www.assesstoolkit.org
• Catholic Health Association: Assessing and Addressing Community Health Needs—http://www.chausa.org/communitybenefit/printed-resources/assessing-and-addressing-community-health-needs
• Community Health Assessment and Group Evaluation (CHANGE): Building a Foundation of Knowledge to Prioritize Community Needs—http://www.cdc.gov/nccdphp/dch/programs/healthycommunitiespro-gram/tools/change.htm
• Community Health Needs Assessment—http://www.chna.org
• Health Education Curriculum Analysis Tool (HECAT)—http://www.cdc.gov/HealthyYouth/HECAT/index.htm
• Indian Community Health Profile Toolkit—http://www.npaihb.org/images/resources_docs/Toolkit_Final.pdf
• Mobilizing for Action through Planning and Partnerships (MAPP)—http://www.naccho.org/topics/infrastructure/mapp
• Protocol for Assessing Community Excellence in Environmental Health (PACE EH)—http://www.cdc.gov/nceh/ehs/CEHA/PACE_EH.htm
• Resource Center for Community Health Assessments and Community Health Improvement Plans—http://www.naccho.org/topics/infrastructure/CHAIP/chachip-online-resource-center.cfm
• Some Recommended Practice Areas for Enhancing Community Health Improvement. Work Group for Community Health and Development, University of Kansas—http://ctb.ku.edu/sites/default/files/site_files/recommended_practices_for_enhancing_community_health_improvement.pdf
• School Health Index (SHI): Self-Assessment and Planning Guide—http://www.cdc.gov /HealthyYouth/SHI
• The Community Tool Box—http://ctb.ku.edu/en/default.aspx
State Resources
• New York State Department of Health—http://www.health.ny.gov/statistics/chac
• Minnesota Department of Health—http://www.health.state.mn.us/divs/opi/pm/lphap/cha/howto.html
• North Carolina Department of Health and Human Services—http://publichealth.nc.gov/lhd/cha
NOTE: Web addresses accessed November 11, 2013.

Copyright © National Academy of Sciences. All rights reserved.
Evaluating Obesity Prevention Efforts: A Plan for Measuring Progress
Evaluating Obesity Prevention Efforts194
CAS is generally the responsibility of public health officials as outlined in Essential Public Health Services, a guiding framework for the responsibilities of local public health systems (CDC, 2010). Departments from larger local jurisdictions often have the capacity to prepare their own CAS, although the surveillance of continuous or periodic measures are sometimes funded by or contracted with federal, state, or private-sector bodies. Smaller jurisdictions often rely on their state health departments to prepare reports and provide technical assistance (see Box 7-4). The capacity of local and state health departments to prepare CAS depends on local and state funding allocations, because little continuous federal support for these activities exists. Increasingly, other community stakeholders such as United Way, health care delivery systems, health plans, regional health system collaboratives (that include delivery systems, health plans, and employers), and community foundations are conducting assessments relevant to their missions and communities. For example the Puget Sound Health Alliance conducts assessments and surveillance of the health care environment across medical groups and clinics in five counties of Washington State (Puget Sound Health Alliance, 2013).
In some cases, existing policies and regulations specify who should conduct a CAS. For example, the Patient Protection and Affordable Care Act, Section 9007 (Public Law 111-148, 111th Congress) requires nonprofit hospitals to conduct community health needs assessments every 3 years and to adopt an imple-mentation strategy to address identified needs. The legislation also requires incorporation of input from people who represent the broad interests of the community and sharing the results of CAS with the pub-lic. Additionally, health centers supported federally by the Health Resources Services Administration are required to produce needs assessments for their programs (Section 330 of the Public Health Service Act, 42 USCS § 254b). At local public health departments, a CAS must be conducted as a prerequisite for accreditation (Public Health Accreditation Board, 2012).
CAS requires competency in several practice areas including promoting community engagement, data collection and analysis, small area analysis, gathering data on community assets, social determinants, and displaying and disseminating findings (Fawcett et al., 2011). These skills are absent in many com-munities, given resource constraints. Developing training and technical assistance assets and disseminat-ing them widely requires curricula, training platforms, model protocols and methods, and peer-learning. CDC, U.S. Department of Agriculture (USDA), state health departments, and other nongovernmental and professional organizations support or at least contribute to these activities through direct or indirect fund-ing, publications, webinars, or technical assistance (see Chapter 6).
Clarify Goals of Assessment and Surveillance
In the context of this report, CAS answers questions such as whether and how much obesity rates are declining, health behaviors are changing, and environments are improving. Whether programs are being implemented, systems and capacities are developing, and policies are being implemented become the work of monitoring as part of the formal evaluation or ongoing quality control by responsible agencies. Although the periodic assessments (surveillance) provide for measures of change, community assessment may also be done as a one-time activity to describe or “diagnose” the health of a community for the pur-poses of planning, developing community health improvement processes, or preparing funding proposals.
CAS can have diverse goals. It can provide an overall description of progress in preventing obesity, meet the local hospital’s need for a community assessment, identify the prevalence of determinants of obe-

Copyright © National Academy of Sciences. All rights reserved.
Evaluating Obesity Prevention Efforts: A Plan for Measuring Progress
195Community Obesity Assessment and Surveillance
sity, inform choice of prevention strategies, address a specific community change target, or meet reporting requirements for boards or funders.
define Audience and the Information That will Move Them to Action
CAS has multiple local audiences. Policy makers, local health departments, voluntary health agen-cies, advocacy groups, schools, employers, and United Way use CAS for planning, prioritization, budget allocations, and solicitations for support. Hospitals must now use CAS for guiding provision of commu-nity benefits. The media use CAS as sources for news stories. Community organizations use CAS to dem-onstrate need and advocate for resources. Assessors use CAS as data sources for conducting intervention summative evaluations. Understanding the audience(s) and what will attract their attention and motivate them to act should guide the tailoring of the assessment to increase its utility (see Chapter 2).
define Topics to Include in Assessment/Surveillance
Decisions about topics to include in a CAS are driven by the interests of local stakeholders, avail-ability of data for the community of interest, and the scope and purpose. The Committee recommends including core indicators available at the local level from national data sets (see below), including routinely available local data (e.g., student body mass index [BMI] from schools; health system data; planning department data; crime data; surveys; Selected Metropolitan/Micropolitan Area Risk Trends [SMART]; Behavioral Risk Factor Surveillance System [BRFSS]; local Youth Risk Behavior Surveillance System [YRBSS]; and the Special Supplemental Nutrition Program for Women, Infants, and Children program data), and adding additional indicators of local interest after assessing the feasibility of obtain-ing local data to describe them. The Committee recommends, when possible, including assessment and surveillance of environments that influence food and physical activity behaviors and of policies and norms and attitudes about causes of obesity and willingness to support strategies to prevent obesity as recom-mended in the APOP report (IOM, 2012a).
Quantitative Data Sources and Systems Available at the Local Level
Data and indicators are available but options limited. Many indicators have relevance to assessment and surveillance of progress in obesity prevention (see Chapter 4). In practice, local communities use a very small subset of these indicators. An important finding of the Committee is that federal data sources are woefully inadequate for describing progress in obesity prevention at the community level because they do not provide data at the local level, either at all or with sufficient sample sizes, coverage, frequency, and timeliness. Larger communities and states tend to have more data because their populations are large enough that sample sizes in current federal data sources are sufficient to permit statistically appropriate analyses or they have resources to oversample their populations to generate sufficient sample sizes within statewide or national samples.
Table 7-1 provides a summary of data sources that have estimates of obesity prevention–related data available at the community level. These existing federal data systems have significant limitations. For example, BRFSS sample sizes are too small to allow subgroup or stratified analyses (e.g., by race or income) in most communities. In addition, data are not consistently available even for large communities over time. The Metropolitan and Micropolitan Statistical Areas, as defined by the Census Bureau, and

Copyright © National Academy of Sciences. All rights reserved.
Evaluating Obesity Prevention Efforts: A Plan for Measuring Progress
Evaluating Obesity Prevention Efforts196
TABLE 7-1 Data Sources for Obesity Prevention Indicator Topics Available at the Local Level*
Data Source Indicator Topic Notes
American Community Survey
Adult active transport by walkingBicycling by adultsDemographic dataa
Provides demographic and transportation variables: age, gender, income, race/ethnicity, education at the county, incorporated place, zIP code tabulation area, and school district levels
Behavioral Risk Factor Surveillance System (BRFSS)
Adult physical activityConsumption of fruits (adults) Consumption of vegetables (adults)Obesity (adult)Overweight (adult)
Can provide data for approximately 90 percent of U.S. counties (although for smaller counties, confidence intervals are quite wide) through multi-year aggregation (5-7 years)
Selected Metropolitan/Micropolitan Area Risk Trends (SMART) BRFSS can be used to estimate information for large communities
Bayesian estimation methods can be used to obtain data for all counties for single years
Census Bureau’s County and zIP Code Business Patterns
Fast-food outlet densityHealthy food outlet densityRecreational facility outlet density
Decennial Census Adult active transport by walkingBicycling by adultsDemographic dataa
Includes these variables at census tract and block group levels as well as higher levels
School Health Policies and Practices Survey
Availability of healthy food options in schools
Daily school physical educationJoint/shared use of community facilitiesNational Health Education Standards Nutrition professional development for
teachersSchool Breakfast Program in schoolsSchool policies to facilitate access to clean
drinking waterSchool recessSugar-sweetened beverage policies in schools
Provides data for selected large districts, schools, and randomly selected classroom levels
School measurement of student weights and heights
Obesity (children/adolescents)Overweight (children/adolescents)
Availability varies depending on state or community policy
Special Supplemental Nutrition Program for Women, Infants, and Children (WIC)
Obesity (low-income preschool children, 0-5 years of age)
The WIC program collects weight and height data on most participating children. State WIC programs may provide these data to assessors
U.S. Department of Agriculture’s Food Environmental Atlas
Community Supported AgricultureFarm-to-School programsFarmers markets

Copyright © National Academy of Sciences. All rights reserved.
Evaluating Obesity Prevention Efforts: A Plan for Measuring Progress
197Community Obesity Assessment and Surveillance
Data Source Indicator Topic Notes
Youth Risk Behavior Surveillance System (YRBSS)
Adolescent physical activity Consumption of fruit (adolescents)Consumption of vegetables (adolescents)Daily school physical educationObesity (adolescents)Overweight (adolescents)Sugar-sweetened beverage consumption
(adolescents)
Provides self-report data on middle and high school students for a limited number of large school districts
* See Appendix D for further information on these sources. a Indicator to track and monitor differential rates of exposures to social and policy environments.
TABLE 7-1 Continued
counties with data available from SMART BRFSS for a given year will fluctuate because of sample size requirements and because states occasionally face administrative or budgetary requirements to change their sample size and design from one year to another. For low-income preschoolers aged 0-5, BMI data had been available from the Pediatric and Pregnancy Nutrition Surveillance System, but this was dis-continued in 2012. Data for other indicators must be collected through special local efforts—and most counties lack resources to do so.
Table 7-2 shows which of the indicators recommended in the APOP report (IOM, 2012a) for describing and tracking progress in obesity prevention are available for larger and smaller communities to consider for inclusion in a CA or surveillance system. All of the recommended indicators, described in Chapter 4, that are available at the county level are included. In addition, indicators that are available and used in some communities are included, even though the evidence linking them to obesity outcomes is less robust. Green denotes that an indicator is readily available for all communities from online sources, yellow denotes that more effort is required but some communities have capacity to analyze locally avail-able data or existing BRFSS or YRBSS data, and red denotes not available. A “larger” community is oper-ationally defined as one that has either SMART BRFSS or local YRBSS data available.
The Committee encourages the use of available core indicators so that communities can compare and contrast their progress with their peers and relative to benchmarks and so that data can be aggre gated across communities. The Committee also encourages collecting and reporting on indicators that are not part of the core set, including demographics, norms, and attitudes. Table 7-3 provides indicators that may be useful for CAS but currently are not readily available at the local level from available and ongoing data sources that are recommended in Chapter 4 of this report as well as indicators for APOP-recommended strategies that are not readily available (i.e., gaps). As described below, it is possible for communities to obtain or collect data for these indicators by conducting surveys of their own and partnering with others in their community (e.g., academic institutions, hospitals, businesses, organizations). Each community needs to identify priority indicators given its particular needs, resources, and assets.
Data available in certain communities. In addition to these generally available sources, individual jurisdic-tions may collect primary data, depending on local resources and interests, or may have unique data avail-able from other sources for secondary analyses. Such data may be quantitative or qualitative. Although

Copyright © National Academy of Sciences. All rights reserved.
Evaluating Obesity Prevention Efforts: A Plan for Measuring Progress
Evaluating Obesity Prevention Efforts198
TABLE 7-2 List of Indicators Available for Use at the Community Level
Indicator Topica Data Source
Current Availability by Community Sizeb
Larger Smaller
Overarching/System-Level
Obesity-adult BRFSS
Overweight-adult BRFSS
Obesity-adolescent School reports, YRBSS
Overweight-adolescent School reports, YRBSS
Obesity-child School reports
Overweight-child School reports
Obesity-preschool age (low income) WIC
Goal Area 1: Physical Activity Environment
Adult physical activity BRFSS
Adolescent physical activity YRBSS
Joint/shared use of community facilities (school facilities) SHPPS
Adult active transport by walking ACS
Bicycling by adults ACS
Recreational facility outlet density CzCBP
Leisure physical activity-adultc BRFSS
Screen time-adolescentsc YRBSS
Goal Area 2: Food and Beverage Environment
Sugar-sweetened beverage policies in schools (school district) SHPPS
Sugar-sweetened beverage consumption YRBSS (adolescents)
School policies to facilitate access to clean drinking water SHPPS
Consumption of fruit-adult BRFSS (adults)
Consumption of fruit-adolescent YRBSS (adolescents)
Consumption of vegetable-adult BRFSS (adults)
Consumption of vegetable-adolescent YRBSS (adolescents)
Fast food outlet density CzCBP
Healthy food outlet density CzCBP
SNAP and WIC-authorized storesc USDA
Farmers’ markets densityc USDA
Population living in food desertsc USDA
Goal Area 3: Messaging Environment
Goal Area 4: Health Care and Worksite
Goal Area 5: School Environment
Daily school physical education (adolescent participation) YRBSS
Daily school physical education (school requirements) SHPPS
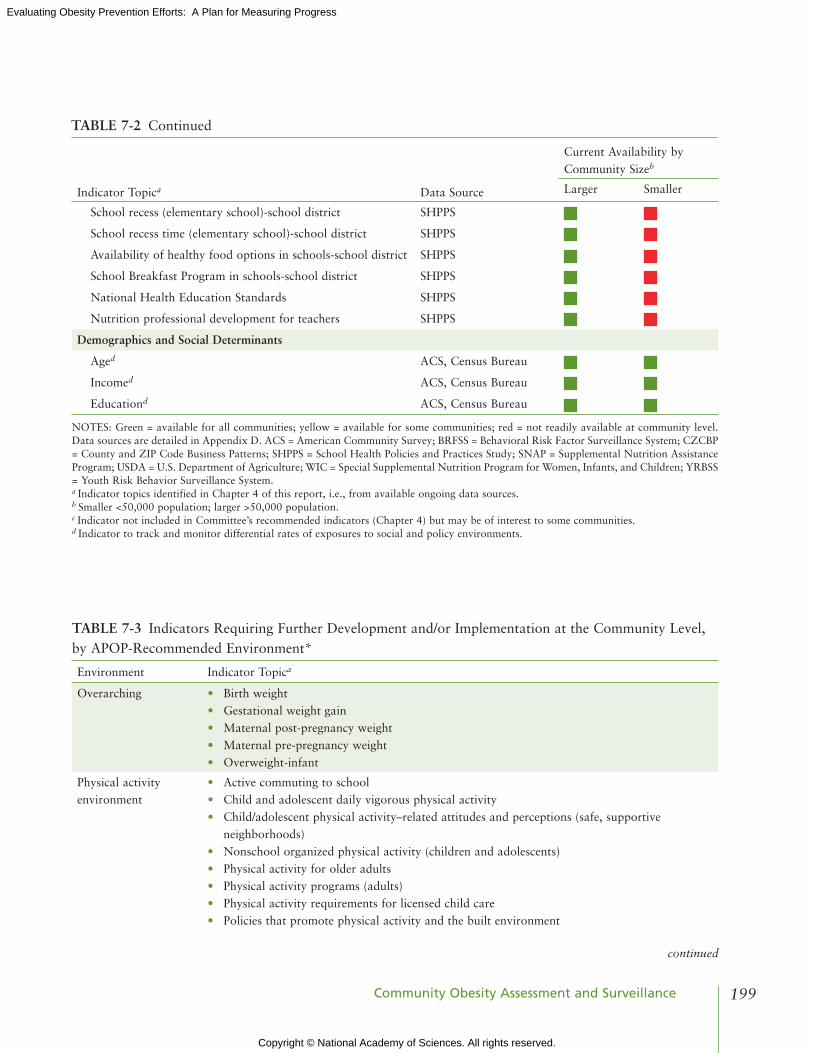
Copyright © National Academy of Sciences. All rights reserved.
Evaluating Obesity Prevention Efforts: A Plan for Measuring Progress
199Community Obesity Assessment and Surveillance
Indicator Topica Data Source
Current Availability by Community Sizeb
Larger Smaller
School recess (elementary school)-school district SHPPS
School recess time (elementary school)-school district SHPPS
Availability of healthy food options in schools-school district SHPPS
School Breakfast Program in schools-school district SHPPS
National Health Education Standards SHPPS
Nutrition professional development for teachers SHPPS
Demographics and Social Determinants
Aged ACS, Census Bureau
Incomed ACS, Census Bureau
Educationd ACS, Census Bureau
NOTES: Green = available for all communities; yellow = available for some communities; red = not readily available at community level. Data sources are detailed in Appendix D. ACS = American Community Survey; BRFSS = Behavioral Risk Factor Surveillance System; CzCBP = County and zIP Code Business Patterns; SHPPS = School Health Policies and Practices Study; SNAP = Supplemental Nutrition Assistance Program; USDA = U.S. Department of Agriculture; WIC = Special Supplemental Nutrition Program for Women, Infants, and Children; YRBSS = Youth Risk Behavior Surveillance System.a Indicator topics identified in Chapter 4 of this report, i.e., from available ongoing data sources. b Smaller <50,000 population; larger >50,000 population.c Indicator not included in Committee’s recommended indicators (Chapter 4) but may be of interest to some communities.d Indicator to track and monitor differential rates of exposures to social and policy environments.
TABLE 7-2 Continued
TABLE 7-3 Indicators Requiring Further Development and/or Implementation at the Community Level, by APOP-Recommended Environment*
Environment Indicator Topica
Overarching • Birth weight• Gestational weight gain• Maternal post-pregnancy weight • Maternal pre-pregnancy weight• Overweight-infant
Physical activity environment
• Active commuting to school• Child and adolescent daily vigorous physical activity• Child/adolescent physical activity–related attitudes and perceptions (safe, supportive
neighborhoods)• Nonschool organized physical activity (children and adolescents)• Physical activity for older adults• Physical activity programs (adults)• Physical activity requirements for licensed child care• Policies that promote physical activity and the built environment
continued

Copyright © National Academy of Sciences. All rights reserved.
Evaluating Obesity Prevention Efforts: A Plan for Measuring Progress
Evaluating Obesity Prevention Efforts200
Environment Indicator Topica
Food and beverage environment
• Children and adolescent caloric intake in restaurants• Consumption of solid fats, added sugars, whole grains• Energy intake-adults, adolescents, and children• Food retail incentive policies • Healthy vending/concession policies in government buildings, worksites, and facilities• Nutrition standards in child care• Policies and practices to increase healthier food and beverages for children in restaurants• Price of low-fat milk• Sugar-sweetened beverage consumption (adults, children)• Sugar-sweetened beverage taxation and other policies and practices to reduce
overconsumption of sugar-sweetened beverages
Message environment • Nutrition education policies for local nutrition programs• Purchase of Dietary Guidelines for Americans (DGA) foods and beverages by Supplemental
Nutrition Assistance Program participants• Purchase of recommended DGA foods
Health care and worksites
• Body mass index measurement by physicians• Breastfeeding disparities• Community-based primary prevention nutrition/physical activity–related services• Employee health promotion programs• Employee participation in exercise programs• Employee participation in health promotion programs• Employer lactation support programs• Exclusive breastfeeding• Hospital breastfeeding policies• Insurance incentives for healthy lifestyles• Nutrition/weight/physical activity counseling by physicians• Obesity screening and prevention metrics• Obesity screening and prevention reimbursement strategies• Obesity screening and promotion strategies offered by health plans
School environment • Child school dietary intake/solid fats and added sugars • College physical education/nutrition education• Farm-to-school programs• Federal school meal standards• Nutrition standards in child care• Quality physical education policies• Schools providing food and beverages meeting the DGA
Other indicators • Norms and attitudes—beliefs about causes of obesity, appropriate obesity prevention strategies, challenges of the community, awareness of community resources, etc.
• Percentage APOP-recommended interventions in place
* Accelerating Progress in Obesity Prevention (APOP) report (IOM, 2012a).a These are indicators identified in Table 4-1 and related to APOP strategies that are also gaps at the community level.
TABLE 7-3 Continued

Copyright © National Academy of Sciences. All rights reserved.
Evaluating Obesity Prevention Efforts: A Plan for Measuring Progress
201Community Obesity Assessment and Surveillance
the Committee was unable to develop a comprehensive census or representative sample of all such data, Table 7-4 provides some possibilities. Box 7-5 illustrates an example of a local health department collect-ing primary data through local surveys.
Identify Sub-Populations and Small Areas
Obesity and its determinants vary across sub-populations and neighborhoods within the larger com-munity. People of color, sexual minorities, and low-income people are affected by health inequities, as dis-cussed in Chapter 5. Low-income neighborhoods and those with concentrations of minorities have higher obesity rates and greater prevalence of factors that increase obesity. Reporting on rates of obesity, obesity-related behaviors, and on their determinants among these sub-populations and neighborhoods in relation to better-off populations and places provides documentation of inequities and motivates interventions to reduce them.
Select data to Be Included About Context, Assets, Interventions, Barriers
Obesity prevention occurs in the context of local conditions—demographics and income inequities assets, interventions, and barriers to implementation of interventions. Many communities describe the local context in other documents or formats besides a CA or a surveillance report. Obesity-focused CAS can refer to these sources or include contextual information in the obesity CAS if it helps to make sense of the findings. As described in Table 7-1, demographic contextual data are available variously at the county, incorporated place, zIP code tabulation area, and school district levels from the American Community Survey and at the census tract level from the Decennial Census. Other contextual data generally accrue in records of various public agencies and their contractors or vendors in individual communities. Additional types and uses to support the inclusion of contextual variables are described in Chapter 5.
COLLECT dATA
The Committee recommends that all communities use the data that are readily available online to conduct basic obesity CAS. Some communities may wish to supplement these data through local ad hoc or periodic data collection.
Obtain Existing data from web-Based Platforms
Several websites offer county-level data and data visualization tools that map and chart data (see Table 7-5). The most extensive is the Community Commons and its sister site CommunityHealthNeedsAssessment.org (Community Commons, 2013a). Together they include a data warehouse, a mapping tool, and a CA development tool. The Commons provides access to thousands of comprehensive and current geographic information system data layers and tables ranging from national to point level. Through “Make a Map,” users can explore all data sets and make dynamic, multi-layer maps at the state, county, city, or neighbor-hood (e.g., zIP code and census tract) levels (Community Commons, 2013b).
Chna.org produces a CA that includes available indicators selected by the user and then produces maps, charts, and tables. CDC provides data at its Diabetes Interactive Atlas website, which allows the user to view data and trends for diagnosed diabetes (new and existing cases), obesity, and leisure-time

Copyright © National Academy of Sciences. All rights reserved.
Evaluating Obesity Prevention Efforts: A Plan for Measuring Progress
Evaluating Obesity Prevention Efforts202
TABLE 7-4 Examples of Data Available in Certain Communities
Data Description
Body mass index (BMI) of school-aged children
Several states have varying policies for mandating the collection and reporting of BMI (or height/weight) data of students in their schools (NASBE, 2013).
Community programs and activities
Community-based programs collect data on their activities. Real-time access to and summary of data already collected through community-based organizations—such as participation in fitness classes and programs, trends in types of food purchased—could be assembled at the local level. Rewards/recognition could be given to participating entities to encourage provision of data.
Employee wellness policies and programs
Local business associations may track the presence and types of employee wellness policies and programs, offering insight into the extent to which employers are encouraging active living and healthy eating at work.
Environmental scans of activities
Communities may undergo environmental scans to identify obesity prevention activities that are being implemented.
Health plan data (BMI and other individual health data)
Some health care providers and local and regional quality improvement collaboratives are reporting BMI data. It may be possible to aggregate BMI and other individual health data across health providers and systems to produce community-level data, although this approach is in its infancy and substantial technical (e.g. aggregation of data across disparate electronic health record [EHR] platforms), political, privacy, and resource issues will need to be overcome before the promise of this approach can be realized. In addition, the validity of EHR data needs to be assessed on a variable by variable basis, and standardized measurement protocols are lacking (Chan et al., 2010; Sheon et al., 2011). Despite these concerns, there is limited evidence that using EHR weight data can accurately describe the weight status of the population and the extent to which providers are measuring it (Arterburn et al., 2009). Data collected by health plans from health risk assessments may become another useful source of self-reported weight and height and obesity-related health behaviors.
Local health department survey and other data
Some local health departments collect primary data through local surveys. They may add additional respondents to state Behavioral Risk Factor Surveillance System samples to allow analysis at the county, city, or neighborhood levels. They may conduct surveys to collect data indicators of local interest. Local health departments may also obtain and analyze local data sources, such as built and food environment, vending machine, and child care audits. For example, the availability of county licensing data has allowed Public Health–Seattle & King County to map food retail sites to assess food availability at the neighborhood level (King County, 2013a). California collects detailed health data with the California Health Interview Survey, which provides data for most individual counties for most of its indicators (data from smaller counties is pooled) (CHIS, 2013). New York City conducted a local version of National Health and Nutrition Examination Survey in 1999 and plans to do a second survey in 2013 (New York City Department of Health and Mental Hygiene, 2013b).
Local planning departments data
Local planning departments may have databases describing parks and green spaces, locations of trails and recreation facilities, presence of sidewalks, locations of supermarkets and other food-related businesses, and other features of the built environment. They produce maps of these features, often in collaboration with local health departments.

Copyright © National Academy of Sciences. All rights reserved.
Evaluating Obesity Prevention Efforts: A Plan for Measuring Progress
203Community Obesity Assessment and Surveillance
BOX 7-5 Public Health–Seattle & King County Supporting Primary Data Collection
Public Health–Seattle & King County supports Communities Count, which provides data on the health and well-being of King County communities, informs funding decisions, engages citizens, and complements King County’s existing health, economic, and environmental indicators. It includes measures of obesity, food access (“deserts”), and physical activity derived from existing data sets and complemented by interviews with county residents. In partnership with the state health department and the University of Washington, Public Health–Seattle & King County is conducting a survey of child care sites to assess implementation of nutrition and physical policies and best practices. In collaboration with the University, it has completed a survey of school obesity-related policies and food environments. It is designing a local policy surveillance system to monitor the adoption and implementation of obesity-related policies at the county and municipal levels.
SOURCE: Communities Count, 2012. Communities Count: Social and Health Indicators Across King County. http://www.communitiescount.org (accessed July 11, 2013).
physical inactivity at national, state, and county levels (CDC, 2013). U.S. Department of Health and Human Services (HHS) offers Community Health Status Indicators for counties, although the latest data are from 2006 (HHS, 2013). USDA hosts the Food Atlas (ERS, 2013), which assembles indicators of three broad categories: the food environment (e.g., food choices including access to and acquisition of healthy, affordable food), health and well-being (e.g., food insecurity, diabetes and obesity rates, and physical activity levels), and community characteristics (e.g., demographics composition, natural ame-nities, recreation and fitness centers). County Health Rankings compiles county-level data (some of it estimated rather than directly measured in the county) from multiple sources and ranks counties within states (County Health Rankings, 2013; Remington and Booske, 2011). The Census County and zIP Code Business Patterns provides counts of food and recreation establishments at the county and zIP code levels (Census Bureau, 2013b). The Census Bureau’s American Community Survey provides detailed demo-graphic, housing, commuting, and economic data (Census Bureau, 2013a).
Additional Locally Collected data
Communities across the nation have added locally collected data to supplement generally available data, contingent on local resources, interests, and skills. As described above, data may be available from public health, planning, health care, and other sectors. A community may choose to add additional sample size to existing surveys such as the BRFSS or field its own survey. Qualitative data from public forums, interviews, focus groups, photovoice, and other emerging methods can add valuable information about local context, environments, and policies and can be useful in sense-making and summary forums.

Copyright © National Academy of Sciences. All rights reserved.
Evaluating Obesity Prevention Efforts: A Plan for Measuring Progress
204
TA
BL
E 7
-5 S
ourc
es o
f D
ata
from
Web
-Bas
ed P
latf
orm
s
Sour
ce(L
ates
t Y
ear)
Ove
rarc
hing
Phys
ical
Act
ivit
y E
nvir
onm
ent
Food
and
Bev
erag
e E
nvir
onm
ent
Dem
o-gr
aphi
csC
omm
ents
Obe
sity
Ove
rwei
ght
Lei
sure
ti
me
Act
ive
tran
spor
t
Rec
reat
iona
l fa
cilit
ies
outl
et
dens
ity
Con
sum
ptio
n of
fru
its
and
vege
tabl
es
Gro
cery
/su
perm
arke
t de
nsit
y
Fast
fo
od
outl
et
dens
ity
Loc
al
food
Am
eric
an
Com
mun
ity
Surv
ey
(201
1)
••
1-, 3
-, o
r 5-
year
es
tim
ates
, de
pend
ing
on
popu
lati
on
size
http
://w
ww
.cen
sus.
gov/
acs
CD
C
Dia
bete
s In
tera
ctiv
e A
tlas
(2
009)
••
Can
com
pare
co
unti
es
acro
ss t
he
Uni
ted
Stat
es, m
aps,
tr
ends
http
://w
ww
.cdc
.gov
/dia
bete
s/at
las/
coun
tyda
ta/a
tlas
.htm
l
Com
mun
ity
Com
mon
sM
aps
http
://w
ww
.com
mun
ityc
omm
ons.
org
Com
mun
ity
Hea
lth
Nee
ds
Ass
essm
ent
(201
0-20
11)
••
••
••
••
Map
s, c
hart
s
http
://w
ww
.chn
a.or
g
Com
mun
ity
Hea
lth
Stat
us
Indi
cato
rs
(200
6)
••
••
•O
ffer
s pe
er
coun
ty
com
pari
sons
http
://w
ww
.com
mun
ityh
ealt
h.hh
s.go
v/ho
mep
age.
aspx
?j=1
Cou
nty
and
zIP
Cod
e B
usin
ess
Patt
erns
(2
011)
•b
•b
•b
http
://w
ww
.cen
sus.
gov/
econ
/cbp
Cou
nty
Hea
lth
Ran
king
s (2
010)
••
••
••
Ran
ks
coun
ties
w
ithi
n st
ates
http
://w
ww
.cou
ntyh
ealt
hran
king
s.or
g
Food
A
tlas
(2
009)
•a
••
•c
••
•M
aps
com
pari
ng
coun
ties
, ta
bles
, tre
nds
http
://w
ww
.ers
.usd
a.go
v/da
ta-p
rodu
cts/
food
-env
iron
men
t-at
las.
aspx
NO
TE
:: W
eb a
ddre
sses
acc
esse
d N
ovem
ber
11, 2
013.
a A
lso
pres
choo
l obe
sity
.b
Cou
nts
of s
tore
s.c A
lso
perc
enta
ge li
ving
wit
hout
nea
rby
stor
e.SO
UR
CE
S: C
DC
, 201
3; C
ensu
s B
urea
u, 2
013a
,b; C
omm
unit
y C
omm
ons,
201
3b,c
; Cou
nty
Hea
lth
Ran
king
s, 2
013;
ER
S, 2
013;
HH
S, 2
013.

Copyright © National Academy of Sciences. All rights reserved.
Evaluating Obesity Prevention Efforts: A Plan for Measuring Progress
205
TA
BL
E 7
-5 S
ourc
es o
f D
ata
from
Web
-Bas
ed P
latf
orm
s
Sour
ce(L
ates
t Y
ear)
Ove
rarc
hing
Phys
ical
Act
ivit
y E
nvir
onm
ent
Food
and
Bev
erag
e E
nvir
onm
ent
Dem
o-gr
aphi
csC
omm
ents
Obe
sity
Ove
rwei
ght
Lei
sure
ti
me
Act
ive
tran
spor
t
Rec
reat
iona
l fa
cilit
ies
outl
et
dens
ity
Con
sum
ptio
n of
fru
its
and
vege
tabl
es
Gro
cery
/su
perm
arke
t de
nsit
y
Fast
fo
od
outl
et
dens
ity
Loc
al
food
Am
eric
an
Com
mun
ity
Surv
ey
(201
1)
••
1-, 3
-, o
r 5-
year
es
tim
ates
, de
pend
ing
on
popu
lati
on
size
http
://w
ww
.cen
sus.
gov/
acs
CD
C
Dia
bete
s In
tera
ctiv
e A
tlas
(2
009)
••
Can
com
pare
co
unti
es
acro
ss t
he
Uni
ted
Stat
es, m
aps,
tr
ends
http
://w
ww
.cdc
.gov
/dia
bete
s/at
las/
coun
tyda
ta/a
tlas
.htm
l
Com
mun
ity
Com
mon
sM
aps
http
://w
ww
.com
mun
ityc
omm
ons.
org
Com
mun
ity
Hea
lth
Nee
ds
Ass
essm
ent
(201
0-20
11)
••
••
••
••
Map
s, c
hart
s
http
://w
ww
.chn
a.or
g
Com
mun
ity
Hea
lth
Stat
us
Indi
cato
rs
(200
6)
••
••
•O
ffer
s pe
er
coun
ty
com
pari
sons
http
://w
ww
.com
mun
ityh
ealt
h.hh
s.go
v/ho
mep
age.
aspx
?j=1
Cou
nty
and
zIP
Cod
e B
usin
ess
Patt
erns
(2
011)
•b
•b
•b
http
://w
ww
.cen
sus.
gov/
econ
/cbp
Cou
nty
Hea
lth
Ran
king
s (2
010)
••
••
••
Ran
ks
coun
ties
w
ithi
n st
ates
http
://w
ww
.cou
ntyh
ealt
hran
king
s.or
g
Food
A
tlas
(2
009)
•a
••
•c
••
•M
aps
com
pari
ng
coun
ties
, ta
bles
, tre
nds
http
://w
ww
.ers
.usd
a.go
v/da
ta-p
rodu
cts/
food
-env
iron
men
t-at
las.
aspx
NO
TE
:: W
eb a
ddre
sses
acc
esse
d N
ovem
ber
11, 2
013.
a A
lso
pres
choo
l obe
sity
.b
Cou
nts
of s
tore
s.c A
lso
perc
enta
ge li
ving
wit
hout
nea
rby
stor
e.SO
UR
CE
S: C
DC
, 201
3; C
ensu
s B
urea
u, 2
013a
,b; C
omm
unit
y C
omm
ons,
201
3b,c
; Cou
nty
Hea
lth
Ran
king
s, 2
013;
ER
S, 2
013;
HH
S, 2
013.

Copyright © National Academy of Sciences. All rights reserved.
Evaluating Obesity Prevention Efforts: A Plan for Measuring Progress
Evaluating Obesity Prevention Efforts206
Asset Mapping
The aim of asset mapping is to collect information on community assets (e.g., capabilities and ser-vice offerings of key individuals, organizations, and agencies; environmental conditions and policies that affect obesity; community resources such as parks and recreation centers) to better understand and enhance resources that can contribute to obesity prevention. Assets can be identified through interviews with key informants from relevant sectors of the community and from review of reports, service directories, maps, and websites. They have particular value in overcoming the sense of discouragement associated with the history of mapping only the deficits of some communities, such as minority communities (DyckFehderau et al., 2013). Some of the same Web-based platforms (e.g., Community Commons, Community Health Needs Assessment) can be helpful resources for mapping community assets (see Table 7-5).
Department of Motor Vehicles Data
The Oregon Health Authority has explored the usefulness of using BMI data calculated from height and weight information on state-issued driver licenses and identification cards (Morris et al., 2012). Although such data tend systematically to underestimate weight in women, overestimate height in men, and underestimate BMI relative to BRFSS estimates, they should prove useful for describing temporal trends and small area spatial patterns. Driver licenses data would be useful only for first-time applicants because height and weight status may not be changed during renewal processes. Thirty-nine states collect height and weight data for licenses and identification cards (Morris et al., 2012).
Crowd-Sourcing
Citizen scientists4 have used crowd-sourcing5 models to collect scientific data. Projects such as HealthMap,6 Asthmapolis,7 FluNearYou,8 Galaxy zoo,9 Foldit,10 Lucien Engelen’s Crowdsource your health,11 and CureTogether,12 provide promising examples of how to collect and analyze large quantities of meaningful data. For example, HealthMap collects informal online data sources for disease outbreak monitoring and real-time surveillance of emerging public health threats, including citizen-generated data from mobile devices. Methods used by crowd-sourcing include monitoring online conversations and post-ings, recruiting people to document their communities with smartphone cameras, and engaging people in wiki-based research projects and virtual focus groups.
A study at Washington University explored the use of crowd-sourcing to capture behavioral physical activity changes as a result of policy and built environment changes (Hipp et al., 2013). Although limited in its current application to obesity prevention interventions, crowd-sourcing may offer a useful approach
4 Citizen scientists participate in the systematic data collection and analysis; technology development; natural phenomena testing; and dis-semination of activities on an advocational basis (Open Scientist, 2011).
5 Crowd-sourcing is the practice of obtaining needed services, ideas, or content by soliciting contributions from a large group of people, typically through the Internet.
6 See http://healthmap.org/about (accessed November 11, 2013).7 See http://properhealth.com (accessed November 11, 2013).8 See http://www.flunearyou.org (accessed November 11, 2013).9 See http://www.galaxyzoo.org (accessed November 11, 2013).10 See http://fold.it/portal (accessed November 11, 2013).11 See http://www.ted.com/talks/lucien_engelen_crowdsource_your_health.html (accessed November 11, 2013).12 See http://curetogether.com (accessed November 11, 2013).

Copyright © National Academy of Sciences. All rights reserved.
Evaluating Obesity Prevention Efforts: A Plan for Measuring Progress
207Community Obesity Assessment and Surveillance
to data collection when data are not available from current sources. Addressing issues of validity, reliability, and representativeness will be essential before this approach can be recommended for routine use.
Qualitative Information
Local assessments can also incorporate qualitative information (Denzin and Lincoln, 2011). The combination of qualitative and quantitative data in a mixed-methods approach can produce a more com-plete picture of community health (Creswell et al., 2011; Johnson et al., 2007).
Qualitative data can enhance CAS by capturing information that is difficult to obtain through quan-titative methods such as community assets for obesity prevention, attitudes and beliefs, and leadership and social and political capital to create change (Work Group for Community Health and Development and University of Kansas, 2013b). They can provide information about subgroups and areas too small to describe with quantitative sources by asking community members and community-based organiza-tions about health issues affecting their communities. The process of collecting qualitative data can be a powerful tool for engaging stakeholders and community members in the CAS process. For example, the King County Food and Fitness Initiative used qualitative methods to identify specific and local conditions contributing to obesity, community assets and barriers for promoting healthy eating and active living, and culturally appropriate interventions in two King County neighborhoods, particularly among immigrant and refugee populations (University of Washington Department of Urban Design and Planning, 2008). In another example, an evaluation of Healthy Tomorrows for New Britain Teens used photovoice, a qualita-tive method, to capture in pictures community barriers and facilitators for physical activity, and to ask what made for stress and happiness in their community (Hannay et al., 2013). Although quantitative data from surveys such as the BRFSS and the YRBSS can show prevalence and trends for selected indicators, they are often inadequate for explaining the meaning of observed patterns and understanding the local factors driving the indicators; for instance, how improvements/worsening was associated with changes in resources, leadership, or opposition. Qualitative data can fill this gap and give local decision makers use-ful information for prioritizing among strategies and local program developers’ insight into how best to implement a strategy in their community.
Simple qualitative data collection methods can be substantially less costly than quantitative methods and thus may be a more feasible approach for low-resource communities. These kinds of data can provide an actionable description of community obesity issues.
Limitations of qualitative data have been well described (Baum, 1995; Jick, 1979; Tashakkori and Teddlie, 1998). Qualitative data may not be representative of the population of interest unless appropriate sampling and analytic techniques are used (Brownson et al., 1997). Data can be sensitive to evaluator bias because of the high level of interaction between data collector and data source (Patton, 1987).
Create an Inventory of Local Interventions
A description of local interventions that address obesity can help communities to better understand how changes in the environment (programs, policies, built environment) are unfolding. It can also enable them to see gaps in current activities, better allocate resources, and envision opportunities for coordi-nation and system building. To construct an inventory, community and evaluation partners often use: (a) document review (e.g., of reports, meeting minutes, websites) and (b) interviews with key informants who are knowledgeable about change efforts in their sectors or organizations (e.g., schools, public health,

Copyright © National Academy of Sciences. All rights reserved.
Evaluating Obesity Prevention Efforts: A Plan for Measuring Progress
Evaluating Obesity Prevention Efforts208
parks and recreation, community health foundations and councils). When these data are gathered system-atically and characterized by important dimensions (e.g., change strategy, reach, duration), they can be displayed in graphic form to support sense-making and visualization of collective impact (Collie-Akers et al., 2007; Fawcett and Schultz, 2008).
ANALYzE ANd INTERPRET ThE dATA
Once data are collected, those conducting assessments and surveillance should consider several ana-lytic approaches to maximize their impact. These include
• using estimation methods based on state and/or national data when local data are not available;• displaying trends over time;• presenting data separately for children (including stratification by preschool, elementary school,
middle school, and high school, when possible) and adults;• describing health inequities through analysis of variation in indicators across race/ethnic and
income groups and across small areas (small areas analysis) as appropriate;• including comparison to benchmarks such as Healthy People 2020 (HHS, 2010) or state health
goals, and to rates in state and peer communities;• comparing extent of existing policies and programs described by the assessment with those rec-
ommended in the APOP report (IOM, 2012a);• sharing data with community members and other stakeholders for interpretation (i.e., systematic
reflection on what is seen, its meaning, and implications for action) to identify gaps in local obe-sity prevention activities and suggest actions; and
• visualizing the data with effective charts, maps, and infographics.
Because methods for the analysis of CAS data are well described (NACCHO, 2013; Teutsch and Churchill, 2000), the Committee limits the rest of this discussion to key issues and emerging methods for interpreting and analyzing the data that are collected.
Quantitative Methods
Basic quantitative methods are well described and widely used (NACCHO, 2013; Teutsch and Churchill, 2000) More sophisticated CAS adds small-area analysis, statistical methods to assess the sig-nificance of across-strata differences and time trends, and comparison to peer communities and/or bench-marks. More advanced methods, although not widely used, include use of Bayesian hierarchical modeling, space-time clustering, time series analysis, and geospatial analysis (Brookmeyer and Stroup, 2004; Choi, 2012; Lee et al., 2010; Rao, 2003).
Small-Area Analysis
Small-area analytic methods can provide estimates of indicators for entire communities with small populations and for subdivisions of larger jurisdictions, such as places with disproportionate or unmet health needs (e.g., at the sub-county, neighborhood, zIP code, or census tract levels) (see Jia et al., 2004; Riva et al., 2007; Srebotnjak et al., 2010). Small-area analysis includes mapping the prevalence of obesity

Copyright © National Academy of Sciences. All rights reserved.
Evaluating Obesity Prevention Efforts: A Plan for Measuring Progress
209Community Obesity Assessment and Surveillance
and its determinants by zIP code or neighborhood to help to identify specific groups and places experi-encing health disparities and differential exposure to determinants of obesity such as density of fast food retailers or location of parks and trails. Small areas may include towns or urban neighborhoods of con-centrated poverty. Often, data are not readily available at the small-area level. Until the density of data collection is improved, it is necessary to use alternative approaches including quantitative methods such as pooling data across multiple years, or using synthetic, Bayesian and microsimulation multi-level esti-mation methods and qualitative methods. For application of small-area analysis to obesity, see Li et al. (2009) and zhang et al. (2013).
Synthetic Estimation
Synthetic estimation uses national- and state-level data to provide local-level estimates of health service utilization, expenditures, health insurance, household income, and health behaviors (AHRQ, 2013; Census Bureau, 2013c; NCI, 2013). Synthetic estimates use demographic data at the county level, often from the American Community Survey (Census Bureau, 2013a), to directly adjust data available at higher geographic levels so that they reflect county-level or sub-county-level population composition. For example, estimates can be constructed from the National Survey of Children’s Health to obtain county-level prevalence data for childhood overweight and obesity and related variables such as physical activity of child and parents/family (Data Resource Center for Child and Adolescent Health, 2011).
Bayesian Estimation
This method is based on generating indirect model-dependent estimates using a statistical multi-level model that “borrows strength” in making an estimate for one small area from data collected in other nearby areas (Malec et al., 1997; Rao, 2003). Bayesian multi-level modeling techniques, a type of synthet-ic estimate, have been widely used to obtain local approximations based on state or national data adjust-ed for the local demographic correlates of the desired statistic. For example, CDC’s National Diabetes Interactive Atlas (CDC, 2013) provides county-level estimates of obesity, physical inactivity, and diabetes using data from the BRFSS and the Census Bureau’s Population Estimates Program (see Table 7-4) to model estimates.
Qualitative and Mixed Methods
A variety of methods are used in qualitative assessment. The more common methods include collect-ing data through individual and group interviews, field observations, focus groups, community meetings, open-ended survey questions, document reviews, pictures and videos (e.g., photovoice and digital story-telling), and case studies (or detailed examinations of individual cases). Rapid assessment methods, initial-ly developed for use in low-resource developing countries without established quantitative public health surveillance systems, have been adapted for use in communities across the United States (Beebe, 2001; Kumar, 1993; Scrimshaw and Gleason, 1992). These methods can produce powerful stories that influence policy development and resource procurement. Applying qualitative methods to evaluate and monitor policy and environmental approaches at a population level has been underutilized in obesity prevention research. However, researchers have offered guidance in its application to environmental and policy inter-ventions (case studies: Mitchell and Bernauer, 1998; surveys: Brownson et al., 2000; general use: Beierle,

Copyright © National Academy of Sciences. All rights reserved.
Evaluating Obesity Prevention Efforts: A Plan for Measuring Progress
Evaluating Obesity Prevention Efforts210
1999; Sofaer, 1999; photovoice: Strack et al., 2010). All qualitative methods offer strengths (e.g., insights into context of population of interest, inexpensive) and have limitations (e.g., complexity of analysis, reli-ability, training, credibility to stakeholders (Issel, 2009; Patton, 1987).
Community assessments often rely on mixed methods—the combination of quantitative and quali-tative approaches. As an example, a CA in Douglas County (Kansas) conducted by a partnership among the local health department, community hospital, United Way, and community foundation used a mixed methods approach to help to set priorities for its community health improvement plan (see Table 7-6) (Collie-Akers and Holt, 2012). The evaluators examined data from quantitative sources (e.g., BRFSS data) and qualitative/mixed methods sources (e.g., concerns survey, focus groups) for convergence on priority issues such as lack of access to affordable healthy foods and poverty.
describing health Inequities and determinants of health
As described in Chapter 5, a health inequity is difference or disparity in health outcomes or dis-tribution of health determinants exposures that is systematic, avoidable, and unjust (Braveman, 2003; Kawachi, 2002). Thinking about differential exposures, vulnerabilities, and health consequences is a use-ful starting point. Describing health inequities requires compiling data for the populations or neighbor-hoods that are affected and then displaying the data to compellingly show the inequities.
Box 7-6 offers guidance that has been developed for ensuring that equity is incorporated into CAS design. Demographic and economic data are readily available from the American Community Survey. Maps at the county, zIP code, and census tracts levels of some of these data are available from several visualization tool websites (see Table 7-5). Data on environments, behaviors, and obesity are harder to come by, given the limitations of routinely collected data. If quantitative data for the group of interest are not available, then options include collecting supplemental quantitative data (e.g., oversampling in surveys) or using qualitative methods (e.g., community listening sessions, key informant interviews). It may be helpful to develop a health equity value orientation in the CAS process by building awareness and understanding of social determinants of health and upstream (e.g., policy) approaches to health improve-ment, discussing goals of fairness within the health system and environment and its contribution to health (dis)advantage, health gaps, and social gradients of health outcomes (e.g., related to income inequality). Examples of how communities are assessing health disparities are illustrated in Box 7-7.
Placing Local data in Context
Placing data in a comparative context helps users to understand whether a given indicator is a cause for concern and can motivate a community to take action if indicators are worse relative to its peers. Methods include comparisons to benchmarks and to peer communities. National benchmarks for obesity prevention are included in Healthy People 2020 (HHS, 2010), and many state health departments pro-duce state obesity goals.13 Peer comparisons are available for counties at the County Health Indicators
13 National and state goals can be adjusted for local use using simple methods such as applying the fractional change of these benchmarks to local baseline data. For example, the Healthy People 2020 goal for adult obesity is based on a 10 percent improvement from a 2005-2008 baseline. A local community could apply the same improvement target to its baseline data. A more sophisticated approach could incorporate adjustment for age, gender, race/ethnicity, and income differences between the national and community populations.

Copyright © National Academy of Sciences. All rights reserved.
Evaluating Obesity Prevention Efforts: A Plan for Measuring Progress
211Community Obesity Assessment and Surveillance
BOX 7-6 How to Build Health Equity into Your Assessment/Surveillance
1. Understand the health equity issues in the project area
• Identify inequities in health outcomes
• Understand the underlying determinants and socioeconomic issues that lead to inequity (e.g., dif-ferential exposures, vulnerabilities, and consequences for marginalized groups)
2. Identify the disadvantaged group(s) on which to focus
• Review secondary data that have been disaggregated by different groups traditionally experiencing disparities (e.g., specific racial/ethnic, geographic, age, gender, religion, or wealth)
• Conduct quantitative or qualitative studies that look at differences between groups
• Work with community members and leaders to identify the most disadvantaged groups, and work within the locally accepted definition of disadvantaged groups
• Consider the cost of reaching/engaging a particular disadvantaged group compared to reaching another group that also needs attention
3. Decide what changes in conditions are important and feasible to change
4. Define goals and objectives for promoting health equity
5. Determine equity strategies and activities (e.g., modifying policies and programs to address differential exposures, vulnerabilities, and consequences)
6. Develop an equity-focused monitoring and evaluation system to assess progress in changing conditions and achieving health equity*
* Methodologies for measuring equity are addressed in detail in the source.
SOURCE: Adapted from USAID and MCHIP, 2011.
website (HHS, 2013) and for large metropolitan jurisdictions at SMART BRFSS (CDC, 2011). They can also be generated at Community Commons (Community Commons, 2013b).
Visualizing data
Accurate data are essential for high-quality CAS. However, unless the data are readily understood and available in a timely manner, they will not effectively accelerate progress in obesity prevention. Visualization of data so that their meaning is easily understood is another key component of CAS (Tufte, 1997). The ability to create compelling graphics, including charts and maps, has increased dramatically

Copyright © National Academy of Sciences. All rights reserved.
Evaluating Obesity Prevention Efforts: A Plan for Measuring Progress
Evaluating Obesity Prevention Efforts212
TABLE 7-6 Community Health Issues Identified Using a Mix of Community Assessment Methods (Douglas County, Kansas, 2012)
Community Health IssueConcern Survey
Focus Group Interviews
Health Status Report Photovoice
Lack of access to affordable healthy foods • • • • •Limited access to dental services • • • •Insufficient access to health care and other services • • • •Poverty/too few job opportunities • • • •Limited access to safe,* affordable housing • • • •Frequent abuse of alcohol (including binge drinking and drinking and driving) • • • •Lack of access to health insurance coverage • • • •Disparities in health outcomes and quality of life • • •Inadequate recognition of mental health issues and access to mental health services • • •Limited knowledge of available health and other services • • •Lack of physical activity • • •Inadequate transportation linking people to services, jobs, and recreation • •Prevalence of abuse and intimate partner violence • •
* Safe housing includes absence of environmental toxins, including mold and lead.SOURCE: Collie-Akers and Holt, 2012.
with the widespread availability of software applications and user-friendly websites for data visualiza-tion. For example, www.healthydane.org provides an interactive website to view the health status of Dane County, Wisconsin. It is available for use by the entire community. Mapping, facilitated by the increasing availability of geocoded data and sophisticated software, has emerged as a powerful tool for displaying geographic variability of indicators and time trends in geographic patterning.14 Storytelling can bring data to life and create a compelling case for action (Work Group for Community Health and Development and University of Kansas, 2013a). Collecting stories in a story bank so that relevant ones can be accessed in a timely fashion facilitates their use.
14 For examples, see http:// childhealthdata.org/browse/rankings; http://www.cdc.gov/obesity/data/adult.html; http://www. community commons.org; http://www.countyhealthrankings.org (accessed November 11, 2013).

Copyright © National Academy of Sciences. All rights reserved.
Evaluating Obesity Prevention Efforts: A Plan for Measuring Progress
213Community Obesity Assessment and Surveillance
dISSEMINATE FINdINGS
Community measures of obesity and its determinants are useful to the extent to which they are used to increase awareness of the issue, implement or improve interventions, and track progress (or lack thereof). Therefore, dissemination of findings to end users is an essential component of the assessment and surveillance process. Most commonly, findings are assembled into a report that is posted on a website or distributed to interested parties. Summarizing key findings in an infographic can help users to quickly understand the key messages. A few larger health departments have interactive data analysis or visualiza-tion tools on their websites to allow end users to customize their information (Communities Count, 2013; Los Angeles County, 2013; New York City Department of Health and Mental Hygiene, 2013a). Briefings of decision makers and policy makers can increase the likelihood that findings will shape policies, budgets, and programmatic decisions, especially if efforts are made to engage them in interpreting and making sense of the data. Using media advocacy methods to earn media coverage allows the findings to reach a larger audience (APHA, 2000; Wallack et al., 1999). Social media channels can augment coverage and reach more diverse audiences. Hosting community meetings to discuss and make sense of the data can engage residents in devising and implementing interventions and can build support for obesity prevention.
BOX 7-7 Assessing Health Inequities and Disparities
Contra Costa Health Services uses small-area analysis to identify health disparities within the Contra Costa county in California. With this information Contra Costa created a 5-year plan to reduce health and health care disparities. This includes efforts to improve its service delivery system to address health dispari-ties (e.g., through culturally and linguistically appropriate services) and efforts to partner with local commu-nity and public agencies (e.g., education, housing, transportation, community development, land use plan-ning) to address physical and social environmental factors that underlie health inequities. Website: http://cchealth.org (accessed November 12, 2013).
Alameda County Public Health Department in California is addressing the social conditions that lead to poor health through participation in the Joint Center for Political and Economic Studies, Health Policy Institute National Place Matters Initiative. Alameda County closely tracks inequities in health and uses data on social determinants of health to inform community health improvement efforts. Public health officials in Alameda County use compelling data to raise awareness about inequities and the importance of addressing conditions for health at a fundamental level, and they underscore the need for capacity-building to address these systemic issues. Website: http://www.acphd.org (accessed November 12, 2013).

Copyright © National Academy of Sciences. All rights reserved.
Evaluating Obesity Prevention Efforts: A Plan for Measuring Progress
Evaluating Obesity Prevention Efforts214
CURRENT PRACTICE IN COMMUNITY ASSESSMENT ANd SURVEILLANCE
This chapter concludes with an overview of what communities across the United States are doing with respect to obesity-focused CAS. To locate CAS examples, the Committee consulted with experts and organizations that provide technical assistance for conducting CAS and used Internet search engines to identify and review existing CAS. Table 7-7 identifies indicators reported in the sample of CAS reports the Committee was able to identify and does not represent the wide-ranging set of obesity-related indicators measured in CAS across the country. The table aims to illustrate indicators that are reported from CAS in more than one community. Each community reported a number of other obesity-related indicators in its CAS, such as overweight low-income infants and children, use of outdoor recreational areas, safety of cyclists, adults who have been advised by a health care professional to lose weight, and gaining insight into the community’s obesity-related norms and attitudes, such as the accessibility to affordable healthy foods and effectiveness of the health care system (see Appendix G).
SUMMARY
Community assessments are intended to assess the current status, and surveillance systems are intended to assess progress overall in a community. They involve the collection of data at a point in time and over time at the community level for the purpose of describing current health status and determinants of health at points in time and over time. Specific to obesity, these data can describe the current state of obesity-related intended impacts and outcomes (see Figure 3-1) as well as contextual factors that influence obesity (e.g., demographics, social determinants).
Although the chapter identifies several resources available to aid communities across the country, there is no consensus guidance for what indicators to measure or what methodologies to use when con-ducting obesity-focused CAS. Based on a review of the current infrastructure for conducting obesity-focused CAS, the Committee found
• a lack of data available at the local level for indicators relevant to measuring progress of APOP
strategies (IOM, 2012a). Especially needed are data for preschoolers and elementary school students and systematic descriptions of determinants of obesity (e.g., environments, policies, other interventions, norms, and attitudes). Additional sources of data at the local level may exist in multiple sectors, such as health care, planning, and schools; and
• a need to increase sample size of existing surveillance systems, add data on missing indicators, and develop new systems for policy, environmental, and intervention indicators, and for report-ing data by race and socioeconomic status to the extent possible and by small areas affected by inequity in larger communities.
Other important findings include the following:
• There is a lack of a common set of indicators to allow cross-community comparisons and aggregation;
• Engaging stakeholders/community in assessment process is valuable;• Capacity to develop assessments varies widely across communities; and

Copyright © National Academy of Sciences. All rights reserved.
Evaluating Obesity Prevention Efforts: A Plan for Measuring Progress
215
TA
BL
E 7
-7 E
xam
ples
of
Indi
cato
rs R
epor
ted
in B
road
er C
omm
unit
y H
ealt
h A
sses
smen
t R
epor
ts
Indi
cato
r To
pic
Smal
l Cou
ntie
s (<
50,0
00 r
esid
ents
)L
arge
Cou
ntie
s (>
50,0
00 r
esid
ents
)
Che
roke
e C
ount
y,
NC
a
Hill
C
ount
y,
MT
b L
inco
ln,
MA
c
McK
ean
Cou
nty,
PA
d
Con
tra
Cos
ta
Cou
nty,
C
Ae
Dut
ches
s C
ount
y,
NY
f
Law
renc
e-D
ougl
as
Cou
nty,
K
Sg
Lee
Cou
nty,
N
Ch
Ove
rarc
hing
Obe
sity
(ad
ult)
••
••
•O
verw
eigh
t (a
dult
)•
•O
verw
eigh
t/ob
ese
(adu
lt)
•O
besi
ty (
child
)•
Ove
rwei
ght
(chi
ld)
•O
verw
eigh
t/ob
ese
(chi
ld)
••
Goa
l Are
a 1:
Phy
sica
l Act
ivit
y E
nvir
onm
enti
Adu
lts
leis
ure
tim
e ph
ysic
al a
ctiv
ity
••
•A
dult
phy
sica
l act
ivit
y •
•G
oal A
rea
2: F
ood
and
Bev
erag
e E
nvir
onm
enti
Adu
lts
cons
umpt
ion
of f
ruit
s an
d ve
geta
bles
•
•
•
A
cces
s to
aff
orda
ble
heal
thy
food
s•
•G
oal A
rea
3: M
essa
ge E
nvir
onm
enti
Goa
l Are
a 4:
Hea
lth
Car
e an
d W
orks
ite
Env
iron
men
ti
Goa
l Are
a 5:
Sch
ool E
nvir
onm
enti
Oth
er: N
orm
s/A
ttit
udes
, obe
sity
-rel
ated
Perc
eive
d pr
iori
ties
/ass
ets/
issu
es/n
eeds
of
the
com
mun
ity
(obe
sity
-rel
ated
)•
••
••
••
SOU
RC
ES:
a C
ount
y of
Che
roke
e (2
008)
; b L
arso
n (2
013)
; c C
omm
unit
y O
ppor
tuni
ties
Gro
up, I
nc. (
2010
); d
Cen
ter
for
Rur
al H
ealt
h Pr
acti
ce a
nd U
nive
rsit
y of
Pit
tsbu
rgh
at B
radf
ord
(200
5);
e C
ontr
a C
osta
Hea
lth
Serv
ices
Pub
lic H
ealt
h D
ivis
ion
(201
0);
f C
ente
r fo
r G
over
nmen
tal
Res
earc
h (2
009a
,b);
g C
ollie
-Ake
rs a
nd H
olt
(201
2);
h L
ee C
ount
y Pu
blic
Hea
lth
Ass
essm
ent
Team
and
Lee
CA
N (
2010
).i T
hese
are
goa
l are
as id
enti
fied
in t
he A
ccel
erat
ing
Pro
gres
s in
Obe
sity
Pre
vent
ion
repo
rt (
IOM
, 201
2a).

Copyright © National Academy of Sciences. All rights reserved.
Evaluating Obesity Prevention Efforts: A Plan for Measuring Progress
Evaluating Obesity Prevention Efforts216
• Improving the accessibility and dissemination of assessment data through multiple channels will improve their use for decision makers, media, and the public.
The Community Obesity Assessment and Surveillance Plan (see Box 7-1) provides guidance for local communities to identify and use a set of common indicators that measure impacts and outcomes of strategies recommended in the APOP report (IOM, 2012a). It also provides guidance for developing local capacity for these assessments, including common use and understanding of assessment protocols, descrip-tions of health disparities, community engagement, oversight, and public reporting on progress. The plan was developed not only to accommodate communities with varying resources and assets (i.e., large and small communities), but also to provide a common set of indicators that can be measured, compared, and aggregated across multiple jurisdictions. Given the existing gaps in the current infrastructure for CAS of APOP strategies identified by the Committee, Chapter 10 provides seven recommendations (and a set of potential actions and actors) to support the successful implementation of the components of the Community Obesity Assessment and Surveillance Plan.
REFERENCES
AHRQ (Agency for Healthcare Research and Quality). 2013. Medical expenditure panel survey: State-level medical
expenditures. http://meps.ahrq.gov/data_stats/quick_tables_results.jsp?component=1&subcomponent=0&year=
2010&tableSeries=8&searchText=&searchMethod=1&Action=Search (accessed March 20, 2013).
APHA (American Public Health Association). 2000. APHA media advocacy manual. Washington, DC: APHA.
Arterburn, D. E., G. L. Alexander, J. Calvi, L. A. Coleman, M. W. Gillman, R. Novotny, V. P. Quinn, M. Rukstalis,
V. J. Stevens, E. M. Taveras, and N. E. Sherwood. 2009. Body mass index measurement and obesity prevalence
in ten U.S. health plans. Clinical Medical Research 8(3/4):126-130.
Baum, F. 1995. Researching public health: Behind the qualitative-quantitative methodological debate. Social Science
and Medicine 40(4):459-468.
Beebe, J. 2001. Rapid assessment process: An introduction. Walnut Creek, CA: Altamira Press.
Beierle, T. C. 1999. Using social goals to evaluate public participation in environmental decisions. Policy Studies
Review 16(3/4):75-103.
Braveman, P. A. 2003. Monitoring equity in health and healthcare: A conceptual framework. Journal of Health
Population Nutrition 21(3):181-192.
Brookmeyer, R., and D. F. Stroup. 2004. Monitoring the health of populations: Statistical principles and methods for
public health surveillance. New York: Oxford University Press.
Brownson, R. C., C. J. Newschaffer, and F. Ali-Abarghoui. 1997. Policy research for disease prevention: Challenges
and practical recommendations. American Journal of Public Health 87(5):735-739.
Brownson, R. C., R. A. Housemann, D. R. Brown, J. Jackson-Thompson, A. C. King, B. R. Malone, and J. F. Sallis.
2000. Promoting physical activity in rural communities: Walking trail access, use, and effects. American
Journal of Preventive Medicine 18(3):235-241.
CDC (Centers for Disease Control and Prevention). 2010. 10 essential public health services. http://www.cdc.gov/
nphpsp/essentialservices.html (accessed March 20, 2013).
CDC. 2011. SMART: BRFSS city and county data. http://www.cdc.gov/brfss/smart/technical_infodata.htm (accessed
July 12, 2013).
CDC. 2013. Diabetes public health resource. Diabetes interactive atlas. http://www.cdc.gov/diabetes/atlas (accessed
May 30, 2013).

Copyright © National Academy of Sciences. All rights reserved.
Evaluating Obesity Prevention Efforts: A Plan for Measuring Progress
217Community Obesity Assessment and Surveillance
Census Bureau. 2013a. American community survey. http://www.census.gov/acs/www (accessed July 11, 2013).
Census Bureau. 2013b. County business patterns (CBP) and zip code business patterns (ZBP). http://www.census.
gov/econ/cbp (accessed July 11, 2013).
Census Bureau. 2013c. Model-based small area income & poverty estimates (SAIPE) for school districts, counties,
and states. http://www.census.gov/did/www/saipe (accessed March 20, 2013).
Center for Governmental Research. 2009a. Appendix B—survey script. http://www.co.dutchess.ny.us/CountyGov/
Departments/Health/Publications/HDICASurveyAppB.pdf (accessed April 24, 2013).
Center for Governmental Research. 2009b. Dutchess County ICA community health survey final report. http://www.
co.dutchess.ny.us/CountyGov/Departments/Health/Publications/HDICASurvey.pdf (accessed April 24, 2013).
Center for Rural Health Practice and University of Pittsburgh at Bradford. 2005. Community health needs assess-
ment. Mckean County, Pennsylvania. http://www.upb.pitt.edu/uploadedFiles/About/Sponsored_Programs/
Center_for_Rural_Health_Practice/CHA%20Final.pdf (accessed April 22, 2013).
Chan, K. S., J. B. Fowles, and J. P. Weiner. 2010. Electronic health records and the reliability and validity of quality
measures: A review of the literature. Medical Care Research and Review 67(5):503-527.
CHIS (California Health Interview Survey). 2013. California health interview survey. http://healthpolicy.ucla.edu/
chis/Pages/default.aspx (accessed July 11, 2013).
Choi, B. C. K. 2012. The past, present, and future of public health surveillance. Scientifica (2012).
Cibula, D. A., L. F. Novick, C. B. Morrow, and S. M. Sutphen. 2003. Community health assessment. American
Journal of Preventive Medicine 24(4 Suppl):118-123.
Collie-Akers, V., and C. Holt. 2012. Douglas County community health assessment report. Community Health
Improvement Partnership, Lawrence-Douglas County Health Department, Work Group for Community
Health and Development.
Collie-Akers, V., S. B. Fawcett, J. A. Schultz, V. Carson, J. Cyprus, and J. E. Pierle. 2007. Analyzing a community-
based coalition’s efforts to reduce health disparities and the risk for chronic disease in Kansas City, Missouri.
Preventing Chronic Disease 4(3):A66.
Communities Count. 2013. New! Interact with adult obesity data. http://www.communitiescount.org/index.
php?page=interactive-15-demographic-breakdowns (accessed April 22, 2013).
Community Commons. 2013a. About. Community commons. http://www.communitycommons.org/about (accessed
May 30, 2013).
Community Commons. 2013b. Community commons. Together for the common good. http://www.
communitycommons.org (accessed April 4, 2013).
Community Commons. 2013c. Community health needs assessment (CHNA). http://assessment. communitycommons.
org/CHNA (accessed July 11, 2013).
Community Opportunities Group, Inc. 2010. Town of Lincoln community health assessment & planning project.
http://www.lincolntown.org/Adobe%20Acrobat%20Files/Healthy%20Community/Lincoln%20Healthy%20
Communities%20Final%20Report%20071210.pdf (accessed April 22, 2013).
Contra Costa Health Services Public Health Division. 2010. Community health indicators for Contra Costa County.
http://cchealth.org/health-data/hospital-council/2010/pdf/2010_community_health_indicators_report_complete.
pdf (accessed April 22, 2013).
County Health Rankings. 2013. County health rankings & roadmaps: A healthier nation, county by county. http://
www.countyhealthrankings.org (accessed July 12, 2013).
County of Cherokee. 2008. Cherokee County community health assessment (CHA). http://www.mahec.net/media/
nccha/cherokee.pdf (accessed April 22, 2013).

Copyright © National Academy of Sciences. All rights reserved.
Evaluating Obesity Prevention Efforts: A Plan for Measuring Progress
Evaluating Obesity Prevention Efforts218
Creswell, J. W., A. C. Klassen, V. L. Plano Clark, and K. C. Smith. 2011. Best practices for mixed methods research
in the health sciences. Bethesda, MD: Office of Behavioral and Social Sciences Research, National Institutes of
Health.
Data Resource Center for Child and Adolescent Health. 2011. Local uses of state data and how to construct a syn-
thetic estimate. Portland, OR: Oregon Health and Sciences University.
Denzin, N. K., and Y. S. Lincoln. 2011. The Sage handbook of qualitative research. 4th ed. Los Angeles, CA: Sage
Publications.
DyckFehderau, D., N. L. Holt, G. D. Ball, Alexander First Nation Community, and N. D. Willows. 2013. Feasibility
study of asset mapping with children: Identifying how the community environment shapes activity and food
choices in Alexander First Nation. Rural Remote Health 13:2289.
ERS (Economic Research Service). 2013. Food environment atlas overview. http://www.ers.usda.gov/data-products/
food-environment-atlas.aspx#.Ud7zdDvksxF (accessed July 11, 2013).
Fawcett, S. B., and J. A. Schultz. 2008. Supporting participatory evaluation using the community tool box’s online
documentation system. In Community-based participatory research for health, edited by M. Minkler and N.
Wallerstein. San Francisco, CA: Jossey-Bass. Pp. 419-425.
Fawcett, S. B., R. Boothroyd, J. A. Schultz, V. T. Fancisco, V. Carson, and R. Bremby. 2003. Building capacity
for participatory evaluation within community initiatives. Journal of Prevention and Intervention in the
Community 26(2):21-36.
Fawcett, S., C. Holt, and J. Schultz. 2011. Some recommended practice areas for community health improvement
(report to the CDC, Office of Prevention through Healthcare). Work Group for Community Health and
Development, University of Kansas.
Hannay, J., R. Dudley, S. Milan, and P. K. Leibovitz. 2013. Combining photovoice and focus groups: Engaging
Latina teens in community assessment. American Journal of Preventive Medicine 44(3 Suppl 3):S215-S224.
HHS (Department of Health and Human Services). 2010. Healthy People 2020. http://www.healthypeople.gov/2020/
default.aspx (accessed January 31, 2013).
HHS. 2013. Community health status indicators. http://www.communityhealth.hhs.gov/homepage.aspx?j=1 (accessed
June 15, 2012).
Hipp, J. A., D. Adlakha, B. Chang, A. A. Eyler, and R. B. Pless. 2013. Emerging technologies: Webcams and crowd-
sourcing to identify active transportation. Brown School Faculty Publications Paper 3.
IOM (Institute of Medicine). 2003. The future of the public’s health in the 21st century. Washington, DC: The
National Academies Press.
IOM. 2007. Progress in preventing childhood obesity: How do we measure up? Washington, DC: The National
Academies Press.
IOM. 2012a. Accelerating progress in obesity prevention: Solving the weight of the nation. Washington, DC: The
National Academies Press.
IOM. 2012b. An integrated framework for assessing the value of community-based prevention. Washington, DC:
The National Academies Press.
Israel, B. A., E. Eng, A. J. Schulz, and E. A. Parker. 2013. Methods for community-based participatory research for
health. 2nd ed. San Francisco, CA: Jossey-Bass.
Issel, L. M. 2009. Health program planning and evaluation: A practical systematic approach for community health.
2nd ed. Sudbury, MA: Jones and Bartlett Publishers.
Jia, H., P. Muennig, and E. Borawski. 2004. Comparison of small-area analysis techniques for estimating county-
level outcomes. American Journal of Preventive Medicine 26(5):453-460.
Jick, T. D. 1979. Mixing qualitative and quantitative methods: Triangulation in action. Administrative Science
Quarterly 24(4):602-611.
Copyright © National Academy of Sciences. All rights reserved.
Evaluating Obesity Prevention Efforts: A Plan for Measuring Progress
219Community Obesity Assessment and Surveillance
Johnson, R. B., A. J. Onwuegbuzie, and L. A. Turner. 2007. Toward a definition of mixed methods research. Journal
of Mixed Methods Research 1(2):112-133.
Kawachi, I., S. V. Subramanian, and N. Almeida-Filho. 2002. A glossary for health inequalities. Journal of
Epidemiology and Community Health 56(9):647-652.
King County. 2013a. Health policy. http://your.kingcounty.gov/aimshigh/search2.asp?HHChHealthPolicy (accessed
July 11, 2013).
King County. 2013b. Indicator: Obesity, health reporting areas. http://www.kingcounty.gov/healthservices/health/
data/chi2009/RiskAdultObese/~/media/health/publichealth/documents/indicators/RiskAdultObeseMap.ashx
(accessed April 15, 2013).
King County. 2013c. Indicator: Obesity, King County. http://www.kingcounty.gov/healthservices/health/data/chi2009/
RiskAdultObese.aspx (accessed April 10, 2013).
Kumar, K. 1993. Rapid appraisal methods. Washington, DC: The World Bank.
Larson, K. 2013. Hill County community health assessment 2010-2011. http://www.dphhs.mt.gov/publichealth/
accreditation/documents/hill-cha.pdf (accessed April 22, 2013).
Lee, L. M., S. M. Teutsch, S. B. Thacker, and M. E. St. Louis, eds. 2010. Principles & practice of public health sur-
veillance. 3rd ed. New York: Oxford University Press.
Lee County Public Health Assessment Team and LeeCAN. 2010. Lee County North Carolina. Access to the world.
Community health assessment. http://www.leecountync.gov/LinkClick.aspx?fileticket=YcCnyE8z68k%
3D&tabid=205 (accessed April 22, 2013).
Li, W., J. L. Kelsey, z. zhang, S. C. Lemon, S. Mezgebu, C. Boddie-Willis, and G. W. Reed. 2009. Small-area estima-
tion and prioritizing communities for obesity control in Massachusetts. American Journal of Public Health
99(3):511-519.
Los Angeles County. 2013. LA HealthDataNow! http://dqs.publichealth.lacounty.gov/default.aspx (accessed April 22,
2013).
Malec, D., J. Sedransk, C. L. Moriarity, and F. B. LeClere. 1997. Small area inference for binary variables in the
National Health Interview Survey. Journal of the American Statistical Association 92(439):815-826.
McIntyre, S., and A. Ellaway. 2000. Ecological approaches: Rediscovering the role of the physical and social envi-
ronment. In Social epidemiology, edited by L. Berkman and I. Kawachi. New York: Oxford University Press.
Pp. 332-348.
Minkler, M., and N. Wallerstein. 2008. Community-based participatory research for health: From process to out-
comes. 2nd ed. San Francisco, CA: Jossey-Bass.
Mitchell, R., and T. Bernauer. 1998. Empirical research on international environmental policy: Designing qualitative
case studies. Journal of Environment & Development 7(1):4-31.
Morris, D. S., S. S. Schubert, D. L. Ngo, D. Rubado, E. Main, and J. P. Douglas. 2012. DMV records are valuable
for obesity surveillance in Oregon. Portland: Oregon Health Authority Environmental Public Health Tracking.
NACCHO (National Association of County and City Health Officials). 2013. Recommendations of characteristics
for high-quality community health assessments and community health improvement plans. http://www.naccho.
org/topics/infrastructure/CHAIP/upload/Final-Consensus-Statement-for-Distribution-Updated-032113.docx
(accessed June 24, 2013).
NASBE (National Association of State Boards of Education). 2013. State school health policy database: Screening
for health conditions. http://www.nasbe.org/healthy_schools/hs/bytopics.php?topicid=4100 (accessed April 15,
2013).
NCI (National Cancer Institute). 2013. Small area estimates for states, counties, & health service areas. http://sae.
cancer.gov (accessed March 20, 2013).

Copyright © National Academy of Sciences. All rights reserved.
Evaluating Obesity Prevention Efforts: A Plan for Measuring Progress
Evaluating Obesity Prevention Efforts220
New York City Department of Health and Mental Hygiene. 2013a. Epiquery: NYC interactive health data. https://
a816-healthpsi.nyc.gov/epiquery (accessed April 22, 2013).
New York City Department of Health and Mental Hygiene. 2013b. New York City health and nutrition examination
survey. http://www.nyc.gov/html/doh/html/data/nyc-hanes.shtml (accessed April 5, 2013).
NIH (National Institutes of Health). 2011. Principles of community engagement. 2nd ed. Pub 11-7782. Washington,
DC: Government Printing Office.
Open Scientist. 2011. Finalizing a definition of “citizen science” and “citizen scientists.” http://www.openscientist.
org/2011/09/finalizing-definition-of-citizen.html (accessed April 10, 2013).
Patton, M. Q. 1987. How to use qualitative methods in evaluation. Newbury Park, CA: Sage Publications.
Public Health Accreditation Board. 2012. National public health department accreditation prerequisites. http://www.
phaboard.org/wp-content/uploads/PrerequisitesJuly-2012.pdf (accessed March 20, 2013).
Puget Sound Health Alliance. 2013. Alliance reports. What is the community checkup? http://www.
wacommunitycheckup.org/resources/alliance-reports (accessed April 10, 2013).
Rao, J. N. K. 2003. Small area estimation. Hoboken, NJ: John Wiley & Sons.
Remington, P. L., and B. C. Booske. 2011. Measuring the health of communities—how and why? Journal of Public
Health Management and Practice 17(5):397-400.
Riva, M., L. Gauvin, and T. A. Barnett. 2007. Toward the next generation of research into small area effects on
health: A synthesis of multilevel investigations published since July 1998. Journal of Epidemiology and
Community Health 61(10):853-861.
Scrimshaw, N., and G. R. Gleason. 1992. Rapid assessment procedures: Qualitative methodologies for planning and
evaluation of health related programmes. Boston, MA: International Nutrition Foundation for Developing
Countries.
Sheon, A., V. Katta, B. Costello, M. Longjohn, and K. Mantinan. 2011. Registry-based BMI surveillance: A guide to
system preparation, design, and implementation. Ann Arbor, MI: Altarum Institute.
Sofaer, S. 1999. Qualitative methods: What are they and why use them? Health Services Research 34(5 Pt
2):1101-1118.
Srebotnjak, T., A. H. Mokdad, and C. J. Murray. 2010. A novel framework for validating and applying standardized
small area measurement strategies. Population Health Metrics 8:26.
Strack, R. W., K. A. Lovelace, T. D. Jordan, and A. P. Holmes. 2010. Framing photovoice using a social-ecological
logic model as a guide. Health Promotion and Practice 11(5):629-636.
Tashakkori, A., and C. Teddlie. 1998. Mixed methodology: Combining qualitative and quantitative approaches
(applied social research methods). Thousand Oaks, CA: Sage.
Teutsch, S. M., and R. E. Churchill, eds. 2000. Principles and practice of public health surveillance. 2nd ed. New
York: Oxford University Press.
Tsui, E., M. Cho, and N. Freudenberg. 2013. Methods for community-based participatory policy work to improve
food environments in New York City. In Methods for community-based participatory research for health. 2nd
ed, edited by B. A. Israel, E. Eng, A. J. Schulz, and E. A. Parker. San Francisco, CA: Jossey-Bass. Pp. 517-545.
Tufte, E. R. 1997. Visual explanations, images and quantities, evidence and narrative. Cheshire, CT: Graphics Press.
University of Washington Department of Urban Design and Planning. 2008. Food for thought: Groundwork for the
King County Food & Fitness Initiative. Seattle, WA: University of Washington.
USAID (U.S. Agency for International Development) and MCHIP (Maternal and Child Health Integrated Program).
2011. Considerations for incorporating health equity into project designs: A guide for community-oriented
maternal, neonatal, and child health projects. Washington, DC: U.S. Government Printing Office.
Wallack, L., K. Woodruff, L. Dorfman, and I. Diaz. 1999. News for a change: An advocate’s guide to working with
the media. Thousand Oaks, CA: Sage.

Copyright © National Academy of Sciences. All rights reserved.
Evaluating Obesity Prevention Efforts: A Plan for Measuring Progress
221Community Obesity Assessment and Surveillance
Work Group for Community Health and Development and University of Kansas. 2013a. Community innovator:
Increasing access to fresh produce in central Detroit. Peaches & greens produce market—Detroit, Michigan,
United States. http://ctb.ku.edu/en/out_of_the_box/finalists/communityinnovatorPeachesAndGreens.aspx
(accessed April 10, 2013).
Work Group for Community Health and Development and University of Kansas. 2013b. The Community tool box:
Bringing solutions to light. http://ctb.ku.edu/en/default.aspx (accessed March 21, 2013).
zhang, X., S. Onufrak, J. B. Holt, and J. B. Croft. 2013. A multilevel approach to estimating small area childhood
obesity prevalence at the census block-group level. Preventing Chronic Disease 10:E68.

Copyright © National Academy of Sciences. All rights reserved.
Evaluating Obesity Prevention Efforts: A Plan for Measuring Progress

Copyright © National Academy of Sciences. All rights reserved.
Evaluating Obesity Prevention Efforts: A Plan for Measuring Progress
223
8Monitoring and Summative Evaluation of Community Interventions1
1 A portion of this chapter content was drawn from commissioned work for the Committee by Allen Cheadle, Ph.D., Group Health Cooperative; Suzanne Rauzon, M.P.H., University of California, Berkeley; Carol Cahill, M.L.S., Group Health Cooperative; Diana Charbonneau, M.I.T., Group Health Cooperative; Elena Kuo, Ph.D., Group Health Cooperative; and Lisa Schafer, M.P.H., Group Health Cooperative.
Why: Why develop a Community-Level Obesity Intervention Monitoring and Summative Evaluation Plan? Monitoring and summative evaluation of local interventions is critically important both to guide community action and to inform national choices about the most effective and cost-effective interventions for funding, dissemination, and uptake by other communities.
What: What is a Community-Level Obesity Intervention Monitoring and Summative Evaluation Plan? Complementary to the Community Obesity Assessment and Surveillance Plan (in Chapter 7), a Monitoring and Summative Evaluation Plan for community-level obesity interventions is a template to help communi-ties to monitor implementation of the intervention and evaluate the long-term outcomes and population impacts such as behavior change, reduced prevalence of obesity, and improved health.
How: How should a Community-Level Obesity Intervention Monitoring and Summative Evaluation Plan be implemented? A template for customizing plans for monitoring and summative evaluation identifies priorities to accommodate local differences in terms of opportunities for change, context, resources avail-able for evaluating strategies recommended in the Accelerating Progress in Obesity Prevention report, and stakeholder input. Because innovations in obesity prevention often receive their initial test at the community level, rigorous and practical methods are desirable to build national knowledge. Combining knowledge from both experimental studies and practice experience can inform national evaluation by casting light on the prevalence of strategies, their feasibility, and their ease of implementation.

Copyright © National Academy of Sciences. All rights reserved.
Evaluating Obesity Prevention Efforts: A Plan for Measuring Progress
Evaluating Obesity Prevention Efforts224
This chapter presents guidance to develop plans for monitoring and evaluating2 community-level obesity prevention interventions.3 Flexibility in developing community-level monitoring and summa-
tive evaluation plans is appropriate given the variety of user needs (as summarized in Chapter 2), local context, and available resources. Monitoring and evaluating community-level efforts to prevent obesity is critical for accelerating national progress in obesity prevention and for providing evidence to inform a national plan for evaluation. Community-level evaluation encompasses the issues of learning not only “what works,” but also the relative feasibility to implement interventions in different situations and the comparative effectiveness of various strategies—the extent to which they work. This information is essen-tial to improving a national plan for evaluation. In line with “what works,” monitoring of the implemen-tation of interventions also informs local implementers on how to improve and manage interventions. It casts light on how and why these interventions may prevent obesity. Finally, it encompasses translating effective interventions for implementation on a broader scale and determining the contexts in which they are and are not effective (i.e., generalizability). This learning will allow greater return on national invest-ments in obesity prevention.
dEFINITION OF COMMUNITY-LEVEL INTERVENTIONS
As described in Chapter 7, the Committee defines community level as activities conducted by local governmental units (e.g., cities, counties), school districts, quasi-governmental bodies (e.g., regional plan-ning authorities, housing authorities, etc.) and private-sector organizations (e.g., hospitals, businesses, child care providers, voluntary health associations, etc.). Communities vary widely with respect to popula-tion size, diversity, context, and impact of obesity. Community capacities for monitoring and summative evaluation are also highly variable, with a wide range of expertise and resources for collecting and using data to evaluate the implementation and effectiveness of interventions.
Community intervention monitoring and summative evaluation can be focused on programs, sys-tems, policies, or environmental changes, or any combination of these in multi-faceted initiatives.
• A local program focuses on a specific sub-population of a community, most often takes place in a single setting or sector (e.g., schools), is usually administered by a single organization, and deploys a limited set of services or health promotion strategies. In the past, local efforts focused mostly on counseling, education, and behavior-change programs delivered directly to individu-als as well as some broader school-based and community-based programs. Published reports showed modest effects of these programs when done alone (e.g., Anderson et al., 2009; Waters et al., 2011), so the field has moved to incorporating them into more comprehensive or multi-level interventions.
• A community-level initiative is a multi-level, multi-sector set of strategies focused on a defined geographic community or population, and it typically includes policy, program, and environ-mental changes in different parts of the community (e.g., government, business, schools, com-
2 As defined in Chapter 1, monitoring is the tracking of the implementation of interventions compared to standards of performance. Evaluation is the effort to detect changes in output, outcomes, and impacts associated with interventions and to attribute those changes to the interventions.
3 Interventions refer to programs, systems, policies, environmental changes, services, products, or any combination of these multi-faceted initiatives.

Copyright © National Academy of Sciences. All rights reserved.
Evaluating Obesity Prevention Efforts: A Plan for Measuring Progress
225Monitoring and Summative Evaluation of Community Interventions
munity organizations). Multi-component mass media campaigns, such as the Home Box Office (HBO) Institute of Medicine (IOM) campaign The Weight of the Nation (TWOTN), that utilize community screenings, learning toolkits, and local events, also fall into this category. Based on experience with control of tobacco and other drugs, multi-component initiatives hold greater potential to prevent obesity than do programs or individual strategies by themselves (IOM, 2012a).
This chapter covers some important considerations for monitoring and summative evaluation that exist across obesity prevention programs and community-level initiatives. The chapter emphasizes the par-ticular challenges and opportunities of community-level evaluation, for which evaluation methods are less well established and evolving.
ThE SPECIAL ChALLENGES OF COMMUNITY-LEVEL INITIATIVES
Evaluators have less control over community-level initiatives than they do over research-based pro-grams or nationally guided efforts such as U.S. Department of Agriculture’s (USDA’s) feeding programs and other federal transportation initiatives. This makes the monitoring of implementation essential and the use of rigorous evaluation methods more challenging (Hawkins et al., 2007; Sanson-Fisher et al., 2007). Any evaluation must weigh trade-offs between internal and external validity, feasibility, and ethics versus experimental control, and intrusiveness versus free choice among participants. These decisions become more difficult for initiatives that arise from community decision making (Mercer et al., 2007). For example, communities will institute their own mix of local policies and environmental changes, mak-ing random assignment to a particular intervention (program or policy), and thus attribution of cause and effect with outcomes, more difficult. Exposure to certain elements of a community initiative can sometimes be determined by random assignment, but exposure to the entire “package” usually cannot.4 Characteristics of a community influence both the implementation and the outcome of the intervention being evaluated, requiring assessment of community contextual influences (IOM, 2010; Issel, 2009). In general, the field needs to develop efficient and valid methods for community evaluations including the documentation of the unfolding, sequencing, and building of multiple changes in communities and sys-tems over time (Roussos and Fawcett, 2000) and synergies among these changes (Jagosh et al., 2012).
Community-level intervention on policy, environment, and systems is a relatively new approach, and therefore evidence of the effectiveness of most of these strategies is limited. In particular, more empirical evidence is needed about whether, and to what extent, changing food environments promotes healthier eating (Osei-Assibey et al., 2012). There also is some uncertainty about which specific changes in the built environment will lead to increases in physical activity (Heath et al., 2006; Kahn et al., 2002). Appropriate methods are emerging to evaluate community-level impact, but most studies continue to be cross-sectional (an observation made at one point in time or interval) (Booth et al., 2005; Heath et al., 2006; Papas et al., 2007). Several strategies with evidence of effectiveness are listed in the Centers for Disease Control
4 Although random assignment of communities to entire policies and systems has not, to the Committee’s knowledge, been attempted in the obesity prevention field, both the United States and other countries have randomly assigned place and people to policies in the past, as in the case of the RAND Health Insurance Experiment (Brook et al., 2006) and Mexico’s Seguro Popular experiment (King et al., 2009). Since the 1980s, researchers have randomized entire communities to multi-faceted prevention initiatives, but the experiments are often costly and relatively rare, with limited generalizability (COMMIT Research Group, 1995; Farquhar et al., 1990; Merzel and D’Afflitti, 2003; Wagner et al., 2000).

Copyright © National Academy of Sciences. All rights reserved.
Evaluating Obesity Prevention Efforts: A Plan for Measuring Progress
Evaluating Obesity Prevention Efforts226
and Prevention (CDC) Community Guide (Community Preventive Services Task Force, 2013), as well as in “What Works for Health,” a resource associated with the County Health Rankings model of assessing community needs (County Health Rankings, 2013). However, to date, CDC and IOM recommendations for strategies to include in community-level initiatives tend to rely on expert opinion (IOM, 2009; Khan et al., 2009).
Evidence points to comprehensive, community-level initiatives as the most promising approach to promote and sustain a healthy environment (Ashe et al., 2007; Doyle et al., 2006; Glanz and Hoelscher, 2004; IOM, 2009; Khan et al., 2009; Ritchie et al., 2006; Sallis and Glanz, 2006; Sallis et al., 2006), particularly when supported by state or national mass media and other components that communities cannot afford (CDC, 2007). Related work on tobacco control programs, notably from the California and Massachusetts model programs, demonstrated how national and state mass media can support local pro-grams with resources (Koh et al., 2005; Tang et al., 2010).
To address the special monitoring and summative evaluation challenges of community-level initia-tives, the Committee commissioned5 a review of published literature, as well as unpublished evaluation studies and online descriptions, to identify initiatives that have been or are currently being evaluated. Cheadle and colleagues (2012) conducted a search for years 2000-2012 using PubMed and websites of agencies that aggregate reports on obesity prevention interventions, such as the Agency for Healthcare Research and Quality Innovations Exchange and the Robert Wood Johnson Foundation’s (RWJF’s) Active Living Research program. The review found 37 community-level initiatives that included sufficient detail concerning their intervention and evaluation methods. These included 17 completed initiatives that included population-level outcome results (3 negative studies, 14 positive) (see Table H-1 in Appendix H). Another 20 initiatives are either in process or do not measure population-level behavior change (see Table H-2 in Appendix H). Some of the largest and potentially most useful evaluations are in progress. In particular, many independent evaluations of CDC’s Communities Putting Prevention to Work initiatives are being conducted; and a large-scale National Institutes of Health–funded Healthy Communities Study is doing a retrospective examination of associations between the intensity of more than 200 community programs and policies and community obesity rates in more than 200 areas across the United States (see Appendix H) (National Heart, Lung, and Blood Institute, 2012).
TOwARd A COMMUNITY-LEVEL MONITORING ANd SUMMATIVE EVALUATION PLAN
As noted in Chapter 2 and the L.E.A.D. (Locate evidence, Evaluate it, Assemble it, and Inform Decisions) framework (IOM, 2010), local monitoring and summative evaluation plans should be driven by the information needs of end users and the contexts of decisions, not on preconceptions of what evaluation is about. Common measures of progress are highly desirable, because they permit comparison of interven-tions and aggregation of studies into a body of evidence. However, uniformity of methods is not desirable, because the contexts of local interventions are so diverse. Moreover, available resources dictate the types of data collection and analysis that are appropriate and feasible. This chapter discusses the choices available within available resources. With the pursuit of more universal agreement on and provisions for indicators and surveillance measures recommended in earlier chapters, more would be available and feasible.
5 Commissioned for the Committee by Allen Cheadle, Ph.D., Group Health Cooperative; Suzanne Rauzon, M.P.H., University of California, Berkeley; Carol Cahill, M.L.S., Group Health Cooperative; Diana Charbonneau, M.I.T., Group Health Cooperative; Elena Kuo, Ph.D., Group Health Cooperative; Lisa Schafer, M.P.H., Group Health Cooperative.

Copyright © National Academy of Sciences. All rights reserved.
Evaluating Obesity Prevention Efforts: A Plan for Measuring Progress
227Monitoring and Summative Evaluation of Community Interventions
Tailoring the Plan to End-User Needs
To establish “what works” (effectiveness), outcomes need to be attributed to the community inter-vention. This requires high-quality measurement and design, consistent with resources and logistical con-straints (Shadish et al., 2002). Although rigorous methods are more common in research projects, they are also feasible for community evaluations, and some examples of best practices when conducting evalu-ations are described in Appendix H. On the other hand, to demonstrate local progress, stakeholders may be satisfied with intervention monitoring and summative evaluation that measures good implementation and an improvement in outcomes, without worrying much about causal attribution to a specific obesity prevention effort. Yet, other purposes lie somewhere between these, as with measures of progress in spe-cific settings and population segments, and these are important for generalizable knowledge. For example, by knowing the particular combination of interventions in particular communities and observing relative improvements in those communities, without being overly strict about causal attribution, the field can better understand the types of interventions (or combinations of interventions) that are most likely to be associated with desired outcomes, their prevalence and feasibility nationally, as well as the dose of envi-ronmental change (i.e., strength of intervention, duration, and extent of reach to affect the target popula-tion) likely required to achieve them. This information can then inform the priorities for more rigorous tests of effectiveness.
Tailoring the Plan to Available Resources
Almost universally, local monitoring and summative evaluation has limited resources (Rossi et al., 2004). Therefore, evaluation needs to tailor the methods to answer the highest priority questions. Infrastructure improvements as outlined in Chapter 3 may alleviate the situation, but even then most local evaluation budgets are likely to be quite small without the assistance of outside funders.6 Rigorous methods may seem out of reach for many local evaluations, and the cost of data collection can be daunt-ing given the scarcity of local surveillance information. Still, useful evaluation can be conducted, even when expensive data collection is not feasible and methods have limited rigor. As seen below, some rela-tively simple additions to design and measurement can greatly improve the monitoring and summative evaluation plan, thus adding to national knowledge about community interventions.
Tailoring the Plan to the Intervention Context and Logic
In community-level interventions, the number and kind of strategies are highly diverse and may vary substantially from one initiative to another, as communities implement programs, policies, and envi-ronmental changes that address their specific issues and context. Also, there is potential for community engagement to increase over time after community changes take place, thus leading to more commu-nity changes. For evaluation, this situation is radically different from conventional programs, in which (ideally) a well-defined linear set of activities is tested, improved, and disseminated for adoption in other locations. This situation poses special issues for planning, design, measurement, and analysis.
6 In 2012, the Community Transformation Grant awards ranged from $200,000 to $10 million (CDC, 2012). CDC recommended that 10 percent be used for evaluation (Laura Kettel-Khan, Office of the Director, Division of Nutrition, Physical Activity and Obesity, CDC, April 2013).

Copyright © National Academy of Sciences. All rights reserved.
Evaluating Obesity Prevention Efforts: A Plan for Measuring Progress
Evaluating Obesity Prevention Efforts228
COMPONENTS OF A COMMUNITY-LEVEL OBESITY INTERVENTION MONITORING ANd SUMMATIVE EVALUATION PLAN
The components of a community-level monitoring and summative evaluation plan are seen in a proposed template (see Box 8-1). Within those components, considerable flexibility is needed. The core of any plan includes engaging stakeholders, identifying resources, having a logic model or theory of change, selecting the right focus, using appropriate measures, collecting quality data, using appropriate analytic methods, interpreting or making sense of the data, and disseminating the findings.
BOX 8-1 Components of a Community-Level Obesity Intervention Monitoring and Summative Evaluation Plan
Purpose: To guide community action and to inform national choices about the most effective and cost- effective strategies identified in the Accelerating Progress in Obesity Prevention report for funding, dis-semination, and uptake by other communities.
1. Design stakeholder involvement.
a. Identify stakeholders.
b. Consider the extent of stakeholder involvement.
c. Assess desired outcomes of monitoring and summative evaluation.
d. Define stakeholder roles in monitoring and summative evaluation.
2. Identify resources for monitoring and summative evaluation.
a. Person-power resources
b. Data collection resources
3. Describe the intervention’s framework, logic model, or theory of change.
a. Purpose or mission
b. Context or conditions
c. Inputs: resources and barriers
d. Activities or interventions
e. Outputs of activities
f. Intended effects or outcomes

Copyright © National Academy of Sciences. All rights reserved.
Evaluating Obesity Prevention Efforts: A Plan for Measuring Progress
229Monitoring and Summative Evaluation of Community Interventions
4. Focus the monitoring and summative evaluation plan.
a. Purpose or uses: What does the monitoring and summative evaluation aim to accomplish?
b. Priorities by end-user questions, resources, context
c. What questions will the monitoring and summative evaluation answer?
d. Ethical implications (benefit outweighs risk)
5. Plan for credible methods.
a. Stakeholder agreement on methods
b. Indicators of success
c. Credibility of evidence
6. Synthesize and generalize.
a. Disseminate and compile studies
b. Learn more from implementation
c. Ways to assist generalization
d. Shared sense-making and cultural competence
e. Disentangle effects of interventions
SOURCE: Adapted from A Framework for Program Evaluation: A Gateway to Tools. The Community Tool Box, http://ctb.ku.edu/en/tablecontents/sub_section_main_1338.aspx (accessed November 12, 2013).
There are many good resources on monitoring and summative evaluation methods, so this chap-ter does not repeat them (Cronbach, 1982; Fetterman and Wandersman, 2005; Fitzpatrick et al., 2010; Patton, 2008; Rossi et al., 2004; Shadish et al., 2002; Wholey et al., 2010). For example, this report does not include a discussion on analytic methods. Certain issues, however, are central to developing an effec-tive local evaluation of obesity prevention. For this reason, the chapter devotes a good bit of attention to stakeholder involvement, emerging methods, and interpretation of findings.

Copyright © National Academy of Sciences. All rights reserved.
Evaluating Obesity Prevention Efforts: A Plan for Measuring Progress
Evaluating Obesity Prevention Efforts230
designing Stakeholder Involvement
Some commonly identified stakeholder groups include those operating the intervention, such as staff and members of collaborating organizations, volunteers, and sponsors, and priority groups served or affected by the intervention, such as community members experiencing the problem, funders, public officials, and researchers. Some stakeholder groups are not immediately apparent, and guidance on the general subject is available (e.g., Preskill and Jones, 2009). Two aspects are specifically important for planning community-level obesity prevention monitoring and evaluation: community participation and cultural competence.
Community Participation in Obesity Monitoring and Summative Evaluation Plans
Community participation is beneficial for the planning of most program monitoring and summa-tive evaluation; it is essential for the evaluation of community-level initiatives. Yet, in the commissioned literature review of 37 community-level evaluations, only 6 mentioned participation at all and that was in the context of the intervention rather than the evaluation (see Appendix H). As seen in Chapter 2, com-munity coalitions are often the driving force behind community-level initiatives. Community engagement and formative evaluation are critically linked. Without community engagement, the community may have inadequate trust in the evaluation process to make strategy improvements based on evaluation findings and recommendations. Community participation may also facilitate access to data, not only qualitative but also quantitative data kept by organizations and not available to the public, that evaluators would otherwise not be aware of or able to collect. Other benefits have been well described. The primary dis-advantages include time burden on community members and a lack of skill in community engagement on the part of many evaluators (Israel et al., 2012; Minkler and Wallerstein, 2008).
Participatory approaches to community monitoring and summative evaluation reflect a continuum of community engagement and control—from deciding the logic model and evaluation questions to making sense of the data and using them to improve obesity prevention efforts. In less participatory approaches, the evaluator has more technical control of the evaluation (Shaw et al., 2006). In more par-ticipatory approaches, communities and researchers/evaluators share power to a greater extent when pos-ing evaluation questions, making sense of results, and using the information to make decisions, although there may be trade-offs with this approach, too (Fawcett and Schultz, 2008; Mercer et al., 2008).
The Special Role of Cultural Competence in Obesity Monitoring and Summative Evaluation Plans
As noted in Chapter 5, there is a national urgency to evaluate and address the factors that lead to racial and ethnic disparities in obesity prevalence. Community interventions to address such disparities require cultural competence in both the interventions and their evaluations. Participatory methods facili-tate the use of cultural competence.
The American Evaluation Association (2011) states: “Evaluations cannot be culture free. Those who engage in evaluation do so from perspectives that reflect their values, their ways of viewing the world, and their culture. Culture shapes the ways in which evaluation questions are conceptualized, which in turn influence what data are collected, how the data will be collected and analyzed, and how data are interpreted” (Web section, The Role of Culture and Cultural Competence in Quality Education).

Copyright © National Academy of Sciences. All rights reserved.
Evaluating Obesity Prevention Efforts: A Plan for Measuring Progress
231Monitoring and Summative Evaluation of Community Interventions
Ethical, scientific, and practical reasons call for culturally competent evaluation: ethical, because profes-sional guidelines specify evaluation that is valid, honest, respectful of stakeholders, and considerate of the general public welfare; scientific, because misunderstandings about cultural context create systematic error that threatens validity; and cultural assumptions, because the theories underlying interventions reflect implicit and explicit assumptions about how things work.
The practical reason to consider culture in evaluating of obesity prevention efforts is that the record is mixed about the effectiveness of cultural competence in health promotion programs (e.g., Robinson et al., 2010). Culturally competent evaluation can help the field to address this mixed result by assuring that interventions are, in fact, consistent with a population’s experience and expectations. Evaluation has demonstrated the effectiveness of cultural tailoring in some areas (Bailey et al., 2008; Hawthorne et al., 2008). Culturally tailored media materials and targeted programs reach more of the intended population (Resnicow et al., 1999). Culturally competent evaluation can assess whether interventions focus on issues of importance to the cultural group; whether interventions address where and how people eat, shop, and spend recreational time; and which environmental changes produce the most powerful enablers for more healthful nutrition and physical activity.
Identifying Resources for Monitoring or Summative Evaluation
Monitoring and summative evaluation plans can maximize resources in two areas, person-power and data collection. Regarding person-power, evaluations can draw on the expertise of local colleges and universities and of health departments, which will generally improve evaluation quality and potentially lower the cost. Faculty in schools offering degrees in health professions are often required or encouraged by accrediting bodies to provide community service, which they often do through evaluations. Students will find evaluation projects suitable for service-learning opportunities and internships. For example, the Council on Education for Public Health requires that tenure and promotion strongly consider community service and that student experiences include service learning with community organizations (Council on Education for Public Health, 2005). Free services are not always high-quality services, however, and may lack consistency and follow-up. The Community-Campus Partnerships for Health offers useful guidance for maximizing the quality of evaluation activities provided as service (Community-Campus Partnerships for Health, 2013). The guiding principles for evaluation outlined in Chapter 3, which are endorsed by researchers’ professional associations, can also help.
Data collection is generally the highest-cost component of evaluations. Using available information where applicable, such as local surveillance and other community assessment and surveillance (CAS) data, can minimize the cost. Making data collection a by-product of prevention activity can also lower cost, as in the collection of participation rosters, media tracking, and public meeting minutes. Community resident volunteers can collect data using methods such as photovoice (see Chapter 7 and Appendix H) and envi-ronmental audits,7 thus adding both person-power and data.
7 Observations to identify interventions being implemented in a particular area.

Copyright © National Academy of Sciences. All rights reserved.
Evaluating Obesity Prevention Efforts: A Plan for Measuring Progress
Evaluating Obesity Prevention Efforts232
describing the Intervention Framework, Logic Model, or Theory of Change
Frameworks, logic models, and theories of change are heuristics—experience-based techniques for problem solving, learning, and discovery designed to facilitate and guide decision making. A logic model is not a description of the intervention itself, but rather a graphic depiction of the rationale and expecta-tions of the intervention. A theory of change is similar to a logic model except that it also describes the “mechanisms through which the intervention’s inputs and activities are thought to lead to the desired out-comes” (Leviton et al., 2010b, p. 215).
For the monitoring and summative evaluation plan, one ideally can turn to the logic model or theory used in the planning of the program, but often this was not developed or made explicit in the ear-lier program planning, and must be constructed retrospectively.
There are many options to choose from among formats for logic models and theories of change. The choice depends on what will have the most clarity and ease of presentation for the user audience (Leviton et al., 2010b). Figure 8-1 illustrates a graphic depiction of the presumed components and causal path-ways in local-level obesity prevention efforts. Not all evaluations will include all the elements or all the pathways, which is to be expected in areas with such diversity of local initiatives. Building on Figure 8-1, Table 8-1 provides some detail on generic logic model components, with the potential program components listed in the first row and potential community-level components in the second row. Outputs and outcomes resulting from programs are also commonly seen in multi-faceted community initiatives.
In building logic models, the components must be clarified. Although not appearing in the table, the purpose or mission describes the problem or goal to which the program, effort, or initiative is addressed, and context or conditions mean the situation in which the intervention will take place and factors that may affect outcomes. Inputs represent resources such as time, talent, equipment, information, and money. Inputs also include barriers such as a history of conflict, environmental factors, and economic conditions. The activities are the specifics of what the intervention will do to affect change and improve outcomes, while outputs are direct evidence of having performed the activities, such as products or participation in services by a target group. Activities and outputs are logically connected to short-, intermediate-, and long-term outcomes: for example, engagement of local decision makers is presumed to help to achieve
FIGURE 8-1 Generic logic model or theory of change for community obesity prevention.NOTES: Not all interventions will include programs, policies, and environmental changes or systems changes. Not all interven-tions will focus on both diet and physical activity. Dashed lines indicate potential for interventions to increase community engagement over time.
Figure 8-1.eps
Initial Conditions
Community Engagement
Policy, Environment, System Changes
Programs
Change Diet
Change Physical Activity
Reduce Obesity
Prevalence
Inputs

Copyright © National Academy of Sciences. All rights reserved.
Evaluating Obesity Prevention Efforts: A Plan for Measuring Progress
233Monitoring and Summative Evaluation of Community Interventions
TABLE 8-1 Generic Logic Model for Community-Level Initiatives to Prevent Obesity
Inputs Outputsa
Outcomes (Impact)a
Short term Intermediate Ultimate
Prog
ram
C
ompo
nent
s
Initial:• resources• staff • public
opinion• community
norms
• program activities
• outreach • media
messages
• target group program participants
Changes in: • knowledge• attitudes
Improved:• physical
activity• diet
Improved:• prevalence of
obesity and overweight
• population health
Mul
ti-F
acet
ed I
niti
ativ
es
• public opinion
• community norms
• policies identified
• policy opportunities
• advocacy allies
• decision makers engaged
• public meetings attended
• community organized
• advocates recruited and trained
• enforcement of changes monitored
Increases in: • public
support • resources • advocacy,
allies, and power
Changes in:• policies • environments• systems
• changes in community norms
• change sustained in environment
• change sustained in policy and system
a Outputs and outcomes resulting from program components are also commonly seen in the multi-faceted initiatives.
changes in policy and environment, which are presumed to change diet or physical activity and, therefore, help to achieve healthy weight for a greater portion of the population.
Logic models and theories of change help greatly to assess the plausibility that particular interven-tions can achieve their goals. Is it plausible—believable—that the connecting arrows of a logic model or the assumptions of a theory are likely to produce the outcomes predicted? Evaluating implausible inter-ventions wastes resources and is needlessly discouraging for the field. Logic models and theories of change also cast light on the “dose” of intervention (i.e., intensity, duration, and reach) that is likely to be neces-sary to achieve change. The low-cost technique of evaluability assessment helps to establish plausibility, indicates which intervention components are ready for evaluation, and pinpoints areas for improvement in implementation or the mix of strategies involved (Leviton et al., 2010b).
Focusing the Obesity Monitoring and Summative Evaluation Plan
The framework, logic model, or theory of change helps to focus the monitoring and summative evaluation plan: what the evaluation aims to accomplish. By prioritizing based on user needs, resources, and context, the choices often become very clear. Limited resources do not have to imply reduced rigor, and below, in the section titled “Planning for Credible Methods,” some suggestions are offered to improve rigor.

Copyright © National Academy of Sciences. All rights reserved.
Evaluating Obesity Prevention Efforts: A Plan for Measuring Progress
Evaluating Obesity Prevention Efforts234
The Importance of Focusing on Outputs and Short- and Intermediate-Term Outcomes
A good local monitoring and summative evaluation plan requires a dose of realism. People tend to focus automatically on health impacts such as a change in obesity prevalence, obesity-related diseases such as diabetes, or perhaps in diet and physical activity. Yet in local evaluations, this focus may be premature or overly ambitious, insofar as it may take years for changes in behavior and health to become apparent. Certainly, it is essential to learn “what works” to achieve health improvements, but a premature rush to evaluating behavior and health outcomes can lead to negative findings, with a chilling effect on innova-tion (Shadish et al., 1991).
Most community plans should focus monitoring and summative evaluation earlier in the logic model sequence than they do. This could be done instead of, concurrently with, or in preparation for, assessing behavior and health outcomes. Program evaluation should focus first on monitoring ade-quate implementation and dose (i.e., strength or intensity of intervention, duration, and reach); and community-level initiatives should focus on achieving the amount and kind of policy, environment, or systems changes sufficient to achieve population-level outcomes (dose). As an example, the 2008 Physical Activity Guidelines Advisory Committee has determined that 60 minutes of daily physical activity pre-vents childhood obesity (HHS, 2008); an intervention to increase daily physical activity can be well evaluated by monitoring implementation of the policy or program or measuring the minutes of physical activity. Although assessing weight changes may be desirable, it is not necessary and may not be feasible or affordable in the short term.
There are other reasons for community evaluations to focus earlier in the sequence of activities, outputs, outcomes, and population impacts. Most local evaluations are of short duration, so effects on behavior or health outcomes might not be seen during the evaluation time period. Without local or state-wide surveillance systems, the cost of measuring behaviors and obesity is often prohibitive. But building knowledge depends on gaining local experience with the short- and intermediate-term outcomes, which will tell us whether the dose of intervention was likely to be sufficient to achieve a population-level change in behaviors or obesity (see below). This challenge also applies to mass media programs or cam-paigns, such as the HBO/IOM TWOTN.
Monitoring and documenting implementation will assist in program improvement and assessing progress toward achieving system, policy, and environmental changes. Methods such as empowerment evaluation (Fetterman and Wandersman, 2005) and the Getting to Outcomes framework (Chinman et al., 2008) are especially helpful for program improvement, because they focus on the needs of implementers and on strategy for improvement. Assuring implementation is a particular problem in evaluating change in institutions such as school districts and large worksites where obesity and related health issues are not a priority, or where changes are distributed across several sectors (such as education, child care, or transportation), organizations, or organization subunits such as parks or schools within a district. In the community measurement approach developed by the University of Kansas (Fawcett and Schultz, 2008), community and evaluation partners use key informant interviews and report reviews to document and score instances of community/system changes (i.e., programs, policies, practices, built environment) and to characterize aspects related to their dose (e.g., strength of change strategy, duration, and reach; sectors and levels in which implemented).

Copyright © National Academy of Sciences. All rights reserved.
Evaluating Obesity Prevention Efforts: A Plan for Measuring Progress
235Monitoring and Summative Evaluation of Community Interventions
Assessment of Local Assets and Resources
A local obesity prevention policy monitoring system can not only spark and inform local policy development efforts, but also enhance policy evaluations (Chriqui et al., 2011). Such a system monitors the adoption and implementation of policies over time, includes specific criteria to rate the strength of policies, and describes the number of people affected by the policy (reach). However, few if any com-munities have such a monitoring system or the capacity to develop one. Table 8-2 summarizes issues to consider when designing a policy-monitoring system. Data on the built environment and status of policy adoption and implementation is generally not found in routinely collected data. Built environment audits and local policy-monitoring systems can fill this gap.
Data on the built and food environment can stimulate local action and also provide important data for evaluation and research (Brownson et al., 2009; Glanz, 2009; Sallis, 2009; Sallis and Glanz, 2009). These data can be used to, for example, determine the presence or absence of an environmental feature (e.g., a park or grocery store); assess the quality of the feature; document disparities in access; and evalu-ate progress (IOM, 2012b).
Three categories of environmental data are being used: (1) perceived measures obtained by tele-phone interview or self-administered questionnaires; (2) observational measures obtained using systematic observational methods (audits) that are collected “objectively” and “unobtrusively” (Cheadle et al., 1992; Saelens et al., 2003); and (3) archival data sets that are often layered and analyzed with geographic infor-mation systems. An emerging audit method is the use of remote assessment, such as Google Earth (Rundle et al., 2011; Taylor et al., 2011). These data can be used to drive public health actions at the local level (Fielding and Frieden, 2004). For example, collection of local data (bicycle and pedestrian counts) in Columbia, Missouri, has helped to document the effects of built environment changes (e.g., improved street design, sidewalks around schools, activity-friendly infrastructure) (Sayers et al., 2012).
Special Issues for Community-Level Initiatives
Multi-component community-level interventions have the special challenge of complexity. Interventions occur at several social-ecologic levels and with activities spanning the full spectrum of com-munity change, from development of policy, systems, capacity, and infrastructure change to resulting changes in environments and programs. Specifying which combination of interventions is optimal for health effects is not possible in most community-level evaluations—evaluating many sites using different combinations of interventions offers our best chance to determine “what works” in combination.
Local evaluation planners, however, have several options to cope with complexity. Most evaluations collect far more data than will be analyzed or used, so simplicity may be a virtue even in evaluation of community-level initiatives. One approach is to invest more resources in evaluation of a specific compo-nent of a multi-strategy initiative, rather than trying to evaluate all of them. The choice depends on the logic model, because it allows the plan to consider components that are
• ready for evaluation;• more likely to have an impact in the time frame of the evaluation;• plausible to achieve sufficient “dose” to change behavior, environments, or health outcomes;

Copyright © National Academy of Sciences. All rights reserved.
Evaluating Obesity Prevention Efforts: A Plan for Measuring Progress
Evaluating Obesity Prevention Efforts236
TABLE 8-2 Considerations When Designing a Local Monitoring System
Consideration Key Factors
System purpose • To understand the policy adoption and/or implementation process• To catalog on-the-books policies to assess policy change, readiness, implementation, and/or impact• To monitor changes in policy adoption over time• To facilitate multi-site collaborations across jurisdictions with similar policy surveillance systems
Policy jurisdiction
• County• Municipal• School district
Policy type • Legislative (e.g., ordinances, resolutions)• Administrative (e.g., regulations, executive orders)• Judicial decrees (e.g., case law)• Policy documents without the force of law (e.g., master or comprehensive plans, agency internal
policies and memos, position papers, etc.)
Periodicity • Will the system include only prospective policy adoption or changes or will it include retrospectively adopted policies?
• How often will updates be conducted (e.g., weekly, monthly, quarterly, annually)?
Policy status • Introduced/proposed policies• Enacted policies• Policies effective as of a certain date
Type of data to include
• Quantitative data documenting the policy presence/absence and/or the detailed policy elements (e.g., policy scope and strength)
• Qualitative data describing the policy content (including, possibly, keywords for searching the system)
Policy coding • For policy surveillance systems, how will the policies be evaluated to assess the scope and strength? — What will be the scientific basis for measures of the scope and strength of the policies?
• Will the coding scheme allow for the coding of new, innovative policy approaches?
Inclusion of policy process data
• Barriers and facilitators to policy adoption and/or implementation — Role and resources of key stakeholders/champions — Local contextual factors (e.g., socioeconomic and demographic factors, political climate, industry influences, etc.)
— Costs — Key factors influencing or inhibiting adoption and/or implementation
Inclusion of policy outcome/impact data
• Quantitative and/or qualitative data on the impact of a given policy• Short-, intermediate-, and long-term indicators of policy impact• Unintended consequences of the policy (positive and negative)
Resource availability and constraints
• Ongoing funding versus one-time funding to support the staffing required to develop and maintain the system over time
— Data systems/programmer support — Policy analyst support — Evaluation research support
SOURCE: Information summarized from Chriqui et al., 2011.

Copyright © National Academy of Sciences. All rights reserved.
Evaluating Obesity Prevention Efforts: A Plan for Measuring Progress
237Monitoring and Summative Evaluation of Community Interventions
• innovative so they add to national knowledge, or might become part of a cross-site evaluation; and
• more likely to be institutionalized or maintained over time.
It is quite feasible to conduct rigorous studies of intervention components this way, and for reasonable cost. The Food Trust8 is using this approach in two current randomized experiments, evaluating the effects of placement of healthy foods in Philadelphia’s corner stores and offering price incentives to con-sumers of whole milk to try low-fat and skim milk (Personal communication, Allison Karpyn, Director of Research and Evaluation, The Food Trust, April 3, 2013).
Planning for Credible Methods
Criteria for Credible Methods
A plan for credible evaluation needs to consider both scientific credibility and face validity or clar-ity for stakeholders. Some best practices for both scientific credibility and face validity are well within reach of local evaluators, and examples are presented in Appendix H. Scientific credibility means using the highest quality measures recommended in the National Collaborative on Childhood Obesity Research Registry that are also consistent with resources and local expertise, and a design that is appropriate for the questions to be asked. Even better would be the more consistent use of common measures for policy, environmental, systems, and behavioral changes, because they permit comparison across communities and interventions.
Indicators will only have credibility with stakeholders if they agree to them as accurate reflections of intervention reality and what would constitute intervention success. In particular, community-level initia-tives may garner some opposition, so the face validity of measures deserves strong consideration. In the same way, credibility is enhanced by transparency about the design and analysis.
Planning for Measurement and Data Collection
For the measurement and monitoring of implementation, evaluators need to balance information against respondent burden and intrusiveness, as well as cost. Monitoring of implementation will be most complete and successful if it provides useful feedback to program implementers themselves (Rossi et al., 2004). Policy and system changes often require advocacy or community organizing. To analyze and track progress in this area, the technique of Power Analysis (Pateriya and Castellanos, 2003) is useful. Power Analysis identifies, for any community organizing effort, who is for, against, or neutral about a suggested change, as well as their power to affect the success of the effort. Changes over time in the array of allies, opponents, and their power over the situation are highly revealing and helpful to community organizers.
Issues around the measurement of changes in knowledge, attitudes, and community norms are well-covered elsewhere (Fishbein and Ajzen, 2010). Prevention programs generally need to pay more atten-tion to the measurement of cost, given the importance of this issue to many potential users of evaluation. Lucid, helpful resources are available for this purpose (Haddix et al., 2002). Given the response burden in measuring costs that many prevention projects experience, as well as the variation in costs based on the
8 See http://www.thefoodtrust.org/index.php (accessed November 12, 2013).

Copyright © National Academy of Sciences. All rights reserved.
Evaluating Obesity Prevention Efforts: A Plan for Measuring Progress
Evaluating Obesity Prevention Efforts238
region of the United States (New York versus the rural south, for example), it might be helpful to docu-ment the staff time, material and other resources, and volunteer effort, rather than the actual dollar cost (IOM, 2012b). This would permit local users elsewhere in the nation to not only understand the level of effort and resources needed, but also consider the costs based on local conditions.
For evaluating changes in policy, environment, or systems, recommended tools are available through online inventories (see Table H-3 in Appendix H for a partial list), but instruments have proliferated and can be quite lengthy and complex (Saelens and Glanz, 2009). For most evaluations, it is helpful to use shorter measures that focus on aspects of the environment most closely related to the strategic aims of intervention, rather than use more comprehensive tools. For instance, to evaluate the effects of the Kansas City Chronic Disease Coalition (a CDC Racial and Ethnic Approaches to Community Health [REACH] 2010 initiative), Collie-Akers et al. (2007) documented, characterized, and graphically displayed the unfolding of community/systems changes over time; and this composite measure of the comprehensive intervention was associated with changes in diet among African American women in this low-income community.
Some of the indicators generated through CAS are useful for initiative evaluations if they capture environmental or policy changes appropriate to the intervention(s). These data can provide a low-cost alternative to primary data collection, comparison communities, and a longer time frame of available data. Mixed-methods approaches that combine quantitative and qualitative methods are recommended where possible. Photovoice and digital story telling using videos are particularly helpful in enabling the cultural groups most affected by the obesity epidemic to document and evaluate efforts on their behalf (Hannay et al., 2013; Wang et al., 2004). Where resources are very low, the monitoring and evaluation plan might consist of a retrospective assessment, using key informants to report on changes, supplemented by photos or other documentation. Documented qualitative changes, accompanied by specific examples and photos can be especially powerful in engaging community and providing pilot data that can be used to expand efforts and obtain additional funding for evaluation.
Monitoring and summative evaluation of behavioral and weight outcomes is challenging, given the time and resource limitations of most community interventions. “Gold standard” methods to capture changes in food and caloric intake patterns and minutes of physical activity, such as multiple 24-hour recalls and accelerometer studies, are labor intensive and time consuming. Anthropometric assessment of body mass index (BMI) is a reliable measurement technique when conducted by well-trained staff who follow rigorous protocols (Berkson et al., 2013), but it is expensive, especially outside of health care or institutional (e.g., schools) settings. BMI and behavioral measures can also be collected with self-reported measures using brief phone and/or paper surveys, but collecting primary survey data is costly. Existing secondary data (e.g., the Behavioral Risk Factor Surveillance System) in most parts of the United States lack sufficient respondents at the county or neighborhood level. Self-reported assessment of food intake, physical activity, height, and weight can be challenging in children (Dietz et al., 2009) and certain popula-tions (e.g., elderly, racial/ethnic groups with language barriers) (IOM, 2012b).
Community interventions seek population-level impact, which presents two additional data collec-tion challenges. First, they must sample and measure health behaviors and outcomes at the population level. This is a challenge, in part because we presume that community-level interventions will have small effects given the array of factors that shape physical activity and dietary behaviors (Koepsell et al., 1992; Merzel and D’Afflitti, 2003). Yet, even small effects from community-level changes will have importance at the population level (Homer et al., 2010). Unfortunately, small population-level changes are difficult

Copyright © National Academy of Sciences. All rights reserved.
Evaluating Obesity Prevention Efforts: A Plan for Measuring Progress
239Monitoring and Summative Evaluation of Community Interventions
to detect because the measurement and sampling error associated with population-level surveys require large sample sizes, which are costly to collect (Atienza and King, 2002; Koepsell et al., 1992; Merzel and D’Afflitti, 2003). In addition, it is difficult to obtain response rates that are representative of the entire population of a community without a substantial investment in multiple contacts to obtain completed surveys (Bunin et al., 2007; Curtin et al., 2005). In the absence of local-level surveillance information, a lower-cost option may be developing proxy measures or reasonable markers for population-level out-comes: for example, changes in the prevalence of obesity in children by measuring BMI in all 4th, 8th, and 11th graders as a marker of changes in food consumption (Hoelscher et al., 2010; personal communi-cation, Allison Karpyn, Director of Research and Evaluation, The Food Trust, April 3, 2013).
The second challenge concerns the length of follow-up. It is likely that community environmental and programmatic changes must be sustained over a long period of time for significant population-level impact. Most primary population-level data collection, however, is constrained by the funding period of the initiative, with data collection ending at or soon after intervention funding stops. To have a reasonable chance of detecting longer-term changes, some of the data collection resources must be shifted to one or more years beyond the initiative period, which means reducing sample sizes at each data collection occa-sion or finding more inexpensive, less comprehensive methods that permit a larger overall number of sur-veys over longer periods of time. One advantage of logic model designs (see below in the next section) is that they focus long-term follow-up data collection only in those communities where the dose or extent of community changes suggests there is likely to be an observed impact. Or, inversely, they can focus retro-spective collection of data on implementation or intermediate outcomes of community policies, programs, and environmental changes on those communities for which improvement in health outcomes were noted.
Planning for Design and Analysis
The local monitoring and summative evaluation plan needs to consider designs and analyses that are suitable to end-user questions. In many cases, the question “what works?” cannot be answered by the most common or feasible designs. In line with the L.E.A.D. framework (IOM, 2010), causal attribu-tion is not always necessary; it is not the only useful question to be asked. Even the weaker designs may be sufficient to demonstrate progress for local decision makers. Many designs are useful for monitor-ing implementation and delivering an intervention. Many designs can help to reduce uncertainty about which interventions are most promising or powerful for obesity prevention for subsequent more-definitive evaluations. With a few simple additions, weaker designs can become substantially stronger for assessing effectiveness as the program investment rises. In this section, various designs are presented as a range of options for consideration in line with end-user purposes.
Randomized experiments, whether at the individual or cluster level (e.g., schools, worksites, or randomly assigned communities) remain the gold standard for attributing outcomes to a program or community-level initiative. The methods for experiments are well established, but they are more suited to research than to most community-level evaluations. Testing what works for complex community-level initiatives is challenging given the cost and difficulty of randomizing entire communities (Merzel and D’Afflitti, 2003), and, as a result, the field has moved away from a focus on multi-site studies to a focus on individual communities. There are still group-randomized trials at levels less aggregated than com-munity (e.g., schools, worksites) and at least one retrospective, non-experimental study is currently under way (see Appendix H, Healthy Communities Study).

Copyright © National Academy of Sciences. All rights reserved.
Evaluating Obesity Prevention Efforts: A Plan for Measuring Progress
Evaluating Obesity Prevention Efforts240
The pre-/post-intervention design is most commonly used in single-community evaluations. Although it can be useful for other purposes, it is not adequate to assess effectiveness. In line with the L.E.A.D. framework (IOM, 2010), such evaluations may be enough to satisfy local decision makers that progress is being made. Unfortunately, for determining “what works” this design suffers from threats to validity that offer many plausible alternative explanations for any observed changes in behavior or health status (Shadish et al., 2002). An alternative explanation based on selection bias, for instance, is that citi-zens may be pre disposed to engage in healthful behavior; consequently they also demand, and obtain, health promotion programs, environmental changes, and relevant policies. Secular trends may also be responsible for change, in that increasing attention to obesity prevention over time may produce behav-ior changes, increased programs, and changes in policy and environment to meet citizen demands. Other alternative explanations include local history (i.e., something else happened in the intervention community concurrent with the intervention itself), seasonality (i.e., influencing changes in food intake and physical activity behavior), and, potentially, regression to the mean. The bottom line is that no pattern of change or lack of change in any outcome at a single site can be interpreted as a causal statement in the absence of a comparison group, given the range of predictable, regularly occurring alternative explanations.
The nonequivalent comparison group design is stronger than the single-group pretest-posttest design for community-level interventions. In this design outcomes are measured pre- and post-intervention in intervention communities and carefully selected comparison communities. The evaluation of Shape up Somerville, often cited as a successful community-level initiative, is an example of this approach and employed a single community with two comparison communities (Economos et al., 2007). However, results from nonequivalent comparison group designs are still subject to alternative interpretations. The most obvious is that the comparison group is, by definition, nonequivalent, and any measured or unmeasured differences between program and control sites could explain any differences in outcomes. Evaluators may attempt to adjust statistically for initial differences. However, error connected with mea-surement can actually introduce statistical bias, and it will not be clear whether the findings were over or under adjusted (Shadish et al., 2002).
Logic model designs start with a theory of change about the mechanism by which the comprehen-sive community initiative is intended to achieve its long-term outcomes and then create indicators for each step in the logic model. If the temporal pattern of change is consistent with that specified in the logic model, and if intermediate outcomes specified in advance are plausibly related to the outcomes, then the intervention is more likely to have been the cause of the population-level changes. These designs are more definitive about causal attribution than the pre- and post-intervention designs, although the results can still be open to alternative explanations, in particular, selection bias. Nevertheless, with a myriad of poten-tial factors affecting obesity, logic model designs are useful to identify the strategies that are most likely to have power for prevention. They are useful for the complexity and emergent nature of community-level initiatives, and, in various ways, they inform the field about the amount and kind of community/system changes—and associated time and effort—that will be required to achieve results. Two examples appear in Appendix H.
The advantage of logic model designs is that they are more “specific,” that is, better able to rule out false positives where a favorable population-level change occurred that was not the result of the initia-tive. Thus, if a behavioral outcome improves but there are no corresponding community changes, or if the intervention does not have a sufficient dose (i.e., strength of intervention, duration, and reach), then it is

Copyright © National Academy of Sciences. All rights reserved.
Evaluating Obesity Prevention Efforts: A Plan for Measuring Progress
241Monitoring and Summative Evaluation of Community Interventions
much harder to conclude that the intervention was responsible for the observed positive outcome. A chal-lenge of the logic model approach is that it requires an accurate assessment of the amount and kind (dose) of changes in the community/environment (e.g., Collie-Akers et al., 2007). Intervention intensity, duration, and fidelity have been found to be associated with size of effects in other evaluation fields, and they are widely recognized as important concepts, although the concept of reach is not always addressed (Hulleman and Cordray, 2009).
By adding even a few design features, evaluations become stronger to assess effectiveness. Even two pre-intervention measurements, rather than a single baseline measurement, can help to reduce uncertain-ties about secular trends in behavior or health outcomes and increase reliability of measures. With local- or state-level surveillance systems, it may even become feasible to use short interrupted time series (or multiple base line designs), a far preferable design that helps to control for several alternative explanations (Shadish et al., 2002). Causal modeling, also called path analysis, builds on the logic model approach by establishing that an intervention precedes the outcomes in time, then applies regression analysis to examine the extent to which the variance in outcomes is accounted for by the intervention compared to other forces. The “population dose” approach also uses causal modeling in analysis, but causal modeling can be used independently of dose measurement—it is a statistical control concept (see Appendix H for additional information on the “population dose” approach). Although it confines itself to examining asso-ciations, the Healthy Communities Study is an especially rigorous example of causal modeling in that it includes measures of both the amount and intensity of community programs/policies (the dose) and child-hood obesity rates (the intended outcome) (see Appendix H). Finally, the regression-discontinuity design rules out most alternative explanations and provides similar estimates to those of experimental designs, provided that its assumptions are met (Shadish et al., 2002). Yet it is under-utilized in prevention research (see Appendix H for an example of regression-discontinuity design).
Synthesis and Generalization
Disseminating and Compiling Studies
Understanding the extent of community-level changes required to bring about health outcomes is the first step toward generalized knowledge and spread of effective prevention. Local evaluations are vital to this process, because there will be some overlap in the mix of intervention components, creating potential to identify the ones with power to effect change. Yet compiling and synthesizing the results of local evalu-ations are challenges, for at least two reasons. First, measures of policy, environment, and even behavioral changes are not yet collected using commonly accepted measures that can be compared and synthesized. Cost information is rare, although recent federal efforts in Community Transformation Grants (CTGs) and Communities Putting Prevention to Work (CPPW) may soon cast light on the issue of resources necessary for these efforts. Second, website locations for an end user of evaluation to visit and find the desired infor-mation are in flux—the Cochrane Collaboration and the Task Force on Community Preventive Services are the main repositories for systematic reviews, but their emphasis on strength of evidence tends to underrate the weight of evidence from evaluations conducted under less controlled conditions. Evaluation results are scattered in peer-reviewed and non-peer-reviewed publications, across many websites and at presentations at multiple conferences. In the interest of generalized knowledge, more needs to be done to aggregate study findings about what combinations of strategies work and under what conditions.

Copyright © National Academy of Sciences. All rights reserved.
Evaluating Obesity Prevention Efforts: A Plan for Measuring Progress
Evaluating Obesity Prevention Efforts242
If studies using various designs (e.g., multiple baselines, causal modeling, regression-discontinuity, pre-post measurement, and nonequivalent comparison communities) all reach the same conclusions about behavior change, then this is to the good. Heterogeneous studies provide a stronger inference about cau-sation than do a large number of studies that are all vulnerable to the same alternative explanations. The availability of multiple single-community evaluations suggests that building the evidence base about community-level interventions will depend on many evaluations of individual strategies—or combinations of strategies—rather than a handful of large-scale experimental or quasi-experimental studies. Finally, dis-parate findings from multiple evaluations can offer insight as to the applicability of some interventions for some populations and the inappropriateness of those same interventions for other populations (Green and Glasgow, 2006).
Learning More from Implementation Monitoring
A wealth of local evaluation information will likely become available from CDC’s CPPW, REACH, and CTG initiatives, as well as other national initiatives with multiple local sites. Yet, there is no central forum or repository to understand barriers and facilitators to implementation, assess costs and cost- effectiveness of alternatives, or to gain an improved understanding about what can be implemented for a given amount of time and resources, and what can be learned from important variations in implementa-tion. It is critically important to synthesize and assemble this information as these large national initiatives conclude. They are essential for translation and scaling up, as well as for generalizability about the effec-tiveness of obesity prevention.
Although evaluation generally looks to outcome studies to understand generalizability, this conven-tional interpretation is not sufficient (Green and Glasgow, 2006). The conventional view is that one must accrue randomized controlled trials or at least quasi-experiments to establish external validity (Shadish et al., 2002). Yet, this view ignores issues concerning feasibility, cost, and context of implementation of the same intervention in diverse settings. Practitioner knowledge about what is or can be implemented in a given setting, not to mention their special knowledge of the population’s preferences and current knowl-edge, attitudes, and behavior, is essential. Generalizability also means reducing uncertainty about what will work in a given setting, population, and with available resources (Cronbach, 1982). This information is potentially available from the evaluation reports regarding government investments—such as CPPW, CTG, and REACH—as well as foundation initiatives.
Using Common Outcome Measures to Assist Comparisons and Generalizability
Preventing obesity requires an adjustment of daily calorie intake and expenditure, changes that can be achieved through many policy and environmental changes (Wang et al., 2012). As more is learned about the policy, environmental, and systems changes that lead to behavior and weight changes, it may eventually become possible to project these outcomes for local evaluations rather than measure them directly. However, this can only happen if the measures employed in research and evaluation become commonly accepted and used and are translatable into calories ingested or expended. Comparable cost measurement is also vitally needed. If these improvements were made, then strategies could be compared for their effectiveness and cost-effectiveness. With more systematic attention to measuring costs and out-comes in a commonly accepted fashion, obesity prevention could achieve the same ability to translate interventions to the bottom line for health, cost-effectiveness, and quality of life that the health sector has

Copyright © National Academy of Sciences. All rights reserved.
Evaluating Obesity Prevention Efforts: A Plan for Measuring Progress
243Monitoring and Summative Evaluation of Community Interventions
seen for hypertension control (Weinstein and Stason, 1976) or HIV prevention (Farnham et al., 2010). In fact, Wang et al. (2012) developed the energy gap framework to estimate the effects on childhood obesity of a wide range of prevention activities. They reviewed the literature on interventions affecting youth diet, activity levels, energy balance, and weight, examining calorie intake or expenditure where this informa-tion was available, and also estimating the reach of the interventions. They have developed a Web-based tool9 to allow users to project the impact of policy, environmental, and program changes on childhood obesity at the population level.
Shared Interpretation of Results and Cultural Competence
The Committee acknowledges that each community is unique in its aims, context, and broader determinants of health. Yet, across communities, when local people, such as those experiencing health disparities consistently point to preferences for particular obesity prevention strategies, when they “vote with their feet” for participation and engagement, or when they consistently interpret community con-ditions such as built environment features in particular ways, then it behooves evaluators to listen. Methods are available to synthesize and interpret qualitative data such as photovoice and focus groups (Yin and Heald, 1975), and these can be combined in mixed-method studies to better understand out-comes and address disparities in obesity for the most vulnerable populations (Yin, 2008). Participatory evaluation approaches provide an opportunity for understanding of the findings. By engaging commu-nity and scientific partners together in systematically reflecting on the data, there will often be a better answer to questions such as
• What are we seeing? (e.g., Is there an association between the level of the intervention and
improvement or worsening in outcomes?)• What does it mean? (e.g., What does this suggest about the amount and kind of intervention
strategies that may be necessary?)• Implications for adjustment? (e.g., Given what we are learning, what adjustments should we
make in our efforts?) (Fawcett et al., 2003).
Disentangling Effects of Interventions
Certain communities are starting to report reductions in obesity. The difficulty is that there is rarely one single intervention that made a difference, and the different components of the comprehensive inter-vention (e.g., programs, policies, and built environment features) came online at different time points. For example, Philadelphia has reported a reduction in childhood obesity from 21.5 percent to 20.5 percent over a 3-year period, and a wide variety of school and community interventions—different policies, pro-grams, and environmental changes in multiple sectors—may be responsible (Robbins et al., 2012). But which initiatives—combinations of programs and policies—have the greatest potential to achieve this result? What about cost-effectiveness? Which ones should other communities replicate? What combina-tion of interventions had the most power?
One response is that the unique context of a given community makes for a complex set of events that is difficult to interpret. Yet this is not sufficient. True, complexity and context make for unique
9 See http://www.caloriccalculator.org (accessed November 12, 2013).

Copyright © National Academy of Sciences. All rights reserved.
Evaluating Obesity Prevention Efforts: A Plan for Measuring Progress
Evaluating Obesity Prevention Efforts244
combinations of interventions and outcomes in any given community. However, new patterns can be seen when one steps back from complexity and looks at differences and similarities across community initiatives. Looking across many communities, it may become possible to identify the interventions that are consistently associated with improvements in outcomes. It may even be possible to derive theories to explain the patterns after the fact, a practice that has become very useful for evaluation in complex areas such as quality improvement in medicine (Dixon-Woods et al., 2011). Theories of importance to community-level initiatives might include organizational change theory, for example (Glanz and Bishop, 2010). Such patterns might be identified, provided that the outcomes of local community-level evaluations become more readily available through fully published details of the interventions and their implementa-tion and context (Green et al., 2009). For example, Philadelphia instituted major changes in the public schools and in the communities surrounding the schools. If these features are consistently seen in urban communities where obesity has declined, then at a minimum they rise to the top of priorities for further study. This is yet another way that single site, pre-post evaluations (perhaps complemented with logic model designs) can have value. Combined with research projects that improve measurement of the com-munity intervention and introduce a variety of controls (perhaps using nonequivalent control, regression discontinuity, or interrupted time series designs), such instances reduce uncertainty about the best invest-ments for scarce prevention resources.
However, it will not always be possible to detect which intervention made the most difference. It is important to keep documenting the outcome of interest, as would a historian, documenting key events and contextual changes that occur on the timeline.
A Better System to Identify Interventions That Are Suitable for Evaluation
Across communities and interventions, the wealth of potential leverage points to intervene is daunting—an “embarrassment of riches” thanks to the social ecological model. In addition to disentan-gling the powerful leverage points in existing evaluations, it may be possible to approach the problem dif-ferently, through the Systematic Screening and Assessment (SSA) Method (Leviton et al., 2010a). Whereas syn thesis relies on collecting the results of existing evaluations, the SSA Method collects promising pro-grams and then determines whether they are worthwhile evaluating. The SSA Method was initially used in collaboration among RWJF, CDC, and the ICF Macro contract research firm to screen 458 nominations of policy and environmental change initiatives to prevent childhood obesity. An expert panel reviewed these nominations and selected 48 that underwent evaluability assessments to assess both their poten-tial for population-level impact and their readiness for evaluation. Of these, 20 were deemed to be both promising and ready for evaluation, and at least 6 of the top-rated innovations have now undergone eval-uation. Byproducts of this process included some insights about the combinations of program components that were plausible to achieve population-level outcomes. Out of the array of potential leverage points, at least some were identified as having more payoffs, in advance of costly evaluation.
ExAMPLE: OPPORTUNITIES ANd ChALLENGES OF EVALUATING COMMUNITY-LEVEL COMPONENTS OF ThE wEIGhT OF ThE NATION
Some of the opportunities and challenges for measuring progress in obesity prevention at the community level can be illustrated using TWOTN as an example. The TWOTN video and collateral

Copyright © National Academy of Sciences. All rights reserved.
Evaluating Obesity Prevention Efforts: A Plan for Measuring Progress
245Monitoring and Summative Evaluation of Community Interventions
campaign—a nationally developed program—can be employed locally to engage stakeholders to take action as part of a multi-component awareness, advocacy, and action strategy (see Chapter 1 for descrip-tion). One approach to assessing the local contributions of TWOTN, as distinguished from national con-tributions (see Chapter 6 for description of measurement opportunities of the national components), is to evaluate such local efforts consistent with their stated aims and an articulated logic model or theory of change. The following describes current community-level evaluations that are in process and how the use of a logical model as described in this chapter could focus the analysis and improve the evaluation infor-mation. Two local-level evaluations of TWOTN are in process. First, Kaiser Permanente surveyed people who conducted small-group screenings of TWOTN and planners and supporters of community-level activities. The surveys focused on participation, usefulness of media and written materials, and intended changes (Personal communication, Sally Thompson Durkan, Kaiser Permanente, April 29, 2013).
Second, CDC Prevention Research Centers (PRCs), led by the University of North Carolina, Chapel Hill, are identifying locally hosted screenings, conducting a pretest and immediate posttest, and following up with 6-week Web surveys of participants willing to be contacted by e-mail. They ask about message credibility, self-efficacy for both individual- and community-level change, community capacity for change, intention to make individual change as well as influence policy and environmental change, and support for three obesity-related policies. The follow-up survey queries respondents about action taken on the single item they identified as a focus of their activity in the posttest.
These CDC PRC efforts will provide some information about community-level activities subsequent to screenings. The community-level evaluations could be more useful if they analyzed their data using the logic model design described above. For example, if schools utilize TWOTN-derived products, such as the three follow-on children’s movies released in May 2013, then one might assess changes in knowledge about obesity before versus after viewing the movies. Lacking a logic model, or even in addition to the logic model, content analysis of the movies could provide an indication of the particular themes and infor-mation that are being emphasized. Any other specific objectives of the children’s movies would need to be specified in advance and measured before and after their viewing. This would be strengthened if measured for comparison in nearly identical classrooms, schools, or other units not exposed, with the pre-post dif-ferences between units the measure of effect. This, in turn, would be further strengthened if multiple units exposed and not exposed were randomly assigned to receive or not receive the exposure to the video and other TWOTN components. Implementing these steps will require a sustained commitment of resources to support measurement of the community components of the campaign.
Other approaches recommended at the 2012 IOM Workshop (IOM, 2012b) (see Chapter 5) might also be considered. Regardless of research design, the Committee would emphasize the importance of
• utilizing strong theoretical or logic models (Cheadle et al., 2003; Julian, 1997); • monitoring reach or dosage, which is actually a critical step in the logic model for any health
promotion program or mass media campaign (Cheadle et al., 2012; Glasgow et al., 2006; Hornik, 2002);
• conducting multiple waves of measurement, the more the better, preferably both before and after a campaign (Shadish et al., 2002); and

Copyright © National Academy of Sciences. All rights reserved.
Evaluating Obesity Prevention Efforts: A Plan for Measuring Progress
Evaluating Obesity Prevention Efforts246
• replicating and more structured reporting on the reach, effectiveness (with whom), adoption by organizations, implementation, and maintenance to enhance external validity or adaptability to other settings (Glasgow et al., 1999).
The mass media literature emphasizes the importance of exposure to the message (Hornik, 2002; IOM, 2012b), which is closely associated with or equivalent to reach and dose; the literature on small-group and community-based interventions emphasizes the parallel concept of participation in the inter-vention (Glasgow et al., 2006). It is inherently obvious that an intervention, whether it is a mass media campaign or a community-based intervention, cannot affect people’s attitudes or behaviors unless they are exposed to and participate in it. The reach or exposure might amount to as little as a touch, with the associated outcome being the person’s or group’s awareness or recognition of some feature of the event or message, or as much as intensive engagement, measured by a higher level of recall, knowledge, and reaction to the event or message, discussion with others, engagement in new behaviors, and possibly attri-bution of a behavior change to the intervention.
SUMMARY
Community-level monitoring and summative evaluations are vital for guiding local action and informing national choices about the most effective and cost-effective obesity prevention interventions rec-ommended in the IOM Accelerating Progress in Obesity Prevention (APOP) report for funding, dissemi-nation, and uptake by other communities. The depth and rigor of the evaluations should depend on user needs, the resources available, and the context. Although the highest quality designs and measurement are always helpful, resources may not be available to use them and user questions may not require them. If the monitoring and summative evaluation plan considers resource levels in the context of end-user needs, then key outcomes are likely to be addressed, as summarized in Table 8-3.
Even a few modest additions can greatly improve the credibility and quality of community moni-toring and summative evaluation measurement and designs. Yet even the less preferred and less rigorous evaluation designs and measurement can be helpful in aggregate, at the national level, to reduce uncer-tainty about priority strategies for adoption and further study. Monitoring and summative evaluation plans should at a minimum incorporate the elements of stakeholder involvement; identify and leverage resources; describe the intervention’s framework, logic model, or theory of change; focus the monitoring and evaluation plan; use credible methods; and synthesize and generalize the findings. Given the existing gaps in the current infrastructure for monitoring and summative evaluation of APOP report strategies identified by the Committee, Chapter 10 provides seven recommendations (and a set of potential actions and actors) to support the successful implementation of the components of the Community-Level Obesity Intervention Monitoring and Summative Evaluation Plan.

Copyright © National Academy of Sciences. All rights reserved.
Evaluating Obesity Prevention Efforts: A Plan for Measuring Progress
247Monitoring and Summative Evaluation of Community Interventions
TABLE 8-3 Recommended Approaches for Key Outcomes of Community Monitoring and Summative Evaluation, by Level of Evaluation Resources
Resources
Key Outcomes
Documenting environmental change Estimating the dose Measuring population-level impact
Low (5-10%)a
Oral and written progress reporting annually from community coordinators
Observation of selected key strategies
Intensity (strength, duration, reach) estimates based on progress report information and the literature when available
Secondary data, when available at an appropriate geographic level
Medium(10-15%)
Oral and written progress reporting at regular intervals jointly by evaluators and community coordinators
Use of environmental and policy assessment tools for selected key strategies
Intensity (strength, duration, reach) estimates based on progress reporting information, literature when available, and program evaluations of selected key strategies
Secondary data, if available School-based surveys of youth
food and physical activity attitudes and behaviors
High(>15%)
Oral and written progress reporting at regular intervals jointly by evaluators and community coordinators
Use of comprehensive and validated environmental and policy assessment tools for all key strategies
Intensity (strength, duration, reach) estimates based on progress reporting information, literature when available, and program evaluations of all key strategies
Secondary data, if availableSchool-based surveys of youth Mail/phone surveys of adults
a Percentages indicate the amount of resources for evaluation, as a percentage of the intervention budget. SOURCE: Adapted from Community Tool Box (http://ctb.ku.edu/en/default.aspx, accessed Novemer 12, 2013).
REFERENCES
American Evaluation Association. 2011. American Evaluation Association public statement on cultural competence
in evaluation. http://www.eval.org/p/cm/ld/fid=92 (accessed June 3, 2013).
Anderson, L. M., T. A. Quinn, K. Glanz, G. Ramirez, L. C. Kahwati, D. B. Johnson, L. R. Buchanan, W. R. Archer,
S. Chattopadhyay, G. P. Kalra, D. L. Katz, and Task Force on Community Preventive Services. 2009. The
effectiveness of worksite nutrition and physical activity interventions for controlling employee overweight and
obesity: A systematic review. American Journal of Preventive Medicine 37(4):340-357.
Ashe, M., L. M. Feldstein, S. Graff, R. Kline, D. Pinkas, and L. zellers. 2007. Local venues for change: Legal strate-
gies for healthy environments. Journal of Law, Medicine, and Ethics 35(1):138-147.
Atienza, A. A., and A. C. King. 2002. Community-based health intervention trials: An overview of methodological
issues. Epidemiologic Reviews 24(1):72-79.
Bailey, E. J., S. G. Kruske, P. S. Morris, C. J. Cates, and A. B. Chang. 2008. Culture-specific programs for children
and adults from minority groups who have asthma. Cochrane Database of Systematic Reviews (2):CD006580.

Copyright © National Academy of Sciences. All rights reserved.
Evaluating Obesity Prevention Efforts: A Plan for Measuring Progress
Evaluating Obesity Prevention Efforts248
Berkson, S. S., J. Espinola, K. A. Corso, H. Cabral, R. McGowan, and V. R. Chomitz. 2013. Reliability of height and
weight measurements collected by physical education teachers for a school-based body mass index surveillance
and screening system. Journal of School Health 83(1):21-27.
Booth, K. M., M. M. Pinkston, and W. S. Poston. 2005. Obesity and the built environment. Journal of the American
Dietetic Association 105(5 Suppl 1):S110-S117.
Brook, R. H., E. B. Keeler, K. N. Lohr, J. P. Newhouse, J. E. Ware, W. H. Rogers, A. Ross Davies, C. D. Sherbourne,
G. A. Goldberg, P. Camp, C. Kamberg, A. Leibowitz, J. Keesey, and D. Reboussin. 2006. The health insurance
experiment: A classic RAND study speaks to the current health care reform debate. Santa Monica, CA: RAND
Corporation.
Brownson, R. C., C. M. Hoehner, K. Day, A. Forsyth, and J. F. Sallis. 2009. Measuring the built environment for
physical activity: State of the science. American Journal of Preventive Medicine 36(4 Suppl):S99-S123, e1-e12.
Bunin, G. R., L. G. Spector, A. F. Olshan, L. L. Robison, M. Roesler, S. Grufferman, X. O. Shu, and J. A. Ross.
2007. Secular trends in response rates for controls selected by random digit dialing in childhood cancer
studies: A report from the children’s oncology group. American Journal of Epidemiology 166(1):109-116.
CDC (Centers for Disease Control and Prevention). 2007. Best practices for comprehensive tobacco control
programs—October 2007. Atlanta, GA: U.S. Department of Health and Human Services, Centers for Disease
Control and Prevention, National Center for Chronic Disease Prevention and Health Promotion, Office on
Smoking and Health.
CDC. 2012. Community transformation grants (CTG). http://www.cdc.gov/communitytransformation/index.htm
(accessed April 10, 2013).
Cheadle, A., E. Wagner, T. Koepsell, A. Kristal, and D. Patrick. 1992. Environmental indicators: A tool for evaluating
community-based health-promotion programs. American Journal of Preventive Medicine 8(6):345-350.
Cheadle, A., W. L. Beery, H. P. Greenwald, G. D. Nelson, D. Pearson, and S. Senter. 2003. Evaluating the California
Wellness Foundation’s Health Improvement Initiative: A logic model approach. Health Promotion Practice
4(2):146-156.
Cheadle, A., P. M. Schwartz, S. Rauzon, E. Bourcier, S. Senter, and R. Spring. 2012. Using the concept of “popula-
tion dose” in planning and evaluating community-level obesity prevention initiatives. Clinical Medicine &
Research 10(3):184-185.
Chinman, M., S. Hunter, P. Ebener, S. Paddock, L. Stillman, P. Imm, and A. Wandersman. 2008. The Getting to
Outcomes demonstration and evaluation: An illustration of the prevention support system. American Journal
of Community Psychology 41(3-4):206-224.
Chriqui, J. F., J. C. O’Connor, and F. J. Chaloupka. 2011. What gets measured, gets changed: Evaluating law and
policy for maximum impact. Journal of Law, Medicine & Ethics 39:21-26.
Collie-Akers, V. L., S. B. Fawcett, J. A. Schultz, V. Carson, J. Cyprus, and J. E. Pierle. 2007. Analyzing a community-
based coalition’s efforts to reduce health disparities and the risk for chronic disease in Kansas City, Missouri.
Preventing Chronic Disease 4(3):A66. http://www.cdc.gov/pcd/issues/2007/jul/06_0101.htm (accessed June 4,
2013).
COMMIT Research Group. 1995. Community intervention trial for smoking cessation (COMMIT): I. Cohort results
from a four-year community intervention. American Journal of Public Health 85(2):183-192.
Community-Campus Partnerships for Health. 2013. Community-campus partnerships for health. Service learning.
http://depts.washington.edu/ccph/servicelearningres.html (accessed June 3, 2013).
Community Preventive Services Task Force. 2013. The guide to community preventive services: What works to pro-
mote health. http://www.thecommunityguide.org/index.html (accessed April 10, 2013).
Council on Education for Public Health. 2005. Accreditation criteria schools of public health. http://www.ceph.org/
assets/SPH-Criteria.pdf (accessed June 3, 2013).

Copyright © National Academy of Sciences. All rights reserved.
Evaluating Obesity Prevention Efforts: A Plan for Measuring Progress
249Monitoring and Summative Evaluation of Community Interventions
County Health Rankings. 2013. What works for health. http://www.countyhealthrankings.org/programs (accessed
May 31, 2013).
Cronbach, L. J. 1982. Designing evaluations of educational and social programs. San Francisco, CA: Jossey-Bass.
Curtin, R., S. Presser, and E. Singer. 2005. Changes in telephone survey nonresponse over the past quarter century.
Public Opinion Quarterly 69(1):87-98.
Dietz, W. H., M. T. Story, and L. C. Leviton. 2009. Issues and implications of screening, surveillance, and reporting
of children’s BMI. Pediatrics 124(Suppl 1):S98-S101.
Dixon-Woods, M., C. L. Bosk, E. L. Aveling, C. A. Goeschel, and P. J. Pronovost. 2011. Explaining Michigan:
Developing an ex post theory of a quality improvement program. Milbank Quarterly 89(2):167-205.
Doyle, S., A. Kelly-Schwartz, M. Schlossberg, and J. Stockard. 2006. Active community environments and health:
The relationship of walkable and safe communities to individual health. Journal of the American Planning
Association 72(1):19-31.
Economos, C. D., R. R. Hyatt, J. P. Goldberg, A. Must, E. N. Naumova, J. J. Collins, and M. E. Nelson. 2007. A
community intervention reduces BMI z-score in children: Shape Up Somerville first year results. Obesity (Silver
Spring) 15(5):1325-1336.
Farnham, P. G., D. R. Holtgrave, S. L. Sansom, and H. I. Hall. 2010. Medical costs averted by HIV prevention
efforts in the United States, 1991-2006. Journal of Acquired Immune Deficiency Syndromes 54(5):565-567.
Farquhar, J. W., S. P. Fortmann, J. A. Flora, C. B. Taylor, W. L. Haskell, P. T. Williams, N. Maccoby, and P. D. Wood.
1990. Effects of communitywide education on cardiovascular disease risk factors. The Stanford Five-City
Project. Journal of the American Medical Association 264(3):359-365.
Fawcett, S. B., and J. A. Schultz. 2008. Supporting participatory evaluation using the Community Tool Box online
documentation system. In Community-based participatory research for health, edited by M. Minkler and N.
Wallerstein. San Francisco, CA: Jossey-Bass. Pp. 419-424.
Fawcett, S. B., R. Boothroyd, J. A. Schultz, V. T. Francisco, V. Carson, and R. Bremby. 2003. Building capacity
for participatory evaluation within community initiatives. Journal of Prevention and Intervention in the
Community 26(2):21-36.
Fetterman, D. M., and A. Wandersman, eds. 2005. Empowerment evaluation. Principles in practice. New York: The
Guilford Press.
Fielding, J. E., and T. R. Frieden. 2004. Local knowledge to enable local action. American Journal of Preventive
Medicine 27(2):183-184.
Fishbein, M., and I. Ajzen. 2010. Predicting and changing behavior: The reasoned action approach. New York:
Taylor & Francis Group.
Fitzpatrick, J. L., J. R. Sanders, and B. R. Worthen. 2010. Program evaluation: Alternative approaches and practical
guidelines. 4th ed. Upper Saddle River, NJ: Pearson.
Glanz, K. 2009. Measuring food environments: A historical perspective. American Journal of Preventive Medicine
36(4 Suppl):S93-S98.
Glanz, K., and D. B. Bishop. 2010. The role of behavioral science theory in development and implementation of
public health interventions. Annual Review of Public Health 31:399-418.
Glanz, K., and D. Hoelscher. 2004. Increasing fruit and vegetable intake by changing environments, policy and
pricing: Restaurant-based research, strategies, and recommendations. Preventive Medicine 39(Suppl 2):S88-S93.
Glasgow, R. E., T. M. Vogt, and S. M. Boles. 1999. Evaluating the public health impact of health promotion inter-
ventions: The RE-AIM framework. American Journal of Public Health 89(9):1322-1327.
Glasgow, R. E., L. M. Klesges, D. A. Dzewaltowski, P. A. Estabrooks, and T. M. Vogt. 2006. Evaluating the impact
of health promotion programs: Using the RE-AIM framework to form summary measures for decision making
involving complex issues. Health Education Research 21(5):688-694.

Copyright © National Academy of Sciences. All rights reserved.
Evaluating Obesity Prevention Efforts: A Plan for Measuring Progress
Evaluating Obesity Prevention Efforts250
Green, L. W., and R. E. Glasgow. 2006. Evaluating the relevance, generalization, and applicability of research: Issues
in external validation and translation methodology. Evaluation and the Health Professions 29(1):126-153.
Green, L. W., R. E. Glasgow, D. Atkins, and K. Stange. 2009. Making evidence from research more relevant, use-
ful, and actionable in policy, program planning, and practice: Slips “twixt cup and lip.” American Journal of
Preventive Medicine 37(6S1)S187-S191.
Haddix, A. C., S. M. Teutsch, and P. S. Corso. 2002. Prevention effectiveness: A guide to decision analysis and eco-
nomic evaluation. New York: Oxford University Press.
Hannay, J., R. Dudley, S. Milan, and P. K. Leibovitz. 2013. Combining photovoice and focus groups: Engaging
Latina teens in community assessment. American Journal of Preventive Medicine 44(3 Suppl 3):S215-S224.
Hawkins, N. G., R. W. Sanson-Fisher, A. Shakeshaft, C. D’Este, and L. W. Green. 2007. The multiple baseline design
for evaluating population-based research. American Journal of Preventive Medicine 33(2):162-168.
Hawthorne, K., Y. Robles, R. Cannings-John, and A. G. Edwards. 2008. Culturally appropriate health education for
type 2 diabetes mellitus in ethnic minority groups. Cochrane Database of Systematic Reviews (3):CD006424.
Heath, G. W., R. C. Brownson, J. Kruger, R. Miles, K. E. Powell, L. T. Ramsey, and Task Force on Community
Preventive Services. 2006. The effectiveness of urban design and land use and transport policies and practices
to increase physical activity: A systematic review. Journal of Physical Activity and Health 3(Suppl 1):S55-S76.
HHS (Department of Health and Human Services). 2008. Physical activity guidelines for Americans. Washington, DC:
Department of Health and Human Services.
Hoelscher, D. M., S. H. Kelder, A. Perez, R. S. Day, J. S. Benoit, R. F. Frankowski, J. L. Walker, and E. S. Lee. 2010.
Changes in the regional prevalence of child obesity in 4th, 8th, and 11th grade students in Texas from 2000-
2002 to 2004-2005. Obesity (Silver Spring) 18(7):1360-1368.
Homer, J., B. Milstein, K. Wile, J. Trogdon, P. Huang, D. Labarthe, and D. Orenstein. 2010. Simulating and evaluat-
ing local interventions to improve cardiovascular health. Preventing Chronic Disease 7(1):A18. http://www.
cdc.gov/pcd/issues/2010/jan/08_0231.htm (accessed June 4, 2013).
Hornik, R. C. 2002. Exposure: Theory and evidence about all the ways it matters. Social Marketing Quarterly
8(3):31-37.
Hulleman, C. S., and D. S. Cordray. 2009. Moving from the lab to the field: The role of fidelity and achieved relative
intervention strength. Journal of Research on Educational Effectiveness 2(1):88-110.
IOM (Institute of Medicine). 2009. Local government actions to prevent childhood obesity. Washington, DC: The
National Academies Press.
IOM. 2010. Bridging the evidence gap in obesity prevention: A framework to inform decision making. Washington,
DC: The National Academies Press.
IOM. 2012a. Accelerating progress in obesity prevention: Solving the weight of the nation. Washington, DC: The
National Academies Press.
IOM. 2012b. Measuring progress in obesity prevention: Workshop report. Washington, DC: The National Academies
Press.
Israel, B. A., E. Eng, A. J. Schulz, and E. A. Parker. 2012. Methods for community-based participatory research for
health. 2nd ed. San Francisco, CA: Jossey-Bass.
Issel, L. M. 2009. Health program planning and evaluation: A practical systematic approach for community health.
2nd ed. Sudbury, MA: Jones and Bartlett Publishers.
Jagosh, J., A. C. Macaulay, P. Pluye, J. Salsberg, P. L. Bush, J. Henderson, E. Sirett, G. Wong, M. Cargo, C. P.
Herbert, S. D. Seifer, L. W. Green, and T. Greenhalgh. 2012. Uncovering the benefits of participatory research:
Implications of a realist review for health research and practice. Milbank Quarterly 90(2):311-346.
Julian, D. A. 1997. The utilization of the logic model as a system level planning and evaluation device. Evaluation
and Program Planning 20(3):251-257.

Copyright © National Academy of Sciences. All rights reserved.
Evaluating Obesity Prevention Efforts: A Plan for Measuring Progress
251Monitoring and Summative Evaluation of Community Interventions
Kahn, E. B., L. T. Ramsey, R. C. Brownson, G. W. Heath, E. H. Howze, K. E. Powell, E. J. Stone, M. W. Rajab, and
P. Corso. 2002. The effectiveness of interventions to increase physical activity. A systematic review. American
Journal of Preventive Medicine 22(4 Suppl):73-107.
Khan, L., K. Sobush, D. Keener, K. Goodman, A. Lowry, J. Kakietek, S. zaro. 2009. Recommended community
strategies and measurements to prevent obesity in the United States. Morbidity and Mortality Weekly Report
58(RR-7):1-26.
King, G., E. Gakidou, K. Imai, J. Lakin, R. T. Moore, C. Nall, N. Ravishankar, M. Vargas, M. M. Tellez-Rojo, J. E.
Avila, M. H. Avila, and H. H. Llamas. 2009. Public policy for the poor? A randomised assessment of the
Mexican universal health insurance programme. Lancet 373(9673):1447-1454.
Koepsell, T. D., E. H. Wagner, A. C. Cheadle, D. L. Patrick, D. C. Martin, P. H. Diehr, E. B. Perrin, A. R. Kristal,
C. H. Allan-Andrilla, and L. J. Dey. 1992. Selected methodological issues in evaluating community-based
health promotion and disease prevention programs. Annual Review of Public Health 13:31-57.
Koh, H. K., C. M. Judge, H. Robbins, C. C. Celebucki, D. K. Walker, and G. N. Connolly. 2005. The first decade of
the Massachusetts tobacco control program. Public Health Reports 120(5):482-495.
Leviton, L. C., L. Kettel Khan, and N. Dawkins, eds. 2010a. The Systematic Screening and Assessment Method:
Finding innovations worth evaluating. New Directions in Evaluation (125):1-118.
Leviton, L. C., L. Kettel-Khan, D. Rog, N. Dawkins, and D. Cotton. 2010b. Evaluability assessment to improve
public health policies, programs, and practices. Annual Review of Public Health 31:213-233.
Mercer, S. L., B. J. DeVinney, L. J. Fine, L. W. Green, and D. Dougherty. 2007. Study designs for effectiveness and
translation research: Identifying trade-offs. American Journal of Preventive Medicine 33(2):139-154.
Mercer, S. L., L. W. Green, M. Cargo, M. Potter, M. Daniel, R. S. Olds, and E. Reed-Gross. 2008. Reliability-tested
guidelines for assessing participatory research projects. In Community-based participatory research for health:
From process to outcomes. 2nd ed., edited by M. Minkler and N. Wallerstein. San Francisco, CA: Jossey-Bass.
Pp. 407-418.
Merzel, C., and J. D’Afflitti. 2003. Reconsidering community-based health promotion: Promise, performance, and
potential. American Journal of Public Health 93(4):557-574.
Minkler, M., and N. Wallerstein. 2008. Introduction to CBPR: New issues and emphasis. In Community-based par-
ticipatory research for health: From process to outcomes. 2nd ed., edited by M. Minkler and N. Wallerstein.
San Francisco, CA: Jossey-Bass. Pp. 5-24.
National Heart, Lung, and Blood Institute. 2012. Healthy communities study. http://www.nhlbi.nih.gov/hcs/index.
htm (accessed April 10, 2013).
Osei-Assibey, G., S. Dick, J. Macdiarmid, S. Semple, J. J. Reilly, A. Ellaway, H. Cowie, and G. McNeill. 2012. The
influence of the food environment on overweight and obesity in young children: A systematic review. BMJ
Open 2:e001538. doi: 10.1136/.
Papas, M. A., A. J. Alberg, R. Ewing, K. J. Helzlsouer, T. L. Gary, and A. C. Klassen. 2007. The built environment
and obesity. Epidemiologic Reviews 29:129-143.
Pateriya, D., and P. Castellanos. 2003. Power tools manual. A manual for organizations fighting for justice. Los
Angeles, CA: Strategic Concepts in Organizing and Policy Education.
Patton, M. Q. 2008. Utilization-focused evaluation. 4th ed. Thousand Oaks, CA: Sage Publications.
Preskill, H., and N. A. Jones. 2009. Practical guide for engaging stakeholders in the evaluation process. Princeton,
NJ: Robert Wood Johnson Foundation.
Resnicow, K., T. Baranowski, J. S. Ahluwalia, and R. L. Braithwaite. 1999. Cultural sensitivity in public health:
Defined and demystified. Ethnicity and Disease 9(1):10-21.

Copyright © National Academy of Sciences. All rights reserved.
Evaluating Obesity Prevention Efforts: A Plan for Measuring Progress
Evaluating Obesity Prevention Efforts252
Ritchie, L. D., P. B. Crawford, D. M. Hoelscher, and M. S. Sothern. 2006. Position of the American Dietetic
Association: Individual-, family-, school-, and community-based interventions for pediatric overweight. Journal
of the American Dietetic Association 106(6):925-945.
Robbins, J. M., G. Mallya, M. Polansky, and D. F. Schwarz. 2012. Prevalence, disparities, and trends in obesity
and severe obesity among students in the Philadelphia, Pennsylvania, school district, 2006-2010. Preventing
Chronic Disease 9. http://dx.doi.org/10.5888/pcd9.120118 (accessed June 4, 2013).
Robinson, T. N., D. M. Matheson, H. C. Kraemer, D. M. Wilson, E. Obarzanek, N. S. Thompson, S. Alhassan, T. R.
Spencer, K. F. Haydel, M. Fujimoto, A. Varady, and J. D. Killen. 2010. A randomized controlled trial of cul-
turally tailored dance and reducing screen time to prevent weight gain in low-income African American girls:
Stanford GEMS. Archives of Pediatrics and Adolescent Medicine 164(11):995-1004.
Rossi, P. H., M. W. Lipsey, and H. E. Freeman. 2004. Evaluation: A systematic approach. 7th ed. Thousand Oaks,
CA: Sage Publications.
Roussos, S. T., and S. B. Fawcett. 2000. A review of collaborative partnerships as a strategy for improving commu-
nity health. Annual Review of Public Health 21:369-402.
Rundle, A. G., M. D. Bader, C. A. Richards, K. M. Neckerman, and J. O. Teitler. 2011. Using Google Street View to
audit neighborhood environments. American Journal of Preventive Medicine 40(1):94-100.
Saelens, B. E., and K. Glanz. 2009. Work group I: Measures of the food and physical activity environment:
Instruments. American Journal of Preventive Medicine 36(4 Suppl):S166-S170.
Saelens, B. E., J. F. Sallis, J. B. Black, and D. Chen. 2003. Neighborhood-based differences in physical activity: An
environment scale evaluation. American Journal of Public Health 93(9):1552-1558.
Sallis, J. F. 2009. Measuring physical activity environments: A brief history. American Journal of Preventive Medicine
36(4 Suppl):S86-S92.
Sallis, J. F., and K. Glanz. 2006. The role of built environments in physical activity, eating, and obesity in childhood.
Future of Children 16(1):89-108.
Sallis, J. F., and K. Glanz. 2009. Physical activity and food environments: Solutions to the obesity epidemic. Milbank
Quarterly 87(1):123-154.
Sallis, J. F., R. B. Cervero, W. Ascher, K. A. Henderson, M. K. Kraft, and J. Kerr. 2006. An ecological approach to
creating active living communities. Annual Review of Public Health 27:297-322.
Sanson-Fisher, R. W., B. Bonevski, L. W. Green, and C. D’Este. 2007. Limitations of the randomized controlled trial
in evaluating population-based health interventions. American Journal of Preventive Medicine 33(2):155-161.
Sayers, S. P., J. W. LeMaster, I. M. Thomas, G. F. Petroski, and B. Ge. 2012. Bike, walk, and wheel: A way of life in
Columbia, Missouri, revisited. American Journal of Preventive Medicine 43(5 Suppl 4):S379-S383.
Shadish, W. R., T. D. Cook, and L. C. Leviton. 1991. Foundations of program evaluation: Theorists and their theo-
ries. Newbury Park, CA: SAGE Publications.
Shadish, W. R., T. D. Cook, and D. T. Campbell. 2002. Experimental and quasi-experimental designs for generalized
causal inference. 2nd ed. Boston, MA: Houghton Mifflin.
Shaw, I. F., J. C. Greene, and M. M. Mark. 2006. The SAGE handbook of evaluation. London: SAGE Publications.
Tang, H., E. Abramsohn, H. Y. Park, D. W. Cowling, and W. K. Al-Delaimy. 2010. Using a cessation-related outcome
index to assess California’s cessation progress at the population level. Tobacco Control 19(Suppl 1):i56-i61.
Taylor, B. T., P. Fernando, A. E. Bauman, A. Williamson, J. C. Craig, and S. Redman. 2011. Measuring the quality of
public open space using Google Earth. American Journal of Preventive Medicine 40(2):105-112.
Wagner, E. H., T. M. Wickizer, A. Cheadle, B. M. Psaty, T. D. Koepsell, P. Diehr, S. J. Curry, M. Von Korff, C.
Anderman, W. L. Beery, D. C. Pearson, and E. B. Perrin. 2000. The Kaiser Family Foundation Community
Health Promotion Grants Program: Findings from an outcome evaluation. Health Services Research
35(3):561-589.

Copyright © National Academy of Sciences. All rights reserved.
Evaluating Obesity Prevention Efforts: A Plan for Measuring Progress
253Monitoring and Summative Evaluation of Community Interventions
Wang, C. C., S. Morrel-Samuels, P. M. Hutchison, L. Bell, and R. M. Pestronk. 2004. Flint photovoice: Community
building among youths, adults, and policymakers. American Journal of Public Health 94(6):911-913.
Wang, Y. C., C. T. Orleans, and S. L. Gortmaker. 2012. Reaching the Healthy People goals for reducing childhood
obesity: Closing the energy gap. American Journal of Preventive Medicine 42(5):437-444.
Waters, E., A. de Silva-Sanigorski, B. J. Hall, T. Brown, K. J. Campbell, Y. Gao, R. Armstrong, L. Prosser, and C. D.
Summerbell. 2011. Interventions for preventing obesity in children. Cochrane Database of Systematic Reviews
Issue 12. Art. No.: CD001871. DOI: 10.1002/14651858.CD001871.pub3.
Weinstein, M. C., and W. B. Stason. 1976. Hypertension: A policy perspective. Cambridge, MA: Harvard University
Press.
Wholey, J. S., H. P. Hatry, and K. E. Newcomber. 2010. Handbook of practical program evaluation. 3rd ed. San
Francisco, CA: Jossey-Bass.
Yin, R. K. 2008. Case study research: Design and methods. 4th ed. Thousand Oaks, CA: Sage.
Yin, R. K., and K. A. Heald. 1975. Using the case survey method to analyze policy studies. Administrative Science
Quarterly 20:371-381.

Copyright © National Academy of Sciences. All rights reserved.
Evaluating Obesity Prevention Efforts: A Plan for Measuring Progress

Copyright © National Academy of Sciences. All rights reserved.
Evaluating Obesity Prevention Efforts: A Plan for Measuring Progress
255
9Systems and Evaluation: Placing a Systems Approach in Context
Obesity is complex. Attempts to treat or prevent it with individual behavior-change strategies (as a simple problem) have generally not been effective. Consideration of a complex systems approach to
identify the best choices for obesity prevention is a worthwhile, arguably essential, endeavor. The impor-tance of considering a systems approach to obesity is explicitly identified in the Institute of Medicine (IOM) report Accelerating Progress in Obesity Prevention (APOP) (IOM 2012a). The report notes that “a systems perspective helps to reveal, and create, the potential for combined impacts (or synergies) that can further accelerate progress in preventing obesity” (IOM, 2012a, p. 7). From an evaluation perspec-
Why: To date, the majority of obesity prevention evaluation efforts have focused on methods that do not optimally recognize the interactions and relationships among the many factors that comprise a complex health issue such as obesity. As a result, important learnings may be missed. A systems approach to obesity prevention evaluation efforts can build on current evaluation methods and improve our understanding on the relationships and their impact among the Accelerating Progress in Obesity Prevention (IOM, 2012a) report strategies, outcomes, and stakeholders across a variety of settings.
What: Complex systems are a configuration of interacting, interdependent parts, connected through a web of relationships, that form a whole greater than the sum of its parts (Holland, 2000). The explicit recogni-tion by evaluators that obesity is complex will help to facilitate the increased use of systems approaches in evaluation efforts for obesity prevention.
How: From a systems perspective, evaluating progress of obesity prevention efforts should include sup-port for better understanding of the interactions and relationships among individuals, groups, communities, stakeholders, and national efforts across a variety of settings and throughout the evaluation process frame-work (see Chapter 3).

Copyright © National Academy of Sciences. All rights reserved.
Evaluating Obesity Prevention Efforts: A Plan for Measuring Progress
Evaluating Obesity Prevention Efforts256
tive, systems science provides quantitative methodologies that enable evaluators to consider the dynamic relationships of factors at multiple levels of analysis, but it also includes qualitative approaches to actively engage members of the community in a participatory process. Evaluation deals with challenges of the real world—dealing with reality as it unfolds demands a complex adaptive systems perspective.
The complexity of obesity introduces notable challenges for evaluators. Simple or uncomplicated systems are likely to be homogenous, linear, static, and independent, with little feedback or connection to other levels or subsystems. On the other hand, complex systems are a configuration of interacting, inter-dependent parts, connected through a web of relationships, that form a whole greater than the sum of its parts (Holland, 2000). Complex systems are mostly nonlinear, dynamic, interdependent, generate feed-back, and have several connected levels. In a complex system, a given set of circumstances will not always yield the same result (Holmes et al., 2012).
A systems approach to obesity may help to make sense of the complexity (discussions related to systems and complexity tend to use a unique lexicon, and many of the terms used in this discussion are defined in Appendix B). By identifying leverage points and simple rules among a network of interconnect-ing nodes, evaluators can advance their understanding of how different components work together under various circumstances to influence movement in weight status. This enables evaluators to better identify where to look, what to measure, when to measure, how to recommend action, and why the proposed approach is important for decision makers to consider. A systems approach elevates the importance of understanding contextual factors and relationships to describe what is happening, why it is happening, and what may be the best action (how) to achieve progress in the intended direction.
To provide context in which a systems approach to evaluation may occur, the Committee con-sidered some situations in which a systems approach could be used to take action. It should be kept in mind that systems bring together a set of elements into a meaningful set of relationships—connected and interdependent—that act together as a whole. In effect, systems work by uniting various elements in a meaningful relationship that acts as a whole. To evaluate these complex systems is to evaluate patterns of relationships, how they are sustained, how they self-organize, and how they emerge. Systems, therefore, can only be understood as an integrated whole; the result of both the sum and the relationships among its elements.
In the context of taking action to evaluate obesity prevention, action-oriented questions to ask include what happened, what will happen, and what is the best choice? All of these questions may apply to dealing with obesity as a system. However, as discussed below in more detail, the first two questions may be addressed by treating obesity as a predictable issue that may be solved through reductionist think-ing and, as such, represent simple or at most complicated systems. On the other hand, the third ques-tion addresses obesity as a complex system that is not so predictable and, as such, cannot be understood through reductionist approaches (Finegood, 2011).
EVALUATING ThE “whAT hAPPENEd?” QUESTION
To describe what happened, a basic reporting approach may be taken. This generally takes the form of surveillance and other monitoring techniques that describe the current state, which is attributed to activities conducted in the past. The “what happened” question context is representative of a static, independent, linear situation that potentially describes some combination of what has happened, when it

Copyright © National Academy of Sciences. All rights reserved.
Evaluating Obesity Prevention Efforts: A Plan for Measuring Progress
257Systems and Evaluation: Placing a Systems Approach in Context
might have happened, where it may have happened, and how much, how high, what level, or what score may have been attained.
EVALUATING ThE “whAT wILL hAPPEN?” QUESTION
To describe what will happen as a result of actions taken, evaluation approaches will generally use techniques that predict or estimate the likelihood of certain desired outcome(s) based on the observed association with another set of factors or the measured changes in proximal intervention targets that allow for the prediction of desired ultimate outcomes. To address this question, evaluators use several approaches, including randomized controlled trials and variations on experimental designs that attempt to control for many confounders (Mercer et al., 2007). These evaluation techniques also tend to address the problem in a reductionist manner, attempt to identify cause and effect, and often fall short in solving the complexity of the interactions among the many factors associated with obesity. On the other hand, this type of approach may be very useful for addressing, to some level of confidence, the potential impact of actions proposed or taken, how to prevent adverse outcomes, or how to provide an estimate of antici-pated value of interventions.
EVALUATING ThE “whAT IS ThE BEST ChOICE?” QUESTION
To address the question what is the best choice of action, considering all available options, com-plexity science is needed. Complexity science is an attempt to understand how things influence each other within the context of the whole. The Committee considers obesity to be a complex system insofar as it possesses characteristics consistent with complexity that include being heterogeneous, nonlinear, stochastic, interdependent, generating feedback, self-organizing, and involving emergence (Finegood, 2011). A systems approach to taking action demands respecting the characteristics of systems noted above and considering leverage points that may influence change within a complex system—attempting to identify the “best choice” for action. The remainder of this chapter will focus on addressing the third question: “What is the best choice?”
hOw wILL EVALUATION EFFORTS BENEFIT FROM A SYSTEMS APPROACh?
Although relatively new, systems theory is already contributing to evaluations of obesity interven-tions (C3 Collaborating for Health, 2011). Evalations that do not consider systems dynamics or con ditions will likely miss aspects of the intervention and its environment that influence the intervention’s operation and success (Hargreaves, 2010). To optimize the development of practice-based evidence from such studies, researchers and practitioners will need to develop evaluation systems that enable continuous learning and the pooling of findings and best practices (Holmes et al., 2012). To move toward systems-informed evalu-ation, researchers will need to reconsider the types of evidence needed from a systems point of view. For example, questions around effective leadership to facilitate systems change and leveraging of networks to advance health improvements become increasingly important with increased complexity (Holmes et al., 2012). Systems science (as it applies to community-based prevention) can address how causal structures change over time, including the effect of changes in the type or number of interventions implemented, or how changes in social norms, community practices, and leadership may affect outcomes. Examining these

Copyright © National Academy of Sciences. All rights reserved.
Evaluating Obesity Prevention Efforts: A Plan for Measuring Progress
Evaluating Obesity Prevention Efforts258
causal structures can increase understanding about both intended and unintended consequences of inter-ventions (IOM, 2012b; Meadows, 1999; Sterman, 2000; Ulrich, 2000). As one example of how a systems approach may be used to support evaluation, consider multiple uses of mapping the relationships among the many variables and factors of a complex system, including identification of leverage points, anticipation of unintended consequences and unexpected results, and comprehensive assessment of stakeholder views.
Mapping and the Use of Mapping
Systems maps (e.g., causal loop diagrams) help to visualize relationships. The process of developing a causal loop diagram is well suited for group work and facilitating communication among diverse stake-holders (Homer et al., 2006; Milstein and Homer, 2009). A systems map represents a dynamic hypothesis, an evidence-based or evidence-informed depiction of relationships, but the map itself cannot be tested (Homer et al., 2006; Milstein and Homer, 2009). Systems causal maps may be created with specific appli-cation to obesity and can be the result of a quantitative or qualitative approach to complex systems map-ping. Excellent examples of complex systems maps for obesity are presented in Tackling Obesities: Future Choices—Building the Obesity Systems Map, a report from the United Kingdom Government’s Foresight Program (Vandenbroeck et al., 2007),1 the APOP report (IOM, 2012a), or An Integrated Framework for Assessing the Value of Community-Based Prevention report (IOM, 2012b). An example of the latter is provided in Figure 9-1.
Identification of Leverage Points
A map depicting the underlying theories of change and causal structures of a comprehensive obe-sity prevention policy system can increase the understanding of the multiple pathways of impact of obesity preven tion policies and actions. Mapping these relationships helps to identify key leverage points in the system that may influence multiple other variables in the system. In turn these diagrams can help evalu-ators to identify and prioritize key variables and associated measures to be assessed. It guides evaluators on “where to look” for short-, intermediate-, and long-term effects of program and policy options, which may enhance the use and collection of relevant data (Diez Roux, 2011).
Anticipation and Identification of Unintended Consequences and Unexpected Results
The ideal, of course, would be to make only the best choices, but complex systems have emergent properties that make them unpredictable. Therefore, it is worthwhile to consider how to use systems approaches to identify and anticipate consequences of policies and actions taken that are not optimal or ideal but might be ameliorated. The use of obesity system causal maps can identify pathways that high-light actions and responses within the system that are more likely than others. For example, a map of the obesity prevention policy system can more explicitly elucidate the pathways from obesity prevention poli-cies and programs to health outcomes as well as the underlying structures that reinforce or hinder change processes (IOM, 2012b, p. 146). This type of mapping can support the entire proposed framework (see Figure 3-1) for evaluating progress in obesity prevention. The feedback identified through mapping, posi-tive and negative, reinforcing and weakening, anticipated and unexpected, provides opportunities for evaluators to explore the mechanisms that fuel or retard relationships and feedback in the system. This
1 See http://www.bis.gov.uk/assets/foresight/docs/obesity/12.pdf (accessed November 12, 2013).

Copyright © National Academy of Sciences. All rights reserved.
Evaluating Obesity Prevention Efforts: A Plan for Measuring Progress
259Systems and Evaluation: Placing a Systems Approach in Context
FIGURE 9-1 Example causal loop diagram for value of community-based prevention policies.SOURCE: IOM, 2012b.
Figure 9-1 from old report.eps
Figure App 1--BitmappedBroadside. Not much smaller for portraitmeans paying attention to the relationships among actors in the system, among program components, and
among levels of the system. One example of unintended consequences in efforts to prevent obesity and increase fruit and vegetable intake among school children is illustrated in Box 9-1.
Comprehensive View of Elements and Stakeholders Involved or Affected by Change Efforts
To generate a useful systems model or map, multiple stakeholders and perspectives invested in the situation need to be engaged in the process (IOM, 2012a; Williams and Imam, 2006). Also known as par-ticipatory evaluation, systems-informed evaluators have a responsibility to “increase the voices of those in the margin” (Williams and Imam, 2006, p. 9) in all phases of development and evaluation of the inter-vention and establish common goals reflecting the various perspectives of the stakeholders. Their partici-pation in building systems maps tends to unearth causal loops that experts and others from outside the community would not anticipate.

Copyright © National Academy of Sciences. All rights reserved.
Evaluating Obesity Prevention Efforts: A Plan for Measuring Progress
Evaluating Obesity Prevention Efforts260
A SYSTEMS PERSPECTIVE ON ThE ChALLENGE OF EVALUATING OBESITY PREVENTION
Complex systems are a configuration of interacting, interdependent parts, connected through a web of relationships, that represent a whole greater than the sum of the parts (Holland, 2000). Research supports the obesity-related influences that stem from genetics, neurobiology, physiology, psychology, behavior, family structure and influences, social context and social norms, environment, economics, markets, and public policy. However, the mechanisms of these relationships are not always well researched (Hammond, 2009). Because obesity is more likely to be the result of a multitude of factors interacting with each other over time than any single causal factor (Glass and McAtee, 2006) drives the field to recognize that obesity is complex and that progress in obesity prevention may gain significant ben-efits when evaluation strategies include a systems perspective.
An earlier IOM report, Bridging the Evidence Gap in Obesity Prevention: A Framework to Inform Decision Making (IOM, 2010), discusses the need to apply a systems perspective to obesity prevention. A systems approach to obesity prevention makes sense because multiple properties specific to obesity need to be considered in combination in order to address obesity prevention effectively (although this list of properties may not be all-inclusive). Properties to consider include the following:
BOX 9-1 yumPower School Challenge
In 2011, a not-for-profit health plan in Minnesota announced a multi-year community collaboration called “yumPower” (www.yumpower.com) to increase “better-for-you” food consumption across a variety of com-munity settings, including elementary schools. During the 2012 school year, 32 elementary schools (about 15,000 students) participated in the yumPower School Challenge pilot program designed specifically to increase intake of fruits and vegetables among elementary school students. The program kicked off with a 45-minute, high-energy, interactive school assembly led by Radio Disney at each school site. Students were given fruit and veggie trackers to record their consumption each day for 4 weeks. Schools received tracking supplies and pencils and notepads to provide students with reminders and incentives for tracking. Some key findings: 16 extra tons of fruits and vegetables were consumed by the students over this 4-week time frame, students increased their fruits and vegetables consumption by 11 percent overall and by 22 percent during weekend days, participation rates were as high as 76 percent, and finally 93 percent of teachers and school staff said they would recommend the program to other schools. An unintended consequence occurred as well: food service staff faced challenges dealing with the increased demand for fruits and vegetables. This conundrum prompted one food service staff person to say “be sure to warn food service before you start because we ran out of fruits and vegetables and needed to order more!” Programs designed to increase healthy food consumption for one group must consider all stakeholders affected by the changes that the program may bring about.
SOURCES: HealthPartners, 2012; Isham et al., 2013.

Copyright © National Academy of Sciences. All rights reserved.
Evaluating Obesity Prevention Efforts: A Plan for Measuring Progress
261Systems and Evaluation: Placing a Systems Approach in Context
• Obesity is related to social networks.• Intervention outcomes for obesity prevention are affected by unanticipated, emergent situations
and baseline assumptions that may not hold over time. • Significant inter-individual variability exists in biological, physiological, and emotional responses
to interventions.• A significant knowledge gap exists related to weight accumulation.• Resource allocation that addresses obesity prevention is related to other areas competing for the
same resources.
With all of these properties to consider, using a systems perspective for evaluating obesity preven-tion efforts is challenging. Decisions around what systems approaches to consider may be informed by an understanding of which simple rules govern the behavior of the system and at what level of the sys-tem provides the most opportunity to make a difference. In addition, costs, scalability, and sustainability of interventions are important considerations (Hammond, 2009; Huang et al., 2009; Levy et al., 2011; Mabry et al., 2010; Nader et al., 2012). To discuss this in more detail, the next two sections address the concepts of “simple rules” and “system levels.”
Simple Rules
Complex systems, given their dynamic and interacting characteristics, are inherently unpredictable, and interacting with them leads to continually emerging novel behavior (Plsek and Greenhalgh, 2001). Nevertheless, it appears that this emergent property follows an inherent self-organization facilitated through simple, locally applied rules. Examples of simple rules identified to explain complex behavior in, for example, the context of health systems include those associated with large system transformation and those that attempt to explain how health systems create value for their stakeholders. Best et al. (2012) identified five simple rules that were likely to enhance the success of transformation initiatives: “1) blend designated leadership with distributed leadership, 2) establish feedback loops, 3) attend to history, 4) engage physicians, and 5) include patients and families” (p. 421). Kottke et al. (2012) identified five simple rules that generate value for the health system’s stakeholders: “1) the stakeholders agree on a set of mutual, measurable goals for the system; 2) the extent to which the goals are being achieved is reported to the public; 3) resources are available to achieve the goals; 4) stakeholder incentives, imperatives, and sanc-tions are aligned with the agreed-upon health goals; and 5) leaders of all stakeholders endorse, promote, and honor the agreed-on health system goals.” Identifying the simple rules that govern the behavior of the system in question may point to a limited number of intervention opportunities that are likely to influence the outcomes and overall impact on the goal of obesity prevention.
Simple rules also relate to the concept of self-organization, that is, the capacity of a system to make its own structure more complex. For example, a researcher may consider the organization of a person’s social network. People who have friends who are overweight are more likely to be overweight themselves (Valente et al., 2009). Furthermore, if their social system changes over time, the likelihood they may gain or lose weight is highly correlated with the weight of the friends to whom they are connected (Christakis and Fowler, 2007). As such, the relationships a person has may be considered a simple rule related to body weight, but caution must be exercised in not equating correlation with causation.

Copyright © National Academy of Sciences. All rights reserved.
Evaluating Obesity Prevention Efforts: A Plan for Measuring Progress
Evaluating Obesity Prevention Efforts262
System Levels
In addition to simple rules, system levels also provide a means to make systems approaches more actionable. For example, when obesity interventions are only applied at the level of the individual and do not take into consideration what happens at the level of behavioral settings (e.g., worksites, schools, health care), sectors influencing (e.g., public health, education, business, government), or social norms and values, it is unlikely that the changes induced will be sustainable (IOM, 2012a). Malhi et al. (2009) simplified an original list described by Meadows (2008) into five system levels at which obesity interven-tions could be applied. These levels include (1) paradigm (a system’s deepest belief), (2) goals (what the system is trying to achieve), (3) structure (enhancing connections across most of the system as a whole), (4) feedback and delays (to effect self-regulation, self-reinforcement, and adaptation of the system), and (5) structural elements (to affect subsystems, actors, and the physical structure of the system). The para-digm level is the most difficult at which to intervene, whereas the structural elements level is the least dif-ficult. However, interventions at the more difficult levels tend to be more effective and impactful. In the context of childhood obesity, Malhi et al. (2009) found that most recommendations for interventions are made at the structural elements level. This is the level that includes a strong evidence base and is associ-ated with evidence of cause and effect. Paradoxically, it is the level least likely to be effective in creating and sustaining change in a complex system. Table 9-1 describes the intervention levels and associates them with objectives for evaluation.
A clear example of interventions implemented at multiple levels of a system is the tobacco experi-ence over the past several decades. The interrelated set of activities that eventually connected several levels of interventions represents an evolution toward a systems approach to address tobacco use in the United States. As outlined in Bridging the Evidence Gap in Obesity Prevention: A Framework to Inform Decision Making (IOM, 2010), the combined and coordinated set of activities implemented at the individual, com-
TABLE 9-1 Places to Intervene in a Complex System and the Associated Evaluation Objectives
Level Definition/Description Evaluation Objective
Structural elements Subsystems, actors, and the physical structure of the system
Assess level of coherence among the components of the system
Feedback and delays Self-regulation, self-reinforcement, and adaptation of the system. Reinforcing loops for driving growth and balancing loops for constraining goals
Assess degree to which the system operates in a continuous manner, and assess the likelihood that the system will or will not grow
Structure Enhancing connections across most of the system as a whole
Assess degree to which interdependent elements in a network work together
Goals What the system is trying to achieve Evaluate how well the system adapts to its environment
Paradigm A system’s deepest belief Understand the degree to which the system acts as a learning environment
SOURCES: Adapted from Finegood, 2011; Malhi et al., 2009; and Meadows, 2008.

Copyright © National Academy of Sciences. All rights reserved.
Evaluating Obesity Prevention Efforts: A Plan for Measuring Progress
263Systems and Evaluation: Placing a Systems Approach in Context
munity, population, system, and public education levels all contributed to overall tobacco use reductions in the country. Figure 9-2 presents this set of activities.
Simple rules and system levels can be used to identify opportunities to take action and may be regarded as a fundamentally different way of thinking about how to approach complex problems, such as obesity.
USING A SYSTEMS PERSPECTIVE TO AddRESS POPULATION hEALTh: A REVIEw OF PRIOR IOM REPORTS
Previous IOM consensus committees have applied systems thinking to identify the types of evidence and research needed to guide decision making around obesity prevention; to identify promising strategies and actions; to anticipate the effects and unanticipated consequences of actions; and to explore different pathways through which interventions can lead to changes—for better or worse—in population behavior and health outcomes. This report builds from this knowledge base by applying a systems approach to evaluation design and implementation. The Committee built on three reports that present applicable dis-cussion of system approaches to obesity prevention; they are briefly presented in Table 9-2 below.
EVALUATION TOOLS ANd SYSTEMS SCIENCE
A diverse set of qualitative, quantitative, and mixed-methods evaluation and analytic tools are avail-able to help to evaluate actions to address a complex problem such as obesity. The tools can be used to
Figure 9-2.eps
Public education–level Intervention• Surgeon General’s reports
• Public service announcements• Media campaigns
Individual-level Intervention• Smoking cessation tools
• Physician counseling• Telephone quitlines
Community-level Intervention• Community-based coalitions• Workplace smoking policies
• NCI COMMIT project
Population-level Intervention• Clean air laws
• Tobacco taxation• NCI ASSIST project
System-level Intervention• Epidemiological models
• System models, networks, knowledge• NCI ISIS project
FIGURE 9-2 Evolution of tobacco control approaches toward system thinking.NOTE: ASSIST = American Stop Smoking Intervention Study; COMMIT = Community Intervention Trial for Smoking Cessation; ISIS = Initiative on the Study and Implementation of Systems; NCI = National Cancer Institute.SOURCE: Adapted from NCI, 2007.

Copyright © National Academy of Sciences. All rights reserved.
Evaluating Obesity Prevention Efforts: A Plan for Measuring Progress
Evaluating Obesity Prevention Efforts264
TABLE 9-2 IOM Reports That Used Systems Perspectives
IOM Report Description Emphasis on Systems
Bridging the Evidence
Gap in Obesity
Prevention: A Framework
to Inform Decision
Making (IOM, 2010)
This report developed the L.E.A.D. (locate, evaluate, assemble, inform decisions) framework to help researchers locate, evaluate, and analyze evidence to inform and advance decision making. This framework can help evaluators to maximize opportunities to generate evidence from policy and practice, and it can help other end users—such as public health practitioners—collect, analyze, and present information.
• Frame the problem• Understand potential causes• Identify critical leverage points of influence• Take effective action• Maintain a systems perspective throughout• Give consideration to external validity
of the evidence for applicability in other populations or settings
Accelerating Progress
in Obesity Prevention:
Solving the Weight of the
Nation (APOP) (IOM, 2012a)
The APOP recommendations addressed five environments—physical activity, food, message, health care and work, school—with the understanding that synergies across actions in these environments would advance greater movement in preventing obesity than action in any one area alone.
To understand the process of system change, the committee proposed monitoring engagement, communication, and leadership among all sectors to increase the development, implementation, and coordination of common messages, processes, and strategies.
An Integrated Framework
for Assessing the Value
of Community-Based
Prevention (IOM, 2012b)
This report developed a framework for assessing the value of community-based nonclinical prevention policies and wellness strategies.
This report highlighted the utility of a systems science approach to understanding the collective impact of community-based interventions. It discussed the value of a systems approach to coalition formation, research design, and analytical descriptions and evaluations.
identify changes in patterns of system behavior over time and to advance an understanding of the factors and conditions underpinning these changes. The tools range from sophisticated computer models, such as systems dynamics modeling (Homer and Hirsch, 2006; Sterman, 2006), dynamic microsimulation model-ing (Mitton et al., 2000), and agent-based modeling (Axelrod and Tesfatsion, 2006; Epstein, 2006), as well as qualitative approaches such as focus groups and Concept Mapping (Kane and Trochim, 2007), which require little technological support. Some examples of tools presented in Box 9-2 are discussed in more detail below.
Simulated Virtual worlds: A Quantitative Model
Simulated virtual worlds, an example of a quantitative method that is based on formal models, are widely used to advance hypotheses about how a system behaves over time. High-quality empiri-cal research, especially well-designed experimental and quasi-experimental studies, is needed to inform systems models (IOM, 2010), which use data-driven assumptions to guide their predictions (Levy et al.,

Copyright © National Academy of Sciences. All rights reserved.
Evaluating Obesity Prevention Efforts: A Plan for Measuring Progress
265Systems and Evaluation: Placing a Systems Approach in Context
BOX 9-2 Examples of Evaluation Tools/Methods for Complex Systems
Quantitative Methods Qualitative Methods
Agent-based modeling Case studies, interviews, and focus groups
Time-trend analysis Observation of activities
Observational or cross-sectional studies Document reviews
Retrospective analyses Outcome mapping, concept mapping
Adaptive learning measurement systems Analyses of emergent system-wide patterns, tracking of events, encounters, and policy changes
Geographic information system spatial analysis Use of simple rules and conditions of self-organization
Simulated virtual worlds Soft systems methodology
Systems dynamic modeling Appreciative inquiry, reflective practice
Dynamic microsimulation modeling Group model building
Systems mapping/causal loop model building
SOURCE: Adapted from Hargreaves, 2010.
2011). The ReThink Health dynamics simulation model was designed to help planners to test different quantitatively estimated effects of scenarios by tracking changes in health status, utilization, costs, and equity following different intervention options (ReThink Health, 2012). To varying degrees, the proposed interventions address risk, care, capacity, cost, funding, and/or economic and health care trends (e.g., prevalence of uninsured individuals, local economic climate). These simulated scenarios are also useful for evaluators because they shed light on what types of impacts can be expected under different conditions in the short- and long-term. As a result, they point to where in the system evaluators should monitor and measure change, and at what intervals of time. In essence, they can help to identify the best choice among a variety of options.
Group Model Building: A Qualitative Model
Group model building (GMB), a qualitative method example, presents a participatory process for developing and analyzing a formal model. This iterative approach, conducted over several meetings, fosters collaboration and stakeholder involvement, and it can help to address issues of transparency by articulating underlying assumptions. It may be especially valuable when working with marginalized com-munities (Hovmand et al., 2012). GMB requires teamwork, distinct roles (e.g., facilitator, recorder), and facilitation to help to advance collaboration and manage conflict. Process maps can help teams to visual-ize and plan the overall sequence of GMB sessions.

Copyright © National Academy of Sciences. All rights reserved.
Evaluating Obesity Prevention Efforts: A Plan for Measuring Progress
Evaluating Obesity Prevention Efforts266
SYSTEMS IN ThE CONTExT OF ThE COMMITTEE’S PROPOSEd EVALUATION FRAMEwORk
The framework, as presented in Chapter 3, outlines five components, including inputs, activities, outputs, intended outcomes, and impacts (see Figure 3-1). Each of these components can be viewed through a complexity lens. The various evaluation methods and tools discussed above can be applied to each component’s set of activities shown in Figure 9-3 to support the evaluation and measurement effort. Some tools or methods can be applied to multiple sections or the entire framework at once, whereas others may be applied to a single step in the model. For example, a systems map can encompass sources of input, activities in the evaluation efforts, identified outputs and intended outcomes, and anticipated impacts.
Examples of systems approaches to obesity prevention evaluation that may be applied to the frame-work are provided in Figure 9-3. The examples are presented as part of each step of the model as well as in the context of the entire model. The “Inputs” box dialogue sessions may be one example of collecting insights that follow a systems approach methodology. The “Impacts” box the need to collect School Health Policies and Practices Study and School Nutrition Dietary Assessment Study–like data on child care settings on a national and periodic basis represents another opportunity for cross-agency collaboration. In addition the ability to identify sociocultural and socioeconomic determinants, timing of exposure, and living and working conditions across populations illustrates another important multi-level relationship that follows a systems approach methodology (further described in Chapter 5 and applied in Chapters 6, 7, and 8). Looking at the framework as a whole, and recognizing that complex systems include, for example, charac-teristics such as nonlinearity, interdependency, feedback loops, and emergence (Finegood, 2011), one real-izes that complex social networks serve as an example of a systems approach to evaluation that includes
Figure 9-3.eps
context for systems-oriented evaluations; Inputs: Stakeholders’ needs/goals; current
need for systems-oriented evaluation
Activities: Need for identifying multi-level process-oriented indicators; develop the plan to monitor/evaluate; and develop
resources for technical assistance
Outputs: Recommended set of core environmental change indicators and
measures leveraging networks, identifying leaders, and enabling continuous learning and pooling of findings and best practices;
protocols and guidance for systems evaluations; participatory evaluation to
engage stakeholders
Outcomes: Improved evaluation/surveillance capacity and
infrastructure; activities; and data use with a systems lens
Impacts: Multi-sector/multi-level partnerships; improved physical, policy,
and social systems; reduction of geographic (spatial) disparities
Vision: Networks and feedback loops that include individuals,
families, peers, communities, regions, states, and the nation
FIGURE 9-3 Examples of how various systems approaches to evaluation may be applied to obesity prevention efforts in the context of the Committee’s evaluation framework.

Copyright © National Academy of Sciences. All rights reserved.
Evaluating Obesity Prevention Efforts: A Plan for Measuring Progress
267Systems and Evaluation: Placing a Systems Approach in Context
many of the systems characteristics noted and applies to the entire framework. Complex social networks, and their inherent feedback loops, have been shown to affect obesity. Using social network analysis, Christakis and Fowler (2007) were able to examine the spread of obesity over time among subjects of the Framingham Heart Study. These researchers showed that obesity was clearly associated with social rela-tionships (e.g., friends, spouses, and siblings) and that the geographic distance among people (an example of physical environment) was less important than social environment. They were also able to show that obesity followed the friendships and concluded that obesity is, in fact, contagious.
Case Examples
Change in body weight is associated with an imbalance between energy content of food stuffs consumed and energy expended. Hence, to consider the potential of any obesity intervention, its impact on both energy intake and expenditure needs to be properly accounted for. Hall et al. (2011) provide an example of how predictions about the potential effect of an intervention may differ between more tradi-tional approaches and systems approaches to obesity prevention. These researchers compared the results of a projected impact of taxing caloric sweetened beverages on obesity prevalence based on the extrapola-tion of a static weight loss prediction model to the results of a dynamic simulation model. The static model, presented in a report by the U.S. Department of Agriculture (USDA) (Smith et al., 2010), esti-mated the impact of a 20 percent tax to be an overall decrease in energy intake of about 40 kcal per day and a 1.8 kg body weight loss per year. Extrapolated over 5 years, this would result in almost 10 kg body weight loss. In comparison, the dynamic simulation model estimated that the overall impact of a decrease in energy intake as a result of the tax increase would reduce average body weight by about 1.8 kg over 5 years and about 1 kg of weight loss after 1 year (Hall et al., 2011). This result is in stark contrast to the estimates of the USDA analysis and highlights the importance of inter-individual variability of weight loss (caused by the same intervention), uncertainty of the assumptions made about energy expenditure, and the trajectory of human weight change. This example in the context of obesity prevention recognizes the importance of a careful consideration of the interactive and dynamic relationships among all factors and variables that influence the outcomes of interest over time.
Another case example outlines how a systems approach to obesity prevention evaluation may be used in a larger context to support decision making and dissemination of successful interventions. Figure 9-4 illustrates how a complex obesity systems map has been used to inform action (e.g., planning, decision making, and implementation) around obesity prevention. The case example starts with the explic-it recognition that the workplace may be regarded as a complex adaptive system and that addressing obe-sity, considered complex in its own right, should be considered from a systems perspective. The Foresight obesity system causal map, created by the UK government (Butland et al., 2007), is used as the starting point to identify the best choice(s) for addressing obesity at the workplace. The workplace is mentioned in the context of physical activity (energy expenditure) in two of the seven main thematic clusters—the indi-vidual physical activity and physical activity environment clusters. More specifically, these clusters indicate the issues of overall level of occupational activity and dominance of sedentary employment. Hence, two places that can provide leverage to address obesity prevention successfully include the potential to increase person-level activity during the workday and to change the work environment by reducing the sedentary nature of the work tasks in which employees are engaged.

Copyright © National Academy of Sciences. All rights reserved.
Evaluating Obesity Prevention Efforts: A Plan for Measuring Progress
Evaluating Obesity Prevention Efforts268
FIGURE 9-4 Case example of an obesity system casual map applied to a workplace setting to identify intervention opportuni-ties and evaluate energy balance (physical activity) interventionsSOURCE: Vandenbroeck et al., 2007. Foresight: Tackling Obesities: Future Choices—Project Report, 2nd Edition. Final Project Report. The Government Office for Science: London.
Figure 9-4.epsbroadside
Step 2:Consider the obesity causal map(Vandenbroeck et al., 2007).
Step 3:Simplify the map to its main thematic clusters and identify the places where physical activity related variables are located(Vandenbroeck et al., 2007).
Step 4:Identify the best choices for action. Dominance of sedentary employment (physical activity environment cluster) is associated with level of occupational activity (individual physical activity cluster) which, in turn, links to overall physical activity.
Following identification of best choices for intervention, a decision was made to invest in an intervention designed to change the sedentary mature of the work and to reduce sitting time throughout the day for employees with sedentary job types. Whereas this is unlikely to result in weight loss, per se, it may be helpful in increasing energy expenditures and vasomotion, addressing back and neck pain due to static tension, and overall mobility that may aid in prevention of weight gain.
Step 5:Design intervention concepts that change the work environment and address prolonged sedentary time.
Step 6: Conduct pilot feasibility study and disseminate results: The “Take-A-Stand” project (Pronk et al., 2012).
Review outcomes and impacts and consider broad-based dissemination:• Reduced prolonged sitting time• Reduced upper back and neck pain• Improved mood states• Increased self-reported productivity • Worker perceptions of enhanced energy levels, feeling
more focused, happier, and less stressed
Step 7:Disseminate findings to larger organization: Application of solution to entire company (Koster, 2012).
Step 1: Recognition of both obesity and the workplace as complex adaptive systems, intervention goals set on obesity (energy balance) and associated behaviors and consider person-, policy , and physical and social environment-level solutions. Focus of interest is physical activity (Pronk, 2009).
Dec
isio
n to
inve
st in
an
inte
rven
tion
As a result of this evaluation of the Foresight obesity maps, program planners decided to invest resources in programmatic solutions. They designed and tested intervention concepts in a pilot project (Pronk et al., 2012). In the context of a multi-component, comprehensive health and well-being program, sit-stand devices were deployed in the work stations of employees with sedentary job types (call-center employees). Employees were engaged in a participatory manner, a supportive environment was established to optimize participation, and minimally invasive measurement methods were deployed to monitor per-formance. The results of the pilot study proved meaningful from the perspective of both the employees and management, and, as a result, the solution was deployed across all areas of the company that housed sedentary jobs (Koster, 2012).
SUMMARY
This chapter presents a systems approach to evaluate obesity prevention efforts in context and con-siders it from an end user’s perspective by asking the question, “what is the best choice?” when taking
Copyright © National Academy of Sciences. All rights reserved.
Evaluating Obesity Prevention Efforts: A Plan for Measuring Progress
269Systems and Evaluation: Placing a Systems Approach in Context
action. It describes what a systems approach entails, what are its key components, how opportunities for action may be identified, where readers may find other discussions of systems applied to obesity, what evaluation tools and methods are available, and what benefits a systems approach may provide to evalu-ation efforts in this area. Finally, the chapter considers how systems may be applied to the Committee’s proposed evaluation framework.
A systems approach may be useful to describe interrelationships among the many variables and ele-ments that are involved in obesity and prevention efforts. It can help policy makers and implementers to identify the most important leverage points to achieve progress to determine “what is the best choice?” regarding what action to take and how best to invest resources.
Taking a systems approach to evaluating the APOP strategies will enable researchers and decision makers to think about evaluation efforts in new ways—identifying the types of data to collect and the methods for analyzing the data, identifying core indicators and measures that leverage networks and feed-back loops among different sectors of society, identifying leaders, and engaging stakeholders in all aspects of evaluation. The result of these activities will improve the capacity and infrastructure of the collective evaluation system for obesity. And because obesity itself is an integral part of the larger systems of public and population health, it may be viewed as a major element in the larger complex system of the health of populations in communities, across states, and across the nation.
REFERENCES
Axelrod, R., and L. Tesfatsion. 2006. Appendix A. A guide for newcomers to agent-based modeling in the social sci-
ences. In Handbook of computational economics, vol. 2: Agent-based computational economics, edited by L.
Tesfatsion and K. L. Judd. Amsterdam, the Netherlands: North-Holland. Pp. 1647-1659.
Best, A., T. Greenhalgh, S. Lewis, J. E. Saul, S. Carroll, and J. Bitz. 2012. Large-system transformation in health care:
A realist review. Milbank Quarterly 90(3):421-456.
Butland, B., S. Jebb, P. Kopelman, P. McPherson, S. Thomas, J. Mardell, and V. Parry. 2007. Foresight: Tackling
obesities: Future choices–project report, 2nd edition. London, UK: Government Office for Science.
C3 Collaborating for Health. 2011. Beyond Foresight: Can systems thinking help us address complex problems like
obesity and chronic disease? http://www.c3health.org/wp-content/uploads/2011/03/Diane-Finegood-seminar-
FINAL-20110322.pdf (accessed January 30, 2013).
Christakis, N. A., and J. H. Fowler. 2007. The spread of obesity in a large social network over 32 years. New
England Journal of Medicine 357(4):370-379.
Diez Roux, A. V. 2011. Complex systems thinking and current impasses in health disparities research. American
Journal of Public Health 101(9):1627.
Epstein, J. M. 2006. Remarks on the foundations of agent-based generative social science. In Handbook of com-
putational economics, vol. 2: Agent-based computational economics, edited by L. Tesfatsion and K. L. Judd.
Amsterdam, the Netherlands: North-Holland. Pp. 1585-1604.
Finegood, D. T. 2011. The complex systems science of obesity. In The Oxford handbook of the social science of
obesity, edited by J. Cawley. New York: Oxford University Press. Pp. 208-236.
Glass, T. A., and M. J. McAtee. 2006. Behavioral science at the crossroads in public health: Extending horizons,
envisioning the future. Social Science and Medicine 62(7):1650-1671.
Hall, K. D., G. Sacks, D. Chandramohan, C. C. Chow, Y. C. Wang, S. L. Gortmaker, and B. A. Swinburn. 2011.
Quantification of the effect of energy imbalance on bodyweight. Lancet 378(9793):826-837.

Copyright © National Academy of Sciences. All rights reserved.
Evaluating Obesity Prevention Efforts: A Plan for Measuring Progress
Evaluating Obesity Prevention Efforts270
Hammond, R. A. 2009. Complex systems modeling for obesity research. Preventing Chronic Disease 6(3):A97.
http://www.cdc.gov/pcd/issues/2009/jul/09_0017.htm (accessed June 6, 2013).
Hargreaves, M. 2010. Evaluating system change: A planning guide. Princeton, NJ: Mathematica Policy Research, Inc.
HealthPartners. 2012. YumPower school challenge. Summary of key findings. Bloomington, MN: HealthPartners.
Holland, J. H. 2000. Emergence: From chaos to order. Oxford, UK: Oxford University Press.
Holmes, B. J., D. T. Finegood, B. L. Riley, and A. Best. 2012. Systems thinking in dissemination and implementation
research. In Dissemination and implementation research in health: Translating science to practice, edited by
R. C. Brownson, G. A. Colditz, and E. K. Proctor. New York: Oxford University Press. Pp. 175-191.
Homer, J. B., and G. B. Hirsch. 2006. System dynamics modeling for public health: Background and opportunities.
American Journal of Public Health 96(3):452-458.
Homer, J., B. Milstein, W. Dietz, D. Buchner, and E. Majestic. 2006. Obesity population dynamics: Exploring
historical growth and plausible futures in the U.S. Paper presented at 24th International System Dynamics
Conference, Nijmegen, Netherlands.
Hovmand, P. S., D. F. Andersen, E. Rouwette, G. P. Richardson, K. Rux, and A. Calhoun. 2012. Group model-
building “scripts” as a collaborative planning tool. Systems Research and Behavioral Science 29(2):179-193.
Huang, T. T., A. Drewnowski, S. K. Kumanyika, and T. A. Glass. 2009. A systems-oriented multilevel framework
for addressing obesity in the 21st century. Preventing Chronic Disease 6(3):A82. http://www.cdc.gov/pcd/
issues/2009/jul/09_0013.htm (accessed June 7, 2013)
IOM (Institute of Medicine). 2010. Bridging the evidence gap in obesity prevention: A framework to inform decision
making. Washington, DC: The National Academies Press.
IOM. 2012a. Accelerating progress in obesity prevention: Solving the weight of the nation. Washington, DC: The
National Academies Press.
IOM. 2012b. An integrated framework for assessing the value of community-based prevention. Washington, DC:
The National Academies Press.
Isham, G. J., D. J. zimmerman, D. A. Kindig, and G. W Hornseth. 2013. HealthPartners adopts community business
model to deepen focus on nonclinical factors of health outcomes. Health Affairs 32(8):1446-1452.
Kane, M., and W. M. K. Trochim. 2007. Concept mapping for planning and evaluation. Thousand Oaks, CA: Sage
Publication.
Koster, K. 2012. Sit-stand workstations incorporate movement into work days of sedentary employees. Employee
Benefit News, December 1.
Kottke, T. E., N. P. Pronk, and G. J. Isham. 2012. The simple health system rules that create value. Preventing
Chronic Disease 9:110179. http://dx.doi.org/10.5888/pcd9.110179 (accessed June 7, 2013).
Levy, D., P. Mabry, Y. Wang, S. Gortmaker, T. T. K. Huang, T. Marsh, M. Moodie, and B. Swinburn. 2011.
Simulation models of obesity: A review of the literature and implications for research and policy. Obesity
Reviews 12(5):378-394.
Mabry, P. L., S. E. Marcus, P. I. Clark, S. J. Leischow, and D. Mendez. 2010. Systems science: A revolution in public
health policy research. American Journal of Public Health 100(7):1161-1163.
Malhi, L., O. Karanfil, T. Merth, M. Acheson, A. Palmer, and D. T. Finegood. 2009. Places to intervene to make
complex food systems more healthy, green, fair, and affordable. Journal of Hunger and Environmental
Nutrition 4(3-4):466-476.
Meadows, D. 1999. Leverage points: Places to intervene in a system. Hartland, VT: The Sustainability Institute.
Meadows, D. H. 2008. Thinking in systems: A primer, edited by D. Wright. White River Junction, VT: Chelsea
Green Publishing Company.
Mercer, S. L., B. J. DeVinney, L. J. Fine, L. W. Green, and D. Dougherty. 2007. Study designs for effectiveness and
translation research: Identifying trade-offs. American Journal of Preventive Medicine 33(2):139-154.

Copyright © National Academy of Sciences. All rights reserved.
Evaluating Obesity Prevention Efforts: A Plan for Measuring Progress
271Systems and Evaluation: Placing a Systems Approach in Context
Milstein, B., and J. Homer. 2009. System dynamics simulation in support of obesity prevention decision-making.
Paper read at Institute of Medicine Workshop on the Application of Systems Thinking to the Development
and Use of Evidence in Obesity Prevention Decision-Making, March 16, 2009, Irvine, CA. http://www.iom.
edu/~/media/Files/Activity%20Files/PublicHealth/ObesFramework/IOMIrvine16Mar09v52MilsteinHomer.ashx
(accessed September 23, 2013).
Mitton, L., H. Sutherland, and M. Weeks, eds. 2000. Microsimulation modelling for policy analysis: Challenges and
innovations. Cambridge, UK: University Press.
Nader, P. R., T. T. Huang, S. Gahagan, S. Kumanyika, R. A. Hammond, and K. K. Christoffel. 2012. Next steps in
obesity prevention: Altering early life systems to support healthy parents, infants, and toddlers. Childhood
Obesity 8(3):195-204.
NCI (National Cancer Institute). 2007. Greater than the sum: Systems thinking in tobacco control. Tobaco con-
trol monograph no. 18. NCI Tobacco Control Monograph Series. NIH Pub. No. 06-6085. Bethesda, MD:
Department of Health and Human Services, National Institutes of Health, National Cancer Institute.
Plsek, P. E., and T. Greenhalgh. 2001. Complexity science: The challenge of complexity in health care. British
Medical Journal 323(7313):625-628.
Pronk, N. P. 2009. Physical activity promotion in business and industry: Evidence, context, and recommendations for
a national plan. Journal of Physical Activity and Health 6(Suppl 2):S220-S235.
Pronk, N. P., A. S. Katz, M. Lowry, and J. R. Payfer. 2012. Reducing occupational sitting time and improving worker
health: The Take-a-Stand Project, 2011. Preventing Chronic Disease 9:E154. http://dx.doi.org/10.5888.
pcd9.110323 (accessed June 7, 2013).
ReThink Health. 2012. Summary of the ReThink Health dynamics simulation model. http://rippelfoundation.org/
docs/RTH-Dynamics-Model-Summary-v6.pdf (accessed November 16, 2012).
Smith, T. A., B.-H. Lin, and J.-Y. Lee. 2010. Taxing caloric sweetened beverages: Potential effects on beverage
consumption, calorie intake, and obesity. Economic Research Report No. 100. Washington, DC: Economic
Research Service, U.S. Department of Agriculture.
Sterman, J. D. 2000. Business dynamics. Systems thinking and modeling for a complex world. Boston, MA:
McGraw-Hill.
Sterman, J. D. 2006. Learning from evidence in a complex world. American Journal of Public Health 96(3):505-514.
Ulrich, W. 2000. Reflective practice in the civil society: The contribution of critically systemic thinking. Reflective
Practice 1(2):247-268.
Valente, T. W., K. Fujimoto, C. P. Chou, and D. Spruijt-Metz. 2009. Adolescent affiliations and adiposity: A social
network analysis of friendships and obesity. Journal of Adolescent Health 45(2):202-204.
Vandenbroeck, P., J. Goossens, and M. Clemens. 2007. Foresight tackling obesities: Future choices—building the
obesity system map. London, UK: Government Office for Science.
Williams, B, and I. Imam, eds. 2006. Systems concepts in evaluation: An expert anthology. Los Angeles: EdgePress,
American Evaluation Association.

Copyright © National Academy of Sciences. All rights reserved.
Evaluating Obesity Prevention Efforts: A Plan for Measuring Progress

Copyright © National Academy of Sciences. All rights reserved.
Evaluating Obesity Prevention Efforts: A Plan for Measuring Progress
273
10Taking Action: Recommendations for Evaluating Progress of Obesity Prevention Efforts
The importance of evaluating the relative impact of obesity efforts is well known, and the challenges are not new. Those challenges remain, however, far from resolved. Even modest improvement in evalu-
ation has the potential to provide clarity and refined direction in addressing the obesity epidemic. This report provides flexible evaluation plans for the national, state, and community levels (including indica-tors of status and progress) that can be implemented now. It also recommends a number of infrastructure changes at the national level that could make these evaluations even more effective in the future.
With funding from the Michael & Susan Dell Foundation, the Institute of Medicine (IOM) Committee on Evaluating Progress of Obesity Prevention Efforts was formed to develop a concise and actionable plan for measuring progress in obesity prevention efforts for the nation and adaptable guide-lines for local community evaluation. The Committee’s assigned tasks were to
1. draw on the recommendations and recommended indicators of progress from the IOM com-
mittee and 2012 report, Accelerating Progress in Obesity Prevention (APOP); consider existing and new tools and metrics (e.g., trend analysis, community/local measures) to measure progress; and develop a plan for a national-level evaluation of obesity prevention efforts by sector and, if appropriate, across sectors;
2. develop a community-level measurement plan that adds detail and supports the national-level evaluation plan; and
3. identify measurement ideas that can determine the specific impact of the Home Box Office (HBO)/IOM campaign called The Weight of the Nation (TWOTN).
The intended audiences for the report’s recommended plans and measurement ideas are decision makers, community members, researchers, and evaluators at all levels and across all sectors of society.

Copyright © National Academy of Sciences. All rights reserved.
Evaluating Obesity Prevention Efforts: A Plan for Measuring Progress
Evaluating Obesity Prevention Efforts274
The Committee relied on specific definitions for commonly used terms in this report. Interventions refer to policies, programs, systems, environmental changes, services, products, or any combination of these multi-faceted initiatives. Assessment is an effort to use data on the community or other jurisdic-tion to characterize the problem, its distribution, and efforts to address it. Monitoring is the tracking of the implementation of interventions compared to standards of performance. Surveillance is the ongoing systematic, collection, analysis, and interpretation of data that are tracked over time to detect patterns, disparities, and changes that may be associated with interventions or other causes. Summative evaluation is the effort to detect changes in output, outcomes, and impacts associated with the interventions and to attribute those changes to the interventions. In this report, the Committee sometimes uses the term evalu-ation to refer to all four of these functions. An indicator is a source of data or evidence that can be used to assess the status or trend of a person or population (a measurement, e.g., prevalence of obesity).
OBESITY EVALUATION PLANS
Evaluation plans (for assessment, monitoring, surveillance, and summative evaluation activities) are tools that contain guidance for planning, implementing, and evaluating obesity prevention efforts. A comprehensive evaluation plan can guide decision makers and users responsible for developing or funding evaluations to measure progress in national obesity prevention efforts. Community-level obesity evalua-tion plans can similarly support identification of key components in implementing evaluations at the local level. They offer guidance at the community level that is sensitive to local variation in needs, context, and resources, and they can help to support aggregation and dissemination of information across communities.
As described in the evaluation process framework in Figure 10-1 (detailed in Chapter 3), an evalu-ation plan is a key activity (found in Box 2 of Figure 10-1) that provides guidance for organizing and implementing evaluation-related efforts to achieve the intended outputs, outcomes, and impacts identified in the evaluation framework.
The successful implementation of the national and community evaluation plans recommended in this report will require the support of other activities, including a core set of indicators and common mea-sures of success; resources for training, technical assistance, and dissemination; and an adequate evalua-tion infrastructure. To support these activities, the Committee (1) identifies existing indicators of progress that can be incorporated into the recommended plans, can be helpful in identifying gaps in existing data and information systems, and can provide examples of indicators that can be used by evaluators seeking to evaluate obesity prevention interventions and (2) recommends actions that will improve leadership and coordination, guidance, capacity, and infrastructure for evaluation efforts.
Actions to support and implement the plans and other activities will improve evaluation capaci-ties in the short-term (e.g., use of a core set of existing indicators), increase evaluation activities in the intermediate-term (e.g., improve capacity and guidance), and enhance data use in the long-term to assess population-level changes and improvements that can result from widespread implementation of evidence-based interventions to prevent obesity (i.e., outcomes, Box 4 in the evaluation framework).
CONCLUSIONS ANd RECOMMENdATIONS
Along with the framework in Chapter 3, the Committee details key findings in this report on dimensions of national- and community-level evaluation, including the information/data needs of those

Copyright © National Academy of Sciences. All rights reserved.
Evaluating Obesity Prevention Efforts: A Plan for Measuring Progress
275Taking Action
Figures S-1, 4-1 and 10-1.eps
1. Inputs
• User/Stakeholder Needs• Existing Objectives Strategies• Context for Evaluationa
• Guiding Principles for Evaluationa
• Resources
2. Activities
• Identify Indicators/Measures of Success• Develop Evaluationa Plans and
Infrastructure• Develop Resources for Training, Technical
Assistance, and Dissemination
3. Outputs
• Core Indicators and Measures• Recommendations and Guidance• Support for Implementation
4. Outcomes
• Short-term: Improved Evaluationa
Capacity and Training• Intermediate-term: Increased
Evaluationa Activities• Long-term: Enhanced Data Use
5. Intended Impacts/ Improvements
• Partnerships, Environments, Policies, Behaviors, Norms
• Energy Expenditure/Intake• Overweight/Obesity• Population Health and Well-Being; Equity
Evaluation Framework
FIGURE 10-1 Framework for evaluating progress of obesity prevention efforts. a Evaluation refers to assessment, monitoring, surveillance, and summative evaluation activities. NOTE: An Evaluation Plan is an activity listed in Box 2.
interested in obesity prevention and its results (Chapter 2), indicators that can serve as markers for assessing the progress of obesity prevention efforts recommended in the APOP report (Chapter 4), the infrastructure and capacity to support evaluation, and methods and protocols for conducting evaluations (Chapters 5, 6, 7, and 8), and a systems approach to obesity prevention evaluation efforts (Chapter 9). Based on these findings, the Committee has identified seven broad conclusions that serve as the context for the development of and guidance provided in the recommended plans and supporting actions that follow (see Box 10-1).
This chapter describes (1) indicators that are aligned with the recommendations in the APOP report from readily available data sources; (2) a National Obesity Evaluation Plan; and (3) a Community Obesity Evaluation Plan, and it recommends seven actions to support the implementation of the recommended plans. In the final part of the chapter the Committee identified measurement ideas for determining the impact of the HBO/IOM TWOTN campaign.

Copyright © National Academy of Sciences. All rights reserved.
Evaluating Obesity Prevention Efforts: A Plan for Measuring Progress
Evaluating Obesity Prevention Efforts276
BOX 10-1 Broad Conclusions Informing Plans for Evaluation Regarding Obesity Prevention Efforts
• There is a pressing need to act on the problem of obesity, but there are gaps in the certainty of the effectiveness of actions or mixture of actions being implemented across the country. Systematic and comprehensive evaluations along with more routine assessments, monitoring, and surveillance offer valuable guidance for improving the quality and outcomes (or impact) of the actions being implemented and for defining the direction of further basic and implementation research.
• Information generated from current obesity prevention evaluation efforts, other than assessment of needs at the national and state levels, does not always address the needs and interests of the users of this information, often because of limited or outdated data (especially at the community level) and few presentations of the data in useful and timely formats.
• Current data (monitoring) systems do not adequately track progress of environmental and policy- related obesity prevention actions or systems changes recommended in the Accelerating Progress in Obesity Prevention report (IOM, 2012a). Such monitoring is needed at both the national and com munity levels, especially for populations at greatest risk for obesity. These limitations exist primarily because monitoring systems have traditionally focused on measuring individual behaviors, energy expenditure/energy intake, and overweight and obesity.
• Current investment in evaluation is too low and sporadic, presenting serious barriers to understanding the impact of and need for future investments in implementing interventions.
• A systems science approach to evaluation can help evaluation users identify and select combinations of actions and strategies to implement in multiple sectors, and at multiple levels, with available resources.
• Although many data systems exist, the current national systems for monitoring progress of recom-mended obesity prevention actions and for surveillance of their effects on obesity lack adequate leader-ship, coordination, infrastructure, guidance, accountability, and capacity.
• Communities lack adequate guidance, capacity, data, and resources necessary for assessing the status of obesity and its determinants, identifying prevention needs, monitoring obesity prevention actions, evaluating their short-term outcomes, and tracking (through surveillance) their long-term association with obesity reduction in the aggregate and differences among population segments.
Indicators of Progress
One clear gap in evaluation efforts is the identification of a set of core indicators to use at the national and community levels for measuring progress in obesity prevention efforts. As a key first step in identifying this core set, the Committee identified a list of indicators that currently exist. Based on available and ongoing data sources, the Committee identified several overarching and goal area–specific

Copyright © National Academy of Sciences. All rights reserved.
Evaluating Obesity Prevention Efforts: A Plan for Measuring Progress
277Taking Action
indicators that were best aligned with the recommendations included in the APOP report. The 83 indica-tors identified provide a menu of possible indicators for use by evaluators. This exercise produced a list of indicators that can act as a starting point for the development of core indicators and related measures as well as for the identification of gaps in the existing data systems that can be incorporated into evaluation plans (national and community levels), and provide guidance to improve long-term evaluation infrastruc-ture and capacities. In the short term, evaluators of obesity prevention programs, policies, and environ-ments can use the indicators identified by the Committee to begin to comprehensively assess obesity pre-vention actions already being implemented across the country.
Of particular importance to the Committee was recognition that evaluating progress for the nation as a whole, and for regions of the nation, requires special attention to the disparities that are associated with the obesity epidemic. Although numerous challenges remain, the Committee found a small yet grow-ing literature of tools and methodologies for monitoring progress toward obesity prevention among popu-lations with health disparities.
A National Evaluation Plan for Obesity Prevention
A discrepancy exists between the importance and magnitude of the obesity problem and the level of action in the United States for developing a cohesive plan to evaluate implementation of efforts across the country and assess their impact. Currently U.S. efforts lag behind those in other countries to provide common guidance, support, and the appropriate infrastructure to support evaluation efforts. Although the Committee identified important strengths of the current monitoring, surveillance, and summative evalua-tion data systems, limitations of current national evaluation efforts exist, the following needs resulting in:
• coordinating leadership, integration, and accountability of evaluation efforts across federal agencies, within and between departments, across federal, state, and local governments, and with the nongovernmental and private sectors;
• maximizing and coordinating the use of data already being collected;• identifying and prioritizing indicators at the national and community levels and developing new
indicators where necessary; • improving surveillance capacity and frequency, especially for policies and environmental factors,
and evaluation capacity/leadership;• improving training and support for monitoring, surveillance, and evaluation;• improving access to and dissemination of data, findings from analysis, and other information
for the consumer;• collecting additional longitudinal data, including national incidence trends and local prevalence
trends for obesity;• tracking and monitoring disparities and their social determinants (i.e., differential exposures/
opportunities, vulnerabilities/capabilities, and consequences); and • using best practices of evaluation design, including monitoring and feedback on progress on
intermediate outcomes (i.e., community/system changes such as new policies, expanded pro-grams, and environmental changes).

Copyright © National Academy of Sciences. All rights reserved.
Evaluating Obesity Prevention Efforts: A Plan for Measuring Progress
Evaluating Obesity Prevention Efforts278
The Committee developed a National Evaluation Plan for Obesity Prevention (see Box 10-2) for the United States. The National Obesity Evaluation Plan is designed to organize the planning, implementa-tion, and evaluation of the impact of obesity prevention interventions recommended in the APOP report at a national level. It is important to note here that the APOP report frames obesity prevention efforts in terms of policy, systems-level, and environmental approaches, which require new evaluation approaches, indicators, and measures. Box 10-2 identifies key components for organizing a National Obesity Evaluation Plan. Activities for achieving the objectives are outlined here; Chapter 6 provides detailed guidance to address each activity. This plan is intentionally broad to provide a starting point for the development, use, and support of core indicators (derived from the list in Chapter 4 organized around the APOP recommendations) and recommended methodologies, as well as flexibility for future innovations. The Committee stresses that the National Obesity Evaluation Plan activities should be prioritized to lever-age existing resources that maximize the use of existing resources and efficiency of data collection and avoid duplication of efforts. Seven recommended actions to improve the national evaluation infrastructure necessary for implementing the plans are offered in a later section of this chapter.
The National Evaluation Plan for Obesity Prevention can be used as a model for state and multi-state regional evaluations. By using the National Obesity Evaluation Plan as a blueprint, states will be able to provide comparable data that can be used as benchmarks for state progress, when monitored over time, as well as when compared to other state and national data. However, state-level evaluation activities should be flexible enough to adapt to unique populations and regional characteristics requiring changes in measurement protocols or instruments. While a National Obesity Evaluation Plan can show changes in general trends over time, state-level plans have the potential to identify success stories using APOP strate-gies that can be disseminated broadly to accelerate obesity prevention progress.
The Community Evaluation Plan for Obesity Prevention
The Committee provides guidance for communities that are implementing or intend to implement obesity prevention interventions. The guidance, in the form of the Community Obesity Evaluation Plan consists of two distinct sets of activities: (1) community assessment and surveillance to describe the cur-rent health status, resources, and determinants of health in a community (assessment) and to track them over time (surveillance) and (2) more tailored community intervention summative evaluations that seek to establish and share what is being tried and implemented (monitoring) and to identify the effectiveness of local efforts to prevent obesity (summative evaluation). Together these activities provide baseline data and “diagnostic” data on the state of obesity and related “determinants” or conditions in the community. They offer opportunities to establish and share “what works.”
Many times, information captured locally is specifically tailored data that cannot be captured at the national level; community-level evaluation activities (assessment, surveillance, monitoring, and summative evaluation) provide an essential additional level of detail and local context-specific information that the National Obesity Evaluation Plan cannot. The learnings derived from this local information will allow greater return on national investments in obesity prevention as well as inform refinements to the national evaluation plan.

Copyright © National Academy of Sciences. All rights reserved.
Evaluating Obesity Prevention Efforts: A Plan for Measuring Progress
279Taking Action
BOX 10-2 Core Components and Activities of the National Plan for Evaluating Progress in Obesity Prevention
Purpose: To evaluate progress at the national level in implementing strategies from the Institute of Medicine Accelerating Progress in Obesity Prevention (APOP) report and in achieving intended impacts as described in the Evaluation Framework (see Box 5 in Figure 10-1).
Components:
1. Identify leadership, infrastructure, resources, priorities, and timeline for implementing the plan.
2. Identify current national efforts for evaluation, including indicators (Chapter 4), and incorporate them selectively into national monitoring, surveillance, and summative evaluation data systems that are responsive to the needs of data users.
3. Propose data and infrastructure to add to existing monitoring and surveillance systems to fill gaps, and facilitate community obesity evaluation plans.
4. Propose additional assessment, monitoring, surveillance, and summative evaluation activities, new measures, and innovative strategies to implementation in the future.
5. Outline mechanisms for feedback to data users, assuring accessibility, privacy, and cost-efficiency.
6. Detail adaptations of the plan at the state level, with further applications at the regional level.
Activities (see seven recommended actions for implementation):
1. Designate a federal obesity evaluation task force or entity to oversee the implementation of the National Obesity Evaluation Plan and coordinate with relevant federal, state, local, and private-sector entities.
a. Identify and obtain the infrastructure necessary for implementing the plan and coordinate with appropriate partners
b. Ensure adequate benchmarks/goals, including a schedule for updates
c. Establish a process for prioritization, accountability, and adaptation of plan activities including an annual report to the agency responsible for leading the effort
d. Identify priorities and create an ongoing timeline for implementing the plan
i. Short-term objectives achievable within 1-3 years
ii. Intermediate-term objectives achievable within 3-5 years
iii. Long-term objectives achievable for 5 years or longer
continued

Copyright © National Academy of Sciences. All rights reserved.
Evaluating Obesity Prevention Efforts: A Plan for Measuring Progress
Evaluating Obesity Prevention Efforts280
2. Identify current national evaluation efforts, including indicators for monitoring and surveillance systems to minimize duplication, maximize use of data already being collected, and identify priorities to address evaluation gaps in a coordinated fashion.
a. Use the indicator list (Chapter 4) as a starting point to identify a core set of indicators
b. Match indicators as much as possible for common measurement across jurisdictions
c. Examine existing links to the Leading Health Indicators and other recommendations as consistent with APOP
d. Promote use of common measures through the National Collaborative on Childhood Obesity Research (NCCOR) (see Chapter 5) to facilitate harmonization of data across data-collection systems
e. Expand School Health Policies and Practices Study to include measures of additional settings such as worksite, child care centers, and schools on a rolling basis every 3 years rather than current settings every 6 years
f. Expand National Health and Nutrition Examination Survey (NHANES) sampling, analyses, and/or reporting to address gaps in developmental levels of children birth to 1 year, 2 to 5 years, 6 to 10 years, 11 to 13 years, and 14 to 19 years
g. Expand NHANES to oversample populations that are underserved or at greater risk for obesity
h. Standardize currently collected data and planned systems, such as electronic health records, for data aggregation
i. Incorporate data from birth certificates, Special Supplemental Nutrition Program for Women, Infants, and Children (WIC), Early Head Start, and Head Start into the National Obesity Evaluation Plan
j. Expand current monitoring and surveillance structures into existing data-collection systems at the national or state levels
3. Develop new data-collection infrastructure or systems, indicators, and measures to address gaps identified as priorities in areas such as policy and environment, physical activity, child care centers, worksites, health plans, federally qualified health centers, and community health centers/WIC clinics.
BOX 10-2 Continued
Community Assessments and Surveillance
Community assessment provides first-time assessment of status or trends overall in a community. Surveillance provides repeated or continuous assessment of progress overtime. Specific to this report, these data can assess what is being done in a community and reveal the factors that influence local obesity prev-alence and incidence (e.g., demographics, social determinants).

Copyright © National Academy of Sciences. All rights reserved.
Evaluating Obesity Prevention Efforts: A Plan for Measuring Progress
281Taking Action
4. Increase national and state capacity for assessment, monitoring, surveillance, and summative evaluation.
a. Standardize and provide training on measurement protocols (e.g., body mass index, waist circumfer-ence) and data-collection methods
b. Provide technical support for data utilization, statistical analysis, and reporting
i. Assess the impact of the data loss that resulted from discontinuation of the Centers for Disease Control and Prevention’s Pediatric Nutrition Surveillance System and Pregnancy Nutrition Surveillance System (state- and county-level data) and provide ongoing technical assistance to states that use existing data
c. Create lists of recommended standardized tools and methods for measurement
i. Expand and maintain the NCCOR Surveillance System and Measures Registry
5. Ensure that all relevant data systems include a mechanism for relevant and timely feedback to data users.
a. Expand Health Indicators Warehouse and other interactive sources of federal-level data
b. Expand and maintain Community Commons
c. Develop additional “dashboards” and “federal report card” formats that can be interactive and dis-play data in easily understood infographics and tables
6. Ensure that evaluation plans in federally funded obesity-related grants and programs include common indicators and measures that can be aggregated across communities and inform the plan.
7. Encourage development and testing of alternative and emergent methods of collecting data, including
a. Real-time access of data from community-based organizations
b. Capitalization on the “quantified self” movement
c. Use of new technologies and geospatial modeling
Although the Committee identified several resources available to aid communities across the country, currently there is no consensus guidance for what indicators to measure or methodologies to use when con-ducting obesity-focused community assessment and surveillance. Based on a review of the existing infrastruc-ture for conducting obesity-focused community-level assessment and surveillance, the Committee found
• a lack of data available at the local level for indicators relevant to measuring progress of APOP
strategies. Especially needed are data for preschoolers and elementary school children, and sys-

Copyright © National Academy of Sciences. All rights reserved.
Evaluating Obesity Prevention Efforts: A Plan for Measuring Progress
Evaluating Obesity Prevention Efforts282
tematic descriptions of determinants of obesity (e.g., environments, policies, other interventions, norms, and attitudes). Additional sources of data at the local level may exist in multiple sectors, such as health care, planning, and schools;
• a need to increase sample size of existing surveillance systems, add data on missing indicators, and develop new systems for policy, environmental, intervention indicators; and
• report data by race and socioeconomic status to the extent possible and by small areas affected by inequity for larger communities.
Other important findings include the following:
• There is a lack of a common set of indicators to allow cross-community comparisons and aggregation.
• Engaging stakeholders/community in assessment process is valuable.• Capacity to develop assessments varies widely across communities.• Improving the accessibility and dissemination of assessment data through multiple channels will
improve their use for decision makers, media, and the public.
The intent of the Community Obesity Assessment and Surveillance Plan (see Box 10-3) is to provide guidance for local communities to identify and use a set of core indicators that measure obesity-related outcomes and impacts and to develop local capacity for these assessments, including common use and understanding of assessment protocols, descriptions of health disparities, community engagement, over-sight, and public reporting on progress. The Committee developed the Community Obesity Assessment and Surveillance Plan to not only accommodate communities with varying resources and assets, but also provide a core set of indicators that can be measured comparably and aggregated across multiple jurisdic-tions. Recommended actions to support the development of local infrastructure and capacities for com-munity assessments and surveillance are offered in a later section of this chapter. These enhanced capaci-ties will lead to greater use of data and findings to inform local obesity prevention efforts, guide resource allocation, and engage stakeholders.
Monitoring and Summative Evaluation of Community Interventions
Community evaluations are critically important to developing knowledge about effective local interventions and for realistic implementation of local, state, and federal policies and funding initiatives. Community-level evaluation encompasses learning “what works” and also the relative effectiveness of various strategies—the extent to which they work (summative evaluation). In line with “what works,” summative evaluation also informs local implementers about ways to improve and manage interventions. It casts light on how and why these interventions may prevent obesity. Finally, it encompasses translating the effective interventions to be implemented on a broader scale and determining the contexts in which they are and are not effective (monitoring).
Box 10-4 identifies key components to develop and implement a Community-Level Obesity Intervention Monitoring and Summative Evaluation Plan. Considerable flexibility is needed within these components. As outlined, the core of any plan includes engaging stakeholders, identifying resources, hav-ing a logic model or theory of change, selecting the right focus, using appropriate measures, collecting

Copyright © National Academy of Sciences. All rights reserved.
Evaluating Obesity Prevention Efforts: A Plan for Measuring Progress
283Taking Action
BOX 10-3 Components of a Community Obesity Assessment and Surveillance Plan
Purpose: To provide accurate and timely knowledge of local obesity-related conditions and relevant c hanges or trends over time as a result of implementing strategies in the Accelerating Progress in Obesity Prevention (APOP) report.
1. Define community boundaries.
a. Create specific geographic areas that reflect jurisdictions, key stakeholders, and community members’ perceptions of geographic boundaries.
2. Engage community members and other key stakeholders.
a. Include stakeholders to the extent possible, in defining community, identifying priorities, planning assessment, collecting data, interpretating and sense-making of results, and disseminating the findings.
3. Plan assessment/surveillance and include stakeholders and community members.
a. Identify lead agency or agencies responsible for conducting assessment/surveillance.
b. Clarify goals of assessment/surveillance.
c. Define audience and what information will move it to action.
d. Define topics to include in assessment/surveillance.
e. Identify sub-populations and small areas disproportionately affected by obesity, and develop approach to collecting information about them.
f. Select local data to be included about context, assets, interventions, barriers, and social determi-nants, and which data to schedule for ongoing surveillance.
4. Collect data.
a. Obtain existing data from Web-based platforms or published reports.
b. As resources permit, add other sources of data.
c. Create an inventory of local obesity prevention interventions.
5. Analyze and make sense of the data.
a. Include trends over time.
b. Present data for infants, children, adolescents, adults, and special populations.
c. Describe variation in indicators (e.g., across race/ethnicity/socioeconomic status/small areas).
continued

Copyright © National Academy of Sciences. All rights reserved.
Evaluating Obesity Prevention Efforts: A Plan for Measuring Progress
Evaluating Obesity Prevention Efforts284
d. Include comparison to benchmarks, state rates, and peer communities.
e. Compare extent of existing interventions identified to those recommended in APOP report.
f. Share data with community members and other stakeholders for their interpretations and sug-gested implications for action.
g. Visualize, or illustrate, data.
6. Disseminate findings.
a. Prepare reports, websites, infographics, and other dissemination tools.
b. Share findings with stakeholders and engage them in interpretation of findings.
c. Present findings at community meetings for further interpretation.
d. Implement a media advocacy strategy to gain media coverage.
e. Consider using social media to further increase awareness of findings.
NOTE: Steps are further detailed in Chapter 7.
BOX 10-4 Components of a Community-Level Obesity Intervention Monitoring and Summative Evaluation Plan
Purpose: To guide local action and to inform national choices about the most effective and cost-effective strategies identified in the Accelerating Progress in Obesity Prevention (APOP) report for funding, dissemina-tion, and uptake by other communities.
1. Design stakeholder involvement.
a. Identify stakeholders
b. Consider the extent of stakeholder involvement
c. Assess desired outcomes of monitoring and summative evaluation
d. Define stakeholder roles in monitoring and summative evaluation
BOX 10-3 Continued
continued

Copyright © National Academy of Sciences. All rights reserved.
Evaluating Obesity Prevention Efforts: A Plan for Measuring Progress
285Taking Action
2. Identify resources for the monitoring and summative evaluation.
a. Person-power resources
b. Data-collection resources
3. Describe the intervention’s framework, logic model, or theory of change.
a. Purpose or mission
b. Context or conditions
c. Inputs: resources and barriers
d. Activities or interventions
e. Outputs of activities
f. Intended effects or outcomes
4. Focus the monitoring and summative evaluation plan.
a. Purpose or uses: What does the monitoring and summative evaluation aim to accomplish?
b. Priorities by end-user questions, resources, context
c. What questions will the monitoring and summative evaluation answer?
d. Ethical implications (benefit outweighs risk)
5. Plan for credible methods.
a. Stakeholder agreement on methods
b. Indicators of success
c. Credibility of evidence
6. Synthesize and generalize.
a. Disseminate and compile studies
b. Learn more from implementation
c. Ways to assist generalization
d. Shared sense-making and cultural competence
e. Disentangle effects of interventions
NOTE: Steps are further detailed in Chapter 8.
BOX 10-4 Continued

Copyright © National Academy of Sciences. All rights reserved.
Evaluating Obesity Prevention Efforts: A Plan for Measuring Progress
Evaluating Obesity Prevention Efforts286
high-quality data, using appropriate analytic methods, engaging in sense-making, and disseminating findings. Chapter 8 provides detailed support and guidance for implementing each component of the Community-Level Obesity Intervention Monitoring and Summative Evaluation Plan. Recommended actions to support the development of local infrastructure and capacities for community-level intervention monitoring and summative evaluation are posited in a later section of this chapter.
Finally, the National Obesity Evaluation Plan and the Community Obesity Evaluation Plan are interdependent. The two plans have the potential to provide essential support and feedback to each other. Successful implementation of the community plan is supported by the components of the national plan, using indicators, sources of data, resources, and methodologies coordinated and developed with leader-ship at the national level. However, the community plan and its associated activities also provide an addi-tional level of detail and local context-specific information that the national plan cannot measure. Indeed large-scale community-level evaluation efforts, which are intended to identify effective strategies that can be brought to scale in other communities, are already under way.
Considerations for Investing in Obesity Evaluation Plans
Evaluating obesity prevention is complex, and so is valuing the effort. The evaluation of obesity prevention may be a challenging proposition to implement when the gaps and recommendations identified by this report are considered. These challenges include financial resources, political factors, and different points of view of where to invest [scarce] resources. However, prevention of obesity may bring value to many stakeholders in the community and to society as a whole. As such, it would be useful to consider a valuation framework that brings transparency and legitimacy to the decision-making process of whether to invest in evaluation resources. The IOM recently published a report titled An Integrated Framework for Assessing the Value of Community-Based Prevention (IOM, 2012) that provides a blueprint for such a process. Using the proposed framework will allow local, regional, state, and national stakeholders to deal with reasonable disagreement and, in cases where such disagreement persists, identify and address poten-tial legitimacy problems (Pronk et al., 2013).
Taking Action to Support the National and Community Obesity Evaluation Plans
Using the considerable number of indicators available through federal, state, and community efforts identified in this report (Chapter 4) and guided by methodologies and protocols outlined in the plans as a guide (Chapters 5, 6, 7, and 8), researchers, communities, and policy and other decision makers can take immediate action to begin comprehensive assessment of obesity prevention efforts recommended in the APOP report and already under way across the country.
As the study progressed and the Committee’s ideas matured, it became clear that the evaluation plans recommended by the Committee will not be fully realized without organizational changes and sup-port across multiple federal, state, and local government agencies and departments in collaboration with other nonfederal partners responsible for obesity prevention–related activities. Given the existing gaps identified by the Committee, the following recommended actions will support the successful implementa-tion of the components of the evaluation plans and will assure timely and meaningful data to inform and improve obesity prevention efforts at national, state, and community levels. The seven recommendations include aspects of leadership; data collection; guidance for identifying and using common indicators, mea-

Copyright © National Academy of Sciences. All rights reserved.
Evaluating Obesity Prevention Efforts: A Plan for Measuring Progress
287Taking Action
sures, methods, and outcomes; dissemination of the information collected; workforce capacity develop-ment; assessment of disparities and health equity; and a systems approach to evaluation. The Committee offers a set of potential actions to guide each recommended action to fill existing gaps in the current evaluation infrastructure.
The resources needed to implement some of the recommendations (given the set of potential actions) range from minimal to substantial; some are occasional, and others require frequent to continuous mea-surement. As described in the prior section this means that some of the Committee’s recommendations to support implementation of the evaluation plans call for leadership and expenditures that will require trade-off decisions by government, organizations, and the private sector, with astute use of existing resources and prioritization of other necessary actions implemented with short-, intermediate-, and long-term time perspectives.
Improve Leadership and Coordination for Evaluation
The Committee believes that centralized leadership is necessary to coordinate the planning, imple-mentation, and evaluation of the impact of obesity prevention efforts across the country. As described in Chapter 6, most of the existing data collection and support for evaluation exists across multiple federal agencies.1 The current decentralized structure provides limited authority, responsibility, or support and coordination for these efforts at the national level. The Committee views that gap in empowered leader-ship in coordinating resources for evaluating obesity prevention efforts at the federal level as a major obstacle to measuring obesity prevention efforts. Progress could be made if a federal task force or entity would take a leadership position in this coordination effort.
A number of relevant task forces/entities could serve in this coordination role. The Committee believes that one or a combination of these would be the best option for overseeing and implement-ing the National Obesity Evaluation Plan and for reporting to whatever agency is leading these efforts. Alternatively, the appointment of a new task force could also successfully address the need for improved leadership of evaluation of obesity prevention efforts, but the committee does not view it as necessary. It was not in the Committee’s charge or in its expertise to analyze various options and recommend a spe-cific entity to take on this responsibility (e.g., Department of Health and Human Services [HHS] Healthy Weight Task Force, National Prevention Council, National Collaborative on Child Obesity Research, Interagency Committee for Human Nutrition Research, National Committee for Vital and Health Statistics).
Recommendation 1: An obesity evaluation task force or another entity should oversee and implement the National Obesity Evaluation Plan and provide support for the Community Obesity Evaluation Plan and should coordinate with other federal, state, and local public- and private-sector groups and other stake-holders who support, use, or conduct evaluations. The task force/entity could be a new or existing entity or a combination of existing entities.
1 Includes, but is not limited to, efforts in the following federal agencies: Corporation for National and Community Service; Departments of Agriculture, Commerce, Defense, Education, Health and Human Services, Interior, Labor, Transportation, and Veteran Affairs; Domestic Policy Council; Environmental Protection Agency; Federal Trade Commission; General Services Administration; and Office of Management and Budget.

Copyright © National Academy of Sciences. All rights reserved.
Evaluating Obesity Prevention Efforts: A Plan for Measuring Progress
Evaluating Obesity Prevention Efforts288
The task force that oversees the National Obesity Evaluation Plan will have the following key roles:
• Identify and secure the infrastructure (i.e., effective leadership structure) necessary for imple-mentation of the National Obesity Evaluation Plan
• Coordinate with appropriate federal partners and include representatives from major stake-holder groups (e.g., child care settings, schools, worksites, local and state government, public health departments, business/private sector, and communities)
• Ensure adequate national benchmarks/guidelines/goals (e.g., Dietary Guidelines for Americans, Healthy People 2020 objectives, Physical Activity Guidelines for Americans, reports of the U.S. Surgeon General)
• Create an ongoing timeline for implementation of the activities outlined in the National Obesity Evaluation Plan
• Establish a process for accountability, prioritization, and adaptation by agencies reporting periodically to the task force/entity on their activities, and the task force/entity reporting annu-ally to the agency that is leading these efforts on coordination efforts, gaps in monitoring, recommendations for new measures and evaluations, and progress toward meeting goals.
Improve Data Collection for Evaluation
Recommendation 2: Using the recommended indicators and gaps identified in this report as guides (i.e., related to Accelerating Progress in Obesity Prevention report strategies), all federal agencies2 and state and local health departments responsible for collecting data relevant to obesity prevention efforts, in coordination with relevant private partners, should identify, coordinate, and maximize current efforts for ongoing collection of recommended indicators and, according to the priorities identified, address existing evaluation gaps at the national and local levels.
To guide the implementation of this recommendation, potential actions to coordinate efforts and address gaps include the following:
• Examine all relevant national survey activities and harmonize existing efforts (e.g., use of
common metrics) across the federal agencies (see Appendix Table D-1). • Identify linkages among current U.S. efforts identified in Recommendation 1 (and those of
World Health Organization and European Union obesity-related evaluation plans) to enhance multinational coordination, comparison, and efficiency of evaluation plans.
• Ensure the ongoing collection and maintenance of existing data systems, leverage their use, and increase their capacity through connection and computing technology.
• Standardize currently collected data and data systems (e.g., electronic health records, data from departments of motor vehicles) to make aggregation and comparison of data feasible.
2 Agricultural Research Service, Economic Research Service, and Food and Nutrition Service of the U.S. Department of Agriculture; Census Bureau of the U.S. Department of Commerce; Agency for Healthcare Research and Quality, Centers for Disease Control and Prevention, Health Resources and Services Administration, and National Institutes of Health of the U.S. Department of Health and Human Services; Bureau of Labor Statistics of the U.S. Department of Labor; and Federal Highway Administration of the U.S. Department of Transportation.

Copyright © National Academy of Sciences. All rights reserved.
Evaluating Obesity Prevention Efforts: A Plan for Measuring Progress
289Taking Action
• Expand existing surveys or develop new monitoring and surveillance systems (through other governmental funding or private funds or partnerships with commercial data providers) to address gaps at the national level, including increased frequency of key existing surveys; improved sampling or analysis and reporting for key intervention priorities in existing data surveys (all developmental levels of children and adolescents, populations at greater risk of obesity); in areas such as school, child care centers, worksites, health plans, clinics; increased sharing and use of commercially available data; developmental and implementation of policy and environmental indicators; cataloguing of interventions; and longitudinal data systems to monitor the incidence (i.e., new cases) of obesity (see Chapter 6, and Chapter 4, Table 4-4, for detailed list of gaps).
• Build, connect, and strengthen existing data systems and form partnerships to improve the avail-ability of existing data to local jurisdictions, including improving sampling methodology and size; partnering with schools, health plans, and businesses to collect and make available rel-evant information to local jurisdictions; and including policy and environmental indicators (see Chapter 7 and Chapter 4, Tables 4-1 and 4-4).
• Assess the loss of data from discontinued or one-time surveillance systems (e.g., Centers for Disease Control [CDC] and Prevention’s Pediatric and Pregnancy Nutrition Surveillance Systems, National Youth Physical Activity and Nutrition Study) that could provide additional national-, state-, and local-level data and determine what support can be provided to states using existing data.
• Encourage state and local governments to develop the necessary infrastructure for creating data systems that will capture obesity prevention–related data below the national and, in some cases, state levels.
• Encourage states to disseminate existing data relevant to local jurisdictions and provide support to communities by developing community-level indicator estimates where data gaps remain.
Provide Common Guidance for Evaluation
Recommendation 3: Relevant federal agencies (e.g., in the U.S. Departments of Agriculture, Commerce, Health and Human Services, Labor, and Transportation) and state and local health departments, in collaboration with nonfederal partners, should standardize the collection and analysis of data, includ-ing common indicators, measures, methods, and outcomes used for assessment, monitoring, surveillance, and summative evaluation to assure aggregation among localities and back to the National Obesity Evaluation Plan.
To guide the implementation of this recommendation, potential actions to standardize the use of common indicators and measures include the following:
• Promote the use of sets of core indicators for assessment at the national, state, large community, and small community levels that, at a minimum, include indicators of obesity prevalence, physi-cal activity, and nutrition to assess environmental and policy changes as recommended in the APOP report (see recommended indicators in Chapter 6, Table 6-3, for national- and state-level indicators and Chapter 7, Table 7-2, for large and small communities).

Copyright © National Academy of Sciences. All rights reserved.
Evaluating Obesity Prevention Efforts: A Plan for Measuring Progress
Evaluating Obesity Prevention Efforts290
• Identify, develop, and disseminate a common measure for capturing each recommended indica-tor, maximizing feasibility and validity while minimizing cost and identifying what would be possible to collect at multiple levels—national, state, and local.
• Ensure that all federally funded grants and programs that include the recommended strategies to accelerate progress in obesity prevention (i.e., APOP report recommendations) include appropri-ate core indicators and common measures. Encourage similar metrics for research and summa-tive evaluation funded by nongovernmental organization grants.
• Organizations that conduct mandated community assessments and surveillances should include the appropriate indicators recommended by the Committee (see Chapter 7, Table 7-2), including hospitals and their partners who are conducting required assessments and public health agencies who are meeting accreditation requirements.
To guide the implementation of this recommendation, potential actions to standardize the use of common methods and outcomes include the following:
• Create a standard national evaluation report template for assessing the progress of obesity pre-vention efforts that specifies obesity-related indicators, benchmarks, and subgroup analyses.
• In collaboration with the National Collaborative on Child Obesity Research, federal agencies (e.g., CDC, U.S. Department of Agriculture) should promote use of common tools and methods for measuring immediate and long-term outcomes.
• For community assessments and surveillance, promote the use of best practice templates for planning and implementing community assessments (see Box 10-3 and Chapter 7). Create a standard obesity community assessment and surveillance template that specifies obesity-related indicators, recommended analysis (e.g., subgroup, small areas, time trends), benchmarks and peer comparisons, and presentation format. It should include model language and provide a design template to minimize effort needed to produce reports. Specifications should include routine across-group comparisons (e.g., race, income) and comparisons with peer communities.
• Promote the use of best practice templates for community-level monitoring and summative evaluations of obesity prevention efforts (see Box 10-4 and Chapter 8), including the use of practical participatory engagement and use of a strong methodological study design and analy-ses. Document critical evaluation goals in a standardized format to improve the evidence base at levels practical for the resources of the community, including (1) monitoring and documenting implementation of policy, program, and environmental changes; (2) estimating collective impact of combinations of strategies including by characterizing and weighting their intensity (i.e., strength of intervention, reach, duration); and (3) measuring intermediate-term changes (e.g., in policies, systems, infrastructure, and capacity) and their association with long-term surveillance of population-level outcomes (e.g., behaviors related to physical activity and healthy nutrition, obesity).
• Examine new, alternative, and emerging methods of collecting data (e.g., real-time access of data from community-based organizations, crowd sourcing techniques, new technologies and hand-held or worn devices, geographic information systems).

Copyright © National Academy of Sciences. All rights reserved.
Evaluating Obesity Prevention Efforts: A Plan for Measuring Progress
291Taking Action
Improve Access to and Dissemination of Evaluation Data
Recommendation 4: Relevant federal agencies (e.g., in the U.S. Departments of Agriculture, Commerce, Health and Human Services, Labor, and Transportation) in collaboration with academics, non-governmental organizations, and state and local health departments, should coordinate existing efforts to ensure that federal, state, and local assessment, monitoring, surveillance, and summative evaluation systems include a mechanism for feedback to users of evaluation data. In addition, local evaluations should con-tinue to build the evidence base for the Accelerating Progress in Obesity Prevention report strategies; be stored, curated, synthesized, and shared to improve generalizable knowledge about implementation barriers and opportunities; and clarify “what works” in different contexts.
To guide the implementation of this recommendation, potential actions to improve access to and disseminate data include the following:
• Further develop or expand use of existing data warehouses and resource centers (e.g., HHS’s Health Information Warehouse, Data Resource Center for Child and Adolescent Health). The National Collaborative on Child Obesity Research is considering an evaluation registry that would describe and identify where major evaluation data can be obtained; this should be encour-aged and expanded.
• Expand access to and increase functionality of data visualization tools (e.g., Community Commons, Data Resource Center for Child and Adolescent Health) so that users can add local data and produce charts and maps.
• Provide tools to use and access data for local data analysis, including support for generating synthetic estimates.
• Develop registries for gathering and disseminating the results of community-level evaluations of obesity prevention efforts.
• Create an online data entry, assessment, and monitoring system to support regular local food and physical activity environment, program, and policy scans.
Improve Workforce Capacity for Evaluation
Recommendation 5: The Centers for Disease Control and Prevention, National Institutes of Health, and the U.S. Department of Agriculture, through the National Collaborative on Child Obesity Research and other nongovernmental and professional organizations, should build on their existing evaluation resources to assure support for the diverse and inter-disciplinary workforce engaged in conducting assessments, sur-veillance, monitoring, and summative evaluation activities.
To guide the implementation of this recommendation, potential actions to improve workforce capacity include the following:
• Provide standardized training on planning and designing assessments, surveillance, monitoring, and summative evaluations for policy and environmental interventions, including the use of common indicators, measurement protocols, data collection methods, and the use of qualitative methods.

Copyright © National Academy of Sciences. All rights reserved.
Evaluating Obesity Prevention Efforts: A Plan for Measuring Progress
Evaluating Obesity Prevention Efforts292
• Develop mechanisms for providing technical assistance for data access, statistical analysis, and reporting from state health departments, federal government (e.g., CDC), and nongovernmental organizations for states, territories, and local entities.
• Create a database of local evaluation expertise for use by stakeholders engaged in obesity pre-vention interventions.
• Link to a national network of knowledge brokers who can help to support and guide implemen-tation of evaluation plans.
• Identify expertise at state and local universities and colleges for improved design and analysis of initiatives.
• Partner with state and local universities and professional organizations (e.g., National Association of County and City Health Officials) to offer online courses/webinars on how to conduct community assessments, surveillance, monitoring, and summative evaluations in different contexts.
• Strengthen university-community engagement and collaboration through community-based participatory assessments and participatory evaluation.
• Facilitate the development of resources provided to state and local health departments so they have necessary capacity to evaluate obesity prevention efforts.
• Increase skills in communicating findings with consumers, media, and decision makers in a relevant and understandable manner.
Improve Evaluations to Address Disparities and Health Equity
Recommendation 6: The U.S. Department of Health and Human Services in collaboration with non-federal partners should increase its capacity to address health equity by practicing participatory and culturally competent evaluation, and it should standardize the collection, analysis, and reporting of data targeting disparities and health equity, and improve the accessibility of tools and methods for measuring social determinants that put populations at elevated risk for obesity.
To implement this recommendation,
• CDC as well as state and local health departments should strengthen assessment, monitoring, surveillance, and summative evaluation efforts through the following activities: (1) assure data samples are designed to allow analysis of differential and avoidable health outcomes related to race/ethnicity, income, and geographic sub-groups; (2) increase local data collection with an emphasis on disadvantaged populations and the differential exposures, vulnerabilities, and consequences that produce disparities; (3) make better use of data aggregation that allows for pooling of data across time and/or geographic area; (4) improve the methods for small area esti-mation that are often used to provide smoothed or synthetic estimates of risk; (5) standardize metrics to allow more effective pooling of data; (6) improve data collection methods via multi-method sampling (e.g., telephone, in-person, Internet); and (7) employ interviewers fluent in the language and culture of choice (for populations for whom English is not the first language).
• CDC, as well as state and local health departments, should strengthen assessment and monitor-ing of environmental conditions and systems relationships among them that produce disparities

Copyright © National Academy of Sciences. All rights reserved.
Evaluating Obesity Prevention Efforts: A Plan for Measuring Progress
293Taking Action
through the following activities: (1) increase local data collection with an emphasis on differ-ential exposures (e.g., access to healthful foods), vulnerabilities, and consequences; (2) adapt measures to allow for culturally appropriate foods, activities, and health-promoting environ-ments; and (3) use methods for small-area analysis to examine associations between differential exposures/vulnerabilities and associated health disparities.
• The Secretary of HHS in collaboration with other federal agencies should (1) develop common conceptual and operational language, domain (i.e., individual dietary behavior, food environ-ment, individual physical activity behavior, physical activity environment), and definitions to understand influences on disparities and health equity in obesity, taking into account expertise from multiple disciplines; (2) identify common tools (both qualitative and quantitative) for all target populations most at risk for obesity disparities across all levels of impact (e.g., individual, community, society); and (3) emphasize the quality of these recommended tools and methods for adapting them to specific contexts and systems.
• The National Collaborative on Child Obesity Research, a public-private partnership, should (1) identify best practices for both participatory and culturally competent evaluation; (2) expand the capability of its Registry to house and provide regular updates on core tools and methodolo-gies to measure disparities and equity and improve the accessibility, utility, and dissemination of these tools; and (3) consider expanding the core tools and methodologies to include adults.
Support a Systems Approach in Evaluation
Recommendation 7: Evaluators, government, and private funders should incorporate a systems approach to evaluating obesity prevention efforts into their research-related activities through leader ship, funding, and training support.
To implement this recommendation, • Evaluators should embrace a systems approach—reflecting interactions among strategies in and
across multiple sectors and levels—to guide their methods of research and evaluation of obesity prevention efforts.
• Government agencies should examine what combination(s) of indicators is most appropriate for evaluating progress in obesity prevention, focusing on categories of indicators that relate to the systems framework recommended in the APOP report.
• Government agencies and private organizations funding obesity prevention research and evalu-ation should (1) stimulate the use of systems science by integrating it into requests for proposals of research designed to address multi-sectoral, multi-level, and multi-component issues; (2) create requests for proposals that focus on systems science–based research in obesity prevention; and (3) stimulate research on the value proposition of a systems approach to obesity evaluation by creating calls for research that include numerous domains and elements to identify the “value” of community-based interventions (based on the recommendations of the Committee on Valuing Community-Based, Non-Clinical Prevention Policies and Wellness Strategies).
• Relevant federal agencies funding obesity prevention work (e.g., CDC, National Institutes of Health, Agency for Healthcare Research and Quality) should encourage and promote partner-

Copyright © National Academy of Sciences. All rights reserved.
Evaluating Obesity Prevention Efforts: A Plan for Measuring Progress
Evaluating Obesity Prevention Efforts294
ships between federal/public and private organizations to train the evaluation workforce in the use of systems science for the purpose of obesity prevention evaluations by convening work-shops, bringing together stakeholders, and providing pilot funding for developmental projects.
ThE wEIGhT OF ThE NATION MEASUREMENT IdEAS
TWOTN, a campaign produced by HBO and the IOM, is an illustrative contributor to a long-term national commitment to prevent obesity through policy and environmental changes. Along with many other events and vehicles, TWOTN attempts to make people aware of the obesity problem, raise their consciousness about policy and environmental forces that give rise to obesity, and, with the community screenings and school materials, engage them in strategies to address the problem. TWOTN utilized mul-tiple components, including national (primarily the HBO television series and associated website) and community components (e.g., local screenings, school initiatives). According to its task, the Committee reviewed the components and goals/objectives of TWOTN and offered ideas for measurement of its impact.
Given the range of social media and advocacy efforts involved in TWOTN, it is a challenge to assess its contribution to the total mix among other components of the national efforts, let alone attribute change in physical activity, nutrition behaviors, or obesity to it; however, assessment of TWOTN can be illustrative of some of the challenges and opportunities that are inherent in evaluation of similar obesity prevention initiatives.
The initial national evaluation of TWOTN (see Box 6-3) will provide indicators of national dosage (or reach or exposure). The Committee concludes that further national-level evaluation is not warranted at this time because the extensive diffusion and secondary reach of the program has made comparison populations increasingly difficult to distinguish based on their exposure to elements of the campaign. The Committee provided some methods for national evaluation of future campaigns in Chapter 6. However, it will probably not be possible to disentangle TWOTN media campaign activities from other national and community activities that employ policy and environmental strategies to raise awareness and engage stakeholders in obesity prevention at this time.
Current community summative evaluation efforts by Prevention Research Centers (through University of North Carolina Chapel Hill) and Kaiser Permanente will provide indicators of local dosage or reach for TWOTN. Further community summative evaluations should be based on a logic-model approach. For example, if schools utilize TWOTN-derived products, such as the media kits and the three follow-on children’s film, then one might assess changes in knowledge about obesity before versus after viewing the film. The Committee emphasizes the importance of (1) using strong theoretical or logic models; (2) assessing reach or dosage, which is actually a critical step in the logic model for any health promotion program or mass media campaign; and (3) multiple waves of measurement, the more the better, preferably both before and after a campaign. Implementing these steps will require a commitment to resources for supporting the measurement of the community components of the campaign. Chapter 8 details these current efforts and suggests approaches to evaluating the community-level components of TWOTN.
The only real source of mass media data on reach, exposure, or dosage is from commercial sources (e.g., Nielsen). No government-sponsored repository of these data exists. This is distinct from most of

Copyright © National Academy of Sciences. All rights reserved.
Evaluating Obesity Prevention Efforts: A Plan for Measuring Progress
295Taking Action
the other indicator areas, so it is worth highlighting as a potential area for strengthening the capacity for national evaluation of future media campaigns and media material for obesity prevention efforts (see Chapter 6).
FINAL ThOUGhTS
In 2012, the IOM’s Accelerating Progress in Obesity Prevention: Solving the Weight of the Nation report provided recommended strategies and action steps for implementation by key stakeholders and sectors that individually have positive acceleration potential and that combined will create synergies that can further accelerate progress in preventing obesity over the next decade. These 20 strategies offer the focus for future evaluation efforts across the United States. This report builds on these strategies and offers an evaluation framework to inform and improve obesity prevention efforts. Key activities identified in the evaluation framework and provided in this report include obesity evaluation plans at the national and community levels that provide a tool for guiding the planning, implementation, and evaluation of obesity prevention efforts. A second key activity identified in the evaluation framework is a list of indica-tors and sources of data and provide a source of baseline data to begin to comprehensively assess obesity prevention actions already being implemented across the country. These indicators can be incorporated into the evaluation plans and will provide guidance for improving new targeted evaluations of the strate-gies recommended in the APOP report.
REFERENCES
IOM (Institute of Medicine). 2012. An integrated framework for assessing the value of community-based prevention.
Washington, DC: The National Academies Press.
Pronk, N. P., L. M. Hernandez, and R. S. Lawrence. 2013. An integrated framework for assessing the value of
community-based prevention: A report of the Institute of Medicine. Preventing Chronic Disease 10:120323.

Copyright © National Academy of Sciences. All rights reserved.
Evaluating Obesity Prevention Efforts: A Plan for Measuring Progress

Copyright © National Academy of Sciences. All rights reserved.
Evaluating Obesity Prevention Efforts: A Plan for Measuring Progress
297
AAcronyms
ACA Patient Protection and Affordable Care Act of 2010ACHP Alliance for Community Health PlansACS American Community SurveyAHIP America’s Health Insurance PlansAHRQ Agency for Healthcare Research and QualityALSPAC Avon Longitudinal Study of Pregnancy and Childhood AMA American Medical AssociationAPOP Accelerating Progress in Obesity Prevention: Solving the Weight of the Nation
(2012 Institute of Medicine report)ARRA American Recovery and Reinvestment Act
BGCA Boys and Girls Club of AmericaBMI body mass index BRFSS Behavioral Risk Factor Surveillance SystemBTG Bridging the Gap program
CACFP Child and Adult Care Food ProgramCAS community assessment and surveillanceCATCH Child and Adolescent Trial for Cardiovascular Health programCBPR community-based participatory researchCCAT Community Coalition Action TheoryCDC Centers for Disease Control and PreventionCFBAI Children’s Food and Beverage Advertising InitiativeCLASS Classification of Laws Associated with School StudentsCOCOMO Common Community Measures for Obesity PreventionCOGIS Childhood Obesity GIS (Community Cares)CPTI Community Pediatrics Training InitiativeCPPW Communities Putting Prevention to Work

Copyright © National Academy of Sciences. All rights reserved.
Evaluating Obesity Prevention Efforts: A Plan for Measuring Progress
Evaluating Obesity Prevention Efforts298
CSFII Continuing Survey of Food Intakes by IndividualsCTG Community Transformation Grant CzCBP County zIP Code Business Patterns
DASH Division of Adolescent and School HealthDGA Dietary Guidelines for Americans DGAC Dietary Guidelines Advisory CommitteeDOE Department of EducationDOT Department of TransportationDPAS WHO Global Strategy on Diet, Physical Activity and Health
EFNEP Expanded Food and Nutrition Education ProgramEHR electronic health recordEPA Environmental Protection AgencyEPODE Ensemble Prévenons l’Obésité Des EnfantsEPSDT Early and Periodic Screening, Diagnosis and TreatmentERS Economic Research Service
FACES Head Start Family and Child Experiences SurveyFCC Federal Communications CommissionFDA Food and Drug AdministrationFHWA Federal Highway Administration FLEJ Faith Leaders for Environmental JusticeFLSA Fair Labor Standards ActFNB Food and Nutrition BoardFQHC federally qualified health centerFSS Food Security Supplement to the Current Population SurveyFTC Federal Trade CommissionFY fiscal year
GAO Government Accountability Office (previously General Accounting Office)GIS geographic information systemGMB group model buildingGSA U.S. General Services Administration
HEALCP Healthy Eating Active Living Convergence PartnershipHEDIS Healthcare Effectiveness Data and Information SetHHFKA Healthy, Hunger-Free Kids ActHHS U.S. Department of Health and Human ServicesHIA Health Impact AssessmentHIE health information exchangeHIPAA Health Insurance Portability and Accountability Act

Copyright © National Academy of Sciences. All rights reserved.
Evaluating Obesity Prevention Efforts: A Plan for Measuring Progress
299Appendix A
HITECH Health Information Technology for Economic and Clinical HealthHIW Health Indicators Warehouse HP2020 Healthy People 2020HPI Health Policy InstituteHRSA Health Resources and Services AdministrationHWC Healthy Weight Commitment
IFPS-II Infant Feeding Practices Survey IIIOM Institute of MedicineIWG Interagency Working Group
JCSEE Joint Committee on Standards for Educational Evaluation
L.E.A.D. Locate, Evaluate, Assemble, Inform Decision
MCHB Maternal and Child Health BureauMEPS Medical Expenditure Panel SurveyMMSA metropolitan and micropolitan statistical areamPINC National Survey of Maternity Practices in Infant Nutrition and Care
NACCHO National Association of County and City Health OfficialsNAMCS National Ambulatory Medical Care SurveyNASBE National Association of State Boards of EducationNCCDPHP National Center for Chronic Disease Prevention and Health Promotion NCCOR National Collaborative on Childhood Obesity ResearchNCCOR-R National Collaborative on Childhood Obesity Research RegistryNCHS National Center for Health StatisticsNCI National Cancer InstituteNCQA National Committee for Quality AssuranceNGO nongovernmental organization NHANES National Health and Nutrition Examination SurveyNHES National Household Education Surveys programNHIS National Health Interview SurveyNHTS National Household Travel SurveyNHWS National Health and Wellness SurveyNIH National Institutes of HealthNIOSH National Institute for Occupational Safety and HealthNIS National Immunization SurveyNOPREN Nutrition and Obesity Policy Research and Evaluation NetworkNPHIC National Public Health Information CoalitionNRA National Restaurant AssociationNRC National Research Council

Copyright © National Academy of Sciences. All rights reserved.
Evaluating Obesity Prevention Efforts: A Plan for Measuring Progress
Evaluating Obesity Prevention Efforts300
NRPA National Recreation and Park AssociationNSCH National Survey of Children’s HealthNSLP National School Lunch ProgramNYPANS National Youth Physical Activity and Nutrition Survey
OW Office of Water
PA physical activityPAG Physical Activity Guidelines for AmericansPE physical educationPedNSS Pediatric Nutrition Surveillance SystemPNSS Pregnancy Nutrition Surveillance System PPHEAL Partnership to Promote Healthy Eating and Active LivingPRAMS Pregnancy Risk Assessment Monitoring SystemPRC Prevention Research CenterPSA public service announcementPWSS Potable Water Surveillance System
QALY quality-adjusted life-year
RCT randomized controlled trialREACH Racial and Ethnic Approaches to Community Health ROI return on investmentRWJF Robert Wood Johnson Foundation
SDWIS Safe Drinking Water Information SystemSHPPS School Health Policies and Practices StudySHRM Society for Human Resource ManagementSIPD Survey of Income and Program DynamicsSMART Selected Metropolitan/Micropolitan Areas Risk Trends SNAP Supplemental Nutrition Assistance ProgramSNAP-Ed SNAP EducationSNDA School Nutrition Dietary Assessment Study SoFAS solid fats and added sugars SPAN School Physical Activity and NutritionSRTS Safe Routes to SchoolSurvSAG Surveillance Science Advisory Group
TWOTN The Weight of the Nation campaign
USDA U.S. Department of AgricultureUSPSTF U.S. Preventive Services Task Force

Copyright © National Academy of Sciences. All rights reserved.
Evaluating Obesity Prevention Efforts: A Plan for Measuring Progress
301Appendix A
WHO World Health OrganizationWIC Special Supplemental Nutrition Program for Women, Infants, and Children
YMCA Young Men’s Christian AssociationYMCLS Youth Media Campaign Longitudinal Survey YRBS Youth Risk Behavior SurveyYRBSS Youth Risk Behavior Surveillance System

Copyright © National Academy of Sciences. All rights reserved.
Evaluating Obesity Prevention Efforts: A Plan for Measuring Progress

Copyright © National Academy of Sciences. All rights reserved.
Evaluating Obesity Prevention Efforts: A Plan for Measuring Progress
303
BGlossary
Activities In terms of logic models, the actions necessary to achieve desired outcomes. For this report, activities to improve evaluation efforts include reviewing indicators and measures, developing plans and infrastructure, and enhancing resources.
Assessment An effort in which data on the community or other jurisdiction characterizes the problem, its distribution, and describes efforts to address it.
Body mass index (BMI) A ratio of weight in kilograms to the square of height in meters. BMI is used as a screening tool to identify possible weight problems and is considered a fairly reliable indicator of body fatness.
Causal loop diagram A diagram that links elements in a system by positive or negative feed-back mecha-nisms. Also known as a systems map.
Community People sharing a common place (e.g., city, neighborhood); they may also share a common experience (e.g., living in a neighborhood with few grocery stores or parks or living in poverty) or interest (e.g., working together to promote better nutrition or active living).
Community level Activities conducted by local governmental units (e.g., cities, counties), school districts, quasi-governmental bodies (e.g., regional planning authorities, housing authorities, etc.) and private-sector organizations (e.g., hospitals, businesses, child care providers, voluntary health associations, etc.).
Complex adaptive system A system composed of many unrelated pieces that interact in subtle or nonlin-ear ways to strongly influence the overall behavior of the system.
Complexity The study of complex adaptive systems (see Complex adaptive system).

Copyright © National Academy of Sciences. All rights reserved.
Evaluating Obesity Prevention Efforts: A Plan for Measuring Progress
Evaluating Obesity Prevention Efforts304
Concept mapping A process to enable conceptualizing and describing ideas on a topic and visually rep-resenting these ideas in a map.
Context The set of factors or circumstances that surrounds a situation or event and that gives meaning to its interpretation; the broader environment in which a program operates.
Cross-sectional The observation of a defined population at a single point in time or time interval.
Delays In terms of systems science, the length of time relative to the rate of system change.
Diffusion of innovations The diffusion of innovations theory was proposed by Rogers1 to explain the processes and factors influencing the spread and adoption of new innovations through certain channels over time. Key components of the diffusion theory are (1) perceived attributes of the innovation, (2) inno-vativeness of the adopter, (3) social system, (4) individual adoption process, and (5) diffusion system.
Dynamics In terms of systems science, the behavior over time of a system or any of its components.
Emergence In terms of systems science, the arising of novel and coherent structures, patterns, and properties during the process of self-organization in complex systems.
End users See Evaluation users.
Environmental audit Identification of interventions being implemented in a particular area.
Evaluation users Those with an interest in obesity prevention and its results, also known as stakehold-ers. Can refer to policy makers, government agency staff, nongovernmental organizations at all levels, advocates, opponents, local coalitions, researchers and evaluators, businesses, media, or the public.
Feedback loop In terms of systems science, the mechanism (rule or information flow or signal) that allows a change in a value of an asset at a point in time to affect a flow into or out of that same asset.
Formative evaluation Identifies needs and track changes to guide and facilitate program improvement while the program activities are in progress. In terms of the Committee’s evaluation framework, formative evaluation includes the needs, inputs, resources, and activities.
Geographic information system (GIS) A system of computer hardware, software, and special data used to capture, manage, analyze, and display geographically referenced information.
Group model building A participatory method for including stakeholders in the process of developing a system dynamics model.
1 Rogers, E. M. 2003. Diffusion of innovations. 5th ed. New York: Free Press.

Copyright © National Academy of Sciences. All rights reserved.
Evaluating Obesity Prevention Efforts: A Plan for Measuring Progress
305Appendix B
Health disparities The population-specific differences in the presence of disease, health outcomes, or access to health care across racial, ethnic, and socioeconomic groups.
Impacts In terms of logic models, the population-level changes and improvements that can result from widespread implementation of evidence-based interventions to prevent obesity.
Incidence The frequency of new cases of a condition or disease within a defined time period. Incidence is commonly measured in new cases per 1,000 (or 100,000) population at risk per year.
Indicator A source of data or evidence that can be used to assess the status or trend of a person or pop-ulation. Aggregates of raw and processed data that are used to measure social, economic, and health out-comes such as obesity rates, morbidity, and life expectancy. In this report examples of indicators include the prevalence of obesity or the proportion of states with strong nutritional standards for foods and bev-erages sold or provided in schools.
Inputs In terms of logic models, the type and level of considerations or resources required to support, implement, and accomplish a set of activities and considerations influencing the choice of interventions or activities. In this report examples of inputs include user needs, existing objectives and strategies, and cur-rent context.
Interventions Programs, systems, policies, environmental changes, services, products, or any combina-tion of these multi-faceted initiatives.
Knowledge brokers Organizations or individuals that provide staffing, knowledge, and/or expertise in assessing and interpreting evidence facilitating interaction between research and decision makers.
Leverage point The place to intervene in a system.
Logic model A tool used to present a graphic depiction of how a program is supposed to work along with the relationships between the inputs, activities, outputs, and outcomes.
Longitudinal Examines the specific characteristics of individuals, subgroups, or populations over time.
Measure The actual survey item or set of items, assessment method, or observational technique that is used to quantify an indicator (data or evidence).
Monitoring Tracking of the implementation of interventions (see Interventions) compared to standards of performance.
Natural experiment Naturally occurring circumstances in which different populations are exposed or not exposed to a potential causal factor or intervention such that the circumstances resemble a true exper-iment in which study participants may be assigned to exposed or unexposed groups.

Copyright © National Academy of Sciences. All rights reserved.
Evaluating Obesity Prevention Efforts: A Plan for Measuring Progress
Evaluating Obesity Prevention Efforts306
Obesity In adults, a body mass index (BMI) of 30 or greater is considered obese. Among those who are obese, the increasing health risks at higher levels of BMI are sometimes indicated by further classification into grades of increasing severity: grade 1 obesity is defined as a BMI of 30 to 34.9, grade 2 is a BMI of 35.0 to 39.9, and grade 3 is a BMI of 40 or greater. In this report, obesity in children and adolescents refers to age- and sex-specific BMIs that are equal to or greater than the 95th percentile of the Centers for Disease Control and Prevention’s BMI growth charts.
Objective A statement of movement in an indicator toward a quantitative target usually by a specified time.
Outcomes The changes that result from inputs, activities, and outputs to support evaluation efforts. Depending on the nature of the activities and outputs achieved, an outcome can be short term, intermedi-ate term, or long term. In this report outcomes include improved evaluation and surveillance capacities needed to understand and improve progress in obesity prevention and improved population health and equity.
Outputs The direct products of activities; usually a tangible deliverable produced as a result of an activity. In this report, outputs related to improved evaluation and surveillance include identification of core objectives and measures and recommendation and guidance on methods and protocols for surveil-lance and evaluation.
Overweight In adults overweight is defined as a body mass index (BMI) of 25 to 29.9. In this report, overweight in children and adolescent refers to age- and sex-specific BMIs at or above the 85th percentile of the Centers for Disease Control and Prevention’s BMI growth charts.
Policy monitoring (policy health law) The ongoing, systematic collection, analysis, interpretation, and dissemination of information about a given body of public health law and policy.
Policy surveillance Reports on individual policy measures without linking to prior policy action.
Population dose The product of penetration (reach divided by the size of the target population) and effect size (relative change in behavior for each person exposed).
Prevalence The number of instances of a condition or a disease in a population at a designated point of time; usually expressed as a percentage of the total population.
Simple rules In systems science, simple rules provide guidance for “decisions” about how best to adapt to changes in the environment. Simple rules are used to look retrospectively and to plan prospectively for increasing cohesiveness across an organization or among a group of individuals.
Stakeholders See Evaluation users.

Copyright © National Academy of Sciences. All rights reserved.
Evaluating Obesity Prevention Efforts: A Plan for Measuring Progress
307Appendix B
Summative evaluation The effort (experimental or quasi-experimental controls or designs) to detect changes in output, outcomes, and impacts associated with interventions and attribute those changes to the interventions.
Surveillance The ongoing systematic collection, analysis, and interpretation of data tracked over time to detect patterns, disparities, and changes that may be associated with interventions.
System A set of elements or parts that is coherently organized and interconnected in a pattern or struc-ture that produces a characteristic set of behaviors, often classified as its “function” or “purpose.”
Systems approach An approach that views a phenomenon and its components in its entirety, not just a single element, and that emphasizes the interactions and connectedness of the components to understand the entire system. A systems approach involves awareness of the wider context, an appreciation for inter-actions among different components, and transdisciplinary thinking. It acknowledges that individuals and families are embedded within broader social, political, and economic systems that shape behaviors and constrain access to resources necessary to maintain health.
Systems map See Causal loop diagram.
Systems perspective See Systems approach.
Systems science Research related to systems theory that offers insight into the nature of the whole sys-tem that often cannot be gained by studying the system’s components in isolation.
Systems theory An interdisciplinary theory that requires a merging of multiple perspectives and sources of information and deals with complex systems in technology, society, and science.
Systems thinking An iterative learning process in which one takes a broad, holistic, long-term perspec-tive on the world and examines the linkages and interactions among its elements.

Copyright © National Academy of Sciences. All rights reserved.
Evaluating Obesity Prevention Efforts: A Plan for Measuring Progress

Copyright © National Academy of Sciences. All rights reserved.
Evaluating Obesity Prevention Efforts: A Plan for Measuring Progress
309
CGuiding Principles for Evaluation
Table C-1 provides detailed descriptions of the guiding principles identified in Chapter 3 of the Committee’s report. The Committee devised these principles to serve two aims: (1) to guide its delib-
erations and development of the national- and community-level evaluation plans and (2) to provide guidance to evaluators who will implement the national and community plans in their own settings. Recognizing that each evaluation is subject to its own unique context, constraints, and resources, the principles described below are intended to be suggestive. For each principle, the Committee has provided a plain language definition along with examples of end-user questions to help evaluators to interpret the relevance of a given principle for consideration when (1) identifying indicators of progress, (2) choosing appropriate evaluation processes, and (3) making decisions in regard to evaluating obesity prevention efforts.

Copyright © National Academy of Sciences. All rights reserved.
Evaluating Obesity Prevention Efforts: A Plan for Measuring Progress
Evaluating Obesity Prevention Efforts310
TABLE C-1 Committee to Evaluate Progress in Obesity Prevention Guiding Principle Definitions and End-User Questions
Guiding Principle (indicator/method/end user)* Relevant Definitions/Explanations
Accuracy
(indicator/methods)
Plain language definition: The extent to which an indicator, measure, or evaluation plan is free from error or bias. Accuracy is derived from both reliability (replicability), which is the consistency of an indicator/measure to yield similar results under varying conditions, and validity, which is the extent to which an indicator/measure directly and without error represents a specific concept, construct, or variable. Validity includes internal validity, or the minimization of bias, and external validity, which is the extent to which evaluation findings can be generalized to broader and more diverse populations. Accuracy also encompasses the terms sensitivity, which is the proportion of true positives for a condition or indicator assessed by the measure relative to all those who have the condition or indicator, and specificity, which is the proportion of true negatives for a condition or indicator assessed by the measure relative to all those who do not have the condition or indicator.
Examples of end-user questions: Does the information collected accurately represent what is being measured, e.g., is it valid? Does the information collected reflect the same results under different circumstances and across time periods, e.g., is it reliable or reproducible? Are the data analyzed appropriately? Is the design of the evaluation appropriate to answer the question being asked? Are the conclusions from the evaluation justified? Are the results valid and reliable for a specific population or across more diverse populations? What is the specificity and sensitivity of the measure?
SOURCES: Adapted from Brownson et al., 2012; IOM, 2010; Yarbrough et al., 2011.
Capacity Building
(methods/end user)
Plain language definition: Providing the human resources and infrastructure necessary to conduct and sustain the evaluation including, but not limited to, training, mentoring, identifying alternative funding, building internal assets, and forming partnerships. Ensuring that relevant end users understand the necessity of evaluation capacity at the outset and throughout the evaluation process.
Examples of end-user questions: Do consultation and technical support enhance the competence of those doing the evaluation? Do they enable current and future generations to work together better on this and other evaluations? Are resources identified and used efficiently to continue relevant evaluation efforts? Are end users committed to providing the resources and infrastructure necessary to conduct and sustain the evaluation in both the short- and long-term?
SOURCES: Adapted from Brownson et al., 2012; Fawcett, 2002.

Copyright © National Academy of Sciences. All rights reserved.
Evaluating Obesity Prevention Efforts: A Plan for Measuring Progress
311Appendix C
Guiding Principle (indicator/method/end user)* Relevant Definitions/Explanations
Comparability
(indicator/methods)
Plain language definition: The comparison of an indicator/measure with a frame of reference, standard, or benchmark over time among different data sources, methods/protocols, populations, and communities. Goals and benchmarks for obesity prevention in the United States can be found in Healthy People 2020 (HHS, 2010b), the Dietary
Guidelines for Americans (HHS, 2010a), and the Physical Activity Guidelines for
Americans (HHS, 2008).
Examples of end-user questions: What sources of criteria, goals, or guidelines can be used for obesity-related measures? How does a community/group/population rate or rank in terms of obesity indicators/methods relative to other communities/groups/populations or to the U.S. population in general? How do the obesity indicators/measures in a community or the nation change over time? How far is a community or group from recommended guidelines or benchmarks for obesity-related measures?
SOURCES: Adapted from Fawcett, 2002; IOM, 2009; Rossi and Freeman, 1993; Scriven, 1991.
Context
(methods/end user)
Plain language definition: Assessing the conditions, some more modifiable than others, that can help inform practice. The conditions can be political, cultural, social, and organizational, and include end users’ needs, interpretation, or framing of the results of the evaluation. Consider the broader environment in which an intervention, program, or evaluation is being conducted or implemented. Understanding the context within which an evaluation is being conducted is necessary to identify probable influences on the evaluation design as well as the results of the evaluation. Understanding the context within which an evaluation is conducted also is an important factor in assessing the external validity (i.e., the extent to which evaluation findings can be generalized to broader and more diverse populations) of the evaluation.
Examples of end-user questions: Do contextual factors affect the ability to carry out and evaluate a particular intervention? How does a practitioner or researcher best measure and track contextual factors? Does the evaluation design account for important contextual factors that may influence the outcome of the evaluation? From what context are end users operating?
SOURCES: Adapted from CDC, 1999; Rabin et al., 2006; Waters et al., 2006; Yarbrough et al., 2011.
TABLE C-1 Continued

Copyright © National Academy of Sciences. All rights reserved.
Evaluating Obesity Prevention Efforts: A Plan for Measuring Progress
Evaluating Obesity Prevention Efforts312
Guiding Principle (indicator/method/end user)* Relevant Definitions/Explanations
Coordination and Partnership
(methods/end users)
Plain language definition: Assuring all partner perspectives (including policy makers, evaluators, community members, representatives of various sectors, etc.) are involved in the development, implementation, and dissemination of the evaluation. Maximizes identified strengths and assets of each partner, but also works to address needs and increase capacity of all partners including sharing of resources, risks, and responsibilities. Requires open lines of communication among all partners to ensure effective collaborations. Multi-sectoral collaborations are often necessary and can include members from local or state health departments, elected officials, urban planners, businesses or the Chamber of Commerce, school boards or schools, hospitals, universities, nongovernmental organizations such as local affiliates of the American Heart Association, and Cooperative Extension agents. Strong leadership is key to ensuring effective collaborations and partnerships. Partners can facilitate dissemination of evaluation findings through their respective networks and tailor the findings specific to their end-users’ needs.
Examples of end-user questions: Are all relevant groups or end users involved in the partnership or collaborative? Are community members and other end users involved in determining what “success” would look like? Are sufficient resources devoted to maintenance of the partnership or collaborative? Is communication adequate to allow for effective coordination among end users within the partnership so that duplication of effort is avoided and scarce resources are leveraged to the maximum extent? During and after the evaluation, are the partnerships or collaboratives given opportunities to see the results and to help interpret their meaning?
SOURCES: Adapted from Community-Campus Partnerships for Health, 2012; Fawcett, 2002; Hargreaves, 2010; IOM, 2009, 2010, 2012; WHO, 2010.
Dissemination
(end users)
Plain language definition: The development of a systematic and effective approach to communicate and provide information about obesity-related indicators/measures to the priority population and end users.
Examples of end-user questions: What is the plan for communicating obesity-related indicators/measures to the community or group in a timely fashion? Are the appropriate opinion leaders and end users included in the process? Are dissemination materials appropriate for the end users? Does the dissemination plan have adequate reach within the priority population? Is the process effective?
SOURCES: Adapted from Brownson et al., 2012; Glasgow et al., 1999; Rogers, 2003.
TABLE C-1 Continued

Copyright © National Academy of Sciences. All rights reserved.
Evaluating Obesity Prevention Efforts: A Plan for Measuring Progress
313Appendix C
Guiding Principle (indicator/method/end user)* Relevant Definitions/Explanations
Feasibility
(indicator/methods)
Plain language definition: The effectiveness and efficiency with which an indicator/measure is capable of being measured with available resources. Examples of end-user questions: What tools, staffing, time, funding, or other resources are required to conduct a particular evaluation? Are the required resources accessible to the evaluator or practitioner? What data sources are available at the appropriate level? SOURCE: Adapted from Yarbrough et al., 2011.
Health Disparities/Equity
(indicator/methods/end users)
Plain language definition: The preventable differences in the burden of disease, injury, violence, and opportunities to achieve optimal health that are experienced by socially disadvantaged populations.
Examples of end-user questions: Did the evaluation prioritize and include measures that specifically focus on populations that are disproportionately affected by obesity based on geography, race/ethnicity, socioeconomic status, gender, and age? Are indicators/measures appropriate for socially disadvantaged populations? Do indicators/measures and evaluation plans include input and feedback from end-users from these populations? Are appropriate contextual factors assessed and included in interpretation of results?
SOURCES: Adapted from CDC, 2008; IOM, 2012; WHO, 2010.
Impact
(end users)
Plain language definition: The evaluation improves understanding of whether a program or policy causes changes in the desired direction for the outcome of interest and whether the program or policy has unintended consequences or negative outcomes. Impact assessments involve both qualitative and quantitative methods or a triangulation of methods.
Examples of end-user questions: Do we have information about the contribution of community and systems changes (i.e., new or modified programs, policies, and practices) to valued outcomes? Can we see how (and whether) the amount and distribution of community and systems change is related to community-level outcomes? Are there any unintended consequences or negative outcomes associated with the program or policy?
SOURCES: Adapted from Fawcett, 2002; Rossi and Freeman, 1993; Wholey et al., 2010.
Implementation
(methods)
Plain language definition: The process of adopting and integrating appropriate and routine use of obesity-related indicators/measures and surveillance/evaluation plans into specific settings to provide ongoing feedback for evaluation of obesity prevention efforts.
Examples of end-user questions: Which surveillance/evaluation plan and indicators/measures should be adopted for a particular community? How can a surveillance/evaluation plan be incorporated into routine use to provide data on a periodic basis? How can fidelity of implementation be assured?
SOURCES: Adapted from Brownson et al., 2012; Glasgow et al., 2012.
TABLE C-1 Continued

Copyright © National Academy of Sciences. All rights reserved.
Evaluating Obesity Prevention Efforts: A Plan for Measuring Progress
Evaluating Obesity Prevention Efforts314
Guiding Principle (indicator/method/end user)* Relevant Definitions/Explanations
Parsimony
(indicator/methods)
Plain language definition: The principle that when several indicators/measures could provide similar information, the most succinct and simplest should be selected.
Examples of end-user questions: Is there duplication among selected indictors/measures, or has the most parsimonious assessment been used? Are contextual measures necessary, e.g., do they measure closely interrelated concepts? Have methods been optimized to ensure the most direct measurement possible?
SOURCES: Adapted from Nolan, 1997; Sober, 1981.
Priority Setting
(indicators/methods/end users)
Plain language definition: Involves development of guidelines, standards, and goals to guide evaluation design, indicator/measure development, and dissemination decisions. Requires significant input from end users/partners early in the evaluation design process to ensure that relevant and necessary priorities are identified and accounted for throughout the evaluation design, implementation, and dissemination processes. Accounts for the individual and common goals and objectives of the end users. Includes prioritizing and setting aside necessary resources to support and sustain the evaluation.
Examples of end-user questions: Have all end users specified their priorities at the outset of the evaluation design process? Are all end users’ priorities accounted for in the design, implementation, and dissemination of the evaluation findings? Are end-user priorities reflected in the selection of relevant indicators/measures? Have the end users committed the necessary resources to ensure that their priorities are maintained in the evaluation design, implementation, and dissemination?
SOURCE: Adapted from WHO, 2010.
Relevance
(indicators/methods/end users)
Plain language definition: The extent to which the evaluation objectives and design, including the indicators, measures, and surveillance systems, are consistent with the identified and emergent priorities, needs, concerns, and values of the end users. The extent to which the indicators, measures, and surveillance systems provide practical, timely, meaningful information consistent with identified and emergent needs of end users.
Examples of end-user questions: Are the indicators that will be used to evaluate impact of the program/policy consistent with the end users’ identified and emergent needs? Are the necessary surveillance systems in place to provide the necessary indicators that are responsive to the end-user needs? Are end-user values accounted for in the design of the evaluation?
SOURCES: Adapted from Fawcett, 2002; Wholey et al., 2010; Yarbrough et al., 2011.
TABLE C-1 Continued

Copyright © National Academy of Sciences. All rights reserved.
Evaluating Obesity Prevention Efforts: A Plan for Measuring Progress
315Appendix C
Guiding Principle (indicator/method/end user)* Relevant Definitions/Explanations
Scalability
(indicator/methods)
Plain language definition: The extent to which a measure or evaluation method can be expanded to reach a larger population, yet still maintain accuracy and feasibility.
Examples of end-user questions: Is the evaluation program or measure reaching the entire intended audience or only a subset? What additional resources are required to conduct measurements in the entire population of interest? Will the measure or method retain its validity and reliability when reach is expanded?
SOURCES: Adapted from Brownson et al., 2012; Milat et al., 2012; Pronk, 2003.
Surveillance
(methods)
Plain language definition: Ongoing, systematic, representative collection, analysis, interpretation, and dissemination of data on public health problems, policies, or environments of interest. Requires commitment on the part of end users to ensure that necessary surveillance systems are sustained throughout the life of the evaluation. Surveillance systems often are designed or tailored to respond to end users’ new and emergent needs. Requires end-user support and prioritization to ensure that indicators can be assessed over time.
Examples of end-user questions: Are quantitative data compiled at regular intervals at the national and/or community levels to enable longitudinal tracking of the outcome or public health problem of interest? Are the data in the surveillance system readily available for immediate use at the national/community levels to identify when a public health problem is emerging, worsening, has reached a plateau, or is improving? Can the surveillance system data be extracted in ways to inform policy-relevant decisions? Are policy-tracking data readily available in systematic and reliable formats to indicate the extent to which communities have adopted given policy(ies) of interest?
SOURCES: Adapted from German et al., 2001; Jacobs et al., 2012.
Sustainability
(indicator/methods/end users)
Plain language definition: The likelihood that monitoring and evaluation plans and indicators/measures will be continued or maintained over an extended period of time after external support and funding is terminated.
Examples of end-user questions: What factors (e.g., funds, community capacity/infrastructure, partnerships, policies) are needed to promote sustainability of evaluation efforts? Are the benefits of and feedback obtained from the evaluation plan tangible enough to ensure community support and sustainability? Can the evaluation plan or measure be adapted for sustainability in diverse populations, yet maintain accuracy?
SOURCES: Adapted from Scheirer and Dearing, 2011; Shediac-Rizkallah and Bone, 1998.
TABLE C-1 Continued

Copyright © National Academy of Sciences. All rights reserved.
Evaluating Obesity Prevention Efforts: A Plan for Measuring Progress
Evaluating Obesity Prevention Efforts316
Guiding Principle (indicator/method/end user)* Relevant Definitions/Explanations
Systems-oriented
(methods/end users)
Plain language definition: An approach that recognizes the relationships between multiple interconnecting and interacting components within and across multiple levels as well as other contextual factors in the broader environment. Related to coordination and partnerships among key end users. Requires an understanding and recognition that diet, physical activity, and obesity are each influenced by multiple, inter-connected environments and sectors including, but not limted to, urban planning, food and beverage industries, marketing, health care, education, sport and recreation, transport, commerce, business and industry, agriculture, trade and finance.
Examples of end-user questions: How diverse are the perspectives of the end users involved in the program? Is the evaluation intended to find causal factors or explain observed relationships? Is the evaluation intended to support program development, summarize program impact, or monitor trends over time? What sectors are clearly involved in the proposed solutions? Are the roles and responsibilities clearly defined for each of the sectors? Who are the leaders that best represent the sectors and end users involved? To what extent are those leaders engaged in the efforts and connected with their constituencies?
SOURCES: Adapted from Hargreaves, 2010; IOM, 2010, 2012; WHO, 2010.
Transparency
(methods/end users)
Plain language definition: Clear identification of end users and their objectives/needs early in the evaluation design process helps to communicate openness and provides an opportunity to raise objections or concerns about the process. When evaluation results are reported, effectively communicating complete descriptions of findings (positive, negative, and neutral), limitations, conclusions, and potential sources of conflicts of interest (including funding sources).
Examples of end-user questions: Was the evaluation fair, impartial, and just? Was the evaluation and its findings (1) responsive and inclusive, (2) clear and fair, (3) open, (4) free of conflicts of interest, and (5) considerate of fiscal responsibility? Were end users consulted in the evaluation design and question development processes? Were end users’ new and emergent needs accounted for in the evaluation design, implementation, and dissemination processes?
SOURCES: Adapted from Abouzahr et al., 2007; IOM, 2009; Preskill and Jones, 2009; WHO, 2010; Yarbrough et al., 2011.
TABLE C-1 Continued

Copyright © National Academy of Sciences. All rights reserved.
Evaluating Obesity Prevention Efforts: A Plan for Measuring Progress
317Appendix C
Guiding Principle (indicator/method/end user)* Relevant Definitions/Explanations
Utility
(methods/end users)
Plain language definition: Evaluations should be designed and conducted by individuals with expertise/experience in conducting evaluations. The evaluation should be designed to be useful, relevant, and responsive to the full range of end users and their needs including those involved with the program being evaluated as well as those that will be affected by the outcome of the evaluation. The evaluation should be designed to account for individual and cultural values underlying the evaluation purpose, methods, and decisions. Careful attention should be placed on timely and appropriate reporting of evaluation progress and outcomes to the evaluation end users. The evaluation should anticipate potential consequences—both positive and unintended—and reporting should aim to guard against misuse or unintended consequences.
End-user questions: To what extent do the evaluation end users find the evaluation methods, processes, and outputs (products) useful or valuable in meeting their needs? Are the results of the evaluation provided to evaluation end users in a timely fashion and in an appropriate format that can readily be used?
SOURCE: Adapted from Yarbrough et al., 2011.
Value
(end users)
Plain language definition: The relative utility of the surveillance and evaluation information, in relation to end-user needs and culture, while maintaining credibility and adaptability and avoiding unintended consequences.
End-user questions: Does the surveillance or evaluation plan address identified and emerging needs of the community or group? Is the information from the surveillance or evaluation plan shared in a credible and relevant manner, without judgment? Do the end users have input into all facets of the surveillance and evaluation plan? Is care taken to avoid unintended consequences or judgment from the evaluation plan or resulting information?
SOURCE: Adapted from Yarbrough et al., 2011.
* (1) Indicator, (2) methods, and (3) end user indicate to what the guiding principle is applicable when making decisions about evaluating obesity prevention efforts.
TABLE C-1 Continued

Copyright © National Academy of Sciences. All rights reserved.
Evaluating Obesity Prevention Efforts: A Plan for Measuring Progress
Evaluating Obesity Prevention Efforts318
REFERENCES
Abouzahr, C., S. Adjei, and C. Kanchanachitra. 2007. From data to policy: Good practices and cautionary tales.
Lancet 369(9566):1039-1046.
Brownson, R. C., G. A. Colditz, and E. K. Proctor. 2012. Dissemination and implementation research in health:
Translating science to practice. New York: Oxford University Press.
CDC (Centers for Disease Control and Prevention). 1999. Framework for program evaluation in public health.
Morbidity and Mortality Weekly Report 48(RR11):1-40.
CDC. 2008. Community health and program services (CHAPS): Health disparities among racial/ethnic populations.
Atlanta, GA: U.S. Department of Health and Human Services.
Community-Campus Partnerships for Health. 2012. Community-Campus Partnerships for Health: Promoting health
equity and social justice. http://www.ccph.info (accessed December 27, 2012).
Fawcett, S. B. 2002. Evaluating comprehensive community initiatives: A bill of rights and responsibilities. In
Improving population health: The California Wellness Foundation’s health improvement initiative, edited by S.
Isaacs. San Francisco, CA: Social Policy Press. Pp. 229-233.
German, R. R., L. M. Lee, J. M. Horan, R. L. Milstein, C. A. Pertowski, M. N. Waller, Guidelines Working Group
Centers for Disease Control and Prevention. 2001. Updated guidelines for evaluating public health surveil-
lance systems: Recommendations from the guidelines working group. MMWR Recommendations and Reports
50(RR-13):1-35; quiz CE31-CE37.
Glasgow, R. E., T. M. Vogt, and S. M. Boles. 1999. Evaluating the public health impact of health promotion inter-
ventions: The RE-AIM framework. American Journal of Public Health 89(9):1322-1327.
Glasgow, R. E., C. Vinson, D. Chambers, M. J. Khoury, R. M. Kaplan, and C. Hunter. 2012. National Institutes
of Health approaches to dissemination and implementation science: Current and future directions. American
Journal of Public Health 102(7):1274-1281.
Hargreaves, M. 2010. Evaluating system change: A planning guide. Princeton, NJ: Mathematica Policy Research, Inc.
HHS (Department of Health and Human Services). 2008. Physical activity guidelines for Americans. Washington,
DC: U.S. Department of Health and Human Services.
HHS. 2010a. Dietary guidelines for Americans. Washington, DC: Government Printing Office.
HHS. 2010b. Healthy People 2020. http://www.healthypeople.gov/2020/default.aspx (accessed January 31, 2013).
IOM (Institute of Medicine). 2009. Local government actions to prevent childhood obesity. Washington, DC: The
National Academies Press.
IOM. 2010. Bridging the evidence gap in obesity prevention: A framework to inform decision making. Washington,
DC: The National Academies Press.
IOM. 2012. Accelerating progress in obesity prevention: Solving the weight of the nation. Washington, DC: The
National Academies Press.
Jacobs, J. A., E. Jones, B. A. Gabella, B. Spring, and R. C. Brownson. 2012. Tools for implementing an evidence-
based approach in public health practice. Preventing Chronic Disease 9:E116.
Milat, A. J., L. King, A. E. Bauman, and S. Redman. 2012. The concept of scalability: Increasing the scale and
potential adoption of health promotion interventions into policy and practice. Health Promotion International
[epub ahead of print].
Nolan, D. 1997. Quantitative parsimony. British Journal for the Philosophy of Science 48:329-343.
Preskill, H., and N. A. Jones. 2009. Practical guide for engaging stakeholders in the evaluation process. Princeton,
NJ: Robert Wood Johnson Foundation.
Pronk, N. P. 2003. Designing and evaluating health promotion programs: Simple rules for a complex issue. Disease
Management and Health Outcomes 11(3):149-157.

Copyright © National Academy of Sciences. All rights reserved.
Evaluating Obesity Prevention Efforts: A Plan for Measuring Progress
319Appendix C
Rabin, B. A., R. C. Brownson, J. F. Kerner, and R. E. Glasgow. 2006. Methodologic challenges in disseminat-
ing evidence-based interventions to promote physical activity. American Journal of Preventive Medicine
31(4 Suppl):S24-S34.
Rogers, E. M. 2003. Diffusion of innovations. 5th ed. New York: The Free Press.
Rossi, P. H., and H. E. Freeman. 1993. Evaluation: A systematic approach. 5th ed. Newbury Park, CA: Sage
Publications.
Scheirer, M. A., and J. W. Dearing. 2011. An agenda for research on the sustainability of public health programs.
American Journal of Public Health 101(11):2059-2067.
Scriven, M. 1991. Evaluation thesaurus. Newbury Park, CA: Sage Publications.
Shediac-Rizkallah, M. C., and L. R. Bone. 1998. Planning for the sustainability of community-based health pro-
grams: Conceptual frameworks and future directions for research, practice and policy. Health Education
Research 13(1):87-108.
Sober, E. 1981. The principle of parsimony. British Journal for the Philosophy of Science 32:145-156.
Waters, E., J. Doyle, N. Jackson, F. Howes, G. Brunton, A. Oakley, and C. Cochrane. 2006. Evaluating the effec-
tiveness of public health interventions: The role and activities of the Cochrane Collaboration. Journal of
Epidemiology and Community Health 60(4):285-289.
WHO (World Health Organization). 2010. Population-based prevention strategies for childhood obesity. Report of a
WHO forum and technical meeting, Geneva, 15–17 December 2009. Geneva: WHO.
Wholey, J. S., H. P. Hatry, and K. E. Newcomber. 2010. Handbook of practical program evaluation. 3rd ed. San
Francisco, CA: Jossey-Bass.
Yarbrough, D. B., L. M. Shulha, R. K. Hopson, and F. A. Caruthers. 2011. The program evaluation standards: A
guide for evaluators and evaluation users. 3rd ed. Thousand Oaks, CA: Sage.

Copyright © National Academy of Sciences. All rights reserved.
Evaluating Obesity Prevention Efforts: A Plan for Measuring Progress

Copyright © National Academy of Sciences. All rights reserved.
Evaluating Obesity Prevention Efforts: A Plan for Measuring Progress
321
dTable of Indicator data Sources

Copyright © National Academy of Sciences. All rights reserved.
Evaluating Obesity Prevention Efforts: A Plan for Measuring Progress
322
TA
BL
E D
-1 T
able
of
Indi
cato
r D
ata
Sour
ces*
Dat
a So
urce
and
Web
site
Spon
sor
Freq
uenc
y of
Dat
a U
pdat
es
Sam
ple
Des
ign
and
Sam
ple
Size
(i
f ap
plic
able
)Ta
rget
Pop
ulat
ion
(or
Com
pone
nts)
Lev
el o
f E
stim
ates
or
Dat
a A
vaila
ble
Com
men
ts
Am
eric
an C
omm
unit
y Su
rvey
(A
CS)
http
://w
ww
.cen
sus.
gov/
acs
U.S
. Cen
sus
Bur
eau
Ann
ual
Cro
ss-s
ecti
onal
Mor
e th
an 2
mill
ion
hous
ehol
ds in
201
1
All
hous
ehol
ds
50 s
tate
s, D
C, P
uert
o R
ico
Nat
iona
lSt
ate
Cou
nty
Cit
yz
IP C
ode
Sele
cted
A
mer
ican
In
dian
/A
lask
an
Nat
ive
area
s
Cou
nty,
cit
y,
and
zIP
Cod
e es
tim
ates
av
aila
ble
in 1
-,
3-, a
nd 5
-yea
r in
crem
ents
ba
sed
on t
he
juri
sdic
tion
siz
e
Beh
avio
ral R
isk
Fact
or
Surv
eilla
nce
Syst
em (
BR
FSS)
http
://w
ww
.cdc
.gov
/brf
ss
HH
S/C
DC
Ann
ual
Cro
ss-s
ecti
onal
Sa
mpl
ing
fram
e: 5
0 st
ates
, DC
, Pue
rto
Ric
o, V
irgi
n Is
land
s,
Gua
m, a
nd o
ther
U.S
. te
rrit
orie
s~5
06,0
00 in
terv
iew
s in
201
1
Civ
ilian
, hou
seho
lds
wit
h la
nd-l
ine
or
cellu
lar
tele
phon
es,
resp
onde
nts
mus
t be
ag
e 18
+
Nat
iona
lSt
ate
Sele
cted
M
MSA
sSe
lect
ed
coun
ties
Bri
dgin
g th
e G
ap (
BT
G)
http
://w
ww
.br
idgi
ngth
egap
rese
arch
.org
Rob
ert
Woo
d Jo
hnso
n Fo
unda
tion
Ann
ual
Tax
data
beg
in in
19
97; a
ll ot
her
data
be
gin
wit
h sc
hool
ye
ar 2
006-
07
Cod
ed s
tate
law
s re
late
d to
foo
d an
d be
vera
ge t
axat
ion;
sc
hool
foo
d, n
utri
tion
, ph
ysic
al e
duca
tion
, an
d ph
ysic
al a
ctiv
ity
envi
ronm
ents
; sta
te
safe
rou
tes
to s
choo
l-re
late
d la
ws;
sta
te
farm
-to-
scho
ol-r
elat
ed
law
s
50 s
tate
s an
d D
CN
atio
nal
Stat
eC
oded
st
ate
polic
y su
rvei
llanc
e da
ta b
ased
on
codi
fied
sta
te
stat
utor
y an
d ad
min
istr
ativ
e (r
egul
ator
y) la
ws
CD
C C
hron
ic D
isea
se S
tate
Po
licy
Tra
ckin
g Sy
stem
http
://ap
ps.n
ccd.
cdc.
gov/
CD
PHPP
olic
ySea
rch/
Def
ault
.asp
x
HH
S/C
DC
Ong
oing
4,78
8 nu
trit
ion,
ph
ysic
al a
ctiv
ity,
and
ob
esit
y po
licie
s (a
s of
3/
18/2
013)
Reg
ulat
ion
and
legi
slat
ive
bills
rel
ated
to
nut
riti
on, p
hysi
cal
acti
vity
, and
obe
sity
pr
even
tion
Stat
eIn
divi
dual
bill
-le
vel t
rack
ing
CD
C S
tate
Ind
icat
or R
epor
t on
Fru
its
and
Veg
etab
les
http
://w
ww
.cdc
.gov
/nu
trit
ion/
dow
nloa
ds/S
tate
-In
dica
tor-
Rep
ort-
Frui
ts-
Veg
etab
les-
2013
HH
S/C
DC
Ann
ual
Dat
a in
dica
tors
co
nstr
ucte
d fr
om
seve
ral o
ther
nat
iona
l an
d st
ate
data
base
s
50 s
tate
s an
d D
CN
atio
nal
Stat
eIn
divi
dual
-lev
el
diet
beh
avio
ral
indi
cato
rs,
polic
y, a
nd
envi
ronm
enta
l in
dica
tors
Cla
ssif
icat
ion
of L
aws
Ass
ocia
ted
wit
h Sc
hool
St
uden
ts (
CL
ASS
)ht
tp://
clas
s.ca
ncer
.gov
HH
S/N
IH/N
CI
2003
-200
820
10E
very
2 y
ears
Stat
e sc
hool
-bas
ed
phys
ical
edu
cati
on,
rece
ss, a
nd n
utri
tion
-re
late
d la
ws
50 s
tate
s an
d D
CN
atio
nal
Stat
eC
oded
sta
te
law
pol
icy
surv
eilla
nce
data
sy
stem
Cou
nty
and
zIP
Cod
e B
usin
ess
Patt
erns
(C
zC
BP)
http
://w
ww
.cen
sus.
gov/
econ
/cb
p/in
dex.
htm
l
U.S
. Cen
sus
Bur
eau
Ann
ual
Cro
ss-s
ecti
onal
bu
sine
ss t
rend
sB
usin
esse
s w
ith
paid
em
ploy
ees
Nat
iona
l St
ate
Cou
nty
MM
SAz
IP C
ode
Fede
ral a
ppro
pria
tion
s la
ws
http
://th
omas
.loc.
gov/
hom
e/ap
prop
/app
13.h
tml
U.S
. G
over
nmen
tA
nnua
lN
AN
AN
atio
nal
Gen
eral
Ser
vice
s A
dmin
istr
atio
n (G
SA)
http
://w
ww
.gsa
.gov
U.S
. G
over
nmen
tN
AN
AN
AN
atio
nal
Hea
lthc
are
Eff
ecti
vene
ss
Dat
a an
d In
form
atio
n Se
t (H
ED
IS)
http
://w
ww
.ncq
a.or
g/H
ED
ISQ
ualit
yMea
sure
men
t/H
ED
ISM
easu
res.
aspx
NC
QA
Ong
oing
80 m
easu
res
acro
ss 5
do
mai
ns o
f he
alth
car
eD
ata
prov
ided
by
heal
th p
lans
Nat
iona
lR
egio
nal
Stat
e
Incl
udes
m
easu
res
rela
ted
to d
iabe
tes
care
an
d ch
ildho
od
and
adul
t w
eigh
t/bo
dy m
ass
inde
x (B
MI)
ass
essm
ent

Copyright © National Academy of Sciences. All rights reserved.
Evaluating Obesity Prevention Efforts: A Plan for Measuring Progress
323
TA
BL
E D
-1 T
able
of
Indi
cato
r D
ata
Sour
ces*
Dat
a So
urce
and
Web
site
Spon
sor
Freq
uenc
y of
Dat
a U
pdat
es
Sam
ple
Des
ign
and
Sam
ple
Size
(i
f ap
plic
able
)Ta
rget
Pop
ulat
ion
(or
Com
pone
nts)
Lev
el o
f E
stim
ates
or
Dat
a A
vaila
ble
Com
men
ts
Am
eric
an C
omm
unit
y Su
rvey
(A
CS)
http
://w
ww
.cen
sus.
gov/
acs
U.S
. Cen
sus
Bur
eau
Ann
ual
Cro
ss-s
ecti
onal
Mor
e th
an 2
mill
ion
hous
ehol
ds in
201
1
All
hous
ehol
ds
50 s
tate
s, D
C, P
uert
o R
ico
Nat
iona
lSt
ate
Cou
nty
Cit
yz
IP C
ode
Sele
cted
A
mer
ican
In
dian
/A
lask
an
Nat
ive
area
s
Cou
nty,
cit
y,
and
zIP
Cod
e es
tim
ates
av
aila
ble
in 1
-,
3-, a
nd 5
-yea
r in
crem
ents
ba
sed
on t
he
juri
sdic
tion
siz
e
Beh
avio
ral R
isk
Fact
or
Surv
eilla
nce
Syst
em (
BR
FSS)
http
://w
ww
.cdc
.gov
/brf
ss
HH
S/C
DC
Ann
ual
Cro
ss-s
ecti
onal
Sa
mpl
ing
fram
e: 5
0 st
ates
, DC
, Pue
rto
Ric
o, V
irgi
n Is
land
s,
Gua
m, a
nd o
ther
U.S
. te
rrit
orie
s~5
06,0
00 in
terv
iew
s in
201
1
Civ
ilian
, hou
seho
lds
wit
h la
nd-l
ine
or
cellu
lar
tele
phon
es,
resp
onde
nts
mus
t be
ag
e 18
+
Nat
iona
lSt
ate
Sele
cted
M
MSA
sSe
lect
ed
coun
ties
Bri
dgin
g th
e G
ap (
BT
G)
http
://w
ww
.br
idgi
ngth
egap
rese
arch
.org
Rob
ert
Woo
d Jo
hnso
n Fo
unda
tion
Ann
ual
Tax
data
beg
in in
19
97; a
ll ot
her
data
be
gin
wit
h sc
hool
ye
ar 2
006-
07
Cod
ed s
tate
law
s re
late
d to
foo
d an
d be
vera
ge t
axat
ion;
sc
hool
foo
d, n
utri
tion
, ph
ysic
al e
duca
tion
, an
d ph
ysic
al a
ctiv
ity
envi
ronm
ents
; sta
te
safe
rou
tes
to s
choo
l-re
late
d la
ws;
sta
te
farm
-to-
scho
ol-r
elat
ed
law
s
50 s
tate
s an
d D
CN
atio
nal
Stat
eC
oded
st
ate
polic
y su
rvei
llanc
e da
ta b
ased
on
codi
fied
sta
te
stat
utor
y an
d ad
min
istr
ativ
e (r
egul
ator
y) la
ws
CD
C C
hron
ic D
isea
se S
tate
Po
licy
Tra
ckin
g Sy
stem
http
://ap
ps.n
ccd.
cdc.
gov/
CD
PHPP
olic
ySea
rch/
Def
ault
.asp
x
HH
S/C
DC
Ong
oing
4,78
8 nu
trit
ion,
ph
ysic
al a
ctiv
ity,
and
ob
esit
y po
licie
s (a
s of
3/
18/2
013)
Reg
ulat
ion
and
legi
slat
ive
bills
rel
ated
to
nut
riti
on, p
hysi
cal
acti
vity
, and
obe
sity
pr
even
tion
Stat
eIn
divi
dual
bill
-le
vel t
rack
ing
CD
C S
tate
Ind
icat
or R
epor
t on
Fru
its
and
Veg
etab
les
http
://w
ww
.cdc
.gov
/nu
trit
ion/
dow
nloa
ds/S
tate
-In
dica
tor-
Rep
ort-
Frui
ts-
Veg
etab
les-
2013
HH
S/C
DC
Ann
ual
Dat
a in
dica
tors
co
nstr
ucte
d fr
om
seve
ral o
ther
nat
iona
l an
d st
ate
data
base
s
50 s
tate
s an
d D
CN
atio
nal
Stat
eIn
divi
dual
-lev
el
diet
beh
avio
ral
indi
cato
rs,
polic
y, a
nd
envi
ronm
enta
l in
dica
tors
Cla
ssif
icat
ion
of L
aws
Ass
ocia
ted
wit
h Sc
hool
St
uden
ts (
CL
ASS
)ht
tp://
clas
s.ca
ncer
.gov
HH
S/N
IH/N
CI
2003
-200
820
10E
very
2 y
ears
Stat
e sc
hool
-bas
ed
phys
ical
edu
cati
on,
rece
ss, a
nd n
utri
tion
-re
late
d la
ws
50 s
tate
s an
d D
CN
atio
nal
Stat
eC
oded
sta
te
law
pol
icy
surv
eilla
nce
data
sy
stem
Cou
nty
and
zIP
Cod
e B
usin
ess
Patt
erns
(C
zC
BP)
http
://w
ww
.cen
sus.
gov/
econ
/cb
p/in
dex.
htm
l
U.S
. Cen
sus
Bur
eau
Ann
ual
Cro
ss-s
ecti
onal
bu
sine
ss t
rend
sB
usin
esse
s w
ith
paid
em
ploy
ees
Nat
iona
l St
ate
Cou
nty
MM
SAz
IP C
ode
Fede
ral a
ppro
pria
tion
s la
ws
http
://th
omas
.loc.
gov/
hom
e/ap
prop
/app
13.h
tml
U.S
. G
over
nmen
tA
nnua
lN
AN
AN
atio
nal
Gen
eral
Ser
vice
s A
dmin
istr
atio
n (G
SA)
http
://w
ww
.gsa
.gov
U.S
. G
over
nmen
tN
AN
AN
AN
atio
nal
Hea
lthc
are
Eff
ecti
vene
ss
Dat
a an
d In
form
atio
n Se
t (H
ED
IS)
http
://w
ww
.ncq
a.or
g/H
ED
ISQ
ualit
yMea
sure
men
t/H
ED
ISM
easu
res.
aspx
NC
QA
Ong
oing
80 m
easu
res
acro
ss 5
do
mai
ns o
f he
alth
car
eD
ata
prov
ided
by
heal
th p
lans
Nat
iona
lR
egio
nal
Stat
e
Incl
udes
m
easu
res
rela
ted
to d
iabe
tes
care
an
d ch
ildho
od
and
adul
t w
eigh
t/bo
dy m
ass
inde
x (B
MI)
ass
essm
ent
cont
inue
d
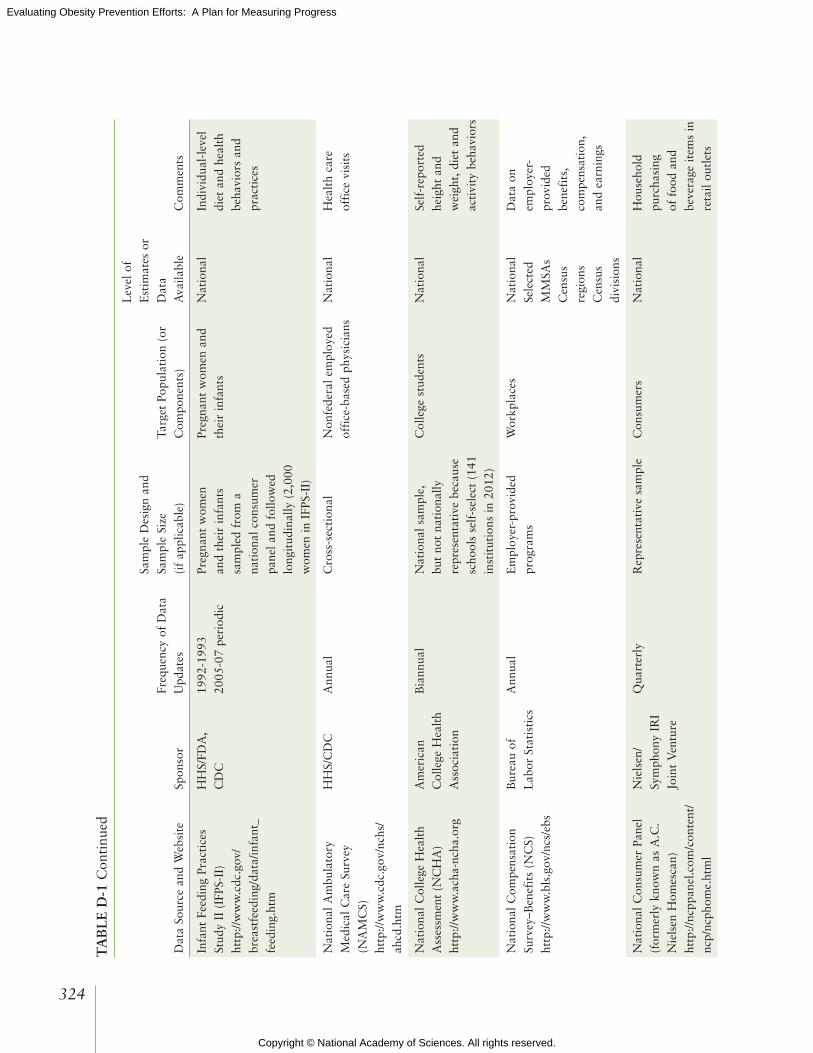
Copyright © National Academy of Sciences. All rights reserved.
Evaluating Obesity Prevention Efforts: A Plan for Measuring Progress
324
TA
BL
E D
-1 C
onti
nued
Dat
a So
urce
and
Web
site
Spon
sor
Freq
uenc
y of
Dat
a U
pdat
es
Sam
ple
Des
ign
and
Sam
ple
Size
(i
f ap
plic
able
)Ta
rget
Pop
ulat
ion
(or
Com
pone
nts)
Lev
el o
f E
stim
ates
or
Dat
a A
vaila
ble
Com
men
ts
Infa
nt F
eedi
ng P
ract
ices
St
udy
II (
IFPS
-II)
http
://w
ww
.cdc
.gov
/br
east
feed
ing/
data
/infa
nt_
feed
ing.
htm
HH
S/FD
A,
CD
C
1992
-199
320
05-0
7 pe
riod
icPr
egna
nt w
omen
an
d th
eir
infa
nts
sam
pled
fro
m a
na
tion
al c
onsu
mer
pa
nel a
nd f
ollo
wed
lo
ngit
udin
ally
(2,
000
wom
en in
IFP
S-II
)
Preg
nant
wom
en a
nd
thei
r in
fant
s N
atio
nal
Indi
vidu
al-l
evel
di
et a
nd h
ealt
h be
havi
ors
and
prac
tice
s
Nat
iona
l Am
bula
tory
M
edic
al C
are
Surv
ey
(NA
MC
S)
http
://w
ww
.cdc
.gov
/nch
s/ah
cd.h
tm
HH
S/C
DC
Ann
ual
Cro
ss-s
ecti
onal
Non
fede
ral e
mpl
oyed
of
fice
-bas
ed p
hysi
cian
sN
atio
nal
Hea
lth
care
of
fice
vis
its
Nat
iona
l Col
lege
Hea
lth
Ass
essm
ent
(NC
HA
)ht
tp://
ww
w.a
cha-
ncha
.org
Am
eric
an
Col
lege
Hea
lth
Ass
ocia
tion
Bia
nnua
lN
atio
nal s
ampl
e,
but
not
nati
onal
ly
repr
esen
tati
ve b
ecau
se
scho
ols
self
-sel
ect
(141
in
stit
utio
ns in
201
2)
Col
lege
stu
dent
sN
atio
nal
Self
-rep
orte
d he
ight
and
w
eigh
t, d
iet
and
acti
vity
beh
avio
rs
Nat
iona
l Com
pens
atio
n Su
rvey
–Ben
efit
s (N
CS)
http
://w
ww
.bls
.gov
/ncs
/ebs
Bur
eau
of
Lab
or S
tati
stic
sA
nnua
lE
mpl
oyer
-pro
vide
d pr
ogra
ms
Wor
kpla
ces
Nat
iona
lSe
lect
ed
MM
SAs
Cen
sus
regi
ons
Cen
sus
divi
sion
s
Dat
a on
em
ploy
er-
prov
ided
be
nefi
ts,
com
pens
atio
n,
and
earn
ings
Nat
iona
l Con
sum
er P
anel
(f
orm
erly
kno
wn
as A
.C.
Nie
lsen
Hom
esca
n)ht
tp://
ncpp
anel
.com
/con
tent
/nc
p/nc
phom
e.ht
ml
Nie
lsen
/Sy
mph
ony
IRI
Join
t V
entu
re
Qua
rter
lyR
epre
sent
ativ
e sa
mpl
eC
onsu
mer
sN
atio
nal
Hou
seho
ld
purc
hasi
ng
of f
ood
and
beve
rage
item
s in
re
tail
outl
ets
Nat
iona
l Far
m-t
o-Sc
hool
N
etw
ork
http
://w
ww
.far
mto
scho
ol.o
rg
Tid
es C
ente
r, Sa
n Fr
anci
sco,
C
A
Ong
oing
Tra
cks
farm
-to-
scho
ol
prog
ram
s in
50
stat
esN
atio
nal K
-12
scho
ols
and
loca
l far
ms
Nat
iona
lSt
ate
Nat
iona
l Hea
lth
and
Nut
riti
on E
xam
inat
ion
Surv
ey (
NH
AN
ES)
“Wha
t W
e E
at in
Am
eric
a”ht
tp://
ww
w.c
dc.g
ov/n
chs/
nhan
es.h
tm
HH
S/C
DC
USD
A/A
RS
Con
tinu
ous
Ann
ual s
ince
199
9C
ross
-sec
tion
al~5
,000
per
sons
ex
amin
ed a
nnua
lly
Civ
ilian
, hou
seho
ld
popu
lati
on a
ll ag
es
sinc
e 19
99
Ove
rsam
ple
of lo
w-
inco
me,
His
pani
cs,
and
Asi
ans
Nat
iona
l In
divi
dual
-lev
el
esti
mat
es o
f be
havi
ors
and
mea
sure
d he
alth
st
atus
Nat
iona
l Hea
lth
Inte
rvie
w
Surv
ey (
NH
IS)
http
://w
ww
.cdc
.gov
/nch
s/nh
is.h
tm
HH
S/C
DC
Ann
ual (
wee
kly
and
mon
thly
pr
obab
ility
sa
mpl
es)
Cro
ss-s
ecti
onal
~39,
500
hous
ehol
ds
(HH
s);
~101
,900
per
sons
in
~40,
500
fam
ilies
, all
ages
(20
11)
Civ
ilian
, hou
seho
ld
popu
lati
on
Ove
rsam
ple
of A
fric
an
Am
eric
ans,
His
pani
cs,
and
Asi
ans
Nat
iona
l Se
lect
ed s
tate
es
tim
ates
w
/yea
rs
com
bine
d
Hou
seho
ld-
and
indi
vidu
al-l
evel
es
tim
ates
Nat
iona
l Hou
seho
ld T
rave
l Su
rvey
(N
HT
S)ht
tp://
nhts
.orn
l.gov
DO
T/F
HW
A20
09 P
erio
dic
(eve
ry 5
-7 y
ears
)C
ross
-sec
tion
al~1
50,0
00 H
Hs;
35
1,00
0 pe
rson
s
Civ
ilian
, hou
seho
ld
popu
lati
on
Dai
ly t
rave
l for
pe
rson
s 5+
yea
rs
Nat
iona
lSe
lect
ed s
tate
s (i
f th
ey c
hoos
e to
add
-on)
Hou
seho
ld-
and
indi
vidu
al-l
evel
es
tim
ates
Nat
iona
l Im
mun
izat
ion
Surv
ey (
NIS
)ht
tp://
ww
w.c
dc.g
ov/n
chs/
nis.
htm
HH
S/C
DC
Ann
ual
Cro
ss-s
ecti
onal
Chi
ldre
n ag
ed 1
9-35
m
onth
s H
ealt
h ca
re p
rovi
ders
of
chi
ldre
n
Nat
iona
l St
ate
Sele
cted
larg
e ur
ban
area
s
Dat
a on
br
east
feed
ing
prac
tice
s
Nat
iona
l Pro
file
of
Loc
al
Hea
lth
Dep
artm
ents
ht
tp://
ww
w.n
acch
o.or
g/to
pics
/infr
astr
uctu
re/p
rofi
le/
inde
x.cf
m
NA
CC
HO
Sem
i-re
gula
rly
(las
t su
rvey
con
duct
ed in
20
13)
The
cor
e qu
esti
onna
ire
is s
ent
to e
very
LH
D
in t
he U
nite
d St
ates
; a
rand
om s
ampl
e of
L
HD
s al
so r
ecei
ve
supp
lem
enta
l mod
ules
Loc
al h
ealt
h de
part
men
tsN
atio
nal
Loc
al h
ealt
h de
part
men
t in
fras
truc
ture
Nat
iona
l Res
ourc
e C
ente
r fo
rH
ealt
h an
d Sa
fety
in C
hild
C
are
and
Ear
ly E
duca
tion
—St
ate
Lic
ensi
ng I
nfor
mat
ion
http
://nr
ckid
s.or
g/ST
AT
ES/
stat
es.h
tm
Nat
iona
l R
esou
rce
Cen
ter
for
Hea
lth
and
Safe
ty in
Chi
ld
Car
e an
d E
arly
E
duca
tion
At
leas
t 2×
per
yea
rC
ensu
sE
arly
chi
ld c
are
cent
ers
Stat
eL
inks
to
stat
e la
ws
cont
aini
ng
licen
sing
st
anda
rds
for
earl
y ch
ild c
are
prog
ram
s
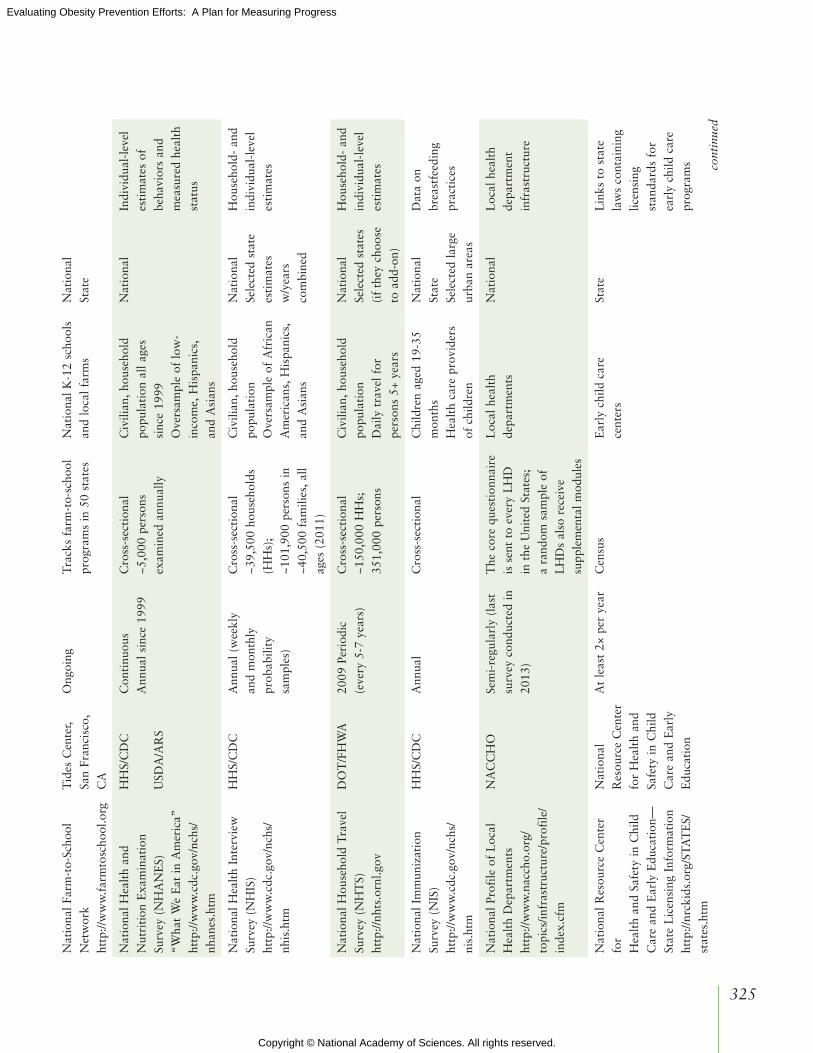
Copyright © National Academy of Sciences. All rights reserved.
Evaluating Obesity Prevention Efforts: A Plan for Measuring Progress
325
Dat
a So
urce
and
Web
site
Spon
sor
Freq
uenc
y of
Dat
a U
pdat
es
Sam
ple
Des
ign
and
Sam
ple
Size
(i
f ap
plic
able
)Ta
rget
Pop
ulat
ion
(or
Com
pone
nts)
Lev
el o
f E
stim
ates
or
Dat
a A
vaila
ble
Com
men
ts
Infa
nt F
eedi
ng P
ract
ices
St
udy
II (
IFPS
-II)
http
://w
ww
.cdc
.gov
/br
east
feed
ing/
data
/infa
nt_
feed
ing.
htm
HH
S/FD
A,
CD
C
1992
-199
320
05-0
7 pe
riod
icPr
egna
nt w
omen
an
d th
eir
infa
nts
sam
pled
fro
m a
na
tion
al c
onsu
mer
pa
nel a
nd f
ollo
wed
lo
ngit
udin
ally
(2,
000
wom
en in
IFP
S-II
)
Preg
nant
wom
en a
nd
thei
r in
fant
s N
atio
nal
Indi
vidu
al-l
evel
di
et a
nd h
ealt
h be
havi
ors
and
prac
tice
s
Nat
iona
l Am
bula
tory
M
edic
al C
are
Surv
ey
(NA
MC
S)
http
://w
ww
.cdc
.gov
/nch
s/ah
cd.h
tm
HH
S/C
DC
Ann
ual
Cro
ss-s
ecti
onal
Non
fede
ral e
mpl
oyed
of
fice
-bas
ed p
hysi
cian
sN
atio
nal
Hea
lth
care
of
fice
vis
its
Nat
iona
l Col
lege
Hea
lth
Ass
essm
ent
(NC
HA
)ht
tp://
ww
w.a
cha-
ncha
.org
Am
eric
an
Col
lege
Hea
lth
Ass
ocia
tion
Bia
nnua
lN
atio
nal s
ampl
e,
but
not
nati
onal
ly
repr
esen
tati
ve b
ecau
se
scho
ols
self
-sel
ect
(141
in
stit
utio
ns in
201
2)
Col
lege
stu
dent
sN
atio
nal
Self
-rep
orte
d he
ight
and
w
eigh
t, d
iet
and
acti
vity
beh
avio
rs
Nat
iona
l Com
pens
atio
n Su
rvey
–Ben
efit
s (N
CS)
http
://w
ww
.bls
.gov
/ncs
/ebs
Bur
eau
of
Lab
or S
tati
stic
sA
nnua
lE
mpl
oyer
-pro
vide
d pr
ogra
ms
Wor
kpla
ces
Nat
iona
lSe
lect
ed
MM
SAs
Cen
sus
regi
ons
Cen
sus
divi
sion
s
Dat
a on
em
ploy
er-
prov
ided
be
nefi
ts,
com
pens
atio
n,
and
earn
ings
Nat
iona
l Con
sum
er P
anel
(f
orm
erly
kno
wn
as A
.C.
Nie
lsen
Hom
esca
n)ht
tp://
ncpp
anel
.com
/con
tent
/nc
p/nc
phom
e.ht
ml
Nie
lsen
/Sy
mph
ony
IRI
Join
t V
entu
re
Qua
rter
lyR
epre
sent
ativ
e sa
mpl
eC
onsu
mer
sN
atio
nal
Hou
seho
ld
purc
hasi
ng
of f
ood
and
beve
rage
item
s in
re
tail
outl
ets
Nat
iona
l Far
m-t
o-Sc
hool
N
etw
ork
http
://w
ww
.far
mto
scho
ol.o
rg
Tid
es C
ente
r, Sa
n Fr
anci
sco,
C
A
Ong
oing
Tra
cks
farm
-to-
scho
ol
prog
ram
s in
50
stat
esN
atio
nal K
-12
scho
ols
and
loca
l far
ms
Nat
iona
lSt
ate
Nat
iona
l Hea
lth
and
Nut
riti
on E
xam
inat
ion
Surv
ey (
NH
AN
ES)
“Wha
t W
e E
at in
Am
eric
a”ht
tp://
ww
w.c
dc.g
ov/n
chs/
nhan
es.h
tm
HH
S/C
DC
USD
A/A
RS
Con
tinu
ous
Ann
ual s
ince
199
9C
ross
-sec
tion
al~5
,000
per
sons
ex
amin
ed a
nnua
lly
Civ
ilian
, hou
seho
ld
popu
lati
on a
ll ag
es
sinc
e 19
99
Ove
rsam
ple
of lo
w-
inco
me,
His
pani
cs,
and
Asi
ans
Nat
iona
l In
divi
dual
-lev
el
esti
mat
es o
f be
havi
ors
and
mea
sure
d he
alth
st
atus
Nat
iona
l Hea
lth
Inte
rvie
w
Surv
ey (
NH
IS)
http
://w
ww
.cdc
.gov
/nch
s/nh
is.h
tm
HH
S/C
DC
Ann
ual (
wee
kly
and
mon
thly
pr
obab
ility
sa
mpl
es)
Cro
ss-s
ecti
onal
~39,
500
hous
ehol
ds
(HH
s);
~101
,900
per
sons
in
~40,
500
fam
ilies
, all
ages
(20
11)
Civ
ilian
, hou
seho
ld
popu
lati
on
Ove
rsam
ple
of A
fric
an
Am
eric
ans,
His
pani
cs,
and
Asi
ans
Nat
iona
l Se
lect
ed s
tate
es
tim
ates
w
/yea
rs
com
bine
d
Hou
seho
ld-
and
indi
vidu
al-l
evel
es
tim
ates
Nat
iona
l Hou
seho
ld T
rave
l Su
rvey
(N
HT
S)ht
tp://
nhts
.orn
l.gov
DO
T/F
HW
A20
09 P
erio
dic
(eve
ry 5
-7 y
ears
)C
ross
-sec
tion
al~1
50,0
00 H
Hs;
35
1,00
0 pe
rson
s
Civ
ilian
, hou
seho
ld
popu
lati
on
Dai
ly t
rave
l for
pe
rson
s 5+
yea
rs
Nat
iona
lSe
lect
ed s
tate
s (i
f th
ey c
hoos
e to
add
-on)
Hou
seho
ld-
and
indi
vidu
al-l
evel
es
tim
ates
Nat
iona
l Im
mun
izat
ion
Surv
ey (
NIS
)ht
tp://
ww
w.c
dc.g
ov/n
chs/
nis.
htm
HH
S/C
DC
Ann
ual
Cro
ss-s
ecti
onal
Chi
ldre
n ag
ed 1
9-35
m
onth
s H
ealt
h ca
re p
rovi
ders
of
chi
ldre
n
Nat
iona
l St
ate
Sele
cted
larg
e ur
ban
area
s
Dat
a on
br
east
feed
ing
prac
tice
s
Nat
iona
l Pro
file
of
Loc
al
Hea
lth
Dep
artm
ents
ht
tp://
ww
w.n
acch
o.or
g/to
pics
/infr
astr
uctu
re/p
rofi
le/
inde
x.cf
m
NA
CC
HO
Sem
i-re
gula
rly
(las
t su
rvey
con
duct
ed in
20
13)
The
cor
e qu
esti
onna
ire
is s
ent
to e
very
LH
D
in t
he U
nite
d St
ates
; a
rand
om s
ampl
e of
L
HD
s al
so r
ecei
ve
supp
lem
enta
l mod
ules
Loc
al h
ealt
h de
part
men
tsN
atio
nal
Loc
al h
ealt
h de
part
men
t in
fras
truc
ture
Nat
iona
l Res
ourc
e C
ente
r fo
rH
ealt
h an
d Sa
fety
in C
hild
C
are
and
Ear
ly E
duca
tion
—St
ate
Lic
ensi
ng I
nfor
mat
ion
http
://nr
ckid
s.or
g/ST
AT
ES/
stat
es.h
tm
Nat
iona
l R
esou
rce
Cen
ter
for
Hea
lth
and
Safe
ty in
Chi
ld
Car
e an
d E
arly
E
duca
tion
At
leas
t 2×
per
yea
rC
ensu
sE
arly
chi
ld c
are
cent
ers
Stat
eL
inks
to
stat
e la
ws
cont
aini
ng
licen
sing
st
anda
rds
for
earl
y ch
ild c
are
prog
ram
s cont
inue
d

Copyright © National Academy of Sciences. All rights reserved.
Evaluating Obesity Prevention Efforts: A Plan for Measuring Progress
326
TA
BL
E D
-1 C
onti
nued
Dat
a So
urce
and
Web
site
Spon
sor
Freq
uenc
y of
Dat
a U
pdat
es
Sam
ple
Des
ign
and
Sam
ple
Size
(i
f ap
plic
able
)Ta
rget
Pop
ulat
ion
(or
Com
pone
nts)
Lev
el o
f E
stim
ates
or
Dat
a A
vaila
ble
Com
men
ts
Nat
iona
l Sur
vey
of
Chi
ldre
n’s
Hea
lth
(NSC
H)
http
://ch
ildhe
alth
data
.org
/le
arn/
NSC
H
HH
S/H
RSA
/M
CH
BE
very
4 y
ears
; po
ssib
ly a
nnua
l in
futu
re
Cro
ss-s
ecti
onal
~91,
642
surv
eys
of
child
ren
(0-1
7 yr
s ol
d); b
etw
een
1,70
0-1,
900
for
each
sta
te
Non
inst
itut
iona
lized
ch
ildre
n ag
ed 0
-17
yrs
old
Nat
iona
lSt
ate
HR
SA r
egio
n
Nat
iona
l Sur
vey
of
Em
ploy
er-S
pons
ored
Hea
lth
Plan
sht
tp://
ww
w.m
erce
r.com
/us
heal
thpl
ansu
rvey
Mer
cer
Ann
ual
Em
ploy
er h
ealt
h ca
re
polic
ies
Em
ploy
ers
Nat
iona
l
Nat
iona
l Sur
vey
of
Mat
erni
ty P
ract
ices
in
Infa
nt N
utri
tion
and
C
are
(mPI
NC
)ht
tp://
ww
w.c
dc.g
ov/
brea
stfe
edin
g/da
ta/m
pinc
/in
dex.
htm
HH
S/C
DC
Eve
ry 2
yea
rs s
ince
20
07B
irth
fac
iliti
es,
prac
tice
s, a
nd p
rogr
amA
ll U
.S. s
tate
s an
d te
rrit
orie
sN
atio
nal
Stat
e
Nat
iona
l Sur
vey
on E
nerg
y B
alan
ce-r
elat
ed
Car
e A
mon
g Pr
imar
y C
are
Phys
icia
ns
http
://ou
tcom
es.c
ance
r.gov
/su
rvey
s/en
ergy
HH
S/N
IH/
NC
I, N
ICH
D,
NID
DK
, O
BSS
R, C
DC
2008
(u
ncle
ar w
hen
next
su
rvey
will
occ
ur)
Cro
ss-s
ecti
onal
Prim
ary
care
ph
ysic
ians
tre
atin
g ch
ildre
n an
d/or
adu
lts
Nat
iona
l
Nat
iona
l Vit
al S
tati
stic
s Sy
stem
http
://w
ww
.cdc
.gov
/NC
HS/
nvss
.htm
HH
S/C
DC
Ong
oing
Col
lect
ed d
urin
g vi
tal
even
ts—
birt
hs, d
eath
s,
mar
riag
es, d
ivor
ces,
an
d fe
tal d
eath
s
Leg
al a
utho
rity
for
th
e re
gist
rati
on o
f vi
tal e
vent
s re
side
s in
divi
dual
ly w
ith
50 s
tate
s, 2
cit
ies
(Was
hing
ton,
DC
, an
d N
ew Y
ork
Cit
y),
and
5 te
rrit
orie
s (P
uert
o R
ico,
the
V
irgi
n Is
land
s, G
uam
, A
mer
ican
Sam
oa, a
nd
the
Com
mon
wea
lth
of
the
Nor
ther
n M
aria
na
Isla
nds)
Nat
iona
lSt
ate
Nie
lsen
Med
ia R
esea
rch
http
://w
ww
.nie
lsen
.com
The
Nie
lsen
C
ompa
nyO
ngoi
ngL
ongi
tudi
nal p
anel
Eac
h ho
useh
old
pane
l mem
ber
part
icip
ates
for
2
year
s. R
ando
m d
igit
di
alin
g an
d on
line
pane
l rec
ruit
men
t to
obt
ain
a sa
mpl
e th
at is
as
nati
onal
ly
repr
esen
tati
ve a
s po
ssib
le. S
trat
ifie
d sa
mpl
ing
and
over
sam
plin
g of
ce
rtai
n po
pula
tion
s (e
.g.,
yout
h, r
acia
l/et
hnic
min
orit
ies)
App
roxi
mat
ely
25,0
00
hous
ehol
ds
Hou
seho
lds
in t
he 4
8 co
ntig
uous
sta
tes
Nat
iona
lM
etro
polit
an
Mar
ket
grou
ps
(con
stru
cted
by
Nie
lsen
)
Con
tain
s da
ta o
n ex
posu
re t
o fo
od
and
beve
rage
ad
vert
isin
g as
w
ell a
s da
ta o
n th
e fr
eque
ncy
of t
elev
isio
n vi
ewin
g,
vide
ogam
e, a
nd
Inte
rnet
use
eac
h da
y (s
eden
tary
be
havi
ors)

Copyright © National Academy of Sciences. All rights reserved.
Evaluating Obesity Prevention Efforts: A Plan for Measuring Progress
327
Dat
a So
urce
and
Web
site
Spon
sor
Freq
uenc
y of
Dat
a U
pdat
es
Sam
ple
Des
ign
and
Sam
ple
Size
(i
f ap
plic
able
)Ta
rget
Pop
ulat
ion
(or
Com
pone
nts)
Lev
el o
f E
stim
ates
or
Dat
a A
vaila
ble
Com
men
ts
Nat
iona
l Sur
vey
of
Chi
ldre
n’s
Hea
lth
(NSC
H)
http
://ch
ildhe
alth
data
.org
/le
arn/
NSC
H
HH
S/H
RSA
/M
CH
BE
very
4 y
ears
; po
ssib
ly a
nnua
l in
futu
re
Cro
ss-s
ecti
onal
~91,
642
surv
eys
of
child
ren
(0-1
7 yr
s ol
d); b
etw
een
1,70
0-1,
900
for
each
sta
te
Non
inst
itut
iona
lized
ch
ildre
n ag
ed 0
-17
yrs
old
Nat
iona
lSt
ate
HR
SA r
egio
n
Nat
iona
l Sur
vey
of
Em
ploy
er-S
pons
ored
Hea
lth
Plan
sht
tp://
ww
w.m
erce
r.com
/us
heal
thpl
ansu
rvey
Mer
cer
Ann
ual
Em
ploy
er h
ealt
h ca
re
polic
ies
Em
ploy
ers
Nat
iona
l
Nat
iona
l Sur
vey
of
Mat
erni
ty P
ract
ices
in
Infa
nt N
utri
tion
and
C
are
(mPI
NC
)ht
tp://
ww
w.c
dc.g
ov/
brea
stfe
edin
g/da
ta/m
pinc
/in
dex.
htm
HH
S/C
DC
Eve
ry 2
yea
rs s
ince
20
07B
irth
fac
iliti
es,
prac
tice
s, a
nd p
rogr
amA
ll U
.S. s
tate
s an
d te
rrit
orie
sN
atio
nal
Stat
e
Nat
iona
l Sur
vey
on E
nerg
y B
alan
ce-r
elat
ed
Car
e A
mon
g Pr
imar
y C
are
Phys
icia
ns
http
://ou
tcom
es.c
ance
r.gov
/su
rvey
s/en
ergy
HH
S/N
IH/
NC
I, N
ICH
D,
NID
DK
, O
BSS
R, C
DC
2008
(u
ncle
ar w
hen
next
su
rvey
will
occ
ur)
Cro
ss-s
ecti
onal
Prim
ary
care
ph
ysic
ians
tre
atin
g ch
ildre
n an
d/or
adu
lts
Nat
iona
l
Nat
iona
l Vit
al S
tati
stic
s Sy
stem
http
://w
ww
.cdc
.gov
/NC
HS/
nvss
.htm
HH
S/C
DC
Ong
oing
Col
lect
ed d
urin
g vi
tal
even
ts—
birt
hs, d
eath
s,
mar
riag
es, d
ivor
ces,
an
d fe
tal d
eath
s
Leg
al a
utho
rity
for
th
e re
gist
rati
on o
f vi
tal e
vent
s re
side
s in
divi
dual
ly w
ith
50 s
tate
s, 2
cit
ies
(Was
hing
ton,
DC
, an
d N
ew Y
ork
Cit
y),
and
5 te
rrit
orie
s (P
uert
o R
ico,
the
V
irgi
n Is
land
s, G
uam
, A
mer
ican
Sam
oa, a
nd
the
Com
mon
wea
lth
of
the
Nor
ther
n M
aria
na
Isla
nds)
Nat
iona
lSt
ate
Nie
lsen
Med
ia R
esea
rch
http
://w
ww
.nie
lsen
.com
The
Nie
lsen
C
ompa
nyO
ngoi
ngL
ongi
tudi
nal p
anel
Eac
h ho
useh
old
pane
l mem
ber
part
icip
ates
for
2
year
s. R
ando
m d
igit
di
alin
g an
d on
line
pane
l rec
ruit
men
t to
obt
ain
a sa
mpl
e th
at is
as
nati
onal
ly
repr
esen
tati
ve a
s po
ssib
le. S
trat
ifie
d sa
mpl
ing
and
over
sam
plin
g of
ce
rtai
n po
pula
tion
s (e
.g.,
yout
h, r
acia
l/et
hnic
min
orit
ies)
App
roxi
mat
ely
25,0
00
hous
ehol
ds
Hou
seho
lds
in t
he 4
8 co
ntig
uous
sta
tes
Nat
iona
lM
etro
polit
an
Mar
ket
grou
ps
(con
stru
cted
by
Nie
lsen
)
Con
tain
s da
ta o
n ex
posu
re t
o fo
od
and
beve
rage
ad
vert
isin
g as
w
ell a
s da
ta o
n th
e fr
eque
ncy
of t
elev
isio
n vi
ewin
g,
vide
ogam
e, a
nd
Inte
rnet
use
eac
h da
y (s
eden
tary
be
havi
ors) co
ntin
ued

Copyright © National Academy of Sciences. All rights reserved.
Evaluating Obesity Prevention Efforts: A Plan for Measuring Progress
328
TA
BL
E D
-1 C
onti
nued
Dat
a So
urce
and
Web
site
Spon
sor
Freq
uenc
y of
Dat
a U
pdat
es
Sam
ple
Des
ign
and
Sam
ple
Size
(i
f ap
plic
able
)Ta
rget
Pop
ulat
ion
(or
Com
pone
nts)
Lev
el o
f E
stim
ates
or
Dat
a A
vaila
ble
Com
men
ts
NPD
Gro
upht
tps:
//ww
w.n
pd.c
om/w
ps/
port
al/n
pd/u
s/ho
me
NPD
Gro
upO
ngoi
ngN
atio
nally
re
pres
enta
tive
sam
ple
of c
onsu
mer
s O
nlin
e co
nsum
er
pane
l wit
h m
ore
than
2
mill
ion
part
icip
ants
Con
sum
ers
Nat
iona
l
Preg
nanc
y R
isk
Ass
essm
ent
Mon
itor
ing
Syst
em
(PR
AM
S)ht
tp://
ww
w.c
dc.g
ov/p
ram
s
HH
S/C
DC
Ann
ual
Ran
dom
sam
ple
from
bi
rth
cert
ific
ates
Wom
en w
ith
a re
cent
live
bir
th (
and
thei
r in
fant
s) in
40
part
icip
atin
g st
ates
an
d N
ew Y
ork
Cit
y
Stat
eB
reas
tfee
ding
M
ater
nal d
iet
and
acti
vity
be
havi
ors
Pre-
preg
nanc
y w
eigh
tG
esta
tion
al
diab
etes
Qua
rter
ly F
ood-
at-
Hom
e Pr
ice
Dat
abas
e (Q
FAH
PD)
http
://w
ww
.ers
.us
da.g
ov/d
ata-
prod
ucts
/qu
arte
rly-
food
-at-
hom
e-pr
ice-
data
base
.asp
x#.
UU
Ns3
Bfk
uSo
USD
A/E
RS
1999
-200
6
(ver
sion
1)
2004
-201
0 (
vers
ion
2)
26 m
etro
polit
an
and
9 no
nmet
ro-
polit
an m
arke
ts f
or
2004
-201
0
Food
pri
ces
for
54
food
gro
ups
Loc
al
Scho
ol H
ealt
h Po
licie
s an
d Pr
acti
ces
Stud
y (S
HPP
S)ht
tp://
ww
w.c
dc.g
ov/
Hea
lthy
You
th/s
hpps
/inde
x.ht
m
HH
S/C
DC
Eve
ry 6
yea
rsN
atio
nally
rep
rese
nted
sa
mpl
e of
50
stat
es
and
DC
Ran
dom
ly s
elec
ted
clas
ses
(cla
ssro
om-
leve
l dat
a)
Publ
ic s
choo
l sta
te
agen
cies
; pu
blic
sch
ool
adm
inis
trat
ion;
pu
blic
and
pri
vate
sc
hool
fac
ulty
and
st
aff;
teac
hers
Nat
iona
lSt
ate
Sele
cted
larg
e di
stri
cts
Scho
ol N
utri
tion
Die
tary
A
sses
smen
t Su
rvey
(SN
DA
)ht
tp://
ww
w.m
athe
mat
ica-
mpr
.com
/nut
riti
on/
snda
_IV
.asp
USD
A/F
NS
Peri
odic
SN
DA
-III
: 20
04-2
005
SND
A-I
V:
2009
-201
0SN
DA
-V: p
lann
ed
Cro
ss-s
ecti
onal
SN
DA
-III
: 2,3
14
publ
ic s
choo
l stu
dent
s in
gra
des
1-12
fro
m
287
sam
pled
sch
ools
SND
A I
V: 5
95 s
choo
l fo
od a
utho
riti
es a
nd
902
sam
pled
sch
ools
Nat
iona
lly
repr
esen
tati
ve s
ampl
es
of d
istr
icts
, sch
ools
, an
d st
uden
ts (
in
SND
A I
II)
in 4
8 co
ntig
uous
sta
tes
and
DC
Nat
iona
lSt
uden
t-le
vel
beha
vior
s in
SN
DA
-III
and
V
; Sch
ool-
leve
l in
dica
tors
in
SND
A-I
II, I
V,
and
V
Stat
e B
irth
Reg
istr
ies/
Bir
th
Rec
ords
Dat
abas
esht
tp://
ww
w.c
dc.g
ov/
nchs
/nvs
s/st
ate_
heal
th_
depa
rtm
ents
.htm
U.S
. G
over
nmen
tO
ngoi
ngC
olle
cted
dur
ing
vita
l ev
ents
—bi
rths
Preg
nant
wom
en a
nd
new
born
sSt
ate
Stat
e SN
AP-
Ed
Plan
s ht
tp://
snap
.nal
.usd
a.go
v/st
ate-
gate
s
USD
AA
nnua
lC
ensu
sSN
AP-
Ed
prog
ram
sSt
ate
Stat
e-le
vel p
lans
fo
r SN
AP-
Ed
prog
ram
s
Stat
e SN
AP
Polic
y D
atab
ase
http
://w
ww
.ers
.usd
a.go
v/da
ta-p
rodu
cts/
snap
-pol
icy-
data
base
.asp
x
USD
AO
ngoi
ngC
ensu
sSN
AP
stat
e pr
ogra
m
polic
ies
Stat
eSN
AP
Polic
y D
atab
ase
http
://w
ww
.ers
.us
da.g
ov/d
ata-
prod
ucts
/sna
p-po
licy-
data
base
.as
px
Yal
e R
udd
Cen
ter
for
Food
Pol
icy
and
Obe
sity
—
Leg
isla
tive
Dat
abas
eht
tp://
ww
w.y
aler
uddc
ente
r.or
g/le
gisl
atio
n
Yal
e R
udd
Cen
ter
for
Food
Pol
icy
&
Obe
sity
2010
-pre
sent
Cen
sus
Leg
isla
tion
intr
oduc
ed,
enac
ted,
vet
oed,
fai
led,
or
rep
eale
d
Nat
iona
lSt
ate
Sele
cted
larg
e m
etro
polit
an
area
s
Food
pol
icy
and
obes
ity-
rela
ted
legi
slat
ive
trac
king
da
taba
se

Copyright © National Academy of Sciences. All rights reserved.
Evaluating Obesity Prevention Efforts: A Plan for Measuring Progress
329
Dat
a So
urce
and
Web
site
Spon
sor
Freq
uenc
y of
Dat
a U
pdat
es
Sam
ple
Des
ign
and
Sam
ple
Size
(i
f ap
plic
able
)Ta
rget
Pop
ulat
ion
(or
Com
pone
nts)
Lev
el o
f E
stim
ates
or
Dat
a A
vaila
ble
Com
men
ts
NPD
Gro
upht
tps:
//ww
w.n
pd.c
om/w
ps/
port
al/n
pd/u
s/ho
me
NPD
Gro
upO
ngoi
ngN
atio
nally
re
pres
enta
tive
sam
ple
of c
onsu
mer
s O
nlin
e co
nsum
er
pane
l wit
h m
ore
than
2
mill
ion
part
icip
ants
Con
sum
ers
Nat
iona
l
Preg
nanc
y R
isk
Ass
essm
ent
Mon
itor
ing
Syst
em
(PR
AM
S)ht
tp://
ww
w.c
dc.g
ov/p
ram
s
HH
S/C
DC
Ann
ual
Ran
dom
sam
ple
from
bi
rth
cert
ific
ates
Wom
en w
ith
a re
cent
live
bir
th (
and
thei
r in
fant
s) in
40
part
icip
atin
g st
ates
an
d N
ew Y
ork
Cit
y
Stat
eB
reas
tfee
ding
M
ater
nal d
iet
and
acti
vity
be
havi
ors
Pre-
preg
nanc
y w
eigh
tG
esta
tion
al
diab
etes
Qua
rter
ly F
ood-
at-
Hom
e Pr
ice
Dat
abas
e (Q
FAH
PD)
http
://w
ww
.ers
.us
da.g
ov/d
ata-
prod
ucts
/qu
arte
rly-
food
-at-
hom
e-pr
ice-
data
base
.asp
x#.
UU
Ns3
Bfk
uSo
USD
A/E
RS
1999
-200
6
(ver
sion
1)
2004
-201
0 (
vers
ion
2)
26 m
etro
polit
an
and
9 no
nmet
ro-
polit
an m
arke
ts f
or
2004
-201
0
Food
pri
ces
for
54
food
gro
ups
Loc
al
Scho
ol H
ealt
h Po
licie
s an
d Pr
acti
ces
Stud
y (S
HPP
S)ht
tp://
ww
w.c
dc.g
ov/
Hea
lthy
You
th/s
hpps
/inde
x.ht
m
HH
S/C
DC
Eve
ry 6
yea
rsN
atio
nally
rep
rese
nted
sa
mpl
e of
50
stat
es
and
DC
Ran
dom
ly s
elec
ted
clas
ses
(cla
ssro
om-
leve
l dat
a)
Publ
ic s
choo
l sta
te
agen
cies
; pu
blic
sch
ool
adm
inis
trat
ion;
pu
blic
and
pri
vate
sc
hool
fac
ulty
and
st
aff;
teac
hers
Nat
iona
lSt
ate
Sele
cted
larg
e di
stri
cts
Scho
ol N
utri
tion
Die
tary
A
sses
smen
t Su
rvey
(SN
DA
)ht
tp://
ww
w.m
athe
mat
ica-
mpr
.com
/nut
riti
on/
snda
_IV
.asp
USD
A/F
NS
Peri
odic
SN
DA
-III
: 20
04-2
005
SND
A-I
V:
2009
-201
0SN
DA
-V: p
lann
ed
Cro
ss-s
ecti
onal
SN
DA
-III
: 2,3
14
publ
ic s
choo
l stu
dent
s in
gra
des
1-12
fro
m
287
sam
pled
sch
ools
SND
A I
V: 5
95 s
choo
l fo
od a
utho
riti
es a
nd
902
sam
pled
sch
ools
Nat
iona
lly
repr
esen
tati
ve s
ampl
es
of d
istr
icts
, sch
ools
, an
d st
uden
ts (
in
SND
A I
II)
in 4
8 co
ntig
uous
sta
tes
and
DC
Nat
iona
lSt
uden
t-le
vel
beha
vior
s in
SN
DA
-III
and
V
; Sch
ool-
leve
l in
dica
tors
in
SND
A-I
II, I
V,
and
V
Stat
e B
irth
Reg
istr
ies/
Bir
th
Rec
ords
Dat
abas
esht
tp://
ww
w.c
dc.g
ov/
nchs
/nvs
s/st
ate_
heal
th_
depa
rtm
ents
.htm
U.S
. G
over
nmen
tO
ngoi
ngC
olle
cted
dur
ing
vita
l ev
ents
—bi
rths
Preg
nant
wom
en a
nd
new
born
sSt
ate
Stat
e SN
AP-
Ed
Plan
s ht
tp://
snap
.nal
.usd
a.go
v/st
ate-
gate
s
USD
AA
nnua
lC
ensu
sSN
AP-
Ed
prog
ram
sSt
ate
Stat
e-le
vel p
lans
fo
r SN
AP-
Ed
prog
ram
s
Stat
e SN
AP
Polic
y D
atab
ase
http
://w
ww
.ers
.usd
a.go
v/da
ta-p
rodu
cts/
snap
-pol
icy-
data
base
.asp
x
USD
AO
ngoi
ngC
ensu
sSN
AP
stat
e pr
ogra
m
polic
ies
Stat
eSN
AP
Polic
y D
atab
ase
http
://w
ww
.ers
.us
da.g
ov/d
ata-
prod
ucts
/sna
p-po
licy-
data
base
.as
px
Yal
e R
udd
Cen
ter
for
Food
Pol
icy
and
Obe
sity
—
Leg
isla
tive
Dat
abas
eht
tp://
ww
w.y
aler
uddc
ente
r.or
g/le
gisl
atio
n
Yal
e R
udd
Cen
ter
for
Food
Pol
icy
&
Obe
sity
2010
-pre
sent
Cen
sus
Leg
isla
tion
intr
oduc
ed,
enac
ted,
vet
oed,
fai
led,
or
rep
eale
d
Nat
iona
lSt
ate
Sele
cted
larg
e m
etro
polit
an
area
s
Food
pol
icy
and
obes
ity-
rela
ted
legi
slat
ive
trac
king
da
taba
se cont
inue
d

Copyright © National Academy of Sciences. All rights reserved.
Evaluating Obesity Prevention Efforts: A Plan for Measuring Progress
330
Dat
a So
urce
and
Web
site
Spon
sor
Freq
uenc
y of
Dat
a U
pdat
es
Sam
ple
Des
ign
and
Sam
ple
Size
(i
f ap
plic
able
)Ta
rget
Pop
ulat
ion
(or
Com
pone
nts)
Lev
el o
f E
stim
ates
or
Dat
a A
vaila
ble
Com
men
ts
You
th R
isk
Beh
avio
r Su
rvei
llanc
e Sy
stem
(Y
RB
SS)
http
://w
ww
.cdc
.gov
/H
ealt
hyY
outh
/yrb
s/in
dex.
htm
HH
S/C
DC
Bie
nnia
lC
ross
-sec
tion
al
scho
ol-b
ased
sur
vey
sam
ples
(47
sta
tes,
5
terr
itor
ies,
2 t
riba
l, 22
loca
l reg
ions
) ~1
5,50
0 yo
uth
in
2011
You
th in
pub
lic a
nd
priv
ate
scho
ols,
gra
des
9-12
; age
s 12
-21
yrs
old
Nat
iona
lSt
ate
Loc
al
Indi
vidu
al-l
evel
be
havi
ors
* T
his
tabl
e pr
ovid
es d
etai
led
info
rmat
ion
on e
ach
of t
he d
ata
sour
ces
liste
d in
Cha
pter
4, T
able
4-2
, inc
ludi
ng t
he s
pons
orin
g or
gani
zati
on, s
tudy
des
ign,
per
iodi
city
, and
pop
ulat
ions
st
udie
d. A
ppen
dix
F, T
able
F-2
lis
ts e
xam
ples
of
nati
onal
sur
veill
ance
and
eva
luat
ion
syst
em d
ata
sour
ces
that
can
be
cons
ider
ed f
or t
heir
pot
enti
al b
ased
on
the
spec
ific
mea
sure
s,
targ
et p
opul
atio
n, a
nd le
vel o
f th
e da
ta d
esir
ed f
or in
dica
tors
.N
OT
ES:
AR
S =
Agr
icul
tura
l Res
earc
h Se
rvic
e; C
DC
= U
.S. C
ente
rs f
or D
isea
se C
ontr
ol a
nd P
reve
ntio
n; D
OT
= U
.S. D
epar
tmen
t of
Tra
nspo
rtat
ion;
ER
S =
Eco
nom
ic R
esea
rch
Serv
ice;
FD
A =
U.S
. Foo
d an
d D
rug
Adm
inis
trat
ion;
FH
WA
= U
.S. F
eder
al H
ighw
ay A
dmin
istr
atio
n; F
NS
= Fo
od a
nd N
utri
tion
Ser
vice
; HH
= h
ouse
hold
; HH
S =
U.S
. Dep
artm
ent
of H
ealt
h an
d H
uman
Ser
vice
s; H
RSA
= H
ealt
h R
esou
rces
and
Ser
vice
s A
dmin
istr
atio
n; I
RI
= In
form
atio
n R
esou
rces
, In
c.;
LH
D =
loc
al h
ealt
h de
part
men
t; M
CH
B =
Mat
erna
l an
d C
hild
H
ealt
h B
urea
u; M
MSA
= m
etro
polit
an a
nd m
icro
polit
an s
tati
stic
al a
rea;
NA
CC
HO
= N
atio
nal
Ass
ocia
tion
of
Cou
nty
and
Cit
y H
ealt
h O
ffic
ials
; N
CI
= N
atio
nal
Can
cer
Inst
itut
e;
NC
QA
= N
atio
nal C
ente
r fo
r Q
ualit
y A
ssur
ance
; NIC
HD
= N
atio
nal I
nsti
tute
of
Chi
ld H
ealt
h an
d H
uman
Dev
elop
men
t; N
IDD
K =
Nat
iona
l Ins
titu
te o
f D
iabe
tes
and
Dig
esti
ve a
nd
Kid
ney
Dis
ease
s; N
IH =
Nat
iona
l Ins
titu
tes
of H
ealt
h; O
BSS
R =
Off
ice
of B
ehav
iora
l and
Soc
ial S
cien
ces
Res
earc
h; S
NA
P =
Supp
lem
enta
l Nut
riti
on A
ssis
tanc
e Pr
ogra
m; U
SDA
= U
.S.
Dep
artm
ent
of A
gric
ultu
re.
TA
BL
E D
-1 C
onti
nued

Copyright © National Academy of Sciences. All rights reserved.
Evaluating Obesity Prevention Efforts: A Plan for Measuring Progress
331
Edisparities Tables
1
The following summarizes the findings for the number of tools and methods identified by population of risk or social influence by each of the five environments in the National Collaborative on Childhood
Obesity Research Registry (NCCOR-R).
PhYSICAL ACTIVITY ENVIRONMENT
NCCOR-R housed N=290 tools and methods of the physical activity environment at the time of this review. After applying exclusionary criteria,2 removing duplicate tools and methods relevant to other target environments, and assessing populations at risk, the Committee identified 65 tools and methods (see Table E-1). About half of the tools and methods (N=36) were focused at the community level, and the rest were individual level (N=29). Four tools and methods were designed for populations at risk for disparities, specifically African Americans (N=1), Hispanics (N=2), and American Indian and Alaskan Natives (N=1). None of the tools or methods were designed specifically for Asian or Hawaiian or Pacific Islanders. One measurement tool targeted multiple populations at risk for disparities, and the remain-ing 60 tools and methods related to physical activity environment were inclusive of majority white and various other multiethnic populations at risk for disparities. Six tools and methods specifically targeted females, and none addressed only males. For 12 tools and methods, the database included no information on sex specificity, and the remaining tools and methods cited use with both males and females (N=47). Of the 46 tools and methods identifying geographic location, none were specific to rural settings; instead the majority cited use in urban settings (N=37) or both urban and rural settings (N=10). Disability was the focus of only one measurement tool or method (Spivock et al., 2007); sexual identity was not cited as a reported focus of any tools and methods.
A majority of tools and methods included variables that address living and working conditions (N=55) generally defined by aspects of the built environment, access, and availability to safe places to be
1 This summary does not include references. Citations to support statements made herein are given in the body of the report. 2 Exclusionary criteria for identifying tools and methods within NCCOR-R targeting populations with health disparities included individual
tools and methods of dietary intake or physical activity (e.g., 24-hour dietary recalls, food frequency tools and methods, or actigraph), and surveillance tools and methods because Accelerating Progress in Obesity Prevention report (IOM, 2012) recommendations focus on environ-mental and policy changes.

Copyright © National Academy of Sciences. All rights reserved.
Evaluating Obesity Prevention Efforts: A Plan for Measuring Progress
Evaluating Obesity Prevention Efforts332
active, and other environmental aesthetics. Sociocultural influences were primarily designated as study covariates. Socioeconomic influences identified in NCCOR-R included covariates including races and socioeconomic status (SES) for N=38, and relevant variables of interest; instead relevant variables of inter-est; were frequently included as covariates in studies using the target tools and methods (N=55). Wolch and colleagues (2011) reported the only tool or method that captured any length of exposure to disadvan-taged conditions addressed a time frame of 8 years.
A majority of the tools and methods reviewed use interviews, surveys, or questionnaires, either investigator- or self-administered (N=40). Observational instruments were less common (N=7), and only Davison (2011) and Israel et al. (2006) used focus group methods. The use of geographic information system (GIS) methods accounted for N=21 cited tools and methods. Of the 58 tools and methods report-ing sample size, N=8 cited use with fewer than 100 subjects, N=19 cited use with 100 to 500 subjects, and N=31 cited use with greater than 500 subjects. Finally, psychometric properties of either reliability or validity were not reported for 22 of the 65 tools and methods. Of those with reported psychometric data, N=18 reported both reliability and validity, N=9 reported only reliability, and N=16 reported only valid-ity. Of the N=27 tools and methods for which some form of reliability was reported, methods included test-retest (N=17), internal consistency (N=8), inter-rater reliability (N=6), and inter-instrumentation (N=1). Validity3 was reported for 31 tools and methods and included construct validity (N=13 tools and methods), concurrent (N=7), criterion (N=8), predictive (N=5), content (N=1), convergent (N=1), discrim-inant (N=1), and face validity (N=1 each).
FOOd ANd BEVERAGE ENVIRONMENT
A search of the food environment in NCCOR-R yielded 283 tools and methods. After applying exclusionary criteria, removing duplicate tools and methods relevant to other target environments, and assessing populations at risk, the Committee identified 51 tools and methods for inclusion in Table E-2. More than two-thirds (N=34) are focused at the community level, and one-third are at the individual level (N=17). Fourteen tools and methods were designed specifically for populations at risk for disparities, with 13 focused on African Americans and 1 focused on Hispanics. Two tools and methods were multi ethnic (e.g., addressed both African American and Hispanics), while 31 tools and methods were for whites along with multiple other populations at risk. Among tools and methods specific to sex, four were used spe-cifically with females, while one tool or method was used with only males. Fourteen tools and methods cited use with both male and female populations, while 32 tools and methods did not specify sex. Of the 38 tools and methods identifying geographic focus, only one specified use with a rural setting, while the majority (N=30) were used in urban settings. Seven tools and methods cited use in both rural and urban locations. There were no tools and methods designed for populations with disabilities or sexual identity/preference.
This review of dimensions of disparities revealed that 47 tools and methods included variables rel-evant to living and working conditions and measuring their access to and availability of foods and quality of foods. Sociocultural influences were included in 2 measurement tools or research methodology, while socioeconomic influences were described in 12 tools and methods. Sociocultural covariates were described
3 Definitions for the various types of validity can be located at http://nccor.org/downloads/NCCOR%20MPR%20Report%20Final.pdf (accessed November 12, 2013).

Copyright © National Academy of Sciences. All rights reserved.
Evaluating Obesity Prevention Efforts: A Plan for Measuring Progress
333Appendix E
in N=7 while socioeconomic covariates were described in N=29. N=41 studies listed socioeconomic relat-ed variables. Tools and methods of life course exposure were not included.
The majority of tools and methods were interviews, surveys, or questionnaires, either administered by researchers or self-administered (N=28); few observational instruments (N=5) and focus group meth-ods (N=4) were used. The use of GIS methods accounted for N=10 cited tools and methods. Of the 39 tools and methods reporting sample size, N=4 cited use with fewer than 100 subjects, N=22 were used with 100 to 500 subjects, and N=13 were used for greater than 500 subjects. Of the 51 tools and meth-ods related to food and beverage environment in NCCOR-R, 33 did not include psychometric properties. Of those reporting psychometric properties of data generated by the tool or method, N=9 reported find-ings for both reliability and validity, N=8 reported only reliability, and 1 cited only tools and methods of validity. Of the tools and methods in which some form of reliability was reported, methods included test-retest (N=7), internal consistency (N=9), and inter-rater reliability (N=8). Types of validity testing included construct validity (N=6), and one each for criterion (N=1), predictive (N=1), convergent (N=1), and face validity (N=1).
MESSAGE ENVIRONMENT
A search of NCCOR-R for media and message environment produced 95 tools and methods. After applying exclusionary criteria, removing duplicate tools and methods, and targeting the search toward populations of interest, the Committee included 8 tools and methods in Table E-3. Of these, five were focused at the community level and three at the individual level. Four tools and methods were designed specifically for populations at risk for disparities, including three focused on African Americans and one on Hispanics. The remaining three tools and methods were designed for the majority white population but also included specific ethnic populations at risk for disparities; one tool/method did not report eth-nicity. All 8 tools and methods were used with urban populations. None of the tools or methods were focused on sex, persons with disabilities, or sexual identity. Six tools and methods addressed living and working conditions. Ayala and colleagues (2007) described the only tool or method to include sociocul-tural content related to eating and socioeconomic content related to purchasing. None of the tools and methods addressed duration or intensity of exposure to media.
Interviews, surveys, or questionnaires, either administered by researchers or self-administered, account-ed for seven tools and methods; one instrument was observational. All tools and methods reported sample size: N=2 tool/method was used with fewer than 100 subjects, N=3 with 100 to 500 subjects, and N=3 tools and methods were used with more than 500 subjects. Psychometric properties of reliability or validity were not available through NCCOR-R for three of the eight tools and methods. Of those reporting psychometric data, two reported findings for both reliability and validity, and three reported only reliability. Reliability methods included test-retest (N=2), internal consistency (N=1), and inter-rater reliability (N=2). Criterion validity was reported on two tools and methods. No other validity information was provided.
hEALTh CARE/wORkSITE ENVIRONMENT
NCCOR-R contained 14 tools and methods regarding the health care/worksite environment. After applying exclusionary criteria, removing duplicate tools and methods, and targeting the search toward populations of interest, the Committee included only two tools and methods in Table E-4. None of these

Copyright © National Academy of Sciences. All rights reserved.
Evaluating Obesity Prevention Efforts: A Plan for Measuring Progress
Evaluating Obesity Prevention Efforts334
tools and methods were designed specifically for populations at risk for disparities. One tool/method was focused at the community level, and one at the individual level. Both addressed urban settings. Neither addressed specific populations related to sex, disability, or sexual identity. A review of tools and methods targeting or addressing dimensions of disparities revealed that both tools and methods addressed living and working conditions; variables of sociocultural or socioeconomic influence or life course exposure were not described. One tool/method was a telephone survey; the other was a self-administered question-naire. One tool/method reported use with a sample size of fewer than 100 subjects; one was used with greater than 500 subjects. Psychometric qualities were not reported for either tool or method.
SChOOL ANd ChILd CARE ENVIRONMENT
NCCOR-R yielded 364 tools and methods of school and early child care environments. After apply-ing exclusionary criteria, removing duplicate tools and methods relevant to other target environments, and assessing by populations at risk, the Committee identified 48 tools and methods for inclusion in Table E-5. Of these, N=38 reflected the individual level, N=3 organizational, N=5 community, and N=2 policy level. Twenty-one tools and methods were designed specifically for populations at risk for disparities, all of which were derived from one study (The Minnesota Girls’ Health Enrichment Multi-Site Studies [GEMS] pilot study) that focused on African American girls (Story et al., 2003). Two tools and methods addressed American Indians, and two were developed for Asian Americans, and one addressed both the African American and Hispanic populations. No other tools and methods were identified as targeting any other populations at risk for disparities. Twenty-one of the tools and methods described were population-wide, addressing multiple ethnic minorities and the majority white population. In addition to the GEMS tools and methods (N=21), 3 studies focused only on women or girls; 14 were used with populations of males and females. With regard to geographic focus, 16 tools and methods cited use with urban popu-lations; none included use with rural or combined rural and urban populations. None of the tools and methods specifically addressed sexual identity or disabilities associated with the school and child care environment.
Variables reflecting living and working conditions were included in 39 tools and methods (of which 21 were from the GEMS study). Sociocultural variables were included in three tools and methods plus GEMS, while socioeconomic variables were not included in any tools and methods. As noted in previous environments, variables of interest were again described as covariates in studies that used the target tools and methods (sociocultural N=27, socioeconomic N=15). N=21 plus GEMS studies included socioeco-nomic-related variables. None of the tools and methods addressed length of exposure to disadvantaged conditions.
Interviews, surveys, or questionnaires, either administered by researchers or self-administered, accounted for N=43 tools and methods (including all GEMS tools and methods), while two instruments were observational. Three tools and methods used GIS methods. Of the tools and methods reporting sample size, N=7 tools and methods plus GEMS were used with less than 100 subjects, N=7 were used for 100 to 500 subjects, and N=9 included more than 500 subjects. Psychometric properties of reliability or validity were not available for 14 tools and methods. Of those reporting psychometric data, 4 reported findings for both reliability and validity, N=7 + 21 GEMS reported only reliability, and N=3 cited valid-ity only. Of the tools and methods in which some form of reliability was reported, methods included

Copyright © National Academy of Sciences. All rights reserved.
Evaluating Obesity Prevention Efforts: A Plan for Measuring Progress
335Appendix E
test-retest (N=5), internal consistency (N=2 + 21 GEMS), and inter-rater reliability (N=4). Validity was reported as follows: face validity (N=1), constructive (N=1), concurrent (N=2), criterion (N=3), content (N=1), and predictive (N=2).
OThER LIMITATIONS
Chapter 5 and this Appendix focus only on tools and methods available in the NCCOR-R and did not secure tools and methods located outside of NCCOR-R or in other tools and research methods data-bases. This review did not attempt to assess the tools and methods of the monitoring of implementation or quality of interventions as applied to cultural sensitivity on the part of organizations and practitioners. As mentioned previously, no other databases focus on measuring obesity and related environments, pro-grams, and systems and provide a good opportunity to compile existing tools and methods that could be used to assess progress with particular attention to disparities. In addition, NCCOR-R is an active data-base with tools and methods added on a continuing basis. Therefore, relevant tools and methods entered into NCCOR-R after the review may not have been captured. The search was conducted using multiple key terms and words as descriptors of targeted populations at risk and social influence. Although this was a comprehensive strategy, it is possible that the key terms did not identify all possible tools and methods. A detailed review of all of the content of NCCOR-R tools and methods was beyond the scope of this review. The review relied on the descriptive data provided by NCCOR-R and expert interpretation of these data to categorize the instruments. In doing so, potential inconsistencies in how constructs of inter-est were defined, inaccuracy in categorizing tools and methods, or omission of critical variables of inter-est could have crept into this report. NCCOR-R was designed to house tools and methods particularly relevant to childhood obesity, which may limit inclusion of relevant tools and methods beyond youth; however, many food and physical activity environmental tools and methods identified are not age-specific and were therefore included and apply to the adult population. This likely limited the library of tools and methods included in the worksite/health care environment. Despite these limitations, it is noteworthy that at the time of this review, 17 percent of the NCCOR-R tools and methods were for children ages 2-5 years, whereas 19 percent were for use only with adults. Finally, this review focused on the availability of tools and methods of disparity and equity, and not on factors defining their use, scale of measurement (absolute versus ratio), or interpretation. Measurement of health disparities and equity have additional implications for assessing indicators of health and social advantage/disadvantage and for comparing indi-cators across social strata (Braveman, 2012; Woolf and Braveman, 2011). These are conceptual and meth-odological issues that require careful consideration, are the subject of other reviews (Braveman, 2009), and will have some consideration in other chapters (Chapters 6, 7, and 8).
REFERENCES
Abarca, J., and S. Ramachandran. 2005. Using community indicators to assess nutrition in Arizona-Mexico border
communities. Preventing Chronic Disease 2(1):A06.
Adams, A., and R. Prince. 2010. Correlates of physical activity in young American Indian children: Lessons learned
from the Wisconsin Nutrition and Growth Study. Journal of Public Health Management and Practice
16(5):394-400.

Copyright © National Academy of Sciences. All rights reserved.
Evaluating Obesity Prevention Efforts: A Plan for Measuring Progress
Evaluating Obesity Prevention Efforts336
Adams, J., E. Ganiti, and M. White. 2011. Socio-economic differences in outdoor food advertising in a city in
Northern England. Public Health Nutrition 14(6):945-950.
Alfonzo, M., M. G. Boarnet, K. Day, T. Mcmillan, and C. L. Anderson. 2008. The relationship of neighbourhood
build environment features and adult parent’s walking. Journal of Urban Design 13(1):29-51.
Algert, S. J., A. Agrawal, and D. S. Lewis. 2006. Disparities in access to fresh produce in low-income neighborhoods
in Los Angeles. American Journal of Preventive Medicine 30(5):365-370.
Andresen, E. M., T. K. Malmstrom, F. D. Wolinsky, M. Schootman, J. P. Miller, and D. K. Miller. 2008. Rating
neighborhoods for older adult health: Results from the African American health study. BMC Public Health
8:35.
Andrews, M., L. Kantor,M. Lino, and D. Ripplinger, D. 2001. Using USDA’s thrifty food plan to assess food avail-
ability and affordability Food Review 24(2):45.
Apparicio, P., M. S. Cloutier, and R. Shearmur. 2007. The case of Montreal’s missing food deserts: Evaluation of
accessibility to food supermarkets. International Journal of Health Geographics 6:4.
Arcan, C., M. Y. Kubik, J. A. Fulkerson, C. Davey, and M. Story. 2011. Association between food opportunities dur-
ing the school day and selected dietary behaviors of alternative high school students, Minneapolis/Saint Paul,
Minnesota, 2006. Preventing Chronic Disease 8(1):A08.
Atkinson, J. L., J. F. Sallis, B. E. Saelens, K. L. Cain, and J. B. Black. 2005. The association of neighborhood design
and recreational environments with physical activity. American Journal of Health Promotion 19(4):304-309.
Ayala, G. X., B. Baquero, E. M. Arredondo, N. Campbell, S. Larios, and J. P. Elder. 2007. Association between fam-
ily variables and Mexican American children’s dietary behaviors. Journal of Nutrition Education and Behavior
39(2):62-69.
Ball, K., D. Crawford, and G. Mishra. 2006. Socio-economic inequalities in women’s fruit and vegetable intakes: A
multilevel study of individual, social and environmental mediators. Public Health Nutrition 9(5):623-630.
Baranowski, T., M. Missaghian, A. Broadfoot, K. Watson, K. Cullen, T. Nicklas, J. Fisher, J. Baranowski, and S.
O’Donnell. 2006. Fruit and vegetable shopping practices and social support scales: A validation. Journal of
Nutrition Education and Behavior 38(6):340-351.
Baranowski, T., K. Watson, M. Missaghian, A. Broadfoot, J. Baranowski, K. Cullen, T. Nicklas, J. Fisher, and S.
O’Donnell. 2007. Parent outcome expectancies for purchasing fruit and vegetables: A validation. Public
Health Nutrition 10(3):280-291.
Baranowski, T., K. Watson, M. Missaghian, A. Broadfoot, K. Cullen, T. Nicklas, J. Fisher, J. Baranowski, and S.
O’Donnell. 2008. Social support is a primary influence on home fruit, 100% juice, and vegetable availability.
Journal of the American Dietetic Association 108(7):1231-1235.
Bauer, K. W., D. Neumark-Sztainer, J. A. Fulkerson, P. J. Hannan, and M. Story. 2011. Familial correlates of adoles-
cent girls’ physical activity, television use, dietary intake, weight, and body composition. International Journal
of Behavioral Nutrition and Physical Activity 8:25.
Befort, C., H. Kaur, N. Nollen, D. K. Sullivan, N. Nazir, W. S. Choi, L. Hornberger, and J. S. Ahluwalia. 2006.
Fruit, vegetable, and fat intake among non-Hispanic black and non-Hispanic white adolescents: Associations
with home availability and food consumption settings. Journal of the American Dietetic Association
106(3):367-373.
Benjamin, S. E., B. Neelon, S. C. Ball, S. I. Bangdiwala, A. S. Ammerman, and D. S. Ward. 2007. Reliability and
validity of a nutrition and physical activity environmental self-assessment for child care. International Journal
of Behavioral Nutrition and Physical Activity 4:29.
Berkey, C. S., H. R. Rockett, A. E. Field, M. W. Gillman, A. L. Frazier, C. A. Camargo, Jr., and G. A. Colditz. 2000.
Activity, dietary intake, and weight changes in a longitudinal study of preadolescent and adolescent boys and
girls. Pediatrics 105(4):E56.

Copyright © National Academy of Sciences. All rights reserved.
Evaluating Obesity Prevention Efforts: A Plan for Measuring Progress
337Appendix E
Block, D., and J. Kouba. 2006. A comparison of the availability and affordability of a market basket in two commu-
nities in the Chicago area. Public Health Nutrition 9(7):837-845.
Block, J. P., R. A. Scribner, and K. B. DeSalvo. 2004. Fast food, race/ethnicity, and income: A geographic analysis.
American Journal of Preventive Medicine 27(3):211-217.
Boles, R. E., T. D. Nelson, L. A. Chamberlin, J. M. Valenzuela, S. N. Sherman, S. L. Johnson, and S. W. Powers.
2010. Confirmatory factor analysis of the child feeding questionnaire among low-income African American
families of preschool children. Appetite 54(2):402-405.
Braveman, P. 2009. A health disparities perspective on obesity research. Preventing Chronic Disease 6(3):A91.
Braveman, P. 2012. Health inequalities by class and race in the US: What can we learn from the patterns? Social
Science and Medicine 74(5):665-667.
Braza, M., W. Shoemaker, and A. Seeley. 2004. Neighborhood design and rates of walking and biking to elementary
school in 34 California communities. American Journal of Health Promotion 19(2):128-136.
Brownson, R. C., J. J. Chang, A. A. Eyler, B. E. Ainsworth, K. A. Kirtland, B. E. Saelens, and J. F. Sallis. 2004.
Measuring the environment for friendliness toward physical activity: A comparison of the reliability of 3 ques-
tionnaires. American Journal of Public Health 94(3):473-483.
Bryant, M. J., D. S. Ward, D. Hales, A. Vaughn, R. G. Tabak, and J. Stevens. 2008. Reliability and validity of the
healthy home survey: A tool to measure factors within homes hypothesized to relate to overweight in children.
International Journal of Behavioral Nutrition and Physical Activity 5:23.
Burdette, H. L., and R. C. Whitaker. 2004. Neighborhood playgrounds, fast food restaurants, and crime:
Relationships to overweight in low-income preschool children. Preventive Medicine 38(1):57-63.
Burdette, H. L., R. C. Whitaker, and S. R. Daniels. 2004. Parental report of outdoor playtime as a measure of physi-
cal activity in preschool-aged children. Archives of Pediatrics and Adolescent Medicine 158(4):353-357.
Cassady, D., R. Housemann, and C. Dagher. 2004. Measuring cues for healthy choices on restaurant menus:
Development and testing of a measurement instrument. American Journal of Health Promotion 18(6):444-449.
Catlin, T. K., E. J. Simoes, and R. C. Brownson. 2003. Environmental and policy factors associated with overweight
among adults in Missouri. American Journal of Health Promotion 17(4):249-258.
Caughy, M. O., P. J. O’Campo, and J. Patterson. 2001. A brief observational measure for urban neighborhoods.
Health Place 7(3):225-236.
Cerin, E., T. L. Conway, B. E. Saelens, L. D. Frank, and J. F. Sallis. 2009. Cross-validation of the factorial struc-
ture of the Neighborhood Environment Walkability Scale (NEWS) and its abbreviated form (NEWS-A).
International Journal of Behavioral Nutrition and Physical Activity 6:32.
Chen, X., M. Sekine, S. Hamanishi, H. Wang, Y. Hayashikawa, T. Yamagami, and S. Kagamimori. 2002. The
validity of nursery teachers’ report on the physical activity of young children. Journal of Epidemiology
12(5):367-374.
Chiang, P. H., M. L. Wahlqvist, M. S. Lee, L. Y. Huang, H. H. Chen, and S. T. Huang. 2011. Fast-food outlets and
walkability in school neighbourhoods predict fatness in boys and height in girls: A Taiwanese population
study. Public Health Nutrition 14(9):1601-1609.
Crawford, P. B., W. Gosliner, P. Strode, S. E. Samuels, C. Burnett, L. Craypo, and A. K. Yancey. 2004. Walking the
talk: Fit WIC wellness programs improve self-efficacy in pediatric obesity prevention counseling. American
Journal of Public Health 94(9):1480-1485.
Cullen, K. W., and D. I. Thompson. 2005. Texas school food policy changes related to middle school a la carte/snack
bar foods: Potential savings in kilocalories. Journal of the American Dietetic Association 105(12):1952-1954.
Cullen, K. W., and K. B. Watson. 2009. The impact of the Texas public school nutrition policy on student food selec-
tion and sales in Texas. American Journal of Public Health 99(4):706-712.

Copyright © National Academy of Sciences. All rights reserved.
Evaluating Obesity Prevention Efforts: A Plan for Measuring Progress
Evaluating Obesity Prevention Efforts338
Cullen, K. W., T. Baranowski, E. Owens, T. Marsh, L. Rittenberry, and C. de Moor. 2003. Availability, accessibil-
ity, and preferences for fruit, 100% fruit juice, and vegetables influence children’s dietary behavior. Health
Education and Behavior 30(5):615-626.
Davison, K. K., K. Li, M. L. Baskin, T. Cox, and O. Affuso. 2011. Measuring parental support for children’s physical
activity in white and African American parents: The activity support scale for multiple groups (ACTS-MG).
Preventive Medicine 52(1):39-43.
Dennisuk, L. A., A. J. Coutinho, S. Suratkar, P. J. Surkan, K. Christiansen, M. Riley, J. A. Anliker, S. Sharma, and J.
Gittelsohn. 2011. Food expenditures and food purchasing among low-income, urban, African-American youth.
American Journal of Preventive Medicine 40(6):625-628.
DeVault, N., T. Kennedy, J. Hermann, M. Mwavita, P. Rask, and A. Jaworsky. 2009. It’s all about kids: Preventing
overweight in elementary school children in Tulsa, OK. Journal of the American Dietetic Association
109(4):680-687.
Diez Roux, A. V., K. R. Evenson, A. P. McGinn, D. G. Brown, L. Moore, S. Brines, and D. R. Jacobs, Jr. 2007.
Availability of recreational resources and physical activity in adults. American Journal of Public Health
97(3):493-499.
Ding, D., J. F. Sallis, G. J. Norman, B. E. Saelens, S. K. Harris, J. Kerr, D. Rosenberg, N. Durant, and K. Glanz.
2012. Community food environment, home food environment, and fruit and vegetable intake of children and
adolescents. Journal of Nutrition Education and Behavior 44(6):634-638.
Donkin, A. J., E. A. Dowler, S. J. Stevenson, and S. A. Turner. 2000. Mapping access to food in a deprived area: The
development of price and availability indices. Public Health Nutrition 3(1):31-38.
Doyle, S., A. Kelly-Schwartz, M. Schlossberg, and J. Stockard. 2006. Active community environments and health:
The relationship of walkable and safe communities to individual health. Journal of the American Planning
Association 72(1):19-31.
Dunton, G. F., and M. Schneider. 2006. Perceived barriers to walking for physical activity. Preventing Chronic
Disease 3(4):A116.
Echeverria, S. E., A. V. Diez-Roux, and B. G. Link. 2004. Reliability of self-reported neighborhood characteristics.
Journal of Urban Health 81(4):682-701.
Economos, C. D., J. M. Sacheck, K. Kwan Ho Chui, L. Irizarry, J. Guillemont, J. J. Collins, and R. R. Hyatt. 2008.
School-based behavioral assessment tools are reliable and valid for measurement of fruit and vegetable intake,
physical activity, and television viewing in young children. Journal of the American Dietetic Association
108(4):695-701.
Edmonds, J., T. Baranowski, J. Baranowski, K. W. Cullen, and D. Myres. 2001. Ecological and socioeconomic
correlates of fruit, juice, and vegetable consumption among African-American boys. Preventive Medicine
32(6):476-481.
Epstein, L. H., S. Raja, S. S. Gold, R. A. Paluch, Y. Pak, and J. N. Roemmich. 2006. Reducing sedentary behavior:
The relationship between park area and the physical activity of youth. Psychological Science 17(8):654-659.
Evenson, K. R., and A. P. McGinn. 2005. Test-retest reliability of a questionnaire to assess physical environmental
factors pertaining to physical activity. International Journal of Behavioral Nutrition and Physical Activity 2:7.
Evenson, K. R., A. A. Eyler, S. Wilcox, J. L. Thompson, and J. E. Burke. 2003. Test-retest reliability of a question-
naire on physical activity and its correlates among women from diverse racial and ethnic groups. American
Journal of Preventive Medicine 25(3 Suppl 1):15-22.
Evenson, K. R., A. S. Birnbaum, A. L. Bedimo-Rung, J. F. Sallis, C. C. Voorhees, K. Ring, and J. P. Elder. 2006.
Girls’ perception of physical environmental factors and transportation: Reliability and association with physi-
cal activity and active transport to school. International Journal of Behavioral Nutrition and Physical Activity
3:28.

Copyright © National Academy of Sciences. All rights reserved.
Evaluating Obesity Prevention Efforts: A Plan for Measuring Progress
339Appendix E
Ewing, R., T. Schmid, R. Killingsworth, A. zlot, and S. Raudenbush. 2003. Relationship between urban sprawl and
physical activity, obesity, and morbidity. American Journal of Health Promotion 18(1):47-57.
Ewing, R., R. C. Brownson, and D. Berrigan. 2006. Relationship between urban sprawl and weight of United States
youth. American Journal of Preventive Medicine 31(6):464-474.
Frank, L. D., M. A. Andresen, and T. L. Schmid. 2004. Obesity relationships with community design, physical activ-
ity, and time spent in cars. American Journal of Preventive Medicine 27(2):87-96.
Frank, L. D., T. L. Schmid, J. F. Sallis, J. Chapman, and B. E. Saelens. 2005. Linking objectively measured physical
activity with objectively measured urban form: Findings from SMARTRAQ. American Journal of Preventive
Medicine 28(2 Suppl 2):117-125.
Franzini, L., M. N. Elliott, P. Cuccaro, M. Schuster, M. J. Gilliland, J. A. Grunbaum, F. Franklin, and S. R. Tortolero.
2009. Influences of physical and social neighborhood environments on children’s physical activity and obesity.
American Journal of Public Health 99(2):271-278.
Fulkerson, J. A., M. C. Nelson, L. Lytle, S. Moe, C. Heitzler, and K. E. Pasch. 2008. The validation of a home food
inventory. International Journal of Behavioral Nutrition and Physical Activity 5:55.
Gattshall, M. L., J. A. Shoup, J. A. Marshall, L. A. Crane, and P. A. Estabrooks. 2008. Validation of a survey
instrument to assess home environments for physical activity and healthy eating in overweight children.
International Journal of Behavioral Nutrition and Physical Activity 5:3.
Glanz, K., J. F. Sallis, B. E. Saelens, and L. D. Frank. 2007. Nutrition environment measures survey in stores
(NEMS-S): Development and evaluation. American Journal of Preventive Medicine 32(4):282-289.
Gomez, J. E., B. A. Johnson, M. Selva, and J. F. Sallis. 2004. Violent crime and outdoor physical activity among
inner-city youth. Preventive Medicine 39(5):876-881.
Gordon-Larsen, P., M. C. Nelson, P. Page, and B. M. Popkin. 2006. Inequality in the built environment underlies key
health disparities in physical activity and obesity. Pediatrics 117(2):417-424.
Gosliner, W., K. A. Madsen, G. Woodward-Lopez, and P. B. Crawford. 2011. Would students prefer to eat healthier
foods at school? Journal of School Health 81(3):146-151.
Graham, D. J., M. Schneider, and S. S. Dickerson. 2011. Environmental resources moderate the relationship between
social support and school sports participation among adolescents: A cross-sectional analysis. International
Journal of Behavioral Nutrition and Physical Activity 8:34.
Grigsby-Toussaint, D. S., I. K. Moise, and S. D. Geiger. 2011. Observations of marketing on food packaging targeted
to youth in retail food stores. Obesity (Silver Spring) 19(9):1898-1900.
Haire-Joshu, D., B. W. Yount, E. L. Budd, C. Schwarz, R. Schermbeck, S. Green, and M. Elliott. 2011. The quality
of school wellness policies and energy-balance behaviors of adolescent mothers. Preventing Chronic Disease
8(2):A34.
Hayes, L. R. 2000. Are prices higher for the poor in New York City? Journal of Consumer Policy 12(1-2):69-101.
Hearn, M.D., T. Baranowski, J. Baranowski, C. Doyle, M. Smith, L. S. Lin, and K. Resnicow. 1998. Environmental
influences on dietary behavior among children: Availability and accessibility of fruits and vegetables enable
consumption. Journal of Health Education 29(1):26-32.
Helling, A., and D. S. Sawicki. 2003. Race and residential accessibility to shopping and services. Housing Policy
Debate 12(1-2):69-101.
Hendrickson, D., C. Smith, and N. Eikenberry. 2006. Fruit and vegetable access in four lower income food deserts
communities in Minnesota. Agriculture and Human Values 23(3):371-383.
Hino, A. A. F., R. S. Reis, I. C. Ribeiro, D. C. Parra, R. C. Brownson, and R. C. Fermino. 2010. Using observational
methods to evaluate public open spaces and physical activity in Brazil. Journal of Physical Activity and Health
7(Suppl 2):S146-154.

Copyright © National Academy of Sciences. All rights reserved.
Evaluating Obesity Prevention Efforts: A Plan for Measuring Progress
Evaluating Obesity Prevention Efforts340
Horodynski, M. A., M. Stommel, H. E. Brophy-Herb, and L. Weatherspoon. 2010. Mealtime television viewing and
dietary quality in low-income African American and caucasian mother-toddler dyads. Maternal and Child
Health Journal 14(4):548-556.
Horowitz, C. R., K. A. Colson, P. L. Hebert, and K. Lancaster. 2004. Barriers to buying healthy foods for people
with diabetes: Evidence of environmental disparities. American Journal of Public Health 94(9):1549-1554.
Huston, S. L., K. R. Evenson, P. Bors, and z. Gizlice. 2003. Neighborhood environment, access to places for activ-
ity, and leisure-time physical activity in a diverse North Carolina population. American Journal of Health
Promotion 18(1):58-69.
Ihmels, M. A., G. J. Welk, J. C. Eisenmann, and S. M. Nusser. 2009. Development and preliminary validation of a
Family Nutrition and Physical Activity (FNPA) screening tool. International Journal of Behavioral Nutrition
and Physical Activity 6:14.
Inagami, S., D. A. Cohen, B. K. Finch, and S. M. Asch. 2006. You are where you shop: Grocery store locations,
weight, and neighborhoods. American Journal of Preventive Medicine 31(1):10-17.
IOM (Institute of Medicine). 2012. Accelerating progress in obesity prevention: Solving the weight of the nation.
Washington, DC: The National Academies Press.
Israel, B. A., A. J. Schulz, L. Estrada-Martinez, S. N. zenk, E. Viruell-Fuentes, A. M. Villarruel, and C. Stokes. 2006.
Engaging urban residents in assessing neighborhood environments and their implications for health. Journal of
Urban Health 83(3):523-539.
Jilcott, S. B., T. Keyserling, T. Crawford, J. T. McGuirt, and A. S. Ammerman. 2011a. Examining associations among
obesity and per capita farmers’ markets, grocery stores/supermarkets, and supercenters in US counties. Journal
of the American Dietetic Association 111(4):567-572.
Jilcott, S. B., S. Wade, J. T. McGuirt, Q. Wu, S. Lazorick, and J. B. Moore. 2011b. The association between
the food environment and weight status among eastern North Carolina youth. Public Health Nutrition
14(9):1610-1617.
Kaufman, P. 1999. Rural poor have less access to supermarkets, large grocery stores. Rural Development Perspectives
13(3):19-26.
Kimm, S. Y., N. W. Glynn, A. M. Kriska, S. L. Fitzgerald, D. J. Aaron, S. L. Similo, R. P. McMahon, and B. A.
Barton. 2000. Longitudinal changes in physical activity in a biracial cohort during adolescence. Medicine and
Science in Sports and Exercise 32(8):1445-1454.
King, W. C., S. H. Belle, J. S. Brach, L. R. Simkin-Silverman, T. Soska, and A. M. Kriska. 2005. Objective measures
of neighborhood environment and physical activity in older women. American Journal of Preventive Medicine
28(5):461-469.
Kipke, M. D., E. Iverson, D. Moore, C. Booker, V. Ruelas, A. L. Peters, and F. Kaufman. 2007. Food and park envi-
ronments: Neighborhood-level risks for childhood obesity in east Los Angeles. Journal of Adolescent Health
40(4):325-333.
Kirtland, K. A., D. E. Porter, C. L. Addy, M. J. Neet, J. E. Williams, P. A. Sharpe, L. J. Neff, C. D. Kimsey, Jr., and B.
E. Ainsworth. 2003. Environmental measures of physical activity supports: Perception versus reality. American
Journal of Preventive Medicine 24(4):323-331.
Lee, S. M., C. Tudor-Locke, and E. K. Burns. 2008. Application of a walking suitability assessment to the immediate
built environment surrounding elementary schools. Health Promotion Practice 9(3):246-252.
Lewis, L. B., D. C. Sloane, L. M. Nascimento, A. L. Diamant, J. J. Guinyard, A. K. Yancey, and G. Flynn. 2005.
African Americans’ access to healthy food options in south Los Angeles restaurants. American Journal of
Public Health 95(4):668-673.

Copyright © National Academy of Sciences. All rights reserved.
Evaluating Obesity Prevention Efforts: A Plan for Measuring Progress
341Appendix E
Li, F., P. Harmer, B. J. Cardinal, M. Bosworth, and D. Johnson-Shelton. 2009. Obesity and the built environ-
ment: Does the density of neighborhood fast-food outlets matter? American Journal of Health Promotion
23(3):203-209.
Liu, G. C., J. S. Wilson, R. Qi, and J. Ying. 2007. Green neighborhoods, food retail and childhood overweight:
Differences by population density. American Journal of Health Promotion 21(4 Suppl):317-325.
McGinn, A. P., K. R. Evenson, A. H. Herring, and S. L. Huston. 2007a. The relationship between leisure, walking,
and transportation activity with the natural environment. Health Place 13(3):588-602.
McGinn, A. P., K. R. Evenson, A. H. Herring, S. L. Huston, and D. A. Rodriguez. 2007b. Exploring associations
between physical activity and perceived and objective measures of the built environment. Journal of Urban
Health 84(2):162-184.
McGinn, A. P., K. R. Evenson, A. H. Herring, S. L. Huston, and D. A. Rodriguez. 2008. The association of perceived
and objectively measured crime with physical activity: A cross-sectional analysis. Journal of Physical Activity
and Health 5(1):117-131.
McKenzie, T. L., S. J. Marshall, J. F. Sallis, and T. L. Conway. 2000. Leisure-time physical activity in school environ-
ments: An observational study using soplay. Preventive Medicine 30(1):70-77.
McKenzie, T. L., D. A. Cohen, A. Sehgal, S. Williamson, and D. Golinelli. 2006. System for Observing Play and
Recreation in Communities (SOPARC): Reliability and feasibility measures. Journal of Physical Activity and
Health 3(Suppl 1):S208-S222.
Moore, L. V., and A. V. Diez Roux. 2006. Associations of neighborhood characteristics with the location and type of
food stores. American Journal of Public Health 96(2):325-331.
Moreno, J. P., M. L. Kelley, D. N. Landry, V. Paasch, M. A. Terlecki, C. A. Johnston, and J. P. Foreyt. 2011.
Development and validation of the family health behavior scale. International Journal of Pediatric Obesity
6(2-2):e480-e486.
Morland, K., S. Wing, A. Diez Roux, and C. Poole. 2002. Neighborhood characteristics associated with the location
of food stores and food service places. American Journal of Preventive Medicine 22(1):23-29.
Morland, K., A. V. Diez Roux, and S. Wing. 2006. Supermarkets, other food stores, and obesity: The atherosclerosis
risk in communities study. American Journal of Preventive Medicine 30(4):333-339.
Mujahid, M. S., A. V. Diez Roux, J. D. Morenoff, and T. Raghunathan. 2007. Assessing the measurement prop-
erties of neighborhood scales: From psychometrics to ecometrics. American Journal of Epidemiology
165(8):858-867.
Nelson, M. C., P. Gordon-Larsen, Y. Song, and B. M. Popkin. 2006. Built and social environments associations with
adolescent overweight and activity. American Journal of Preventive Medicine 31(2):109-117.
Neumark-Sztainer, D., S. A. French, P. J. Hannan, M. Story, and J. A. Fulkerson. 2005. School lunch and snacking
patterns among high school students: Associations with school food environment and policies. International
Journal of Behavioral Nutrition and Physical Activity 2(1):14.
Norman, G. J., S. K. Nutter, S. Ryan, J. F. Sallis, K. J. Calfas, and K. Patrick. 2006. Community design and access
to recreational facilities as correlates of adolescent physical activity and body-mass index. Journal of Physical
Activity and Health 3(Suppl 1):S118-S128.
Pate, R. R., K. McIver, M. Dowda, W. H. Brown, and C. Addy. 2008. Directly observed physical activity levels in
preschool children. Journal of School Health 78(8):438-444.
Polat, S., and B. Erci. 2010. Psychometric properties of the child feeding scale in Turkish mothers. Asian Nursing
Research 4(3):111-121.
Roemmich, J. N., L. H. Epstein, S. Raja, and L. Yin. 2007. The neighborhood and home environments: Disparate
relationships with physical activity and sedentary behaviors in youth. Annals of Behavioral Medicine
33(1):29-38.

Copyright © National Academy of Sciences. All rights reserved.
Evaluating Obesity Prevention Efforts: A Plan for Measuring Progress
Evaluating Obesity Prevention Efforts342
Romero, A. J., T. N. Robinson, H. C. Kraemer, S. J. Erickson, K. F. Haydel, F. Mendoza, and J. D. Killen. 2001.
Are perceived neighborhood hazards a barrier to physical activity in children? Archives of Pediatrics and
Adolescent Medicine 155(10):1143-1148.
Rossen, L. M., K. M. Pollack, F. C. Curriero, T. M. Shields, M. J. Smart, C. D. Furr-Holden, and M. Cooley-
Strickland. 2011. Neighborhood incivilities, perceived neighborhood safety, and walking to school among
urban-dwelling children. Journal of Physical Activity and Health 8(2):262-271.
Rundle, A., A. V. Diez Roux, L. M. Free, D. Miller, K. M. Neckerman, and C. C. Weiss. 2007. The urban built envi-
ronment and obesity in New York City: A multilevel analysis. American Journal of Health Promotion 21(4
Suppl):326-334.
Saelens, B. E., J. F. Sallis, J. B. Black, and D. Chen. 2003. Neighborhood-based differences in physical activity: An
environment scale evaluation. American Journal of Public Health 93(9):1552-1558.
Scott, M. M., K. R. Evenson, D. A. Cohen, and C. E. Cox. 2007. Comparing perceived and objectively measured
access to recreational facilities as predictors of physical activity in adolescent girls. Journal of Urban Health
84(3):346-359.
Sirard, J. R., M. C. Nelson, M. A. Pereira, and L. A. Lytle. 2008. Validity and reliability of a home environment
inventory for physical activity and media equipment. International Journal of Behavioral Nutrition and
Physical Activity 5:24.
Sloane, D. C., A. L. Diamant, L. B. Lewis, A. K. Yancey, G. Flynn, L. M. Nascimento, W. J. McCarthy, J. J.
Guinyard, and M. R. Cousineau. 2003. Improving the nutritional resource environment for healthy living
through community-based participatory research. Journal of General Internal Medicine 18(7):568-575.
Spivock, M., L. Gauvin, and J. M. Brodeur. 2007. Neighborhood-level active living buoys for individuals with physi-
cal disabilities. American Journal of Preventive Medicine 32(3):224-230.
Stevens, J., C. E. Cornell, M. Story, S. A. French, S. Levin, A. Becenti, J. Gittelsohn, S. B. Going, and R. Reid. 1999.
Development of a questionnaire to assess knowledge, attitudes, and behaviors in American Indian children.
American Journal of Clinical Nutrition 69(4 Suppl):773S-781S.
Story, M., N. E. Sherwood, J. H. Himes, M. Davis, D. R. Jacobs, Jr., Y. Cartwright, M. Smyth, and J. Rochon.
2003a. An after-school obesity prevention program for African-American girls: The Minnesota GEMS pilot
study. Ethnicity and Disease 13(1 Suppl 1):S54-S64.
Story, M., M. P. Snyder, J. Anliker, J. L. Weber, L. Cunningham-Sabo, E. J. Stone, A. Chamberlain, B. Ethelbah,
C. Suchindran, and K. Ring. 2003b. Changes in the nutrient content of school lunches: Results from the
Pathways study. Preventive Medicine 37(6 Pt 2):S35-S45.
Surkan, P. J., A. J. Coutinho, K. Christiansen, L. A. Dennisuk, S. Suratkar, E. Mead, S. Sharma, and J. Gittelsohn.
2011. Healthy food purchasing among African American youth: Associations with child gender, adult care-
giver characteristics and the home food environment. Public Health Nutrition 14(4):670-677.
Taber, D. R., J. Stevens, K. R. Evenson, D. S. Ward, C. Poole, M. L. Maciejewski, D. M. Murray, and R. C.
Brownson. 2011. State policies targeting junk food in schools: Racial/ethnic differences in the effect of policy
change on soda consumption. American Journal of Public Health 101(9):1769-1775.
Tester, J. M., I. H. Yen, L. C. Pallis, and B. A. Laraia. 2011. Healthy food availability and participation in WIC
(special supplemental nutrition program for women, infants, and children) in food stores around lower- and
higher-income elementary schools. Public Health Nutrition 14(6):960-964.
Welk, G. J., E. Wickel, M. Peterson, C. D. Heitzler, J. E. Fulton, and L. D. Potter. 2007. Reliability and validity of
questions on the youth media campaign longitudinal survey. Medicine and Science in Sports and Exercise
39(4):612-621.

Copyright © National Academy of Sciences. All rights reserved.
Evaluating Obesity Prevention Efforts: A Plan for Measuring Progress
343Appendix E
Williams, J. E., M. Evans, K. A. Kirtland, M. M. Cavnar, P. A. Sharpe, M. J. Neet, and A. Cook. 2005. Development
and use of a tool for assessing sidewalk maintenance as an environmental support of physical activity. Health
Promotion Practice 6(1):81-88.
Witten, K., D. Exeter, and A. Field. 2003. The quality of urban environments: Mapping, variation in access to com-
munity resources. Urban Studies 40(1):161-177.
Wolch, J., M. Jerrett, K. Reynolds, R. McConnell, R. Chang, N. Dahmann, K. Brady, F. Gilliland, J. G. Su, and K.
Berhane. 2011. Childhood obesity and proximity to urban parks and recreational resources: A longitudinal
cohort study. Health Place 17(1):207-214.
Woolf, S. H., and P. Braveman. 2011. Where health disparities begin: The role of social and economic determinants—
and why current policies may make matters worse. Health Affairs 30(10):18521859.
Wright, N. D., A. E. Groisman-Perelstein, J. Wylie-Rosett, N. Vernon, P. M. Diamantis, and C. R. Isasi. 2011. A life-
style assessment and intervention tool for pediatric weight management: The habits questionnaire. Journal of
Human Nutrition and Dietetics 24(1):96-100.
Yoo, S., T. Baranowski, M. Missaghian, J. Baranowski, K. Cullen, J. O. Fisher, K. Watson, I. F. zakeri, and T.
Nicklas. 2006. Food-purchasing patterns for home: A grocery store-intercept survey. Public Health Nutrition
9(3):384-393.
zenk, S. N., A. J. Schulz, T. Hollis-Neely, R. T. Campbell, N. Holmes, G. Watkins, R. Nwankwo, and A. Odoms-
Young. 2005a. Fruit and vegetable intake in African Americans income and store characteristics. American
Journal of Preventive Medicine 29(1):1-9.
zenk, S. N., A. J. Schulz, B. A. Israel, S. A. James, S. Bao, and M. L. Wilson. 2005b. Neighborhood racial composi-
tion, neighborhood poverty, and the spatial accessibility of supermarkets in metropolitan Detroit. American
Journal of Public Health 95(4):660-667.
zenk, S. N., A. J. Schulz, B. A. Israel, S. A. James, S. Bao, and M. L. Wilson. 2006. Fruit and vegetable access dif-
fers by community racial composition and socioeconomic position in Detroit, Michigan. Ethnicity and Disease
16(1):275-280.

Copyright © National Academy of Sciences. All rights reserved.
Evaluating Obesity Prevention Efforts: A Plan for Measuring Progress
Evaluating Obesity Prevention Efforts344
TABLE E-1 Physical Activity Environment Measurement Tools and Research Methods
Tool/Method
Level, purpose, description, sample size, psychometric properties
Population at risk: race/ethnicity; sex; sexual identity; disability; geographic location
Social determinants:living and working conditions; sociocultural; socioeconomic; life course exposure
Urban Design Audit(Alfonzo et al., 2008)
Community levelObservation tool for urban design characteristics of neighborhoods Items: NR; self-administeredN=NR, 11 neighborhoods in California; Parents of 3-5th grade studentsReliability – NR; Validity – NR
Race/ethnicity: AA, Hispanic, Asian, HI/PI, whiteSex: M/FSexual identity: NRDisability: NRGeographic: Urban/rural
Living and working conditions: Street connectivity, crime/safety, facility adequacy or quality aesthetics, land use, pedestrian infrastructureSociocultural: NRSocioeconomic: Related variables – income, employment, education, number of cars in householdLife course exposure: NR
African American Health Neighborhood Assessment Scale(Andresen et al., 2008)
Community levelTo determine observer ratings of neighborhoods and establish psychometric properties88 items, 7-item scale; researcher-administered, direct observation N=998 adultsReliability – inter-rater; Validity – concurrent, discriminant, convergent
Race/ethnicity: AASex: M/FSexual identity: NRDisability: NRGeographic: Urban
Living and working conditions: Aesthetics, pedestrian infrastructure, traffic safety Sociocultural: NRSocioeconomic: NR Life course exposure: NR
Neighborhood Environment Walkability Survey (NEWS)(Atkinson et al., 2005)
Community levelTo assess neighborhood design factors and recreational environments68 items; self-administered questionnaireN=102 adultsReliability – test-retest; Validity – construct
Race/ethnicity: AA, Hispanic, Asian, whiteSex: M/FSexual identity: NRDisability: NRGeographic: Urban
Living and working conditions: Street connectivity, crime/safety, traffic safety, facility access, aesthetics, land use, population and housing density, pedestrian infrastructure, home PA equipmentSociocultural: NRSocioeconomic: Covariates – SES, raceLife course exposure: NR

Copyright © National Academy of Sciences. All rights reserved.
Evaluating Obesity Prevention Efforts: A Plan for Measuring Progress
345Appendix E
Tool/Method
Level, purpose, description, sample size, psychometric properties
Population at risk: race/ethnicity; sex; sexual identity; disability; geographic location
Social determinants:living and working conditions; sociocultural; socioeconomic; life course exposure
Home Environment Factors for Adolescent Girls(Bauer et al., 2011)
Home-individual levelTo assess familial support for adolescents’ PA, healthful dietary intake, and limiting TV use; parental modeling of behavior; and resources in the homeItems: NR; self- or third-party-administeredN=253 parents of adolescent girls grades 9-12Reliability – NR; Validity – NR
Race/ethnicity: AA, AI/AN, Hispanic, Asian, whiteSex: FemaleSexual identity: NRDisability: NRGeographic: Urban
Living and working conditions: Home access/availability of PA equipment/fruit/vegetable, TV use, access/availability to healthful foodsSociocultural: NR Socioeconomic: Covariates – SES, race; Related variables – educationLife course exposure: NR
Youth/Adolescent Questionnaire for 9 to 14 Year Olds(Berkey et al., 2000)
Individual levelTo examine the role of PA, inactivity, and dietary patterns on annual weight changes among preadolescents and adolescents, taking growth and development into account132 itemsN=10,769 children 6-18 yrs oldReliability – NR; Validity – criterion
Race/ethnicity: AA, AI/AN, Hispanic, Asian, whiteSex: M/FSexual identity: NRDisability: NRGeographic: NR
Living and working conditions: NRSociocultural: NR Socioeconomic: NA Life course exposure: Assessed over 12-month period
Physical Activity Questionnaire for 9 to 14 Year Olds(Berkey et al., 2000)
17 itemsReliability – inter-instrument; Validity – criterion
TV, Video, & Games Questionnaire for 9 to 14 Year Olds(Berkey et al., 2000)
Items: NRReliability – NR; Validity – NR
TABLE E-1 Continued
continued

Copyright © National Academy of Sciences. All rights reserved.
Evaluating Obesity Prevention Efforts: A Plan for Measuring Progress
Evaluating Obesity Prevention Efforts346
Tool/Method
Level, purpose, description, sample size, psychometric properties
Population at risk: race/ethnicity; sex; sexual identity; disability; geographic location
Social determinants:living and working conditions; sociocultural; socioeconomic; life course exposure
School and Home Physical Activity and Inactivity Questionnaire(Berkey et al., 2000)
Record or log of moderate to vigorous PAReliability – NR; Validity – NR
Neighborhood Design Scale(Braza et al., 2004)
Individual levelTo determine how 5th-grade students arrived to school 1 week before Walk to School Day 1 item; GIS protocol N=NR, 5th-grade students from 34 of 150 elementary schools surveyedReliability – NR; Validity – NR
Race/ethnicity: AA, Hispanic, Asian, HI/PI, whiteSex: NRSexual identity: NRDisability: NRGeographic: NR
Living and working conditions: Street connectivity, population and housing densitySociocultural: NRSocioeconomic: Covariates – SES, race; Related variables – WIC/school lunch programLife course exposure: NR
Physical Activity Environment(Brownson et al., 2004)
Community levelTested reliability of 3 questionnaires that assess social and physical environments61 items; researcher-administered by phoneN=97 adults Reliability – test-retest; Validity – NR
Race/ethnicity: AA, whiteSex: M/FSexual identity: NRDisability: NRGeographic: Urban/rural
Living and working conditions: Facility adequacy, access, aestheticsSociocultural: NRSocioeconomic: Related variables – income, employment, educationLife course exposure: NR
Perceived Community and Workplace Environment(Brownson et al., 2004)
Community levelTested reliability of 3 questionnaires that assess social and physical environments104 items; researcher-administered by phoneN=99Reliability – test retest with four subscales; Validity – NR
Race/ethnicity: AA, whiteSex: M/FSexual identity: NRDisability: NRGeographic: Urban/rural
Living and working conditions: Perceived barriers to PA, cycling infrastructure, pedestrian/traffic safety, policy Sociocultural: Social environmentSocioeconomic: Covariates – SES, race; Related variables – income, employment, educationLife course exposure: NR
TABLE E-1 Continued

Copyright © National Academy of Sciences. All rights reserved.
Evaluating Obesity Prevention Efforts: A Plan for Measuring Progress
347Appendix E
Tool/Method
Level, purpose, description, sample size, psychometric properties
Population at risk: race/ethnicity; sex; sexual identity; disability; geographic location
Social determinants:living and working conditions; sociocultural; socioeconomic; life course exposure
Neighborhood Playgrounds and Safety(Burdette and Whitaker, 2004)
Community levelTo assess BMI, proximity to fast food restaurants/playgrounds, and objective tools and methods of crime in neighborhoods; GIS protocolN=7,020 children 3-5 yrs oldReliability – NR; Validity – NR
Race/ethnicity: AA, whiteSex: M/FSexual identity: NRDisability: NRGeographic: Urban
Living and working conditions: Neighborhood crime/safety, facility accessSociocultural: NRSocioeconomic: Related variables – WIC/school lunch program Life course exposure: NR
Parental Report of Outdoor Playtime(Burdette and Whitaker, 2004)
Individual levelTo compare a direct method of PA in preschool-aged children with 2 parental-report methods of children’s outdoor playtime4 items; third party, direct observationN=250 childrenReliability – NR; Validity – criterion
Race/ethnicity: AA, whiteSex: NRSexual identity: NRDisability: NRGeographic: Urban
Living and working conditions: Recess, play breaksSociocultural: NRSocioeconomic: NRLife course exposure: NR
Proximity of Fast Food Restaurants(Burdette and Whitaker, 2004)
Community levelTo examine the proximity of children’s residences to playgrounds and fast food restaurants and neighborhood safety GIS protocolN=7,020 low-income childrenReliability – NR; Validity – NR
Race/ethnicity: AA, whiteSex: NRSexual identity: NR Disability: NRGeographic: NR
Living and working conditions: Availability/access to fast food restaurantsSociocultural: NRSocioeconomic: Related variables – WIC/school lunch programLife course exposure: NR
Environmental and Policy Factors(Catlin et al., 2003)
Individual levelTo measure perceived association between environmental and policy factors and overweight92 items; researcher-administered by phoneN=2,821Reliability – NR; Validity – NR
Race/ethnicity: AA, whiteSex: M/FSexual identity: NRDisability: NRGeographic: Urban
Living and working conditions: Pedestrian infrastructure, aesthetics, facility access, cycling infrastructure, pedestrian/crime/safety, policySociocultural: NRSocioeconomic: Covariates – SES, race; Related variables – employment, education, marital statusLife course exposure: NR
TABLE E-1 Continued
continued

Copyright © National Academy of Sciences. All rights reserved.
Evaluating Obesity Prevention Efforts: A Plan for Measuring Progress
Evaluating Obesity Prevention Efforts348
Tool/Method
Level, purpose, description, sample size, psychometric properties
Population at risk: race/ethnicity; sex; sexual identity; disability; geographic location
Social determinants:living and working conditions; sociocultural; socioeconomic; life course exposure
Observation Tool for Urban Neighborhoods(Caughy et al., 2001)
Community levelTo develop a brief observational method for urban neighborhoods relevant to the health and well-being of families and children45 itemsReliability – test-retest; Validity – construct
Race/ethnicity: AA, white, multiethnicSex: NRSexual identity: NRDisability: NRGeographic: Urban
Living and working conditions: Crime/safety, facility adequacy/appeal, land use, aesthetics/beautificationSociocultural: NRSocioeconomic: Covariates – SES, race; Related variables – income, employment, per capita crime, average household wealthLife course exposure: NR
Neighborhood Environment Walkability Scale (NEWS) and NEWS-Abbrev (NEWS-A) (Cerin et al., 2009)
Individual levelAssess perceived environmental attributes believed to influence PA67 items; self-administered by mailN=912 subjects in 16 neighborhoodsReliability – internal consistency; Validity – construct validity
Racial/ethnicity: AA, AI/AN, Hispanic, Asian, HI/PI, whiteSex: M/FSexual identity: NR Disability: NRGeographic: Urban
Living and working conditions: Street connectivity, crime/safety, aesthetics, land use, population/housing density, pedestrian safety/infrastructureSociocultural: NRSocioeconomic: Covariates – SES, race; Related variables – income, educationLife course exposure: NR
Activity Support Scale for Multiple Groups (ACTS-MG) for Parents of Elementary School-Aged Children(Davison et al., 2011)
Individual levelAdapted tool/method from the Activity Support Scale for use with AA parents, assess behaviors of sports/rec, video, recess, screen time; focus groups to guide development12 items; self-administered or in personN=119 AA and 117 white parentsReliability – internal consistency; Validity – content
Race/ethnicity: AA, whiteSex: M/FSexual identity: NRDisability: NRGeographic: Urban
Living and working conditions: Total environments/locations, after-school/out-of-school youth programs, community/neighborhood as a whole, parks/playground, recreational facility/area, school, transportation infrastructure, youth programsSociocultural: NR Socioeconomic: Related variables – income, educationLife course exposure: NR
TABLE E-1 Continued

Copyright © National Academy of Sciences. All rights reserved.
Evaluating Obesity Prevention Efforts: A Plan for Measuring Progress
349Appendix E
Tool/Method
Level, purpose, description, sample size, psychometric properties
Population at risk: race/ethnicity; sex; sexual identity; disability; geographic location
Social determinants:living and working conditions; sociocultural; socioeconomic; life course exposure
Availability of Recreational Resources(Diez Roux et al., 2007)
Community levelData from a large cohort of adults to investigate availability of recreational resources related to PA levels; GIS protocolN=2,723 adultsReliability – NR; Validity – construct
Race/ethnicity: AA, Hispanic, whiteSex: M/FSexual identity: NRDisability: NRGeographic: Urban/rural
Living and working conditions: Facility access, appeal or quality, crime/safetySociocultural: NRSocioeconomic: Covariates – SES, race; Related variables – incomeLife course exposure: NR
Measures of Walkability and Safety(Doyle et al., 2006)
Community levelMeasurement tool adapted from National Health and Nutrition Examination Survey III – data on individual health parameters in 35 counties compared to county crime and walkabilityItems: NR; researcher-administeredN=9,252 adults across 35 urban countiesReliability – NR; Validity – NR
Race/ethnicity: AA, Hispanic, whiteSex: NRSexual identity: NRDisability: NRGeographic: Urban
Living and working conditions: Street connectivity, pedestrian infrastructure, crime/safetySociocultural: Covariates – social influenceSocioeconomic: Covariates – SES, race; Related variables – income, education, and time living in area Life course exposure: NR
Barriers to Walking for PA(Dunton and Schneider, 2006)
Community level Questions to measure barriers to walking for PA were developed and tested among college students10 items; type of measure: NRN=305 college studentsReliability – test-retest, internal consistency; Validity – criterion, concurrent
Race/ethnicity: Hispanic, Asian, HI/PI, whiteSex: M/FSexual identity: NRDisability: NRGeographic: Urban
Living and working conditions: Total environment, locations, commuteSociocultural: NRSocioeconomic: Related variables – educationLife course exposure: NR
Density, Design, and Diversity Near Home(Epstein et al., 2006)
Community level To determine whether characteristics of neighborhood environment are related to substitution of PA for sedentary behavior; GIS protocolN=58 children 8-15 yrs oldReliability – NR; Validity – construct validity, accelerometer data
Race/ethnicity: AA, Hispanic, whiteSex: M/FSexual identity: NRDisability: NRGeographic: Urban
Living and working conditions: Land use, facility access, street connectivity, population/housing densitySociocultural: NRSocioeconomic: Covariates – SES, race; Related variables – socioeconomic index Life course exposure: NR
TABLE E-1 Continued
continued

Copyright © National Academy of Sciences. All rights reserved.
Evaluating Obesity Prevention Efforts: A Plan for Measuring Progress
Evaluating Obesity Prevention Efforts350
Tool/Method
Level, purpose, description, sample size, psychometric properties
Population at risk: race/ethnicity; sex; sexual identity; disability; geographic location
Social determinants:living and working conditions; sociocultural; socioeconomic; life course exposure
Women and Physical Activity Survey(Evenson et al., 2003)
Individual level To examine the test-retest reliability of a survey designed to measure PA and its correlates among women from diverse racial and ethnic groups13-item survey; researcher-administered by phoneN=344 womenReliability – test-retest; Validity – NR
Race/ethnicity: AA, AI/AN, Hispanic, whiteSex: FemaleSexual identity: NRDisability: NRGeographic: Urban
Living and working conditions: Sense of community, crime, traffic, overall PA environment, sidewalks, exercise places, unattended dogs, street light at nightSociocultural: Covariates – psychological perceptions, social influence Socioeconomic: Covariates – SES, race; Related variables – employment, education, marital statusLife course exposure: NR
Perceived PA Environment(Evenson et al., 2003)
Community levelTo assess physical environmental factors that might be associated with PA in a diverse adult population; Pikora framework51 items; researcher-administered by phoneN=106 adultsReliability – test-retest, internal consistency; Validity – NR
Race/ethnicity: AA, whiteSex: M/FSexual identity: NRDisability: NRGeographic: Urban/rural
Living and working conditions: Crime/safety, pedestrian/traffic safety, facility access, adequacy, aesthetics, land use, pedestrian infrastructure, facility access, availability/proximitySociocultural: NRSocioeconomic: Related variables – employment, educationLife course exposure: NR
TABLE E-1 Continued

Copyright © National Academy of Sciences. All rights reserved.
Evaluating Obesity Prevention Efforts: A Plan for Measuring Progress
351Appendix E
Tool/Method
Level, purpose, description, sample size, psychometric properties
Population at risk: race/ethnicity; sex; sexual identity; disability; geographic location
Social determinants:living and working conditions; sociocultural; socioeconomic; life course exposure
Perceptions of Physical Environmental Factors(Evenson et al., 2003)
Individual level Questionnaire to determine perceptions of physical environment and transportation26 items; self-administeredN=610 6th- and 8th-grade girlsReliability – test-retest, multiple subscales; Validity – construct
Race/ethnicity: AA, AI/AN, Asian, HI/PI, whiteSex: Female Sexual identity: NRDisability: NRGeographic: Urban/rural
Living and working conditions: Crime/safety, pedestrian/traffic safety, facility access, pedestrian infrastructure, aesthetics/beautification Sociocultural: NRSocioeconomic: Covariates – SES, race; Related variables – WIC/school lunch programLife course exposure: NR
Urban Sprawl Index(Ewing et al., 2003)
Community levelAssess relationship between built environment and weightGIS protocolN=6,760 subjects in 954 urban countiesReliability – NR; Validity – NR
Race/ethnicity: AA, Hispanic, whiteSex: M/F Sexual identity: NRDisability: NRGeographic: Urban/rural
Living and working conditions: Street connectivity, crime, population/housing density, sprawl Sociocultural: NRSocioeconomic: Covariates – SES, raceLife course exposure: NR
National Longitudinal Survey of Youth: Diet and Activity Questions(Ewing et al., 2006)
Community levelTo determine if urban sprawl is associated with health, BMI for U.S. youth9 items; researcher-administered questionnaireN=6,760 subjects in 954 countiesReliability – NR; Validity – NR
Race/ethnicity: AA, Hispanic, whiteSex: M/FSexual identity: NRDisability: NRGeographic: NR
Living and working conditions: NR Sociocultural: NRSocioeconomic: NRLife course exposure: NR
TABLE E-1 Continued
continued

Copyright © National Academy of Sciences. All rights reserved.
Evaluating Obesity Prevention Efforts: A Plan for Measuring Progress
Evaluating Obesity Prevention Efforts352
Tool/Method
Level, purpose, description, sample size, psychometric properties
Population at risk: race/ethnicity; sex; sexual identity; disability; geographic location
Social determinants:living and working conditions; sociocultural; socioeconomic; life course exposure
Built Environment Measurements(Frank et al., 2004)
Community levelTo evaluate the relationship between built environment and place of residence, travel patternsN=10,878Reliability – NR; Validity – construct
Race/ethnicity: AA, white Sex: M/FSexual identity: NRDisability: NRGeographic: Urban
Living and working conditions: Total environment, location, community/neighborhood, population/housing density, land use, street connectivity Sociocultural: NRSocioeconomic: Covariates – SES, race; Related variables – income, educationLife course exposure: NR
Walkability Index(Frank et al., 2005)
Community levelObjective measures of the built environment unique to each household’s physical location developed within a GIS to assess land-use mix, residential density, and street connectivity. Measures were then combined into a walkability index; GIS protocolN=357Reliability – NR; Validity – predictive
Race/ethnicity: AA, whiteSex: M/FSexual identity: NRDisability: NRGeographic: Urban
Living and working conditions: Street connectivity, land use, population/housing density Sociocultural: NRSocioeconomic: Covariates – SES, race; Related variables – income, educationLife course exposure: NR
Physical Activity Survey for 5th Graders(Franzini et al., 2009)
Community levelSurvey of environmental characteristics, adopted from the Youth Risk Behavior Survey and the Project on Human Development in Chicago Neighborhoods Community Survey Items: NR; observation and questionnaireN=650 childrenReliability – internal consistency; Validity – NR
Race/ethnicity: AA, Hispanic, whiteSex: M/FSexual identity: NRDisability: NRGeographic: Urban
Living and working conditions: Street connectivity, cycling infrastructure, facility access, adequacy/appeal, population/housing density, crime/safety, aesthetics, urban design qualitiesSociocultural: Covariates – social influence (e.g., parental modeling)Socioeconomic: Covariates – SES, race; Related variables – income, education Life course exposure: NR
TABLE E-1 Continued

Copyright © National Academy of Sciences. All rights reserved.
Evaluating Obesity Prevention Efforts: A Plan for Measuring Progress
353Appendix E
Tool/Method
Level, purpose, description, sample size, psychometric properties
Population at risk: race/ethnicity; sex; sexual identity; disability; geographic location
Social determinants:living and working conditions; sociocultural; socioeconomic; life course exposure
Traffic, Safety, and Social Factors Scales(Franzini et al., 2009)
Community levelTools and methods to investigate the association between physical and social neighborhood environments and 5th-grade students’ PA and obesitySelf-administered and observationN=650 children and caregiversReliability – internal consistency; Validity – NR
Race/ethnicity: AA, Hispanic, whiteSex: M/FSexual identity: NRGeographic: Urban
Living and working conditions: Neighborhood, crime/safety, pedestrian/traffic safety, aesthetics, land use, population/housing density, social environmentSociocultural: Covariates – social influence (e.g., parental modeling)Socioeconomic: Covariates – SES, race; Related variables – income, educationLife course exposure: NR
Home Environment Survey(Gattshall et al., 2008)
Home – individual levelTo validate a survey instrument to assess home environments for PA and healthy eating in overweight children126 items; self-administered questionnaireN=219 children; N=156 parentsReliability – inter-rater, test-retest, internal consistency; Validity – predictive
Race/ethnicity: AA, AI/AN, Hispanic, Asian, whiteSex: M/FSexual identity: NRDisability: NRGeographic: NR
Living and working conditions: Food environment, PA environment, individual diet and PA variablesSociocultural: Covariates – social influence, parental modelingSocioeconomic: Related variables – educationLife course exposure: NR
Perceived Barriers to Physical Activity(Gomez et al., 2004)
Individual levelTo model relationships between outdoor PA and objective violent crime densitiesQuestionnaire items NR; self-administeredN=177 low-income adolescents, 12 to 18 yrs oldReliability – NR; Validity – construct validity, two criterion
Race/ethnicity: AA, Hispanic, whiteSex: M/FSexual identity: NRDisability: NRGeographic: Urban
Living and working conditions: Perceived crime/ safetySociocultural: NRSocioeconomic: Covariates – SES, race; Related variables – incomeLife course exposure: NR
TABLE E-1 Continued
continued

Copyright © National Academy of Sciences. All rights reserved.
Evaluating Obesity Prevention Efforts: A Plan for Measuring Progress
Evaluating Obesity Prevention Efforts354
Tool/Method
Level, purpose, description, sample size, psychometric properties
Population at risk: race/ethnicity; sex; sexual identity; disability; geographic location
Social determinants:living and working conditions; sociocultural; socioeconomic; life course exposure
Measure of Crime and Built Environment(Gomez et al., 2004)
Community levelTo compare PA with crime densities and perception of neighborhood safety and levels of PA; GIS protocolN=177 low-income adolescents, 12 to 18 yrs oldReliability – NR; Validity – construct validity
Race/ethnicity: MultiethnicSex: M/FSexual identity: NRDisability: NRGeographic: Urban
Living and working conditions: Facility access, availability, proximity, crime/safety Sociocultural: NRSocioeconomic: Covariates – SES, race; Related variables – incomeLife course exposure: NR
Physical Activity Facilities(Gordon-Larsen et al., 2006)
Community levelAssess the geographic and social distribution of PA facilities and how disparity in access might underlie population-level PA and overweight patterns; GIS protocolN=20,745 students 12-18 yrs old in 132 schools across 42,857 census blocksReliability – NR; Validity – NR
Race/ethnicity: WhiteSex: M/FSexual identity: NRDisability: NRGeographic: NR
Living and working conditions: Facility access, availability, proximitySociocultural: NRSocioeconomic: Covariates: SES, race; Related variables –education, population densityLife course exposure: NR
Perceived Physical Competence and Social Support for Physical Activity Scales for 14 Year Olds(Graham et al., 2011)
Individual levelMeasurement of access to environmental PA resources moderates the relationship between psychosocial resources (social support and perceived competence) and PA 16 items; self-administeredN=130 subjects 12-18 yrs oldReliability – NR; Validity – NR
Race/ethnicity: AA, Asian, whiteSex: M/FSexual identity: NRDisability: NRGeographic: Urban
Living and working conditions: NRSociocultural: NRSocioeconomic: Related variables – incomeLife course exposure: NR
TABLE E-1 Continued

Copyright © National Academy of Sciences. All rights reserved.
Evaluating Obesity Prevention Efforts: A Plan for Measuring Progress
355Appendix E
Tool/Method
Level, purpose, description, sample size, psychometric properties
Population at risk: race/ethnicity; sex; sexual identity; disability; geographic location
Social determinants:living and working conditions; sociocultural; socioeconomic; life course exposure
Environmental Features Linked to Physical Activity for 14 Year Olds(Graham et al., 2011)
Community levelTo determine access to environmental PA resources moderates the relationship between psychosocial resources (social support and perceived competence) and PA Construction of tool/method from existing dataN=192 adolescentsReliability – NR; Validity – NR
Race/ethnicity: AA, Asian, whiteSex: NRSexual Identity: NRDisability: NRGeographic: NR
Living and working conditions: PA environment variables, facility access, pedestrian infrastructureSociocultural: Covariates – self-efficacy, beliefs, preferencesSocioeconomic: Related variables – incomeLife course exposure: NR
Neighborhood Parks and Squares in Curitiba, Brazil(Hino et al., 2010)
Community levelDirect observation of parks and squares in differing SES neighborhoods to determine PA and demographics of usersGIS protocol; sample size – NRReliability – NR; Validity – NR
Race/ethnicity: HispanicSex: M/FSexual identity: NRDisability: NRGeographic: Urban
Living and working conditions: Cycling infrastructure, facility access, adequacy/appeal or quality, population/housing density, open space/greenness Sociocultural: NRSocioeconomic: Covariates – SES, race; Related variables – incomeLife course exposure: NR
Neighborhood Environment and Access(Huston et al., 2003)
Community levelAdapted tool/measure to examine associations between perceived neighborhood characteristics, access to places for activity, and leisure-time PA, derived from Behavioral Risk Factor Surveillance System133 items; phone interviewN=1,796 subjects located in 6 counties in North CarolinaReliability – inter-rater; Validity – criterion
Race/ethnicity: AA, AI/AN, whiteSex: M/FSexual identity: NRDisability: NRGeographic: NR
Living and working conditions: Pedestrian traffic safety, infrastructure, street lights, unattended dogs Sociocultural: NRSocioeconomic: Covariates – SES, race; Related variables – income, educationLife course exposure: NR
TABLE E-1 Continued
continued

Copyright © National Academy of Sciences. All rights reserved.
Evaluating Obesity Prevention Efforts: A Plan for Measuring Progress
Evaluating Obesity Prevention Efforts356
Tool/Method
Level, purpose, description, sample size, psychometric properties
Population at risk: race/ethnicity; sex; sexual identity; disability; geographic location
Social determinants:living and working conditions; sociocultural; socioeconomic; life course exposure
Physical Activity Environment, Healthy Environment Partnership (HEP) Survey(Israel et al., 2006)
Individual levelTo delineate the manner in which urban environments reflect broader social processes, such as those creating racially, ethnically, and economically segregated communities with vast differences in aspects of the built environment, opportunity structures, social environments, and environmental exposuresN=57 focus groupsReliability – NR; Validity – NR
Race/ethnicity: AA, Hispanic, whiteSex: M/FSexual identity: NRDisability: NRGeographic: Urban
Living and working conditions: NRSociocultural: Perceived stressorsSocioeconomic: Related variables – incomeLife course exposure: NR
Habitual Activity Questionnaire(Kimm et al., 2000)
Individual levelTo develop and use two self-report methods and an objective measure to assess longitudinal changes in PA in a large bi-ethnic cohort of young girls from childhood through adolescenceNumber of items: NR; self-, third-party-, researcher-administeredN=2,379 AA and white girls 9-10 to 18-19 yrs oldReliability – NR; Validity – criterion
Race/ethnicity: AA, whiteSex: FemaleSexual identity: NRDisability: NRGeographic: NR
Living and working conditions: NR Sociocultural: NRSocioeconomic: NRLife course exposure: NR
Census-Based and Land-Use Measures of the Environment(King et al., 2005)
Community levelTo identify objectively measured attributes of the neighborhood environment that may be associated with PA levels in older women; GIS protocolN=158 womenReliability – NR; Validity – construct
Race/ethnicity: AA, whiteSex: FemaleSexual identity: NRDisability: NRGeographic: Urban
Living and working conditions: Facility access, availability, proximity, median year homes built was used to capture general differences in street design, land use Sociocultural: NRSocioeconomic: Covariates – SES, race; Related variables – employment, education, marital statusLife course exposure: NR
TABLE E-1 Continued

Copyright © National Academy of Sciences. All rights reserved.
Evaluating Obesity Prevention Efforts: A Plan for Measuring Progress
357Appendix E
Tool/Method
Level, purpose, description, sample size, psychometric properties
Population at risk: race/ethnicity; sex; sexual identity; disability; geographic location
Social determinants:living and working conditions; sociocultural; socioeconomic; life course exposure
Availability and Quality of Local Parks(Kipke et al., 2007)
Community levelTo examine how environmental factors may be associated with increased risk for obesity; GIS protocol Researcher-administered, direct observationN=1,803 subjects 18-59 yrs oldReliability – inter-rater; Validity – NR
Race/ethnicity: HispanicSex: M/F Sexual identity: NRDisability: NRGeographic: Urban
Living and working conditions: Pedestrian infrastructure, land use, aesthetics, facility adequacy, crime/safetySociocultural: NRSocioeconomic: Covariates – SES, race; Related variables – income, educationLife course exposure: NR
Physical Activity Environment Measures(Kirtland et al., 2003)
Individual levelSurvey of perceived environmental characteristics and correlated to objective environmental measures to determine validity and reliability; correlated with GIS26 items; researcher-administered by phone N=1,112 adultsReliability – test-retest; Validity – predictive
Race/ethnicity: AA, whiteSex: M/FSexual identity: NRDisability: NRGeographic: Urban
Living and working conditions: Perceptions of crime/safety, pedestrian/traffic safety, facility access, adequacy/appeal, pedestrian infrastructure, social environmentSociocultural: NRSocioeconomic: Related variables – income, educationLife course exposure: NR
Walking Suitability Score(Lee et al., 2008)
Community levelTo examine the usefulness of applying a walking suitability assessment to geographic area around schools11 items; sample size = NRReliability – NR; Validity – construct
Race/ethnicity: AA, AI/AN, Hispanic, Asian, whiteSex: M/FSexual identity: NRDisability: NRGeographic: Urban
Living and working conditions: Pedestrian, traffic, infrastructureSociocultural: NRSocioeconomic: Related variables – WIC/school lunch participationLife course exposure: NR
Perceived Natural Environment(McGinn et al., 2007a)
Individual levelAdapted from 2001 BRFSS module–perceived measures of natural environment and PA; Questionnaire and GIS protocolResearcher-administeredN=1,482 adultsReliability – test-retest; Validity – criterion
Race/ethnicity: AA, Hispanic, whiteSex: M/FSexual identity: NRDisability: NRGeographic: Statewide
Living and working conditions: Weather, trees, exhaust fumes/pollutionSociocultural: NRSocioeconomic: Covariates – SES, raceLife course exposure: NR
TABLE E-1 Continued
continued

Copyright © National Academy of Sciences. All rights reserved.
Evaluating Obesity Prevention Efforts: A Plan for Measuring Progress
Evaluating Obesity Prevention Efforts358
Tool/Method
Level, purpose, description, sample size, psychometric properties
Population at risk: race/ethnicity; sex; sexual identity; disability; geographic location
Social determinants:living and working conditions; sociocultural; socioeconomic; life course exposure
Street Connectivity and Traffic Measures(McGinn et al., 2007b)
Community levelSurvey to describe associations between perceptions and objective measures of the built environment and their associations with leisure, walking, and transportation activity; questionnaire and GIS protocolN=1,270 telephone surveysReliability – NR; Validity – predictive, concurrent
Race/ethnicity: AA, whiteSex: NR Sexual identity: NRDisability: NRGeographic: Urban
Living and working conditions: Street connectivity, pedestrian/traffic safety, infrastructure, sidewalksSociocultural: NRSocioeconomic: Covariates – SES, raceLife course exposure: NR
Crime and Safety Index(McGinn et al., 2008)
Individual levelTo compare perceived area crime, objectively measured to assess for correlation6 items; Researcher-administered by phoneN=1,658 adultsReliability – test-retest; Validity – concurrent
Race/ethnicity: AA, whiteSex: M/FSexual identity: NRDisability: NRGeographic: Urban/rural
Living and working conditions: Crime/safetySociocultural: NRSocioeconomic: Covariates – SES, race; Related variables – income, educationLife course exposure: NR
Objective Measures of Crime(McGinn et al., 2008)
Community levelTo compare measures of perceived crime with observed crime and examine association between independent and combined effects of objective and perceived crime on PA; GIS protocolItems: NRN=303Reliability – NR; Validity – concurrent
Race/ethnicity: AA, whiteSex: M/FSexual identity: NRDisability: NRGeographic: Urban
Living and working conditions: Crime/safetySociocultural: NRSocioeconomic: Covariates – SES, race; Related variables – income, educationLife course exposure: NR
TABLE E-1 Continued

Copyright © National Academy of Sciences. All rights reserved.
Evaluating Obesity Prevention Efforts: A Plan for Measuring Progress
359Appendix E
Tool/Method
Level, purpose, description, sample size, psychometric properties
Population at risk: race/ethnicity; sex; sexual identity; disability; geographic location
Social determinants:living and working conditions; sociocultural; socioeconomic; life course exposure
Family Health Behavior Scale of 5-12 year olds(Moreno et al., 2011)
Individual levelTo develop a psychometrically sound, parent-report measure of family and child behaviors related to obesity in children27 items; self-administeredN=47 children 5-12 yrs oldReliability – test retest, internal consistency; Validity – concurrent
Race/ethnicity: AA, Hispanic, Asian, whiteSex: M/FSexual identity: NRDisability: NRGeographic: NR
Living and working conditions: NRSociocultural: Covariates – social influence (e.g., parental modeling) Socioeconomic: Covariates – SES levelsLife course exposure: NR
Neighborhood Characteristics Measure(Nelson et al., 2006)
Community levelAdapted from National Longitudinal Study of Adolescent Health (1994-1995) to determine patterning of neighborhood characteristics, beyond basic urban, rural, suburban trichotomy, and its impact on PA and overweight; GIS protocolN=20,745 students 12-18 yrs old in 132 schoolsReliability – NR; Validity – NR
Race/ethnicity: AA, Hispanic, Asian, whiteSex: M/FSexual identity: NRDisability: NRGeographic: Urban/rural/ suburban
Living and working conditions: Street connectivity, crime, pedestrian infrastructure, family access, comparison of weight and PA survey data to subject neighborhood characteristics Sociocultural: NRSocioeconomic: Covariates – SES, race; Related variables – educationLife course exposure: NR
Measure of Community Design and Access to Recreational Facilities(Norman et al., 2006)
Community levelTo establish neighborhood-level environmental features and their association with adolescent PA and weight status, PA correlated with GIS analysis of surrounding environment; GIS protocolN=799 subjects 6-18 yrs oldReliability – NR; Validity – NR
Race/ethnicity: AA, AI/AN, Hispanic, Asian, whiteSex: NRSexual identity: NRDisability: NRGeographic: Urban
Living and working conditions: Street connectivity, facility access, land use, population/housing density, pedestrian infrastructure, retail floor area and walkability indexSociocultural: NRSocioeconomic: Covariates – SES, race; Related variables – educationLife course exposure: NR
TABLE E-1 Continued
continued

Copyright © National Academy of Sciences. All rights reserved.
Evaluating Obesity Prevention Efforts: A Plan for Measuring Progress
Evaluating Obesity Prevention Efforts360
Tool/Method
Level, purpose, description, sample size, psychometric properties
Population at risk: race/ethnicity; sex; sexual identity; disability; geographic location
Social determinants:living and working conditions; sociocultural; socioeconomic; life course exposure
Neighborhood Environment GIS Characteristics(Roemmich et al., 2007)
Community level To determine whether the neighborhood environment or number of televisions in home environment are independently associated with child PA and television time; GIS protocolN=78Reliability – NR; Validity – NR
Race/ethnicity: AA, white, multiethnic Sex: NRSexual identity: NRDisability: NRGeographic: NR
Living and working conditions: Pedestrian/traffic safety, facility access, population/housing density, street width/connectivity, land useSociocultural: NRSocioeconomic: Covariates – SES, race; Related variables – employment/unemploymentLife course exposure: NR
Neighborhood Hazards(Romero et al., 2001)
Individual levelQuestionnaire measuring child’s perception of hazards8 itemsN=796 studentsReliability – NR; Validity – NR
Race/ethnicity: AA, Hispanic, Asian, HI/PI, whiteSex: M/FSexual identity: NRDisability: NRGeographic: NR
Living and working conditions: Crime/safetySociocultural: NRSocioeconomic: Covariates – SES, race; Related variables – education, SES based on occupationLife course exposure: NR
Neighborhood Inventory of Environmental Typology (NIfETy) Method for Urban Children (Rossen et al., 2011)
Individual levelSurvey of parents and children on walking practices, analysis of environment for safety, using measure adapted from the Multiple Opportunities to Reach Excellence (2007) objective structured inventory 78 itemsN=365 subjects 6-18 yrs oldReliability – NR; Validity – NR
Race/ethnicity: AA, AI/AN, Hispanic, Asian, white, multiethnicSex: M/FSexual identity: NRDisability: NRGeographic: Urban
Living and working conditions: Crime/safety, neighborhood activities, adult activity, youth activity, physical disorderSociocultural: Social environmentSocioeconomic: Covariates – SES, race; Related variables – income, education, employment status, WIC/school lunch programLife course exposure: NR
TABLE E-1 Continued

Copyright © National Academy of Sciences. All rights reserved.
Evaluating Obesity Prevention Efforts: A Plan for Measuring Progress
361Appendix E
Tool/Method
Level, purpose, description, sample size, psychometric properties
Population at risk: race/ethnicity; sex; sexual identity; disability; geographic location
Social determinants:living and working conditions; sociocultural; socioeconomic; life course exposure
Built Environment Characteristics(Rundle et al., 2007)
Community level To examine whether urban form is associated with body size within a densely settled city; GIS protocolN=13,102 Reliability – NR; Validity – construct
Race/ethnicity: AA, Hispanic, Asian, whiteSex: NRSexual identity: NRDisability: NRGeographic: Urban
Living and working conditions: Street connectivity, land use, population/housing density, access to public transportationSociocultural: NRSocioeconomic: Covariates – SES, race; Related variables – income, educationLife course exposure: NR
Neighborhood Environment Walkability Scale (NEWS)(Saelens et al., 2003)
Individual level To assess walkability of environment and self-reported PA, weight, and height68 items; questionnaireN=107 adults in 2 neighborhoodsReliability – test-retest; Validity – concurrent
Race/ethnicity: AA, Hispanic, Asian, whiteSex: M/F Sexual identity: NRDisability: NRGeographic: Urban
Living and working conditions: Perceived street connectivity, crime/safety, pedestrian traffic safety, cycling infrastructure, aesthetics, land use, pedestrian infrastructure, population/housing density Sociocultural: NRSocioeconomic: Related variables – educationLife course exposure: NR
Perceived Access to Recreational Facilities(Scott et al., 2007)
Individual levelTo examine the relationship between number and proximity of objectively measured PA facilities and perceptions and compare objective and self-report measures as predictors of PAItems: NR; self- or researcher-administeredN=1,367 6th-grade girls who participated in the Trial of Activity for Adolescent Girls (TAAG) Reliability – NR; Validity – predictive
Race/ethnicity: AA, Hispanic, whiteSex: Female Sexual identity: NRDisability: NRGeographic: NR
Living and working conditions: Facility access Sociocultural: NRSocioeconomic: Covariates – SES, raceLife course exposure: NR
TABLE E-1 Continued
continued

Copyright © National Academy of Sciences. All rights reserved.
Evaluating Obesity Prevention Efforts: A Plan for Measuring Progress
Evaluating Obesity Prevention Efforts362
Tool/Method
Level, purpose, description, sample size, psychometric properties
Population at risk: race/ethnicity; sex; sexual identity; disability; geographic location
Social determinants:living and working conditions; sociocultural; socioeconomic; life course exposure
Physical Activity and Media Inventory (PAMI)(Sirard et al., 2008)
Individual levelTo comprehensively reflect the availability and accessibility of PA and screen media equipment in the home environment61 items; self- or researcher-administered, in-person or mailN=31 adultsReliability – test-retest; Validity – criterion
Race/ethnicity: AA, AI/AN, Hispanic, Asian, white, multiethnicSex: M/FSexual identity: NRDisability: NRGeographic: Urban
Living and working conditions: Perceived facility access, adequacy/appeal or quality, objective review of number of rooms, PA media equipment Sociocultural: NRSocioeconomic: Related variables – education, home ownership valuesLife course exposure: NR
Neighborhood Facility Availability and Accessibility Measure(Spivock et al., 2007)
Community levelTo describe extent to which environmental supports (buoys) promoting active living among individuals with disabilities are present in neighborhoods located in a large urban area, examine association between presence of buoys and neighborhood-level indicators of affluence, proportions of individuals w/disabilities living in the neighborhood, and other active living indicators18-item survey; researcher-administered, direct observationN=112 neighborhoodsReliability – inter-rater; Validity – construct
Race/ethnicity: NRSex: NRSexual identity: NRDisability: YesGeographic: Urban
Living and working conditions: Pedestrian/traffic safety, cycling infrastructure, facility adequacy, pedestrian infrastructure, crime/safety, aesthetics/beautificationSociocultural: NRSocioeconomic: Covariates – SES, raceLife course exposure: NR
TABLE E-1 Continued

Copyright © National Academy of Sciences. All rights reserved.
Evaluating Obesity Prevention Efforts: A Plan for Measuring Progress
363Appendix E
Tool/Method
Level, purpose, description, sample size, psychometric properties
Population at risk: race/ethnicity; sex; sexual identity; disability; geographic location
Social determinants:living and working conditions; sociocultural; socioeconomic; life course exposure
Knowledge, Attitudes, and Behaviors in American Indian Children(Stevens et al., 1999)
Individual levelTo develop a culturally sensitive, age-appropriate questionnaire to assess PA, diet, weight-related attitudes, and cultural identity130-item questionnaire; in person, self-administeredN=371 school children 6-11 yrs oldReliability – test-retest; Validity – NR
Race/ethnicity: AI/ANSex: M/FSexual identity: NRDisability: NRGeographic: Urban
Living and working conditions: Modeling of PA environment and barriers Sociocultural: Weight-related attitudes, culture; Covariates – knowledge, psychological factors (e.g., self-efficacy, beliefs, preferences), social influence (e.g., parent modeling)Socioeconomic: NRLife course exposure: NR
Measures of Sidewalk Maintenance(Williams et al., 2005)
Individual levelTo develop and test objective tool to measure sidewalk maintenanceN=5 items; Sample size = NR; researcher-administeredReliability – Inter-rater; Validity – NR
Race/ethnicity: AA, AI/AN, Asian, HI/PI, whiteSex: M/FSexual identity: NRDisability: NRGeographic: Urban
Living and working conditions: Pedestrian infrastructureSociocultural: NRSocioeconomic: NRLife course exposure: NR
Community Resource Accessibility Index (CRAI)(Witten et al., 2003)
Community level To develop an area-based index of locational access to community services, facilities, and amenities; GIS protocolSample size = NRReliability – NR; Validity – face
Race/ethnicity: HI/PI, whiteSex: NRSexual identity: NRDisability: NRGeographic: Urban
Living and working conditions: Objective measure of facility access, adequacy/appeal or quality/type of facility, availability/access to foodSociocultural: NRSocioeconomic: Covariates – SES, race; Related variables – incomeLife course exposure: NR
TABLE E-1 Continued
continued

Copyright © National Academy of Sciences. All rights reserved.
Evaluating Obesity Prevention Efforts: A Plan for Measuring Progress
Evaluating Obesity Prevention Efforts364
Tool/Method
Level, purpose, description, sample size, psychometric properties
Population at risk: race/ethnicity; sex; sexual identity; disability; geographic location
Social determinants:living and working conditions; sociocultural; socioeconomic; life course exposure
Park Area and Recreation Programs for Southern California Communities(Wolch et al., 2011)
Community levelTo assess how proximity to parks and recreational resources affects development of childhood obesity through a longitudinal study; GIS protocol, construction of measure from existing dataN=3,173 children 9-10 yrs oldReliability – NR; Validity – NR
Race/ethnicity: AA, Hispanic, Asian, whiteSex: M/FSexual identity: NRDisability: NRGeographic: Urban
Living and working conditions: Crime/safetySociocultural: NRSocioeconomic: Related variables – Income, employment statusLife course exposure: Subjects followed 8 years
Park Area and Recreation Programs for Southern California Communities(Wolch et al., 2011)
Community levelTo assess how proximity to parks and recreational resources affects development of childhood obesity through a longitudinal study; GIS protocol, construction of measure from existing dataN=3,173 children 9-10 yrs oldReliability – NR; Validity – NR
Race/ethnicity: AA, Hispanic, Asian, whiteSex: M/FSexual identity: NRDisability: NRGeographic: Urban
Living and working conditions: Crime/safetySociocultural: NRSocioeconomic: Related variables – income, employment statusLife course exposure: Subjects followed 8 years
HABITS Questionnaire(Wright et al., 2011)
Individual levelTo establish convergent validity and reliability for a quick simple measure of food intake and PA/sedentary behavior19 itemsN=35 children 7-16 yrs oldReliability – test retest; Validity – criterion
Race/ethnicity: AA, HispanicSex: M/FSexual identity: NRDisability: NRGeographic: Urban/rural
Living and working conditions: NRSociocultural: NRSocioeconomic: NRLife course exposure: NR
NOTES: AA = African American, AI = American Indian; AN = Alaska Native; BMI = body mass index; F = female; GIS = geographic infor-mation systems; HI/PI = Hawaiian/Pacific Islander; M = male; NR = not relevant; PA = physical activity; SES = socioeconomic status; WIC = Special Supplemental Nutrition Program for Women, Infants, and Children
TABLE E-1 Continued

Copyright © National Academy of Sciences. All rights reserved.
Evaluating Obesity Prevention Efforts: A Plan for Measuring Progress
365Appendix E
TABLE E-2 Food and Beverage Environment Measurement Tools and Research Methods
Tool/Method
Level, purpose, description, sample size, psychometric properties
Population at risk: race/ethnicity; sex; sexual identity; disability; geographic location
Social determinants:living and working conditions; sociocultural; socioeconomic; life course exposure
Grocery Store Manager Questionnaire(Abarca and Ramachandran, 2005)
Individual levelTo develop an interview for administration to grocery store managers in communities along the Arizona-Mexico border 26 questions; in-person interview, delivery in English/SpanishNumber of subjects: NRReliability – NR; Validity – NR
Race/ethnicity: HispanicSex: NRSexual identity: NRDisability: NRGeographic: NR
Living and working conditions: Total and grocery store environment and access to low-fat foods, whole grains, low-fat dairy, meat, fish, poultry, eggs, Equal sweetener, juice, jello, salt/substituteSociocultural: NRSocioeconomic: NRLife course exposure: NR
Measure of Access to Fruits and Vegetables(Algert et al., 2006)
Community levelTo examine the extent to which food pantry clients live within reasonable walking distance of stores carrying fresh produceExisting data; items not includedN=3,985 food pantry clients and 84 food stores Reliability – NR; Validity – NR
Race/ethnicity: AA, AI/AN, Hispanic, Asian, white Sex: NRSexual identity: NRDisability: NRGeographic: NR
Living and working conditions: Availability/access to foods across multiple environmentsSociocultural: NRSocioeconomic: Covariates – food security/insecurity; Related variables – income, educationLife course exposure: NR
Thrifty Food Plan (TFP)(Andrews et al., 2001)
Community levelTo assess whether food is available and affordable in a community by determining how much a family would have to spend in local area stores to buy a specific set of relatively lower-cost foods that make up a nutritious diet68 items; self-administered or researcher-administeredN=NRReliability – NR; Validity – NR
Race/ethnicity: NRSex: NRSexual identity: NRDisability: NRGeographic: Urban
Living and working conditions: Availability/access to a variety of foodsSociocultural: NRSocioeconomic: Affordability/pricing; Related variables – income, WIC/school lunch programLife course exposure: NR
continued

Copyright © National Academy of Sciences. All rights reserved.
Evaluating Obesity Prevention Efforts: A Plan for Measuring Progress
Evaluating Obesity Prevention Efforts366
Tool/Method
Level, purpose, description, sample size, psychometric properties
Population at risk: race/ethnicity; sex; sexual identity; disability; geographic location
Social determinants:living and working conditions; sociocultural; socioeconomic; life course exposure
GIS Measures of Accessibility and Cluster Analysis of Geographic Accessibility to Grocery Stores(Apparicio et al., 2007)
Community levelTo identify food deserts in socially deprived areas within cities with poor access to food retailers; Based on three measures of accessibility to supermarkets calculated using GISExisting data; Items – NR; Assessment of Montreal, including proximity, diversity, and variety in terms of food and prices Reliability – NR; Validity – NR
Race/ethnicity: NRSex: NRSexual identity: NRDisability: NRGeographic: Urban
Living and working conditions: Availability/access to foods via supermarkets Sociocultural: NRSocioeconomic: Covariates – SES, race; Related variables – predominately low income, employment/unemployment, areas of poverty, educationLife course exposure: NR
Availability of Large Supermarkets(Ball et al., 2006)
Community levelTo test the contribution of individual, social, and environmental factors to mediating SES inequalities in fruit/vegetable consumption among women; GIS protocolN=45 neighborhoods, 3,547 womenReliability – NR; Validity – NR
Race/ethnicity: NRSex: Female Sexual identity: NRDisability: NRGeographic: NR
Living and working conditions: Fruits/vegetable availability Sociocultural: Covariates – psychological factors (self-efficacy, beliefs, preferences) and social influence (parent modeling)Socioeconomic: Covariates – SES, race; Related variables – educationLife course exposure: NR
Home Fruit and Vegetable Availability Interview(Baranowski et al., 2006)
Individual levelTo assess the psychometric characteristics of new scales of shopping practices and social support for purchasing fruits and vegetablesItems – NR; researcher-administeredN=166 food shoppers with children at home Reliability – test-retest, internal consistency; Validity – construct
Race/ethnicity: AA, Hispanic, whiteSex: NRSexual identity: NRDisability: NRGeographic: Urban
Living and working conditions: Purchasing habits, label readingSociocultural: NRSocioeconomic: Related variables – educationLife course exposure: NR
TABLE E-2 Continued

Copyright © National Academy of Sciences. All rights reserved.
Evaluating Obesity Prevention Efforts: A Plan for Measuring Progress
367Appendix E
continued
Tool/Method
Level, purpose, description, sample size, psychometric properties
Population at risk: race/ethnicity; sex; sexual identity; disability; geographic location
Social determinants:living and working conditions; sociocultural; socioeconomic; life course exposure
Survey on Purchasing Fruits and Vegetables(Baranowski et al., 2007)
Individual levelTo validate four scales – outcome expectancies for purchasing fruit and for purchasing vegetables, and comparative outcome expectancies for purchasing fresh fruit and for purchasing fresh vegetables versus other forms of fruit and vegetables 72 items; researcher-administeredN=161Reliability – test-retest, internal consistency; Validity – NR
Race/ethnicity: AA, Hispanic, whiteSex: NRSexual identity: NRDisability: NRGeographic: Urban
Living and working conditions: Availability, accessSociocultural: NRSocioeconomic: Related variables – educationLife course exposure: NR
Questionnaire on Influences on Fruit, Juice, and Vegetable (FJV) Availability(Baranowski et al., 2008)
Individual levelA scale for home fruit/juice/vegetable pantry management practices was generated from focus group discussions with diverse 162 food shoppers24 items; researcher-administered focus groupsN=122 adultsReliability – NA; Validity – construct
Race/ethnicity: AA, Hispanic, whiteSex: NRSexual identity: NRDisability: NRGeographic: Urban
Living and working conditions: NRSociocultural: Covariates – social influence (e.g., parental modeling)Socioeconomic: Covariates – SES, raceLife course exposure: NR
Home Fruit, Juice, and Vegetables Pantry Management Practices Survey Instruments(Baranowski et al., 2008)
Individual level–home environmentTo develop a scale for home FJV pantry management practices generated from focus group discussions with food shoppers 24 items; self-administered by phoneN=171 food shoppersReliability – test-retest; Validity – construct
Race/ethnicity: AA, Hispanic, whiteSex: NRSexual identity: NRDisability: NRGeographic: NR
Living and working conditions: Home availability and access to FJVSociocultural: Covariates – social influence (e.g., parental modeling) Socioeconomic: Related variables – educationLife course exposure: NR
TABLE E-2 Continued

Copyright © National Academy of Sciences. All rights reserved.
Evaluating Obesity Prevention Efforts: A Plan for Measuring Progress
Evaluating Obesity Prevention Efforts368
Tool/Method
Level, purpose, description, sample size, psychometric properties
Population at risk: race/ethnicity; sex; sexual identity; disability; geographic location
Social determinants:living and working conditions; sociocultural; socioeconomic; life course exposure
Home Foods Availability Survey(Befort et al., 2006)
Individual level–home environmentTo explore home food availability and common settings of food consumption as correlates of fruit, vegetable, and fat intake among a sample of non-Hispanic black and white adolescents45 items; third-party-administeredN=144 adolescents and their parentsReliability – NR; Validity – NA
Race/ethnicity: AA, whiteSex: NRSexual identity: NRDisability: NRGeographic: NR
Living and working conditions: Home availability and access to fruit and vegetables, fat foodsSociocultural: Covariates – social influence Socioeconomic: Covariates – SES, race; Related variables – educationLife course exposure: NR
Block Urban Area Market Basket Survey(Block and Kouba, 2006)
Community levelThe U.S. Department of Agriculture standard market basket survey and methodology were modified to characterize the food landscape of an inner-city AA neighborhood and its mixed-race suburban neighbor; detailed analysis focuses on the relationship between community store mix, price, availability, produce qualityEnvironmental observation; researcher-administeredN=134 surveys of retail food stores in Austin and Oak Park, IllinoisReliability – NR; Validity – NR
Race/ethnicity: AA, white, multiethnicSex: NRSexual identity: NRDisability: NRGeographic: Urban
Living and working conditions: Availability and access to fruit and vegetablesSociocultural: NRSocioeconomic: Covariates – pricing or cost variables; Related variables – incomeLife course exposure: NR
Fast Food Restaurant Density (FFRD) GIS Analysis(Block et al., 2004)
Community levelTo determine the geographic distribution of fast food restaurants relative to neighborhood socio-demographics; GIS protocolN=155Reliability – NR; Validity – NR
Race/ethnicity: AASex: NRSexual identity: NRDisability: NRGeographic: Urban
Living and working conditions: Availability and access to foods Sociocultural: NRSocioeconomic: Covariates – SES, race; Related variables – incomeLife course exposure: NR
TABLE E-2 Continued

Copyright © National Academy of Sciences. All rights reserved.
Evaluating Obesity Prevention Efforts: A Plan for Measuring Progress
369Appendix E
continued
Tool/Method
Level, purpose, description, sample size, psychometric properties
Population at risk: race/ethnicity; sex; sexual identity; disability; geographic location
Social determinants:living and working conditions; sociocultural; socioeconomic; life course exposure
Child Feeding Questionnaire (CFQ)(Boles et al., 2010)
Individual levelTo examine the factor structure for three of the CFQ subscales, a widely used measure of parental feeding practices 31 itemsN=296 low-income parents of AA preschool childrenReliability – internal consistency; Validity – NR
Race/ethnicity: AASex: Female Sexual identity: NRDisability: NRGeographic: Urban
Living and working conditions: NR Sociocultural: NRSocioeconomic: Covariates – SES; Related variables – WIC/school lunch programLife course exposure: NR
Healthy Home Survey(Bryant et al., 2008)
Individual levelTo develop a survey to assess characteristics of the home environment21 items; researcher- or self-administeredN=85 families with at least 1 child between 3-8 yrs old; N=45 for repeat testingReliability – inter-rater; Validity – criterion
Race/ethnicity: AA, whiteSex: M/FSexual identity: NRDisability: NRGeographic: NR
Living and working conditions: Availability, access, policy/practice, meals together, facility adequacy and quality of home/building environment Sociocultural: NRSocioeconomic: Related variables – incomeLife course exposure: NR
Menu Checklist on Healthy Choice Cues(Cassady et al., 2004)
Individual level–community assessmentTo develop and test menu checklist to assess cues for healthy choices in restaurants31 itemsN=NRReliability – inter-rater; Validity – NR
Race/ethnicity: AASex: NRSexual identity: NRDisability: NRGeographic: Urban
Living and working conditions: Labeling, point of purchase, food quality at restaurants Sociocultural: NRSocioeconomic: NRLife course exposure: NR
TABLE E-2 Continued

Copyright © National Academy of Sciences. All rights reserved.
Evaluating Obesity Prevention Efforts: A Plan for Measuring Progress
Evaluating Obesity Prevention Efforts370
Tool/Method
Level, purpose, description, sample size, psychometric properties
Population at risk: race/ethnicity; sex; sexual identity; disability; geographic location
Social determinants:living and working conditions; sociocultural; socioeconomic; life course exposure
Neighborhood Food Expenditures for 10 to 14 Year Olds(Dennisuk et al., 2011)
Individual levelTo investigate food purchasing behaviors of low-income, urban AA youth using Youth Impact Questionnaire (YIQ)Items – NR; researcher-administered interviewsN=237 low-income households, child and caregiverReliability – NR; Validity – NR
Race/ethnicity: AASex: M/FSexual identity: NRDisability: NRGeographic: Urban
Living and working conditions: Availability/access to foods via convenience/corner, limited service/fast food, recreational and other food facilities Sociocultural: NRSocioeconomic: Covariates – pricing or cost variables; Related variables – income, education, employment/unemployment, program participation (e.g., WIC, reduced school meals), household size Life course exposure: NR
Community and Home Food Environments for 5 to 18 Year Olds(Ding et al., 2012)
Community levelTo determine reliability of new food environment measures; association between home food environment and fruit and vegetable intake/community and home food environment20 items; self- or third-party-administered N=458 adolescents and parentsReliability – internal consistency; Validity – NR
Race/ethnicity: AA, Hispanic, whiteSex: M/FSexual identity: NRDisability: NRGeographic: NR
Living and working conditions: Access/availability to convenience/corner stores, farmers market, restaurant, grocery stores/home/neighborhoodSociocultural: NRSocioeconomic: Related variables – incomeLife course exposure: NR
Price and Availability Indices of Healthy Food(Donkin et al., 2000)
Community levelTo develop and map indices to illustrate variation in the cost and availability of healthy foodAdministered in personN=194 items; N=199 outletsReliability – NR; Validity – NR
Race/ethnicity: AA, whiteSex: NRSexual identity: NRDisability: NRGeographic: NR
Living and working conditions: Availability/access to food environment, convenience/corner stores, restaurants, grocery/supermarket, Sociocultural: NRSocioeconomic: Food pricing; Covariates – SES, race; Related variables – incomeLife course exposure: NR
TABLE E-2 Continued

Copyright © National Academy of Sciences. All rights reserved.
Evaluating Obesity Prevention Efforts: A Plan for Measuring Progress
371Appendix E
continued
Tool/Method
Level, purpose, description, sample size, psychometric properties
Population at risk: race/ethnicity; sex; sexual identity; disability; geographic location
Social determinants:living and working conditions; sociocultural; socioeconomic; life course exposure
GIS Mapping of Indices(Donkin et al., 2000)
Community levelTo develop and map indices to illustrate variation in cost and availability of healthy food; Existing dataN=199 outlets in contiguous wards of LondonReliability – NR; Validity – NR
Race/ethnicity: AA, whiteSex: NRSexual identity: NRDisability: NRGeographic: NR
Living and working conditions: Availability/access to food environment including supermarket, grocery, convenience/corner Sociocultural: NRSocioeconomic: Affordability/pricing; Covariates – SES, race; Related variables – incomeLife course exposure: NR
Self-Reported Neighborhood Characteristics(Echeverria et al., 2004)
Community levelTo estimate the reliability of a questionnaire measuring various self-reported measures of the neighborhood environment of possible relevance to cardiovascular diseaseResearcher-administered face-to-face interviewsN=12 items; N=48 participantsReliability – test-retest; Validity – NR
Race/ethnicity: AA, HispanicSex: NRSexual identity: NRDisability: NRGeographic: Urban
Living and working conditions: PA and food environment, neighborhood, supermarket, shopping, facility access, availability, proximitySociocultural: NRSocioeconomic: Related variables – income, educationLife course exposure: NR
Home Fruit, Juice, and Vegetables (FJV) AvailabilityFruit, Juice, and Vegetables Availability Checklist(Edmonds et al., 2001)
Individual levelTo examine whether median family income and FJV availability in grocery stores, restaurants, and homes in 11 census tracts correlated with FJV consumption 25 items; phone interviewN=90 AA Boy Scouts 11-14 yrs oldReliability – NR; Validity – NR
Race/ethnicity: AASex: Male Sexual identity: NRDisability: NRGeographic: Urban
Living and working conditions: Availability and access to foods at groceries, restaurants, and home Sociocultural: NRSocioeconomic: Covariates – SES, raceLife course exposure: NR
TABLE E-2 Continued

Copyright © National Academy of Sciences. All rights reserved.
Evaluating Obesity Prevention Efforts: A Plan for Measuring Progress
Evaluating Obesity Prevention Efforts372
Tool/Method
Level, purpose, description, sample size, psychometric properties
Population at risk: race/ethnicity; sex; sexual identity; disability; geographic location
Social determinants:living and working conditions; sociocultural; socioeconomic; life course exposure
Home Food Inventory (HFI)(Fulkerson et al., 2008)
Individual level–homeTo develop and validate a home food inventory that is easily completed by research participants in their homes and includes a comprehensive range of both healthful and less healthful foods that are associated with obesity186 items; self-administered questionnaireN=393; Sample 1=51 adult participants, 6 research staff who independently completed HFI in homes; Sample 2=342 familiesReliability – inter-rater; Validity – construct
Race/ethnicity: AA, AI/AN, Hispanic, Asian, white, multiethnicSex: M/FSexual identity: NRDisability: NRGeographic: NR
Living and working conditions: Home food inventory availability and accessSociocultural: NRSocioeconomic: Related variables – educationLife course exposure: NR
Home Environment Survey(Gattshall et al., 2008)
Individual level–homeTo develop and test the reliability and validity of a measure of the home environment186 items; in person or self-administeredN=219Reliability – test-retest, inter-rater, internal consistency; Validity – predictive
Race/ethnicity: AA, AI/AN, Hispanic, Asian, whiteSex: NRSexual identity: NRDisability: NRGeographic: NR
Living and working conditions: Food availability and access, policy/practice, facility access/policy Sociocultural: Covariates – social influence, parental modelingSocioeconomic: Related variables – educationLife course exposure: NR
Nutrition Environment Measures Survey in Stores (NEMS-S) for Retail Stores(Glanz et al., 2007)
Community levelTo develop and evaluate measures of nutrition environments in retail food stores; environmental observation93 items; researcher-administeredN=85 stores; 4 neighborhoods in urban areaReliability – test-retest, inter-rater, internal consistency; Validity – face construct
Race/ethnicity: AA Sex: NRSexual identity: NRDisability: NRGeographic: Urban
Living and working conditions: Food availability and access, food quality Sociocultural: NRSocioeconomic: Affordability and pricing; Related variables – incomeLife course exposure: NR
TABLE E-2 Continued

Copyright © National Academy of Sciences. All rights reserved.
Evaluating Obesity Prevention Efforts: A Plan for Measuring Progress
373Appendix E
continued
Tool/Method
Level, purpose, description, sample size, psychometric properties
Population at risk: race/ethnicity; sex; sexual identity; disability; geographic location
Social determinants:living and working conditions; sociocultural; socioeconomic; life course exposure
Hayes Urban Market Basket Survey(Hayes, 2000)
Community levelTo revisit issue of price discriminationof food in poor urban areas20 items; researcher-administeredN=NR, 28 urban zIP codesReliability – inter-rater; Validity – NR
Race/ethnicity: AA, Asian, whiteSex: NRSexual identity: NRDisability: NRGeographic: Urban
Living and working conditions: NR Sociocultural: NRSocioeconomic: Affordability and pricing of food; Covariates – SES, race; Related variables – incomeLife course exposure: NR
Measures of Accessibility to Grocery Stores and Fast Food Chains(Helling and Sawicki, 2003)
Community levelTo assess accessibility to personal consumption opportunities across predominantly black, upper-income tracts; GIS protocolN=NR, 10 counties, 25 census tractsReliability – NR; Validity – NR
Race/ethnicity: AA, whiteSex: NRSexual identity: NRDisability: NRGeographic: Urban
Living and working conditions: Facility adequacy, availability, access for full service restaurant, grocery store, fast food restaurantSociocultural: NRSocioeconomic: Covariates – SES, race; Related variables – incomeLife course exposure: NR
Consumer Food Choice and Access Survey(Hendrickson et al., 2006)
Community levelTo determine access to fruits/vegetables by low-income residents living in selected urban and rural Minnesotan communities; focus groupsN=796 low-income subjects from rural and urban communitiesReliability – NR; Validity – NR
Race/ethnicity: AA, AI/AN, Hispanic, Asian, white Sex: M/FSexual identity: NRDisability: NRGeographic: Urban/rural
Living and working conditions: Food availability and access Sociocultural: NRSocioeconomic: Food affordability and pricing, Related variables – income, employment/unemployment, educationLife course exposure: NR
TABLE E-2 Continued

Copyright © National Academy of Sciences. All rights reserved.
Evaluating Obesity Prevention Efforts: A Plan for Measuring Progress
Evaluating Obesity Prevention Efforts374
Tool/Method
Level, purpose, description, sample size, psychometric properties
Population at risk: race/ethnicity; sex; sexual identity; disability; geographic location
Social determinants:living and working conditions; sociocultural; socioeconomic; life course exposure
Focus Group Discussion of Food Availability(Hendrickson et al., 2006)
Community levelTo conduct focus group discussions, responses to a consumer survey and an inventory of foodstuffs available at stores located in all the communities and at large grocery stores in neighborhoods adjacent to the urban communitiesN=41 focus groups; researcher-administeredN=396 urban neighborhoods; N=400 rural communitiesReliability – NR; Validity – NR
Race/ethnicity: AA, AI/AN, Hispanic, whiteSex: M/FSexual identity: NRDisability: NRGeographic: Urban/rural
Living and working conditions: Availability and access, food qualitySociocultural: NRSocioeconomic: Pricing and affordability of food; Related variables – income, employment, educationLife course exposure: NR
Toddler Parent Mealtime Behavior Questionnaire for Toddlers and Mothers(Horodynski et al., 2010)
Individual level To examine maternal demographic characteristics and depressive symptoms as predictors of TV viewing during mealtimes, and investigate how mealtime TV viewing predicts mother and toddler food consumption4 items; self- or third-party-administeredN=199 AA/200 Caucasian, low-income mother-toddler dyads Reliability – NR; Validity – NR
Race/ethnicity: AA, whiteSex: M/FSexual identity: NRDisability: NRGeographic: Urban/rural
Living and working conditions: Food quality at homeSociocultural: NRSocioeconomic: Covariates – SES, race; Related variables – income, education, employment status, WIC/school lunch programLife course exposure: NR
TABLE E-2 Continued

Copyright © National Academy of Sciences. All rights reserved.
Evaluating Obesity Prevention Efforts: A Plan for Measuring Progress
375Appendix E
continued
Tool/Method
Level, purpose, description, sample size, psychometric properties
Population at risk: race/ethnicity; sex; sexual identity; disability; geographic location
Social determinants:living and working conditions; sociocultural; socioeconomic; life course exposure
Food Availability Survey(Horowitz et al., 2004)
Individual levelTo compare the availability and cost of diabetes-healthy foods in a racial/ethnic minority neighborhood in East Harlem, with those in the adjacent, largely white and affluent Upper East Side in New York City; environmental observation5 items; researcher-administeredN=173 East Harlem and 152 Upper East Side grocery storesReliability – inter-rater; Validity – NR
Race/ethnicity: AA, whiteSex: NRSexual identity: NRDisability: NRGeographic: Urban
Living and working conditions: Food availability and access Sociocultural: NRSocioeconomic: Affordability and pricing of food; Related variables – incomeLife course exposure: NR
Family Nutrition and PA Survey (FNPA)(Ihmels et al., 2009)
Individual levelTo develop an easy-to-use screening tool designed to assess family environmental and behavioral factors that may predispose a child to becoming overweight21 items; third-party-administeredN=854Reliability – internal consistency; Validity – construct
Race/ethnicity: AA, Hispanic, whiteSex: NRSexual identity: NRDisability: NRGeographic: Urban
Living and working conditions: Home environmentSociocultural: Family environment/parent/behavioral factorsSocioeconomic: Covariates – SES, race; Related variables – WIC/school lunch program Life course exposure: NR
Community Grocery Store Survey(Inagami et al., 2006)
Community levelTo assess location of grocery stores where individuals shop and its association with BMI were examined; Existing dataResearcher-administeredN=2,144 low-income subjectsReliability – NR; Validity – NR
Race/ethnicity: AA, Hispanic, Asian, whiteSex: M/FSexual identity: NRDisability: NRGeographic: Urban
Living and working conditions: Availability and access to grocery storesSociocultural: NRSocioeconomic: Covariates – SES, race; Related variables – income, employment, educationLife course exposure: NR
TABLE E-2 Continued

Copyright © National Academy of Sciences. All rights reserved.
Evaluating Obesity Prevention Efforts: A Plan for Measuring Progress
Evaluating Obesity Prevention Efforts376
Tool/Method
Level, purpose, description, sample size, psychometric properties
Population at risk: race/ethnicity; sex; sexual identity; disability; geographic location
Social determinants:living and working conditions; sociocultural; socioeconomic; life course exposure
Farmers’ Market and Grocery Store Environments in US Counties(Jilcott et al., 2011a)
Community levelTo examine county-level associations among obesity prevalence and per capita farmers markets, grocery, supercenters, adjusted for demographic factors and metropolitan status; existing dataN=NR, 3,141 counties across 50 statesReliability – NR; Validity – NR
Race/ethnicity: AA, HispanicSex: NRSexual identity: NRDisability: NRGeographic: Urban/rural
Living and working conditions: Food availability and access Sociocultural: NRSocioeconomic: Covariates – SES, race; Related variables – incomeLife course exposure: NR
Food Venue Accessibility for 8 to 18 Year Olds(Jilcott et al., 2011b)
Community level A geographic information systems database was constructed by geocoding home addresses and food venues; existing data/GIS protocolN=744 youth and food venuesReliability – NR; Validity – NR
Race/ethnicity: AA, whiteSex: NRSexual identity: NRDisability: NRGeographic: Urban
Living and working conditions: Food access and availabilitySociocultural: NRSocioeconomic: Covariates – SES, race; Related variables – insurance statusLife course exposure: NR
Grocery Store Accessibility Measure(Kaufman, 1999)
Community levelTo assess pricing and access of food available to poor households; GIS protocolN=NR, 36 counties bordering Mississippi DeltaReliability – NR; Validity – NR
Race/ethnicity: AA Sex: NRSexual identity: NRDisability: NRGeographic: Urban/rural
Living and working conditions: Food availability and access Sociocultural: NRSocioeconomic: Affordability/pricing; Covariates – pricing/cost variables; Related variables – income, WIC/school lunch programLife course exposure: NR
TABLE E-2 Continued
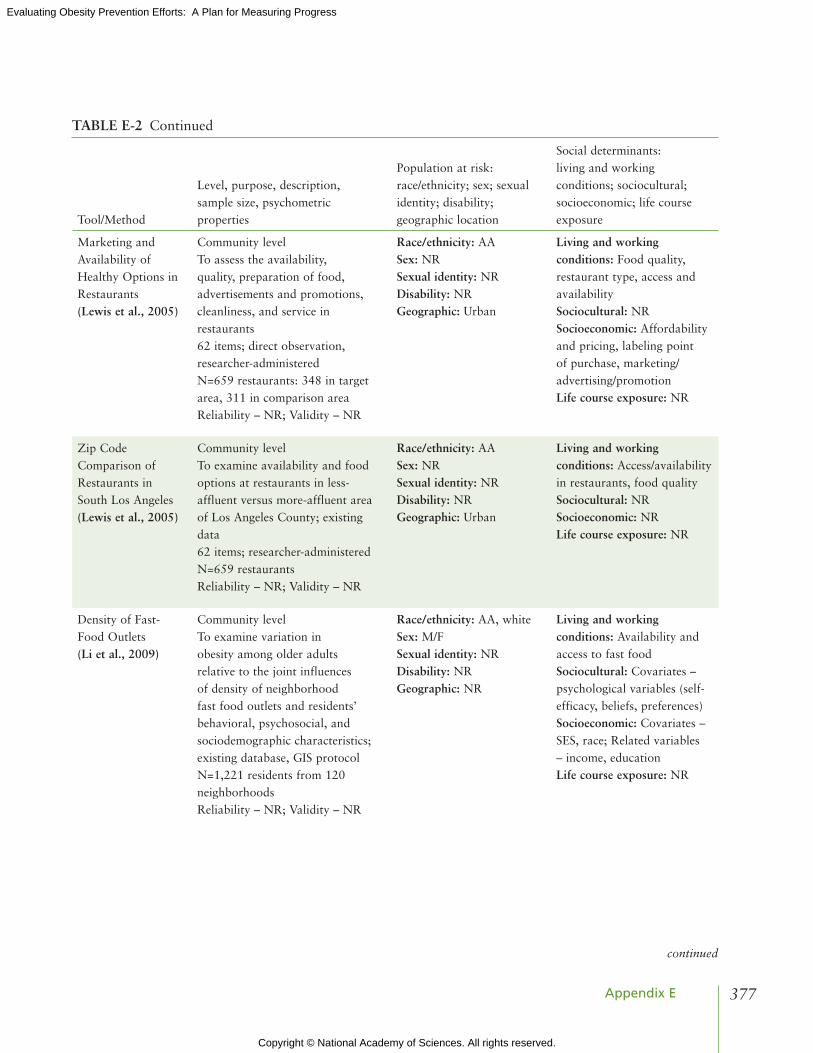
Copyright © National Academy of Sciences. All rights reserved.
Evaluating Obesity Prevention Efforts: A Plan for Measuring Progress
377Appendix E
continued
Tool/Method
Level, purpose, description, sample size, psychometric properties
Population at risk: race/ethnicity; sex; sexual identity; disability; geographic location
Social determinants:living and working conditions; sociocultural; socioeconomic; life course exposure
Marketing and Availability of Healthy Options in Restaurants(Lewis et al., 2005)
Community levelTo assess the availability, quality, preparation of food, advertisements and promotions, cleanliness, and service in restaurants 62 items; direct observation, researcher-administeredN=659 restaurants: 348 in target area, 311 in comparison areaReliability – NR; Validity – NR
Race/ethnicity: AASex: NRSexual identity: NRDisability: NRGeographic: Urban
Living and working conditions: Food quality, restaurant type, access and availabilitySociocultural: NRSocioeconomic: Affordability and pricing, labeling point of purchase, marketing/advertising/promotionLife course exposure: NR
zip Code Comparison of Restaurants in South Los Angeles(Lewis et al., 2005)
Community levelTo examine availability and food options at restaurants in less-affluent versus more-affluent area of Los Angeles County; existing data62 items; researcher-administeredN=659 restaurantsReliability – NR; Validity – NR
Race/ethnicity: AASex: NRSexual identity: NRDisability: NRGeographic: Urban
Living and working conditions: Access/availability in restaurants, food qualitySociocultural: NRSocioeconomic: NRLife course exposure: NR
Density of Fast-Food Outlets(Li et al., 2009)
Community levelTo examine variation in obesity among older adults relative to the joint influences of density of neighborhood fast food outlets and residents’ behavioral, psychosocial, and sociodemographic characteristics; existing database, GIS protocolN=1,221 residents from 120 neighborhoodsReliability – NR; Validity – NR
Race/ethnicity: AA, whiteSex: M/FSexual identity: NRDisability: NRGeographic: NR
Living and working conditions: Availability and access to fast foodSociocultural: Covariates – psychological variables (self-efficacy, beliefs, preferences)Socioeconomic: Covariates – SES, race; Related variables – income, educationLife course exposure: NR
TABLE E-2 Continued

Copyright © National Academy of Sciences. All rights reserved.
Evaluating Obesity Prevention Efforts: A Plan for Measuring Progress
Evaluating Obesity Prevention Efforts378
Tool/Method
Level, purpose, description, sample size, psychometric properties
Population at risk: race/ethnicity; sex; sexual identity; disability; geographic location
Social determinants:living and working conditions; sociocultural; socioeconomic; life course exposure
Neighborhood Vegetation and Proximity to Food Retail Protocol(Liu et al., 2007)
Community levelTo examine relationships between overweight in children and environment factors, including vegetation and food retail locations; GIS protocolN=7,334 subjects 3-18 yrs oldReliability – NR; Validity – NR
Race/ethnicity: AA, Hispanic, whiteSex: NRSexual identity: NRDisability: NRGeographic: Rural
Living and working conditions: Access/availability to stores, groceries, markets and restaurantsSociocultural: NRSocioeconomic: NRLife course exposure: NR
Geographic Assessment of Type and Quantity of Food Stores(Moore and Diez Roux, 2006)
Community levelTo investigate associations between local food environment and neighborhood racial/ethnic and socioeconomic compositionN=NR; existing data, Census tracks in Maryland, North Carolina, New YorkReliability – NR; Validity – NR
Race/ethnicity: AA, Hispanic, whiteSex: M/FSexual identity: NRDisability: NRGeographic: Urban
Living and working conditions: Availability and access to food outlets, stores, marketsSociocultural: NRSocioeconomic: Covariates – SES, race; Related variables – incomeLife course exposure: NR
Geographic Assessment of Neighborhood Characteristics and Location of Food Stores (Morland et al., 2002)
Community levelTo examine the distribution of food stores and food service places by neighborhood wealth and racial segregation; existing data (Atherosclerosis Risk in Communities study)N=NR; 216 census tracts from Maryland, Minnesota, Mississippi, North CarolinaReliability – NR; Validity – NR
Race/ethnicity: AA, whiteSex: M/FSexual identity: NRDisability: NRGeographic: Urban/rural
Living and working conditions: Availability and access to food stores and servicesSociocultural: NRSocioeconomic: Covariates – SES, race; Related variables – home ownership and valuesLife course exposure: NR
TABLE E-2 Continued

Copyright © National Academy of Sciences. All rights reserved.
Evaluating Obesity Prevention Efforts: A Plan for Measuring Progress
379Appendix E
continued
Tool/Method
Level, purpose, description, sample size, psychometric properties
Population at risk: race/ethnicity; sex; sexual identity; disability; geographic location
Social determinants:living and working conditions; sociocultural; socioeconomic; life course exposure
Community Supermarket and Other Food Stores Measure(Morland et al., 2006)
Community levelTo examine whether characteristics of local food environment are associated with prevalence of cardiovascular risk factorsConstruction of measure from existing dataN=10,763 subjects from 270 census tracts in Maryland, Minnesota, Mississippi, North CarolinaReliability – NR; Validity – NR
Race/ethnicity: AA, whiteSex: M/FSexual identity: NRDisability: NRGeographic: Urban/rural
Living and working conditions: Availability and access to food outletsSociocultural: NRSocioeconomic: Covariates – SES, race; Related variables – income, educationLife course exposure: NR
Neighborhood Scale Questionnaire on Food Quality, Safety, Aesthetics, and Social Cohesion(Mujahid et al., 2007)
Community levelTo develop measures of neighborhood environment that are important in cardiovascular disease risk, assess psychometric and ecometric properties and examine individual- and neighborhood-level predictors of measures; Questionnaire36 items; researcher-administered by phoneN=5,988 from Maryland, North Carolina, New YorkReliability – test-retest internal consistency; Validity – convergent
Race/ethnicity: AA, Hispanic, Asian, whiteSex: NRSexual identity: NRDisability: NRGeographic: Urban
Living and working conditions: Food quality, adequacy, and appeal; aesthetics, traffic and crime/safety, facility adequacy and appealSociocultural: Social environmentSocioeconomic: Covariates – SES, race; Related variables – income, educationLife course exposure: NR
Child Feeding Scale in Turkish Mothers(Polat and Erci, 2010)
Individual levelTo adopt the Child Feeding Scale to assess validity and reliability of the Turkish version of the scaleItems: NR; self-administeredN=158 mothersReliability – internal consistency; Validity – construct
Race/ethnicity: NRSex: FemaleSexual identity: NRDisability: NRGeographic: Urban
Living and working conditions: NR Sociocultural: NRSocioeconomic: Related variables – income, education, employment/unemploymentLife course exposure: NR
TABLE E-2 Continued

Copyright © National Academy of Sciences. All rights reserved.
Evaluating Obesity Prevention Efforts: A Plan for Measuring Progress
Evaluating Obesity Prevention Efforts380
Tool/Method
Level, purpose, description, sample size, psychometric properties
Population at risk: race/ethnicity; sex; sexual identity; disability; geographic location
Social determinants:living and working conditions; sociocultural; socioeconomic; life course exposure
Food Environment, Shopping List Survey(Sloane et al., 2003)
Community levelTo inventory selected markets in targeted areas of high AA concentration in comparison with markets in a contrasting wealthier area with fewer AAsQuestionnaire; third-party-administeredN=261 stores in Los Angeles target area; 69 in contrast areaReliability – NR; Validity – NR
Race/ethnicity: AASex: NRSexual identity: NRDisability: NRGeographic: Urban
Living and working conditions: Food quality, adequacy and appeal, availability and access, serviceSociocultural: NRSocioeconomic: Covariates – SES, race; Related variables – income, poverty ratesLife course exposure: NR
Food Environment, Healthy Food Assessment Survey(Sloane et al., 2003)
Community levelTo study nutritional environment of an urban area to better understand the role of such resources in residents’ efforts to live a healthy lifeQuestionnaire; third-party-administeredN=261 stores in Los Angeles target area; 69 in contrast areaReliability – NR; Validity – NR
Race/ethnicity: AASex: NRSexual identity: NRDisability: NRGeographic: Urban
Living and working conditions: Food quality, adequacy and appeal, availability and access, serviceSociocultural: NRSocioeconomic: Covariates – SES, race; Related variables – income, poverty ratesLife course exposure: NR
Youth Impact Questionnaire (YIQ) for 10 to 14 Year Olds(Surkan et al., 2011)
Community levelTo examine how factors related to the home food environment and individual characteristics are associated with healthy food purchasing among low-income AA youth38 items; in-person-administeredN=206 youth and adultsReliability – NR; Validity – NA
Race/ethnicity: AASex: M/FSexual identity: NRDisability: NRGeographic: NR
Living and working conditions: Availability, accessSociocultural: Covariates – psychological factors (e.g., self-efficacy, beliefs, preferences), social influence (e.g., parental modeling)Socioeconomic: Covariates – SES, race; Related variables – education, employment, marital status, material style of life scoreLife course exposure: NR
TABLE E-2 Continued

Copyright © National Academy of Sciences. All rights reserved.
Evaluating Obesity Prevention Efforts: A Plan for Measuring Progress
381Appendix E
continued
Tool/Method
Level, purpose, description, sample size, psychometric properties
Population at risk: race/ethnicity; sex; sexual identity; disability; geographic location
Social determinants:living and working conditions; sociocultural; socioeconomic; life course exposure
Food Purchasing Patterns for Home Consumption (Yoo et al., 2006)
Community levelTo identify the most common frequency of food-purchasing patterns and relate to characteristics of individuals and familiesItems: NR; researcher-administeredN=823 adultsReliability – NR; Validity – NR
Race/ethnicity: AA, Hispanic, Asian, HI/PI, whiteSex: M/FSexual identity: NRDisability: NRGeographic: Urban
Living and working conditions: Assessment of supermarket, grocery, and convenience storesSociocultural: NRSocioeconomic: Covariates – SES, race; Related variables – income, educationLife course exposure: NR
Food Store Characteristics Survey(Zenk et al., 2005a)
Community levelTo examine whether characteristics of retail food stores where AA women shopped mediated association between income and intake of fruit and vegetables; QuestionnaireN=266Reliability – NR; Validity – NR
Race/ethnicity: AASex: FemaleSexual identity: NRDisability: NRGeographic: Urban
Living and working conditions: Availability/access, food quality, assessed grocery store/supermarket Sociocultural: NRSocioeconomic: Affordability, food pricing; Related variables – income, educationLife course exposure: NR
Manhattan Block Distance to the Nearest Supermarket(Zenk et al., 2005b)
Community levelTo evaluate spatial accessibility of chain supermarkets in relation to neighborhood racial composition and poverty; GIS protocol Researcher-administeredN=NR, 869 neighborhoods/census tracts in metropolitan DetroitReliability – NA; Validity – NR
Race/ethnicity: AA, whiteSex: NRSexual identity: NRDisability: NRGeographic: Urban
Living and working conditions: Food access and availabilitySociocultural: NRSocioeconomic: Related variables – incomeLife course exposure: NR
TABLE E-2 Continued

Copyright © National Academy of Sciences. All rights reserved.
Evaluating Obesity Prevention Efforts: A Plan for Measuring Progress
Evaluating Obesity Prevention Efforts382
Tool/Method
Level, purpose, description, sample size, psychometric properties
Population at risk: race/ethnicity; sex; sexual identity; disability; geographic location
Social determinants:living and working conditions; sociocultural; socioeconomic; life course exposure
Fruit and Vegetable Access by Community Racial Composition and Socioeconomic Position(Zenk et al., 2006)
Community levelTo compare fruit/vegetable availability at food stores in four Detroit-area communities: (1) predominately AA, low socioeconomic position (SEP), (2) racially heterogeneous, low SEP (3) predominately AA, middle SEP (4) racially heterogeneous, middle SEP; observational studyN=304 food stores located in the four communities Reliability – inter-rater; Validity – NR
Race/ethnicity: AA, Hispanic, whiteSex: NRSexual identity: NRDisability: NRGeographic: Urban
Living and working conditions: Food access and availability, qualitySociocultural: NRSocioeconomic: Affordability, pricingLife course exposure: NR
NOTES: AA = African American, AI = American Indian; AN = Alaska Native; BMI = body mass index; F = female; FJV = fruit, juice, and vegetable; HI/PI = Hawaiian/Pacific Islander; GIS = geographic information systems; M = male; NR = not relevant; PA = physical activity; SES = socioeconomic status; WIC = Special Supplemental Nutrition Program for Women, Infants, and Children
TABLE E-2 Continued
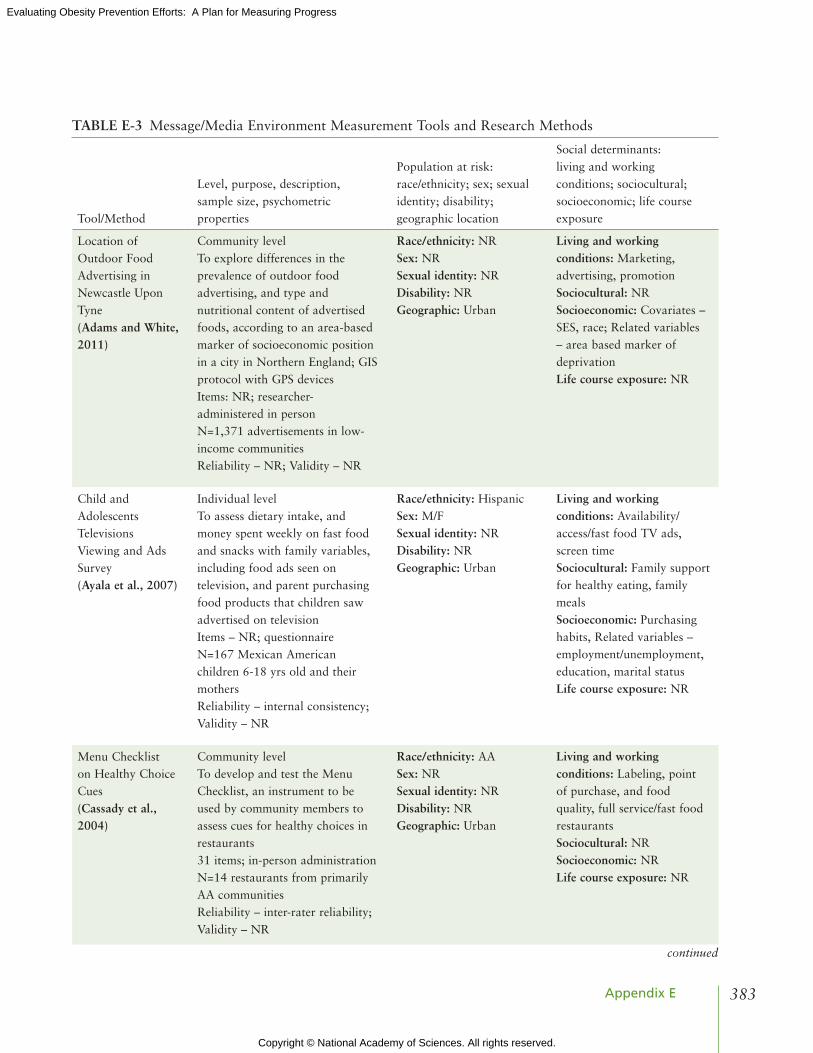
Copyright © National Academy of Sciences. All rights reserved.
Evaluating Obesity Prevention Efforts: A Plan for Measuring Progress
383Appendix E
TABLE E-3 Message/Media Environment Measurement Tools and Research Methods
Tool/Method
Level, purpose, description, sample size, psychometric properties
Population at risk: race/ethnicity; sex; sexual identity; disability; geographic location
Social determinants:living and working conditions; sociocultural; socioeconomic; life course exposure
Location of Outdoor Food Advertising in Newcastle Upon Tyne(Adams and White, 2011)
Community levelTo explore differences in the prevalence of outdoor food advertising, and type and nutritional content of advertised foods, according to an area-based marker of socioeconomic position in a city in Northern England; GIS protocol with GPS devicesItems: NR; researcher-administered in personN=1,371 advertisements in low-income communities Reliability – NR; Validity – NR
Race/ethnicity: NRSex: NRSexual identity: NRDisability: NRGeographic: Urban
Living and working conditions: Marketing, advertising, promotionSociocultural: NRSocioeconomic: Covariates – SES, race; Related variables – area based marker of deprivation Life course exposure: NR
Child and Adolescents Televisions Viewing and Ads Survey(Ayala et al., 2007)
Individual levelTo assess dietary intake, and money spent weekly on fast food and snacks with family variables, including food ads seen on television, and parent purchasing food products that children saw advertised on televisionItems – NR; questionnaireN=167 Mexican American children 6-18 yrs old and their mothersReliability – internal consistency; Validity – NR
Race/ethnicity: HispanicSex: M/FSexual identity: NRDisability: NRGeographic: Urban
Living and working conditions: Availability/access/fast food TV ads, screen timeSociocultural: Family support for healthy eating, family mealsSocioeconomic: Purchasing habits, Related variables – employment/unemployment, education, marital statusLife course exposure: NR
Menu Checklist on Healthy Choice Cues(Cassady et al., 2004)
Community levelTo develop and test the Menu Checklist, an instrument to be used by community members to assess cues for healthy choices in restaurants31 items; in-person administrationN=14 restaurants from primarily AA communitiesReliability – inter-rater reliability; Validity – NR
Race/ethnicity: AA Sex: NRSexual identity: NRDisability: NRGeographic: Urban
Living and working conditions: Labeling, point of purchase, and food quality, full service/fast food restaurantsSociocultural: NRSocioeconomic: NRLife course exposure: NR
continued

Copyright © National Academy of Sciences. All rights reserved.
Evaluating Obesity Prevention Efforts: A Plan for Measuring Progress
Evaluating Obesity Prevention Efforts384
Tool/Method
Level, purpose, description, sample size, psychometric properties
Population at risk: race/ethnicity; sex; sexual identity; disability; geographic location
Social determinants:living and working conditions; sociocultural; socioeconomic; life course exposure
Retail Food Storage Packaging Retail for Youth (Grigsby-Toussaint et al., 2011)
Community level, new measure To examine extent to which foods marketed on the Internet and television to youth are also available and marketed in retail food stores, and whether differences exist in the marketing practices across store types and by neighborhood racial composition78-item survey; self-administeredN=118 food storesReliability – inter-rater; Validity – NR
Race/ethnicity: AA, whiteSex: NRSexual identity: NRDisability: NRGeographic: Urban
Living and working conditions: Availability, access, marketing/advertising/promotion Sociocultural: NRSocioeconomic: Related variables – low-income populations, educationLife course exposure: NR
Restaurant Physical Environment Profile(Lewis et al., 2005)
Community levelTo assess the availability, quality, and preparation of food in restaurants and to assess advertisements and promotions, cleanliness, and service for each restaurant 62 items; in person, direct observation N=659 restaurants in 348 areas with 311 comparison areasReliability – NR; Validity – NR
Race/ethnicity: AASex: NRSexual identity: NRDisability: NRGeographic: Urban
Living and working conditions: Affordability/pricing, availability/access, facility adequacy/appeal, food quality, point of purchase/labeling Sociocultural: NRSocioeconomic: NRLife course exposure: NR
Marketing and Availability of Healthy Options in Restaurants(Lewis et al., 2005)
Community levelTo assess the availability, quality, and preparation of food in restaurants, and advertisements and promotions, cleanliness, and service for each restaurant Researcher-administered in personN=659 restaurants in 348 areas with 311 comparison areasReliability – NR; Validity – NR
Race/ethnicity: AASex: NRSexual identity: NRDisability: NRGeographic: Urban
Living and working conditions: Affordability/pricing, availability/access, food quality, point of purchase/labeling, marketing/advertisingSociocultural: NRSocioeconomic: NRLife course exposure: NR
TABLE E-3 Continued

Copyright © National Academy of Sciences. All rights reserved.
Evaluating Obesity Prevention Efforts: A Plan for Measuring Progress
385Appendix E
Tool/Method
Level, purpose, description, sample size, psychometric properties
Population at risk: race/ethnicity; sex; sexual identity; disability; geographic location
Social determinants:living and working conditions; sociocultural; socioeconomic; life course exposure
PA and Media Inventory(Sirard et al., 2008)
Individual levelTo develop and test the reliability and validity of a self-report instrument to comprehensively reflect the availability and accessibility of PA61 items; self-administeredN=31 adult participants with a child 10-17 yrs oldReliability – test-retest; Validity – criterion
Race/ethnicity: AA, AI/AN, Hispanic, Asian, white, multiculturalSex: NRSexual identity: NRDisability: NRGeographic: Urban
Living and working conditions: Facility access/availability/proximity, facility adequacy/appeal/quality, and rooms/PA/media Sociocultural: NRSocioeconomic: Related variables – education, home ownershipLife course exposure: NR
Youth Media Campaign Longitudinal Survey(Welk et al., 2007)
Individual levelTo evaluate the reliability and validity of the PA questions in the Youth Media Campaign Longitudinal Survey (YMCLS), a nationally representative survey of youth 9-13 yrs oldItems – NR; researcher-administeredN=192 subjects 9-13 yrs old (93 males and 99 females)Reliability – test-retest; Validity – criterion
Race/ethnicity: AA, Hispanic, whiteSex: M/FSexual identity: NRDisability: NRGeographic: Urban
Living and working conditions: NRSociocultural: NRSocioeconomic: Related variables – income, WIC/free/reduced school lunch programLife course exposure: NR
NOTES: AA = African American, AI = American Indian; AN = Alaska Native; F = female; GIS = geographic information systems; GPS = global positioning systems; M = male; NR = not relevant; PA = physical activity; SES = socioeconomic status; WIC = Special Supplemental Nutrition Program for Women, Infants, and Children
TABLE E-3 Continued

Copyright © National Academy of Sciences. All rights reserved.
Evaluating Obesity Prevention Efforts: A Plan for Measuring Progress
Evaluating Obesity Prevention Efforts386
TABLE E-4 Worksite/Healthcare Environment Measurement Tool and Research Methods
Tool/Method
Level, purpose, description, sample size, psychometric properties
Population at risk: race/ethnicity; sex; sexual identity; disability; geographic location
Social determinants:living and working conditions; sociocultural; socioeconomic; life course exposure
Environmental and Policy Factors Measure(Catlin et al., 2003)
Community levelTo measure the association between environmental and policy factors (i.e., community perceptions, community infrastructure, and worksite infrastructure) and being overweight; telephone survey adapted from the Missouri Cardiovascular Disease Survey 92 items; interviewN=2,871Reliability – NR; Validity – NR
Race/ethnicity: AA, whiteSex: NRSexual identity: NRDisability: NRGeographic: Urban
Living and working conditions: Pedestrian infrastructure, aesthetics/beautification, facility access/availability/proximity, pedestrian/traffic safety, crime/safety, policySociocultural: NRSocioeconomic: Covariates – SES, race; Related variables – education, employment/unemployment, marital statusLife course exposure: NR
Worksite Support of PA and Healthy Food Availability Measures(Crawford et al., 2004)
Individual level, new measureTo measure staff perceptions of workplace environment, personal habits and health beliefs, and self-efficacy Items – NR; questionnaire; self-administeredN=51Reliability – NR; Validity – NR
Race/ethnicity: Hispanic, Asian, whiteSex: M/FSexual identity: NRDisability: NRGeographic: Urban
Living and working conditions: Workplace environmentSociocultural: Covariates – psychological factors, including self-efficacy, beliefs, preferencesSocioeconomic: NRLife course exposure: NR
NOTES: AA = African American; F = female; M = male; NR = not relevant; PA = physical activity; SES = socioeconomic status.

Copyright © National Academy of Sciences. All rights reserved.
Evaluating Obesity Prevention Efforts: A Plan for Measuring Progress
387Appendix E
TABLE E-5 School and Child Care Environment Measurement Tools and Research Methods
Tool/Method
Level, purpose, description, sample size, psychometric properties
Population at risk: race/ethnicity; sex; sexual identity; disability; geographic location
Social determinants:living and working conditions; sociocultural; socioeconomic; life course exposure
Wisconsin Nutrition and Growth Study (WINGS) Survey for 3 to 8 Year Olds(Adams and Prince, 2010)
Individual levelTo understand the prevalence and contributing factors to pediatric obesity in Wisconsin tribes and provide the foundation for intervention design7 items; measures of PA by questionnaireN=412 children 2-11 yrs old Reliability – test-retest; Validity – NR
Race/ethnicity: AI/ANSex: NRSexual identity: NRDisability: NRGeographic: NR
Living and working conditions: NRSociocultural: NRSocioeconomic: NRLife course exposure: NR
School Food Opportunities(Arcan et al., 2011)
Individual levelTo assess dietary behaviors of students attending alternative high schools12 items; questionnaire; in-person deliveryN=145 low-SES youth 12-18 yrs oldReliability – NR; Validity – NR
Race/ethnicity: AA, whiteSex: M/FSexual identity: NRDisability: NRGeographic: Urban
Living and working conditions: NRSociocultural: NRSocioeconomic or class: Covariates – SES, race; Related variables – WIC/free reduced school lunch programLife course exposure: NR
Nutrition and PA Self-Assessment for Child Care (NAP SACC)(Benjamin et al., 2007)
Organizational levelTo assess the nutrition and PA environments in child care settings56 items; questionnaire; self-administeredN=59 child care center directors and 109 staff Reliability – inter-rater, test-retest; Validity – face, construct, content, criterion
Race/ethnicity: NRSex: NRSexual identity: NRDisability: NRGeographic: NR
Living and working conditions: Food availability/access, quality, policy/practice, provision nutrition education, policy, crime/safety, facilities/adequacy/appeal/quality, aesthetics/beautificationSociocultural: NRSocioeconomic: NRLife course exposure: NR
continued

Copyright © National Academy of Sciences. All rights reserved.
Evaluating Obesity Prevention Efforts: A Plan for Measuring Progress
Evaluating Obesity Prevention Efforts388
Tool/Method
Level, purpose, description, sample size, psychometric properties
Population at risk: race/ethnicity; sex; sexual identity; disability; geographic location
Social determinants:living and working conditions; sociocultural; socioeconomic; life course exposure
School Commute Scale(Braza et al., 2004)
Community levelTo evaluate neighborhood design and rates of student walking and biking to school1 item; third-party-administeredN=2,993; 34 of 150 California schools participating in Walk to School eventsReliability – NR; Validity – NR
Race/ethnicity: AA, Hispanic, Asian, white Sex: M/FSexual identity: NRDisability: NRGeographic: NR
Living and working conditions: Commute to work/schoolSociocultural: NRSocioeconomic: Covariates – SES, race; Related variables – WIC/free/reduced school lunch programLife course exposure: NR
Nursery Teachers’ Report on PA of Young Children(Chen et al., 2002)
Individual levelTo test the validity of nursery teachers’ report on the PA of young childrenItems – NR; third-party-administeredN=21 children ages 3-4 in nursery school in Japan and teachersReliability – NR; Validity – criterion
Race/ethnicity: AsianSex: M/FSexual identity: NRDisability: NRGeographic: Urban
Living and working conditions: NRSociocultural: NRSocioeconomic: NRLife course exposure: NR
School Food Environments for 6 to 13 Year Olds(Chiang et al., 2011)
Community levelTo measure the influence of fast-food stores and convenience food stores on growth and body composition in a range of residential densities for Northeast Asian food culture; QuestionnaireN=2,283 children in 359 townships/districts of TaiwanReliability – NR; Validity – NR
Race/ethnicity: AsianSex: M/FSexual identity: NRDisability: NRGeographic: NR
Living and working conditions: Availability/accessSociocultural: NRSocioeconomic: Covariates – SES, race; Related variables – income, educationLife course exposure: NR
TABLE E-5 Continued

Copyright © National Academy of Sciences. All rights reserved.
Evaluating Obesity Prevention Efforts: A Plan for Measuring Progress
389Appendix E
continued
Tool/Method
Level, purpose, description, sample size, psychometric properties
Population at risk: race/ethnicity; sex; sexual identity; disability; geographic location
Social determinants:living and working conditions; sociocultural; socioeconomic; life course exposure
Food Policies a la Carte and Snack Bars(Cullen and Thompson, 2005)
Policy levelNew measure derived from multiple data sources from aggregated sales data; Existing dataN= 23 schools, primarily low-income, subjects 12-18 yrs oldReliability – NR; Validity – NR
Race/ethnicity: AA, Hispanic Sex: NRSexual identity: NRDisability: NRGeographic: Urban
Living and working conditions: Policies/practice related to food group, types of food, foods of minimal nutritional value, sweetened beverages Sociocultural: NRSocioeconomic: Related variables – WIC/free/reduced school lunch programLife course exposure: NR
Daily Food Production Records for the National School Lunch Program Meals and Point of Sale Data for Snack Bar Items(Cullen and Watson, 2009)
Organizational levelTo assess the statewide impact of the 2004 Texas Public School Nutrition Policy on foods and beverages served or sold in schoolGIS methods; existing data N=47 schools in 11 school districts in Texas Reliability – NR; Validity – NR
Race/ethnicity: AA, Hispanic, whiteSex: NRSexual identity: NRDisability: NRGeographic: NR
Living and working conditions: Food production records/average sales data of foods servedSociocultural: NRSocioeconomic: Related variables – WIC/free/reduced school lunch programLife course exposure: NR
Fruit, Juice, and Vegetable (FJV) Availability Questionnaire for Students(Cullen et al., 2003)
Individual level To examine the relationships among home fruit (F), 100% fruit juice (J), and vegetable (V) availability and accessibility 34 items; child- and parent-focused questionnairesN= 225 4th- to 6th-grade children and their parents (N=88)Reliability – internal consistency; Validity – NR
Race/ethnicity: AA, Hispanic, Asian, whiteSex: M/FSexual identity: NRDisability: NRGeographic: NR
Living and working conditions: Availability, accessSociocultural: NRSocioeconomic: Related variables – education, family compositionLife course exposure: NR
TABLE E-5 Continued

Copyright © National Academy of Sciences. All rights reserved.
Evaluating Obesity Prevention Efforts: A Plan for Measuring Progress
Evaluating Obesity Prevention Efforts390
Tool/Method
Level, purpose, description, sample size, psychometric properties
Population at risk: race/ethnicity; sex; sexual identity; disability; geographic location
Social determinants:living and working conditions; sociocultural; socioeconomic; life course exposure
Pathways Knowledge, Attitudes, and Behaviors (KAB) Questionnaire(DeVault et al., 2009)
Individual measureTo evaluate effectiveness of nutrition component for 4th-grade children in public schoolsResearcher-administeredN=20 4th-grade classes, 140 studentsReliability – NR; Validity – NR
Race/ethnicity: AA, AI/AN, Hispanic, whiteSex: M/FSexual identity: NRDisability: NRGeographic: Urban
Living and working conditions: NRSociocultural: Covariate psychological factors (e.g., self-efficacy, beliefs, preferences), social influence (e.g., parent modeling)Socioeconomic: Covariates – SES, race; Related variables – WIC/free/reduced school lunch programLife course exposure: NR
Food Checklist for It’s All About Kids Program(DeVault et al., 2009)
Individual levelTo evaluate effectiveness of nutrition component for 4th-grade children in public schoolsItems – NR; researcher-administeredN=20 4th-grade classes, 140 studentsReliability – NR; Validity – NR
Race/ethnicity: AA, AI/AN, Hispanic, whiteSex: M/FSexual identity: NRDisability: NRGeographic: Urban
Living and working conditions: NRSociocultural: Confidence to participate in PA; Covariates – knowledge, psychological factors (e.g., self-efficacy, beliefs, preferences), social influence (e.g., parent modeling)Socioeconomic: Covariates – SES, race; Related variables – psychological, social variables, WIC/free/reduced school lunch programLife course exposure: NR
Shape Up Somerville Study Physical Activity Questionnaire for Young Children(Economos et al., 2008)
Individual levelThree school-based questionnaires to assess (a) fruit/vegetable intake, (b) PA and television (TV) viewing, and (c) perceived parental support for diet and PA6 items; phone, in-person administrationN=86 school childrenReliability – test-retest; Validity – concurrent
Race/ethnicity: AA, AI/AN, Hispanic, Asian, whiteSex: M/FSexual identity: NRDisability: NRGeographic: Urban
Living and working conditions: NRSociocultural: Covariates – social influence (e.g., parental modeling)Socioeconomic: Covariates – SES, race; Related variables – incomeLife course exposure: NR
TABLE E-5 Continued

Copyright © National Academy of Sciences. All rights reserved.
Evaluating Obesity Prevention Efforts: A Plan for Measuring Progress
391Appendix E
continued
Tool/Method
Level, purpose, description, sample size, psychometric properties
Population at risk: race/ethnicity; sex; sexual identity; disability; geographic location
Social determinants:living and working conditions; sociocultural; socioeconomic; life course exposure
Modified “Fruits and Vegetables You Ate Yesterday” Survey for Shape Up Somerville Study(Economos et al., 2008)
Individual levelThree school-based questionnaires to assess (a) fruit and vegetable intake, (b) PA and TV viewing, and (c) perceived parental support for diet and physical activity4 items; phone, in-person administrationN=86 school childrenReliability – test-retest; Validity – criterion
Race/ethnicity: AA, AI/AN, Hispanic, Asian, whiteSex: M/FSexual identity: NRDisability: NRGeographic: Urban
Living and working conditions: NRSociocultural: Covariates – social influence (e.g., parental modeling)Socioeconomic: Covariates – SES, race; Related variables – incomeLife course exposure: NR
Parental Support Questionnaire for Shape Up Somerville Study(Economos et al., 2008)
Individual levelThree school-based questionnaires to assess (a) fruit and vegetable intake, (b) PA and TV viewing, and (c) perceived parental support for diet and physical activity3 items; phone, in-person administrationN=86 school childrenReliability – test-retest; Validity – NR
Race/ethnicity: AA, AI/AN, Hispanic, Asian, whiteSex: M/FSexual identity: NRDisability: NRGeographic: Urban
Living and working conditions: NRSociocultural: Perception of parental support for fruit and vegetables; Covariates – social influence (e.g., parental modeling)Socioeconomic: Covariates – SES, race; Related variables – incomeLife course exposure: NR
Healthy Eating, Active Communities (HEAC) Survey for 7th and 9th Graders(Gosliner et al., 2011)
Individual levelTo assess attitudes and behaviors regarding school food environments during spring 2006138 items; self-administeredN=5,365 subjects 12-18 yrs oldReliability – NR; Validity – NR
Race/ethnicity: AA, AI/AN, Hispanic, Asian, whiteSex: M/FSexual identity: NRDisability: NRGeographic: Urban
Living and working conditions: Perceptions of school food environment, availability/access, facility adequacy/appealSociocultural: Perception of healthiness; Covariates – psychological factors (e.g., self-efficacy, beliefs, preferences)Socioeconomic: Related variables – low-income studentsLife course exposure: NR
TABLE E-5 Continued

Copyright © National Academy of Sciences. All rights reserved.
Evaluating Obesity Prevention Efforts: A Plan for Measuring Progress
Evaluating Obesity Prevention Efforts392
Tool/Method
Level, purpose, description, sample size, psychometric properties
Population at risk: race/ethnicity; sex; sexual identity; disability; geographic location
Social determinants:living and working conditions; sociocultural; socioeconomic; life course exposure
School Wellness Policies for Post-Partum Adolescents(Haire-Joshu et al., 2011)
Policy levelSchool Wellness Policy Coding Tool used to assess the strength and comprehensiveness of school district wellness policies from 251 schools attended by participating adolescent mothersItems – NR; self-administered questionnaireN=647 respondents from N=251 schools across 27 statesReliability – NR; Validity – NR
Race/ethnicity: AA, Hispanic, whiteSex: NRSexual identity: NRDisability: NRGeographic: Urban
Living and working conditions: Policies related to food and PA environmentSociocultural: NRSocioeconomic: Related variables – WIC/free/reduced school lunch programLife course exposure: NR
Home Availability and Accessibility of Fruits and Vegetables – Parent Survey(Hearn et al., 1998)
Individual levelSurveys of parents and children, food consumption records, and examination of foods served at several schoolsNumber of items and sample size – NRReliability – Internal consistency; Validity – NR
Race/ethnicity: AA, whiteSex: NRSexual identity: NRDisability: NRGeographic: Urban
Living and working conditions: Home environment, availability/accessSociocultural: NRSocioeconomic: Covariates – SES, race; Related variables – employment/unemployment, educationLife course exposure: NR
School Lunch Availability and Accessibility of Fruit and Vegetable Survey(Hearn et al., 1998)
Individual levelSurvey of parents and children, food consumption records, and examination of foods served at schoolsNumber of items and sample size – NRReliability – NR; Validity – NR
Race/ethnicity: AA, white Sex: NRSexual identity: NRDisability: NRGeographic: Urban
Living and working conditions: Availability and access of foods at schoolSociocultural: NRSocioeconomic: Covariates – SES, raceLife course exposure: NR
TABLE E-5 Continued

Copyright © National Academy of Sciences. All rights reserved.
Evaluating Obesity Prevention Efforts: A Plan for Measuring Progress
393Appendix E
continued
Tool/Method
Level, purpose, description, sample size, psychometric properties
Population at risk: race/ethnicity; sex; sexual identity; disability; geographic location
Social determinants:living and working conditions; sociocultural; socioeconomic; life course exposure
System for Observing Play and Leisure Activities in Youth for Middle Schoolers(McKenzie, 2000)
Individual levelTo directly observe group PA and measure leisure time physical activity of adolescentsNumber of items and sample size – NR; researcher-administered, direct observationReliability – inter-rater; Validity – concurrent
Race/ethnicity: AA, Hispanic, whiteSex: NRSexual identity: NRDisability: NRGeographic: Urban
Living and working conditions: School facility adequacy/appeal or qualitySociocultural: NRSocioeconomic: Related variables – WIC free/reduced school lunch programLife course exposure: NR
System for Observing Play and Recreation in Communities (SOPARC)(McKenzie et al., 2006)
Individual levelTo develop SOPARC and test its use by observing 16,244 individuals in 165 park areasItems – NR; researcher-administered, direct observationN=16,244Reliability – inter-rater; Validity – NR
Race/ethnicity: AA, Hispanic, white, multiethnic Sex: NRSexual identity: NRDisability: NRGeographic: Urban
Living and working conditions: PA at parks and playgrounds, facility adequacy/appeal or qualitySociocultural: NRSocioeconomic: Covariates – SES, race; Related variables – incomeLife course exposure: NR
Principal/Food Service Director Survey of School Food Policies(Neumark-Sztainer et al., 2005)
Individual levelTo examine associations between high school student lunch patterns and vending machine purchases, and school food environment and policiesItems – NR; questionnaireN=1,088 high school studentsReliability – NR; Validity – NR
Race/ethnicity: AA, AI/AN, Hispanic, Asian, whiteSex: NRSexual identity: NRDisability: NRGeographic: Urban
Living and working conditions: Environment, policySociocultural: NRSocioeconomic: Related variables – WIC free/reduced school lunch programLife course exposure: NR
Observational System for Recording PA in Children for Preschoolers (OSRAC)(Pate et al., 2008)
Individual levelTo develop the OSRAC-Preschool Version, to measure PA levels and related factors in 3- to 5-yr-old children in preschoolsResearcher-administeredN=493 children 3-5 yrs old in 24 preschoolsReliability – inter-rater; Validity – NR
Race/ethnicity: AA, whiteSex: M/FSexual identity: NRDisability: NRGeographic: NR
Living and working conditions: NRSociocultural: NRSocioeconomic: Covariates – SES, race; Related variables – educationLife course exposure: NR
TABLE E-5 Continued

Copyright © National Academy of Sciences. All rights reserved.
Evaluating Obesity Prevention Efforts: A Plan for Measuring Progress
Evaluating Obesity Prevention Efforts394
Tool/Method
Level, purpose, description, sample size, psychometric properties
Population at risk: race/ethnicity; sex; sexual identity; disability; geographic location
Social determinants:living and working conditions; sociocultural; socioeconomic; life course exposure
Objectively Measured Access to Recreational Facilities(Scott et al., 2007)
Community levelTo examine relationship between number and proximity of PA facilities and perceptions; compare objective and self-report measures as predictors of PA; GIS protocolN=1,367 girlsReliability – NR; Validity – predictive
Race/ethnicity: AA, Hispanic, whiteSex: FemaleSexual identity: NRDisability: NRGeographic: Urban
Living and working conditions: Facility access/availability/proximity Sociocultural: NRSocioeconomic: Covariates – SES, raceLife course exposure: NR
Perceived Access to Recreational Facilities (Scott et al., 2007)
Individual level To examine relationship between number and proximity of PA facilities and perceptions; compare objective and self-report measures as predictors of PA; GIS protocolSelf-administered questionnaireN=1367 girlsReliability – NR; Validity – predictive
Race/ethnicity: AA, Hispanic, whiteSex: FemaleSexual identity: NRDisability: NRGeographic: NR
Living and working conditions: PA environment, recreational facilitiesSociocultural: NRSocioeconomic: Covariates – SES, raceLife course exposure: NR
Girls’ Health Enrichment Multi-Site Studies (GEMS) Measures(Story et al., 2003a)
Individual level Development of an after-school obesity-prevention program for AA girls; part of the GEMS project to test interventions designed to reduce excess weight gainSelf-administeredN=54 girls 6-11 yrs oldReliability – internal consistency; Validity – NR
Race/ethnicity: AASex: FemaleSexual identity: NRDisability: NRGeographic: NR
Living and working conditions: Availability, access, home environmentSociocultural: Individual variables related to diet, PA, and body image; Covariates – knowledge, psychological factors (e.g., self-efficacy, beliefs, preferences)Socioeconomic: Related variables – low income, education, female headed households, home ownership/valuesLife course exposure: NR
GEMS Measure: Low Fat Food Practices(Story et al., 2003a)
25 items
TABLE E-5 Continued

Copyright © National Academy of Sciences. All rights reserved.
Evaluating Obesity Prevention Efforts: A Plan for Measuring Progress
395Appendix E
continued
Tool/Method
Level, purpose, description, sample size, psychometric properties
Population at risk: race/ethnicity; sex; sexual identity; disability; geographic location
Social determinants:living and working conditions; sociocultural; socioeconomic; life course exposure
GEMS Measure: Obesity Prevention Questionnaire(Story et al., 2003a)
Items – NR
GEMS Measure: Weight Control Behaviors(Story et al., 2003a)
Items – NRReliability – internal consistency
GEMS Measure: Perceived Food Availability Questionnaire (Story et al., 2003a)
31 itemsReliability – internal consistency
GEMS Measure: Availability of Lower-Fat and Higher-Fat Foods(Story et al., 2003a)
29 itemsReliability – internal consistency
GEMS Measure: Self-Efficacy for Healthy Food Preparation (Story et al., 2003a)
10 itemsReliability – internal consistency
GEMS Measure: GEMS Activity Questionnaire(Story et al., 2003a)
28 items
GEMS Measure: Motivation for Healthy Eating(Story et al., 2003a)
5 itemsReliability – internal consistency
TABLE E-5 Continued

Copyright © National Academy of Sciences. All rights reserved.
Evaluating Obesity Prevention Efforts: A Plan for Measuring Progress
Evaluating Obesity Prevention Efforts396
Tool/Method
Level, purpose, description, sample size, psychometric properties
Population at risk: race/ethnicity; sex; sexual identity; disability; geographic location
Social determinants:living and working conditions; sociocultural; socioeconomic; life course exposure
GEMS Measure: Motivation for Physical Activity(Story et al., 2003a)
2 itemsReliability – internal consistency
GEMS Measure: Physical Activity Outcome Expectancies(Story et al., 2003a)
17 itemsReliability – internal consistency
GEMS Measure: Physical Activity Preference(Story et al., 2003a)
17 itemsReliability – internal consistency
GEMS Measure: Parent Encouragement for Healthy Eating(Story et al., 2003a)
5 itemsReliability – internal consistency
GEMS Measure: Physical Activity Self-Concept for 8-10 year olds(Story et al., 2003a)
4 itemsReliability – internal consistency
GEMS Measure: Diet Knowledge for 8-10 year olds(Story et al., 2003a)
6 items
GEMS Measure: TV Viewing Questionnaire for 8-10 year olds(Story et al., 2003a)
4 itemsReliability – internal consistency
TABLE E-5 Continued
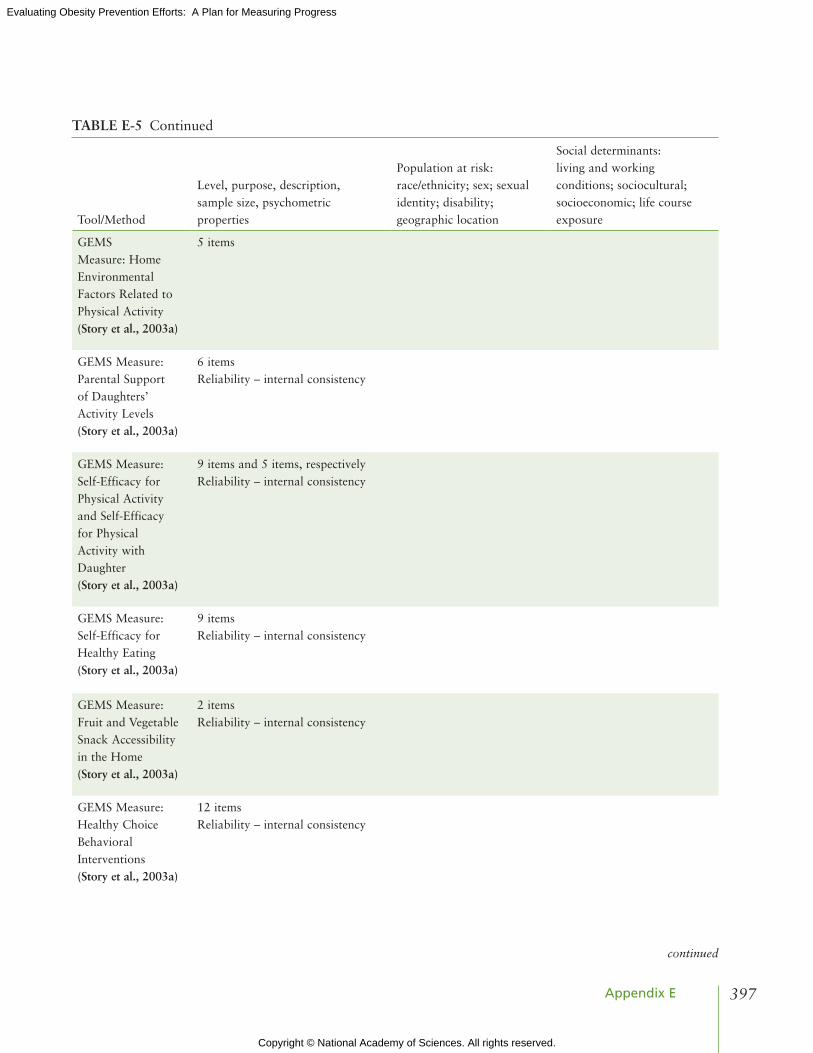
Copyright © National Academy of Sciences. All rights reserved.
Evaluating Obesity Prevention Efforts: A Plan for Measuring Progress
397Appendix E
continued
Tool/Method
Level, purpose, description, sample size, psychometric properties
Population at risk: race/ethnicity; sex; sexual identity; disability; geographic location
Social determinants:living and working conditions; sociocultural; socioeconomic; life course exposure
GEMS Measure: Home Environmental Factors Related to Physical Activity(Story et al., 2003a)
5 items
GEMS Measure: Parental Support of Daughters’ Activity Levels(Story et al., 2003a)
6 itemsReliability – internal consistency
GEMS Measure: Self-Efficacy for Physical Activity and Self-Efficacy for Physical Activity with Daughter(Story et al., 2003a)
9 items and 5 items, respectivelyReliability – internal consistency
GEMS Measure: Self-Efficacy for Healthy Eating (Story et al., 2003a)
9 itemsReliability – internal consistency
GEMS Measure: Fruit and Vegetable Snack Accessibility in the Home(Story et al., 2003a)
2 itemsReliability – internal consistency
GEMS Measure: Healthy Choice Behavioral Interventions(Story et al., 2003a)
12 itemsReliability – internal consistency
TABLE E-5 Continued

Copyright © National Academy of Sciences. All rights reserved.
Evaluating Obesity Prevention Efforts: A Plan for Measuring Progress
Evaluating Obesity Prevention Efforts398
Tool/Method
Level, purpose, description, sample size, psychometric properties
Population at risk: race/ethnicity; sex; sexual identity; disability; geographic location
Social determinants:living and working conditions; sociocultural; socioeconomic; life course exposure
School Lunch Menu and Recipe Survey(Story et al., 2003a)
Organizational levelTo collect 5 consecutive days of school lunch menu items collected from 20 control and 21 intervention schools at 4 time periods; nutrient content analyzedItems – NR; third-party, researcher-administered logN=1,700 AI childrenReliability – NR; Validity – NR
Race/ethnicity: AI/ANSex: M/FSexual identity: NRDisability: NRGeographic: NR
Living and working conditions: Food accessibility, availability, quality, policy/practiceSociocultural: NRSocioeconomic: Related variables – WIC free/reduced school lunch programLife course exposure: NR
School Health Policies and Programs Study Survey(Taber et al., 2011)
Community levelTo assess whether states required or recommended that schools prohibit junk food in vending machines, snack bars, concession stands, and parties from the 2000 and 2006 School Health Policies and Programs Study; state policies collected through computer-assisted telephone interviews or self-administered mailed questionnaires to school personnel and compared with Youth Risk Behavior Survey)GIS methodsN=33 statesReliability – NR; Validity – NR
Race/ethnicity: AA, AI/AN, Hispanic, Asian,HI/PI, whiteSex: FemaleSexual identity: NRDisability: NRGeographic: NR
Living and working conditions: Policy/practice Sociocultural: NRSocioeconomic: Related variables – incomeLength of exposure: NR
TABLE E-5 Continued

Copyright © National Academy of Sciences. All rights reserved.
Evaluating Obesity Prevention Efforts: A Plan for Measuring Progress
399Appendix E
Tool/Method
Level, purpose, description, sample size, psychometric properties
Population at risk: race/ethnicity; sex; sexual identity; disability; geographic location
Social determinants:living and working conditions; sociocultural; socioeconomic; life course exposure
Healthy Food Items Checklist for Elementary School Food Environments(Tester et al., 2011)
Community levelTo survey the range of food outlets around schools and examine how the availability of healthy food in the food stores encountered varies by income status of the school and by store participation in WIC food assistance program; existing data; GIS protocol/detailed description; GIS methods28 items; environmental observationN=NR, 52 elementary schools and food outlets within network buffer zonesReliability – NR; Validity – NR
Race/ethnicity: AA, Hispanic, Asian, whiteSex: M/F Sexual identity: NRDisability: NRGeographic: NR
Living and working conditions: Availability and access to food quality grocery stores/schools Sociocultural: NRSocioeconomic: Covariates – SES, race; Related variables – low-income population only, WIC, free/reduced school lunch programLength of exposure: NR
NOTES: AA = African American, AI = American Indian; AN = Alaska Native; F = female; GIS = geographic information systems; HI/PI = Hawaiian/Pacific Islander; M = male; NR = not relevant; PA = physical activity; SES = socioeconomic status; WIC = Special Supplemental Nutrition Program for Women, Infants, and Children.
TABLE E-5 Continued

Copyright © National Academy of Sciences. All rights reserved.
Evaluating Obesity Prevention Efforts: A Plan for Measuring Progress

Copyright © National Academy of Sciences. All rights reserved.
Evaluating Obesity Prevention Efforts: A Plan for Measuring Progress
401
FNational Plan Resources
Included in this appendix:
• TABLE F-1 International Evaluation Plans and Activities• TABLE F-2 Examples of National Surveillance and Evaluation Systems• TABLE F-3 Comprehensive State Obesity Prevention, Physical Activity, and Nutrition Plans

Copyright © National Academy of Sciences. All rights reserved.
Evaluating Obesity Prevention Efforts: A Plan for Measuring Progress
Evaluating Obesity Prevention Efforts402
TABLE F-1 International Evaluation Plans and Activities
Country or Organization Evaluation Plan or Activity Description Reference
Australia National Obesity Taskforce A national action agenda identifying actions and outcomes to monitor the progress of setting-specific strategies, monitoring of performance and evidence, and outcomes for coordination and capacity building for children, young people, and families
Commonwealth of Australia, 2003
Australia Indigenous Chronic Disease Package
Strategies for and a monitoring and evaluation framework to reach targets for closing the gap between Indigenous and non-Indigenous Australians (reducing health disparities)
Australian Government Department of Health and Aging, 2010
EPODE (Together Let’s Prevent Childhood Obesity) European Network
EPODE European Network Recommendations
Recommendations for the implementation of community-based interventions aimed at preventing childhood obesityA Scientific Evaluation and Dissemination Committee is developing the EPODE evaluation “how to” on a large scale
Borys et al., 2011
European Commission
European Union Platform for Action on Diet, Physical Activity, and Health
Common monitoring framework for each member country published in annual reports Platform emphasizes policy interventions at governmental levels, including marketing of unhealthful foods; availability of processed foods with reduced total fat or added sugar; guidelines for physical activity; inclusion of physical and nutrition education in schools; strengthening of monitoring systems; community-based interventions
European Commission, 2005, 2007, 2010, 2013b,c
European Commission
European Community Health Indicators
A list of common indicators to facilitate cross-country comparisons
European Commission, 2013a

Copyright © National Academy of Sciences. All rights reserved.
Evaluating Obesity Prevention Efforts: A Plan for Measuring Progress
403Appendix F
Country or Organization Evaluation Plan or Activity Description Reference
United Kingdom Cross-Government Strategy Components include (1) indicators for achieving the vision; (2) activities to achieve the vision; (3) building a Coalition for Better Health, a Cabinet Committee on Health and Well-being, a Cabinet Committee on Families, Children, and Young People, and a cross-government obesity advisory group to help develop dialogue, intersectoral, and other needed infrastructural supports; provide cross-sector/government leadership; monitoring; and (4) performing the work to report to the Committees and build the evidence baseOne-year progress and monitoring reports from this “cross-government strategy” include a set of leading indicators and outcome indicators
UK Department of Health and Department of Children, Schools, and Families, 2008
United Kingdom Change4Life, evaluated by the Department of Health
Messages promote 8 key behaviors: sugar swaps, 5-a-day, meal time, bite-size meals, 60 active minutes, cut back fat, up & about, and snack check
National Social Marketing Centre, 2006; UK Department of Health, 2010a
United Kingdom Strategy and Call to Action from the UK Coalition of Health(and the Public Health Responsibility Deal)
Focus is the role of the local decision makers and the connection to the government’s role as a national leader and support for guidance A “National Ambition Review Group” reviews progress on obesityEquality Analysis template helps account for fair and just action
Equality and Inclusion Team, 2011; UK Department of Health, 2010b, 2011
World Health Organization (WHO)/Europe member states (21 countriesa)
WHO European Childhood Obesity Surveillance Initiative (COSI)
Coordination that harmonized surveillance systems for childhood obesity across the European Region. Supplements the ongoing, country-specific obesity monitoring. Targets measured body mass index surveillance for children aged 6 to 9 yrs old
WHO, 2013; Wijnhoven et al., 2013
a 21 counties established the Childhood Obesity Surveillance Initiative (COSI), and as of the 2009/2010 data collection period 17 counties have participated.
TABLE F-1 Continued

Copyright © National Academy of Sciences. All rights reserved.
Evaluating Obesity Prevention Efforts: A Plan for Measuring Progress
404
TA
BL
E F
-2 E
xam
ples
of
Nat
iona
l Sur
veill
ance
and
Eva
luat
ion
Syst
ems*
Dat
a So
urce
and
Web
site
Spon
sor
Freq
uenc
y of
Dat
a U
pdat
es
Sam
ple
Des
ign
(if
appl
icab
le)
and
Sam
ple
Size
Targ
et P
opul
atio
n (o
r C
ompo
nent
s)
Lev
el o
f E
stim
ates
or
Dat
a A
vaila
ble
Com
men
ts
Ear
ly C
hild
hood
Lon
gitu
dina
l St
udy-
Bir
th (
EC
LS-
B)
and
Kin
derg
arte
n (E
CL
S-K
) ht
tp://
nces
.ed.
gov/
ecls
/inde
x.as
pen
DoE
D2
prev
ious
coh
orts
: 20
01 b
irth
coh
ort;
19
98-1
999
K-c
ohor
t fo
llow
ed
thro
ugh
8th
grad
e
2010
-201
1 K
-coh
ort
follo
wed
th
roug
h 5t
h gr
ade
Nat
iona
l sam
ple
of
child
ren
in 3
coh
orts
L
ongi
tudi
nal
follo
w-u
p
Chi
ldre
n fr
om b
irth
or
kind
erga
rten
thr
ough
m
iddl
e sc
hool
Nat
iona
lM
easu
red
he
ight
and
w
eigh
tFo
od
cons
umpt
ion
at h
ome
and
scho
ol
Ear
ly H
ead
Star
t Fa
mily
and
C
hild
exp
erie
nces
Sur
vey
(Bab
y FA
CE
S)ht
tp://
ww
w.a
cf.h
hs.g
ov/
prog
ram
s/op
re/r
esea
rch/
proj
ect/
earl
y-he
ad-s
tart
-fam
ily-
and-
child
-exp
erie
nces
-stu
dy-
baby
- fa
ces
HH
S/A
CF
Peri
odic
200
7-20
14C
ohor
t st
udy
(thr
ough
ag
e 3
year
s)R
epre
sent
ativ
e sa
mpl
e of
89
Ear
ly H
ead
Star
t pr
ogra
ms
in 2
009
and
2 co
hort
s of
fam
ilies
: (1
) a
peri
nata
l gro
up
and
(2)
a gr
oup
of
infa
nts
abou
t 1
yrs
old
Chi
ldre
n in
Ear
ly
Hea
d St
art
Nat
iona
lB
reas
tfee
ding
In
fant
fee
ding
pr
acti
ces
Die
t an
d
acti
vity
be
havi
ors
Chi
ld c
are
Food
Env
iron
men
t A
tlas
http
://w
ww
.ers
.usd
a.go
v/da
ta-p
rodu
cts/
food
-env
iron
men
t-at
las
USD
A/E
RS
Ong
oing
Ass
embl
es s
tati
stic
s on
foo
d en
viro
nmen
t in
dica
tors
Var
ies
Var
ies
Food
en
viro
nmen
t
Hea
d St
art
Fam
ily a
nd C
hild
E
xper
ienc
es S
urve
y (F
AC
ES)
http
://w
ww
.acf
.hhs
.gov
/pr
ogra
ms/
opre
/res
earc
h/pr
ojec
t/he
ad-s
tart
-fam
ily-
and-
child
-exp
erie
nces
- su
rvey
-fac
es-1
997-
2013
HH
S/A
CF
Peri
odic
199
7-20
13C
ohor
t st
udy
Sam
ples
of
Hea
d St
art
fam
ilies
, chi
ldre
n, a
nd
prog
ram
s65
pro
gram
s,
130
cent
ers,
486
cl
assr
oom
s, a
nd 3
,718
ch
ildre
n in
200
9 FA
CE
S
Chi
ldre
n in
Hea
d St
art
Nat
iona
lD
iet
and
acti
vity
be
havi
ors
Chi
ld c
are
Hea
lth
and
Die
t Su
rvey
ht
tp://
ww
w.f
da.g
ov/F
ood/
Food
Scie
nceR
esea
rch/
Con
sum
erB
ehav
ior
Res
earc
h/uc
m19
3895
.htm
HH
S/FD
APe
riod
ic19
82-2
008
Cro
ss-s
ecti
onal
ra
ndom
-dig
it-d
ial
tele
phon
e su
rvey
Non
inst
itut
iona
lized
ad
ults
in 5
0 st
ates
and
D
C
Nat
iona
lC
onsu
mer
kn
owle
dge,
at
titu
des,
and
pr
acti
ces
on d
iet
Nat
iona
l Hou
seho
ld
Edu
cati
on S
urve
ys P
rogr
am
(NH
ES)
http
://nc
es.e
d.go
v/nh
es
DoE
DE
very
oth
er y
ear
Prov
ides
des
crip
tive
da
ta o
n th
e ed
ucat
iona
l act
ivit
ies
of t
he U
.S. p
opul
atio
n an
d of
fers
res
earc
hers
, ed
ucat
ors,
and
pol
icy
mak
ers
a va
riet
y of
sta
tist
ics
on t
he
cond
itio
n of
edu
cati
on
in t
he U
nite
d St
ates
Pres
choo
l-ag
e th
roug
h ad
ults
N
atio
nal
Reg
iona
lE
arly
chi
ld c
are
Bef
ore
and
afte
r-sc
hool
car
e of
sch
ool-
age
child
ren
Nat
iona
l Hou
seho
ld F
ood
Acq
uisi
tion
and
Pur
chas
e Su
rvey
(Fo
odA
PS)
http
://w
ww
.ers
.usd
a.go
v/to
pics
/foo
d-nu
trit
ion-
assi
stan
ce/s
uppl
emen
tal-
nutr
itio
n-as
sist
ance
-pro
gram
-%
28sn
ap%
29/n
atio
nal-
food
-st
udy.
aspx
#.U
XQ
DT
Mqy
PTo
USD
A/E
RS
2012
Cro
ss-s
ecti
onal
stu
dy
of h
ouse
hold
s, 7
-day
di
arie
s of
foo
ds
purc
hase
d/ac
quir
ed a
t ho
me
and
away
fro
m
hom
e
Supp
lem
enta
l N
utri
tion
Ass
ista
nce
Prog
ram
(SN
AP)
pa
rtic
ipan
ts a
nd n
on-
SNA
P pa
rtic
ipan
ts
Nat
iona
lFo
od
envi
ronm
ent
Food
pur
chas
es
and
shop
ping
be
havi
orFo
od s
ecur
ity

Copyright © National Academy of Sciences. All rights reserved.
Evaluating Obesity Prevention Efforts: A Plan for Measuring Progress
405
TA
BL
E F
-2 E
xam
ples
of
Nat
iona
l Sur
veill
ance
and
Eva
luat
ion
Syst
ems*
Dat
a So
urce
and
Web
site
Spon
sor
Freq
uenc
y of
Dat
a U
pdat
es
Sam
ple
Des
ign
(if
appl
icab
le)
and
Sam
ple
Size
Targ
et P
opul
atio
n (o
r C
ompo
nent
s)
Lev
el o
f E
stim
ates
or
Dat
a A
vaila
ble
Com
men
ts
Ear
ly C
hild
hood
Lon
gitu
dina
l St
udy-
Bir
th (
EC
LS-
B)
and
Kin
derg
arte
n (E
CL
S-K
) ht
tp://
nces
.ed.
gov/
ecls
/inde
x.as
pen
DoE
D2
prev
ious
coh
orts
: 20
01 b
irth
coh
ort;
19
98-1
999
K-c
ohor
t fo
llow
ed
thro
ugh
8th
grad
e
2010
-201
1 K
-coh
ort
follo
wed
th
roug
h 5t
h gr
ade
Nat
iona
l sam
ple
of
child
ren
in 3
coh
orts
L
ongi
tudi
nal
follo
w-u
p
Chi
ldre
n fr
om b
irth
or
kind
erga
rten
thr
ough
m
iddl
e sc
hool
Nat
iona
lM
easu
red
he
ight
and
w
eigh
tFo
od
cons
umpt
ion
at h
ome
and
scho
ol
Ear
ly H
ead
Star
t Fa
mily
and
C
hild
exp
erie
nces
Sur
vey
(Bab
y FA
CE
S)ht
tp://
ww
w.a
cf.h
hs.g
ov/
prog
ram
s/op
re/r
esea
rch/
proj
ect/
earl
y-he
ad-s
tart
-fam
ily-
and-
child
-exp
erie
nces
-stu
dy-
baby
- fa
ces
HH
S/A
CF
Peri
odic
200
7-20
14C
ohor
t st
udy
(thr
ough
ag
e 3
year
s)R
epre
sent
ativ
e sa
mpl
e of
89
Ear
ly H
ead
Star
t pr
ogra
ms
in 2
009
and
2 co
hort
s of
fam
ilies
: (1
) a
peri
nata
l gro
up
and
(2)
a gr
oup
of
infa
nts
abou
t 1
yrs
old
Chi
ldre
n in
Ear
ly
Hea
d St
art
Nat
iona
lB
reas
tfee
ding
In
fant
fee
ding
pr
acti
ces
Die
t an
d
acti
vity
be
havi
ors
Chi
ld c
are
Food
Env
iron
men
t A
tlas
http
://w
ww
.ers
.usd
a.go
v/da
ta-p
rodu
cts/
food
-env
iron
men
t-at
las
USD
A/E
RS
Ong
oing
Ass
embl
es s
tati
stic
s on
foo
d en
viro
nmen
t in
dica
tors
Var
ies
Var
ies
Food
en
viro
nmen
t
Hea
d St
art
Fam
ily a
nd C
hild
E
xper
ienc
es S
urve
y (F
AC
ES)
http
://w
ww
.acf
.hhs
.gov
/pr
ogra
ms/
opre
/res
earc
h/pr
ojec
t/he
ad-s
tart
-fam
ily-
and-
child
-exp
erie
nces
- su
rvey
-fac
es-1
997-
2013
HH
S/A
CF
Peri
odic
199
7-20
13C
ohor
t st
udy
Sam
ples
of
Hea
d St
art
fam
ilies
, chi
ldre
n, a
nd
prog
ram
s65
pro
gram
s,
130
cent
ers,
486
cl
assr
oom
s, a
nd 3
,718
ch
ildre
n in
200
9 FA
CE
S
Chi
ldre
n in
Hea
d St
art
Nat
iona
lD
iet
and
acti
vity
be
havi
ors
Chi
ld c
are
Hea
lth
and
Die
t Su
rvey
ht
tp://
ww
w.f
da.g
ov/F
ood/
Food
Scie
nceR
esea
rch/
Con
sum
erB
ehav
ior
Res
earc
h/uc
m19
3895
.htm
HH
S/FD
APe
riod
ic19
82-2
008
Cro
ss-s
ecti
onal
ra
ndom
-dig
it-d
ial
tele
phon
e su
rvey
Non
inst
itut
iona
lized
ad
ults
in 5
0 st
ates
and
D
C
Nat
iona
lC
onsu
mer
kn
owle
dge,
at
titu
des,
and
pr
acti
ces
on d
iet
Nat
iona
l Hou
seho
ld
Edu
cati
on S
urve
ys P
rogr
am
(NH
ES)
http
://nc
es.e
d.go
v/nh
es
DoE
DE
very
oth
er y
ear
Prov
ides
des
crip
tive
da
ta o
n th
e ed
ucat
iona
l act
ivit
ies
of t
he U
.S. p
opul
atio
n an
d of
fers
res
earc
hers
, ed
ucat
ors,
and
pol
icy
mak
ers
a va
riet
y of
sta
tist
ics
on t
he
cond
itio
n of
edu
cati
on
in t
he U
nite
d St
ates
Pres
choo
l-ag
e th
roug
h ad
ults
N
atio
nal
Reg
iona
lE
arly
chi
ld c
are
Bef
ore
and
afte
r-sc
hool
car
e of
sch
ool-
age
child
ren
Nat
iona
l Hou
seho
ld F
ood
Acq
uisi
tion
and
Pur
chas
e Su
rvey
(Fo
odA
PS)
http
://w
ww
.ers
.usd
a.go
v/to
pics
/foo
d-nu
trit
ion-
assi
stan
ce/s
uppl
emen
tal-
nutr
itio
n-as
sist
ance
-pro
gram
-%
28sn
ap%
29/n
atio
nal-
food
-st
udy.
aspx
#.U
XQ
DT
Mqy
PTo
USD
A/E
RS
2012
Cro
ss-s
ecti
onal
stu
dy
of h
ouse
hold
s, 7
-day
di
arie
s of
foo
ds
purc
hase
d/ac
quir
ed a
t ho
me
and
away
fro
m
hom
e
Supp
lem
enta
l N
utri
tion
Ass
ista
nce
Prog
ram
(SN
AP)
pa
rtic
ipan
ts a
nd n
on-
SNA
P pa
rtic
ipan
ts
Nat
iona
lFo
od
envi
ronm
ent
Food
pur
chas
es
and
shop
ping
be
havi
orFo
od s
ecur
ity
cont
inue
d

Copyright © National Academy of Sciences. All rights reserved.
Evaluating Obesity Prevention Efforts: A Plan for Measuring Progress
406
Dat
a So
urce
and
Web
site
Spon
sor
Freq
uenc
y of
Dat
a U
pdat
es
Sam
ple
Des
ign
(if
appl
icab
le)
and
Sam
ple
Size
Targ
et P
opul
atio
n (o
r C
ompo
nent
s)
Lev
el o
f E
stim
ates
or
Dat
a A
vaila
ble
Com
men
ts
SNA
P Po
licy
Dat
abas
e ht
tp://
ww
w.e
rs.u
sda.
gov/
data
-pr
oduc
ts/s
nap-
polic
y-da
taba
se.
aspx
#.U
X5f
NqL
kuSo
USD
APe
riod
ic50
sta
tes
and
DC
(d
ata
prov
ided
fro
m
Janu
ary
1996
thr
ough
D
ecem
ber
2011
)
Stat
e SN
AP-
Ed
prog
ram
sSt
ate
Stat
e an
d L
ocal
Are
a In
tegr
ated
Tel
epho
ne S
urve
y (S
LA
ITS)
http
://w
ww
.cdc
.gov
/nch
s/sl
aits
.ht
m
USD
A/C
DC
Peri
odic
R
ando
m-d
igit
-dia
l su
pple
men
t dr
awn
from
the
Nat
iona
l Im
mun
izat
ion
Surv
ey
sam
ple
fram
e
Adu
lts
and
child
ren
(dep
endi
ng o
n su
rvey
ye
ar)
Stat
e L
ocal
are
aH
ealt
h ca
re
Stat
e lic
ensi
ng r
egul
atio
ns f
or
phys
ical
act
ivit
y in
chi
ld c
are
http
://nr
ckid
s.or
g/St
ates
/sta
tes.
ht
Nat
iona
l R
esou
rce
Cen
ter
for
Hea
lth
and
Safe
ty in
Chi
ld
Car
e an
d E
arly
E
duca
tion
Ong
oing
St
ate
licen
sing
an
d re
gula
tion
in
form
atio
n, s
tate
s co
ntac
ted
twic
e a
year
to
ver
ify
accu
racy
of
info
rmat
ion
on
regu
lati
ons
50 s
tate
s, D
C, P
uert
o R
ico,
and
the
Vir
gin
Isla
nds
Nat
iona
lSt
ate
Chi
ld c
are
Stud
ies
of C
hild
and
Adu
lt
Car
e Fo
od P
rogr
am (
CA
CFP
)ht
tp://
ww
w.f
ns.u
sda.
gov/
cacf
p/ch
ild-a
nd-a
dult
-car
e-fo
od-
prog
ram
-cac
fp
USD
A/F
NS
Chi
ld C
are
Food
Pr
ogra
m b
egan
in
196
8; n
ame
chan
ged
in 1
990
Day
car
e pr
ogra
ms
w/
CA
CFP
Chi
ldre
n an
d ad
ults
re
ceiv
ing
day
care
se
rvic
es in
CA
CFP
Chi
ldre
n to
ag
e 18
yrs
old
an
d ad
ults
Chi
ld c
are
m
eals
and
sn
acks
Adu
lt d
ay c
are
mea
ls a
nd
snac
ks
Stud
ies
of S
peci
al
Supp
lem
enta
l Nut
riti
on
Prog
ram
for
Wom
en,
Infa
nts
,and
Chi
ldre
n (W
IC)
Part
icip
ants
ht
tp://
ww
w.f
ns.u
sda.
gov/
Ora
/m
enu/
Publ
ishe
d/W
IC/W
IC.
htm
USD
A/F
NS
Bie
nnia
l sin
ce 1
992
(mul
tipl
e st
udie
s)C
ross
-sec
tion
alV
arie
s by
sur
vey
Part
icip
ants
in W
IC
Nat
iona
lB
reas
tfee
ding
Infa
nt f
eedi
ng
prac
tice
sW
IC p
olic
ies
and
prac
tice
s
* In
add
itio
n to
the
nat
iona
l an
d st
ate
surv
eys
desc
ribe
d in
Cha
pter
6,
a fu
ll lis
t of
ind
icat
or d
ata
sour
ces
draw
n fr
om c
urre
nt s
tudi
es c
an b
e fo
und
in A
ppen
dix
D,
Tabl
e D
-1.
App
endi
x F,
Tab
le F
-2,
lists
exa
mpl
es o
f na
tion
al s
urve
illan
ce a
nd e
valu
atio
n sy
stem
dat
a so
urce
s th
at c
an b
e co
nsid
ered
for
the
ir p
oten
tial
bas
ed o
n th
e sp
ecif
ic m
easu
res,
tar
get
popu
lati
on, a
nd le
vel o
f th
e da
ta d
esir
ed f
or in
dica
tors
. N
OT
ES:
AC
F =
Adm
inis
trat
ion
for
Chi
ldre
n an
d Fa
mili
es; C
DC
= C
ente
rs f
or D
isea
se C
ontr
ol a
nd P
reve
ntio
n; D
oED
= D
epar
tmen
t of
Edu
cati
on; E
RS
= E
cono
mic
Res
earc
h Se
rvic
e;
FDA
= F
eder
al D
rug
Adm
inis
trat
ion;
FN
S =
Food
and
Nut
riti
on S
ervi
ce; H
HS
= H
ealt
h an
d H
uman
Ser
vice
s; S
NA
P-E
d =
Supp
lem
enta
l Nut
riti
on A
ssis
tanc
e Pr
ogra
m-E
duca
tion
;USD
A
= U
.S. D
epar
tmen
t of
Agr
icul
ture
.
TA
BL
E F
-2 C
onti
nued

Copyright © National Academy of Sciences. All rights reserved.
Evaluating Obesity Prevention Efforts: A Plan for Measuring Progress
407
Dat
a So
urce
and
Web
site
Spon
sor
Freq
uenc
y of
Dat
a U
pdat
es
Sam
ple
Des
ign
(if
appl
icab
le)
and
Sam
ple
Size
Targ
et P
opul
atio
n (o
r C
ompo
nent
s)
Lev
el o
f E
stim
ates
or
Dat
a A
vaila
ble
Com
men
ts
SNA
P Po
licy
Dat
abas
e ht
tp://
ww
w.e
rs.u
sda.
gov/
data
-pr
oduc
ts/s
nap-
polic
y-da
taba
se.
aspx
#.U
X5f
NqL
kuSo
USD
APe
riod
ic50
sta
tes
and
DC
(d
ata
prov
ided
fro
m
Janu
ary
1996
thr
ough
D
ecem
ber
2011
)
Stat
e SN
AP-
Ed
prog
ram
sSt
ate
Stat
e an
d L
ocal
Are
a In
tegr
ated
Tel
epho
ne S
urve
y (S
LA
ITS)
http
://w
ww
.cdc
.gov
/nch
s/sl
aits
.ht
m
USD
A/C
DC
Peri
odic
R
ando
m-d
igit
-dia
l su
pple
men
t dr
awn
from
the
Nat
iona
l Im
mun
izat
ion
Surv
ey
sam
ple
fram
e
Adu
lts
and
child
ren
(dep
endi
ng o
n su
rvey
ye
ar)
Stat
e L
ocal
are
aH
ealt
h ca
re
Stat
e lic
ensi
ng r
egul
atio
ns f
or
phys
ical
act
ivit
y in
chi
ld c
are
http
://nr
ckid
s.or
g/St
ates
/sta
tes.
ht
Nat
iona
l R
esou
rce
Cen
ter
for
Hea
lth
and
Safe
ty in
Chi
ld
Car
e an
d E
arly
E
duca
tion
Ong
oing
St
ate
licen
sing
an
d re
gula
tion
in
form
atio
n, s
tate
s co
ntac
ted
twic
e a
year
to
ver
ify
accu
racy
of
info
rmat
ion
on
regu
lati
ons
50 s
tate
s, D
C, P
uert
o R
ico,
and
the
Vir
gin
Isla
nds
Nat
iona
lSt
ate
Chi
ld c
are
Stud
ies
of C
hild
and
Adu
lt
Car
e Fo
od P
rogr
am (
CA
CFP
)ht
tp://
ww
w.f
ns.u
sda.
gov/
cacf
p/ch
ild-a
nd-a
dult
-car
e-fo
od-
prog
ram
-cac
fp
USD
A/F
NS
Chi
ld C
are
Food
Pr
ogra
m b
egan
in
196
8; n
ame
chan
ged
in 1
990
Day
car
e pr
ogra
ms
w/
CA
CFP
Chi
ldre
n an
d ad
ults
re
ceiv
ing
day
care
se
rvic
es in
CA
CFP
Chi
ldre
n to
ag
e 18
yrs
old
an
d ad
ults
Chi
ld c
are
m
eals
and
sn
acks
Adu
lt d
ay c
are
mea
ls a
nd
snac
ks
Stud
ies
of S
peci
al
Supp
lem
enta
l Nut
riti
on
Prog
ram
for
Wom
en,
Infa
nts
,and
Chi
ldre
n (W
IC)
Part
icip
ants
ht
tp://
ww
w.f
ns.u
sda.
gov/
Ora
/m
enu/
Publ
ishe
d/W
IC/W
IC.
htm
USD
A/F
NS
Bie
nnia
l sin
ce 1
992
(mul
tipl
e st
udie
s)C
ross
-sec
tion
alV
arie
s by
sur
vey
Part
icip
ants
in W
IC
Nat
iona
lB
reas
tfee
ding
Infa
nt f
eedi
ng
prac
tice
sW
IC p
olic
ies
and
prac
tice
s
* In
add
itio
n to
the
nat
iona
l an
d st
ate
surv
eys
desc
ribe
d in
Cha
pter
6,
a fu
ll lis
t of
ind
icat
or d
ata
sour
ces
draw
n fr
om c
urre
nt s
tudi
es c
an b
e fo
und
in A
ppen
dix
D,
Tabl
e D
-1.
App
endi
x F,
Tab
le F
-2,
lists
exa
mpl
es o
f na
tion
al s
urve
illan
ce a
nd e
valu
atio
n sy
stem
dat
a so
urce
s th
at c
an b
e co
nsid
ered
for
the
ir p
oten
tial
bas
ed o
n th
e sp
ecif
ic m
easu
res,
tar
get
popu
lati
on, a
nd le
vel o
f th
e da
ta d
esir
ed f
or in
dica
tors
. N
OT
ES:
AC
F =
Adm
inis
trat
ion
for
Chi
ldre
n an
d Fa
mili
es; C
DC
= C
ente
rs f
or D
isea
se C
ontr
ol a
nd P
reve
ntio
n; D
oED
= D
epar
tmen
t of
Edu
cati
on; E
RS
= E
cono
mic
Res
earc
h Se
rvic
e;
FDA
= F
eder
al D
rug
Adm
inis
trat
ion;
FN
S =
Food
and
Nut
riti
on S
ervi
ce; H
HS
= H
ealt
h an
d H
uman
Ser
vice
s; S
NA
P-E
d =
Supp
lem
enta
l Nut
riti
on A
ssis
tanc
e Pr
ogra
m-E
duca
tion
;USD
A
= U
.S. D
epar
tmen
t of
Agr
icul
ture
.

Copyright © National Academy of Sciences. All rights reserved.
Evaluating Obesity Prevention Efforts: A Plan for Measuring Progress
Evaluating Obesity Prevention Efforts408
TABLE F-3 Comprehensive State Obesity Prevention, Physical Activity, and Nutrition Plans
State Title Website
Alabama Strategic Plan for the Prevention and Control of Overweight and Obesity in Alabama
http://www.adph.org/NUTRITION/assets/ObesityPlan.pdf
Alaska Alaska in Action: Statewide Physical Activity & Nutrition Plan
http://dhss.alaska.gov/Documents/Publications/alaskaInAction.pdf
Arizona Arizona Nutrition and Physical Activity State Plan
http://physicalactivityplan.org/resources/PA-Plans/ArizonaPA.pdf
Arkansas Changing the Culture of Health in Arkansas
http://www.healthy.arkansas.gov/programsServices/healthStatistics/Brfss/Documents/publications/Other/chronic_disease_plan2006.pdf
California California Obesity Prevention Plan: A Vision for Tomorrow, Strategic Actions for Today
http://www.cdph.ca.gov/programs/COPP/Documents/COPP-ObesityPreventionPlan-2010.pdf.pdf
Colorado Physical Activity and Nutrition State Plan 2010
http://www.chd.dphe.state.co.us/Resources/cms/pp/COPAN/2004stateplan.pdf
Connecticut Healthy Eating and Active Living: Connecticut’s Plan for Health Promotion
http://www.ct.gov/dph/lib/dph/state_health_planning/dphplans/obesity_hlth_promo_plan_2005.pdf
Delaware Physical Activity, Nutrition, and Obesity Prevention Comprehensive Plan
http://dhss.delaware.gov/dph/dpc/files/pano_comp_plan-09.pdf
Georgia Georgia’s Nutrition and Physical Activity Plan
http://health.state.ga.us/pdfs/familyhealth/nutrition/NutritionandPhysicalActivityPlanFINAL.pdf
Hawaii Hawaii Physical Activity and Nutrition Plan
http://www.healthyhawaii.com/images/stories/PANSummit/pan%20plan%20final.pdf
Idaho Idaho Physical Activity and Nutrition Program: Do It for Life!
http://healthandwelfare.idaho.gov/Health/IdahoPhysicalActivityandNutritionIPAN/tabid/114/Default.aspx
Illinois Illinois Strategic Plan: Promoting Healthy Eating and Physical Activity to Prevent and Control Obesity
http://www.idph.state.il.us/HealthWellness/IL_Existing_State_Plan.pdf
Indiana Indiana Healthy Weight Initiative
http://www.inhealthyweight.org/files/state_plan_final-with_cover-low.pdf
Iowa Iowans Fit For Life Plan http://www.idph.state.ia.us/iowansfitforlife/common/pdf/state_plan.pdf
Kentucky Kentucky Nutrition & Physical Activity State Action Plan 2005
http://fitky.org

Copyright © National Academy of Sciences. All rights reserved.
Evaluating Obesity Prevention Efforts: A Plan for Measuring Progress
409Appendix F
State Title Website
Louisiana Louisiana Council on Obesity Prevention and Management Strategic Plan
http://new.dhh.louisiana.gov/assets/docs/LegisReports/LA-Obesity-Council2008-2009.pdf
Maine The Maine Physical Activity and Nutrition Plan
http://www.healthymainepartnerships.org/panp/documents/226-701-05_PAN_Plan.pdf
Maryland Maryland Nutrition and Physical Activity Plan
http://www.healthyactivemaryland.org/NPA/npaplan.pdf
Michigan Michigan Healthy Eating and Physical Activity Strategic Plan: 2010-2020
http://www.michigan.gov/documents/mdch/Mi_Healthy_State_Plan_353817_7.pdf
Minnesota Minnesota Plan to Reduce Obesity and Obesity-Related Chronic Diseases
http://www.health.state.mn.us/divs/hpcd/chp/cdrr/obesity/obesityplan/obesityplan.html
Missouri Missouri Council for Activity and Nutrition Strategic Plan
http://extension.missouri.edu/mocan/MoCANstrategicplan_web.pdf
Montana Montana Nutrition and Physical Activity Program: Strategic Plan to Prevent Obesity and Other Chronic Diseases
http://www.mtnapa.com/images/1strategicplan.pdf
Nebraska Nebraska Physical Activity and Nutrition State Plan: Promoting Healthy Weight and Preventing Chronic Disease
http://dhhs.ne.gov/Documents/PANstateplan.pdf
Nevada Strategic Plan for the Prevention of Obesity in Nevada
http://health.nv.gov/PDFs/obeseplan.pdf
New Hampshire
Healthy Eating Active Living Action Plan for New Hampshire 2008
http://www.healnh.org/images/pdffiles/HEALactionPlan.pdf
New Jersey The New Jersey Obesity Prevention Action Plan
http://www.nj.gov/health/fhs/documents/obesity_prevention.pdf
New Mexico The New Mexico Plan to Promote Healthier Weight: A Comprehensive Plan to Reduce Obesity, Overweight, and Related Chronic Diseases
http://www.health.state.nm.us/pdf/NM_PPHW2006Web.pdf
New York New York State Strategic Plan for Overweight and Obesity Prevention
http://www.health.ny.gov/prevention/obesity/strategic_plan
TABLE F-3 Continued
continued

Copyright © National Academy of Sciences. All rights reserved.
Evaluating Obesity Prevention Efforts: A Plan for Measuring Progress
Evaluating Obesity Prevention Efforts410
State Title Website
North Carolina
Eat Smart, Move More: North Carolina’s Plan to Prevent Overweight, Obesity, and Related Chronic Diseases
http://www.eatsmartmovemorenc.com/ESMMPlan/Texts/ESMMPlan_Desktop.pdf
North Dakota North Dakota Healthy Eating and Physical Activity: A State Plan for Action
http://www.ndhealth.gov/NutrPhyAct/ND%20Healthy%20Eating% 20and%20Physical%20Activity%20State%20Plan.pdf
Ohio The Ohio Obesity Prevention Plan
http://www.healthyohioprogram.org/en/resources/datareports/~/ media/9B42F122F2074DB19E0A931505BE01D4.ashx
Oklahoma Get Fit Eat Smart OK: Oklahoma Physical Activity and Nutrition State Plan
http://www.ok.gov/strongandhealthy/%3Ci%3EGet_Fit_Eat_Smart%3C_i%3E_State_Plan/index.html
Oregon A Healthy Active Oregon: Statewide Physical Activity and Nutrition Plan
http://public.health.oregon.gov/PreventionWellness/PhysicalActivity/Documents/PAN_rpt_07.pdf
Pennsylvania Pennsylvania Nutrition and Physical Activity Plan to Prevent Obesity and Related Chronic Diseases
http://www.health.state.pa.us/pdf/nutrition/nutrition.pdf
Rhode Island Eat Smart Move More Rhode Island: A Plan of Action
http://www.health.ri.gov/publications/actionplans/2010InitiativeFor HealthyWeight.pdf
South Carolina Moving South Carolina Towards a Healthy Weight: Comprehensive Nutrition and Physical Activity Approaches to Address Obesity
http://www.scdhec.gov/health/chcdp/obesity/docs/StatePlanComplete.pdf
South Dakota South Dakota State Plan for Nutrition and Physical Activity to Prevent Obesity and Other Chronic Diseases
http://www.healthysd.gov/Documents/2010PlanUpdate.pdf
Tennessee Eat Well, Play More: Tennessee Statewide Nutrition and Physical Activity Plan
http://www.eatwellplaymoretn.org/plan-overview/about-the-plan
Texas Eat Smart, Be Active: Strategic Plan for the Prevention of Obesity in Texas
http://www.dshs.state.tx.us/obesity/pdf/strategic_plan.pdf
Utah Utah Nutrition and Physical Activity Plan
http://www.slideshare.net/StateofUtah/utah-nutrition-and-physical-activity-plan-20102020
TABLE F-3 Continued

Copyright © National Academy of Sciences. All rights reserved.
Evaluating Obesity Prevention Efforts: A Plan for Measuring Progress
411Appendix F
State Title Website
Vermont Fit and Healthy Vermonters: Preventing Obesity in Vermont, A Statewide Plan
http://healthvermont.gov/family/fit/documents/Obesity_Plan.pdf
Virginia Healthy Eating and Active Living Program
http://www.vdh.virginia.gov/ofhs/prevention/heal
Washington Washington State Nutrition and Physical Activity Plan
http://depts.washington.edu/waaction/plan/about/2011_update.html
West Virginia West Virginia Everyday: A Statewide Plan to Improve Physical Activity and Nutrition
http://www.wvohl.com/Portals/3/Everyday%20Final.pdf
Wisconsin Wisconsin Nutrition and Physical Activity State Plan: A Comprehensive Plan to Prevent Obesity and Reduce Chronic Disease in Wisconsin
http://www.dhs.wisconsin.gov/publications/P4/p40126.pdf
Wyoming Physical Activity and Nutrition in Children and Adolescents
http://www.health.wyo.gov/Media.aspx?mediaId=12553
NOTE: Four states (Florida, Kansas, Massachusetts, and Mississippi) and the District of Columbia do not have formal comprehensive state plans.
TABLE F-3 Continued

Copyright © National Academy of Sciences. All rights reserved.
Evaluating Obesity Prevention Efforts: A Plan for Measuring Progress
Evaluating Obesity Prevention Efforts412
REFERENCES
Australian Government Department of Health and Aging. 2010. Indigenous Chronic Disease Package monitoring
and evaluation framework. http://www.health.gov.au/internet/ctg/publishing.nsf/Content/ICDP-monitoring-
and-evaluation-framework (accessed November 1, 2012).
Borys, J. M., Y. Le Bodo, S. De Henauw, L. A. Moreno, M. Romon, J. C. Seidell, and T. L. S. Visscher. 2011.
Preventing childhood obesity. EPODE European Network recommendations. Cachan cedex, France: Lavoisier.
Commonwealth of Australia. 2003. Healthy weight 2008. Australia’s future: The national action agenda for children
and young people and their families. Canberra, ACT: Commonwealth of Australia.
Equality and Inclusion Team. 2011. Equality analysis: A call to action on obesity in England. London: Department
of Health.
European Commission. 2005. EU platform on diet, physical activity, and health. http://ec.europa.eu/health/archive/
ph_determinants/life_style/nutrition/platform/docs/eu_platform_mon-framework_en.pdf (accessed April 4,
2013).
European Commission. 2007. A strategy for Europe on nutrition, overweight, and obesity-related health issues.
http://europa.eu/legislation_summaries/public_health/health_determinants_lifestyle/c11542c_en.htm (accessed
June 4, 2013).
European Commission. 2010. A strategy for Europe on nutrition, overweight and obesity-related health issues:
Implementation progress report. http://ec.europa.eu/health/nutrition_physical_activity/docs/implementation_
report_en.pdf (accessed June 4, 2013).
European Commission. 2013a. European Community Health Indicators (ECHI)—body mass index. http://ec.europa.
eu/health/nutrition_physical_activity/indicators/index_en.htm (accessed April 4, 2013).
European Commission. 2013b. Nutrition and physical activity: EU platform for action on diet, physical activity and
health. http://ec.europa.eu/health/nutrition_physical_activity/platform/index_en.htm (accessed April 4, 2013).
European Commission. 2013c. Nutrition and physical activity: Key documents. http://ec.europa.eu/health/nutrition_
physical_activity/key_documents/index_en.htm#anchor1 (accessed April 4, 2013).
National Social Marketing Centre. 2006. Change4Life and social marketing: A hands-on guide to planning, develop-
ing, and evaluating a Change4Life social marketing project. London: UK Department of Health.
UK Department of Health. 2010a. Change4life one year on. London: Crown.
UK Department of Health. 2010b. Healthy lives, healthy people: Our strategy for public health in England. London:
The Stationary Office.
UK Department of Health. 2011. Healthy lives, healthy people: A call to action on obesity in England. London:
Crown.
UK Department of Health and Department of Children, Schools, and Families. 2008. Healthy weight, healthy lives:
A cross-government strategy for England. London: Crown.
WHO (World Health Organization). 2013. WHO European Childhood Obesity Surveillance Initiative (COSI).
http://www.euro.who.int/en/what-we-do/health-topics/disease-prevention/nutrition/activities/monitoring-and-
surveillance/who-european-childhood-obesity-surveillance-initiative-cosi (accessed April 5, 2013).
Wijnhoven, T. M., J. M. van Raaij, A. Spinelli, A. I. Rito, R. Hovengen, M. Kunesova, G. Starc, H. Rutter, A.
Sjoberg, A. Petrauskiene, U. O’Dwyer, S. Petrova, V. Farrugia Sant’angelo, M. Wauters, A. Yngve, I. M.
Rubana, and J. Breda. 2013. WHO European childhood obesity surveillance initiative 2008: Weight, height
and body mass index in 6-9-year-old children. Pediatric Obesity 8(2):79-97.

Copyright © National Academy of Sciences. All rights reserved.
Evaluating Obesity Prevention Efforts: A Plan for Measuring Progress
413
GCommunity health Assessment and Surveillance Resources
The Committee located examples of community health assessments from across the United States (see Chapter 7). Table G-1 identifies indicator topics reported in the sample of community health assess-
ment reports the Committee was able to identify.
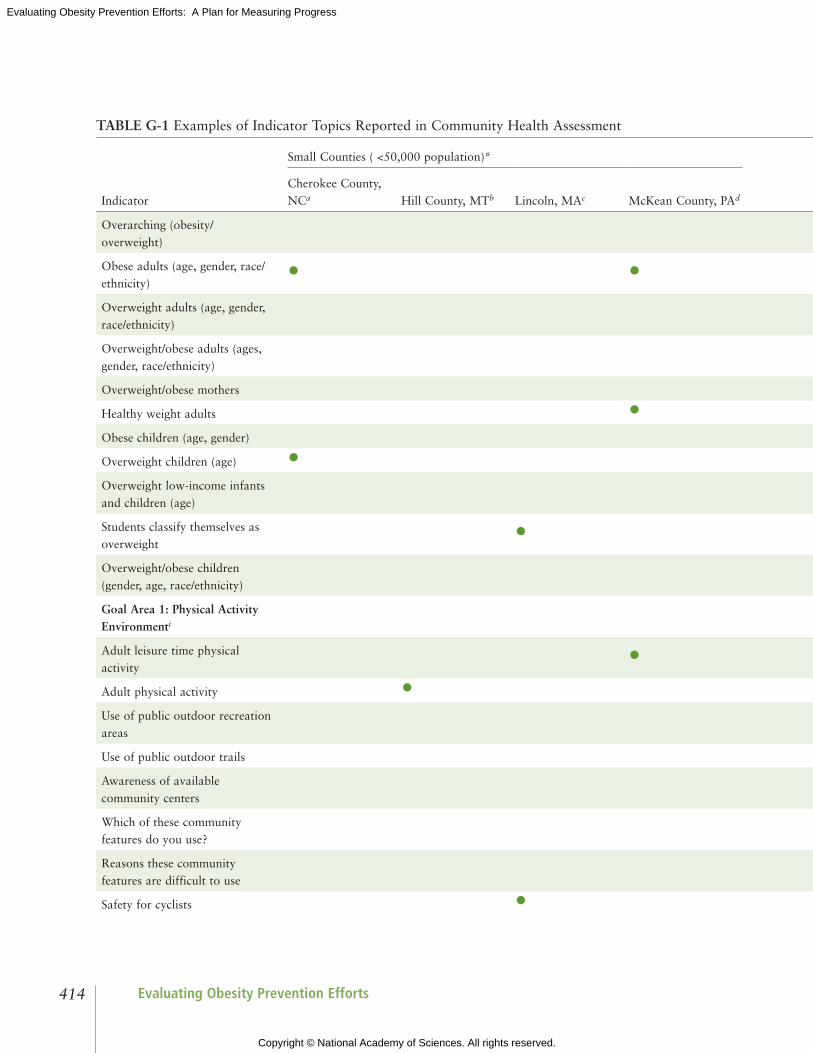
Copyright © National Academy of Sciences. All rights reserved.
Evaluating Obesity Prevention Efforts: A Plan for Measuring Progress
Evaluating Obesity Prevention Efforts414
TABLE G-1 Examples of Indicator Topics Reported in Community Health Assessment
Indicator
Small Counties ( <50,000 population)* Large Counties ( >50,000 population)*
Cherokee County, NCa Hill County, MTb Lincoln, MAc McKean County, PAd Contra Costa County, CAe Dutchess County, NYf
Lawrence-Douglas County, KSg Lee County, NCh
Overarching (obesity/overweight)
Obese adults (age, gender, race/ethnicity)
• • • • •Overweight adults (age, gender, race/ethnicity)
• •Overweight/obese adults (ages, gender, race/ethnicity)
•Overweight/obese mothers •Healthy weight adults •Obese children (age, gender) •Overweight children (age) •Overweight low-income infants and children (age)
•Students classify themselves as overweight
•Overweight/obese children (gender, age, race/ethnicity)
• •Goal Area 1: Physical Activity Environmenti
Adult leisure time physical activity
• • •Adult physical activity • •Use of public outdoor recreation areas
•Use of public outdoor trails •Awareness of available community centers
•Which of these community features do you use?
•Reasons these community features are difficult to use
•Safety for cyclists •

Copyright © National Academy of Sciences. All rights reserved.
Evaluating Obesity Prevention Efforts: A Plan for Measuring Progress
415Appendix G
TABLE G-1 Examples of Indicator Topics Reported in Community Health Assessment
Indicator
Small Counties ( <50,000 population)* Large Counties ( >50,000 population)*
Cherokee County, NCa Hill County, MTb Lincoln, MAc McKean County, PAd Contra Costa County, CAe Dutchess County, NYf
Lawrence-Douglas County, KSg Lee County, NCh
Overarching (obesity/overweight)
Obese adults (age, gender, race/ethnicity)
• • • • •Overweight adults (age, gender, race/ethnicity)
• •Overweight/obese adults (ages, gender, race/ethnicity)
•Overweight/obese mothers •Healthy weight adults •Obese children (age, gender) •Overweight children (age) •Overweight low-income infants and children (age)
•Students classify themselves as overweight
•Overweight/obese children (gender, age, race/ethnicity)
• •Goal Area 1: Physical Activity Environmenti
Adult leisure time physical activity
• • •Adult physical activity • •Use of public outdoor recreation areas
•Use of public outdoor trails •Awareness of available community centers
•Which of these community features do you use?
•Reasons these community features are difficult to use
•Safety for cyclists •
continued

Copyright © National Academy of Sciences. All rights reserved.
Evaluating Obesity Prevention Efforts: A Plan for Measuring Progress
Evaluating Obesity Prevention Efforts416
Indicator
Small Counties ( <50,000 population)* Large Counties ( >50,000 population)*
Cherokee County, NCa Hill County, MTb Lincoln, MAc McKean County, PAd Contra Costa County, CAe Dutchess County, NYf
Lawrence-Douglas County, KSg Lee County, NCh
Elderly physical activity programs
•Goal Area 2: Food and Beverage Environmenti
Adult consumption of fruits and vegetables
• • •Access to affordable healthy foods
• •Reasons it is difficult to buy healthy food
•Goal Area 3: Message Environmenti
Goal Area 4: Health Care and Worksite Environmenti
Obese, received advice from doctor to lose weight in the past year
•
Adults, told by health care professional they are overweight/obese
•
Breastfeeding rate •Any/exclusive breastfeeding initiation (race/ethnicity)
•Community-based prevention health services and programs
•Availability and scope of health care
•Effectiveness of health care system
•Goal Area 5: School Environmenti
Other: Norms/Attitudes, Obesity-related
Health-related issues • • • •Priority issues in community •
TABLE G-1 Continued

Copyright © National Academy of Sciences. All rights reserved.
Evaluating Obesity Prevention Efforts: A Plan for Measuring Progress
417Appendix G
Indicator
Small Counties ( <50,000 population)* Large Counties ( >50,000 population)*
Cherokee County, NCa Hill County, MTb Lincoln, MAc McKean County, PAd Contra Costa County, CAe Dutchess County, NYf
Lawrence-Douglas County, KSg Lee County, NCh
Elderly physical activity programs
•Goal Area 2: Food and Beverage Environmenti
Adult consumption of fruits and vegetables
• • •Access to affordable healthy foods
• •Reasons it is difficult to buy healthy food
•Goal Area 3: Message Environmenti
Goal Area 4: Health Care and Worksite Environmenti
Obese, received advice from doctor to lose weight in the past year
•
Adults, told by health care professional they are overweight/obese
•
Breastfeeding rate •Any/exclusive breastfeeding initiation (race/ethnicity)
•Community-based prevention health services and programs
•Availability and scope of health care
•Effectiveness of health care system
•Goal Area 5: School Environmenti
Other: Norms/Attitudes, Obesity-related
Health-related issues • • • •Priority issues in community •
TABLE G-1 Continued
continued

Copyright © National Academy of Sciences. All rights reserved.
Evaluating Obesity Prevention Efforts: A Plan for Measuring Progress
Evaluating Obesity Prevention Efforts418
Indicator
Small Counties ( <50,000 population)* Large Counties ( >50,000 population)*
Cherokee County, NCa Hill County, MTb Lincoln, MAc McKean County, PAd Contra Costa County, CAe Dutchess County, NYf
Lawrence-Douglas County, KSg Lee County, NCh
Priority issues facing youth •Unhealthy behaviors • •Activities needed in a community
• •Perceived challenges of community
• •Perceived strengths of community
•Community health needs •Factors that contribute to the health of community
• •Factors that prevent the health of community
•* Small counties’ population of less than 50,000 residents; large counties’ population is greater than 50,000 residents. SOURCES: a County of Cherokee (2008); b Larson (no date); c Communities Opportunities Group, Inc. (2010); d Center for Rural Health Practice and University of Pittsburgh at Bradford (2005); e Contra Costa Health Services Public Health Division (2010); f Center for Governmental Research (2009a,b); g Collie-Akers and Holt (2012); h Lee County Public Health Assessment Team and LeeCAN “A Healthy Carolinians Partnership” (2010).i These are goal areas identified in the Accelerating Progress in Obesity Prevention report (IOM, 2012a).
TABLE G-1 Continued

Copyright © National Academy of Sciences. All rights reserved.
Evaluating Obesity Prevention Efforts: A Plan for Measuring Progress
419Appendix G
Indicator
Small Counties ( <50,000 population)* Large Counties ( >50,000 population)*
Cherokee County, NCa Hill County, MTb Lincoln, MAc McKean County, PAd Contra Costa County, CAe Dutchess County, NYf
Lawrence-Douglas County, KSg Lee County, NCh
Priority issues facing youth •Unhealthy behaviors • •Activities needed in a community
• •Perceived challenges of community
• •Perceived strengths of community
•Community health needs •Factors that contribute to the health of community
• •Factors that prevent the health of community
•* Small counties’ population of less than 50,000 residents; large counties’ population is greater than 50,000 residents. SOURCES: a County of Cherokee (2008); b Larson (no date); c Communities Opportunities Group, Inc. (2010); d Center for Rural Health Practice and University of Pittsburgh at Bradford (2005); e Contra Costa Health Services Public Health Division (2010); f Center for Governmental Research (2009a,b); g Collie-Akers and Holt (2012); h Lee County Public Health Assessment Team and LeeCAN “A Healthy Carolinians Partnership” (2010).i These are goal areas identified in the Accelerating Progress in Obesity Prevention report (IOM, 2012a).
TABLE G-1 Continued

Copyright © National Academy of Sciences. All rights reserved.
Evaluating Obesity Prevention Efforts: A Plan for Measuring Progress
Evaluating Obesity Prevention Efforts420
REFERENCES
Center for Governmental Research. 2009a. Appendix B—Survey script. http://www.co.dutchess.ny.us/CountyGov/
Departments/Health/Publications/HDICASurveyAppB.pdf (accessed April 24, 2013).
Center for Governmental Research. 2009b. Dutchess County ICA community health survey final report. http://www.
co.dutchess.ny.us/CountyGov/Departments/Health/Publications/HDICASurvey.pdf (accessed April 24, 2013).
Center for Rural Health Practice and University of Pittsburgh at Bradford. 2005. Community health needs assess-
ment. McKean County, Pennsylvania. http://www.upb.pitt.edu/uploaded Files/About/Sponsored_Programs/
Center_for_Rural_Health_Practice/CHA%20Final.pdf (accessed April 22, 2013).
Collie-Akers, V., and C. Holt. 2012. Douglas County community health assessment report. Community Health
Improvement Partnership, Lawrence-Douglas County Health Department, Work Group for Community
Health and Development.
Communities Opportunities Group, Inc. 2010. Town of Lincoln community health assessment & planning project.
http://www.lincolntown.org/Adobe%20Acrobat%20Files/Healthy%20Community/Lincoln%20Healthy%20
Communities%20Final%20Report%20071210.pdf (accessed April 22, 2013).
Contra Costa Health Services Public Health Division. 2010. Community health indicators for Contra Costa county.
http://cchealth.org/health-data/hospital-council/2010/pdf/2010_community_health_indicators_report_complete.
pdf (accessed April 22, 2013).
County of Cherokee. 2008. Cherokee County community health assessment (CHA). http://www.mahec.net/media/
nccha/cherokee.pdf (accessed April 22, 2013).
Larson, K. no date. Hill county community health assessment 2010-2011. http://www.dphhs.mt.gov/publichealth/
accreditation/documents/hill-cha.pdf (accessed April 22, 2013).
Lee County Public Health Assessment Team and LeeCAN “A Healthy Carolinians Partnership.” 2010. Lee County
North Carolina. Access to the world. Community health assessment. http://www.leecountync.gov/LinkClick.
aspx?fileticket=YcCnyE8z68k%3D&tabid=205 (accessed April 22, 2013).

Copyright © National Academy of Sciences. All rights reserved.
Evaluating Obesity Prevention Efforts: A Plan for Measuring Progress
421
hCommunity Intervention Resources
Included in this appendix:
• TABLE H-1 Description of Selected Community-Level Obesity Prevention Initiatives with Population-Level Results
• TABLE H-2 Description of Selected Community-Level Obesity Prevention Initiatives: In Progress or No Population-Level Measurement
• TABLE H-3 Selected Tools for Evaluating Community Obesity Prevention Initiatives• Evaluations Illustrating Best Practices for Measurement and Design — Cultural Competence and Photovoice — Logic Model Design Examples — Causal Modeling: The Healthy Communities Study — A Potential Regression-Discontinuity Evaluation

Copyright © National Academy of Sciences. All rights reserved.
Evaluating Obesity Prevention Efforts: A Plan for Measuring Progress
Evaluating Obesity Prevention Efforts422
TABLE H-1 Description of Selected Community-Level Obesity Prevention Initiatives with Population-Level Results (n=17)
Initiative (Time period)
Target Population/Design Intervention Evaluation Methods Results
5-2-1-0 Let’s Go! (AHRQ Health Care Innovations Exchange, 2012h)(2009-2011)
Setting: Greater Portland, ME (Community, US)Target population: Children/adolescentsDesign: Pre/post
Community-level environmental and messaging strategies targeting physical activity, fruits and vegetables, sugary drinks, screen time
Parent surveys from 2007-2011 reporting program awareness and proxy report of children’s behavior
Increased prevalence of targeted behaviors based on parent self-reported data
Allegiance Health— Health Improvement Organization (AHRQ Health Care Innovations Exchange, 2012d)(2000-)a
Setting: Jackson, MI (Community, US) Target population: Adults, children/adolescentsDesign: Pre/post
Health partnership efforts among patients, physicians, employers, schools, faith-based organizations, the health system, and the health plan
Pilot evaluation of worksite wellness component; tracking of employee participation health status measures
Participants managed stress better, avoided weight gain, controlled blood pressure and cholesterol, avoided sick days, and reduced overall health risk
Arkansas Obesity Prevention Initiative (University of Arkansas for Medical Sciences, 2011)(2000-2010)
Setting: Arkansas (State-level, US)Target population: Children/adolescents Design: Quasi-experimental
Range of statewide efforts to support local schools in making policy and environmental change, including Coordinated School Health and Safe Routes to School grants
School district surveys, stakeholder interviews with parents and school leaders, BMIb monitoring; sample of 484 schools across the state
No change in obesity rates. Decreases in student purchases from vending machines; but no changes in soda consumption or visits to fast food restaurants
EPODE (Together Let’s Prevent Childhood Obesity)(Romon et al., 2009)(1992-2004)
Setting: 2 small towns in northern France (Community, Europe)Target population: Children, 5-12 yrs oldDesign: Quasi-experimental (post only comparison)
A school-based nutrition information program initiated in 1992 followed by several community-based interventions
Repeated, cross-sectional, school-based survey for selected school years from 1992-2004 plus BMI on all 5-12 yrs old children attending school; survey in comparison towns in 2004 only
Age-adjusted odds ratio for overweight significantly lower in 2003 and 2004 (girls only). In 2004, the overweight prevalence was significantly lower than in the comparison towns

Copyright © National Academy of Sciences. All rights reserved.
Evaluating Obesity Prevention Efforts: A Plan for Measuring Progress
423Appendix H
Initiative (Time period)
Target Population/Design Intervention Evaluation Methods Results
Five-a-Day Community Evaluation Tool (Ashfield-Watt et al., 2007)(2001-2005)
Setting: Five economically deprived communities in England (Community, Europe)Target population: AdultsDesign: Quasi-experimental
Community-based interventions to improve fruit and vegetable intake
810 people in pilot intervention communities compared with 270 people participating in an unrelated observational study as controls
Knowledge increased as did access to fruits and vegetables, but no demonstrable effect on total fruit and vegetable intake
Girls Health Enrichment Multi-site Studies (GEMS) (Klesges et al., 2010; Robinson et al., 2010) (1999-2001)
Setting: Memphis, TN; Oakland, CA (Community, US)Target population: Preadolescent overweight/obese African American girlsDesign: Randomized-controlled trial (individual-level)
Culturally appropriate obesity prevention approaches involving girls and their parents, community centers or YWCAs (Young Women’s Christian Association), and schools
Randomized to obesity prevention program intervention or alternative self-esteem building program
Memphis: no change in BMI Oakland: changes in BMI were not different in the intervention versus the control group
Hartslag Limburg (Schuit et al., 2006)(1998-2003)
Setting: Maastricht region, Netherlands (Community, Europe)Target population: AdultsDesign: Quasi-experimental
Integrative community-based cardiovascular disease prevention program promoting a healthy lifestyle
Cohort study comparing 5-year mean change in risk factors between the intervention and reference area
Adjusted difference in mean change in risk factors between intervention and reference group was significant for BMI, waist circumference, total cholesterol, and serum glucose
Healthy Eating, Active Communities and Central California Regional Obesity Prevention Program (HEAC/CCROPP) (Samuels & Associates, 2010) (2007-2010)
Setting: 14 low-income communities in CA (Community, US) Target population: Youth and adultsDesign: Quasi-experimental
Policy and environmental interventions in schools, worksites, health care organizations, and the community at large
Repeated cross-sectional surveys of 400 randomly selected 7th and 9th grade students from 13 HEAC communities and 6 out-of-area comparison communities
Findings from the school survey combined with environmental assessments confirm that when students are exposed to healthier environments they are more likely to make healthier choices
TABLE H-1 Continued
continued

Copyright © National Academy of Sciences. All rights reserved.
Evaluating Obesity Prevention Efforts: A Plan for Measuring Progress
Evaluating Obesity Prevention Efforts424
Initiative (Time period)
Target Population/Design Intervention Evaluation Methods Results
Healthy Eating Active Lifestyles Together Helping Youth (HEALTHY) Armstrong (AHRQ Health Care Innovations Exchange, 2012a)(2005-2009)
Setting: Rural Armstrong County, PA (Community, US)Target population: ChildrenDesign: Pre/post
Using elements of the national We Can! program to help children improve their nutritional habits and engage in more physical activity
Pre- and post-implementation comparisons of student behaviors, including time engaged in physical activity, purchases of high-calorie foods, and school cafeteria expenditures on fresh fruits and vegetables
Significantly increased levels of physical activity and improved food choices made by students, who consume less “junk food” and more fruits and vegetables in school
Healthy Hawks program (AHRQ Health Care Innovations Exchange, 2012f)(2006-)
Setting: Communities in Kansas (Community, US)Target population: Overweight childrenDesign: Pre/post (individual-level)
Working with children and their families to develop goals and strategies and establish a healthier lifestyle. Community support built for recruitment and sustainability of changes
Pre/post BMI; caloric intake (self-reported dietary data)
Significantly reduced caloric intake and BMI among participants after 12 weeks
Healthy Living Cambridge Kids (Chomitz et al., 2010)(2004-2007)
Setting: Cambridge, MA (Community, US)Target population: Students K-8Design: Pre/post
Community-based effort to support the “5-2-1” guidelines: 5+ servings of fruits and vegetables, screen time <2 hours, 1+ hour of exercise
Comparison of BMI and fitness test results in a 1,900 students tested at baseline and 3 years after program implementation
BMI z-scoresc and proportion obese decreased, and mean number of fitness tests (0-5) passed increased. Obesity among all race/ethnicity groups declined
Kaiser Permanente Healthy Eating Active Living Community Health Initiative (HEAL-CHI) (Cheadle et al., 2012a)(2006-2010)
Setting: Three low-income communities in Northern CA (Community, US)Target population: Youth and adultsDesign: Quasi-experimental logic model design
Policy and environmental interventions in schools, worksites, health care organizations, and the community at large
School-based surveys and Fitnessgramd measures of students in intervention and matched comparison communities; surveys of adults using Interactive Voice Response in intervention communities
Improvements in physical activity behaviors found where high-dose interventions were present in schools
TABLE H-1 Continued

Copyright © National Academy of Sciences. All rights reserved.
Evaluating Obesity Prevention Efforts: A Plan for Measuring Progress
425Appendix H
Initiative (Time period)
Target Population/Design Intervention Evaluation Methods Results
Nemours Delaware Initiative (Chang et al., 2010)(2006-)
Setting: Delaware (State-level, US)Target population: ChildrenDesign: Quasi-experimental
Statewide policy change; learning collaboratives; technical assistance to schools, child care, and primary care
Statewide survey in 2006, 2008. Fitnessgram measurement in pilot school physical education (PE) program (n=19)
Leveling off of obesity rates statewide. Students in pilot PE schools were 1.5 times more likely to be in Healthy Fitness zone (indicator of physical fitness)
New York City (NYC) Department of Health obesity prevention initiative (NYC Obesity Task Force, 2012)(2002-)
Setting: New York, NY (Community, US)Target population: Students K-8, adultsDesign: Pre/post
Community-based environment and policy change efforts, including schools, restaurants, grocery stores, hospitals, worksites
Use of existing surveys: NYC Community Health Survey, New York Youth Risk Behavior Survey, NYC Fitnessgram
Decline in K-8 obesity rate 5.5% between 2006-2007 (21.9%) and 2010-2011 (20.7%). No report on adult progress
Paso del Norte Foundation Obesity Initiative (Coleman, 2006; Coleman et al., 2005; Heath and Coleman, 2003; Hoelscher et al., 2010; Smith et al., 2005)(2002-2005)
Setting: El Paso, TX and surrounding area (Community, US).Target population: Adults, childrenDesign: Pre/post (children)
Community-based initiatives that included coordinated school health program support (Coordinated Approach to Child Health [CATCH]), plus community nutrition (Que Sabrosa Vida) and activity (Walk El Paso) programs, and a media program for radio and TV
Population-based representative survey of school children in Texas Health Service Region 9/10 between 2000-2002 and 2004-2005 (School Physical Activity and Nutrition [SPAN] survey)
Children in 4th grade had a 7.0% decrease in obesity (statistically significant). Also related changes in behavior
Romp & Chomp (de Silva-Sanigorski et al., 2010)(2004-2008)
Setting: Geelong, Australia (Community, Australia)Target population: Young children (0-5 yrs old)Design: Quasi-experimental
Community-wide, multisetting, multistrategy intervention focused on community capacity building and environmental changes
Repeat cross-sectional design with a comparison sample
Significantly lower mean weight, BMI, and BMI z-scores in the intervention group. Significantly lower relative intake of packaged snacks and fruit juice
TABLE H-1 Continued
continued

Copyright © National Academy of Sciences. All rights reserved.
Evaluating Obesity Prevention Efforts: A Plan for Measuring Progress
Evaluating Obesity Prevention Efforts426
Initiative (Time period)
Target Population/Design Intervention Evaluation Methods Results
Shape Up Somerville (Economos et al., 2007)(2002-2005)
Setting: Somerville, MA (Community, US)Target population: Children grades 1-3Design: Quasi-experimental
Comprehensive community-level intervention involving children, parents, teachers, schools, city departments, health care providers
Non-randomized controlled trial: 3 intervention schools compared to 2 comparison schools. Pre/post BMI was primary outcome measure
BMI z-scores decreased by –0.1005 compared with children in the control communities after controlling for covariates
a Dates are approximate—often not explicitly included in articles or reports, and sometimes unclear if an initiative is ongoing. b Body mass index (BMI) is a number calculated from a person’s weight and height. BMI provides a reliable indicator of body fatness for most people and is used to screen for weight categories that may lead to health problems.c BMI z-scores indicates how many units (of the standard deviation) an individual’s BMI is above or below the average value for their age group and sex. d Fitnessgram is a fitness assessment and reporting program for youth developed in 1982, which measures aerobic capacity; body composition; and muscular strength, endurance, and flexibility.
TABLE H-1 Continued

Copyright © National Academy of Sciences. All rights reserved.
Evaluating Obesity Prevention Efforts: A Plan for Measuring Progress
427Appendix H
TABLE H-2 Description of Selected Community-Level Obesity Prevention Initiatives: In Progress or No Population-Level Measurement (n=20)
Initiative Description
Children and Neighbors Defeat Obesity (CAN DO) Houston (Correa et al., 2010)
Coalition around obesity led by a workplace-oriented wellness organization. Two pilot neighborhoods selected. Children aged 6-12 years targeted. Focus group approach identified physical activity in one neighborhood (safety) and nutrition education in another.
Collaborate for Healthy Weight (NICHQ, 2012)
National project of the National Initiative for Children’s Healthcare Quality and the Health Resources and Services Administration bringing together primary care providers, public health professionals, and leaders of community organizations to work across traditional professional borders to address obesity at the community level.
Communities Putting Prevention to Work (CPPW) (CDC, 2013)
Fifty communities funded (39 obesity prevention) through a 2-year cooperative agreement to reduce chronic disease related to obesity and tobacco using the evidence and practice-based MAPPS.a This effort is expected to produce broad, high-impact, sustainable, health outcomes through policy, systems, and environmental change.
Consortium to Lower Obesity in Chicago Children (CLOCC)(Becker et al., 2008)
Obesity prevention coalition in Chicago promoting healthy and active lifestyles for children through environmental changes, public education, advocacy, research, outcome measurement, and program evaluation.
Eat Smart, Move More North Carolina (Eat Smart, Move More North Carolina, 2013)
A statewide movement that promotes increased opportunities for healthy eating and physical activity wherever people live, learn, earn, play, and pray. Emphasizes policy and organizational change and evidence-based practices (e.g., media campaigns, worksite interventions, body mass index [BMI] monitoring).
Get a Life! (Mississippi) (AHRQ, 2012c)
Supports schools, churches, local governments, and employers in eight rural Mississippi counties in addressing the area’s obesity epidemic. Key program elements include supporting local health councils, providing technical support, and regional planning.
Go for Your Life(Victoria, Australia) (Haby et al., 2009)
Community-based interventions in six communities in regions of low socioeconomic status. Planned and managed by primary care physicians/lead agencies, support from Department of Health Services and a state-wide evaluator.
Healthy Alberta Communities Project (Alberta Provence, Canada) (Raine et al., 2010)
Partnership between the Health Ministry and University of Alberta to promote environmental approaches to obesity prevention.
Healthy and Active Communities (Missouri) (Hessel et al., 2010)
Approaches include grantmaking, evaluation support, technical assistance for dissemination, policy assessment, and development of local, regional, and statewide collaborations to increase access to physical activity and nutrition through environmental, policy, and behavior change.
continued

Copyright © National Academy of Sciences. All rights reserved.
Evaluating Obesity Prevention Efforts: A Plan for Measuring Progress
Evaluating Obesity Prevention Efforts428
Initiative Description
Healthy Communities Study (NHLBI, 2013a)
Five-year observational study of communities that aims to (1) determine the associations between community programs/policies and BMI, diet, and physical activity in children; (2) identify the community, family, and child factors that modify or mediate the associations between community programs/policies and BMI, diet, and physical activity in children; and (3) assess the associations between program/policies and BMI, diet, and physical activity in children in communities that have a high proportion of African American, Latino, and/or low-income residents.
Healthy Eating Active Living Cities Campaign(California) (AHRQ, 2012g)
Builds awareness among California city officials about the role of the physical environment in promoting healthy habits and provides them with an array of practical support for passing policies and resolutions to make it easier for residents to engage in healthy behaviors.
Healthy Kids, Healthy Communities (RWJF, 2013)
Nationwide initiative in 50 communities pursuing policy and environmental change strategies.
IDEFICS(Identification and prevention of dietary- and lifestyle-induced health effects in children and infants) (De Heneauw et al., 2011)
Developed and implemented innovative community-oriented intervention programs for obesity prevention and healthy lifestyle primarily in children aged 2-10 years in eight European countries: Belgium, Cyprus, Estonia, Germany, Hungary, Italy, Spain, and Sweden. Eight matched pair communities per country.
Nutrition and Physical Activity Self-Assessment for Child Care (NAP SACC) (Smart Start & The North Carolina Partnership for Children) (Iruka et al., 2009)
Creating a cadre of early childhood health and wellness champions among state and local leaders and the professionals working with young children and families, and ensuring that children attending child care programs are served nutritious foods, engage in physical activity, and have teachers modeling healthy behaviors.
Project FIT (Grand Rapids, MI) (Eisenmann et al., 2011)
Collaboration between the public school system, local health systems, physicians, neighborhood associations, businesses, faith-based leaders, community agencies, and university researchers to develop a multi-faceted approach to promote physical activity and healthy eating.
Recreation Rx(San Diego, CA)(AHRQ et al., 2012e)
Facilitates partnerships between physicians and recreation providers in underserved communities to increase access to safe and structured activities.
San Diego County Childhood Obesity Initiative(San Diego County Childhood Obesity Initiative, 2013)
Public/private partnership to reduce and prevent childhood obesity in San Diego County by creating healthy environments for all children and families through advocacy, education, policy development, and environmental change.
TABLE H-2 Continued

Copyright © National Academy of Sciences. All rights reserved.
Evaluating Obesity Prevention Efforts: A Plan for Measuring Progress
429Appendix H
Initiative Description
Wayne County Health Department/Partnership for the Children of Wayne County (NC)/Goldsborough Parks and Recreation Department (AHRQ et al., 2012b)
Partnership working with nonprofit groups to promote better nutrition and increased physical activity among preschoolers who attend 8 local child care centers.
WE CAN! (NHLBI, 2013b)
National movement that offers organizations, community groups, and health professionals a centralized resource to promote a healthy weight in youth through community outreach, partnership development, and media activities.
W.K. Kellogg Foundation Food and Fitness Initiative (USDA, 2010)
Creating communities that support access to locally grown, healthy, affordable food, and safe and convenient places for physical activity and play, for families and children. Nine communities nationwide funded for implementation.
a MAPPS = Five evidence-based strategies, when combined, expected to improve health behaviors by changing community environments: Media, Access, Point of decision information, Price, and Social support/services.
TABLE H-2 Continued

Copyright © National Academy of Sciences. All rights reserved.
Evaluating Obesity Prevention Efforts: A Plan for Measuring Progress
Evaluating Obesity Prevention Efforts430
TABLE H-3 Selected Tools for Evaluating Community Obesity Prevention Initiatives
Source Description Website
COLLECTIONS
Active Living Research Tools to collect data on streets, schools, parks, or other community settings to see how well they support physical activity
http://www.activelivingresearch.org/toolsandresources/toolsandmeasures
National Collaborative on Childhood Obesity Research (NCCOR) Measures Registry
Searchable database of diet and physical activity measures relevant to childhood obesity researchMeasures included to describe, monitor, and evaluate interventions—particularly policy and environmental interventions—and factors and outcomes at all levels of the socio-ecological model
http://tools.nccor.org/measures
National Cancer Institute Risk Factor Monitoring & Methods
Tools for researchers, including dietary surveys and environmental assessments
http://riskfactor.cancer.gov
SELECTED ENVIRONMENT MEASUREMENT TOOLS
Environmental Assessment of Public Recreation Spaces (EAPRS)
Comprehensive direct observation assessment of the physical environments of parks and playgrounds, with an emphasis on evaluating physical elements and qualities with respect to their functionality or potential functionality (e.g., how a park or playground element is used or could be used by adults and children)
http://www.seattlechildrens.org/research/child-health-behavior-and-development/saelens-lab/measures-and-protocols
Irvine Minnesota Inventory Measures a wide range of built environment features that may affect physical activity, especially walking Includes 160 items covering 4 domains: accessibility, pleasurability, perceived safety from traffic, and perceived safety from crime
https://webfiles.uci.edu/kday/public/index.html
Nutrition Environment Measures Survey (NEMS)
Measures focus on surveying community and consumer nutrition environments; which include the type and location of food outlets (stores and restaurants); availability of healthful choices; and information, pricing, promotion, and placement of healthier food products
http://www.med.upenn.edu/nems

Copyright © National Academy of Sciences. All rights reserved.
Evaluating Obesity Prevention Efforts: A Plan for Measuring Progress
431Appendix H
Source Description Website
Communities of Excellence in Nutrition, Physical Activity & Obesity Prevention (CX3)
Field surveys of neighborhood food access
http://www.cdph.ca.gov/programs/cpns/Pages/CX3_T2_FieldSurveys.aspx
SELECTED POLICY MEASUREMENT TOOLS
Bridging the Gap Research Informing Policy and Practices for Healthy Youth
Includes surveys of school district policies and practices related to childhood obesity and tools for coding school district wellness policies
http://www.bridgingthegapresearch.org/research/district_wellness_policies
University of California, Berkeley Center for Weight and Health Evaluation/Tools
Surveys include Nutrition Learning Environments, Actions, & Policies (Nutrition LEAP); Nutrition Services Questionnaire; and Survey of Child Care Providers
http://cwh.berkeley.edu/center/evaluation_tools
WellSAT: Wellness School Assessment Tool
Online tool for quantitative assessment of school wellness policies from the Yale Rudd Center for Food Policy & Obesity
http://www.wellsat.org
School Health Index Centers for Disease Control and Prevention’s online self-assessment and planning tool schools can use to improve their health and safety policies and programs
http://www.cdc.gov/healthyyouth/shi/index.htm
CoalitionsWork Tools & Resources Resources include assessments of community and state plans for obesity prevention
http://coalitionswork.com/resources/tools
TRAINING
Built Environment Assessment Training (BEAT) Institute online training
Free courses on assessing the built environment for physical activity, including an in-depth look at specific tools, and assessing the nutrition environment with the NEMS
http://www.med.upenn.edu/beat/onlinetraining.shtml
Community Tool Box sections on community evaluation
Free, open-source lessons and tools for designing and implementing community evaluations
http://ctb.ku.edu/en/dothework/tools_tk_content_page_254.aspx
TABLE H-3 Continued

Copyright © National Academy of Sciences. All rights reserved.
Evaluating Obesity Prevention Efforts: A Plan for Measuring Progress
432
EVALUATIONS ILLUSTRATING BEST PRACTICES FOR MEASUREMENT ANd dESIGN
Cultural Competence and PhotoVoice
PhotoVoice1 and other qualitative evaluation strategies offer one method for assessing and com-paring environmental and policy changes. PhotoVoice is particularly helpful for evaluating efforts on behalf of ethnic groups most affected by the obesity epidemic that may not have found a collective voice. PhotoVoice enables community members to document community strengths and concerns. Through discussion, photos taken by community volunteers stimulate dialogue about community issues related to obesity and other health issues and provide a basis to critically assess changes (Wang et al., 2004). PhotoVoice can greatly assist evaluation through community sense-making of the results—a critically important issue because the range of environmental changes is so large and complex and their impor-tance locally is still not well understood. Furthermore, if PhotoVoice reveals that a policy is not being enforced, or promised environmental changes have not occurred, then this is a basis for further action. Quantification is helpful to assess the extent of promised changes, but is not needed to demonstrate the lack of progress in achieving those changes.
Healthy Tomorrows for New Britain Teens in Connecticut is an afterschool obesity prevention program serving predominantly low-income Latina girls of Puerto Rican descent (Hannay et al., 2013). It offers a variety of activities including nutritional counseling, physical activity, and leadership develop-ment for change in the community. A qualitative mid-course evaluation employed focus groups of teens and parents, as well as an eight-session PhotoVoice curriculum. To guide taking photos, the participants co-developed framing questions about community barriers and facilitators for physical activity and about what made for stress and happiness in their community. PhotoVoice and focus group sessions with teens were in English, and for parents they were in both English and Spanish. Themes emerged that represented a collective narrative and a basis for youth advocacy, which has led to improvements in school physical education policy and the reopening of neighborhood pools (Hannay et al., 2013).
Logic Model design Examples
Examples of two approaches that systematically apply logic model designs to data from community-level initiatives are the “community measurement” approach developed by the University of Kansas (Fawcett and Schultz, 2008; Francisco et al., 1993) and the “population dose” concept developed as part of the evaluation of the Kaiser Permanente Community Health Initiative (KP-CHI) (Cheadle et al., 2012b). Media research has employed principles similar to the population dose idea dating from the 1950s, a feature that is potentially important to evaluation of the Home Box Office/Institute of Medicine campaign The Weight of the Nation (Farrelly et al., 2005; Lazarsfeld and Merton, 1971; Schramm and Roberts, 1971).
In the community measurement approach developed by the University of Kansas (Fawcett and Schultz, 2008), community and evaluation partners use key informant interviews and report reviews to document and score instances of community/system changes (i.e., programs, policies, practices, built envi-ronment), and to characterize aspects related to their intensity (e.g., strength of change strategy, duration, and reach; sectors and levels in which implemented). A plot of the cumulative community changes is over-
1 PhotoVoice funds photography-based projects to support social change.

Copyright © National Academy of Sciences. All rights reserved.
Evaluating Obesity Prevention Efforts: A Plan for Measuring Progress
433Appendix H
laid with a plot of the trend in a population-level outcome (such as behavior change). See Figure H-1 for an illustrative figure (drawn from Collie-Akers and Fawcett, 2008, p. 362).
If shifts in the population-level outcome trend line coincide temporally with shifts in the trend of community changes, then it is plausible to attribute the population-level changes to the community-level initiative. The University of Kansas team has used this method successfully in several initiatives (e.g., Collie-Akers et al., 2007). Although it is still possible that secular trends could be responsible for this pat-tern, it is increasingly implausible with every passing year.
The “population dose” approach uses elements of the RE-AIM (reach, effectiveness, adoption, implementation, and maintenance) method of combining reach and effectiveness to estimate the likely impact of a community change strategy on population-level behavior (Glasgow et al., 2006). Population dose is defined operationally as the product of penetration (reach divided by the size of the target popu-lation) and effect size (relative change in behavior for each person exposed). For example, if 20 percent of the community target population lives near a new walking trail and the average effect size is a 10 percent increase in minutes walked per day among residents living near a newly installed walking trail, the population dose is 20 percent ÷ 10 percent = 2 percent. Essentially, population dose is the effect size of the intervention, if the effect was spread across all of the residents of the target community. Because quantitative effect sizes for policy and environmental change interventions are generally unavailable in the literature, this method uses a three-level rating system (high/medium/low) to assess the strength of most intervention strategies; methods are described elsewhere (Cheadle et al., 2012b).
The dose ratings are then combined with population-level outcome data to examine whether higher-dose community change strategies or clusters of strategies are associated with measured population-level
FIGURE H-1 Hypothetical association of community and system changes with population-health improvement. Example of University of Kansas Work Group attribution approach.SOURCE: Collie-Akers and Fawcett, 2008.
0
10
20
30
40
50
60
70
80
90
100
0
10
20
30
40
50
60
70
80
90
100
1 2 3 4 5 6 7 8
Cum
ulat
ive
Num
ber
of C
omm
unity
Cha
nges
Per
cent
Chi
ldre
n O
bese
Physical Activity
Community Changes

Copyright © National Academy of Sciences. All rights reserved.
Evaluating Obesity Prevention Efforts: A Plan for Measuring Progress
Evaluating Obesity Prevention Efforts434
changes in the relevant outcomes. For example, if a number of built environment changes are rated as high dose for promoting walking, then a survey of community residents should show measurable increases in minutes walked (Cheadle et al., 2012a).
Causal Modeling: The healthy Communities Study
Funded by the National Heart, Lung, and Blood Institute, the Healthy Communities Study will run from 2010 to 2015 and is designed to be a multi-site national study of community-level programs and policies and their relationship with childhood obesity (NHLBI, 2012). Although not designed as an evaluation, the study includes many features that strengthen the interpretation of evaluations, many of which are within reach of local evaluations. The study is not about assessing causal relationships, but it illustrates some ways in which causal inferences can be strengthened in evaluation. And the role of local implementation is critically important to its success.
The observational study is both retrospective and cross-sectional, covering a 10-year period. It uses the University of Kansas community measurement approach described in Chapter 8 (e.g., Collie-Akers et al., 2007) to (a) identify discrete instances of community programs/policies, (b) characterize them along specific dimensions (e.g., by duration, reach, strength of intervention), and (c) develop an intensity score for the intervention that unfolds over time (reflecting the amount and kind of community programs/ policies in place). The study will examine associations between intensity scores for community programs/policies and children’s body mass index (BMI) trajectories and current behavior. The study is not designed to evaluate any specific program, policy, or community, but will instead systematically assess whether components or characteristics of representative programs/policies in communities across the country are related to BMI, diet, and physical activity in children.
The study uses both qualitative and quantitative data and takes advantage of the natural variation in local programs and policies to
(a) “determine the associations between community programs/policies and BMI, diet, and physical
activity for children; (b) identify the community, family, and child factors that modify or mediate the associations
between community programs/policies and BMI, diet, and physical activity in children; (c) assess the associations among community programs/policies and BMI, diet, and physical activity
in children in communities that have a high proportion of African American, Latino, and/or low-income residents” at higher risk for health disparities (NHLBI, 2013a).
Children’s height and weight, diet, and physical activity will be assessed in-person for the cross-sectional component, and BMI trajectories over a 10-year period will be calculated, using baseline height and weight abstracted from participant medical records. Thus, the Healthy Communities Study includes multiple observations of intermediate outcomes (community programs/policies) and long-term outcomes. Investigators will be able to examine when various interventions started and whether there were any asso-ciated changes in behavior and BMI after that time.
Community programs/policies will be identified and described through interviews with key infor-mants (e.g., school principals, parks and recreation staff, directors of community coalitions) and docu-

Copyright © National Academy of Sciences. All rights reserved.
Evaluating Obesity Prevention Efforts: A Plan for Measuring Progress
435Appendix H
ment review (reports of related activities). Instances will then be scored using an observational code and protocol. An overall intensity score will be calculated: the number of community programs and policies implemented, weighted by their intensity (i.e., strength of behavior change strategy used, reach, and duration in place). This composite intensity score—calculated for each community for each year of this study—will serve as a measure of the unfolding of the comprehensive intervention being implemented in the community related to obesity prevention. Thus, the Healthy Communities Study employs the recom-mended measurement of implementation “dose.” Also, note that this retrospective review depends greatly on the extent to which local evaluation has documented implementation (or key informants are available to be interviewed). A potential weakness is that the documentation may not be as thorough as necessary to examine more fine-grained relationships between particular interventions and outcomes. However, at a community level this documentation should be sufficient to examine intermediate outcomes (com-munity programs/policies) as a particular “dose” of environmental change related to childhood obesity prevention.
More than 200 communities (defined as high school catchment areas) and approximately 20,000 children and their parents/caregivers will be included. In each community, data will be collected on approximately 80 children in kindergarten through 8th grade. Communities were selected using a hybrid approach: a national probability-based sample of communities, and a purposive sample of communities that are known to be active in child obesity prevention work. The probability sample of communities can be generalized to the rest of the United States, while the purposive sample allows a better understanding of the variety of policies and programs being implemented.
By including the probability sample of communities, the Healthy Communities Study greatly improves on the non-equivalent comparison group design. In one sense, the probability sample stands in for a “control” group for the purposive sample of communities that are known to be implementing pre-vention. In another sense, however, most of the communities are likely to have implemented something—what community programs/policies they have implemented varies in amount, type, time, and place. The study will characterize the temporal patterns of implementation of various interventions, as well as the dose of interventions given. This permits much more powerful causal modeling than is feasible for most local evaluations. The sheer number of communities and children involved makes causal modeling a very powerful explanatory tool. The study will have enough power to control statistically for factors known to affect childhood obesity, such as income, ethnicity, and region of the United States. In addition, it can analyze the temporal relationship between interventions and change. Finally, because communities vary in the types of intervention and the times at which those interventions were introduced, the study can disen-tangle the relative contributions of these interventions by examining the strength of association between outcomes and particular kinds of intervention (such as introduction of a school policy, strength of the policy, when the policy was implemented).
A Potential Regression-discontinuity Evaluation
The regression-discontinuity design requires a strict criterion (such as need) to determine who receives intervention and who does not. It then measures the association between pre- and post-values and examines whether there is a discontinuity in this association based on receipt of intervention. It requires many units (e.g., children, schools), as in any regression analysis. This design can be applied in some areas

Copyright © National Academy of Sciences. All rights reserved.
Evaluating Obesity Prevention Efforts: A Plan for Measuring Progress
Evaluating Obesity Prevention Efforts436
of obesity prevention based on a population’s pre-intervention weight status. For example, some states, such as California and Arkansas, measure children’s weight and height in all public schools; schools might be selected for intervention based on school-level prevalence of obesity. In that case, change would be seen in any school-level discontinuity in the regression line between pre- and post-intervention prevalence. The effect size is a change in either the intercept or slope of the regression line (see Figure H-2).
REFERENCES
AHRQ (Agency for Healthcare Research and Quality) Health Care Innovations Exchange. 2012a. Community coali-
tion supports schools in helping students increase physical activity and make better food choices. http://www.
innovations.ahrq.gov/content.aspx?id=3232 (accessed April 14, 2013).
AHRQ Health Care Innovations Exchange. 2012b. County, city, and community agencies support childcare centers
and parents in improving nutrition and physical activity habits of preschoolers. http://www.innovations.ahrq.
gov/content.aspx?id=3283 (accessed June 7, 2013).
AHRQ Health Care Innovations Exchange. 2012c. Foundation supports rural stakeholders in promoting better eat-
ing and physical activity, leading to anecdotal reports of improved behaviors and outcomes. http://www.
innovations.ahrq.gov/content.aspx?id=3267 (accessed June 7, 2013).
AHRQ Health Care Innovations Exchange. 2012d. Multistakeholder, community-wide collaborative prevents disease
and promotes health. http://www.innovations.ahrq.gov/content.aspx?id=1755 (accessed April 15, 2013).
AHRQ Health Care Innovations Exchange. 2012e. Recreation “prescriptions” increase use of free community exer-
cise programs by low-income patients who are overweight or obese. http://www.innovations.ahrq.gov/content.
aspx?id=2934 (accessed June 7, 2013).
FIGURE H-2 Regression discontinuity design applied to school-based obesity prevention.NOTE: BMI = body mass index.
Post-test school average BMI
Actual regression line
Effect size
Pre-test school average BMI
Effect size

Copyright © National Academy of Sciences. All rights reserved.
Evaluating Obesity Prevention Efforts: A Plan for Measuring Progress
437Appendix H
AHRQ Health Care Innovations Exchange. 2012f. Staged weight management program helps overweight children
reduce caloric intake and body mass index. http://www.innovations.ahrq.gov/content.aspx?id=2290 (accessed
April 15, 2013).
AHRQ Health Care Innovations Exchange. 2012g. Statewide campaign provides education and technical support
to city officials, leading to policies that promote healthy behaviors. http://www.innovations.ahrq.gov/content.
aspx?id=3231 (accessed June 7, 2013).
AHRQ Health Care Innovations Exchange. 2012h. Tools, education, and technical assistance encourage child care
sites to adopt strategies that promote healthy eating and physical activity in young children. http://www.
innovations.ahrq.gov/content.aspx?id=3253 (accessed April 15, 2013).
Ashfield-Watt, P. A., A. A. Welch, S. Godward, and S. A. Bingham. 2007. Effect of a pilot community interven-
tion on fruit and vegetable intakes: Use of FACET (Five-a-day Community Evaluation Tool). Public Health
Nutrition 10(7):671-680.
Becker, A. B., M. Longjohn, and K. K. Christoffel. 2008. Taking on childhood obesity in a big city: Consortium to
Lower Obesity in Chicago Children (CLOCC). Progress in Pediatric Cardiology 25(2):199-206.
CDC (Centers for Disease Control and Prevention). 2013. Communities putting prevention to work. http://www.cdc.
gov/communitiesputtingpreventiontowork (accessed April 10, 2013).
Chang, D. I., A. Gertel-Rosenberg, V. L. Drayton, S. Schmidt, and G. B. Angalet. 2010. A statewide strategy to battle
child obesity in Delaware. Health Affairs 29(3):481-490.
Cheadle, A., S. Rauzon, R. Spring, P. M. Schwartz, S. Gee, E. Gonzalez, J. Ravel, C. Reilly, A. Taylor, and D.
Williamson. 2012a. Kaiser Permanente’s community health initiative in northern California: Evaluation find-
ings and lessons learned. American Journal of Health Promotion 27(2):e59-e68.
Cheadle, A., P. M. Schwartz, and S. Rauzon. 2012b. Using the concept of “population dose” in planning and evalu-
ating community-level obesity prevention initiatives. Clinical Medicine & Research 10(3):184-185.
Chomitz, V. R., R. J. McGowan, J. M. Wendel, S. A. Williams, H. J. Cabral, S. E. King, D. B. Olcott, M. Cappello,
S. Breen, and K. A. Hacker. 2010. Healthy Living Cambridge Kids: A community-based participatory effort to
promote healthy weight and fitness. Obesity (Silver Spring) 18(Suppl 1):S45-S53.
Coleman, K. J. 2006. Mobilizing a low income border community to address state mandated coordinated school
health. American Journal of Health Education 37(1):15-26.
Coleman, K. J., C. L. Tiller, J. Sanchez, E. M. Heath, O. Sy, G. Milliken, and D. A. Dzewaltowski. 2005. Prevention
of the epidemic increase in child risk of overweight in low-income schools: The El Paso Coordinated Approach
to Child Health. Archives of Pediatrics and Adolescent Medicine 159(3):217-224.
Collie-Akers, V., and S. B. Fawcett. 2008. Preventing childhood obesity through collaborative public health action in
communities. In Handbook of childhood and adolescent obesity, edited by E. Jelalian and R. G. Steele. New
York: Springer Science. Pp. 351-368.
Collie-Akers, V. L., S. B. Fawcett, J. A. Schultz, V. Carson, J. Cyprus, and J. E. Pierle. 2007. Analyzing a community-
based coalition’s efforts to reduce health disparities and the risk for chronic disease in Kansas City, Missouri.
Preventing Chronic Disease 4(3):A66. http://www.cdc.gov/pcd/issues/2007/jul/06_0101.htm (accessed June 6,
2013).
Correa, N. P., N. G. Murray, C. A. Mei, W. B. Baun, B. J. Gor, N. B. Hare, D. Banerjee, T. F. Sindha, and L. A.
Jones. 2010. CAN DO Houston: A community-based approach to preventing childhood obesity. Preventing
Chronic Disease 7(4):A88. http://www.cdc.gov/pcd/issues/2010/jul/09_0184.htm (accessed June 7, 2013).
De Henauw, S., V. Verbestel, S. Marild, G. Barba, K. Bammann, G. Eiben, A. Hebestreit, L. Iacoviello, K. Gallois,
K. Konstabel, E. Kovacs, L. Lissner, L. Maes, D. Molnar, L. A. Moreno, L. Reisch, A. Siani, M. Tornaritis,
G. Williams, W. Ahrens, I. De Bourdeaudhuij, I. Pigeot, and IDEFICS Consortium. 2011. The IDEFICS
community-oriented intervention programme: A new model for childhood obesity prevention in Europe?
International Journal of Obesity (London) 35(Suppl 1):S16-S23.

Copyright © National Academy of Sciences. All rights reserved.
Evaluating Obesity Prevention Efforts: A Plan for Measuring Progress
Evaluating Obesity Prevention Efforts438
de Silva-Sanigorski, A. M., A. C. Bell, P. Kremer, M. Nichols, M. Crellin, M. Smith, S. Sharp, F. de Groot, L.
Carpenter, R. Boak, N. Robertson, and B. A. Swinburn. 2010. Reducing obesity in early childhood: Results
from Romp & Chomp, an Australian community-wide intervention program. American Journal of Clinical
Nutrition 91(4):831-840.
Eat Smart, Move More North Carolina. 2013. Eat smart, move more North Carolina. http://www.eatsmartmove
morenc.com/index.html (accessed June 7, 2013).
Economos, C. D., R. R. Hyatt, J. P. Goldberg, A. Must, E. N. Naumova, J. J. Collins, and M. E. Nelson. 2007. A
community intervention reduces BMI z-score in children: Shape Up Somerville first year results. Obesity (Silver
Spring) 15(5):1325-1336.
Eisenmann, J. C., K. Alaimo, K. Pfeiffer, H. J. Paek, J. J. Carlson, H. Hayes, T. Thompson, D. Kelleher, H. J. Oh, J.
Orth, S. Randall, K. Mayfield, and D. Holmes. 2011. Project FIT: Rationale, design, and baseline characteris-
tics of a school- and community-based intervention to address physical activity and healthy eating among low-
income elementary school children. BMC Public Health 11:607.
Farrelly, M. C., K. C. Davis, M. L. Haviland, P. Messeri, and C. G. Healton. 2005. Evidence of a dose-response rela-
tionship between “truth” antismoking ads and youth smoking prevalence. American Journal of Public Health
95(3):425-431.
Fawcett, S. B., and J. A. Schultz. 2008. Using the Community Tool Box’s online documentation system to support
participatory evaluation of community health initiatives. In Community-based participatory research for
health, edited by M. Minkler and N. Wallerstein. San Francisco, CA: Jossey-Bass.
Francisco, V. T., A. L. Paine, and S. B. Fawcett. 1993. A methodology for monitoring and evaluating community
health coalitions. Health Education Research 8(3):403-416.
Glasgow, R. E., L. M. Klesges, D. A. Dzewaltowski, P. A. Estabrooks, and T. M. Vogt. 2006. Evaluating the impact
of health promotion programs: Using the RE-AIM framework to form summary measures for decision making
involving complex issues. Health Education Research 21(5):688-694.
Haby, M., R. Doherty, and L. Holt. 2009. Experiences of the Health Promoting Communities demonstration proj-
ects. Powerpoint presentation to the Community-based Childhood Obesity Prevention Initiatives—Putting
the Lessons Learned into Practice Forum, July 23, 2009. http://www.goforyourlife.vic.gov.au/hav/admin.nsf/
Images/Michelle_Haby_forum.ppt/$File/Michelle_Haby_forum.ppt (accessed June 7, 2013).
Hannay, J., R. Dudley, S. Milan, and P. K. Leibovitz. 2013. Combining Photovoice and focus groups: Engaging
Latina teens in community assessment. American Journal of Preventive Medicine 44(3 Suppl 3):S215-S224.
Heath, E. M., and K. J. Coleman. 2003. Adoption and institutionalization of the Child and Adolescent Trial for
Cardiovascular Health (CATCH) in El Paso, Texas. Health Promotion Practice 4(2):157-164.
Hessel, A. S., J. W. Marshall, W. Brown, A. B. Sabina, and K. DeForest. 2010. Healthy and Active Communities
Initiative: A foundation’s response to the obesity epidemic. Preventive Medicine 50(Suppl 1):S93-S94.
Hoelscher, D. M., S. H. Kelder, A. Perez, R. S. Day, J. S. Benoit, R. F. Frankowski, J. L. Walker, and E. S. Lee. 2010.
Changes in the regional prevalence of child obesity in 4th, 8th, and 11th grade students in Texas from 2000-
2002 to 2004-2005. Obesity (Silver Spring) 18(7):1360-1368.
Iruka, I., K. Maxwell, and J. Sotolongo. 2009. Nutrition and physical activity self-assessment for child care (NAP
SACC): Final 2009 evaluation report. University of North Carolina Frank Porter Graham Child Development
Institute & North Carolina Partnership for Children, Inc.
Klesges, R. C., E. Obarzanek, S. Kumanyika, D. M. Murray, L. M. Klesges, G. E. Relyea, M. B. Stockton, J. Q.
Lanctot, B. M. Beech, B. S. McClanahan, D. Sherrill-Mittleman, and D. L. Slawson. 2010. The Memphis
Girls’ Health Enrichment Multi-site Studies (GEMS): An evaluation of the efficacy of a 2-year obesity preven-
tion program in African American girls. Archives of Pediatrics and Adolescent Medicine 164(11):1007-1014.

Copyright © National Academy of Sciences. All rights reserved.
Evaluating Obesity Prevention Efforts: A Plan for Measuring Progress
439Appendix H
Lazarsfeld, P. F., and Merton R. K. 1971. Mass communication, popular taste and organized social action. In The
process and effects of mass communication, edited by W. Schramm and D. F. Roberts. Urbana, IL: University
of Chicago Press. Pp. 554-578.
NHLBI (National Heart, Lung, and Blood Institute). 2012. Healthy communities study. http://www.nhlbi.nih.gov/
hcs/index.htm (accessed April 10, 2013).
NHLBI. 2013a. Healthy communities study: How communities shape children’s health (HCS). http://www.nhlbi.nih.
gov/resources/obesity/pop-studies/hcs.htm (accessed May 30, 2013).
NHLBI. 2013b. WE CAN! Ways to enhance children’s activity and nutrition. http://www.nhlbi.nih.gov/health/public/
heart/obesity/wecan (accessed June 7, 2013).
NICHQ (National Initiative for Children’s Healthcare Quality). 2012. Joining forces for healthier communities:
Collaborate for Healthy Weight progress report. Boston, MA: NICHQ.
NYC (New York City) Obesity Task Force. 2012. Reversing the epidemic: The New York City Obesity Task Force plan
to prevent and control obesity. http://www.nyc.gov/html/om/pdf/2012/otf_report.pdf (accessed April 16, 2013).
Raine, K. D., R. Plotnikoff, C. Nykiforuk, H. Deegan, E. Hemphill, K. Storey, D. Schopflocher, P. Veugelers, T. C.
Wild, and A. Ohinmaa. 2010. Reflections on community-based population health intervention and evaluation
for obesity and chronic disease prevention: The Healthy Alberta Communities Project. International Journal of
Public Health 55(6):679-686.
Robinson, T. N., D. M. Matheson, H. C. Kraemer, D. M. Wilson, E. Obarzanek, N. S. Thompson, S. Alhassan, T. R.
Spencer, K. F. Haydel, M. Fujimoto, A. Varady, and J. D. Killen. 2010. A randomized controlled trial of cul-
turally tailored dance and reducing screen time to prevent weight gain in low-income African American girls:
Stanford GEMS. Archives of Pediatrics and Adolescent Medicine 164(11):995-1004.
Romon, M., A. Lommez, M. Tafflet, A. Basdevant, J. M. Oppert, J. L. Bresson, P. Ducimetiere, M. A. Charles, and
J. M. Borys. 2009. Downward trends in the prevalence of childhood overweight in the setting of 12-year
school- and community-based programmes. Public Health Nutrition 12(10):1735-1742.
RWJF (Robert Wood Johnson Foundation). 2013. Healthy kids, healthy communities. http://www.healthykids
healthycommunities.org (accessed April 10, 2013).
Samuels & Associates. 2010. Healthy Eating, Active Communities and Central California Regional Obesity
Prevention Program final evaluation synthesis report. Oakland: The California Endowment.
San Diego County Childhood Obesity Initiative. 2013. San Diego County Childhood Obesity Initiative. http://our
communityourkids.org (accessed June 7, 2013).
Schramm, W., and D. F. Roberts. 1971. The process and effects of mass communication. Urbana, IL: University of
Chicago Press.
Schuit, A. J., G. C. Wendel-Vos, W. M. Verschuren, E. T. Ronckers, A. Ament, P. Van Assema, J. Van Ree, and E. C.
Ruland. 2006. Effect of 5-year community intervention Hartslag Limburg on cardiovascular risk factors.
American Journal of Preventive Medicine 30(3):237-242.
Smith, W. E., R. S. Day, and L. B. Brown. 2005. Heritage retention and bean intake correlates to dietary fiber intakes
in Hispanic mothers—Que Sabrosa Vida. Journal of the American Dietetic Association 105(3):404-411;
discussion 411-412.
University of Arkansas for Medical Sciences. 2011. Year 7 evaluation: Arkansas Act 1220 of 2003 to combat child-
hood obesity. Little Rock, AR: Fay W. Boozman College of Public Health.
USDA (U.S. Department of Agriculture). 2010. The W.K. Kellogg Food and Fitness Initiative. http://www.nifa.usda.
gov/nea/food/in_focus/health_if_food_fitness_initiative.html (accessed April 10, 2013).
Wang, C. C., S. Morrel-Samuels, P. M. Hutchison, L. Bell, and R. M. Pestronk. 2004. Flint Photovoice: Community
building among youths, adults, and policymakers. American Journal of Public Health 94(6):911-913.

Copyright © National Academy of Sciences. All rights reserved.
Evaluating Obesity Prevention Efforts: A Plan for Measuring Progress

Copyright © National Academy of Sciences. All rights reserved.
Evaluating Obesity Prevention Efforts: A Plan for Measuring Progress
441
IPanel Agenda
Evaluating Progress of Obesity Prevention Efforts: What Does the Field Need to Know?
Public Session of the Committee on Evaluating Progress of Obesity Prevention EffortsFriday, October 12, 2012
Keck Center of the National Academies500 Fifth Street NW, Washington, DC
Room 100
PURPOSE: To gain a mutual understanding and ability to recognize and reflect in the Committee’s report what it means to use evaluation information of obesity prevention efforts from the perspective of differ-ent key stakeholders, including federal agencies, funders, organizations, businesses, the education system, advocates, health care plans, and public policy makers.
9:00 am Welcome, Introductions, and Purpose of Open Session Lawrence Green, Chair
Moderator: Laura Leviton, Committee member
9:05 Corrine Graffunder Centers for Disease Control and Prevention
9:20 David Fukuzawa The Kresge Foundation
9:40 LuAnn Heinen National Business Group on Health

Copyright © National Academy of Sciences. All rights reserved.
Evaluating Obesity Prevention Efforts: A Plan for Measuring Progress
Evaluating Obesity Prevention Efforts442
10:00 Jessica Donze Black The Pew Charitable Trusts
10:20 BREAK
10:30 Lynne Cuppernull Alliance of Community Health Plans
10:50 William Purcell Jones Hawkins and Farmers, PLC
11:10 Q&A
12:15 pm ADJOURN

Copyright © National Academy of Sciences. All rights reserved.
Evaluating Obesity Prevention Efforts: A Plan for Measuring Progress
443
jCommittee Biographies
Lawrence W. Green, Dr.P.H., M.P.H. (Chair), is professor in the Department of Epidemiology and Biostatistics at the University of California, San Francisco. Prior to his current position, Dr. Green was director of the Office of Science and Extramural Research at the Centers for Disease Control and Prevention (CDC). Dr. Green’s area of interest is policy and program implications of health research and evaluation. Under President Carter’s Administration, Dr. Green served as the first director of the Office of Health Information, Health Promotion, Physical Fitness, and Sports Medicine in the Department of Health and Human Services. He has served on the public health faculties at University of California, Berkeley; The Johns Hopkins University; Harvard University; the University of Texas; and the University of British Columbia and as vice president and director of the Kaiser Family Foundation’s National Health Promotion Program. Dr. Green is a member of the Institute of Medicine (IOM). He serves as a member of the IOM Committee on Valuing Community-Based, Non-Clinical Prevention and Wellness Strategies, and he served on the IOM Committee on An Evidence Framework for Obesity Prevention Decision Making and as an ex officio member of the IOM’s Clinical Research Roundtable. Earlier, he chaired both the IOM Committee to Review the CDC’s Centers for Research and Demonstration of Health Promotion and Disease Prevention and the IOM Committee on Drug Abuse Prevention Research. He received his B.S., M.P.H., and Dr.P.H. from the University of California, Berkeley.
Christina Bethell, Ph.D., M.P.H., M.B.A., is professor in the Department of Pediatrics at Oregon Health and Science University School of Medicine and founding director of the Child and Adolescent Health Measurement Initiative (CAHMI) and the National Data Resource Center for Child and Adolescent Health (DRC). The DRC is a Health Resources and Services Administration funded center to assist in the development, dissemination, and applied use of population-based data, with a focus on the National Survey of Children’s Health (NSCH) and the National Survey of Children with Special Health Care Needs (NS-CSHCN). Her research focuses on understanding and enhancing the role of the health care system to protect and improve health outcomes and promote the early and lifelong development of health of chil-dren, with a major focus on the development, testing, and implementation of consumer-centered methods to measure and improve health and the health care quality of health systems and providers. Dr. Bethell serves as principal investigator for the collaborative development, validation, and national, state, and local implementation of child, youth, and family health and health care quality data and tools. These

Copyright © National Academy of Sciences. All rights reserved.
Evaluating Obesity Prevention Efforts: A Plan for Measuring Progress
Evaluating Obesity Prevention Efforts444
tools include the Promoting Healthy Development Survey (PHDS), the Young Adult Health Care Survey (YAHCS), the Children with Special Health Care Needs Screener (CSHCN Screener), the Medical Home Measurement Module, and other child health and health care quality measures, most of which have been endorsed for voluntary use by the National Quality Forum. Her work to promote the prevention and treatment of childhood overweight and obesity includes publications on national, across state, and across child findings from the NSCH and design of parent-driven tools to identify their child’s risks and needs and improve the quality of well-child care (www.WellVisitPlanner.org). Dr. Bethell earned her under-graduate degree in psychology from the University of California, Los Angeles. She received her M.P.H. and M.B.A. from the University of California, Berkeley, and earned a Ph.D. in health services and policy research from the University of Chicago.
Ronette R. Briefel, Dr.P.H., R.D., is a senior fellow at Mathematica Policy Research. Before join-ing Mathematica in 1999, she held several nutrition research and nutrition policy positions with the National Health and Nutrition Examination Survey (NHANES) program of the National Center for Health Statistics, CDC. Dr. Briefel is an expert in dietary and nutrition assessment and population-based strategies to prevent disease and promote health. Her expertise covers childhood obesity, food insecurity, chronic disease epidemiology, and analysis and interpretation of national survey data to study low-income and high-risk populations. Previously, Dr. Briefel led national studies on the food consumption patterns and nutrient intakes of infants, toddlers, and preschoolers; evaluations of the school food environment, school meals, and children’s diet and obesity; and evidence-based reviews of children’s dietary guidance. She is a principal investigator for the evaluation of the U.S. Department of Agriculture’s (USDA’s) Summer Electronic Benefits Transfer for Children Demonstration that is providing food assistance to low-income children in the summer months. Dr. Briefel served on the IOM Committee on Strategies to Reduce Sodium Intake in the United States; the IOM Committee on Dietary Risk Assessment in the Special Supplemental Nutrition Program for Women, Infants, and Children (WIC) Program; and the Division of Behavioral and Social Sciences and Education Committee on National Statistics Project on Enhancing the Data Infrastructure in Support of Food and Nutrition Programs, Research, and Decision Making. She served on the External Scientific Panel for the National Collaborative on Childhood Obesity Research (NCCOR) in 2012 and received the American Dietetic Association Foundation Elaine R. Monsen Award for Outstanding Research Literature in 2011. Dr. Briefel received a Dr.P.H. in chronic disease epidemiology from the University of Pittsburgh and is a registered dietitian.
Ross C. Brownson, Ph.D., is professor in the Brown School and the School of Medicine (Division of Public Health Sciences) at Washington University in St. Louis. He is involved in numerous community-level studies designed to reduce modifiable risk factors such as physical inactivity, unhealthy eating, and tobacco use. In particular, he is interested in evaluating the impacts of environmental and policy inter-ventions on health behaviors. Dr. Brownson conducts research on dissemination and implementation of evidence-based interventions in public health and policy settings. He is co-director of the CDC-funded Prevention Research Center (PRC), a project aimed at developing innovative approaches to chronic dis-ease prevention. Current activities of the PRC include evaluation of a wide range of physical activity and obesity policies. Dr. Brownson is the author of 7 books and 340 peer-reviewed articles. His books include Chronic Disease Epidemiology and Control, Applied Epidemiology, Handbook of Obesity Prevention,
Copyright © National Academy of Sciences. All rights reserved.
Evaluating Obesity Prevention Efforts: A Plan for Measuring Progress
445Appendix J
Evidence-Based Public Health, and Dissemination and Implementation Research in Health: Translating Science to Practice. Dr. Brownson served on the IOM Committees on An Evidence Framework for Obesity Prevention Decision Making, Progress in Preventing Childhood Obesity, and Prevention of Obesity in Children and Youth. He received his Ph.D. in environmental health and epidemiology from Colorado State University.
Jamie F. Chriqui, Ph.D., M.H.S., is a senior research scientist and director of policy surveillance and eval-uation for the Health Policy Center within the Institute for Health Research and Policy at the University of Illinois, Chicago (UIC), and a research associate professor in political science at UIC. Prior to join-ing UIC, Dr. Chriqui served as technical vice-president of the Center for Health Policy and Legislative Analysis at The MayaTech Corporation and, previously, as a policy analyst at the National Institute on Drug Abuse. She has experience conducting public health policy research, evaluation, and analysis, with an emphasis on obesity, substance abuse, tobacco control, and other chronic disease–related policy issues. Her research interests focus on examining the impact of law and policy on community and school environments as well as individual behaviors and attitudes. Her current research focuses on community policies related to the physical activity and food environments, sugar-sweetened beverage taxation, and school district wellness policies. She directs all state, local, and school district policy research activities for the Robert Wood Johnson Foundation–supported Bridging the Gap program and is principal investiga-tor or co-investigator on several National Institutes of Health (NIH) research grants. Dr. Chriqui serves on numerous obesity-related advisory and expert panels. She is a member of the IOM Committee on Accelerating Progress in Obesity Prevention. She holds a B.A. in political science from Barnard College at Columbia University, an M.H.S. in health policy from The Johns Hopkins Bloomberg School of Public Health, and a Ph.D. in policy sciences (health policy concentration) from the University of Maryland, Baltimore County.
Stephen Fawcett, Ph.D., is Kansas Health Foundation distinguished professor in the Department of Applied Behavioral Science at the University of Kansas (KU) and the director of KU Work for Community Health and Development, a World Health Organization Collaborating Centre. Dr. Fawcett uses methods of behavioral science and community development to help understand and improve how communities create conditions that promote health and development. He is co-author of nearly 200 articles and book chapters and several books in the areas of community and public health, child and youth health and development, and community development. He has consulted with a number of private foundations and national and international organizations, including the Robert Wood Johnson Foundation (RWJF), CDC, and Pan American Health Organization. A former visiting scholar at the World Health Organization (WHO), he serves as a member of the WHO Expert Panel on Health Promotion. He is the author of sci-entific publications about community approaches to obesity prevention. Dr. Fawcett was an IOM Scholar-in-Residence, an external reviewer for the IOM Committee report on Progress in Preventing Childhood Obesity, and a member of the IOM Board on Population Health and Public Health Practice. Dr. Fawcett received his Ph.D. in developmental psychology from KU.
Brian R. Flay, D.Phil., is a professor in the School of Social and Behavioral Health Sciences in the College of Public Health and Human Sciences at Oregon State University. Dr. Flay’s research interests include

Copyright © National Academy of Sciences. All rights reserved.
Evaluating Obesity Prevention Efforts: A Plan for Measuring Progress
Evaluating Obesity Prevention Efforts446
health promotion and disease prevention research, mass media for health promotion and disease preven-tion, positive youth development, comprehensive school reform, and prevention research theory and methods. His research focuses on understanding and preventing the adoption of unsafe behaviors, with particular attention to the health of children and adolescents. Dr. Flay is the author of numerous sci-entific publications about child and adolescent risk behaviors, particularly among low socioeconomic status groups. He previously served as a member on the IOM Committee on Reducing Tobacco Use, the IOM Committee on HIV Prevention Strategies, and the IOM Panel on Evaluation of AIDS Interventions. Dr. Flay received his D.Phil. from Waikato University, New zealand, and completed his postdoctoral stud-ies at Northwestern University.
Deanna M. Hoelscher, Ph.D., R.D., L.D., C.N.S., is the John P. McGovern Professor in Health Promotion and Behavioral Sciences and director of the Michael & Susan Dell Center for Healthy Living at the University of Texas School of Public Health, Austin Regional Campus. Dr. Hoelscher’s research interests include child and adolescent nutrition, school-based health promotion programs, dietary and physical activity assessment methodology, evaluation of child obesity policies, and dissemination of school health programs. She has been the principal investigator on many research projects with child and adolescent populations, most notably the Child and Adolescent Trial for Cardiovascular Health (CATCH) and the Travis County CATCH project, studies to decrease cardiovascular risk factors in children and childhood obesity; the School Physical Activity and Nutrition (SPAN) study, a child and adolescent overweight prevalence study in Texas; the Texas Child Obesity Prevention Policy Evaluation (T-COPPE) project; and Lunch is in the Bag, an NIH-funded parent program that addresses lunch-packing behaviors. She is also principal investigator of the Texas Child Obesity Research Demonstration (Texas CORD) grant to devel-op, implement, and evaluate an integrated, systems-oriented approach to obesity prevention and weight management for underserved, ethnically diverse children ages 2 to 12. Dr. Hoelscher is president of the International Society of Behavioral Nutrition and Physical Activity. She was a reviewer on the following IOM reports: Strategies to Reduce Sodium Intake in the United States, School Meals: Building Blocks for Healthy Children, and Nutrition Standards for Foods in Schools. Dr. Hoelscher was chair of the Texas Council on Cardiovascular Disease and Stroke from 2003 to 2005 and of the Research Dietary Practice Group of the Academy of Nutrition and Dietetics from 2004 to 2005. She has served as the Public Health Nutrition Division chair of the Society for Nutrition Education and was program chair of the Annual Meeting Planning Committee for the Academy of Nutrition and Dietetics. Dr. Hoelscher received her B.S. in food science and technology from Texas A&M University and her M.A. in nutrition and Ph.D. in bio-logical sciences from the University of Texas. Dr. Hoelscher is a registered dietitian.
James W. Krieger, M.D., M.P.H., is chief of the Chronic Disease and Injury Prevention Section at Public Health–Seattle & King County, and clinical professor of Medicine and Health Services and attending physi-cian at the University of Washington. Dr. Krieger is a nationally recognized expert in the development and evaluation of community-based chronic disease control and prevention programs. His recent research work has emphasized interventions to reduce health disparities in healthy eating and active living by addressing social and physical environmental determinants of health. He has worked with multiple sectors to imple-ment and evaluate menu labeling in King County, design and build healthy public housing communities, reduce access to sugary beverages, and develop and evaluate community health worker interventions to

Copyright © National Academy of Sciences. All rights reserved.
Evaluating Obesity Prevention Efforts: A Plan for Measuring Progress
447Appendix J
address chronic diseases. He recently led Seattle & King County’s Communities Putting Prevention to Work (CPPW) program and now co-leads the local Community Transformation Grant. He has also played a lead role in other multi-sector community-based partnerships that address health inequities, including REACH, Steps, Allies Against Asthma (RWJF), and Food and Fitness (Kellogg). Dr. Krieger was a mem-ber of the IOM Committee on Childhood Obesity Action for Local Governments. He is founding chair of the National Association of County and City Health Officials Big Cities Chronic Disease Community of Practice and leads its sugar-sweetened beverage work group. He is co-chair of Advancing the Movement, a CDC- and foundation-sponsored effort to connect the hundreds of healthy community initiatives across the nation into a learning community. He has received numerous awards for his work, including the U.S. Secretary of Health and Human Services Innovation in Prevention, the U.S. Department of Housing and Urban Development Healthy Homes Innovation, and the U.S. Environmental Protection Agency Children’s Environmental Health Excellence Awards. He received his undergraduate degree from Harvard University, completed medical training at the University of California, San Francisco, and received an M.P.H. from the University of Washington.
Laura C. Leviton, Ph.D., is senior adviser for evaluation at RWJF. Since joining RWJF in 1999, she has overseen evaluations in most of RWJF’s areas of focus and continues that role today on the founda-tion initiatives in preventing childhood obesity and for vulnerable populations. Previously, Dr. Leviton was a professor of public health at the University of Alabama at Birmingham and on the faculty of the University of Pittsburgh School of Public Health. She was president of the American Evaluation Association in 2000. She is the co-author of two books—Foundations of Program Evaluation and Confronting Public Health Risks—and serves on several editorial boards for evaluation journals. Dr. Leviton served on the IOM Committee to Evaluate Preparedness for Terrorist Attacks and the IOM Committee to Assess the Hearing Loss Prevention Program of the National Institute on Occupational Safety and Health. She is a founding member of the Improvement Science Development Group of the Health Foundation of the United Kingdom. She received the 2011 award for evaluation publication of the year from the American Evaluation Association. She received a B.A. in psychology from Reed College, a Ph.D. in social psychology from the University of Kansas, and her postdoctoral training in evaluation research from Northwestern University.
K. M. Venkat Narayan, M.D., M.Sc., M.B.A., is Ruth and O.C. Hubert Professor of Global Health and Epidemiology at Rollins School of Public Health and professor Medicine, School of Medicine at Emory University. Dr. Narayan is a physician-scientist trained in internal medicine, geriatric medicine, and pre-ventive medicine, and specializes in the epidemiology and prevention of obesity, diabetes, and vascular diseases. Until 2006, he led the Diabetes, Epidemiology, and Statistics Branch, Division of Diabetes Translation, CDC. Dr. Narayan was a visiting scientist at BIH from 1992 to 1996. He is an investigator in several large, multicenter, national studies of diabetes, including the TRIAD Study of diabetes quality of care, Diabetes Prevention Program, the ACCORD Trial of cariovascular disease prevention, and the SEARCH study of diabetes in children. He has authored more than 300 peer-reviewed journal articles. Dr. Narayan directs the Emory Global Diabetes Research Center and is principal investigator on three global health training grants. He is a fellow of the American College of Physicians, Royal College of Physicians of Ireland, and the faculty of public health medicine of the Royal College of Physicians, United Kingdom.

Copyright © National Academy of Sciences. All rights reserved.
Evaluating Obesity Prevention Efforts: A Plan for Measuring Progress
Evaluating Obesity Prevention Efforts448
Dr. Narayan served on the IOM Committee on a National Surveillance System for Cardiovascular and Select Chronic Diseases. He received his M.Sc. from the University of Edinburgh, his M.B.A. from Edinburgh’s Heriot-Watt University, and his M.D. from St. Johns Medical College, Bangalore, India.
Nico P. Pronk, Ph.D., is vice president and chief science officer at HealthPartners in Minneapolis, Minnesota. Dr. Pronk is a senior research investigator at the HealthPartners Research Foundation and holds an adjunct faculty position as professor of Society, Human Development, and Health at the Harvard School of Public Health. Dr. Pronk is widely published in both the scientific and practice literatures and is a national and international speaker on population health and health promotion. He a member of the Task Force on Community Preventive Services, the founding president of the International Association for Worksite Health Promotion (IAWHP), and a member of the Research Advisory Committee of the Health Enhancement Research Organization (HERO). Among other activities, Dr. Pronk formerly served on the Clinical Obesity Research Panel at NIH, the Carter Center Medical Home initiative, the Defense Health Board (Armed Forces Epidemiological Board), the Health Promotion Advisory Panel at the National Commission on Quality Assurance (NCQA), and various IOM committees. He is the senior editor of ACSM’s Worksite Health Handbook, Second Edition and the author of the scientific background paper for the business and industry sector of the U.S. National Physical Activity Plan. Dr. Pronk received his doctorate degree in exercise physiology at Texas A&M University and completed his postdoctoral studies in behavioral medicine at the University of Pittsburgh Medical Center and Western Psychiatric Institute and Clinic in Pittsburgh, Pennsylvania.
Lorrene Ritchie, Ph.D., R.D., is director of research at the Atkins Center for Weight and Health at the University of California, Berkeley. To identify promising target behaviors for the prevention of obesity and its co-morbidities, Dr. Ritchie has led several evidence-based reviews of the scientific literature. She served as an evidence analyst for the Academy of Nutrition and Dietetics (formerly the American Dietetic Association) and was a member of the Academy’s Pediatric Weight Management Workgroup to formu-late evidence-based practice guidelines. She was the lead author of the Academy’s 2006 position paper on pediatric weight management and is co-authoring the upcoming 2013 update to this paper. Dr. Ritchie co-authored a comprehensive book on the determinants of obesity (Obesity: Dietary and Developmental Influences). She has devoted her career to the development of interdisciplinary, science-based, and cul-turally relevant solutions to the obesity epidemic and has conducted studies in numerous settings on the implementation and evaluation of nutrition policy and promotion activities. Her research interests include dietary patterns, timing of eating and sleep duration in relation to the development of obesity, evaluation of the impact of food and beverage policy in child care and school settings, the effect of nutrition educa-tion in Special Supplemental Nutrition Program for Women, Infants, and Children, and the relationship between community-based nutrition programs and policies and the development of obesity in children. Dr. Ritchie has an M.S. and Ph.D. in nutritional sciences from the University of California, Berkeley, and is a registered dietitian.
Elsie Taveras, M.D., M.P.H., is associate professor of pediatrics and population medicine at Harvard Medical School and of Nutrition at Harvard School of Public Health. She is chief of the Division of General Academic Pediatrics and director of Pediatric Population Health Management at Massachusetts

Copyright © National Academy of Sciences. All rights reserved.
Evaluating Obesity Prevention Efforts: A Plan for Measuring Progress
449Appendix J
General Hospital. Her main focus of research is understanding determinants of obesity in children and developing interventions to prevent obesity, especially in underserved populations. She is principal inves-tigator of several NIH- and CDC-funded studies related to childhood obesity prevention. Dr. Taveras has extensive expertise in epidemiologic investigations into the developmental origins of obesity, obesity pre-vention and treatment, pediatrics, examining racial/ethnic disparities, and direction of cluster randomized trials in the clinical setting. Her work spans the spectrum of study designs in obesity from observational, epidemiology studies to interventions across the life course. She served on the IOM Committee on Obesity Prevention Policies for Young Children. Dr. Taveras trained in pediatrics at Children’s Hospital Boston and Boston Medical Center and received her M.P.H. from the Harvard School of Public Health.

Copyright © National Academy of Sciences. All rights reserved.
Evaluating Obesity Prevention Efforts: A Plan for Measuring Progress