Brace treatment for osteoarthritis of the knee: a prospective randomized multi-centre trial
Upload
khangminh22Category
view
1download
0
Citation: Onu, I.; Matei, D.; Sardaru,
D.-P.; Cascaval, D.; Onu, A.;
Gherghel, R.; Serban, I.L.; Mocanu,
G.D.; Iordan, D.A.; Murariu, G.; et al.
Rehabilitation of Patients with
Moderate Knee Osteoarthritis Using
Hyaluronic Acid
Viscosupplementation and
Physiotherapy. Appl. Sci. 2022, 12,
3165. https://doi.org/10.3390/
app12063165
Academic Editors: Stefano Masiero
and Daniele Coraci
Received: 2 February 2022
Accepted: 16 March 2022
Published: 20 March 2022
Publisher’s Note: MDPI stays neutral
with regard to jurisdictional claims in
published maps and institutional affil-
iations.
Copyright: © 2022 by the authors.
Licensee MDPI, Basel, Switzerland.
This article is an open access article
distributed under the terms and
conditions of the Creative Commons
Attribution (CC BY) license (https://
creativecommons.org/licenses/by/
4.0/).
applied sciences
Article
Rehabilitation of Patients with Moderate Knee OsteoarthritisUsing Hyaluronic Acid Viscosupplementationand PhysiotherapyIlie Onu 1,2,3,* , Daniela Matei 1, Dragos-Petrica Sardaru 1, Dan Cascaval 2 , Ana Onu 3, Robert Gherghel 3,4,Ionela Lacramioara Serban 4, George Danut Mocanu 5, Daniel Andrei Iordan 5,*, Gabriel Murariu 6
and Anca-Irina Galaction 1,2
1 Department of Biomedical Sciences, Faculty of Medical Bioengineering, University of Medicine and Pharmacy“Grigore T. Popa” Iasi, 700454 Iasi, Romania; [email protected] (D.M.); [email protected] (D.-P.S.);[email protected] (A.-I.G.)
2 Doctoral School of Faculty of Chemical Engineering and Environmental Protection “Cristofor Simionescu”,Technical University “Gheorghe Asachi” Iasi, 700050 Iasi, Romania; [email protected]
3 Department of Physiotherapy, Micromedica Clinic, 610119 Piatra Neamt, Romania;[email protected] (A.O.); [email protected] (R.G.)
4 Department of Morpho-Functional Sciences II, Faculty of Medicine, University of Medicine and Pharmacy“Grigore T. Popa” Iasi, 700115 Iasi, Romania; [email protected]
5 Department of Individual Sports and Kinetotherapy, Faculty of Physical Education and Sport,“Dunărea de Jos” University of Galati, 800008 Galati, Romania; [email protected]
6 Chemistry, Physics and Environment Department, Faculty of Sciences and Environment, “Dunarea de Jos”University of Galati, 800201 Galati, Romania; [email protected]
* Correspondence: [email protected] (I.O.); [email protected] (D.A.I.)
Abstract: Knee osteoarthritis (KOA) is one of the most common public health problems which cannotbe cured and ultimately leads to disability. Current management is largely limited to the treatmentof the symptoms. To avoid the late stages of KOA that lead to knee replacement, the key point is tocontrol and reduce destructive processes using efficient pharmacological products combined withphysiotherapy (PT). Herein, we perform a monocentric observational study to compare the effect ofcombining a multi-modal physiotherapy regime and intra-articular (IA) injection with hyaluronicacid (HA) on the non-surgical treatment of KOA. Patients with mild KOA were randomly assigned totwo groups to receive an HA injection with PT or an HA injection only. The assessment tools for pain,clinical disease severity, and disability were the total score on the Western Ontario and McMasterUniversities Osteoarthritis Index (WOMAC) (scores range from 0 to 96, with higher scores indicatingworse pain, function, and stiffness), knee range of motion (ROM), pain on the visual analog scale(VAS), and muscle strength testing (MST). All tests were evaluated every 3 months up to 1 year fromthe baseline. The study enrolled 52 patients with ages between 47 and 61 years who were dividedinto two groups. Thirty-seven (n = 37) patients were randomized in the pilot group (PG) and receivedIA injections with the viscoelastic hyaluronic acid product (HA) combined with a multi-modal PTregime. The PT program included 10 sessions of transcutaneous electrical nerve stimulation, low-level laser therapy, ultrasound, physical exercise, and cryotherapy. Fifteen patients (n = 15) fromthe control group (CG) received the IA HA injections only. All patients were confirmed with mildKOA of Kellgren–Lawrence grade 2 on radiographs at the beginning of the treatment. The baselinecharacteristics, including the severity of pain and level of disability, were similar in the two groups.At baseline, the mean (±SD) WOMAC scores reported were 64.6 ± 4.08 in the CG and 64.5 ± 2.99in the PG. Notably, at only 3 months into the study, the mean scores were significantly improvedto 56.7 ± 5 in the CG and 48.27 ± 2.13 in the PG (mean between-group difference = 16.19 points;95% confidence interval), finding favor for the combination of HA injections and physiotherapy.At the study’s endpoint (12 months), the scores were improved in both groups, with the meanbetween-group difference remaining significant (7.08 points, 95% confidence interval). A decrease inpain, as evaluated by the VAS scale, was reported for both groups, with the PG reporting a betterVAS score that decreased from 5.7 to 2 when compared to the CG, which decreased from 5.7 to 3. The
Appl. Sci. 2022, 12, 3165. https://doi.org/10.3390/app12063165 https://www.mdpi.com/journal/applsci

Appl. Sci. 2022, 12, 3165 2 of 25
physical assessment parameters (ROM and MST) followed the same trend, with a rapid improvementin the ROM in the PG, changing from 98 to 115 in the first 3 months, and a slower and moresteady evolution in the CG group, changing from 100 to 112 in 9 months. Herein, we report on thecombination therapy of an intra-articularly administered HA viscoelastic product and a multi-modalphysiotherapy regime, which can play a key role in the non-surgical treatment of KOA, effectivelycontrolling pain, stiffness, and the ROM value and improving patients’ quality of life.
Keywords: knee osteoarthritis; hyaluronic acid; viscoelastic infiltration; physiotherapy;combination therapy
1. Introduction
Osteoarthritis (OA) is one of the most important public health problems and the mostcommon joint disorder in the elderly. It is well recognized that OA leads to decreasedquality of life due to pain and stiffness, including limited activity in daily life and work witha decreasing capacity of the affected individual for integration in the family and society,which often results in depression and anxiety [1]. Moreover, OA poses a huge financialburden on the healthcare systems around the globe, and although not fatal, it significantlyreduces the quality of life of tens of millions globally.
OA is an inflammatory disease characterized by chronic and progressive cartilagedegeneration, osteophyte formation, subchondral sclerosis, margin hypertrophy of thebone, and changes in the synovial membrane. There are several risk factors linked to theonset of OA, such as age, body weight, and metabolic and genetic factors. The occurrenceand rate of OA across studies vary greatly, depending on the used definition, the populationtested (primary versus tertiary care), and the dispersal of OA risk factors, such as age, sex,obesity, and geographical region [2]. Aging, inflammation, and oxidative stress appear tobe major contributing factors to the development and progression of OA. The progressiveloss and breakdown of articular cartilage induced by inflammation play an essential role inthe pathogenesis of OA [3]. The main manifestation of OA is synovial inflammation, withloss of articular cartilage and degenerative changes in other tissues such as the synovium,menisci, ligaments, and subchondral bone.
Knee osteoarthritis (KOA) is a disease that eventually becomes disabling, and in thelast stage, the solution is total knee arthroplasty. A multitude of factors leads to KOA’sprogression that are associated with the destruction of articular cartilage. Along with thesecartilage changes, a reduction in the elastic and viscous properties of the synovial fluidoccurs. The molecular weight and concentration of the naturally occurring hyaluronicacid decrease.
Both early diagnosis and conservative treatment methods are critical in the subsequentevolution of the disease. The treatment of patients depends on the clinical diagnosisassociated with the imaging diagnosis based on radiographic images.
Hyaluronic acid (HA), also known as hyaluronan or hyaluronate, is widely distributedin many tissues and fluids in the human body but more abundantly in the articular cartilageand synovial fluid (SF) [4]. It is well established that in KOA, the viscoelastic properties ofthe SF are compromised, as both the concentration and the molecular weight decrease withtime and aging. [5,6]. HA has many biological properties, such as articular cartilage lubrica-tion and antioxidative or anti-nitrosative, analgesic, anti-inflammatory, chondroprotective,ECM degradation prevention, and cartilage repair effects, and is actively synthesized by Bsynoviocytes, fibroblasts, and chondrocytes. HA can enhance the synthesis of chondroitinsulphate and proteoglycans and reduce the production and activity of metalloproteinases(MMPs) [7]. HA was found to counteract the effect of IL-1 by inhibiting the IL-1-induceddownregulation of type II collagen mRNA expression [8]. HA may be involved in variouscellular interactions (cell differentiation, proliferation, development, and recognition) and

Appl. Sci. 2022, 12, 3165 3 of 25
physiological functions [9]. A comprehensive review of the molecular mechanisms andtherapeutic applications can be found elsewhere [10].
From the literature, it is known that the pathological changes of SF HA, with itsdecreased molecular weight and concentration, led to the concept of viscosupplementation(VS). VS is a safe, effective, and well-established treatment for OA that involves injecting asolution based on HA into the affected synovial joint. Optimal treatment with VS shoulddelay the degeneration of the cartilage and even help to regenerate the structure of thearticular cartilage [11]. VS with HA in KOA restores the properties of healthy SF, activatesthe physiological production of HA by synovial membrane cells, has a painkiller and anti-inflammatory effect, and inhibits cartilage degradation enzymes such as metalloproteinases(MMPs) [12–14]. Hsieh et al. measured the levels of MMP-2, MMP-9, urokinase-typeplasminogen activator (u-PA), and plasminogen activator inhibitor (PAI-1) in a series ofchondral, meniscal, and synovial cultures of early OA after treatment with or without threeHA products with different molecular weights (MWs) and demonstrated that all of theHA products could decrease the secretion of MMP-2 and MMP-9. They suggested thatHA with a high MW might be more effective in inhibiting MMP-2, MMP-9, u-PA, andPAI-1 expression [15]. HA can bind to receptors such as CD44 (the most widely distributedcell surface receptor recognized for HA binding), the receptor for hyaluronate-mediatedmotility (RHAMM), and Intercellular Adhesion Molecule 1 (ICAM-1) [16].
Moreover, VS could restore the rheological properties of the SF and promote the en-dogenous synthesis of a higher MW and possibly more functional HA, thereby improvingmobility and articular function and decreasing pain [17]. The intra-articular (IA) adminis-tration of HA is reported to be more effective than oral administration because it avoidssystemic exposure and potential adverse side effects.
HA, being a physiological component, is not expected to produce adverse reactionseven after repeated administration [18]. In clinical trials, IA administration of HA is safeand well-tolerated in OA patients [18,19], with only minor side effects that might occursuch as pain at the injection site, local joint pain, swelling, and local skin reactions.
However, HA treatment is contraindicated in individuals who are hypersensitiveto HA products, women who are pregnant or nursing, pediatric patients, patients withbacteremia, or patients with infections in or around the target knee [20].
Physical therapy (PT) in KOA rehabilitation is an essential part of healthcare thatprovides services for the development, maintenance, and restoration of movement capacityand functional ability to the maximum possible level throughout life. PT is a form ofmusculoskeletal disorder treatment with the help of physical agents.
Transcutaneous electrical nerve stimulation (TENS) is a method of pain therapy usedworldwide by physiotherapists and medical practitioners. TENS reduces pain in KOAby selectively stimulating the large-diameter, low-threshold, non-noxious afferents indermatomes and increasing the excitability of the quadriceps motor neuron [21]. It hasbeen shown that TENS activates the native opioid receptors targeting δ and µ receptorswith high- and low-frequency current pulses [22]. The Philadelphia panel published arandomized control trial (RCT), and they concluded that TENS currents provided significantpain relief in KOA patients compared with a placebo [23]. The results found in the meta-analysis studies showed that TENS currents have a significant effect on the reduction ofpro-inflammatory cytokines, especially IL-6 [24].
Low-level laser therapy (LLLT) is a form of non-invasive PT that applies low-powerlasers or light-emitting diodes (LEDs) to the surface of the body. LLLT is used by physiother-apists to treat various musculoskeletal conditions, including KOA. LLLT has an analgesicand pain-relieving effect as well as a bio modulatory effect on microcirculation. LLLT hasstrong anti-inflammatory and analgesic effects, including tissue healing and improvinglymphedema [25,26]. In a 2009 study, Béla Hegedus et al. showed that LLLT improvedknee flexion and decreased knee pain in KOA-affected joints over a 2-month period afterthe therapy session, using the WOMAC questionnaire or the Lequesne index to evaluatethe output. The study was performed on 27 patients, and treatment was performed with

Appl. Sci. 2022, 12, 3165 4 of 25
an LLLT twice a week over a period of 4 weeks with a GaAlAs laser diode at 50 mW powerand at continuous wave with a 830-nm wavelength [27].
Ultrasound (US) therapy is a non-invasive and safe form of PT used for muscu-loskeletal conditions, including KOA. US not only relieves symptoms but also can providepotential cartilage reparation effects [28]. Multiple studies have shown that US promotescollagen formation, regulates inflammatory responses, and induces cartilage repair [29,30].In a meta-analysis published by Zhang C et al. in 2016 comprising RCTs from 1991 to2014, they demonstrated that US is a safe and valid type of PT in relieving OA-relatedpain and improving joints’ ROM [31]. In PT, US is most often used in continuous modeand rarely in pulsed mode with a low duty cycle. Priscila Daniele de Oliveira Perruciniet al. showed that low-intensity pulsed US had a bio-stimulating effect on fibroblast cellsin vitro. They proved that US with a duty-cycle of 10% and 0.2 W/cm2 intensity presentedsuperior bio-stimulation response in contrast to 0.5 W/cm2 intensity and 20% duty-cycle.After 48 h from US therapy, the treatment affected the IL-6 cytokine production and geneticmodulation, confirming its therapeutic properties related to the initial phases of tissuehealing [32].
Cryotherapy is a non-pharmacological intervention that has been widely used incontrolling inflammation, edema, and pain management [33]. Cryotherapy is a techniqueconsidered to be safe, inexpensive, and easy to administer for physiotherapists and patients.Cryotherapy on an animal model with induced KOA reduces synovial inflammation dueto lower leukocyte migration and inflammatory cytokine concentration at the knee jointcavity [34]. Controlling pro-inflammatory cytokines is a key factor in the treatment of KOAand has been considered a pharmacological therapeutic approach. However, anti-cytokinedrugs exhibit potential iatrogenic effects, and cryotherapy controls the inflammation andimproves the clinical condition without side effects. Cryotherapy is rarely prescribed asan adjuvant treatment for KOA, and unfortunately, there are not enough studies to showthe long-term benefits of this therapy [35]. In this study, we introduced cryotherapy at theend of the PT program to reduce the joint temperature in order to protect the application ofHA-biopolymer.
Physical therapy exercises (PTEs) are used to limit the loss of joint function caused byKOA. PTE is used to manage the symptoms of KOA and optimize the quality of life. Regularexercise prevents joint degradation and maintains joint mobility and muscle tone, thusincreasing joint stability and coordination in patients with KOA. Most clinical guidelinesrecommend PTE, patient education, and weight loss [36,37].
VS with HA products and PT are the most common means used worldwide to protectarticular cartilage in the synovial joints, control the pain, and stimulate joint tissues. Despitethe large body of literature in the field, currently, there are no standardized PT protocols thatuse combinations of physical agents and pharmacological agents to control the progressionof KOA.
In this study, we sought to evaluate a treatment regime that would limit the progressionof KOA by combining HA VS with a multi-modal PT approach that includes transcutaneousTENS, LLLT, cryotherapy, US, and PTE.
2. Materials and Methods2.1. Trial Procedure
A monocentric observational study was performed from January 2020 to July 2021in the orthopedics and physiotherapy departments of the Piatra Neamt, MicromedicaClinic. The study was approved by the Ethical Committee for Scientific Research of theMicromedica Clinic in Piatra Neamt, and was carried out in accordance with the HelsinkiDeclaration of Ethical Principles. All patients included in the study signed their informedconsent. The study was performed on a group of 52 patients diagnosed with KOA in stage2 of the “Kellgren and Lawrence system” (KL) based on radiological examination of theanterior-posterior view of an X-ray of the knee. KL classification is commonly used inepidemiological research studies of KOA to guide health professionals in their clinical

Appl. Sci. 2022, 12, 3165 5 of 25
decision making, especially for managing patients with surgical indications [38]. TheKL system uses five classes: KL 0 (normal), KL 1 (narrowing of the joint space), KL 2(osteophytes and narrowing of the joint space), KL 3 (multiple osteophytes, well-definedjoint narrowing, sclerosis, and possible bone deformity), and KL 4 (large osteophytes,marked joint narrowing, severe sclerosis, and defined bone deformity). The study reportfollows the Consolidated Standards of Reporting Trials (CONSORT) model using theCONSORT checklist (Figure 1) [39].
Appl. Sci. 2022, 12, x FOR PEER REVIEW 5 of 26
of the “Kellgren and Lawrence system” (KL) based on radiological examination of the anterior-posterior view of an X-ray of the knee. KL classification is commonly used in epidemiological research studies of KOA to guide health professionals in their clinical decision making, especially for managing patients with surgical indications [38]. The KL system uses five classes: KL 0 (normal), KL 1 (narrowing of the joint space), KL 2 (osteo-phytes and narrowing of the joint space), KL 3 (multiple osteophytes, well-defined joint narrowing, sclerosis, and possible bone deformity), and KL 4 (large osteophytes, marked joint narrowing, severe sclerosis, and defined bone deformity). The study report follows the Consolidated Standards of Reporting Trials (CONSORT) model using the CONSORT checklist (Figure 1) [39].
Figure 1. The CONSORT flow diagram of the progress through the phases of a randomized trial of two groups (enrolment, intervention, follow-up, and data analysis).
2.2. Patients and Demographics The pilot group (PG) consisted of 37 patients who benefited from intra-articular (IA)
VS with a Kombihylan® viscoelastic HA product and 10 consecutive sessions of PT. The control group (CG) consisted of 15 patients treated with Kombihylan® without PT ses-sions. The patients had an equal distribution by gender; 26 were men and 26 were women aged 47–61 years, weighing between 65 and 110 kg and with heights between 154 and 186 cm.
The PG included 16 women and 21 men, with 7 having bilateral KOA, 13 having left KOA, and 17 patients having right KOA. Of these, 22 patients entered the occupational risk group, in which they stood in a bipedal position for more than 4 h per day. The CG included 15 patients, of which 10 women and 6 men aged between 50 and 61 years, weigh-ing between 65 and 110 kg and having heights between 154 and 186 cm. In this group, 3 patients suffered from bilateral KOA, 11 had left KOA, and 2 had right KOA, of which 14 of them were in the occupational risk group.
Figure 1. The CONSORT flow diagram of the progress through the phases of a randomized trial oftwo groups (enrolment, intervention, follow-up, and data analysis).
2.2. Patients and Demographics
The pilot group (PG) consisted of 37 patients who benefited from intra-articular (IA)VS with a Kombihylan® viscoelastic HA product and 10 consecutive sessions of PT. Thecontrol group (CG) consisted of 15 patients treated with Kombihylan® without PT sessions.The patients had an equal distribution by gender; 26 were men and 26 were women aged47–61 years, weighing between 65 and 110 kg and with heights between 154 and 186 cm.
The PG included 16 women and 21 men, with 7 having bilateral KOA, 13 having leftKOA, and 17 patients having right KOA. Of these, 22 patients entered the occupationalrisk group, in which they stood in a bipedal position for more than 4 h per day. TheCG included 15 patients, of which 10 women and 6 men aged between 50 and 61 years,weighing between 65 and 110 kg and having heights between 154 and 186 cm. In this group,3 patients suffered from bilateral KOA, 11 had left KOA, and 2 had right KOA, of which 14of them were in the occupational risk group.
The CONSORT flow diagram of the progress through the phases of a parallel random-ized trial of two groups (enrolment, intervention, follow-up, and data analysis) is presentedin Figure 1.
Appl. Sci. 2022, 12, 3165 6 of 25
2.3. HA Injections
The viscoelastic product with the commercial name Kombihylan® was purchasedfrom Ropharm® (Romania). Kombihylan® is a biological matrix with a molecular weight of3 MDa in the form of a viscoelastic solution containing HA which is obtained by bacterialfermentation of a Streptococcus strain. The product was administered IA by an orthope-dic specialist.
2.4. Procedure Steps (PS)
PS1: Using appropriate sterile techniques, an aspiration from the knee was performedfrom the suprapatellar region with a needle and syringe to depressurize the joint capsule.About 2 mL of SF was aspirated from the knee joint to reduce post-procedural swelling,preventing the increase in IA pressure.
PS2: IA infiltration was performed with the viscoelastic product Kombihylan® (3 mL)in the suprapatellar region using the same needle.
PS3: After removing the needle, the patient was asked to walk for 5–10 min to “ho-mogenize” the viscoelastic product.
PS4: After 72 h, each patient started the program of PT for 10 consecutive days.
2.5. Study Design
For the inclusion criteria, the eligible patients were those who did not have increasedinflammatory markers above the accepted values (normal blood count, erythrocyte sed-imentation rate, and C-reactive protein), patients diagnosed with KOA and confirmedradiologically with KL 2 stage without previous infiltration of other viscoelastic substancesor glucocorticoids in the last 12 months, and patients without knee synovitis in the last12 months. Patients with bilateral KL 2 stage KOA were also included but only if they hada single symptomatic knee.
The exclusion criteria included a known allergy or hypersensitivity to sodium hyaluronate,chondroitin sulphate, N-acetylglucosamine, or any of the ingredients of Kombihylan prod-uct and patients with signs of local inflammation or medium hydrarthrosis. Moreover,patients with preexisting infections or skin diseases at the injection site, known infection ofthe affected joint, patients diagnosed with inflammatory rheumatic diseases or systemicdiseases, or known systemic bleeding disorders, as well as bleeding or a tendency to bleedwere not included in the study. Patients with bilateral KOA who had different stages fromKL 2 and who were symptomatic were excluded. Consumption of NSAID drugs or otherfood supplements was prohibited.
Backup medication for PG and CG, consisting of 1000 mg metamizole sodium with500 mg of acetaminophen taken twice a day for up to 5 consecutive days, was taken intoaccount in case of insufficient improvement. However, it was not necessary to administerthe backup medication for PG and CG throughout the study.
The PT program in KOA was the same for all patients for the 10-day duration. Thegoal of the PT program was to reduce pain without using other medications (NSAIDs,painkillers, or local anesthetics) or other procedures. All procedures were performed in thecold to avoid modification on the previously administered viscous HA-based biopolymer.
2.6. Physiotherapy Treatment
PT1: electrotherapy-conventional TENS electroanalgesia for 30–40 min using two fre-quency channels at 100 Hz and 100 µs.
PT2: LLLT, 3-kHz frequency with a 904-nm GaAlAs probe, 108 mW of power at5 Joules/point, and a maximum of 40 Joules/application.
PT3—US: 8 min of 0.2–0.3 W/cm2 at 1 MHz with a 10% duty cycle.PT4—PTE: over 40 min per session with moderate-intensity exercise that included
the following: warm up for 5 min with a stationary bike, static quads with a hold for7 s, knee extensions over a roll with a hold for 7 s, single-leg raises for 50 reps, step-upsfor 50 reps, calf raises for three sets of 10–15, and wall squats with a hold for 5–10 s.

Appl. Sci. 2022, 12, 3165 7 of 25
Neuro-proprioceptive facilitation (PNF) techniques were used in four movement patterns(MPs) repeated 2–3 times as a set: MP1 (flexion-abduction-internal), MP2 (extension-adduction-external), MP3 (flexion-adduction-external), and MP4 (extension-abduction-internal) rotations. The PNF techniques included PNF1 (contract-relax), PNF2 (hold-relax);PNF3 (reversal of antagonists), and PNF4 (repeated stretch) [37].
PT5: cryotherapy ice packs were applied at the end of the PT to cool down the affectedknee (at least 15 min).
2.7. Assessment Tests and Outcomes
All results were analyzed from the perspective of multiple indicators: the visual analogscale (VAS), the WOMAC scale, muscle strength testing, and knee goniometry, namely therange of motion (ROM).
The VAS is a pain assessment tool used worldwide by clinicians and physiothera-pists [40]. The VAS is scored on a scale from 0 to 10, with 0 representing the absence of painand 10 representing extreme pain [41].
The Western Ontario and McMaster Universities Arthritis Index (WOMAC) is usedfor the evaluation of KOA. The WOMAC self-administered questionnaire consists ofthree subscales: pain, stiffness, and function. The maximum WOMAC score is 96 andrepresents an assessment made by the patient that refers to daily activities, functionalmobility, walking, general health, and quality of life. A high WOMAC score correlates witha decrease in quality of life [42].
Muscle strength testing is a system consisting of manual examination techniques thatassess the strength of each muscle or muscle group. The most commonly accepted methodof evaluating muscle strength is the Oxford Scale (also known as the Medical ResearchCouncil Manual Muscle Testing Scale). This method involves testing key muscles from theupper and lower extremities against the examiner’s resistance and grading the patient’sstrength on a 0–5 scale accordingly [43]. In this study, we chose to evaluate the quadricepsmuscle, since it is the extensor of the knee that helps maintain a bipedal position andperforms gate control. Moreover, it has been previously reported that inhibition of thearthrogenic muscle in KOA causes a decrease in quadriceps muscle strength through a loopphenomenon [44,45].
Knee flexion or knee range of motion (ROM) is the movement of the knee in thesagittal plane. The functional value of the knee is 90 degrees and is calculated from theextension being 0 degrees and then onward through 45, 90, 125, and 135 degrees. The wideangle of the knee represents more bending, so the leg approaches on the posterior side ofthe thigh [46,47].
Statistical Approach
Regarding the statistical methodology approach, the procedure is described in theliterature by several authors [48]. Thus, if in the first phase a preliminary statistical descrip-tion is made presenting the average values, the standard deviations, and the comparisonsbetween the series of values, in the second phase, an evaluation of the correlation coeffi-cients is made. This second step is necessary to identify the grouping of the factors thatinfluences the expected result. Finally, the principal components analysis (PCA) methodwas applied, a procedure based on the use of correlation coefficient values. This last step isenough to highlight the dynamic grouping of the factors that influence the desired result.
3. Results
All patients were assessed by VAS, WOMAC, muscle strength testing, and kneegoniometry at baseline (Table 1) and after 3, 6, 9, and 12 months with the same tests.Additionally, the within-group effect size was evaluated for each test as Ω = initial − final(12 months).

Appl. Sci. 2022, 12, 3165 8 of 25
Table 1. Baseline characteristics of the patients *.
Characteristic Total Cohort(n = 52)
Pilot Group(HA Injection + PT)(n = 37)
Control Group(HA Injection)(n = 15)
Age (years) 55.9 ± 4.1 55.8 ± 4.2 56.1 ± 4.0
Female gender—no. (%) 26 (13.5) 16 (5.9) 10 (1.6)
Body mass index 30.0 ± 7.8 29.0 ± 3.5 32.3 ± 13.3
Symptomatic knee—no. (%)
Right knee 19 (9.9) 17 (6.3) 2 (0.3)
Left knee 24 (12.5) 13 (4.8) 11 (1.8)
Both knees 10 (5.2) 7 (2.6) 3 (0.5)
Baseline measures
WOMAC total score 64.5 ± 3.3 64.5 ± 2.99 64.6 ± 4.1
VAS scale 5.7 ± 0.5 5.7 ± 0.5 5.6 ± 0.5
ROM (degrees) 98.4 ± 11.4 98.1 ± 12.5 99.1 ± 8.6
Muscle strength testing (Oxford scale) 3.8 ± 0.5 3.8 ± 0.5 3.8 ± 0.4
* Plus and minus values are means ± SD. Percentages may not total 100 because of rounding.
3.1. Patient Groups’ Descriptive Statistical Results
For completeness of exposure, a comparison of the distribution by gender, age, symp-tomatic knee, and weight for the PG and CG is presented in Figures 2–5. These representa-tions were made for ease and quality of exposure.
Figure 2 shows the distribution of the CG and PG by gender. It can be easily notedthat the distributions were comparable, with the ratios of the components being approxi-mately equal.
Appl. Sci. 2022, 12, x FOR PEER REVIEW 9 of 26
Figure 2. Histogram representation for the gender distribution of the control group (CG) and the pilot group (PG).
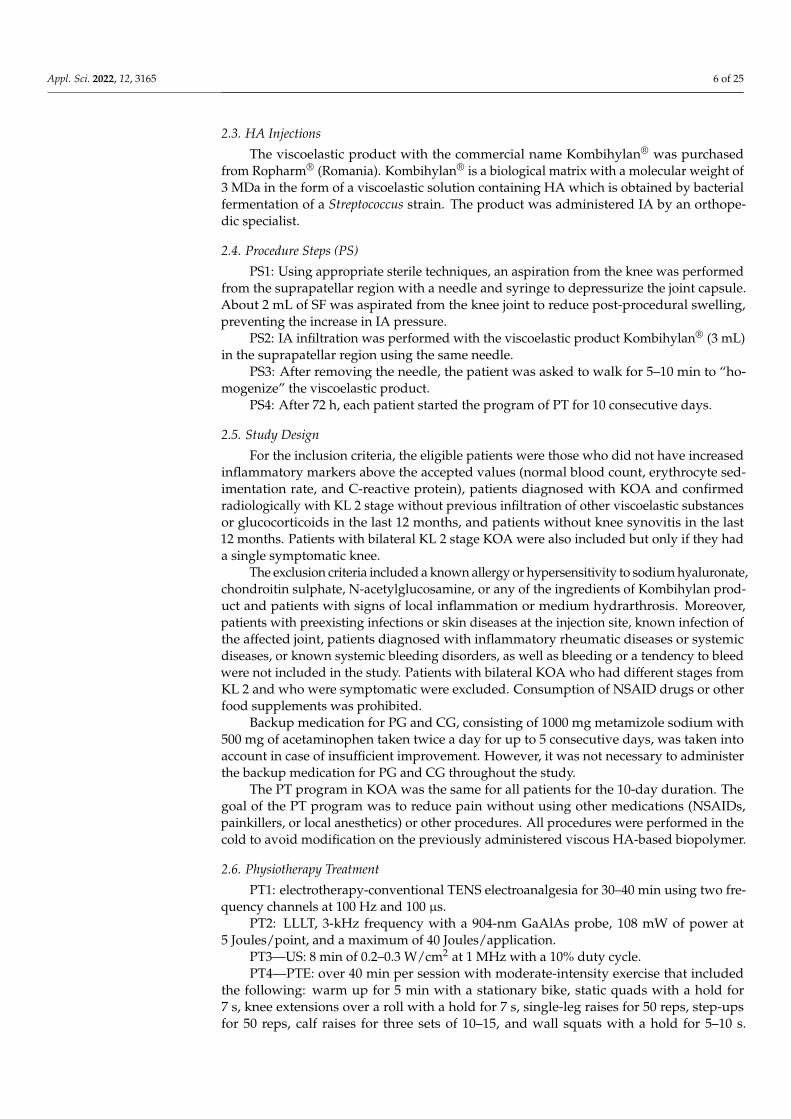
Figure 3. Histogram representation for the age interval distribution of the control group (CG) and the pilot group (PG).
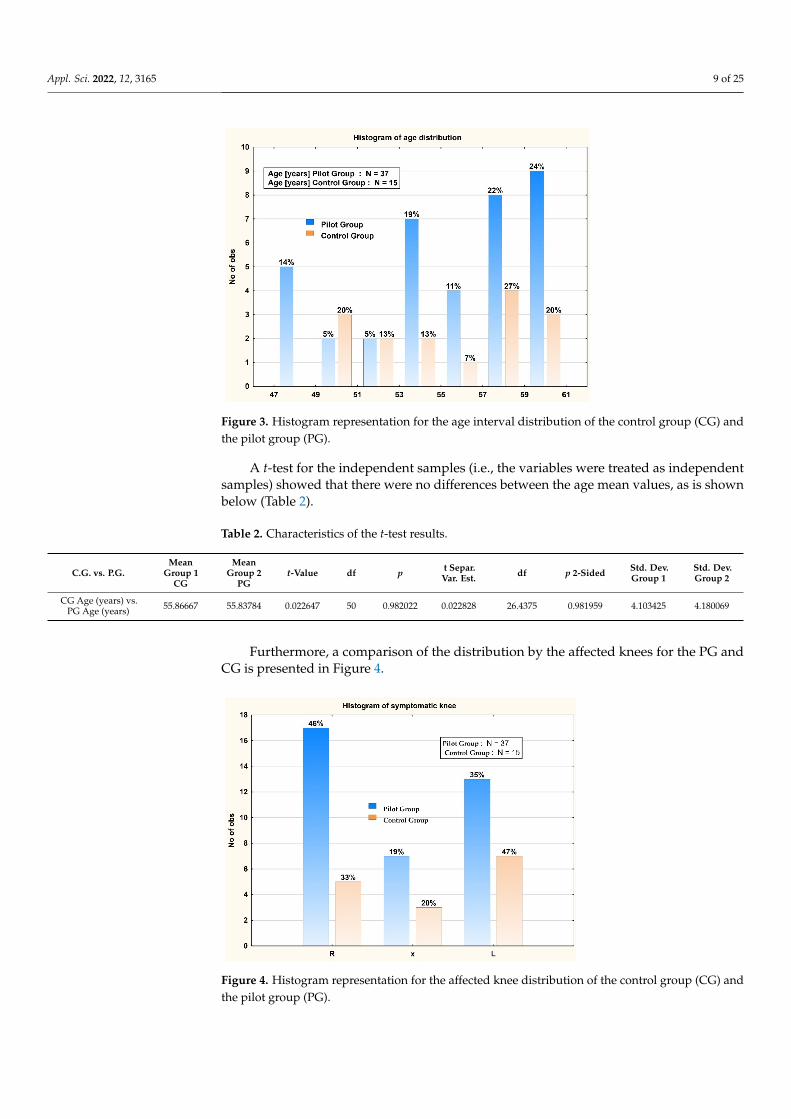
A t-test for the independent samples (i.e., the variables were treated as independent samples) showed that there were no differences between the age mean values, as is shown below (Table 2).
Table 2. Characteristics of the t-test results.
C.G. vs. P.G. Mean Group 1 CG
Mean Group 2 PG
t-Value df p t Separ. Var. Est.
df p 2-Sided Std. Dev. Group 1
Std. Dev. Group 2
CG Age (years) vs. PG Age (years)
55.86667 55.83784 0.022647 50 0.982022 0.022828 26.4375 0.981959 4.103425 4.180069
Furthermore, a comparison of the distribution by the affected knees for the PG and CG is presented in Figure 4.
Figure 2. Histogram representation for the gender distribution of the control group (CG) and thepilot group (PG).
For the aim of easier exposure, a comparison of the distribution by age interval for thePG and CG is presented in Figure 3.
Appl. Sci. 2022, 12, 3165 9 of 25
Appl. Sci. 2022, 12, x FOR PEER REVIEW 9 of 26
Figure 2. Histogram representation for the gender distribution of the control group (CG) and the pilot group (PG).
Figure 3. Histogram representation for the age interval distribution of the control group (CG) and the pilot group (PG).
A t-test for the independent samples (i.e., the variables were treated as independent samples) showed that there were no differences between the age mean values, as is shown below (Table 2).
Table 2. Characteristics of the t-test results.
C.G. vs. P.G. Mean Group 1 CG
Mean Group 2 PG
t-Value df p t Separ. Var. Est.
df p 2-Sided Std. Dev. Group 1
Std. Dev. Group 2
CG Age (years) vs. PG Age (years)
55.86667 55.83784 0.022647 50 0.982022 0.022828 26.4375 0.981959 4.103425 4.180069
Furthermore, a comparison of the distribution by the affected knees for the PG and CG is presented in Figure 4.
Figure 3. Histogram representation for the age interval distribution of the control group (CG) andthe pilot group (PG).
A t-test for the independent samples (i.e., the variables were treated as independentsamples) showed that there were no differences between the age mean values, as is shownbelow (Table 2).
Table 2. Characteristics of the t-test results.
C.G. vs. P.G.Mean
Group 1CG
MeanGroup 2
PGt-Value df p t Separ.
Var. Est. df p 2-Sided Std. Dev.Group 1
Std. Dev.Group 2
CG Age (years) vs.PG Age (years) 55.86667 55.83784 0.022647 50 0.982022 0.022828 26.4375 0.981959 4.103425 4.180069
Furthermore, a comparison of the distribution by the affected knees for the PG andCG is presented in Figure 4.
Appl. Sci. 2022, 12, x FOR PEER REVIEW 10 of 26
Figure 4. Histogram representation for the affected knee distribution of the control group (CG) and the pilot group (PG).
For completeness of the presentation, a Mann–Whitney U test (also called the Mann–Whitney–Wilcoxon test) is a nonparametric test of the null hypothesis. Using this proce-dure, we could show that there were no significant differences. As is known from the literature [48], the Mann–Whitney U test is significant at p < 0.05000, and the p value for our case was p = 1.000.
Figure 5. Histogram representation for the weight distribution of the control group (CG) and the pilot group (PG).
A t-test for the independent samples (i.e., the variables treated as independent sam-ples) showed that there were no differences between the weight mean values, as is shown below (Table 3).
Figure 4. Histogram representation for the affected knee distribution of the control group (CG) andthe pilot group (PG).

Appl. Sci. 2022, 12, 3165 10 of 25
Appl. Sci. 2022, 12, x FOR PEER REVIEW 10 of 26
Figure 4. Histogram representation for the affected knee distribution of the control group (CG) and the pilot group (PG).
For completeness of the presentation, a Mann–Whitney U test (also called the Mann–Whitney–Wilcoxon test) is a nonparametric test of the null hypothesis. Using this proce-dure, we could show that there were no significant differences. As is known from the literature [48], the Mann–Whitney U test is significant at p < 0.05000, and the p value for our case was p = 1.000.
Figure 5. Histogram representation for the weight distribution of the control group (CG) and the pilot group (PG).
A t-test for the independent samples (i.e., the variables treated as independent sam-ples) showed that there were no differences between the weight mean values, as is shown below (Table 3).
Figure 5. Histogram representation for the weight distribution of the control group (CG) and thepilot group (PG).
For completeness of the presentation, a Mann–Whitney U test (also called the Mann–Whitney–Wilcoxon test) is a nonparametric test of the null hypothesis. Using this procedure,we could show that there were no significant differences. As is known from the litera-ture [48], the Mann–Whitney U test is significant at p < 0.05000, and the p value for our casewas p = 1.000.
A t-test for the independent samples (i.e., the variables treated as independent samples)showed that there were no differences between the weight mean values, as is shown below(Table 3).
Table 3. Characteristics of the t-test results.
CG vs. PG MeanGroup 1
MeanGroup 2 t-Value df p t Separ.
Var. Est. df p 2-Sided Std. Dev.Group 1
Std. Dev.Group 2
CG Weight (kg) vs.PG Weight (kg) 83.4 83.89189 −0.13462 50 0.893455 −0.11851 20.50209 0.906819 14.54451 10.75429
3.2. Patient Results Description
As seen in Figure 6, at month 3 in the treatment program, the pain as assessed by theVAS scores decreased considerably from the baseline in both groups, with a larger andsharper effect observed in the PG from 5.730 ± 0.450 to 2.108 ± 0.614 (p = 0.5). A moremoderate improvement was observed from months 3 to 6. Beyond 6 months, the VASscores started to plateau in both groups but remained better in the PG patients receivingthe combination treatment.
From a clinical perspective, the patients in the PG that underwent the combinedapproach (HA+ PT) no longer experienced noticeable pain or morning stiffness as early as3 months into the treatment period. In contrast, while a pain decrease was evident in theCG patients, as observed by the improved VAS scores, intermittent morning stiffness wasstill experienced throughout the study period. The within-group effect size for the VASscore ΩVAS between the two groups was statistically significant (p < 0.0001), with a ΩVA of3.757 ± 0.683 in the PG compared with the ΩVAS of 2.750 ± 0.683 in the CG group.

Appl. Sci. 2022, 12, 3165 11 of 25
Appl. Sci. 2022, 12, x FOR PEER REVIEW 11 of 26
Table 3. Characteristics of the t-test results.
CG vs. PG Mean Group 1
Mean Group 2
t-Value df p t Separ. Var. Est.
df p 2-Sided Std. Dev. Group 1
Std. Dev. Group 2
CG Weight (kg) vs. PG Weight (kg)
83.4 83.89189 −0.13462 50 0.893455 −0.11851 20.50209 0.906819 14.54451 10.75429
3.2. Patient Results Description As seen in Figure 6, at month 3 in the treatment program, the pain as assessed by the
VAS scores decreased considerably from the baseline in both groups, with a larger and sharper effect observed in the PG from 5.730 ± 0.450 to 2.108 ± 0.614 (p = 0.5). A more moderate improvement was observed from months 3 to 6. Beyond 6 months, the VAS scores started to plateau in both groups but remained better in the PG patients receiving the combination treatment.
Figure 6. Evolution of pain over time in the control group (n = 15) and pilot group (n = 37), measured on a visual analog scale (VAS) at inclusion (initial point) and every 3 months up to 12 months.
From a clinical perspective, the patients in the PG that underwent the combined ap-proach (HA+ PT) no longer experienced noticeable pain or morning stiffness as early as 3 months into the treatment period. In contrast, while a pain decrease was evident in the CG patients, as observed by the improved VAS scores, intermittent morning stiffness was still experienced throughout the study period. The within-group effect size for the VAS score ΩVAS between the two groups was statistically significant (p < 0.0001), with a ΩVA of 3.757 ± 0.683 in the PG compared with the ΩVAS of 2.750 ± 0.683 in the CG group.
At the baseline, the mean (± SD) WOMAC scores reported were 64.6 ± 4.08 in the CG and 64.5 ± 2.99 in the PG. Notably, at only 3 months into the study, the mean scores were significantly improved to 56.7 ± 5 in the CG and 48.27 ± 2.13 in the PG (mean between-group difference: 16.19 points; 95% confidence interval), finding favoring of the combina-tion of VS with HA and PT. At the study’s endpoint in 12 months, the scores were im-proved in both groups, with the mean between-group difference remaining significant (7.08 points; 95% confidence interval) (Figure 7). This translated into a significant im-provement in pain and discomfort when the PT regimes were added to the pharmacolog-ical treatment, highlighting the importance of a combined, multimodal approach for the management of pain in KOA patients.
Figure 6. Evolution of pain over time in the control group (n = 15) and pilot group (n = 37), measuredon a visual analog scale (VAS) at inclusion (initial point) and every 3 months up to 12 months.
At the baseline, the mean (± SD) WOMAC scores reported were 64.6 ± 4.08 in the CGand 64.5 ± 2.99 in the PG. Notably, at only 3 months into the study, the mean scores were sig-nificantly improved to 56.7 ± 5 in the CG and 48.27 ± 2.13 in the PG (mean between-groupdifference: 16.19 points; 95% confidence interval), finding favoring of the combination ofVS with HA and PT. At the study’s endpoint in 12 months, the scores were improved inboth groups, with the mean between-group difference remaining significant (7.08 points;95% confidence interval) (Figure 7). This translated into a significant improvement inpain and discomfort when the PT regimes were added to the pharmacological treatment,highlighting the importance of a combined, multimodal approach for the management ofpain in KOA patients.
Appl. Sci. 2022, 12, x FOR PEER REVIEW 12 of 26
Figure 7. Western Ontario and McMaster Universities Osteoarthritis Index (WOMAC) total scores over the 12-month follow-up period. WOMAC total scores range from 0 to 96, with higher scores indicating worse pain, function, and stiffness. The values in parentheses are 95% confidence inter-vals (also indicated by the I bars). All 52 participants were included in the analysis in the CG (n = 15) and PG (n = 37).
From a clinical perspective, both groups of patients obtained considerably good re-sults from the perspective of WOMAC classification. Both groups registered in the first stage (first 3 months) an improvement in functional mobility and walking, followed by significant improvement in the quality of life at the 12-month endpoint. These results val-idate the efficiency of the IA infiltration with Kombihylan® in patients with KOA, yet the PG recorded superior results from the first 3 months, thus separating the two groups of patients until the end of the study.
When calculating the within-group effect size, ΩWOMAC in the PG was 41.22 ± 3.65, and in the CG, it was 34.75 ± 3.36, with a significant statistical difference between groups as p < 0.0001.
Figure 8 depicts the muscle strength testing scale where, notably, the PG reported a fast and sharp increase from a value of 3.81 ± 0.52 at the baseline to 4.76 ± 0.44 at 3 months, which remained stable up to 1 year. A smaller size effect was registered in the CG, which did not receive the PT program. Thus, the CG remained around a value of 4, during the 12 months of screening (Figure 8). Muscle strengths values of four and five are clinically acceptable. From the patients’ perspective, based on the feedback interviews, there were no noticeable differences between groups, since a value of four is considered good and five is normal. However, from the perspective of arthrogenic inhibition, for long-term maintenance, a value as close to 5 as possible means limiting this negative loop phenom-enon that contributes to the acceleration of KOA.
Figure 8. Evaluation of the strength of the quadriceps muscle over time in the control group (n = 15) and pilot group (n = 37), measured on a scale from 0 to 5 at inclusion (initial point) and every 3
Figure 7. Western Ontario and McMaster Universities Osteoarthritis Index (WOMAC) total scoresover the 12-month follow-up period. WOMAC total scores range from 0 to 96, with higher scoresindicating worse pain, function, and stiffness. The values in parentheses are 95% confidence intervals(also indicated by the I bars). All 52 participants were included in the analysis in the CG (n = 15) andPG (n = 37).
From a clinical perspective, both groups of patients obtained considerably goodresults from the perspective of WOMAC classification. Both groups registered in the firststage (first 3 months) an improvement in functional mobility and walking, followed bysignificant improvement in the quality of life at the 12-month endpoint. These resultsvalidate the efficiency of the IA infiltration with Kombihylan® in patients with KOA, yetthe PG recorded superior results from the first 3 months, thus separating the two groups ofpatients until the end of the study.
When calculating the within-group effect size, ΩWOMAC in the PG was 41.22 ± 3.65,and in the CG, it was 34.75 ± 3.36, with a significant statistical difference between groupsas p < 0.0001.

Appl. Sci. 2022, 12, 3165 12 of 25
Figure 8 depicts the muscle strength testing scale where, notably, the PG reporteda fast and sharp increase from a value of 3.81 ± 0.52 at the baseline to 4.76 ± 0.44 at3 months, which remained stable up to 1 year. A smaller size effect was registered in theCG, which did not receive the PT program. Thus, the CG remained around a value of 4,during the 12 months of screening (Figure 8). Muscle strengths values of four and five areclinically acceptable. From the patients’ perspective, based on the feedback interviews,there were no noticeable differences between groups, since a value of four is consideredgood and five is normal. However, from the perspective of arthrogenic inhibition, forlong-term maintenance, a value as close to 5 as possible means limiting this negative loopphenomenon that contributes to the acceleration of KOA.
Appl. Sci. 2022, 12, x FOR PEER REVIEW 12 of 26
Figure 7. Western Ontario and McMaster Universities Osteoarthritis Index (WOMAC) total scores over the 12-month follow-up period. WOMAC total scores range from 0 to 96, with higher scores indicating worse pain, function, and stiffness. The values in parentheses are 95% confidence inter-vals (also indicated by the I bars). All 52 participants were included in the analysis in the CG (n = 15) and PG (n = 37).
From a clinical perspective, both groups of patients obtained considerably good re-sults from the perspective of WOMAC classification. Both groups registered in the first stage (first 3 months) an improvement in functional mobility and walking, followed by significant improvement in the quality of life at the 12-month endpoint. These results val-idate the efficiency of the IA infiltration with Kombihylan® in patients with KOA, yet the PG recorded superior results from the first 3 months, thus separating the two groups of patients until the end of the study.
When calculating the within-group effect size, ΩWOMAC in the PG was 41.22 ± 3.65, and in the CG, it was 34.75 ± 3.36, with a significant statistical difference between groups as p < 0.0001.
Figure 8 depicts the muscle strength testing scale where, notably, the PG reported a fast and sharp increase from a value of 3.81 ± 0.52 at the baseline to 4.76 ± 0.44 at 3 months, which remained stable up to 1 year. A smaller size effect was registered in the CG, which did not receive the PT program. Thus, the CG remained around a value of 4, during the 12 months of screening (Figure 8). Muscle strengths values of four and five are clinically acceptable. From the patients’ perspective, based on the feedback interviews, there were no noticeable differences between groups, since a value of four is considered good and five is normal. However, from the perspective of arthrogenic inhibition, for long-term maintenance, a value as close to 5 as possible means limiting this negative loop phenom-enon that contributes to the acceleration of KOA.
Figure 8. Evaluation of the strength of the quadriceps muscle over time in the control group (n = 15) and pilot group (n = 37), measured on a scale from 0 to 5 at inclusion (initial point) and every 3 Figure 8. Evaluation of the strength of the quadriceps muscle over time in the control group (n = 15)and pilot group (n = 37), measured on a scale from 0 to 5 at inclusion (initial point) and every 3 monthsup to 12 months. ΩForce of 0.78 ± 0.58 for the PG was in contrast with the ΩForce of 0.19 ± 0.40obtained for the CG with statistical significance at p < 0.0001.
While IA infiltration with Kombihylan® for KOA did not change the quadricepsmuscle strength parameters for the 12-month study interval, the training through PTEtoned the quadriceps and achieved a great overall within-group effect, with a value formuscle strength testing ΩForce of 0.78 ± 0.58 for the PG in contrast with the ΩForce of0.19 ± 0.40 obtained for CG (statistical significance: p < 0.0001).
Similar results were obtained for the knee flexion evaluation test (ROM) as shownin Figure 9, where it is observed that the PG started from the average value of 98 degreesat the baseline, followed by a sudden increase to 115 degrees in the first 3 months andreaching a plateau between 6 and 12 months, as previously observed for all the other testsperformed. In the case of the CG, the value at the baseline was 100 degrees of flexion,with a slow increase up to 112 degrees at month 9 followed by a significant decrease to105 degrees at the endpoint (12 months).
Appl. Sci. 2022, 12, x FOR PEER REVIEW 13 of 26
months up to 12 months. ΩForce of 0.78 ± 0.58 for the PG was in contrast with the ΩForce of 0.19 ± 0.40 obtained for the CG with statistical significance at p < 0.0001.
While IA infiltration with Kombihylan® for KOA did not change the quadriceps mus-cle strength parameters for the 12-month study interval, the training through PTE toned the quadriceps and achieved a great overall within-group effect, with a value for muscle strength testing ΩForce of 0.78 ± 0.58 for the PG in contrast with the ΩForce of 0.19 ± 0.40 obtained for CG (statistical significance: p < 0.0001).
Similar results were obtained for the knee flexion evaluation test (ROM) as shown in Figure 9, where it is observed that the PG started from the average value of 98 degrees at the baseline, followed by a sudden increase to 115 degrees in the first 3 months and reach-ing a plateau between 6 and 12 months, as previously observed for all the other tests per-formed. In the case of the CG, the value at the baseline was 100 degrees of flexion, with a slow increase up to 112 degrees at month 9 followed by a significant decrease to 105 de-grees at the endpoint (12 months).
Figure 9. ROM evaluation of knee flexion in the PG (n = 37) and the CG (n = 15). Statistically, the within-group ROM effect size ΩROM was 16.62 ± 6.24 in the PG versus 8.75 ± 8.27 in CG, with p < 0.0004.
3.3. Descriptive Statistics In this paragraph, we present the preliminary statistical analysis of the results ob-
tained. For the PG, the descriptive statistics of the results obtained after the successive tests
are presented in Table 4. Herein, the correlation values for the PG’s measured parameters are presented. A p value of 0.05 was considered significant. The significant correlations are marked in bold.
In all cases, there were strong correlations between the measured values of muscle strength and the values of the ROM test. Due to this, it turned out that the ROM flexion test was a fairly accurate tool for evaluating the evolution in the case of the parameters for measuring muscle strength. Notably, the correlation observed in the PG between the WOMAC test after 3 months and the initial WOMAC test (corr = 0.6155, p = 0.000) can also be highlighted.
For the CG, the correlation matrix showed a different representation (Table 5). The critical value for the p parameter was also considered to be p = 0.05. The significant corre-lations are marked in bold.
Figure 9. ROM evaluation of knee flexion in the PG (n = 37) and the CG (n = 15). Statistically, thewithin-group ROM effect size ΩROM was 16.62 ± 6.24 in the PG versus 8.75 ± 8.27 in CG, withp < 0.0004.

Appl. Sci. 2022, 12, 3165 13 of 25
3.3. Descriptive Statistics
In this paragraph, we present the preliminary statistical analysis of the results obtained.For the PG, the descriptive statistics of the results obtained after the successive tests
are presented in Table 4. Herein, the correlation values for the PG’s measured parametersare presented. A p value of 0.05 was considered significant. The significant correlations aremarked in bold.
Table 4. Correlations between PG parameters of the patients.
Variable for PGInitial
MuscleStrength
MuscleStrength
after3 Months
MuscleStrength
after6 Months
MuscleStrength
after12 Months
MuscleStrength
after9 Months
InitialROM
FlexionTest
ROMFlexion
Testafter
3 Months
ROMFlexion
Testafter
6 Months
ROMFlexion
Testafter
9 Months
ROMFlexion
Testafter
12 Months
Initial musclestrength
1.0000 0.7757 0.4211 0.3404 0.4211 0.6834 0.6749 0.6431 0.6210 0.6497
p = --- p = 0.000 p = 0.009 p = 0.039 p = 0.009 p = 0.000 p = 0.000 p = 0.000 p = 0.000 p = 0.000
Muscle strengthafter 3 months
0.7757 1.0000 0.5492 0.4300 0.5492 0.7180 0.8032 0.7804 0.7269 0.7703
p = 0.000 p = --- p = 0.000 p = 0.008 p = 0.000 p = 0.000 p = 0.000 p = 0.000 p = 0.000 p = 0.000
Muscle strengthafter 6 months
0.4211 0.5492 1.0000 0.8390 1.0000 0.7923 0.8168 0.8283 0.8253 0.8169
p = 0.009 p = 0.000 p = --- p = 0.000 p = --- p = 0.000 p = 0.000 p = 0.000 p = 0.000 p = 0.000
Muscle strengthafter 12 months
0.3404 0.4300 0.8390 1.0000 0.8390 0.7507 0.6987 0.6959 0.7132 0.6845
p = 0.039 p = 0.008 p = 0.000 p = --- p = 0.000 p = 0.000 p = 0.000 p = 0.000 p = 0.000 p = 0.000
Muscle strengthafter 9 months
0.4211 0.5492 1.0000 0.8390 1.0000 0.7923 0.8168 0.8283 0.8253 0.8169
p = 0.009 p = 0.000 p = --- p = 0.000 p = --- p = 0.000 p = 0.000 p = 0.000 p = 0.000 p = 0.000
Initial ROMflexion test
0.6834 0.7180 0.7923 0.7507 0.7923 1.0000 0.9128 0.8981 0.8969 0.8769
p = 0.000 p = 0.000 p = 0.000 p = 0.000 p = 0.000 p = --- p = 0.000 p = 0.000 p = 0.000 p = 0.000
ROM flexiontest after3 months
0.6749 0.8032 0.8168 0.6987 0.8168 0.9128 1.0000 0.9858 0.9675 0.9730
p = 0.000 p = 0.000 p = 0.000 p = 0.000 p = 0.000 p = 0.000 p = --- p = 0.00 p = 0.00 p = 0.00
ROM flexiontest after6 months
0.6431 0.7804 0.8283 0.6959 0.8283 0.8981 0.9858 1.0000 0.9888 0.9813
p = 0.000 p = 0.000 p = 0.000 p = 0.000 p = 0.000 p = 0.000 p = 0.00 p = --- p = 0.00 p = 0.00
ROM flexiontest after9 months
0.6210 0.7269 0.8253 0.7132 0.8253 0.8969 0.9675 0.9888 1.0000 0.9775
p = 0.000 p = 0.000 p = 0.000 p = 0.000 p = 0.000 p = 0.000 p = 0.00 p = 0.00 p = --- p = 0.00
ROM flexiontest after
12 months
0.6497 0.7703 0.8169 0.6845 0.8169 0.8769 0.9730 0.9813 0.9775 1.0000
p = 0.000 p = 0.000 p = 0.000 p = 0.000 p = 0.000 p = 0.000 p = 0.00 p = 0.00 p = 0.00 p = ---
In all cases, there were strong correlations between the measured values of musclestrength and the values of the ROM test. Due to this, it turned out that the ROM flexiontest was a fairly accurate tool for evaluating the evolution in the case of the parametersfor measuring muscle strength. Notably, the correlation observed in the PG between theWOMAC test after 3 months and the initial WOMAC test (corr = 0.6155, p = 0.000) can alsobe highlighted.
For the CG, the correlation matrix showed a different representation (Table 5). Thecritical value for the p parameter was also considered to be p = 0.05. The significantcorrelations are marked in bold.

Appl. Sci. 2022, 12, 3165 14 of 25
Table 5. Correlations between CG parameters of the patients.
Variable for CGInitial
WOMACTest
WOMACTestafter
3 Months
WOMACTestafter
6 Months
WOMACTestafter
9 Months
WOMACTestafter
12 Months
InitialVASTest
VASTestafter
3 Months
VAS Testafter
6 Months
VAS Testafter
9 Months
VAS Testafter
12 Months
InitialMuscle
Strength
CG initialWOMAC test
1 0.9405 0.8527 0.8501 0.8456 −0.0934 −0.2515 0.5589 0.3104 0.0032 −0.4657
p = --- p = 0.000 p = 0.000 p = 0.000 p = 0.000 p = 0.741 p = 0.366 p = 0.030 p = 0.260 p = 0.991 p = 0.080
CG WOMACtest after3 months
0.9405 1 0.8475 0.796 0.7774 −0.0867 −0.2788 0.6159 0.2942 −0.1538 −0.4413
p = 0.000 p = --- p = 0.000 p = 0.000 p = 0.001 p = 0.759 p = 0.314 p = 0.015 p = 0.287 p = 0.584 p = 0.100
CG WOMACtest after6 months
0.8527 0.8475 1 0.9181 0.9044 −0.0772 −0.1555 0.5677 0.3346 −0.1084 −0.4292
p = 0.000 p = 0.000 p = --- p = 0.000 p = 0.000 p = 0.784 p = 0.580 p = 0.027 p = 0.223 p = 0.700 p = 0.110
CG WOMACtest after9 months
0.8501 0.796 0.9181 1 0.9405 −0.2109 −0.2605 0.4734 0.1476 0.0868 −0.4428
p = 0.000 p = 0.000 p = 0.000 p = --- p = 0.000 p = 0.451 p = 0.348 p = 0.075 p = 0.600 p = 0.758 p = 0.098
CG WOMACtest after
12 months
0.8456 0.7774 0.9044 0.9405 1 −0.1191 −0.2289 0.611 0.2513 0.2289 −0.4783
p = 0.000 p = 0.001 p = 0.000 p = 0.000 p = --- p = 0.672 p = 0.412 p = 0.016 p = 0.366 p = 0.412 p = 0.071
CG initial VAStest
−0.0934 −0.0867 −0.0772 −0.2109 −0.1191 1 0.7206 0.3273 0.6124 −0.3203 0.6124
p = 0.741 p = 0.759 p = 0.784 p = 0.451 p = 0.672 p = --- p = 0.002 p = 0.234 p = 0.015 p = 0.245 p = 0.015
CG VAS testafter 3 months
−0.2515 −0.2788 −0.1555 −0.2605 −0.2289 0.7206 1 −0.0262 0.1961 −0.3269 0.6864
p = 0.366 p = 0.314 p = 0.580 p = 0.348 p = 0.412 p = 0.002 p = --- p = 0.926 p = 0.484 p = 0.234 p = 0.005
CG VAS testafter 6 months
0.5589 0.6159 0.5677 0.4734 0.611 0.3273 −0.0262 1 0.5345 −0.1048 −0.1336
p = 0.030 p = 0.015 p = 0.027 p = 0.075 p = 0.016 p = 0.234 p = 0.926 p = --- p = 0.040 p = 0.710 p = 0.635
CG VAS testafter 9 months
0.3104 0.2942 0.3346 0.1476 0.2513 0.6124 0.1961 0.5345 1 −0.1961 0.1667
p = 0.260 p = 0.287 p = 0.223 p = 0.600 p = 0.366 p = 0.015 p = 0.484 p = 0.040 p = --- p = 0.484 p = 0.553
CG VAS testafter 12 months
0.0032 −0.1538 −0.1084 0.0868 0.2289 −0.3203 −0.3269 −0.1048 −0.1961 1 −0.1961
p = 0.991 p = 0.584 p = 0.700 p = 0.758 p = 0.412 p = 0.245 p = 0.234 p = 0.710 p = 0.484 p = --- p = 0.484
CG initialmuscle strength
−0.4657 −0.4413 −0.4292 −0.4428 −0.4783 0.6124 0.6864 −0.1336 0.1667 −0.1961 1
p = 0.080 p = 0.100 p = 0.110 p = 0.098 p = 0.071 p = 0.015 p = 0.005 p = 0.635 p = 0.553 p = 0.484 p = ---
CG musclestrength after
3 months
– – – – – – – – – – –
p = --- p = --- p = --- p = --- p = --- p = --- p = --- p = --- p = --- p = --- p = —
CG musclestrength after
6 months
– – – – – – – – – – –
p = --- p = --- p = --- p = --- p = --- p = --- p = --- p = --- p = --- p = --- p = —
CG muscleStrength after
9 months
– – – – – – – – – – –
p = --- p = --- p = --- p = --- p = --- p = --- p = --- p = --- p = --- p = --- p = —
CG musclestrength after
12 months
−0.2271 −0.1703 −0.1322 −0.1775 −0.169 0.3273 0.3669 −0.0714 −0.1336 −0.1048 0.5345
p = 0.416 p = 0.544 p = 0.639 p = 0.527 p = 0.547 p = 0.234 p = 0.179 p = 0.800 p = 0.635 p = 0.710 p = 0.040
3.4. Statistical Difference Analysis
Difference analysis for each group was performed by applying the t-test analysis. Forthe control group (CG), the t-test values for the measured muscle strength magnitudes arepresented in the Table 6 below. It is easily observed that the t-tests gave insignificant valuesbetween successive measurement sets. This observation is in agreement with the graphicalrepresentation in Figure 9.

Appl. Sci. 2022, 12, 3165 15 of 25
Table 6. T-test between CG muscle strength measurement sets of the patients.
CG Grouped by Measurement Set vs.CG Grouped by Measurement Set t-Value df p t Separ.
Var. Est. df p 2-Sided Std. Dev.Group 1
Std. Dev.Group 2
CG initial muscle strength vs.CG muscle strength after 3 months −1.87083 28 0.071854 −1.87083 14 0.082418 0.414039 0
CG muscle strength after 3 months vs.CG muscle strength after 6 months 28 - 0 0
CG muscle strength after 6 months vs.CG muscle strength after 9 months 28 - 0 0
CG muscle strength after 9 months vs.CG muscle strength after 12 months 1 28 0.325875 1 14 0.334282 0 0.258199
CG initial muscle strength vs.CG muscle strength after 6 months −1.87083 28 0.071854 −1.87083 14 0.082418 0.414039 0
CG initial muscle strength vs.CG muscle strength after 9 months −1.87083 28 0.071854 −1.87083 14 0.082418 0.414039 0
CG muscle strength after 12 months vs.CG initial muscle strength 1.0583 28 0.298964 1.0583 23.45845 0.300695 0.258199 0.414039
For the PG, the t-test measured values for the muscle strength magnitudes are pre-sented in Table 7. The t-tests gave significant values (marked in bold), and there weresubstantial differences between successive measurement sets. This observation is coherentwith the graphical representation from Figure 10.
Table 7. t-test between CG muscle strength measurement sets of the patients.
PG Grouped by Measurement Set vs.PG Grouped by Measurement Set t-Value df p t Separ.
Var. Est. df p 2-Sided Std. Dev.Group 1
Std. Dev.Group 2
PG initial muscle strength vs.PG muscle strength after 3 months −8.5027 72 0 −8.5027 69.8896 0 0.518429 0.43496
PG initial muscle strength vs.PG muscle strength after 6 months −7.4849 72 0 −7.4849 71.44489 0 0.518429 0.47458
PG initial muscle strength vs.PG muscle strength after 9 months −7.4849 72 0 −7.4849 71.44489 0 0.518429 0.47458
PG initial muscle strength vs.PG muscle strength after 12 months −6.6337 72 0 −6.6337 71.88094 0 0.518429 0.49774
PG muscle strength after 3 months vs.PG muscle strength after 6 months 0.7661 72 0.446103 0.7661 71.45966 0.446122 0.434959 0.47458
PG muscle strength after 3 months vs.PG muscle strength after 9 months 0.7661 72 0.446103 0.7661 71.45966 0.446122 0.434959 0.47458
PG muscle strength after 3 months vs.PG muscle strength after 12 months 1.4922 72 0.140003 1.4922 70.72959 0.140081 0.434959 0.49774
PG muscle strength after 6 months vs.PG muscle strength after 9 months 0 72 1 0 72 1 0.474579 0.47458
PG muscle strength after 6 months vs.PG muscle strength after 12 months 0.7171 72 0.47561 0.7171 71.8371 0.475615 0.474579 0.49774
PG muscle strength after 9 months vs.PG initial muscle strength 7.4849 72 0 7.4849 71.44489 0 0.474579 0.51843
PG muscle strength after 9 months vs.PG muscle strength after 12 months 0.7171 72 0.47561 0.7171 71.8371 0.475615 0.474579 0.49774
PG muscle strength after 12 months vs.PG initial muscle strength 6.6337 72 0 6.6337 71.88094 0 0.497743 0.51843
PG muscle strength after 12 months vs.PG muscle strength after 9 months −0.7171 72 0.47561 −0.7171 71.8371 0.475615 0.497743 0.47458

Appl. Sci. 2022, 12, 3165 16 of 25
Appl. Sci. 2022, 12, x FOR PEER REVIEW 17 of 26
PG muscle strength after 6 months vs. PG muscle strength after 12 months
0.7171 72 0.47561 0.7171 71.8371 0.475615 0.474579 0.49774
PG muscle strength after 9 months vs. PG initial muscle strength
7.4849 72 0 7.4849 71.44489 0 0.474579 0.51843
PG muscle strength after 9 months vs. PG muscle strength after 12 months 0.7171 72 0.47561 0.7171 71.8371 0.475615 0.474579 0.49774
PG muscle strength after 12 months vs. PG initial muscle strength 6.6337 72 0 6.6337 71.88094 0 0.497743 0.51843
PG muscle strength after 12 months vs. PG muscle strength after 9 months
−0.7171 72 0.47561 −0.7171 71.8371 0.475615 0.497743 0.47458
(a) (b)
Figure 10. PCA analysis results for the (a) pilot group and (b) control group at baseline (initial).
3.5. PCA Analysis We sought to perform a thorough data analysis that included all the elements in the
database of the study. Of all the methods of statistical analysis, the method adopted by us was the principal component analysis (PCA) method. Figure 10 shows the results of the PCA method obtained at the initial time (Figure 10a) comparing the two groups of pa-tients.
It was observed that at the initial moment, the configuration of the factors was some-what similar (Figure 10a,b). Thus, at the baseline, factor 1 had important contributions from the VAS test, muscle strength, and ROM flexion for the PG (Table 8), and for the CG, factor 1 had important contributions from the same factors (Table 3b). Notable differences were observed in the level of contributions of factor 2. While for the PG the age had an important contribution (Table 8), for the CG, age was already included predominantly in factor 3 (Table 9).
While for the CG the PCA diagram for the first two factors practically remained un-changed (Figure 11b), being only an inversion of axes in relation to Figure 10b, for the PG, there were obvious changes (Figure 11a) in relation to the previous situation. These changes were best seen by analyzing the contribution of factors for each group. Thus, if for both the PG and the CG age was a parameter that was included in the second-order factor, for the PG, the weight and height remained coupled and gave contributions to fac-tor 3 (Table 10). In contrast, for the CG, weight was a factor of prime importance (Table 11), while height was a less important factor. These observed aspects are natural for pa-tients who do not receive effective treatment.
Figure 10. PCA analysis results for the (a) pilot group and (b) control group at baseline (initial).
3.5. PCA Analysis
We sought to perform a thorough data analysis that included all the elements in thedatabase of the study. Of all the methods of statistical analysis, the method adopted by uswas the principal component analysis (PCA) method. Figure 10 shows the results of thePCA method obtained at the initial time (Figure 10a) comparing the two groups of patients.
It was observed that at the initial moment, the configuration of the factors was some-what similar (Figure 10a,b). Thus, at the baseline, factor 1 had important contributionsfrom the VAS test, muscle strength, and ROM flexion for the PG (Table 8), and for the CG,factor 1 had important contributions from the same factors (Table 3b). Notable differenceswere observed in the level of contributions of factor 2. While for the PG the age had animportant contribution (Table 8), for the CG, age was already included predominantly infactor 3 (Table 9).
Table 8. Factor coordinates of the variables based on correlations for the pilot group (PG) at theinitial stage.
Variable Factor 1 Factor 2 Factor 3 Factor 4 Factor 5 Factor 6
Age (years) −0.17544 −0.12843 0.800838 −0.40152 0.372737 −0.10588
Weight (kg) −0.38716 0.763855 0.261097 −0.09065 −0.16274 0.38502
Height (cm) −0.47821 0.638149 −0.0947 0.355641 0.32781 −0.34755
Initial WOMAC test −0.42858 −0.06762 −0.64829 −0.42846 0.422578 0.161166
Initial VAS test 0.512754 0.487966 −0.17507 −0.56843 −0.24671 −0.2804
Initial muscle strength 0.876851 0.101257 −0.01479 0.093 0.219449 −0.0209
Initial ROM flexion test 0.802037 0.262331 0.026423 0.113245 0.342044 0.243706

Appl. Sci. 2022, 12, 3165 17 of 25
Table 9. Factor coordinates of the variables based on correlations for the control group (CG) at theinitial stage.
Variable Factor 1 Factor 2 Factor 3 Factor 4 Factor 5 Factor 6
Age (years) −0.40854 −0.77165 0.248408 −0.09066 −0.40941 −0.01051
Weight (kg) 0.64822 0.150963 0.508954 −0.54186 0.048725 −0.04472
Height (cm) 0.583746 0.23023 0.660958 0.366693 −0.06892 0.173656
Initial WOMAC test 0.639288 −0.74257 −0.15343 0.015238 0.10918 0.064899
Initial VAS test −0.60224 −0.47681 0.526263 0.156451 0.263397 −0.19787
Initial muscle strength −0.90239 −0.12719 0.112096 −0.19381 0.15468 0.308977
CG initial WOMAC 0.639288 −0.74257 −0.15343 0.015238 0.10918 0.064899
While for the CG the PCA diagram for the first two factors practically remainedunchanged (Figure 11b), being only an inversion of axes in relation to Figure 10b, for thePG, there were obvious changes (Figure 11a) in relation to the previous situation. Thesechanges were best seen by analyzing the contribution of factors for each group. Thus, iffor both the PG and the CG age was a parameter that was included in the second-orderfactor, for the PG, the weight and height remained coupled and gave contributions to factor3 (Table 10). In contrast, for the CG, weight was a factor of prime importance (Table 11),while height was a less important factor. These observed aspects are natural for patientswho do not receive effective treatment.
Appl. Sci. 2022, 12, x FOR PEER REVIEW 18 of 26
Table 8. Factor coordinates of the variables based on correlations for the pilot group (PG) at the initial stage.
Variable Factor 1 Factor 2 Factor 3 Factor 4 Factor 5 Factor 6 Age (years) −0.17544 −0.12843 0.800838 −0.40152 0.372737 −0.10588 Weight (kg) −0.38716 0.763855 0.261097 −0.09065 −0.16274 0.38502 Height (cm) −0.47821 0.638149 −0.0947 0.355641 0.32781 −0.34755
Initial WOMAC test −0.42858 −0.06762 −0.64829 −0.42846 0.422578 0.161166 Initial VAS test 0.512754 0.487966 −0.17507 −0.56843 −0.24671 −0.2804
Initial muscle strength 0.876851 0.101257 −0.01479 0.093 0.219449 −0.0209 Initial ROM flexion test 0.802037 0.262331 0.026423 0.113245 0.342044 0.243706
Table 9. Factor coordinates of the variables based on correlations for the control group (CG) at the initial stage.
Variable Factor 1 Factor 2 Factor 3 Factor 4 Factor 5 Factor 6 Age (years) −0.40854 −0.77165 0.248408 −0.09066 −0.40941 −0.01051 Weight (kg) 0.64822 0.150963 0.508954 −0.54186 0.048725 −0.04472 Height (cm) 0.583746 0.23023 0.660958 0.366693 −0.06892 0.173656
Initial WOMAC test 0.639288 −0.74257 −0.15343 0.015238 0.10918 0.064899 Initial VAS test −0.60224 −0.47681 0.526263 0.156451 0.263397 −0.19787
Initial muscle strength −0.90239 −0.12719 0.112096 −0.19381 0.15468 0.308977 CG initial WOMAC 0.639288 −0.74257 −0.15343 0.015238 0.10918 0.064899
(a) (b)
Figure 11. PCA analysis results for the (a) pilot group and (b) control group at 3 months.
Table 10. Factor coordinates of the variables based on correlations for the pilot group (PG) after 3 months.
Variable Factor 1 Factor 2 Factor 3 Factor 4 Factor 5 Factor 6 Age 0.227779 −0.672723 0.236629 0.539305 0.271364 −0.269485
Weight 0.474756 −0.210575 −0.668359 0.184855 0.167216 0.465744 Height 0.419664 0.009419 −0.742912 −0.060786 −0.227288 −0.463873
WOMAC test after 3 months 0.470012 −0.343063 0.100854 −0.681551 0.427492 −0.055478 VAS test after 3 months 0.340695 −0.629027 0.242235 −0.153364 −0.619587 0.148715
Muscle strength after 3 months −0.836608 −0.323219 −0.253536 −0.227014 −0.022256 −0.069839 ROM flexion test after 3 months −0.795795 −0.445332 −0.292966 0.003051 0.068194 0.060417
Figure 11. PCA analysis results for the (a) pilot group and (b) control group at 3 months.
Table 10. Factor coordinates of the variables based on correlations for the pilot group (PG) after3 months.
Variable Factor 1 Factor 2 Factor 3 Factor 4 Factor 5 Factor 6
Age 0.227779 −0.672723 0.236629 0.539305 0.271364 −0.269485
Weight 0.474756 −0.210575 −0.668359 0.184855 0.167216 0.465744
Height 0.419664 0.009419 −0.742912 −0.060786 −0.227288 −0.463873
WOMAC test after 3 months 0.470012 −0.343063 0.100854 −0.681551 0.427492 −0.055478
VAS test after 3 months 0.340695 −0.629027 0.242235 −0.153364 −0.619587 0.148715
Muscle strength after 3 months −0.836608 −0.323219 −0.253536 −0.227014 −0.022256 −0.069839
ROM flexion test after 3 months −0.795795 −0.445332 −0.292966 0.003051 0.068194 0.060417

Appl. Sci. 2022, 12, 3165 18 of 25
Table 11. Factor coordinates of the variables based on correlations for the control group (CG) after3 months.
Variable Factor 1 Factor 2 Factor 3 Factor 4 Factor 5 Factor 6
Age 0.372638 −0.770865 0.351498 −0.004635 −0.376629 −0.038537
Weight −0.739012 0.097571 0.392983 0.516199 0.042614 −0.147063
Height −0.562548 0.355252 0.666723 −0.284778 0.011011 0.177754
WOMAC test after 3 months −0.671922 −0.720087 −0.100533 −0.036668 0.120227 0.063944
VAS test after 3 months 0.764624 −0.334418 0.375759 −0.175039 0.311154 −0.186721
ROM flexion test after 3 months −0.671922 −0.720087 −0.100533 −0.036668 0.120227 0.063944
Initial muscle strength 0.856078 −0.178459 0.13093 0.359274 0.118778 0.273779
For the following data set taken after 6 months of monitoring, the PCA diagram for theCG remained practically unchanged (Figure 12b) compared with the previous situations.
Appl. Sci. 2022, 12, x FOR PEER REVIEW 19 of 26
Table 11. Factor coordinates of the variables based on correlations for the control group (CG) after 3 months.
Variable Factor 1 Factor 2 Factor 3 Factor 4 Factor 5 Factor 6 Age 0.372638 −0.770865 0.351498 −0.004635 −0.376629 −0.038537
Weight −0.739012 0.097571 0.392983 0.516199 0.042614 −0.147063 Height −0.562548 0.355252 0.666723 −0.284778 0.011011 0.177754
WOMAC test after 3 months −0.671922 −0.720087 −0.100533 −0.036668 0.120227 0.063944 VAS test after 3 months 0.764624 −0.334418 0.375759 −0.175039 0.311154 −0.186721
ROM flexion test after 3 months −0.671922 −0.720087 −0.100533 −0.036668 0.120227 0.063944 Initial muscle strength 0.856078 −0.178459 0.13093 0.359274 0.118778 0.273779
For the following data set taken after 6 months of monitoring, the PCA diagram for the CG remained practically unchanged (Figure 12b) compared with the previous situa-tions.
For the PG, there were obvious changes (Figure 12a) in relation to the previous situ-ation. In Figure 10a, if the PG presented important contributions for factor 2 from the VAS and WOMAC values, after 6 months of monitoring, the contributions of these factors were found in factor 3 (Table 12). For the PG, the height and weight parameters remained cou-pled and contributed to factor 2. This fact suggests that the body mass index would be extremely useful for analyzing the evolution of this group.
For the CG, age was a parameter that was included in the second-order factor, along with the weight and height (Table 13). However, for the CG, the WOMAC, VAS, and ROM size effects had major contributions, being included in the factor 1 component.
(a) (b)
Figure 12. PCA analysis results for the (a) pilot group and (b) control group at 6 months.
Table 12. Factor coordinates of the variables based on correlations for the pilot group (PG) after 6 months.
Variable Factor 1 Factor 2 Factor 3 Factor 4 Factor 5 Factor 6 Age −0.057318 0.008466 −0.638977 −0.689853 0.248303 0.225369
Weight 0.149165 0.80625 −0.236736 −0.067622 0.126056 −0.501077 Height 0.146953 0.798468 −0.108744 0.317836 −0.052394 0.472586
WOMAC test after 6 months 0.284124 −0.182385 −0.719375 0.11887 −0.590437 −0.075881 VAS test after 6 months 0.301459 −0.344811 −0.498948 0.545593 0.4917 −0.030827
Muscle strength after 6 months −0.904867 0.072547 −0.240087 0.203629 0.006427 0.020377 ROM flexion test after 6 months −0.937252 0.016756 −0.162417 0.096187 −0.03038 −0.072024
Figure 12. PCA analysis results for the (a) pilot group and (b) control group at 6 months.
For the PG, there were obvious changes (Figure 12a) in relation to the previous sit-uation. In Figure 10a, if the PG presented important contributions for factor 2 from theVAS and WOMAC values, after 6 months of monitoring, the contributions of these factorswere found in factor 3 (Table 12). For the PG, the height and weight parameters remainedcoupled and contributed to factor 2. This fact suggests that the body mass index would beextremely useful for analyzing the evolution of this group.
Table 12. Factor coordinates of the variables based on correlations for the pilot group (PG) after6 months.
Variable Factor 1 Factor 2 Factor 3 Factor 4 Factor 5 Factor 6
Age −0.057318 0.008466 −0.638977 −0.689853 0.248303 0.225369
Weight 0.149165 0.80625 −0.236736 −0.067622 0.126056 −0.501077
Height 0.146953 0.798468 −0.108744 0.317836 −0.052394 0.472586
WOMAC test after 6 months 0.284124 −0.182385 −0.719375 0.11887 −0.590437 −0.075881
VAS test after 6 months 0.301459 −0.344811 −0.498948 0.545593 0.4917 −0.030827
Muscle strength after 6 months −0.904867 0.072547 −0.240087 0.203629 0.006427 0.020377
ROM flexion test after 6 months −0.937252 0.016756 −0.162417 0.096187 −0.03038 −0.072024

Appl. Sci. 2022, 12, 3165 19 of 25
For the CG, age was a parameter that was included in the second-order factor, alongwith the weight and height (Table 13). However, for the CG, the WOMAC, VAS, and ROMsize effects had major contributions, being included in the factor 1 component.
Table 13. Factor coordinates of the variables based on correlations for the control group (CG) after6 months.
Variable Factor 1 Factor 2 Factor 3 Factor 4 Factor 5 Factor 6
Age −0.173219 −0.781599 −0.42766 0.359204 −0.106859 −0.189099
Weight −0.552026 0.550402 −0.411497 −0.330655 −0.32422 −0.092426
Height −0.246372 0.752784 −0.393773 0.432213 0.043256 0.169942
WOMAC test after 6 months −0.906747 −0.284033 0.265738 0.058011 −0.117826 0.096282
VAS test after 6 months −0.716628 −0.302249 −0.411121 −0.254999 0.399897 0.033566
ROM flexion test after 6 months −0.906747 −0.284033 0.265738 0.058011 −0.117826 0.096282
Initial muscle strength 0.608334 −0.621005 −0.34678 −0.150183 −0.187282 0.257677
For the next data set taken after 9 months of monitoring, the PCA diagram for theCG showed configurations with very few modifications (Figure 13b) compared with theprevious situations (Tables 14 and 15).
Appl. Sci. 2022, 12, x FOR PEER REVIEW 20 of 26
Table 13. Factor coordinates of the variables based on correlations for the control group (CG) after 6 months.
Variable Factor 1 Factor 2 Factor 3 Factor 4 Factor 5 Factor 6 Age −0.173219 −0.781599 −0.42766 0.359204 −0.106859 −0.189099
Weight −0.552026 0.550402 −0.411497 −0.330655 −0.32422 −0.092426 Height −0.246372 0.752784 −0.393773 0.432213 0.043256 0.169942
WOMAC test after 6 months −0.906747 −0.284033 0.265738 0.058011 −0.117826 0.096282 VAS test after 6 months −0.716628 −0.302249 −0.411121 −0.254999 0.399897 0.033566
ROM flexion test after 6 months −0.906747 −0.284033 0.265738 0.058011 −0.117826 0.096282 Initial muscle strength 0.608334 −0.621005 −0.34678 −0.150183 −0.187282 0.257677
For the next data set taken after 9 months of monitoring, the PCA diagram for the CG showed configurations with very few modifications (Figure 13b) compared with the pre-vious situations (Tables 14 and 15).
For the PG (Figure 13a), the PCA diagram did not change significantly in relation to the previous situation. In Figure 10a, if the PG presented important contributions for fac-tor 2 from the VAS and WOMAC values placed in the same quadrant, after 9 months of monitoring, the contributions of these factors were found separately, having opposite in-fluences within the same factor (Table 14). After 12 months, for the PG, the height and weight parameters remained coupled (Figure 14a) and contributed as in the previous sit-uations in factor 2 (Table 16).
For the CG, age was a parameter that was also included in the second-order factor (Figure 14b) along with height (Table 17). However, the WOMAC, VAS, and ROM sizes had major contributions, being included in the factor 1 component (Table 17).
(a) (b)
Figure 13. PCA analysis results for the (a) pilot group and (b) control group at 9 months.
Table 14. Factor coordinates of the variables based on correlations with the pilot group (PG) after 9 months.
Variable Factor 1 Factor 2 Factor 3 Factor 4 Factor 5 Factor 6 Age −0.163722 −0.129883 −0.817701 −0.38458 −0.303894 −0.217337
Weight 0.421275 −0.681319 −0.180406 −0.202216 0.047842 0.531264 Height 0.398624 −0.639181 0.118911 −0.191559 0.463704 −0.407028
WOMAC test after 9 months −0.477327 0.33645 −0.454268 0.040244 0.655758 0.132361 VAS test after 9 months 0.255099 −0.347793 −0.393474 0.805155 −0.057139 −0.083135
Muscle strength after 9 months −0.780641 −0.517856 0.201877 −0.006728 −0.099046 −0.054374 ROM flexion test after 9 months −0.848415 −0.430933 0.075602 0.109443 0.005286 0.065062
Figure 13. PCA analysis results for the (a) pilot group and (b) control group at 9 months.
Table 14. Factor coordinates of the variables based on correlations with the pilot group (PG) after9 months.
Variable Factor 1 Factor 2 Factor 3 Factor 4 Factor 5 Factor 6
Age −0.163722 −0.129883 −0.817701 −0.38458 −0.303894 −0.217337
Weight 0.421275 −0.681319 −0.180406 −0.202216 0.047842 0.531264
Height 0.398624 −0.639181 0.118911 −0.191559 0.463704 −0.407028
WOMAC test after 9 months −0.477327 0.33645 −0.454268 0.040244 0.655758 0.132361
VAS test after 9 months 0.255099 −0.347793 −0.393474 0.805155 −0.057139 −0.083135
Muscle strength after 9 months −0.780641 −0.517856 0.201877 −0.006728 −0.099046 −0.054374
ROM flexion test after 9 months −0.848415 −0.430933 0.075602 0.109443 0.005286 0.065062

Appl. Sci. 2022, 12, 3165 20 of 25
Table 15. Factor coordinates of the variables based on correlations with the control group (CG) after9 months.
Variable Factor 1 Factor 2 Factor 3 Factor 4 Factor 5 Factor 6
Age 0.149027 −0.778052 −0.281976 0.458076 0.206861 −0.200724
Weight −0.648258 0.371211 −0.321741 0.340358 −0.468873 −0.052548
Height −0.513533 0.544514 −0.499268 0.108515 0.394234 0.152721
WOMAC test after 9 months −0.767118 −0.606757 0.177542 0.010254 −0.001097 0.108391
VAS test after 9 months 0.088746 −0.550926 −0.642614 −0.506753 −0.137218 0.004974
ROM flexion test after 9 months −0.767118 −0.606757 0.177542 0.010254 −0.001097 0.108391
Muscle strength 0.830623 −0.295921 −0.112589 0.323617 −0.146676 0.289099
For the PG (Figure 13a), the PCA diagram did not change significantly in relationto the previous situation. In Figure 10a, if the PG presented important contributions forfactor 2 from the VAS and WOMAC values placed in the same quadrant, after 9 monthsof monitoring, the contributions of these factors were found separately, having oppositeinfluences within the same factor (Table 14). After 12 months, for the PG, the height andweight parameters remained coupled (Figure 14a) and contributed as in the previoussituations in factor 2 (Table 16).
Appl. Sci. 2022, 12, x FOR PEER REVIEW 21 of 26
Table 15. Factor coordinates of the variables based on correlations with the control group (CG) after 9 months.
Variable Factor 1 Factor 2 Factor 3 Factor 4 Factor 5 Factor 6 Age 0.149027 −0.778052 −0.281976 0.458076 0.206861 −0.200724
Weight −0.648258 0.371211 −0.321741 0.340358 −0.468873 −0.052548 Height −0.513533 0.544514 −0.499268 0.108515 0.394234 0.152721
WOMAC test after 9 months −0.767118 −0.606757 0.177542 0.010254 −0.001097 0.108391 VAS test after 9 months 0.088746 −0.550926 −0.642614 −0.506753 −0.137218 0.004974
ROM flexion test after 9 months −0.767118 −0.606757 0.177542 0.010254 −0.001097 0.108391 Muscle strength 0.830623 −0.295921 −0.112589 0.323617 −0.146676 0.289099
(a) (b)
Figure 14. PCA analysis results for the (a) pilot group and (b) control group at 12 months.
Table 16. Factor coordinates of the variables based on correlations with the pilot group (PG) after 12 months.
Variable Factor 1 Factor 2 Factor 3 Factor 4 Factor 5 Factor 6 Age −0.148961 −0.067687 0.927 −0.096863 0.06868 −0.313573
Weight 0.438348 0.615282 0.381684 −0.025543 0.228492 0.480341 Height 0.455133 0.667716 0.046186 −0.045912 −0.561316 −0.155468
WOMAC test after 12 months −0.594652 −0.168703 0.257435 0.615788 −0.314365 0.270036 VAS test after 12 months −0.153677 0.687375 −0.173122 0.544848 0.294779 −0.295345
Muscle strength after 12 months −0.739748 0.399993 −0.094774 −0.376964 −0.077168 0.06215 ROM flexion test after 12 months −0.816146 0.346115 −0.007506 −0.231227 0.04065 0.031053
Table 17. Baseline characteristics of the t-test results and factor coordinates of the variables based on correlations with the control group (CG) after 12 months.
Variable Factor 1 Factor 2 Factor 3 Factor 4 Factor 5 Factor 6 Age −0.066009 −0.856533 0.12279 −0.443203 0.111468 0.195097
Weight −0.564898 0.497323 −0.098491 −0.494398 −0.423191 0.018414 Height −0.509841 0.59758 0.248188 −0.342513 0.446991 −0.065168
Initial muscle strength 0.774789 −0.430082 0.069126 −0.38836 −0.052896 −0.237342 WOMAC test after 12 months −0.851222 −0.46791 −0.205264 0.070895 0.016589 −0.095119
VAS test after 12 months −0.368794 −0.178153 0.878551 0.166963 −0.177382 −0.032566 ROM flexion test after 12 months −0.851222 −0.46791 −0.205264 0.070895 0.016589 −0.095119
Figure 14. PCA analysis results for the (a) pilot group and (b) control group at 12 months.
Table 16. Factor coordinates of the variables based on correlations with the pilot group (PG) after12 months.
Variable Factor 1 Factor 2 Factor 3 Factor 4 Factor 5 Factor 6
Age −0.148961 −0.067687 0.927 −0.096863 0.06868 −0.313573
Weight 0.438348 0.615282 0.381684 −0.025543 0.228492 0.480341
Height 0.455133 0.667716 0.046186 −0.045912 −0.561316 −0.155468
WOMAC test after 12 months −0.594652 −0.168703 0.257435 0.615788 −0.314365 0.270036
VAS test after 12 months −0.153677 0.687375 −0.173122 0.544848 0.294779 −0.295345
Muscle strength after 12 months −0.739748 0.399993 −0.094774 −0.376964 −0.077168 0.06215
ROM flexion test after 12 months −0.816146 0.346115 −0.007506 −0.231227 0.04065 0.031053

Appl. Sci. 2022, 12, 3165 21 of 25
For the CG, age was a parameter that was also included in the second-order factor(Figure 14b) along with height (Table 17). However, the WOMAC, VAS, and ROM sizeshad major contributions, being included in the factor 1 component (Table 17).
Table 17. Baseline characteristics of the t-test results and factor coordinates of the variables based oncorrelations with the control group (CG) after 12 months.
Variable Factor 1 Factor 2 Factor 3 Factor 4 Factor 5 Factor 6
Age −0.066009 −0.856533 0.12279 −0.443203 0.111468 0.195097
Weight −0.564898 0.497323 −0.098491 −0.494398 −0.423191 0.018414
Height −0.509841 0.59758 0.248188 −0.342513 0.446991 −0.065168
Initial muscle strength 0.774789 −0.430082 0.069126 −0.38836 −0.052896 −0.237342
WOMAC test after 12 months −0.851222 −0.46791 −0.205264 0.070895 0.016589 −0.095119
VAS test after 12 months −0.368794 −0.178153 0.878551 0.166963 −0.177382 −0.032566
ROM flexion test after 12 months −0.851222 −0.46791 −0.205264 0.070895 0.016589 −0.095119
4. Discussion
KOA is considered the tenth largest contributor to global years lived with disabil-ities [49,50]. The prevalence of OA is very high, and it is expected to affect more than50 million subjects in the US by 2020 and increase with the aging of the population [51].
Non-pharmacologic strategies are a first-line approach to managing symptoms suchas exercise, weight loss, and patient education [52,53]. Physical activity of 150 min/weekconsisting of moderate-intensity aerobic exercise or 2 days/week of moderate-to-vigorousphysical activity in muscle-strengthening exercises is important in maintaining physicalfunction in OA [52].
Pharmacological treatment options include simple analgesics, nonsteroidal NSAIDs,selective COX-2 inhibitors, intra-articular corticosteroid injections, VS, and surgery. How-ever, NSAIDs can cause gastrointestinal problems, renal failure, hypertension, and have athrombotic potential, especially at high doses [53].
For patients with joint effusions, corticosteroids are usually administered by an IAinjection. Systemic administration of corticosteroids, due to severe side effects, is notrecommended in OA. Additionally, there are possible adverse events following repeatedadministration of corticosteroids, such as local tissue atrophy, long-term joint damage dueto reduced bone formation, and the risk of infection [54]. Corticoids may produce immuno-suppressive and anti-inflammatory effects, reduce production of IL-1, prostaglandins, andleukotriene, and increase joint mobility. IA corticosteroid injections provide a short-termreduction in OA pain and act as key therapy for moderate-to-severe pain relief in patientswith OA [54].
For VS with HA, platelet-rich plasma (PRP) injections or combination products such asPRP + HA have been used to improve lubrication, modulate inflammation, and modify thecatabolic micro-environment [55]. Contraindications to hyaluronate injections include aller-gies, joint infections at the injection site, and pregnant and lactating women. Patients withvenous or lymphatic stasis in the legs, bleeding disorders, or treatment with anticoagulantsare generally contraindicated.
Herein, a two-group parallel randomized trial design was used to evaluate the effec-tiveness of a single HA-based VS product in combination with PT over a 1-year period.
In this study, the WOMAC score decreased for both groups of patients, with remark-able results obtained at 3 months in the PG followed at some distance by the CG. From thispoint of view, the PT consistently improved the quality of life of the patients.
The decrease in the VAS pain scores achieved from 5.7 to 2 represents the mostimportant outcome of the combination therapy with Kombihylan® and PT. A VAS valueof six is a high value of pain intensity, which is difficult to tolerate by patients, and in

Appl. Sci. 2022, 12, 3165 22 of 25
general, medical doctors tend to prescribe long-term analgesic and anti-inflammatory drugs.However, a VAS value of two is associated with mild pain, which is transient and does notrequire medication. Reaching the VAS value of two for the PG and keeping it steady for9 months is an important step in reducing drug use and improving the quality of life. Witha VAS value of three, the CG stays on the plateau for 6 months, and the descent from theinitial point is not as sudden as in the PG but is nonetheless sufficiently satisfactory.
The muscle strength in the PG increased from a value of four, corresponding to agood response, to a value of five, corresponding to a normal muscle strength response.We observed that training through PTE toned the quadriceps muscle and overcame thenegative loop phenomenon of arthrogenic inhibition. The fact that in 3 months the strengthincreased and then was maintained until month 12 showed us that PTE made a significantdifference in obtaining good function of the knee extensor when compared with the CG.
Although the values for the knee flexion were relatively small, they fell within the lastquadrant, and generally, the last degrees from 110 to 135 are the most difficult to recover.However, the ROM of the PG was improved by an average of 16.6 degrees throughout theperiod, and the values of the CG marked an average improvement of 8.7 degrees.
Although the results were satisfactory from a clinical perspective, future research isneeded to determine the best protocol and sequence of PT steps in combination with IA VSwith HA that could lead to the best outcomes for the patient.
There were limitations to this study. An important limitation was the use of only oneHA-based product in the same quantity for all patients regardless of age, sex, and weight.The PT procedures were refined before this study and applied according to all patients inthe PG. Another limitation of this study was the use of a single 10-day PT protocol, andfuture studies should focus on extended treatment protocols in different combinations.This study demonstrated the efficacy of VS with HA in combination with PT at several timeintervals. Evaluations stopped after a year, and future studies should exceed 1 year to showthe effectiveness of these therapies in the medium and long term. Of all the positive aspectsdiscussed above, it is worth mentioning that this study provided specific results, withstaggered determinations monitoring the evolution of patients at specific time intervals.On the other hand, the small size of the patient sample, human error, and the lack of acorrelation with the biological samples obtained from joint SF are among the few limitationsthat need to be addressed in the future.
5. Conclusions
We showed that PT plays a key role in the non-surgical treatment of KOA, effectivelycontrolling pain, stiffness, and ROM and improving patients’ quality of life. Moreover, thecombination of IA VS with an HA-biopolymer and PT can enhance the effect of the VSalone, reducing symptomatology and possibly limiting the KOA progression.
PT is an internationally recognized form of treatment for KOA by physicians andpatients as part of treatment guidelines, known as an important clinical tool. It is non-invasive, well tolerated and accepted by patients. The improvement of treatment schemesin KOA is a preoccupation for physiotherapists, especially when IA VS with HA hasbeen performed.
Further studies are needed to evaluate the limitation of joint destruction in KOA usingVS with HA in combination with with different PT procedures.
Author Contributions: Study design, I.O., D.M., R.G., D.A.I., D.-P.S. and A.O.; data collection, I.O.,R.G. and A.O.; data analysis, D.M., G.D.M. and G.M.; drafting manuscript, I.O., D.M., D.C., D.A.I.,I.L.S. and A.-I.G. All authors made a significant contribution to the work reported, whether thatis in the conception, study design, execution, acquisition of data, analysis and interpretation, or inall these areas, and took part in drafting, revising, or critically reviewing the article. All authorshave equally contributed to this article as senior authors. All authors have read and agreed to thepublished version of the manuscript.
Funding: This research received no external funding.
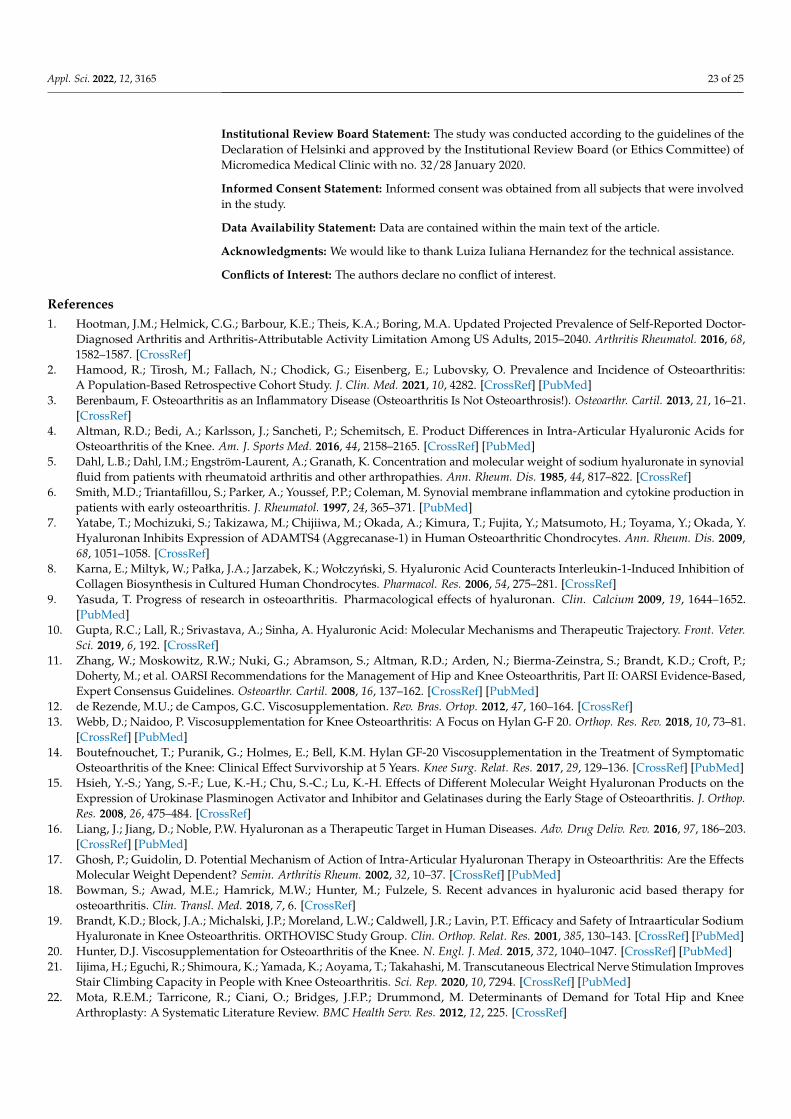
Appl. Sci. 2022, 12, 3165 23 of 25
Institutional Review Board Statement: The study was conducted according to the guidelines of theDeclaration of Helsinki and approved by the Institutional Review Board (or Ethics Committee) ofMicromedica Medical Clinic with no. 32/28 January 2020.
Informed Consent Statement: Informed consent was obtained from all subjects that were involvedin the study.
Data Availability Statement: Data are contained within the main text of the article.
Acknowledgments: We would like to thank Luiza Iuliana Hernandez for the technical assistance.
Conflicts of Interest: The authors declare no conflict of interest.
References1. Hootman, J.M.; Helmick, C.G.; Barbour, K.E.; Theis, K.A.; Boring, M.A. Updated Projected Prevalence of Self-Reported Doctor-
Diagnosed Arthritis and Arthritis-Attributable Activity Limitation Among US Adults, 2015–2040. Arthritis Rheumatol. 2016, 68,1582–1587. [CrossRef]
2. Hamood, R.; Tirosh, M.; Fallach, N.; Chodick, G.; Eisenberg, E.; Lubovsky, O. Prevalence and Incidence of Osteoarthritis:A Population-Based Retrospective Cohort Study. J. Clin. Med. 2021, 10, 4282. [CrossRef] [PubMed]
3. Berenbaum, F. Osteoarthritis as an Inflammatory Disease (Osteoarthritis Is Not Osteoarthrosis!). Osteoarthr. Cartil. 2013, 21, 16–21.[CrossRef]
4. Altman, R.D.; Bedi, A.; Karlsson, J.; Sancheti, P.; Schemitsch, E. Product Differences in Intra-Articular Hyaluronic Acids forOsteoarthritis of the Knee. Am. J. Sports Med. 2016, 44, 2158–2165. [CrossRef] [PubMed]
5. Dahl, L.B.; Dahl, I.M.; Engström-Laurent, A.; Granath, K. Concentration and molecular weight of sodium hyaluronate in synovialfluid from patients with rheumatoid arthritis and other arthropathies. Ann. Rheum. Dis. 1985, 44, 817–822. [CrossRef]
6. Smith, M.D.; Triantafillou, S.; Parker, A.; Youssef, P.P.; Coleman, M. Synovial membrane inflammation and cytokine production inpatients with early osteoarthritis. J. Rheumatol. 1997, 24, 365–371. [PubMed]
7. Yatabe, T.; Mochizuki, S.; Takizawa, M.; Chijiiwa, M.; Okada, A.; Kimura, T.; Fujita, Y.; Matsumoto, H.; Toyama, Y.; Okada, Y.Hyaluronan Inhibits Expression of ADAMTS4 (Aggrecanase-1) in Human Osteoarthritic Chondrocytes. Ann. Rheum. Dis. 2009,68, 1051–1058. [CrossRef]
8. Karna, E.; Miltyk, W.; Pałka, J.A.; Jarzabek, K.; Wołczynski, S. Hyaluronic Acid Counteracts Interleukin-1-Induced Inhibition ofCollagen Biosynthesis in Cultured Human Chondrocytes. Pharmacol. Res. 2006, 54, 275–281. [CrossRef]
9. Yasuda, T. Progress of research in osteoarthritis. Pharmacological effects of hyaluronan. Clin. Calcium 2009, 19, 1644–1652.[PubMed]
10. Gupta, R.C.; Lall, R.; Srivastava, A.; Sinha, A. Hyaluronic Acid: Molecular Mechanisms and Therapeutic Trajectory. Front. Veter.Sci. 2019, 6, 192. [CrossRef]
11. Zhang, W.; Moskowitz, R.W.; Nuki, G.; Abramson, S.; Altman, R.D.; Arden, N.; Bierma-Zeinstra, S.; Brandt, K.D.; Croft, P.;Doherty, M.; et al. OARSI Recommendations for the Management of Hip and Knee Osteoarthritis, Part II: OARSI Evidence-Based,Expert Consensus Guidelines. Osteoarthr. Cartil. 2008, 16, 137–162. [CrossRef] [PubMed]
12. de Rezende, M.U.; de Campos, G.C. Viscosupplementation. Rev. Bras. Ortop. 2012, 47, 160–164. [CrossRef]13. Webb, D.; Naidoo, P. Viscosupplementation for Knee Osteoarthritis: A Focus on Hylan G-F 20. Orthop. Res. Rev. 2018, 10, 73–81.
[CrossRef] [PubMed]14. Boutefnouchet, T.; Puranik, G.; Holmes, E.; Bell, K.M. Hylan GF-20 Viscosupplementation in the Treatment of Symptomatic
Osteoarthritis of the Knee: Clinical Effect Survivorship at 5 Years. Knee Surg. Relat. Res. 2017, 29, 129–136. [CrossRef] [PubMed]15. Hsieh, Y.-S.; Yang, S.-F.; Lue, K.-H.; Chu, S.-C.; Lu, K.-H. Effects of Different Molecular Weight Hyaluronan Products on the
Expression of Urokinase Plasminogen Activator and Inhibitor and Gelatinases during the Early Stage of Osteoarthritis. J. Orthop.Res. 2008, 26, 475–484. [CrossRef]
16. Liang, J.; Jiang, D.; Noble, P.W. Hyaluronan as a Therapeutic Target in Human Diseases. Adv. Drug Deliv. Rev. 2016, 97, 186–203.[CrossRef] [PubMed]
17. Ghosh, P.; Guidolin, D. Potential Mechanism of Action of Intra-Articular Hyaluronan Therapy in Osteoarthritis: Are the EffectsMolecular Weight Dependent? Semin. Arthritis Rheum. 2002, 32, 10–37. [CrossRef] [PubMed]
18. Bowman, S.; Awad, M.E.; Hamrick, M.W.; Hunter, M.; Fulzele, S. Recent advances in hyaluronic acid based therapy forosteoarthritis. Clin. Transl. Med. 2018, 7, 6. [CrossRef]
19. Brandt, K.D.; Block, J.A.; Michalski, J.P.; Moreland, L.W.; Caldwell, J.R.; Lavin, P.T. Efficacy and Safety of Intraarticular SodiumHyaluronate in Knee Osteoarthritis. ORTHOVISC Study Group. Clin. Orthop. Relat. Res. 2001, 385, 130–143. [CrossRef] [PubMed]
20. Hunter, D.J. Viscosupplementation for Osteoarthritis of the Knee. N. Engl. J. Med. 2015, 372, 1040–1047. [CrossRef] [PubMed]21. Iijima, H.; Eguchi, R.; Shimoura, K.; Yamada, K.; Aoyama, T.; Takahashi, M. Transcutaneous Electrical Nerve Stimulation Improves
Stair Climbing Capacity in People with Knee Osteoarthritis. Sci. Rep. 2020, 10, 7294. [CrossRef] [PubMed]22. Mota, R.E.M.; Tarricone, R.; Ciani, O.; Bridges, J.F.P.; Drummond, M. Determinants of Demand for Total Hip and Knee
Arthroplasty: A Systematic Literature Review. BMC Health Serv. Res. 2012, 12, 225. [CrossRef]

Appl. Sci. 2022, 12, 3165 24 of 25
23. Cherian, J.J.; Harrison, P.E.; Benjamin, S.A.; Bhave, A.; Harwin, S.F.; Mont, M.A. Do the Effects of Transcutaneous Electrical NerveStimulation on Knee Osteoarthritis Pain and Function Last? J. Knee Surg. 2016, 29, 497–501. [CrossRef] [PubMed]
24. Do Carmo Almeida, T.C.; Dos Santos Figueiredo, F.W.; Barbosa Filho, V.C.; de Abreu, L.C.; Fonseca, F.L.A.; Adami, F. Effects ofTranscutaneous Electrical Nerve Stimulation on Proinflammatory Cytokines: Systematic Review and Meta-Analysis. Mediat.Inflamm. 2018, 2018, 1094352. [CrossRef] [PubMed]
25. Tumilty, S.; Munn, J.; McDonough, S.; Hurley, D.A.; Basford, J.R.; Baxter, G.D. Low Level Laser Treatment of Tendinopathy:A Systematic Review with Meta-analysis. Photomed. Laser Surg. 2010, 28, 3–16. [CrossRef] [PubMed]
26. Smoot, B.; Chiavola-Larson, L.; Lee, J.; Manibusan, H.; Allen, D.D. Effect of Low-Level Laser Therapy on Pain and Swelling inWomen with Breast Cancer-Related Lymphedema: A Systematic Review and Meta-Analysis. J. Cancer Surviv. 2015, 9, 287–304.[CrossRef] [PubMed]
27. Hegedus, B.; Viharos, L.; Gervain, M.; Gálfi, M. The Effect of Low-Level Laser in Knee Osteoarthritis: A Double-Blind, Random-ized, Placebo-Controlled Trial. Photomed. Laser Surg. 2009, 27, 577–584. [CrossRef] [PubMed]
28. Rothenberg, J.B.; Jayaram, P.; Naqvi, U.; Gober, J.; Malanga, G.A. The Role of Low-Intensity Pulsed Ultrasound on CartilageHealing in Knee Osteoarthritis: A Review. PM&R 2017, 9, 1268–1277. [CrossRef]
29. Paliwal, S.; Mitragotri, S. Therapeutic Opportunities in Biological Responses of Ultrasound. Ultrasonics 2008, 48, 271–278.[CrossRef]
30. Schumann, D.; Kujat, R.; Zellner, J.; Angele, M.K.; Nerlich, M.; Mayr, E.; Angele, P. Treatment of Human Mesenchymal Stem Cellswith Pulsed Low Intensity Ultrasound Enhances the Chondrogenic Phenotype In Vitro. Biorheology 2006, 43, 431–443. [PubMed]
31. Zhang, C.; Xie, Y.; Luo, X.; Ji, Q.; Lu, C.; He, C.; Wang, P. Effects of Therapeutic Ultrasound on Pain, Physical Functions andSafety Outcomes in Patients with Knee Osteoarthritis: A Systematic Review and Meta-Analysis. Clin. Rehabilit. 2016, 30, 960–971.[CrossRef]
32. De Oliveira Perrucini, P.D.; Poli-Frederico, R.C.; de Almeida Pires-Oliveira, D.A.; Dragonetti Bertin, L.; Beltrão Pires, F.; Shimoya-Bittencourt, W.; Martins Santos, V.; Medeiros Coelho, J.; Franco de Oliveira, R. Anti-Inflammatory and Healing Effects of PulsedUltrasound Therapy on Fibroblasts. Am. J. Phys. Med. Rehabilit. 2019, 99, 19–25. [CrossRef] [PubMed]
33. Dantas, L.O.; Moreira, R.D.F.C.; Norde, F.M.; Serrão, P.R.; Alburquerque-Sendín, F.; Salvini, T.F. The Effects of Cryotherapy onPain and Function in Individuals with Knee Osteoarthritis: A Systematic Review of Randomized Controlled Trials. Clin. Rehabilit.2019, 33, 1310–1319. [CrossRef]
34. Barbosa, G.M.; Cunha, J.E.; Cunha, T.M.; Martinho, L.B.; Castro, P.A.T.S.; Oliveira, F.F.B.; Cunha, F.Q.; Ramalho, F.S.; Salvini, T.F.Clinical-like Cryotherapy Improves Footprint Patterns and Reduces Synovial Inflammation in a Rat Model of Post-TraumaticKnee Osteoarthritis. Sci. Rep. 2019, 9, 14518. [CrossRef] [PubMed]
35. Dantas, L.O.; Jorge, A.E.; Regina Mendes da Silva Serrão, P.; Aburquerque-Sendín, F.; de Fatima Salvini, T. Cryotherapy Associatedwith Tailored Land-Based Exercises for Knee Osteoarthritis: A Protocol for a Double-Blind Sham-Controlled Randomised Trial.BMJ Open 2020, 10, e035610. [CrossRef]
36. Hou, Y.; Yang, Z.; Lin, J.; Chen, Y.; Xing, D.; Wang, B. Systematic Review of Clinical Practice Guidelines on Exercise Therapy forKnee Osteoarthritis and Critical Appraisal Using AGREEII Instrument. Osteoarthr. Cartil. 2018, 26, S324–S325. [CrossRef]
37. Song, Q.; Shen, P.; Mao, M.; Sun, W.; Zhang, C.; Li, L. Proprioceptive neuromuscular facilitation improves pain and descendingmechanics among elderly with knee osteoarthritis. Scand. J. Med. Sci. Sports 2020, 30, 1655–1663. [CrossRef] [PubMed]
38. Noyes, F. Noyes’ Knee Disorders: Surgery, Rehabilitation, Clinical Outcomes, 1st ed.; Saunders: Philadelphia, PA, USA, 2009;ISBN 978-1-4377-2118-8.
39. Schulz, K.F.; Altman, D.G.; Moher, D. CONSORT 2010 statement: Updated guidelines for reporting parallel group randomizedtrials. BMC Med. 2010, 8, 18. [CrossRef] [PubMed]
40. Faiz, K.W. VAS—Visual Analog Scale. Tidsskr. Nor. Laegeforen 2014, 134, 323. [CrossRef] [PubMed]41. Alghadir, A.H.; Anwer, S.; Iqbal, A.; Iqbal, Z.A. Test-Retest Reliability, Validity, and Minimum Detectable Change of Visual
Analog, Numerical Rating, and Verbal Rating Scales for Measurement of Osteoarthritic Knee Pain. J. Pain Res. 2018, 11, 851–856.[CrossRef]
42. Silman, A.; Smolen, J.; Weinblatt, M.; Weisman, M.; Hochberg, M.; Gravallese, E. Rheumatology, 2-Volume Set, 7th ed.; Elsevier:Amsterdam, The Netherlands, 2018; ISBN 978-0-7020-7306-9.
43. Brown, M.; Avers, D. Daniels and Worthingham’s Muscle Testing, 10th ed.Saunders: Philadelphia, PA, USA, 2018; ISBN 978-0-323-56956-9.
44. Rice, D.A.; McNair, P.J. Quadriceps Arthrogenic Muscle Inhibition: Neural Mechanisms and Treatment Perspectives. Semin.Arthritis Rheum. 2010, 40, 250–266. [CrossRef] [PubMed]
45. Becker, R.; Berth, A.; Nehring, M.; Awiszus, F. Neuromuscular quadriceps dysfunction prior to osteoarthritis of the knee. J. Orthop.Res. 2004, 22, 768–773. [CrossRef] [PubMed]
46. Norkin, C.C.; White, D.J. Measurement of Joint Motion: A Guide to Goniometry; FA Davis: New York, NY, USA, 2009; ISBN 978-0-8036-2347-7.
47. Benner, R.W.; Shelbourne, K.D.; Bauman, S.N.; Norris, A.; Gray, T. Knee Osteoarthritis: Alternative Range of Motion Treatment.Orthop. Clin. N. Am. 2019, 50, 425–432. [CrossRef] [PubMed]
48. Murariu, G.; Popa, P.; Timofti, M.; Georgescu, L.P. Multivariate statistical analyses of Danube river water quality at Galati,Romania. Environ. Eng. Manag. J. 2018, 17, 1249–1266. [CrossRef]

Appl. Sci. 2022, 12, 3165 25 of 25
49. Kyu, H.H.; Abate, D.; Abate, K.H.; Abay, S.M.; Abbafati, C.; Abbasi, N.; Abbastabar, H.; Abd-Allah, F.; Abdela, J.; Abdelalim, A.;et al. Global, regional, and national disability-adjusted life-years (DALYs) for 359 diseases and injuries and healthy life expectancy(HALE) for 195 countries and territories, 1990–2017: A systematic analysis for the Global Burden of Disease Study 2017. Lancet2018, 392, 1859–1922. [CrossRef]
50. March, L.; Cross, M.; Lo, C.; Arden, N.; Gates, L.; Leyland, K.; Hawker, G.; King, L. Osteoarthritis: A Serious Disease. OARSI org.2016, pp. 1–103. Available online: https://oarsi.org/sites/default/files/docs/2016/oarsi_white_paper_oa_serious_disease_121416_1.pdf (accessed on 1 March 2022).
51. Cross, M.; Smith, E.; Hoy, D.; Nolte, S.; Ackerman, I.; Fransen, M.; Bridgett, L.; Williams, S.; Guillemin, F.; Hill, C.L.; et al. Theglobal burden of hip and knee osteoarthritis: Estimates from the Global Burden of Disease 2010 study. Ann. Rheum. Dis. 2014, 73,1323–1330. [CrossRef] [PubMed]
52. Chae, K.J.; Choi, M.J.; Kim, K.Y.; Ajayi, F.F.; Chang, I.S.; Kim, I.S. Osteoarthritis: Careand Management: Clinical Guideline; NationalInstitute for Health and Care, 2014. Available online: https://www.nice.org (accessed on 1 March 2022).
53. Bannuru, R.R.; Osani, M.C.; Vaysbrot, E.E.; Arden, N.K.; Bennell, K.; Bierma-Zeinstra, S.M.A.; Kraus, V.B.; Lohmander, L.S.;Abbott, J.H.; Bhandari, M.; et al. OARSI guidelines for the non-surgical management of knee, hip, and polyarticular osteoarthritis.Osteoarthr. Cartil. 2019, 27, 1578–1589. [CrossRef] [PubMed]
54. Rozental, T.D.; Sculco, T.P. Intra-articular corticosteroids: An updated overview. Am. J. Orthop. 2000, 29, 18–23.55. Pourcho, A.M.; Smith, J.; Wisniewski, S.J.; Sellon, J.L. Intraarticular platelet-rich plasma injection in the treatment of knee
osteoarthritis: Review and recommendations. Am. J. Phys. Med. Rehabilit. 2014, 93, S108–S121. [CrossRef]
Copyright © 2022 FDOKUMEN