Effects of exercise adherence on physical function among overweight older adults with knee...
176
THE COURSE OF CHRONIC DISEASE, DEPRESSION, AND HEALTH BEHAVIOR IN LONGITUDINAL PERSPECTIVE Findings concerning the epidemiology of aging HET BELOOP VAN CHRONISCHE ZIEKTE, DEPRESSIE, EN GEZONDHEIDSGEDRAG IN LONGITUDINAAL PERSPECTIEF Bevindingen aangaande de epidemiologie van veroudering
-
Upload
independent -
Category
Documents
-
view
3 -
download
0
Transcript of Effects of exercise adherence on physical function among overweight older adults with knee...
THE COURSE OF CHRONIC DISEASE, DEPRESSION,
AND HEALTH BEHAVIOR IN LONGITUDINAL
PERSPECTIVE
Findings concerning the epidemiology of aging
HET BELOOP VAN CHRONISCHE ZIEKTE, DEPRESSIE, EN
GEZONDHEIDSGEDRAG IN LONGITUDINAAL PERSPECTIEF
Bevindingen aangaande de epidemiologie van veroudering

II
The studies described in this thesis were performed at the Care and Public Health Research
Institute (CAPHRI) of the Universiteit Maastricht, which partakes in the Netherlands School of
Primary Care Research (CaRe), re-acknowledged by the Royal Dutch Academy of Sciences
(KNAW) in 2000.
The studies described in this thesis were financially supported through research grants from
the J.W. Fulbright Association, Stichting Anna Fonds, Nationaal Reumafonds, and Wake Forest
University, which are gratefully acknowledged.
Financial support for printing this thesis by the Faculty of Health Sciences of the Universiteit
Maastricht, the Care And Public Health Research Institute (CAPHRI) is gratefully acknowledged.
The course of chronic disease, depression, and health behavior in longitudinal perspective:
Findings concerning the epidemiology of aging. C.H. van Gool. Doctoral dissertation,
Universiteit Maastricht – with references – with summary in Dutch. MeSH subject headings:
Chronic disease, Depression, Health Behavior, Lifestyle, Adherence, Longitudinal studies,
Aging.
Lay out by C.H. van Gool; printed by Ipskamp PrintPartners.
Cover design by Ivorm Concept & Design, Tilburg (www.Ivorm.nl).
ISBN: 90-9019432-0
Copyright © 2005, C.H. VAN GOOL, Universiteit Maastricht, Department of Health Care
Studies, PO Box 616, 6200 MD Maastricht, The Netherlands, Telephone: (+31) 043 3882204;
Facsimile: (+31) 043 3884169, E-mail: [email protected]
ALL RIGHTS RESERVED. NO PART OF THIS BOOK MAY BE REPRODUCED, STORED IN A RETRIEVAL SYSTEM, OR TRANSMITTED, IN ANY FORM OR BY ANY MEANS, ELECTRONICAL, MECHANICAL, PHOTOCOPYING, RECORDING, OR OTHERWISE, WITHOUT THE WRITTEN PERMISSION OF THE AUTHOR.
III
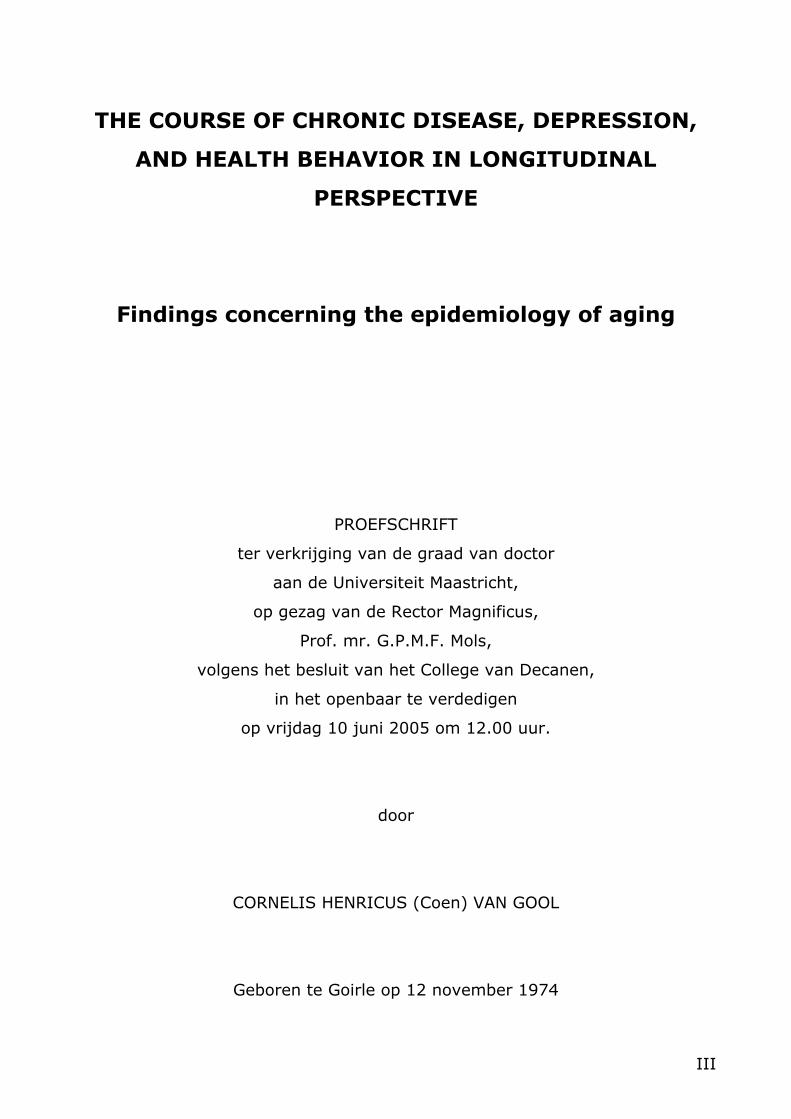
THE COURSE OF CHRONIC DISEASE, DEPRESSION,
AND HEALTH BEHAVIOR IN LONGITUDINAL
PERSPECTIVE
Findings concerning the epidemiology of aging
PROEFSCHRIFT
ter verkrijging van de graad van doctor
aan de Universiteit Maastricht,
op gezag van de Rector Magnificus,
Prof. mr. G.P.M.F. Mols,
volgens het besluit van het College van Decanen,
in het openbaar te verdedigen
op vrijdag 10 juni 2005 om 12.00 uur.
door
CORNELIS HENRICUS (Coen) VAN GOOL
Geboren te Goirle op 12 november 1974

IV
Promotores:
Prof. dr. J.Th.M. van Eijk
Prof. dr. G.I.J.M. Kempen
Co-promotor:
Dr. B.W.J.H. Penninx (Vrije Universiteit Amsterdam)
Beoordelingscommissie:
Prof. dr. J.A. Knottnerus (voorzitter)
Prof. dr. J.J. Jolles
Prof. dr. J. van Os
Prof. dr. R. Sanderman (Rijksuniversiteit Groningen)

V
"He who is of calm and happy nature will hardly feel
the pressure of age, but to him who is of
an opposite disposition youth
and age are equally
a burden"
(Plato, 427bC – 347bC)
"I enjoy research more than eating"
(Curt P. Richter, 1894-1988)

VI
VII
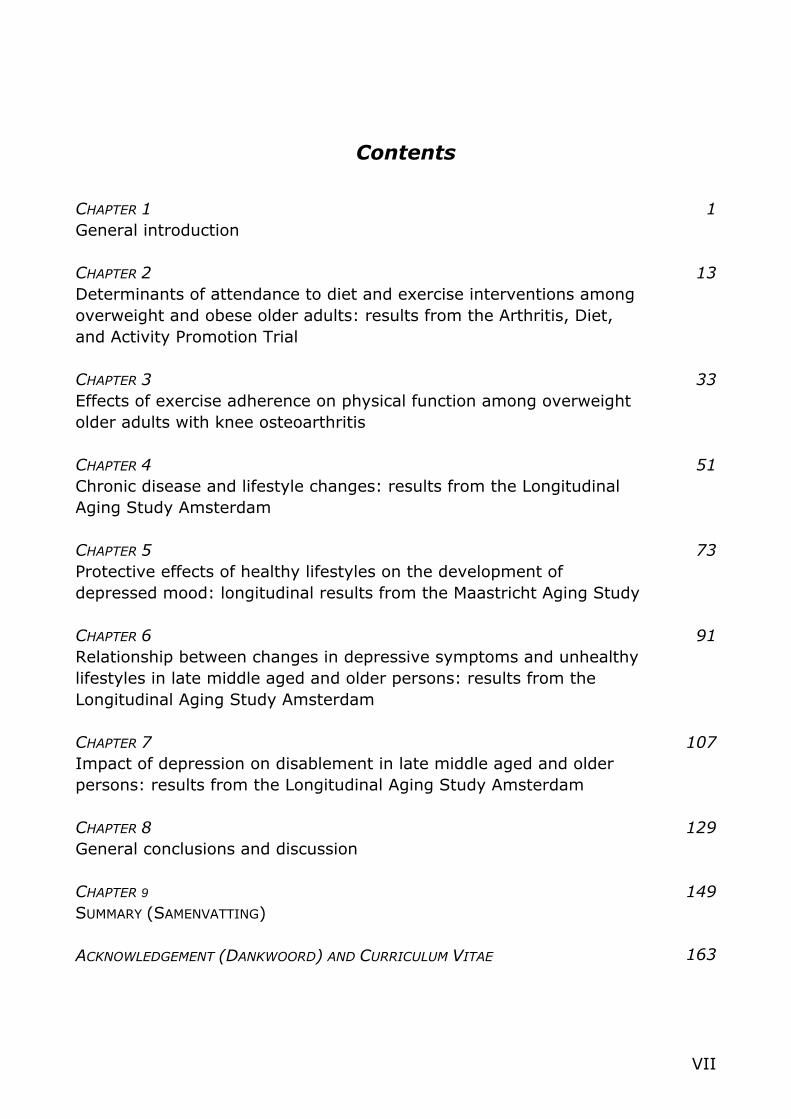
Contents
CHAPTER 1 General introduction CHAPTER 2 Determinants of attendance to diet and exercise interventions among overweight and obese older adults: results from the Arthritis, Diet, and Activity Promotion Trial CHAPTER 3 Effects of exercise adherence on physical function among overweight older adults with knee osteoarthritis CHAPTER 4 Chronic disease and lifestyle changes: results from the Longitudinal Aging Study Amsterdam CHAPTER 5 Protective effects of healthy lifestyles on the development of depressed mood: longitudinal results from the Maastricht Aging Study CHAPTER 6 Relationship between changes in depressive symptoms and unhealthy lifestyles in late middle aged and older persons: results from the Longitudinal Aging Study Amsterdam CHAPTER 7 Impact of depression on disablement in late middle aged and older persons: results from the Longitudinal Aging Study Amsterdam CHAPTER 8 General conclusions and discussion CHAPTER 9 SUMMARY (SAMENVATTING) ACKNOWLEDGEMENT (DANKWOORD) AND CURRICULUM VITAE
1
13
33
51
73
91
107
129
149
163

VIII

1
1 CHAPTER 1
General introduction

2
1 1.1 Determining the framework: the epidemiology of aging
estern society’s industrial revolution had several important
consequences, one of which is still ongoing: the medical revolution.
Inventions, like penicillin, radioactivity, and Röntgen radiation, had the
important consequences that all kinds of life threatening diseases, such as
tuberculosis and poliomyelitis, could be detected earlier, and, eventually, could
be turned from life threatening into recovery or life lasting. Together with
improved sanitary conditions, this has lead to a decrease in infant mortality
and increase in life expectancy, resulting, ultimately, in the proportion of
people aged 65 years and older constituting an increasingly part of populations
in Western society. In the Netherlands, for example, this proportion will have
increased from 7.7% in 1950 to an expected 23.4% in 2040 [1].
The earlier detection of certain diseases in combination with the life
lasting character of diseases (instead of life threatening) also has the
consequence that persons are more likely to be struck by chronic disease as
they age. Therefore, an increasingly great part of the aging population will
spend an increasingly great part of their life with chronic diseases.
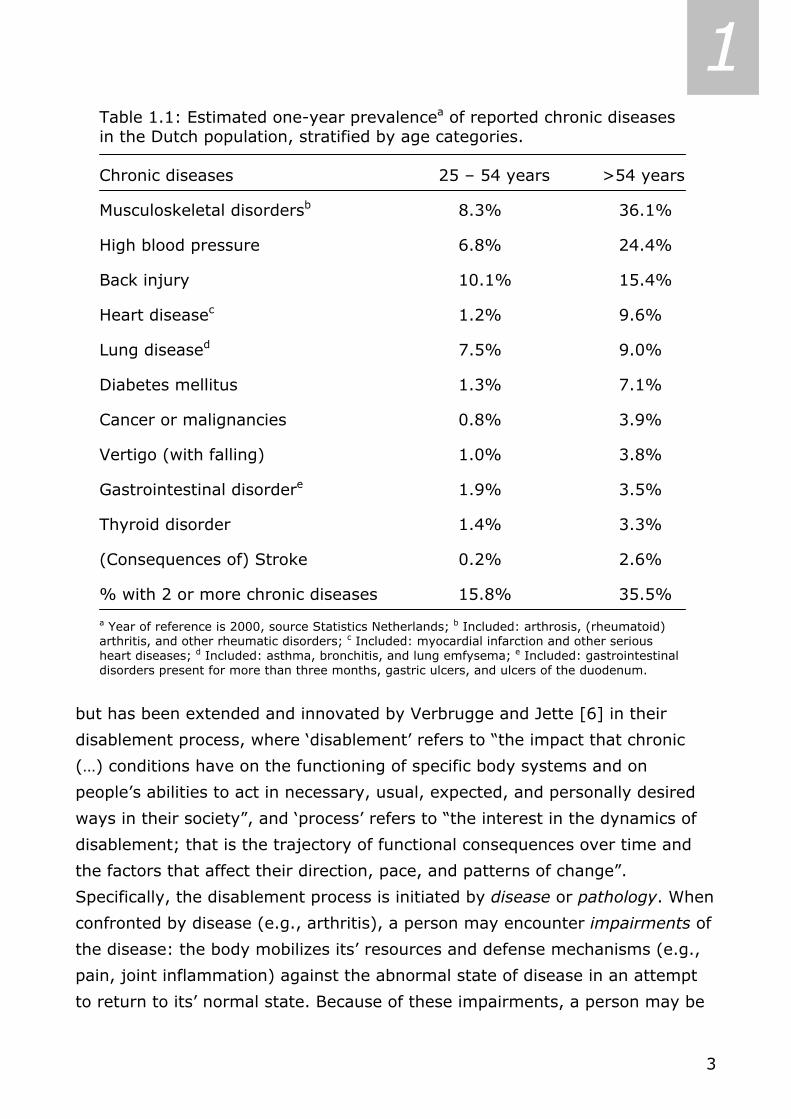
As shown in the table with percentages of reported chronic diseases in
the Dutch population [2], the one-year prevalence of musculoskeletal disorders
in persons aged 25 through 54 years was 8.3%, while the one-year prevalence
in persons aged 55 years and over was 36.1% (Table 1.1). For high blood
pressure the one-year prevalence in persons aged 25 through 54 years is
6.8%, while the one-year prevalence in persons aged 55 years and over is
24.4%. As a last example, only 1.2% of persons aged 25-54 years reported to
have (had) heart disease, while almost 10% of the persons aged 55 years and
over indicated to have (had) a serious heart condition or myocardial infarction.
In the age group 25 through 54 years only 15.8% has two or more chronic
diseases, whereas 35.5% of the age group 55 years and over reported two or
more chronic disease. This suggests not only that aging is associated with an
increased risk of being struck by chronic diseases, but also that being struck by
chronic disease is associated with an increased risk of more chronic conditions.
Being struck by a chronic disease can be the start of a natural sequence
of events that occurs as a consequence of disease and that culminates in
disability [3]. This disease-disability pathway has been described before [4,5],
W
3
1 Table 1.1: Estimated one-year prevalencea of reported chronic diseases in the Dutch population, stratified by age categories. Chronic diseases 25 – 54 years >54 years
Musculoskeletal disordersb 8.3% 36.1%
High blood pressure 6.8% 24.4%
Back injury 10.1% 15.4%
Heart diseasec 1.2% 9.6%
Lung diseased 7.5% 9.0%
Diabetes mellitus 1.3% 7.1%
Cancer or malignancies 0.8% 3.9%
Vertigo (with falling) 1.0% 3.8%
Gastrointestinal disordere 1.9% 3.5%
Thyroid disorder 1.4% 3.3%
(Consequences of) Stroke 0.2% 2.6%
% with 2 or more chronic diseases 15.8% 35.5%
a Year of reference is 2000, source Statistics Netherlands; b Included: arthrosis, (rheumatoid) arthritis, and other rheumatic disorders; c Included: myocardial infarction and other serious heart diseases; d Included: asthma, bronchitis, and lung emfysema; e Included: gastrointestinal disorders present for more than three months, gastric ulcers, and ulcers of the duodenum.
but has been extended and innovated by Verbrugge and Jette [6] in their
disablement process, where ‘disablement’ refers to “the impact that chronic
(…) conditions have on the functioning of specific body systems and on
people’s abilities to act in necessary, usual, expected, and personally desired
ways in their society”, and ‘process’ refers to “the interest in the dynamics of
disablement; that is the trajectory of functional consequences over time and
the factors that affect their direction, pace, and patterns of change”.
Specifically, the disablement process is initiated by disease or pathology. When
confronted by disease (e.g., arthritis), a person may encounter impairments of
the disease: the body mobilizes its’ resources and defense mechanisms (e.g.,
pain, joint inflammation) against the abnormal state of disease in an attempt
to return to its’ normal state. Because of these impairments, a person may be

4
1 limited functionally in performing routine tasks in a usual way (e.g., difficulty
in grasping and rotating fixed objects). The persistent functional limitation in
routine tasks can cause a person to be no longer able to adequately perform a
functional or social role, and can qualify a person as disabled. For example, no
longer being able to turn on a water faucet hinders the role of self-care.
The pathway from disease to disability is not inexorable [7]. Each of the
steps in the disablement process can be modified by predisposing risk factors
(present before disease manifestation: e.g., biological, lifestyle, demographic
factors, socioeconomic status), extra-individual factors (e.g., health insurance,
surgery, medication), and intra-individual factors (e.g., coping style, lifestyle
changes, symptoms of depression).
Traditionally, medicine used to focus on causes of diseases, and reducing
incidence of diseases by eradicating etiologic factors (primary prevention).
However, as medicine is being confronted with an increasingly great part of the
aging population spending an increasingly great part of their life with more
chronic diseases, the need arises for reducing chronic disease burden by early
detection and effective initial treatment (secondary prevention). As there is no
cure (yet) for chronic diseases, tertiary prevention, aimed at preventing
additional morbidity as a consequence of initial chronic disease, seems the
strategy indicated to follow in order to add life to years of older people, instead
of only years to life [6,8,9]. An example of tertiary prevention is promoting
healthy lifestyles, such as giving up smoking, moderate alcohol intake, being
physically active for at least 30 minutes per day on average, and following a
well-balanced diet.
So, gradually, a different way of thinking is noticeable in medicine
regarding chronic diseases. Whereas medicine traditionally was focused on
preventing or eliminating causes of each disease (model of primary causality),
nowadays the focus is on the model of circular causality, in which causes and
consequences of diseases are difficult to distinguish: the consequences of the
one disease may be the cause of another disease, the consequences of which
may be the cause of yet another disease, and so on… Effective tertiary
prevention of chronic diseases should foremost aim at assessing all aspects of
chronic disease. Which chronic diseases are more common? What kind of
comorbid conditions can be distinguished? The epidemiology of aging tries to

5
1 explore what diseases become more prevalent as people age, what
determinants are facilitating for being struck by diseases typical of old age,
and what factors are protective for being struck by these diseases. Knowing
this, tertiary prevention of chronic diseases can then investigate possibilities to
intervene on this negative circular chain, and prevent or diminish negative
consequences of disease in terms of impairments, limitations, or even disability
[10].
1.2 Associations between chronic disease, depression, and
health behavior Chronic diseases differ greatly regarding onset (acute vs. gradual), course
(progressive decline vs. constant or episodic), functional incapacitation
(disabling vs. no incapacitation), prognosis (fatal or life-threatening vs.
recovery or life lasting), and illness controllability (low vs. high; [11]). As
described before, aging is associated with an increased risk of all kinds of
potentially disabling chronic diseases. Chronic diseases not only negatively
influence physical functioning, but can also have an unfavorable influence on
(symptoms of) depression [12]. Depression, in its’ turn, can provoke (or
worsen the course of) chronic disease [13,14]. In both cross-sectional and
longitudinal studies, people with specific diseases reported more symptoms of
depression, as compared to those without chronic diseases [15-19]. Moreover,
a higher number of chronic diseases is strongly associated with more
depressive symptomatology [20,21]. Bearing in mind the earlier mentioned
higher numbers of chronic diseases in older people, this places persons of 55
years and over at increased risk of more symptoms of depression related to
chronic diseases.
There are several possible mechanisms to explain the association
frequently found between chronic diseases and depression. First, structural or
neurochemical changes of the brain, or immune system deficiencies may be
the cause of depression [18,22]. Second, psychosocial consequences of the
disease, such as decreased quality of life, may lead to depression [23]. There
are also several possible mechanisms through which depression can lead to
chronic diseases. A biological mechanism in the case of heart disease is that
depression goes together with elevated plasma norepinephrine, increased

6
1 heart rate, and reduced heart-rate variability [24,25], ultimately leading to
heart disease. Another mechanism through which depression can lead to
chronic diseases is that more symptoms of depression could lead to an
increase in smoking behavior, an increase in alcohol intake, and a decrease in
physical activity, and less adherence to medical regimen. These unhealthy
behaviors are well known risk factors for chronic disease incidence or
worsening [26,27]. Finally, both chronic disease and depression could well be
symptoms of mutually shared underlying latent pathology or disease [28], as
for example too high levels of the thyroid hormone thyroxine and symptoms of
depression are both symptoms of hyperthyroid disorder. Ultimately, one can
say that the mechanisms of chronic disease causing depression and the
mechanisms of depression causing or worsening chronic disease seem to
increase the risk of each other over time.
Chronic diseases and health behavior, which we defined in our study as
smoking behavior, alcohol intake, physical activity, body composition, and the
extent to which people adhere to health advice or medication (regimen
adherence) are unmistakably intertwined. Chronic disease incidence, for
example arthritis, may cause a physically active person to transcend to an
unhealthy sedentary lifestyle, as the pain of his or her condition is too much of
an impediment in being physically active. Also, healthy lifestyle changes may
be indicated to prevent chronic disease incidence or worsening [29]. Chronic
disease prevention is a good example of how changing lifestyles (e.g., quit
smoking) or enhancing regimen adherence (e.g., attending smoking cessation
classes) can contribute to the prevention of chronic disease incidence or
worsening (preventing myocardial infarction incidence, or preventing
atherosclerosis from worsening).
There are a number of studies available that have examined the
association between depression and unhealthy lifestyles, particularly in older
people. It seems that depressed persons are more likely than non-depressed
persons to engage in unhealthy lifestyles, such as smoking, excessive alcohol
intake, physical inactivity, unhealthy eating habits, and intervention non-
compliance [30-32]. About the effect of health behavior on depression, it can
be said that regular physical activity was protective for both prevalent as well
as incident depression [33]. Also, in a prospective study physical inactivity was

7
1 found to be a risk factor for symptoms of depression [34]. Regarding the other
health behavior concepts and their association with depression: nicotine
dependent as to non-nicotine dependent, but also smokers as to non-smokers
had higher depression scores [35,36]; alcoholics as to non-alcoholics were at
higher risk of depression, whereas non-alcoholics experienced mood-enhancing
effects when using alcohol [37]; and being extremely obese was associated
with the increased risk for depression [38].
1.3 Study objectives The primary objective of this study is to gain more insight into the reciprocal
associations between depression, health behavior, and the course of chronic
disease among late middle aged and older persons, as depicted in the
conceptual model (Figure 1.1). In order to attain this primary objective, the
data of three different longitudinal studies were made available to us, with
which specific research questions will be answered. The Arthritis, Diet, and
Activity Promotion Trial (ADAPT) is a randomized controlled trial that compared
effectiveness of three interventions with a control group on physical function of
316 overweight and obese older adults with knee OA, carried out by Wake
Forest University in Winston-Salem (NC, United States). The Longitudinal
Aging Study Amsterdam (LASA) is an ongoing, population-based cohort-study
on predictors and consequences of changes in well-being and autonomy among
3107 late middle- and older aged adults, carried out by the Vrije Universiteit of
Amsterdam. Finally, the Maastricht Aging Study (MAAS) is an ongoing,
Note: The numbered arrows in the figure refer to the different chapters in this dissertation
Figure 1.1: Conceptual model of our study COURSE OF CHRONIC DISEASE 7 2 & 4 3
2 & 6 2 LIFESTYLE REGIMEN ADHERENCE
DEPRESSION 5 HEALTH BEHAVIOR
8
1 population-based cohort-study on determinants of successful (cognitive) aging
among 3449 adults, aged between 24 and 81 years, and carried out by the
Universiteit Maastricht.
Specifically, our research questions – which correspond both with the
respective numbered arrows in the conceptual model and with the chapter
numbers in this dissertation – are:
2) What determinants predict high and low intervention adherence to an
18-month intervention program in the Arthritis, Diet, and Activity Promotion
Trial? In this study we examined whether determinants from the domains of
chronic disease, lifestyle, and mental health, amongst others, could predict the
extent of attendance to intervention sessions among older respondents with
knee osteoarthritis;
3) Is exercise adherence to an 18-month intervention program associated
with improvements in physical function in the Arthritis, Diet, and Activity
Promotion Trial? In this study we examined whether the extent of attendance
to intervention sessions was predictive of improvements in physical function
and self-reported disability among older respondents with knee osteoarthritis;
4) Is chronic disease status associated with changes in unhealthy lifestyle in
the Longitudinal Aging Study Amsterdam? In this study we analyzed whether
lifestyle patterns changed during a six-year period, and whether these changes
were different among specific chronic diseases among late middle aged and
older community-dwelling respondents;
5) Are (changes in) lifestyle associated with symptoms of depression in the
Maastricht Aging Study? In this study we analyzed the effect of smoking,
alcohol use, level of physical exercise, and body mass index, and the changes
herein over a six-year period, on subsequent depression among adult
respondents from the general population;
6) Are (changes in) symptoms of depression associated with lifestyle in the
Longitudinal Aging Study Amsterdam? In this study we examined the effect of
being depressed, and changes in being depressed over a six-year period, on
smoking, alcohol use, level of physical exercise, and the changes herein over a
six-year period among late middle aged and older community-dwelling
respondents;
9
1 7) What is the impact of depression on the process of disablement in the
Longitudinal Aging Study Amsterdam? In this study we analyzed whether the
process of disablement could be identified in our sample of late middle aged
and older community-dwelling respondents and whether or not depression
accelerated this process.
Results may provide insights into determinants of the associations
between depression, health behavior, and the course of chronic disease that
are amenable to change, which can potentially be used in intervention
research, and may therefore be relevant for clinical practice. Additionally, the
outcome may contribute to improvements in public health policy and to cost-
effective health care.

10
1 1.4 References 1. Nationaal Kompas Volksgezondheid. Bilthoven: RIVM , 2002.
2. Statistics Netherlands. Reported health and lifestyle. Retrieved June 3, 2004, from
http://statline.cbs.nl/StatWeb/start.asp?lp=Search/Search.
3. Escalante A, Del Rincon I. The disablement process in rheumatoid arthritis. Arthritis Rheum 2002;
47: 333-42.
4. World Health Organization (WHO). International Classification of Impairments, Disabilities, and
Handicaps. Geneva, Switzerland: WHO, 1980.
5. Nagi SZ. Some conceptual issues in disability and rehabilitation. In: Sussman MB, editor. Sociology
and rehabilitation. Washington, D.C: American Sociological Association, 1965: 100-13.
6. Verbrugge LM, Jette AM. The disablement process. Soc Sci Med 1994; 38: 1-14.
7. Guccione AA. Arthritis and the process of disablement. Phys Ther 1994; 74: 408-14.
8. Fries JF. The compression of morbidity: near or far? Milbank Q 1989; 67: 208-32.
9. Spitzer WO. State of science 1986: quality of life and functional status as target variables for
research. J Chronic Dis 1987; 40: 465-71.
10. Wagner EH, Austin BT, Von Korff M. Organizing care for patients. Milbank Q 1996; 74: 511-544.
11. Rolland JS. Chronic illness and the life cycle: a conceptual framework. Fam Process. 1987; 26: 203-
21.
12. Bisschop MI. Psychosocial resources and the consequences of specific chronic diseases in older age:
the Longitudinal Aging Study Amsterdam [dissertation]. Enschede, the Netherlands: Febodruk, 2004.
13. National Academy on an Aging Society. Depression: A treatable disease. Challenges for the 21st
Century: Chronic & Disabling Conditions 9. Retrieved May 31, 2004 from
http://www.agingsociety.org/profiles.
14. Depression Guideline Panel. Depression in primary care, Vol 1. Detection and diagnosis. Clinical
Practice Guideline, Number 5. Rockville, MD: Department of Health and Human Services, Public
Health Service, Agency for Health Care Policy and Research. AHCPR Publication No. 93-0550, 1993.
15. Bisschop MI, Kriegsman DM, Deeg DJ, Beekman AT, van Tilburg W. The longitudinal relation between
chronic diseases and depression in older persons in the community: the Longitudinal Aging Study
Amsterdam. J Clin Epidemiol 2004; 57: 187-94.
16. Borson S, Barnes RA, Kukull WA, Okimoto JT, Veith RC, Inui TS, Carter W, Raskind MA. Symptomatic
depression in elderly medical outpatients. I. Prevalence, demography, and health service utilization. J
Am Geriatr Soc 1986; 34: 341-7.
17. Cassileth BR. Psychosocial problems and support of the advanced cancer patient. Rays 1985; 10:
131-4.
18. Shimoda K, Robinson RG. The relationship between poststroke depression and lesion location in long-
term follow-up. Biol Psychiatry 1999; 45: 187-92.
19. Terry DJ. Stress, coping and coping resources as correlates of adaptation in myocardial infarction
patients. Br J Clin Psychol 1992; 31 (Pt 2): 215-25.
20. Black SA, Goodwin JS, Markides KS. The association between chronic diseases and depressive
symptomatology in older Mexican Americans. J Gerontol A Biol Sci Med Sci 1998; 53: M188-94.
21. Palinkas LA, Wingard DL, Barrett-Connor E. Chronic illness and depressive symptoms in the elderly: a
population-based study. J Clin Epidemiol 1990; 43: 1131-41.
22. Zautra AJ, Burleson MH, Matt KS, Roth S, Burrows L. Interpersonal stress, depression, and disease
activity in rheumatoid arthritis and osteoarthritis patients. Health Psychol 1994; 13: 139-48.
11
1 23. Aneshensel CS, Frerichs RR, Huba GJ. Depression and physical illness: a multiwave, nonrecursive
causal model. J Health Soc Behav 1984; 25: 350-71.
24. Hughes JW, Stoney CM. Depressed mood is related to high-frequency heart rate variability during
stressors. Psychosom Med 2000; 62: 796–803.
25. Pitzalis MV, Iacoviello M, Todarello O, Fioretti A, Guida P, Massari F, Mastropasqua F, Russo GD,
Rizzon P. Depression but not anxiety influences the autonomic control of heart rate after myocardial
infarction. Am Heart J 2001; 141: 765-71.
26. Gohlke H. Lifestyle modification - is it worth it? Herz 2004; 29: 139-44.
27. Meigs JB, Hu FB, Rifai N, Manson JE. Biomarkers of endothelial dysfunction and risk of type 2
diabetes mellitus. JAMA 2004; 291: 1978-86.
28. Penninx BW, Leveille S, Ferrucci L, van Eijk JT, Guralnik JM. Exploring the effect of depression on
physical disability: longitudinal evidence from the established populations for epidemiologic studies of
the elderly. Am J Public Health 1999; 89: 1346-52.
29. Ellingsen I, Hjermann I, Abdelnoor M, Hjerkinn EM, Tonstad S. Dietary and antismoking advice and
ischemic heart disease mortality in men with normal or high fasting triacylglycerol concentrations: a
23-y follow-up study. Am J Clin Nutr 2003; 78: 935-40.
30. Aneshensel CS, Huba GJ. Depression, alcohol use, and smoking over one year: a four-wave
longitudinal causal model. J Abnorm Psychol 1983; 92: 134-50.
31. Stephens T. Physical activity and mental health in the United States and Canada: evidence from four
population surveys. Prev Med 1988; 17: 35-47.
32. Slymen DJ, Drew JA, Elder JP, Williams SJ. Determinants of non-compliance and attrition in the
elderly. Int J Epidemiol 1996; 25: 411-9.
33. Strawbridge WJ, Deleger S, Roberts RE, Kaplan GA. Physical activity reduces the risk of subsequent
depression for older adults. Am J Epidemiol 2002; 156: 328-34.
34. Farmer ME, Locke BZ, Moscicki EK, Dannenberg AL, Larson DB, Radloff LS. Physical activity and
depressive symptoms: the NHANES I Epidemiologic Follow-up Study. Am J Epidemiol 1988; 128:
1340-51.
35. John U, Meyer C, Rumpf HJ, Hapke U. Depressive disorders are related to nicotine dependence in the
population but do not necessarily hamper smoking cessation. J Clin Psychiatry 2004; 65: 169-76.
36. Daniel M, Cargo MD, Lifshay J, Green LW.Cigarette smoking, mental health and social support: data
from a northwestern First Nation. Can J Public Health 2004; 95: 45-9.
37. Freed EX. Alcohol and mood: an updated review. Int J Addict 1978; 13: 173-200.
38. Dong C, Sanchez LE, Price RA.Relationship of obesity to depression: a family-based study. Int J Obes
Relat Metab Disord 2004; 28: 790-5.

12
1
13
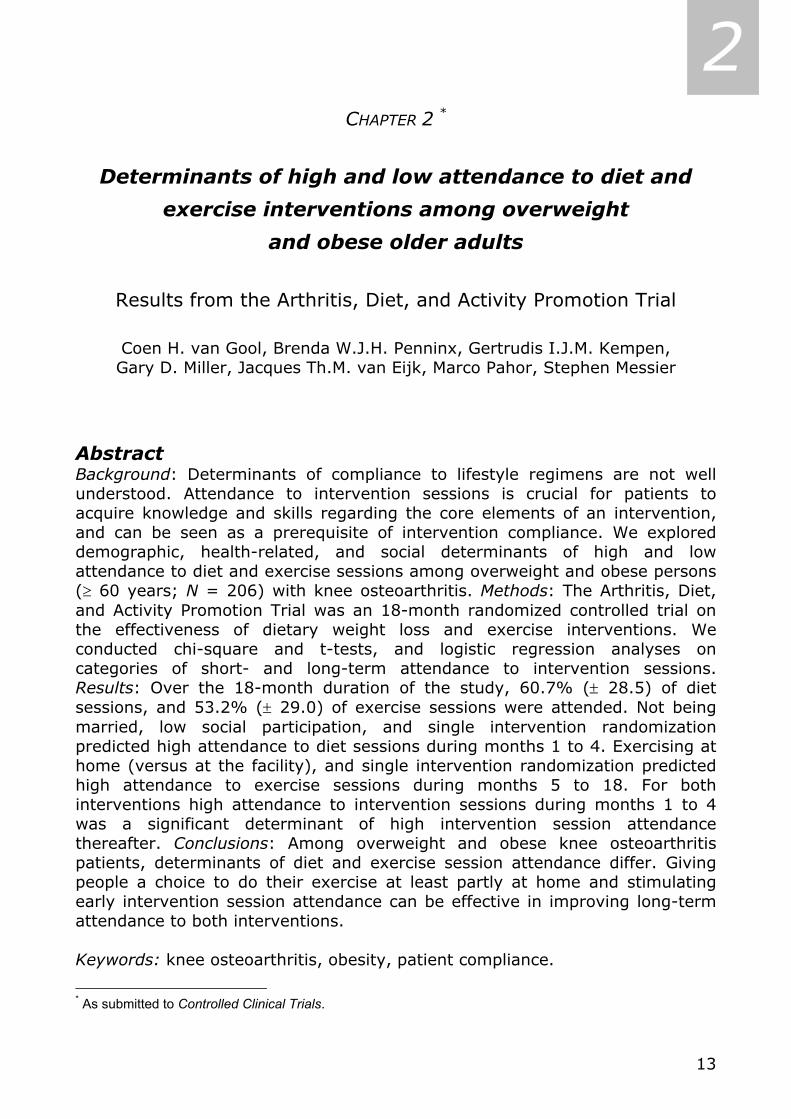
2 CHAPTER 2 *
Determinants of high and low attendance to diet and
exercise interventions among overweight
and obese older adults
Results from the Arthritis, Diet, and Activity Promotion Trial
Coen H. van Gool, Brenda W.J.H. Penninx, Gertrudis I.J.M. Kempen, Gary D. Miller, Jacques Th.M. van Eijk, Marco Pahor, Stephen Messier
Abstract Background: Determinants of compliance to lifestyle regimens are not well understood. Attendance to intervention sessions is crucial for patients to acquire knowledge and skills regarding the core elements of an intervention, and can be seen as a prerequisite of intervention compliance. We explored demographic, health-related, and social determinants of high and low attendance to diet and exercise sessions among overweight and obese persons (≥ 60 years; N = 206) with knee osteoarthritis. Methods: The Arthritis, Diet, and Activity Promotion Trial was an 18-month randomized controlled trial on the effectiveness of dietary weight loss and exercise interventions. We conducted chi-square and t-tests, and logistic regression analyses on categories of short- and long-term attendance to intervention sessions. Results: Over the 18-month duration of the study, 60.7% (± 28.5) of diet sessions, and 53.2% (± 29.0) of exercise sessions were attended. Not being married, low social participation, and single intervention randomization predicted high attendance to diet sessions during months 1 to 4. Exercising at home (versus at the facility), and single intervention randomization predicted high attendance to exercise sessions during months 5 to 18. For both interventions high attendance to intervention sessions during months 1 to 4 was a significant determinant of high intervention session attendance thereafter. Conclusions: Among overweight and obese knee osteoarthritis patients, determinants of diet and exercise session attendance differ. Giving people a choice to do their exercise at least partly at home and stimulating early intervention session attendance can be effective in improving long-term attendance to both interventions. Keywords: knee osteoarthritis, obesity, patient compliance.
* As submitted to Controlled Clinical Trials.
14
2 2.1 Introduction
nee osteoarthritis (OA) is a leading cause of decreasing physical function
among older adults [1-3], which ultimately may limit a person's
independence of living. Study outcomes have prompted the American College
of Rheumatology to recommend weight loss and exercise for obese patients
with knee OA [4]. There is evidence that obesity is strongly associated with
knee OA [5-7], and that weight loss may prevent the worsening of this
degenerative joint disease [8]. Exercise programs have demonstrated
improvements in mobility among patients with knee OA [5,9-11]. However,
success of efforts for pain relief and improvement of clinical outcomes in
patients with OA is largely dependent on intervention compliance [12].
Attendance to intervention sessions is crucial for patients to acquire knowledge
and skills regarding the core elements of an intervention. Hence, attendance to
intervention sessions can be seen as an important prerequisite of intervention
compliance.
Recent reviews on physical activity interventions identify advanced age,
female gender, low educational level, smoking, being overweight, low social
support and medical concerns as determinants of poor intervention session
attendance [13-16]. However, as these determinants were derived from
studies using short-term interventions and short follow-up durations in young
and healthy samples, it remains unclear whether these determinants apply to
older, more diseased persons. Determinants of attendance to diet intervention
sessions are less well studied [17-19]. To our knowledge, no study has
examined the impact of the same set of determinants on both diet and
exercise session attendance.
We explored determinants of high and low attendance to an 18-month
dietary weight loss and an 18-month exercise intervention. We selected a
broad range of determinants – demographics, health-related, and social
variables – since it has been indicated by previous research that all of these
domains may be important for intervention session attendance [14,15].
Understanding determinants of high and low diet and exercise session
attendance may be helpful to tailor future therapies to maximize intervention
session attendance among overweight and obese older people with knee OA,
which is pivotal in developing effective interventions [16,20-22].
K
15
2 2.2 Methods Design
The Arthritis, Diet, and Activity Promotion Trial (ADAPT) was a randomized
controlled trial to compare effectiveness of three 18-months interventions – a
dietary weight loss program (WL), an exercise program (EX), and a dietary
weight loss plus exercise program (WL+EX) – with a healthy lifestyle control
group on physical function of overweight and obese adults with knee OA. Main
study findings indicated that especially participants in the WL+EX program
improved their physical function and health-related quality of life over time.
Detailed information on all interventions as well as sampling and data-
collection procedures, and main study outcomes can be found elsewhere [23-
25]. The current study reports on determinants of high and low attendance to
sessions of the intervention programs.
Study sample and Intervention
Inclusion criteria for study participation were: 1) age ≥ 60 years; 2) body mass
index (BMI) ≥ 28 kg/m2; 3) knee pain on most of the days; 4) sedentary
activity pattern for the past 6 months with less than 20 minutes of formal
exercise once a week; 5) self-reported difficulty ascribed to knee pain in at
least one activity of daily living; and 6) radiographic evidence of tibia-femoral
OA. Potential participants were excluded if they: 1) had a serious medical
condition that prevented safe participation in the exercise intervention
program; 2) had a mini-mental state examination (MMSE [26]) score ≤ 23; 3)
could not finish the 18 month trial due to severe psychiatric morbidity or
terminal illness; or 4) were unable to walk without an assistive device. After
pre-screening 2,209 persons, written informed consent was obtained from 316
participants. They were randomly assigned to one of four study groups: 82 in
the WL intervention, 80 in the EX intervention, 76 in the WL+EX intervention,
and 78 in the healthy lifestyle control group. Since we wanted to explore
determinants of intervention session attendance, only the three intervention
groups (N = 238) were included in our secondary data analyses. The study
was conducted at the Claude D. Pepper Older Americans Independence center
of Wake Forest University with the approval of the institutional review board.
Participant progress during the study is depicted in Figure 2.1.

16
2 Figure 2.1: Flowchart of participant progress in ADAPT study.
Intervention session Intervention session Number of participants in each participation at Loss to follow-up participation at intervention at the end of the
Interventions: baseline: during intervention period: follow-up: study with valid measurements:
Weight loss program (WL)
(n=82)
Weight loss + Exercise program (WL+EX) (n=76)
Control group(n=78)
Diet sessions(n=158)
Exercise sessions (n=156)
Control group healthy lifestyle
education (n=78)
Exercise program (EX)
(n=80)
Diet sessions(n=137)
Exercise sessions (n=133)
WL program(n=73)
WL+EX program(n=64)
Control group(n=73)
EX program(n=69)
Control group healthy lifestyle
education (n=73)
WL+EX program (n=12)
WL program (n=9)
EX program (n=11)
Control group (n=5)
Ineligible(n=1569
Tota
l per
sons
pre
-scr
eene
d (n
=220
9)
Ran
dom
ized
(n=3
16)
Declined (n=297)
The goal of the WL program was to achieve and maintain an average
weight loss of 5% during 18 months. This was done through diet sessions.
During the first four months (initiation phase) an individual introductory
session was followed by 16 weekly sessions in a 1:3 ratio of individual versus
group sessions. The transition and maintenance phase (maintenance phase;
months 5 to 18) started with one individual and three group sessions bi-weekly
over an eight-week period. Hereafter, meetings were held monthly, also in a
1:3 ratio of individual versus group contact, followed by telephone contacts,
initiated by a study interviewer, two weeks after the meeting.
The EX program intended to expand aerobic and resistance-training
capacities. The three days per week exercise program -the exercise sessions-
consisted of two 15 minutes aerobics phases, during which participants walked
within a range of 50-75% of their heart rate reserve, and were separated by a
15 minutes resistance-training phase, which consisted of two sets of 12
repetitions of the following exercises: leg extension, leg curl, heel raise, and
step up. Ankle cuff weights and weighted vests provided resistance. Fifteen
minutes of cooling down ended each session. The initiation phase was held at
the facility. In the maintenance phase participants could either choose to
exercise at home, exercise in a facility-based program, or in a combined
facility-home-based program. Those who had opted for the (combined) home-
based program were expected to exercise as much as the facility-based
participants – 60 minutes, three days a week – and had to keep daily exercise
logs, in which they were asked to carefully report on exercise frequency,
duration, and achieved heart rate.
Participants in the WL+EX program underwent an exact combination of
the aforementioned WL and EX interventions. During the first four months diet
17
2 sessions and exercise sessions were done consecutively and on the same day.
Transportation to intervention sessions, and to baseline, six-, and 18-months
post-randomization assessment visits was provided for all participants when
needed. Intervention participation was stimulated by reminder telephone calls.
Additionally, if participants did not show-up at intervention sessions, they were
contacted by telephone as well.
Measurements
Outcome measures
We assessed diet session attendance by dividing the number of times
participants actually attended diet sessions or responded (telephone contact),
by the number of sessions participants were asked to attend, or number of
times participants were asked to respond, multiplied by 100%. Exercise
session attendance was measured by dividing the number of exercise sessions
participants actually attended or exercised at home (exercise log) by the
number of sessions participants were asked to attend or exercise at home,
multiplied by 100%. As we used a different time frame in our analyses and
included a different number of participants in our sample than the main study
outcome paper did, intervention session attendance percentages may differ
across studies [24].
Since determinants of session attendance early in the intervention may
differ from those later on in the intervention [20], we distinguished between
initiation phase and maintenance phase in the analyses. Preliminary analyses
indicated that both diet session attendance and exercise session attendance
were not distributed normally. Therefore, we created four dichotomous
outcome variables in which both initiation phase and maintenance phase
session attendance were divided at median value into two approximately
equally large categories, labeled low and high diet and exercise session
attendance, respectively.
Determinants
Age, gender, marital status, years of education, and ethnicity were self-
reported at baseline. Participants’ self-reported medical histories at baseline
assessed presence of arthritis in other sites of their bodies (yes/no), and

18
2 presence of the following chronic diseases (yes/no): cardiovascular disease
(CVD), cancer, diabetes, and lung disease. Study staff recorded participants’
weight in kilograms and height in meters at the facility, with which baseline
BMI was calculated. Baseline self-reported physical function was measured
with the Western Ontario and McMaster Universities Osteoarthritis Index
(WOMAC) [27] and consisted of three sub scales: a) Function: difficulty
performing activities of daily living, b) Pain: pain experienced due to arthritis,
and c) Stiffness: severity of experienced stiffness. Three separate scale scores
were used in the analyses, with high scores indicating, respectively, more
difficulty, more pain, and more stiffness. The MMSE, administered by study
staff, was used to assess cognitive function at baseline [26]. Since we used a
MMSE score ≤ 23 as an exclusion criterion, MMSE scores ranged from 24 to 30
(mildly impaired to good cognitive function, respectively). At baseline,
participants were encouraged to complete a 6-minute walk test as quickly as
possible without wearing a watch [28], from which walking speed in meters
per second was derived. Participants were asked about their baseline smoking
status (yes/no) and alcohol consumption (yes/no). We used the baseline
Mental Health (5 items) and Social Functioning (2 items) scales of the Short
Form 36 Quality of Life Health Survey (SF-36), which assess, respectively,
participants’ perceptions of their mental health and social functioning [29].
Baseline social support was assessed by the Medical Outcomes Study Social
Support Survey [30]. Scores on these three scales ranged from 0 to 100. As a
measure of social participation we used participants’ baseline responses to 4
questions whether they were a member of any religious community (yes/no),
any organized club (yes/no), social organization (yes/no), and the frequency of
attendance to these (never or almost never/once or twice a year/once a
month/once a week/more than once a week). The sum score ranged from 2 to
12, with high scores indicating higher social participation.
As attendance of intervention sessions is not stable over time, we considered
percentage session attendance in the initiation phase to be a potential
determinant of attendance to intervention sessions in the maintenance phase.
Intervention randomization - i.e. being allocated to a single versus a combined
intervention - was considered to be a potential determinant of attendance to
intervention sessions. Finally, since participants in the EX and WL+EX

19
2 intervention could choose their location of exercise after the initiation phase (at
least partly at home versus at the facility), it was considered a potential
determinant of exercise session attendance.
Statistical analyses
After descriptive analyses at baseline, we conducted chi-square and t-tests,
and multivariate logistic regression analyses, with determinants of attendance
as independent variable and dichotomous categories of session attendance as
dependent variables, with odds ratios (OR’s) and 95% confidence intervals
(95%CI). Chi-square and t-tests identified relevant determinants. Statistical
significance of p ≤ .15 in univariate analyses was used as criterion for inclusion
in additional multivariate analyses, which identified unique contributions of
those determinants.
2.3 Results Follow-up data on intervention outcome measurements of 32 of the
participants (N = 238) were unavailable due to illness incidence, refusal, or
moving out of the region. A chi-square test showed that non-respondents were
divided evenly over intervention groups (p = .67). We included 73 out of 82
(89.0%) participants who were randomized into the WL intervention, 69 out of
80 (86.3%) who were randomized into the EX intervention, and 64 out of 76
(84.2%) who were randomized into the WL+EX intervention (N = 206). Chi-
square and t-tests showed that intervention groups did not differ significantly
on any of the baseline variables. Participants’ mean age was 68.3 years (SD =
6.1), 25.7% were male, 59.3% were married, 27.7% had an education of 12
years or less, and the 26.6% non-white ethnicity consisted of 26.1% African-
American and 0.5% Hispanic participants. Mean percentage attendance to diet
sessions over the 18-month duration was 60.7% (± 28.5). The initiation phase
of the diet sessions was inclined to be attended better by the WL intervention
group than by the WL+EX intervention group (72.8% vs. 63.9%; p = .07),
whereas there was no significant difference in attendance in the maintenance
phase of the diet sessions (55.2% vs. 48.9%; p = .26). Overall attendance to
diet sessions (N = 137) decreased over time from 68.6% (± 28.5) in the first
four months of the study to 52.3% (± 31.9) in the last 14 months of the study.
20
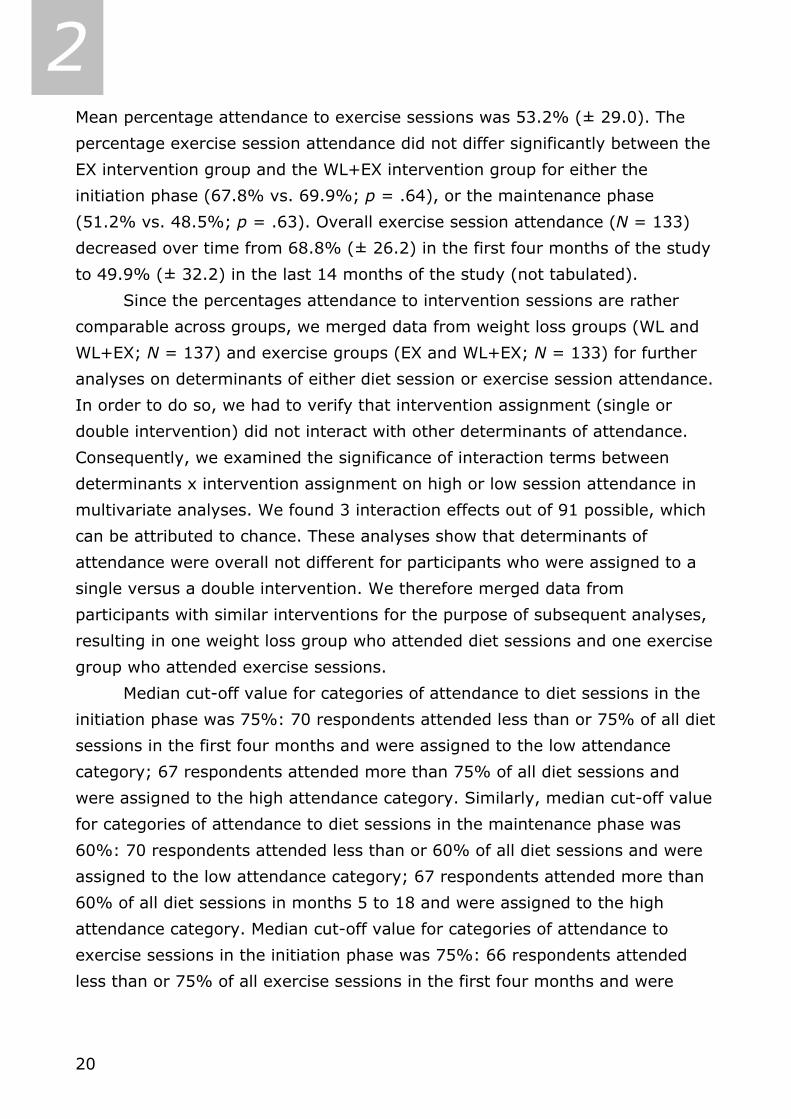
2 Mean percentage attendance to exercise sessions was 53.2% (± 29.0). The
percentage exercise session attendance did not differ significantly between the
EX intervention group and the WL+EX intervention group for either the
initiation phase (67.8% vs. 69.9%; p = .64), or the maintenance phase
(51.2% vs. 48.5%; p = .63). Overall exercise session attendance (N = 133)
decreased over time from 68.8% (± 26.2) in the first four months of the study
to 49.9% (± 32.2) in the last 14 months of the study (not tabulated).
Since the percentages attendance to intervention sessions are rather
comparable across groups, we merged data from weight loss groups (WL and
WL+EX; N = 137) and exercise groups (EX and WL+EX; N = 133) for further
analyses on determinants of either diet session or exercise session attendance.
In order to do so, we had to verify that intervention assignment (single or
double intervention) did not interact with other determinants of attendance.
Consequently, we examined the significance of interaction terms between
determinants x intervention assignment on high or low session attendance in
multivariate analyses. We found 3 interaction effects out of 91 possible, which
can be attributed to chance. These analyses show that determinants of
attendance were overall not different for participants who were assigned to a
single versus a double intervention. We therefore merged data from
participants with similar interventions for the purpose of subsequent analyses,
resulting in one weight loss group who attended diet sessions and one exercise
group who attended exercise sessions.
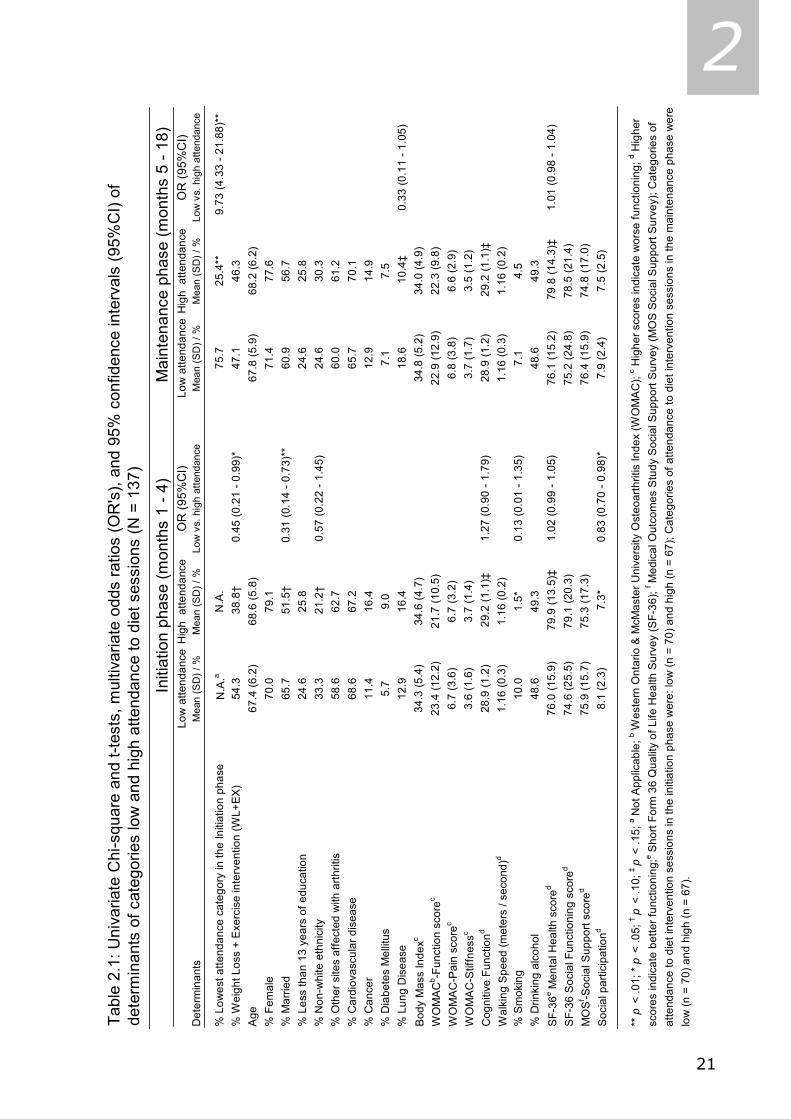
Median cut-off value for categories of attendance to diet sessions in the
initiation phase was 75%: 70 respondents attended less than or 75% of all diet
sessions in the first four months and were assigned to the low attendance
category; 67 respondents attended more than 75% of all diet sessions and
were assigned to the high attendance category. Similarly, median cut-off value
for categories of attendance to diet sessions in the maintenance phase was
60%: 70 respondents attended less than or 60% of all diet sessions and were
assigned to the low attendance category; 67 respondents attended more than
60% of all diet sessions in months 5 to 18 and were assigned to the high
attendance category. Median cut-off value for categories of attendance to
exercise sessions in the initiation phase was 75%: 66 respondents attended
less than or 75% of all exercise sessions in the first four months and were
21
2
Tabl
e 2.
1: U
niva
riate
Chi
-squ
are
and
t-tes
ts, m
ultiv
aria
te o
dds
ratio
s (O
R's
), an
d 95
% c
onfid
ence
inte
rval
s (9
5%C
I) of
de
term
inan
ts o
f cat
egor
ies
low
and
hig
h at
tend
ance
to d
iet s
essi
ons
(N =
137
)
Low
atte
ndan
ceH
igh
atte
ndan
ceO
R (9
5%C
I)Lo
w a
ttend
ance
Hig
h a
ttend
ance
OR
(95%
CI)
Det
erm
inan
tsM
ean
(SD
) / %
Mea
n (S
D) /
%Lo
w v
s. h
igh
atte
ndan
ceM
ean
(SD
) / %
Mea
n (S
D) /
%Lo
w v
s. h
igh
atte
ndan
ce
% L
owes
t atte
ndan
ce c
ateg
ory
in th
e In
itiat
ion
phas
e N
.A.a
N.A
.75
.725
.4**
9.7
3 (4
.33
- 21.
88)*
*%
Wei
ght L
oss
+ E
xerc
ise
inte
rven
tion
(WL+
EX
)54
.3 3
8.8†
0.4
5 (0
.21
- 0.9
9)*
47.1
46.3
Age
67.4
(6.2
)68
.6 (5
.8)
67.8
(5.9
)68
.2 (6
.2)
% F
emal
e70
.079
.171
.477
.6%
Mar
ried
65.7
51.
5† 0
.31
(0.1
4 - 0
.73)
**60
.956
.7%
Les
s th
an 1
3 ye
ars
of e
duca
tion
24.6
25.8
24.6
25.8
% N
on-w
hite
eth
nici
ty33
.3 2
1.2†
0.57
(0.2
2 - 1
.45)
24.6
30.3
% O
ther
site
s af
fect
ed w
ith a
rthrit
is58
.662
.760
.061
.2%
Car
diov
ascu
lar d
isea
se68
.667
.265
.770
.1%
Can
cer
11.4
16.4
12.9
14.9
% D
iabe
tes
Mel
litus
5.7
9.0
7.1
7.5
% L
ung
Dis
ease
12.9
16.4
18.6
10.
4‡0.
33 (0
.11
- 1.0
5)B
ody
Mas
s In
dexc
34.3
(5.4
)34
.6 (4
.7)
34.8
(5.2
)34
.0 (4
.9)
WO
MA
Cb -F
unct
ion
scor
ec23
.4 (1
2.2)
21.7
(10.
5)22
.9 (1
2.9)
22.3
(9.8
)W
OM
AC
-Pai
n sc
orec
6.7
(3.6
)6.
7 (3
.2)
6.8
(3.8
)6.
6 (2
.9)
WO
MA
C-S
tiffn
essc
3.6
(1.6
)3.
7 (1
.4)
3.7
(1.7
)3.
5 (1
.2)
Cog
nitiv
e Fu
nctio
nd 28
.9 (1
.2)
29.
2 (1
.1)‡
1.27
(0.9
0 - 1
.79)
28.9
(1.2
) 2
9.2
(1.1
)‡W
alki
ng S
peed
(met
ers
/ sec
ond)
d1.
16 (0
.3)
1.16
(0.2
)1.
16 (0
.3)
1.16
(0.2
)%
Sm
okin
g10
.01.
5*0.
13 (0
.01
- 1.3
5)7.
14.
5%
Drin
king
alc
ohol
48.6
49.3
48.6
49.3
SF-
36e M
enta
l Hea
lth s
core
d76
.0 (1
5.9)
79.
9 (1
3.5)
‡1.
02 (0
.99
- 1.0
5)76
.1 (1
5.2)
79.
8 (1
4.3)
‡1.
01 (0
.98
- 1.0
4)S
F-36
Soc
ial F
unct
ioni
ng s
core
d74
.6 (2
5.5)
79.1
(20.
3)75
.2 (2
4.8)
78.5
(21.
4)M
OS
f -Soc
ial S
uppo
rt sc
ored
75.9
(15.
7)75
.3 (1
7.3)
76.4
(15.
9)74
.8 (1
7.0)
Soc
ial p
artic
ipat
iond
8.1
(2.3
) 7
.3*
0.8
3 (0
.70
- 0.9
8)*
7.9
(2.4
)7.
5 (2
.5)
atte
ndan
ce to
die
t int
erve
ntio
n se
ssio
ns in
the
initi
atio
n ph
ase
wer
e: lo
w (n
= 7
0) a
nd h
igh
(n =
67)
; Cat
egor
ies
of a
ttend
ance
to d
iet i
nter
vent
ion
sess
ions
in th
e m
aint
enan
ce p
hase
wer
e
Initi
atio
n ph
ase
(mon
ths
1 - 4
)M
aint
enan
ce p
hase
(mon
ths
5 - 1
8)
** p
< .0
1; *
p <
.05;
† p
< .1
0; ‡
p <
.15;
a Not
App
licab
le; b W
este
rn O
ntar
io &
McM
aste
r Uni
vers
ity O
steo
arth
ritis
Inde
x (W
OM
AC
); c H
ighe
r sco
res
indi
cate
wor
se fu
nctio
ning
; d Hig
her
low
(n =
70)
and
hig
h (n
= 6
7).
scor
es in
dica
te b
ette
r fun
ctio
ning
;e Sho
rt Fo
rm 3
6 Q
ualit
y of
Life
Hea
lth S
urve
y (S
F-36
); f M
edic
al O
utco
mes
Stu
dy S
ocia
l Sup
port
Sur
vey
(MO
S S
ocia
l Sup
port
Sur
vey)
; Cat
egor
ies
of

22
2 75% of all exercise sessions and were assigned to the high attendance
category. Alike, median cut-off value for categories of attendance to exercise
sessions in the maintenance phase was 60%: 73 respondents attended less
than or 60% of all exercise sessions and were assigned to the low attendance
category; 60 respondents attended more than 60% of all exercise sessions in
months 5 to 18 and were assigned to the high attendance category.
Non-smoking status and low social participation were significant
univariate determinants of high attendance to diet sessions in the initiation
phase, as shown in Table 2.1 (p < .05). Single intervention randomization
versus the double intervention (WL vs. WL+EX), marital status, ethnicity,
cognitive function and mental health status were included in the multivariate
model as well, because of statistical significance below p = .15. In multivariate
logistic regression analyses, marital status (p < .01), social participation (p <
.05), and single intervention randomization (p < .05) were significant
determinants of attendance to diet sessions in the first 4 months: respondents
who were married were less likely to attend the diet intervention sessions in
the first four months than respondents who were not married (OR 0.31, 95%CI
0.14, 0.74). Respondents who scored high on social participation were less
likely to attend diet sessions in the first four months, compared to respondents
who scored low on social participation (OR 0.83, 95%CI 0.70, 0.98). Finally,
respondents who were randomized into the WL+EX intervention were less
likely to attend diet sessions in the first four months, compared to respondents
who were in the WL intervention (OR 0.45, 95%CI 0.21, 0.99).
High attendance to diet sessions in the initiation phase was the only
significant univariate determinant of high attendance to diet sessions in the
maintenance phase, as shown in Table 2.1 (p < .01). Lung disease and mental
health were included in the multivariate model as well, because of statistical
significance below p = .15. In multivariate regression analyses, high
attendance to diet sessions in the first 4 months was the only significant
determinant of high attendance to diet sessions in the last 14 months (p <
.01): respondents who were in the highest category of the variable diet session
attendance in months 1 to 4, were almost 10 times as likely to be in the
highest category of the variable diet session attendance in months 5 to 18,

23
2 compared to respondents who were in the lowest category of the variable diet
session attendance in months 1 to 4 (OR 9.73, 95%CI 4.33, 21.88).
Not having cardiovascular disease and being of advanced age were
significant univariate determinants of high attendance to exercise sessions in
the first 4 months, as shown in Table 2.2 (p < .05). Ethnicity, smoking status,
and the WOMAC-Function subscale were included in the multivariate model as
well, because of statistical significance below p = .15. In multivariate
regression analysis, no determinant significantly predicted attendance to
exercise sessions in the initiation phase.
After the initiation phase, 37 (27.8%) participants chose to continue
their intervention exercises (at least partly) at home, while 96 (72.2%)
participants continued doing their exercises at the facility (not tabulated). High
attendance to exercise sessions in the initiation phase, having lung disease,
male gender (all p < .01), exercising (partly) at home, Caucasian ethnicity, low
BMI, and high walking speed (all p < .05) were significant univariate
determinants of high attendance to exercise sessions in months 5 to 18, as
shown in Table 2.2. In the multivariate model we also included marital status,
diabetes mellitus, the WOMAC-Stiffness subscale, and single intervention
randomization, because of statistical significance below p = .15. In multivariate
regression analysis, high attendance to exercise sessions in the initiation phase
(p < .01), EX intervention randomization (vs. WL+EX), exercising (partly) at
home, and not having lung disease (all p < .05) significantly predicted high
attendance to exercise sessions in months 5 through 18. Respondents who
were in the highest category of the variable exercise session attendance in
months 1 to 4, were almost 7 times as likely to be in the highest category of
the variable exercise session attendance in months 5 to 18, compared to
respondents who were in the lowest category of the variable exercise session
attendance in months 1 to 4 (OR 6.86, 95%CI 2.62, 17.96). Respondents who
continued doing their exercises at the facility were less likely to adhere to the
exercise program than their counterparts who opted for doing their exercises
at least partly at home (OR 0.26, 95%CI 0.09, 0.76). Also, respondents who
were randomized into the WL+EX intervention were less likely to attend
exercise sessions in the final 14 months, compared to respondents who were in
the EX intervention (OR 0.35, 95%CI 0.14, 0.86). Finally, respondents with

24
2
Tabl
e 2.
2: U
niva
riate
Chi
-squ
are
and
t-tes
ts, m
ultiv
aria
te o
dds
ratio
s (O
R's
), an
d 95
% c
onfid
ence
inte
rval
s (9
5%C
I) of
de
term
inan
ts o
f cat
egor
ies
low
and
hig
h at
tend
ance
to e
xerc
ise
sess
ions
(N =
133
)
Low
atte
ndan
ceH
igh
atte
ndan
ceO
R (9
5%C
I)Lo
w a
ttend
ance
Hig
h a
ttend
ance
OR
(95%
CI)
Det
erm
inan
ts
Mea
n (S
D) /
%M
ean
(SD
) / %
Low
vs.
hig
h at
tend
ance
Mea
n (S
D) /
%M
ean
(SD
) / %
Low
vs.
hig
h at
tend
ance
% L
owes
t atte
ndan
ce c
ateg
ory
in th
e In
itiat
ion
phas
e N
.A.a
N.A
.66
.2 3
0.0*
* 6
.86
(2.6
2 - 1
7.96
)**
% E
xerc
ise
at th
e fa
cilit
y N
.A.
N.A
.81
.1 6
1.7*
0.2
6 (0
.09
- 0.7
6)*
% W
eigh
t Los
s +
Exe
rcis
e in
terv
entio
n (W
L+E
X)
47.8
49.3
54.1
41.
7‡ 0
.35
(0.1
4 - 0
.86)
*A
ge67
.4 (6
.3)
69.
6 (6
.3)*
1.06
(1.0
0 - 1
.12)
68.3
(6.6
)68
.7 (6
.1)
% F
emal
e77
.671
.683
.8 6
3.3*
*0.
60 (0
.20
- 1.8
4)%
Mar
ried
56.9
58.2
50.0
66.
7†1.
03 (0
.37
- 2.8
7)%
Les
s th
an 1
3 ye
ars
of e
duca
tion
28.8
30.8
31.9
27.1
% N
on-w
hite
eth
nici
ty30
.3 2
0.0‡
0.59
(0.2
4 - 1
.43)
31.9
16.
9*1.
80 (0
.50
- 6.4
8)%
Oth
er s
ites
affe
cted
with
arth
ritis
61.2
67.2
63.5
65.0
% C
ardi
ovas
cula
r dis
ease
76.1
61.
2*0.
49 (0
.22
- 1.1
0)73
.063
.3%
Can
cer
14.9
19.4
18.9
15.0
% D
iabe
tes
Mel
litus
11.9
7.5
13.5
5.0
†0.
34 (0
.06
- 1.9
3)%
Lun
g D
isea
se13
.417
.923
.0 6
.7**
0.1
4 (0
.03
- 0.7
5)*
Bod
y M
ass
Inde
xc35
.0 (6
.1)
33.8
(4.6
)35
.4 (6
.3)
33.
2 (3
.9)*
0.93
(0.8
3 - 1
.04)
WO
MA
Cb -F
unct
ion
scor
ec25
.2 (1
0.8)
22.
3 (1
1.2)
‡0.
98 (0
.95
- 1.0
2)24
.9 (1
1.3)
22.3
(10.
6)W
OM
AC
-Pai
n sc
orec
7.0
(3.2
)6.
9 (3
.5)
7.3
(3.4
)6.
5 (3
.3)
WO
MA
C-S
tiffn
essc
3.7
(1.4
)3.
7 (1
.6)
3.9
(1.5
) 3
.5 (1
.4)‡
1.06
(0.7
6 - 1
.48)
Cog
nitiv
e Fu
nctio
nd 28
.8 (1
.4)
29.0
(1.2
)28
.8 (1
.4)
29.0
(1.2
)W
alki
ng S
peed
(met
ers
/ sec
ond)
d1.
16 (0
.2)
1.16
(0.2
)1.
12 (0
.3)
1.2
0 (0
.2)*
1.94
(0.2
1 - 1
7.57
)%
Sm
okin
g9.
0 1
.5†
0.20
(0.0
2 - 1
.88)
5.4
5.0
% D
rinki
ng a
lcoh
ol52
.246
.350
.048
.3S
F-36
e Men
tal H
ealth
sco
red
77.5
(15.
9)79
.4 (1
3.4)
78.7
(14.
6)78
.2 (1
4.8)
SF-
36 S
ocia
l Fun
ctio
ning
sco
red
78.4
(22.
9)79
.3 (2
2.0)
77.7
(23.
7)80
.2 (2
0.9)
MO
Sf -S
ocia
l Sup
port
scor
ed76
.6 (1
4.5)
78.4
(13.
7)78
.0 (1
4.0)
76.9
(14.
2)S
ocia
l par
ticip
atio
nd7.
6 (2
.3)
7.5
(2.6
)7.
7 (2
.3)
7.4
(2.5
)
low
(n =
73)
and
hig
h (n
= 6
0).
scor
es in
dica
te b
ette
r fun
ctio
ning
;e Sho
rt Fo
rm 3
6 Q
ualit
y of
Life
Hea
lth S
urve
y (S
F-36
); f M
edic
al O
utco
mes
Stu
dy S
ocia
l Sup
port
Sur
vey
(MO
S S
ocia
l Sup
port
Sur
vey)
; Cat
egor
ies
of
Initi
atio
n ph
ase
(mon
ths
1 - 4
)M
aint
enan
ce p
hase
(mon
ths
5 - 1
8)
** p
< .0
1; *
p <
.05;
† p
< .1
0; ‡
p <
.15;
a Not
App
licab
le; b W
este
rn O
ntar
io &
McM
aste
r Uni
vers
ity O
steo
arth
ritis
Inde
x (W
OM
AC
); c H
ighe
r sco
res
indi
cate
wor
se fu
nctio
ning
; d Hig
her
atte
ndan
ce to
die
t int
erve
ntio
n se
ssio
ns in
the
initi
atio
n ph
ase
wer
e: lo
w (n
= 6
6) a
nd h
igh
(n =
67)
; Cat
egor
ies
of a
ttend
ance
to d
iet i
nter
vent
ion
sess
ions
in th
e m
aint
enan
ce p
hase
wer
e
25
2 lung disease were less likely to attend exercise sessions in months 5 to 18
compared to respondents not reporting lung disease (OR 0.14, 95%CI 0.03,
0.75).
2.4 Discussion Our study found an overall diet session attendance of 60.7% among older
persons with knee OA, and varied from 68.6% in the first four months of the
study to 52.3% in the last 14 months of the intervention. Overall exercise
session attendance was 53.2%, and varied from 68.8% in the first four months
of the study to 49.9% in the last 14 months of the intervention. In multivariate
analyses we found that not being married, low social participation, and single
intervention randomization were predictive of high diet session attendance in
the initiation phase of the study. In multivariate analyses, high diet session
attendance in months 1 to 4 was the only significant predictor of high diet
session attendance in the maintenance phase. Multivariate analyses on
determinants of initiation phase exercise session attendance yielded no
significant results. High exercise session attendance in the initiation phase, and
exercising (at least partly) at home, single intervention randomization, and not
having cardiovascular disease were predictors of high exercise session
attendance in the maintenance phase.
Attendance to dietary interventions has shown to decrease with
intervention duration, e.g. from 90% during a 10-week dietary intervention
among overweight and obese, post-menopausal women to 70% during a 2-
year dietary intervention which was similar in intensity to our diet intervention
[31,32]. Diet session attendance diminished in our study as well; from 68.6%
in the first four months of the study to 52.3% in the last 14 months of the
study. Our average diet intervention attendance (61%) seems poor, compared
to the aforementioned 70%. However, this percentage was achieved in a study
among women aged 45 to 69 without any apparent health problems [31],
whereas our study was conducted among older respondents with pain, mobility
problems and knee OA.
Exercise session attendance tends to decrease with intervention duration
[32]. We found this in our study as well: from 68.8% in the first four months
of the study, to 49.9% in months 5 to 18. Our overall exercise session
26
2 attendance of 53.2% seems to be in line with the described attendance range
of 36%-68% in long-term home-based exercise interventions or compared to
the attendance range of 36%-80% in long-term group-based exercise
interventions [33].
Married respondents were less likely to attend diet sessions than their
divorced, widowed, or never married counterparts. Perhaps married
respondents were less likely to find the time and dedication to attend diet
sessions in the first 4 months due to all kinds of social or familial involvements.
On the other hand, the greater attendance to diet sessions among respondents
who are divorced, widowed, or never married, could reflect the strong desire to
keep up their health and remain independent, despite their knee OA. Alike, low
social participation was associated with high diet session attendance. This may
indicate that participants, who were less socially involved in all kinds of
community or religious activities, were more likely to find the time and
dedication to attend diet sessions in the first 4 months. It is also possible that
these participants were more susceptible to the social aspect that goes out
from group interventions, and were more likely to attend diet sessions.
In the maintenance phase of the exercise sessions, we found that
participants who were doing their exercises at least partly at home to be likely
to adhere better to the exercise program than their counterparts who remained
exercising at the facility. Participants who exercised at home were asked to
keep their own exercise logs. Whether these logs reflect true exercise effort of
participants, or rather social desirability remains unclear. However, Castro and
colleagues [34] found that exercise logs are valid and reliable reflections of
true energy expenditure. Although exercising at home requires a strong self-
discipline of a participant, it still is easier to implement in a person’s daily life
than fixed exercise classes. It may also be that participants acquire a sense of
control when they are given the choice where to do their exercises, which may
boost their motivation. In addition, perceived barriers, such as climate factors
and mobility problems, may have lessened participant’s enthusiasm to
continue session attendance at the facility.
Being randomized into the double intervention versus a single
intervention demonstrated to be detrimental for session attendance in the
initiation phase of the diet sessions and in the maintenance phase of the

27
2 exercise sessions. It should be kept in mind that randomization into a double
intervention may interfere too strongly with participant’s daily life than single
intervention randomization does.
We found that for both the dietary and the exercise intervention, session
attendance in the initiation phase is a very strong predictor of session
attendance in a later stage of the intervention. This may indicate that if
participants are convinced of intervention benefits and willing to come in for
the first months of interventions, they are more likely to remain engaged. This
could be due to the fact that repetition of behavior tends to make the behavior
habitual [20-22,35], or due to the fact that participants are simply interested
in the topic of study. This finding may suggest that efforts to stimulate
attendance to intervention sessions should be done from the very early phase
of the intervention on. Moreover, a study on the effects of exercise session
attendance in this same sample demonstrated that the respondents in the
highest tertile regarding intervention session attendance improved significantly
more in physical performance and self-reported disability than respondents
who were in the lowest tertile regarding intervention session attendance [12].
A shortcoming of our study was that we only included sociodemographic,
health-related, and social variables, and did not consider psychological
variables, such as self-efficacy expectancies, and health-related attitudes.
These should be subject of future studies regarding interventions prone to non-
compliance. Although we acknowledge to the fact that attendance to
intervention sessions does not equal intervention compliance, we believe that
measures of intervention attendance reflect a certain precursory value of the
extent to which a participant really is physically active, or really is changing
eating habits.
In sum, various determinants – some of which modifiable – were
predictive of high and low diet and exercise session attendance in our study.
Overall, in the initiation phase, determinants of diet session attendance were
not the same determinants that predicted exercise session attendance. Since
session attendance in the maintenance phase of our study was mainly
determined by session attendance in the initiation phase, this shows that
efforts to motivate people and increase session attendance should be done in
the very early stage of interventions. It is remarkable that among our older

28
2 respondents with pain, mobility problems and knee OA, determinants of diet
and exercise session attendance were mainly non-medical. This suggests that
interventions such as ours are conductible and appropriate for older persons
who are hindered in their mobility.
29
2 2.5 References 1. Messier SP, Loeser RF, Hoover JL, Semble EL, Wise CM. Osteoarthritis of the knee: effects
on gait, strength, and flexibility. Arch Phys Med Rehabil 1992;73(1):29-36.
2. Ettinger WH, Jr., Fried LP, Harris T, Shemanski L, Schulz R, Robbins J. Self-reported
causes of physical disability in older people: the Cardiovascular Health Study. CHS
Collaborative Research Group. J Am Geriatr Soc 1994;42(10):1035-1044.
3. Schultz AB. Mobility impairment in the elderly: challenges for biomechanics research. J
Biomech 1992;25(5):519-528.
4. Recommendations for the medical management of osteoarthritis of the hip and knee:
2000 update. American College of Rheumatology Subcommittee on Osteoarthritis
Guidelines. Arthritis Rheum 2000;43(9):1905-15.
5. Davis MA, Ettinger WH, Neuhaus JM. Obesity and osteoarthritis of the knee: evidence
from the National Health and Nutrition Examination Survey (NHANES I). Semin Arthritis
Rheum 1990;20(3 Suppl 1):34-41.
6. Felson DT. The epidemiology of knee osteoarthritis: results from the Framingham
Osteoarthritis Study. Semin Arthritis Rheum 1990;20(3 Suppl 1):42-50.
7. Hartz AJ, Fischer ME, Bril G, Kelber S, Rupley D, Jr., Oken B, et al. The association of
obesity with joint pain and osteoarthritis in the HANES data. J Chronic Dis 1986;39(4):
311-319.
8. Felson DT, Zhang Y, Anthony JM, Naimark A, Anderson JJ. Weight loss reduces the risk
for symptomatic knee osteoarthritis in women. The Framingham Study. Ann Intern Med
1992;116(7):535-539.
9. Ettinger WH, Jr., Burns R, Messier SP, Applegate W, Rejeski WJ, Morgan T, et al. A
randomized trial comparing aerobic exercise and resistance exercise with a health
education program in older adults with knee osteoarthritis. The Fitness Arthritis and
Seniors Trial (FAST). JAMA 1997;277(1):25-31.
10. Minor MA, Hewett JE, Webel RR, Anderson SK, Kay DR. Efficacy of physical conditioning
exercise in patients with rheumatoid arthritis and osteoarthritis. Arthritis Rheum
1989;32(11):1396-1405.
11. Fisher NM, Pendergast DR, Gresham GE, Calkins E. Muscle rehabilitation: its effect on
muscular and functional performance of patients with knee osteoarthritis. Arch Phys Med
Rehabil 1991;72(6):367-374.
12. Van Gool CH, Penninx BW, Kempen GI, Rejeski WJ, Miller GD, van Eijk JTh, Pahor M,
Messier SP. Effects of exercise adherence on physical function among overweight older
adults with knee osteoarthritis. Arthritis Rheum; 53(1):24-32.
13. Wilbur J, Chandler P, Miller AM. Measuring adherence to a women's walking program.
West J Nurs Res 2001;23(1):8-24.
14. King AC, Rejeski WJ, Buchner DM. Physical activity interventions targeting older adults. A
critical review and recommendations. Am J Prev Med 1998;15(4):316-333.

30
2 15. Rhodes RE, Martin AD, Taunton JE, Rhodes EC, Donnelly M, Elliot J. Factors associated
with exercise adherence among older adults. An individual perspective. Sports Med
1999;28(6):397-411.
16. Courneya KS, Blanchard CM, Laing DM. Exercise adherence in breast cancer survivors
training for a dragon boat race competition: a preliminary investigation. Psychooncology
2001;10(5):444-452.
17. Kyngas H, Lahdenpera T. Compliance of patients with hypertension and associated
factors. J Adv Nurs 1999;29(4):832-839.
18. Sherman AM, Bowen DJ, Vitolins M, Perri MG, Rosal MC, Sevick MA, et al. Dietary
adherence: characteristics and interventions. Control Clin Trials 2000;21(5Suppl): 206S-
211S.
19. Urban N, White E, Anderson GL, Curry S, Kristal AR. Correlates of maintenance of a low-
fat diet among women in the Women's Health Trial. Prev Med 1992;21(3):279-291.
20. Maddux JE, Brawley LR, Boykin A. Self-efficacy and health behavior: protection,
promotion, and detection. In: J.E.Maddux, editor. Self-efficacy, Adaptation, and
Adjustment: Theory, Research, and Application. New York: Plenum; 1995. p. 173-202.
21. Rejeski WJ, Brawley LR, Ettinger W, Morgan T, Thompson C. Compliance to exercise
therapy in older participants with knee osteoarthritis: implications for treating disability.
Med Sci Sports Exerc 1997;29(8):977-985.
22. Ronis DL, Yates JF, Kirscht JP. Attitudes, decisions, and habits as determinants of
behavior. In: A.R.Pratkanis, S.J.Breckler, A.G.Greenwald, editors. Attitude structure and
function. New York: Erlbaum; 2002. p. 213-239.
23. Rejeski WJ, Focht BC, Messier SP, Morgan T, Pahor M, Penninx B. Obese, older adults
with knee osteoarthritis: weight loss, exercise, and quality of life. Health Psychol 2002;
21(5):419-26.
24. Messier SP, Loeser RF, Miller GD, Morgan TM, Rejeski WJ, Sevick MA, Ettinger WH Jr,
Pahor M, Williamson JD. Exercise and dietary weight loss in overweight and obese older
adults with knee osteoarthritis: the Arthritis, Diet, and Activity Promotion Trial. Arthritis
Rheum 2004 May;50(5):1501-10.
25. Miller GD, Rejeski WJ, Williamson JD, Morgan T, Sevick MA, Loeser RF, Ettinger WH Jr,
Messier SP. The Arthritis, Diet and Activity Promotion Trial (ADAPT): design, rationale,
and baseline results. Control Clin Trials 2003; 24: 462-80.
26. Folstein MF, Folstein SE, McHugh PR. "Mini-mental state". A practical method for grading
the cognitive state of patients for the clinician. J Psychiatr Res 1975; 12(3): 189-198.
27. Bellamy N, Buchanan WW, Goldsmith CH, Campbell J, Stitt LW. Validation study of
WOMAC: a health status instrument for measuring clinically important patient relevant
outcomes to antirheumatic drug therapy in patients with osteoarthritis of the hip or knee.
J Rheumatol 1988;15(12):1833-1840.
28. Rejeski WJ, Ettinger WH, Jr., Shumaker S, Heuser MD, James P, Monu J, et al. The
evaluation of pain in patients with knee osteoarthritis: the knee pain scale. J Rheumatol
1995;22(6):1124-1129.
31
2 29. Ware JE, Jr., Sherbourne CD. The MOS 36-item short-form health survey (SF-36). I.
Conceptual framework and item selection. Med Care 1992;30(6):473-483.
30. Sherbourne CD, Stewart AL. The MOS social support survey. Soc Sci Med 1991;32(6):
705-714.
31. Bunyard LB, Dennis KE, Nicklas BJ. Dietary intake and changes in lipoprotein lipids in
obese, postmenopausal women placed on an American Heart Association Step 1 diet. J
Am Diet Assoc 2002;102(1):52-57.
32. Insull W, Jr., Henderson MM, Prentice RL, Thompson DJ, Clifford C, Goldman S, et al.
Results of a randomized feasibility study of a low-fat diet. Arch Intern Med 1990;150(2):
421-427.
33. Van der Bij AK, Laurant MG, Wensing M. Effectiveness of physical activity interventions
for older adults: a review. Am J Prev Med 2002;22(2):120-133.
34. Castro CM, Wilcox S, O'Sullivan P, Baumann K, King AC. An exercise program for
women who are caring for relatives with dementia. Psychosom Med 2002; 64 (3): 458-
68.
35. Oliver K, Cronan T. Predictors of exercise behaviors among fibromyalgia patients. Prev
Med 2002; 35: 383-9.
2.6 Acknowledgement Support for this study was provided by the Claude D. Pepper Older Americans
Independence Center of Wake Forest University through grants from the
National Institutes of Health 5P60-AG-10484-07, and a General Clinical
Research Grant M01-RR00211.

32
2
33
3 CHAPTER 3 *
Effects of exercise adherence on physical function
among overweight older adults with knee osteoarthritis
Coen H. van Gool, Brenda W.J.H. Penninx, Gertrudis I.J.M. Kempen, W. Jack Rejeski, Gary D. Miller, Jacques Th.M. van Eijk, Marco Pahor, Stephen Messier
Abstract Objective: For patients with knee osteoarthritis (OA), adherence to prescribed exercise regimen is important in preserving physical function. We explored whether high exercise adherence improved physical function among older adults with OA who were overweight and obese. Methods: Associations between exercise adherence, changes in 6-minute walking distance in meters, and self-reported disability (Western Ontario and McMaster Universities Osteoarthritis Index [WOMAC] – Function subscale) after 6 and 18 months were examined among a ‘Arthritis, Diet, and Activity Promotion Trial’ subsample (N = 134), using multiple linear regression models. Results: Higher exercise adherence was associated with greater improvements in 6-minute walking distance after 6 and 18 months and in disability after 6 months. Pain and body mass index (BMI) contributed – to some extent – in explaining the link between exercise adherence and changes in physical performance and self-reported disability. Conclusions: Higher exercise adherence is associated with improved physical function. This indicates that promoting adherence is clinically relevant when prescribing exercise regimen which also focus on decrease in pain and BMI to overweight and obese older adults with knee OA. Key words: Intervention adherence, physical function, disability.
* As published in Arthritis & Rheumatism (Arthritis Care & Research) 2005; 53 (1): 24-32.

34
3 3.1 Introduction
nee osteoarthritis (OA) is a leading cause of decreasing physical function
among older adults, and may limit a person’s independence of living and
affect health-related quality of life (1,2). In knee OA disease management,
treatment options include adopting healthy lifestyles and physical exercise (3).
These treatment options may also have beneficial effects on mental health (4).
Compliance to treatment is important in attaining treatment goals. Specifically,
when a physical exercise regimen is prescribed, adherence to this regimen is
crucial in preserving physical performance and function, in terms of observed
walking distance and self-reported disability, respectively, and in reducing pain
for patients with knee OA (5).
Generally, exercise adherence tends to decrease with intervention
duration, and usually results in an increase in concurrent and subsequent
physical activity levels, although changes are small and generally short-lived
(6-9). Several studies in healthy and diseased older adults showed favorable
effects of exercise on muscle strength, aerobic capacity, reduction of fracture
risk, and general well-being (7,10,11). Studies among older adults with (knee)
OA examining effects of exercise adherence have described greater
improvements in physical performance, disability, pain, quality of life, and
depressive symptoms for participants who adhered more to the exercise
intervention regimen (4,12,13). However, poor exercise adherence may partly
have caused studies examining effects of exercise adherence in older adults
who were overweight and obese to be inconclusive regarding weight
maintenance and physical fitness (8,9).
Studies examining effects of exercise intervention adherence on health
outcomes in overweight and obese older adults with knee OA may offer insight
into the effectiveness of exercise interventions in the growing group of
overweight and obese older adults suffering from knee OA. The present study
examined 1) whether higher exercise adherence to an 18-month intervention
program was associated with more improvements in physical performance and
self-reported disability, and 2) whether changes in modifiable, potentially
explanatory variables, i.e. pain, mental health, social functioning, body mass
index (BMI), location of exercise, could explain the association between
exercise adherence and changes in physical performance and self-reported
K
35
3 disability, by performing secondary analyses using data of the ‘Arthritis, Diet,
and Activity Promotion Trial’ (ADAPT).
3.2 Materials & Methods Design & Study sample
ADAPT was a randomized controlled trial conducted among overweight and
obese, 60-year old and older adults with knee OA to compare effectiveness of
three different 18-month interventions – a dietary weight loss, an exercise,
and a combined dietary weight loss plus exercise intervention – with a healthy
lifestyle control group on physical function, knee pain, stiffness, weight loss,
and physical performance. Data collection visits took place at baseline, 6 and
18 months post-randomization. The study was approved of by Wake Forest
University’s institutional review board. Sampling, data-collection procedures,
information on the interventions, and main study findings have been reported
in detail elsewhere (14-16).
Inclusion criteria for participation in ADAPT were: 1) aged 60 years and
over; 2) body mass index (BMI = weight in kilograms / height in meters2) ≥
28; 3) knee pain on most of the days; 4) sedentary activity pattern for the
past 6 months with less than 20 minutes of formal exercise once a week; 5)
self-reported difficulty ascribed to knee pain in at least one (Instrumental)
Activity of Daily Living ((I)ADL); and 6) radiographic evidence of tibia-femoral
OA. Potential participants were excluded if they: 1) had a serious medical
condition that prevented safe participation in the exercise intervention
program; 2) had a mini-mental state examination (MMSE; 17) score ≤ 23; 3)
could not finish the 18 month trial due to severe psychiatric morbidity or end-
stage terminal illness; or 4) were unable to walk without a cane or other
assistive device. Written informed consent was obtained from 316 eligible
community-dwelling older adults. Subsequently they were randomly assigned
to one of four study groups: 80 in the exercise group; 76 in the exercise plus
dietary weight loss group – hereafter respectively called exercise only and
exercise plus diet; 82 in the diet only group; and 78 in the healthy lifestyle
control group. Since these last two groups did not contain exercise information
we only included the two exercise groups (N = 156) in our secondary data
analyses.
36
3 Intervention
The exercise intervention was intended to expand aerobic and resistance-
training capacities for participants in the exercise only and exercise plus diet
intervention group. The three days per week exercise program and consisted
of two 15 minutes aerobics phases, during which participants walked within
50-85% of their heart rate reserve, and were separated by a resistance-
training phase (20 minutes), which consisted of two sets of 12 repetitions of
the following exercises: leg extension, leg curl, heel raise, and step up. Ankle
cuff weights and weighted vests were used to provide resistance. Five minutes
of warming up and cooling down started and ended each session, respectively.
The initiation phase (months 1 to 4) was held at the facility. After the
transition phase (months 5 and 6) participants could either choose to exercise
at home, exercise in a facility-based program, or to combine both options in
the maintenance phase (months 7 to 18). Those who had opted for the
(combined) home-based program were expected to exercise as much as the
facility-based participants – 60 minutes, three days a week – and had to keep
daily exercise logs, in which they were asked to carefully report on exercise
frequency, duration, and achieved heart rate. During the first two months of
home-based exercise study staff contacted these participants by telephone bi-
weekly, tri-weekly during the following two months, and monthly thereafter, to
exert supervision. If participants did not show-up at intervention sessions, they
were contacted by telephone as well.
Measurements
-Evaluation of exercise adherence
Percentage exercise regimen adherence was measured by dividing the number
of exercise sessions the participant actually attended or exercised at home
(exercise log) by the number of prescribed sessions, multiplied by 100 (15).
We calculated percentage exercise adherence for the first 6 months (called
initiation phase), and overall percentage exercise adherence (months 1 to 18).
Scores range from 0 to 100 on both variables with higher scores indicating
more exercise adherence.
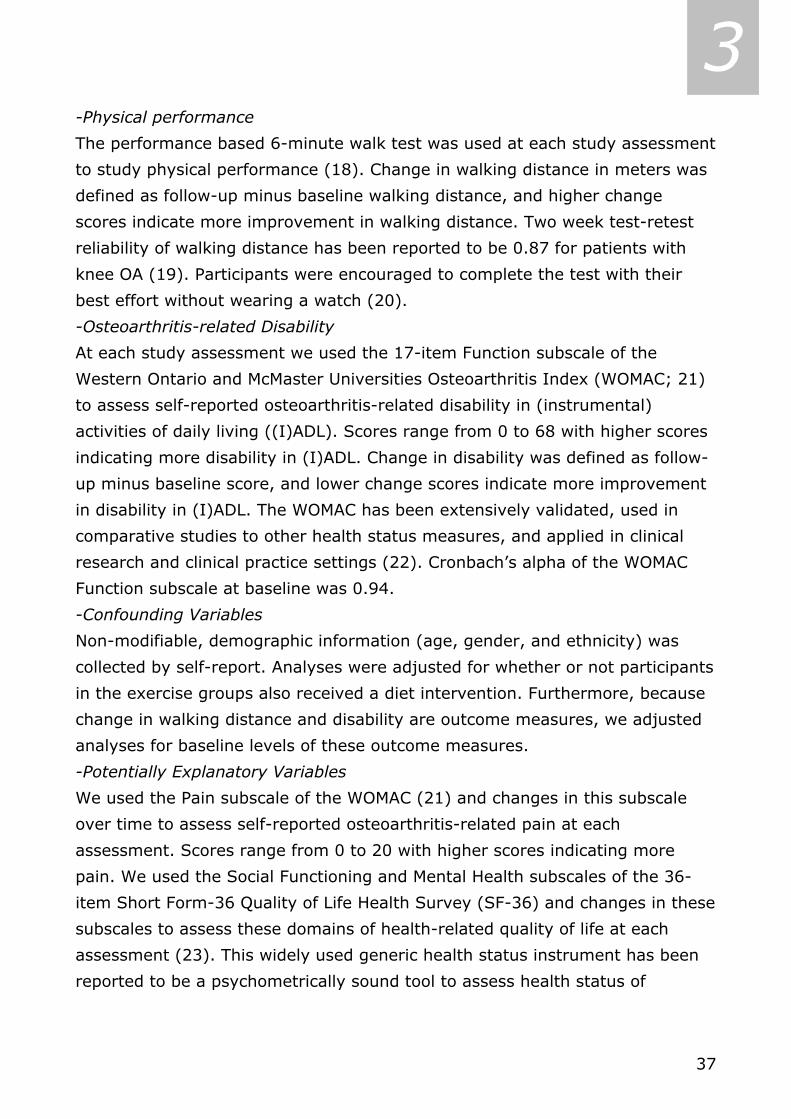
37
3 -Physical performance
The performance based 6-minute walk test was used at each study assessment
to study physical performance (18). Change in walking distance in meters was
defined as follow-up minus baseline walking distance, and higher change
scores indicate more improvement in walking distance. Two week test-retest
reliability of walking distance has been reported to be 0.87 for patients with
knee OA (19). Participants were encouraged to complete the test with their
best effort without wearing a watch (20).
-Osteoarthritis-related Disability
At each study assessment we used the 17-item Function subscale of the
Western Ontario and McMaster Universities Osteoarthritis Index (WOMAC; 21)
to assess self-reported osteoarthritis-related disability in (instrumental)
activities of daily living ((I)ADL). Scores range from 0 to 68 with higher scores
indicating more disability in (I)ADL. Change in disability was defined as follow-
up minus baseline score, and lower change scores indicate more improvement
in disability in (I)ADL. The WOMAC has been extensively validated, used in
comparative studies to other health status measures, and applied in clinical
research and clinical practice settings (22). Cronbach’s alpha of the WOMAC
Function subscale at baseline was 0.94.
-Confounding Variables
Non-modifiable, demographic information (age, gender, and ethnicity) was
collected by self-report. Analyses were adjusted for whether or not participants
in the exercise groups also received a diet intervention. Furthermore, because
change in walking distance and disability are outcome measures, we adjusted
analyses for baseline levels of these outcome measures.
-Potentially Explanatory Variables
We used the Pain subscale of the WOMAC (21) and changes in this subscale
over time to assess self-reported osteoarthritis-related pain at each
assessment. Scores range from 0 to 20 with higher scores indicating more
pain. We used the Social Functioning and Mental Health subscales of the 36-
item Short Form-36 Quality of Life Health Survey (SF-36) and changes in these
subscales to assess these domains of health-related quality of life at each
assessment (23). This widely used generic health status instrument has been
reported to be a psychometrically sound tool to assess health status of
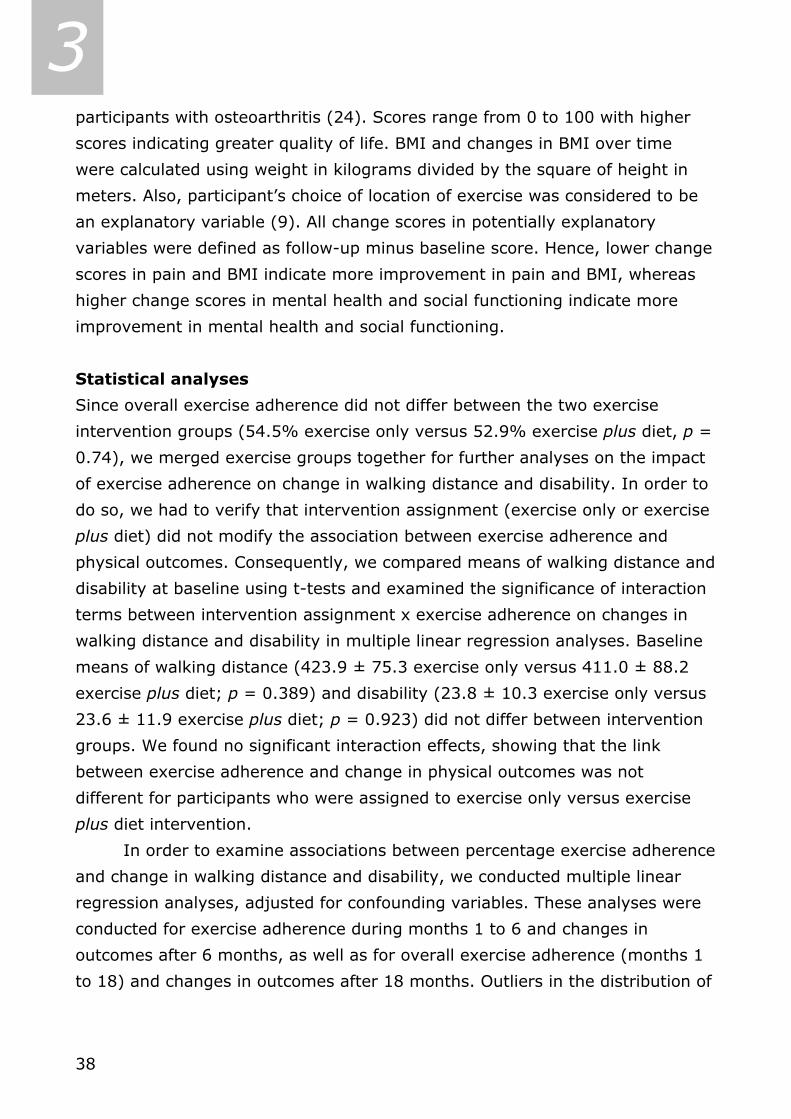
38
3 participants with osteoarthritis (24). Scores range from 0 to 100 with higher
scores indicating greater quality of life. BMI and changes in BMI over time
were calculated using weight in kilograms divided by the square of height in
meters. Also, participant’s choice of location of exercise was considered to be
an explanatory variable (9). All change scores in potentially explanatory
variables were defined as follow-up minus baseline score. Hence, lower change
scores in pain and BMI indicate more improvement in pain and BMI, whereas
higher change scores in mental health and social functioning indicate more
improvement in mental health and social functioning.
Statistical analyses
Since overall exercise adherence did not differ between the two exercise
intervention groups (54.5% exercise only versus 52.9% exercise plus diet, p =
0.74), we merged exercise groups together for further analyses on the impact
of exercise adherence on change in walking distance and disability. In order to
do so, we had to verify that intervention assignment (exercise only or exercise
plus diet) did not modify the association between exercise adherence and
physical outcomes. Consequently, we compared means of walking distance and
disability at baseline using t-tests and examined the significance of interaction
terms between intervention assignment x exercise adherence on changes in
walking distance and disability in multiple linear regression analyses. Baseline
means of walking distance (423.9 ± 75.3 exercise only versus 411.0 ± 88.2
exercise plus diet; p = 0.389) and disability (23.8 ± 10.3 exercise only versus
23.6 ± 11.9 exercise plus diet; p = 0.923) did not differ between intervention
groups. We found no significant interaction effects, showing that the link
between exercise adherence and change in physical outcomes was not
different for participants who were assigned to exercise only versus exercise
plus diet intervention.
In order to examine associations between percentage exercise adherence
and change in walking distance and disability, we conducted multiple linear
regression analyses, adjusted for confounding variables. These analyses were
conducted for exercise adherence during months 1 to 6 and changes in
outcomes after 6 months, as well as for overall exercise adherence (months 1
to 18) and changes in outcomes after 18 months. Outliers in the distribution of

39
3 the variable change in walking distance after 6 months - scores below and over
the 2.5th percentiles - were transformed into the value of the lower and upper
2.5th percentiles, -84.1 and 169.9 meters, respectively, to ensure that all
outcome variables were distributed normally. Hereafter, tertile scores of
percentage exercise adherence were created by dividing participants in three
equally large categories: (1) low adherence, (2) intermediate adherence, and
(3) high adherence to the exercise regimen for both the initiation phase (≤
62%, n = 46; 63% to 82%, n = 43; and ≥ 83%, n = 45, respectively) and
overall study duration (≤ 40%, n = 45; 41% to 70%, n = 44; and ≥ 71%, n =
45, respectively). Univariate analyses of covariance (ANCOVA) were used to
examine differences in estimated means in changes in walking distance and
disability after 6 and 18 months between adherence categories with low
adherence as reference category, adjusted for confounding variables. As a
potentially mediating or explanatory variable in an association has to correlate
with both the independent, and with the dependent variable, correlations
between potentially explanatory variables and percentage exercise adherence,
and correlations between potentially explanatory variables and change in
walking distance and change in disability were examined. Finally, multiple
linear regression models were computed in which each potentially explanatory
variable was entered as covariate, after adjustment for confounding variables,
to explore their contribution in explaining the associations between exercise
adherence and change in physical performance and disability. A priori level of
significance used in all analyses was 0.05.
3.3 Results Of the 156 participants, 69 (86.3%) of the exercise only and 65 (85.5%) of the
exercise plus diet intervention were still exercising after the 18 months of the
study. Analyses of variance and chi-square tests indicated that respondents
lost to follow-up (N = 22) did not differ from participants (N = 134) on any of
the baseline variables (all p’s > 0.05), or on intervention assignment (p =
0.90). Participants’ mean age was 68.5 ± 6.3 years (N = 134), 72.2% were
women, 76.1% were Caucasian, 57.6% were married, and 68.7% were
educated more than 12 years.
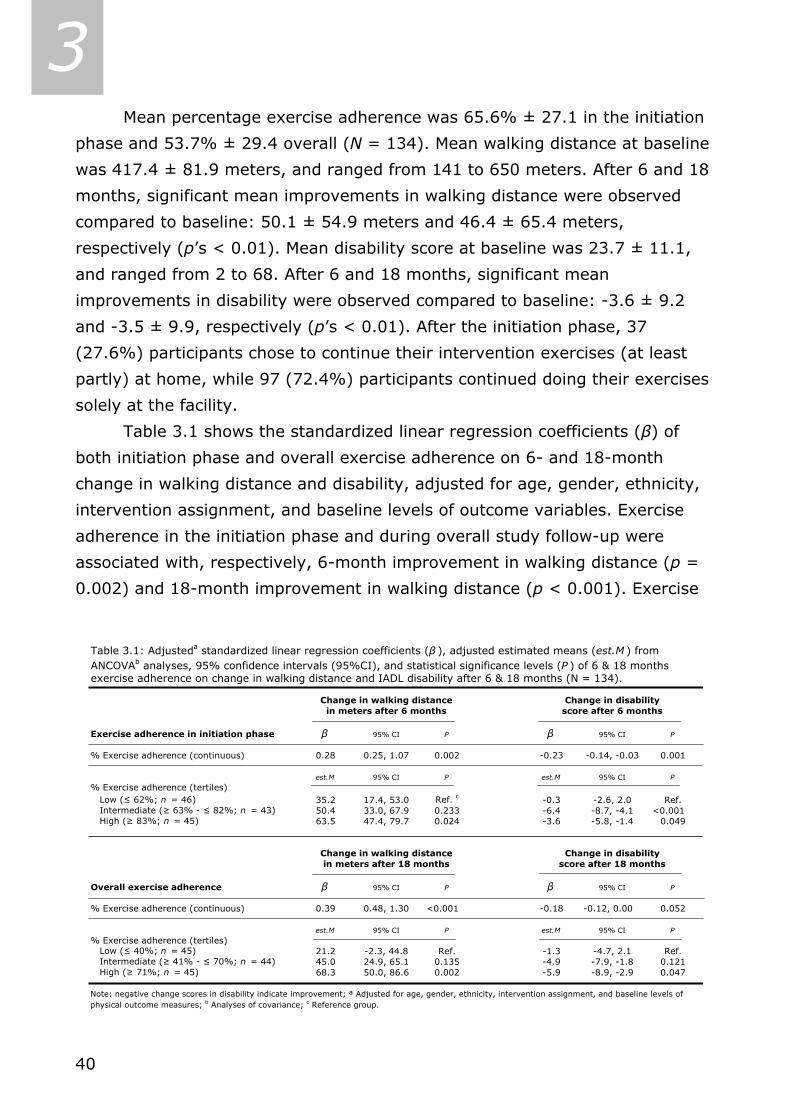
40
3 Mean percentage exercise adherence was 65.6% ± 27.1 in the initiation
phase and 53.7% ± 29.4 overall (N = 134). Mean walking distance at baseline
was 417.4 ± 81.9 meters, and ranged from 141 to 650 meters. After 6 and 18
months, significant mean improvements in walking distance were observed
compared to baseline: 50.1 ± 54.9 meters and 46.4 ± 65.4 meters,
respectively (p’s < 0.01). Mean disability score at baseline was 23.7 ± 11.1,
and ranged from 2 to 68. After 6 and 18 months, significant mean
improvements in disability were observed compared to baseline: -3.6 ± 9.2
and -3.5 ± 9.9, respectively (p’s < 0.01). After the initiation phase, 37
(27.6%) participants chose to continue their intervention exercises (at least
partly) at home, while 97 (72.4%) participants continued doing their exercises
solely at the facility.
Table 3.1 shows the standardized linear regression coefficients (β) of
both initiation phase and overall exercise adherence on 6- and 18-month
change in walking distance and disability, adjusted for age, gender, ethnicity,
intervention assignment, and baseline levels of outcome variables. Exercise
adherence in the initiation phase and during overall study follow-up were
associated with, respectively, 6-month improvement in walking distance (p =
0.002) and 18-month improvement in walking distance (p < 0.001). Exercise
exercise adherence on change in walking distance and IADL disability after 6 & 18 months (N = 134).
Change in walking distance Change in disabilityin meters after 6 months score after 6 months
Exercise adherence in initiation phase β 95% CI P β 95% CI P
% Exercise adherence (continuous) 0.28 0.25, 1.07 0.002 -0.23 -0.14, -0.03 0.001
est.M 95% CI P est.M 95% CI P
% Exercise adherence (tertiles) Low (≤ 62%; n = 46) 35.2 17.4, 53.0 Ref. c -0.3 -2.6, 2.0 Ref. Intermediate (≥ 63% - ≤ 82%; n = 43) 50.4 33.0, 67.9 0.233 -6.4 -8.7, -4.1 <0.001 High (≥ 83%; n = 45) 63.5 47.4, 79.7 0.024 -3.6 -5.8, -1.4 0.049
Change in walking distance Change in disabilityin meters after 18 months score after 18 months
Overall exercise adherence β 95% CI P β 95% CI P
% Exercise adherence (continuous) 0.39 0.48, 1.30 <0.001 -0.18 -0.12, 0.00 0.052
est.M 95% CI P est.M 95% CI P
% Exercise adherence (tertiles) Low (≤ 40%; n = 45) 21.2 -2.3, 44.8 Ref. -1.3 -4.7, 2.1 Ref. Intermediate (≥ 41% - ≤ 70%; n = 44) 45.0 24.9, 65.1 0.135 -4.9 -7.9, -1.8 0.121 High (≥ 71%; n = 45) 68.3 50.0, 86.6 0.002 -5.9 -8.9, -2.9 0.047
Note: negative change scores in disability indicate improvement; ª Adjusted for age, gender, ethnicity, intervention assignment, and baseline levels ofphysical outcome measures; b Analyses of covariance; c Reference group.
Table 3.1: Adjusteda standardized linear regression coefficients (β ), adjusted estimated means (est.M ) from ANCOVAb analyses, 95% confidence intervals (95%CI), and statistical significance levels (P ) of 6 & 18 months
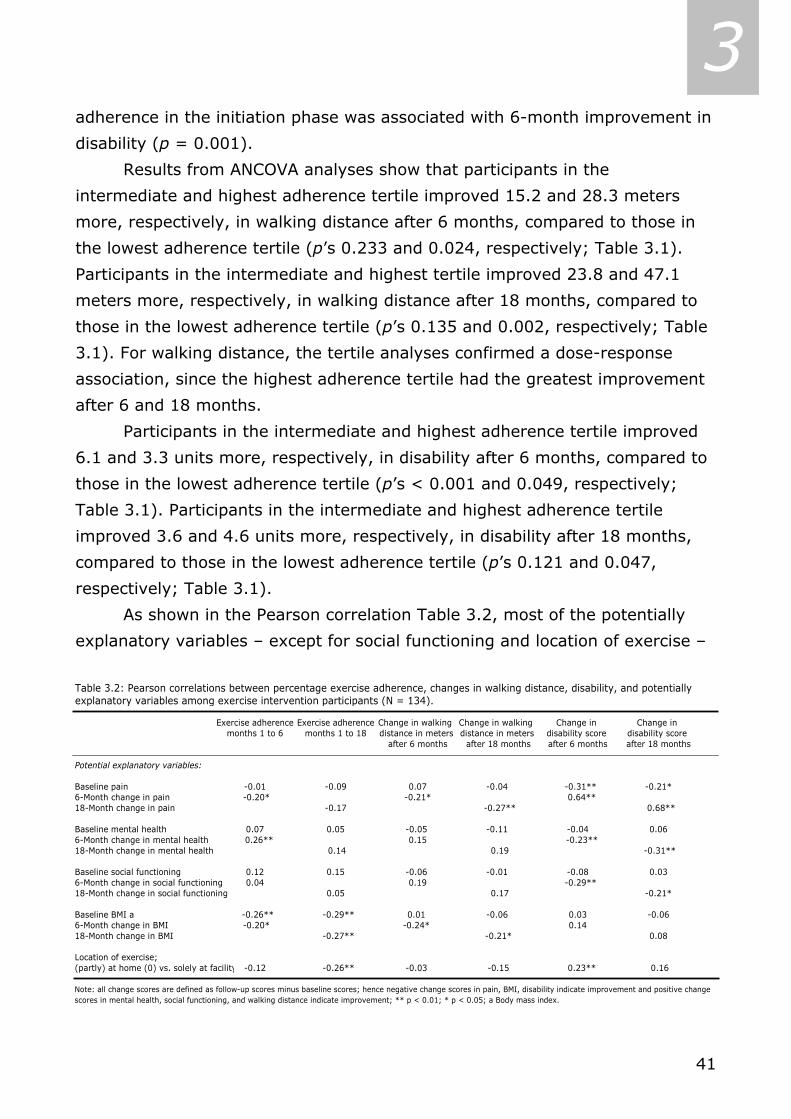
41
3 adherence in the initiation phase was associated with 6-month improvement in
disability (p = 0.001).
Results from ANCOVA analyses show that participants in the
intermediate and highest adherence tertile improved 15.2 and 28.3 meters
more, respectively, in walking distance after 6 months, compared to those in
the lowest adherence tertile (p’s 0.233 and 0.024, respectively; Table 3.1).
Participants in the intermediate and highest tertile improved 23.8 and 47.1
meters more, respectively, in walking distance after 18 months, compared to
those in the lowest adherence tertile (p’s 0.135 and 0.002, respectively; Table
3.1). For walking distance, the tertile analyses confirmed a dose-response
association, since the highest adherence tertile had the greatest improvement
after 6 and 18 months.
Participants in the intermediate and highest adherence tertile improved
6.1 and 3.3 units more, respectively, in disability after 6 months, compared to
those in the lowest adherence tertile (p’s < 0.001 and 0.049, respectively;
Table 3.1). Participants in the intermediate and highest adherence tertile
improved 3.6 and 4.6 units more, respectively, in disability after 18 months,
compared to those in the lowest adherence tertile (p’s 0.121 and 0.047,
respectively; Table 3.1).
As shown in the Pearson correlation Table 3.2, most of the potentially
explanatory variables – except for social functioning and location of exercise –
explanatory variables among exercise intervention participants (N = 134).
Exercise adherence Exercise adherence Change in walking Change in walking Change in Change in months 1 to 6 months 1 to 18 distance in meters distance in meters disability score disability score
after 6 months after 18 months after 6 months after 18 months
Potential explanatory variables:
Baseline pain -0.01 -0.09 0.07 -0.04 -0.31** -0.21*6-Month change in pain -0.20* -0.21* 0.64**18-Month change in pain -0.17 -0.27** 0.68**
Baseline mental health 0.07 0.05 -0.05 -0.11 -0.04 0.066-Month change in mental health 0.26** 0.15 -0.23**18-Month change in mental health 0.14 0.19 -0.31**
Baseline social functioning 0.12 0.15 -0.06 -0.01 -0.08 0.036-Month change in social functioning 0.04 0.19 -0.29**18-Month change in social functioning 0.05 0.17 -0.21*
Baseline BMI a -0.26** -0.29** 0.01 -0.06 0.03 -0.066-Month change in BMI -0.20* -0.24* 0.14 18-Month change in BMI -0.27** -0.21* 0.08
Location of exercise;(partly) at home (0) vs. solely at facility -0.12 -0.26** -0.03 -0.15 0.23** 0.16
Note: all change scores are defined as follow-up scores minus baseline scores; hence negative change scores in pain, BMI, disability indicate improvement and positive change scores in mental health, social functioning, and walking distance indicate improvement; ** p < 0.01; * p < 0.05; a Body mass index.
Table 3.2: Pearson correlations between percentage exercise adherence, changes in walking distance, disability, and potentially

42
3 were either significantly correlated with both exercise adherence and change in
walking distance, or were significantly correlated with both exercise adherence
and change in disability. Prominent results of correlation analyses were that
both improvements in pain, as well as improvements in mental health, were
correlated significantly with improvements in disability. Also, improvements in
pain, as well as decreased BMI, were correlated significantly with increased
walking distance (Table 3.2).
Table 3.3 shows multiple linear regression models examining the
associations between exercise adherence and change in walking distance after
6 months and after the entire duration of the study. In these analyses, we
explored the influence of each potentially explanatory variable separately by
entering it into a model, which is already adjusted for potentially confounding
variables. After adjustment for confounding variables, high 6-month exercise
adherence was significantly associated with greater 6-month improvements in
walking distance (β 0.28; p = 0.002). When we entered the potentially
explanatory variable baseline BMI and 6-month change in BMI in the multiple
linear regression model with 6-month exercise adherence as independent
variable and 6-month change in walking distance as dependent variable – after
initial adjustment for confounding variables – the standardized regression
coefficient dropped substantially to 0.24 (p = 0.013; Table 3.3). To a lesser
Table 3.3: Multiple linear regression models and standardized regression coefficients (β ) of percentage exercise adherence over 6 and 18 months on 6- and 18-months changes in walking distance in meters, after adjustment for potentially confounding and explanatory variables (N = 134).
β 95%CI a P β (95%CI) P
Model 1 Potentially confounding variablesb 0.28 0.25, 1.07 0.002 0.39 0.48, 1.30 <0.001
Model 2 Potentially confounding variables +Baseline & change in pain 0.26 0.25, 1.01 0.004 0.37 0.44, 1.28 <0.001
Model 3 Potentially confounding variables+Baseline & change in mental health 0.26 0.17, 1.04 0.007 0.38 0.47, 1.31 <0.001
Model 4 Potentially confounding variables+Baseline & change in social functioning 0.26 0.17, 1.01 0.007 0.36 0.40, 1.26 <0.001
Model 5 Potentially confounding variables+Baseline & change in BMIc 0.24 0.12, 0.98 0.013 0.28 0.21, 1.11 0.004
Model 6 Potentially confounding variables+Location of exercise 0.28 0.25, 1.08 0.002 0.38 0.47, 1.30 <0.001
a 95% confidence interval; b potentially confounding variables include age, gender, ethnicity, intervention assignment, and baselinelevels of walking distance; c Body mass index.
6-month change in walking distance
18-month change inwalking distance
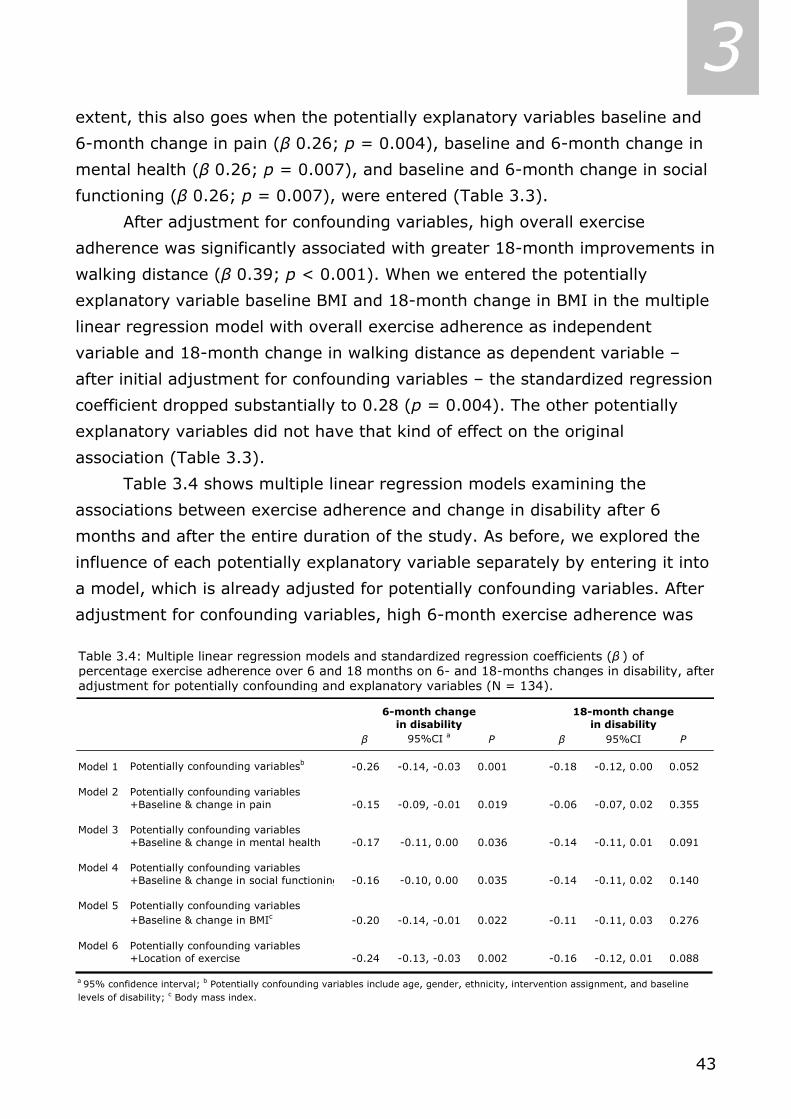
43
3 extent, this also goes when the potentially explanatory variables baseline and
6-month change in pain (β 0.26; p = 0.004), baseline and 6-month change in
mental health (β 0.26; p = 0.007), and baseline and 6-month change in social
functioning (β 0.26; p = 0.007), were entered (Table 3.3).
After adjustment for confounding variables, high overall exercise
adherence was significantly associated with greater 18-month improvements in
walking distance (β 0.39; p < 0.001). When we entered the potentially
explanatory variable baseline BMI and 18-month change in BMI in the multiple
linear regression model with overall exercise adherence as independent
variable and 18-month change in walking distance as dependent variable –
after initial adjustment for confounding variables – the standardized regression
coefficient dropped substantially to 0.28 (p = 0.004). The other potentially
explanatory variables did not have that kind of effect on the original
association (Table 3.3).
Table 3.4 shows multiple linear regression models examining the
associations between exercise adherence and change in disability after 6
months and after the entire duration of the study. As before, we explored the
influence of each potentially explanatory variable separately by entering it into
a model, which is already adjusted for potentially confounding variables. After
adjustment for confounding variables, high 6-month exercise adherence was
Table 3.4: Multiple linear regression models and standardized regression coefficients (β ) of percentage exercise adherence over 6 and 18 months on 6- and 18-months changes in disability, afteradjustment for potentially confounding and explanatory variables (N = 134).
β 95%CI a P β 95%CI P
Model 1 Potentially confounding variablesb -0.26 -0.14, -0.03 0.001 -0.18 -0.12, 0.00 0.052
Model 2 Potentially confounding variables +Baseline & change in pain -0.15 -0.09, -0.01 0.019 -0.06 -0.07, 0.02 0.355
Model 3 Potentially confounding variables+Baseline & change in mental health -0.17 -0.11, 0.00 0.036 -0.14 -0.11, 0.01 0.091
Model 4 Potentially confounding variables+Baseline & change in social functioning -0.16 -0.10, 0.00 0.035 -0.14 -0.11, 0.02 0.140
Model 5 Potentially confounding variables+Baseline & change in BMIc -0.20 -0.14, -0.01 0.022 -0.11 -0.11, 0.03 0.276
Model 6 Potentially confounding variables+Location of exercise -0.24 -0.13, -0.03 0.002 -0.16 -0.12, 0.01 0.088
a 95% confidence interval; b Potentially confounding variables include age, gender, ethnicity, intervention assignment, and baseline levels of disability; c Body mass index.
6-month changein disability
18-month changein disability

44
3 significantly associated with greater 6-month improvements in disability (β -
0.26; p = 0.001). When we entered the potentially explanatory variable
baseline pain and 6-month change in pain in the multiple linear regression
model with 6-month exercise adherence as independent variable and 6-month
change in disability as dependent variable – after initial adjustment for
confounding variables – the standardized regression coefficient dropped to -
0.15 (p = 0.019; Table 3.4). This also goes when the potentially explanatory
variables baseline and 6-month change in social functioning (β -0.16; p =
0.035), baseline and 6-month change in mental health (β -0.17; p = 0.036),
and baseline and 6-month change in BMI (β -0.20; p = 0.022) were entered.
The other potentially explanatory variables did not have that kind of effect on
the original association (Table 3.4).
After adjustment for confounding variables, high overall exercise
adherence was not significantly associated with greater 18-month
improvements in disability (β 0.18; p = 0.052). When we entered the
potentially explanatory variable baseline pain and 18-month change in pain in
the multiple linear regression model with overall exercise adherence as
independent variable and 18-month change in disability as dependent variable
– after initial adjustment for confounding variables – the standardized
regression coefficient dropped to -0.06 (p = 0.355; Table 3.4). This also goes
when the potentially explanatory variable baseline and 6-month change in BMI
(β -0.11; p = 0.276) was entered. The other potentially explanatory variables
did not have that kind of effect on the original association (Table 3.4).
3.4 Discussion Our study provides evidence that exercise adherence is associated with
improvements in (observed) physical performance and self-reported disability.
We found that, after adjustment for confounding variables, higher exercise
adherence goes together with greater improvements in walking distance after
6 and 18 months, and with greater improvements in disability after 6 months.
Pain, mental health, and BMI correlated both with exercise adherence and with
changes in walking distance or disability. Because of these associations, these
variables were able to contribute – to some extent – in explaining the link

45
3 between exercise adherence and changes in physical performance and self-
reported disability.
In our 18-month study, percentage exercise adherence in the initiation
phase (65.6%) was higher than overall exercise adherence (53.7%).
Considering the fact that our sample consisted of overweight and obese older
adults suffering from knee OA, we conclude that both percentages are in line
with current literature regarding adherence rates (25).
Exercise adherence was a significant predictor of greater improvements
in walking distance, even when potentially explanatory variables were taken
into account. Moreover, ANCOVA analyses revealed that the tertiles with the
participants who had the best adherence improved significantly more in
walking distance between baseline and, respectively, 6- and 18-month follow-
up compared to the tertile with the participants who had the poorest
adherence. So, in line with a dose-response association, our study showed that
the more participants adhere to the exercise regimen, the more they improve
on walking distance.
We also found a significant association in the short-term period between
high exercise adherence and improvement in disability. Possible explanations
for the association between exercise adherence and disability not being
sustained after 6 six months could be that the first six months of the
intervention were very intensive, with exercise sessions at the facility, for at
least four months. Hereafter, exercise adherence decreased and participants’
improvement in disability could have stagnated. Secondly, knee OA is an
aggravating condition; hence it is possible that participants’ condition declined,
and self-reported disability worsened. Both short- and long-term ANCOVA
analyses revealed that the tertile with participants who had highest adherence
rates – improved significantly more in disability compared to the tertile with
participants who had the poorest adherence.
A potentially mediating or explanatory variable in an association has to
correlate with both the independent, and with the dependent variable. We
found significant correlations with independent and dependent variables for
most, but not all, potentially explanatory variables. Overall, the choice of our
potentially explanatory variables seems justified.
46
3 From our multiple linear regression analyses it seemed that especially
BMI during the intervention period was a contributing variable in explaining the
association between high exercise adherence and improvement in physical
performance. Pain during the intervention period was the most contributing
variable in explaining the association between exercise adherence and
improvement in self-reported disability.
Our results of a positive link between exercise adherence and
improvements in physical performance and self-reported disability are in line
with Ettinger and colleagues (12), who also found significant associations
between high exercise adherence and improvements in physical performance
and disability in a sample which consisted of obese older adults with knee OA
for more than 46%. Conform other studies, we found significant correlations
between high exercise adherence and improvements in pain (5,12). Rejeski,
Ettinger, Martin, & Morgan suggested that changes in knee pain may mediate
effects of exercise interventions on disability (26). From our analyses it also
seemed that decrease in pain during the intervention period was a contributing
variable in explaining the association between high exercise adherence and
improvement in disability. Although it is plausible that exercise does improve
pain levels, a reciprocal association might also be present: participants in great
pain being less likely to exercise and thus not adhere to prescribed exercise
regimen. Participants who do not adhere to exercise regimen are not
exercising (enough), perhaps due to their physical complaints, and will
therefore not experience beneficial effects of exercise on pain. Either way, not
exercising enough could trap persons into a downward spiral, where inactivity
stimulates pain levels and pain results in more inactivity, which eventually
could end in loss of independence.
Empowering patients with knee OA through self-management courses
could break the abovementioned downward spiral. If patients learn to attribute
their symptoms in a cognitive way, beliefs of control over the disease may
increase, levels of fear may decrease, and through the decrease of perceived
barriers, patients might no longer be hesitant about physical activity.
Subsequent perceived benefits of (adherence to) exercise on pain and
disability may eventually result in better disease control. Rejeski and
colleagues (26) already concluded that beliefs of control mediated the effects
47
3 that (adherence to) exercise programs had on disability and health perceptions
in a study among patients with knee OA.
Decrease in BMI was an important mediating variable in the associations
of exercise adherence with physical performance and self-reported disability.
Although decrease in BMI can be associated closely with decrease in pain and
improved stamina, and thus have an effect on physical performance and self-
reported disability, decrease in BMI can also be associated with improvements
in physical impediments, such as decreased skinfold thickness, and increased
dynamic balance and result consequently in improvements in physical
performance and self-reported disability.
In our study, adherence was measured in terms of attendance to
exercise sessions, and not actual level of participation. To some extent, this
obscures the actual effect of the intervention on physical function. However,
attendance to intervention sessions is crucial for participants to acquire
knowledge and skills regarding the core elements of an intervention.
Therefore, we believe that measures of intervention attendance reflect a
certain precursory value of the extent to which a participant is really physically
active. It would serve comparison of results, if more exercise studies would use
attendance measures in their design.
We believe the strength of our study is that we explored the association
between exercise adherence and concurrent change in physical function, over a
short-term, and a long-term period, and tried to explain this association with
modifiable, potentially explanatory variables. Our findings show that higher
exercise adherence goes together with greater physical improvements in a
dose-response fashion, and with improvements in self-reported disability.
Consequently, promoting exercise adherence appears to be clinically relevant
when prescribing exercise regimen, which also focus on improvements in knee
pain and in BMI, to overweight older adults with knee OA.
48
3 3.5 References
1. Brown JH, Kazis LE, Spitz PW, Gertman PJ, Fries F, Meenan RF. The dimensions of health
outcomes: a cross-validated examination of health status measurement. Am J Public
Health 1984; 74(2): 159-61.
2. Ettinger WH Jr, Fried LP, Harris T, Shemanski L, Schulz R, Robbins J. Self-reported causes
of physical disability in older people: the Cardiovascular Health Study. CHS Collaborative
Research Group. J Am Geriatr Soc 1994; 42(10): 1035-44.
3. American College of Rheumatology Subcommittee on Osteoarthritis Guidelines.
Recommendations for the medical management of osteoarthritis of the hip and knee:
2000 update. Arthritis Rheum 2000; 43(9): 1905-15.
4. Penninx BW, Rejeski WJ, Pandya J, Miller ME, Di Bari M, Applegate WB, Pahor M. Exercise
and depressive symptoms: a comparison of aerobic and resistance exercise effects on
emotional and physical function in older persons with high and low depressive
symptomatology. J Gerontol B Psychol Sci Soc Sci 2002; 57(2): P124-32.
5. Thomas KS, Muir KR, Doherty M, Jones AC, O'Reilly SC, Bassey EJ. Home based exercise
programme for knee pain and knee osteoarthritis: randomised controlled trial. BMJ 2002;
325(7367): 752-6.
6. Van der Bij AK, Laurant MG, Wensing M. Effectiveness of physical activity interventions for
older adults: a review. Am J Prev Med 2002; 22(2): 120-33.
7. Dorn J, Naughton J, Imamura D, Trevisan M. Correlates of compliance in a randomized
exercise trial in myocardial infarction patients. Med Sci Sports Exerc 2001; 33(7): 1081-9.
8. Fogelholm M, Kukkonen-Harjula K. Does physical activity prevent weight gain - a
systematic review. Obes Rev 2000; 1(2): 95-111.
9. Borg P, Kukkonen-Harjula K, Fogelholm M, Pasanen M. Effects of walking or resistance
training on weight loss maintenance in obese, middle-aged men: a randomized trial. Int J
Obes Relat Metab Disord 2002; 26(5): 676-83.
10. King AC, Rejeski J, Buchner DM. Physical activity interventions targeting older adults. A
critical review and recommendations. Am J Prev Med 1998; 15: 316-33.
11. Rejeski WJ, Mihalko SL. Physical activity and quality of life in older adults. J Gerontol A
Biol Sci Med Sci 2001; 56 Spec No 2(2): 23-35.
12. Ettinger WH Jr, Burns R, Messier SP, Applegate W, Rejeski WJ, Morgan T, Shumaker S,
Berry MJ, O'Toole M, Monu J, Craven T. A randomized trial comparing aerobic exercise
and resistance exercise with a health education program in older adults with knee
osteoarthritis. The Fitness Arthritis and Seniors Trial (FAST). JAMA 1997; 277(1): 25-31.
13. Belza B, Topolski T, Kinne S, Patrick DL, Ramsey SD. Does adherence make a difference?
Results from a community-based aquatic exercise program. Nurs Res 2002; 51: 285-91.
14. Rejeski WJ, Focht BC, Messier SP, Morgan T, Pahor M, Penninx B. Obese, older adults with
knee osteoarthritis: weight loss, exercise, and quality of life. Health Psychol 2002; 21(5):
419-26.
15. Messier SP, Loeser RF, Miller GD, Morgan TM, Rejeski WJ, Sevick MA, Ettinger WH Jr,
Pahor M, Williamson JD. Exercise and dietary weight loss in overweight and obese older
49
3 adults with knee osteoarthritis: the Arthritis, Diet, and Activity Promotion Trial. Arthritis
Rheum 2004; 50: 1501-10.
16. Miller GD, Rejeski WJ, Williamson JD, Morgan T, Sevick MA, Loeser RF, Ettinger WH Jr,
Messier SP. The Arthritis, Diet and Activity Promotion Trial (ADAPT): design, rationale,
and baseline results. Control Clin Trials 2003; 24: 462-80.
17. Folstein MF, Folstein SE, McHugh PR. "Mini-mental state". A practical method for grading
the cognitive state of patients for the clinician. J Psychiatr Res 1975; 12(3): 189-98.
18. Butland RJ, Pang J, Gross ER, Woodcock AA, Geddes DM. Two-, six-, and 12-minute walk
tests in respiratory disease. BMJ 1982; 284: 1607-8.
19. Rejeski WJ, Ettinger WH Jr, Shumaker S, James P, Burns R, Elam JT. Assessing
performance-related disability in patients with knee osteoarthritis. Osteoarthritis Cartilage
1995; 3(3): 157-67.
20. Rejeski WJ, Ettinger WH Jr, Shumaker S, Heuser MD, James P, Monu J, Burns R. The
evaluation of pain in patients with knee osteoarthritis: the knee pain scale. J Rheumatol
1995; 22(6): 1124-9.
21. Bellamy N, Buchanan WW, Goldsmith CH, Campbell J, Stitt LW. Validation study of
WOMAC: a health status instrument for measuring clinically important patient relevant
outcomes to antirheumatic drug therapy in patients with osteoarthritis of the hip or knee.
J Rheumatol 1988; 15(12): 1833-40.
22. Bellamy N. WOMAC: A 20-Year Experiential Review of a Patient-Centered Self-reported
Health Status Questionnaire. J Rheumatol 2002; 29(12): 2473-6.
23. Ware JE Jr, Sherbourne CD. The MOS 36-item short-form health survey (SF-36). I.
Conceptual framework and item selection. Med Care 1992; 30(6): 473-83.
24. Kosinski M, Keller SD, Hatoum HT, Kong SX, Ware JE Jr. The SF-36 Health Survey as a
generic outcome measure in clinical trials of patients with osteoarthritis and rheumatoid
arthritis: tests of data quality, scaling assumptions and score reliability. Med Care 1999;
37(5 Suppl): MS10-22.
25. King AC, Pruitt LA, Phillips W, Oka R, Rodenburg A, Haskell WL. Comparative effects of
two physical activity programs on measured and perceived physical functioning and other
health-related quality of life outcomes in older adults. J Gerontol A Biol Sci Med Sci 2000;
55(2): M74-83.
26. Rejeski WJ, Ettinger WH Jr, Martin K, Morgan T. Treating disability in knee osteoarthritis
with exercise therapy: a central role for self-efficacy and pain. Arthritis Care Res 1998;
11(2): 94-101.
3.6 Acknowledgement Support for this study was provided by the Claude D. Pepper Older Americans
Independence Center of Wake Forest University through grants from the
National Institutes of Health 5P60-AG-10484-07, and a General Clinical
Research Grant M01-RR00211.

50
3
51
CHAPTER 4 *
Chronic disease and lifestyle changes
Results from the Longitudinal Aging Study Amsterdam
Coen H. van Gool, Gertrudis I.J.M. Kempen, Brenda W.J.H. Penninx, Dorly J.H. Deeg, Jacques Th.M. van Eijk
Abstract This paper addresses the association between course of chronic disease and lifestyle. We examined differences in unhealthy lifestyles – smoking, excessive alcohol use, being sedentary – and lifestyle changes after six years in prevalent and incident chronic disease categories – lung and cardiovascular disease, diabetes, and osteo- and/or rheumatic arthritis – among 2184 late middle- and older aged respondents from the Netherlands. Lastly, we examined whether changes in lifestyle were related to changes in disease-related symptomatology. Overall, proportions of respondents who smoked decreased over time, while proportions of respondents who were sedentary increased. Respondents with incident cardiovascular disease changed their lifestyles more than those from other disease categories. Respondents demonstrating healthy lifestyle changes did not differ in change in disease-related symptoms from those persisting in unhealthy lifestyles. If our findings are replicated in future studies, health promotion strategies might be targeted differently, to reach patient groups for intervention who do not initiate more healthy lifestyles. Key words: chronic disease, lifestyle, symptomatology, longitudinal studies * As submitted to the International Journal of Behavioral Medicine.
52
4 4.1 Introduction
n abundance of studies showed that certain unhealthy lifestyles, such as
smoking, excessive alcohol use, and lack of physical activity, can provoke
or worsen different chronic diseases (e.g., lung disease [Viegi et al., 2001],
cardiovascular disease [CVD; Yusuf et al., 2001; Gohlke, 2004], diabetes
[Eliasson et al., 2004], osteo- and/or rheumatic arthritis [OA/RA; Saag et al.,
1997]). Conversely, healthy lifestyles, such as not smoking, moderate alcohol
use, and daily physical activity, may help preserve physical function and
reduce the risk of disease worsening in patients with chronic diseases (e.g.,
Aldana et al., 2003; Penninx et al., 2001; Baumann, 2004).
Healthy lifestyle changes – from unhealthy behavior to healthy – are
hypothesized to be associated with a more favorable course of chronic
diseases, as compared to persistence in unhealthy lifestyles, and are often
encouraged in self-management programs that aim to enhance coping with
chronic diseases (Clark & Hampson, 2001; Lorig & Holman, 2003; Song et al.,
2003; Eagan et al., 2004). Healthy lifestyle changes can be the result of
patients’ adherence to healthy lifestyle regimens, advised to them by health
professionals (Ellingsen et al., 2003), or may follow from patients’ awareness
of their responsibility for their own health. For some patients their chronic
disease status alone can be a reason to alter their health behavior (Blanchard
et al., 2003). Healthy lifestyle changes can also be the result of patients
behaving according to what society expects from them. This latter
phenomenon – also called ‘behaving according to the social label of disease’ –
has been described before and is known to have changed (health) behavior
(Lemert, 1951; Twaddle & Hessler, 1977); Lastly, healthy lifestyle changes
may follow from personal necessity. Patients may experience serious disease-
related symptoms, for example intense chest pains, and realize that they
cannot go on like before.
This paper addresses the association between course of chronic disease
and lifestyle and examines if our data can support one or more of the reasons
for healthy lifestyle changes desribed in the paragraph above. We studied
prevalences of unhealthy lifestyles – smoking, excessive alcohol use, being
sedentary – and changes in these over a six-year period across prevalent and
incident chronic disease categories in a population-based sample of late
A

53
4 middle- and older aged respondents in the Netherlands. Subsequently, we
examined if changes in lifestyle were related to changes in disease-related
symptomatology, within disease categories.
4.2 Methods Design and Study population
The Longitudinal Aging Study Amsterdam (LASA) is a population-based cohort-
study on predictors and consequences of changes in well-being and autonomy
in the late middle- and older aged population. Sampling, data collection
procedures, and non-response were reported in detail elsewhere (Penninx et
al., 2000; Van den Heuvel et al., 1996). Briefly, a random sample, stratified by
age and gender, was drawn from the population registers of 11 municipalities,
divided over three geographic regions in the Netherlands. Initially, 3107
respondents, aged 55-85 years, were enrolled in the study. The baseline cycle
was in 1992 and 1993 and consisted of two interview sessions, termed the
main and medical interview. A group of 352 respondents, all born after 1930,
did not receive the medical interview after participation in the baseline main
interview and had incomplete data on lifestyle variables by default. Finally, a
group of 571 (20.7%) respondents chose not to participate after the main
interview (n=519) or had incomplete data at baseline (n=52), leaving our
baseline sample with 2184 (79.3%) respondents. After six years, respondents
were approached for follow-up (Broese van Groenou, Deeg, & Penninx, 2003).
Between baseline and follow-up medical interview, 549 (25.1%) respondents
died, 132 (6.1%) refused participation, 138 (6.3%) were interviewed by
telephone and had no data on lifestyle variables, 74 (3.4%) respondents were
unable to participate due to cognitive or physical impairments, 57 (2.6%)
could not be contacted, and 67 (3.1%) respondents had incomplete data on
the follow-up medical interview, leaving 1167 (53.4%) respondents at follow-
up.
Measurements
Chronic Disease Status
Self-reported chronic disease status was assessed at both baseline and follow-
up, using an adapted form of the Dutch Health Interview Questionnaire
54
4 (Statistics Netherlands, 1989). Respondents were asked whether or not they
had a specific disease. The list of diseases was summed and included lung
disease (including chronic obstructive pulmonary disease [COPD], emphysema,
bronchitis, asthma), CVD (including coronary heart disease [CHD],
cerebrovascular accident [CVA], peripheral arterial disease [PAD]), diabetes,
and osteo- and/or rheumatic arthritis [OA/RA]. Respondents could indicate if
they had other chronic diseases that were not summed. Because of the
heterogeneous character of the physical complaints that go with cancer, we
categorized this ailment into the ‘other diseases’ category. Due to
heterogeneity in this ‘other diseases’ category, the chronic disease categories
of interest for this study were limited to four: lung disease, CVD, diabetes, and
OA/RA. Reported diseases at baseline were ‘prevalent’. Reported diseases at
follow-up that were not reported at baseline, were ‘incident’. Cohen’s Kappa’s
for concordance between patient and general practitioner compared to non-
patient and general practitioner in our study ranged from 0.31 for OA/RA, and
0.59 for lung disease, to 0.69 for heart disease, and 0.85 for diabetes
(Kriegsman et al., 1996).
Disease-related symptomatology
Disease-related symptomatology was assessed using self-reported symptom
inventories of the chronic diseases at both data collection cycles (Kriegsman et
al., 1997). The symptom inventory of lung disease included eight questions
about the frequency of coughing, coughing up phlegm, wheezing, shortness of
breath, and the quality of the respondents’ night rest. Scores ranged from 0 to
11, with higher scores indicating more lung disease-related symptoms. The
symptom inventory of CHD included five questions about the frequency of
chest pains, and how fast these pains disappear, swollen feet at getting up and
going to bed, and the use of extra pillows at night. Scores ranged from 0 to 6,
with higher scores indicating more CHD-related symptoms. The symptom
inventory of PAD included three questions about pain experienced when
walking, and whether this pain disappears when stopping walking. Scores
ranged from 0 to 4, with higher scores indicating more PAD-related symptoms.
The symptom inventory of CVA included four questions about problems with
the use of arms, hands, or legs ever since the occurrence of the CVA (yes/no),
55
4 problems with vision since the CVA (yes/no), problems with speech since the
CVA (yes/no), and problems with understanding written text (yes/no). Scores
range from 0 to 4, with higher scores indicating more CVA-related symptoms.
The composite variable for symptoms regarding cardiovascular disease (CVD)
included the sum of the abovementioned symptom inventories of CHD, PAD,
and CVA, and ranged from 0 to 14 with higher scores indicating more CVD-
related symptoms. The symptom inventory of diabetes included six questions
about the frequency of chest pains, pain experienced when walking, and
whether this pain disappears when stopping walking. Scores ranged from 0 to
8, with higher scores indicating more diabetes-related symptoms. The
combined symptom inventory of OA/RA included 12 questions about the
frequency of pain, stiffness, and swelling of joints, and the prevalence of
arthritic symptoms in a list of joints. Scores ranged from 0 to 12, with higher
scores indicating more arthritis-related symptoms. For patients with prevalent
disease, we computed a disease-specific symptomatology change score
(follow-up minus baseline), with higher scores indicating greater increase in
disease-related symptoms. For patients with incident disease only follow-up
disease-related symptoms were taken into consideration.
Lifestyle variables
Respondents’ self-reported smoking behavior was assessed at baseline and
follow-up, and was initially dichotomized into ‘not smoking’ versus ‘smoking
([self-rolled] cigarettes, cigars, pipe)’. Also, we measured the average number
of cigarettes smoked per week among persons who smoked cigarettes. We
also used a smoking behavior change score over a period of six years to
indicate whether or not respondents had ceased smoking. When respondents
reported smoking cigarettes either at baseline or at follow-up, average number
of cigarettes smoked per week was used to compute a continuous follow-up
minus baseline change score, with negative change scores indicating decrease
in average number of cigarettes smoked per week over a six-year period.
Respondents’ self-reported alcohol intake was assessed at baseline and
follow-up, and was categorized into ‘no alcohol use at all’, ‘light or moderate
alcohol use (i.e. drinking up to two alcoholic consumptions on average per
day)’, or ‘excessive alcohol use (i.e. drinking more than two alcoholic

56
4 consumptions on average per day)’. We also used an alcohol intake change
score over a period of six years to indicate whether or not respondents had
ceased excessive alcohol use. Also, we used baseline and follow-up average
number of alcoholic consumptions per week to compute a continuous follow-up
minus baseline change score, with negative change scores indicating decrease
in average number of alcoholic consumptions per week over six years.
At baseline and follow-up, averaged daily minutes of physical activity
was computed by multiplying self-reported frequency and duration of walking,
cycling, sports, and light (e.g., doing the dishes, or ironing) and heavy (e.g.,
cleaning windows, or vacuum cleaning) household chores (Stel et al., 2004). If
either frequency of the activity was missing, or time spent on the activity in
minutes, these were imputed by gender- and activity-specific series means.
Averaged daily minutes of physical activity was then dichotomized into the
lowest quartile on the one hand, representing ‘sedentary lifestyle’, versus the
upper three quartiles on the other, representing ‘active lifestyle’. The cut-off
score to determine sedentary lifestyle was <86 minutes of averaged daily
physical activity, both at baseline and follow-up. A six-year period change
score was computed to indicate whether or not respondents had become
active. Also, we used baseline and follow-up average number of minutes of
physical activity per day, to compute a change score (follow-up minus
baseline), with positive change scores indicating increase in minutes of
physical activity per day over a of six-year period.
Covariates
Potentially confounding covariates were age, gender, and educational level.
The latter ranged from 1 (not finished elementary school) to 9 (finished
university). Since respondents could report more than one chronic disease,
multimorbidity – number of self-reported diseases, including those in the ‘other
diseases’ category – was used as a covariate, ranged from 0 to 10, and was
assessed at both data collection cycles. Also, a follow-up minus baseline
multimorbidity change score was used in longitudinal analyses, with higher
scores indicating greater increase in number of chronic diseases over a six-
year period.
57
4 Statistical Analyses
Following descriptive sample analyses at baseline, we compared lifestyle and
covariate means, as well as proportional differences in lifestyle and covariates,
for each prevalent chronic disease category at baseline, using Chi-square and
one-sample t-tests, and (multinomial) logistic regression analyses adjusted for
covariates. Lifestyle changes between baseline and follow-up were examined
separately for prevalent versus incident categories of the four chronic disease
categories, using McNemar tests for one-sample dependent observations.
Kruskall-Wallis non-parametric tests were used to explore continuous lifestyle
change variables among respondents who smoked, used alcohol excessively,
or had a sedentary lifestyle at baseline, for each chronic disease category.
Finally, we examined if change in disease-related symptoms differed between
respondents who showed a healthy lifestyle change and respondents who
persisted in unhealthy lifestyles, within each chronic disease category, using
multivariate analyses of variance. These analyses were performed both
unadjusted, and adjusted for age, gender, education, and change in
multimorbidity. Data were analyzed using SPSS 11.5. Level of significance in
all analyses was p < 0.05.
4.3 Results Baseline
Compared to respondents in the study sample with complete data on all key
variables at baseline (n=2184), respondents who chose not to participate after
the main interview or had incomplete data at baseline (n=571), were older
(74.6 ± 7.9 versus [vs.] 71.7 ± 8.0; p < .001), were more likely to be in the
category of elementary through lower vocational education (73.0% vs. 63.0%;
p < .001), were more likely to have CVD (34.7% vs. 29.2%; p < .05), were
more likely to have diabetes (11.0% vs. 7.8%, p < .05), were more likely to
smoke (32.7% vs. 23.9%; p < .05), and drank fewer alcoholic drinks per week
on average (4.2 ± 8.6 vs. 7.1 ± 10.0; p < .001; not tabulated).
Table 4.1 shows chronic disease prevalence figures across categories of
background variables at baseline. Respondents in all chronic disease categories
were older compared to respondents in the rest of the sample not reporting
that specific chronic disease. Also, all four chronic diseases became more
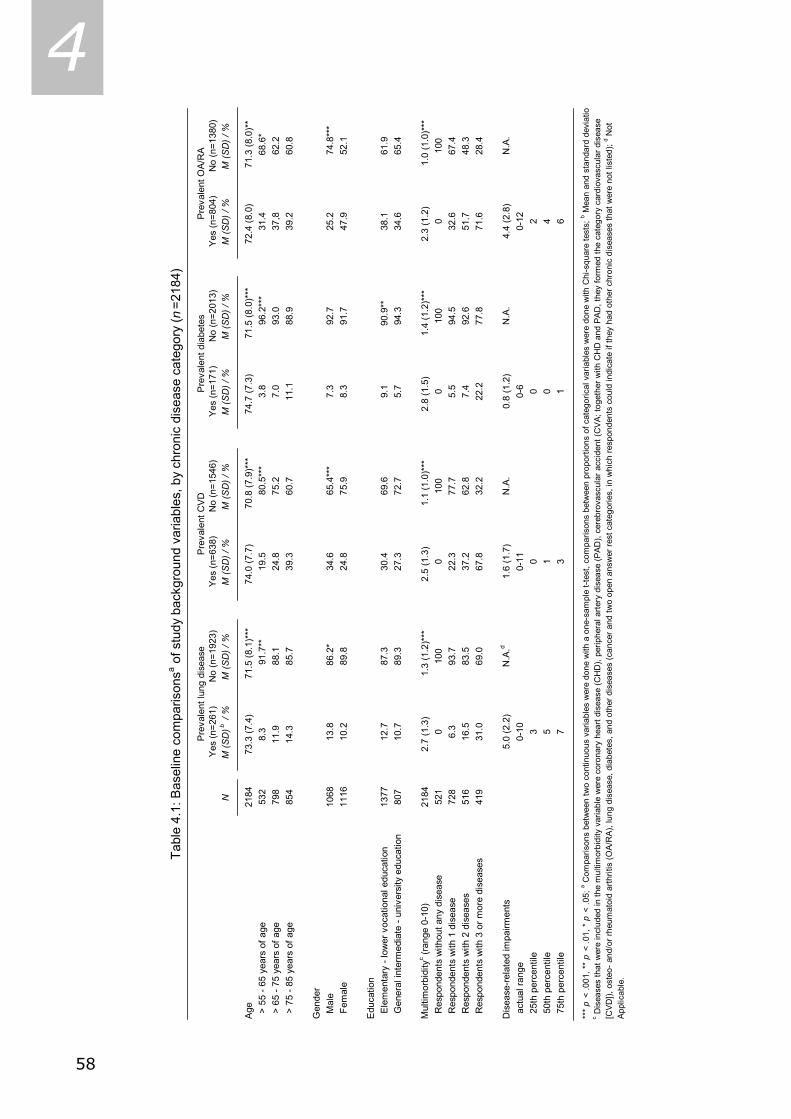
58
4
Yes
(n=2
61)
No
(n=1
923)
Yes
(n=6
38)
No
(n=1
546)
Yes
(n=1
71)
No
(n=2
013)
Yes
(n=8
04)
No
(n=1
380)
NM
(SD
)b /
%M
(SD
) / %
M (S
D) /
%M
(SD
) / %
M (S
D) /
%M
(SD
) / %
M (S
D) /
%M
(SD
) / %
Age
2184
73.3
(7.4
) 7
1.5
(8.1
)***
74.0
(7.7
) 7
0.8
(7.9
)***
74.7
(7.3
) 7
1.5
(8.0
)***
72.4
(8.0
) 7
1.3
(8.0
)**
> 5
5 - 6
5 ye
ars
of a
ge53
28.
3
91
.7**
19.5
8
0.5*
**3.
8
96.
2***
31.4
68.
6* >
65
- 75
year
s of
age
798
11.9
88
.124
.875
.27.
093
.037
,862
.2 >
75
- 85
year
s of
age
854
14.3
85
.739
.360
.711
.188
.939
.260
.8
Gen
der
Mal
e10
6813
.8 8
6.2*
34.6
6
5.4*
**7.
392
.725
.2
74.
8***
Fem
ale
1116
10.2
89.8
24.8
75.9
8.3
91.7
47.9
52.1
Edu
catio
n E
lem
enta
ry -
low
er v
ocat
iona
l edu
catio
n13
7712
.787
.330
.469
.69.
1 9
0.9*
*38
.161
.9 G
ener
al in
term
edia
te -
univ
ersi
ty e
duca
tion
807
10.7
89.3
27.3
72.7
5.7
94.3
34.6
65.4
Mul
timor
bidi
tyc (r
ange
0-1
0)
2184
2.7
(1.3
) 1
.3 (1
.2)*
**2.
5 (1
.3)
1.1
(1.0
)***
2.8
(1.5
) 1
.4 (1
.2)*
**2.
3 (1
.2)
1.0
(1.0
)***
Res
pond
ents
with
out a
ny d
isea
se52
10
100
010
00
100
010
0 R
espo
nden
ts w
ith 1
dis
ease
728
6.3
93.7
22.3
77.7
5.5
94.5
32.6
67.4
Res
pond
ents
with
2 d
isea
ses
516
16.5
83.5
37.2
62.8
7.4
92.6
51.7
48.3
Res
pond
ents
with
3 o
r mor
e di
seas
es41
931
.069
.067
.832
.222
.277
.871
.628
.4
Dis
ease
-rel
ated
impa
irmen
ts5.
0 (2
.2)
N.A
.d 1.
6 (1
.7)
N.A
.0.
8 (1
.2)
N.A
.4.
4 (2
.8)
N.A
. a
ctua
l ran
ge0-
100-
110-
60-
12 2
5th
perc
entil
e3
00
2 5
0th
perc
entil
e5
10
4 7
5th
perc
entil
e7
31
6
***
p <
.001
, **
p <
.01,
* p
< .0
5; a C
ompa
rison
s be
twee
n tw
o co
ntin
uous
var
iabl
es w
ere
done
with
a o
ne-s
ampl
e t-t
est,
com
paris
ons
betw
een
prop
ortio
ns o
f cat
egor
ical
var
iabl
es w
ere
done
with
Chi
-squ
are
test
s; b M
ean
and
stan
dard
dev
iatio
c Dis
ease
s th
at w
ere
incl
uded
in th
e m
ultim
orbi
dity
var
iabl
e w
ere
coro
nary
hea
rt di
seas
e (C
HD
), pe
riphe
ral a
rtery
dis
ease
(PAD
), ce
rebr
ovas
cula
r acc
iden
t (C
VA; t
oget
her w
ith C
HD
and
PAD
, the
y fo
rmed
the
cate
gory
car
diov
ascu
lar d
isea
se
[CVD
]), o
steo
- and
/or r
heum
atoi
d ar
thrit
is (O
A/R
A), l
ung
dise
ase,
dia
bete
s, a
nd o
ther
dis
ease
s (c
ance
r and
two
open
ans
wer
rest
cat
egor
ies,
in w
hich
resp
onde
nts
coul
d in
dica
te if
they
had
oth
er c
hron
ic d
isea
ses
that
wer
e no
t lis
ted)
; d Not
A
pplic
able
.
Tabl
e 4.
1: B
asel
ine
com
paris
onsa o
f stu
dy b
ackg
roun
d va
riabl
es, b
y ch
roni
c di
seas
e ca
tego
ry ( n
=218
4)
Pre
vale
nt lu
ng d
isea
seP
reva
lent
CV
DP
reva
lent
dia
bete
sP
reva
lent
OA
/RA
59
4 prevalent across increasing age-categories. Proportionally more men than
women reported lung disease and/or CVD (13.8% vs. 10.7% and 34.6% vs.
24.8%, respectively), while proportionally more women than men reported
OA/RA (47.9% vs. 25.2%). Also, proportionally more respondents with
elementary through lower vocational education than respondents with general
intermediate through university education reported diabetes (9.1% vs. 5.7%).
Regarding multimorbidity, respondents in the chronic disease categories
reported an average of 2.7 (± 1.3), 2.5 (± 1.3), 2.8 (± 1.5), and 2.3 (± 1.2)
chronic conditions, respectively. Exactly one-third of our baseline sample
reported having one chronic disease (n=728). Among respondents reporting
two diseases (n=516), prevalence figures of lung disease and diabetes are
lower than those of CVD and OA/RA. Finally, two out of three respondents
reporting three or more diseases (n=419) were likely to have CVD, and almost
three out of four respondents reporting three or more diseases were likely to
have OA/RA.
Respondents with lung disease reported a mean of 5.0 (± 2.2)
symptoms at baseline, on a theoretical score range from 0 to 11 with an actual
score range from 0 to 10, with higher scores indicating more disease-related
symptoms. Respondents with CVD reported a mean of 1.6 (± 1.7) disease-
related symptoms at baseline, with an actual score range from 0 to 11 on a
theoretical score range from 0 to 14. Respondents with diabetes reported a
mean of 0.8 (± 1.2) symptoms at baseline, with an actual score range from 0
to 6 on a theoretical score range from 0 to 8. The distributions of CVD- and
diabetes-related symptoms appeared to be non-normal, as these were skewed
positively. Respondents with OA/RA reported a mean of 4.4 (± 2.8) disease-
related symptoms at baseline, with an actual score range from 0 to 12 on a
theoretical score range from 0 to 12 (Table 4.1).
At baseline, 23.9% of the respondents were current smokers, 19.2%
reported excessive alcohol use, and 25.0% were sedentary. As shown in Table
4.2, the proportion of smokers was lower among respondents with OA/RA,
compared to the rest of the study sample (20.4% vs. 25.9%). However, this
association became non-significant in logistic regression analyses, adjusting for
the covariates age, gender, educational level, and multimorbidity. Respondents
with CVD at baseline smoked significantly fewer cigarettes on average per
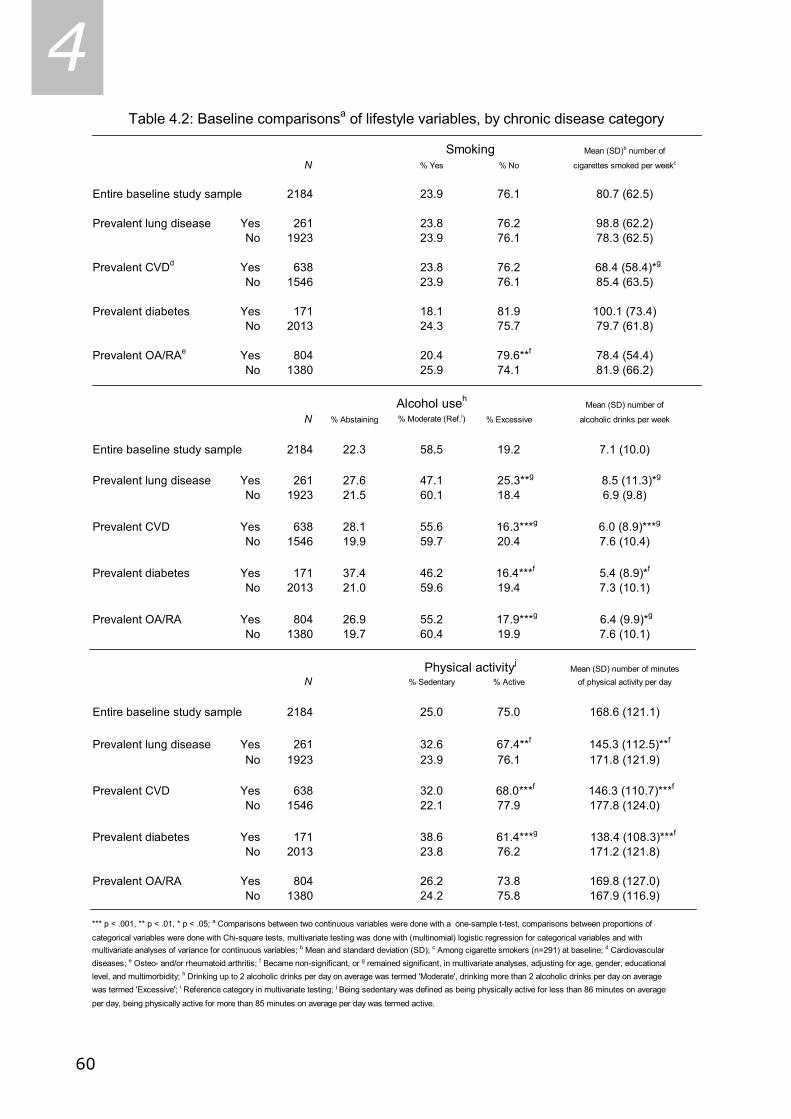
60
4 N % Yes % No
Entire baseline study sample 2184 23.9 76.1
Prevalent lung disease Yes 261 23.8 76.2No 1923 23.9 76.1
Prevalent CVDd Yes 638 23.8 76.2No 1546 23.9 76.1
Prevalent diabetes Yes 171 18.1 81.9No 2013 24.3 75.7
Prevalent OA/RAe Yes 804 20.4 79.6**f
No 1380 25.9 74.1
N % Abstaining % Moderate (Ref.i) % Excessive
Entire baseline study sample 2184 22.3 58.5 19.2
Prevalent lung disease Yes 261 27.6 47.1 25.3**g
No 1923 21.5 60.1 18.4
Prevalent CVD Yes 638 28.1 55.6 16.3***g
No 1546 19.9 59.7 20.4
Prevalent diabetes Yes 171 37.4 46.2 16.4***f
No 2013 21.0 59.6 19.4
Prevalent OA/RA Yes 804 26.9 55.2 17.9***g
No 1380 19.7 60.4 19.9
N % Sedentary % Active
Entire baseline study sample 2184 25.0 75.0
Prevalent lung disease Yes 261 32.6 67.4**f
No 1923 23.9 76.1
Prevalent CVD Yes 638 32.0 68.0***f
No 1546 22.1 77.9
Prevalent diabetes Yes 171 38.6 61.4***g
No 2013 23.8 76.2
Prevalent OA/RA Yes 804 26.2 73.8No 1380 24.2 75.8
*** p < .001, ** p < .01, * p < .05; a Comparisons between two continuous variables were done with a one-sample t-test, comparisons between proportions of
categorical variables were done with Chi-square tests, multivariate testing was done with (multinomial) logistic regression for categorical variables and withmultivariate analyses of variance for continuous variables; b Mean and standard deviation (SD); c Among cigarette smokers (n=291) at baseline; d Cardiovascular diseases; e Osteo- and/or rheumatoid arthritis; f Became non-significant, or g remained significant, in multivariate analyses, adjusting for age, gender, educational level, and multimorbidity; h Drinking up to 2 alcoholic drinks per day on average was termed 'Moderate', drinking more than 2 alcoholic drinks per day on average was termed 'Excessive'; i Reference category in multivariate testing; j Being sedentary was defined as being physically active for less than 86 minutes on average per day, being physically active for more than 85 minutes on average per day was termed active.
Table 4.2: Baseline comparisonsa of lifestyle variables, by chronic disease category
78.3 (62.5)
85.4 (63.5)
100.1 (73.4)
68.4 (58.4)*g
80.7 (62.5)
81.9 (66.2)
cigarettes smoked per weekc
Mean (SD)b number of
98.8 (62.2)
79.7 (61.8)
78.4 (54.4)
alcoholic drinks per week
Mean (SD) number of
6.0 (8.9)***g
7.6 (10.4)
8.5 (11.3)*g
6.9 (9.8)
7.1 (10.0)
5.4 (8.9)*f
7.3 (10.1)
6.4 (9.9)*g
7.6 (10.1)
138.4 (108.3)***f
Mean (SD) number of minutesof physical activity per day
168.6 (121.1)
171.2 (121.8)
145.3 (112.5)**f
171.8 (121.9)
146.3 (110.7)***f
169.8 (127.0)167.9 (116.9)
Smoking
Alcohol useh
Physical activityj
177.8 (124.0)

61
4 week than the rest of the study sample. This association remained significant
in multivariate analyses. Respondents with lung disease reported more than
the rest of the study sample either to abstain from alcohol use, or to use
alcohol excessively (27.6% vs. 21.5%, and 25.3% vs. 18.4%, respectively;
Table 4.2). In contrast, respondents with CVD, diabetes, and/or OA/RA
reported less excessive alcohol intake than the rest of the study sample
(16.3% vs. 20.4%, 16.4% vs. 19.4%, and 17.9 vs. 19.9%, respectively). In
multivariate multinomial logistic regression analyses, only the association
between having diabetes and alcohol use became non-significant. Respondents
with lung disease reported to drink more glasses of alcohol on average per
week than their counterparts in the rest of the study sample (8.5 ± 11.3 vs.
6.9 ± 9.8), whereas respondents with CVD, diabetes, and/or OA/RA reported
to drink fewer glasses of alcohol than their counterparts in the rest of the
study sample (6.1 ± 8.9 vs. 7.6 ± 10.4, 5.4 ± 8.9 vs. 7.3 ± 10.1, and 6.4 ±
10.1 vs. 7.5 ± 10.0, respectively; Table 4.2). When tested in multivariate
analyses, adjusted for covariates, the association between having diabetes and
baseline average number of alcoholic drinks per week became non-significant.
In all chronic disease categories but the OA/RA category, proportions of
respondents who reported sedentary lifestyles were significantly larger
compared to the rest of the sample. Except for the OA/RA category,
respondents in chronic disease categories reported less average minutes of
physical activity per day than their counterparts in the rest of the sample
without that chronic disease (Table 4.2). However, when tested in multivariate
analyses, adjusted for covariates, only the association between having
diabetes and being sedentary remained significant.
Follow-up
Compared to respondents in the study sample with complete data on all key
variables at baseline and follow-up (n=1167), at baseline, respondents in the
attrition group (n=1017) were older (74.1 ± 8.2 vs. 69.6 ± 7.3; p < .001),
were more likely to be male (51.6% vs. 46.5%; p < .05), were more likely to
be in the category of elementary through lower vocational education (68.5%
vs. 58.3%; p < .001), had higher multimorbidity scores (1.6 ± 1.3 vs. 1.3 ±
1.2; p < .001), were more likely to have lung disease (14.1% vs. 10.1%; p <
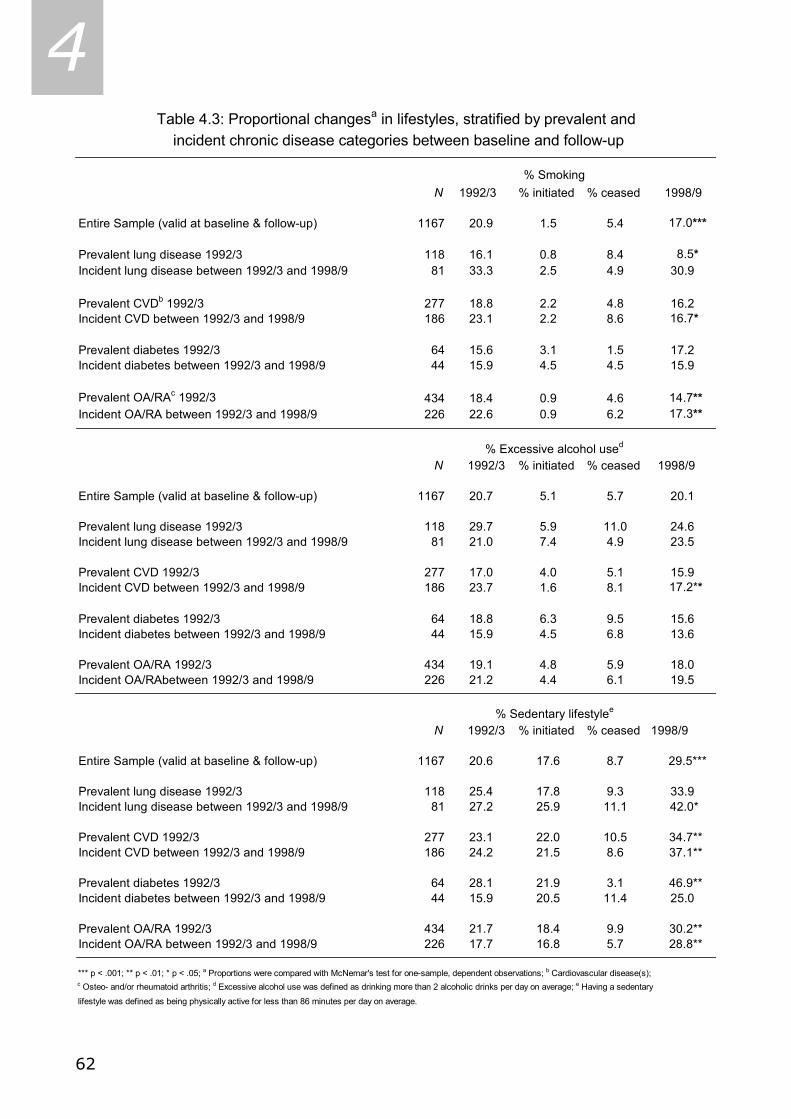
62
4
N 1992/3 % initiated % ceased 1998/9
Entire Sample (valid at baseline & follow-up) 1167 20.9 1.5 5.4 17.0***
Prevalent lung disease 1992/3 118 16.1 0.8 8.4 8.5*Incident lung disease between 1992/3 and 1998/9 81 33.3 2.5 4.9 30.9
Prevalent CVDb 1992/3 277 18.8 2.2 4.8 16.2Incident CVD between 1992/3 and 1998/9 186 23.1 2.2 8.6 16.7*
Prevalent diabetes 1992/3 64 15.6 3.1 1.5 17.2Incident diabetes between 1992/3 and 1998/9 44 15.9 4.5 4.5 15.9
Prevalent OA/RAc 1992/3 434 18.4 0.9 4.6 14.7**Incident OA/RA between 1992/3 and 1998/9 226 22.6 0.9 6.2 17.3**
N 1992/3 % initiated % ceased 1998/9
Entire Sample (valid at baseline & follow-up) 1167 20.7 5.1 5.7 20.1
Prevalent lung disease 1992/3 118 29.7 5.9 11.0 24.6Incident lung disease between 1992/3 and 1998/9 81 21.0 7.4 4.9 23.5
Prevalent CVD 1992/3 277 17.0 4.0 5.1 15.9Incident CVD between 1992/3 and 1998/9 186 23.7 1.6 8.1 17.2**
Prevalent diabetes 1992/3 64 18.8 6.3 9.5 15.6Incident diabetes between 1992/3 and 1998/9 44 15.9 4.5 6.8 13.6
Prevalent OA/RA 1992/3 434 19.1 4.8 5.9 18.0Incident OA/RAbetween 1992/3 and 1998/9 226 21.2 4.4 6.1 19.5
N 1992/3 % initiated % ceased 1998/9
Entire Sample (valid at baseline & follow-up) 1167 20.6 17.6 8.7 29.5***
Prevalent lung disease 1992/3 118 25.4 17.8 9.3 33.9Incident lung disease between 1992/3 and 1998/9 81 27.2 25.9 11.1 42.0*
Prevalent CVD 1992/3 277 23.1 22.0 10.5 34.7**Incident CVD between 1992/3 and 1998/9 186 24.2 21.5 8.6 37.1**
Prevalent diabetes 1992/3 64 28.1 21.9 3.1 46.9**Incident diabetes between 1992/3 and 1998/9 44 15.9 20.5 11.4 25.0
Prevalent OA/RA 1992/3 434 21.7 18.4 9.9 30.2**Incident OA/RA between 1992/3 and 1998/9 226 17.7 16.8 5.7 28.8**
*** p < .001; ** p < .01; * p < .05; a Proportions were compared with McNemar's test for one-sample, dependent observations; b Cardiovascular disease(s); c Osteo- and/or rheumatoid arthritis; d Excessive alcohol use was defined as drinking more than 2 alcoholic drinks per day on average; e Having a sedentary
lifestyle was defined as being physically active for less than 86 minutes per day on average.
Table 4.3: Proportional changesa in lifestyles, stratified by prevalent and incident chronic disease categories between baseline and follow-up
% Excessive alcohol used
% Sedentary lifestylee
% Smoking
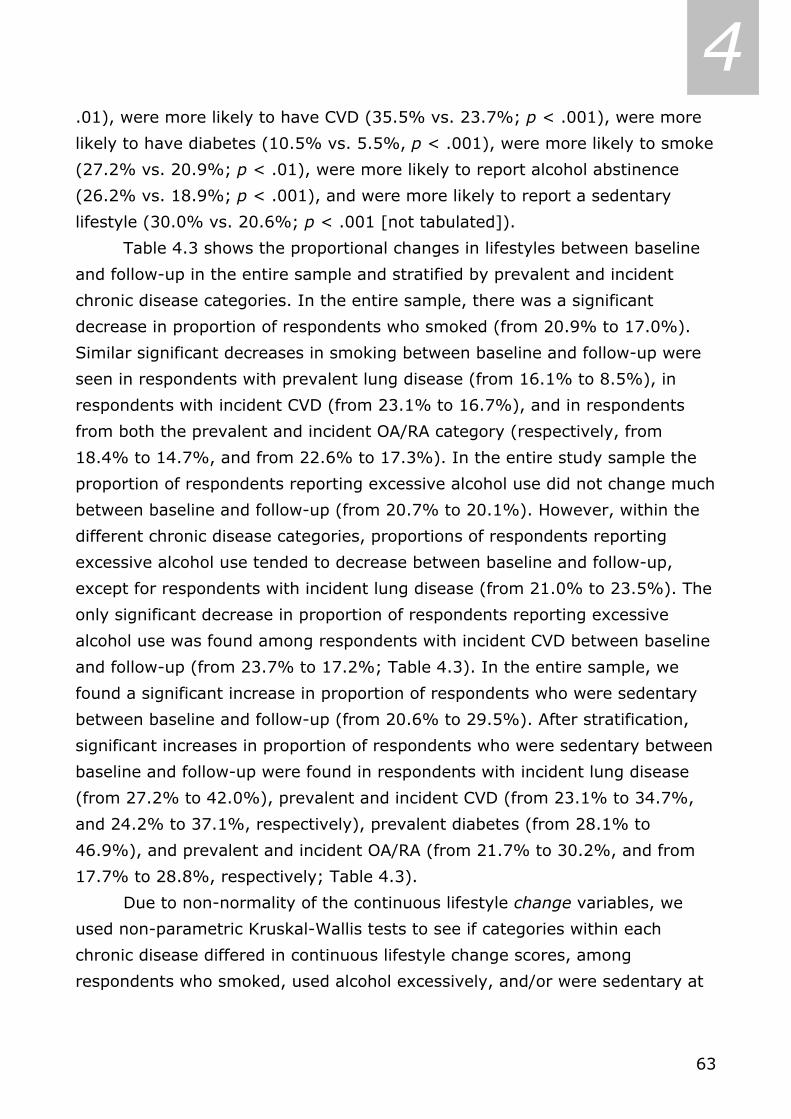
63
4 .01), were more likely to have CVD (35.5% vs. 23.7%; p < .001), were more
likely to have diabetes (10.5% vs. 5.5%, p < .001), were more likely to smoke
(27.2% vs. 20.9%; p < .01), were more likely to report alcohol abstinence
(26.2% vs. 18.9%; p < .001), and were more likely to report a sedentary
lifestyle (30.0% vs. 20.6%; p < .001 [not tabulated]).
Table 4.3 shows the proportional changes in lifestyles between baseline
and follow-up in the entire sample and stratified by prevalent and incident
chronic disease categories. In the entire sample, there was a significant
decrease in proportion of respondents who smoked (from 20.9% to 17.0%).
Similar significant decreases in smoking between baseline and follow-up were
seen in respondents with prevalent lung disease (from 16.1% to 8.5%), in
respondents with incident CVD (from 23.1% to 16.7%), and in respondents
from both the prevalent and incident OA/RA category (respectively, from
18.4% to 14.7%, and from 22.6% to 17.3%). In the entire study sample the
proportion of respondents reporting excessive alcohol use did not change much
between baseline and follow-up (from 20.7% to 20.1%). However, within the
different chronic disease categories, proportions of respondents reporting
excessive alcohol use tended to decrease between baseline and follow-up,
except for respondents with incident lung disease (from 21.0% to 23.5%). The
only significant decrease in proportion of respondents reporting excessive
alcohol use was found among respondents with incident CVD between baseline
and follow-up (from 23.7% to 17.2%; Table 4.3). In the entire sample, we
found a significant increase in proportion of respondents who were sedentary
between baseline and follow-up (from 20.6% to 29.5%). After stratification,
significant increases in proportion of respondents who were sedentary between
baseline and follow-up were found in respondents with incident lung disease
(from 27.2% to 42.0%), prevalent and incident CVD (from 23.1% to 34.7%,
and 24.2% to 37.1%, respectively), prevalent diabetes (from 28.1% to
46.9%), and prevalent and incident OA/RA (from 21.7% to 30.2%, and from
17.7% to 28.8%, respectively; Table 4.3).
Due to non-normality of the continuous lifestyle change variables, we
used non-parametric Kruskal-Wallis tests to see if categories within each
chronic disease differed in continuous lifestyle change scores, among
respondents who smoked, used alcohol excessively, and/or were sedentary at

64
4
No lun
g dise
ase
Prevale
nt lun
g dis.
Incide
nt lun
g dis.
No CVD
Prevale
nt CVD
Incide
nt CVD
No diab
etes
Prevale
nt dia
betes
Incide
nt dia
betes
No OA/R
A
Prevale
nt OA/R
A
Incide
nt OA/R
A
0102030405060
Follo
w-u
pB
asel
ine
NB
: C
ateg
orie
s w
ithin
chr
onic
dis
ease
s ar
e m
utua
lly e
xclu
sive
; 198
resp
onde
nts
who
sm
oked
had
no
lung
dis
ease
, 19
resp
onde
nts
who
sm
oked
had
pre
vale
nt lu
ng d
isea
se, a
nd 2
7 re
spon
dent
s w
ho s
mok
ed h
ad
inci
dent
lung
dis
ease
; 149
resp
onde
nts
who
sm
oked
had
no
CVD
, 52
resp
onde
nts
who
sm
oked
had
pre
vale
nt C
VD
, and
43
resp
onde
nts
who
sm
oked
had
inci
dent
CV
D; 2
27 re
spon
dent
s w
ho s
mok
ed h
ad n
o di
abet
es,
10 re
spon
dent
s w
ho s
mok
ed h
ad p
reva
lent
dia
bete
s, a
nd 7
resp
onde
nts
who
sm
oked
had
inci
dent
dia
bete
s; 1
13 re
spon
dent
s w
ho s
mok
ed h
ad n
o O
A/R
A, 8
0 re
spon
dent
s w
ho s
mok
ed h
ad p
reva
lent
OA
/RA
, and
51
resp
onde
nts
who
sm
oked
had
inci
dent
OA
/RA
; Kru
skal
-Wal
lis n
on-p
aram
etric
test
s w
ere
used
to c
ompa
re c
hang
es in
mea
n nu
mbe
r of c
igar
ette
s sm
oked
per
wee
k at
bas
elin
e an
d fo
llow
-up
betw
een
cate
gorie
s w
ithin
ea
ch d
isea
se, a
nd y
ield
ed n
o si
gnifi
cant
resu
lts.
Figu
re 4
.1a:
Mea
n nu
mbe
r of c
igar
ette
s sm
oked
at b
asel
ine
and
6-ye
ar fo
llow
-up,
am
ong
ciga
rette
sm
oker
s at
bas
elin
e (N
=244
), st
ratif
ied
by c
hron
ic d
isea
se c
ateg
orie
s
Number of cigarettes smoked per week
65
4 baseline. In the figures we depicted grouped means of both baseline and
follow-up continuous lifestyle scores. Among smokers at baseline (Figure
4.1a), respondents with prevalent lung disease and/or prevalent diabetes
appeared to cut down relatively more on number of cigarettes smoked per
week compared to respondents with incident lung disease and/or incident
diabetes. In the CVD and OA/RA categories this pattern could not be
established. Among excessive alcohol users at baseline (Figure 4.1b),
respondents with prevalent diabetes appeared to cut down relatively more on
number of alcoholic drinks per week than respondents in other prevalent or
incident chronic disease categories, followed by respondents with incident CVD
(Figure 4.1b). Improvement in minutes of physical activity per day among
respondents who were sedentary at baseline and had no diabetes, prevalent
diabetes, or incident diabetes differed significantly: respondents with prevalent
diabetes appeared to improve less in minutes of physical activity per day
compared to the other two categories (Figure 4.1c).
Consequently, we compared adjusted means of changes in disease-
related symptomatology in prevalent and incident disease categories between
respondents who showed a healthy lifestyle change, i.e. ceased smoking,
ceased using alcohol excessively, and/or initiated an active lifestyle, on the one
hand and those who persisted in their unhealthy lifestyle, i.e. continued
smoking, using alcohol excessively, and/or being sedentary, on the other.
These analyses were performed only for the 11 disease categories in which
lifestyles changed significantly, as shown in Table 4.3, and were performed
both unadjusted and adjusted for covariates. The analyses yielded no
statistically significant differences in disease-related symptoms between
respondents who showed a healthy lifestyle change and those who persisted in
their unhealthy lifestyle (not tabulated).
4.4 Discussion This study addressed the associations between chronic disease and lifestyle
domains. We described and examined the prevalence of lifestyles – smoking,
excessive alcohol use, being physically active – and proportional changes in
these lifestyles over a six-year period across chronic disease categories in a
population-based sample of late middle- and older aged respondents in the
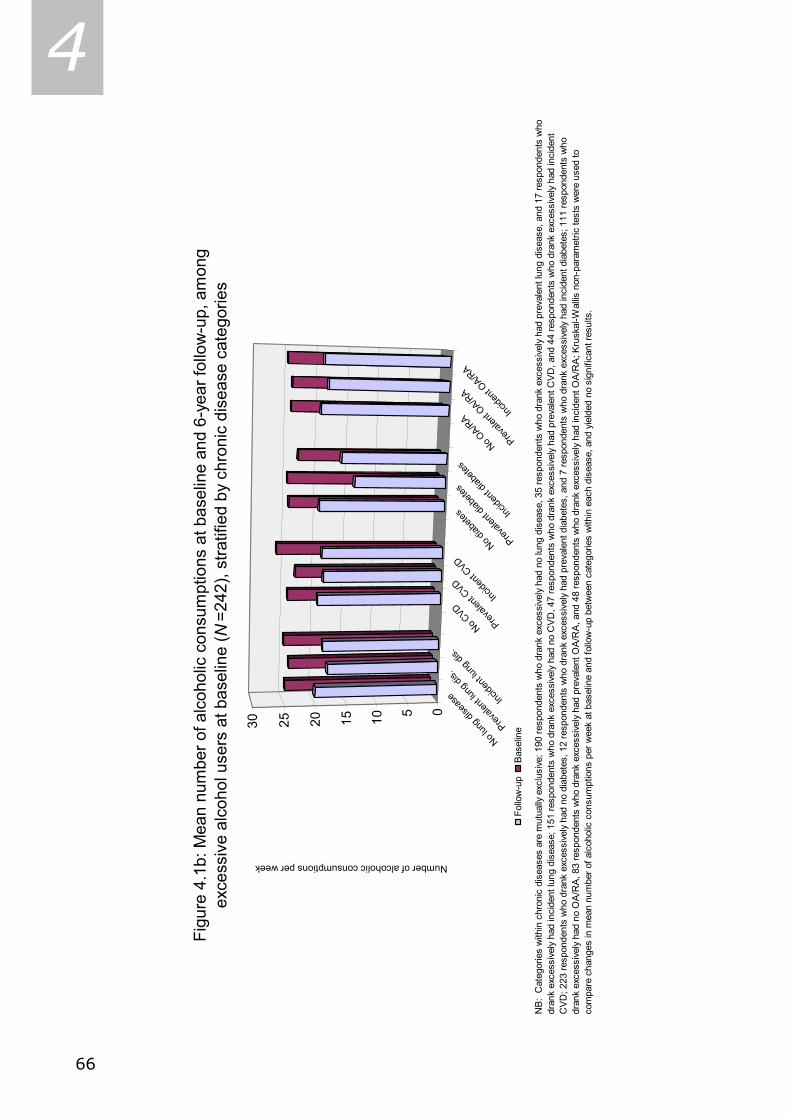
66
4
Figu
re 4
.1b:
Mea
n nu
mbe
r of a
lcoh
olic
con
sum
ptio
ns a
t bas
elin
e an
d 6-
year
follo
w-u
p, a
mon
gex
cess
ive
alco
hol u
sers
at b
asel
ine
( N=2
42),
stra
tifie
d by
chr
onic
dis
ease
cat
egor
ies
NB:
Cat
egor
ies
with
in c
hron
ic d
isea
ses
are
mut
ually
exc
lusi
ve; 1
90 re
spon
dent
s w
ho d
rank
exc
essi
vely
had
no
lung
dis
ease
, 35
resp
onde
nts
who
dra
nk e
xces
sive
ly h
ad p
reva
lent
lung
dis
ease
, and
17
resp
onde
nts
who
dr
ank
exce
ssiv
ely
had
inci
dent
lung
dis
ease
; 151
resp
onde
nts
who
dra
nk e
xces
sive
ly h
ad n
o C
VD
, 47
resp
onde
nts
who
dra
nk e
xces
sive
ly ha
d pr
eval
ent C
VD
, and
44
resp
onde
nts
who
dra
nk e
xces
sive
ly h
ad in
cide
nt
CVD
; 223
resp
onde
nts
who
dra
nk e
xces
sive
ly h
ad n
o di
abet
es, 1
2 re
spon
dent
s w
ho d
rank
exc
essi
vely
had
pre
vale
nt d
iabe
tes,
and
7 re
spon
dent
s w
ho d
rank
exc
essi
vely
had
inci
dent
dia
bete
s; 1
11 re
spon
dent
s w
ho
dran
k ex
cess
ivel
y ha
d no
OA
/RA,
83
resp
onde
nts
who
dra
nk e
xces
sive
ly h
ad p
reva
lent
OA/
RA
, and
48
resp
onde
nts
who
dra
nk e
xces
sive
ly h
ad in
cide
nt O
A/R
A; K
rusk
al-W
allis
non
-par
amet
ric te
sts
wer
e us
ed to
co
mpa
re c
hang
es in
mea
n nu
mbe
r of a
lcoh
olic
con
sum
ptio
ns p
er w
eek
at b
asel
ine
and
follo
w-u
p be
twee
n ca
tego
ries
with
in e
ach
dise
ase,
and
yie
lded
no
sign
ifica
nt re
sults
.
No lun
g dise
ase
Prevale
nt lun
g dis.
Incide
nt lun
g dis.
No CVD
Prevale
nt CVD
Incide
nt CVD
No diab
etes
Prevale
nt dia
betes
Incide
nt dia
betes
No OA/R
A
Prevale
nt OA/R
A
Incide
nt OA/R
A
051015202530
Follo
w-u
pB
asel
ine
Number of alcoholic consumptions per week

67
4 Netherlands. At baseline, associations between chronic diseases and lifestyle
domains appeared to vary. In our sample, the percentage of respondents who
reported to smoke at baseline with prevalent CVD was about similar to the
percentage of respondents who reported to smoke at baseline without CVD.
However, this latter group smoked significantly more cigarettes per week on
average than the former group. The percentage of respondents who reported
excessive alcohol use at baseline with prevalent lung disease was significantly
higher than the percentage of respondents who reported excessive alcohol use
at baseline without prevalent lung disease, while the associations between
baseline excessive alcohol use and CVD, diabetes, and OA/RA tended to be
reversed. The percentage of sedentary respondents at baseline with prevalent
diabetes was significantly higher than the percentage of sedentary respondents
at baseline without prevalent diabetes.
In the entire sample, proportions of respondents who reported to smoke
decreased over a six-year period, while the proportion of respondents who
reported sedentary lifestyles increased. Respondents with incident CVD reacted
strongly to their newly diagnosed disease: they were more likely than
respondents in other chronic disease categories to quit smoking, to cease
excessive alcohol use, and less likely to initiate a physically active lifestyle
between baseline and follow-up. Respondents with prevalent or incident OA/RA
were more likely to quit smoking and less likely to initiate a physically active
lifestyle between baseline and follow-up, compared to respondents without
those conditions.
Adjusted analyses examining the continuous measures of lifestyle change
within each disease category among the respondents who smoked or drank
excessively at baseline yielded no statistically significant results (Figure 4.1a-
b). However, among the respondents who were sedentary at baseline,
respondents with prevalent diabetes improved less in averaged daily minutes
of physical activity compared to those without diabetes or incident diabetes
(Figure 4.1c).
Finally, adjusted analyses comparing change in disease-related
symptomatology between respondents who showed a healthy lifestyle change
and those who persisted in their unhealthy lifestyle across chronic disease
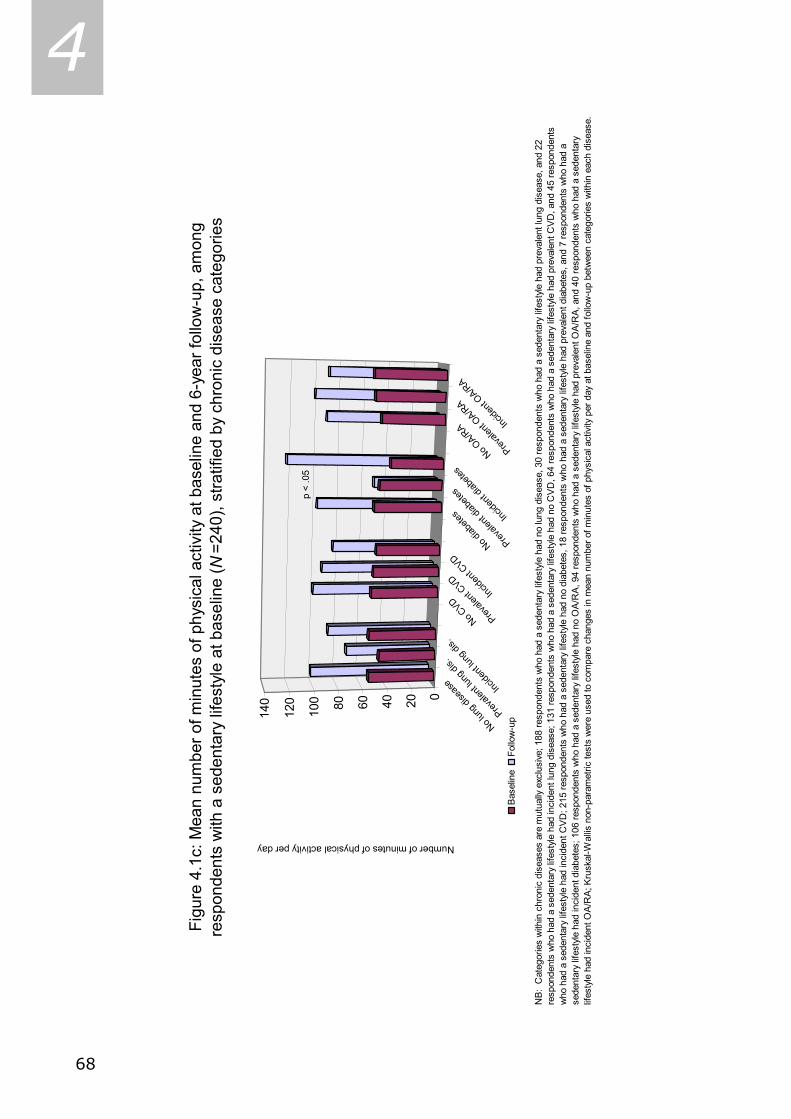
68
4
Figu
re 4
.1c:
Mea
n nu
mbe
r of m
inut
es o
f phy
sica
l act
ivity
at b
asel
ine
and
6-ye
ar fo
llow
-up,
am
ong
resp
onde
nts
with
a s
eden
tary
life
styl
e at
bas
elin
e ( N
=240
), st
ratif
ied
by c
hron
ic d
isea
se c
ateg
orie
s
NB
: C
ateg
orie
s w
ithin
chr
onic
dis
ease
s ar
e m
utua
lly e
xclu
sive
; 188
resp
onde
nts
who
had
a s
eden
tary
life
styl
e ha
d no
lung
dis
ease
, 30
resp
onde
nts
who
had
a s
eden
tary
life
style
had
pre
vale
nt lu
ng d
isea
se, a
nd 2
2 re
spon
dent
s w
ho h
ad a
sed
enta
ry li
fest
yle
had
inci
dent
lung
dis
ease
; 131
resp
onde
nts
who
had
a s
eden
tary
life
styl
e ha
d no
CV
D, 6
4 re
spon
dent
s w
ho h
ad a
sed
enta
ry li
fest
yle
had
prev
alen
t CV
D, a
nd 4
5 re
spon
dent
s w
ho h
ad a
sed
enta
ry li
fest
yle
had
inci
dent
CV
D; 2
15 re
spon
dent
s w
ho h
ad a
sed
enta
ry li
fest
yle h
ad n
o di
abet
es, 1
8 re
spon
dent
s w
ho h
ad a
sed
enta
ry li
fest
yle
had
prev
alen
t dia
bete
s, a
nd 7
resp
onde
nts
who
had
a
sede
ntar
y lif
esty
le h
ad in
cide
nt d
iabe
tes;
106
resp
onde
nts
who
had
a s
eden
tary
life
styl
e ha
d no
OA
/RA
, 94
resp
onde
nts
who
had
a s
eden
tary
life
styl
e ha
d pr
eval
ent O
A/R
A, a
nd 4
0 re
spon
dent
s w
ho h
ad a
sed
enta
ry
lifes
tyle
had
inci
dent
OA
/RA
; Kru
skal
-Wal
lis n
on-p
aram
etric
test
s w
ere
used
to c
ompa
re c
hang
es in
mea
n nu
mbe
r of m
inut
es o
f phy
sica
l act
ivity
per
day
at b
asel
ine
and
follo
w-u
p be
twee
n ca
tego
ries
with
in e
ach
dise
ase.
No lun
g dise
ase
Prevale
nt lun
g dis.
Incide
nt lun
g dis.
No CVD
Prevale
nt CVD
Incide
nt CVD
No diab
etes
Prevale
nt dia
betes
Incide
nt dia
betes
No OA/R
A
Prevale
nt OA/R
A
Incide
nt OA/R
A
020406080100
120
140
Bas
elin
eFo
llow
-up
Number of minutes of physical activity per day
p <
.05

69
4 categories in which a significant proportional lifestyle change took place – as
presented in Table 4.3 – yielded no significant results.
Our findings regarding lifestyle changes are concordant with studies that
conclude that lifestyles are variable over time (Mulder et al., 1998; Johansson
& Sundquist, 1999). We found that current smoking behavior and excessive
alcohol use are less susceptible to change than physical activity. The extent to
which these health behaviors fluctuate differs across chronic disease
categories.
Healthy lifestyle changes have been reported to be associated with a
remission of disease-related symptoms (Eagan et al., 2004), with improved
self-reported health status (Johansson & Sundquist, 1999), and with decreased
mortality (Paffenbarger et al., 1993). Despite the above, our study results
defy the hypothesis that healthy lifestyle changes may follow from personal
necessity, that patients may experience such serious disease-related
symptoms, for example intense chest pains, and realize that they cannot go on
like before. It appears that change in disease severity, as indicated by disease-
related symptomatology, does not play a role in healthy lifestyle changes,
because, among respondents reporting the same prevalent or incident chronic
disease, changes in disease-related symptoms did not differ between those
who showed healthy lifestyle changes and those who persisted in their
unhealthy behavior.
Furthermore, our findings cannot disprove the other notions that were
hypothesized in the introduction; that, within our sample, respondents with
chronic diseases make healthy lifestyle changes as a result of their adherence
to healthy lifestyle regimens, advised to them by health professionals
(Ellingsen et al., 2003); as a result of their awareness that they are
responsible for their own health, as for some respondents their chronic disease
status alone may be a reason to alter their health behavior (Blanchard et al.,
2003); or as a result of respondents with chronic diseases behaving according
to what is expected from them by society. Because sample sizes in several
analyses were small, resulting in suboptimal statistical power, it was not
feasible to examine other potential correlates of lifestyle change, like
personality, and social network size.
70
4 In the literature, many studies can be found regarding lifestyle variables.
A small part of these studies use the same definitions of lifestyle variables.
Additionally, only a fraction of those studies followed up on and quantified
categories of lifestyle change, e.g. percentage quit smoking or percentage
incident excessive alcohol use. Thus, our study contributes to the existing
literature by explicitly quantifying these lifestyle changes.
In sum, in this sample of community-dwelling late middle-aged and older
persons from the Netherlands associations between chronic diseases and
lifestyle domains appeared to be variable over time and across chronic disease
categories. Changes in continuous lifestyle measures among respondents with
unhealthy lifestyles at baseline appeared not to differ across chronic disease
categories, nor were changes in disease-related symptoms different for
respondents who showed a healthy lifestyle change and those who persisted in
their unhealthy behavior. To our knowledge this is the first study that
described the prevalences of lifestyles and lifestyle changes across different
chronic diseases, and the effect of healthy lifestyle changes on change in
disease-related symptomatology among late middle-aged and older
respondents. Knowing whether a certain group of patients is inclined more
than others to make healthy lifestyle changes might be important information
which can be used to target health promotion strategies more effectively and
to enhance the effectiveness of self-management programs that aim at coping
with chronic diseases. If our findings are replicated in future studies, health
promotion strategies may be targeted more effectively, and patient groups
who do not initiate more healthy lifestyles might be reached for intervention.

71
4 4.5 References Aldana, S.G., Whitmer, W.R., Greenlaw, R., Avins, A.L., Salberg, A., Barnhurst, M., Fellingham,
G., & Lipsenthal, L. (2003). Cardiovascular risk reductions associated with aggressive
lifestyle modification and cardiac rehabilitation. Heart Lung. 32: 374-82.
Baumann, A.E. (2004). Updating the evidence that physical activity is good for health: an
epidemiological review 2000-2003. J. Sci. Med. Sport. 7 (1 Suppl): 6-19.
Blanchard, C.M., Denniston, M.M., Baker, F., Ainsworth, S.R., Courneya, K.S., Hann, D.M.,
Gesme, D.H., Reding, D., Flynn, T., & Kennedy, J.S. (2003). Do adults change their
lifestyle behaviors after a cancer diagnosis? Am. J. Health Behav 27: 246-56.
Broese van Groenou, M.I., Deeg, D.J., & Penninx, B.W. (2003). Income differentials in
functional disability in old age: relative risks of onset, recovery, decline, attrition and
mortality. Aging Clin. Exp. Res. 15: 174-83.
Clark, M., & Hampson, S.E. (2001). Implementing a psychological intervention to improve
lifestyle self-management in patients with Type 2 diabetes. Patient Educ. Couns. 42: 247-
256.
Eagan, T.M., Gulsvik, A., Eide, G.E., & Bakke, P.S. (2004). Remission of respiratory symptoms
by smoking and occupational exposure in a cohort study. Eur. Respir. J. 23: 589-94.
Eliasson, M., Asplund, K., Nasic, S., & Rodu, B. (2004). Influence of smoking and snus on the
prevalence and incidence of type 2 diabetes amongst men: the northern Sweden MONICA
study. J. Intern. Med. 256: 101-10.
Ellingsen, I., Hjermann, I., Abdelnoor, M., Hjerkinn, E.M., & Tonstad S. (2003). Dietary and
antismoking advice and ischemic heart disease mortality in men with normal or high fasting
triacylglycerol concentrations: a 23-y follow-up study. Am. J. Clin. Nutr. 78: 935-40.
Gohlke H. (2004). Prävention durch Lebensstiländerung: Was ist gesichert? [Lifestyle
modification - is it worth it?] Herz. 29: 139-44.
Johansson, S.E., & Sundquist, J. (1999). Change in lifestyle factors and their influence on
health status and all-cause mortality. Int. J. Epidemiol. 28: 1073-80.
Kriegsman, D.M., Deeg, D.J., van Eijk, J.T., Penninx, B.W., & Boeke, A.J. (1997). Do disease
specific characteristics add to the explanation of mobility limitations in patients with
different chronic diseases? A study in The Netherlands. J. Epidemiol. Community Health 51:
676-85.
Kriegsman, D.M., Penninx, B.W., Van Eijk, J.Th., Boeke, A.J., & Deeg, D.J. (1996). Self-reports
and general practitioners information on the presence of chronic diseases in community-
dwelling elderly. A study of accuracy of patients’ self-reports and on determinants of
accuracy. J. Clin. Epidemiol. 49: 1407-17.
Lemert, E. (1951). Social pathology. McGraw-Hill book Co., New York.
Lorig, K.R., & Holman, H.R. (2003). Self-management education: History, definition,
outcomes, and mechanisms. Ann. Behav. Med. 26: 1-7.
Mulder, M., Ranchor, A.V., Sanderman, R., Bouma, J., & van den Heuvel, W.J. (1998). The
stability of lifestyle behaviour. Int. J. Epidemiol. 27: 199-207.
72
4 Paffenbarger, R.S. Jr, Hyde, R.T., Wing, A.L., Lee, I.M., Jung, D.L., & Kampert, J.B. (1993).
The association of changes in physical-activity level and other lifestyle characteristics with
mortality among men. N. Engl. J. Med. 328: 538-45.
Penninx, B.W., Deeg, D.J., Van Eijk, J.Th., Beekman, A.T., & Guralnik, J.M. (2000). Changes in
depression and physical decline in older adults: a longitudinal perspective. J. Affect. Disord.
61: 1-12.
Penninx, B.W., Messier, S.P., Rejeski, W.J., Williamson, J.D., DiBari, M., Cavazzini, C.,
Applegate, W.B., & Pahor, M. (2001). Physical exercise and the prevention of disability in
activities of daily living in older persons with osteoarthritis. Arch. Intern. Med. 161: 2309-
16.
Saag, K.G., Cerhan, J.R., Kolluri, S., Ohashi, K., Hunninghake, G.W., & Schwartz, D.A. (1997).
Cigarette smoking and rheumatoid arthritis severity. Ann. Rheum. Dis. 56: 463-9.
Song, R., Lee, E.O., Lam, P., & Bae, S.C. (2003). Effects of tai chi exercise on pain, balance,
muscle strength, and perceived difficulties in physical functioning in older women with
osteoarthritis: a randomized clinical trial. J. Rheumatol. 30: 2039-44.
Statistics Netherlands. (1989). Health Interview Questionnaire. Statistics Netherlands, Heerlen,
The Netherlands.
Stel, V.S., Smit, J.H., Pluijm, S.M., Visser, M., Deeg, D.J., & Lips, P. (2004). Comparison of the
LASA Physical Activity Questionnaire with a 7-day diary and pedometer. J. Clin. Epidemiol.
57: 252-8.
Twaddle, A.C., & Hessler, R.M. (1977). A sociology of health. Mosby, Saint Louis.
Van den Heuvel, N., Smits, C.H., Deeg, D.J., & Beekman, A.T. (1996). Personality: A
moderator of the relation between cognitive functioning and depression in adults aged 55-
85? J. Affect. Disord. 41: 229-240.
Viegi, G., Scognamiglio, A., Baldacci, S., Pistelli, F., & Carrozzi, L. (2001). Epidemiology of
chronic obstructive pulmonary disease (COPD). Respiration 68: 4-19.
Yusuf, S., Reddy, S., Ounpuu, S., & Anand, S. (2001). Global burden of cardiovascular
diseases: part I: general considerations, the epidemiologic transition, risk factors, and
impact of urbanization. Circulation 104: 2746-53.
4.6 Acknowledgement The Longitudinal Aging Study Amsterdam is largely funded by the Ministry of
Health, Welfare, and Sports of the Netherlands.
73
5 CHAPTER 5 *
Associations between lifestyle and depressed mood
Longitudinal results from the Maastricht Aging Study
Coen H. van Gool, Gertrudis I.J.M. Kempen, Hans Bosma,
Martin P.J. van Boxtel, Jelle Jolles, & Jacques Th.M. van Eijk Abstract Objectives: Associations between lifestyles and the development of affective problems are not unequivocally clear. We examined if healthy lifestyles protect against the development of depressed mood. Methods: A six-year follow-up sample of 1186 participants of the Maastricht Aging Study (MAAS), aged 24 through 81 years, provided data on smoking, alcohol use, physical exercise, body mass index (BMI), and mood at baseline and follow-up. Associations between lifestyles and depressed mood were examined using cross-sectional and longitudinal techniques of analysis. Results: No cross-sectional associations between lifestyle and depressive symptomatology were found. Excessive alcohol use at baseline predicted depressed mood at follow-up (Relative Risk [RR] 2.53; 95% Confidence Interval [95%CI] 1.11 – 5.79), and >30 minutes of physical exercise per day at baseline predicted follow-up absence of depressed mood (RR 0.50; 95%CI 0.29 – 0.87). Not being overweight for six years (RR 0.49; 95%CI 0.25 – 0.95) was associated with follow-up absence of depressed mood. Conclusions: In this relatively healthy population sample, certain lifestyles either predicted or protected against depressed mood. Adopting healthy lifestyles might be a starting point to prevent or deal with depressed mood over time. Key words: Lifestyle, depressive symptomatology, longitudinal studies.
* As submitted to the American Journal of Public Health.

74
5 5.1 Introduction
t is assumed that depressed mood is caused by a complex of physical,
psychological, and socio-environmental factors [1]. For example,
unhealthy lifestyles, such as smoking, excessive alcohol use, low levels of
physical exercise, or being overweight or obese, may provoke chronic diseases
[2,3] or worsen health status over time [4]. Chronic diseases, in turn, go
together with more symptoms of depression [5], and feelings of depression
may provoke more unhealthy lifestyles [6]. Another potentially downward
spiraling mechanism might be that unhealthy lifestyles elicit or exacerbate
feelings of depression [7,8], and that feelings of depression, subsequently,
provoke or worsen (the consequences of) chronic diseases [9,10]. However, it
is not unequivocally clear how unhealthy lifestyles and the development of
depressed mood - referring to clinically relevant levels of depressive
symptomatology along the depressive spectrum [11] - are associated over
time.
Although the association between current smoking and depressed mood
has been consistently established in various cross-sectional study samples [12-
14], little evidence is available regarding its longitudinal association: whether
current smoking precedes or follows depressed mood. In general, heavy
drinking is associated with depressed mood [15,16]. Moreover, depressed
mood is more often secondary to alcoholism than primary [15]. Physical
activity seems to help counteract prevalent depression and to protect against
incident depression. Still, longitudinal studies are asked for to further unravel
this association [17,18]. The association between being overweight or obese
and depressed mood is controversial, as negative, positive, and no associations
have been found [19-22].
If healthy lifestyles are associated with absence of, or protect against the
development of depressed mood, this common, yet debilitating condition might
be prevented or dealt with in the future by promoting healthy lifestyles. In this
study we focus on the following question: Do healthy lifestyles protect against
the development of depressed mood in the general population?
I

75
5 5.2 Methods Design and Study population
To date, the prospective Maastricht Aging Study (MAAS) on determinants of
successful aging, has baseline and two three-year intermittent follow-up
measurements. As first follow-up lifestyle variables were unavailable for
respondents aged 49 or younger, we used baseline and second follow-up data.
Between 1993 and 1995, participants were selected from a register of 15
family practices in the south of the Netherlands [23]. General practitioners
invited 9919 persons, aged 24 to 81 years, to participate in the study by
completing a questionnaire and undergoing medical and neuropsychological
examination. Participants were stratified by age, sex, and level of general
ability. Exclusion criteria were history of chronic neurological pathology, stroke,
or mental retardation. Approximately 3449 respondents completed
questionnaires. Of this group, 1877 respondents (54.4%) participated in the
medical and neuropsychological examination. Subsequently, 54 individuals
were excluded due to unreliable test results, or MMSE scores below 24,
indicating a cognitive disorder [24], leaving 1823 individuals at baseline. At
follow-up, 1376 (75.5%) of these 1823 individuals were invited for follow-up
assessment. Beforehand, 274 (15.0%) respondents refused further
participation, 116 (6.4%) had died, 42 (2.3%) were lost to follow-up, and 15
(0.8%) were medically unfit to participate. Ultimately, 1186 (86.2%) of the
1376 respondents were included in the study sample, as 190 (13.8%)
respondents were lost to subsequent analyses due to incomplete data at
baseline or follow-up on either lifestyle or depression. The local medical ethics
committee approved of the study and participants gave their written informed
consent. Sampling, data collection procedures, and non-response are described
elsewhere [25,26].
Measurements
Depressive symptomatology at baseline was measured with the Depression
scale of the Symptom Checklist (SCL-90) [27,28]. The 16 items of the self-
report SCL-90 Depression scale range from 1 to 5, with 1 indicating no
complaint and 5 maximal complaint. Scores range from 16 to 80, with higher
scores indicating more symptoms of depression. At follow-up, we used the

76
5 Center for Epidemiologic Studies Depression (CES-D) scale [29], as this 20-
item self-report scale was both designed for epidemiologic research purposes
and has proven good psychometric qualities, for example in older populations
[30]. The 20 items of the CES-D scale range from 0 to 3, with 0 indicating no
complaint and 3 maximal complaint. Scores range from 0 to 60, with higher
scores indicating more symptoms of depression. In order to screen for people
with depressed mood, we applied the commonly used cut-off score of ≥ 16
regarding the CES-D [29]. Predictive validity of both depression instruments
are reported elsewhere [31].
Habitual smoking behavior at baseline and follow-up was addressed to in
the questionnaire with the questions: “Do you smoke currently? (no/yes); If
you do not smoke currently, did you smoke in the past? (no/yes)”. Baseline
and follow-up habitual smoking behavior was categorized in: 1) Respondent
currently smokes (reference category in analyses), 2) Respondent smoked
formerly, and 3) Respondent never smoked. Change in smoking behavior over
time was categorized in: 1) Respondent still does not smoke; 2) Respondent
quit smoking; 3) Respondent started smoking; 4) Respondent still smokes
(reference category in analyses).
Habitual alcohol intake at baseline and follow-up was addressed to in the
questionnaire with the questions: “What kind of alcoholic beverage do you
usually drink? (beer, wine/sherry/port/vermouth, liquor, varies, I absolutely
never drink alcohol); If you drink alcohol, how many glasses of alcohol do you
drink per day on average? (> 10 glasses, between 7 to 10 glasses, between 3
to 6 glasses, 1 or 2 glasses); If you drink alcohol, how many days of the week
do you drink alcohol on average? (every day, 5 to 6, 3 to 4, 1 to 2, less than 1
day per week)”. Based on these variables continuous baseline and follow-up
averaged number of alcoholic consumptions per week was computed. Also,
baseline and follow-up habitual alcohol intake measures were categorized in:
1) Respondent does not drink (reference category in analyses), 2) Respondent
drinks up to 2 alcoholic consumptions per day on average, and 3) Respondent
drinks 3 or more alcoholic consumptions per day on average (excessive alcohol
use). Change in alcohol use over time was categorized in: 1) Respondent still
drinks alcohol; 2) Respondent started drinking alcohol; 3) Respondent quit

77
5 drinking alcohol; 4) Respondent still does not drink alcohol (reference category
in analyses).
Habitual physical exercise at baseline and follow-up was addressed to in
the questionnaire with the questions: “Can you indicate how many hours per
week on average you spend on (light) sports, such as ball sports, aerobic
exercise, walking, biking, etc. (If you do not sport at all, please fill out 0)?”.
Based on these variables continuous baseline and follow-up the average of
minutes per day spent on physical exercise was computed. Furthermore,
baseline and follow-up physical exercise measures were categorized in: 1)
Respondent does not engage in physical exercise (reference category in
analyses), 2) Respondent engages in physical exercise for up to 30 minutes
per day on average, and 3) Respondent engages in physical exercise for more
than 30 minutes per day on average. Change in physical exercise over time
was categorized in: 1) Respondent still engages in physical exercise; 2)
Respondent initiated physical exercise; 3) Respondent quit exercising; 4)
Respondent still does not engage in physical exercise (reference category in
analyses).
Body mass index (BMI) was calculated by dividing weight in kilograms by
the square of height in meters. Study staff recorded body weight and height at
baseline and follow-up. We used BMI cut-off scores of ≥ 27.8 for men and ≥
27.3 for women to distinguish between respondents who were (at least)
overweight (reference category in analyses) and those who were not [32].
Change in overweight status over time was categorized in: 1) Respondent is
still not overweight; 2) Respondent is no longer overweight; 3) Respondent
became overweight; 4) Respondent is still overweight (reference category in
analyses).
Previous research demonstrated that age, gender, education, and
number of chronic diseases are associated with both lifestyle [33-35], and with
depression [10,36,37]. Hence, these variables were included in our analyses as
covariates. Educational level was obtained from the questionnaire, as were age
and gender. We categorized educational level into low (respondents with
primary education at most), intermediate (respondents with junior vocational
training), and high (respondents with senior vocational or academic training).
Lastly, respondents could indicate if a medical doctor ever made a diagnosis of

78
5 one or more 37 chronic diseases that were screened for in a semi-structured
interview by a trained research assistant.
Statistical Analyses
Following attrition analyses, description of baseline study sample, and
comparisons of baseline and follow-up study variables, associations between
baseline lifestyle and baseline and follow-up symptoms of depression were
analyzed. Hereafter, we studied associations between changes in lifestyle
between baseline and follow-up and depressive symptomatology at follow-up.
Data were analyzed with SPSS 11.5 using cross-sectional and longitudinal
techniques of analyses, specifically chi-square, McNemar, (paired samples) t-
tests, analyses of variance, and multivariate logistic regression models with the
(changes in) lifestyle domains as independent and clinically relevant depressive
symptomatology at follow-up as outcome variable, using the unhealthy
lifestyles as reference categories and adjusted for covariates. Additionally,
analyses regarding follow-up clinically relevant depressive symptomatology or
lifestyle change variables were adjusted for baseline levels of the depression or
lifestyle variables.
5.3 Results As shown in Table 5.1, attrition analyses at baseline demonstrated that,
compared to respondents, persons who were lost to follow-up (n = 637) or
were non-respondents (n = 1626; together n = 2263) were: significantly older
(55.1 ± 17.6 years lost to follow-up or non-respondents versus [vs.] 49.0 ±
14.7 years respondents); more likely to be female (55.8% vs. 47.7%); more
likely to report low educational level (51.6% vs. 37.2%); reported more
chronic diseases (1.9 ± 1.8 vs. 1.3 ± 1.3); reported les minutes of physical
activity per day (13.5 ± 27.3 vs. 18.3 ± 28.3); were more likely to be
overweight (39.9% vs. 33.0%); and had more symptoms of depression (20.0
± 7.9 vs. 20.5 ± 6.1; Table 5.1).
Also shown in Table 5.1 are the lifestyle domains at follow-up. Between
baseline and follow-up, the proportion of respondents who reported smoking
decreased from 26.6% to 21.9%. Between baseline and follow-up, the
proportions of respondents who either reported not drinking alcohol at all, or

79
5 Table 5.1: Population characteristics at baseline and comparisonsa on key variables at baseline and follow-up
Non-respondentsor lost to follow-up Study Sample
(n = 2263b) (n = 1186)Baseline Follow-up
Mean (SD) / % Mean (SD) / % Mean (SD) / %
Age % 24-44 years 32.3 41.6c1 N.A.e
% 45-64 years 32.3 40.7 N.A. % 65-81 years 35.4 17.7 N.A.
Age (continuous) 55.1 (17.6) 49.0 (14.7)c1
Gender % Male 44.2 52.3c1 N.A. % Female 55.8 47.7 N.A.
Education % High 21.6 28.8c1 N.A. % Intermediate 26.8 34.0 N.A. % Low 51.6 37.2 N.A.
Chronic diseases % No chronic disease 23.3 33.4c1 N.A. % One chronic disease 27.2 33.8 N.A. % Two or more chronic diseases 49.4 32.8 N.A.
# Chronic diseases 1.9 (1.8) 1.3 (1.3)c1 N.A.
Smoking behavior % Respondent currently smokes 29.1 26.6 21.9d1
% Respondent used to smoke 36.4 38.6 40.7 % Respondent never smoked 34.5 34.8 37.4
Averaged daily alcohol intake % Respondent does not drink alcohol 20.3 13.9 15.5d1
% Up to 2 alcoholic drinks 75.2 79.4 76.3 % 3 or more alcoholic drinks 4.5 6.7 8.2 # Glasses of alcohol per week 6.1 (8.9) 6.1 (9.4) 6.2 (8.9)
Averaged daily time spent on physical exercise % Respondent does not engage in physical exercise 61.2 49.4b1 62.7c1
% Up to 30 minutes 23.3 28.3 25.2 % More than 30 minutes 15.5 22.3 12.1 # Minutes of physical exercise per day 13.5 (27.3) 18.3 (28.3)c1 10.6 (20.5)d1
Body mass index (BMI) % ≥ 27.3 (women); ≥ 27.8 (men) 39.9 33.0c2 39.7d1
% < 27.3 (women); < 27.8 (men) 60.1 67.0 60.3 BMI (continuous) 27.2 (4.4) 26.5 (4.1)c1 27.0 (4.2)d1
SCL-90 Depression scale 22.0 (7.9) 20.5 (6.1)c1 N.A.
CES-D Depression scale N.A. N.A. 7.9 (6.7) % ≥ 16 N.A. N.A. 14.3 % < 16 N.A. N.A. 85.7
a Comparisons of continuous variables were tested with (paired samples) t-tests and univariate analyses of variance; comparisons of categories were tested using chi-square and McNemar tests; b Numbers of non-response and loss to follow-up vary from 2263 for sociodemographics, smoking behavior, alcohol intake, physical exercise, and SCL-90 Depression scale to 637 for BMI and number of chronic diseases; c differs significantly from non-respondents or persons lost to follow-up (c1 p < .001; c2 p < .01; c3 p < .05); d differs significantly from baseline (d1 p < .001; d2 p < .01; d3 p < .05); e Not Applicable.

80
5 reported to drink three or more alcoholic drinks per day on average, increased
from 13.9% to 15.5% and from 6.7% to 8.2%, respectively (Table 5.1). The
proportion of respondents who did not engage in physical exercise increased
from 45.4% at baseline to 62.7% at follow-up. In addition, the averaged
number of minutes daily physical exercise decreased from 18.3 ± 28.3 at
baseline to 10.6 ± 20.5 at follow-up. Not only did the average level of BMI in
the study sample increase from 26.5 ± 4.1 to 27.0 ± 4.2 between baseline and
follow-up, the proportion of overweight respondents increased from 33.0% at
baseline to 39.7% at follow-up as well. Lastly, 14.3% of the respondents
scored above the clinically relevant threshold of the CES-D scale at follow-up
(Table 5.1).
Results from cross-sectional univariate analyses are shown in Table 5.2.
Respondents aged 45 through 64 years reported higher mean depression
scores at baseline compared to other age categories. Women had significantly
higher mean depression scores than men. The proportion of respondents with
low education reported significantly higher mean depression scores than
respondents with intermediate or high education. Also at baseline, the
proportion of respondents with two or more chronic diseases had higher mean
depression scores compared to respondents without chronic disease or with no
more than one chronic disease. Finally, respondents who reported excessive
alcohol use at baseline had significantly lower mean SCL-90 depression scores
at baseline than respondents who drank less alcohol or did not drink at all
(Table 5.2). When the abovementioned covariates were taken into account in
post hoc analyses, though, the association between baseline alcohol use and
baseline depressive symptomatology became redundant (not tabulated).
Table 5.3 shows results from longitudinal analyses, presented as relative
risks (RR’s) and 95% confidence intervals (95%CI) from adjusted multivariate
logistic regression models with baseline lifestyle domains as determinants of
follow-up depressed mood. Compared to respondents who reported at baseline
not to drink alcohol at all, respondents who reported to drink more than three
alcoholic drinks per day on average at baseline were approximately 2.5 times
as likely to be depressed at follow-up (RR 2.53; 95%CI 1.11 – 5.79). Also,
every glass of alcohol consumed on average per week at baseline was

81
5 Table 5.2: Baseline and follow-up depression scores and comparisonsa stratified by baseline sociodemographicinformation and baseline lifestyle domains (n = 1186)
SCL-90 Depressionscore at baseline
Mean (SD) Mean (SD)
Age 24-44 years n = 493 20.3 (6.2)b3 7.0 (6.5)b1 12.6% 83.4% 45-64 years n = 483 21.1 (6.7) 8.5 (6.9) 14.9% 85.1% 65-81 years n = 210 19.8 (4.2) 9.1 (6.2) 17.1% 82.9% Age; Mean (SD) 51.2 (14.6) 48.7 (14.7)b3
Gender Male n = 620 19.6 (5.0)b1 7.1 (5.8)b1 9.5% 90.5%b1
Female n = 566 21.5 (7.1) 8.9 (7.4) 19.6% 80.4%
Education High n = 342 20.0 (6.1)b2 6.9 (6.3)b1 12.0% 88.0%b2
Intermediate n = 403 20.1 (5.7) 7.5 (6.5) 11.2% 88.8% Low n = 441 21.3 (6.4) 9.1 (7.0) 19.0% 81.0%
Chronic diseases No chronic disease n = 396 19.6 (4.7)b1 7.0 (6.7)b1 12.1% 87.9% One chronic disease n = 401 20.4 (6.0) 7.8 (6.4) 13.2% 86.8% Two or more chronic diseases n = 389 21.6 (7.3) 9.1 (6.8) 17.7% 82.3% # Chronic diseases; Mean (SD) 1.5 (1.5) 1.2 (1.3)b3
Smoking behaviour Respondent currently smokes n = 315 20.9 (6.7) 8.3 (7.3) 16.5% 83.5% Respondent used to smoke n = 458 20.4 (5.9) 8.2 (6.7) 14.6% 85.4% Respondent never smoked n = 413 20.3 (5.9) 7.4 (6.1) 12.3% 87.7%
Averaged daily alcohol intake No, respondent does not drink alcohol n = 164 22.1 (7.8)b1 8.7 (7.7) 17.1% 82.9% Up to 2 alcoholic drinks n = 942 20.3 (5.9) 7.8 (6.5) 13.6% 86.1% 3 or more alcoholic drinks n = 80 19.7 (3.9) 7.7 (6.4) 16.3% 83.7% # Glasses of alcohol per week; Mean (SD) 6.1 (10.5) 6.1 (9.3)
Averaged daily time spent on physical exercise Respondent does not engage in physical exercise n = 586 20.8 (6.4) 8.6 (7.2)b1 17.1% 84.1%b2
Up to 30 minutes n = 336 20.6 (5.7) 7.9 (6.3) 14.3% 85.7% More than 30 minutes n = 264 19.8 (5.9) 6.6 (5.7) 8.3% 91.7% # Minutes of physical exercise per day; Mean (SD) 12.8 (24.2) 19.2 (28.9)b2
Body mass index (BMI) ≥ 27.3 (women); ≥ 27.8 (men) n = 391 21.0 (6.4) 8.7 (7.1)b2 16.1% 83.9% < 27.3 (women); < 27.8 (men) n = 795 20.3 (6.0) 7.6 (6.4) 13.5% 86.5% BMI; Mean (SD) 26.4 (4.1) 26.5 (4.1)
a Comparisons of continuous variables were tested using t-tests and univariate analyses of variance; we used chi-square tests to compare categorical variables; b differs mutually (b1 p < .001; b2 p < .01; b3 p < .05); c i.e. CES-D score ≥ 16.
CES-D Depression score at follow-up Depressedc vs. Non-depressed
14.3%; n = 170 vs. 85.7%; n = 1016
associated with a 2% increased risk of being depressed at follow-up (RR 1.02;
95%CI 1.00 – 1.04). Both analyses were adjusted for all covariates (Table
5.3).
Respondents who reported to be engaged in physical exercise for more
than 30 minutes per day on average at baseline, decreased their risk of being
depressed at follow-up by 50% compared to respondents who reported not to
be engaged in physical exercise at all (RR 0.50; 95%CI 0.29 – 0.87). Also,
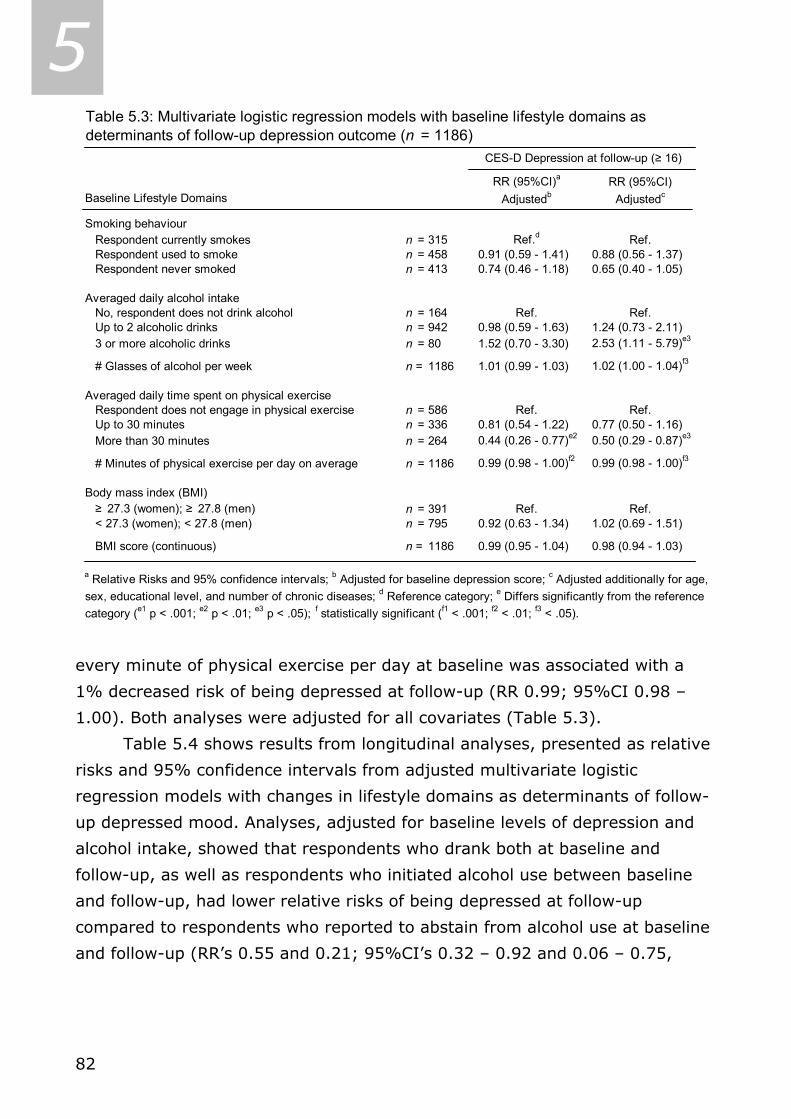
82
5 Table 5.3: Multivariate logistic regression models with baseline lifestyle domains as determinants of follow-up depression outcome (n = 1186)
RR (95%CI)a RR (95%CI)Baseline Lifestyle Domains Adjustedb Adjustedc
Smoking behaviour Respondent currently smokes n = 315 Ref.d Ref. Respondent used to smoke n = 458 0.91 (0.59 - 1.41) 0.88 (0.56 - 1.37) Respondent never smoked n = 413 0.74 (0.46 - 1.18) 0.65 (0.40 - 1.05)
Averaged daily alcohol intake No, respondent does not drink alcohol n = 164 Ref. Ref. Up to 2 alcoholic drinks n = 942 0.98 (0.59 - 1.63) 1.24 (0.73 - 2.11) 3 or more alcoholic drinks n = 80 1.52 (0.70 - 3.30) 2.53 (1.11 - 5.79)e3
# Glasses of alcohol per week n = 1186 1.01 (0.99 - 1.03) 1.02 (1.00 - 1.04)f3
Averaged daily time spent on physical exercisen = 586 Ref. Ref.
Up to 30 minutes n = 336 0.81 (0.54 - 1.22) 0.77 (0.50 - 1.16)n = 264 0.44 (0.26 - 0.77)e2 0.50 (0.29 - 0.87)e3
# Minutes of physical exercise per day on average n = 1186 0.99 (0.98 - 1.00)f2 0.99 (0.98 - 1.00)f3
Body mass index (BMI) ≥ 27.3 (women); ≥ 27.8 (men) n = 391 Ref. Ref. < 27.3 (women); < 27.8 (men) n = 795 0.92 (0.63 - 1.34) 1.02 (0.69 - 1.51)
BMI score (continuous) n = 1186 0.99 (0.95 - 1.04) 0.98 (0.94 - 1.03)
a Relative Risks and 95% confidence intervals; b Adjusted for baseline depression score; c Adjusted additionally for age, sex, educational level, and number of chronic diseases; d Reference category; e Differs significantly from the reference category (e1 p < .001; e2 p < .01; e3 p < .05); f statistically significant (f1 < .001; f2 < .01; f3 < .05).
Respondent does not engage in physical exercise
More than 30 minutes
CES-D Depression at follow-up (≥ 16)
every minute of physical exercise per day at baseline was associated with a
1% decreased risk of being depressed at follow-up (RR 0.99; 95%CI 0.98 –
1.00). Both analyses were adjusted for all covariates (Table 5.3).
Table 5.4 shows results from longitudinal analyses, presented as relative
risks and 95% confidence intervals from adjusted multivariate logistic
regression models with changes in lifestyle domains as determinants of follow-
up depressed mood. Analyses, adjusted for baseline levels of depression and
alcohol intake, showed that respondents who drank both at baseline and
follow-up, as well as respondents who initiated alcohol use between baseline
and follow-up, had lower relative risks of being depressed at follow-up
compared to respondents who reported to abstain from alcohol use at baseline
and follow-up (RR’s 0.55 and 0.21; 95%CI’s 0.32 – 0.92 and 0.06 – 0.75,
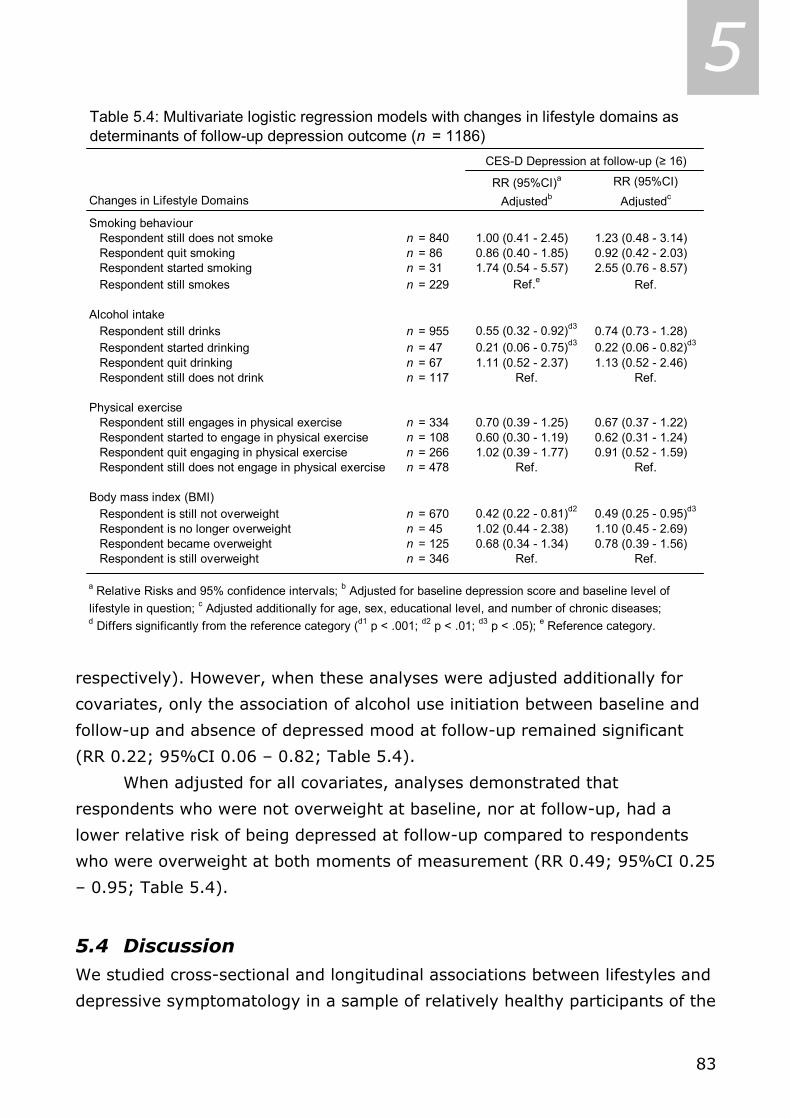
83
5 Table 5.4: Multivariate logistic regression models with changes in lifestyle domains as determinants of follow-up depression outcome (n = 1186)
RR (95%CI)a RR (95%CI)Changes in Lifestyle Domains Adjustedb Adjustedc
Smoking behaviour Respondent still does not smoke n = 840 1.00 (0.41 - 2.45) 1.23 (0.48 - 3.14) Respondent quit smoking n = 86 0.86 (0.40 - 1.85) 0.92 (0.42 - 2.03) Respondent started smoking n = 31 1.74 (0.54 - 5.57) 2.55 (0.76 - 8.57) Respondent still smokes n = 229 Ref.e Ref.
Alcohol intake Respondent still drinks n = 955 0.55 (0.32 - 0.92)d3 0.74 (0.73 - 1.28) Respondent started drinking n = 47 0.21 (0.06 - 0.75)d3 0.22 (0.06 - 0.82)d3
Respondent quit drinking n = 67 1.11 (0.52 - 2.37) 1.13 (0.52 - 2.46) Respondent still does not drink n = 117 Ref. Ref.
Physical exercise Respondent still engages in physical exercise n = 334 0.70 (0.39 - 1.25) 0.67 (0.37 - 1.22) Respondent started to engage in physical exercise n = 108 0.60 (0.30 - 1.19) 0.62 (0.31 - 1.24) Respondent quit engaging in physical exercise n = 266 1.02 (0.39 - 1.77) 0.91 (0.52 - 1.59) Respondent still does not engage in physical exercise n = 478 Ref. Ref.
Body mass index (BMI) Respondent is still not overweight n = 670 0.42 (0.22 - 0.81)d2 0.49 (0.25 - 0.95)d3
Respondent is no longer overweight n = 45 1.02 (0.44 - 2.38) 1.10 (0.45 - 2.69) Respondent became overweight n = 125 0.68 (0.34 - 1.34) 0.78 (0.39 - 1.56) Respondent is still overweight n = 346 Ref. Ref.
a Relative Risks and 95% confidence intervals; b Adjusted for baseline depression score and baseline level oflifestyle in question; c Adjusted additionally for age, sex, educational level, and number of chronic diseases; d Differs significantly from the reference category (d1 p < .001; d2 p < .01; d3 p < .05); e Reference category.
CES-D Depression at follow-up (≥ 16)
respectively). However, when these analyses were adjusted additionally for
covariates, only the association of alcohol use initiation between baseline and
follow-up and absence of depressed mood at follow-up remained significant
(RR 0.22; 95%CI 0.06 – 0.82; Table 5.4).
When adjusted for all covariates, analyses demonstrated that
respondents who were not overweight at baseline, nor at follow-up, had a
lower relative risk of being depressed at follow-up compared to respondents
who were overweight at both moments of measurement (RR 0.49; 95%CI 0.25
– 0.95; Table 5.4).
5.4 Discussion We studied cross-sectional and longitudinal associations between lifestyles and
depressive symptomatology in a sample of relatively healthy participants of the

84
5 MAAS study over a 6-year period. In cross-sectional baseline analyses, we
found no associations between alcohol use and depressive symptomatology. In
longitudinal analyses, we found that baseline excessive alcohol use, as
compared to alcohol abstinence, predicted follow-up depressed mood, and that
more than 30 minutes of physical exercise on average per day at baseline, as
compared to not exercising at all, predicted follow-up absence of depressed
mood. Finally, we found alcohol use initiation to be associated with absence of
follow-up depressed mood compared to steady non-drinkers, and not being
overweight at both moments of measurement to be associated with absence of
follow-up depressed mood compared to respondents who are overweight at
both moments of measurement.
Although our study found a decrease in proportion respondents who
reported to smoke, we did not find any associations between (change in)
smoking behavior and subsequent depressed mood. This is contradictory to a
substantial part of the current literature [6,12-14]. Moreover, the increase in
proportion respondents who never smoked indicates some inconsistency in
completing the questionnaires over a six-year period. This may be detrimental
to the reliability of data regarding smoking behavior and may have weakened
associations between smoking behavior and depressive symptomatology.
Our finding of a significant longitudinal predictive effect of baseline
excessive alcohol use on the development of depressed mood is in
concordance to some extent with the finding of Aneshensel and colleagues [8].
They found contradictory cross-sectional and longitudinal effects of alcohol use
on depression. From their study among 742 adults in the Los Angeles
Metropolitan Area Sample, they inferred that high levels of alcohol use were
associated with low levels of depressive symptomatology (cross-sectional), but
that high initial levels of alcohol use were associated with increased depressive
symptomatology (longitudinal).
Our finding of a significant longitudinal protective effect of high initial
level of physical exercise on subsequent depressed mood, is partly in line with
the results of Strawbridge and colleagues [17]. They found that high levels of
physical activity were associated with absence of depression and were
protective against incident depression among 1947 community-dwelling adults,
aged 50 through 94 years, using a five-year follow-up. Their measure of

85
5 physical activity was defined as usual frequency (never, sometimes, often;
scoring was zero, one, or two, respectively) of physical exercise, taking part in
active sports, taking long walks, and swimming.
Parallels can be drawn between our finding of a longitudinal association
between successfully keeping BMI values below overweight cut-off levels and
absence of depressed mood and the findings of Roberts and colleagues [20]
and Ogden [38]. This last study reported a different psychological profile for
individuals who proved successful in maintaining their BMI below obese cut-off
levels: “they reported greater endorsement for psychological consequences,
and indicated that they had been motivated to lose weight for psychological
reasons”. Lastly, the association between not being overweight for six years
and the absence of follow-up depressed mood might be mediated by pain.
Earlier work showed that high levels of BMI are associated with low levels of
health-related quality of life (HRQoL) [39], and high levels of pain [40], and,
moreover, that the association between BMI and HRQoL was being mediated
by levels of pain [41]. Analogously, as compared to respondents who are
unsuccessful in maintaining their BMI below overweight cut-off levels,
respondents who are successful might experience lower levels of pain in joints
that are crucial in mobility, for example, and potentially be at less risk for
subsequent depressive symptomatology.
The authors are uncertain about the validity of the association between
alcohol use initiation and absence of depressed mood at follow-up. Firstly, as
this analysis was adjusted for baseline depression, we actually examined
simultaneity of change in alcohol use and change in depression, which
prohibits causal inferences. For all we know, a decrease in depressive
symptomatology could be associated with an increase in alcohol use, also
among those who initially reported to abstain from alcohol use. Secondly, we
cannot rule out that this finding is a statistical artifact due to selection bias (as
non-respondents reported more symptoms of depression), and relatively small
sample size of the respondents who initiated alcohol use (n = 47).
Another limitation of our study pertains to the attrition due to non-
response and loss to follow-up. Although our study used a six-year follow-up,
the considerable proportion of attrition may have caused selection bias
regarding our study sample. As we mentioned earlier, this could be an
86
5 alternative explanation for the association we found between alcohol use
initiation and absence of depressed mood. However, Kempen and van
Sonderen take the view that the effect of attrition is more disturbing for
descriptive results than for measures of (longitudinal) association, such as
used in our study [42].
A last limitation of our study pertains to the use of our lifestyle change
categories. As we categorized lifestyle changes simply as cross-product of
baseline and follow-up smoking, drinking, exercising, or being overweight
(no/yes), we may have augmented heterogeneity within categories, as
compared to heterogeneity between categories, and diminished statistical
power. Consequently, estimations of true effects of lifestyle changes on
subsequent depressed mood may be conservative. These limitations should be
kept in mind when interpreting our results and public health recommendations.
However, we believe that our study has strengths as well. To our
knowledge, this is the first study that examined associations between four
lifestyle domains and depressive symptomatology in the same sample, using
both cross-sectional and longitudinal techniques of analyses. Pivotal in our
study are the longitudinal findings that: 1) baseline excessive alcohol use
predicted follow-up depressed mood; 2) more than 30 minutes of baseline
physical exercise predicted absence of follow-up depressed mood; and 3) not
being overweight over a longer period of time was associated with absence of
follow-up depressed mood. Regarding the potentially downward spiral -
mentioned in the introduction - our results indicate that this downward motion
might be stopped by adopting healthy lifestyles, in order to prevent incidence
or worsening of depressive symptomatology over time. Consequently, chronic
disease incidence or worsening might also be prevented.
Should the evidence of certain lifestyles being protective against the
development of depressed mood accumulate after replication studies, then
(more) controlled intervention studies should be called for. Preliminary results
indicate favorable effects of, for example, exercise on mental health [43,44].
As good results were obtained in lowering symptoms of depression using
psychoeducation [45,46], future intervention studies might attempt to prevent
incidence or worsening of depressed mood by encouraging healthy lifestyles as
well as by using psychoeducation.

87
5 5.5 References 1. Jorm AF. The epidemiology of depressive states in the elderly: implications for
recognition, intervention and prevention. Soc Psychiatry Psychiatr Epidemiol 1995; 30:
53-9.
2. Gohlke H. Lifestyle modification - is it worth it? Herz 2004; 29: 139-44.
3. Meigs JB, Hu FB, Rifai N, et al. Biomarkers of endothelial dysfunction and risk of type 2
diabetes mellitus. JAMA 2004; 291: 1978-86.
4. Penninx BW, Leveille S, Ferrucci L, van Eijk JT, Guralnik JM. Exploring the effect of
depression on physical disability: longitudinal evidence from the established populations
for epidemiologic studies of the elderly. Am J Public Health 1999; 89: 1346-52.
5. Bisschop MI, Kriegsman DM, Deeg DJ, et al. The longitudinal relation between chronic
diseases and depression in older persons in the community: the Longitudinal Aging Study
Amsterdam. J Clin Epidemiol 2004; 57: 187-94.
6. Van Gool CH, Kempen GI, Penninx BW, et al. Relationship between changes in depressive
symptoms and unhealthy lifestyles in late middle aged and older persons: results from
the Longitudinal Aging Study Amsterdam. Age Ageing 2003; 32: 81-7.
7. National Academy on an Aging Society. Depression: A treatable disease. Challenges for
the 21st Century: Chronic & Disabling Conditions 9. Retrieved May 31, 2004 from
http://www.agingsociety.org/profiles.
8. Aneshensel CS, Huba GJ. Depression, alcohol use, and smoking over one year: a four-
wave longitudinal causal model. J Abnorm Psychol 1983; 92: 134-50.
9. Depression Guideline Panel. Depression in primary care, Vol 1. Detection and diagnosis.
Clinical Practice Guideline, Number 5. Rockville, MD: Department of Health and Human
Services, Public Health Service, Agency for Health Care Policy and Research. AHCPR
Publication No. 93-0550, 1993.
10. Van Gool CH, Kempen GI, Penninx BW, et al. Impact of depression on disablement in late
middle aged and older persons: results from the Longitudinal Aging Study Amsterdam.
Soc Sci Med; in press.
11. Haringsma R, Engels GI, Beekman AT, Spinhoven P. The criterion validity of the Center
for Epidemiological Studies Depression Scale (CES-D) in a sample of self-referred elders
with depressive symptomatology. Int J Geriatr Psychiatry 2004; 19: 558-63.
12. Anda RF, Williamson DF, Escobedo LG, et al. Depression and the dynamics of smoking. A
national perspective. JAMA 1990; 264: 1541-5.
13. Carney RM, Rich MW, Tevelde A, et al. Major depressive disorder in coronary artery
disease. Am J Cardiol 1987; 60: 1273-5.
14. Frederick T, Frerichs RR, Clark VA. Personal health habits and symptoms of depression at
the community level. Prev Med 1988; 17: 173-82.
15. Freed EX. Alcohol and mood: an updated review. Int J Addict 1978; 13: 173-200.
16. Aneshensel, CS. An application of log-linear models: the stress-buffering function of
alcohol use. J Drug Educ 1983; 13: 287-301.
88
5 17. Strawbridge WJ, Deleger S, Roberts RE, et al. Physical activity reduces the risk of
subsequent depression for older adults. Am J Epidemiol 2002; 156: 328-34.
18. Goodwin RD. Association between physical activity and mental disorders among adults in
the United States. Prev Med 2003; 36: 698-703.
19. Bin Li Z, Yin Ho S, Man Chan W, et al. Obesity and depressive symptoms in Chinese
elderly. Int J Geriatr Psychiatry 2004; 19: 68-74.
20. Roberts RE, Strawbridge WJ, Deleger S, et al. Are the fat more jolly? Ann Behav Med
2002; 24: 169-80.
21. Ross CE. Overweight and depression. J Health Social Beh 1994; 35: 63-79.
22. Carpenter KM, Hasin DS, Allison DB, et al. Relationships between obesity and DSM-IV
major depressive disorder, suicide ideation, and suicide attempts: results from a general
population study. Am J Public Health 2000; 90: 251-7.
23. Metsemakers JF, Höppener P, Knottnerus JA, et al. Computerized health information in
the Netherlands: A registration network of family practices. British J Gen Practice 1992;
42: 102-6.
24. Folstein MF, Folstein SE, McHugh PR. "Mini-mental state". A practical method for grading
the cognitive state of patients for the clinician. J Psychiatr Res 1975; 12: 189-198.
25. Jolles J, Houx PJ, van Boxtel MP, et al. (Eds). Maastricht Aging Study: Determinants of
cognitive aging. Maastricht: Neuropsych Publishers, 1995.
26. Van Boxtel MP, Buntinx F, Houx PJ, et al. The relation between morbidity and cognitive
performance in a normal aging population. Journal of Gerontology 1998; 53A: M146-54.
27. Derogatis LR, Lipman RS, Covi L. SCL-90: an outpatient psychiatric rating scale––
preliminary report. Psychopharmacol Bull 1973; 9: 13–27
28. Arrindell WA, Ettema JHM. Dimensional structure, reliability and validity of the Dutch
version of the Symptom Checklist (SCL-90). Ned Tijdschr Psychologie 1981; 43: 381–7.
29. Radloff LS. The CES-D scale: A self-report depressive mood scale for research in the
general population. App Psychol Meas 1977; 1: 385–401.
30. Beekman AT, Deeg DJ, Van Limbeek J, et al. Criterion validity of the Center for
Epidemiologic Studies Depression scale (CES-D): results from a community-based sample
of older subjects in The Netherlands. Psychol Med 1997; 27: 231–5.
31. Dohrenwend BP. Mental illness in the United States: epidemiological estimates. New
York: Praeger Publishers, 1980.
32. Williamson DF, Kahn HS, Remington PL, et al. The 10-year incidence of overweight and
major weight gain in US adults. Arch Intern Med 1990; 150: 665-72.
33. Enright PL, McBurnie MA, Bittner V, et al. The 6-min walk test: a quick measure of
functional status in elderly adults. Chest 2003; 123: 387-98.
34. Ruchlin HS. Prevalence and correlates of alcohol use among older adults. Prev Med 1997;
26: 651-7.
35. Henderson PN, Rhoades D, Henderson JA, et al. Smoking cessation and its determinants
among older American Indians: the Strong Heart Study. Ethn Dis 2004; 14: 274-9.
89
5 36. Beekman AT, Penninx BW, Deeg DJ, et al. Depression and physical health in later life:
results from the Longitudinal Aging Study Amsterdam (LASA). J Affect Disord 1997; 46:
219-31.
37. Dong C, Sanchez LE, Price RA. Relationship of obesity to depression: a family-based
study. Int J Obes Relat Metab Disord 2004; 28: 790-5.
38. Ogden J.The correlates of long-term weight loss: a group comparison study of obesity.
Int J Obes Relat Metab Disord 2000; 24: 1018-25.
39. Yancy WS Jr, Olsen MK, Westman EC, Bosworth HB, Edelman D. Relationship between
obesity and health-related quality of life in men. Obes Res 2002; 10: 1057-64.
40. Barofsky I, Fontaine KR, Cheskin LJ. Pain in the obese: impact on health-related quality-
of-life. Ann Behav Med 1997; 19: 408-10.
41. Heo M, Allison DB, Faith MS, Zhu S, Fontaine KR. Obesity and quality of life: mediating
effects of pain and comorbidities. Obes Res 2003; 11: 209-16.
42. Kempen GI, Van Sonderen E. Psychological attributes and changes in disability among
low-functioning, older persons: does attrition affect the outcomes? J Clin Epidemiol 2002,
55: 224-9.
43. Atlantis E, Chow CM, Kirby A, Fiatarone Singh M. An effective exercise-based intervention
for improving mental health and quality of life measures: a randomized controlled trial.
Prev Med 2004; 39: 424-34.
44. Blumenthal JA, Babyak MA, Moore KA, et al. Effects of exercise training on older patients
with major depression. Arch Intern Med 1999; 159: 2349-56.
45. Commissaris K, Verhey FR, Jolles J. A controlled study into the effects of psychoeducation
for patients with cognitive disturbances. J Neuropsychiatry Clin Neurosci 1996; 8: 429-
35.
46. Christensen H, Griffiths KM, Jorm AF. Delivering interventions for depression by using the
internet: randomised controlled trial. BMJ 2004; 328 (7434): 265.
5.6 Acknowledgement This work was supported in part by a grant from the Dutch Ministries of
Education and Health and Welfare, via the Steering Committee for
Gerontological Research (NESTOR). It is part of the Maastricht Aging Study
(MAAS).

90
5

91
6 CHAPTER 6 *
Relationship between changes in depressive
symptoms and unhealthy lifestyles in late
middle aged and older persons
Results from the Longitudinal Aging Study Amsterdam
Coen H. van Gool, Gertrudis I.J.M. Kempen, Brenda W.J.H. Penninx, Dorly J.H. Deeg, Aartjan T.F. Beekman, Jacques Th.M. van Eijk
Abstract Background: Depressed mood is common in late life, more prevalent among the chronically diseased than in the general population, and has various health-related consequences. So far, the association between depression and unhealthy lifestyles among chronically diseased has not been examined longitudinally in older persons. Primary Objective: To determine if depressed mood is associated with unhealthy lifestyles in late middle aged and older people, with or without chronic somatic diseases. Methods: In a sample of 1280 community-dwelling people from the Netherlands, the associations between depressive symptoms and lifestyle domains were analysed cross-sectionally and longitudinally - using logistic regression analyses and multivariate analyses of variance. Results: After controlling for confounders, depressed people (N = 176 at baseline) were more likely to be smokers (OR 1.71; 95%CI 1.17-2.52). A persistent depression was associated with an increase in cigarette consumption (p = .036). Having an emerging depression (N = 155) was most likely to co-occur with persons’ change from being physically active to being sedentary (RR 1.62; 95%CI 1.05-2.52), and was associated with the largest decrease in minutes of physical activity (p = .038). This effect was not modified or confounded by chronic somatic disease. A persistent depression tended to be associated with incident excessive alcohol use (RR 4.04; 95% CI 0.97-16.09; p = .056). Conclusions: Depression is associated with smoking behavior, and with increase in cigarette consumption. An emerging depression is associated with becoming sedentary, irrespective of their disease status at baseline, and is associated with decrease in minutes of physical activity. Key words: depression, lifestyle, chronic disease, longitudinal studies.
* As published in Age & Ageing 2003; 32 (1): 81-7.
92
6 6.1 Introduction
epression is common in late life [1]. On average, people with chronic
diseases are 1.5 to 2 times more often depressed [2]. The most probable
explanation is a reciprocal interaction between chronic somatic disease and
late life depression [e.g., 3-6]. One mechanism is the adoption of unhealthy
lifestyles by depressed people [7]. The deteriorating effects of unhealthy
lifestyles on chronic somatic diseases have been described previously [8, 9].
Lifestyle domains, such as alcohol use, smoking history, and physical activity
were identified as confounders in the relation between depression and heart
disease [10, 11]. The importance of advanced insight in the mechanism
through which depression may trigger or worsen chronic medical conditions is
evident, with the increasing number of older people with chronic diseases in
most western societies [12]. Also, the prevalence of depression may differ
across specific disease groups [13], and different lifestyles may be relevant to
different diseases. Improvement of mental health of chronically diseased is
imperative. This improvement could change the attitudes towards healthy
lifestyles, thus stopping a possible downward spiral of depression, unhealthy
lifestyles, and deterioration of chronic disease.
There are a number of studies available regarding the effect of
depression on unhealthy lifestyles, particularly in older people. While the
relationship between depression and physical inactivity is well established [14],
the association of depressive symptoms and smoking behavior remains
unclear. In fact, some studies found major depression to increase the risk of
smoking intensity significantly, but not of smoking initiation [15, 16]. However,
no causal inferences can be made, since most of these studies did not use
longitudinal designs or yielded inconsistent results.
Little is known about the impact of depressed mood, or changes therein,
on the adoption of unhealthy lifestyles in late middle aged and older persons,
with or without chronic diseases. In this paper we focus on the following
questions: Are depressive symptoms associated with unhealthy lifestyles, (i.e.,
alcohol use, smoking behavior, and physical activity)? Are there any
differences in this respect among people with different chronic diseases (i.e.
heart disease, chronic non-specific lung disease (CNSLD), diabetes, and
osteoarthritis)?
D

93
6 6.2 Methods Design
For this study baseline and second follow-up measurements were used from
the Longitudinal Aging Study Amsterdam (LASA). LASA is a longitudinal,
prospective cohort-study on predictors and consequences of changes in well-
being and autonomy in the late middle aged and older population with baseline
and two three-year intermittent follow-up measurements. Because first follow-
up lifestyle variables were not available for all respondents, only baseline and
second follow-up data were used. Sampling, data collection procedures, and
non-response have been reported in detail elsewhere [10, 17, 18].
Study sample
A total of 3107 respondents, aged 55-85 years, were enrolled in the study. The
first round of data collection took place in 1992 and 1993. The six-year follow-
up data collection was in 1998 and 1999 [19]. Between baseline interview and
follow-up, 766 (24.6%) respondents had died, 217 (7.0%) refused
participation, 202 (6.5%) were interviewed by telephone, which interview did
not include data on lifestyle, 102 (3.3%) respondents were unable to
participate due to cognitive or physical impairments, and 86 (2.8%) could not
be contacted. After participation in the main baseline interview, another 352
(11.3%) respondents, all born after 1930, were not followed up for practical
reasons related to the study design. Ultimately, 102 (3.3%) respondents were
lost to subsequent analyses because of their incomplete data on depression
and lifestyle, leaving a total of 1280 (41.2%) respondents with complete data.
Measurements
Depressive symptoms were measured with the Center for Epidemiologic
Studies Depression (CES-D) scale [20]. This 20-item self-report scale was
designed for epidemiologic research purposes in older populations and has
proven good psychometric qualities, for instance in the Netherlands [21]. In
order to screen for people with clinically relevant levels of depressive
symptoms, hereafter called depression, we applied the commonly used CES-D
cut-off score of 16 (i.e. 16 or higher [20]). We used two measures of
depression: the depression score at baseline (depressed vs. not depressed)

94
6 and a measure for change in depression during follow-up. This change in
depression was categorised into: ‘no depression’, ‘emerging depression’,
‘remitted depression’, and ‘persistent depression’. Similar to Kennedy [22] and
Penninx [19] a relevant change in depression was defined as an increase
(emerging depression) or a decrease (remitted depression) of more than 0.5 ×
standard deviation (SD) (0.5 × 8 = 4 CES-D points) between baseline and
follow-up, thereby transcending the cut-off score. Persons not fulfilling the
condition of relevant change were categorised as having either no depression
or a persistent depression, depending on their baseline level of depressive
symptoms.
Respondents’ alcohol intake [23] at baseline and follow-up was
dichotomised in: no to moderate alcohol intake (to an average of two drinks a
day) vs. excessive alcohol intake (average of three or more drinks per day;
[e.g., 19]). We used baseline alcohol intake as initial score and two
dichotomised change scores (quit excessive alcohol use vs. remain drinking;
emerging excessive alcohol use vs. no excessive alcohol use). Smoking
behavior [23] at baseline and follow-up was dichotomised in: never smoked or
stopped smoking, vs. currently smoking cigarettes, cigars, or pipe [e.g., 19].
We used baseline smoking behavior as initial score and two dichotomised
change scores (quit smoking vs. continue smoking; smoking initiation vs.
remain non-smoking). In addition, we examined number of cigarettes smoked
per week. Physical activity was measured in minutes per day by adding up
averaged, self-reported time spent on walking, cycling, sports, and light (e.g.,
doing the dishes, or ironing) and heavy (e.g., cleaning windows, or vacuum
cleaning) household chores [24-26]. This variable was then dichotomised in
the lowest quartile on the one hand, representing sedentary lifestyle at
baseline, and the upper three quartiles on the other, representing more active
lifestyles at baseline. The cut-off score to determine sedentary lifestyle was at
83.6 minutes of average daily physical activity, both at baseline and follow-up.
Again, we used baseline physical activity as initial score and two dichotomised
change scores (become sedentary vs. remain active; become physically active
vs. remain inactive).
Potential confounders included baseline socio-demographics: sex, age,
and years of education. In addition, physical disability was measured with a 3-

95
6 item physical disability scale, previously validated in the Netherlands [27, 28];
scores range from 3 to 12, theoretically. Low scores on this scale indicate more
physical disability. These confounders were selected because they relate to
both lifestyle and depression [2, 14, 19, 29-31].
Chronic disease status, as a potential effect modifier, was assessed by
self-report [23]. We selected CNSLD, heart disease, diabetes, and
osteoarthritis. These four chronic diseases each represent one major disease
category: CNSLD represents disorders of the respiratory system, heart disease
represents disorders regarding the cardiovascular system, diabetes represents
metabolic disorders, and osteoarthritis represents musculo-skeletal disorders.
Data on psychometric qualities of the concordance between patient and
general practitioner in our study sample have been reported in detail
elsewhere [32] and appeared to be satisfactory.
Statistical Analyses
First, associations between depression at baseline and lifestyle at baseline
were studied. In addition, associations between depression at baseline and
changes in lifestyle were analysed. Third, associations between changes in
depression and changes in lifestyle were examined. Finally, to determine
moderating effects of chronic somatic disease, interaction terms of chronic
disease status × depression were entered in all analyses.
Data were analysed with SPSS 10.0 using chi-square tests, t-tests, and
logistic regression models with depression as independent and the separate
(changes in) lifestyle domains as outcome variables, while controlling for age,
sex, educational level attained, and physical disability. Odds-ratios (ORs),
relative risk-ratios (RRs), and 95% confidence intervals (CIs) are presented. In
addition, multivariate analyses of variance (MANOVA’s) were performed with
depression change scores as independent and continuous lifestyle change
scores as dependent variables, while controlling for age, sex, educational level
attained, and physical disability.
6.3 Results Analyses of attrition at baseline demonstrated that persons who were lost to
follow-up (N = 1827) were significantly: older (71.4 years non-responders vs.
96
6 69.9 years respondents), more likely to be men (50.6% vs. 45.4%), and more
physically disabled (9.3 vs. 10.3). In addition, significantly more non-
responders reported to have enjoyed only elementary through lower vocational
education (66.2% vs. 59.9%), and to have chronic diseases (45.3% vs.
40.3%). Furthermore, non-responders were more often likely to be smokers
(28.7% vs. 21.4%), to be less often excessive drinkers (2.7% vs. 4.1%), and
to have more often sedentary lifestyles (38.2% vs. 25.5%) compared to
respondents.
The percentage of respondents with clinically relevant levels of
depressive symptoms, i.e. with CES-D scores ≥ 16, increased significantly from
13.8% to 20.3% between baseline and follow-up (p ≤ .001), which may be due
to age-related health changes or other life events. The proportion of
respondents who smoked decreased significantly from 21.4% to 17.3% (p ≤
.001). The proportion of respondents who were excessive alcohol users
decreased significantly from 4.1% to 3.4% (p ≤ .001). The proportion of
respondents with sedentary lifestyles increased significantly from 25.5% to
35.2% (p ≤ .001). Study sample characteristics by depression status at
baseline are presented in Table 6.1.
At baseline, a significant relation was found between depression and
smoking behavior: persons with depressed mood were significantly more often
smokers (see Table 6.1), with a corresponding OR of 1.71 (95% CI; 1.17-2.52;
adjusted for age, sex, years of education, and baseline physical disability).
Other associations yielded no significance. None of the interaction terms of
each chronic somatic disease status × depression reached the level of
significance, after inclusion in the logistic regression analyses regarding
smoking behavior. In addition, after implementing each chronic somatic
disease status term as a confounder, the association between depression and
smoking behavior remained similar (data not shown).
The logistic regression analyses of baseline depression and changes in
lifestyle yielded no significant associations (data not shown).
Changes in depression could only significantly predict changes in physical
activity in respondents who were originally physically active: respondents with
an emerging depression between baseline and follow-up were at a 62% higher
risk of becoming sedentary in physical activity between baseline and follow-up

97
6 Table 6.1: Study sample characteristics at baseline (N = 1280). 1992/1993 Depressed Non-depressed (13.8%; N=176) (86.2%; N=1104) % Age - 55 – 64 yrs 28.8 38.1† % Gender - Female 68.2 52.4* % Education - elementary through lower 70.5 58.2*
vocational education % CNSLD (N = 127) 13.6 9.3 % Heart disease (N = 229) 20.5 17.5 % Diabetes (N = 68) 6.8 5.1 % Osteoarthritis (N = 457) 45.5 34.1* % Excessive alcohol use (avg of ≥3 glasses a day) 4.0 4.1 % Smoking (N= 157) 28.4 20.3† % Sedentary lifestyle (avg of ≤ 83.6 minutes of 30.7 24.7 physical activity a day) Age M (SD) 69.3 (8.6) 69.9 (7.1) Physical disability (N = 1279) M (SD) 8.8 (3.7) 10.6 (2.5)* Number of cigarettes a week (N = 157) M (SD) 88.5 (74.2) 75.5 (60.5) Minutes of daily physical activity M (SD) 154.5 (111.7) 171.4 (125.6) Note: * p is significant at the ≤ .01 level; † p is significant at the ≤ .05 level. Proportional variables were tested using Chi-square tests; continuous variables were tested using T-tests.
(Table 6.2). Overall changes in excessive alcohol use were small. Note,
however, that the four-fold likelihood of persistent depressed
persons,compared to never depressed persons, of incident excessive alcohol
use over a six-year period was borderline significant (p = 0.056).
None of the interaction terms of each chronic somatic disease status ×
relevant change in depression reached the level of significance. In
addition,after implementing each chronic somatic disease status term as a
confounder, the associations between relevant change in depression and
change in physical activity, and persistent depression and incident excessive
alcohol use remained similar (data not shown).

98
6
Tab
le 6
.2:
Adju
sted
A R
elat
ive
Ris
k-ra
tios
for
the
pre
dic
tive
val
ue
of d
epre
ssio
n,
and r
elev
ant
chan
ges
in d
epre
ssio
n o
n c
han
ges
in lifes
tyle
bet
wee
bas
elin
e an
d f
ollo
w-u
p a
mon
g lat
e m
iddle
aged
and o
lder
per
sons.
Rel
evan
t Chan
ge
in D
epre
ssio
n &
N
Inc.
BRR
(95%
CI)
NIn
c.
RR
(95%
CI)
Chan
ge
in E
xces
sive
alc
ohol
use
- N
o dep
ress
ed m
ood
911
1.4
%Ref
. C38
2.3
%Ref
.
- Em
ergin
g d
epre
ssio
n148
1.3
%1.2
4(0
.27 –
5.7
5)
71.3
%0.2
1(0
.03 –
1.6
5)
- Rem
itte
d d
epre
ssio
n74
1.3
%0.7
5(0
.09 –
6.1
8)
21.3
%2.8
3(0
.02 –
10.8
6)
- Pe
rsis
tent
dep
ress
ion
94
3.0
%4.0
4(0
.97 –
16.0
9)
52.0
%2.3
5(0
.05 –
3.3
6)
Rel
evan
t Chan
ge
in D
epre
ssio
n &
N
Inc.
BRR
(95%
CI)
NIn
c.
RR
(95%
CI)
Chan
ge
in S
mok
ing b
ehav
iour
- N
o dep
ress
ed m
ood
765
1.6
%
Ref
.184
5.3
%Ref
.
- Em
ergin
g d
epre
ssio
n115
0.6
%0.5
3(0
.07 –
4.1
8)
40
6.5
%1.0
7(0
.48 –
2.4
0)
- Rem
itte
d d
epre
ssio
n55
2.6
%2.2
0(0
.46 –
10.5
4)
21
6.5
%1.1
2(0
.37 –
3.3
7)
- Pe
rsis
tent
dep
ress
ion
70
1.0
%1.3
4(0
.14 –
12.4
4)
29
7.1
%1.1
2(0
.43 –
2.9
1)
Rel
evan
t Chan
ge
in D
epre
ssio
n &
N
Inc.
BRR
(95%
CI)
NIn
c.
RR
(95%
CI)
Chan
ge
in S
eden
tary
lifes
tyle
- N
o dep
ress
ed m
ood
712
18.3
%Ref
.237
9.8
%Ref
.
- Em
ergin
g d
epre
ssio
n119
27.1
%1.6
2†
(1.0
5 –
2.5
2)
36
8.4
%0.8
8(0
.39 –
1.9
8)
- Rem
itte
d d
epre
ssio
n50
18.2
%1.0
9(0
.56 –
2.1
4)
26
19.5
%2.0
6(0
.84 –
5.0
6)
- Pe
rsis
tent
dep
ress
ion
72
21.2
%1.2
5(0
.70 –
2.2
4)
27
7.1
%0.5
4(0
.20 –
1.5
0)
Not
e:
A A
dju
sted
for
age,
gen
der
, ye
ars
of e
duca
tion
, an
d p
hys
ical
dis
abili
ty;
Inc.
B =
6-y
ear
inci
den
ce;
Ref
. C =
Ref
eren
ce c
ateg
ory;
D A
mon
g
per
sons
who
wer
e not
usi
ng a
lcoh
ol e
xces
sive
ly a
t bas
elin
e; E
Am
ong p
erso
ns
who
wer
e usi
ng a
lcoh
ol e
xces
sive
ly a
t bas
elin
e; F
Am
ong p
erso
ns
who
wer
e not
sm
okin
g a
t bas
elin
e; G
Am
ong p
erso
ns
who
wer
e sm
okin
g a
t bas
elin
e; H
Am
ong p
erso
ns
who
wer
e phys
ical
ly a
ctiv
e at
bas
elin
e;
I Am
ong p
erso
ns
who
wer
e se
den
tary
at
bas
elin
e; †
p is
signific
ant
at t
he ≤
.05 lev
el.
Em
ergin
g e
xces
sive
alc
ohol
use
DQ
uit e
xces
sive
alc
ohol
use
E
Quit s
mok
ing
G
Bec
omin
g p
hys
ical
ly a
ctiv
eITurn
ing into
a s
eden
tary
lifes
tyle
H
Sm
okin
g initia
tion
F
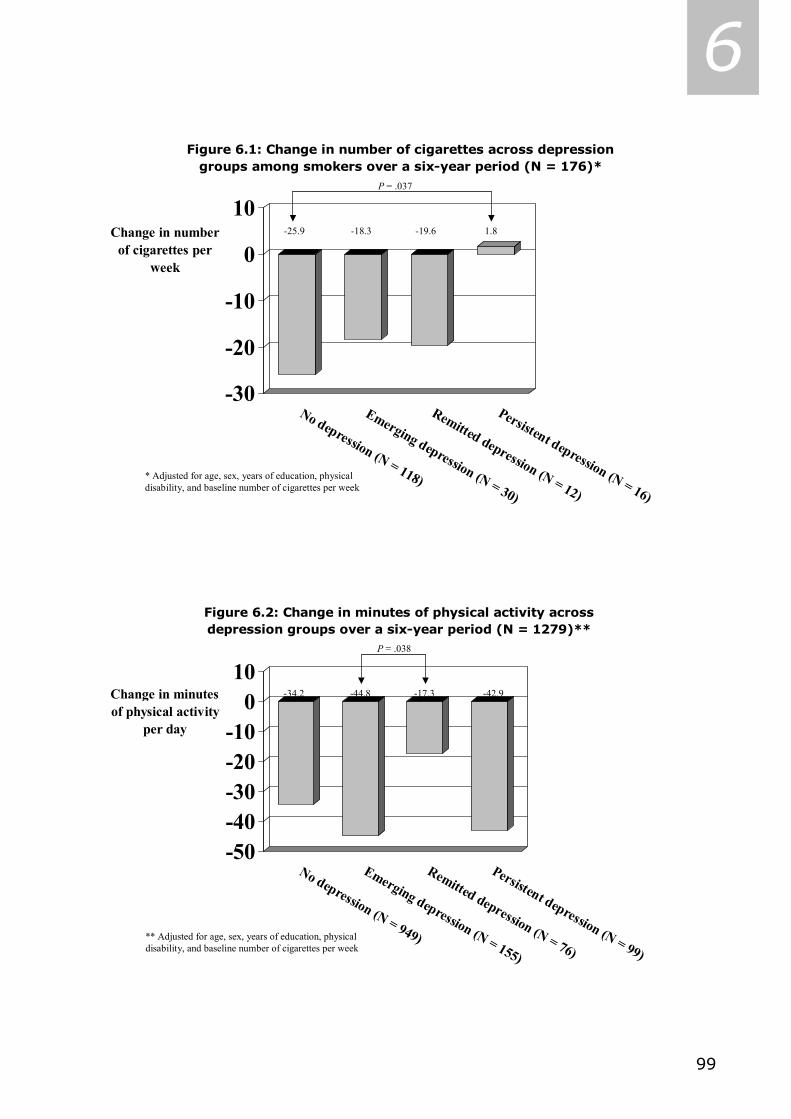
99
6
-30
-20
-10
0
10Change in number
of cigarettes per week
No depression (N = 118)
Emerging depression (N = 30)
Remitted depression (N = 12)
Persistent depression (N = 16)
Figure 6.1: Change in number of cigarettes across depression groups among smokers over a six-year period (N = 176)*
-25.9 -18.3 -19.6 1.8
P = .037
* Adjusted for age, sex, years of education, physical disability, and baseline number of cigarettes per week
-50-40-30-20-10
010
Change in minutes of physical activity
per day
No depression (N = 949)
Emerging depression (N = 155)
Remitted depression (N = 76)
Persistent depression (N = 99)
Figure 6.2: Change in minutes of physical activity across depression groups over a six-year period (N = 1279)**
-34.2 -44.8 -17.3 -42.9
P = .038
** Adjusted for age, sex, years of education, physical disability, and baseline number of cigarettes per week

100
6 MANOVA demonstrated that persistent depression was associated with
an increase in cigarette consumption of nearly two per week, while no
depressed mood was associated with a decrease per week of nearly 26
cigarettes over a six-year period (Figure 6.1). The average decrease in
cigarettes per week in the total – smoking – sample was 21.9 (N = 176; p
≤.001). Analyses were adjusted for above-mentioned covariates and baseline
cigarette consumption. In addition, an emerging depressed mood was
associated with a nearly 45 minutes decrease in physical activity per day, while
a remitted depressed mood was associated with a decrease of ‘only’ 17.3
minutes in physical activity per day over a six-year period (Figure 6.2).
Analyses were adjusted for above-mentioned covariates and baseline minutes
of physical activity. The average decrease in minutes of physical activity per
day in the total sample was 33.5 minutes (N = 1279; p ≤ .001). No
multivariate analyses were performed for (change in) depression and change in
alcohol use, for there was no continuous measure of alcohol use available.
6.4 Discussion We studied the association between depression and lifestyle in a sample of
Dutch late middle aged and older adults over a six-year period. We found a
significant cross-sectional association between depression and smoking
behavior at baseline, which was independent of chronic somatic disease status.
Longitudinally, depression at baseline proved not to be predictive of changes in
lifestyles later on. Although statistically non-significant, persistent depressed
persons were at a four-fold likelihood of incident excessive alcohol use,
compared to never depressed people. In addition, persons with an emerging
depression were significantly more likely to concurrently adopt a sedentary
lifestyle, irrespective of their somatic disease status, as there were no
significant interaction effects, nor were there any confounding effects of
chronic somatic disease status.
The fact that we found a cross-sectional association between depression
and smoking is in concordance with most of the literature of the past decade
[e.g., 15, 33]. MANOVA demonstrated that persistent depressed smokers,
compared to never depressed smokers, seem unable or are less often
motivated to decrease cigarette consumption over a six-year period. Here,
101
6 longitudinal data support cross-sectional findings. One of the consequences of
smoking is vascular disease. The association between depression and smoking
may be one of the pathways through which depression and vascular disease
are related. This is in support of the theory of vascular depression, in which
there is a supposed link between cerebrovascular disease and manifestation of
a specific subtype of depression arising in late life [e.g., 34].
Noteworthy is the apparent effect of depression on physical activity.
People with an emerging depression tended to change more often to a
sedentary lifestyle than people without a depression, while people with a
remitted depression tended to become physically active compared to people
without a depression (reference group). In addition, difference in change in
minutes of physical activity is largest between the groups with emerging
depression and remitted depression. It seems that our results and the
literature are in line, regarding physical activity’s antidepressant effect [e.g.,
14, 35-37], but the inference of depression being a risk factor for simultaneous
physical inactivity cannot be made on the base of our results.
A limitation of the present study is the considerable attrition (58.8%). In
addition, the fact that people who were lost to follow-up were more often male,
older, and more likely to have a chronic disease, puts the generalization of the
results at risk. However, if any, we believe that attrition would have an
underestimating effect on our associations instead of an overestimation of
reported associations. Moreover, Kempen and Van Sonderen [38]
demonstrated that attrition’s effect is more disturbing for descriptive results
than for measures of (longitudinal) association.
Another limitation pertains to the fact that incidences of ‘quit excessive
alcohol use’ and ‘smoking initiation’ are low, causing very small sub groups.
Consequently, reliability of logistic regression coefficients regarding these
variables is rather low. However, additional analyses of continuous data relieve
that limitation regarding smoking. A last limitation pertains to the fact that
most important results of this study were derived from cross-sectional
analyses, or analyses of congruence of change. These analyses cannot
disentangle the direction of association, and hence, results cannot be
interpreted in any causal way.
102
6 Summarizing, one can put that, in this study depression, although not
referring to a clinical diagnosis, but rather to clinically relevant depressive
symptoms, is associated with smoking behavior, irrespective of chronic somatic
disease status. In addition, persistent depression tends to be associated with
incident excessive alcohol use. The emergence of depression shows
congruence with changing into a sedentary lifestyle, irrespective of chronic
somatic disease status. However, no causal relation can be demonstrated,
since the analyses relate to simultaneous changes. Our study showed
consistent results from different designs. Depression was associated with
smoking behavior cross-sectionally (Logistic regression), but change in
depression was associated with change in smoking behavior (MANOVA) as well.
Typically, this is one of the major advantages of a longitudinal study over a
cross-sectional one.
We have shown that emergence of depression goes together with
developing a sedentary lifestyle. Clearly, clinical practice can benefit from this
line of study if further research can clarify whether treatment of depressive
symptoms can prevent the development of sedentary lifestyles, so that both
physical and mental health can be preserved.

103
6 6.5 References 1. Copeland JR, Beekman AT, Dewey ME et al. Cross-cultural comparison of depressive
symptoms in Europe does not support stereotypes of ageing. Br J Psychiatry 1999; 174:
322-9.
2. Beekman ATF, Penninx BWJH, Deeg DJH, Ormel J, Braam AW, Van Tilburg W. Depression
and physical health in later life: results from the Longitudinal Aging Study Amsterdam
(LASA). J Affect Disord 1997; 46: 219-31.
3. Mayou RA. Depressive mood and type of physical disorder and treatment. In: MM
Robertson, CLE Katona (editors). Depressive mood and Physical Illness. London: Wiley;
1997: p. 21-38.
4. Cohen S, Rodriquez MS. Pathways linking affective disturbances and physical disorders.
Health Psychol 1995; 14: 374-80.
5. Mayou RA, Sharpe M. Psychiatric illnesses associated with physical disease. Bailliere’s Clin
Psychiatry 1995; 1: 2.
6. Lebowitz BD, Pearson JL, Schneider LS et al. Diagnosis and treatment of depression in
late life. Consensus statement update. JAMA 1997; 278: 1186-90.
7. Haynes RB, McKibbon KA, Kanani R. Systematic review of randomized trials of
interventions to assist patients to follow prescriptions for medications. Lancet 1996; 348:
383-6.
8. Klatsky AL. Alcohol, coronary disease, and hypertension. Annu Rev Med 1996;47:149-60.
9. Francis K. Physical activity in the prevention of cardiovascular disease. Phys Ther.
1996;76:456-468.]
10. Penninx BWJH, Beekman ATF, Honig A et al. Depression and cardiac mortality: results
from a community-based longitudinal study. Arch Gen Psychiatry 2001; 58: 221-7.
11. Jonas BS, Franks P, Ingram DD. Are symptoms of anxiety and depression risk factors for
hypertension? Longitudinal evidence from the National Health and Nutrition Examination
Survey I Epidemiologic Follow-up Study. Arch Fam Med 1997 Jan-Feb;6(1):43-9.
12. Perenboom RJM, Van Herten, LM, Boshuizen HC, Van de Water HPA. Trends in de gezonde
levensverwachting in Nederland 1983-1994, met een verdeling naar de ernst van
ongezondheid [Trends in healthy life-expectancy in the Netherlands 1983-1994, stratified
by ill health]. In: PJM Van der Maas, PGN Kramers (editors). Volksgezondheid;
Toekomstverkenning 1997, deel III Gezondheid en levensverwachting gewogen [Public
health; future scenario 1997, Volume III Health and weighted life expectancy]. Maarssen:
Elsevier; 1997: p. 53-77.
13. Katz IR. On the inseparability of mental and physical health in aged persons: lessons from
depression and medical comorbidity. Am J Geriatr Psychiatry 1996; 4: 1-16.
14. Kempen GIJM, Verbrugge LM, Merril SS, Ormel J. The impact of multiple impairments on
disability in community-dwelling older people. Age Ageing 1998; 27: 595-604.
15. Breslau N, Peterson EL, Schultz LR, Chilcoat HD, Andreski P. Major depression and stages
of smoking. A longitudinal investigation. Arch Gen Psychiatry 1998; 55: 161-6.
104
6 16. Anda RF, Williamson DF, Escobedo LG, Mast EE, Giovino GA, Remington PL. Depression
and the dynamics of smoking. A national perspective. JAMA 1990; 264: 1541-5.
17. Deeg, D.J.H., Knipscheer, C.P.M., Van Tilburg, W., editors. Autonomy and Well- being in
the Aging Population: Concepts and Design of the Longitudinal Aging Study Amsterdam.
NIG Trendstudies No.7. Bunnik: Netherlands Institute of Gerontology; 1993.
18. Smit, J.H., de Vries, M.Z., Poppelaars, J.L. Data-collection and fieldwork procedures. In:
D.J.H. Deeg, A.T.F. Beekman, D.M.W. Kriegsman, M. Westendorp-de Serière, editors.
Autonomy and Well-being in the aging population II: Report from the Longitudinal Aging
Study Amsterdam 1992-1996. Amsterdam: VU University Press; 1998: p. 9-20.
19. Penninx, B.W., Deeg, D.J.H., Van Eijk, J.Th. M., Beekman, A.T.F., Guralnik, J.M. Changes
in depression and physical decline in older adults: a longitudinal perspective. J Affect
Disord, 2000; 61: 1-12.
20. Radloff, L.S. The CES-D scale: A self-report depressive mood scale for research in the
general population. App Psychol Meas, 1977; 1: 385-401.
21. Beekman, A.T., Deeg, D.J.H., Van Limbeek, J., Braam, A.W., De Vries, M.Z., Van Tilburg,
W. Criterion validity of the Center for Epidemiologic Studies Depression scale (CES-D):
results from a community-based sample of older subjects in The Netherlands. Psychol
Med, 1997; 27: 231-5.
22. Kennedy, G.J., Kelman, H.R., Thomas, C. Persistence and remission of depressive
symptoms in late life. Am J Psychiatry 1991; 148: 174-8.
23. Statistics Netherlands. Health interview questionnaire. Heerlen, The Netherlands: Central
Bureau of Statistics; 1989.
24. Visser, M., Launer, L. J., Deurenberg, P., Deeg, D. J. Total and sports activity in older
men and women: relation with body fat distribution. Am J Epidemiol, 1997; 145: 752-61.
25. Caspersen, C.J., Bloemberg, B.P.M., Saris, W.H.M., Merrit, R.K., Kromhout, D. The
prevalence of selected physical activities and their relation with coronary heart disease
risk factors in elderly men: the Zutphen Study, 1985. Am J Epidemiol, 1991; 133: 1078-
92.
26. Voorrips, L.E., Ravelli, A.C., Dongelmans, P.C., Deurenberg, D., Van Staveren, W.A. A
physical activity questionnaire for the elderly. Med Sci Sports Exerc, 1991; 23: 974-9.
27. Van Sonsbeek, J.L.A. Methodische en inhoudelijke aspecten van de OESO- indicator
betreffende langdurige beperkingen in het lichamelijk functioneren [Methodological and
substantial aspects of the OECD indicator of chronic functional limitations]. Maandbericht
Gezondheid [Statistics Netherlands], 1988; 88: 4-17.
28. Kriegsman DM, Deeg DJH, Van Eijk JThM, Penninx BWJH, Boeke AJ. Do disease specific
characteristics add to the explanation of mobility limitations in patients with different
chronic diseases? A study in the Netherlands. J Epidemiol Community Health 1997; 51:
676-85.
29. Aneshensel CS, Yokopenic PA. Tests for the comparability of a causal model of depression
under two conditions of interviewing. J Pers Soc Psychol 1985; 49: 1337-48.

105
6 30. Guccione AA, Felson DT, Anderson JJ et al. The effects of specific medical conditions on
the functional limitations of elders in the Framingham Study. Am J Public Health 1994;
84: 351-8.
31. Midanik LT, Clark WB. The demographic distribution of US drinking patterns in 1990:
description and trends from 1984. Am J Public Health 1994; 84: 1218-22.
32. Kriegsman DM, Penninx BWJH, Van Eijk JThM, Boeke AJ, Deeg DJH. Self-reports and
general practitioners information on the presence of chronic diseases in community-
dwelling elderly. A study of accuracy of patients’ self-reports and on determinants of
accuracy. J Clin Epidemiol 1996; 49: 1407-17.
33. Kandel DB, Davies M. Adult sequelae of adolescent depressive symptoms. Arch Gen
Psychiatry 1986; 43: 255-62.
34. Baldwin RC, O’Brien J. Vascular basis of late-onset depressive disorder. Br J Psychiatry
2002; 180; 157-60.
35. Dunn AL, Trivedi MH, O'Neal HA. Physical activity dose-response effects on outcomes of
depression and anxiety. Med Sci Sports Exerc 2001; 33 (Suppl): S587-97.
36. Camacho TC, Roberts RE, Lazarus NB, Kaplan GA, Cohen RD. Physical activity and
depression: evidence from the Alameda County Study. Am J Epidemiol 1991; 134: 220-
31.
37. Singh NA, Clements KM, Singh MA. The efficacy of exercise as a long-term antidepressant
in elderly subjects: a randomized, controlled trial. J Gerontol A Biol Sci: Med Sci 2001;
56: M497-504.
38. Kempen GIJM, Van Sonderen E. Psychological attributes and changes in disability among
low-functioning, older persons: does attrition affect the outcomes? J Clin Epidemiol 2002,
55: 224-9.
6.6 Acknowledgement The Longitudinal Aging Study Amsterdam is partly funded by the Ministry of
Health, Welfare, and Sports of the Netherlands.

106
6
107
7 CHAPTER 7 *
Impact of depression on disablement in late middle aged
and older persons
Results from the Longitudinal Aging Study Amsterdam
Coen H. van Gool, Gertrudis I.J.M. Kempen, Brenda W.J.H. Penninx, Dorly J.H. Deeg, Aartjan T.F. Beekman, Jacques Th.M. van Eijk
Abstract The main pathway of the disablement process consists of four consecutive phases: Pathology (presence of disease / injury), Impairments (dysfunctions / structural abnormalities), Functional Limitations (restrictions in basic physical / mental actions), and Disability (difficulty doing Activities of Daily Life (ADL)). This study determines the presence of the main pathway of disablement in a cohort aged 55 years and older, and examines whether progression in the main pathway of disablement is accelerated in the presence of depression. Based on baseline (T1) and two three-year follow-up interviews (T2 & T3) from the Longitudinal Aging Study Amsterdam (LASA) in a population-based cohort of 1110 Dutch persons, we first analysed the intermediate effect of the different consecutive phases of the disablement process by means of multiple regression, adjusted for covariates. Then, depression was used as interaction term in multiple regression analyses linking the consecutive phases of the disablement process. We found that Impairments mediated the association between Pathology and Functional Limitations, and that Functional Limitations mediated the association between Impairments and Disability. Depression significantly modified the associations between Pathology and subsequent Impairments, and between Functional Limitations and subsequent Disability. In sum, the main pathway of the disablement process was identified in our sample. In addition, we found an accelerating effect of depression, particularly in the early and late stages of the model. Reduction of depression may help slow down the process of disablement for persons who find themselves in those stages of the model. Key words: disablement process, depressive symptoms, longitudinal studies.
* As published in Social Science & Medicine 2005; 60 (1): 25-36.
108
7 7.1 Introduction
ue to the aging of the population and the fact that improvements in
medical technology will decrease the mortality of chronic diseases among
patients, the prevalence of late middle aged and older people with chronic
diseases will increase dramatically (Ruwaard & Kramers, 1997; Van Eijk & De
Haan, 1998; World Health Organization & Food and Agriculture Organization,
2003). Although long duration is typical for chronic diseases, there are
differences in disease course and in disease severity, as well as in the physical
and psychosocial burden they can impose on people (Rolland, 1987; Penninx,
1996; Kempen, Ormel, Brilman, & Relyveld, 1997). Having a chronic disease
and additional impairments may have consequences for the physical
performance and adequacy of social and role functioning of an individual. This
trajectory from disease to the inability of performing certain roles can be
viewed as the disablement process (Verbrugge & Jette, 1994). The main
pathway of the disablement process consists of four consecutive phases:
pathology (presence of disease) may lead to impairments (anatomic and
structural abnormalities), which in turn may precipitate functional limitations
(restrictions in basic physical and mental actions), which then may lead to
disability (difficulty doing activities of daily life; cf. Figure 7.1; Verbrugge &
Jette, 1994; Lawrence & Jette, 1996). There are risk factors, intra-individual
factors, and extra-individual factors interacting with the main pathway during
its entire course, potentially accelerating or slowing down the process of
disablement. In practice, the associations between the four main phases are
reciprocal and intertwining because of feedback loops, as, for example,
disability may cause new, additional pathology (Verbrugge & Jette, 1994).
Depressed medically ill patients are more likely to experience a higher
burden of disease-specific symptoms than their non-depressed counterparts
(Ciechanowski, Katon, & Russo, 2000). Depressive symptoms have also been
found to predict disability (Armenian, Pratt, Gallo, & Eaton, 1998) and to
influence functional recovery after fall-related injury in older persons (Kempen,
Sanderman, Scaf-Klomp, & Ormel, 2003). Other evidence suggests that
depression and disability mutually contribute to the other’s risk over time
(Bruce, 2000; Geerlings, Beekman, Deeg, Twisk, & Van Tilburg, 2001; Ormel,
Rijsdijk, Sullivan, van Sonderen, & Kempen, 2002). Considering the above, it
D

109
7 Figure 7.1: The main pathway of the disablement process and influencing factors, adapted from Verbrugge and Jette (1994).
a The phases of the main pathway of the disablement process and influencing factors are underlined; b Examples of the practical contents of the phases of disablement are between brackets; c The way the disablement phases were operationalised in the present study are in Italics; d Index diseases include chronic non-specific lung disease (CNSLD), heart disease, (peripheral) arterial disease, diabetes, osteo- and rheumatic arthritis.
Pathologya
(Presence of diseaseb)
-Number of index diseasesc,d
Risk Factors
(e.g., predisposing biological characteristics)
-Age, Gender, Education, Comorbid conditions
Intra-individual Factors
(e.g., psychosocial factors and internal resources)
-Depression
Extra-individual Factors
(e.g., medical care and rehabilitation)
Impairments
(Anatomic and structural abnormalities)
-Scores on symptom inventories of index
diseases
Functional Limitations
(Restrictions in basic physical and mental actions)
-Scores on hearing, vision, cognitive function, self-reported mobility, and performance tests
Disability
(Difficulty doing activities of daily life)
-ADL score, and disease-related disability score
seems that people with chronic diseases carry a double burden when they
experience depressive symptoms, as these may aggravate conditions (National
Academy on an Aging Society, 2000). This can have adverse consequences for
the course of their disablement process.
Although the associations between depression and the separate phases
of disablement have been studied in different samples before, either cross-
sectionally (Kempen, Verbrugge, Merrill, & Ormel, 1998; Kim, Kunik, Molinari,
Hillman, Lalani, Orengo, et al., 2000), or longitudinally (Ormel, Vonkorff,
Oldehinkel, Simon, Tiemens, & Ustun, 1999) to date, the association between
depression and phases of disablement has not been studied from a longitudinal
perspective in a population-based sample.
Therefore, in this paper we focus on the following research objectives.
First, can the main pathway of the disablement process be identified in a
sample of Dutch late middle aged and older persons over a six-year period?
And second, does depression, defined as an intra-individual factor influencing
the main pathway, accelerate the process of disablement? In other words: are
associations between two consecutive phases of the disablement process over
a three-year period stronger for those who are depressed than for those who
are not?
110
7 7.2 Methods Design and Study population
The Longitudinal Aging Study Amsterdam (LASA) is a cohort-study on
predictors and consequences of changes in well-being and autonomy in the
late middle aged and older population. Sampling, data collection procedures,
and non-response have been reported in detail elsewhere (Van den Heuvel,
Smits, Deeg, & Beekman, 1996; Penninx, Deeg, van Eijk, Beekman, &
Guralnik, 2000). In short, a random sample, stratified by age and gender, was
drawn from the population registers of 11 municipalities, divided over three
geographic regions in the Netherlands. Initially, 3107 respondents, aged 55-85
years, were enrolled in the study. The baseline cycle took place in 1992 and
1993 (T1). After approximately three and six years, respondents were
approached for first (T2) and second follow-up (T3), respectively (Lan, Deeg,
Guralnik, & Melzer, 2003). Between T1 and T3, 766 (24.6%) respondents had
died, 288 (9.3%) could not be contacted (moved, etc.), 217 (7.0%) refused
participation, 102 (3.3%) respondents were unable to participate due to
cognitive or physical impairments, and 100 (3.2%) respondents were excluded
due to terminated interviews or shortened versions of the interview, leaving
1634 (52.6%) respondents with valid data. We then selected respondents with
no missing values on all relevant variables to monitor intra-individual changes
in the disablement process. The largest subsequent attrition was on the
composite variable of functional limitations, where 298 (9.6%) respondents
had one or more missing values. In addition, 226 (7.3%) respondents had one
or more missing values on other relevant variables, leaving, finally, a study
sample of 1110 (35.7%) healthy and (chronically) diseased respondents.
Measurements
In this study, the first phase of the disablement process, pathology, was
based on number of self-reported diseases (Kriegsman, Penninx, van Eijk,
Boeke, & Deeg, 1996), ranged from 0 to 6, and was assessed at all three data
collection cycles. For a strict interpretation of Verbrugge & Jette‘s main
pathway of the disablement process (1994), we only included those chronic
diseases, hereafter called index diseases, of which a symptom inventory was
included in the medical interview. Respondents were asked whether or not

111
7 they have a certain disease. The list of index diseases was summed and
included chronic non-specific lung disease (CNSLD), heart disease, arterial
disease, diabetes, osteo- and rheumatic arthritis. Reported diseases at
baseline were checked with respondents’ general practitioners. Cohen’s
Kappa’s for concordance between patient and general practitioner compared to
non-patient and general practitioner ranged from 0.31 for osteoarthritis, and
0.59 CNSLD, to 0.69 for heart disease, and 0.85 for diabetes (Kriegsman,
Penninx, van Eijk, et al., 1996).
Impairments were assessed using symptom inventories of the index
diseases at all three data collection cycles (Kriegsman, Deeg, van Eijk,
Penninx, & Boeke, 1997). The symptom inventory of CNSLD consisted of 8
questions about the frequency of coughing, coughing up phlegm, wheezing,
shortness of breath, and the quality of the respondents’ night’s rest regarding
the disease. Scores ranged from 0 to 11, with higher scores indicating more
CNSLD-related impairments. The symptom inventory of heart disease
consisted of 5 questions about the frequency of chest pains, and how fast
these pains disappear, swollen feet at getting up and going to bed, and the use
of extra pillows at night. Scores ranged from 0 to 6, with higher scores
indicating more heart disease-related impairments. The symptom inventory of
arterial disease consisted of 3 questions about pain experienced when walking,
and whether this pain disappears when stopping walking. Scores ranged from
0 to 4, with higher scores indicating more arterial disease-related impairments.
The symptom inventory of diabetes consisted of 6 questions about the
frequency of chest pains, pain experienced when walking, and whether this
pain disappears when stopping walking. Scores ranged from 0 to 8, with higher
scores indicating more diabetes-related impairments. The combined symptom
inventory of osteo- and rheumatoid arthritis consisted of 12 questions about
the frequency of pain, stiffness, and swelling of joints, and the prevalence of
arthritic symptoms in a list of joints. Scores ranged from 0 to 12, with higher
scores indicating more arthritis-related impairments. Detailed information on
disease-specific symptom inventories was published earlier (Kriegsman, Deeg,
van Eijk, et al., 1997). Because the range of disease-specific symptom
inventories was not equal across diseases, individual sum scores per symptom
inventory were standardized using the formula in Figure 7.2. The impairments

112
7 Figure 7.2: Formula used to standardize variables.
sum score thus ranged, theoretically, from 0 to 5, with higher scores indicating
more impairments relating to the index diseases.
Functional limitations were assessed at all three data collection cycles
using information on hearing, vision (Van Sonsbeek, 1988), cognitive
functioning (Mini Mental State Examination (MMSE); Folstein, Folstein, &
McHugh, 1975), self-reported mobility (Van Sonsbeek, 1988), and physical
performance tests (Magaziner, 1991). Questions regarding vision were ‘Can
you read the fine print in a newspaper without glasses?’ and ‘Can you
recognize someone’s face at a four meter distance without glasses?’ (yes,
without difficulty / yes, with some difficulty / yes, with much difficulty /no, I
cannot). Questions regarding hearing were ‘Can you understand a conversation
between three or four persons without a hearing device?’ and ‘Can you hold a
conversation with one person without a hearing device?’ (yes, without difficulty
/ yes, with some difficulty / yes, with much difficulty /no, I cannot). Scores for
hearing and vision, separately, ranged from 0 to 6, with higher scores
indicating more difficulty seeing or hearing. Cognitive function was assessed by
the MMSE. After linear transformation of initial sum scores, scores ranged from
0 to 30 with higher scores indicating reduced cognitive function. Questions
regarding self-reported mobility limitations were ‘Can you go up and down a
flight of 15 stairs without stopping?’, and ‘Can you walk for five minutes
outside the house?’, respectively (yes, without difficulty / yes, with some
difficulty / yes, with much difficulty / yes, but only with help / no, I cannot).
Scores were summed and ranged from 0 to 8, with higher scores indicating
more limitations in self-reported mobility. Physical performance tests included
three subtests; walking six meters, five chair stands not using arms, and
putting on and taking off a cardigan (Penninx, Deeg, van Eijk, et al., 2000). On
the subtests, time needed was scored according to quartiles of the time
required in the study sample, so that the fastest quartile scored 0 and the
Individual or raw _ Lower limit of (theoretical) score on variable score range of variable
(Theoretical) score range of variable

113
7 slowest quartile scored 3. Persons who were not able to perform a subtest
scored 4 for that particular subtest. Overall functional limitations were
computed by standardizing outcomes on vision, hearing, cognitive function,
self-reported mobility, and performance subtests using the aforementioned
formula in Figure 7.2, added up, and ranged from 0 to 7, with higher scores
indicating more functional limitations.
Disability was assessed at all three data collection cycles using items of
two self-reported disability measurement scales. The first was a disability scale
that was previously validated in the Netherlands (Van Sonsbeek, 1988;
Kriegsman, Deeg, van Eijk, et al., 1997). Respondents answered questions
about difficulties in doing activities of daily living (ADL), such as, clipping their
own toenails, dressing, and using transportation (yes, without difficulty / yes,
with some difficulty / yes, with much difficulty / yes, but only with help / no, I
cannot). Sum scores ranged from 0 to 12, and higher scores indicated more
disability. Furthermore, disability was assessed using a composite variable on
self-report information to what extent respondents’ disease(s) or health
problem(s) limited their daily activities (adapted from Stewart, Hays, & Ware,
1988). Respondents answered questions about ‘Do health problems limit your
daily activities?’ (no / yes, somewhat / yes, very much), ‘How long have health
problems limited your daily activities?’ (more / less than three months), ‘How
many days during the past month did you have to stay in bed due to (an)
illness?’ and ‘How many days during the past month were you unable to do
your daily activities due to (an) illness?’ (none / 1-3 days / 4-7 days / >1
week, <1 month / all of the time). Scores ranged from 0 to 16 with higher
scores indicating more disability. Both disability scores correlated 0.44 at
baseline, and were then standardized using the aforementioned formula, added
up, and ranged from 0 to 2, with higher scores indicating more overall
disability.
Depression was assessed using the Center for Epidemiologic Studies
Depression (CES-D) scale at all three data collection cycles (Radloff, 1977).
This 20-item self-report scale was designed for epidemiologic research
purposes in the general population and has proven good psychometric
qualities, for instance in the Netherlands (Beekman, van Limbeek, Deeg,
Wouters, & van Tilburg, 1994). Scores ranged from 0 to 60, with higher scores

114
7 indicating more depressive symptoms. We used the CES-D’s widely accepted
cut-off score of ≥ 16 (Kennedy, Kelman, & Thomas, 1990; Beekman, Deeg,
van Limbeek, Braam, de Vries, & van Tilburg, 1997; Penninx, Deeg, van Eijk,
et al., 2000) to indicate clinically significant depressive symptoms, hereafter
called depression.
Potentially confounding covariates are age, gender – derived from
municipal registers –, and educational level. The latter was obtained through
self-report, and ranged from 1 (did not finish elementary school) to 9 (finished
university). Reported diseases that were not one of the index diseases were
scored as comorbid conditions and ranged from 0 to 4.
Statistical Analyses
Following attrition analyses, and descriptive sample analyses, we examined
correlations within T1, and between T1, T2, and T3 variables of the main
pathway of the disablement process to gain insight in our suggested model.
Subsequently, we conducted multivariate linear regression analyses on
separate phases of the main pathway of the disablement process to establish
identification of our model (Figure 7.3). Specifically, part of the effect of
‘Pathology T1’ on ‘Functional Limitations T3’ is considered to go through
‘Impairments T2’ if the main effect, defined as the standardized regression
coefficient, of ‘Pathology T1’ on ‘Functional Limitations T3’ (transitions ‘1’ & ‘4’
in Figure 7.3) diminishes with at least 10%, as a rule of thumb (Baron &
Kenny, 1986), when entering ‘Impairments T2’ in the regression model. This
analysis is adjusted for covariates and ‘change in Pathology between T1 and
T3’. Similarly, part of the effect of ‘Impairments T1’ on ‘Disability T3’ goes
through ‘Functional Limitations T2’ if the standardized regression coefficient of
‘Impairments T1’ on ‘Disability T3’ (transitions ‘3’ & ‘6’ in Figure 7.3)
diminishes with at least 10% when entering ‘Functional Limitations T2’ in the
regression model. This regression analysis is adjusted for covariates and
‘change in Impairments between T1 and T3’.
Verbrugge and Jette (1994) defined depression as an intra-individual
factor influencing the main pathway. In order to test this assumption, we
conducted multivariate linear regression analyses to examine the influence of

115
7
depression on associations between two consecutive phases in the disablement
process. We wanted to rule out the advanced effects of depression and the
independent variable on the dependent variable by including their change
scores between two consecutive phases in the regression model. Thus, in
regression analysis with ‘Impairments T2’ as dependent variable and
‘Pathology T1’ as independent variable, we adjusted for covariates and ‘change
in Pathology between T1 and T2’, and ‘change in depression between T1 and
T2’. Also, we entered ‘depression T1’ and the product term ‘depression T1
Pathology T1’. If this product term proves statistically significant, the
association between Pathology T1 and Impairments T2 is different for
depressed respondents at baseline compared to non-depressed respondents at
baseline. We examined this for all consecutive phases of the main pathway of
the disablement process (transitions ‘1’ through ‘6’ in Figure 7.3). The
unstandardized regression coefficients of the significant interaction terms were
explored in detail, in order to compare transitions with similar variables. The
variance inflation factor (VIF) was used to measure collinearity in all regression
models.
a Transitions (1) through (6) correspond with sequence of analyses of model identification, and analyses of interaction.
FunctionalLimitations T1
FunctionalLimitations T2
Pathology T1 Pathology T2 Pathology T3
Impairments T1 Impairments T2 Impairments T3
Disability T1 Disability T2 Disability T3
Self-reported index diseases(Statistics Netherlands, 1989)
Standardized symptom inventoriesof index diseases (Kriegsman, Deeg, vanEijk, Penninx, & Boeke, 1997)
Cognitive Limitations (MMSE)(Folstein, Folstein, & McHugh, 1975)
Hearing Limitations(Van Sonsbeek, 1988)
Visual Limitations(Van Sonsbeek, 1988)
Physical performancelimitations (Magaziner, 1991)
ADL Disability(Van Sonsbeek, 1988)
Disease-related disability(Stewart, Hays, & W are, 1988)
FunctionalLimitations T3
Figure 7.3: Model for the analyses of the main pathway of the disablement process.
1a
3
5
4
6
21
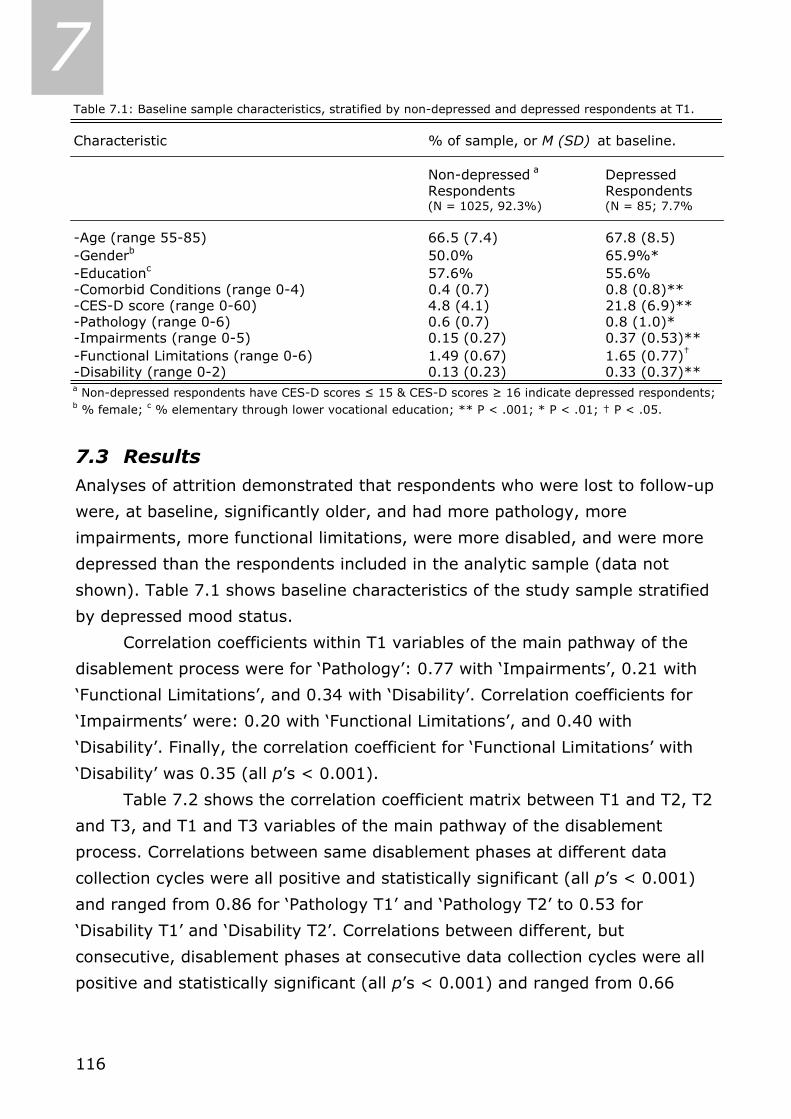
116
7
7.3 Results Analyses of attrition demonstrated that respondents who were lost to follow-up
were, at baseline, significantly older, and had more pathology, more
impairments, more functional limitations, were more disabled, and were more
depressed than the respondents included in the analytic sample (data not
shown). Table 7.1 shows baseline characteristics of the study sample stratified
by depressed mood status.
Correlation coefficients within T1 variables of the main pathway of the
disablement process were for ‘Pathology’: 0.77 with ‘Impairments’, 0.21 with
‘Functional Limitations’, and 0.34 with ‘Disability’. Correlation coefficients for
‘Impairments’ were: 0.20 with ‘Functional Limitations’, and 0.40 with
‘Disability’. Finally, the correlation coefficient for ‘Functional Limitations’ with
‘Disability’ was 0.35 (all p’s < 0.001).
Table 7.2 shows the correlation coefficient matrix between T1 and T2, T2
and T3, and T1 and T3 variables of the main pathway of the disablement
process. Correlations between same disablement phases at different data
collection cycles were all positive and statistically significant (all p’s < 0.001)
and ranged from 0.86 for ‘Pathology T1’ and ‘Pathology T2’ to 0.53 for
‘Disability T1’ and ‘Disability T2’. Correlations between different, but
consecutive, disablement phases at consecutive data collection cycles were all
positive and statistically significant (all p’s < 0.001) and ranged from 0.66
Table 7.1: Baseline sample characteristics, stratified by non-depressed and depressed respondents at T1.
Characteristic % of sample, or M (SD) at baseline.
Non-depressed a DepressedRespondents Respondents(N = 1025, 92.3%) (N = 85; 7.7%
-Age (range 55-85) 66.5 (7.4) 67.8 (8.5)-Genderb 50.0% 65.9%*-Educationc 57.6% 55.6%-Comorbid Conditions (range 0-4) 0.4 (0.7) 0.8 (0.8)**-CES-D score (range 0-60) 4.8 (4.1) 21.8 (6.9)**-Pathology (range 0-6) 0.6 (0.7) 0.8 (1.0)*-Impairments (range 0-5) 0.15 (0.27) 0.37 (0.53)**-Functional Limitations (range 0-6) 1.49 (0.67) 1.65 (0.77)†
-Disability (range 0-2) 0.13 (0.23) 0.33 (0.37)**a Non-depressed respondents have CES-D scores ≤ 15 & CES-D scores ≥ 16 indicate depressed respondents; b % female; c % elementary through lower vocational education; ** P < .001; * P < .01; † P < .05.
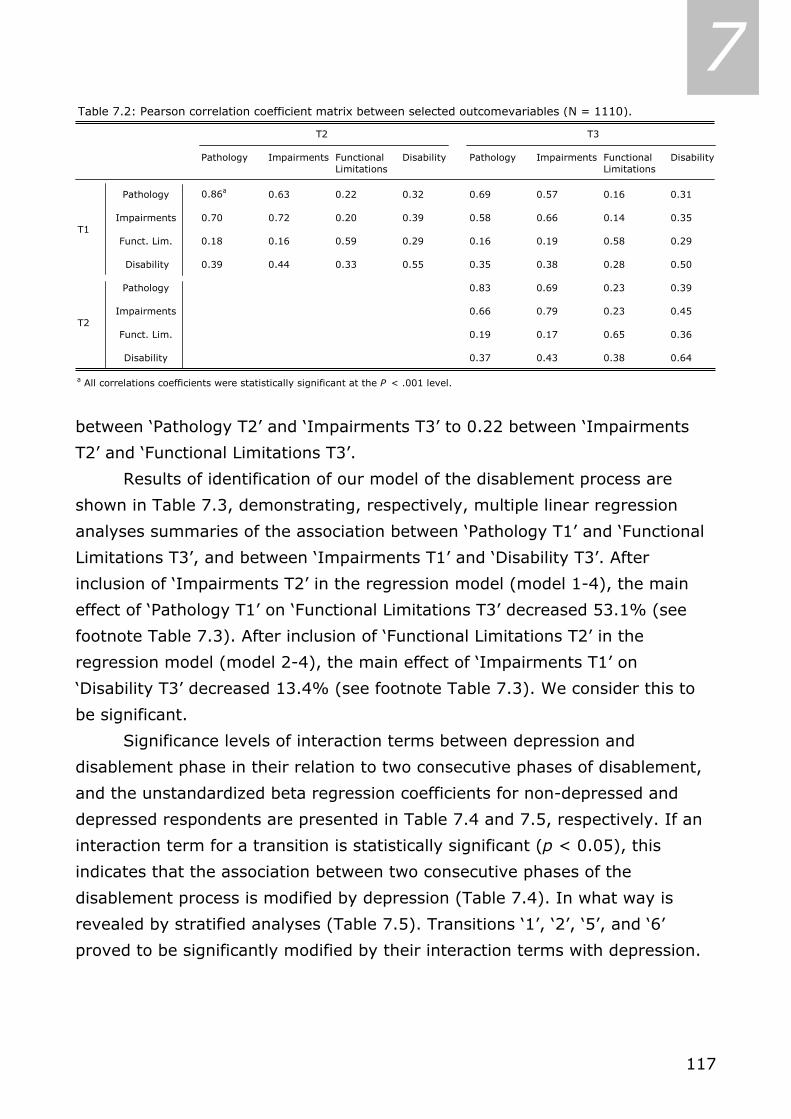
117
7
between ‘Pathology T2’ and ‘Impairments T3’ to 0.22 between ‘Impairments
T2’ and ‘Functional Limitations T3’.
Results of identification of our model of the disablement process are
shown in Table 7.3, demonstrating, respectively, multiple linear regression
analyses summaries of the association between ‘Pathology T1’ and ‘Functional
Limitations T3’, and between ‘Impairments T1’ and ‘Disability T3’. After
inclusion of ‘Impairments T2’ in the regression model (model 1-4), the main
effect of ‘Pathology T1’ on ‘Functional Limitations T3’ decreased 53.1% (see
footnote Table 7.3). After inclusion of ‘Functional Limitations T2’ in the
regression model (model 2-4), the main effect of ‘Impairments T1’ on
‘Disability T3’ decreased 13.4% (see footnote Table 7.3). We consider this to
be significant.
Significance levels of interaction terms between depression and
disablement phase in their relation to two consecutive phases of disablement,
and the unstandardized beta regression coefficients for non-depressed and
depressed respondents are presented in Table 7.4 and 7.5, respectively. If an
interaction term for a transition is statistically significant (p < 0.05), this
indicates that the association between two consecutive phases of the
disablement process is modified by depression (Table 7.4). In what way is
revealed by stratified analyses (Table 7.5). Transitions ‘1’, ‘2’, ‘5’, and ‘6’
proved to be significantly modified by their interaction terms with depression.
Table 7.2: Pearson correlation coefficient matrix between selected outcomevariables (N = 1110).
T2 T3
Pathology Impairments Functional Disability Pathology Impairments Functional DisabilityLimitations Limitations
Pathology 0.86a 0.63 0.22 0.32 0.69 0.57 0.16 0.31
Impairments 0.70 0.72 0.20 0.39 0.58 0.66 0.14 0.35T1
Funct. Lim. 0.18 0.16 0.59 0.29 0.16 0.19 0.58 0.29
Disability 0.39 0.44 0.33 0.55 0.35 0.38 0.28 0.50
Pathology 0.83 0.69 0.23 0.39
Impairments 0.66 0.79 0.23 0.45T2
Funct. Lim. 0.19 0.17 0.65 0.36
Disability 0.37 0.43 0.38 0.64
a All correlations coefficients were statistically significant at the P < .001 level.
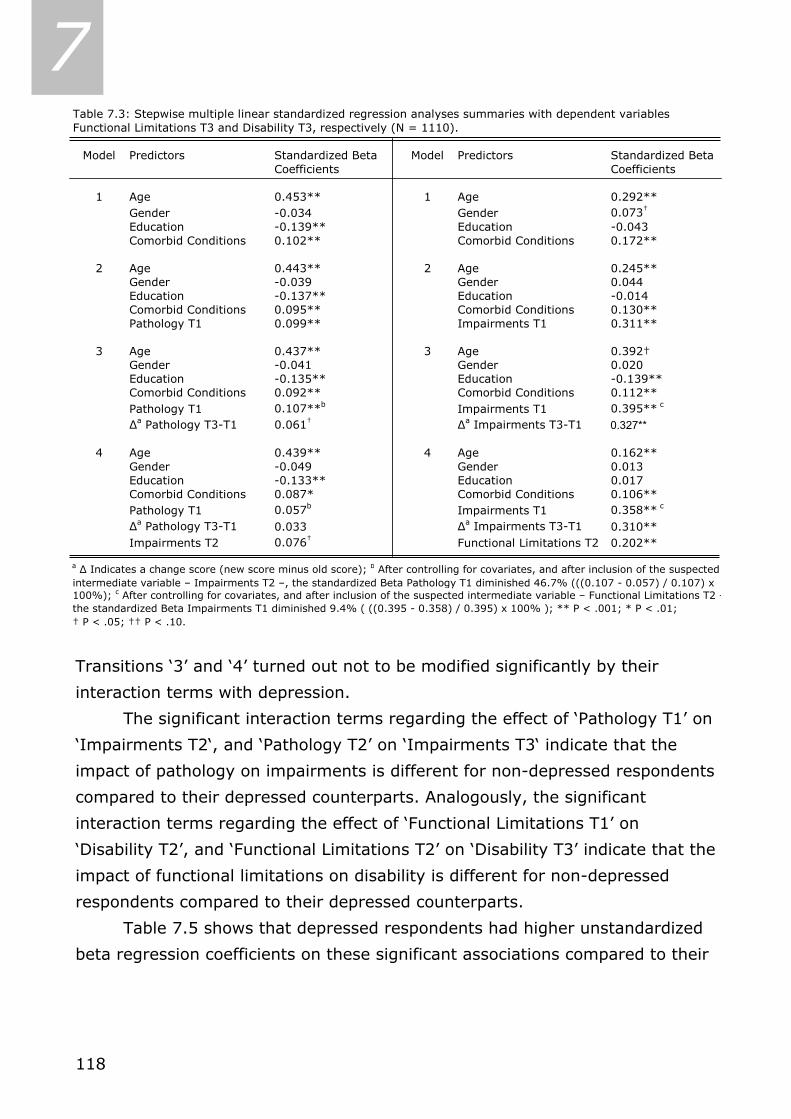
118
7
Transitions ‘3’ and ‘4’ turned out not to be modified significantly by their
interaction terms with depression.
The significant interaction terms regarding the effect of ‘Pathology T1’ on
‘Impairments T2‘, and ‘Pathology T2’ on ‘Impairments T3‘ indicate that the
impact of pathology on impairments is different for non-depressed respondents
compared to their depressed counterparts. Analogously, the significant
interaction terms regarding the effect of ‘Functional Limitations T1’ on
‘Disability T2’, and ‘Functional Limitations T2’ on ‘Disability T3’ indicate that the
impact of functional limitations on disability is different for non-depressed
respondents compared to their depressed counterparts.
Table 7.5 shows that depressed respondents had higher unstandardized
beta regression coefficients on these significant associations compared to their
Table 7.3: Stepwise multiple linear standardized regression analyses summaries with dependent variables Functional Limitations T3 and Disability T3, respectively (N = 1110).
Model Predictors Standardized Beta Model Predictors Standardized BetaCoefficients Coefficients
1 Age 0.453** 1 Age 0.292**Gender -0.034 Gender 0.073†
Education -0.139** Education -0.043Comorbid Conditions 0.102** Comorbid Conditions 0.172**
2 Age 0.443** 2 Age 0.245**Gender -0.039 Gender 0.044Education -0.137** Education -0.014Comorbid Conditions 0.095** Comorbid Conditions 0.130**Pathology T1 0.099** Impairments T1 0.311**
3 Age 0.437** 3 Age 0.392†Gender -0.041 Gender 0.020Education -0.135** Education -0.139**Comorbid Conditions 0.092** Comorbid Conditions 0.112**Pathology T1 0.107**b Impairments T1 0.395** c
∆a Pathology T3-T1 0.061† ∆a Impairments T3-T1 0.327**
4 Age 0.439** 4 Age 0.162**Gender -0.049 Gender 0.013Education -0.133** Education 0.017Comorbid Conditions 0.087* Comorbid Conditions 0.106**Pathology T1 0.057b Impairments T1 0.358** c
∆a Pathology T3-T1 0.033 ∆a Impairments T3-T1 0.310**Impairments T2 0.076† Functional Limitations T2 0.202**
a ∆ Indicates a change score (new score minus old score); b After controlling for covariates, and after inclusion of the suspected intermediate variable – Impairments T2 –, the standardized Beta Pathology T1 diminished 46.7% (((0.107 - 0.057) / 0.107) x 100%); c After controlling for covariates, and after inclusion of the suspected intermediate variable – Functional Limitations T2 –the standardized Beta Impairments T1 diminished 9.4% ( ((0.395 - 0.358) / 0.395) x 100% ); ** P < .001; * P < .01; † P < .05; †† P < .10.
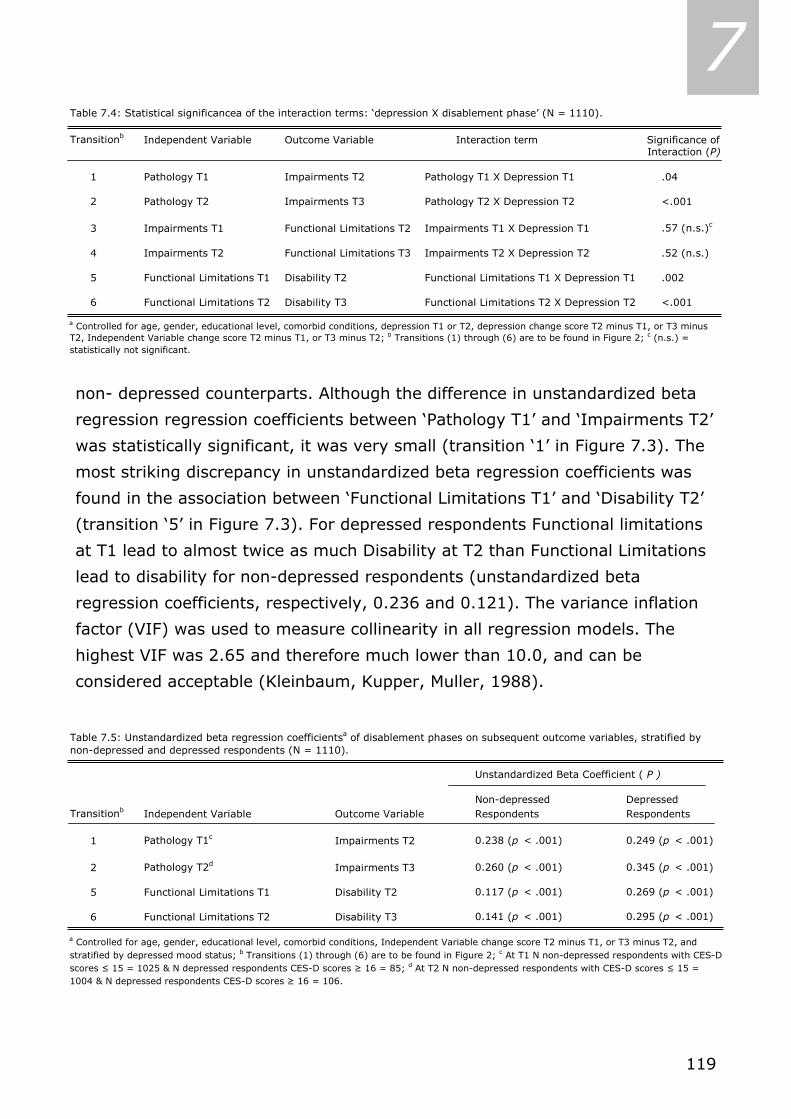
119
7
non- depressed counterparts. Although the difference in unstandardized beta
regression regression coefficients between ‘Pathology T1’ and ‘Impairments T2’
was statistically significant, it was very small (transition ‘1’ in Figure 7.3). The
most striking discrepancy in unstandardized beta regression coefficients was
found in the association between ‘Functional Limitations T1’ and ‘Disability T2’
(transition ‘5’ in Figure 7.3). For depressed respondents Functional limitations
at T1 lead to almost twice as much Disability at T2 than Functional Limitations
lead to disability for non-depressed respondents (unstandardized beta
regression coefficients, respectively, 0.236 and 0.121). The variance inflation
factor (VIF) was used to measure collinearity in all regression models. The
highest VIF was 2.65 and therefore much lower than 10.0, and can be
considered acceptable (Kleinbaum, Kupper, Muller, 1988).
Table 7.4: Statistical significancea of the interaction terms: ‘depression X disablement phase’ (N = 1110).
Transitionb Independent Variable Outcome Variable Interaction term Significance of Interaction (P)
1 Pathology T1 Impairments T2 Pathology T1 Χ Depression T1 .04
2 Pathology T2 Impairments T3 Pathology T2 Χ Depression T2 <.001
3 Impairments T1 Functional Limitations T2 Impairments T1 Χ Depression T1 .57 (n.s.)c
4 Impairments T2 Functional Limitations T3 Impairments T2 Χ Depression T2 .52 (n.s.)
5 Functional Limitations T1 Disability T2 Functional Limitations T1 Χ Depression T1 .002
6 Functional Limitations T2 Disability T3 Functional Limitations T2 Χ Depression T2 <.001
a Controlled for age, gender, educational level, comorbid conditions, depression T1 or T2, depression change score T2 minus T1, or T3 minus T2, Independent Variable change score T2 minus T1, or T3 minus T2; b Transitions (1) through (6) are to be found in Figure 2; c (n.s.) = statistically not significant.
Table 7.5: Unstandardized beta regression coefficientsa of disablement phases on subsequent outcome variables, stratified by non-depressed and depressed respondents (N = 1110).
Unstandardized Beta Coefficient ( P )
Non-depressed DepressedTransitionb Independent Variable Outcome Variable Respondents Respondents
1 Pathology T1c Impairments T2 0.238 (p < .001) 0.249 (p < .001)
2 Pathology T2d Impairments T3 0.260 (p < .001) 0.345 (p < .001)
5 Functional Limitations T1 Disability T2 0.117 (p < .001) 0.269 (p < .001)
6 Functional Limitations T2 Disability T3 0.141 (p < .001) 0.295 (p < .001)
a Controlled for age, gender, educational level, comorbid conditions, Independent Variable change score T2 minus T1, or T3 minus T2, and stratified by depressed mood status; b Transitions (1) through (6) are to be found in Figure 2; c At T1 N non-depressed respondents with CES-D scores ≤ 15 = 1025 & N depressed respondents CES-D scores ≥ 16 = 85; d At T2 N non-depressed respondents with CES-D scores ≤ 15 = 1004 & N depressed respondents CES-D scores ≥ 16 = 106.

120
7 7.4 Discussion This paper aimed 1) to identify the main pathway of the disablement process in
a sample of Dutch late middle aged and older persons over a 6-year period,
and 2) to examine whether depression accelerates the process of disablement
(i.e. whether associations between two consecutive phases of the disablement
process are stronger for those who are depressed than for those who are not).
First, we found empirical evidence for the identification of the main
pathway of the disablement process in our sample of Dutch late middle-aged
and older persons. Associations between all disablement phases were positive
and statistically significant, and the impact of prior disablement process
variables decreased when the impact of intermediate phases were taken into
account. Second, four of the six associations we examined in the main pathway
were modified by depression, in the expected way. More specific, associations
in the early and late phases of the process of disablement were modified by
depression. This indicates acceleration in those transitions of the disablement
process, at least partly, due to pre-existing depression.
Few other studies have used the disablement process to attain a
comprehensive view on the course of a specific disease, e.g. arthritis
(Guccione, 1994; Escalante & Del Rincon, 2002), and pulmonary disease
(Jette, Manago, Medved, Nickerson, Warzycha, & Bourgeois, 1997). Generic,
middle-aged and older adult population-based, longitudinal studies that
consider the disablement process as a whole in their study are even more
sparse (Femia, Zarit, & Johansson, 2001; Peek, Ottenbacher, Markides, &
Ostir, 2003); those involving depression as well are, to our knowledge, lacking.
Femia, Zarit, & Johansson (2001) and Peek, Ottenbacher, Markides, & Ostir
(2003), however, found that the disablement process main pathway could be
identified in a cross-sectional sample of the oldest-old Swedes, and in a
longitudinal sample of the EPESE among older Mexican American adults,
respectively. Moreover, both studies suggested that psychosocial experiences
could greatly affect the disability experience. We found longitudinal support for
their suggestion in the case of depression: the modifications by depression of
the associations that we found, indicate acceleration in transitions of the
disablement process due to pre-existing depression. The differences in effect
between non-depressed and depressed persons, when transitions either from

121
7 pathology to impairments, or from functional limitations to disability were
analyzed, suggest that depression seems particularly at work in the early and
late phases of the disablement process. The transition from impairments to
functional limitations, however, was not significantly modified by depression.
This can be due to the fact that, in our study with a heterogeneous sample,
this is a transition from the disease-related construct of impairments,
measured with disease-specific symptom inventories, to the more generic
construct of functional limitations, measured with several generic instruments.
Studies that use a more homogeneous sample, e.g. only participants with
pulmonary disease (Jette, Manago, Medved, et al., 1997) in combination with
the use of disease-specific instruments to assess functional limitations, may be
more likely to find evidence of modification of the transition from impairments
to functional limitations by depression.
In specific medical conditions, such as diabetes and heart diseases,
depressive comorbidity is a predictor of worse course and outcome of those
diseases (Depression Guideline Panel, 1993). How does this interaction have
its effect on impairments? First, there could be a biological explanation.
Inflammatory serum markers, such as C-reactive protein (CRP), and cytokine
interleukin-6 (IL-6), were found to be elevated in depressed respondents
compared to their non-depressed counterparts (Tiemeier, Hofman, van Tuijl,
Kiliaan, Meijer, & Breteler, 2003). Chronically elevated inflammatory serum
markers are believed to negatively influence the course of a wide array of
diseases, e.g., Alzheimer or substantial cognitive decline (Yaffe, Lindquist,
Penninx, Simonsick, Pahor, Kritchevsky, et al., 2003), anemia (Tilg, Ulmer,
Kaser, & Weiss, 2001), arthritis (Wong, Toh, Wilson, Rowley, Karschimkus,
Prior, et al., 2003), cancer (Repetto, Venturino, Fratino, Serraino, Troisi,
Gianni, et al., 2003), heart disease (Stone, Mendall, Kaski, Edger, Risley,
Poloniecki, et al., 2002), and lung disease (Mannino, Ford, & Redd, 2003). The
differential effect of pathology on impairments that we found for depressed
respondents compared to their non-depressed counterparts may thus be a
clinical manifestation of depression on the immunological level.
A second explanation for the stronger effect of pathology on impairments
that we found for depressed respondents compared to their non-depressed
counterparts may be that depressed physically ill respondents may suffer more
122
7 from feelings of hopelessness, or be more pessimistic than non-depressed
physically ill respondents that their physical symptoms will be effectively
treated and, therefore, not report their physical symptoms to their GP’s (cf.
Schubert, Yokley, Sloan, & Gottesman, 1995). These authors also suggest that
depression may delay identification, treatment, and rehabilitation of coexisting
physical illness, when the conditions are coincidental, thereby causing a
discrepancy in impairments between depressed physically ill and non-
depressed physically ill respondents. In addition, depressed physically ill
respondents may be less likely to comply with their medical regimen (Carney,
Freedland, Eisen, Rich, & Jaffe, 1995; Ciechanowski, Katon, & Russo, 2000),
and less likely to adopt a healthy lifestyle (van Gool, Kempen, Penninx, Deeg,
Beekman, & van Eijk, 2003) compared to their non-depressed counterparts,
thereby delaying treatment and rehabilitation as well. This also can lead to a
discrepancy in impairments between depressed physically ill and non-
depressed physically ill respondents.
The stronger effect of functional limitations on disability that we found
for depressed respondents compared to their non-depressed counterparts may
be a motivational manifestation of depression: depressed and functionally
limited respondents may be less able or motivated to (try to) maintain a
certain level of ability. Lamb (1996) found cross-sectional evidence for
respondents with this frail profile of both depression and functional limitations
to be more disabled than respondents with only a depressed profile, or
respondents with only a functionally limited profile. Kempen, Steverink, Ormel,
and Deeg (1996) found that depressed older adults scored lower on self-
reported functional limitations than could be expected on the basis of
performance-based functional limitations. Due to our use of a composite
variable for functional limitations, composed of self-reported and performance-
based measures of functional limitations, in our study this overestimation
should be moderate. Moreover, does inaccurate self-estimation on functional
limitations make the estimation any less valid for the depressed respondent
itself?
Our study suffers from attrition during six years, much of which is
caused by mortality. Only relatively healthy participants survived. Study
dropouts were older, were more diseased, had more impairments and
123
7 limitations, were more disabled and depressed. This could cause an
underestimation of true interaction effects that we found between disablement
phases and depression. Kempen & Van Sonderen (2002), however, take the
view that, although attrition may be responsible for inaccurate estimations of
descriptive measures, attrition has less influence on measures of association.
Another limitation pertains to our use of composite variables in each stage of
the disablement process, instead of multiple separate variables. The latter
approach would have conserved information contained in the separate
variables, and would allow for better interpretation of the separate variables.
However, this approach is beyond the scope of the paper, as it would obscure
the comprehensiveness of our conceptual model.
Implications of our study are twofold. First, identification of the process
of disablement could be regarded as an indication that the model can be used
in future studies among population-based age groups similar to ours, to
replicate our findings. Second, our results regarding the interactions between
transitions of the main pathway of the disablement process and depression can
be interpreted as an indication that prevention or treatment of depression can
slow down the process of disablement, specifically transitions from pathology
to impairments and from functional limitations to disability. Partial support for
this interpretation comes from Von Korff, Ormel, Katon, & Lin (1992), who
report significant reductions in ADL disability scores in persons whose
depression improved significantly, compared to non-significant reductions in
ADL disability scores in persons whose depression did not, or did only
moderately improve after 12 months.
Lastly, with our study results we hope to have contributed to the ongoing
discussion (Charney , Reynolds, Lewis, Lebowitz, Sunderland, Alexopoulos, et
al., 2003) regarding the consequences of late life mood disorders and the need
to improve diagnosis and treatment of persons afflicted by those mood
disorders.
124
7 7.5 References 1. Armenian, H. K., Pratt, L. A., Gallo, J., & Eaton, W. W. (1998). Psychopathology as
predictor of disability: a population-based follow-up study in Baltimore, Maryland.
American Journal of Epidemiology, 148, 269-275.
2. Baron, R. M., & Kenny, D. A. (1986). The moderator-mediator variable distinction in social
psychological research: conceptual, strategic, and statistical considerations. Journal of
Personality and Social Psychology, 51 (6), 1173-1182.
3. Beekman, A. T., Deeg, D. J., Van Limbeek, J., Braam, A. W., De Vries, M. Z., & Van
Tilburg, W. (1997). Criterion validity of the Center for Epidemiologic Studies Depression
scale (CES-D): Results from a community-based sample of older subjects in The
Netherlands. Psychological Medicine, 27 (1), 231-235.
4. Beekman, A. T., van Limbeek, J., Deeg, D. J., Wouters, L., & van Tilburg, W. (1994). A
screening tool for depression in the elderly in the general population: the usefulness of
Center for Epidemiological Studies Depression Scale (CES-D). Tijdschrift voor
Gerontologie en Geriatrie, 25 (3),95-103.
5. Bruce, M. L. (2000). Depression and disability. In G. M. Williamson, D. R. Shaffer, & P. A.
Parmelee (Eds.), Physical Illness and Depression in Older Adults: a Handbook of Theory,
Research, and Practice (pp. 11-29). New York: Kluwer Academic / Plenum Publishers.
6. Carney, R. M., Freedland, K. E., Eisen, S. A., Rich, M. W., & Jaffe, A. S. (1995). Major
depression and medication adherence in elderly patients with coronary artery disease.
Health Psychology, 14 (1), 88-90.
7. Charney, D. S., Reynolds, C. F., 3rd, Lewis, L., Lebowitz, B. D., Sunderland, T.,
Alexopoulos, G. S., et al. (2003). Depression and Bipolar Support Alliance consensus
statement on the unmet needs in diagnosis and treatment of mood disorders in late life.
Archives of General Psychiatry, 60 (7), 664-672.
8. Ciechanowski, P. S., Katon, W. J., & Russo, J. E. (2000). Depression and diabetes: impact
of depressive symptoms on adherence, function, and costs. Archives of Internal Medicine,
60, 3278-3285.
9. Depression Guideline Panel (1993). Depression in primary care, Vol 1. Detection and
diagnosis. Clinical Practice Guideline, Number 5. Rockville, MD, U.S. Department of Health
and Human Services, Public Health Service, Agency for Health Care Policy and Research.
AHCPR Publication No. 93-0550.
10. Escalante, A., & Del Rincon, I. (2002). The disablement process in rheumatoid arthritis.
Arthritis and Rheumatism, 47 (3), 333-342.
11. Femia, E. E., Zarit, S. H., & Johansson, B. (2001). The disablement process in very late
life: A study of the oldest-old in Sweden. The Journals of Gerontology. Series B:
Psychological Sciences and Social Sciences, 56 (1), P12-23.
12. Folstein, M. F., Folstein, S. E., & McHugh, P. R. (1975). Mini-mental state: A practical
method for grading the cognitive state of patients for the clinician. Journal of Psychiatric
Research, 12, 189-198.
125
7 13. Geerlings, S. W., Beekman, A. T., Deeg, D. J., Twisk, J. W., & Van Tilburg, W. (2001).
The longitudinal effect of depression on functional limitations and disability in older
adults: an eight-wave prospective community-based study. Psychological Medicine, 31
(8), 1361-1371.
14. Guccione, A. A. (1994). Arthritis and the process of disablement. Physical Therapy, 74
(5), 408-414.
15. Jette, D. U., Manago, D., Medved, E., Nickerson, A., Warzycha, T., & Bourgeois, M. C.
(1997). The disablement process in patients with pulmonary disease. Physical Therapy,
77 (4), 385-394.
16. Kempen, G. I. J. M., Ormel, J., Brilman, E. I., & Relyveld, J. (1997). Adaptive responses
among Dutch elderly: the impact of eight chronic medical conditions on health-related
quality of life. American Journal of Public Health, 87 (1), 38-44.
17. Kempen, G. I. J. M., Sanderman, R., Scaf-Klomp, W., & Ormel, J. (2003). The role of
depressive symptoms in recovery from injuries to the extremities in older persons: a
prospective study. International Journal of Geriatric Psychiatry, 18, 14-22.
18. Kempen, G. I., Steverink, N., Ormel, J., & Deeg, D. J. (1996). The assessment of ADL
among frail elderly in an interview survey: self-report versus performance-based tests
and determinants of discrepancies. Journal of Gerontology Series B Psychological Sciences
and Social Sciences, 51(5), 254-260.
19. Kempen, G. I., & van Sonderen, E. (2002). Psychological attributes and changes in
disability among low-functioning older persons: Does attrition affect the outcomes?
Journal of Clinical Epidemiology, 55 (3), 224-229.
20. Kempen, G. I. J. M., Verbrugge, L. M., Merrill, S. S., & Ormel, J. (1998). The impact of
multiple impairments on disability in community-dwelling older people. Age and Ageing,
27, 595-604.
21. Kennedy, G. L., Kelman, H. R., & Thomas, C. (1990). The emergence of depressive
symptoms in late life: the importance of declining health and increasing disability. Journal
of Community Health, 5, 93-104.
22. Kim, H. F., Kunik, M. E., Molinari, V. A., Hillman, S. L., Lalani, S., Orengo, C. A., Petersen,
N. J.,Nahas, Z., & Goodnight-White, S. (2000). Functional impairment in COPD patients:
the impact of anxiety and depression. Psychosomatics, 41(6), 465-471.
23. Kleinbaum, D. G., Kupper, L. L., & Muller, K. E. (1988). Applied regression analysis and
other multivariable methods. Belmont, CA: Duxbury Press.
24. Kriegsman, D. M., Deeg, D. J., van Eijk, J. T., Penninx, B. W., & Boeke, A. J. (1997). Do
disease specific characteristics add to the explanation of mobility limitations in patients
with different chronic diseases? A study in The Netherlands. Journal of Epidemiology and
Community Health, 51 (6), 676-685.
25. Kriegsman, D. M., Penninx, B. W. J. H., Van Eijk, J. Th. M., Boeke, A. J., & Deeg, D. J. H.
(1996). Self-reports and general practitioners information on the presence of chronic
diseases in community-dwelling elderly. A study of accuracy of patients’ self-reports and
on determinants of accuracy. Journal of Clinical Epidemiology, 49 (12), 1407-1417.

126
7 26. Lamb, V. L. (1996). A cross-national study of quality of life factors associated with
patterns of elderly disablement. Social Science and Medicine, 42 (3), 363-377.
27. Lan, T. Y., Deeg, D. J. H., Guralnik, J. M., & Melzer, D. (2003). Responsiveness of the
index of mobility limitation: Comparison with gait speed alone in the longitudinal aging
study Amsterdam. Journal of Gerontology, 58A(8), 721-727.
28. Lawrence, R. H., & Jette, A. M. (1996). Disentangling the disablement process. The
Journals of Gerontology. Series B: Psychological Sciences and Social Sciences, 51 (4),
S173-S182.
29. Magaziner, J. (1991). Hip fracture recovery study patient-proxy concordance study field
manual.Baltimore, MD, USA: University of Maryland, School of Medicine.
30. Mannino, D. M., Ford, E. S., & Redd, S. C. (2003). Obstructive and restrictive lung disease
and markers of inflammation: data from the Third National Health and Nutrition
Examination. American Journal of Medicine, 114 (9), 758-762.
31. National Academy on an Aging Society. (2000). Depression: A treatable disease.
Challenges for the 21st Century: Chronic and Disabling Conditions 9.
http://www.agingsociety.org/profiles.htm.
32. Ormel, J., Rijsdijk, F. V., Sullivan, M., van Sonderen, E., & Kempen, G. I. (2002).
Temporal and reciprocal relationship between IADL/ADL disability and depressive
symptoms in late life. The Journals of Gerontology. Series B: Psychological Sciences and
Social Sciences, 57 (4), P338-P347.
33. Ormel, J., Vonkorff, M., Oldehinkel, A. J., Simon, G., Tiemens, B. G., & Ustun, T. B.
(1999). Onset of disability in depressed and non-depressed primary care patients.
Psychological Medicine, 29 (4), 847-853.
34. Peek, M. K., Ottenbacher, K. J., Markides, K. S., & Ostir, G. V. (2003). Examining the
disablement process among older Mexican American adults. Social Science and Medicine,
57, 413-425.
35. Penninx, B. W., Deeg, D. J. H., Van Eijk, J. Th. M., Beekman, A. T. F., & Guralnik, J. M.
(2000). Changes in depression and physical decline in older adults: a longitudinal
perspective. Journal of Affective Disorders, 61 (1-2), 1-12.
36. Penninx, B. W. J. H. (1996). Social support in elderly people with chronic diseases: does it
really help? [doctoral dissertation]. Amsterdam: Vrije Universiteit.
37. Radloff, L. S. (1977). The CES-D scale: A self-report depressive mood scale for research
in the general population. Applied Psychological Measurement, 3 (1), 385-401.
38. Repetto, L., Venturino, A., Fratino, L., Serraino, D., Troisi, G., Gianni, W., & Pietropaolo,
M. (2003). Geriatric oncology: a clinical approach to the older patient with cancer.
European Journal of Cancer, 39 (7), 870-880.
39. Rolland, J. S. (1987). Chronic illness and the life cycle: a conceptual framework. Family
Process, 26 (2), 203-21.
40. Ruwaard, D., & Kramers, P. G. N. (1997). Volksgezondheid toekomst verkenning1997: de
som der delen [Public health future scenario 1997: the sum of parts]. Bilthoven, The
Netherlands: Rijksinstituut voor Volksgezondheid en Milieu (RIVM).

127
7 41. Schubert, D. S., Yokley, J., Sloan, D., & Gottesman, H. (1995). Impact of the interaction
of depression and physical illness on a psychiatric unit's length of stay. General Hospital
Psychiatry, 17 (5), 326-334.
42. Stewart, A., Hays, R., & Ware, J. (1988). The Medical Outcome Study short form general
health survey. Medical Care, 26, 724-733.
43. Stone, A. F., Mendall, M. A., Kaski, J. C., Edger, T. M., Risley, P., Poloniecki, J., Camm, A.
J., & Northfield, T. C. (2002). Effect of treatment for Chlamydia pneumoniae and
Helicobacter pylori on markers of inflammation and cardiac events in patients with acute
coronary syndromes: South Thames Trial of Antibiotics in Myocardial Infarction and
Unstable Angina (STAMINA). Circulation, 106 (10), 1219-1223.
44. Tiemeier, H., Hofman, A., van Tuijl, H. R., Kiliaan, A. J., Meijer, J., & Breteler, M. M.
(2003). Inflammatory proteins and depression in the elderly. Epidemiology, 14 (1), 103-
107.
45. Tilg, H., Ulmer, H., Kaser, A., & Weiss, G. (2002). Role of IL-10 for induction of anaemia
during inflammation. Journal of Immunology, 169 (4), 2204-2209.
46. Van den Heuvel, N., Smits, C. H., Deeg, D. J., & Beekman, A. T. (1996). Personality: A
moderator of the relation between cognitive functioning and depression in adults aged 55-
85? Journal of Affective Disorders, 41 (3), 229-240.
47. Van Eijk, J. Th. M., & De Haan, M. (1998). Care for the chronically ill: the future role of
health care professionals. Patient Education and Counseling, 35 (3), 233-240.
48. Van Gool, C. H., Kempen, G. I. J. M., Penninx, B. W. J. H., Deeg, D. J., Beekman, A.T., &
van Eijk, J.T. (2003). Relationship between changes in depressive symptoms and
unhealthy lifestyles in late middle aged and older persons: results from the Longitudinal
Aging Study Amsterdam. Age and Ageing, 32 (1), 81-87.
49. Van Sonsbeek, J. L. A. (1988). Methodological and substantial aspects of the OECD
indicator of chronic functional limitations. Maandbericht Gezondheid[Statistics
Netherlands], 88, 4-17.
50. Verbrugge, L. M., & Jette, A. M. (1994). The disablement process. Social Science and
Medicine, 38 (1), 1-14.
51. Von Korff, M., Ormel, J., Katon, W., & Lin, E. H. (1992). Disability and depression among
high utilizers of health care: A longitudinal analysis. Archives of General Psychiatry, 49
(2), 91-100.
52. Wong, M., Toh, L., Wilson, A., Rowley, K., Karschimkus, C., Prior, D., Romas, E.,
Clemens, L., Dragicevic, G., Harianto, H., Wicks, I., McColl, G., Best, J., & Jenkins, A.
(2003). Reduced arterial elasticity in rheumatoid arthritis and the relationship to vascular
disease risk factors and inflammation. Arthritis and Rheumatism, 48 (1), 81-89.
53. World Health Organization, & Food and Agriculture Organization. (2003). Diet, nutrition
and the prevention of chronic diseases. Report of a Joint WHO/FAO Expert Consultation.
Geneva, Switzerland: World Health Organisation Technical Report Series, no. 916.
128
7 54. Yaffe, K., Lindquist, K., Penninx, B. W., Simonsick, E. M., Pahor, M., Kritchevsky,
S.,Launer, L., Kuller, L., Rubin, S., & Harris, T. (2003). Inflammatory markers and
cognition in well-functioning African-American and white elders. Neurology, 61 (1), 76-80.
7.6 Acknowledgement The Longitudinal Aging Study Amsterdam is partly funded by the Ministry of
Health, Welfare, and Sports of the Netherlands.

129
8 CHAPTER 8
General conclusions and discussion

130
8 his dissertation examined several reciprocal associations between
depression, health behavior, and the course of chronic disease, mainly
among late middle aged and older persons, utilizing data from three different
studies in the Netherlands and the United States. Following a brief synopsis of
the main findings and conclusions of our study, the results are put in
perspective, and some considerations regarding measurement instruments and
research methodology used in this study are addressed. Finally, implications
for public health and future research are outlined.
8.1 Main findings and conclusions
The research questions of our study can be summarized in the conceptual
model that was presented in the introductory chapter (1). We will discuss our
main findings using the arrows within this model (Figure 8.1).
Determinants of regimen adherence to diet and exercise interventions
(Arrows 2)
In an exploration using demographic, health-related, and psychosocial
information, we wanted to identify determinants of adherence to a diet and
exercise regimen. Over the 18-month duration of the diet and exercise
intervention study among at least overweight knee osteoarthritis patients aged
≥60 years, predictors of adherence to both interventions appeared not to be
associated with physical or mental health. For both interventions, high initial
T
Note: The numbered arrows in the figure refer to the different chapters in this dissertation
Figure 8.1: Conceptual model of our study COURSE OF CHRONIC DISEASE 7 2 & 4 3
2 & 6 2 LIFESTYLE REGIMEN ADHERENCE
DEPRESSION 5 HEALTH BEHAVIOR
131
8 attendance to intervention sessions predicted intervention session attendance
thereafter, indicating that persistence or motivation of persons seems to be
crucial here. In addition, giving people a choice of where to do their exercise
(either at home or at a research facility) and stimulating early intervention
session attendance can be effective in improving long-term attendance to both
interventions.
Associations between regimen adherence and physical function and
disability (Arrow 3)
In overweight or obese patients with knee osteoarthritis (OA), higher exercise
adherence – the extent to which persons attend intervention sessions and
reported to have exercised at home – was found to be associated with greater
improvements in physical function and in disability, though the latter to a
lesser extent. Changes in the potentially explanatory variables pain and BMI
modified these associations to some extent. Promoting adherence is clinically
important when prescribing exercise regimen to overweight and obese older
adults with knee OA. These regimens could also focus on decrease in pain and
BMI.
Chronic disease and lifestyle changes (Arrow 4)
We examined prevalences of unhealthy lifestyles – smoking, excessive alcohol
use, and being sedentary – and found that lifestyles varied over a six-year
period and across chronic disease categories. Proportions of older persons who
smoked decreased, while proportions of respondents with sedentary lifestyles
increased. Older persons with incident cardiovascular disease were more likely
to change lifestyles than persons in other chronic disease groups. Those
persons who made healthy lifestyle changes – from unhealthy to healthy
behavior – did not differ in experienced disease burden from those who
persisted in their unhealthy behavior within chronic disease groups. Knowing
whether (and why) a specific group of patients is inclined more than others to
make healthy lifestyle changes might be important. This can be used to target
health promotion strategies more effectively and enhance the effectiveness of
self-management programs that aim at coping with chronic diseases.
132
8 Ultimately, chronic disease groups who do not initiate more healthy lifestyles
might be reached for intervention.
Associations between lifestyle and depressed mood (Arrow 5)
Excessive alcohol use predicted subsequent depressed mood, and >30 minutes
of physical exercise per day predicted subsequent absence of depressed mood.
Not being overweight for a longer period of time was predictive of subsequent
absence of depressed mood. Adopting healthy lifestyles could be a way to
‘break the negative cycle’ and might be a starting point to prevent or to deal
with depressed mood over time.
Associations between depressed mood and lifestyle (Arrow 6)
We examined whether symptoms of depression were associated with unhealthy
lifestyles – smoking, excessive alcohol use, and being sedentary – and found
that depressed persons were more likely to be smokers. A persistent
depression was associated with an increase in cigarette consumption. Having
an emerging depression was most likely to co-occur with persons becoming
sedentary, and was associated with the largest decrease in minutes of physical
activity per day. This effect was not modified or confounded by having chronic
somatic disease. A persistent depression tended to be associated with incident
excessive alcohol use. It should be clarified whether or not treatment of
symptoms of depression can prevent the development of sedentary lifestyles.
The process of disablement and depression (Arrow 7)
We examined the main pathway of the disablement process - which was
hypothesized to consist of four consecutive phases: pathology, impairments,
functional limitations, and disability – and how depression affects this pathway.
We found that impairments mediated the association between pathology and
functional limitations, and that functional limitations mediated the association
between impairments and disability, both in a time-dependent way, so that the
main pathway of the disablement process could be identified in our study. In
addition, we found an accelerating effect of depression, particularly in the early
and late stages of the model. Reduction of depression may help slow down the
133
8 process of disablement for persons who find themselves in particularly those
stages of the model.
Conclusions
Transcending the findings of the separate studies, we can conclude that the
course of chronic disease is accelerated under the presence of depression.
However, we found that the disease’s negative consequences on daily
functioning can be restricted, as our study in patients with knee osteoarthritis
demonstrated. Furthermore, for specific chronic diseases, the course of disease
is associated differentially with lifestyle, and lifestyle changes. Healthy lifestyle
changes, however, appeared not to be related with a relief of experienced
disease burden. Other factors may be at work here.
When living a healthy lifestyle, the risk of a depression is relatively low. Still,
should a depression emerge, a shift is likely to happen from being physically
active to being sedentary. And when being persistently depressed, the risk of
living unhealthy lifestyles is more prominent. In sum, in our study we found
clear indications for an interrelationship between the concepts of course of
chronic disease, depression, and health behavior among older persons.
8.2 The prevalence of our key variables in perspective to
other studies In order to put our findings in perspective, we briefly compare several
prevalence figures from our findings with each other and with prevalence
estimates of Statistics Netherlands (chapter 1;[1]).
Chronic conditions
We tabulated the most prominent findings and ranked the studies beginning
with the youngest, and probably healthiest sample (MAAS; 24 through 81
years), and ending with the sample assumed to be least healthy (ADAPT; 60
years and older plus all respondents were at least overweight and had knee
OA; Table 8.1). As the study samples get older and ‘unhealthier’, the
prevalence of heart disease increases – although different definitions of heart
disease have been used – as does the prevalence of lung disease, and the
proportion of respondents reporting 2 or more chronic conditions increases.

134
8 The prevalence of musculoskeletal disorders among respondents in the ADAPT
study was set to 100% as radiographic evidence of having knee OA was a
study inclusion criterion.
Table 8.1: Comparison of prevalence figures (percentages) of several chronic conditions
across studies
Study MAAS1 CBS2 LASA3 ADAPT4
n=1186 n=10110 n=2184 n=206
Age <55 62.9 0 0 0
55-65 19.4 44.8 24.4 37.4
65-75 14.7 33.5 36.5 46.3
75+ 3.0 21.8 39.1 16.3
Gender Male 52.3 48.2 48.9 26.1
Female 47.7 51.8 51.1 73.9
Lung disease N.A.5 9.0 12.0 15.4
Heart disease N.A. 9.6 29.2 64.6
Diabetes N.A. 7.1 7.8 9.9
Musculo-skeletal disease(s) N.A. 36.1 36.8 100
≥ 2 chronic conditions 32.8 35.5 42.8 49.36 1 Based on figures from chapter 5 (n=1186); 2 Based on estimates from Statistics Netherlands (chapter 1; [1]); 3 Based on figures from chapter 4; 4 Based on figures from chapter 2; 5 Not available; 6 Besides knee osteoarthritis.
Depression
Although termed differently across our studies, respondents with scores ≥ 16
on the CES-Depression scale were considered to have clinically relevant levels
of depressive symptomatology. In chapter 5 we found that 14.3% of the study
sample (n=1186) of MAAS was depressed. In chapter 6 we were able to follow-
up on depression in a sample of LASA over a six-year period (n=1280).
Proportion of depressed respondents increased from 13.8% at baseline to
20.3% at follow-up. These prevalences appeared to be in line with findings in a
review of the literature on community prevalence of depression in later life [2],
in which an averaged prevalence of all depressive syndromes deemed clinically
relevant was found of 13.3%. However, this averaged prevalence was
135
8 calculated from the results of 28 community-based studies examining the
prevalence of all depressive syndromes deemed clinically relevant among
persons 55 years and older. These prevalences varied greatly: from 2.8% in
Japan, to 35.0% in Hong Kong. In a study in which several European study
centers collaborated to examine the extent of geographical variation in
depression prevalences, using the same standardized assessment method
(GMS-AGECAT), a ‘European’ depression prevalence was estimated at 12.3%,
with extreme prevalences of 8.8% in Iceland and 23.6% in Munich, Germany.
These large differences across countries could be due to differences in religion,
and urbanization, but not to differences in age [3].
The prevalences of 13.8% and 20.3% in chapter 6 are based on a cut-off
score of 16 on depressive symptomatology measured by the CES-D [4]. Major
depressive disorder (MDD), dysthymic disorder (DD), and subtreshold
depressive disorders are included in this cut-off value. While the prevalence of
MDD tends to decrease with age, the prevalence of other depressive disorders
is more likely to increase [2]. So the apparent increase in prevalence could be
due to selective survivorship (those with severe depression are less likely to
grow old), an increase in the incidence of comorbid depressive
symptomatology that goes with the increased risk of physical illness as people
age (heart disease, dementia [4]), and/or the occurrence of life events.
As mentioned in chapter 7, depression and disability contribute to the
risk of each other over time [5-7]. This could be explained by an overlap in
somatic symptoms or concomitants of both concepts, such as decreased
muscle mass. An underlying physical system failure, however, may at the basis
of this overlap, causing both depression and disability.
Smoking behavior
In 2001, The Netherlands counted almost 16 million inhabitants; nearly 3.8
million of them (23.7%) were 55 years or older. This last group was estimated
to contain 22.8% smokers [1]. In our MAAS study sample (chapter 5) 26.6%
smoked, which decreased after six years to 21.9% (17.7% decrease). In our
LASA study sample, 20.9% smoked and decreased after six years to 17.0%
(18.7% decrease). The percentage of respondents who smoked in the MAAS
study sample is somewhat higher than the Statistics Netherlands estimate and
136
8 the LASA study. This may be due to a lower averaged age (49.0), as well as a
wider age range (24-81) in the MAAS study. In general, the percentage of
respondents who smoke decreases with age [8].
Alcohol use
Statistics Netherlands estimated that the averaged number of alcoholic drinks
in the Dutch older population ranges from 9.6 drinks per week among 55-64
year-olds to 6.0 among 75 year-olds and older [1]. In chapter 5 we found that
respondents from our sample from the MAAS study (n=1186) consumed
approximately 6.1 alcoholic consumptions per week, which remained relatively
stable with 6.2 alcoholic consumptions after six years. In chapter 4 we found
that respondents from the LASA study (n=2184) consumed 7.1 alcoholic
consumptions per week on average.
Excessive alcohol use is termed differently internationally. Statistics
Netherlands [1] used the same definition as we did: three or more alcoholic
consumptions per day on average. Statistics Netherlands estimated that
approximately 8% of all adults and 10.4% of the persons aged 55 years or
older use alcohol excessively. From the MAAS study we learned that 6.7%
used alcohol excessively, which increased to 8.2% after six years, among 24 to
81-year olds. Our LASA study in chapter 6 shows that 4.1% of the respondents
(n=1280) drinks three or more alcoholic drinks per day on average. However,
as this may have been quite a selective group of respondents (selective
survivorship), their lifestyles might have been healthier than the lifestyles of
those in the entire sample or in the population.
Physical activity
Statistics Netherlands estimates that the number of minutes physical exercise
ranges from approximately 13 among 55 to 64 year-olds to less than 5
minutes among 75 year-olds and older [1]. Only sportive activities were taken
into account, however. In chapter 5 the averaged number of minutes of
physical exercise per day initially was 18.3. This decreased after six years to
10.6. However, this study sample was somewhat younger than the group of
reference from the study from Statistics Netherlands. Respondents were
considered having a sedentary lifestyle when their number of minutes of
137
8 physical activity (this comprised not only all sportive activities, but light and
heavy household chores as well) was in the lowest quartile of the baseline
study sample. In chapter 4 we found that 25.0% of our initial sample
(n=2184) was physically active for less than 86 minutes per day on average.
Hereafter, we followed-up on a study subsample (n=1167) for six years and
found that 20.6% was sedentary at the beginning, and 29.5% after six years.
Among another, differently selected sample from the same study (LASA;
chapter 6) we found that 25.5% of 1280 respondents were physically active for
less than 84 minutes on average per day at study baseline. After six years this
percentage increased to 35.2%. Statistics Netherlands estimated that, in 2001,
approximately 37.5% of all persons aged 55 and older did not conform to the
recommendation of being (moderately intense) physically active for at least
150 minutes per week. Having a chronic condition does not automatically
mean that the recommendation can not be met (chapter 4), as several of the
chronic disease categories score above the recommendation, with respect to
physical activity.
Body Mass Index (BMI)
Statistics Netherlands, as well as numerous other institutions, defines
overweightness as having a BMI, or Quetelet index, of ≥ 25 [1,5]. It is
estimated that among 55 year old and older people, 54.9% are at least
overweight [1]. These percentages increase with age until approximately 70
years, and decrease thereafter [8]. However, another study showed that these
overweight cut-off levels are somewhat unreliable, as respondents who
fluctuate in bodyweight may be unjustly categorized as overweight [9].
Therefore, the ADAPT study as well as the MAAS study utilized more strict
overweight cut-off levels – i.e. ≥ 28, and ≥ 27.3 for women and ≥ 27.8 for
men, respectively. According to our more conservative measure of being
overweight, 33% of our MAAS study sample (n=1186) was overweight at
study initiation. After six years 39.7% was overweight. In absolute numbers,
the MAAS study sample’s BMI increased from an averaged 26.5 at baseline to
27.0 after six years, among 24 to 81 year old respondents. Statistics
Netherlands estimated that the BMI of the general population increased from
24.9 in 2000 to 25.1 after three years, among 20 to 70 year old people [1].
138
8 8.3 Validity of the study By discussing the extent to which potential threats to the internal and external
validity apply to our study, we evaluate the adequacy of the overall research
design of our study and of the adjustments we made to avoid potential bias in
our study.
Threats to internal validity
Internal validity of a study refers to the extent to which the study findings
actually apply to the study respondents [10], or ‘did we use the correct study
design?’. Grossly, threats to the internal validity of our study can lead to over-
or underestimation of effects or associations, or to a switch in effect
parameters, and can be categorized into instrumentation bias, selection bias,
and confounding [10].
Instrumentation bias
In general, research using self-reported measurements is cheap, easy to
administer, and is not bothered by, for example, inter-rater variability.
Downside of self- reported measurements can be the risk of acquiescence,
inaccurate recollection, and answers to questions being socially desirable.
These distortions of effect sizes due to erroneous measurement of variables
can lead to information bias.
In chapter 5, 37.4% of the respondents from the MAAS study (n=1186)
reported at follow-up to have never smoked. However, cross-tabulating these
data with baseline findings showed that 38 of these respondents reported to
have smoked formerly and 1 respondent reported to have been a current
smoker at baseline. Perhaps due to (some of) the earlier mentioned risks,
approximately 39 persons were either mistaken at baseline or at follow-up, or
both! In the other two categories of the smoking behavior variable a similar
process of misclassification may have occurred. However, this may not emerge
from the data as evident as the increased percentage of persons who reported
never to have smoked. Whether or not this misclassification in the smoking
behavior variable was random is difficult to determine, but it may have been a
source of information bias.

139
8 A final source of information bias when using self-reported
instrumentation is the possibility that the state a person is in, influences the
rating of a person on other variables, also called reactivity. The state a person
is in, is susceptible to fluctuation and can be misleading, as it can be mistaken
for a trait, which is a more stable characteristic of persons. Often, it is this
stable trait that researchers are looking for, and not the state a person is in.
For example, persons who feel somewhat depressed while filling out a
questionnaire on self-perceived health or activities of daily living, can easily
feel different a couple of days later. In the meantime, these persons may well
have scored lower on self-perceived health or activities of daily living than
might have been expected on the basis of performance-based measures [11].
In our study, this may have caused some overestimation of variability within
respondents.
Selection bias
As we already briefly stipulated in previous chapters, large prospective
observational studies, particularly those who involve older persons, have the
disadvantage of being susceptible to study attrition due to morbidity and
mortality. Several of the studies in this dissertation used data from large
prospective longitudinal studies with at least two moments of measurement.
Typically in longitudinal research among older persons in the general
population, more and more respondents become ill and/or move to nursing
homes and the relatively healthy respondents are likely to remain in the
ultimate study samples, especially when follow-up measurements are (several)
years apart. Then statistical power diminishes and study attrition is selective;
the remaining study sample is no longer representative of the study
population. This endangers the reliability of study results, and generalization of
study findings should be done with caution. The above described selection bias
could have affected our study as well. The effect it had would be the effect of
underestimation of intragroup changes, as persons who dropped out due to
morbidity or mortality may have gone through physical changes faster than the
persons who are still in the study sample [12]. This means that, in our study,
associations might have been stronger when (more) persons with bad health
were included in the study sample. Kempen and van Sonderen acknowledge

140
8 the effect of attrition on intragroup changes [13]. However, they suggest that
attrition is of less influence when measures of association are the focus of
study.
Another source of study attrition that may cause selection bias, stems
from the selection of respondents once they have commenced participation in
interview cycles. Longitudinal studies that only include respondents with valid
measurements may suffer from incompleteness of interviews or
questionnaires, also called item nonresponse. Without the use of imputation
strategies, it may lead to decreased sample sizes, decreased statistical power,
and inaccurate effect estimations. When using imputation strategies, it is
possible that the imputed value underestimates true variability, potentially
leading to a distortion of power in hypothesis testing, and inaccurate effect
estimations. The studies in this dissertation that examined change were
affected by incompleteness of measurements by reasons of item nonresponse.
In only one occasion, however, in chapter 4, we chose to use imputation
methods to replace missing values on physical activity measures, which were
missing by reasons of item nonresponse.
In all, selection bias may have bothered some of our study results and
may have lead to some underestimation of the associations that we found.
Therefore, we call for a cautious interpretation of the conclusions of the
affected chapters.
Confounding A final concern regarding the internal validity refers to potential confounders
which may lead to spurious associations between the independent and
dependent variables of a study. Strictly speaking, confounders are both
associated with the independent and dependent variables, but are no part of a
causal sequence between independent and dependent variable. In our study
we have both attempted to identify potentially confounding variables, by
means of correlation analyses, and subsequently, to avoid the negative
consequences of confounding, by controlling these potentially confounding
variables in statistical analyses. We have done this for the variables which we
deemed potentially confounding and which also were available to us. For
example, in chapter 2 we suggest that session attendance in the initiation

141
8 phase is a very strong predictor of session attendance in a later stage of the
intervention. It may well be possible, that psychosocial and/or motivational
variables, which we did not incorporate in our study, are largely responsible for
this strong association. Therefore, some reservations should be made
regarding the comprehensiveness of adjustments in statistical analyses to
avoid confounding, as there might have been confounding variables that were
unavailable to us to identify in analyses, or were unknown to us.
Threats to external validity
External validity of a study refers to the potential generalizability of findings to
other study populations and other settings [14]. For example, we have no
reasons to believe that study outcomes would be different if the ADAPT study
was replicated among ≥60 year old, at least overweight, knee osteoarthritis
patients in the Netherlands. This indicates good external validity. However, our
use of slightly different age groups across studies comprises the extrapolation
of results across studies. Finally, it is worth mentioning that good internal
validity can be regarded as a ‘conditio sine qua non’ for good external validity.
Nevertheless, good internal validity is no guarantee for good external validity.
Causal inferences
In this study we tried to use the strongest models of analyses as possible. In
several studies, this lead us to perform analyses at three different levels:
cross-sectional, longitudinal, and congruence of change. The results from
analyses done with models of congruence of change are – despite covering
changes in variables over time – limited in their power to make causal
inferences. As this method relates change in one variable to change in the
other, using panel data, one can not ascertain which change preceded the
other. The same goes for the results from analyses done with cross-sectional
models. Associating the levels of two variables, measured at the same time,
does not allow for causal inferences. Still, the analyses with the greatest
predictive power involve multiple moments of measurement and try to predict
the level of a variable (e.g., level of depressive symptomatology in 2000) with
the change in another variable (e.g., change in physical activity between 1994
and 2000), which precedes the moment of measurement of the variable one
142
8 wants to predict. Examples of such analyses can be found in chapters 3, 4, 5,
and 6.
8.4 Study implications Keeping the abovementioned methodological considerations in mind,
comments are made with respect to public health relevance, and
recommendations are made for future research.
Public health relevance
The surplus value of our research over other studies is derived from
disentangling and quantifying the separate associations between the
interrelated concepts of course of chronic disease, depression, and health
behavior. Our results indicate that unhealthy lifestyles and depressive
symptomatology contribute to each other’s risk over time. The fact that both
unhealthy lifestyles as well as clinically relevant depressive symptomatology
are prevalent in the older population, plus the fact that both eventually cause
increased morbidity and mortality, emphasizes the public health relevance.
Opportunities for the prevention of the emergence of clinically relevant
depression as well as the treatment of symptoms of depression may be sought
in manipulating lifestyles. The prevention of becoming sedentary (or even
better: promotion of vigorous physical activity), the maintenance of a healthy
weight, and the cessation of both smoking and excessive alcohol use might
contribute to the prevention of the emergence of clinically relevant depression
as well as the treatment of symptoms of depression. And what's more, these
behaviors can safely be strived for, regardless of their potential effect on
depression, as these are beneficial for one’s health anyway. We hypothesize,
though, that adopting and maintaining these healthy behaviors over time lead
to lower levels of depression, and, through these lowered levels of depression,
might lead to less chronic disease burden [15]. Also, when these healthy
lifestyle changes take place and/or are maintained as part of a self-
management program, perceived control over and coping with the
consequences of a chronic disease may be improved, also potentially resulting
in less chronic disease burden [16].
143
8 When changing one’s lifestyle, for instance by starting to exercise daily
for a certain amount of minutes, it appears imperative to ensure adherence to
one’s own lifestyle regimen. For it is adherence to a lifestyle regimen, in this
case actually exercising every day, that beneficially influences the course of
certain chronic diseases, for example osteoarthritis. In order to make regimen
adherence somewhat easier to achieve, these exercise regimens need not be
located at gyms, but can easily be located at home, or at public places, such as
shopping or community centers. In the United States some communal exercise
programs are held in these indoor centers. Participants of these programs walk
vigorously through the shopping malls, in groups. Not only have these
programs demonstrated to be beneficial for several physical parameters, such
as lower extremity muscle force, psychosocial parameters have also been
shown to improve through these programs, for example symptoms of
depression and quality of life [17,18]. Social group effects might be
responsible for this, together with increased self-satisfaction [18], resulting in
enhanced feelings of social support and self-efficacy and thereby improving
psychosocial parameters [19].
From a governmental point of view, the discouragement of unhealthy
lifestyles (smoking, excessive alcohol use, and being sedentary) is done
through television commercials, newspaper advertisements, but also through
banning smoking in certain public spaces, increasing taxes on tobacco
products, and limiting the availability of both alcohol and tobacco products for
certain age groups. The promotion of healthy lifestyles (daily physical activity,
healthy body composition, moderate alcohol use) is also done through
television commercials, and newspaper advertisements. Lately, more and more
health management organizations have begun to reimburse expenses that
their customers make while leading a healthy lifestyle, thereby promoting
these healthy lifestyles. For example, costs of nicotine patches may be
reimbursed for those who wish to quit smoking, costs of visits to a certified
dietician may be reimbursed for those who wish to return to a healthy weight.
However, the promotion of healthy, but especially the discouragement of
unhealthy lifestyles is an arduous mission, for, while national health care
should remain cost-effective, at the same time a balance must be sought in
respecting the personal freedom of people, and the importance of all people -

144
8 not just specific age groups - understanding either the benefits of healthy
lifestyles and the risks of unhealthy lifestyles.
Low socio-economic status (SES) has been found to be a risk factor for
chronic diseases [8], accelerated mobility decline [20], and more unhealthy
lifestyles [8]. Hence, future lifestyle interventions, which seek to promote
healthy behavior in the community, might benefit from an approach that
differentiates in SES status of the target population. Also, (public) health care
and opportunities for healthy lifestyles should remain easily accessible for
people from all SES categories.
Future research
Regarding the treatment of symptoms of depression, whether or not lifestyle
interventions should be done in persons who are under medical treatment for
their depressive symptomatology is indistinct. Beneficial effects of physical
exercise (initiation) on depressive symptomatology are well documented
[21,22]. Far less clear are potential effects of smoking cessation and quitting
excessive alcohol use on depressive symptomatology. In the medical treatment
of depression some side effects have been reported that are unfavorable for
adopting healthy lifestyles, such as weight gain, lethargy, postural
hypotension, and nausea [23]. These might diminish after adopting healthy
lifestyles.
However, depressed persons are likely to suffer from tiredness and
lethargy, independent from their medication. Therefore, a first challenge in
future intervention research may be to reach and motivate depressed persons
to participate, and to motivate them to continue participation in longitudinal
research. Then, future research could examine 1) whether or not the extent to
which persons adhere to these lifestyle interventions matters for the
improvement in symptoms of depression (a suggested dose-response effect),
or that the success of counteracting depressive symptomatology is dependent
on the accumulation of knowledge, skills, or a certain amount of (pre-existing)
healthy behavior (a suggested threshold effect)? Future research could also
clarify 2) whether or not lifestyle interventions are effective in reducing
symptoms of depression; 3) whether these can be incorporated in the existing
therapies to treat depression; and 4) whether or not lifestyle interventions are

145
8 equally effective in persons with minor depression or major depressive
disorder, either in combination or without medical treatment, or cognitive
behavioral therapy for depressive symptomatology. Some preliminary studies
among older persons with minor depression yield promising results for the
effectiveness of a physical activity intervention on symptoms of depression
[22].
With respect to our finding of depression being an accelerator in the
process of disablement, it needs clarification whether this effect of depression
is disease-specific. In other words, does depression affect persons with lung
disease differently as compared to persons with osteoarthritis, for example,
regarding their advancement in the main pathway of the disablement process.
Although some studies identified the main pathway of the model of
disablement among different chronic diseases [24,25], to date no study has
compared the influence of depression on the course of different chronic
diseases in the same sample. This will require prominent longitudinal research.
Unraveling the association between change in disease-related
impairments and changes in lifestyle also requires longitudinal research. The
relevance for this can also be seen in terms of the disablement process. When
studying the advancement of respondents with chronic diseases in the main
pathway of the disablement process, it is important to know whether lifestyle
changes cause either an improvement or aggravation in disease-related
impairments or are caused by an improvement or aggravation in disease-
related impairments. Moreover, when studying aspects of disablement, a need
exists for greater conceptual clarity and concordance regarding disablement
outcomes. Certain similar concepts are defined and operationalised differently
across studies. For example, the concepts of the main pathway of Verbrugge
and Jette’s model of the disablement process were adapted from Nagi’s initial
model of disablement [26, 27]. In turn, this was not too different from the
International Classification of Diseases and Handicaps of the World Health
Organization [28]. All of these models use similar concepts that slightly differ.
This is detrimental for good comparison of study results and limits
comparability across studies.
146
8 8.5 References 1. Statistics Netherlands. Health Interview Questionnaire. Heerlen, The Netherlands:
Statistics Netherlands, 1989.
2. Beekman AT, Copeland JR, Prince MJ. Review of community prevalence of depression in
later life. Br J Psychiatry. 1999 Apr;174: 307-11.
3. Copeland JR, Beekman AT, Dewey ME, et al. Cross-cultural comparison of depressive
symptoms in Europe does not support stereotypes of ageing. Br J Psychiatry 1999;
174: 322-9.
4. Beekman AT, Deeg DJ, Smit JH, et al. Dysthymia in later life: a study in the
community. J Affect Disord. 2004 Sep;81(3):191-9.
5. Bruce ML. Depression and disability. In GM Williamson, DR Shaffer, PA Parmelee (Eds.),
Physical Illness and Depression in Older Adults: a Handbook of Theory, Research, and
Practice. New York: Kluwer Academic / Plenum Publishers, 2000: pp. 11-29.
6. Ormel J, Rijsdijk FV, Sullivan M, van Sonderen E, Kempen GI. Temporal and reciprocal
relationship between IADL/ADL disability and depressive symptoms in late life. J
Gerontol B Psychol Sci Soc Sci 2002; 57: P338-347.
7. Geerlings SW, Beekman AT, Deeg DJ, Twisk JW, van Tilburg W. The longitudinal effect
of depression on functional limitations and disability in older adults: an eight-wave
prospective community-based study. Psychol Med 2001; 31 (8), 1361-1371.
8. Nationaal Kompas Volksgezondheid. Bilthoven, The Netherlands: RIVM, 2002.
9. Williamson DF, Kahn HS, Remington PL, et al. The 10-year incidence of overweight and
major weight gain in US adults. Arch Intern Med 1990; 150: 665-72.
10. Bouter LM, van Dongen MC. Epidemiologisch onderzoek. Opzet en interpretatie.
Houten/Antwerpen: Bohn Stafleu Van Loghum, 2000.
11. Kempen GI, Verbrugge LM, Merril SS, Ormel J. The impact of multiple impairments on
disability in community-dwelling older people. Age Ageing 1998; 27: 595-604.
12. Deeg DJ. Attrition in longitudinal population studies: Does it affect the generalizability
of the findings? 1: An introduction to the series. J Clin Epid 2002; 55 (3): 213-15.
13. Kempen GI, van Sonderen E. Psychological attributes and changes in disability among
low-functioning older persons: does attrition affect the outcomes? J Clin Epidemiol
2002; 55 (3): 224–29.
14. Polit DF, Hungler BP. Nursing Research Principles and Methods. Philadelphia PA:
Lippincott, 1999.
15. Lebowitz BD, Pearson JL, Schneider LS, et al. Diagnosis and treatment of depression in
late life.
Consensus statement update. JAMA 1997; 278: 1186-90.
16. Lorig KR, Holman HR. Self-management education: History, definition, outcomes, and
mechanisms. Ann Behav Med 2003; 26: 1-7.
17. Penninx BW, Rejeski WJ, Pandya J, et al. Exercise and depressive symptoms: a
comparison of aerobic and resistance exercise effects on emotional and physical
function in older persons with high and low depressive symptomatology. J Gerontol B
147
8 Psychol Sci Soc Sci 2002; 57: P124-32.
18. Rejeski WJ, Mihalko SL. Physical activity and quality of life in older adults. J Gerontol A
Biol Sci Med Sci 2001 Oct;56 Spec No: 2:23-35.
19. Toobert DJ, Strycker LA, Glasgow RE, Barrera M, Bagdade JD. Enhancing support for
health behavior change among women at risk for heart disease: the Mediterranean
Lifestyle Trial. Health Educ Res 2002 Oct;17(5): 574-85.
20. Koster A, Bosma H, Kempen GI, et al. Socioeconomic inequalities in mobility decline in
chronic disease groups (asthma/COPD, heart disease, diabetes mellitus, low back pain):
only a minor role for disease severity and comorbidity. J Epidemiol Community Health
2004; 58(10): 862-9.
21. North TC, McCullagh P, Tran ZV: Effect of exercise on depression. Exerc Sport Sci Rev
1990; 18: 379-415.
22. Lawlor DA, Hopker SW. The effectiveness of exercise as an intervention in the
management of depression: systematic review and meta-regression analysis of
randomised controlled trials. BMJ 2001 Mar 31;322(7289):763-7.
23. Berkow R. The Merck manual – Second home edition. Whitehouse Station, NJ: Merck
Research Laboratories, 1999.
24. Escalante A, Del Rincon I. The disablement process in rheumatoid arthritis. Arthritis and
Rheumatism 2002; 47 (3): 333-42.
25. Jette DU, Manago D, Medved E, et al. The disablement process in patients with
pulmonary disease. Physical Therapy 1997; 77 (4): 385-94.
26. Verbrugge LM, Jette AM. The disablement process. Soc Sci Med 1994; 38 (1): 1-14.
27. Nagi SZ. Some conceptual issues in disability and rehabilitation. In: Sussman MB,
editor. Sociology and rehabilitation. Washington, D.C: American Sociological
Association, 1965: 100-13.
28. World Health Organization (WHO). International Classification of Impairments,
Disabilities, and Handicaps. Geneva, Switzerland: WHO, 1980.

148
8

149
9 CHAPTER 9
Summary (Samenvatting)

150
9 9.1 Introduction
n CHAPTER 1 we discuss the central focus of this dissertation, which is the
interrelation between depression, health behavior, and the course of chronic
disease among late middle-aged and older adults. Health behavior was defined
as to include lifestyle – smoking, alcohol use, physical activity, and body
composition – and regimen adherence. From a public health perspective,
unraveling this interrelation is important for several reasons. First, chronic
diseases, depression, and unhealthy lifestyles are prevalent in the general
population. Chronic diseases and depression are even more prevalent in late
middle aged and older persons. Second, some of these concepts have been
suggested to contribute to each other’s risk, eventually leading to increased
burden of disease for patients, higher prevalences of diseases in the
community, and a higher burden for national health care. Primary objective of
this study was to clarify these reciprocal associations, using data from the
(large) longitudinal studies of LASA, MAAS, and ADAPT. Forthcoming
paragraphs will elaborate on this. Results may provide insights into
determinants of the abovementioned associations that are amenable to
change. These determinants could potentially be used in intervention research,
and may therefore be relevant for clinical practice. Finally, outcomes may
contribute to improvements in public health policy and to cost-effective health
care.
9.2 Reciprocity between depression, health behavior, and
chronic disease Determinants of attendance to diet and exercise interventions
Determinants of compliance to lifestyle regimens are not well understood.
Attendance to intervention sessions is crucial for persons to acquire knowledge
and skills regarding the core elements of an intervention, and can be seen as a
prerequisite of intervention compliance. Therefore, in CHAPTER 2, we explored
demographic, health-related, and social determinants of attendance to diet
sessions and exercise sessions in the Arthritis, Diet, and Activity Promotion
Trial. The results pertain to 206 persons of 60 years or older who had knee
osteoarthritis and were – at least – overweight. They were asked to participate
in a dietary weight loss intervention, an exercise intervention, or a combination
I

151
9 of both (double intervention randomization) over the duration of 18 months.
Being randomized into a single intervention and attending sessions in the early
phase of the interventions both predicted high attendance to sessions in the
later phase of the interventions. Ultimately, determinants of attendance to diet
sessions and exercise sessions differed. Giving persons a choice to do their
exercises at least partly at home and stimulating attendance to sessions early
in the intervention may be effective in enhancing long-term attendance to diet
and exercise interventions.
Associations between regimen adherence and physical function and disability
For patients with knee osteoarthritis (knee OA) adherence to a prescribed
physical exercise regimen is important to preserve physical function.
Concurrently though, adherence to a prescribed regimen in general tends to
diminish with the duration of the regimen. We therefore examined, in CHAPTER
3, whether high adherence to an 18-month physical exercise regimen
improved physical performance and self-reported disability among 134 persons
of 60 years or older who had knee OA and were – at least – overweight. These
persons of the Arthritis, Diet, and Activity Promotion Trial were asked to
exercise for one hour - three days per week. Results indicated that higher
exercise adherence was associated with improvements in physical performance
in a dose-response kind of way. High initial adherence to the exercise regimen
was associated with improvements in self-reported disability, but not in the
long run. To a certain extent these associations could be explained by
modifiable variables, such as pain and body mass index (BMI). Thus,
promoting exercise regimen adherence seems justified when prescribing one to
overweight older adults with knee OA, and thereby also focusing on
improvements in pain and BMI.
Chronic disease and lifestyle changes
In CHAPTER 4 we theorized that lifestyle changes might be indicated in some
instances to prevent chronic diseases from worsening and to maintain physical
and social functioning. In 2184 persons of the Longitudinal Aging Study
Amsterdam, we examined differences in lifestyles, and lifestyle changes after
six years, stratified by prevalent and incident chronic disease categories. Lastly
152
9 we tested whether changes in disease-related impairments differed between
persons who made a healthy lifestyle change and those who did not, within the
same chronic disease category. Results indicated that some differences in
lifestyles could be attributed to differences in background variables, such as
age, gender and educational level. Overall, proportions of persons who smoked
decreased, while the proportion of persons who reported to be sedentary
increased. Respondents who developed cardiovascular disease during the study
were more likely to change lifestyles than other chronic disease categories.
Lifestyle changes appeared not to occur under the influence of the emergence
or worsening of disease-related impairments. If our findings are replicated in
future studies, health promotion strategies may be targeted more effectively,
and patient groups who do not initiate more healthy lifestyles might be
reached for intervention.
Associations between lifestyle and depressed mood
A complex of physical, psychological, and socio-environmental factors is
assumed to cause depressed mood, which is defined as clinically relevant
levels of depressive symptomatology along the depressive spectrum. It is not
unequivocally clear how lifestyles, as an example of these socio-environmental
factors, and depressed mood are associated over time. In CHAPTER 5, we
focused on the question: do healthy lifestyles protect against depressed mood
in 1186 persons of the longitudinal Maastricht Aging Study? No cross-sectional
associations between lifestyles and depressed mood were found. Excessive
alcohol use predicted the presence of depressed mood after six years, while
exercising more than 30 minutes per day and not being overweight for six
years were associated with absence of depressed mood after six years. We
concluded that adopting healthy lifestyles might be a starting point to prevent
or to deal with depressed mood over time.
Associations between depressed mood and lifestyle
In CHAPTER 6 we theorized that the way in which depressed mood might trigger
or worsen chronic diseases might go through unhealthy lifestyles. Mental
health improvements in chronically diseased persons could possibly intervene
in the downward spiral of depressed mood, unhealthy lifestyles, and
153
9 deterioration of chronic disease. In 1280 community-dwelling persons from the
Longitudinal Aging Study Amsterdam we examined associations between
depressed mood and unhealthy lifestyles. Results indicated that depressed
persons were likely to smoke, and persistently depressed people increased
their cigarette consumption. Having an emerging depressed mood was likely to
co-occur with change to a sedentary lifestyle, and the largest decrease in
minutes of physical activity. Chronic diseases did not moderate the effects of
depressed mood on unhealthy lifestyles. Clinical practice can benefit from this
line of research if future research can elucidate whether treatment of
depressive symptomatology can prevent unhealthy lifestyle changes.
The process of disablement and depression
The main pathway of the disablement process consists of four consecutive
phases: pathology (presence of disease or injury), impairments (dysfunctions
or structural abnormalities), functional limitations (restrictions in basic physical
or mental actions), and disability (difficulties in doing activities of daily life). In
CHAPTER 7 we determined the presence of the main pathway of the disablement
process, and determined whether progression along the main pathway of
disablement is accelerated in the presence of depressed mood in 1110 persons
from the community-based Longitudinal Aging Study Amsterdam. We analyzed
intermediate effects of different consecutive disablement phases, and
depression was used as an interaction term while linking the consecutive
disablement phases. We concluded that the main pathway of the disablement
process could be identified in our sample, and that depression accelerated
progression in the disablement process, particularly in the early and late
stages of the model. Reduction of depression may help slow down the process
of disablement for persons who find themselves in those stages of the model.
9.3 Conclusions In CHAPTER 8 we summarize the principal findings of the study, and we put our
findings in perspective. Furthermore, methodological considerations are made
regarding internal and external study validity. We conclude with study
implications, which are relevant to public health, and make recommendations
for future research. Although hypothesized before, we conclude that adopting
154
9 and maintaining healthy behaviors over time may lead to lower levels of
depression, and to less chronic disease burden. However, the promotion of
healthy, but particularly the discouragement of unhealthy lifestyles in the
community is an arduous undertaking, for a balance must be sought in
respecting the personal freedom of persons and the importance of all persons
– not just specific age groups – understanding either the health benefits of
healthy lifestyles and the health risks of unhealthy lifestyles, while trying to
make national health care cost-effective. Future research should elucidate: 1)
whether the extent to which persons adhere to their lifestyle regimens matters
for the improvement in depressive symptomatology, 2) whether lifestyle
interventions are effective in the treatment of depressive symptomatology, 3)
whether lifestyle interventions are equally effective in persons with minor
depression or major depressive disorder, and 4) whether lifestyle interventions
can be incorporated in the existing treatment of depressive symptomatology.
Also, whether or not the influence depression has on the course of chronic
diseases is disease-specific, deserves further attention.
9.1 Inleiding n HOOFDSTUK 1 wordt het centrale thema van dit proefschrift besproken; de
samenhang tussen depressie, gezondheidsgedrag, en het beloop van
chronische ziekten onder ouderen. Gezondheidsgedrag was zo gedefinieerd dat
het leefstijl – dus roken, alcohol gebruik, en lichaamsbeweging – en
therapietrouw omvatte. Vanuit het oogpunt van maatschappelijke
gezondheidszorg is het om meerdere redenen van belang dat deze samenhang
wordt onderzocht. Ten eerste, depressie, ongezonde leefstijlen, en chronische
ziekten zijn veelvoorkomend in de gewone bevolking, zelfs nog meer in de
oudere bevolkingslagen. Ten tweede, in eerder onderzoek is gesuggereerd dat
deze concepten bijdragen aan elkaar’s risico, wat uiteindelijk kan leiden tot
toegenomen ziektelast, hogere prevalenties, en hogere uitgaven voor de
nationale gezondheidszorg. Het voornaamste doel van deze studie was het
verhelderen van de wederkerige, onderlinge samenhang, met behulp van
gegevens van de (grote) longitudinale studies LASA, MAAS, en ADAPT. In de
hierop volgende paragrafen zullen daar verder op ingaan. De resultaten
kunnen nieuwe inzichten verschaffen in de veranderbare determinanten van de
I

155
9 hierboven genoemde samenhang. Deze determinanten kunnen wellicht in
interventie onderzoek toegepast worden en zijn daarom van belang voor
clinici. Ten slotte kunnen de uitkomsten bijdragen aan verbeteringen in
gezondheidszorg beleid en aan een meer kosten-effectieve gezondheidszorg.
9.2 Wederkerigheid van depressie, gezondheidsgedrag, en
chronische ziekte Determinanten van deelname aan dieet- en bewegingsinterventies
Determinanten van de mate waarin leefstijladvies wordt opgevolgd zijn
onduidelijk. Het bijwonen van interventie bijeenkomsten wordt verondersteld
cruciaal te zijn om kennis en vaardigheden aangaande de kernelementen van
de interventie op te doen, en kan daarom worden opgevat als een ‘sine qua
non’ voor de mate waarin aan een interventie gevolg wordt gegeven. In
HOOFDSTUK 2 hebben we daarom demografische, gezondheidsgerelateerde, en
sociale determinanten van het bijwonen van bijeenkomsten van dieet- en
bewegingsinterventies geëxploreerd in de Arthritis, Diet, and Activity
Promotion Trial. De resultaten hebben betrekking op 206 personen van 60 jaar
of ouder met tenminste overgewicht en die osteoartritis aan de knie hadden.
Zij waren gevraagd deel te nemen aan een 18 maanden durende
dieetinterventie, bewegingsinterventie, of aan een interventie die beiden
combineert. Ingedeeld worden in een ‘enkele’ interventie en het veelvuldig
bijwonen van bijeenkomsten in het vroege deel van de interventie voorspelden
het veelvuldig bijwonen van bijeenkomsten in het latere deel van de
interventie. Uiteindelijk bleken determinanten van het bijwonen van
bijeenkomsten van de dieet- en bewegingsinterventies te verschillen. Personen
keuzevrijheid geven waar ze hun bewegingsoefeningen kunnen doen en het
stimuleren van het bijwonen van interventie bijeenkomsten in het vroege deel
van de interventie zijn wellicht effectief in het verhogen van het bijwonen van
dieet- en bewegingsinterventie bijeenkomsten.
Het opvolgen van bewegingsadvies en lichamelijk functioneren
Voor patiënten met osteoartritis aan de knie is het van belang een
voorgeschreven bewegingsadvies op te volgen ten einde lichamelijk
functioneren te behouden. Het opvolgen van advies neemt gewoonlijk af

156
9 naarmate de tijd verstrijkt dat het advies geldt. We hebben daarom bekeken,
in HOOFDSTUK 3, of het goed opvolgen van een 18 maanden durend
bewegingsadvies lichamelijk functioneren op prestatietaken en zelf-
gerapporteerde invaliditeit verbeterde bij 134 personen van 60 jaar of ouder
met tenminste overgewicht én osteo-artritis aan de knie. Deze deelnemers aan
de Arthritis, Diet, and Activity Promotion Trial werden gevraagd drie dagen per
week een uur lang oefeningen te doen. De resultaten gaven aan dat naarmate
men trouwer het bewegingsadvies opvolgde de verbeteringen qua lichamelijk
functioneren op de prestatie-taken groter waren. Het initieel goed opvolgen
van het bewegingsadvies leidde tot korte-termijn verbeteringen in zelf-
gerapporteerde invaliditeit, maar niet gedurende de lange termijn. Deze
associaties zijn tot op zekere hoogte te verklaren door tussenkomst van
wijzigbare variabelen, zoals pijn en body mass index (BMI). Vandaar dat het
promoten van het opvolgen van bewegingsadvies zinvol is wanneer een
dergelijk bewegingsadvies wordt voorgeschreven aan oudere personen met
overgewicht én osteoartritis aan de knie dat zich tegelijkertijd richt op
verbeteringen in pijn en BMI.
Chronische ziekte(s) en leefstijl veranderingen
In HOOFDSTUK 4 veronderstelden we dat leefstijl veranderingen in sommige
gevallen geïndiceerd zijn om te voorkomen dat bepaalde chronische ziekte(s)
verergeren, en om een bepaald niveau van fysiek en sociaal functioneren te
behouden. Bij 2184 personen van de Longitudinal Aging Study Amsterdam
hebben we de verschillen in leefstijl onderzocht, en de veranderingen hierin na
zes jaar, en presenteren dat per prevalente en incidente chronische ziekte-
categorie. Tot slot bekeken we of veranderingen in ziekte-gerelateerde
klachten verschillend waren tussen personen die hun ongezonde leefstijl
veranderden en diegenen dat niet deden, binnen een en dezelfde chronische
ziektecategorie. De resultaten gaven aan dat sommige verschillen in leefstijl
toegeschreven konden worden aan verschillen in achtergrond variabelen, zoals
leeftijd, geslacht en opleiding. Over het algemeen namen proporties van
mensen die rookten af, terwijl de proportie van mensen met een sedentaire
leefstijl toenam. Veranderingen in leefstijl lijken niet samen te hangen met het
optreden of verergeren van ziekte-gerelateerde klachten. Wanneer resultaten

157
9 van toekomstig onderzoek een zelfde richting in wijzen, kunnen mogelijk de
programma’s ter bevordering van de gezondheid effectiever worden ingezet
om zo patiënten groepen, die geen gezonde leefstijlveranderingen vertonen, te
bereiken voor interventies.
Samenhang tussen leefstijl en neerslachtigheid
Verondersteld wordt dat een complex van fysieke, psychologische, en sociaal-
en omgevingsgerelateerde factoren neerslachtigheid veroorzaken. Neer-
slachtigheid wordt gedefinieerd als klinisch relevante niveau’s van depressieve
symptomatologie langs het langs het spectrum van depressie. Het is evenwel
niet duidelijk hoe leefstijl - een sociaal- en omgevingsgerelateerde factor - en
neerslachtigheid over tijd met elkaar gelieerd zijn. In HOOFDSTUK 5 richtten we
ons op de vraag of ‘n gezonde leefstijl beschermt tegen neerslachtigheid bij
1186 personen die deelnamen aan de longitudinale Maastricht Aging Study. Er
werden geen cross-sectionele verbanden tussen leefstijl en neerslachtigheid
gevonden. Excessief alcohol gebruik voorspelde de aanwezigheid van neer-
slachtigheid zes jaar later, terwijl het meer dan 30 minuten fysiek actief zijn
per dag en het niet hebben van overgewicht verband hielden met de afwezig-
heid van neerslachtigheid na zes jaar. Geconcludeerd werd dat het aannemen
van een gezonde leefstijl een begin kan zijn in het voorkomen van neerslach-
tigheid of in het succesvol omgaan met neerslachtigheid over de tijd.
Samenhang tussen neerslachtigheid en leefstijl
In HOOFDSTUK 6 theoretiseerden we dat de manier waarop neerslachtigheid
chronische ziekten kan uitlokken of verergeren, deels zou gaan via het hebben
van een ongezonde leefstijl. Verbeteringen in de mentale gezondheid van
mensen met een chronische ziekte zou wellicht kunnen ingrijpen op de
neerwaartse beweging van neerslachtigheid, het hebben van een ongezonde
leefstijl, en verslechtering van chronische ziekte. We onderzochten de
samenhang tussen neerslachtigheid en een ongezonde leefstijl bij 1280
personen die deelnamen aan de Longitudinal Aging Study Amsterdam. De
resultaten gaven aan dat neerslachtige personen vaker rookten, en dat
aanhoudend neerslachtige personen het aantal sigaretten dat ze roken,
opvoerden. Het opkomen van een periode van neerslachtigheid gebeurde vaak

158
9 samen met het veranderen naar een sedentaire leefstijl, en de grootste
afname in minuten die besteed worden aan fysieke activiteit. Chronische
ziekten hadden geen invloed op de samenhang tussen neerslachtigheid en het
hebben van een ongezonde leefstijl. De klinische praktijk kan van dit soort
onderzoek profiteren wanneer toekomstig onderzoek kan uitwijzen of de
behandeling van depressieve symptomatologie de verandering naar ongezonde
leefstijlen kan verhinderen.
Neerslachtigheid en het proces van invalidering bij chronische ziekte
Het belangrijkste traject in het proces van invalidering bestaat uit vier
opeenvolgende fasen: pathologie (aanwezigheid van ziekte of verwonding),
klachten (disfuncties of structurele abnormaliteiten), functionele beperkingen
(beperkingen in basaal fysieke of mentale taken), en invaliditeit (hinder bij het
uitvoeren van alledaagse activiteiten). In HOOFDSTUK 7 hebben we getracht aan
te tonen: 1) de aanwezigheid van het belangrijkste traject van het proces van
invalidering onder 1110 deelnemers aan de Longitudinal Aging Study
Amsterdam, en 2) dat het voortschrijden in het belangrijkste traject in het
proces van invalidering wordt versneld onder aanwezigheid van
neerslachtigheid. We analyseerden intermediërende effecten van verschillende
opeenvolgende fasen van het proces van invalidering op elkaar, en
neerslachtigheid werd gebruikt als interactieterm, terwijl we de opeenvolgende
fasen van het proces van invalidering aan elkaar probeerden te koppelen.
Geconcludeerd werd dat het belangrijkste traject van het proces van
invalidering in onze steekproef geïdentificeerd kon worden, en dat
neerslachtigheid het voortschrijden in het proces van invalidering
daadwerkelijk versneld, vooral in de vroege en late fase van het model. Het
tegengaan van neerslachtigheid zou het voortschrijden in dit proces van
invalidering wellicht kunnen vertragen voor personen die zich in deze fasen
van het model bevinden.
9.3 Conclusies In HOOFDSTUK 8 vatten we de meest in het oog springende bevindingen van
onze studie samen en plaatsen ze in perspectief. Daarnaast worden er
methodologische afwegingen gemaakt met betrekking tot de interne en

159
9 externe validiteit van de studie. We sluiten af met de implicaties van ons
onderzoek die relevant zijn voor het veld van maatschappelijke
gezondheidszorg, en doen aanbevelingen voor toekomstig onderzoek. Hoewel
er al over is getheoretiseerd, concluderen wij dat het aannemen en handhaven
van gezonde gedragingen over de tijd leidt tot lagere niveau’s van depressie
en tot minder ziektelast. Toch is het bevorderen van een gezonde leefstijl,
maar meer nog het afraden van een ongezonde leefstijl, op gemeenschaps- of
nationaal niveau een hachelijke onderneming. Hierin moet namelijk een
evenwicht worden gevonden in het respecteren van iemands persoonlijke
keuzevrijheid en het belang dat iedereen – dus niet slechts enkele leeftijds-
groepen – op de hoogte is van de gezondheidsvoordelen van een gezonde
leefstijl en van de gezondheidsrisico’s van een ongezonde leefstijl, en
ondertussen de kosten van de gezondheidszorg zo laag mogelijk houden.
Toekomstig onderzoek zou kunnen verduidelijken: 1) of gezonde leefstijl
interventies, i.h.b. fysieke activiteit voorschriften, moeten worden uitgevoerd
onder personen die medicijnen gebruiken voor hun depressieve symptoma-
tologie; 2) of de mate waarin personen zich houden aan hun leefstijl advies
van invloed is op de mate waarin de depressieve symptomatologie afneemt; 3)
of leefstijl interventies effectief zijn in de behandeling van depressieve
symptomatologie; 4) of de effectiviteit van leefstijl interventies verschilt tussen
personen met een maiore depressieve stoornis en personen met klachten van
neerslachtigheid; en 5) of leefstijl interventies deel kunnen gaan uitmaken van
de reeds bestaande behandelingstrategieën. Of de invloed, die depressieve
symptomatologie heeft op het proces van invalidering, al dan niet ziekte-
specifiek is, ten slotte, zou ook verduidelijking behoeven.

160
9

161
9

162
9

163
9
Acknowledgement (Dankwoord)
llereerst zou ik graag mijn (co-)promotores willen bedanken. Jacques, “In
der beschränkung zeigt sich erst der Meister”, of, zoals ik duidelijk heb
hopen te maken in de verdediging, “Weniger ist mehr”. Ik heb je manier van
leiding geven over dit project erg kunnen waarderen. Losjes in tijden waarop
het lekker liep, en kordaat in tijden waarin voortgang even op zich lieten
wachten, maar immer in overleg, en immer met het doel dat ik er zelf beter /
wijzer van werd. Ruud, ik vond het prettig om samen met jou ‘aan de grenzen
van het weten’ te werken. Het was voor mij erg fijn om te weten dat ik bij je
aan kon kloppen als me iets niet duidelijk was (hoe klein ook). Ook voor jou
geldt dat je goed aanvoelde wanneer ik bijsturing kon gebruiken en wanneer
niet. Brenda, ik had me geen betere co-promotor kunnen wensen. Niet alleen
ben je (terecht) altijd erg kritisch geweest op hetgeen ik je toestuurde - wat de
kwaliteit van de artikelen heeft verhoogd -, maar jullie (samen met Wout,
Dino, en Mila) hebben me ook gastvrij ontvangen in North Carolina. Je hebt
mede de voorwaarden geschapen voor twee heel fijne werkbezoeken aan de
VS en voor dat alles ben ik je erg dankbaar! Jacques, Ruud, en Brenda, ik hoop
dat we onze samenwerking nog een tijdlang kunnen voortzetten!
Dorly en Martin, als co-auteur van een (aantal) artikel(en) en lid van de
oppositiecommissie hebben jullie bijgedragen aan het bereiken van deze dag,
waarvoor veel dank. Ook de overige leden van zowel de oppositie- als de
beoordelingscommissie wil ik heel hartelijk danken voor hun inzet.
De afgelopen jaren heb ik plezierig gewerkt en genoten van de
ongedwongen sfeer bij de sectie Medische Sociologie. Ik wil graag alle collega's
bedanken die mijn verblijf aangenaam hebben gemaakt: m’n kamergenoten
Godelief en Esther, de dames van het secretariaat, en alle andere -al dan niet
juniore- medewerkers.
Gelukkig was er naast het werk genoeg tijd en ruimte voor ontspanning. Ik
heb me altijd kunnen uitleven bij het hockeyteam, bij Balans, bij Edilibre, bij
de OVSE, en bij Equilibre. Dank, dat jullie dat tolere(e)r(d)en.
A

164
9 My dear American and Italian friends, Hal and Heidi, Graziano, and Matteo,
I believe we found exactly the right balance between work and leisure.
Foosball, hiking trips, and DAC at Ziggy’s (Hell yeah!). That’s what made my
working visits worthwhile. Thanks!
Beste Les en Koen. Onze uitstapjes naar Marmaris, Kreta, Charleston, en
Kopenhagen zorgden voor de broodnodige ontspanning, evenals de
stapavonden in Tilburg en Utrecht. Ik zie al weer uit naar onze volgende
bestemming, waar ook ter wereld!
Pap, mam (ja, ik ben nu klaargekomen met ‘t onderzoek), Margot en
Willem, en Sander bedankt voor jullie onbetaalbare, niet aflatende en
onvervangbare steun gedurende de afgelopen vijf jaar. Bovendien zijn er maar
weinig promovendi die zich gesteund weten door meer dan twee paranimfen!
En lieve Kim, ik weet niet wat (en wanneer!) er van mijn ‘buukske’ zou zijn
geworden als je niet in mijn leven was verschenen. Bedankt voor je begrip en
geduld (als we weer eens door een congres/werkbezoek/weekendtripje niet bij
elkaar konden zijn). Bedankt ook voor je belangstelling, je vriendschap, en
dank voor nog onnoemelijk veel meer, maar wat niet in woorden is uit te
drukken. Bedankt!
Hier wil ik het voorlopig bij laten…

165
9

166
9

167
9
About the author
oen van Gool was born on November 12, 1974 in Goirle. He spent his
childhood in Berkel-Enschot, and went to Cobbenhagen College in Tilburg
where he completed secondary school. After his graduation, he began a study
in Psychology at Tilburg University in September 1993. From March through
October 1999 he performed his internship at the Center for the Sudy of
Giftedness at the Radboud University in Nijmegen, where he was trained in
psychodiagnostic research, and performed literature research on “Under-
achievement in gifted adolescents”. Concurrently he finished his Master’s thesis
on “Self-image and quality of life in asthmatic children” in close collaboration
with his supervisors from Tilburg University and the University Hospital
Maastricht. At graduation in March 2000, he received his Master’s degree in
the free track, in which he combined the Health Psychology track and the Child
Psychology track, as well as his certificate of competence in psycho-diagnostic
research from the Dutch Institute of Psychologists.
In August 2000 he was employed on a PhD programme, on which this
dissertation is based, by the Section of Medical Sociology of the department
Health Care Studies, Universiteit Maastricht. During his PhD traineeship he
followed numerous methodological and statistical courses. In 2001 he was
awarded a Fulbright Visiting Scholar grant in order to conduct research at
Wake Forest University, North Carolina in the United States. Also, in 2004 he
was awarded a Prof. G. Kootstra Fellowship from the Faculty of Medicine of the
Universiteit Maastricht. During this fellowship he will be working on the
preparation of postdoctoral research regarding the interaction of biomedical
and behavioral mechanisms in the process of physical decline in old age.
C

168
9