Brain activity for chronic knee osteoarthritis
14
Brain activity for chronic knee osteoarthritis: Dissociating evoked pain from spontaneous pain Elle L. Parks a , Paul Y. Geha b , Marwan N. Baliki a , Jeffrey Katz c , Thomas J. Schnitzer d , A. Vania Apkarian a,c,d,e,⇑ a Department of Physiology, Northwestern University, Feinberg School of Medicine, Chicago, IL 60611, USA b Department of Psychiatry, Yale University School of Medicine, New Haven, CT 06510, USA c Department of Anesthesia, Northwestern University, Feinberg School of Medicine, Chicago, IL 60611, USA d Department of Physical Medicine and Rehabilitation, Northwestern University, Feinberg School of Medicine, Chicago, IL 60611, USA e Department of Surgery, Northwestern University, Feinberg School of Medicine, Chicago, IL 60611, USA article info Article history: Received 6 August 2010 Received in revised form 24 November 2010 Accepted 20 December 2010 Available online xxxx Keywords: Knee osteoarthritis Prefrontal cortex Limbic fMRI COX2 inhibitor Csf Psychophysics abstract Chronic pain is a hallmark of osteoarthritis (OA), yet little is known about its properties and represen- tation in the brain. Here we use fMRI combined with psychophysics to study knee pain in fourteen OA patients and nine healthy controls. Mechanical painful pressure stimuli were applied to the knee in both groups and ratings of evoked pain and related brain activity examined. We observe that psy- chophysical properties and brain activation patterns of evoked pain are essentially the same between OA patients and healthy subjects, and between worse and better OA knees. In OA patients, stimulus- related brain activity could be distinguished from brain activity associated with spontaneous pain. The former activated brain regions commonly observed for acute painful stimuli in healthy subjects, while the spontaneous pain of OA engaged prefrontal-limbic regions closely corresponding to areas observed for spontaneous pain in other chronic pain conditions, such as chronic back pain and post-herpetic neuralgia. Arthritis-related clinical characteristics of knee OA also mapped to prefrontal-limbic regions. In a subgroup of patients (n = 6) we examined brain activity changes for a 2-week, repeat measure, cyclooxygenase-2 inhibitor (valdecoxib) therapy. Treatment decreased spontaneous pain for the worse knee and clinical characteristics of OA, and increased blood and csf levels of the drug which correlated positively with prefrontal-limbic brain activity. These findings indicate dissociation between mechanically induced and spontaneous OA knee pain, the latter engaging brain regions involved in emotional assessment of the self, and challenge the standard clinical view regarding the nature of OA pain. Ó 2011 Published by Elsevier Ltd. on behalf of European Federation of International Association for the Study of Pain Chapters. 1. Introduction Osteoarthritis (OA) is the most common type of arthritis, and a leading cause of disability worldwide (Sharma et al., 2006). Pain is the primary complaint associated with OA, serving as a predictor of physical dysfunction and muscular weakness, and is thought to influence subsequent outcomes (O’Reilly et al., 1998; Miller et al., 2001; Kidd et al., 2004; Felson, 2005). Thus characterizing the pain of OA is critical to understanding mechanisms underlying the disease. OA pain is generally described as a chronic inflammatory re- sponse (Felson, 2005), generated in part by up-regulation of Na + channels (Laird et al., 2001) and cartilage degradation-associated local production of NO (Takahashi et al., 2001). There is poor relationship between joint anatomical changes, as identified by MRI, and OA pain (Conaghan and Felson, 2004). On the other hand, painful OA knees are more likely to demonstrate structural pathology than non-painful knees (Felson et al., 2001; Hill et al., 2007). OA pain is localized and use-related (Gok et al., 2002; Johnson et al., 2007). Most human studies use either pain ques- tionnaires (Bellamy, 2002; Mendoza et al., 2006; Rosemann et al., 2008; van den Akker-Scheek et al., 2008; Victor et al., 2008) or quantitative sensory testing to measure non-painful somatosensory perception and pain thresholds in response to mechanical or thermal stimuli (Hendiani et al., 2003; Ordeberg, 2004; Martinez et al., 2007; Imamura et al., 2008). These studies 1090-3801/$36.00 Ó 2011 Published by Elsevier Ltd. on behalf of European Federation of International Association for the Study of Pain Chapters. doi:10.1016/j.ejpain.2010.12.007 ⇑ Corresponding author. Address: Northwestern University, Physiology Department Tarry Bldg. 5-703, 303 E. Chicago Ave., Chicago, IL 60611, USA. Tel.: +1 312 503 0404; fax: +1 312 503 5151. E-mail address: [email protected] (A.V. Apkarian). European Journal of Pain 15 (2011) 843.e1–843.e14 Contents lists available at ScienceDirect European Journal of Pain journal homepage: www.EuropeanJournalPain.com
-
Upload
khangminh22 -
Category
Documents
-
view
1 -
download
0
Transcript of Brain activity for chronic knee osteoarthritis

European Journal of Pain 15 (2011) 843.e1–843.e14
Contents lists available at ScienceDirect
European Journal of Pain
journal homepage: www.EuropeanJournalPain.com
Brain activity for chronic knee osteoarthritis: Dissociating evoked painfrom spontaneous pain
Elle L. Parks a, Paul Y. Geha b, Marwan N. Baliki a, Jeffrey Katz c, Thomas J. Schnitzer d,A. Vania Apkarian a,c,d,e,⇑a Department of Physiology, Northwestern University, Feinberg School of Medicine, Chicago, IL 60611, USAb Department of Psychiatry, Yale University School of Medicine, New Haven, CT 06510, USAc Department of Anesthesia, Northwestern University, Feinberg School of Medicine, Chicago, IL 60611, USAd Department of Physical Medicine and Rehabilitation, Northwestern University, Feinberg School of Medicine, Chicago, IL 60611, USAe Department of Surgery, Northwestern University, Feinberg School of Medicine, Chicago, IL 60611, USA
a r t i c l e i n f o a b s t r a c t
Article history:Received 6 August 2010Received in revised form 24 November 2010Accepted 20 December 2010Available online xxxx
Keywords:Knee osteoarthritisPrefrontal cortexLimbicfMRICOX2 inhibitorCsfPsychophysics
1090-3801/$36.00 � 2011 Published by Elsevier Ltd.doi:10.1016/j.ejpain.2010.12.007
⇑ Corresponding author. Address: NorthwesteDepartment Tarry Bldg. 5-703, 303 E. Chicago Ave.,+1 312 503 0404; fax: +1 312 503 5151.
E-mail address: [email protected] (A.V
Chronic pain is a hallmark of osteoarthritis (OA), yet little is known about its properties and represen-tation in the brain. Here we use fMRI combined with psychophysics to study knee pain in fourteenOA patients and nine healthy controls. Mechanical painful pressure stimuli were applied to the kneein both groups and ratings of evoked pain and related brain activity examined. We observe that psy-chophysical properties and brain activation patterns of evoked pain are essentially the same betweenOA patients and healthy subjects, and between worse and better OA knees. In OA patients, stimulus-related brain activity could be distinguished from brain activity associated with spontaneous pain. Theformer activated brain regions commonly observed for acute painful stimuli in healthy subjects, whilethe spontaneous pain of OA engaged prefrontal-limbic regions closely corresponding to areas observedfor spontaneous pain in other chronic pain conditions, such as chronic back pain and post-herpeticneuralgia. Arthritis-related clinical characteristics of knee OA also mapped to prefrontal-limbicregions. In a subgroup of patients (n = 6) we examined brain activity changes for a 2-week, repeatmeasure, cyclooxygenase-2 inhibitor (valdecoxib) therapy. Treatment decreased spontaneous painfor the worse knee and clinical characteristics of OA, and increased blood and csf levels of the drugwhich correlated positively with prefrontal-limbic brain activity. These findings indicate dissociationbetween mechanically induced and spontaneous OA knee pain, the latter engaging brain regionsinvolved in emotional assessment of the self, and challenge the standard clinical view regardingthe nature of OA pain.� 2011 Published by Elsevier Ltd. on behalf of European Federation of International Association for the
Study of Pain Chapters.
1. Introduction
Osteoarthritis (OA) is the most common type of arthritis, and aleading cause of disability worldwide (Sharma et al., 2006). Pain isthe primary complaint associated with OA, serving as a predictor ofphysical dysfunction and muscular weakness, and is thought toinfluence subsequent outcomes (O’Reilly et al., 1998; Miller et al.,2001; Kidd et al., 2004; Felson, 2005). Thus characterizing the painof OA is critical to understanding mechanisms underlying thedisease.
on behalf of European Federation o
rn University, PhysiologyChicago, IL 60611, USA. Tel.:
. Apkarian).
OA pain is generally described as a chronic inflammatory re-sponse (Felson, 2005), generated in part by up-regulation of Na+
channels (Laird et al., 2001) and cartilage degradation-associatedlocal production of NO (Takahashi et al., 2001). There is poorrelationship between joint anatomical changes, as identified byMRI, and OA pain (Conaghan and Felson, 2004). On the otherhand, painful OA knees are more likely to demonstrate structuralpathology than non-painful knees (Felson et al., 2001; Hill et al.,2007). OA pain is localized and use-related (Gok et al., 2002;Johnson et al., 2007). Most human studies use either pain ques-tionnaires (Bellamy, 2002; Mendoza et al., 2006; Rosemannet al., 2008; van den Akker-Scheek et al., 2008; Victor et al.,2008) or quantitative sensory testing to measure non-painfulsomatosensory perception and pain thresholds in response tomechanical or thermal stimuli (Hendiani et al., 2003; Ordeberg,2004; Martinez et al., 2007; Imamura et al., 2008). These studies
f International Association for the Study of Pain Chapters.

843.e2 E.L. Parks et al. / European Journal of Pain 15 (2011) 843.e1–843.e14
identify primary and secondary mechanical and heat hyperalge-sia, implying peripheral and central sensitization, which seem toresolve following joint replacement (Lindh et al., 1997; Hendianiet al., 2003; Ordeberg, 2004; Neugebauer et al., 2007; Shakooret al., 2008). OA is also associated with decreased mechanosen-sation of pressure or vibratory stimuli, yet no study to datehas quantitatively examined pressure-induced pain over the dis-eased joint and its related brain activity. Anti-inflammatorydrugs remain the main therapies used to treat OA symptoms,including those preferentially targeting the COX2 enzyme.Although two COX2 selective inhibitors were recently withdrawnfrom the market, less- and non-selective COX2 inhibitors are stillprescribed (Chen et al., 2008). However, the effect of COX2inhibitor treatment on OA pain-related brain circuitry is notyet known.
Recent studies have begun exploring brain activity in OA inthe absence of peripheral stimulation (Kulkarni et al., 2007),for referred pain in hip OA (Gwilym et al., 2009), and for mod-ulation of brain activity in knee OA by lidocaine patch therapy(Baliki et al., 2008). In the present study, we examine knee OA,hypothesizing that painful pressure stimuli applied to the jointwill induce greater pain and increase related brain activity inOA patients and, that these responses will be greater for theknee more affected by the disease. Given the inflammatory nat-ure of OA, we expected painful stimulus-evoked brain activitypatterns to be similar to those reflecting spontaneous OA pain.We correlated clinical characteristics of OA and the effects of aCOX2 inhibitor treatment with brain activity for evoked andspontaneous pain to further elucidate brain regional activitycharacteristics along these dimensions.
2. Materials and methods
2.1. Participants
Fourteen OA patients (10 males; age 56.1 ± 2.09 years, mean ±SEM) and nine healthy controls (6 males; age 46.55 ± 2.6 years)participated in this study. Six OA patients also participated ina COX2i drug treatment study. All subjects were right-handed,gave informed consent to procedures approved by the North-western University Institutional Review Board, and compensatedfinancially for their time. Healthy subjects had no history ofchronic pain, and OA patients were only included if they fulfilledcriteria of the American College of Rheumatology for classifica-tion of OA (Altman 1986) and had no history of other pain con-ditions. Patients were also required to have experienced OA painfor a duration longer than 3 months with a pain magnitude of atleast 30/100 on a visual analog scale (VAS). During a screeninginterview patients indicated if one knee is generally more pain-ful than the other, or affects more their daily life; this knee wasdesignated as the ‘worse knee’, and the other designated as the‘better knee’. OA pain characteristics were determined using theshort form of McGill Pain Questionnaire (MPQ) Melzack, 1987and the Western Ontario and McMaster Osteoarthritis Index(WOMAC) Bellamy, 2002. Clinical and demographic data aresummarized in Tables S1 and S2, see the online version at10.1016/j.ejpain.2010.12.007. All participants refrained from useof short acting analgesics for 72 h prior to testing and werenot on antidepressants.
2.2. Experimental design
Prior to brain scanning subjects learned how to use a finger-spanning device to continuously report changes in pain intensityon a 0–100 scale, with 0 = no pain and 100 = worst imaginable
pain (Baliki et al., 2006). Pressure was delivered using a cus-tom-made fMRI compatible device designed to apply pressure-pain on deep tissue consisting of a plastic piston 14 mm indiameter with a rounded dull end, propelled by pressurized airand equipped with a feedback sensor to continuously record ap-plied pressure (Fig. S1, see the online version at 10.1016/j.ej-pain.2010.12.007). Pressure was applied to the most sensitivepart of each knee for patients and at the center of the knee jointin controls. During each session, subjects were presented withfour 10 min scan runs of pressure stimulation (two on eachknee), while using the finger device to rate ongoing pain. Sub-jects were instructed to rate the intensity of pain evoked bythe stimulus, and ignore touch and/or pressure sensation. Pa-tients were additionally told not to rate their spontaneous OApain. A measure of spontaneous pain was obtained by interro-gating the patients at the start of each scan run as to their levelof OA pain on a verbal 0–100 scale in the knee about to be stim-ulated. In this design we thus obtained, for each scan run, a tenminute ongoing evoked pain rating as well as a single spontane-ous pain rating for the specified knee.
Depending on the localization of OA pain, the stimulus was
applied to skin just overlying the joint, just over bone, or onsoft tissue. Thus absolute applied pressure varied in intensityas a reflection of stimulation site. Therefore we normalized ap-plied pressure, and pain ratings, between subjects by calculatingrelative stimulus intensities and pain ratings, presented in stan-dardized units (s.u. = number of standard deviations frommean). During each scan run subjects were presented withpressure stimuli distributed in time in a pseudo-random designof variable intensities and durations; the number of stimuli(maximum nine) was determined by monitoring subjects’responses.2.3. COX2 inhibitor treatment study
A subset of OA patients (n = 6) participated in an open-labeledstudy of the effects of a COX2 selective inhibitor (COX2i, valdecox-ib), on OA pain. Our original intention was to carry out this study inall patients. However, halfway through the study the drug waswithdrawn from the market in the US, and thus we discontinuedthe treatment portion. Session 1 was performed prior to the startof drug and after cessation of use of short acting analgesics for72 h. OA patients started use of COX2i drug (10 mg twice daily)and continued to refrain from all other analgesic medications dur-ing this time. The same procedures were then performed: 24 hafter start of drug (session 2), and 2 weeks after continued use ofdrug (session 3).
Immediately following each session, samples of cerebrospinalfluid (csf) and heparinized blood plasma were drawn from eachparticipant to measure drug and PGE2 concentrations. Csf wascollected by lumbar puncture, during which patients sat upright,and following betadine prep, sterile draping and infiltration with1% lidocaine at the L3–L4 interspinous space, an 18 g introducerneedle was inserted. A 24 g pencil-point spinal needle was addedusing sterile technique and with gentle aspiration a clear 0.2 mlof csf was collected. A solid phase extraction (SPE) procedurewas performed on centrifuged csf to obtain 0.10 ml aliquots con-taining analyte and stable isotope labeled internal standard.Immediately following lumbar puncture, 0.5 ml of blood plasmawas drawn from the antecubital fossa using a 21 g needle;0.30 ml aliquots containing analyte and stable isotope labeledinternal standard were extracted with SPE procedure. Sampleswere refrigerated at �20 �C and analyzed within establishedstorage stability periods. Extracted csf and blood plasma sampleswere analyzed by high performance liquid chromatography withtandem mass spectrometry (HPLC/MS/MS). Quantification of

E.L. Parks et al. / European Journal of Pain 15 (2011) 843.e1–843.e14 843.e3
samples was performed blinded as to subject identity and timepoint.
2.4. Psychophysics
Psychophysical properties of knee pressure-induced pain col-lected during fMRI scans were studied in OA patients andhealthy subjects by examining average time variability of painratings relative to the time course of pressure applied to theknee joint, and by quantifying stimulus–response relationshipsbetween applied pressure and resultant pain ratings. To reducerating noise we subtracted baseline pain ratings 7.5 s prior tostart of the stimulus from the pain rating of each episode. Stim-ulation episodes were only included in the analysis if they in-duced a change in pain rating from baseline greater than 10out of 100. In order to investigate the time course of the stimu-lus–response relationship, applied pressure intensity and painratings were averaged separately for the start (rise) and end(fall) phases of each stimulation epoch. A two-way repeatedmeasures analysis of variance was performed for each phasewith time a repeat measure factor and grouping (OA versushealthy, and OA worse versus better knees) the other indepen-dent factor.
2.5. fMRI and anatomical data acquisition
Functional MRI data was acquired with a 3T Siemens Triowhole-body scanner with echo-planar imaging (EPI) capabilityusing a standard 8-channel radio-frequency head coil. Multi-sliceT2⁄-weighted echo-planar images with whole brain coverage wereobtained with the following parameters: repetition time TR = 2.5 s,echo time TE = 30 ms, flip angle = 90�, slice thickness = 3 mm, in-plane resolution = 3.475 � 3.475 mm2, and number of slices = 36.T1-weighted anatomical MRI images were also acquired for eachsubject using the following parameters: TR = 2.1 s, TE = 4.38 ms,flip angle = 8�, FOV = 220 mm, slice thickness = 1 mm, in-plane res-olution = 0.86 � 0.86 mm2, and number of sagittal slices = 160.
2.5.1. Preprocessing of fMRI dataImage analysis based on changes in blood oxygen level-
dependent (BOLD) signal was performed using FSL Version 4.1(www.fmrib.ox.ac.uk/fsl) (Jezzard et al., 2003). Preprocessing ofeach subject’s individual scan run included interleaved slice tim-ing correction, motion correction using MCFLIRT, spatial smooth-ing using a Gaussian kernel of full-width half-maximum 5 mm,linear high-pass temporal filtering (100 s), and intensity normal-ization. Scan runs with an absolute magnitude of head motiongreater than 2.5 mm were excluded from further analyses (sixscans in controls and eight in OA patients). Preprocessed datawas registered to each subjects’ T1 image before normalizationto standard space with the Montreal Neurological Institute(MNI152) template. Following registration, the time course ofthe BOLD signal for a voxel in the white matter(x = 41, y = 60, z = 46) and another voxel in the ventricle(x = 57, y = 75, z = 46) were extracted for subsequent analyses.
2.6. fMRI statistical analyses
2.6.1. General linear model analysisThe fMRI signal was linearly modeled on a voxel-by-voxel basis
using FSL’s improved linear model (FILM) with local autocorrela-tion correction (Woolrich et al., 2001, 2004). For each scan run,pressure-evoked pain ratings were convolved with the hemody-namic response function (gamma function: lag = 6 s, standarddeviation = 3 s). Six head motion vectors (derived from motion cor-rection) and the single-voxel time courses extracted from the
white matter and ventricle for each functional run were used atthis level as covariates of no interest to further remove residualvariance from head motion and scanner and physiological noise.Significance of the model fit to each voxel time-series wascalculated to yield statistical parametric maps for each scan in eachsubject.
2.6.2. Brain activity for stimulus-evoked painTo standardize comparisons between groups and stimulated
knees, stimulus-evoked activity was performed on activity mapsafter flipping the activation maps for right knee stimulation alongthe x-axis. This rendered all stimulus runs to reflect a unilateralstimulation of the left knee, thereby enabling group averages andcomparison of worse and better knees by controlling for the con-found of sidedness. Stimulus pain-related brain activity was iden-tified for each participant by averaging within-subject scan runs ina fixed effects analysis. Group statistical maps were then generatedat the next level by averaging OA patients’ and controls’ activationmaps with a mixed effects analysis and controlling for potentialage effects by regressing out age as a covariate of no interest.
As the mixed effects modeling calculates the true random ef-fects component of the variance and proper degrees of freedomat each voxel, it allows inferences to be made about the wider pop-ulation from which subjects are drawn. Overlap between activitymaps was determined by binarizing and multiplying voxelsexceeding intensity and cluster threshold in OA and controls. Con-trasts between OA and controls were also performed (unpaired t-test, mixed effects) to identify potential differences in brain activ-ity between the two groups. Similar statistical procedures wereemployed to investigate brain activity for worse and better kneesin OA patients.
2.6.3. Differentiating brain activity for spontaneous versus evoked OApain
OA patients’ spontaneous pain value was used as a covariate ofinterest for each scan. The second covariate of interest (evokedpain) was calculated as peak evoked pain averaged across stimula-tion epochs for each scan. Both covariates were included in a fixedeffects multiple regression analysis with individual scan runs(flipped data) as inputs. This approach identifies brain regions in-volved in one condition while correcting for the influence of theother.
2.6.4. Brain activity co-varying with OA clinical characteristicsTo identify brain regions related to clinical characteristics of OA,
we performed separate analyses for WOMAC pain, WOMAC func-tion, and MPQ scores. Within-subject averages of scans across bothknees were generated using un-flipped data, as stimulus lateralitywas not of interest. These maps were then input to higher-levelfixed effects covariate analyses and corrected for age.
2.6.5. Brain activity modulated by COX2i levels in the bloodChanges in brain activity modulated by treatment were identi-
fied by conducting within-subject paired t-tests (fixed effects, un-flipped data) between each of the three scan sessions, yielding 3maps for each subject (session 2 > session 1, session 3 > session 2,and session 3 > session 1). This identifies brain regions that in-crease in activity with continued use of the drug. These maps werethen input to a higher-level Ordinary Least Squares mixed effectsregression model with changes in blood levels of the drug servingas the covariate of interest.
2.6.6. Threshold for identifying brain activationsA gray matter mask was applied to group average maps prior to
thresholding. Cluster-based correction of the z-statistic images wasthresholded at z > 2.7. For each resulting cluster of spatially

843.e4 E.L. Parks et al. / European Journal of Pain 15 (2011) 843.e1–843.e14
connected voxels surviving the z threshold, a cluster probabilitythreshold of P < 0.01 (corresponding to a Family Wise Error Correc-tion of P < 0.0005) was applied to the computed significance of thatcluster, properly correcting for multiple comparisons (Friston et al.,1995).
2.6.7. Surface-based mappingSurface-based mapping was constructed using the Population-
Average, Landmark- and Surface-based (PALS) average-fiducialsurface from the 23 individual subjects as the atlas target (Van Es-sen, 2005).
3. Results
3.1. Psychophysics of knee pressure-evoked pain
Stimulus–response relationships were examined (per stimula-tion) regarding perceptual time courses (rise and fall rates) and re-sponse magnitudes. Stimulus duration did not differ betweencontrols (mean ± SE 24.9 ± 0.61 s) and OA patients (26.5 ± 0.67 s)(p = 0.1), or between better and worse knees in OA (p = 0.2). Peakpressure intensity for each stimulation was slightly higher in con-trols (2.8 ± 0.08 s.u.) than OA (mean ± SE: 2.6 ± 0.06 s.u.) (p = 0.02),but did not differ between better and worse knees in OA (p = 0.5).Peak pain ratings did not differ between controls (mean ± SE:
Fig. 1. Pressure-induced pain is similar between OA patients and healthy subjects, andphases of pressure (B) and pain (A) (in standardized units (s.u.), ±SEM) were averaged acro(C and D) showed no significant differences. Peak pressure and pain for each stimuluscontrols, or better and worse OA knees.
2.7 ± 0.09 s.u.) and OA patients (2.5 ± 0.07) (p = 0.07), or betweenbetter and worse knees in OA (p = 0.7).
The time course for pain ratings during the rise phase of thestimulus was distinct between OA patients and controls(F1,325 = 9.1, p < 0.003), with a significant interaction (time � group,F8,2600 = 5.5, p < 0.00001) (Fig. 1A, first panel). Pressure intensitywas similar between the groups (Fig. 1B, first panel), despite a sig-nificant interaction effect (time � group, F8,2600 = 8.8, p < 0.00001).At 2.5 s prior to stimulus end, OA patients rated stimuli as slightlyless painful (F1,325 = 18.9, p < 0.00002), with a significant interac-tion (time � group, 10 time steps, F9,2925 = 21.4, p < 0.00001)(Fig. 1A, second panel). Stimulus–response relationships betweenpain and pressure were positively correlated in both OA patients(r = 0.67, p < 0.0001) and healthy subjects (r = 0.58, p < 0.0001);however, these slopes did not differ (Fig. 1E). These results werereplicated when using absolute pain and pressure values insteadof standardized units (1 s.u. pain = 14/100 absolute pain; 1 s.u.pressure = 1.5 kg force applied with a 14 mm diameter probe).
Comparison of worse and better knees in OA patients revealedno significant differences in pain or pressure during either the startor end phases of stimulation (Fig. 1C and D). Stimulus–responserelationships were again positively correlated for both knees(worse, r = 0.72, p < 0.0001; better, r = 0.58, p < 0.0001), but theslopes did not differ (Fig. 1F). These results are opposite to our ini-tial hypothesis as they demonstrate no pressure-induced pain per-
between better and worse knees in OA patients. Time courses for the rise and fallss all stimulations. Time courses for pressure and pain in better and worse OA knees
positively correlated in all groups (E & F) but did not distinguish between OA and

Fig. 2. Brain activity for pressure-evoked pain. Group averaged activity for healthy subjects (A) and OA patients (B). Overlapping activations are shown in (C). Contrastanalyses between healthy and OA did not show any significant differences. (D) Examination of better and worse OA knees revealed greater activation for the worse knee in theright lateral prefrontal cortex; the opposite contrast (better > worse) showed no difference. In each sub-figure, left panel is left hemisphere midline view, right panel is topview of the brain.
[Error xdoc]Figure Caption Missing
E.L. Parks et al. / European Journal of Pain 15 (2011) 843.e1–843.e14 843.e5
ception differences between healthy subjects and OA patients, orworse and better knees in OA, either in perceived pain magnitudeor in the time course of pain perception.
3.2. Brain activity for pressure-evoked pain is minimally differentbetween OA and healthy subjects and between worse and better kneesin OA
The pressure-induced pain rating task evoked increased brainactivity in healthy subjects in bilateral insula, thalamus, basal gan-glia (caudate and putamen), amygdala, anterior cingulate (ACc),supplementary motor area (SMA), lateral prefrontal cortex, andposterior parietal cortices, as well as right secondary somatosen-sory cortex (SII), left premotor cortex, periaqueductal gray andother brainstem regions (Figs. 2A and S2A, see the online versionat 10.1016/j.ejpain.2010.12.007, Table S3, see the online versionat 10.1016/j.ejpain.2010.12.007). OA patients exhibited activationin most of the same brain areas, and although it was slightly morewidespread in OA (Figs. 2B and S2B, Table S3), the number of sig-nificantly activated voxels in controls and OA patients overlappedby 81% (Figs. 2C and S2C). Contrast analyses between the twogroups were null in both directions. Thus, there were only smalldifferences in brain activity for pressure-evoked knee pain be-tween OA patients and healthy controls.
Contrasting brain activity between knees in OA patients identi-fied right lateral prefrontal activity for the worse greater than bet-ter knee (Figs. 2D and S2D, Table S3). The opposite contrast
(better > worse) was null. Thus, we observe only small differencesin brain activity between OA worse and better knees. These resultsmatch the psychophysical findings, are opposite to our startinghypothesis, and indicate that between OA and controls, and be-tween worse and better knees, painful pressure stimuli appliedto the knee are only minimally different.3.3. Brain regions associated with pressure-evoked pain versusspontaneous pain in OA
Psychophysically, spontaneous pain ratings were higher for theworse knee (mean ± SE worse knee: 18.9 ± 3.9; better knee:8.1 ± 2.8, p = 0.04). However, the magnitude of evoked pain didnot differ between knees (p = 0.9). Moreover, patients’ oral reportof spontaneous OA pain at the start of each scan showed no rela-tionship with pressure-evoked pain (r = �0.07, p > 0.6). Given thatthe evoked pain and spontaneous pain ratings show minimal inter-action, they can be used to identify brain regions distinct to eachperception.
Brain activity related to pressure-evoked pain in OA patients,corrected for the influence of spontaneous pain, localized mainlyto bilateral insula, SII, ACc, SMA, inferior and posterior parietal cor-tices (Figs. 3A and S3A, see the online version at 10.1016/j.ejpain.2010.12.007, Table S4, see the online version at 10.1016/j.ej-pain.2010.12.007). Notably, a number of brain regions present inthe group average prior to correcting for spontaneous pain(Figs. 2B and S2B) were no longer significantly activated, specifi-
cally thalamus, basal ganglia, amygdala, and lateral prefrontalcortex. Brain activity associated with spontaneous pain, after cor-recting for pressure-evoked pain, localized to the medial and orbi-tal prefrontal cortex, as well as bilateral accumbens and amygdalae(Figs. 3B and S3B, Table S4). These findings demonstrate that OAspontaneous pain engages brain regions distinct from those acti-vated by pressure-evoked pain, specifically prefrontal-limbicstructures.
3.4. Brain activity related to OA clinical characteristics
OA patients’ brain activity was determined in relation to MPQ,WOMAC function, and WOMAC pain scores (Fig. 4 Table S5, seethe online version at 10.1016/j.ejpain.2010.12.007). All three mea-sures mapped primarily to prefrontal cortical areas: MPQ localizedto orbital regions, WOMAC function to orbital, medial, and lateralprefrontal areas, and WOMAC pain to lateral prefrontal cortex,bilateral insula and basal ganglia. Activity maps for MPQ and WO-MAC function overlapped with areas involved in spontaneous OApain. WOMAC pain-related brain activity minimally overlappedwith spontaneous and stimulus-evoked brain activity maps.
All clinical measures of OA significantly positively correlatedwith spontaneous pain, but not with evoked pain ratings (correla-
tions of MPQ total, sensory, and present pain index scores withspontaneous pain were: r = 0.35, 0.41, 0.36, with p < 0.01–0.004;and with evoked pain were: r = 0.18, 0.18, �0.2, p > 0.2; similarlycorrelations of WOMAC total, stiffness, and function with sponta-neous pain: r = 0.35, 0.27, 0.41, p < 0.06–0.004; and with evokedpain: r = 0.02, 0.21, �0.02, p > 0.2–0.9). These relationships alongwith the brain activity findings indicate that questionnaire out-come measures are not representing stimulus-evoked pain, but in-stead better reflect characteristics of spontaneous pain in OA.3.5. COX2 inhibitor treatment effects on OA pain and related brainactivity
With treatment, levels of COX2i increased from undetectable tolarger values in blood (F2,10 = 21.1, p < 0.0004) and csf (F2,10 = 19.9,p < 0.0003) (Fig. 5A). Blood and csf levels of COX2i were tightlycorrelated showing that csf levels are 2% of that in blood (r = 0.9,p < 0.0001). On the other hand, PGE2 levels did not change with
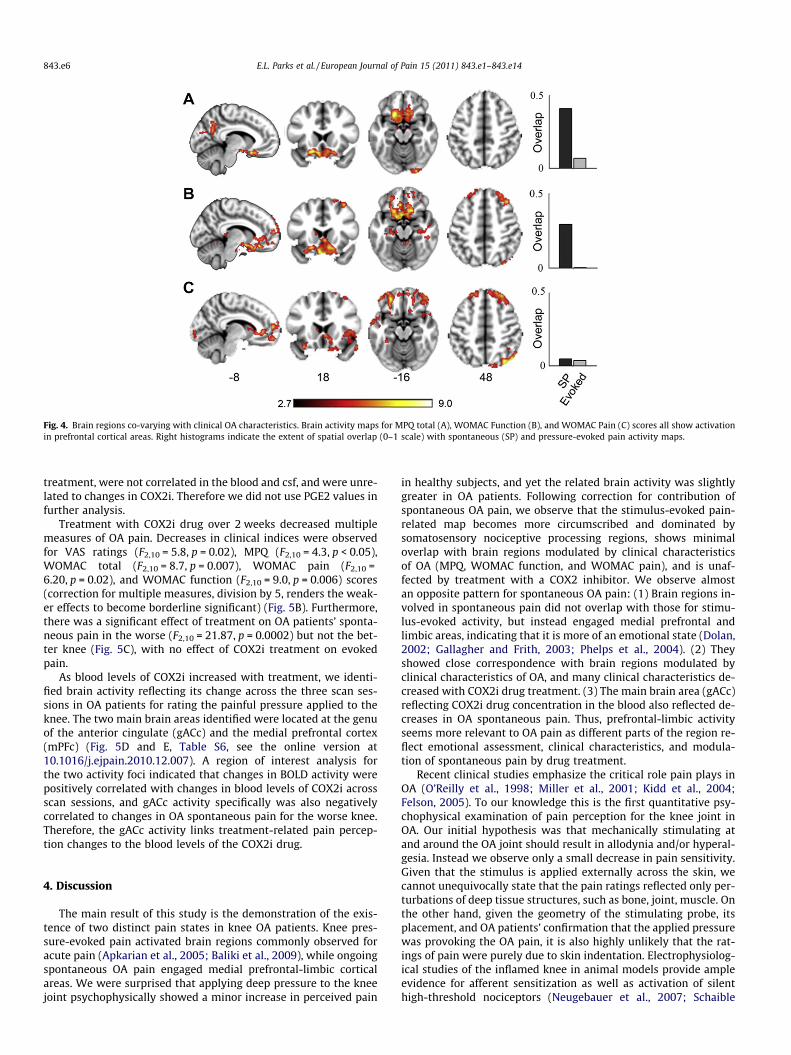
Fig. 4. Brain regions co-varying with clinical OA characteristics. Brain activity maps for MPQ total (A), WOMAC Function (B), and WOMAC Pain (C) scores all show activationin prefrontal cortical areas. Right histograms indicate the extent of spatial overlap (0–1 scale) with spontaneous (SP) and pressure-evoked pain activity maps.
843.e6 E.L. Parks et al. / European Journal of Pain 15 (2011) 843.e1–843.e14
treatment, were not correlated in the blood and csf, and were unre-lated to changes in COX2i. Therefore we did not use PGE2 values infurther analysis.
Treatment with COX2i drug over 2 weeks decreased multiplemeasures of OA pain. Decreases in clinical indices were observedfor VAS ratings (F2,10 = 5.8, p = 0.02), MPQ (F2,10 = 4.3, p < 0.05),WOMAC total (F2,10 = 8.7, p = 0.007), WOMAC pain (F2,10 =6.20, p = 0.02), and WOMAC function (F2,10 = 9.0, p = 0.006) scores(correction for multiple measures, division by 5, renders the weak-er effects to become borderline significant) (Fig. 5B). Furthermore,there was a significant effect of treatment on OA patients’ sponta-neous pain in the worse (F2,10 = 21.87, p = 0.0002) but not the bet-ter knee (Fig. 5C), with no effect of COX2i treatment on evokedpain.
As blood levels of COX2i increased with treatment, we identi-fied brain activity reflecting its change across the three scan ses-sions in OA patients for rating the painful pressure applied to theknee. The two main brain areas identified were located at the genuof the anterior cingulate (gACc) and the medial prefrontal cortex(mPFc) (Fig. 5D and E, Table S6, see the online version at10.1016/j.ejpain.2010.12.007). A region of interest analysis forthe two activity foci indicated that changes in BOLD activity werepositively correlated with changes in blood levels of COX2i acrossscan sessions, and gACc activity specifically was also negativelycorrelated to changes in OA spontaneous pain for the worse knee.Therefore, the gACc activity links treatment-related pain percep-tion changes to the blood levels of the COX2i drug.
4. Discussion
The main result of this study is the demonstration of the exis-tence of two distinct pain states in knee OA patients. Knee pres-sure-evoked pain activated brain regions commonly observed foracute pain (Apkarian et al., 2005; Baliki et al., 2009), while ongoingspontaneous OA pain engaged medial prefrontal-limbic corticalareas. We were surprised that applying deep pressure to the kneejoint psychophysically showed a minor increase in perceived pain
in healthy subjects, and yet the related brain activity was slightlygreater in OA patients. Following correction for contribution ofspontaneous OA pain, we observe that the stimulus-evoked pain-related map becomes more circumscribed and dominated bysomatosensory nociceptive processing regions, shows minimaloverlap with brain regions modulated by clinical characteristicsof OA (MPQ, WOMAC function, and WOMAC pain), and is unaf-fected by treatment with a COX2 inhibitor. We observe almostan opposite pattern for spontaneous OA pain: (1) Brain regions in-volved in spontaneous pain did not overlap with those for stimu-lus-evoked activity, but instead engaged medial prefrontal andlimbic areas, indicating that it is more of an emotional state (Dolan,2002; Gallagher and Frith, 2003; Phelps et al., 2004). (2) Theyshowed close correspondence with brain regions modulated byclinical characteristics of OA, and many clinical characteristics de-creased with COX2i drug treatment. (3) The main brain area (gACc)reflecting COX2i drug concentration in the blood also reflected de-creases in OA spontaneous pain. Thus, prefrontal-limbic activityseems more relevant to OA pain as different parts of the region re-flect emotional assessment, clinical characteristics, and modula-tion of spontaneous pain by drug treatment.
Recent clinical studies emphasize the critical role pain plays inOA (O’Reilly et al., 1998; Miller et al., 2001; Kidd et al., 2004;Felson, 2005). To our knowledge this is the first quantitative psy-chophysical examination of pain perception for the knee joint inOA. Our initial hypothesis was that mechanically stimulating atand around the OA joint should result in allodynia and/or hyperal-gesia. Instead we observe only a small decrease in pain sensitivity.Given that the stimulus is applied externally across the skin, wecannot unequivocally state that the pain ratings reflected only per-turbations of deep tissue structures, such as bone, joint, muscle. Onthe other hand, given the geometry of the stimulating probe, itsplacement, and OA patients’ confirmation that the applied pressurewas provoking the OA pain, it is also highly unlikely that the rat-ings of pain were purely due to skin indentation. Electrophysiolog-ical studies of the inflamed knee in animal models provide ampleevidence for afferent sensitization as well as activation of silenthigh-threshold nociceptors (Neugebauer et al., 2007; Schaible

Fig. 5. Effects of COX2i treatment on OA pain and related brain activity. OA patients were scanned three times (session 1 = prior to drug ingestion, session 2 = 24 h after startof drug, session 3 = after 2 weeks of drug use). (A) Blood levels of COX2i, but not PGE2, increased with treatment. (B) Treatment significantly lowered MPQ scores and VASpain ratings. (C) Stimulus-evoked (Ev) pain (standardized units) was unchanged by treatment. However, spontaneous (SP) pain ratings (0–100 scale) for the worse kneesignificantly decreased. (D and E) Brain activity reflecting changes in COX2i blood concentrations localized to the genu ACc (gACc) and mPFc. Changes in BOLD activity (inparameter estimate units, p.e.) across treatment sessions in both regions positively correlated with changes in COX2i levels. Changes in spontaneous pain for the worse kneeonly correlated with the gACc, where increased treatment-related activity was associated with decreased pain.
E.L. Parks et al. / European Journal of Pain 15 (2011) 843.e1–843.e14 843.e7
et al., 2009). However, these animal studies are done shortly afterperipheral inflammation. Therefore, we suspect that the lack ofpressure-induced pain sensitization of the OA knee is a reflectionof chronicity of OA in the human clinical population, suggestinga mismatch between animal models and clinical OA. Our stimulusparadigm only examined pressure-pain, and other stimulus modal-ities may still exhibit evidence for sensitized joint afferents. Itshould be emphasized that systematic quantitative studies of OApain remain urgently needed, and the current study is only a firstattempt in this direction.
Here we observe that the stimulus-evoked pain has a distinctrepresentation from spontaneous OA pain. Components of theseactivations have been observed in two earlier studies of OA relatedbrain activity (Kulkarni et al., 2007; Gwilym et al., 2009). Our initialhypothesis was that spontaneous pain and evoked pain would mapto the same brain areas, as inflammation is expected to enhancesensitivity and spontaneous firing of peripheral nociceptors. Basedon this idea in an earlier study we attributed pressure stimulus-evoked activity to the inflammatory component of OA (Balikiet al., 2008). The current results clarify this relationship by dissoci-
ating stimulus-evoked brain activity from spontaneous pain-re-lated brain activity. Notably, there is a close correspondencebetween brain regions seen here for spontaneous pain in OA andthose observed for spontaneous pain in other chronic pain condi-tions, including chronic back pain (Baliki et al., 2006) and post-her-petic neuralgia (Geha et al., 2007). In the present study weidentified brain activity for spontaneous pain using a covariateanalysis for subjects’ ratings of stimulus-evoked pain. In two ear-lier studies spontaneous pain-related activity was determinedusing continuous ratings of fluctuations of ongoing pain (Balikiet al., 2006; Geha et al., 2007). Despite methodological differences,in all three chronic pain patient groups we observe similar brainregions identified for spontaneous pain, primarily medial prefron-tal cortex and limbic structures including the amygdala and nu-cleus accumbens. As the latter structures are implicated inemotional assessment of the environment relative to the self(Dolan, 2002; Gallagher and Frith, 2003; Phelps et al., 2004), wecan state that spontaneous chronic pain is generally an emotionalstate, and this applies specifically to knee OA pain too, a conclusionalso reached by Kulkarni et al. (2007). Moreover, the preoccupation

843.e8 E.L. Parks et al. / European Journal of Pain 15 (2011) 843.e1–843.e14
of these regions with spontaneous pain may distort assessmentand prediction of outcomes based on emotional cues (Demboet al., 2005; Apkarian, 2008; Seymour and Dolan, 2008; vanRoozendaal and Krass, 2009), and may underlie the decision-mak-ing deficits observed in different chronic pain conditions (Apkarianet al., 2004), suggesting that similar deficits should also be obser-vable in OA patients. Even though spontaneous pain generally en-gages mPFc-limbic circuitry, there is also a differential gradient ofactivity across the three clinical conditions implying unique emo-tional properties for spontaneous pain in different clinical condi-tions: mPFc is most prominently active in chronic back pain(Baliki et al., 2006) and amygdala and accumbens activity best re-flect clinical characteristics of post-herpetic neuralgia (Geha et al.,2007), whereas in OA more orbitofrontal cortical regions seem en-gaged in the condition, with orbital, medial and lateral PFC activityreflecting its primary clinical characteristics. To our knowledge thisis the first study mapping clinical characteristics of OA pain tobrain activity, and the tight correlation between clinical parame-ters and magnitude of spontaneous OA pain provide further evi-dence as to the physiological source of these clinical measures inOA, and indicate that these medial prefrontal-limbic regions en-code complex properties, expectations and consequences of OApain.
This study is also the first to examine brain activity in OA inrelation to an anti-inflammatory drug treatment, and investigateCOX2i and PGE2 blood and csf levels during the course of treat-ment. The csf levels of COX2i and PGE2 are similar to the onlytwo other reports documenting these values in humans (Hsuet al., 2001; Dembo et al., 2005). Although this was an open-labeledstudy done in a small group of OA patients, we observe specificchanges in clinical outcome measures, spontaneous OA pain, androbust brain activity. We expected a negative correlation betweenPGE2 levels and COX2i (Samad et al., 2001), but this was not ob-served. The lack of relationship between central COX2i and PGE2suggests that the anti-inflammatory effects of COX2i may not becentrally mediated (Samad et al., 2001; Vardeh et al., 2009),although this needs to be tested in a larger sample. Continueduse of the COX2i drug decreased multiple clinical outcome mea-sures and the magnitude of spontaneous pain for the worse OAknee, but had no effect on stimulus-evoked pain. These resultsraise questions as to the time, dose, and site of action for thisCOX2 inhibitor, and for anti-inflammatory drug action in OA ingeneral, and should be investigated in future placebo-controlledstudies. The brain regions related to COX2i are also informativeas to possible mechanisms of OA pain and its modulation byanti-inflammatory drugs: The gACc activity related to changingCOX2i blood levels also reflected changes in spontaneous OA painfor the worse knee. We do not know whether this activity is drivenby changes in pain or in COX2i. Moreover, the general area of thegACc and mPFc are in close proximity to the regions encoding clin-ical characteristics of OA and thus may be influenced by changes inthose parameters as well. This region is also shown to be involvedin placebo effects (Wager et al., 2007; Eippert et al., 2009) and en-gaged in top-down modulation (Fields, 2006). Therefore, it is unli-kely that the brain activity reflecting blood levels of COX2i are dueto local inhibition of COX2 enzyme. Instead, it likely reflects effectsof pain modulation by efficacy of the drug at the joint itself, cou-pled with a top-down modulation based on expectation as wellas peripheral analgesia, which in turn would diminish the centralgain for the afferent spontaneous nociceptive barrage emanatingfrom the OA joint, through spino-cephalad-spinal interactions.
Overall, this study provides multiple lines of evidence indicat-ing that pressure-evoked knee pain and spontaneous OA pain havedistinct mechanisms. The pressure-evoked pain and related brainactivity is minimally different between OA and healthy subjects.In contrast, spontaneous knee OA pain has a brain representation
similar to that seen for spontaneous pain in other clinical chronicpain conditions, and these brain regions relate to clinical character-istics and are modulated by COX2i therapy. These results challengethe clinical ideas regarding the nature of chronic OA pain and pointto the intriguing possibility that the prefrontal-limbic brain regionsidentified for spontaneous pain, and molecular mechanisms under-lying chronic pain in these areas (Millecamps et al., 2006; Centenoet al., 2009), may provide novel therapeutic opportunities for OA.
Acknowledgements
We thank all participants in the study. We also thank Rami Jab-akhanji for aid in building the pressure stimulator. Funding wasprovided by NIH NINDS NS 35115 and partially by Pfizer Pharma-ceuticals. Pfizer Pharmaceuticals provided financial aid, drug, andassisted in drug quantification for csf measurements, but had noinvolvement in other aspects of the project.
References
Apkarian AV, Sosa Y, Krauss BR, Thomas PS, Fredrickson BE, Levy RE, et al. Chronicpain patients are impaired on an emotional decision-making task. Pain2004;108:129–36.
Apkarian AV, Bushnell MC, Treede RD, Zubieta JK. Human brain mechanisms of painperception and regulation in health and disease. Eur J Pain 2005;9:463–84.
Apkarian AV. Pain perception in relation to emotional learning. Curr Opin Neurobiol2008;18:464–8.
Baliki MN, Chialvo DR, Geha PY, Levy RM, Harden RN, Parrish TB, et al. Chronic painand the emotional brain: specific brain activity associated with spontaneousfluctuations of intensity of chronic back pain. J Neurosci 2006;26:12165–73.
Baliki MN, Geha PY, Jabakhanji R, Harden N, Schnitzer TJ, Apkarian AV. Apreliminary fMRI study of analgesic treatment in chronic back pain and kneeosteoarthritis. Mol Pain 2008;4:47.
Baliki MN, Geha PY, Apkarian AV. Parsing pain perception between nociceptiverepresentation and magnitude estimation. J Neurophysiol 2009;101:875–87.
Bellamy N. WOMAC: a 20-year experiential review of a patient-centered self-reported health status questionnaire. J Rheumatol 2002;29:2473–6.
Centeno MV, Mutso A, Millecamps M, Apkarian AV. Prefrontal cortex and spinalcord mediated anti-neuropathy and analgesia induced by sarcosine, a glycine-T1 transporter inhibitor. Pain 2009;145:176–83.
Chen YF, Jobanputra P, Barton P, Bryan S, Fry-Smith A, Harris G, et al.Cyclooxygenase-2 selective non-steroidal anti-inflammatory drugs (etodolac,meloxicam, celecoxib, rofecoxib, etoricoxib, valdecoxib and lumiracoxib) forosteoarthritis and rheumatoid arthritis: a systematic review and economicevaluation. Health Technol Assess 2008;12:1–278.
Conaghan DT, Felson PG. Structural associations of osteoarthritis pain: lessons frommagnetic resonance imaging. Novartis Found Symp 2004;260:191–201[discussion 201-195, 277-199].
Dembo G, Park SB, Kharasch ED. Central nervous system concentrations ofcyclooxygenase-2 inhibitors in humans. Anesthesiology 2005;102:409–15.
Dolan RJ. Emotion, cognition, and behavior. Science 2002;298:1191–4.Eippert F, Bingel U, Schoell ED, Yacubian J, Klinger R, Lorenz J, et al. Activation of the
opioidergic descending pain control system underlies placebo analgesia.Neuron 2009;63:533–43.
Felson DT, Chaisson CE, Hill CL, Totterman SM, Gale ME, Skinner KM, et al. Theassociation of bone marrow lesions with pain in knee osteoarthritis. Ann InternMed 2001;134:541–9.
Felson DT. The sources of pain in knee osteoarthritis. Curr Opin Rheumatol2005;17:624–8.
Fields HL. A motivation-decision model of pain: the role of opioids. In: Proceedingsof the 11th world congress on pain. Seattle: IASP press; 2006. p. 449–59.
Friston KJ, Holmes AP, Worsley KJ, Poline JB, Frith CD, Frackowiak RS. Statisticparametric maps in functional imaging: a general linear approach. Hum BrainMapp 1995;2:189–210.
Gallagher CD, Frith HL. Functional imaging of ‘theory of mind’. Trends Cogn Sci2003;7:77–83.
Geha PY, Baliki MN, Chialvo DR, Harden RN, Paice JA, Apkarian AV. Brain activity forspontaneous pain of postherpetic neuralgia and its modulation by lidocainepatch therapy. Pain 2007;128:88–100.
Gok H, Ergin S, Yavuzer G. Kinetic and kinematic characteristics of gait in patientswith medial knee arthrosis. Acta Orthop Scand 2002;73:647–52.
Gwilym SE, Keltner JR, Warnaby CE, Carr AJ, Chizh B, Chessell I, et al. Psychophysicaland functional imaging evidence supporting the presence of centralsensitization in a cohort of osteoarthritis patients. Arthritis Rheum2009;61:1226–34.
Hendiani JA, Westlund KN, Lawand N, Goel N, Lisse J, McNearney T. Mechanicalsensation and pain thresholds in patients with chronic arthropathies. J Pain2003;4:203–11.

E.L. Parks et al. / European Journal of Pain 15 (2011) 843.e1–843.e14 843.e9
Hill CL, Hunter DJ, Niu J, Clancy M, Guermazi A, Genant H, et al. Synovitis detectedon magnetic resonance imaging and its relation to pain and cartilage loss inknee osteoarthritis. Ann Rheum Dis 2007;66:1599–603.
Hsu MM, Chou YY, Chang YC, Chou TC, Wong CS. An analysis of excitatory aminoacids, nitric oxide, and prostaglandin E2 in the cerebrospinal fluid of pregnantwomen: the effect on labor pain. Anesth Analg 2001;93:1293–6.
Imamura M, Imamura ST, Kaziyama HH, Targino RA, Hsing WT, de Souza LP, et al.Impact of nervous system hyperalgesia on pain, disability, and quality of life inpatients with knee osteoarthritis: a controlled analysis. Arthritis Rheum2008;59:1424–31.
Jezzard P, Mathews P, Smith SM. Functional MRI: an introduction tomethods. Oxford: Oxford University Press; 2003.
Johnson SR, Archibald A, Davis AM, Badley E, Wright JG, Hawker GA. Is self-reportedimprovement in osteoarthritis pain and disability reflected in objectivemeasures? J Rheumatol 2007;34:159–64.
Kidd BL, Photiou A, Inglis JJ. The role of inflammatory mediators on nociception andpain in arthritis. Novartis Found Symp 2004;260:122–33 [discussion 133-128,277-129].
Kulkarni B, Bentley DE, Elliott R, Julyan PJ, Boger E, Watson A, et al. Arthritic pain isprocessed in brain areas concerned with emotions and fear. Arthritis Rheum2007;56:1345–54.
Laird JM, Carter AJ, Grauert M, Cervero F. Analgesic activity of a novel use-dependent sodium channel blocker, crobenetine, in mono-arthritic rats. Br JPharmacol 2001;134:1742–8.
Lindh C, Liu Z, Lyrenas S, Ordeberg G, Nyberg F. Elevated cerebrospinal fluidsubstance P-like immunoreactivity in patients with painful osteoarthritis, butnot in patients with rhizopatic pain from a herniated lumbar disc. Scand JRheumatol 1997;26:468–72.
Martinez V, Fletcher D, Bouhassira D, Sessler DI, Chauvin M. The evolution ofprimary hyperalgesia in orthopedic surgery: quantitative sensory testing andclinical evaluation before and after total knee arthroplasty. Anesth Analg2007;105:815–21.
Melzack R. The short-form McGill Pain Questionnaire. Pain 1987;30:191–7.Mendoza T, Mayne T, Rublee D, Cleeland C. Reliability and validity of a modified
Brief Pain Inventory short form in patients with osteoarthritis. Eur J Pain2006;10:353–61.
Millecamps M, Centeno MV, Berra HH, Rudick CN, Lavarello S, Tkatch T, et al. D-cycloserine reduces neuropathic pain behavior through limbic NMDA-mediatedcircuitry. Pain 2006.
Miller ME, Rejeski WJ, Messier SP, Loeser RF. Modifiers of change in physicalfunctioning in older adults with knee pain: the Observational Arthritis Study inSeniors (OASIS). Rheum 2001;45:331–9.
Neugebauer V, Han JS, Adwanikar H, Fu Y, Ji G. Techniques for assessing knee jointpain in arthritis. Mol Pain 2007;3:8.
O’Reilly SC, Jones A, Muir KR, Doherty M. Quadriceps weakness in knee osteoarthritis:the effect on pain and disability. Ann Rheum Dis 1998;57:588–94.
Ordeberg G. Characterization of joint pain in human OA. Novartis Found Symp2004;260:105–15 [discussion 115-121, 277-109].
Phelps EA, Delgado MR, Nearing KI, LeDoux JE. Extinction learning in humans: roleof the amygdala and vmPFC. Neuron 2004;43:897–905.
Rosemann T, Laux G, Szecsenyi J, Wensing M, Grol R. Pain and osteoarthritis inprimary care: factors associated with pain perception in a sample of 1021patients. Pain Med 2008;9:903–10.
Samad TA, Moore KA, Sapirstein A, Billet S, Allchorne A, Poole S, et al. Interleukin-1beta-mediated induction of Cox-2 in the CNS contributes to inflammatory painhypersensitivity. Nature 2001;410:471–5.
Schaible HG, Richter F, Ebersberger A, Boettger MK, Vanegas H, Natura G, et al. Jointpain. Exp Brain Res 2009;196:153–62.
Seymour R, Dolan B. Emotion, decision making, and the amygdala. Neuron2008;58:662–71.
Shakoor N, Agrawal A, Block JA. Reduced lower extremity vibratory perception inosteoarthritis of the knee. Arthritis Rheum 2008;59:117–21.
Sharma L, Kapoor D, Issa S. Epidemiology of osteoarthritis: an update. Curr OpinRheumatol 2006;18:147–56.
Takahashi K, Hashimoto S, Kubo T, Hirasawa Y, Lotz M, Amiel D. Hyaluronansuppressed nitric oxide production in the meniscus and synovium of rabbitosteoarthritis model. J Orthop Res 2001;19:500–3.
van den Akker-Scheek I, Zijlstra W, Groothoff JW, Bulstra SK, Stevens M. Physicalfunctioning before and after total hip arthroplasty: perception andperformance. Phys Ther 2008;88:712–9.
Van Essen DC. A Population-Average, Landmark- and Surface-based (PALS) atlas ofhuman cerebral cortex. Neuroimage 2005;28:635–62.
van Roozendaal BW, Krass I. Development of an evidence-based checklist for thedetection of drug related problems in type 2 diabetes. Pharm World Sci2009;31:580–95.
Vardeh D, Wang D, Costigan M, Lazarus M, Saper CB, Woolf CJ, et al. COX2 in CNSneural cells mediates mechanical inflammatory pain hypersensitivity in mice. JClin Invest 2009;119:287–94.
Victor TW, Jensen MP, Gammaitoni AR, Gould EM, White RE, Galer BS. Thedimensions of pain quality: factor analysis of the pain quality assessment scale.Clin J Pain 2008;24:550–5.
Wager TD, Scott DJ, Zubieta JK. Placebo effects on human mu-opioid activity duringpain. Proc Natl Acad Sci USA 2007;104:11056–61.
Woolrich MW, Ripley BD, Brady M, Smith SM. Temporal autocorrelation inunivariate linear modeling of FMRI data. Neuroimage 2001;14:1370–86.
Woolrich MW, Behrens TE, Beckmann CF, Jenkinson M, Smith SM. Multilevel linearmodelling for FMRI group analysis using Bayesian inference. Neuroimage2004;21:1732–47.

Fig. S1. Experimental design. An air propelled plastic cylinder was used to exertpainful pressure on the knee as subjects continuously rated pain (0–100 scale)using a finger-span device (A). Visual feedback of pain ratings was presented on ascreen as a moving bar (B). Example pain rating from one subject is shown in C.Shaded areas mark epochs of pressure stimulation; the solid line represents theactual pain rating. The pressure signal and finger-spanning device were synchro-nized and time locked with the fMRI acquisition sequence. Stimuli were applied in apseudo-random pattern of duration and intensity to account for variability in therange of pressures that individuals may deem painful. The experimenter applyingthe stimuli monitored subjects’ pain ratings in response to stimuli during the courseof the scan, and either increased or decreased subsequent stimulus intensity/duration to explore the range of pain for individual subjects. Therefore individualdifferences in this timing dictated the variable number of stimuli (maximum nine)presented during each scan run. This procedure was applied separately to the leftand right knees in both OA patients and healthy controls. Pressure recordings andpain ratings were then used in psychophysical and fMRI analyses.
Fig. S2. Brain activations in more detail. Brain activity for pressure-evoked pain, presented for five brain orientations (more complete view of Fig. 2 in main manuscript).Group averaged activity for controls (A) and OA patients (B). Overlapping activations are shown in (C). Contrast analyses between controls and OA patients did not show anysignificant differences. (D) Examination of better and worse OA knees revealed greater activation for the worse knee in the right lateral prefrontal cortex; the oppositecontrast (better > worse) showed no difference. In each set, left panels show activations for left hemisphere, where top is lateral and bottom is medial views; right panels aresimilarly organized for the right hemisphere; middle panel is the view of the brain from top.
843.e10 E.L. Parks et al. / European Journal of Pain 15 (2011) 843.e1–843.e14

Table S1Summarizes patient demographics. Demographics and clinical characteristics of OA patients (n = 14) participating in the study. Duration is years of OA pain; worse knee indicatespatients’ reported more painful OA knee; VAS is visual analog pain rating on a 0–100 scale; MPQ is McGill Pain Questionnaire total score; WOMAC pain and function are subscalesof Western Ontario and McMaster Osteoarthritis Index.
OApatient
Age(years)
Gender Duration(years)
Worseknee
VAS MPQ WOMACpain
WOMACfunction
History oftrauma
Medications
1 55 F 3 L > R 49 9 10 32 No Celecoxib2 61 M 5 R 56 9 10 37 Yes Aspirin3* 36 M 4 L > R 72 22 12 45 No None4 61 M 3 L > R 62 14 8 31 Yes Acetaminophen5 63 F 5 L > R 75 21 9 20 No Meloxicani6* 58 M 5 L 64 6 10 35 Yes Aspirin7* 56 M 20 L > R 50 16 8 33 Yes Ibuprofen8 57 M 7.5 L > R 90 2 12 35 No Naproxen/
Acetominophen9 64 F 3 L > R 87 12 10 40 No Naproxen10 54 M 22 R > L 81 15 14 44 No Aspirin/Nabumetone11* 44 M 7 L > R 67 14 15 41 No Aspirin/Ibuprofen12* 62 M 4 L > R 60 13 10.5 35.5 Yes Ibuprofen/Naproxen13 53 F 10 R 24 12 9 20 No Ibuprofen14* 61 M 2.5 R > L 67 2 6 20 No Naproxen
* Participated in COX2 inhibitor treatment study.
Fig. S3. Brain activations in more detail. Brain activity for evoked versus spontaneous pain in OA patients, presented for five brain orientations (more complete view of Fig. 3in main manuscript). (A) Brain activity for pressure-evoked pain, after correcting for spontaneous knee OA pain. (B) Brain activity for spontaneous OA pain, after correcting forpressure-evoked pain. Figure views are organized same as Fig. S2.
E.L. Parks et al. / European Journal of Pain 15 (2011) 843.e1–843.e14 843.e11

Table S2Summarizes pain and drug outcome measures for patients participating in the drug study. Pain characteristics and drug and inflammatory marker outcomes (in blood plasma andcsf) for six OA patients who participated in the drug study, measured at three scan sessions. Scan 1 is prior to use of the COX2i drug (baseline). Scan 2 is 24 h after start of COX2idrug. Scan 3 is 2 weeks after continuous use of COX2i drug.
OA Patient VAS MPQ WOMAC Pain WOMAC Function COX2i Plasma (ng/mL) COX2i CSF (ng/mL) PGE2 Plasma (pg/mL) PGE2 CSF (pg/mL)
Scan 13 72 22 12 45 0 0 >1050 45.46 64 6 10 35 0 0 207.4 >10507 50 16 8 33 0 0 520.4 48.311 67 14 15 41 0 0 >1050 28.512 60 13 10.5 35.5 0 0 463.2 39.514 67 2 6 20 0 0 318.4 38.1
Scan 23 46 20 7 22 51.5 1.3 273.8 866 11 3 3 9 44.5 1 257.2 107.97 57 22 9 33 59.7 1.2 725.3 137.111 0 3 4 13 52.4 1 >1050 44.212 8 4 2 11 12.6 0 513.5 22.114 55 1 5 15 119.8 2.2 384.1 66.4
Scan 33 52 15 10 27 83.5 2.8 217.5 966 63 4 11 33 214 5.1 163.4 487 0 0 9 33 252.4 3.3 870 84.811 0 1 10 32 167.4 3.3 1005 8012 39 3 4 16 80.6 3.3 446.4 52.714 30 1 5 16 49.6 1.4 261.8 88.4
Table S3Lists brain regions identified for painful pressure stimulation of the knee. Peak foci for pressure-induced pain on the knee in healthy subjects (n = 9), OA patients (n = 14), and forthe contrast between worse and better OA knees (Worse > Better). The opposite contrast (Better > Worse), and contrasts between OA and Healthy subjects were null.
Healthy subjects OA patients Worse > Better knee
Brain region Coordinates x, y, z Z-score Coordinates x, y, z Z-score Coordinates x, y, z Z-score
R SFG(8) 24, 2, 60 5.65 . . . . . . 18, 16, 58 3.61R MFG . . . . . . . . . . . . 32, 22, 48 3.42L DLPFc (9/46) �46, 44, 20 6.50 �40, 48, 26 6.40 . . . . . .
R DLPFc (9/46) 36, 54, 22 6.79 40, 48, 30 5.54 22, 34, 46 3 22bil ACc (24/32) �6, 10, 46 6.29 8, 14, 38 5.89 . . . . . .
L INS �40, 2, �8 3.69 �32, 26, �2 4.9 . . . . . .
R INS 40, 0, �4 5.19 34, 24, 2 5.45 . . . . . .
L IFG . . . . . . �58, 10, 6 7.88 . . . . . .
R IFG (44/45) 56, 16, 14 7.04 42, 42, �2 6.17 . . . . . .
bil SMA (6) �2, 8, 52 6.49 8, 2, 56 6.96 . . . . . .
L SII . . . . . . �60, �24, 22 3.76 . . . . . .
R SII 60, �20, 16 5.13 62, �22, 26 4.43 . . . . . .
L Temporal Pole (38) �44, 20, �10 6.58 . . . . . . . . . . . .
R Temporal Pole 58, 10, �6 2.94 54, 16, �6 4.40 . . . . . .
L STG (42/48) �54, �42, 22 8.23 . . . . . . . . . . . .
R ITG / STG (22/40/42) 62, �20, 16 6.03 . . . . . . . . . . . .
L PP (7/40/42) �34, �50, 56 7.23 �58, �30, 36 6.81 . . . . . .
R PP (7/40/42) 40, �52, 56 6.28 54, �40, 42 6.65 . . . . . .
L LOG/Cuneus/PreCu (7/19) �22, �78, 36 5.92 . . . . . . . . . . . .
L Amyg �24, �2, �12 3.69 �20, �4, �14 3.54 . . . . . .
R Amyg 26, 0, �14 6.87 . . . . . . . . . . . .
L Caud �10, 10, 0 4.96 �12, 10, 4 3.83 . . . . . .
R Caud 10, 8, 4 3.85 14, 10, 8 3.65 . . . . . .
L Putamen �24, 2, �6 6.80 �26, �8, 4 5.50 . . . . . .
R Putamen 28, �4, �6 8.53 24, 2, 6 6.67 . . . . . .
L Thal �16, �22, 6 5.43 �8, �4, 4 6.29 . . . . . .
R Thal 8, �16, 10 6.08 16, �18, 8 8.67 . . . . . .
bi Brainstem 8, �60, �6 4.07 4, �28, �8 4.85 . . . . . .
PAG 2, �28, �6 3.14 �2, �28, �8 485 . . . . . .
Brodmann areas are shown in parentheses, x, y, z coordinates in mm.DLPFc = dorsolateral prefrontal cortex; mPFc = medial prefrontal cortex; OFC = orbitofrontal cortex; MFG = middle frontal gyrus; SFG = superior frontal gyrus; IFG = inferiorfrontal gyrus; SMA = supplementary motor area; STG = superior temporal gyrus; MTG = medial temporal gyrus; ITG = inferior temporal gyrus; IPL = inferior parietal lobule;PP = posterior parietal cortex; LOG = lateral occipital gyrus; gACc = genu anterior cingulate cortex; paraCG = paracingulate gyrus; ACc = anterior cingulate cortex;PCc = posterior cingulate cortex; postCG = posterior cingulate gyrus; Amyg = amygdala; Cereb = cerebellum; INS = insula; paraHG = parahippocampal gyus; HC = hippo-campus; M1 = primary motor cortex; SII = secondary somatosensory cortex; PreCu = precuneus; Thal = thalamus; NAc = nucleus accumbens; Caud = caudate; PAG = peri-aqueductal gray.
843.e12 E.L. Parks et al. / European Journal of Pain 15 (2011) 843.e1–843.e14
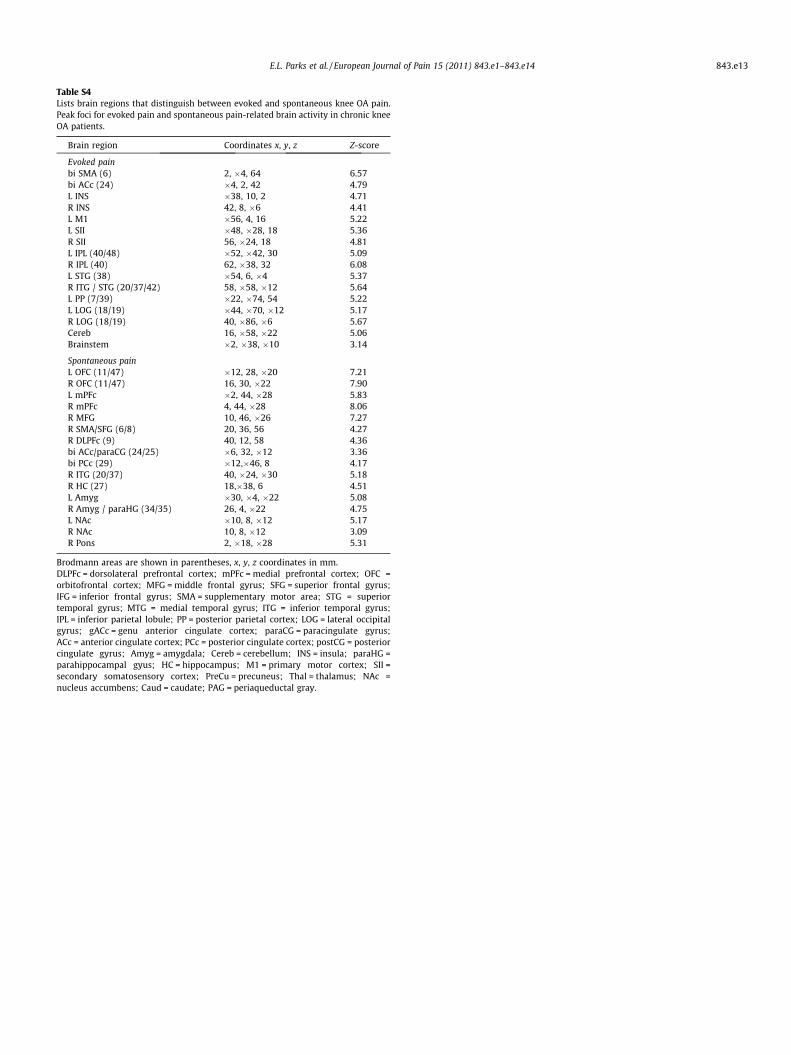
Table S4Lists brain regions that distinguish between evoked and spontaneous knee OA pain.Peak foci for evoked pain and spontaneous pain-related brain activity in chronic kneeOA patients.
Brain region Coordinates x, y, z Z-score
Evoked painbi SMA (6) 2, �4, 64 6.57bi ACc (24) �4, 2, 42 4.79L INS �38, 10, 2 4.71R INS 42, 8, �6 4.41L M1 �56, 4, 16 5.22L SII �48, �28, 18 5.36R SII 56, �24, 18 4.81L IPL (40/48) �52, �42, 30 5.09R IPL (40) 62, �38, 32 6.08L STG (38) �54, 6, �4 5.37R ITG / STG (20/37/42) 58, �58, �12 5.64L PP (7/39) �22, �74, 54 5.22L LOG (18/19) �44, �70, �12 5.17R LOG (18/19) 40, �86, �6 5.67Cereb 16, �58, �22 5.06Brainstem �2, �38, �10 3.14
Spontaneous painL OFC (11/47) �12, 28, �20 7.21R OFC (11/47) 16, 30, �22 7.90L mPFc �2, 44, �28 5.83R mPFc 4, 44, �28 8.06R MFG 10, 46, �26 7.27R SMA/SFG (6/8) 20, 36, 56 4.27R DLPFc (9) 40, 12, 58 4.36bi ACc/paraCG (24/25) �6, 32, �12 3.36bi PCc (29) �12,�46, 8 4.17R ITG (20/37) 40, �24, �30 5.18R HC (27) 18,�38, 6 4.51L Amyg �30, �4, �22 5.08R Amyg / paraHG (34/35) 26, 4, �22 4.75L NAc �10, 8, �12 5.17R NAc 10, 8, �12 3.09R Pons 2, �18, �28 5.31
Brodmann areas are shown in parentheses, x, y, z coordinates in mm.DLPFc = dorsolateral prefrontal cortex; mPFc = medial prefrontal cortex; OFC =orbitofrontal cortex; MFG = middle frontal gyrus; SFG = superior frontal gyrus;IFG = inferior frontal gyrus; SMA = supplementary motor area; STG = superiortemporal gyrus; MTG = medial temporal gyrus; ITG = inferior temporal gyrus;IPL = inferior parietal lobule; PP = posterior parietal cortex; LOG = lateral occipitalgyrus; gACc = genu anterior cingulate cortex; paraCG = paracingulate gyrus;ACc = anterior cingulate cortex; PCc = posterior cingulate cortex; postCG = posteriorcingulate gyrus; Amyg = amygdala; Cereb = cerebellum; INS = insula; paraHG =parahippocampal gyus; HC = hippocampus; M1 = primary motor cortex; SII =secondary somatosensory cortex; PreCu = precuneus; Thal = thalamus; NAc =nucleus accumbens; Caud = caudate; PAG = periaqueductal gray.
E.L. Parks et al. / European Journal of Pain 15 (2011) 843.e1–843.e14 843.e13

Table S5Lists brain areas related to questionnaire outcomes for OA pain. Peak foci for brain regions positively correlated to clinical characteristics of chronic OA pain. MPQ is McGill PainQuestionnaire total score; WOMAC pain and function are subscales of the Western Ontario and McMaster Osteoarthritis Index.
MPQ WOMAC function WOMAC pain
Brain region Coordinates x, y, z Z-score Coordinates x, y, z Z-score Coordinates x, y, z Z-score
L OFC (11/47) �16, 20, �16 7.97 �22, 8, �20 7.79 �26, 44, �14 7.69L mPFc . . . . . . �2, 52, �14 3.29 �4, 54, �12 5.29L MFG/SFG (8) . . . . . . �22, 38, 50 5.10 �32, 28, 52 3.91R MFG/SFG(8) . . . . . . 10, 54, �24 8.96 28, 10, 64 5.3L DLPFc (9/46) . . . . . . . . . . . . �16, 42, 46 4.93R DLPFc (9/46) . . . . . . 42, 32, 42 5.55 44, 50.16 6.47L gACc/ACc (24/25) . . . . . . �8, 36, �4 4.53 �2, 38, 4 5.77L PCc �12, �50, 34 3.2 . . . . . . . . . . . .
L INS . . . . . . . . . . . . �36, �12, �2 5.07R INS . . . . . . . . . . . . 38, �4, �8 4.32R IFG (6/44) . . . . . . . . . . . . 60, 8, 10 5.32R Temporal Pole (38) . . . . . . . . . . . . 42, 14, �22 5.68L MTG/STG (21/22) . . . . . . . . . . . . �66, �30, 4 4.49R ITG (20/37) 40, �36, �22 4.66 40, �36, �26 509 . . . . . .
L ITG (20/37) . . . . . . �34, �46, �8 4.93 �34, �40, �18 4.92L HC/paraHG (34/35) . . . . . . �18,�18, �20 495 . . . . . .
R HC . . . . . . 32, �20, �16 4.14 . . . . . .
L PP (22/42) �64, �40, 10 5.30 . . . . . . . . . . . .
R PP (7, 39, 40) 46, �26, 22 6.35 38, �60, 60 682 . . . . . .
L Occipital (17) . . . . . . . . . . . . �10, �96, 4 5.01R Occipital (18/39) 26, �94, �16 5.83 8, �70, 20 480 34, �78, 48 7.47L LOG/Cuneus/PreCu (7/19) �14, �84, 20 6.15 . . . . . . . . . . . .
L Amyg �24, 4, �20 4.86 . . . . . . . . . . . .
R Amyg . . . . . . 30, 0, �22 391 . . . . . .
L Caud . . . . . . �16, 22, 6 424 �6, 10, 6 4.70R Caud . . . . . . 8, 16, 8 390 8, 18, �4 3.75L NAc �12, 6, �14 3.06 �10, 6, �12 387 �6, 10, �2 3.36R NAc . . . . . . 8, 16, �4 325 12, 18, �8 4.35Cereb . . . . . . �18, �38, �24 4.36 . . . . . .
Brainstem . . . . . . �16, �38, 22 4.49 . . . . . .
Brodmann areas are shown in parentheses, x, y, z coordinates in mm.DLPFc = dorsolateral prefrontal cortex; mPFc = medial prefrontal cortex; OFC = orbitofrontal cortex; MFG = middle frontal gyrus; SFG = superior frontal gyrus; IFG = inferiorfrontal gyrus; SMA = supplementary motor area; STG = superior temporal gyrus; MTG = medial temporal gyrus; ITG = inferior temporal gyrus; IPL = inferior parietal lobule;PP = posterior parietal cortex; LOG = lateral occipital gyrus; gACc = genu anterior cingulate cortex; paraCG = paracingulate gyrus; ACc = anterior cingulate cortex;PCc = posterior cingulate cortex; postCG = posterior cingulate gyrus; Amyg = amygdale; Cereb = cerebellum; INS = insula; paraHG = parahippocampal gyus; HC = hippo-campus; M1 = primary motor cortex; SII = secondary somatosensory cortex; PreCu = precuneus; Thal = thalamus; Caud = caudate; NAc = nucleus accumbens; PAG = peri-aqueductal gray.
Table S6Lists brain areas related to concentration of COX2 inhibitor in the blood. Peak brainactivity foci in regions positively correlated with changes in blood plasma levels of aCOX2 selective inhibitor drug during a 2 week daily treatment regimen.
COX2i
Brain region Coordinates x, y, z Z-score
L OFC �22, 36, �14 3.56L mPFc (10) �12, 52, �8 3.46R mPFc (10) 4, 54, �20 4.05L gACc �10, 48, 8 4.16L HC �28, �38, �2 3.19L paraHG (19) �28, �48, �4 3.45
Brodmann areas are shown in parentheses, x, y, z coordinates in mm.DLPFc = dorsolateral prefrontal cortex; mPFc = medial prefrontal cortex; OFC =orbitofrontal cortex; MFG = middle frontal gyrus; SFG = superior frontal gyrus;IFG = inferior frontal gyrus; SMA = supplementary motor area; STG = superiortemporal gyrus; MTG = medial temporal gyrus; ITG = inferior temporal gyrus;IPL = inferior parietal lobule; PP = posterior parietal cortex; LOG = lateral occipitalgyrus; gACc = genu anterior cingulate cortex; paraCG = paracingulate gyrus;ACc = anterior cingulate cortex; PCc = posterior cingulate cortex; postCG = posteriorcingulate gyrus; Amyg = amygdale; Cereb = cerebellum; INS = insula; paraHG =parahippocampal gyus; HC = hippocampus; M1 = primary motor cortex; SII = sec-ondary somatosensory cortex; PreCu = precuneus; Thal = thalamus; NAc = nucleusaccumbens; Caud = caudate; PAG = periaqueductal gray.
843.e14 E.L. Parks et al. / European Journal of Pain 15 (2011) 843.e1–843.e14