Laporan Praktikum Biologi kelompok samanea saman-difusi osmosis
Upload
independentCategory
view
2download
0
ww.sciencedirect.com
wat e r r e s e a r c h 4 7 ( 2 0 1 3 ) 5 2 3 2e5 2 4 4
Available online at w
journal homepage: www.elsevier .com/locate /watres
Trace organic solutes in closed-loop forwardosmosis applications: Influence of membranefouling and modeling of solute build-up
Arnout D’Haese a,*, Pierre Le-Clech b, Sam Van Nevel c, Kim Verbeken d,Emile R. Cornelissen e, Stuart J. Khan f, Arne R.D. Verliefde a,g
aParticle and Interfacial Technology Group, Ghent University, Coupure Links 653, B-9000 Ghent, BelgiumbUNESCO Centre for Membrane Science and Technology, UNSW Sydney, NSW 2052, Australiac Laboratory for Microbial Ecology and Technology, Ghent University, Coupure Links 653, B-9000 Ghent, BelgiumdDepartment of Materials Science and Engineering, Ghent University, Technologiepark Zwijnaarde 903,
B-9052 Zwijnaarde, BelgiumeKWR Watercycle Institute, Groningenhaven 7, Postbus 1072, 3433 PE Nieuwegein, The Netherlandsf School of Civil & Environmental Engineering, UNSW Sydney, NSW 2052, AustraliagDepartment of Sanitary Engineering, Delft University of Technology, Stevinweg 1, 2628CN Delft, The Netherlands
a r t i c l e i n f o
Article history:
Received 15 February 2013
Received in revised form
14 May 2013
Accepted 2 June 2013
Available online 12 June 2013
Keywords:
Forward osmosis
Organic micro pollutant
Membrane fouling
Biofilm
Modeling
* Corresponding author. Tel.: þ32 (0)9 264 99E-mail address: [email protected]
0043-1354/$ e see front matter ª 2013 Elsevhttp://dx.doi.org/10.1016/j.watres.2013.06.006
a b s t r a c t
In this study, trace organics transport in closed-loop forward osmosis (FO) systems was
assessed. The FO systems considered, consisted of an FO unit and a nanofiltration (NF) or
reverse osmosis (RO) unit, with the draw solution circulating between both units. The
rejection of trace organics by FO, NF and RO was tested. It was found that the rejection
rates of FO were generally comparable with NF and lower than RO rejection rates. To assess
the influence of fouling in FO on trace organics rejection, FO membranes were fouled with
sodium alginate, bovine serum albumin or by biofilm growth, after which trace organics
rejection was tested. A negative influence of fouling on FO rejection was found which was
limited in most cases, while it was significant for some compounds such as paracetamol
and naproxen, indicating specific compound-foulant interactions. The transport mecha-
nism of trace organics in FO was tested, in order to differentiate between diffusive and
convective transport. The concentration of trace organics in the final product water and the
build-up of trace organics in the draw solution were modeled assuming the draw solution
was reconcentrated by NF/RO and taking into account different transport mechanisms for
the FO membrane and different rejection rates by NF/RO. Modeling results showed that if
the FO rejection rate is lower than the RO rejection rate (as is the case for most compounds
tested), the added value of the FO-RO cycle compared to RO only at steady-state was small
for diffusively and negative for convectively transported trace organics. Modeling also
showed that trace organics accumulate in the draw solution.
ª 2013 Elsevier Ltd. All rights reserved.
11.(A. D’Haese).ier Ltd. All rights reserved.
wat e r r e s e a r c h 4 7 ( 2 0 1 3 ) 5 2 3 2e5 2 4 4 5233
1. Introduction Although previous studies have investigated TOrCs rejec-
ForwardOsmosis (FO) has gained attention in recent years as a
water treatment technology capable of handling heavily
impaired water sources and capable of concentrating solu-
tions with a high fouling potential (Cath et al., 2006; Zhao
et al., 2012). The main benefits of FO in this regard are: the
production of high quality permeate because of a high rejec-
tion of different pollutants and operation under osmotic
driving force without the need for a hydraulic pressure dif-
ference (Zhao et al., 2012). FO has been used to reclaim water
from (un)treated domestic waste water (Alturki et al., 2012;
Cath et al., 2010; Cornelissen et al., 2008; Hancock et al.,
2011; Zhang et al., 2011), anaerobic digestion concentrate
(Holloway et al., 2007), and to concentrate liquid foods
(Sant’Anna et al., 2012).
Impaired water sources, such as waste water treatment
plant (WWTP) effluents, are often contaminated with trace
organic compounds (TOrCs) (Daughton and Ternes, 1999;
Ternes et al., 2005). TOrCs are anthropogenic organic com-
pounds present inwastewater at concentrations in the ng/L to
mg/L range. This group of compounds consists of, among
others, pharmaceuticals, personal care products, flame re-
tardants and pesticides. One potential consequence of chronic
exposure to TOrCs is endocrine disruption (Markey et al.,
2002). Although some controversy remains whether endo-
crine disruption has significant effects on humans
(Giwercman, 2011; Sharpe, 2003), the effects of endocrine
disruption caused by estrogenic compounds in aquatic ver-
tebrates has been reported (Sumpter and Johnson, 2005).
Conventional waste water treatment systems, such as coag-
ulation, trickling filters, sand filters and activated sludge
remove TOrCs to varying degree, but often unsatisfactory
when waste water is to be reclaimed. Svenson et al. (2003)
found an increased removal rate of estrogenic compounds in
treatment media with an increased bioactivity. Ternes (1998)
found a TOrCs removal rate varying between 10 and almost
100% for pharmaceuticals in German WWTPs, which is the
same conclusion reached by Van De Steene et al. (2010) who
also found removal rates varying from 0 to almost 100%.
For the practical implementation of FO, maintaining a high
rejection of TOrCs under different operating conditions is a
key challenge, especially if FO is used to produce reclaimed
water from WWTP in- or effluent. Alturki et al. (2012) noted
that rejection of TOrCs by FO in an osmotic MBR (OMBR), of
which the sludge was conditioned to the tested TOrCs, was
consistently high for the solutes with a molecular weight
above 266 g/mole, while the rejection of smaller solutes
appeared to relate to their biodegradation susceptibility. This
could indicate that the actual rejection rates of the smaller
soluteswere quite low. Hancock et al. (2011) have tested TOrC-
rejection in both bench- and pilot-scale installations, using
MBR-treated domestic waste water as a feed. The rejection of
hydrophobic nonionic compounds by FO appeared to improve
with increasing TSS concentration in the feed, which could
indicate sorption of these compounds onto the TSS and sub-
sequent filtration of the TSS. The rejection of mainly nega-
tively charged organic solutes was consistently high,
regardless of the TSS concentration.
tion by FO membranes, there is still relatively limited knowl-
edge on the actual transport mechanisms of these solutes in
FO, which contrasts the transport of TOrCs in pressure-driven
processes such as NF and RO (Bowen et al., 1997; Kim et al.,
2007; Ramon et al., 2012; Verliefde et al., 2009a). In addition,
although the influence of fouling by several water matrices on
rejection of TOrCs has been investigated in practice, most
studies have not tried to identify underlying mechanisms of
influence of fouling on rejection. In contrast to studies on NF/
RO (Botton et al., 2012), the influence of different model fou-
lants and of biofilm formation on rejection of TOrCs in FO has
not been systematically investigated.
When FO is used to reclaim water from impaired sources,
the effect of draw solution regeneration in a closed-loop sys-
tem on the TOrCs concentration in the final product water has
not been investigated yet. Hancock et al. reported a build-up of
TOrCs in the draw solution (Hancock et al., 2011) when using
RO to regenerate the FO draw solution (consisting of NaCl) in a
closed-loop configuration. Cath et al. (2010) made a similar
observation in a closed loop FO-RO configuration. Although
both groups reported a total rejection of TOrCs by the com-
bined FO-RO system in the order of 99%, the statement of FO-
RO being a double barrier against micropollutants has not
been thoroughly assessed in closed-loop systems. Both groups
reported that the build-up of TOrCs in the draw solution was
caused by a higher rejection of TOrCs by RO than by FO (Cath
et al., 2010; Hancock et al., 2011). A TOrCs build up in the draw
solution might negatively impact the TOrCs concentration in
the final permeate. It is therefore imperative to investigate the
fate of TOrCs when FO is used in a closed loop system.
In this study, different model foulants were used to foul FO
membranes and effects on FO rejection of 20 pharmaceuticals
was studied. In addition, long-term biofouling experiments
were carried out, in which the biofouled membrane was
extensively characterized and again the effect on the FO
rejection of pharmaceuticals was investigated. The build-up
of TOrCs in the draw solution is systematically studied and
modeled in closed-loop FO-RO/NF applications, and the po-
tential implications for potable water production are
discussed.
2. Materials and methods
2.1. FO setup and filtration protocols
2.1.1. FO setupThe FO membranes used in this study, were commercial cel-
lulose tri-acetate (CTA) membranes produced by Hydration
Technology Innovations (HTI) (Albany, Oregon, USA). Mem-
brane properties are shown in supplementary information.
The membrane orientation in this study was in FO mode
(active layer facing the feed solution). The membrane cell was
a transparent polycarbonate cell, with a flow channel length
of 250 mm, a width of 50 mm and a membrane surface area of
124 cm2. The membrane cell was oriented horizontally, with
the feed channel on top. Feed and draw solution were deliv-
ered to the membrane module in counter-current mode, both
wat e r r e s e a r c h 4 7 ( 2 0 1 3 ) 5 2 3 2e5 2 4 45234
at a cross-flow velocity of 0.20 m/s, by peristaltic pumps
(ColeeParmer Metrohm, Belgium). The volume and salt con-
centration of the draw solutionwere controlled using a Biostat
B (Sartorius, Germany) which pumped out excess draw solu-
tion and dosed a concentrated salt solution to restore the draw
solution’s salt concentration. Salt leakage was checked by
measuring the conductivity of the feed solution. The Biostat
algorithms were controlled using a conductivity probe by
Consort (Turnhout, Belgium), measuring the conductivity of
the draw solution. The water flux was measured by logging
the weight of the excess draw solution using an OHaus 5000
Xtreme scale which was logged using a LabVIEW script. The
flux was corrected for the dosed salt solution and the draw
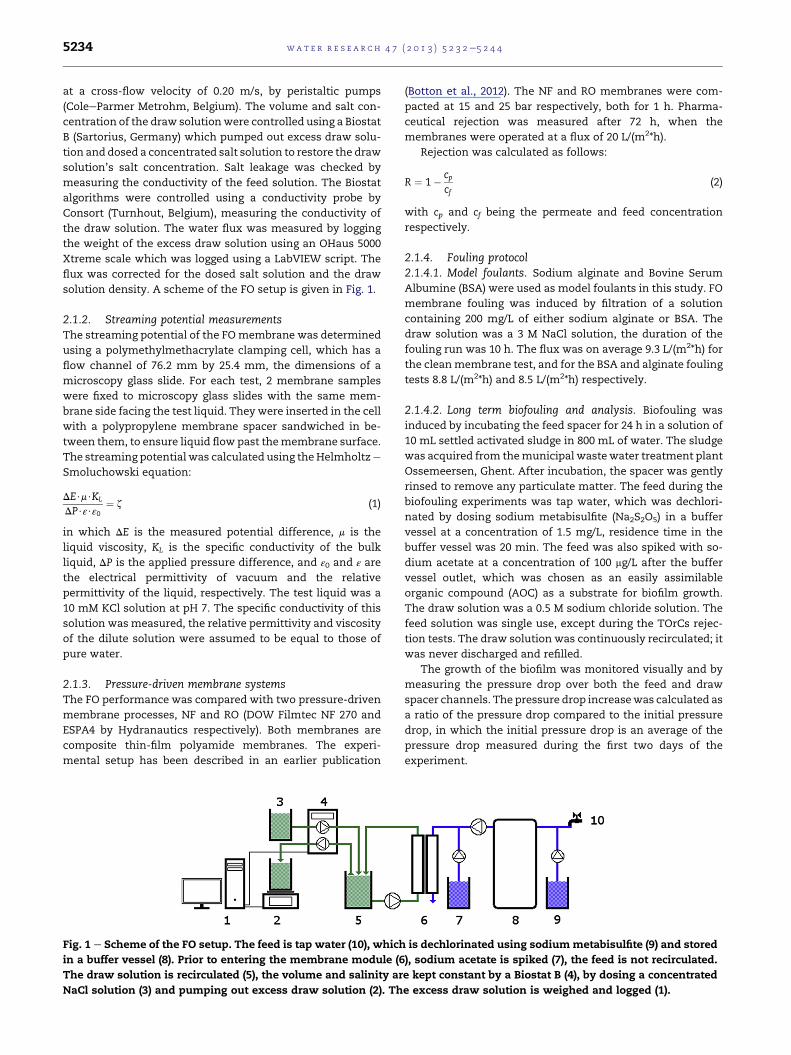
solution density. A scheme of the FO setup is given in Fig. 1.
2.1.2. Streaming potential measurementsThe streaming potential of the FOmembrane was determined
using a polymethylmethacrylate clamping cell, which has a
flow channel of 76.2 mm by 25.4 mm, the dimensions of a
microscopy glass slide. For each test, 2 membrane samples
were fixed to microscopy glass slides with the same mem-
brane side facing the test liquid. They were inserted in the cell
with a polypropylene membrane spacer sandwiched in be-
tween them, to ensure liquid flow past themembrane surface.
The streaming potential was calculated using the Helmholtze
Smoluchowski equation:
DE$m$KL
DP$ε$ε0¼ z (1)
in which DE is the measured potential difference, m is the
liquid viscosity, KL is the specific conductivity of the bulk
liquid, DP is the applied pressure difference, and ε0 and ε are
the electrical permittivity of vacuum and the relative
permittivity of the liquid, respectively. The test liquid was a
10 mM KCl solution at pH 7. The specific conductivity of this
solution was measured, the relative permittivity and viscosity
of the dilute solution were assumed to be equal to those of
pure water.
2.1.3. Pressure-driven membrane systemsThe FO performance was compared with two pressure-driven
membrane processes, NF and RO (DOW Filmtec NF 270 and
ESPA4 by Hydranautics respectively). Both membranes are
composite thin-film polyamide membranes. The experi-
mental setup has been described in an earlier publication
Fig. 1 e Scheme of the FO setup. The feed is tap water (10), which
in a buffer vessel (8). Prior to entering the membrane module (6
The draw solution is recirculated (5), the volume and salinity ar
NaCl solution (3) and pumping out excess draw solution (2). Th
(Botton et al., 2012). The NF and RO membranes were com-
pacted at 15 and 25 bar respectively, both for 1 h. Pharma-
ceutical rejection was measured after 72 h, when the
membranes were operated at a flux of 20 L/(m2*h).
Rejection was calculated as follows:
R ¼ 1� cpcf
(2)
with cp and cf being the permeate and feed concentration
respectively.
2.1.4. Fouling protocol2.1.4.1. Model foulants. Sodium alginate and Bovine Serum
Albumine (BSA) were used as model foulants in this study. FO
membrane fouling was induced by filtration of a solution
containing 200 mg/L of either sodium alginate or BSA. The
draw solution was a 3 M NaCl solution, the duration of the
fouling run was 10 h. The flux was on average 9.3 L/(m2*h) for
the cleanmembrane test, and for the BSA and alginate fouling
tests 8.8 L/(m2*h) and 8.5 L/(m2*h) respectively.
2.1.4.2. Long term biofouling and analysis. Biofouling was
induced by incubating the feed spacer for 24 h in a solution of
10 mL settled activated sludge in 800 mL of water. The sludge
was acquired from themunicipal wastewater treatment plant
Ossemeersen, Ghent. After incubation, the spacer was gently
rinsed to remove any particulate matter. The feed during the
biofouling experiments was tap water, which was dechlori-
nated by dosing sodium metabisulfite (Na2S2O5) in a buffer
vessel at a concentration of 1.5 mg/L, residence time in the
buffer vessel was 20 min. The feed was also spiked with so-
dium acetate at a concentration of 100 mg/L after the buffer
vessel outlet, which was chosen as an easily assimilable
organic compound (AOC) as a substrate for biofilm growth.
The draw solution was a 0.5 M sodium chloride solution. The
feed solution was single use, except during the TOrCs rejec-
tion tests. The draw solution was continuously recirculated; it
was never discharged and refilled.
The growth of the biofilm was monitored visually and by
measuring the pressure drop over both the feed and draw
spacer channels. The pressure drop increasewas calculated as
a ratio of the pressure drop compared to the initial pressure
drop, in which the initial pressure drop is an average of the
pressure drop measured during the first two days of the
experiment.
is dechlorinated using sodiummetabisulfite (9) and stored
), sodium acetate is spiked (7), the feed is not recirculated.
e kept constant by a Biostat B (4), by dosing a concentrated
e excess draw solution is weighed and logged (1).
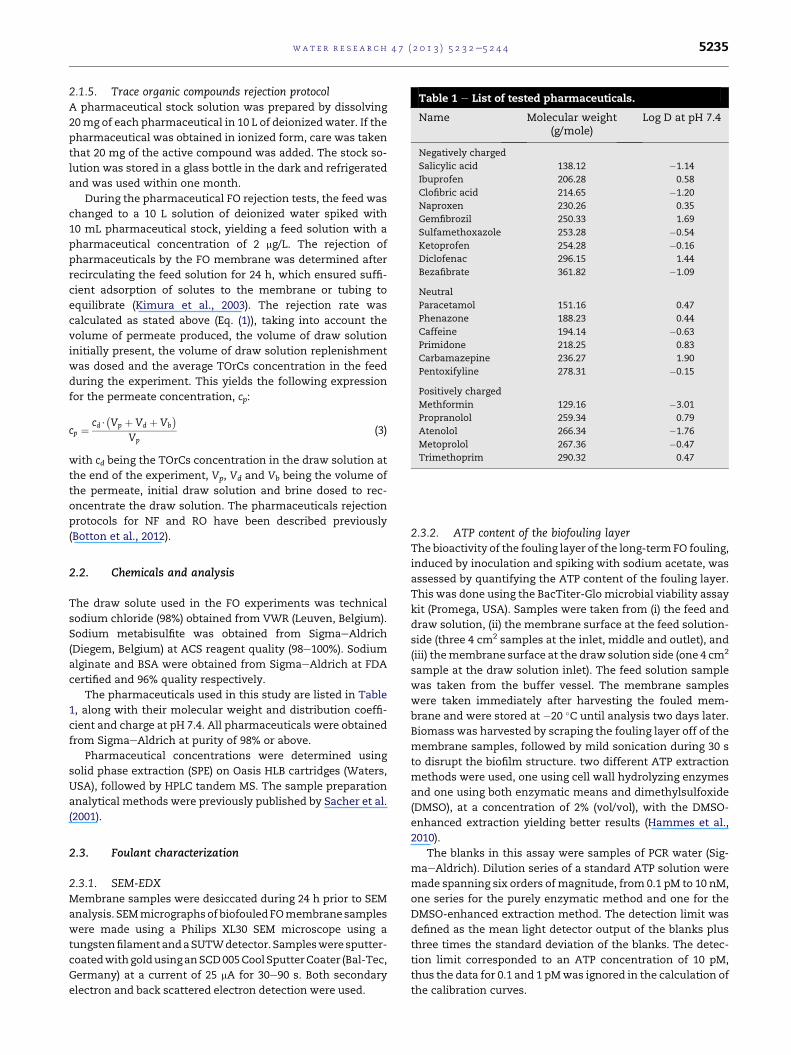
Table 1 e List of tested pharmaceuticals.
Name Molecular weight(g/mole)
Log D at pH 7.4
Negatively charged
Salicylic acid 138.12 �1.14
Ibuprofen 206.28 0.58
Clofibric acid 214.65 �1.20
Naproxen 230.26 0.35
Gemfibrozil 250.33 1.69
Sulfamethoxazole 253.28 �0.54
Ketoprofen 254.28 �0.16
Diclofenac 296.15 1.44
Bezafibrate 361.82 �1.09
Neutral
Paracetamol 151.16 0.47
Phenazone 188.23 0.44
Caffeine 194.14 �0.63
Primidone 218.25 0.83
Carbamazepine 236.27 1.90
Pentoxifyline 278.31 �0.15
Positively charged
Methformin 129.16 �3.01
Propranolol 259.34 0.79
Atenolol 266.34 �1.76
Metoprolol 267.36 �0.47
Trimethoprim 290.32 0.47
wat e r r e s e a r c h 4 7 ( 2 0 1 3 ) 5 2 3 2e5 2 4 4 5235
2.1.5. Trace organic compounds rejection protocolA pharmaceutical stock solution was prepared by dissolving
20mg of each pharmaceutical in 10 L of deionizedwater. If the
pharmaceutical was obtained in ionized form, care was taken
that 20 mg of the active compound was added. The stock so-
lution was stored in a glass bottle in the dark and refrigerated
and was used within one month.
During the pharmaceutical FO rejection tests, the feed was
changed to a 10 L solution of deionized water spiked with
10 mL pharmaceutical stock, yielding a feed solution with a
pharmaceutical concentration of 2 mg/L. The rejection of
pharmaceuticals by the FO membrane was determined after
recirculating the feed solution for 24 h, which ensured suffi-
cient adsorption of solutes to the membrane or tubing to
equilibrate (Kimura et al., 2003). The rejection rate was
calculated as stated above (Eq. (1)), taking into account the
volume of permeate produced, the volume of draw solution
initially present, the volume of draw solution replenishment
was dosed and the average TOrCs concentration in the feed
during the experiment. This yields the following expression
for the permeate concentration, cp:
cp ¼cd$
�Vp þ Vd þ Vb
�Vp
(3)
with cd being the TOrCs concentration in the draw solution at
the end of the experiment, Vp, Vd and Vb being the volume of
the permeate, initial draw solution and brine dosed to rec-
oncentrate the draw solution. The pharmaceuticals rejection
protocols for NF and RO have been described previously
(Botton et al., 2012).
2.2. Chemicals and analysis
The draw solute used in the FO experiments was technical
sodium chloride (98%) obtained from VWR (Leuven, Belgium).
Sodium metabisulfite was obtained from SigmaeAldrich
(Diegem, Belgium) at ACS reagent quality (98e100%). Sodium
alginate and BSA were obtained from SigmaeAldrich at FDA
certified and 96% quality respectively.
The pharmaceuticals used in this study are listed in Table
1, along with their molecular weight and distribution coeffi-
cient and charge at pH 7.4. All pharmaceuticals were obtained
from SigmaeAldrich at purity of 98% or above.
Pharmaceutical concentrations were determined using
solid phase extraction (SPE) on Oasis HLB cartridges (Waters,
USA), followed by HPLC tandem MS. The sample preparation
analytical methods were previously published by Sacher et al.
(2001).
2.3. Foulant characterization
2.3.1. SEM-EDXMembrane samples were desiccated during 24 h prior to SEM
analysis. SEMmicrographsof biofouledFOmembranesamples
were made using a Philips XL30 SEM microscope using a
tungstenfilamentandaSUTWdetector. Samplesweresputter-
coatedwithgoldusinganSCD005CoolSputterCoater (Bal-Tec,
Germany) at a current of 25 mA for 30e90 s. Both secondary
electron and back scattered electron detection were used.
2.3.2. ATP content of the biofouling layerThe bioactivity of the fouling layer of the long-term FO fouling,
induced by inoculation and spiking with sodium acetate, was
assessed by quantifying the ATP content of the fouling layer.
This was done using the BacTiter-Glo microbial viability assay
kit (Promega, USA). Samples were taken from (i) the feed and
draw solution, (ii) the membrane surface at the feed solution-
side (three 4 cm2 samples at the inlet, middle and outlet), and
(iii) themembrane surface at the draw solution side (one 4 cm2
sample at the draw solution inlet). The feed solution sample
was taken from the buffer vessel. The membrane samples
were taken immediately after harvesting the fouled mem-
brane and were stored at �20 �C until analysis two days later.
Biomass was harvested by scraping the fouling layer off of the
membrane samples, followed by mild sonication during 30 s
to disrupt the biofilm structure. two different ATP extraction
methods were used, one using cell wall hydrolyzing enzymes
and one using both enzymatic means and dimethylsulfoxide
(DMSO), at a concentration of 2% (vol/vol), with the DMSO-
enhanced extraction yielding better results (Hammes et al.,
2010).
The blanks in this assay were samples of PCR water (Sig-
maeAldrich). Dilution series of a standard ATP solution were
made spanning six orders ofmagnitude, from 0.1 pM to 10 nM,
one series for the purely enzymatic method and one for the
DMSO-enhanced extraction method. The detection limit was
defined as the mean light detector output of the blanks plus
three times the standard deviation of the blanks. The detec-
tion limit corresponded to an ATP concentration of 10 pM,
thus the data for 0.1 and 1 pMwas ignored in the calculation of
the calibration curves.
wat e r r e s e a r c h 4 7 ( 2 0 1 3 ) 5 2 3 2e5 2 4 45236
2.4. Modeling of TOrCs build-up in closed loopapplications
To investigate the effect of this build-up on the final TOrC
concentration in the produced potable water, the concentra-
tion of trace organics in the draw solution of the FO and in the
RO permeate were modeled as a function of cycle time.
For a more elaborate description of the derivation of the
below mentioned equations and assumptions made in this
model, the reader is referred to the supplementary
information.
Solute transport through a densemembrane can occur due
to diffusion, convection, or a combination of both, as will be
clearly shown in the results below. For all transport mecha-
nisms, the FO permeate solute concentration is defined as:
cp ¼< Js > =< Jw >with<Js> and<Jw> being the average solute
and water flux respectively.
For diffusive transport, the solute flux is given by Fick’s law
of diffusion:
Js ¼ �Dm;s$dcdx
(4)
with �Dm,s the solute diffusion coefficient in the membrane
phase. Integration across the membrane and rearranging
leads to the following equation for the solute concentration in
the FO permeate, cp:
cp ¼B�cf � csð1� yÞ�Jw þ B$y
(5)
in which B ¼ Dm;s$ε=Dx is the solute mass transfer coefficient,
cf and cs the initial solute concentration present in the feed
and in the draw solution prior to dilution by FO respectively,
and y the fraction of draw solution originating from permeate.
In the case of convective transport, the solute concentra-
tion in the permeate is given by:
cp ¼ Kc;s$cf (6)
When both convection and diffusion contribute to solute
transport, the FO permeate solute concentration is given by:
cp¼ Js;diffusionþ Js;convectionJw
¼B�cf �csð1�yÞ�JwþB$y
þKc;s$cf (7)
In this model, the RO rejection rate was assumed to be
constant, regardless of the solute concentration in the draw
solution. The solute concentration in the RO permeate is then
given by:
cp;RO ¼ ð1� RROÞ$cd (8)
with cp,RO and cd the solute RO permeate and draw solution
concentration respectively, and RRO the solute RO rejection
rate. The solute concentration in the RO concentrate is given
by:
cconc ¼ RRO$cd1� y
(9)
The solute concentration in the RO concentrate, cconc, of
cycle t is then substituted in equation (4) or 6 as cs of cycle tþ 1.
The model was solved recursively in Excel 2010 and as a
steady-state in Matlab 7.13.
3. Results
3.1. TOrCs rejection by clean FO, NF and RO membranes
The draw solution in FO processes can be reconcentrated
using NF (when divalent salts or nanoparticles are the draw
solute) or RO membranes. This implies that the trace
contaminant concentration in the final product water is not
only determined by FO rejection, but by the reconcentration
system rejection as well. For this reason, the TOrCs rejection
was compared between FO, NF and RO.
TOrCs rejection in NF and RO is governed by different
processes, which can be broadly divided in steric, electric and
dielectric phenomena. Steric hindrance is an important
mechanism, as has been demonstrated in multiple studies
(Fujioka et al., 2012; Nghiem et al., 2010). Steric hindrance is
dependent on both solute size and pore size, as well as on
solute geometry. A second rejection mechanism is electro-
static repulsion, which is of importance for polyamide mem-
branes, as their surface contains ionizable functional groups.
Charged solutes are rejected by a charged membrane either
due to the solute and membrane having the same charge
(Nghiem et al., 2006), or by Donnan exclusion. Electrostatic
repulsion also influences steric hindrance, because the charge
of functional groups at the membrane surface can alter the
conformation of polymer chains. Electrostatic repulsion is
believed to cause shrinking of the membrane pores by some
authors (Childress and Elimelech, 2000), due to polymer
chains adopting an extended conformation, while other
studies have found increased pore sizes when the active layer
became charged (Bellona et al., 2004). Solute-membrane af-
finity also influences rejection by changing the partitioning of
the solute in the membrane matrix, as was noted and incor-
porated in models in several studies (Fujioka et al., 2012;
Verliefde et al., 2009a, 2009b). As most polyamide mem-
branes are moderately hydrophobic, as shown by their water
contact angle, hydrophobic solutes are absorbed in the
membrane matrix. Very hydrophobic solutes (log Kow > 4)
show a high rejection initially, due to absorption, followed by
a breakthrough as the membrane becomes saturated with the
solute (Bellona et al., 2004).
The water flux of the FO was set at 9.3 L/(m2*h), while the
NF and RO flux were set at 20 L/(m2*h). The higher flux in the
NF and RO influences rejection, but it was deemed realistic in
practical applications, because a diluted draw solution should
not contain any appreciable amount of natural organicmatter
or inorganic foulants. Thus, a higher NF and RO flux would be
feasible and would limit capital expenditure when con-
structing an FO-MBR.
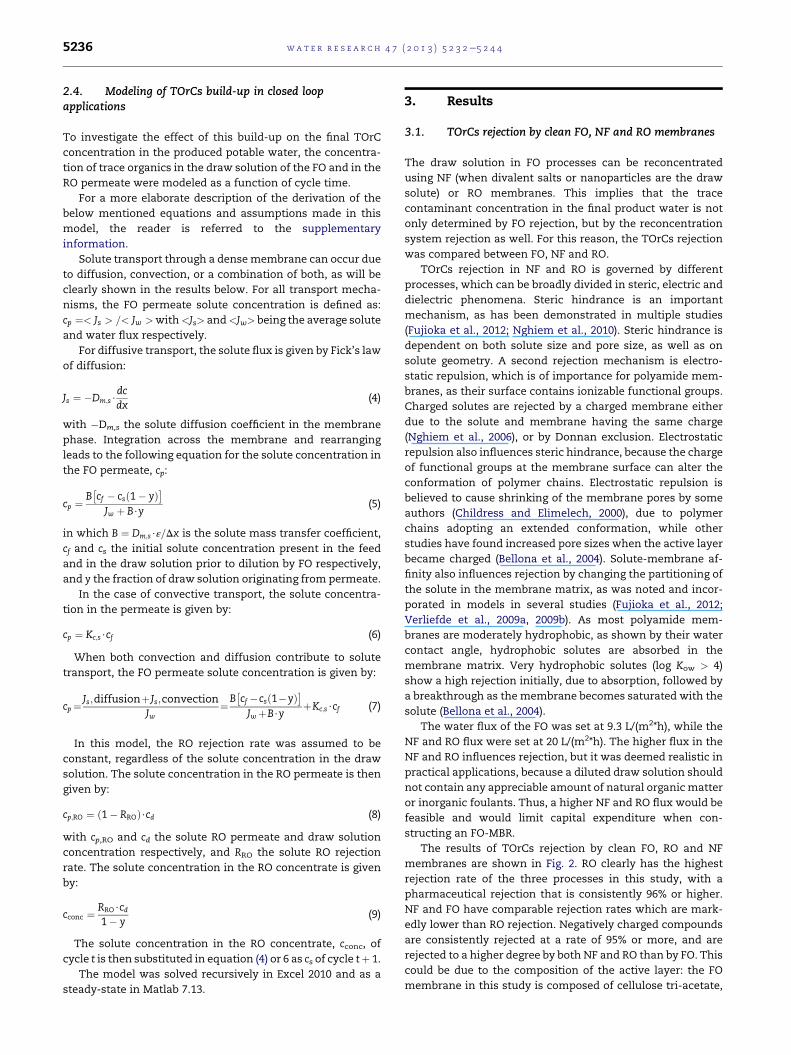
The results of TOrCs rejection by clean FO, RO and NF
membranes are shown in Fig. 2. RO clearly has the highest
rejection rate of the three processes in this study, with a
pharmaceutical rejection that is consistently 96% or higher.
NF and FO have comparable rejection rates which are mark-
edly lower than RO rejection. Negatively charged compounds
are consistently rejected at a rate of 95% or more, and are
rejected to a higher degree by both NF and RO than by FO. This
could be due to the composition of the active layer: the FO
membrane in this study is composed of cellulose tri-acetate,
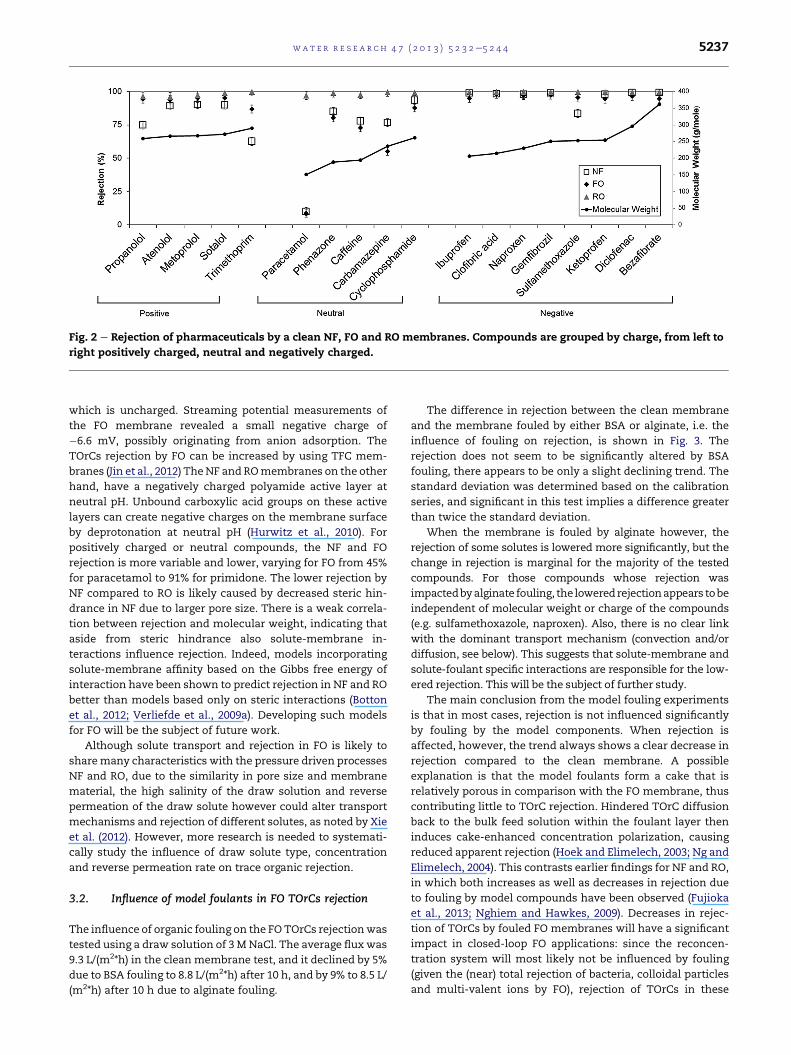
Fig. 2 e Rejection of pharmaceuticals by a clean NF, FO and RO membranes. Compounds are grouped by charge, from left to
right positively charged, neutral and negatively charged.
wat e r r e s e a r c h 4 7 ( 2 0 1 3 ) 5 2 3 2e5 2 4 4 5237
which is uncharged. Streaming potential measurements of
the FO membrane revealed a small negative charge of
�6.6 mV, possibly originating from anion adsorption. The
TOrCs rejection by FO can be increased by using TFC mem-
branes (Jin et al., 2012) TheNF and ROmembranes on the other
hand, have a negatively charged polyamide active layer at
neutral pH. Unbound carboxylic acid groups on these active
layers can create negative charges on the membrane surface
by deprotonation at neutral pH (Hurwitz et al., 2010). For
positively charged or neutral compounds, the NF and FO
rejection is more variable and lower, varying for FO from 45%
for paracetamol to 91% for primidone. The lower rejection by
NF compared to RO is likely caused by decreased steric hin-
drance in NF due to larger pore size. There is a weak correla-
tion between rejection and molecular weight, indicating that
aside from steric hindrance also solute-membrane in-
teractions influence rejection. Indeed, models incorporating
solute-membrane affinity based on the Gibbs free energy of
interaction have been shown to predict rejection in NF and RO
better than models based only on steric interactions (Botton
et al., 2012; Verliefde et al., 2009a). Developing such models
for FO will be the subject of future work.
Although solute transport and rejection in FO is likely to
sharemany characteristics with the pressure driven processes
NF and RO, due to the similarity in pore size and membrane
material, the high salinity of the draw solution and reverse
permeation of the draw solute however could alter transport
mechanisms and rejection of different solutes, as noted by Xie
et al. (2012). However, more research is needed to systemati-
cally study the influence of draw solute type, concentration
and reverse permeation rate on trace organic rejection.
3.2. Influence of model foulants in FO TOrCs rejection
The influence of organic fouling on the FO TOrCs rejectionwas
tested using a draw solution of 3 MNaCl. The average fluxwas
9.3 L/(m2*h) in the clean membrane test, and it declined by 5%
due to BSA fouling to 8.8 L/(m2*h) after 10 h, and by 9% to 8.5 L/
(m2*h) after 10 h due to alginate fouling.
The difference in rejection between the clean membrane
and the membrane fouled by either BSA or alginate, i.e. the
influence of fouling on rejection, is shown in Fig. 3. The
rejection does not seem to be significantly altered by BSA
fouling, there appears to be only a slight declining trend. The
standard deviation was determined based on the calibration
series, and significant in this test implies a difference greater
than twice the standard deviation.
When the membrane is fouled by alginate however, the
rejection of some solutes is lowered more significantly, but the
change in rejection is marginal for the majority of the tested
compounds. For those compounds whose rejection was
impactedbyalginate fouling, the loweredrejectionappears tobe
independent of molecular weight or charge of the compounds
(e.g. sulfamethoxazole, naproxen). Also, there is no clear link
with the dominant transport mechanism (convection and/or
diffusion, see below). This suggests that solute-membrane and
solute-foulant specific interactions are responsible for the low-
ered rejection. This will be the subject of further study.
The main conclusion from the model fouling experiments
is that in most cases, rejection is not influenced significantly
by fouling by the model components. When rejection is
affected, however, the trend always shows a clear decrease in
rejection compared to the clean membrane. A possible
explanation is that the model foulants form a cake that is
relatively porous in comparison with the FO membrane, thus
contributing little to TOrC rejection. Hindered TOrC diffusion
back to the bulk feed solution within the foulant layer then
induces cake-enhanced concentration polarization, causing
reduced apparent rejection (Hoek and Elimelech, 2003; Ng and
Elimelech, 2004). This contrasts earlier findings for NF and RO,
in which both increases as well as decreases in rejection due
to fouling by model compounds have been observed (Fujioka
et al., 2013; Nghiem and Hawkes, 2009). Decreases in rejec-
tion of TOrCs by fouled FO membranes will have a significant
impact in closed-loop FO applications: since the reconcen-
tration system will most likely not be influenced by fouling
(given the (near) total rejection of bacteria, colloidal particles
and multi-valent ions by FO), rejection of TOrCs in these
-40
-30
-20
-10 0 10
Rejection (%)
BSAAlginate
Fig. 3 e Change in FO rejection after membrane fouling by
alginate or BSA, compared to clean FO rejection. A negative
wat e r r e s e a r c h 4 7 ( 2 0 1 3 ) 5 2 3 2e5 2 4 45238
reconcentration systems will be constant. If rejection values
of the FO decline, build-up of TOrCs in the draw solution will
be even higher, leading to an evenmore compromised “double
barrier” system.
3.3. Biofouling in FO
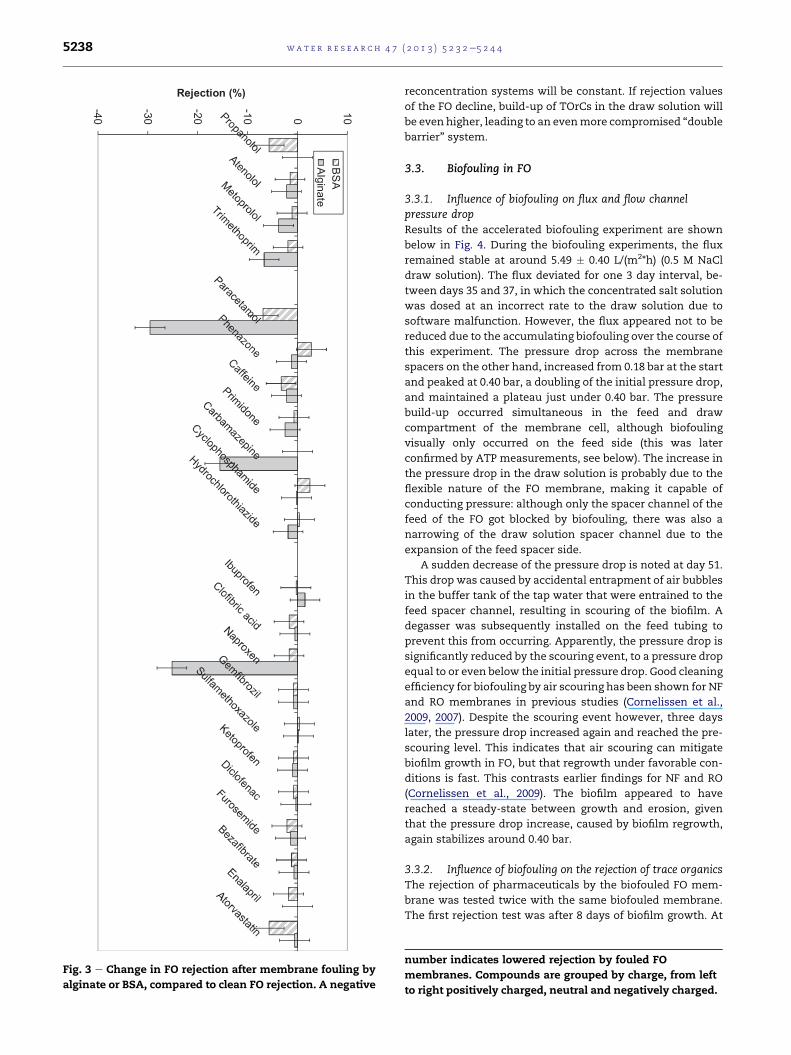
3.3.1. Influence of biofouling on flux and flow channelpressure dropResults of the accelerated biofouling experiment are shown
below in Fig. 4. During the biofouling experiments, the flux
remained stable at around 5.49 � 0.40 L/(m2*h) (0.5 M NaCl
draw solution). The flux deviated for one 3 day interval, be-
tween days 35 and 37, in which the concentrated salt solution
was dosed at an incorrect rate to the draw solution due to
software malfunction. However, the flux appeared not to be
reduced due to the accumulating biofouling over the course of
this experiment. The pressure drop across the membrane
spacers on the other hand, increased from 0.18 bar at the start
and peaked at 0.40 bar, a doubling of the initial pressure drop,
and maintained a plateau just under 0.40 bar. The pressure
build-up occurred simultaneous in the feed and draw
compartment of the membrane cell, although biofouling
visually only occurred on the feed side (this was later
confirmed by ATP measurements, see below). The increase in
the pressure drop in the draw solution is probably due to the
flexible nature of the FO membrane, making it capable of
conducting pressure: although only the spacer channel of the
feed of the FO got blocked by biofouling, there was also a
narrowing of the draw solution spacer channel due to the
expansion of the feed spacer side.
A sudden decrease of the pressure drop is noted at day 51.
This drop was caused by accidental entrapment of air bubbles
in the buffer tank of the tap water that were entrained to the
feed spacer channel, resulting in scouring of the biofilm. A
degasser was subsequently installed on the feed tubing to
prevent this from occurring. Apparently, the pressure drop is
significantly reduced by the scouring event, to a pressure drop
equal to or even below the initial pressure drop. Good cleaning
efficiency for biofouling by air scouring has been shown for NF
and RO membranes in previous studies (Cornelissen et al.,
2009, 2007). Despite the scouring event however, three days
later, the pressure drop increased again and reached the pre-
scouring level. This indicates that air scouring can mitigate
biofilm growth in FO, but that regrowth under favorable con-
ditions is fast. This contrasts earlier findings for NF and RO
(Cornelissen et al., 2009). The biofilm appeared to have
reached a steady-state between growth and erosion, given
that the pressure drop increase, caused by biofilm regrowth,
again stabilizes around 0.40 bar.
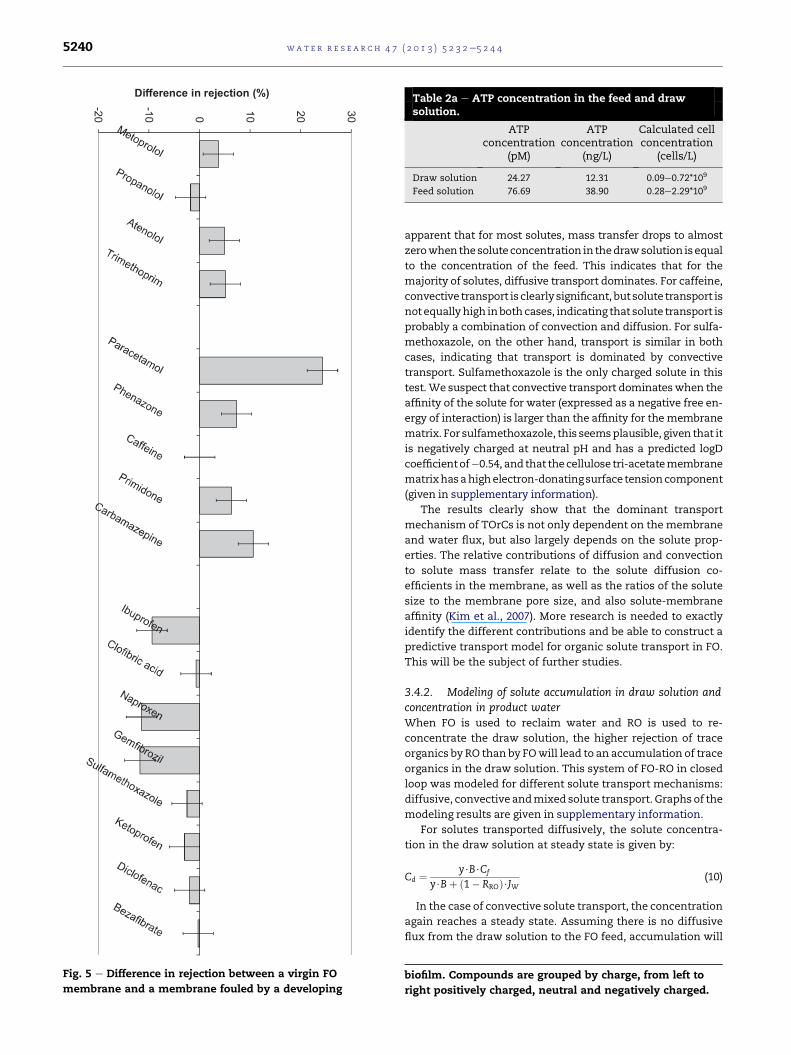
3.3.2. Influence of biofouling on the rejection of trace organicsThe rejection of pharmaceuticals by the biofouled FO mem-
brane was tested twice with the same biofouled membrane.
The first rejection test was after 8 days of biofilm growth. At
number indicates lowered rejection by fouled FO
membranes. Compounds are grouped by charge, from left
to right positively charged, neutral and negatively charged.
Fig. 4 e Flux and pressure drop increase across feed and
draw spacers caused by biofilm growth.
wat e r r e s e a r c h 4 7 ( 2 0 1 3 ) 5 2 3 2e5 2 4 4 5239
that time the biofilm formation was still ongoing, as is shown
by the increasing pressure drop, and the biofilm thicknesswas
hypothesized to still be relatively small. The second rejection
test was performed 49 days after the start of the experiment.
At that point, biofilm formation had almost reached a steady
state, as discussed above. The results of the first test are given
in Fig. 5 relative to the difference in rejection with the clean
membrane (a negative rejection indicating a decrease in
rejection compared to the cleanmembrane). The results of the
second test are given in supplementary information. The
presence of a developing biofilm appears to slightly alter
TOrCs rejection, leading to a slightly higher rejection of
neutral solutes and a lower rejection of some negatively
charged solutes. For positively charged compounds, no clear
trend can be seen. A fully developed biofilm caused a more
pronounced reduction in the rejection of positively charged
compounds and a less clear trend in the rejection of negatively
charged compounds compared to the developing biofilm.
Differences in TOrCs rejection behavior of the two biofilm
growth stages is likely due to differences in the composition of
the extracellular matrix and bacterial cell walls. The relatively
minor differences in TOrCs rejection, lead to the conclusion
that biofilm formation only has a limited impact on FO
rejection, which appears to corroborate findings from NF and
ROmembranes (Botton et al., 2012). The difference in rejection
by a clean membrane and rejection by a biofouled membrane
is for the majority of compounds 10% or less. Hancock et al.
(2011) also noticed an increased TOrCs rejection by an FO
membrane fouled by activated sludge in the case of non-ionic
compounds. The high rejection of charged compounds by FO
was confirmed in this study as well.
3.3.3. Biofilm characterizationThe ATP concentration of the feed and draw solution are
shown in Table 2a, the ATP concentration of the biofilm
samples are shown in Table 2b. The biofilmwas sampled upon
harvesting, 67 days after the start of the experiment. A num-
ber of studies have correlated ATP measurements in fresh
water and drinkingwater environments to cell concentrations
(Berney et al., 2008; Hammes et al., 2010; van der Wielen and
van der Kooij, 2010), these estimates range from about
1.7*10�17 to 13.7*10�17 g ATP/cell. Possible cell concentrations
are calculated based on this range.
van der Wielen and van der Kooij (2010) studied ATP con-
centrations in unchlorinated drinking water in the
Netherlands, and reported ATP concentrations ranging from
0.32 ng/L to 28.0 ng/L Berney et al. (2008) reported ATP con-
centrations of 0.016e0.055 ng/L in unchlorinated drinking
water in Switzerland. These concentrations are considerably
lower than the feed ATP concentration of this test. A possible
explanation is that the feed in this test was potable fresh
water, but it was stored in a large underground buffer during
two days prior to use. Furthermore, the feed was sampled in
the dechlorination buffer vessel of the experimental setup.
Additional microbial growth in this vessel could further in-
crease the amount of active microbial biomass. Growth of
biomass in the feed lines was visually confirmed.
Sodium acetate was chosen as a model AOC and was
spiked in the feed as a nutrient for biofilm development. The
ATP concentration in the biofilm samples show that the ATP
content of the biofilm lowers as the distance to the sodium
acetate solution inlet increases. This indicates that the AOC
was being metabolized as the feed passes over the biofilm.
The draw side of the membrane remained devoid of any
visible biofilm formation during the entire experiment, and
the ATP concentration of the draw solution and the draw so-
lution side membrane sample confirm the low microbial ac-
tivity. The low microbial activity can be due to a lack of
nutrients, a lack of suitable inoculum, or both. The initial draw
solution consisted of a 0.5 MNaCl solution whichwasmade in
deionized water, a solution which can be considered low in
both nutrients and inoculum.
SEM micrographs showed a fully developed biofilm, in
which a large numbers of ellipsoidal particles of approxi-
mately 10 mm length are embedded (Fig. 6). It was suspected
that the particles were eukaryotic organisms, possibly di-
atoms. DAPI staining, in which DAPI preferentially binds to
double-stranded DNA, and DICmicroscopy confirmed that the
particles were indeed eukaryotic organisms (micrograph
given in supplementary information). EDX analysis results
showed a high iron and silica content of the biofilm, spectra
are also shown in supplementary information.
3.4. Transport mechanisms and draw concentrationmodeling
3.4.1. Diffusive versus convective transportTo investigate FO transport mechanisms and differentiate
between diffusive and convective transport of pharmaceuti-
cals, an experiment was carried out in which pharmaceuticals
were only spiked in the feed solution in one run, and then in
both the feed and draw solutions in similar concentrations in
the next run. In case solute transport would only be occurring
by diffusive transport, there would be no net mass transfer of
the solute from the feed to the draw solution when the solute
is present in equimolar quantities in both solutions. This fol-
lows fromFick’s law of diffusion, inwhich the driving force for
mass transfer is a gradient in concentration, as in Equation (1).
In the case transport is purely convective, there would be
mass transfer of the solute in the same direction as the solvent
flux in both cases (i.e., when the feed concentration is higher or
equal to than the draw solution concentration). The results of
themass transfer tests are plotted in Fig. 7. From the figure, it is
-20
-10 0 10 20 30
Difference in rejection (%)
Fig. 5 e Difference in rejection between a virgin FO
membrane and a membrane fouled by a developing
Table 2a e ATP concentration in the feed and drawsolution.
ATPconcentration
(pM)
ATPconcentration
(ng/L)
Calculated cellconcentration
(cells/L)
Draw solution 24.27 12.31 0.09e0.72*109
Feed solution 76.69 38.90 0.28e2.29*109
wat e r r e s e a r c h 4 7 ( 2 0 1 3 ) 5 2 3 2e5 2 4 45240
apparent that for most solutes, mass transfer drops to almost
zerowhenthesolute concentration in thedrawsolution isequal
to the concentration of the feed. This indicates that for the
majority of solutes, diffusive transport dominates. For caffeine,
convective transport is clearlysignificant, but solute transport is
not equallyhigh inbothcases, indicating that solute transport is
probably a combination of convection and diffusion. For sulfa-
methoxazole, on the other hand, transport is similar in both
cases, indicating that transport is dominated by convective
transport. Sulfamethoxazole is the only charged solute in this
test.We suspect that convective transport dominateswhen the
affinity of the solute for water (expressed as a negative free en-
ergy of interaction) is larger than the affinity for themembrane
matrix. For sulfamethoxazole, this seemsplausible, given that it
is negatively charged at neutral pH and has a predicted logD
coefficientof�0.54, and that thecellulose tri-acetatemembrane
matrixhasahighelectron-donatingsurface tensioncomponent
(given in supplementary information).
The results clearly show that the dominant transport
mechanism of TOrCs is not only dependent on the membrane
and water flux, but also largely depends on the solute prop-
erties. The relative contributions of diffusion and convection
to solute mass transfer relate to the solute diffusion co-
efficients in the membrane, as well as the ratios of the solute
size to the membrane pore size, and also solute-membrane
affinity (Kim et al., 2007). More research is needed to exactly
identify the different contributions and be able to construct a
predictive transport model for organic solute transport in FO.
This will be the subject of further studies.
3.4.2. Modeling of solute accumulation in draw solution andconcentration in product waterWhen FO is used to reclaim water and RO is used to re-
concentrate the draw solution, the higher rejection of trace
organics by RO than by FOwill lead to an accumulation of trace
organics in the draw solution. This system of FO-RO in closed
loop was modeled for different solute transport mechanisms:
diffusive, convective andmixed solute transport. Graphsof the
modeling results are given in supplementary information.
For solutes transported diffusively, the solute concentra-
tion in the draw solution at steady state is given by:
Cd ¼y$B$Cf
y$Bþ ð1� RROÞ$JW (10)
In the case of convective solute transport, the concentration
again reaches a steady state. Assuming there is no diffusive
flux from the draw solution to the FO feed, accumulation will
biofilm. Compounds are grouped by charge, from left to
right positively charged, neutral and negatively charged.
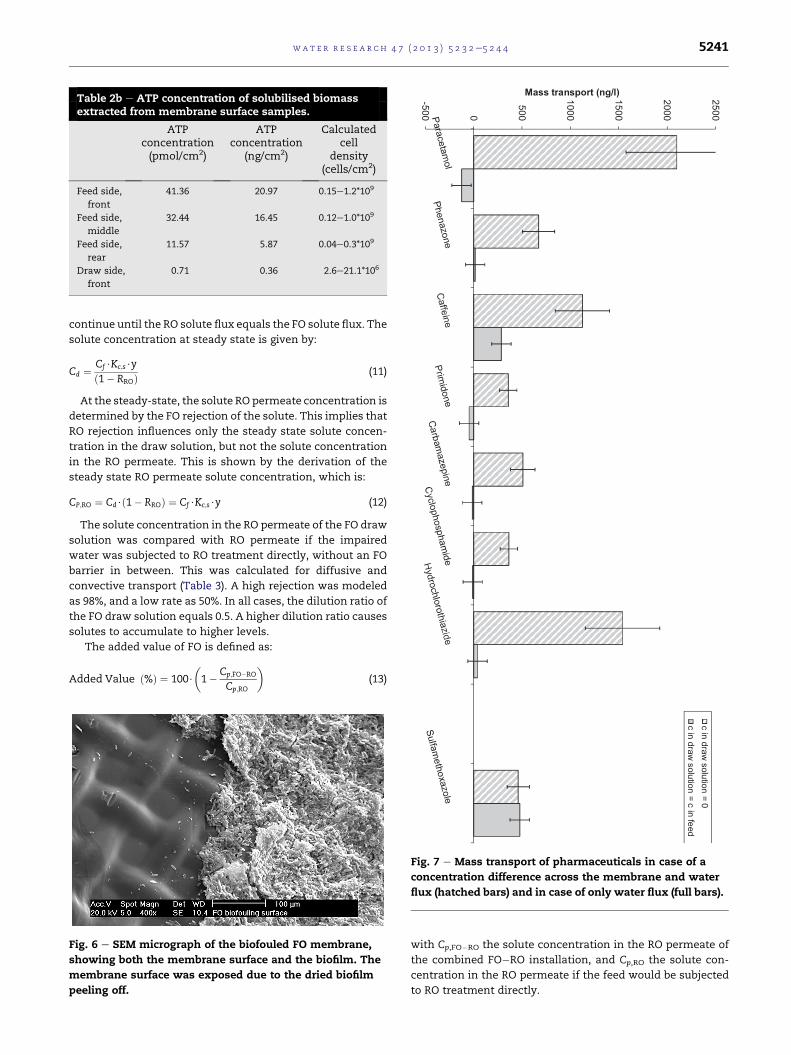
Table 2b e ATP concentration of solubilised biomassextracted from membrane surface samples.
ATPconcentration(pmol/cm2)
ATPconcentration
(ng/cm2)
Calculatedcell
density(cells/cm2)
Feed side,
front
41.36 20.97 0.15e1.2*109
Feed side,
middle
32.44 16.45 0.12e1.0*109
Feed side,
rear
11.57 5.87 0.04e0.3*109
Draw side,
front
0.71 0.36 2.6e21.1*106
-500 0
500
1000
1500
2000
2500
Mass transport (ng/l)
wat e r r e s e a r c h 4 7 ( 2 0 1 3 ) 5 2 3 2e5 2 4 4 5241
continue until the RO solute flux equals the FO solute flux. The
solute concentration at steady state is given by:
Cd ¼ Cf$Kc;s$y
ð1� RROÞ (11)
At the steady-state, the solute RO permeate concentration is
determined by the FO rejection of the solute. This implies that
RO rejection influences only the steady state solute concen-
tration in the draw solution, but not the solute concentration
in the RO permeate. This is shown by the derivation of the
steady state RO permeate solute concentration, which is:
CP;RO ¼ Cd$ð1� RROÞ ¼ Cf$Kc;s$y (12)
The solute concentration in the RO permeate of the FO draw
solution was compared with RO permeate if the impaired
water was subjected to RO treatment directly, without an FO
barrier in between. This was calculated for diffusive and
convective transport (Table 3). A high rejection was modeled
as 98%, and a low rate as 50%. In all cases, the dilution ratio of
the FO draw solution equals 0.5. A higher dilution ratio causes
solutes to accumulate to higher levels.
The added value of FO is defined as:
Added Value ð%Þ ¼ 100$
�1� Cp;FO�RO
Cp;RO
�(13)
Fig. 6 e SEM micrograph of the biofouled FO membrane,
showing both the membrane surface and the biofilm. The
membrane surface was exposed due to the dried biofilm
peeling off.
c in draw solution = 0
c in draw solution = c in feed
Fig. 7 e Mass transport of pharmaceuticals in case of a
concentration difference across the membrane and water
flux (hatched bars) and in case of only water flux (full bars).
with Cp,FO�RO the solute concentration in the RO permeate of
the combined FO�RO installation, and Cp,RO the solute con-
centration in the RO permeate if the feed would be subjected
to RO treatment directly.
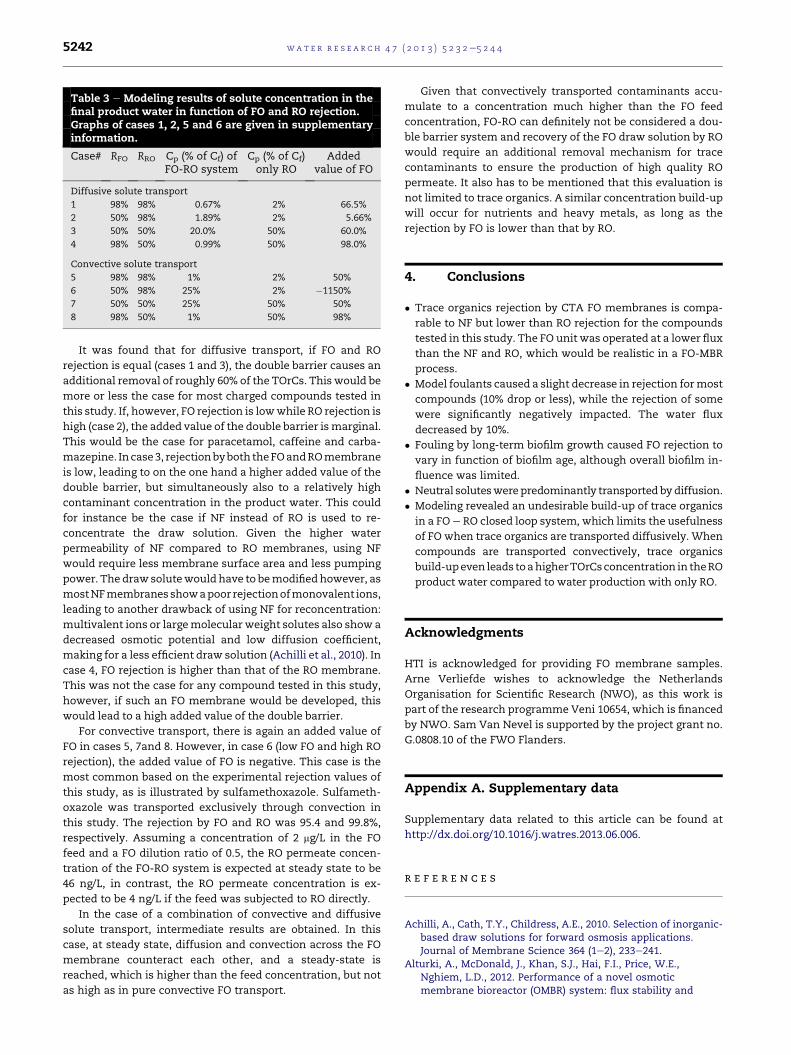
Table 3 e Modeling results of solute concentration in thefinal product water in function of FO and RO rejection.Graphs of cases 1, 2, 5 and 6 are given in supplementaryinformation.
Case# RFO RRO Cp (% of Cf) ofFO-RO system
Cp (% of Cf)only RO
Addedvalue of FO
Diffusive solute transport
1 98% 98% 0.67% 2% 66.5%
2 50% 98% 1.89% 2% 5.66%
3 50% 50% 20.0% 50% 60.0%
4 98% 50% 0.99% 50% 98.0%
Convective solute transport
5 98% 98% 1% 2% 50%
6 50% 98% 25% 2% �1150%
7 50% 50% 25% 50% 50%
8 98% 50% 1% 50% 98%
wat e r r e s e a r c h 4 7 ( 2 0 1 3 ) 5 2 3 2e5 2 4 45242
It was found that for diffusive transport, if FO and RO
rejection is equal (cases 1 and 3), the double barrier causes an
additional removal of roughly 60% of the TOrCs. This would be
more or less the case for most charged compounds tested in
this study. If, however, FO rejection is lowwhile RO rejection is
high (case 2), the added value of the double barrier ismarginal.
This would be the case for paracetamol, caffeine and carba-
mazepine. Incase3, rejectionbyboth theFOandROmembrane
is low, leading to on the one hand a higher added value of the
double barrier, but simultaneously also to a relatively high
contaminant concentration in the product water. This could
for instance be the case if NF instead of RO is used to re-
concentrate the draw solution. Given the higher water
permeability of NF compared to RO membranes, using NF
would require less membrane surface area and less pumping
power. The draw solutewouldhave to bemodifiedhowever, as
mostNFmembranes showapoor rejectionofmonovalent ions,
leading to another drawback of using NF for reconcentration:
multivalent ions or largemolecular weight solutes also show a
decreased osmotic potential and low diffusion coefficient,
making for a less efficient draw solution (Achilli et al., 2010). In
case 4, FO rejection is higher than that of the RO membrane.
This was not the case for any compound tested in this study,
however, if such an FO membrane would be developed, this
would lead to a high added value of the double barrier.
For convective transport, there is again an added value of
FO in cases 5, 7and 8. However, in case 6 (low FO and high RO
rejection), the added value of FO is negative. This case is the
most common based on the experimental rejection values of
this study, as is illustrated by sulfamethoxazole. Sulfameth-
oxazole was transported exclusively through convection in
this study. The rejection by FO and RO was 95.4 and 99.8%,
respectively. Assuming a concentration of 2 mg/L in the FO
feed and a FO dilution ratio of 0.5, the RO permeate concen-
tration of the FO-RO system is expected at steady state to be
46 ng/L, in contrast, the RO permeate concentration is ex-
pected to be 4 ng/L if the feed was subjected to RO directly.
In the case of a combination of convective and diffusive
solute transport, intermediate results are obtained. In this
case, at steady state, diffusion and convection across the FO
membrane counteract each other, and a steady-state is
reached, which is higher than the feed concentration, but not
as high as in pure convective FO transport.
Given that convectively transported contaminants accu-
mulate to a concentration much higher than the FO feed
concentration, FO-RO can definitely not be considered a dou-
ble barrier system and recovery of the FO draw solution by RO
would require an additional removal mechanism for trace
contaminants to ensure the production of high quality RO
permeate. It also has to be mentioned that this evaluation is
not limited to trace organics. A similar concentration build-up
will occur for nutrients and heavy metals, as long as the
rejection by FO is lower than that by RO.
4. Conclusions
� Trace organics rejection by CTA FO membranes is compa-
rable to NF but lower than RO rejection for the compounds
tested in this study. The FO unit was operated at a lower flux
than the NF and RO, which would be realistic in a FO-MBR
process.
� Model foulants caused a slight decrease in rejection formost
compounds (10% drop or less), while the rejection of some
were significantly negatively impacted. The water flux
decreased by 10%.
� Fouling by long-term biofilm growth caused FO rejection to
vary in function of biofilm age, although overall biofilm in-
fluence was limited.
� Neutral soluteswerepredominantly transported by diffusion.
� Modeling revealed an undesirable build-up of trace organics
in a FOe RO closed loop system, which limits the usefulness
of FO when trace organics are transported diffusively. When
compounds are transported convectively, trace organics
build-upeven leads toahigherTOrCsconcentration in theRO
product water compared to water production with only RO.
Acknowledgments
HTI is acknowledged for providing FO membrane samples.
Arne Verliefde wishes to acknowledge the Netherlands
Organisation for Scientific Research (NWO), as this work is
part of the research programme Veni 10654, which is financed
by NWO. Sam Van Nevel is supported by the project grant no.
G.0808.10 of the FWO Flanders.
Appendix A. Supplementary data
Supplementary data related to this article can be found at
http://dx.doi.org/10.1016/j.watres.2013.06.006.
r e f e r e n c e s
Achilli, A., Cath, T.Y., Childress, A.E., 2010. Selection of inorganic-based draw solutions for forward osmosis applications.Journal of Membrane Science 364 (1e2), 233e241.
Alturki, A., McDonald, J., Khan, S.J., Hai, F.I., Price, W.E.,Nghiem, L.D., 2012. Performance of a novel osmoticmembrane bioreactor (OMBR) system: flux stability and
wat e r r e s e a r c h 4 7 ( 2 0 1 3 ) 5 2 3 2e5 2 4 4 5243
removal of trace organics. Bioresource Technology 113 (0),201e206.
Bellona, C., Drewes, J.E., Xu, P., Amy, G., 2004. Factors affectingthe rejection of organic solutes during NF/RO treatmentealiterature review. Water Research 38 (12), 2795e2809.
Berney, M., Vital, M., Hulshoff, I., Weilenmann, H.-U., Egli, T.,Hammes, F., 2008. Rapid, cultivation-independent assessmentof microbial viability in drinking water. Water Research 42(14), 4010e4018.
Botton, S., Verliefde, A.R.D., Quach, N.T., Cornelissen, E.R., 2012.Influence of biofouling on pharmaceuticals rejection in NFmembrane filtration. Water Research 46 (18), 5848e5860.
Bowen, W.R., Mohammad, A.W., Hilal, N., 1997. Characterisationof nanofiltration membranes for predictive purposes d use ofsalts, uncharged solutes and atomic force microscopy. Journalof Membrane Science 126 (1), 91e105.
Cath, T.Y., Childress, A.E., Elimelech, M., 2006. Forward osmosis:principles, applications, and recent developments. Journal ofMembrane Science 281 (1e2), 70e87.
Cath, T.Y., Hancock, N.T., Lundin, C.D., Hoppe-Jones, C.,Drewes, J.E., 2010. A multi-barrier osmotic dilution process forsimultaneous desalination and purification of impaired water.Journal of Membrane Science 362 (1e2), 417e426.
Childress, A.E., Elimelech, M., 2000. Relating nanofiltrationmembrane performance to membrane charge (Electrokinetic)characteristics. Environmental Science & Technology 34 (17),3710e3716.
Cornelissen,E.R.,Vrouwenvelder, J.S.,Heijman,S.G.J.,Viallefont,X.D.,Van Der Kooij, D., Wessels, L.P., 2007. Periodic air/water cleaningfor control of biofouling in spiral woundmembrane elements.Journal of Membrane Science 287 (1), 94e101.
Cornelissen, E.R., Harmsen, D., de Korte, K.F., Ruiken, C.J.,Qin, J.-J., Oo, H., Wessels, L.P., 2008. Membrane fouling andprocess performance of forward osmosis membranes onactivated sludge. Journal of Membrane Science 319 (1e2),158e168.
Cornelissen, E.R., Rebour, L., van der Kooij, D., Wessels, L.P., 2009.Optimization of air/water cleaning (AWC) in spiral woundelements. Desalination 236 (1e3), 266e272.
Daughton, C.G., Ternes, T.A., 1999. Pharmaceuticals and personalcare products in the environment: agents of subtle change?Environ Health Perspectives 107 (Suppl 6).
Fujioka, T., Nghiem, L.D., Khan, S.J., McDonald, J.A., Poussade, Y.,Drewes, J.E., 2012. Effects of feed solution characteristics onthe rejection of N-nitrosamines by reverse osmosismembranes. Journal of Membrane Science 409e410 (0), 66e74.
Fujioka, T., Khan, S.J., McDonald, J.A., Henderson, R.K.,Poussade, Y., Drewes, J.E., Nghiem, L.D., 2013. Effects ofmembrane fouling on N-nitrosamine rejection bynanofiltration and reverse osmosis membranes. Journal ofMembrane Science 427 (0), 311e319.
Giwercman, A., 2011. Estrogens and phytoestrogens in maleinfertility. Current Opinion in Urology 21 (6), 519e526.
Hammes, F., Goldschmidt, F., Vital, M., Wang, Y., Egli, T., 2010.Measurement and interpretation of microbial adenosine tri-phosphate (ATP) in aquatic environments. Water Research 44(13), 3915e3923.
Hancock, N.T., Xu, P., Heil, D.M., Bellona, C., Cath, T.Y., 2011.Comprehensive bench- and pilot-scale investigation of traceorganic compounds rejection by forward osmosis.Environmental Science & Technology 45 (19), 8483e8490.
Hoek, E.M.V., Elimelech, M., 2003. Cake-enhanced concentrationPolarization: a new fouling mechanism for salt-rejectingmembranes. Environmental Science & Technology 37 (24),5581e5588.
Holloway, R.W., Childress, A.E., Dennett, K.E., Cath, T.Y., 2007.Forward osmosis for concentration of anaerobic digestercentrate. Water Research 41 (17), 4005e4014.
Hurwitz, G., Guillen, G.R., Hoek, E.M.V., 2010. Probing polyamidemembrane surface charge, zeta potential, wettability, andhydrophilicity with contact angle measurements. Journal ofMembrane Science 349 (1e2), 349e357.
Jin, X., Shan, J., Wang, C., Wei, J., Tang, C.Y., 2012. Rejection ofpharmaceuticals by forward osmosis membranes. Journal ofHazardous Materials (0).
Kim, T.-U., Drewes, J.E., Scott Summers, R., Amy, G.L., 2007. Solutetransport model for trace organic neutral and chargedcompounds through nanofiltration and reverse osmosismembranes. Water Research 41 (17), 3977e3988.
Kimura, K., Amy, G., Drewes, J., Watanabe, Y., 2003. Adsorption ofhydrophobic compounds onto NF/RO membranes: an artifactleading to overestimation of rejection. Journal of MembraneScience 221 (1e2), 89e101.
Markey, C.M., Rubin, B.S., Soto, A.M., Sonnenschein, C., 2002.Endocrine disruptors: from wingspread to environmentaldevelopmental biology. The Journal of Steroid Biochemistryand Molecular Biology 83 (1e5), 235e244.
Ng, H.Y., Elimelech, M., 2004. Influence of colloidal fouling onrejection of trace organic contaminants by reverse osmosis.Journal of Membrane Science 244 (1e2), 215e226.
Nghiem, L.D., Hawkes, S., 2009. Effects of membrane fouling onthe nanofiltration of trace organic contaminants. Desalination236 (1e3), 273e281.
Nghiem, L.D., Schafer, A.I., Elimelech, M., 2006. Role ofelectrostatic interactions in the retention of pharmaceuticallyactive contaminants by a loose nanofiltration membrane.Journal of Membrane Science 286 (1e2), 52e59.
Nghiem, L.D., Coleman, P.J., Espendiller, C., 2010. Mechanismsunderlying the effects of membrane fouling on thenanofiltration of trace organic contaminants. Desalination 250(2), 682e687.
Ramon, G.Z., Wong, M.C.Y., Hoek, E.M.V., 2012. Transport throughcomposite membrane, part 1: Is there an optimal supportmembrane? Journal of Membrane Science 415e416 (0),298e305.
Sacher, F., Lange, F.T., Brauch, H.-J., Blankenhorn, I., 2001.Pharmaceuticals in groundwaters: analytical methods andresults of a monitoring program in Baden-Wurttemberg,Germany. Journal of Chromatography A 938 (1e2), 199e210.
Sant’Anna, V., Marczak, L.D.F., Tessaro, I.C., 2012. Membraneconcentration of liquid foods by forward osmosis: process andquality view. Journal of Food Engineering 111 (3), 483e489.
Sharpe, R.M., N.E.S, 2003. Male reproductive disorders and therole of endocrine disruption: advances in understanding andidentification of areas for future research. Pure and AppliedChemistry 75 (11e12), 2023e2038.
Sumpter, J.P., Johnson, A.C., 2005. Lessons from endocrinedisruption and their application to other issues concerningtrace organics in the aquatic environment. EnvironmentalScience & Technology 39 (12), 4321e4332.
Svenson, A., Allard, A.-S., Ek, M., 2003. Removal of estrogenicity inSwedish municipal sewage treatment plants. Water Research37 (18), 4433e4443.
Ternes, T.A., 1998. Occurrence of drugs in German sewagetreatment plants and rivers. Water Research 32 (11),3245e3260.
Ternes, T.A., Bonerz, M., Herrmann, N., Loffler, D., Keller, E.,Lacida, B.B., Alder, A.C., 2005. Determination ofpharmaceuticals, iodinated contrast media and muskfragrances in sludge by LC tandem MS and GC/MS. Journal ofChromatography A 1067 (1e2), 213e223.
Van De Steene, J.C., Stove, C.P., Lambert, W.E., 2010. A field studyon 8 pharmaceuticals and 1 pesticide in Belgium: removalrates in waste water treatment plants and occurrence insurface water. Science of The Total Environment 408 (16),3448e3453.

wat e r r e s e a r c h 4 7 ( 2 0 1 3 ) 5 2 3 2e5 2 4 45244
van der Wielen, P.W.J.J., van der Kooij, D., 2010. Effect ofwater composition, distance and season on the adenosinetriphosphate concentration in unchlorinated drinkingwater in the Netherlands. Water Research 44 (17),4860e4867.
Verliefde, A.R.D., Cornelissen, E.R., Heijman, S.G.J., Hoek, E.M.V.,Amy, G.L., Bruggen, B.V.d., van Dijk, J.C., 2009a. Influence ofsolute-membrane affinity on rejection of uncharged organicsolutes by nanofiltration membranes. Environmental Science& Technology 43 (7), 2400e2406.
Verliefde, A.R.D., Cornelissen, E.R., Heijman, S.G.J.,Verberk, J.Q.J.C., Amy, G.L., Van der Bruggen, B., van Dijk, J.C.,2009b. Construction and validation of a full-scale model for
rejection of organic micropollutants by NF membranes.Journal of Membrane Science 339 (1e2), 10e20.
Xie, M., Nghiem, L.D., Price, W.E., Elimelech, M., 2012. Comparisonof the removal of hydrophobic trace organic contaminants byforward osmosis and reverse osmosis. Water Research 46 (8),2683e2692.
Zhang, J., Loong, W.L.C., Chou, S., Tang, C., Wang, R., Fane, A.G.,2011. Membrane biofouling and scaling in forward osmosismembrane bioreactor. Journal of Membrane Science403aV“404 (0), 8e14.
Zhao, S., Zou, L., Tang, C.Y., Mulcahy, D., 2012. Recentdevelopments in forward osmosis: opportunities andchallenges. Journal of Membrane Science 396 (0), 1e21.
Copyright © 2022 FDOKUMEN