Influence of membrane and colloid characteristics on fouling of nanofiltration membranes
11
Journal of Membrane Science 289 (2007) 220–230 Influence of membrane and colloid characteristics on fouling of nanofiltration membranes K. Boussu a,∗ , A. Belpaire a , A. Volodin b,1 , C. Van Haesendonck b,1 , P. Van der Meeren c,2 , C. Vandecasteele a , B. Van der Bruggen a a Laboratory for Applied Physical Chemistry and Environmental Technology, Department of Chemical Engineering, K.U. Leuven, W. de Croylaan 46, B-3001 Leuven, Belgium b Laboratory of Solid-State Physics and Magnetism, Department of Physics and Astronomy, K.U. Leuven, Celestijnenlaan 200D, B-3001 Leuven, Belgium c Particle and Interfacial Technology Group, Faculty of Bioscience Engineering, Ghent University, Coupure Links 653, B-9000 Gent, Belgium Received 1 September 2006; received in revised form 16 November 2006; accepted 2 December 2006 Available online 8 December 2006 Abstract Colloidal fouling is still one of the major impediments for the implementation of membrane processes, e.g. in the purification of surface water. Effects of fouling for several representative nanofiltration membranes during filtration of several types of colloids in different circumstances (pH, ionic strength) are presented in this study. Four different colloidal solutions (silica–aluminum) were selected to investigate both the influence of colloid size and colloid charge. The most pronounced colloidal fouling was observed for the hydrophobic membranes, for which a dense cake layer was formed on the entire mem- brane surface. In addition to the hydrophobicity, membrane roughness also plays a secondary role during filtration of small colloids. These fouling effects were proven both by scanning electron microscopy (SEM) and atomic force microscopy (AFM) measurements. Not only the membrane, but also the colloid characteristics are crucial to control membrane fouling. Large colloids with a negative surface charge seem to be the most beneficial for a nanofiltration process at neutral pH. Changing the pH changes the interaction forces between membranes and colloids and also between the colloids themselves, which is in full agreement with the DLVO theory. Another way to adapt the interaction forces is to increase the ionic strength of the colloidal solution. It was shown that a higher ionic strength leads to more membrane fouling in case of membranes with small pore sizes. © 2006 Elsevier B.V. All rights reserved. Keywords: Nanofiltration; Colloidal fouling; Hydrophobicity; Colloid characteristics 1. Introduction Colloidal particles are ubiquitous in natural waters. Colloids cover a wide size range, from a few nanometers to a few microm- eters. Aquatic colloids comprise clay minerals, colloidal silica, iron, aluminum, and manganese oxides, organic colloids and suspended matter, and calcium carbonate precipitates [1]. ∗ Corresponding author. Tel.: +32 16 32 23 41; fax: +32 16 32 29 91. E-mail addresses: [email protected] (K. Boussu), [email protected] (C. Van Haesendonck), [email protected] (P. Van der Meeren). 1 Tel.: +32 16 32 75 01/71 84; fax: +32 16 32 79 83. 2 Tel.: +32 9 264 60 03; fax: +32 9 264 62 42. In membrane water treatment processes, fouling by these col- loidal particles is one of the major categories of performance deterioration. Despite the vast efforts to reduce membrane fouling by improving membrane properties, optimizing oper- ational conditions and pretreatment of the feed water, fouling is inevitable [2,3]. Therefore, understanding fouling phenomena is critical for the development of membrane-based water treat- ment technologies. Depending on the relative size of colloidal particles and membrane pores, fouling may occur due to either accumulation of particles on the membrane surface and build-up of a cake or by penetration within the membrane pores [4–8]. This study focuses on the former aspect of colloidal fouling, which occurs for nanofiltration (NF) membranes. As fouling is a complex interplay between membrane and feed solution, the characteristics of both the membrane and the 0376-7388/$ – see front matter © 2006 Elsevier B.V. All rights reserved. doi:10.1016/j.memsci.2006.12.001
Transcript of Influence of membrane and colloid characteristics on fouling of nanofiltration membranes

A
Eic
beafco©
K
1
ceis
CP
0d
Journal of Membrane Science 289 (2007) 220–230
Influence of membrane and colloid characteristicson fouling of nanofiltration membranes
K. Boussu a,∗, A. Belpaire a, A. Volodin b,1, C. Van Haesendonck b,1,P. Van der Meeren c,2, C. Vandecasteele a, B. Van der Bruggen a
a Laboratory for Applied Physical Chemistry and Environmental Technology, Department of Chemical Engineering,K.U. Leuven, W. de Croylaan 46, B-3001 Leuven, Belgium
b Laboratory of Solid-State Physics and Magnetism, Department of Physics and Astronomy, K.U. Leuven,Celestijnenlaan 200D, B-3001 Leuven, Belgium
c Particle and Interfacial Technology Group, Faculty of Bioscience Engineering,Ghent University, Coupure Links 653, B-9000 Gent, Belgium
Received 1 September 2006; received in revised form 16 November 2006; accepted 2 December 2006Available online 8 December 2006
bstract
Colloidal fouling is still one of the major impediments for the implementation of membrane processes, e.g. in the purification of surface water.ffects of fouling for several representative nanofiltration membranes during filtration of several types of colloids in different circumstances (pH,
onic strength) are presented in this study. Four different colloidal solutions (silica–aluminum) were selected to investigate both the influence ofolloid size and colloid charge.
The most pronounced colloidal fouling was observed for the hydrophobic membranes, for which a dense cake layer was formed on the entire mem-rane surface. In addition to the hydrophobicity, membrane roughness also plays a secondary role during filtration of small colloids. These foulingffects were proven both by scanning electron microscopy (SEM) and atomic force microscopy (AFM) measurements. Not only the membrane, butlso the colloid characteristics are crucial to control membrane fouling. Large colloids with a negative surface charge seem to be the most beneficial
or a nanofiltration process at neutral pH. Changing the pH changes the interaction forces between membranes and colloids and also between theolloids themselves, which is in full agreement with the DLVO theory. Another way to adapt the interaction forces is to increase the ionic strengthf the colloidal solution. It was shown that a higher ionic strength leads to more membrane fouling in case of membranes with small pore sizes.2006 Elsevier B.V. All rights reserved.
ristics
ldfa
eywords: Nanofiltration; Colloidal fouling; Hydrophobicity; Colloid characte
. Introduction
Colloidal particles are ubiquitous in natural waters. Colloidsover a wide size range, from a few nanometers to a few microm-ters. Aquatic colloids comprise clay minerals, colloidal silica,
ron, aluminum, and manganese oxides, organic colloids anduspended matter, and calcium carbonate precipitates [1].∗ Corresponding author. Tel.: +32 16 32 23 41; fax: +32 16 32 29 91.E-mail addresses: [email protected] (K. Boussu),
[email protected] (C. Van Haesendonck),[email protected] (P. Van der Meeren).1 Tel.: +32 16 32 75 01/71 84; fax: +32 16 32 79 83.2 Tel.: +32 9 264 60 03; fax: +32 9 264 62 42.
iimpaoTw
f
376-7388/$ – see front matter © 2006 Elsevier B.V. All rights reserved.oi:10.1016/j.memsci.2006.12.001
In membrane water treatment processes, fouling by these col-oidal particles is one of the major categories of performanceeterioration. Despite the vast efforts to reduce membraneouling by improving membrane properties, optimizing oper-tional conditions and pretreatment of the feed water, fouling isnevitable [2,3]. Therefore, understanding fouling phenomenas critical for the development of membrane-based water treat-
ent technologies. Depending on the relative size of colloidalarticles and membrane pores, fouling may occur due to eitherccumulation of particles on the membrane surface and build-upf a cake or by penetration within the membrane pores [4–8].
his study focuses on the former aspect of colloidal fouling,hich occurs for nanofiltration (NF) membranes.As fouling is a complex interplay between membrane andeed solution, the characteristics of both the membrane and the

mbran
ctmlsrewflebfcmssc
ciiccchcIpitlr
bnef(atda
iamrrsc
2
2s
D((bDbNdba
fltmvsRcmtapai
TC
MCR
Z
W
K. Boussu et al. / Journal of Me
olloids, together with the feed solution chemistry are neededo explain and to control membrane fouling. Concerning the
embrane characteristics, it is assumed in literature that col-oidal fouling is related to the roughness of the membraneurface [5,6,9,10]. Because of the ridge-and-valley structure ofough membrane surfaces, colloids are thought to be prefer-ntially transported into the valleys (path of least resistance),hich results in “valley clogging” and hence in a more severeux decline in comparison with smooth membranes. How-ver, other researchers [11,12] did not observe any correlationetween colloidal fouling and surface roughness, and the sur-ace hydrophobicity appeared to be the most critical membraneharacteristic to control colloidal fouling. Another importantembrane property is reported to be the permeability [6,13,14],
ince a higher flux can bring more colloids to the membraneurface in a given time period, resulting in a faster growth of theake layer.
Concerning the colloid characteristics, both the size, theharge and the concentration of the colloids may influence foul-ng. An increase in colloid concentration mostly leads to anncrease in fouling [6,13,15–17], while larger colloids eitherause more [13] or less [4,18] fouling in comparison with smallerolloids. Concerning the solution chemistry, adapting the pHhanges the charge of both membrane surface and colloids andence the electrostatic interaction forces between membrane andolloid on one side and between colloids on the other side [19].n addition, the ionic strength of the solution is also a criticalarameter that affects membrane fouling, as the fouling potentialncreases with ionic strength [7,17,20]. The increase is attributedo the compression of the double layer formed around the col-oids at increased strength. This well accepted theory has beeneported to be true for silica particles larger than 50 nm [17].
From this literature overview, it becomes clear that mem-rane fouling by colloids is influenced by many factors. Up toow, a selective but thorough approach of the fouling phenom-na is emphasized by studying only a limited number of foulingactors with (mostly) only one membrane in combination withmostly) only one colloidal solution. This study, however, aims
t investigating several representative NF membranes when fil-ering several colloids with a different solution chemistry (i.e.ifferent colloid concentrations, pH and ionic strengths). Thispproach not only allows to obtain a (qualitative) global foul-piat
able 1haracteristics of the selected nanofiltration membranes
Desal51HL Desal5D
WCOa (Da) 190 260ontact angle (◦) 47 44MS roughnessb (A) 30 57
eta potentialc (mV)pH 3 4 7pH 7 −14 −18pH 10 −17 −21
ater permeability (l/(m2 h bar)) 11.4 3.7
a MWCO, molecular weight cut-off.b Scan area of 1 �m × 1 �m.c Measured in 0.01 M KCl solution.
e Science 289 (2007) 220–230 221
ng study in which both membrane and colloid characteristicsre emphasized, but it also allows to check whether the sameembrane characteristics are qualifying during filtration of these
epresentative colloidal solutions. This reinforces not only theeliability of the conclusions made, but it also facilitates theelection of a proper membrane during filtration of an arbitraryolloidal solution (e.g. in a specific application).
. Materials and methods
.1. Selection of nanofiltration membranes and filtrationet-up
Five different nanofiltration membranes were selected:esal51HL and Desal5DL (GE Osmonics, France), NTR7450
Nitto-Denko/Hydranautics, Switzerland), N30F and NFPES10Nadir, Germany). The characteristics of these membranes haveeen determined previously [21] and are summarized in Table 1.esal5DL has the roughest top layer, while the most hydropho-ic membrane surface is observed for N30F. NFPES10 andTR7450 are also rather hydrophobic membranes with a largeifference in MWCO and permeability. The main differencesetween the hydrophilic membranes Desal51HL and Desal5DLre the surface roughness and the permeability.
Membrane fouling was studied during filtration in a cross-ow set-up (Amafilter, The Netherlands). In the experiments
he applied pressure (�P) was 8 bar and the temperature wasaintained at 293 K by a cooling water circuit. The same feed
elocity (4.5 m/s) was adjusted for all membranes and corre-ponds with a Reynolds number of 30,000 (turbulent region ife > 2000). This high feed velocity was needed to minimizeoncentration polarization, so that mainly the intrinsic foulingechanisms (e.g. hydrophobic or electrostatic interactions) of
he feed solution can be studied. For each fouling experiment,new membrane piece was used to eliminate the influence of
rior experiments. Each membrane piece was firstly placed intocup of distilled water for at least 24 h, to dissolve the conserv-
ng agents. Afterwards, the membrane was pressurized and the
ure water flux was measured for each membrane piece (to takento account the variation between different membrane samples)t 8 bar, neutral pH and without the addition of salt. During fil-ration of the colloidal solutions, permeate flux was measured asL NTR7450 N30F NFPES10
310 680 120070 88 72
9 25 13
1 1 1−17 −15 −12−19 −18 −15
5.7 3.8 15.4

2 mbran
adrtoo
�
wf(fl�
1fldFswysrbmaP2sammoaccsmfif
R
wtgpttbsRpewr
tf
2
s(HuaCtWoww
w2H0a2e
ζ
wtfb
bG4to
3
3
icabprt(
22 K. Boussu et al. / Journal of Me
function of time during 2 h. To compare flux decline betweenifferent membranes, relative fluxes (in %) were defined as theatio of the permeate flux to the (respective) pure water flux. Forhe experiments with NaCl, the permeate flux was corrected forsmotic pressure (�π), which was calculated using the equationf Van’t Hoff:
π = (CNaCl,feed − CNaCl,permeate)RT (1)
ith CNaCl,feed and CNaCl,permeate the concentration of NaCl ineed and permeate respectively; R the universal gas constant8.314 J/(mol K)); T the temperature (K). A corrected relativeux was obtained by multiplying the relative flux with the factorP/(�P −�π). By repeating the same cross-flow experiment
0 times, the reproducibility or the absolute error on the relativeux was determined as 4%. The colloid concentrations wereetermined with a turbidimeter (DRT-15CE, Scientific Inc.).iltration experiments were also performed with an aqueousolution containing different salt concentrations in combinationith either raffinose (504 g/mol) or maltose (342 g/mol). Anal-sis in feed and permeate was done with a Shimadzu UV-1601pectrophotometer at a wavelength of 470 nm using a colorimet-ic method [22]. To visualize membrane fouling on the surfaces,oth scanning electron microscopy (SEM) and atomic forceicroscopy (AFM) measurements were performed before and
fter the filtration experiments. SEM images were made with ahilips XL30 FEG instrument with an accelerating voltage of0 keV. AFM was performed in non-contact mode on differentcan areas using an Autoprobe M5 setup (Veeco). For each scanrea, the measurements were performed several times on severalembrane places. The small standard deviations of the differenteasurements (ranging from 0.8 A on a smooth surface to 6.2 A
n a rough surface) indicate that the results were reproduciblend that the membrane surface was rather homogeneous. Theantilever, used during AFM, was made out of Si with a springonstant of 3.2 N/m and a nominal tip apex radius of 10 nm. Aftercanning, the images were flattened with a second order polyno-ial approximation (to remove background curvature and slope
rom the image). The root-mean-squared (RMS) roughness [23],.e. the standard deviation of the data, was calculated using theollowing equation:
rms =√∑N
n=1(zn − z)2
N − 1(2)
here z is the average of the z values within the given area; zn
he current z value; N is the number of data points within theiven area. In addition to the RMS roughness, other roughnessarameters can be used to analyse the membrane surface likehe mean roughness (the mean value of the surface relative tohe center plane) or the peak-to-valley distance (the distanceetween the highest data point and the lowest data point of theurface). However, these definitions are less accurate than theMS roughness [23]. In the peak-to-valley distance only two
oints of the scanned surface (namely the highest and the low-st) are taken into account, which is not very presentable for thehole surface. A comparison between the RMS and the meanoughness shows that the latter takes less account of the varia-
aotp
e Science 289 (2007) 220–230
ions of the low frequencies. Therefore, the RMS roughness wasocused in this study.
.2. Selection and characterization of colloids
Four different commercial colloidal dispersions wereelected: VP Disp. W7520 (20 wt%) and Aerodisp W63030 wt%) (from Degussa) and Ludox CL (30 wt%) and LudoxS-30 (30 wt%) (from Sigma–Aldrich). According to the man-facturer, VP Disp. W7520 and Aerodisp W630 have a meanggregate size of 120 nm and 140 nm, respectively, while LudoxL and Ludox HS-30 have a size smaller than 100 nm. Not only
he size, but also the composition of the colloids differs. VP Disp.7520 and Aerodisp W630 are made of silica and aluminum
xide, respectively. Ludox HS-30 is a colloidal silica dispersion,hile Ludox CL is a colloidal silica where each particle is coatedith a layer of aluminum.The electrophoretic mobility (μ in m2/(V s)) of the particles
as determined using a Zetasizer IIc instrument (Malvern) at93 K. The colloid concentration was 1 ml/ml in case of LudoxS-30 and Ludox CL, 4.4 �l/ml in case of Aerodisp W7520 and.5 �l/ml in case of Aerodisp W630. The pH was controlled bydding NaOH or HCl. The applied electric field was typically000 V/m. The zeta potential (� in V) was derived from thelectrophoretic mobility [24] by using the following equation:
= 3ημ
2ε
[1 + 1
2[1 + (2.5/(κa(1 + 2 exp(−κa))))]3
]−1
(3)
ith η the viscosity (Pa s); ε the permittivity (C2/(N m2)); κ−1
he Debye length (m); a the radius of the colloid (m). The relativeault on the measured values of the electrophoretic mobility waselow 10%.
The hydrodynamic radius of the colloids was determinedy Dynamic Light Scattering using the ALV/CGS-3 Compactoniometer (ALV-GmbH, Germany), with a relative fault below%. Measurements were performed on diluted colloidal solu-ions (0.05%) at a scattering angle of 90◦ and at a temperaturef 295 K. Data analysis was performed by cumulant analysis.
. Results
.1. Characterization of the colloids
The zeta potential of the different colloids as a function of pHs given in Fig. 1, together with the approximate borders of theolloid stability region. These borders are taken in this case atbout ±30 mV (in conditions of very low ionic strength), as it iselieved in literature [25] that such an absolute value of the zetaotential is needed to ensure the colloid stability by electrostaticepulsion according to the DLVO theory. Fig. 1 clearly showshe difference in colloid composition. The two silica colloidsVP Disp. W7520 and Ludox HS-30) are negatively charged at
ll pH values with an iso-electric point below pH 3 [19,26]. Thether two colloids (Aerodisp W630 and Ludox CL) are posi-ively charged at low and intermediate pH, have an iso-electricoint between pH 8 and 9 and are negatively charged at high pH.
K. Boussu et al. / Journal of Membrane Science 289 (2007) 220–230 223
Fo
AieWrwsa
dTLahtccWAcsss
bWtLr
THN
ppp00
FC
3f
tam1aaotctTtW
ciaNrtWtot
ig. 1. Zeta potential as a function of pH for the different colloids. The bordersf the colloid stability region are also indicated as dotted lines.
t high pH, however, the zeta potential is low inside the colloidnstability region, implying that aggregation is possible. The iso-lectric points of both the aluminum oxide colloid (Aerodisp
630) and the aluminum-coated silica colloid (Ludox CL) cor-espond well with literature data [19,27,28]. Comparing Fig. 1ith Table 1 also indicates that the colloid zeta potentials are sub-
tantially larger in magnitude than the membrane zeta potentialst intermediate pH [29].
The hydrodynamic radius of the colloids at different pH con-itions and in different NaCl concentrations is presented inable 2. At intermediate pH, it is clear that for Ludox CL andudox HS-30 the radii are much smaller than for Aerodisp W630nd VP Disp. W7520. Changing the pH or adding NaCl mostlyad no influence on the colloid size. Severe coagulation onlyook place for Ludox CL and Aerodisp W630 at high pH, i.e.lose to their iso-electric point (see also Fig. 1). Although someoagulation was also expected for Ludox HS-30 and VP Disp.
7520 at low pH, this was not supported by the DLS results.possible explanation could be that the zeta potentials of these
olloids at low pH are very close to the borders of the colloidtability region (e.g. Ludox HS-30 at pH 3 in Fig. 1), so thattill some electrostatic repulsion forces can occur between theseilica colloids.
Combining Fig. 1 with Table 2 indicates the differencesetween the four selected colloids. At neutral pH, VP Disp.7520 and Aerodisp W630 are large negatively and posi-
ively charged colloids, respectively, whereas Ludox HS-30 and
udox CL are small negatively and positively charged colloids,espectively.
able 2ydrodynamic radius (in nm) of the different colloids as a function of pH andaCl concentrations
Ludox CL AerodispW630
Ludox HS-30 VP Disp.W7520
H 3 30 77 10 68H 5 28 84 8 69H 10 233 1047 8 68.05 M NaCl 41 80 9 67.1 M NaCl 42 85 9 67
ho(
TRa
LALV
ig. 2. Evolution of the relative flux as a function of filtration time for LudoxL (100 mg/l, neutral pH).
.2. Influence of membrane characteristics on colloidalouling
Fig. 2 presents the evolution of the relative flux as a func-ion of filtration time for the different membranes when filtering
100 mg/l Ludox CL dispersion. Similar observations wereade for other colloids (not shown). Fig. 2 shows that after
5 min of filtration the relative flux already becomes stable forll membranes, except for NTR7450. The stable relative flux asfunction of filtration time implies that the colloid fouling caken the membrane surface is formed instantaneously [12,30] andhat no cake growth takes place. Only for NTR7450, the foulingake on the membrane surface seems to grow as a function ofime, as reflected by the continuously decreasing relative flux.he decrease of the relative flux for NTR7450 was observed
o be similar with all colloidal solutions, except for VP Disp.7520 for which a stable relative flux was observed.The results for the relative fluxes after 2 h of filtration with a
olloid concentration of 100 mg/l at neutral pH are presentedn Table 3. Table 3 indicates that the lowest relative fluxesre observed for the more hydrophobic membranes NTR7450,30F and NFPES10. Because of the continuous decrease of the
elative flux as a function of filtration time (Fig. 2), NTR7450 ishe most fouled of all membranes except when filtering VP Disp.
7520. In that case, the relative flux remained stable as a func-ion of filtration time as mentioned before. As the fouling resultsf NTR7450 seem to be outliers among the other membranes,his membrane will not be focused in the following discussions.
The more hydrophilic membranes Desal51HL and Desal5DL
ad the highest relative fluxes and no significant difference wasbserved between these membranes when filtering large colloidsAerodisp W630 and VP Disp. W7520). However, the smallable 3elative fluxes (in %) after 2 h filtration with a colloid concentration of 100 mg/lt neutral pH
Desal51HL Desal5DL NTR7450 N30F NFPES10
udox CL 90 70 34 60 68erodisp W630 87 91 51 50 69udox HS-30 96 84 19 82 89P Disp. W7520 96 95 92 92 87

2 mbran
ciDasa
bfowpdtcpicfl((((rarstcf
vot((tc(cfcitm
biwmca“Nftf
24 K. Boussu et al. / Journal of Me
olloids (Ludox HS-30 and Ludox CL) foul these membranesn a different way: the lowest relative fluxes were found foresal5DL. As the characteristics of Desal51HL and Desal5DL
re very similar except for their roughness (Desal51HL ismoother, see Table 1), this implies that the surface roughnesslso plays a (secondary) role in the fouling phenomenon.
These results indicate that the hydrophobicity of the mem-rane surface is the most important parameter for colloidalouling. The surface roughness has a minor influence andnly in the case when filtering small colloids. No influenceas observed for the MWCO, the surface charge or the waterermeability on the fouling results. This is illustrated by theifferent fouling degrees of Desal5DL and NTR7450 (nearlyhe same MWCO), Desal51HL and N30F (similar surfaceharge at neutral pH) and Desal51HL and NFPES10 (similarermeability). To check the influence of the permeabilityn more detail, the hydraulic resistance due to fouling isalculated (after 2 h of filtration) in addition to the relativeux. For example, the resistances due to fouling of Ludox CL100 mg/l, neutral pH, no addition of salt) were 4 × 10¹² m−1
Desal51HL), 8 × 10¹² m−1 (NFPES10), 40 × 1012 m−1
Desal5DL), 53 × 1012 m−1 (N30F) and 161 × 1012 m−1
NTR7450). Because of the low initial permeability, higheresistances due to fouling were observed for Desal5DL, N30Fnd NTR7450. Just as with the relative fluxes, a differentesistance due to fouling was observed for membranes with the
ame permeability (Desal51HL and NFPES10). However, ashe amount of solution filtered (determined by the permeability)an also be critical in fouling phenomena, resistances due toouling were also calculated after collection of a permeatetsfla
Fig. 3. SEM images of the membrane surface of Desal5DL and N30F,
e Science 289 (2007) 220–230
olume of 100 ml. For example, the resistances due to foulingf Ludox CL (100 mg/l, neutral pH, no addition of salt) inhis case were 4 × 10¹² m−1 (Desal51HL), 7 × 10¹² m−1
NFPES10), 36 × 1012 m−1 (Desal5DL), 52 × 1012 m−1
N30F) and 100 × 1012 m−1 (NTR7450). The resistances dueo fouling in both cases (after 2 h filtration or after permeateollection of 100 ml) are very similar, except for NTR7450see Fig. 2). To verify the influence of the different membraneharacteristics on colloidal fouling, a statistical analysis of theouling results was performed with linear regression using theomputer program SAS. This statistical analysis confirms that,n addition to the colloid characteristics, the hydrophobicity inhe first place and the roughness in the second place are the
ost relevant membrane characteristics.To visualize the fouling effects, SEM images of the mem-
rane surfaces were taken before and after fouling, as illustratedn Fig. 3 for the membranes Desal5DL and N30F in combinationith Ludox CL. The difference in surface roughness between theembranes can clearly be observed in the SEM images of the
lean surface. For the rough membrane Desal5DL, the colloidsre situated mainly in the valleys of the surface after filtration; i.e.valley clogging” has taken place [5,6,9,10]. However, in case of30F, the colloids are distributed over the entire membrane sur-
ace due to hydrophobic interactions between the colloids andhe membrane surface [29] and a uniform, dense cake layer isormed. The resistance of this cake layer seems to be larger than
he resistance of the “valley clogging” by the small colloids,ince the hydrophobic membrane N30F has a lower relativeux than the rough membrane Desal5DL (Table 3). Due to thebsence of hydrophobic interactions (no dense cake layer) andbefore and after fouling with 100 mg/l Ludox CL at neutral pH.
K. Boussu et al. / Journal of Membrane Science 289 (2007) 220–230 225
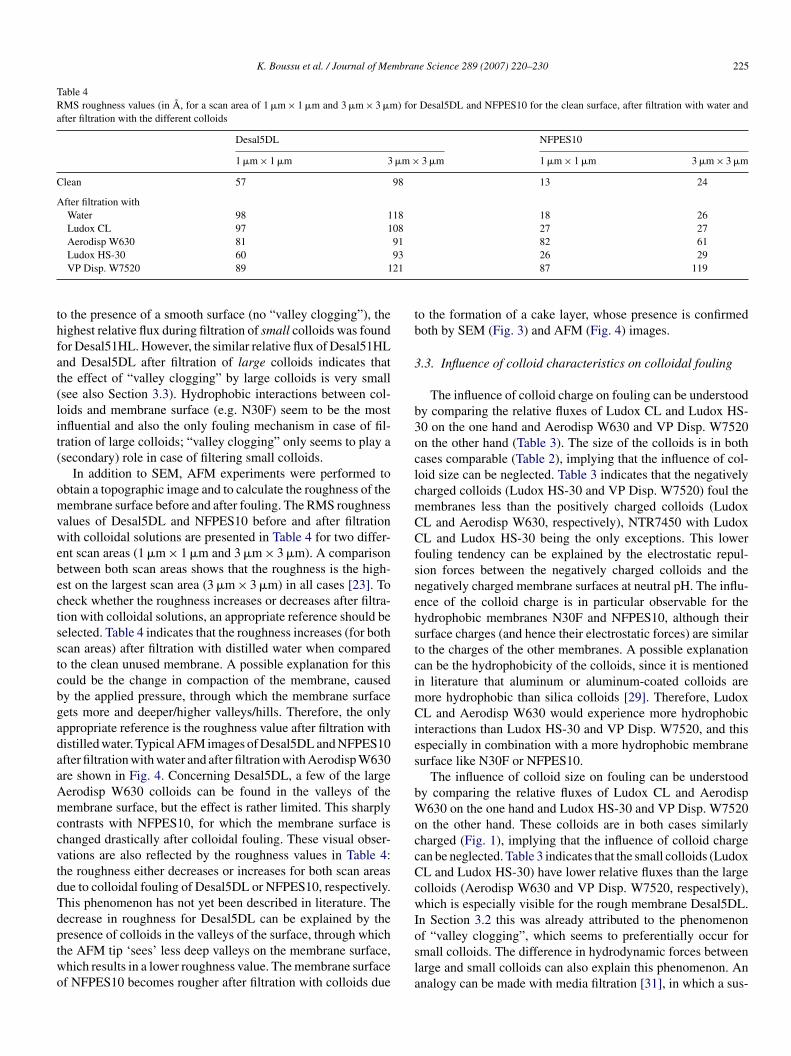
Table 4RMS roughness values (in A, for a scan area of 1 �m × 1 �m and 3 �m × 3 �m) for Desal5DL and NFPES10 for the clean surface, after filtration with water andafter filtration with the different colloids
Desal5DL NFPES10
1 �m × 1 �m 3 �m × 3 �m 1 �m × 1 �m 3 �m × 3 �m
Clean 57 98 13 24
After filtration withWater 98 118 18 26Ludox CL 97 108 27 27Aerodisp W630 81 91 82 61
9321
thfat(lit(
omvwebectsstcbgadaaAmccvtdTdptwo
tb
3
b3oclcmCCfsnehstcimCies
bWoccCcwI
Ludox HS-30 60VP Disp. W7520 89 1
o the presence of a smooth surface (no “valley clogging”), theighest relative flux during filtration of small colloids was foundor Desal51HL. However, the similar relative flux of Desal51HLnd Desal5DL after filtration of large colloids indicates thathe effect of “valley clogging” by large colloids is very smallsee also Section 3.3). Hydrophobic interactions between col-oids and membrane surface (e.g. N30F) seem to be the mostnfluential and also the only fouling mechanism in case of fil-ration of large colloids; “valley clogging” only seems to play asecondary) role in case of filtering small colloids.
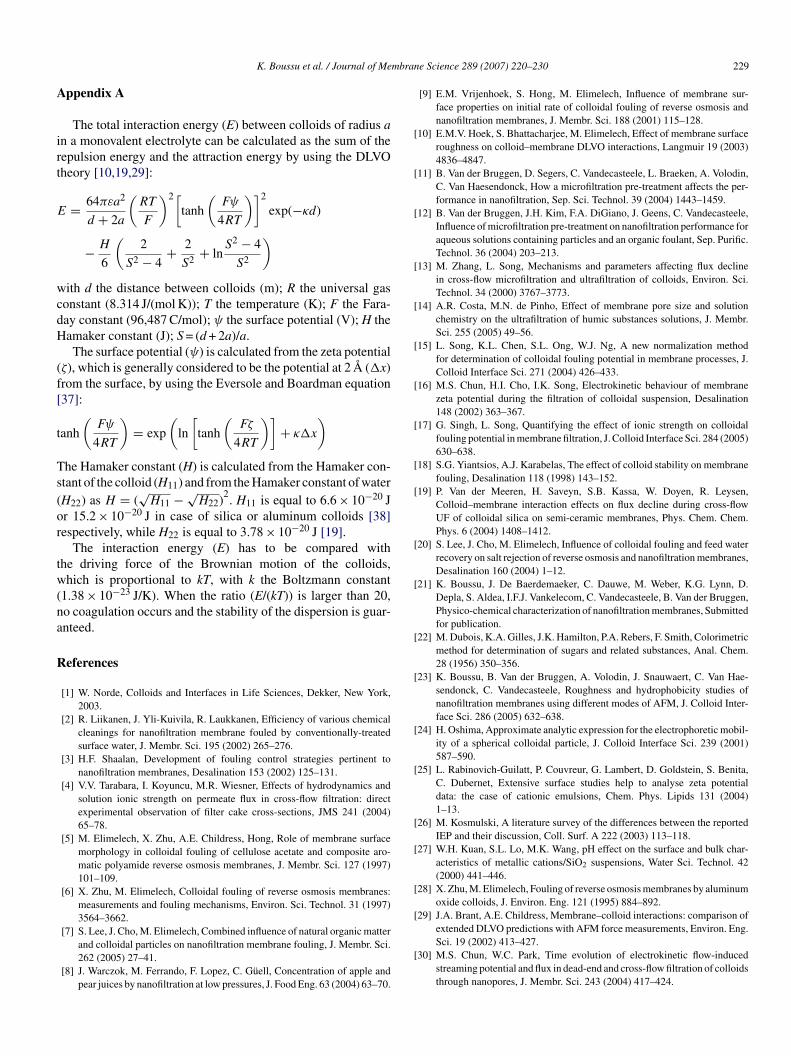
In addition to SEM, AFM experiments were performed tobtain a topographic image and to calculate the roughness of theembrane surface before and after fouling. The RMS roughness
alues of Desal5DL and NFPES10 before and after filtrationith colloidal solutions are presented in Table 4 for two differ-
nt scan areas (1 �m × 1 �m and 3 �m × 3 �m). A comparisonetween both scan areas shows that the roughness is the high-st on the largest scan area (3 �m × 3 �m) in all cases [23]. Toheck whether the roughness increases or decreases after filtra-ion with colloidal solutions, an appropriate reference should beelected. Table 4 indicates that the roughness increases (for bothcan areas) after filtration with distilled water when comparedo the clean unused membrane. A possible explanation for thisould be the change in compaction of the membrane, causedy the applied pressure, through which the membrane surfaceets more and deeper/higher valleys/hills. Therefore, the onlyppropriate reference is the roughness value after filtration withistilled water. Typical AFM images of Desal5DL and NFPES10fter filtration with water and after filtration with Aerodisp W630re shown in Fig. 4. Concerning Desal5DL, a few of the largeerodisp W630 colloids can be found in the valleys of theembrane surface, but the effect is rather limited. This sharply
ontrasts with NFPES10, for which the membrane surface ishanged drastically after colloidal fouling. These visual obser-ations are also reflected by the roughness values in Table 4:he roughness either decreases or increases for both scan areasue to colloidal fouling of Desal5DL or NFPES10, respectively.his phenomenon has not yet been described in literature. Theecrease in roughness for Desal5DL can be explained by the
resence of colloids in the valleys of the surface, through whichhe AFM tip ‘sees’ less deep valleys on the membrane surface,hich results in a lower roughness value. The membrane surfacef NFPES10 becomes rougher after filtration with colloids dueosla
26 2987 119
o the formation of a cake layer, whose presence is confirmedoth by SEM (Fig. 3) and AFM (Fig. 4) images.
.3. Influence of colloid characteristics on colloidal fouling
The influence of colloid charge on fouling can be understoody comparing the relative fluxes of Ludox CL and Ludox HS-0 on the one hand and Aerodisp W630 and VP Disp. W7520n the other hand (Table 3). The size of the colloids is in bothases comparable (Table 2), implying that the influence of col-oid size can be neglected. Table 3 indicates that the negativelyharged colloids (Ludox HS-30 and VP Disp. W7520) foul theembranes less than the positively charged colloids (LudoxL and Aerodisp W630, respectively), NTR7450 with LudoxL and Ludox HS-30 being the only exceptions. This lower
ouling tendency can be explained by the electrostatic repul-ion forces between the negatively charged colloids and theegatively charged membrane surfaces at neutral pH. The influ-nce of the colloid charge is in particular observable for theydrophobic membranes N30F and NFPES10, although theirurface charges (and hence their electrostatic forces) are similaro the charges of the other membranes. A possible explanationan be the hydrophobicity of the colloids, since it is mentionedn literature that aluminum or aluminum-coated colloids areore hydrophobic than silica colloids [29]. Therefore, LudoxL and Aerodisp W630 would experience more hydrophobic
nteractions than Ludox HS-30 and VP Disp. W7520, and thisspecially in combination with a more hydrophobic membraneurface like N30F or NFPES10.
The influence of colloid size on fouling can be understoody comparing the relative fluxes of Ludox CL and Aerodisp630 on the one hand and Ludox HS-30 and VP Disp. W7520
n the other hand. These colloids are in both cases similarlyharged (Fig. 1), implying that the influence of colloid chargean be neglected. Table 3 indicates that the small colloids (LudoxL and Ludox HS-30) have lower relative fluxes than the largeolloids (Aerodisp W630 and VP Disp. W7520, respectively),hich is especially visible for the rough membrane Desal5DL.
n Section 3.2 this was already attributed to the phenomenon
f “valley clogging”, which seems to preferentially occur formall colloids. The difference in hydrodynamic forces betweenarge and small colloids can also explain this phenomenon. Annalogy can be made with media filtration [31], in which a sus-
226 K. Boussu et al. / Journal of Membrane Science 289 (2007) 220–230
× 3 �m, before and after fouling with 100 mg/l Aerodisp W630 at neutral pH.
pwfcaiBtcgtilpm
mitlcse(cbl
Fig. 4. AFM images of Desal5DL and NFPES10 on a scan area of 3 �m
ended particle has to leave the streaming pattern of the filteredater to reach the surface of a grain. This can happen by dif-
usion forces (small colloids) or by interception forces (largeolloids). Although the streaming patterns in nanofiltration runlong the membrane surface instead of through the medium (asn media filtration), the principle is analogous to media filtration.y means of diffusion, small colloids can reach and get attached
o the membrane surface. In case of a rough membrane, theseolloids are released more difficultly and hence “valley clog-ing” occurs. The interception forces of the large colloids, onhe other hand, are counteracted by the high feed velocity appliedn the membrane module. This implies that the probability of aarge colloid to reach the membrane surface is lower than therobability of a small colloid, through which “valley clogging”ainly occurs for small colloids.The colloid size does not only have an influence on the
embrane–colloid interactions, but also on the colloid–colloidnteractions as given by the DLVO theory [10,19,29]. With thisheory, the relation of the total interaction energy between col-oids (E) to the driving force of the Brownian motion of theolloids (kT) can be calculated (see Appendix A) and is pre-ented in Fig. 5(a) for the different colloids. The interactionnergy between colloids is influenced by both the size, the
absolute value of the) surface charge density and the surfaceomposition of the colloids. The largest repulsion is observedetween the Aerodisp W630 colloids, as these colloids arearge (Table 2) in combination with a large surface chargeFig. 5. DLVO interaction energy diagram of different colloids (a) at neutral pHand (b) at different pH values at 293 K.

K. Boussu et al. / Journal of Membrane Science 289 (2007) 220–230 227
FAd
(oHoscbtlirrTs
tttfNfcWf[Nimtt
F(w
bws
3
3
cNDb
Foc3ciaif(e3e
ig. 6. Relative fluxes (in %) for NFPES10 and NTR7450 after filtration of (a)erodisp W630 and Ludox CL and (b) VP Disp. W7520 and Ludox HS-30 atifferent colloid concentrations at neutral pH.
Fig. 1). Fig. 5(a) also indicates that the smallest repulsion isbserved between the smallest colloids (Ludox CL and LudoxS-30), which can possibly explain their “valley clogging”n rough membranes. Between the large colloids, the repul-ion forces are much larger, and the probability that two largeolloids come together in a small valley on a rough mem-rane is much smaller. The DLVO theory can also be appliedo study the interaction energy between membrane and col-oids [32,33]. Unlike the DLVO analysis for colloid–colloidnteractions, the calculation of membrane–colloid interactionsequires extensive computational work and the value of (cur-ently) unknown data (e.g. Hamaker constant of a membrane).herefore, such an analysis falls beyond the scope of thistudy.
In addition to the colloid size and charge, the colloid concen-ration also plays a role in membrane fouling. Fig. 6 presentshe relative fluxes for NFPES10 and NTR7450 after filtration ofhe colloidal solutions in different concentrations. The resultsor the other membranes were comparable to the results forFPES10. The role of the colloid concentration on membrane
ouling is limited for NFPES10, as the relative flux does nothange with increasing concentrations [30]. Only for VP Disp.
7520, a higher colloid concentration causes more membraneouling, which agrees with the observations by other researchers6,13,15,16]. The opposite tendency is, however, observed forTR7450, for which membrane fouling decreases with increas-
ng concentration for all studied colloids. The reason why thisembrane forms an exception is not clear; the combination of
he small pore size with the high hydrophobicity probably causeshis uncommon phenomenon. NTR7450 is also the only mem-
lcaf
ig. 7. Relative fluxes (in %) for Desal51HL and NFPES10 after filtration ofa) Aerodisp W630 and Ludox CL and (b) VP Disp. W7520 and Ludox HS-30ith a colloid concentration of 100 mg/l at different pH.
rane where a decrease of the relative flux as a function of timeas observed in all experiments (except for VP Disp. W7520,
ee also Section 3.2).
.4. Influence of solution chemistry on colloidal fouling
.4.1. Influence of pHThe influence of pH on the relative flux for the different
olloidal solutions is presented in Fig. 7 for Desal51HL andFPES10. The results for the other membranes (N30F andesal5DL) were comparable. A distinction has to be madeetween the aluminum and the silica colloids.
For the aluminum colloids (Ludox CL and Aerodisp W630,ig. 7(a)), the lowest relative flux was observed at pH 6 becausef the electrostatic attraction forces between the negativelyharged membrane and the positively charged colloid. At pHand 10, electrostatic repulsion forces between the equally
harged membranes and colloids result in less fouling. Thismplies that the observed coagulation of the aluminum colloidst pH 10 (Table 2) does not give rise to the formation of signif-cant deposits on the membrane surface [18], but rather to theormation of very porous fractal aggregates [19]. For NFPES10and also for N30F, not presented), Fig. 7(a) indicates a differ-nce between the relative fluxes of the aluminum colloids at pHand pH 10. This can be explained by the fact that the iso-
lectric point of these membranes is close to pH 3, so that only
imited interaction forces between the membrane surface and theolloids occur. Due to the strong repulsion forces between theluminum colloids at pH 3 (presented for Ludox CL in Fig. 5(b)),ouling is, however, limited [19].
228 K. Boussu et al. / Journal of Membrane Science 289 (2007) 220–230
Table 5Relative fluxes (in %) for Desal51HL, N30F and NFPES10 as a function of NaClconcentration after filtration of NaCl solutions without colloids and after filtra-tion of Ludox HS-30 and Aerodisp W630 solutions with a colloid concentrationof 100 mg/l
NaCl (M) No colloid Ludox HS-30 Aerodisp W630
0.01 0.05 0.1 0 0.05 0.1 0 0.05 0.1
Desal51HL 89 90 82 96 85 78 87 93 81NN
FcacfiTtbl
3
NcioN
iociomrTnettlodtFmiT
floFd
Fig. 8. Retentions of raffinose and maltose (in %) for Desal51HL, N30F andNw
rtto(tii
brtcca
4
bolsmh
focpalpsc
Acknowledgement
30F 64 91 101 82 86 93 50 92 94FPES10 96 104 106 89 96 94 69 94 94
For the silica colloids (Ludox HS-30 and VP Disp. W7520,ig. 7(b)), the relative fluxes increase with increasing pH. Thisan be explained by the fact that, not only the membrane, butlso (and especially) the colloid surface gets more negativelyharged. As there is no influence of the membrane charge onouling (Section 3.2), the increase in relative flux with increas-ng pH is related to the (major) increase in colloid charge.his results in stronger electrostatic repulsion forces between
he membrane surface and the colloids on the one hand andetween the colloids on the other hand (Fig. 5(b)) and hence iness fouling.
.4.2. Influence of salt concentrationTable 5 presents the relative fluxes of Desal51HL, N30F and
FPES10 after filtration of solutions with different salt con-entrations, with and without the addition of colloids. Bothn the absence and the presence of colloids, the relative fluxf Desal51HL decreases, while the relative flux of N30F andFPES10 increases with increasing salt concentration.In the absence of colloids, the explanation for the decreas-
ng flux of Desal51HL on the one hand and the increasing fluxf N30F and NFPES10 on the other hand with increasing saltoncentration is twofold, starting from the basis that an increas-ng salt concentration leads to a thinner electrical double layerf the membrane. Due to the obtained shielding effect of theembrane charge, the repulsion in the pores decreases, which
esults in more pore blocking and hence in lower fluxes [34].his was observed for Desal51HL (Table 5) and for similaranofiltration membranes in a previous publication [34]. How-ver, for membranes with larger pores (N30F and NFPES10)he electroviscous effect comes into the picture [35]. This elec-roviscous effect is dependent on the membrane pore size (i.e.arger pore size gives larger electroviscous effect) and is basedn the fact that, by increasing the salt concentration, the thinnerouble layer and the lower membrane charge offer less resis-ance to water passage which hence results in higher fluxes [35].or N30F and NFPES10, the electroviscous effect seems to beore influential than the pore blocking effect as indicated by the
ncreasing relative fluxes with increasing salt concentrations inable 5.
This discussion of the difference in behaviour of the relative
ux for Desal51HL on the one hand and N30F and NFPES10n the other hand is also supported by the data, presented inig. 8. Fig. 8 shows that the pore size of Desal51HL is indepen-ent of the salt concentration (as given by the constant sugarti
FPES10 as a function of NaCl concentration after filtration of NaCl solutionsithout colloids.
etention), whereas the pores of N30F and NFPES10 seemo get larger with increasing salt concentrations (as given byhe decreasing sugar retention). The same phenomenon is alsobserved by Bargeman et al. [36]. The presence of larger poresin case of N30F and NFPES10) in the presence of salt implieshat these pores are not so easily blocked (less pore block-ng effect) and that the electroviscous effect even gets moremportant.
In the presence of colloids, Table 5 indicates that theehaviour of the relative flux is similar to the behaviour of theelative flux without colloids. However, a comparison betweenhe relative fluxes in both situations reveals that the colloidsause an extra fouling resistance in addition to the salt (as indi-ated by the smaller relative fluxes in the presence of colloidsnd NaCl).
. Conclusion
The hydrophobicity of nanofiltration membranes seems toe the most influential factor in colloidal fouling, independentf colloid size or colloid charge. Only when filtering small col-oids by rough membranes, “valley clogging” plays an additionalecondary role in membrane fouling. Therefore, the optimalembrane choice to minimize fouling is a membrane with a
ydrophilic, smooth surface.Concerning the influence of the colloid, the least membrane
ouling was observed (at neutral pH and without the additionf salt) for large, negatively charged colloids. The colloid con-entration does not play a role in case of filtering small orositively charged colloids; only during filtration of large, neg-tively charged colloids, the colloid concentration should be asow as possible for a minimal fouling result. Depending on theore size of the membrane, increasing the ionic strength of theolution (at neutral pH) could also be advantageous to minimizeolloidal fouling.
This research was supported by a fellowship from IWT (Insti-ute for the Promotion of Innovation by Science and Technologyn Flanders).
mbran
A
irt
E
wcdH
(f[
t
Ts(or
tw(na
R
[
[
[
[
[
[
[
[
[
[
[
[
[
[
[
[
[
[
[
[
K. Boussu et al. / Journal of Me
ppendix A
The total interaction energy (E) between colloids of radius an a monovalent electrolyte can be calculated as the sum of theepulsion energy and the attraction energy by using the DLVOheory [10,19,29]:
= 64πεa2
d + 2a
(RT
F
)2[tanh
(Fψ
4RT
)]2
exp(−κd)
− H
6
(2
S2 − 4+ 2
S2 + lnS2 − 4
S2
)
ith d the distance between colloids (m); R the universal gasonstant (8.314 J/(mol K)); T the temperature (K); F the Fara-ay constant (96,487 C/mol); ψ the surface potential (V); H theamaker constant (J); S = (d + 2a)/a.The surface potential (ψ) is calculated from the zeta potential
ζ), which is generally considered to be the potential at 2 A (�x)rom the surface, by using the Eversole and Boardman equation37]:
anh
(Fψ
4RT
)= exp
(ln
[tanh
(Fζ
4RT
)]+ κ�x
)
he Hamaker constant (H) is calculated from the Hamaker con-tant of the colloid (H11) and from the Hamaker constant of waterH22) as H = (
√H11 − √
H22)2. H11 is equal to 6.6 × 10⁻²⁰ Jr 15.2 × 10⁻²⁰ J in case of silica or aluminum colloids [38]espectively, while H22 is equal to 3.78 × 10⁻²⁰ J [19].
The interaction energy (E) has to be compared withhe driving force of the Brownian motion of the colloids,hich is proportional to kT, with k the Boltzmann constant
1.38 × 10⁻²³ J/K). When the ratio (E/(kT)) is larger than 20,o coagulation occurs and the stability of the dispersion is guar-nteed.
eferences
[1] W. Norde, Colloids and Interfaces in Life Sciences, Dekker, New York,2003.
[2] R. Liikanen, J. Yli-Kuivila, R. Laukkanen, Efficiency of various chemicalcleanings for nanofiltration membrane fouled by conventionally-treatedsurface water, J. Membr. Sci. 195 (2002) 265–276.
[3] H.F. Shaalan, Development of fouling control strategies pertinent tonanofiltration membranes, Desalination 153 (2002) 125–131.
[4] V.V. Tarabara, I. Koyuncu, M.R. Wiesner, Effects of hydrodynamics andsolution ionic strength on permeate flux in cross-flow filtration: directexperimental observation of filter cake cross-sections, JMS 241 (2004)65–78.
[5] M. Elimelech, X. Zhu, A.E. Childress, Hong, Role of membrane surfacemorphology in colloidal fouling of cellulose acetate and composite aro-matic polyamide reverse osmosis membranes, J. Membr. Sci. 127 (1997)101–109.
[6] X. Zhu, M. Elimelech, Colloidal fouling of reverse osmosis membranes:measurements and fouling mechanisms, Environ. Sci. Technol. 31 (1997)3564–3662.
[7] S. Lee, J. Cho, M. Elimelech, Combined influence of natural organic matterand colloidal particles on nanofiltration membrane fouling, J. Membr. Sci.262 (2005) 27–41.
[8] J. Warczok, M. Ferrando, F. Lopez, C. Guell, Concentration of apple andpear juices by nanofiltration at low pressures, J. Food Eng. 63 (2004) 63–70.
[
e Science 289 (2007) 220–230 229
[9] E.M. Vrijenhoek, S. Hong, M. Elimelech, Influence of membrane sur-face properties on initial rate of colloidal fouling of reverse osmosis andnanofiltration membranes, J. Membr. Sci. 188 (2001) 115–128.
10] E.M.V. Hoek, S. Bhattacharjee, M. Elimelech, Effect of membrane surfaceroughness on colloid–membrane DLVO interactions, Langmuir 19 (2003)4836–4847.
11] B. Van der Bruggen, D. Segers, C. Vandecasteele, L. Braeken, A. Volodin,C. Van Haesendonck, How a microfiltration pre-treatment affects the per-formance in nanofiltration, Sep. Sci. Technol. 39 (2004) 1443–1459.
12] B. Van der Bruggen, J.H. Kim, F.A. DiGiano, J. Geens, C. Vandecasteele,Influence of microfiltration pre-treatment on nanofiltration performance foraqueous solutions containing particles and an organic foulant, Sep. Purific.Technol. 36 (2004) 203–213.
13] M. Zhang, L. Song, Mechanisms and parameters affecting flux declinein cross-flow microfiltration and ultrafiltration of colloids, Environ. Sci.Technol. 34 (2000) 3767–3773.
14] A.R. Costa, M.N. de Pinho, Effect of membrane pore size and solutionchemistry on the ultrafiltration of humic substances solutions, J. Membr.Sci. 255 (2005) 49–56.
15] L. Song, K.L. Chen, S.L. Ong, W.J. Ng, A new normalization methodfor determination of colloidal fouling potential in membrane processes, J.Colloid Interface Sci. 271 (2004) 426–433.
16] M.S. Chun, H.I. Cho, I.K. Song, Electrokinetic behaviour of membranezeta potential during the filtration of colloidal suspension, Desalination148 (2002) 363–367.
17] G. Singh, L. Song, Quantifying the effect of ionic strength on colloidalfouling potential in membrane filtration, J. Colloid Interface Sci. 284 (2005)630–638.
18] S.G. Yiantsios, A.J. Karabelas, The effect of colloid stability on membranefouling, Desalination 118 (1998) 143–152.
19] P. Van der Meeren, H. Saveyn, S.B. Kassa, W. Doyen, R. Leysen,Colloid–membrane interaction effects on flux decline during cross-flowUF of colloidal silica on semi-ceramic membranes, Phys. Chem. Chem.Phys. 6 (2004) 1408–1412.
20] S. Lee, J. Cho, M. Elimelech, Influence of colloidal fouling and feed waterrecovery on salt rejection of reverse osmosis and nanofiltration membranes,Desalination 160 (2004) 1–12.
21] K. Boussu, J. De Baerdemaeker, C. Dauwe, M. Weber, K.G. Lynn, D.Depla, S. Aldea, I.F.J. Vankelecom, C. Vandecasteele, B. Van der Bruggen,Physico-chemical characterization of nanofiltration membranes, Submittedfor publication.
22] M. Dubois, K.A. Gilles, J.K. Hamilton, P.A. Rebers, F. Smith, Colorimetricmethod for determination of sugars and related substances, Anal. Chem.28 (1956) 350–356.
23] K. Boussu, B. Van der Bruggen, A. Volodin, J. Snauwaert, C. Van Hae-sendonck, C. Vandecasteele, Roughness and hydrophobicity studies ofnanofiltration membranes using different modes of AFM, J. Colloid Inter-face Sci. 286 (2005) 632–638.
24] H. Oshima, Approximate analytic expression for the electrophoretic mobil-ity of a spherical colloidal particle, J. Colloid Interface Sci. 239 (2001)587–590.
25] L. Rabinovich-Guilatt, P. Couvreur, G. Lambert, D. Goldstein, S. Benita,C. Dubernet, Extensive surface studies help to analyse zeta potentialdata: the case of cationic emulsions, Chem. Phys. Lipids 131 (2004)1–13.
26] M. Kosmulski, A literature survey of the differences between the reportedIEP and their discussion, Coll. Surf. A 222 (2003) 113–118.
27] W.H. Kuan, S.L. Lo, M.K. Wang, pH effect on the surface and bulk char-acteristics of metallic cations/SiO2 suspensions, Water Sci. Technol. 42(2000) 441–446.
28] X. Zhu, M. Elimelech, Fouling of reverse osmosis membranes by aluminumoxide colloids, J. Environ. Eng. 121 (1995) 884–892.
29] J.A. Brant, A.E. Childress, Membrane–colloid interactions: comparison of
extended DLVO predictions with AFM force measurements, Environ. Eng.Sci. 19 (2002) 413–427.30] M.S. Chun, W.C. Park, Time evolution of electrokinetic flow-inducedstreaming potential and flux in dead-end and cross-flow filtration of colloidsthrough nanopores, J. Membr. Sci. 243 (2004) 417–424.

2 mbran
[
[
[
[
[
[
[
30 K. Boussu et al. / Journal of Me
31] J.C. Crittenden, R.R. Trussell, D.W. Hand, K.J. Howe, G. Tchobanoglous,Water Treatment: Principles and Design, 2nd ed., John Wiley & Sons, NewJersey, 2005.
32] S. Bhattacharjee, M. Elimelech, Surface element integration: a novel tech-nique for evaluation of DLVO interaction between a particle and a flat plate,J. Colloid Interface Sci. 193 (1997) 273–285.
33] E.M. Hoek, G.K. Agarwal, Extended DLVO interactions between spher-ical particles and rough surfaces, J. Colloid Interface Sci. 298 (2006)
50–58.34] K. Boussu, Y. Zhang, J. Cocquyt, P. Van der Meeren, A. Volodin, C.Van Haesendonck, J.A. Martens, B. Van der Bruggen, Characterization ofpolymeric nanofiltration membranes for systematic analysis of membraneperformance, J. Membr. Sci. 278 (2006) 418–427.
[
e Science 289 (2007) 220–230
35] I.H. Huisman, B. Dutre, K.M. Persson, G. Tragardh, Water permeabil-ity in ultrafiltration and microfiltration: viscous and electroviscous effects,Desalination 113 (1997) 95–103.
36] G. Bargeman, J.M. Vollenbroek, J. Straatsma, C.G.P.H. Schroen, R.M.Boom, Nanofiltration of multi-component feeds: interaction between neu-tral and charged components and their effect on retention, J. Membr. Sci.247 (2005) 11–20.
37] W.G. Eversole, W.W. Boardman, A new method for the determination of
electrokinetic potential in the flow of a semiconducting liquid through asingle capillary, J. Phys. Chem. 46 (1942) 914–926.38] V. Medout-Marere, A simple experimental way of measuring the Hamakerconstant A11 of divided solids by immersion calorimetry in apolar liquids,J. Colloid Interface Sci. 228 (2000) 434–437.