Influence of membrane and colloid characteristics on fouling of nanofiltration membranes
Upload
khangminh22Category
view
0download
0
HAL Id: hal-03089688https://hal.archives-ouvertes.fr/hal-03089688
Submitted on 28 Dec 2020
HAL is a multi-disciplinary open accessarchive for the deposit and dissemination of sci-entific research documents, whether they are pub-lished or not. The documents may come fromteaching and research institutions in France orabroad, or from public or private research centers.
L’archive ouverte pluridisciplinaire HAL, estdestinée au dépôt et à la diffusion de documentsscientifiques de niveau recherche, publiés ou non,émanant des établissements d’enseignement et derecherche français ou étrangers, des laboratoirespublics ou privés.
Nanofiltration performance prediction for brackish waterdesalination: case study of Tunisian groundwater
Mohamed Ayman Kammoun, Sana Gassara, John Palmeri, Ben Amar, AndréDeratani
To cite this version:Mohamed Ayman Kammoun, Sana Gassara, John Palmeri, Ben Amar, André Deratani. Nanofiltrationperformance prediction for brackish water desalination: case study of Tunisian groundwater. Desali-nation and Water Treatment, FHF, 2020, 181, pp.27-39. 10.5004/dwt.2020.25100. hal-03089688

1
Nanofiltration performance prediction for brackish water desalination: case study of
Tunisian groundwater
Mohamed Ayman Kammouna,b, Sana Gassarab, John Palmeric, Raja Ben Amara, André Deratanib
a Laboratoire Sciences des Matériaux et Environnement, Université de Sfax, Faculté des Sciences
de Sfax, Rte. De Soukra Km 4, 3000 Sfax, Tunisia b Institut Européen des Membranes, IEM, UMR-5635, ENSCM, CNRS, Univ Montpellier,
Montpellier, France c Laboratoire Charles Coulomb (L2C), Univ Montpellier, CNRS, Montpellier, France
Abstract
In response to the fresh water scarcity, Tunisia is utilizing more and more membrane
desalination of unconventional resources, including brackish waters and seawater. The
widespread reserves of groundwaters and their low salinity make this resource of special interest.
Two predominant ionic compositions have been identified depending on their relative proportion
of sulfate to chloride ions. The question arising for the decision-makers concerns the choice of
membrane technology and, therefore, of membrane. Two nanofiltration (NF) membranes (NF270
and NF90) and a reverse osmosis (RO) one (BW30) were tested in a desalination study of
synthetic feeds reproducing the ionic composition of three representative groundwaters.
Sulfate/chloride ratio appears to be the key factor for the membrane choice to obtain good
quality drinking water meeting the Tunisian standards. Moreover, validation of two prediction
tools was investigated: ROSA, software provided by the membrane manufacturer and
Nanoflux®, software specifically designed for NF. The experimental NF results are well fitted by
the Nanoflux® simulations. We concluded that ROSA cannot generally provide good NF
predictions because it does not take into account the electric interactions between membrane and
feed.
KeywordsMembrane desalination, Groundwater, Nanofiltration, Performance prediction,
Software validation
2
1. Introduction
The Southern Mediterranean countries have been identified as undergoing one of the most
important water crises in the world. This is the case for Tunisia, one of these countries, which
has been suffering for several years from a water shortage that makes problematic the drinking
water supply in some areas and at particular times of the year. Several studies predict that rising
living standards and the development of the agriculture, industry and tourism sectors, will
exacerbate the water scarcity in such a way that supply disruption could be extended to the whole
of the country [1]. Indeed, according to the Tunisian national water supply agency (SONEDE),
the consumption of drinking water, which attained 381 Mm3 in 2010, is expected to increase to
450 and 500 Mm3 in 2020 and 2030, respectively [2].
Considering the growing water scarcity and the increasing demand for drinking water,
Tunisia is moving more and more towards the exploitation of unconventional resources including
brackish groundwater reserves and, more recently, seawater. Tunisian groundwaters can be
roughly classified into two predominant types of brackish waters: (i) those coming from deep
aquifers with a salinity between 1.5 and 3 g.L-1 comprising a high proportion of sulfate, calcium
and magnesium divalent ions (type 1) and (ii) those coming from sedimentary coastal aquifers
with a salinity between 3 and 5 g.L-1 (type 2), [3]. In recent years, the salinization of the latter
has resulted from intrusion of marine water caused by the over-exploitation of these resources. In
this case, the main contaminants are the chloride and sodium ions [4].
Desalination becomes then essential to avoid soil sterilization in agricultural watering and to
make water suitable for human consumption and everyday household needs [6]. Reverse osmosis
(RO) is the most common membrane technology used for performing this task [7]. This process,
based on dense membranes operating at high pressure, produces overqualified permeate in most
of the cases [8]. Therefore, RO suffers from the following three key limitations: high energy
consumption, low water recovery, and excessive membrane fouling [9-11]. Nowadays, for
obvious economic reasons one the most important issues is the energetic impact of the RO
desalination process. One way of overcoming this challenge is the integration of technologies
less demanding in terms of energy consumption, such as nanofiltration (NF). NF shows clear
advantages over RO, including higher permeate fluxes and lower operating pressure, resulting in
lower investment costs. Moreover, although ion rejection is lower than for RO technology,

3
requirement specifications can often be met using NF, thereby providing a better cost-effective
option in many cases [12-15].
In contrast to RO, NF membranes are considered as porous and exhibit nominal cutoffs
between 200 and 1000 Da [12, 16]. Only the membranes with the tightest pores are used for
desalination treatment. Two groups can be distinguished in the literature regarding the rejection
of monovalent ions (NaCl), as non-exhaustively presented in Table 1.
Table 1: Some commercial nanofiltration membranes classified with respect to their mono- and
divalent salt rejection
Membrane Manufacturer NaCl rejection (%)
MgSO4 rejection (%)
Reference
1st Group NF270
NFX
Trisep TS40
DK, DL
Dow Filmtec
Snyder
Microdyn Nadir
GE Osmonics
50
40 40
<50
>98
99
99
>98
[17]
[18]
[19]
[12] [20]
2d Group NF90
Trisep TS80
ESNA1
Dow Filmtec
Microdyn Nadir
Nitto Hydranautics
> 90
80
>80
>98
99
>86 (CaCl2)
[17]
[21]
[22]
The first group, including for example the NF270 (Dow Filmtec), NFX (Snyder), DK
(GE osmonics) NF membranes, is characterized by a high selectivity between monovalent and
divalent ions for single solutions with typical rejections of less than 60% (NaCl) and higher than
90% (MgSO4), respectively. On the other hand, these membranes offer higher permeate flow
rates than the second group (Table 1), which have rejection properties closer to RO membranes.
The 1st membrane group is generally suggested for cutting down the total hardness of surface,
sea and ground waters due to their high mono/divalent ion selectivity [23-25] while the 2nd group
is preferred for removing the total salinity and pollutants [26]. However, it was also reported that
the NaCl concentration has a strong impact on salinity removal performance.
Therefore, the data in Table 1 are only indicative as the ion composition of real solutions
and the precise plant configuration and operating conditions all have a dramatic effect on the
performances of NF membranes. The electrostatic interactions between the ionic species in a
multi-component feed and between the ions and the membrane charge are highly non-linear and

4
cannot, in general, be predicted straightforwardly using as sole input single salt rejections
performances. There are furthermore currently ill-understood non-electrostatic interactions
(steric, dielectric, hydration, …) that complicate quantitative modeling [27]. It is therefore
usually impossible to predict the NF performance of a given membrane and therefore judge its
suitability for a given application from the limited performance characteristics communicated by
the membrane manufacturers.
The question that arises from the previous discussion is how to decide which kind of
membrane technology (NF or RO) and membrane should be used for desalting the different types
of Tunisian groundwaters. This requires having an efficient modeling tool to save time by
limiting the number of experimental validations. In the case of RO, most of the manufacturers
provide prediction software such as for example ROSA (Dow Filmtech) [28]. For the reasons
mentioned above, it is more difficult to have the equivalent for NF. It should be noted that the
ROSA software, which is well-recognized as a suitable tool for estimating RO membrane
performance in relation to the plant operating conditions, also has an NF database. In this paper,
comparison of performance prediction with the Nanoflux® software, which is well adapted for
NF transport mechanism, was carried out in the case of the NF270 and NF90 membranes, each
being associated with a different group (Table 1). To do so, we confronted the model predictions
with the results of filtration experiments carried out using the two simulated major types of
Tunisian groundwaters. The obtained data were discussed in terms of water quality and
productivity efficiency in order to optimize the membrane and process choice vs. the ground
water ionic composition.
2. Materials and methods
2.1. Theory
The structure of NF membranes was assumed to be a bundle of straight cylindrical
capillaries characterized by their pore radius rp and effective length leff (Fig. 1) and the external
solutions to be ideal and perfectly stirred so that concentration polarization could be neglected in
the present study. The system was considered isothermal with a temperature T of 298 K. The
composition of the feed was fixed by the concentration of the N ions making up the mixture,
each denoted by a concentration C (i=1..N). In the same way,
and ic denote their
concentration in the permeate and inside the membrane, respectively.
5
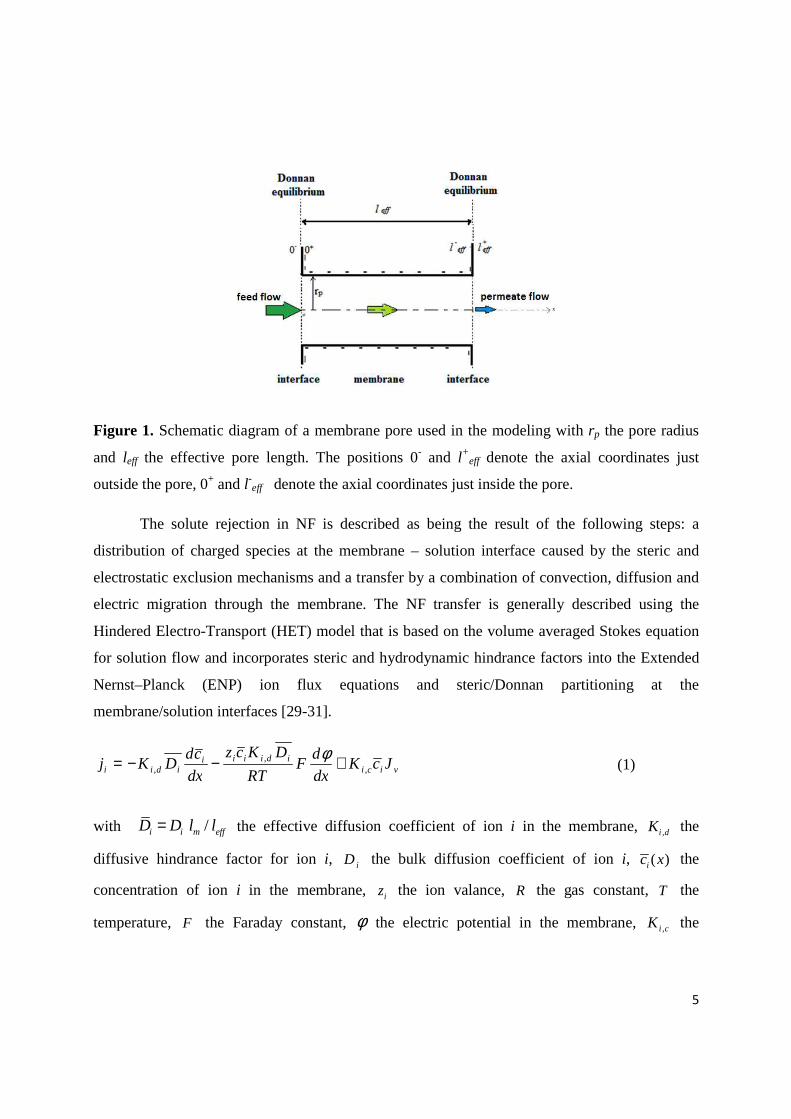
Figure 1. Schematic diagram of a membrane pore used in the modeling with rp the pore radius
and leff the effective pore length. The positions 0- and l+eff denote the axial coordinates just
outside the pore, 0+ and l-eff denote the axial coordinates just inside the pore.
The solute rejection in NF is described as being the result of the following steps: a
distribution of charged species at the membrane – solution interface caused by the steric and
electrostatic exclusion mechanisms and a transfer by a combination of convection, diffusion and
electric migration through the membrane. The NF transfer is generally described using the
Hindered Electro-Transport (HET) model that is based on the volume averaged Stokes equation
for solution flow and incorporates steric and hydrodynamic hindrance factors into the Extended
Nernst–Planck (ENP) ion flux equations and steric/Donnan partitioning at the
membrane/solution interfaces [29-31].
(1)
with /i i m effD D l l= the effective diffusion coefficient of ion i in the membrane, ,i dK the
diffusive hindrance factor for ion i, iD the bulk diffusion coefficient of ion i, ( )ic x the
concentration of ion i in the membrane, iz the ion valance, R the gas constant, T the
temperature, F the Faraday constant, φ the electric potential in the membrane, ,i cK the
viciidiiii
idii JcKdx
dF
RT
DKcz
dx
cdDKj ,
,, +−−= φ
6
convective ion hindrance factor (vJ is the volume flux density based on the membrane area). Eq.
(1) has to be coupled with an explicit expression of the local electroneutrality inside pores:
1
0N
i i mi
z c X=
+ =∑ (2)
where p
m FrX
σ2= is the effective membrane charge (moles/m3 of pore volume) for cylindrical
pores and related to the surface charge density σ. The normalized membrane charge is defined
as:
=
(3)
with is the total salt concentration. Furthermore, in NF, the electric current density across the
membrane vanishes,
1
0N
c i ii
J F z J=
= =∑ (4)
which allows one to obtain a relation between the electric potential gradient and the ionic
concentrations. The volume averaged Stokes equation is given:
0
1v
p
dP dJ
L dx dx
φρ= − − (5)
where is the pure water permeability and
1
N
i ii
F z cρ=
= ∑ the local ion charge density.
In NF the HET equations must be solved using the filtration condition boundary. First, the ionic
molar fluxes iJ are related to solution volume flux Jv as follows :
pi i vJ C J= (6)
Second, the distribution of ions at the membrane/solution interfaces is described by the following
modified Donnan equations,
(0 |0 )(0 ) exp / ( )f
i i i i Dc C z F RTφ − +
+ = Φ − ∆
(7)
( | )( ) exp / ( )
eff eff
pi eff i i i D l l
c l C z F RTφ + −− = Φ − ∆
(8)
where 0- | 0+ and −effl | +
effl denote the membrane/solution interfaces at the feed side and the
permeate side, respectively. iΦ is the steric partitioning coefficient of ion i defined as the ratio

7
between the available section (i.e. taking into account the finite size of the ion) and the pore
cross section and Dφ∆ is the dimensionless Donnan potential arising at each nanopore/external
solution interface.
Finally, at the one membrane element level theoretical ion rejection predictions for multi-
electrolyte solutions can be obtained from:
1p
ii f
i
CR
C= − (9)
NanoFlux® is a commercial nanofiltration simulation program (CNRS) that can solve
numerically the HET model for up to eleven ionic species and composite membrane systems
with up to three distinct layers. Given the composition of the feed solution, the characteristics of
the membrane, and the configuration of the NF installations, NanoFlux® uses an internal single
salt database to predict the NF performance for arbitrary ionic mixtures in terms of ionic
rejection and volume flux density [32-35].
2.2. Experimental part
Materials
Two commercial NF membranes (NF90 and NF270) and one RO membrane (BW30)
from Dow Filmtec were used in this work. The solutions used to characterize the charge and the
performance properties of the membranes were prepared by dissolving salts of analytical grade
salts without further purification in deionized water (18 MΩ/cm, Millipore Milli-Q): NaCl,
CaCl2, Na2SO (Carlo Erba) and MgSO4 (Merck Eurolab). All the solutions were filtered (0.45
µm) prior to use to remove the residual insoluble impurities.
Nanofiltration pilot
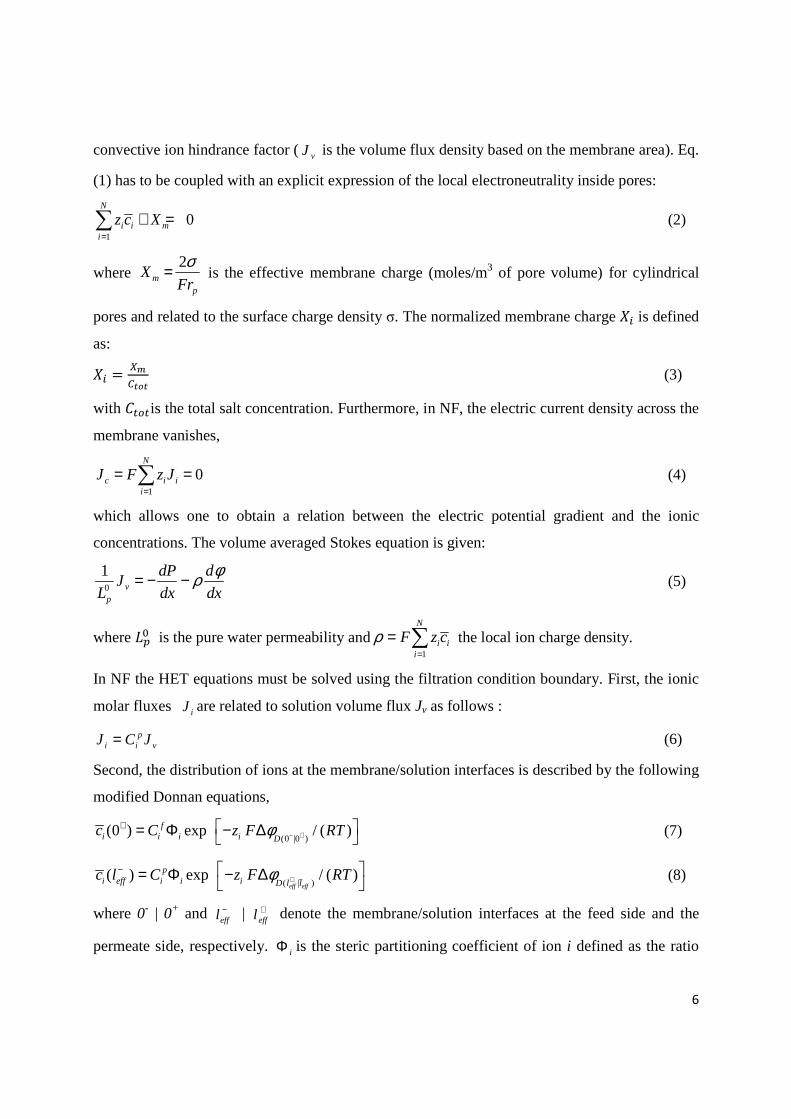
Tangential filtration experiments were carried out using a nanofiltration pilot (Figure 2)
consisting of a feed tank (1) equipped with a temperature control loop (2), a positive
displacement pump (3), a 2.5” stainless steel pressure vessel accommodating 2540 filtration
element (4), a pressure regulating valve (5) and a sampling loop (6). A programmable logic
controller (7) is used to control the equipment and to retrieve the data from the sensors (feed and
permeate flow, feed pressure and retentate, feed tank level). Sampling loop sensors allow pH,
temperature and conductivity measurements of the retentate and permeate. The flow rate of the
feed was set at 7.9 L.min-1. The membranes were first immersed at least overnight in water
8
before being used in any experimental work and each membrane was conditioned by filtering
pure water at 17 bar during 1 hour to avoid any compression effects and to establish leak
tightness. All filtration experiments were carried out with an applied pressure range of 2–15 bar
at room temperature (25°C).
Figure 2. Presentation of the nanofiltration pilot used in this study: (1) feed tank; (2)
temperature control loop; (3) pressure pump; (4) 2.5” stainless steel pressure vessel; (5) pressure
regulating valve; (6) sampling loop; (7) programmable logic controller.
Permeability measurement
Membrane permeability was determined from the volume flux (Jv) by circulating water
through the membrane system. Jv (L.m-2.h-1) was calculated using Eq (10):
=
(∆.) (10)
where Vp (L) is the volume of permeate, ∆t (h) is the permeation time and A (m2) is the active
membrane surface area. Membrane permeability (L.m-2.h-1.bar) was determined from the slope
of the linear variation of Jv as a function of applied pressure P (bar).
Ionic composition of simulated brackish waters from South Tunisia
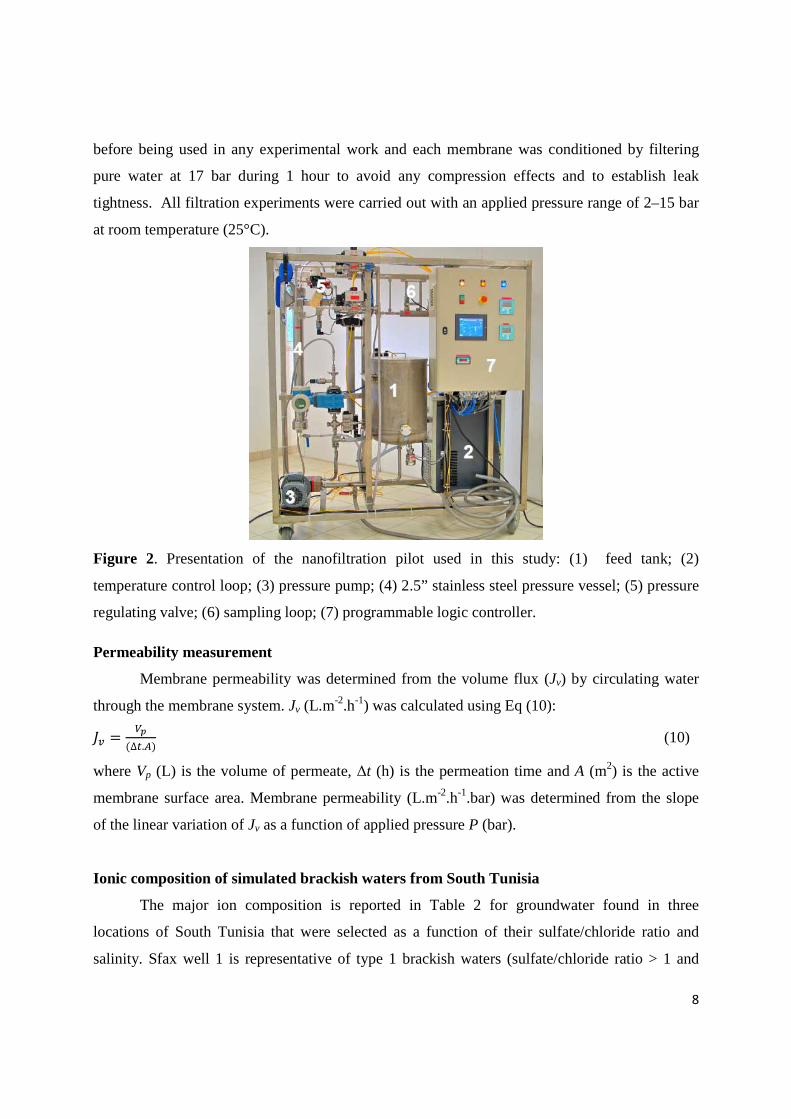
The major ion composition is reported in Table 2 for groundwater found in three
locations of South Tunisia that were selected as a function of their sulfate/chloride ratio and
salinity. Sfax well 1 is representative of type 1 brackish waters (sulfate/chloride ratio > 1 and
9
salinity < 3 g/L) and Sfax well 2 and Gabés of type 2 ones (sulfate/chloride ratio < 1 and salinity
> 3 g/L). Synthetic waters were prepared from the compositions reported in Table 2 and denoted
Feed 1, Feed 2 and Feed 3, respectively. Each of these parameters is compared with the
corresponding value of Tunisian standards for drinking water. The ion composition did not show
the presence of HCO-3 at least not to a large extent. Feed 3 contains about 188 mg/L accounting
for the higher pH value of 8. This concentration is, however, low compared to the other ones and
was therefore not considered a relevant parameter even if it was taken into account in the
preparation of the simulated feed.
Table 2: Physicochemical parameters of 3 brackish groundwaters found in the south of Tunisia
compared with the Tunisian standards for drinking water.
Parameters Sfax well 1 (Feed 1)
Sfax well 2 (Feed 2)
Gabés (Feed 3)
Tunisian standards NT 09.14 (2013) [6]
pH 6.2 6 8 6.5 – 8.5
Na+ (mg/L) 571 837 1430 200
Cl- (mg/L) 500 1400 1900 500
Mg2+ (mg/L) 77 99 106 100
Ca2+ (mg/L) 74 208 320 200
SO42- (mg/L)
HCO3- (mg/L)
1000
-
793
-
1450
188
500
-
Salinity of simulated solutions
(mg/L)
2222
3337
5394
]200 - 2000[
Salt rejection measurement
The salt concentrations in permeate and feed solutions were determined by ion
chromatography (DIONEX ICS- 1000) analysis. The salt rejection was calculated using Eq (9).
Zeta potential
The zeta potential is the electric potential in the interfacial double layer at the location of
the slip plane relative to a point in the bulk fluid away from the interface. It characterizes the
membrane surface charge and can be used for the quantification of its magnitude. The membrane
surface zeta potential was determined with a SurPASS electro-kinetic analyzer (Anton Paar,
10
GmbH) based on the streaming potential method. An adjustable gap cell in which the membrane
samples were mounted was used with a height of about 100 µm [36,37]. The KCl electrolyte
solution at different concentrations was circulated in the cell between two pieces of membrane
that were immersed in the electrolyte overnight before the measurement. The pH of the
electrolyte was controlled by HCl 10-1 M and NaOH 10-1 M solutions. The zeta potential was
calculated using the Helmholtz–Smoluchowski equation from the measured streaming voltage as
a function of pH (from pH 4 to pH 10).
3. Results and discussion
Three simulated solutions with ionic compositions representative of brackish
groundwaters found in South Tunisia (Table 2) were filtered using two NF membranes (NF90
and NF270) and one RO membrane (BW30) for comparison. The salinity spans the range of
2222–5394 mg/L with sulfate/chloride ratio varying from 2 to about 0.5. Two different NF
modeling tools (Rosa and Nanoflux® available from Dow Filmtec and CNRS, respectively) were
used to predict the permeate flow rate and the salt rejection as a function of the applied pressure
in the range of 2 – 14 bar. The obtained simulation results were compared with the experimental
ion rejection data.
3.1. Desalination performances of NF and RO membranes
Feed 1 is characterized by the lowest salinity with a value that exceeds the standard of
Tunisian regulation for drinking water (Table 2) by only 10 %. However, it contains high
concentrations of sodium and sulfate ions with values that exceed the norms by 65 and 50 %,
respectively. Feed 2 has intermediate salinity (3337 mg/L) with high concentrations of sodium,
chloride and sulfate exceeding the standards by approximately 76 %, 64 % and 37 %
respectively. Considering these data, it was expected that NF could lead to permeate with
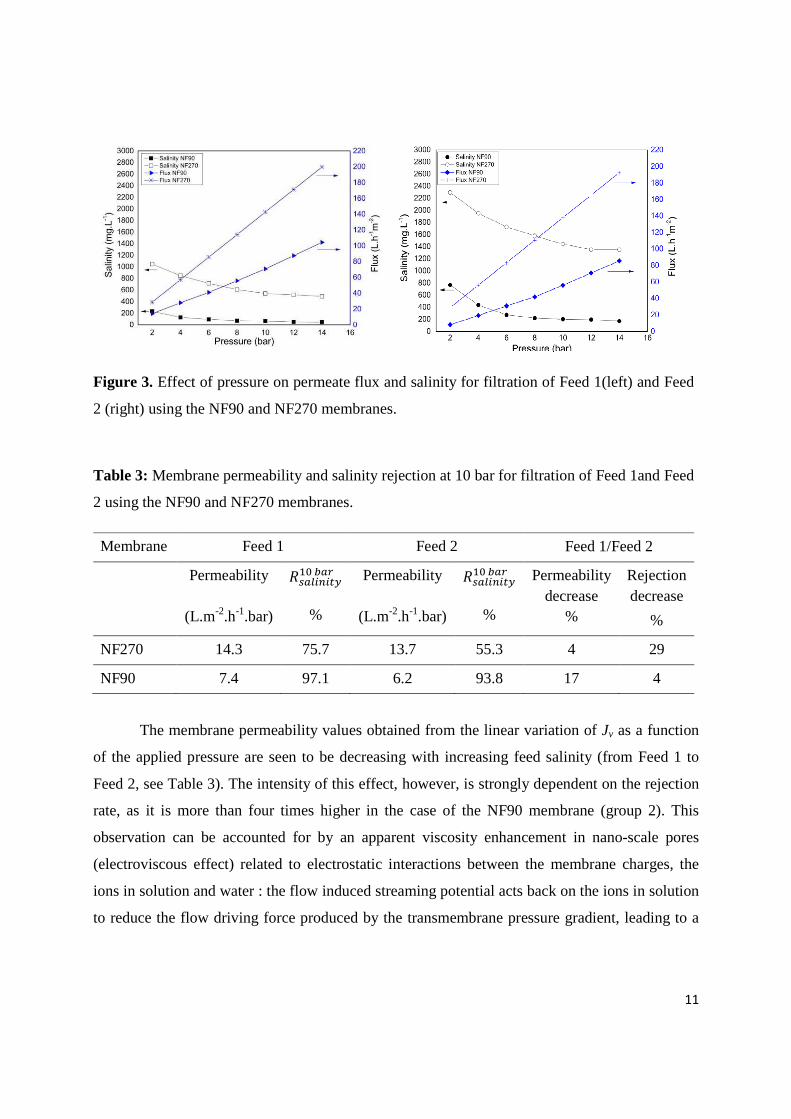
composition meeting the Tunisian regulation for drinking water. Figure 3 shows the NF90 and
NF270 performances in terms of filtration flux (Jv) and permeate salinity as a function of the
applied pressure for Feed 1 and Feed 2.
11
Figure 3. Effect of pressure on permeate flux and salinity for filtration of Feed 1(left) and Feed
2 (right) using the NF90 and NF270 membranes.
Table 3: Membrane permeability and salinity rejection at 10 bar for filtration of Feed 1and Feed
2 using the NF90 and NF270 membranes.
Membrane Feed 1 Feed 2 Feed 1/Feed 2
Permeability
(L.m-2.h-1.bar)
!#$
%
Permeability
(L.m-2.h-1.bar)
!#$
%
Permeability decrease
%
Rejection decrease
%
NF270 14.3 75.7 13.7 55.3 4 29
NF90 7.4 97.1 6.2 93.8 17 4
The membrane permeability values obtained from the linear variation of Jv as a function
of the applied pressure are seen to be decreasing with increasing feed salinity (from Feed 1 to
Feed 2, see Table 3). The intensity of this effect, however, is strongly dependent on the rejection
rate, as it is more than four times higher in the case of the NF90 membrane (group 2). This
observation can be accounted for by an apparent viscosity enhancement in nano-scale pores
(electroviscous effect) related to electrostatic interactions between the membrane charges, the
ions in solution and water : the flow induced streaming potential acts back on the ions in solution
to reduce the flow driving force produced by the transmembrane pressure gradient, leading to a
12
decrease in slope that can be interpreted as an enhanced apparent viscous (on the other hand at
the relatively low salt concentrations studied osmotic pressure effects are weak) [31,33].
As expected from the diffusion / convection transfer mechanism, the passage of ions
across the membrane decreases with an increase of applied pressure (Figure 3). At low pressure
and permeate flow rate, the weak concentration difference between both sides of the membrane
induced by the convective transport is counterbalanced by diffusive transport from the
concentrated solution to the diluted one which enables a high passage of ions. The permeate flux
increases with the trans-membrane pressure reducing the diffusion contribution with respect to
convection leading to the observed decrease of ion passage until a high-pressure plateau is
reached.
Feed 2 mainly differs from Feed 1 by its chloride content, which is about three times
higher (Table 2). The lower rejection of monovalent ions by membranes of group 1 could then
primarily be responsible for the strong decrease of ion rejection from Feed 1 to Feed 2 observed
in the case of the NF270 membrane (Table 3). Another important factor is related to how an
increase of salinity in the feed solution causes the screening of membrane charges, thereby
inducing a reduction of Donnan exclusion and resulting in an alteration of both NF membrane
performances. It should be noted that the water quality produced in all cases is in accordance
with the Tunisian standards in term of salinity (<2000 mg/L). However, treatment of Feed 1 by
NF90 leads to permeate with a too low-level salinity requiring a remineralization operation. The
ion composition of permeates obtained using NF270 and NF90 membranes at respective
transmembrane pressure of 6 and 10 bar (recovery about 15 %) is given in Table 4. The value of
10 bar and 6 bar were chosen since it appears to be a good compromise between salinity removal
and applied pressure. In that case, most permeates fully comply with the Tunisian standards for
drinking water as defined in Table 2 except in the case of treatment of Feed 2 by NF270 where
the sodium and chloride contents in the permeate exceeded the required values. These results
confirm that membranes of group 1 are not appropriate for treating waters with too high content
in monovalent ions due to their high divalent/monovalent selectivity.

13
Table 4: Ion composition of permeates and productivity at 6 bar (NF270) and 10 bar (NF90).
SO42-
mg/L
Cl-
mg/L
Mg2+
mg/L
Ca2+
mg/L
Na+
mg/L
Salinity
mg/L
Permeate flow rate
L/h.m-2
Recovery
(%)
NF270 Feed 1 55.4 384 9 11.2 245.7 705.3 85.6 18
Feed 2 24.8 1207* 15.2 46.8 433* 1727 83.2 17.5
NF90 Feed 1 5.7 37 0.58 0.67 21 65* 71 15.6
Feed 2 2.9 137 0.52 2.4 59 201 56 13.1 * Not complying with the Tunisian standards for drinking water.
To continue the comparison, NF270 is more productive and less energy consuming in
terms of filtration flux than NF90 whereas its permeate salinity is much higher. NF270 (and
group 1 NF membranes) can be considered as the right choice to treat Tunisian groundwaters
with a low NaCl content without any need to remineralize permeate. On the other hand, NF90
(and group 2 NF membranes) are particularly well-suited to treat waters similar to Feed 2.
To highlight in greater detail the behavior of the two studied membranes, representative
of the two groups defined in introduction (Table 1), the rejection performance for each ion is
reported in Figure 4.
Figure 4. Rejection of monovalent and bivalent ions by NF270 and NF90 membranes at a fixed
trans-membrane pressure of 10 bar for Feed 1 and Feed 2.
14
The difference in separation performance between the two membranes is related to their
porous structure, as NF270 is known to have a larger pore size than that of NF90 [38-39].
Moreover, they both have a negatively charged surface at neutral pH as determined by their zeta
potential [39]. Owing to its restricted pore size, which impedes the convective and diffusive
mobility of ions, NF90 can retain more than 98 % of the divalent ions and about 90 % of the
monovalent ones for the two types of feed solutions. The quasi-quantitative rejection of sulfate
ions by the two membranes originates from strong electrostatic interactions between the -2 ion
charge and the membrane surface. In contrast to NF90, NF270 rejects more selectively divalent
anion than divalent cations. Actually, cations act as membrane counter-ions and their passage
depends on the rejection of the other ions to ensure the electroneutrality of concentrate and
permeate according to the Donnan equilibrium effects. In the case of feed 1, the sulfate feed
concentration is higher than that of chloride. The divalent Mg2+ and Ca2+ cations are therefore
highly retained to ensure electroneutrality in the concentrate. By contrast, in the case of feed 2,
the chloride feed concentration is higher than that of sulfates. The passage of chloride through
the membrane because of its lower valance, smaller size and its high mobility causes the passage
of a certain number of divalent counter ions (besides the monovalent ones) to ensure
electroneutrality in both permeate and concentrate sides. Consequently, the rejection of divalent
cations is greater in the case of feed 1 than in feed 2 [38]. In all cases, chloride can be seen in
Figure 4 as the less retained ion and appears to be a discriminating and limiting parameter. Then,
monitoring the concentration of chlorides in permeate is essential to verify the compliance of
nanofiltered water with the standards.
To conclude this part, it is really interesting to compare the performance of brackish
water reverse osmosis (BWRO) membranes with that of the group 2 NF ones. Figure 5 shows the
variation of permeate flow rate and salinity as a function of applied pressure for filtration using
NF90 and BW30 in the case of the groundwater Feed 3 having a higher salinity than Feed 1 and
Feed 2 with a large content of both chloride and sulfate anions. The salinity of permeate meets
the requirement of Tunisian standards for optimum applied pressures of about 10 and 6 bar in the
case of NF90 and BW30, respectively. Beyond these values, the permeate needs to be
remineralized. It should be noted that all the ion parameters are fully in compliance with the
requirement of the Tunisian regulation for drinking water. In Figure 5, it can be seen that the

15
osmotic pressure of Feed 3 is more marked than those of Feed 1 and 2. The linear regression not
passing through origin gives permeability about twice higher for NF90 than for BW30.
Figure 5. Effect of pressure on permeate flux and salinity for filtration of Feed 3 using the NF90
and BW30 membranes. The dashedline represents the lower limit of Tunisian salinity norm.
Table 5 shows the parameters of permeates obtained with the two membranes at applied
pressures of 10 and 14 bar. These data are given only for comparison as the recovery rates are
too low for an efficient BW30 operation. Again, NF appears to be the better solution for the
production of drinking water from this type of groundwater both in terms of productivity and
desalination performance.
Table 5: Parameters of permeates and productivity for treatment of Feed 3 at 10 and 14 bar.
Applied Pressure
Cl-
mg/L
Na+
mg/L
Salinity
mg/L
Permeate flow rate
L/h.m-2
Recovery
(%)
NF90 10 104 64 200 48 10.1
14 58.6 41.7 135 72.2 15.2
BW30 10 57 34 99* 21 4.4
14 43.7 37 77.2* 32.8 6.9 * Not complying with the Tunisian standards for drinking water.
16
At this point, it is obviously essential to have a prediction tool to decide what kind of
membranes (NF group 1 and 2 membranes or BWRO) could the best suited in terms of
desalination performance and specific energy consumption estimated by the produced volume of
desalinated water at a given pressure depending on the feed groundwater salinity and ionic
composition (sulfate and chloride anion content). This is the objective of the following section in
which two available softwares (ROSA and Nanoflux®) were tested and their simulation data
confronted with the previous experimental results.
3.2. Nanofiltration performance prediction : software validation
ROSA prediction
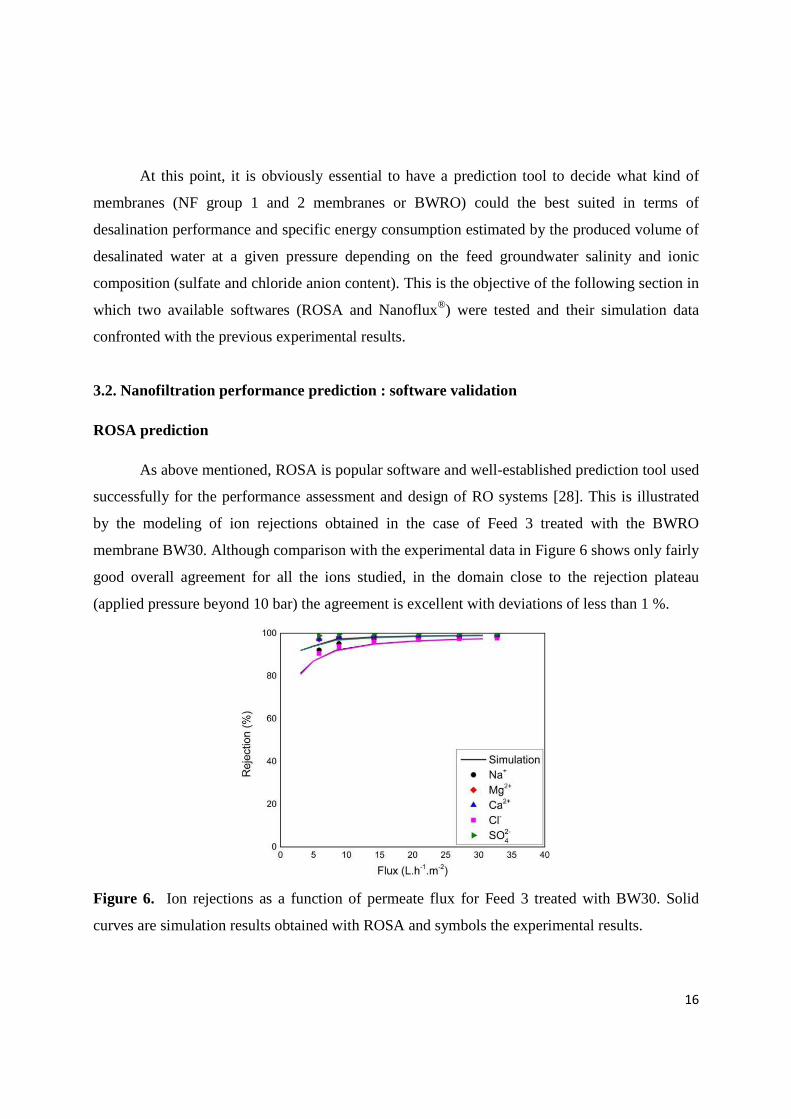
As above mentioned, ROSA is popular software and well-established prediction tool used
successfully for the performance assessment and design of RO systems [28]. This is illustrated
by the modeling of ion rejections obtained in the case of Feed 3 treated with the BWRO
membrane BW30. Although comparison with the experimental data in Figure 6 shows only fairly
good overall agreement for all the ions studied, in the domain close to the rejection plateau
(applied pressure beyond 10 bar) the agreement is excellent with deviations of less than 1 %.
Figure 6. Ion rejections as a function of permeate flux for Feed 3 treated with BW30. Solid
curves are simulation results obtained with ROSA and symbols the experimental results.
17
The ROSA database contains also NF membranes produced by Dow Filmtec including
the NF270 and NF90. The performance of this prediction tool was then checked for the NF
treatment of the studied Tunisian groundwaters. It was demonstrated previously that NF270 and
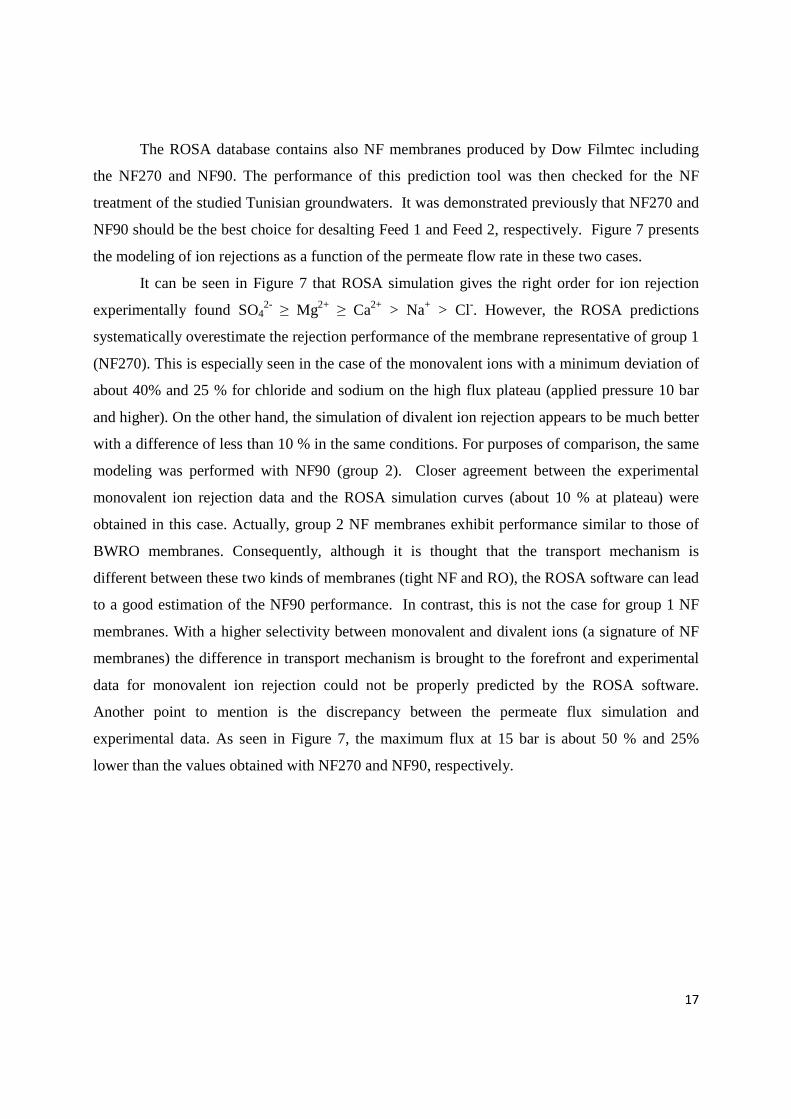
NF90 should be the best choice for desalting Feed 1 and Feed 2, respectively. Figure 7 presents
the modeling of ion rejections as a function of the permeate flow rate in these two cases.
It can be seen in Figure 7 that ROSA simulation gives the right order for ion rejection
experimentally found SO42- ≥ Mg2+ ≥ Ca2+ > Na+ > Cl-. However, the ROSA predictions
systematically overestimate the rejection performance of the membrane representative of group 1
(NF270). This is especially seen in the case of the monovalent ions with a minimum deviation of
about 40% and 25 % for chloride and sodium on the high flux plateau (applied pressure 10 bar
and higher). On the other hand, the simulation of divalent ion rejection appears to be much better
with a difference of less than 10 % in the same conditions. For purposes of comparison, the same
modeling was performed with NF90 (group 2). Closer agreement between the experimental
monovalent ion rejection data and the ROSA simulation curves (about 10 % at plateau) were
obtained in this case. Actually, group 2 NF membranes exhibit performance similar to those of
BWRO membranes. Consequently, although it is thought that the transport mechanism is
different between these two kinds of membranes (tight NF and RO), the ROSA software can lead
to a good estimation of the NF90 performance. In contrast, this is not the case for group 1 NF
membranes. With a higher selectivity between monovalent and divalent ions (a signature of NF
membranes) the difference in transport mechanism is brought to the forefront and experimental
data for monovalent ion rejection could not be properly predicted by the ROSA software.
Another point to mention is the discrepancy between the permeate flux simulation and
experimental data. As seen in Figure 7, the maximum flux at 15 bar is about 50 % and 25%
lower than the values obtained with NF270 and NF90, respectively.
18
Figure 7. Ion rejections as a function of permeate flux for Feed 1/NF270 (left) and Feed 2/NF90
(right). Solid curves are simulation obtained with ROSA and symbols the experimental results.
In order to get further insight into which factors are not properly taken into account by
ROSA, additional NF experiments with a single monovalent salt (NaCl) were undertaken using
the NF270 membrane in the range of applied pressure 3 – 15 bar. In a first experiment, the feed
salt concentration was varied from 10-3 – 10-1 M at a fixed pH = 6 in order to examine how the
feed ion content affects the ROSA prediction in the case of NF membranes. This range
corresponds to chloride ion concentrations from 35.5 to 3550 mg/L and sodium ion
concentrations from 23 to 2300 mg/L. Figure 8 (left) presents the ROSA simulation results and
the experimental data. An increase of the feed ionic strength causes a drastic decrease in the
experimental ion rejection. Actually, the extent of electrical interactions is strongly limited by
the charge screening occurring at high ionic strength, which accounts for a drop in monovalent
rejection [41]. This effect linked to a decrease of the Debye length is well reflected in the zeta
potential change of the NF270 membrane surface as a function of ionic strength and it is
particularly marked for pH values higher than 6 (Figure 9 right) [42]. By contrast no change is
observed in the ROSA simulations. It can, however, predict fairly well the ion rejection for low
salt concentrations around 10-3 M. It can be concluded that the ROSA modeling does not take
into account the variation of electrical interactions with changing feed composition. This could
explain why the ROSA prediction tool cannot predict the rejection behavior of NF membranes
given that interfacial Donnan (electrostatic) exclusion is one of the predominant mechanisms
governing ion rejection in this case.
Feed 1/NF270 Feed 2/NF90

19
Figure 8. Comparison between simulated and experimental ion rejections as a function of
permeate flux for different NaCl feed concentration at pH 6 (left) and the corresponding
permeate flux as a function of NaCl feed concentration (right). Solid curves are simulation
results obtained with ROSA and symbols the experimental results.
The increase in ionic strength leads also to a decline of the experimental permeate flow
rate particularly noticeable in the concentration range between 10-2 and 10-1M. This observation
is due to the rise in osmotic pressure (Figure 8, left). Although this qualitative effect on
membrane performance is well taken into account by the ROSA modeling, the predicted
amplitude of the flow rate drop is much greater than the experimentally observed one. Apart the
large overestimation of ion rejection seen in Figure 8 (left) in the case of 10-1M NaCl feed, the
pure water permeability data input in the ROSA database (about 11 L/h.m2.bar) that is one and
half times lower than the experimental one (16.3 ± 1.0 L/h.m2.bar) could likely be responsible of
the observed discrepancy for the 10-3 and 10-2M NaCl feeds.

20
Figure 9. Ion rejections as a function of permeate flux for 10-2 M NaCl feed at various pH (left).
Solid curves are simulation obtained with ROSA and dots the experimental results. Zeta potential
of the NF270 membrane surface as a function of pH and KCl concentration (right).
The membrane surface charge originates from the ionization of functional groups and/or
the adsorption of charged species, especially in the case of polyvalent ions [43]. As seen in
Figure 9 (right), membrane surface charge is strongly affected by pH of the contacting solution
(isoelectric point between 3 and 4) [44]. NF270 becomes more negatively charged as the pH
increases before reaching a plateau at neutral pH. Next, a second experiment was designed to
examine if this effect is taken into account by ROSA. Figure 9 (left) displays the NF270 ion
rejection for a 10-2 M NaCl feed at three different pH values (3, 6 and 10). This concentration
was chosen to discriminate the effect of pH change from that of ionic strength. It appears from
the experimental data that the rejection at 15 bar decreases from about 90 % to 50 % when
decreasing the pH from 10 to 3. This result is consistent with the membrane charge inferred from
the zeta potential values shown in Figure 9 (right). A higher membrane charge is expected to
lead to a higher ion rejection in the case of a single salt due to the Donnan exclusion.
Interestingly, ROSA can predict more or less the rejection at pH values corresponding to the
plateau (pH = 10) but fails at lower pH when the membrane surface charge shows a large
variation. We do not know how the ROSA software is designed for predicting the rejection
performance of NF membranes, but it appears clearly that the electrical interactions between the
charged solutes and the membrane are not considered in their full complexity and totality. To

21
further investigate this issue, the following section is devoted to the validation of a prediction
tool, Nanoflux®, specifically designed to address the particularities of NF membrane transport.
Nanoflux® validation
The Nanoflux® prediction tool is based on an internal database containing the specific
membrane parameters (pore radius %, normalized membrane charge and effective pore length
&'(() required to solve the set of equations describing the HET model. This database is built
from the rejection data of neutral solutes (%) and of representative single salts including NaCl,
Na2SO4, MgSO4, CaCl2 in different conditions of pH and concentration. By decomposing the
feed solution in a combination of single salts, the software defines a new set of membrane
parameters by mathematical interpolation according to the feed composition and pH. Calculation
using the HET model then enables Nanoflux® to predict membrane performance in terms of flux
and ion rejection. For instance, Table 6 gives the different membrane parameters used by
Nanoflux® for establishing the simulation curves presented below.
Table 6: Parameters determined by Nanoflux® for the modeling performance of the studied NF
membranes as a function of the used feed solutions.
NF270 NF90
%
(nm)
&'((
(µm)
%
(nm)
&'((
(µm)
Feed 1 0.525 -1.245 3.167 0.42 -46.63 8.92
Feed 2 0.525 -0.748 13.84 0.42 -22.45 21.0
Feed 3 - - - 0.42 -30.00 35.0
From these data, it can be seen clearly that the feed composition impacts the normalized
membrane charge and thereby the electrical interactions with the solutes. As indicated before, the
membrane charge density decreases with the increase of the feed ionic strength by charge
screening. This accounts for the reduction of from Feed 1 to Feed 2. However, an increase of
22
this parameter is observed for Feed 3 in spite of a further increase of the salt content. As can be
noted from the composition of Feed 3 in Table 2, the pH of this solution is 8 compared to about 6
for the previous ones, explaining the increase membrane charge. Thus, by taking into account the
electrical interactions more specifically, prediction of NF membrane performance can be more
accurate.
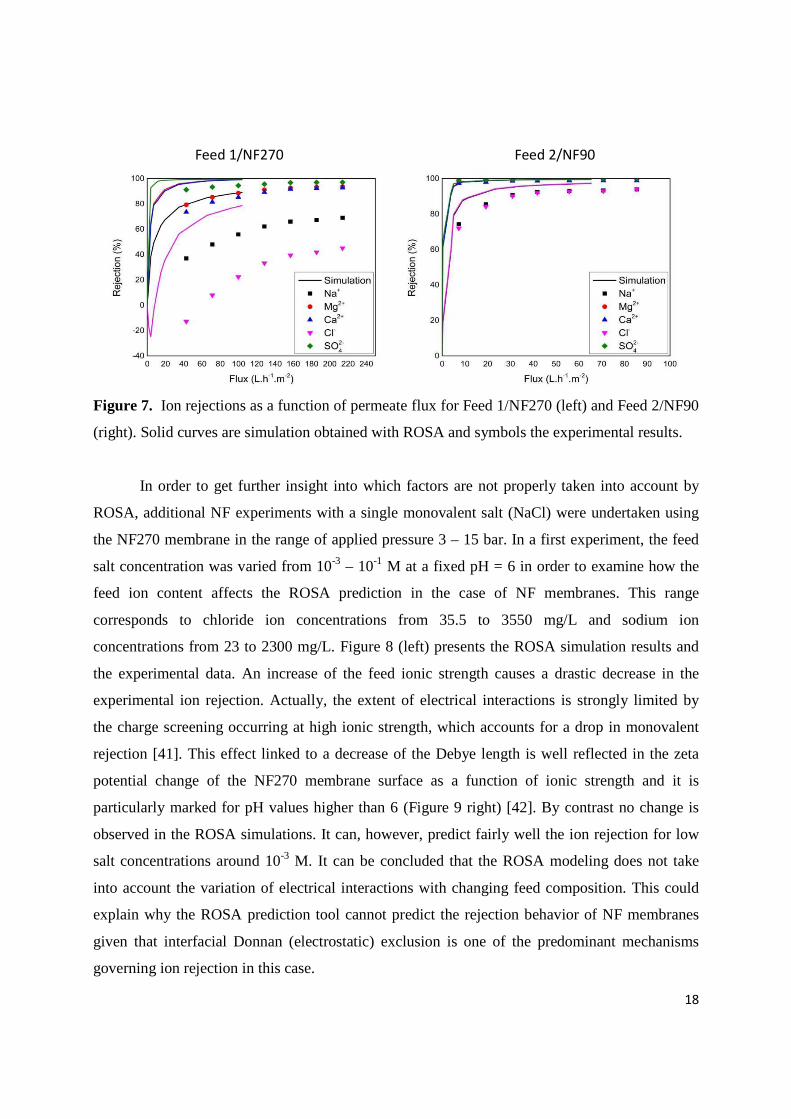
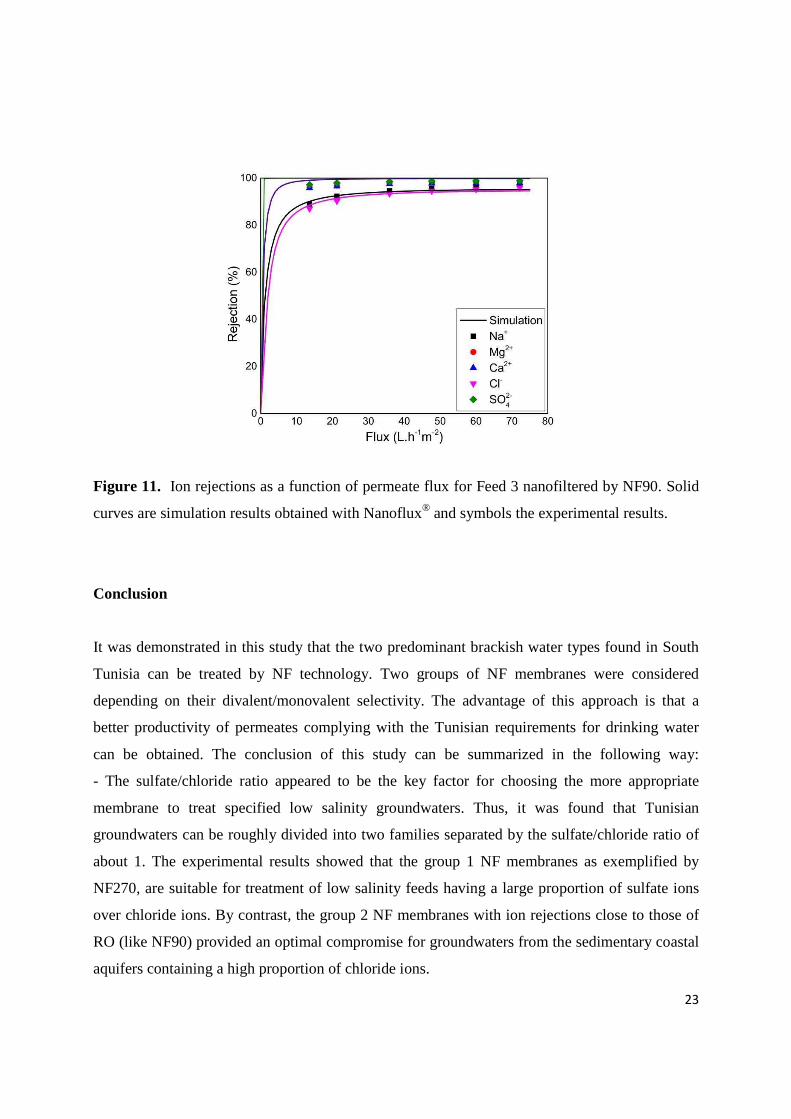
For example, Figures 10 and 11 present the comparison between the simulation curves
given by Nanoflux® for the ion rejection in the case of Feed 1 using NF270 and NF90 and those
for Feed 3 using NF90, respectively. As can be seen, the experimental rejections of the five ions
(Na+, Cl-, SO42-, Ca2+ and Mg2+) are well fitted by the modeling enabling a reliable assessment
of membrane performance in all cases studied.
Figure 10. Ion rejections as a function of permeate flux for Feed 1 nanofiltered by NF270 (left)
and by NF90 (right). Solid curves are simulation results obtained with Nanoflux® and symbols
the experimental results.
23
Figure 11. Ion rejections as a function of permeate flux for Feed 3 nanofiltered by NF90. Solid
curves are simulation results obtained with Nanoflux® and symbols the experimental results.
Conclusion
It was demonstrated in this study that the two predominant brackish water types found in South
Tunisia can be treated by NF technology. Two groups of NF membranes were considered
depending on their divalent/monovalent selectivity. The advantage of this approach is that a
better productivity of permeates complying with the Tunisian requirements for drinking water
can be obtained. The conclusion of this study can be summarized in the following way:
- The sulfate/chloride ratio appeared to be the key factor for choosing the more appropriate
membrane to treat specified low salinity groundwaters. Thus, it was found that Tunisian
groundwaters can be roughly divided into two families separated by the sulfate/chloride ratio of
about 1. The experimental results showed that the group 1 NF membranes as exemplified by
NF270, are suitable for treatment of low salinity feeds having a large proportion of sulfate ions
over chloride ions. By contrast, the group 2 NF membranes with ion rejections close to those of
RO (like NF90) provided an optimal compromise for groundwaters from the sedimentary coastal
aquifers containing a high proportion of chloride ions.
24
- Validation of available software was undertaken to have a decision-making tool for selecting
the right membrane as a function of the feed to be treated and the water quality to be produced. It
was shown that Nanoflux®, a prediction tool specifically designed for taking into account the
complexity of NF membrane transport, can be a useful tool for this technology. On the other
hand, the ROSA software designed for RO was not found to be generally useful for the
prediction of NF membrane performance because it does not appear to account for the electric
interactions between membrane and solutes.
References:
[1] M. Elloumi, La gouvernance des eaux souterraines en Tunisie, “Groundwater governance in
the Arab World –Taking Stok and addressing the challenges”, IMWI publication, (2016).
[2] ITES, Etude stratégique : Système hydraulique de la Tunisie à l’horizon 2030, (2014) 222.
[3] A. Hamdane, La gestion des ressources en eau souterraines (nappes et aquifères) comme
biens communs : Cas de la Tunisie, Synthèse régionale sur l’approche économique de la gestion
de la demande en eau en Méditerranée, (2014).
[4] M.F. Ben Hammouda, P. Carreira, J.M. Marques, H. Egenkamps: Geochimical and isotopic
investigation to study the origin of mineralization of the coastal aquifer of Sousse, Tunisia,
Procedia Earth Planet Sci, 7 (2013) 61-64.
[5] NT.09.14 Normes Tunisiennes – Eaux destinées à la consommation humaine à l'exclusion
des eaux conditionnées, (2013).
[6] Veera Gnaneswar Gude, Desalination of deep groundwater aquifers for freshwater supplies
– Challenges and strategies, Groundwater Sustain Dev 6, (2018), 87-92.
[7] Seema S. Shenvi, Arun M. Isloor, A.F. Ismail, A review on RO membrane technology:
Developments and challenges, Desalination 368 (2015) 10–26.
[8] A.J. Karabelas, D.C. Sioutopoulos, New insights into organic gel fouling of reverse osmosis
desalination membranes, Desalination 368 (2015) 114–126.
[9] Q. She, R. Wang, A.G. Fane, C.Y. Tang, Membrane fouling in osmotically driven membrane
processes: a review, J. Membr. Sci. 499 (2016) 201–233.
[10] M. Badruzzaman, A. Subramani, J. DeCarolis, W. Pearce, J.G. Jacangelo, Impacts of silica
on the sustainable productivity of reverse osmosis membranes treating low salinity brackish
groundwater, Desalination 279 (2011) 210–218.
25
[11] A.W. Mohammad, Y.H. Teow, W.L. Ang, Y.T. Chung, D.L. Oatley-Radcliffe, N. Hilal,
Nanofiltration membranes review: Recent advances and future prospects, Desalination 356
(2015) 226–254.
[12] Talaeipour M, Nouri J, Hassani AH, Mahvi AH, An investigation of desalination by
nanofiltration, reverse osmosis and integrated (hybrid NF/RO) membranes employed in brackish
water treatment, J Environ Health Sci Eng. (2017) 15-18.
[13] N Yousefi, A Fatehizedeh, K Ghadiri, N Mirzaei, S D Ashrafi , A H Mahvi, Application of
nanofilter in removal of phosphate, fluoride and nitrite from groundwater, Desal Water Treat 57
(2016) 11782-11788.
[14] A H Mahvi, M Malakootian, A Fatehizadeh, MH Ehrampoush, Nitrate removal from
aqueous solutions by nanofiltration, Desal Water Treat 29 (2011) 326-330.
[15] B. Van der Bruggen, Nanofiltration in Encyclopedia of membrane science and technology
Eds: E. M. V. Hoek, V. V. Tarabara, John Wiley & Sons, Inc (2013).
[16] https://dowac.custhelp.com/app/answers/detail/a_id/4925/~/filmtec-membranes---
nanofiltration---mwco Updated 23 April 2019.
[17] http://synderfiltration.com/nanofiltration/membranes/, (17 Juin 2019)
[18] https://trisep-membranes.squarespace.com/s/TS40.pdf, (17 Juin 2019)
[19] K. Kŏsutić, D. Dolar, B. Kunst, On experimental parameters characterizing the reverse
osmosis and nanofiltration membranes’ active layer JMembrSci 282 (2006) 109–114.
[20] https://trisep-membranes.squarespace.com/s/TS80.pdf, (17 Juin 2019)
[21] http://membranes.com/solutions/products/nf/esna-2/, (17 Juin 2019)
[22] Y Song , T Li, J Zhou, Z Li, C Gao, Analysis of nanofiltration membrane performance
during softening process of simulated brackish groundwater, Desalination 399 (2016) 159–164.
[23] X Su, Y Song, T Li, G Congjie, Effect of feed water characteristics on nanofiltration
separating performance for brackish water treatment in the Huanghuai region of China, J Water
Process Eng 19 (2017) 147–155.
[24] Y. Song, J. Xu, Y. Xu, X. Gao, C. Gao, Performance of UF–NF integrated membrane
process for seawater softening, Desalination 276 (2011) 109–116.
[25] L. D.Nguyen, S. Gassara , M. Q. Bui, F. Zaviska, P. Sistat, A Deratani Desalination and
removal of pesticides from surface water in Mekong Delta by coupling electrodialysis and
nanofiltration Environ Sci Pollut Res Int doi.org/10.1007/s11356-018-3918-6.
26
[26] H. Chmiel, X. Lefebvre, V. Mavrov, M. Noronha, J. Palmeri, Computer Simulation of
Nanofiltration, Membranes and Processes, In: M. Rieth and W. Schommers (Eds.), Handbook of
Theoretical and Computational Nanotechnology, Volume 5, American Scientific Publishers
(2006) 93–214.
[27] A. Altaee, A Computational Model to Estimate the Performance of 8 inches RO
Membranes in Pressure Vessel, J. Memb. Separ. Tech. 1 (2012) 60-71.
[28] X.-L. Wang, T. Tsuru,M. Togoh, S. Nakao, S. Kimura, Transport of organic electrolytes
with electrostatic and steric-hindrance effects through nanofiltration membranes J. Chem. Eng.
Jap. 28 (1995) 372 – 380.
[29] W. R. Bowen and H. Mukthar, Characterization and prediction of separation performance of
nanofiltration membranes, J. Membr. Sci. 112 (1996) 263 – 274.
[30] X. Lefebvre, J. Palmeri, P. David, Nanofiltration theory: an analytic approach for single
salts, J. Phys. Chem. B 108 (2004) 16811
[31] J. Palmeri, J. Sandeaux, R. Sandeaux, , P. David, C. Guizard, P. Amblard, J.-F. Diaz,B.
Lamaze, Modeling of multi-electrolyte transport in charged ceramic and organic nanofilters
using the computer simulation program NanoFlux, Desalination 147 (2002) 231 – 236.
[32] X. Lefebvre, J. Palmeri, J. Sandeaux, R. Sandeaux, , P. David, B. Maleyre, C. Guizard, P.
Amblard, J.-F. Diaz, B. Lamaze, Nanofiltration modeling: a comparative study of the salt
filtration performance of a charged ceramic membrane and an organic nanofilter using the
computer simulation program nanoflux, Sep. Pur. Tech. 32 (2003) 117 – 126.
[33] J. Palmeri, N. Ben Amar, H. Saidani, A. Deratani , Process modeling of brackish and
seawater nanofiltration, Desal Water Treat 9 (2009) 263 – 271.
[34] X. Lefebvre and J. Palmeri, Nanofiltration Theory: Good co-ion exclusion approximation
for single salts, J. Phys. Chem. B 109 (2005) 5525-5540.
[35] H. Bukšek, T. Luxbacher, I. Petrinić, Zeta potential determination of polymeric materials
using two differently designed measuring cells of an electrokinetic analyzer, Acta Chim.
Slov.57(2010)700–706.
[36] S. Gassara, W. Chinpa, D. Quemener, R. Ben Amar, A.Deratani Pore size tailoring of
poly(ether imide) membrane from UF to NF range by chemical post-treatment using aminated
oligomers, J. Membr. Sci. 436 (2013) 36–46.
27
[37] M. Pontié, H. Dach, J. Leparc, M. Hafsi, A. Lhassani, Novel approach combining physico-
chemical characterizations and mass transfer modelling of nanofiltration and low pressure
reverse osmosis membranes for brackish water desalination intensification, Desalination 221
(2008) 174–191.
[38] A. Azaïs, J. Mendret, S. Gassara, E. Petit, A. Deratani, S. Brosillon, Nanofiltration for
wastewater reuse: Counteractive effects of fouling and matrice on the rejection of pharmaceutical
active compounds, Sep. Purif. Technol. 133 (2014) 313 – 327.
[39] M. Wilf , The Guidebook to Membrane Desalination Technology, Reverse Osmosis,
Nanofiltration and Hybrid Systems Process, Design, Application and Economics, Desalinations
Publications, USA, (2007) 259-260.
[40] J. Luo and Y. Wan, Effects of pH and salt on nanofiltration—a critical review, J. Membr.
Sci. 438(2013)18–28.
[41] L. Thomas, C. Bryan, T Cath, Does the surface zeta potential approach zero at high
salinity?, Advances in Civil, Environmental and Materials Research (ACEM14), Busan, Korea,
August 24-28, 2014.
http://www.i-asem.org/publication_conf/acem14/3.MWT/T3C.3.MW251_386F.pdf
[42] W.B.S. de Lint, N E Benes, J Lyklema, H J.M. Bouwmeester, A J. van der Linde, M
Wessling, Ion Adsorption Parameters Determined from Zeta Potential and Titration Data for a y-
Alumina Nanofiltration Membrane, Langmuir 2003, 19, 5861–5868.
[43] P Ortiz-Albo, R Ibañez, A Urtiaga, Inmaculada Ortiz , Phenomenological prediction of
desalination brines nanofiltration through the indirect determination of zeta potential, Sep Purif
Technol 210 (2019) 746–753.
List of symbols:
A Membrane area, (m2)
(: Concentration of ion i in the feed, (M)
: Concentration of the ion i in the permeate, (M)
Total salt concentration, (M)
ic : Concentration of ion i inside the membrane, (M)
iD : Effective diffusion coefficient of ion i in the membrane, (m2/s)
F: Faraday constant, (C mol-1)

28
Ji : Molar flux density of ion i, (1/mol.m2.s)
Jv : Volume flux density based on the membrane area, (m/s or L/h.m2)
Jc : Electric current density, (C/m2.s)
K i,d: Hindrance factor for diffusion
K i,c : Hindrance factor for convection
Lp0: Pure water permeability, (L/h.bar.m2)
leff : Effective active NF membrane layer thickness, (µm)
lm: Active NF membrane layer thickness, (µm)
P: Average fluid pressure, (bar)
rp : Pore radius, (nm)
R: Gas constant, (J mol-1 K-1)
Ri: Ion rejection of ion i
T: Absolute temperature, (K)
Vp: Volume of permeate, (L)
Xm: Effective membrane charge, (moles/m3)
Xi: Normalized membrane charge
zi: Valence of ion i
∆t: Time, (h)
Dφ∆ : Donnan potential, (mV)
φ : Electric potential, (mV)
iΦ : Steric partitioning coefficient of ion i local ion charge density
σ : Surface charge density, (C/m2)
ρ: Ion charge intensity, (C/m3)
Copyright © 2022 FDOKUMEN