'INTELLECTUAL ASSESSMENT AND PREDICTION: n
345
‘INTELLECTUAL ASSESSMENT AND PREDICTION: n AN ANALYSIS OF CULTURAL INVOLVEMENT I BASED ON THE CULTRUAL—DISTANCE HYPOTHESIS BY _ Henry Jefferson“Grubb„ Virginia Polytechnic Institute and State Univerzity Dissertation submitted to the Faculty of the Virginia Polytechnic Institute and State University in partial fulfillment of the requirements for the degree of DOCTOR OF PHILOSOPHY in PSYCHOLOGY Approved: " • [Ann ~ Thomas H. lendick, Chair A J ‘ Y/I Inthia G. Baum Christopher M. Peterson \ N _ V- ___ iz Joséph JZ Franchina Victoria R. Fu November, 1985 Blacksburg, Virginia
-
Upload
khangminh22 -
Category
Documents
-
view
3 -
download
0
Transcript of 'INTELLECTUAL ASSESSMENT AND PREDICTION: n

‘INTELLECTUAL ASSESSMENT AND PREDICTION:n
AN ANALYSIS OF CULTURAL INVOLVEMENT
IBASED ON THE CULTRUAL—DISTANCE HYPOTHESIS
BY
_ Henry Jefferson“Grubb„
Virginia Polytechnic Institute and State Univerzity
Dissertation submitted to the Faculty of the
Virginia Polytechnic Institute and State University
in partial fulfillment of the requirements for the degree of
DOCTOR OF PHILOSOPHY
in
PSYCHOLOGY
Approved:
"• [Ann ~
Thomas H. lendick, Chair
AJ
‘ Y/I
InthiaG. Baum Christopher M. Peterson
\ N _
V-___ iz
Joséph JZ Franchina Victoria R. Fu
November, 1985Blacksburg, Virginia

INTELLECTUAL ASSESSMENT AND PREDICTION:
AN ANALYSIS OF CULTURAL INVOLVEMNT
BASED ON TH CULTURAL-DISTANCE HYPOTHESIS
x.\
Henry Jefferson Grubb ‘Committee Chair: Thomas H. Ollendick
Psychology
(ABSTRACT)
This paper explores socio-cultural factors which lead to group perfor-
mance differences on IQ tests and learning tasks in an attempt to
determine empirically if the Cultural-Distance Approach hypothesis is
useful in accounting for these differences. The Cultural-Distance
Approach, briefly stated, suggests that a sub-culture's distance from
the major culture on which questions of a test are based and validated
will determine that sub-culture's sub-score pattern. Results of the
present study indicate that although Blacks and Whites perform
similarly on-learning tasks, they perform differently on standardized
IQ tests, possibly because of the loading of cultural influences on
the latter measures. When cultural influences are controlled for,
differences in IQ performance are minimized (i.e., statistically
non-significant). The present investigation was a follow-up of the
author's previous work in this area (Master‘s thesis; Grubb, 1983), and
consisted of two studies. One was a reanalysis of the data obtained in
the original study with the addition of college entrance exam scores
(SAT) and college grade point averages on the 80 original students. The

fsecond study consisted of a replication of the original work with
40-Black and 40-White undergraduates at Virginia Polytechnic Institute
& State University. New variables, and their correlation to intelli-
gence, were investigated and included; personality characteristics,
racial/ethnic identification, and social adjustment to college. In
addition to the previously stated relationships between intelligence,
race, and cultural—distance, new information was obtained which
indicates: (l) a positive correlation between a conservative,
compliant personality and academic ascendancy; (2) a significant
correspondence between college involvement (social adaptation or the
reduction of cultural-distance) and grade-rated academic performance;
and (3) a hypothesized process of supra-cultural (university) adapta-
tion for both Black and White students which has a limiting effect on
their sub-culturally based self-esteem. In all, and from all the
various sources, this paper tends to support the QulLuIBl:Di£££¤££
Hypothesis and its influence on group IQ performance.

iv
A.

man; strength, determination, self-reliance, fearlessness, and the
ability to face any obstacle and overcome. I thank my mother who
taught me what it means to be human; caring, humility, respect for
others, and a commitment to helping those less fortunate. I thank my
wife who walked life's troubled paths with me, putting up with the bad
in me and allowing the good to develop; who helped make the rough roads
smooth; who calmed the angry undirected energy and showed me the peace
within. To my children I say thank you for completing the circle; to
you this work is dedicated. And, as ever, thanks to God. '
V
.
.

I CORINTHIAHS 3:18*
Let no man dsceive himself: If any man among you sssmsth to bewise in this world, let him become a fool, that he may be wise.
*The New Testament, King James Version of the Hg].; Bgylg.·-
viV

TABLE OF CONTENTS
PAGE
ACKNOWLEDGEMNTS ......................................... iv
I CORINTHIANS 3:18 ....................................... vi
LIST OF TABLES ........................................... x
LIST OF FIGURES .......................................... xiii
INTRODUCTION ............................................. 1
Factor X or Variable Z .............................. 2The Two-Stage Argument ............................ 32
Cultural-Distance as Factor X ..................... '34
The Four Ecobehavioral Systems ...................... 38Higher Order Effects in Research .................. 43The Cultural-Distance Perspective/Hypothesis ...... 58
THE PRESENT STUDIES ...................................... 62
The Base (Previous Study—Study I) ................... 62Predicted Outcomes ................................ 62Other Outcomes of Interest ........................ 66
New Construction .................................... 68 ·Test Bias ......................................... 69Cultura1—Re1ativity, Identity Development, and
Bi-Culturality .................................. 73Test Reliability .................................. 82
Micro-level difficulties ........................ 82Macro-level fallacies ........................... 88
METHOD ................................................... 102
Study—II ............................................ 102Subjects .......................................... 102Instruments ....................................... 102
Cultural Variables••••••. ........................ 102Intellectual/Performance Variables ... ,,,,,,,,,, 103
Procedure ......................................... 104NgwA¤3]_y333 ,,,,,,, •..••.••.................... 104
vii2 ‘

TABLE OF CONTENTSPAGE
Study-III ........................................ 106Subjects ....................................... 105Instruments .................................... 106
Cultural/Performance Variables .......„..--•-- 106Measures of Intelligence ..•---·-------·•-··-· 107Personality Inventory ,„„.................... 107
Procedure ,,,,,,................„••..•..„••••••• 108
HYPOTHESIS ............................................ 112
Hypotheses of Study-II............................ 1121
Hypothesis- I:................................. 112Hypothesis- II:................................. 112Hypothesis-III:................................. 112Hypothesis- IV:................................. 113
Hypotheses of Study—III........................... 113Hypothesis· I:................................ 113Hypothesis- II:................................ 113Hypothesis— III:................................ 113Hypothesis- IV:................................ 114Hypothesis- V:................................ 114Hypothesis- VI:................................ 114Hypothesis- VII:................................ 114Hypothesis-VIII:................................ 114Hypothesis— IX:......;......................... 114
RESULTS ............................................... 116
Study-II ......................................... 116Item Bias ...................................... 116Sub—Score Scatter .............................. 120Comparison of Academic and Aptitude Measures ... 124Prediction of Academic Performance ............. 127
Study-III ........................................ 133Replication of Study-I ......................... 133
Untreated IQ and Performance Data ............ 133Regression of the Socio-Cultural Variables ... 139
Replication of Study-II ........................ 146Sub—score scatter on the WAIS-R .............. 146Sub—test Performance on the BCT and PDQ-R .... 150Comparison of Academic and Aptitude Measures . 153Prediction of Academic Performance ........... 155
Personality Characteristics and MeasuredIntelligence ..............................(... 159
Intelligence and Social Adjustment to College ,, 165
lviii

TABLE OF CONTENTSPAGE
Social Adjustment and Academic Functioning .... 176
1 DISCUSSION ...................................,....... 1 8Q
Study·II ........................................ 180Hypothesis- I ................................ 180Hypothesis- II ................................ 184Hypothesis-III ................................ 184Hypothesis— IV ................................ 185
Study-III ....................................... 190
E Hypothesis- I ............................... 190Hypothesis- II ............................... 197Hypothesis- III ............................... 199Hypothesis- IV ............................... 200,Hypothesis- V ............................... 200Hypochesis- VI ............................... 200Hypothesis- VII ............................... 203Hypothesis—VIII ............................... 206Hypothesis- IX ............................... 208
Limitations ..................................... 210
CONCLUDING REMARKS ................................... 220
"AUNT AGGY" .......................................... 226
REFERENCE NOTES ...................................... 227
REFERENCES ........................................... 228
APPENICES ........................................... 241
CURRICULUM VITAE ..................................... 312
ixV ‘

LIST OF TABLES_
Tables Page
1 Table 1: The Hypothesized Effects of the Presence or Absence ofthe Moderator Variable on Correlation .............. 3
Table 2: Number of Developmentally Disabled Clients inCalifornia, Colorado, and Nevada by Race ........... 14
Table 3: Racial Composition of California, Colorado, and Nevada.. 15
Table 4: Breakdown of Blacks and Whites in California, Coloradoand Nevada by Percentage of Developmentally Disabledto General Citizenry ................................ 16
Table 5: Breakdown of Races in California, Colorado, and Nevadaby Percentages in Two Populations .............'...... 17
Table 6: Ratio of Black to White in the Different Populations .... 18
Table 7: Correlation of Learning Ability Ratings with AptitudeTests, Job Knowledge Test, and Work Samples byRace of Rater and Race of Ratee ..................... 94
Table 8: Average Correlation of Learning Ability Rating withObjective Measures by Race of Rater and Race ofRatee ............................................... 95
Table 9: Black Doctorate Recipients (1975-1980) by Type of Collegeof Baccalaureate Origin ............................. 98
TablelO: Black Doctorate Recipients (1978-1980) by Productivityof College of Baccalaureate Origin .................. 99
Tablell: Crosstabulation of Race of Subject (Black vs. White) byPeabody Picture Vocabulary Test (PPVT) questionsfound to reject the Homogeneity Hypothesis (andLevel of Significance)............................... 117
Tab1e12: Crosstabulation of Race of Subject (Black vs. White) byWechsler Adult Intelligence Scale-Revised (WAIS-R)Questions Found to Reject the Homogeneity Hypothesis(and Level of Significance).......................... 119
Tablel3: T-test Comparisons of the Black and White Groups on theWAIS-R Sub-scales.................................... 122
Tablel4: T-Test Comparisons of the Black and White Groups on thePersonal Data Questionnaire Variables ..............._ 125
. Xl

Tables Page
Table 15: T-test Comparisons of the Black and White Group on theAcademic and Aptitude Measures .......................• 126
Table 16: Results of Regression analyses of the Sixteen IndirectMeasures of Aptitude on Current AcademicFunctioning (QCA) ...................................• 128
Table 17: Results of Regression Analysis of the Best Culturally-Levelled PPVT IQ on Current Academic Functioning(QCA)................................................• 132
Table 18: Means of Total Sample, Groups, and Level of Significanceof Main Effect of Race of Subject (ANOVA)............• 134
Table 19: Description of Subpopulations............................ 136
Table 20: Analysis of Variance .................................... 137Table 21: Description of Subpopulations ........................... 138
Table 22: The Five Socio-Cultural Variables Weighing Most Heavilyin the Regression Equations of Each DependentMeasures (All Subjects) ............................•••l4l
Table 23: Analysis of Variance .....................................143
Table 24: Level of Significance Between the Two Racial Groups asDetermined by Analysis of Variance (White over Black),with Certain Socio-Cultural and Environmental VariablesHeld Constant..........................................144
Table 25: T-test Differences Between the Black and White Subjectson Demographie Variables ..............................147
Table 26: T-test Comparisons of the Black and White Groups on theWAIS—R Sub·sca1es .....................................148
Table 27: T-test Comparisons of the Black and White Groups on thePersonal Data Questionnaire-Revised (PD -R) Variables..151
Table 28: T-test Comparisons of the Black and White Groups on the. Academic and Aptitude Measures.........................154
Table 29: Results of Regression Analysis of the Sixteen IndirectMeasures of Aptitude on Current Academic Functioning(VATQCA)...............................................155
Table 30: Relationship of Personality Variables to IQ PearsonCorrelation Coefficients (Total Sample) ................:160
xi

Tables Page‘
Table 31: Relationship of Personality Variables to AcademicAssessment Pearson Correlation Coefficients (TotalSample)............................................. 161
Table 32: Relationship of Personality Variables to IQ PearsonCorrelation Coefficients (Black Subjects)........... 163
Table 33: Relationship of Personality Variables to AcademicAssessment Pearson Correlation Coefficients(Black Sample)...................................... 164
Table 34: Relationship of Personality Variables to IQ PearsonCorrelation Coefficients (White Subjects)........... 166
Table 35: Relationship of Personality Variables to AcademicAssessment Pearson Correlation Coefficients (WhiteSample)............................................. 167
Table 36: Relationship of Social Adjustment Variables (SPQ) toIQ Pearson Correlation Coefficients (Total”Population)......................................... 168
Table 37: Relationship of Social Adjustment Variables (SPQ) to IQPearson Correlation Coefficients (Blacks)........... 170
Table 38: Relationship of Social Adjustment Variables (SPQ) to IQPearson Correlation Coefficients (Whites)........... 172
Table 39: Pearson Correlation Coefficients of Social PerformanceQuestionnaire (SPQ) and College Academic Functioning(VATQCA)............................................ 177
Table 40: Comparison of the Groups' Mean Performance on the SDependent Measures Used in Both Study-I andStudy III........................................... 192
xii4

LIST OF FIGURES
Figures Page
Figure 1: Normal Probability Curve Distribution of IQ Scoresby Race ........................................„„ 20
Figure 2: Reconstructed Probability Curve Distribution of IQScores for Blacks Compared to the NormalProbability Curve Distribution forwhites ,,,,,,...................................... 22
Figure 3: Prediction of Job Knowledge Rating from Job KnowledgeTest Score (Medical Technicians) .................. 96
Figure 4: Sub-score Performance of the Various Groups on theWAIS-R (Study 2) ................................... 123
Figure 5: Sub-score Performance of the Various Groups on theWAIS—R (Study 3) ................................... 149
xiii '

INTRODUCTION
Prediction of student's potential for advanced study in our formal
educational system in America is presently a topic of wide debate.
Colleges and Universities must have some type of assessment procedure
that allows for the placement of a few students, out of many appli-
cants, in a limited number of academic seats. This fact cannot be
ignored. The problem in our multi-cultural society is determining
which students are admitted according to which standards. . Most fre-
quently, intelligence is used as the over-riding standard. As Stoddard
(198¤) chronicles, however, psychologists and educators cannot even
agree em: a single definition of the construct of intelligence. She
lists the following definitions:
Intelligence is the summation of the learning experience ofthe individual.
Intelligence is the aggregate or global capacity of theindividual to act purposefully, to think rationally, and todeal with his environment.
Intelligence is taken to be in large part at least a habitualapproach to problem solving -- a learned mental skill.
Intelligence is what intelligence tests measure.
Intelligence is a systematic collection of abilities or func-tions for processing different kinds of information (p. 17).
In this vein, Jackson (1975) argues that standardized intellectual
and achievement testing is unfair to Blacks and other minorities and,
therefore, should be halted. He sees such measures as limiting access
17
—

2
to higher education for such special populations. Levidow (1978) inter-
prets the use of such devices (IQ tests) as a racist maneuver on the
part of the ruling class in order to perpetuate a class society.
Factor X or Variable Z
Williams (1972), explained the pseudo—predictive validity of
standardized tests with regards to minority populations and academic
functioning by invoking the moderator variable, §_(see Table 1).
Williams states:
Based on information provided in (Table 1), it is ex-pected that matching conditions facilitate high correla-tions, whereas mismatching conditions yield low correla-tions. Z is defined solely as bias in both thepredictor and criterion variable. Thus, in situationswhere Z is present in one variable and not in the other(e.g., #2 and #3) the prediction of y from 1: will beaffected and in all probability, the correlation will be
· low. In cases where Z is absent in both x and y (e.g.,#1), the correlation is expected to be high and posi-tively influenced. That is, those who get high scoreson the predictor will be expected to earn high scores onthe criterion. In cases where Z is present in both xand y (e.g., #¤) the correlation is also expected to behigh, but the scores on both x and y are expected to benegatively influenced (low) due _to the effects of Z.The correlation remains high but for different reasonsthan in #1 (p. 2M).
Williams finds evidence for variable Z in the writings of Jensen.
More specifically, he reviews the research of Jensen (1968, 1969) where
he finds statements to the effect that: (1) low SES children with low
IQs appear brighter than middle class children in learning tasks; (2)
many "disadvantaged" children with measured IQs in the 60-80 range
showed a level of learning on the performance tasks unexpected from

3
G·O
•'U-4-IUJJJJIUUv-4
ää .4: .¤0 ZH oo 3 B ooJ: HO --4 o o ·4-4JJ U m 4-1 •-‘4
:¤!J-4O
GJU- _GGUOW•r-4„¤JJdd
v-4$-40 •-C7ÖH U
$-4 JJ W WUO g Q) O O G)ät! >· Z Z P·*UI:
4-I WO
BJ 20•J| Q4;2 UW[-4 „E••-l
JJ!-4*4-lgO Q: JJ JJ
$-4 0 JJ JJ cz g:WO •v·| G G Q) 0JJJJ U W Wum 0:>~„ 0 cu 0 0UH
4-**-/ JO •-D $-4 $-4*4-40 •v-I Q GS Q4 D-¤·-4'U $-4U3 U N N N N'U0)N
-1-IWQ)
JGJJOQ. .Ps„¤ $-4 JJ JJ
O JJ :1 JJ G0 JJ ¢:.‘ GJ ¢:'. CDUrs Q.) VJ Q) W·«-4>¢ ua 0 rn 0'uv „¤ $-4 .¤ $-4
3 CI ¤• Gl 9-D-4 N N N N
4-I N fü Q

4
their low IQs; and (3) that "on the other hand, upper middle—class
children in the same (range of tested IQ) Performed on the learning
tasks in a way that was consistent with their low IQ's and poor
scholastic performances -- they were consistently slow learners in a
variety of situations."
To summarize Williams, we could hypothesize that the WAIS and
other tests of intelligence are valid predictors of future academic and
intellectual (problem solving) functioning for Whites since both the
predictor variable (WAIS) and criterion variable (school 'curriculum)
have been designed by Whites for Whites, and therefore, variable Z is
absent from both in this case. For a Black sample we could predict
that variable-Z wculd be present in both predictor (WAIS) and criterion
(school curriculum), allowing for high correlation within the sample on
these measures but for different reasons than in the White sample. The
regression equation describing this relationship would be expected to
have a slope equivalent to that of the White sample's but with a
diminished Y-intercept as a result of inherent bias in both indicators
(differential prediction; see Bartlett, Bobko, Mosier, & Hannan,
1978). This is exactly what is found when inter-racial comparisons are
made around the issue of item and test validity (ETS, 1980; Reynolds
and Nigl, 1980).
More space will be devoted to the mathematical formulation of
validity using regression analysis below. Presently, certain studies
clearly demonstrating the effect of variable-Z (or what Jensen labels
factor—X) will be discussed. V
Educators remain perplexed and psychologists are unable to explain

5
why Black students are overrepresented in classes for the mentally
retarded (0lion & Gillis-Olion, 1983) while they are underrepresented
in classes for the physically handicapped (Hilliard, 1980). What is
the evolutionary significance of these findings? How could these facts
be explained parsimoniously with sociobiological insight? Is Jensen's
(1969) now famous statement that, "Negroes brought here as slaves were
selected for docility and strength rather than mental ability, and that
through selective mating the mental qualities never had a chance to
flourish," to be accepted? Would this explain the strong physical
constitution of the Black race and at the same time address its mental
feebleness'? Do the dire projections described by Jensen (Thomas and
Sillen, 1972) as "dysgenic trends" supposedly working to widen the
racial intellectual potential between Black- and White-Americans
account for the presently observed educational placement differences?
Ignoring all that has been written so far on the "brightness"
apparent in Blacks_'on learning tasks (also see Sewell, 1979), the
questions posed above can be answered simply by the fact that the
"selective mating" touted by Jensen somehow produced a "Black" race
where between 75% and 95% of its members can claim some European
ancestry (Robinson, 1982). It should also be noted that various
estimates of the African genetic contribution to the "White-American"
race have ranged from 27% to 33% with the peculiar result that most
Americans with some African ancestry being defined as "White"
(Stuckert, 196lI). Based on these facts, are genetic influences alone
enough anymore to explain the performance difference between the races
6
seen on IQ tests, or is it time to put to rest this major methodo-
logical flaw of psychological and scientific studies - the tacit accep-
tance of this phantasmic concept?
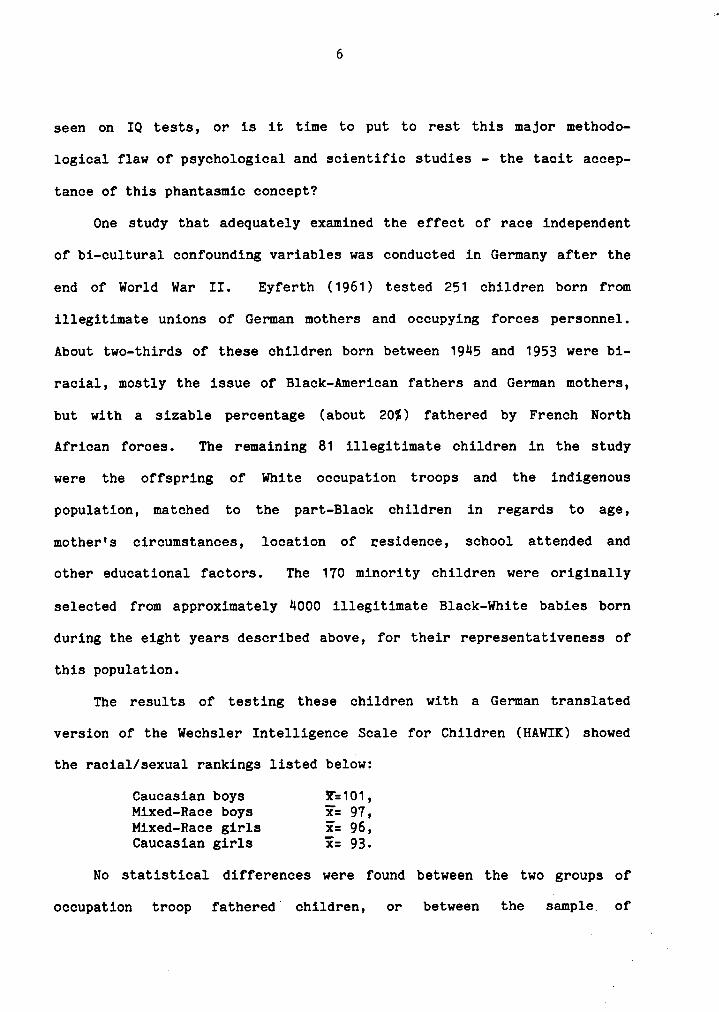
One study that adequately examined the effect of race independent
of bi-cultural confounding variables was conducted in Germany after the
end of World War II. Eyferth (1961) tested 251 children born from
illegitimate unions of German mothers and occupying forces personnel.
About two-thirds of these children born between 19*-15 and 1953 were bi-
racial, mostly the issue of Black-American fathers and German mothers,
but with a sizable percentage (about 20%) fathered by French North
African forces. The remaining 81 illegitimate children in the study
were the offspring of White occupation troops and the indigenous
population, matched to the part-Black children in regards to age,
mother's circumstances, location of residence, school attended and
other educational factors. The 170 minority children were originally
selected from approximately *1000 illegitimate Black-White babies born
during the eight years described above, for their representativeness of
this population.
The results of testing these children with a German translated
version of the Wechsler Intelligence Scale for Children (HAWIK) showed
the racial/sexual rankings listed below:
Caucasian boys 32101,Mixed-Race boys x= 97,Mixed-Race girls
zi:96,
Caucasian girls x: 93.
No statistical differences were found between -the two groups of
occupation troop fathered children, or between the samplej of

7
illegitimate children and a representative sample of 1099 German
children of the same age range. Examination of sub—test scatter
between the two investigated groups and the total investigated sample
and the general German population also did not uncover any differ-
ences. In other words, all three populations (all—German; illegitimate
half—German/half-foreign White; illegitimate half-German/half-foreign
Black) were equivalent in all respects, even the observed sexual differ-
ences. Boys scored significantly better on the HAWIK than same race
females as was true for full-blood Germans. .
A genetic explanation of these results would have to argue for
differential. mating habits involving the Black-White and White-White
liasions. Since no actual intellectual performance scores were
gathered on the parents of the probands, this possibility can only be
judged indirectly. The German mothers were selected to be reasonably
comparable on socio-economic terms. Assuming that this matching
equalized for innate intelligence in the mothers, since SES accounts
for most of the measured IQ variance intra-racially, the U.S. Black
fathers would have to have been positively selected for IQ. Although
some such selection was accomplished by the pre-induction mental
testing during World War II (the Black rejection rate was 30% compared
to a White rejection rate of 3S), this relative within-racial selection
factor did not reduce the usually observed significant difference
between the races (on the Army General Classification Test there was a
1-standard diviation White over Black difference) as measured within
he recruited population (Loehlin, Lindzey, and sp¤u1er, 1975). l
8
Commenting on the above, Loehlin et al. (1975) come to the
conclusion that,
the apparent absence of an average IQ difference among(the White and Black soldiers') offspring would seem toimply either a remarkably strong degree of selection onIQ in one or both races in determining which soldiersfathered illegitimate offspring in Germany, or that theaverage difference in test performance in the popula-tions from which the fathers were drawn was predomin-antly environmental in origin (p.127-128).
Although the alternative hypotheses that (1) intellectually
superior Blacks were somehow selected for procreation by the German
females, that (2) such Blacks were more inclined to seek the sexual
company of German women, or that (3) superior Blacks had higher fer-
tility levels than their duller co-racials in occupied Europe, can
never be completely ruled out, it is much more plausible that the
"average difference in test performance in the populations from which
the fathers were drawn was predominantly environmental in origin."
Once the genetic descendants of these different groups were allowed to
develop in a mono-cultural environment, no cultural (environmental)
differences were detected, leaving one to conclude the absence of any
genetic difference in this sphere. The overall equivalence and the sub-
score group-to—group replications tends to reinforce this
interpretation.
When the differences and sub-scale patterns are approached from a
cultural perspective, the latest knowledge of sociobiology is in
agreement. Characters, such as intelligence and height, which are
measurable on a continuous scale and are determined by the joint
interaction cx' many genes are called quantitative. These characters
1
9
are known to be much more susceptible to environmental influences than
ploymorphisms such as blood groups (Bhatia, 1976), which are relatively
unaffected by the environment. The socio-biological contention
(Hamilton, 196*4) that those traits most associated with fitness (quan-
titative variables) have low heritability seems strongly at odds with
the racial genetic viewpoint that the proportion of genetic contri-
bution to intelligence (surely a trait associated with survival in
mankind (i.e., fitness)) now stands at between 68% to 70% (Das, 1977),
and possibly 80 percent (The Great IQ debate, 1983). Socio-biology
would argue that any trait of survival would quickly spread throughout
the species via the process of natural selection. Thereafter, any
differences in phenotype observed between sub-groups belonging to that
species would be the result of environmental, and in the case
ofSapien,social-cultural influences.
A study which looked at the occurrence of what educators term the
"uneducably retarded" may shed some light on these issues. This short
reanalysis of demographic data for three Western states (Grubb, 1986)
examined the validity of the genetic-heritability explanation put forth
by Jensen (1969) through the focusing in on those members of our
American society labelled Mentally Retarded, specifically those
requiring constant supervision and care. This group includes those
labelled profoundly (IQ S 25) and severly (25 < IQ i *40) retarded
plus the lower range of the moderately retarded group (*40 < IQ i *48).
It has now been demonstrated repeatedly that groups of Whites and
Blacks matched for age and formal schooling score approximately 1-
standard deviation apart on standardized IQ tests, Whites superior to

10
Blacks (Ellis, Bennett, Daniel, and Rickert, 1979; Sternberg and
Salter, 1982; Turner and Jones, 1982). It is also assumed, based on
intra—racial analysis of data (mostly on White. groups) that the
distribution of intelligence, as measured by IQ tests, is distributed
through the populations according to that described by the normal
probability curve.
Figure 1 shows the typical raoial group response pattern on
standardized tests of intelligence such as the Wechsler scales
(Wechsler, 1981). The mean of the White group is at 100, while the
mean Black score is 1-standard deviation below the majority group -- at
85. According to probability statistics, half of each group (selected
randomly) should score below their respective means, 15.9% should score
below -1 standard deviations from their respective mean, and only 2.3%
of each population should be recorded as greater than -2 standard de-
viations below the norm. As Figure 1 demonstrates, only 15.9% and 2.3%
of the White population would score at or below an IQ equal to 85 (-1l
White standard deviation) and 70 (-2 White standard deviations)
respectively. Since the Black group's mean is already equal to an IQ
of 85, the 15-point standard deviation adjusts so that 15.9% of Blacks
receive an IQ score equal to or less than 70 (-1 Black standard
deviation) and 2.3% would receive a score of or below 55 IQ points.
Since approximately two thirds of any random sample falls within
I_1 standard deviation of the mean of its population, and slightly
over 95% of the same sample will be found between _i2 standard de-
viations, it is easy to see why most studies involving differential
statistics would be conducted on groups falling within these ranges,

ll
especially the initially described limits (:1 standard deviation).
Such studies have proven the efficacy of utilizing the bell-shaped
curve in describing IQ performance.
The problem with studies examining racial group differences (or
even individual differences) in this "middle ground" is that much of
the inter- and intra—race differences on IQ tests can be accounted for,
either empirically or hypothetically, by evoking an environmental
explanation. Up to a half standard devlation can be accounted for by
demographic variables. Factors such as sex, socioeconomic status,
father's occupation, and region of residence have already been shown to
decrease the difference between Black and White IQ scores on standard
IQ tests by about one—half standard deviation (Jensen, 1971; Reynolds
and Nigl, 1981). Matchimg groups on these and other commonly found
social, economic, and cultural differences can reduce the gap to six or
seven IQ points on the Wechsler scales.
Even though stratification matching often can reduce the gap
between racial groups, the difference remains statistically signi-
ficant. This ability to reduce the gap has caused some environ-
mentalists to suggest that there are more subtle "environmental"
· differences between the two groups which are not presently quantifiable
but nonetheless in existance and at work, keeping the Black child
from performing at a level equivalent with her White counterpart.
Flynn (1980) has labelled this unknown source of variance a blindfold
and states:
...the environmentalists...posit what I have called ablindfold and what Jensen calls a factor X: a factor"which is present in one population and not in the other

12
and which affects all individuals in one population andnone in the others;" and which must have "an equal orconstant effect on all members of the population inwhich it is present." And once we have falsified everyspecific candidate for the role of factor X, a genetichypothesis is highly probable...(p.53).
Mackenzie (198ü), summarizing the genetic argument illustrated in
the above quoted statement, writes:
In short, if there is relatively little environmentalvariance (i.e., high heritability) in IQ within racialgroups, then the environmental factors needed to accountfor substantial IQ differences between racial groupsmust be ones that, although having a strong effect onIQ, are relatively uniform within each group. It isdifficult even to imagine any credible envivonmentalfactors that meet these requirements, and no satis-factory ones have ever been proposed. Therefore, it canreasonably be concluded that the sources of race dif-ferences in IQ are most likely to be genetic. Thegenetic hypothesis can win the day by default, on thebasis of the weakness of its opponent, without having tosurvive any independent tests of its own (D. 1221).
This assessment has been correct since candidates for factor X
have even included "the flavor of race relations" which is hypothesized
as "sap(ping) the intellectual strength of minority groups" (Watson,
1970). .
The object of the reanalysis to be presented (Grubb, 1986) was not
to deal with the merits of such environmental arguments directly but to
more closely examine the hereditarian position by empirical examination
of data and comparing such data with what would be predicted based on
genetic theory. The subjects were 6,7¤2 developmentally disabled
clients enrolled in federal assistance programs in three western
states (California, Colorado, and Nevada) whom were originally compiled
by the Individualized Data Base Project1. Pertinent information

13
from that study is summarized in Table 2. In Table 3 are the number of
various racial group members for the same three statesz.
The percentage of total retarded citizens of California, Colorado,
and Nevada was determined by dividing the total counted in the Indivi-
dualized Base Project (IBDP) by the total number of residents in those
respective states. The percentage of White retardates to the total
White population and the percentage of Black retardates to the total
Black population were calculated in like fashion.
The percentage of Whites and Blaoks in the general population and
the retarded population of the three state region was also calculated.
Finally the ratio of Blaoks to Whites in the developmentally disabled
population and general citizenry were derived. All this information is
presented in Tables H, 5, and 6.
Based on the percentages of the total and White retarded popu-
eations in these three states, a cut-off score was determined for IQ
inclusion in the developmentally disabled group. Finally the percen-
tage of Blaoks predicted by racial genetics to be under their respec-
tive curve was contrasted to the actual number and percentage found in
this study.
The percentage of the total population in California, Colorado,
and Nevada that was included in the Individualized Data Base Project
(IDBP) as developmentally disabled came out to 0.03%; this same figure
was obtained for the White and Black racial groups. Based on the
Normal Probability Curve, .03% of the general and White population
would receive an IQSÄS and therefore, we may assume that those
people included in IDBP were below this ceiling. It is interesting

‘¤
14
TABLE 2
Number of Developmentally Disabled Clients in California,Colorado, and Nevada by Race
Race of ClientV
Total Clients
All Races 6,742
White (including Spanish-American) 5,956
Black 437
Other & Unknown 349

*¤
15
E‘°$2$:*«
N ä0\¢®¢'¤QQQ Q
•¤„¤•-•¤oNMw 4-•¤¤N•-•M>O¤~ oo¤JZ'U
•~•-t<rr~M '
Q aaa •·¤„a¢o»o•~<rai UO\ON0\In ¤!<r <rOv·|•· •~
oQ
¤¤·«-4 NNu~¤-IME M•n•~OO OM•-am
QQQ Q
EN-4 r-{btw:-4
ä2 322:1 S[-|(¤•rl•••• nUéßbl o•-4 Nu-•G
E••-Iu••-I U)<f¢\wv-Ian ¤JMmMM
QQQ Q
E¤¤Mr~oo¤~O IHOQQue-·•cxN<r~¤
QQ Q2***22 2-u-I
äIB·«·-|EG•¤
323%**8
mouz E-•

16
5>„ -:-4
E *5U :-4N D
-:-4U O~:-4 ¤-: O ON GNU M N N
"U O O OO:-4 U • • •'U<¤
•¤¢¤H HHU N
35 5OLD MO
O N•·4Jvd-:-4*:1
‘EU
:-4O„¤ GQ-4¢¤ O•r'|UJ ••·I:—4•:-4 uQSQ EUO :-4
P- IJ·5r—I N \D INv-I O Q Ih P")
Q cu ¤-4 r~ cn Qwu
•· •~
EUG 'G 0 anUN U·¤
E-4:-4 u'éä :2460
QIn
Mu-4UOtd G:-40 OQbß -:-4
¤¤ 1-4 :-4 :-4 0H-44-I CU M O :-4OG :-4 :-4 nn M
Q Q 0 0 ••EU UN :-4 Q
H O Q N ON00 $3-: 0 M Qgp., •. .4 •.M :-4 N O :-4¢¤>— zu N N¤)..¤ 4-vH OQIB E-4
"GG6>UZ'G GJ Mä U ä u U
U E-4 ~:-4 zu
L' E é $4

17
MU ® NII! GN w•—I Ih QQ • „N sb sb
sb INM I-I cnU M Q
cn ¢¤ •••·C', I-I Q
OO I=¤ Ch•'U·•-I QWu
•HG! ¤—4O¤·—IHZ!O¤«UO GJ C"} N¤-• u N Q•~ •r·I N C"}
:38 é 6 „„;Ew N co ooO
I4-1-5-:-4
¤—I sbIh I-IU) O- Ih
man In csBJ Obb ¢U •· •
A zu u I-I Ihcu
•r·IN
H **5 é"‘
UIU OUH NUGJNB-•M
>»I4-I„¤O I-! N
IB M QEU I-I INCU r-1
•· ••
· O> Q bs sb
E2 *5 $3II! [—I •·¢U’U
NHr: NMN
tiO
TJ ..¤ 73¢¤ 'U
r-4 ä H:5 kl td
Z uO Id OJD-• CD M

18
O·«-IuUI
gé?·•-IUld
'5
C16!
E2 8*zu
O2*N,1::8
·—•°‘u0
3uzuMg
-:1

1 19
that at this extreme end of the intellectual spectrum, there are no
White-Black difference, whereas according to the normal curve of Black
intellectual abilities (Figure 1), one would expect to find .68% of the
general Black population scoring at M8 or below on standardized IQ
tests.
Since the percentage of Blacks in the retarded population of the
three western states is slightly lower (non-significantly) than the
percentage of Blacks in the general population of the same region (and
the obverse applies to the White race), while the ratio of Blacks to
Whites remains same for both populations, it cannot be stated that the
observed results are an artifact of the data being obtained from two
different data pools. According to all the reasoning of racial-
genetics, approximately .68% of the total Black citizenry in Cali-
fornia, Colorado, and Nevada, or 15¤,01Ä Black persons should have been
identified by the IDBP (Figure 1). This "called-for" result would have
been equal to 1-standard deviation and represented a t-score difference
equal to the significant difference of .01 found between the groups in
the central region of the intellectual curve.
This short report attempted to explore the racial-genetic theory
concerning Black-White IQ-differences by analyzing available data on
the occurrence of the profoundly and severly retarded in each racial
group. If IQ is inherited in the same fashion as height or other know
inherited traits, its distribution through each group should be in
accordance with probability statistics, and the difference in group
performance at any cut—off score should be predictable. The data in
this report confirmed these assumptions when the total populations of

20
L. 611uRE 1
NORMAL PROBABILITY CURVE DISTRIBUTIONOF IO 111111 BY RACEWHITE DISTRIBUTION BLACK1.1. 1.1.
RQ WHITE BLACK145 1+3T T
IL+2 T 17.71 11.11 ——*l
lk11 —— 11.11 17.71 Ti
1 T 61.11 11.11 T
85-1 T 16.11 61.11 TQ-
-2 T 2.11 16.11 T
66_______··+
——@ .1 13 .1 1 -—i—
·_ '
·l

21
lthe three target states was analyzed as well as the White population
(see Figure 2). The assumptions of the hereditary viewpoint, as re-
gards the Black race (based on IQ information focused around the·
group's measure of central tendency), was however, not upheld in this
study but would lead one to reject this line of reasoning.
It would appear that for those least affected by education,
culture, and the environment, the profoundly/severely retarded, there
are no racial differences. The Black race at the low end of measured
intellect seems to conform to the normal probability curve of the
general (and White) population (Figure 2). These results cannot be
explained as they were not predicted, by the hereditarian viewpoint.
These results can be explained from an environmental standing if
we consider the non-educable mentally retarded as uninfluenced by
Jensen's factor-X whereas those able to learn are influenced by it. It
is still true that as yet this factor has been undefined and its nature
or name is not the reason of this early discourse; proponents of
suchla
factor could theoretically explain the skewness of the Black
probability curve (would even predict such skewedness of the Black
probability curve) through evoking such a factor's unilateral effect in
the minority group's performance.
Finally, although these findings did not address the high end of
the curve, preliminary data from high IQ societies, presently being
analyzed by the author, suggests that the Black group's representation
past the general (and White) population +2-1/2 standard deviation mark
(IQ=137) is equivalent to that of the majority group (see Figure 2).

n22
‘ FIGURE 2 1RECONSTRUCTED PROBABILITY cu1av6 DISTRIBUTIONOF 10 SCORES 600 6661:16 COMPARED TOTHE 110611116 PROBABILITY CURVE DISTRIBUTION 6011 WHITES
01s1616u110~‘ WHITE
’145 PERCENTILE ·——— wax
aw .<a7.7x wax
H5 84.1% _ <a7.7x
ä mx 84.1%E
85 _ _15.% mx
2.:ax 1
66 6.1x
» 40 ,

23V
This type of result would certainly not be expected from a hereditarian
perspective (see also Loehlin, Lindzey, and Spuhler, 1975; Chapter 5).
It would seem that for middle-class Whites, the normal bell shaped
curve adequately describes the distribution of test tapped intellectual
ability and, therefore, is suggestive of intelligence being an
inherited commodity. The Black population's extreme scores, which are
proportionally equivalent to the White population, would also confirm
this hypothesis. The racial-genetic hypothesis, as previously noted,
has also been argued for by the presentation of Black IQ distribution
in the mid-range of assessed intelligence (ZI; standard
deviations). The problem of normality (as described by the normal
probability curve), and therefore, traditionally understood
inheritability, only arises when the entire range of Black IQ test
performance is examined. This overview requires the addition of some
major factor to explain the contradictions between normal and abnormal
(both superior and inferior) Black individuals and their respective
relationships with their White counterparts.‘
This major factor is what the present investigator terms Cultural-
Distance (CD); to be defined and described more fully later in this
paper. At this point it need only be stated that those in the mid-
range (average) of what this society terms intelligence are most
affected by this variable. Our perspective, therefore, does not deny
the heritability‘ of intelligence, it just disagrees with the belief
that present assessment techniques adequately tap this construct for
those individuals raised in cultures very different from the culture on
which the assessment devices are based and normed. Investigators such

24
1 as Eysenck (1983), Ertl (IQ: Find no racial differences, 1972), Deary
and Brand (Begley, Dallas, and Carey, 1982), and Hendrickson and
Hendrickson (Eysenck, 1982) have looked at brain waves and evoked
potentials as measures of innate intelligence. Decades of work in this
area has determined that more intelligent subjects have "sharper and
more complex" (Begley, Dallas, and Carey, 1982) EEG recordings and
process information to problem resolution at a higher rate of speed and
with fewer errors (Storfer, 1985). These neurological measures also
correlate highly with traditional IQ measures and learning tasks. As
Eysenck (1983) states in a brief summary of his work:
Correlation between IQ and evoked potential, using thenew measures, was found to be .83, and in a replicationstudy using the Raven's Matrices on a different popu-lation a slmilarly high relationship was found. Thesecorrelations are higher than those typically obtainedbetween the Wechsler and other IQ tests, such as theBinet, suggesting that we may here be dealing with atrue measure of intelligence uninfluenced by social edu-cational and cultural factors (p. 3).
The non-biased nature of these "tests" has long been known. Ertl
(IQ: Find no racial differences, 1972) has run investigations invol-
ving hundreds of Black and White subjects in the early 1970s, finding
no significant differences between the racial groups. Both races
seemed to have proportionally equivalent numbers of individuals in all
categories ·from genius to retarded, and the normal bell shaped distri-
bution was an accurate model of the distribution.E
This type of research would argue against a "developmental lag" or
the genetic coding of Blacks with less intellectual skill. This
research would also argue for the Cultural-Distance perspective and
against the racial-genetic proponents' contention that traditional IQ

25
·tests are not biased but represent "true" differences between racial-
cultural groups. The Cultural—Distance viewpoint does not deny the
heritability of intelligence within -groups, only that between -
groups comparisons using pencil-and—paper measures are presently
influenced by culture: variable Z, factor X!
Another study demonstrating the possible effect of variable Z,
factor X, or what this writer prefers to call cultural-distance was
conducted by Abrams and Jernigan (198*4) at Eastern Michigan University
(EMU). The authors of this study followed 229 "high-risk" students
admitted to the university in the fall 1981. These students were
admitted on the condition that they participate in a program of support
services during their first year of studies in order to rectify their
identified deficiencies in academic functioning. This on-going pro-
gram, PASS (Promote Academic Survival and Success), is part of EMU's
efforts to increase the number of non-traditional students (i.e.,
minority, low-income) matriculating at the university.
- Besides providing advising assistance, academic support services,
and peer tutoring, all provisional students in the PASS program are
required to take certain special classes during their freshman year.
Required classes of this one year remedial process include English, a
general university-studies course, history or political science, and
usually a math or science course. Abrams and Jernigan (198*4) summarize
the program in the following paragraph:
Part of the university-studies course is mandatoryparticipation in an academic support services program
consisting of instruction in study skills, reading, and
English. Study skills instruction includes tests takingtechniques, textbook attack methodology, notetaking,

26
”memory skills training, and time management. Reading
’instruction includes comprehension, vocabulary building,spelling, and speed reading. English instruction in-cludes grammar, writing skills, and library skills.Intertwined with this instruction is stress managementtraining and academic counseling. In terms of emphasis,the student spending 20 hours in the program receivesapproximately 10 hours in study skills, 6 hours inreading, and H hours in other areas (p. 263-26Ä).
The authors were interested in determining the efficacy of the
PASS program. They had four hypothesis that were tested: "(a) the
number of hours spent in reading and study skills program and the
number of visits made to tutors (tutor contacts) would signigicantly
correlate with college GPAs and retention of high-risk students in the
university; (b) a significant decrease in students' use of the academic
support services would occur from fall to winter semester; (c) first
semester college grades would significantly correlate with reading test
scores; and (d) participation in a structured reading program would
result in measurable and significant increase in reading vocabulary,
comprehension, and speed, as measured by the Nelson Denny Reading Test
(NDR) ." The authors also sought to "correlate academic success
variables -- as measured by college grade point averages (GPAs), number
of credit hours completed, and persistence in the university -- with
traditional predictors of academic achievement, admission test scores
and high school grades.“
The results of the study following this yearly group of PASS
students surprised the authors in one sense. Traditional predictive
indicies of college proficiency, such as high school "GPAs, reading
scores, and college admission test score" did not significantly cor-

27
relate with either college GPAs or academic success (i.e., course
grades and persistence in college) in the PASS sample.
These non-traditionally prepared students would not have been
admitted under the university's general freshman admissions guidelines
because of poor prior academic functioning (mean HSGPA = 2.53) and poor
test assessment (mean ACT composite : 13.96; mean ACT math = 12.29;
mean ACT english = 12.92; mean SAT combined = 72.78; mean SAT math :
38.18; mean SAT verbal = 3*4.75). Therefore, based on "common know-
ledge“ of college placement boards, these students would all have been
predicted to fail in the college environment; based on the assumed
predictive validity of general measures of intellectual performance
such as ACT and SAT scores, found here to be useless.
Of the 229 entering PASS students, ten withdrew during the fall
lsemester and 29 more withdrew after the fall semester (even though nine
of these had passing GPA's of 2.0 or above). The failure rate (percent
of students receiving a GPA of 2.0 or less -- C average) of PASS
students completing the fall quarter was 35% (77/219), and went up to
H1 percent for those completing the winter quarter (78/190). Overall
the failure rate for PASS students during their first year was ¤3%
(9U/219) as compared to 3% of the university's other students.
What did predict success for the PASS students at Eastern Michigan
University was participation in the PASS program. The number of hours
spent in the reading and study skills program significantly correlated
with fall GPA (r;.39), first year GPA (g;.36), number of fall
semester credit hours passed (g;.26), number of yearly credit hours
passed (g;.32), and differentiated those students passing and failing

l28
Vthe
‘fall quarter (t:3.95; _g<.01). The significant difference
between the groups of passing and failing PASS students at the end of
the winter semester on this variable was somewhat less (t:2.02,
g_:188, p_<.05).
Tutor contacts also support Abrams and Jernigan's (198lI) first
hypothesis. This variable (number of tutor contacts ) correlated
positively with fall GPAs (g_=.25, p_<.O1) and first year GPAs
‘ (_1;:.26, p<.O1). '
The authors discovered that besides fall GPA, the only variable
able to predict retention (with winter enrollment as the criterion) was
the number of hours spent in the reading/study skills program
(2:3.63, _p<.01). The number of tutor contacts approached but did
not reach significance for this variable.
In digesting their study, the authors state:
The above results are a bit disquieting. Not only isthe widespread reliance on traditional entrance criteriaunjustified for the high-risk population, but the most
I significant predictors of their initial semester aca-demic success are not known at the time of matriculation(p. 270).
Why the traditional assessment measures prove useless with what
Abrams and Jernigan (198*4) call "high-risk" students will be discussed
in greater detail later. Let it suffice to state at this point that
those groups and individuals most distant from the cultural norm used

29
as a basis for test construction and around which the social infra-
structure (i.e., school systems and institutions) is built ‘will most
likely be misjudged as regards adaptability to those supra-cultural
referenced environments. The reason for this under prediction of
achievement is that all achievement and intellectual tests assume equi-
valence of social milieus between groups, thus reducing performance
differences to lack of innate ability to acquire these tapped behaviors
(intra-psychic) and completely ingnoring the possibility of opportunity
disparity (exosystematic) or simple functional differential acquisition
of adaptive behaviors (macrosystematic). The fact that culturally-
distant students and groups, when required to incorporate new modes of
behaving (study habits and reading skills) that are useful in practical
situations (school classrooms) and of value in attaining future goals
(formal education, job security), are able to learn and demonstrate
proficiency· in supra-culture valued behaviors is not surprising when
looked at from the broader view espoused by Williams (1972) and
discussed above.
Even Jensen (1969) admits that he could (and has) caused an
increase in test measured intelligence in a matter of an hour, simply
by allowing children to relax and play around with the test prior to
its administration. Are these IQ tests therefore, measuring (at least
partially) familiarity with the materials and procedures of testing?
By allowing a non-traditionally raised child to become familiar with
the valued (and therefore tested) expectations of a test and its
context, one may be allowing a bit of enculturation to transpire.
30
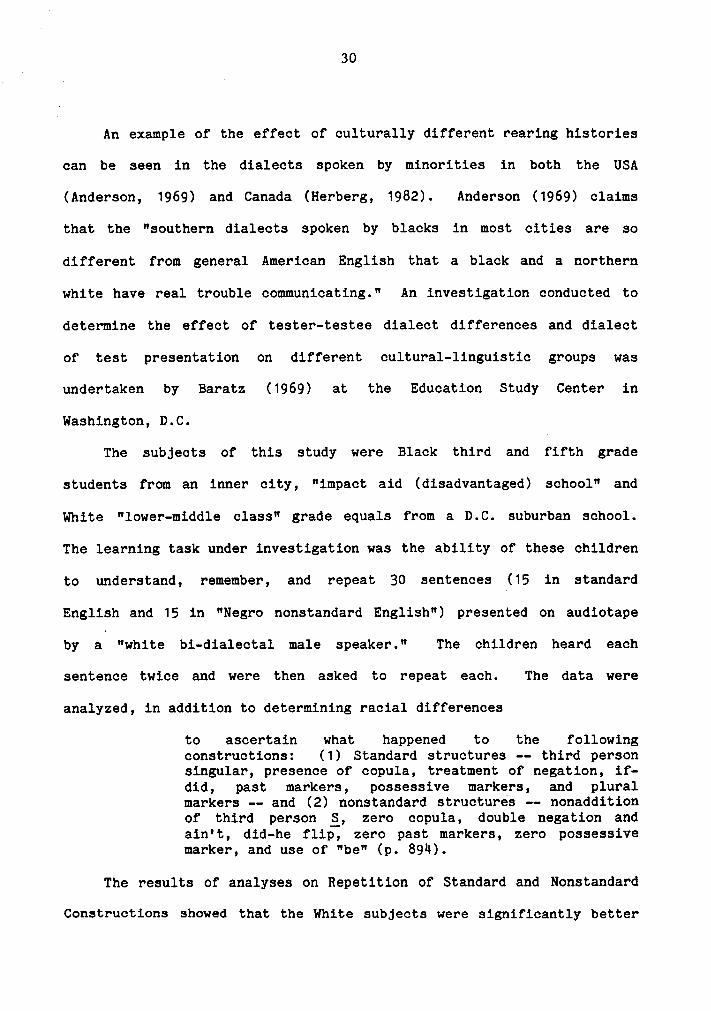
VAnexample of the effect of culturally different rearing histories
can be seen in the dialects spoken by minorities in both the USA
(Anderson, 1969) and Canada (Herberg, 1982). Anderson (1969) claims
that the "southern dialects spoken by blacks in most cities are so
different from general American English that a black and a northern
white have real trouble communicating." An investigation conducted to
determine the effect of tester-testee dialect differences and dialect
of test presentation on different cultural-linguistic groups was
undertaken by Baratz (1969) at the Education Study Center in
Washington, D.C.
The subjects of this study were Black third and fifth grade
students frmm an inner city, "impact aid (disadvantaged) school" and
White "lower-middle class" grade equals from a D.C. suburban school.
The learning task under investigation was the ability of these children
to understand, remember, and repeat 30 sentences l(15 in standard
English and 15 in "Negro nonstandard English") presented on audiotape
bya'
"white bi—dialectal male speaker." The children heard each
sentence twice and were then asked to repeat each. The data were
analyzed, in addition to determining racial differences
to ascertain what happened to the followingconstructions: (1) Standard structures -- third personsingular, presence of copula, treatment of negation, if-did, past markers, possessive markers, and pluralmarkers -- and (2) nonstandard structures -— nonadditionof third person _§, zero copula, double negation andain't, did-he flip, zero past markers, zero possessivemarker, and use of "be" (p. 89ü).
The results of analyses on Repetition of Standard and Nonstandard
Constructions showed that the White subjects were significantly better
A31
at understanding and correctly repeating the standard English sentences
than the Black children. What new information this research added to
the archives was that the Black children outperformed their White age-
mates on the understanding, retention, and reproduction of the sen-
tences dictated in nonstandard Black-English. White superiority in the
use of standard English was attributed to "the significant difference
between Negro and White performance on the following gramatical cate-
gories: third person singular, copula, if-did, and negation." The
Black dominance on nonstandard trials was explained by Baratz as "the
differential performance of Negro and White subjects on the did-he flip
and the double negative constructions." The author concludes that
nonstandard (Black) English as used by the minority children interferes
with their graded performance in the out—culture verbal mode of ex-
pression (standard English) and that when majority children are
required to perform according to minority verbal standards, a like
recorded reduction in measured aptitude is displayed. She sees both
communication packages as having set rules and underlying order, rules
and order which govern the utilized perception of information and
transmittal of same (equivalent results testing short story recall
supports this assumption; Hall, Reder, and Cole, 1975). Baratz claims:
The fact that the standard and nonstandard speakersexhibited similar behaviors when confronted with
sentences _that were outside of their primary codeindicates quite clearly that the "language deficiency"that has been attributed to the children of low-incomeNegroes is not a language deficit so much as a diffi-
A culty in code switching when the second code (standardEnglish) is not as well learned as the first(nonstandard English).

32
...The assumption that Negro lower—class children arelearning a well-ordered but different system from theirwhite counterparts, and that if this system, rather thanstandard English is used as a criterion of "correotness“that the white child will do more poorly than the Negro(i.e., appear deficient), was supported (p. 898-899).
Instemd of Black dialect seen as a pale reflection of standard
(White) English and, therefore, dysfunctional, Black English should be
viewed as providing an ecologically complete method of knowledge trans-
mission (oral communication). The types and modes of verbal order char-
acteristic of nonstandard English can more profitably be seen as en-
functions deserving more than mere deficite appraisal; qualifying for
differential understanding.
The Two-Stage Argument
Despite the accumulation of a great wealth of data such as has
been presented to this point, other investigators (Jensen, 1971, 1973b,
1976; Jensen and Inouye, 1980) see intellectual test assessment as true
measures of individual and group differences based on inherent capa-
cities. Authors adhering to this persuasion account for higher perfor-
mance on standardized tests by certain racial groups as an indication
of superior genotype constitution. Accordingly, patterns of selective
mating and evolutionary adaptation of the sub-species of mankind are
determined to be the regulators of intellectual endowment within, and
between, the races respectively.
However, much of the dogmatic quality of the genetic viewpoint's
proponents have been tempered of late; Jensen et al. (1980) recentlywrote:

33 .
If the Level I—Level II pattern of racial differenceswere largely of genetic origin, the explanation wouldreasonably be sought in differential selective pressures
for different cognitive abilities in the evolutionaryhistories of these groups. If the different patterns of
abilities are of cultural origin, explanations would be
sought in the values, motivation, and styles of childrearing that currently predominate in each of these pop-
ulations. Both avenues at present are likely sources of
explanatory hypotheses and empirical exploration (p. M9).
The soundness of the two arguments still rests in the reputation
of the established science of genetics versus the developing ”arts”
which are the social sciences. Flynn (1980), in his text on race, IQ,
and Jensen asserts that the proponent of racial-genetics _
has fashioned a powerful argument in two steps: first,most of the IQ variance within white America is due to
genetic factors and most of IQ variance within blackAmerica may be, although here the evidence is just
beginning to come in; second, we can falsify every
current hypothesis which attempts to explain the gap
between black and white in environmental terms. There-fore, we have good reason to suspect that most of the
gap between black and white is genetic (p. 23).
To quote Jensen (1973a) directly:
If it were established the heritability of IQ is as high
as 0.75 in both the Negro and White populations, then it
can be said that as yet no environmental factor or com-
bination of factors has been identified on which the
Negro and White populations differ sufficiently to ac-
count for the 15 points mean IQ difference solely interms of nongenetic factors. This makes it necessary,
if one wishes to maintain a purely environmentalist
theory, to hypothesize the influence of subtle,unmeasured, and perhaps unmeasureable environmentaldifferences which contribute to differences betweenraces but not to variance within races (p. 356).
This two-stage argument used by the racial—genetic adherants
requires all the effort be expended by the environmentalists while
requiring very little effort by themselves in proving: (1) herita-
bility estimates of non-White populations, and (2) defining what
34
ecological processes were and/or are at work to produce the inter-
racial difference in tested intelligence. Mackenzie (1984) has
analyzed the genetic argument and found what he considers many faults
with it, but in sumarizing the logic inherent in the argument he
states that the line of reasoning makes it "difficult (to) even ...
imagine any credible environmental factors that meet (the) requirements
(of the argument), and no satisfactory ones have ever been proposed."
Following this reasoning to its complete conclusion, Mackenzie states
that the hereditarians "can reasonably . . . (conclude) that the
sources of race difference in IQ are most likely genetic," and
according to Jensen (1969), account for 60% to 90% of groups variance
on IQ indicies.
Cultural-Distance as Factor X
The author here, and previously (Grubb, 1983), puts forth the idea
that culture itself is the "subtle, unmeasured, and perhaps
unmeasureable environmental differences which contribute to differences
between races but not to variance within races" (Jensen, 1973a) and has
proposed measuring the distance between cultures as a method of quanti-
fying what has been believed an "unmeasureable" phenomenon. Thus then,
cultural-distance is factor X and can be seen to "account for substan-
tial IQ differences between racial groups" while remaining "relatively
uniform within each group." This "variable Z" can be used to explain
parsimoniously the individual differences intra- and inter-racially
whi1e_ also describing accurately and interpreting group response
patterns on assessment batteries. 4

U 35
More space will be devoted to the writer‘s hypothesis below.
First, some of the more conventional environmental explanations will be
explored. Focus will be on specific quantifiable entities that have
been demonstrated to differentiate the two major racial grouping in
America, and correlate with intellectual performance (as measured by
standardized assessment schedules).
Conwill (1980), Herzog, Newcomb, and Cisin (1972), Orive and
Gerard (1975), Sowell (1977), and Deutsch (1960), among others, have
demonstrated the effect of socio-economic standing, father's occu-
pation, father's presence or absence in the home, geographie area of
residence, the urbanisity of living and other environmental differences
between groups which partially account for the observed group perfor-
mance discrepancies. Herzog et al. (1970) conducted a study inves-
tigating the parental and familial differences between high-achieving
and low-achieving poor students in a head—start type program. The two
types of children came from different types of poor families. For one
thing, the higher-functioning children had parents who were more self-
reliant than the other children; they did not borrow from relatives and
friends on a regular basis. The same parents also tended to keep their
living quarters in better care. They were thus, perhaps not as dis-
couraged by or resigned to their condition: perhaps they were not as
distant from the main-stream values and perceptions as were the other
parents, and therefore their children were more programmed in a fashion
enabling them to adopt to and learn from the supra-culture-direeted
learning environment (the school). Perhaps these children were
somewhat able to escape "the way in which even the flavor of race

36
relations can sap the intelleetual strength of minority groups"
(Watson, 1970) because of the efforts of their parents.
Factors such as sex, socioeconomic status as determined by the
oeeupation of the head of household, region of residence in the U.S.,
and urban vs rural residence have already decreased the difference
between Black and White IQ scores on standard IQ tests from 1 standard
deviation (seen in random samples on an uncontrolled basis: Jensen,
1971) to between .5 and .7 standard deviations (Reynolds and Nigl,
1981). Kaufman and Kaufman (1973) matched Black and White children,
between the ages of 2-1/2 and 8-1/2, on these background variables:
age, sex, father's occupation, geographie area, urban vs rural resi-
dence and school grade. Their results indicated no signifieant dif-
ference between Black and White preschool age children (the 2 1/2- to 3
1/2- and il- to 5 1/2- year-old groups) on any of the cognitive scales
ef the McCarthy Scales of Children Abilities (MSCA). They did however,
find a significant racial difference for the 6 1/2- to 8 1/2-year old
group.U
Scarr (1976) investigated the IQ scores of Black children of
differing ages adopted by White families and found that the mean IQ for
this groups was 16 points higher than that achieved by "disadvantaged"
Black children raised in their families of origin in the same geo-
graphic areas. Scarr made sure that the comparison groups did not
differ in any appreciable biologieal fashion, thus undercutting a
possible hereditary explanation. It is also interesting to note that
the difference between the two groups is equal to what is usually

— 37
observed between random White and Black groups. This difference be-
tween racially identical Black groups also parallels Jensen's Black-
White ”pseudo race" dichotomy (Jensen, 1977). Cultural-Distance
analysis of all three comparisons would predict such contrasts.
But, here again this discussion is getting ahead of itself. The
type of environmental influences mentioned above are of a higher order
than those usually considered by traditional environmentalists. More
conventional variables of focus include birth order (Adams, 1972;
Cicirelli, 1978; Hauser and Sewell, 1985; Schooler,1972); family size
(Alvin and Thornton, 198¤; Olneck and Bills, 1979); quality of school
system (Carey and King, 1982; Schofield, 1982; Williams, Foote, Ellis,
King, and Burgower, 1982); parental attitudes (Koutrelakos, 1971);
family income (Oakland, 1983); population setting of childhood
(Koutrelakos, 1971); socioeconomic factors (Alvin and Thornton, 198M;
Deutsch, 1960; Herzog, Newcomb, and Cisin, 1972); parenting behavior,
especially of the mother (Arend, Gove, and Sroufe, 1979; Munroe and
Munroe, 198N; and Ponnuswami, 1972); father's occupation (Belz and
Geary, 198M); and early dialect used in the home and community (Baratz,
1968); in addition to those variables cited above throughout the text
(for more complete listing of typical environmental variables see
Grubb, 1983).
Even the classroom environment is affected by the cultural matrix
of its participants, and the response patternsofl
both majority and
minority teachers. Greenbaum (1985) found that White teachers re-
sponded differently to Anglo or Indian students, hypothesizing that the
instructor's form of information transmission was influenced ·by the

38
interpersonal styles and group interaction patterns of the students.
White "teachers in the Choctaw (Indian) classrooms had longer turn-
switching pauses (2<.O5), asked more questions (p<.O1), and used
shorter utterances to ask questions of individual students (p<.O1)"
than in predominantly White, middle-class public schools. The author
suggested that these teacher differences were caused by the cultural
differences in student classroom interaction; Choctaw students "spoke
individually less often (p_<.O1), used shorter utterances (£<.O1),
interrupted the teacher more often (p<.01), and while the teacher was
talking gazed more at peers (p<.05) than their Anglo counterparts."
Greenbaum (1985) states that, "although probably rooted in the
students' cultural experiences, the functional effects of the observed
differences apparently represent difficulties in classroom interaction
that would presumably obstruct 1earning." Thus we see that even the
interface of cultures in a common, and supposedly neutral, setting can
be influenced by cultural specific behavioral patterns that haveI
evolved in response to different cultural environments of origin (also
see Bersoff, 1971; Moore, 1981).
The Four Ecobehavioral Systems
The above-mentioned investigators have approached the problem of
group performance differences (and individual differences) from dif-
fering points of view (racial-genetics, society, culture, rearing en-
vironment). Each school of thought has contributed some insight into
the problem, each has developed techniques to test its hypotheses, each
has compiled evidence tending to support its conceptualizations, and8
p

39
no doubt, each has some basis in truth. Science however, is a process
of distillation and evolution toward the most parsimonious explan-
ation. What can all of these seemingly diverse theoretical frameworks
have in common? How can their basic differences be reconciled?
The understanding of group performance differences is the
unmistakable subject of investigation which unites all the previously
described conceptualizations. Their focus of investigation is also
almost always the same: the individual (and to some extent the im-
mediate environment in which he or she behaves - the test_situation,
i.e., Watson (1970)). This second point, the level of analysis , may
be more important and critical for the understanding of differences in
theoretical conclusions drawn than the subject investigated itself
(group performance differences).
Bernstein (1982) has posited that in order to be more accurate in
our understanding of social problems we must broaden our perspective to
include the four ecobehavioral systems in which individual behavior
occurs. She states:
there are four levels of analysis: the individual, themicrosystem, the exosystem, and the macrosystem. Theindividual comes to a particular situation with alearning history and biological characteristics whichaffect his or her behavior. The microsystem refers tothe immediate setting in which the individual behaves,while the exosystem is the larger social structure, bothformal and informal, and the macrosystem consists ofoverriding beliefs and values (p.2).
Understanding an individual, and most surely a group of indivi-
duals, requires an appreciation of the processes at work on that
individual, or group, at all levels or more simply, their ecobe-

40 ‘
havioral system. Sarason (1981) paraphrases the beliefs espoused by
John Dewey which make this point most clear:
Dewey says clearly what psychology is still blind to:the substance of psychology cannot be independent of thesocial order. It is not that it should not be inde-pendent but that it cannot be (p. 830).
Some other theorists (Hardy, Welcher, Mellits, and Kagan, 1976;
Lieblich & Kugelmas, 1981; McShane, 1980) have begun to include the
third level of analysis. Proponents of the Head Start program have an
understanding of the influences of the exosystem on childhood
learning. They understand that the lack of reading material in the
home and the paucity of intellectual stimulation is detrimental to high
academic achievement. This level of analysis has been partially
influential in the development and ascendency of what has come to be
termed the deficit hypothesis, described below by Cole and Bruner
(1971):
It rests on the assumption that a community underconditions of poverty (for it is the poor who are thefocus of attention, and a disproportionate number of thepoor are members of minority ethnic groups) is a dis-organized community, and this disorganization expressesitself in various forms of deficit (p. 867).
Therefore, it is assumed that early interventions which supply the
lacked intellectual stimulants will rectify later lowered developmental
stage attainment (Miner, 1957; Reynolds, Gutkin, Elliott, and Witt,
1984). In theory it is a "critical time" and lasting intervention
theory. It describes a process parallel to imprinting in non-human
organisms and is often referred to as "preparedness" (Gardner, 1983).
In fact much of its research base is in the area of comparative psy-
chology and derived frcm animal analogues. This third level of

41
understanding, however, is not sufficient (see Coleman, 1976, p. 517-
519). For example, the slow decline in poor Black children's perfor-
mance during the early school years, even after the great initial gains
of Head Start intervention progress (Herzog, Newcomb, and Cisin, 1972),
cannot be explained on this level of analysis. Only with the inclusion
of the macrosystem - overriding beliefs and values - can complete under-
standing and lasting change be accomplished.
One such approach, the Cultural-Distance Approach (Grubb, 1983),
has been proposed in an attempt to analyze differences in intellectual
and achievement performance observed between Black and White indivi-
duals. In this approach, the author borrowed from other socio-cultural
theorists in the fields of Psychology, Sociology, and Anthropology and
specifically included all four levels of analysis. With the addition
to the fourth level - the macrosystem - the discrepancy in Black-White
IQ test performance between male and female and the decline in Black
mean score performance with age (including male-female and class dif-
ferences) was explained as follows:
The poor, and especially the male poor, have graveobstacles to overcome because of limitations set on themby those with wealth and power. Because females areoften viewed as the "weaker sex" they are often allowedaccess to the domiciles of the ruling classes as do-mestics and are thus privy to modeled behaviors oftenunaccessible to the male of the same class. Is it anywonder that Black females outperform Black males?Looking at the cultural implications would allow for thedisappearance of this effect as social class becameelevated because the modeled behaviors would then beequally accessible to both sexes.
Since the national social requirement of females, re-gardless of race, is to be more expressive (verbal andemotionally) but not necessarily to be competent in thephysical (manual dexterity) or philosophical planés

· 42
A(politics, science, higher mathematics), the reason for
female and male dominance in these socially sanctioned
areas can be attributed to cultural expectations. It
would of course follow that Black females allowed to‘ converse with the White culture would be defined by both
race and sex, thus acquiring higher supra-culture pro-
ficiency in sexually-relevant areas than in those areas
deemed sexually irrelevant. This increased behavioral
proficiency would be transmitted to the Black females'
off-spring unless countered by other forces at work in
the home (the Black father-son relationship) or until
forces outside the home begin to operate (society's
definition of male Blackness for the Black child in the
school system).
Besides being in close proximity with Whites, poorer
female Blacks also encounter racism at a later date in
their lives than Black males thus putting off the
observed decline in Black children IQ scores with age
(p- 52-53)-
This is but one example of how the use of a multi-level analysis
of the problem of intellectual differences is an improvement over a
singular lower level analysis. Many other examples are given by Grubb
(1983). Of course, the author recognized that his personal assessment
of the situation was also the product of his growth and interactions at
all four levels. This too is important. To quote Sarason (1981) once
more:
...one would hardly know that psychology existed in aparticular society having a distinctive social order
deriving from a very distinctive past, that psycho-logists did not (and do not) represent a randomassortment of people, and that by virtue of theirsocialization into their society, and their social-professional niche in it, the substance of theirtheories had to reflect these factors (p. 827).
This makes clear a second point that helps explain why different
investigators are able to come to different conclusions on the issue of
group test descrepancies. Might not the culture, class, race, and sex
of the individual. determine his or her own perspective on this and

43
other issues? Simply believing that one is an objective and "fair”
investigator (or even attempting to practice science in such a manner)
does not obviate the influence of culture and society on one's belief
system and mode of operation (i.e., investigative techniques and inter-
pretation of results).
A couple of quotes from a recent article on theory construction by
Scarr (1985) shows that some psychologists are aware of these issues:
Each scientist approaches scientific problems with atheoretical viewpoint, whether explicit or implicit.Theory guides inquiry through the questions raised, theframework of inquiry, and the interpretation of theresults. Each scientist seeks to find ”facts" to as-similate into his or her world view. Thus, each of usis biased by the human tendency to seek ”faots" that arecongruent with our prior beliefs (p. 499).
...The sociocultural and historical context of theinvestigator is clearly a major determinant of what islikely to be believed by the investigator and by col-leagues. The most persuasive views of the era form theworking assumptions of most scientists of that time (p.501).
Higher Order Effects in Research
A few examples of how our cultural history influences how we
perceive phenomenon may be illustrative. In an article with the
scientifically objective title, "Children's Appreciation of Humor
Victimizing Different Racial—Ethnic Groups: Racial-Ethnic
Differences," McGhee and Duffey (1983) display the prominent White-
American viewpoint as regards differences in measured performance
between the races. The study is summarized adequately by the authors
in their abstract of the paper:4
· _
44
This study examined the early development of humordepicting victims of other racial-ethnic groups amonglow-income black, Mexican American, and white childrenand middle-income white children. Boys and girls be-tween 2 and 6 years of age were presented with pairs ofdrawings differing only in the identification of thevictim of a minor mishap and were asked to choose thefunnier of the two. The pairs included the followingcomparisons: black versus white victim, black versusMexican American victim, and white versus MexicanAmerican victim. As hypothesized, only white childrenfound it funnier to see a child of another racial-ethnicgroup victimized in humor than a child of their owngroup (p. 29).
So far, what has been described is a factual account of what
McGhee_ and Duffey's study found. What goes beyond mere factual
reporting is to be found in their "interpretation" of the results.
Based on the limited literature dealing with "disparagement" or "put-
down" humor, the authors oonclude that their results represent:
...(the) indentification/disposition theory of humorwith a sample of preschool children, and suggest thatas soon as children begin to develop a strong positivesense of racial-ethnic identity they are likely to findgreater enjoyment in seeing other racial-ethnic groupsdisparaged in some way than in seeing their own groupdisparaged. The obtaining of significant preferencesfor white children, but not black or Mexican Americanchildren, was expected in light of previous data sug-
‘ gesting that white children positively identify withtheir own racial-ethnic group earlier (by the preschoolor early elementary school years) than minoritychildren...(p. 37).
This is a particularly enlightening study for review because it
shows how the investigators' beliefs and cultural world view help to
build theories to accommodate empirical data. In this particular
study, two cultural groups (Black and Mexican-American) reported no
difference in alternative stories when the victim was Black, Mexican-
American, or White. Only the White children found stories bwith

l45
particular victims (minorities) more amusing than identical stories
with different victims (Whites). McGhee and Duffey (1983) are able
without the slightest blush to interpret these results to make the
abnormal response (that of the White children) the norm by which the
majority response is judged and found wanting! Blacks and Mexican-
Americans are seen as having "ambivalent attitudes toward their own
racial-ethnic group, while white children generally show consistent
positive attitudes toward their own group."
Would it not be more parsimonious to say that the White children
acquire negative attitudes (prejudice) toward out-group members
(minorities) at an earlier age than either Black or Mexican-American
children? Why are the minority children seen as deficient? How is it
that a negative characteristic (put-down humor) is seen as a positive
attribute when acquired early in life? These rhetorical questions need
no answer. Any answer could be interpreted as a cultural one!
Not only do a minority of cultures in our society endorse what has
been described as disparagement humor; there are also sexual dif-
ferences. Some studies have obtained supportive data (for the
"identification/ disposition humor theory") for females, while others
have shown that women actually prefer humor in which their own sex is
put down (Cantor, 1976; Losco & Epstein, 1975). Only White males (men
and boys) are consistently found to be in agreement with the
"identification/disposition theory", yet McGhee and Duffey cling to
this largely useless construct in order to assign White boys their
culturally expected position of superiority over minority and female
children. All performance not equalling the assumed White male norm is l

46
interpreted as being deficient. Why is not the aberrant White male
performance seen as an early development of a life-long anti—out-group
(prejudice) world view? Why not accept the fact, widely known and
accepted in the general population, that Whites (especially men) are
more prejudiced and discriminatory than other groups of people?
The authors put forth the call for other scientist toconduct future studies along these lines...(with) olderchildren in order to determine whether black or MexicanAmerican children similarly find greater humor in seeinga member of their own group victimized once they beginto develop a strong identity with their own racial-ethnic group (McGhee and Duffey, 1983; p. 37).,
But we already know that Black adults in one study did find anti-
White humor funnier than Whites, but that the same Blacks also found
anti-Black humor as funny as did the Whites (Middleton, 1959). In
other words, the adult Blacks found no difference in humor directed at
in-group or out-group members. This sample of Black adults could look
past the color of the victim, whereas the White adults could not.
According to the identification/dispostion theory of humor, the White
adults had an high degree of positive identification with their co-
racials and thus found little humor in White victimization, while at
the same time they held negative attitudes involving Blacks and could,
therefore, more freely enjoy Black victimization. Blacks, on the other
hand (and still from this perspective), would be seen as having little
positive group identification (unable to enjoy White victimization more
than Black victimization) and equivalent (positive or negative?) at-
titudes involving Blacks and Whites. Another interpretation for all
the above is simply that Blacks are less prejudiced and judgemental

47
than Whites (especially males); that Whites develop a superior-than-
thou world view early in life; and that this world view colors all
interpretation of world events (even the development and understanding
of one's behavior).
At this point, it could be claimed that either a White or Black
world view could be correct in analyzing the results described above.
One area of research that is extensive and well-known to psychologists
will help tip the scales of indecision: the self—esteem literature.
Studies from the 1960's to date comparing self—esteem have, shown that
Blacks feel as good about themselves and their race (or in many cases
better) when compared to Whites (Fu, Korslund, and Hinkle, 1980;
Pettigrew, 1978; Simmons, 1978; Taylor and Walsch, 1979). With this
extensive evidence, the identification/disposition theory becomes an
impotent set of corollaries and continued adherence to this culturally
egocentric "theory" reflects an ethnic psychology.
Another example of the exosystem of a commentator of human
behavior being exposed in his theories is C. Wilson's latest book, A
Criminal History of Mankind (Wilson, 198H). Wilson's Western European
view of man living in the cold brutal gesellschaft of modern urban
life, with its emphasis on individuality and self-determination, has
argued in this 670 page tome that "criminality is a short cut and this
applies to non-violent criminals as much as to violent ones. Crime is
essentially the search for 'the easy way'." The author also claims
that "the individual (criminal) concentrates on his frustration and
resentment and feels robbery or burglary is a legitimate way of ex-
pressing his sense of social grievance."J

48
All responsibility (i.e., choice) of criminal behavior resides
with the individual when viewed from Wilson's perspective. Society,
capitalism, economics, racism, poverty, or other exo- and macro-system
factors are not considered. Empirical tests will either affirm or
disprove the viability of this individual/micro-system view of man-
kind. It only need be noted here that different cultural outlooks
would frame the problem of criminality differently. A more Afrocentric
or Amerindian world view would see the person preying upon the group,
the criminal, as a product of the group. The criminal is viewed as a
manifestation of the group because the world, and one's society in that
world, is seen from a more gemeinschaft focal point. All interaction
is reasoned to be interconnected and interdependent. Each personage
has a role which upholds the process of the culture, each personage is
seen as both a creation of this process and a maintenance factor in its
continuance. A Western world view would even see these culturally
based subjective differences in experiencing the world as genetically
determined and value ordered; a sort of cultural meta—analysis. As
Brown (1969) states, "even the claim of moral superiority has genetic
implications" (i.e., the Western world view is the superior one and is
innate in its beholders).
A third example of culture influencing our research and its
interpretation, in addition to the objectively measured outcomes, is
described concisely in a paper by Munroe and Munroe (198*4). The
authors attempted to replicate research originally conducted on Western
European and American samples showing a correlation between mother
contact in infancy and later childhood intellectual development (as .

49
lmeasured by standard cognitive assessment devices). The Munroes chose
an east African tribe, the Logoli of Kenya, on which to dc this
research.
An earlier study· by the same authors (Munore and Munroe, 1980)
demonstrated a significant relationship between positive affective
outlodc at age five and proportion of time the African children had
been held by their mothers during infancy. The researchers were,
therefore, in the present study (Munroe and Munroe, 1984), interested
in determining what effect maternal-infant behavior would have on later
childhood cognitive performance. The outcome was surprising when
compared to previous research with Western populations; speed of
learning (in a naming task) and participation in "complex activities in
daily life" were negatively correlated with mother-holding in infancy.
The authors concluded that "the child's cognitive performance was
superior when his/her involvement with the mother in infancy had been
low (for the sample), and that this runs counter to the direction of
the ·findings for affect" and the "one positive (significant) as-
sociation with mother-holding . . ., that of a high level of' per-
severance on the puzzle, may indicate something more about motivation
than about cognition, and thus also might be of an affect-related
nature." The bottom line is that, for these children, "frequent mother-
holding was positively associated with the affective variables and
tended to be negatively associated with the cognitive variables."
Another variable investigated also evidenced a similar
relationship with childhood cognitive functioning. Latency of mother's
response to infant crying was found to be positively associated with -

_ 50
lthe embedded figures test and with the degree of childhood partici-
pation in complex chores. It would appear that "the longer the child
had been left to cry as an infant, the better the subsequent per-
formance on these two measures" (Munroe and Munroe, 198M). It should
also be noted that the "two infant-care measures, mother-holding and
latency of response to crying, were not related to each other,
B22 e -.03,n.s."
In their discussion of their findings, the researchers make se-
veral points aimed at reconciling the unpredicted Logoli results with
those of previous Western studies. They contend that:
The element of similarity between long response-latencyto crying and lower mother-holding was the fact of their"distancing" the infant from the social environment.
Both indices might be evidence ... of a rupturing ofestablished ties (p. 298).
The authors then evoke psychodynamic constructs dealing with
object separation, self-differentiation, and individuation to develop-
mentally recreate the differing paths followed by the two designated
groups of Logoli children (high academic achievers and low academic
achievers). They argue that the high achievers were denied constant
mother contact as infants, leading to "heightened awareness" of their
environment because of the emotionally charged atmosphere an incomplete
mother-infant dyad engenders. Those African infants with high mother-
baby involvement were less apt in the Western style school environment
but evidenced more compliant, emotionally stable behavior and an easy-
going (perserverance) social style. To quote the Munroes again: ·
... the picture emerging for the Logoli is that high
mother involvement with the infant apparently produces apositive and persevering (possibly compliant) approach

51
l ‘to the world, but one that is not intellectually optimal— (0. 301).
Munroe and Munroe (198*4) seem to want desperately to make the data
fit previously held concepts of childrearing's influence on cognitive
development. The authors state that the over-attachment of the African
infants to their mothers and the subsequent "rupturing" of that bond is
conducive of later high cognitive development. Then they state that
"low indulgence of infants and inconstancy of presence of nurturing
agents are associated" through intervening variables to possibly in-
tellectual skills. First, they never explain how the gradual reduction
of mother-infant interaction time in the Logoli is related to "incon-
stancy of presence of nuturing agents;" especially since in the Lgoli
culture the infant's held-time remains constant through the early years
because of a matri-association of fictive mothers whose infant contact
time increases as the natural mother's decreases. Secondly, it is
apparent from the text that any behavioral pattern divergent from
Western standards is described in negative terms.
But the story does not yet end. The investigators attempt to
force their findings to fit other facts. They claim that American
infant (12- to 15—month old) confinement to high chairs and playpens
(with toys and other activities as diversions) "might be equated with
the Logoli infant's restrictedness while being held by their mothers.
Both forms of confinement may lead to relative contentment with low
levels of environmental exploration." Now they seem to say the op-
posite of their previous statement. How is it possible to see equi-
valence in mother-infant over-attachment (Logoli) and mother—inf'ant

52
‘
avoidance (American)? The answer can be found in the final quotation
cited above; "In comparison with Western caretakers, Logoli mothers
and siblings attempt to 'engage' infants relatively little. This
difference in conceptualization may be critical, perhaps partially
accounting for the discrepancy between the present findings and those
in Western research ..."
Once again the negative (or deficit) interpretation of deviance
(or difference) is obvious. African mothers are accused of being both
gg;-involved with their infants and gn-involved, depending on the
comparison being made at the moment. The Logoli infants are at once
seen as being too compliant in their approach to the world and lacking
in "object separation" and/or "individuation". To a Western trained
scientific mind all of this seems plausible and even scientific; but
only because of certain sub-stratum macro—level beliefs underlying
every Western scientific endeavor. Sue (1981), describes two of the
basic psychological beliefs accepted and ingrained in Western science
as (1) "the worth of the individual" and (2) "a high priority placed on
self-determined goals." In the Munroe and Munroe (198*4) paper we
can see the two supporting beliefs at work in the hypothesis on
individual development through the (1) "differentation of self from
other" and (2) its correlation with personal academic success (on test
measures) in the West. Mother-infant interaction seems to
foster the development of this individuation in the Western child but
has the "opposite" effect in the Southern (African) child.
Without again reviewing the blatant inconsistency in the study
under discussion, it should be evident that a simpler explanation of

53
Ithe divergent West-South groups results could be developed on a macro-
level of analysis. Could it not be that increased mother—infant
contact fosters enculturation, and therefore, in the West this contact
increases the development of those traits valued by the West (indivi-
dualism and personal academic success) while equivalent bonding in the
Logoli fosters the development of Southern-valued behavioral and
cognitive styles (a group-centered "positive and perservering (possibly
compliant) approach to the world" (Munroe and Munroe, 198lI))? Might it
not also be reasonable to expect that those Logoli children not totally
enculturated (with infant histories of low mother contact) would also
be those children more easily initiated into a foreign culture and
group (the Western-styled school system and larger academic community)?
Would not it be expected that those individuals loosely bound
(relatively) to one world view and set of behaviors could more readily
be enculturated with an alien world view and set of out-group
behaviors, than those individuals more fully committed to and practiced
(relatively) in the group-of-origin culture? This type of mega-
analysis could (and does) help to bring all the contradictory cross-
cultural results together into one meaningful whole. It helps explain
why increased mother-infant contact has different measured changes on
childhood indices of (Western) academic functioning cross-culturally.
It also helps explain why different attributes are positively
correlated with maternal attention, dependent upon the culture; why
Western babies gain test-tapped cognitive skills and Southern babies
gain measured affective stability with motivational components. An exo-
and macro-system approach could finally make sense of why Western

·54
linfant confinement (in playpens, etc.) and Logoli infant-mother contact
both correlate negatively with school room performance. Western
infants who are confined to environmental structures have relatively
less contact with enculturates (mothers) than their in-group cohorts,
thus reducing their degree of enculturation by early elementary
school. African infants who experience greater contact with tribal
enculturators (mothers) relative to their cultural counterparts
increase the disparity between in-culture and out-culture norms. In
both cases the identified action has a disfacilitative effect on future
reaction to academic exposure. Western infants who are well
enculturated and Southern infants who are less well enculturated are
better able to deal with the Western-based formal educational system.
Only a "larger view" of cultural relativity would allow the
preceeding analysis. Just as conduction and convection transfer heat
through different systems producing similar results, and just as an
understanding of larger field dynamics allows the comparison of these
two dissimilar systems, decreased cultural induction in one society and
increased cultural training in a second society can lead to the same
conclusion and be understood if interpreted from a larger multicultural
perspective. No micro-level of analysis based singularly on either
method of heat transmission (directly through solids or indirectly
through fluids) would effectively explain all temperature changes and
neither would unifocal cultural perception lead to a multi—cultural
problem resolution. A macro-level multi-cultural perspective also
allows one to be truly objective, able to view a situation free of the
stricture formed by in—born cultural outlook. Comments such as those

55
of Howard (1970) suggest the urgent need of scientists to relearn
objectivity before examined minorities become adroit at identifying out-
culture biases and ethnocentrism:
The ”Minnesota empiricist" approach to the universe isboth myopio and, most importantly for our purposes,ahistorical. This is to be expected in a country moreconcerned with social engineering than with humandevelopment.
...the less contact between non-Western people andEurope, the better the impact upon the natives...
We must begin to do experiments to find out the bestways of developing black people on their own termsrather than to continue to use the instruments of thecolonizer to describe what colonization has done to us.We must end the tradition of ... the "victim analysis"type of research and begin to do reconnaissance researchon every colonizer.
Statement 1 and 2 describe the (1) short—sightedness of commonly
accepted Western science and (2) the result of Western -- non-Western
(Eastern, Southern) interface. Statement 3 cogently suggest that
tribal, pre-literate, third-world, and minority peoples begin to
scrutinize the motives, both named and unknown, of Western
experimenters. I doubt whether our scientific establishment could
withstand a concentrated examination and "objective" analysis, as it is
presently evolved. Too often there have been ulterior motives
unacknowledged and/or unknown to the Western investigator. Often the
goal has been to hasten assimilation of one culture into that of the
"larger" colonizing culture. In the interim between initial cross-
cultural contact and the ultimate end product of a "melting pot"
process, much "contradictory" and seemingly inexplicable
empirical/comparative knowledge is generated. Interpretation of this

56
data base has been previously forced to fit a Western-European/ North
American mode in the great perponderance of cases. This should not be
surprising since the Western culture is usually the colonizing force
and the contact is usually one of Western domination/superiority.
Weiss (1981), in describing the overriding influence one's culture
has in every aspect of one's life, especially reasoning form and way of
viewing the universe, sums up our need to be constantly aware of its
influence in our personal constructs and its holistic influence on out-
group behavior. He states:
A culture provides each of its human members with thatindividual's mental contact or psychic structuring,which becomes a veritable part of that individual,perhaps the most important part in determiningindividuality itself. To destroy that culture -- whichnot only creates but sustains the individual psyche --is to subject the culture's ”human components” (if I maybe indulged the use of the term) to the most stressfuland agonizing of human experiences (p. 899).
What is being stated here is that between the time of original
cross-cultural contact and full assimilation, the culture at a
disadvantage will undergo extreme psychic stress. The amount of stress
experienced is depended on the amount of similarity or difference
between the two cultures (cultural—distance). To quote Howard (1970)
again: "...the less contact between non-Western people and Europe, the
better the impact upon the native, an important exception being where
the indigenous culture is similar to the invading colonizer."
Much of the minority's cultural stress is a direct result of major-
culture investigators' comparisons of the two cultures and the use of a
deficit model of interpretation to explain. any noted differences.
Those cultures similar (less distant) to the major culture will, of

j 57
course, fare better in these comparisons than more distant cultures for
two reasons: (1) the major culture is able to more fully understand
and appreciate the behavioral patterns associated with the culture and
its people; and (2) the minority culture, because of cultural-closeness
to the majority culture, will allow its individuals to more quickly
assimilate the supra-culture's rewarded behaviors. Too often
scientists never bother to investigate these higher level interactions.
To understand a man we must also understand his culture and the
larger society in which he lives. Just as important, to understand his
conceptualization of reality we must also know the larger frame of
reference from which he grows, and most important for us is the fact
that we must analyze our attempt at understanding behavior from this
meta-level of insight. We must present our understanding fully aware
that we "...as individuals and collectivities...are inevitably
prisoners of time and place, that self-interest and public interest
should not be assumed to be identical, that how self—interest is
defined depends on where one is in the social order, and that to
transcend time and place, even in small parts, requires that one put
into words what the socialization process, because it was so effective,
made it unnecessary to verbalize" (Sarason, 1981). Furthermore, "the
fact that an individual believes _his culture to be 'his' in some
powerful personal sense, as though he had thought out for himself how
to do the things he actually does by traditional prescription, will not
impress the observer whoéhas the cultural view" (Sarason, 1981).
Psychological science has been more concerned with the individual
level of behavior and proximal variables in theory construction and

58
(phencmenon interpretation. Not only has the ignorance of upper levels
allowed personal/cultural factors to influence our research questions,
models and data reduction, it has also influenced the cross-cultural
contact and macro-level cultural patterns of those groups under study
(often negatively).
Focus on proximal variables has created a socio-cultural myopia on
the part of such exclusively lower-level investigators. Often,
epiphenomenon are concluded to be valid (and complete) descriptors of
social, inter-group, _and/or intra-group behavior. The lack of
knowledge of higher level forces and distal vectors impinging on
behavior can lead to quite erroneous conclusions, as the examples
presented herein attest. Scarr (1985) states:
Different levels of analysis do not compete. Each lowerlevel is a constituent of the next higher, and in nosense can one account for the other. Yet they are all
interrelated with implications for the others. ...theyare nested ”truths." Each level has its stipulated
facts that arise from the theoretical framework in whichthe facts are invented, and each is useful to address
questions formulated within that theoretical frame (p.‘ 502).
The Cultural-Distance Perspective/Hypothesis
Therefore, the author proposes this system (The Cultural-Distance
Perspective) fully aware that its organization and content are a
product of the culture from which he comes and the direction in which
he believes research in this area should proceed. It's acceptance is
asked for only until its utility is affirmed or disaffirmed.
Basically, the Cutural-Distance Perspective as outlined previously
(Grubb, 1983) can best be described as a multi-level analysis of inter-
group behavior. The third and fourth levels of analysis outlined by

859
qBernstein (1982) are of primary importance in this approach as is clear
in the prime tenent of this perspective:
Any sub-culture operating according to principles notequally operative in the major culture, not existing inthe major culture, or operating without the benefit of aprinciple operative in the major culture will be assumedto be attending to, processing, storing, retrieving,
and/or practicing functional information not exactly
like that of the major culture (p. 25-26).
The secondary corollary of this approach further explains the
position taken herein: ”Minority member responses to tests based and
validated on the major culture (or even validated on members of the
society according to percentage representation of all sub-cultures in
the super-culture) will show characteristic patterns of group
responding different from those of the norming sample. These response
patterns are indications of what is salient to each minority sub-
culture on the tests and within the major culture, and what is not.
The tests are not responsive to what is salient to the sub-culture but
absent in the major culture, however" (Grubb, 1983).
IAnalysis of group performance is focused at the exosystem and the
macrosystem levels because of the nature of the task - comparison of
groups. From a Cultural-Distance perspective”it
is obvious that no
scientific discussion of racial differences can exclude an examination
of political, historic, economic, and psychological factors which are
inextricably related to racial differences" (Albee et al., for the
Society for the Psychological Study of Social Issues, 1969). When
reliable differences are found to exist between populations, mere
examination of individual differences between members within a
population cannot be expected to wholly explain group differences.

A.60
8This is what many investigators attempt to do, unfortunately. Mohs
(1982) states that "the hereditarians...error...is to confuse within-
group and between -group behavior." The classic studies concerning
heritability of measured intelligence are all within-group
investigations (Taylor, 1976). Even if IQ (or any other "trait") could
be demonstrated to be highly heritable within a group gives one no
license for between-group speculation (see Mackenzie, 198M).
An example may help clarify this point. Suppose we empirically
determine that within a fairly distinct and homogeneous population,
such as the Dutch, that female breast size of parent and offspring
correlate highly. Suppose further that we are able through various
methods of observation such as longitudinal studies and pseudo-
experimentation to conclude that size of female breasts is an inherited
trait within this pcpulation. Now suppose that on a later date we are
able to study the Massim people of Rossel Island, near Papua, and
discover that all the adult females possess extremely large mammary
organs. When comparing the Dutch and Massim are we to simply conclude
that Massim over Dutch superior breast size is solely due to genetic
action? Would we be correct in extrapolating, from our studies with
the Dutch, that Massim women have been eugenically coded to be more
fully endowed than their European sisters?
Most anthropologists would readily see the flaw in such an
argument. How could one interpret such group differences without an
investigation of the culture of these two people? The answer of course
is that one could not. Whereas the Dutch use supportive garments,
suckle their young fewer years, and often bottle feed their offspring,

1 61
utheopposite is true of the Massim. This may be an outrageous example
but it appears psychologists studying intellectual behavior are often
found guilty of such false group comparisons.
According to Minturn (1983), "much of the information necessary to
refute Jensen is probably buried in the monographs of anthropologists.
A classification of emic definitions of intelligence and the basis from
them would go far towards correcting our ethnocentric view of
intelligence tests." He also believes that "Anthropology has the data,
Psychology the methodology, and Sociology the theory necessary for
cultural analysis."

THE PRESENT STUDIES
Two studies were conducted and were based on previous research on The
Cultural-Distance Perspective. Study II consisted of a more flne-
grained analysis of the data obtained frmm the earlier study. Study
III was a cross-validation, of the previous findings, using new data
collected on a new group of subjects, plus added dimensions of
inquiry. But first let us review the original work from which the
present undertaking is derived. .
The Base (Previous Study - Study I)
Predicted Outcomes
The previous study on which the present paper is an extension is a
Master's thesis (Grubb, 1983) which investigated the oft-recorded Black-
White differences on standardized IQ tests, specifically the Wechsler
Adult Intelligence Scale-Revised (WAIS-R) and the Peabody Picture
Vocabulary Test (PPVT). In addition, the performance of Black and
White adults on learning tests tapping both Level-I and Level-II
intellectual functioning (Jensen and Inouye, 1980) was examined.
Eighty adults (16 Black males, 16 Black females, 2*4 White males, 2*4
White females), mostly college students attending Virginia Polytechnic
Institute & State University, tested by two Black and two White
investigators, were also required to fill out a Personal Data
Questionnaire (PDQ) which measured certain socio-cultural/environmental
62 ·—

63
variables thought to affect intellectual behavior (as measured by
standardized IQ tests).
Analyses of varlance (ANOVA's) were calculated for each of the
four dependent measures of IQ (the PPVT, WAIS-R Full Scale, and the
Verbal and Performance scales of the WAIS-R) plus two memory drum
learning tasks (Level-I intelligence) and one concept formation task --
the Booklet Categories Test (BCT) (Level-II intelligence). Initially,
three-way ANOVAs (race of subject by sex of subject by race of
examiner) were computed on each of the dependent variables., Whites as
a group outperformed Blacks on all four measures of IQ. The
differences in White over Black performance on the PPVT was reliably
significant at the 99 percent level of confidence ( g_ <.01).
Further, Blacks scored significantly lower than Whites on the Full
Scale and Verbal Scale of the Wechsler (WAIS-R FS and WAIS—R V) IQ
test. The difference in group responding (p_<.O5) was not as great
as evidenced on the PPVT, however. Finally, although Whites also
outperformed Blacks on the Performance Scale of the Wechsler (WAIS-R
P), the difference was only marginally significant (_g=.O56).
The results of the IQ tests confirmed Hypothesis I of the earlier
study: Analysis of the raw IQ data scores between Black and White
groups showed the usual significant differences favoring Whites on all
four measures of IQ. Although the WAIS-R P was marginal when
originally examined by the a priori ANOVA method (race of subject x sex
of subject x race of examiner) as indicated above, a separate three-way
analysis (race of subject x sex of subject x examiner) conducted in
order to explain a higher order effect found a significant race of

64
subject main effect (p=.0N6). Because most of the subjects were
current college students some self-selection bias in favor of
higher scoring members of both races was evident, decreasing the
usually recorded 1-standard deviation difference between random samples
of the two populationston
.5 and less standard deviation differences on
the different IQ measures.
The previous study also predicted outcomes for the learning
tasks. Hypothesis II stated: "There will be no initial difference
V between racial groups on three memory/problem solving tasks." Blacks
and Whites performed equally well on two of the three learning tasks.
Only on one of the Level-I intelligence measures, a memory recall task,
was there a significant (p<.05) group difference, Blacks superior
to Whites. Because of the self-selection bias mentioned above and
precedent in the literature for such an effect, this outcome was not
unexpected (see Grubb, 1983, p. 60-70).
More importantly, Blacks performed as well or better than Whites
on the Level-I indicators and as well as Whites on the Level-II
intelligence task. This indicated, to the author, that Blacks and
Whites possessed equal amounts of both levels of intelligence but,
because standardized IQ tests (also Level-II measures) were White-
biased (possibly because of culture), Black intellectual functioning
was being under-assessed. The third hypothesis of the study was
therefore:
When certain cultural factors are covaried out of thetest data, Black and White differences (on the IQmeasures) will dissipate below the level of significance
(Grubb, 1983, p. 73). .

65
With the nine socio-cultural variables derived from the Personal
Data Questionnaire, regression equations were run on the seven
intelligence and performance measures. The five socio-cultural
variables weighing most heavily on score performance for the total
sample, appearing most often in the seven regression equations were:
(1) varied social experience; (2) dwelling condition of parental home;
(3) father's occupational level; (M) parental attitude toward formal
education; and (5) parental supervision and intervention in the
subject's .childhood.
When the original analyses of variance were rerun, this time
partialling out the effects of the five most heavily weighted socio-»
cultural factors, the difference between racial groups was found to be
non-reliable for the three WAIS—R scales. The White over Black
difference on the PPVT and Black over White difference on the recall
task were still evident, although the former was now reduced to a
level.Since
the five "over-all" most heavily weighted socio—cultural
variables could not account for the racial group differences on the
PPVT intelligence test or one of the Level-I intelligence learning
tasks (recall), two additional analyses were performed. The first was
an analysis of covariance (ANCOVA) on the PPVT using its individually
determined (by regression equation method cited above) five most
heavily weighted socio-cultural variables: (1) fathers presence; (2)
varied social experience; (3) family income; (M) dwelling condition of
parental home; and (5) father's occupational level. The White over

66
Black superiority on this measure, while still significant, F=u.O39
( 2_=.0M8), was in good measure reduced from its original level of
signifieace, §;7.M61 (2;.008).
The second ANCOVA run on the Level-I learning task (recall) using
its five most heavily* weighted socio-cultural factors (1- number of
siblings, 2- parental supervision and intervention in the subject's
childhood, 3- parental education attainment, M- father's occupation,
and 5- parental attitude toward formal education) produced a non-
significant difference in group performance ( 2_=.O56), even though
the Black trend toward superiority on this measure remained.
In the final analysis, all three hypotheses were upheld (Grubb,
1983):
Taken together the results...clearly show that thissample of Black and White adults have relatively equalability on both Level I and Level II (intelligence).Standardized IQ tests...are however, not truereflections of minority group performance because of thecultural overtones of the questions involved (p. 101).
What propels one culture or subculture may not be theforce propelling another culture or sub-culture. We mayshare certain intellectual propensities because we areall members of a super—culture but we surely have uniqueattributes in the cognitive sphere because of ourmembership in different sub-cultures (p. 107).
Other Outcomes of Interest
The prime tenet of the Cultural-Distance Perspective given earlier
in this paper contains a basic assumption that would predict different
sub-cultures' use of different strategies for learning. Different and
distinct groups might go about learning differently, based on

67
differences in "attending to, processing, storing, retrieving, and/or
practicing functional information" in unlike manners .
Blacks and Whites were noted to have learned the two Level-I
intelligence tasks and a similar Level-I task that was part of the BCT
(the Level-II learning task) according to different principles. Using
a correlational analysis of the four Level-I and -II
learning/performance tasks just mentioned it was concluded that "the
Black and White groups must be utilizing different learning strategies"’
(Grubb, 1983), when responding to these stimuli.
Whites tended to use two different strategies on the two learning
tasks demanding a recognition of previously presented stimuli whereas
the Black group's performance pointed to a related strategy use on
both. Grubb (1983) states:
Since the time between learning and recognition waslonger (up to 30 minutes) on the BCT-sub-test 7 than onthe MD-Recognition index, Whites may have encoded theinformation on the former in a different fashion thanused on the latter. They may utilize their superiorreading/writing/ code usage ability for such extendedrecall work. Blacks may be using the oral/rote memoryprocedure for both. Further investigations into thesedifferences should surely be planned (p. 96).
Another outcome not directly taken up :111 the previous work on
cultural-distance is outlined in the secondary corollary (also cited
above). One would expect sub-cultures to present differences in sub-
score patterns on multi-sectioned assessment devices such as the WAIS-R
and the BCT. This fact has been recorded in the archives on many
occasions for various cultural groups (Arinoldo, 1981; Hays & Smith,
1980; Jones, 1971; Knapp & Seagrim, 1981; Kureshi & Husain, 1981,
Lieblich et al., 1975; McShane & Plas, 1982; Morse, 191N) and was

68 g
observed in the investigation under discussion in a gross fashion:
Black and White performance on the verbal and performance sub-sections
were clear indicators of what abilities were more practiced by each
group. Blacks apparently acquire major-culture motor performance
values and response modes more than seen in their adoption of major-
culture verbal behavior. It would be interesting to look at a lower
level of sub-score pattern within the verbal and performance sections
(the actual 11 sub-scales on the WAIS-R). Also, since the BCT is
composed of 7 sub-tests, and we know that Whites and Blacks used
different strategies to perform at least one of the sub-tests, relative
ranking within-group and between-group of these 7 test sections would
also be of interest.
New Construction
It is a well recorded fact that Blacks score more near the
national norm on performance measures of IQ than verbal measures
(Jones, 1971). What is less well defined is how Blacks, compared to
Whites, fair on individual items on standardized IQ tests. Wrobel and
Howells (1982) conducted a study to determine the accuracy with which
clinicians were able to detect racial (and sexual) bias in WAIS-R
questions. Their findings showed that it was very difficult for
professionals and students (both Black and White) to predict racially
(and sexually) biased items. After the fact, however, WAIS-R items
were determined to possess a 5:1 bias in favor of Whlte to Black loaded
questions (some school assessment measures also show a sex. bias

69
favoring females over males at a rate of M:1 (Reynolds, 1980)). That ·
is, five times as many questions favored. Whites over Blacks, even
though perceptions of clinicians were inconclusive. An interesting
aside was that Black raters were more adept at bias prediction than
Whites, though not significantly so.
Test Bias
Here it is important to make clear an implicit assumption oflthe
cultural-distance approach. We assume that any item which shows a bias
toward one culture (race) is a reflection of that group's placing
higher import on the item than the group which is inferior at correct
responding on said item. The reason for the relatively poor "correct"
response rate of the lower scoring group could be many. Even when
holding test situational variables constant by design (thus obviating
tester-testee interactions) and therefore eliminating microsystem
confounds, we still see item—bias. The present hypothesis considers
the residual difference to lay at the upper levels of analyses (the
exosystem and the macrosystem) .
Now this interpretation is in direct contrast to that held by the
hereditarian (racial-genetic) view. That view claims (empirically)
"that the items (of a test) that best measure individual differences
within each racial group are the same items that discriminate the most
between the racial groups,” (Jensen, 1976). As McGurk (1953) has
observed, "test superiority of the Negro of high socio-economic status
over the Negro of low socio-economic status is associated more with a
superior performance on the non-cultural questions than 'on cultural

70
questions." Using factor analyses, point biserial and bivariate
correlational methods, and analysis of differential prediction through
regression line inspection techniques, hereditarians have seemingly
"proven" (through such statistical methods and to their theoretical
satisfaction) a lack of bias in all major intelligence, aptitude, and
personnel selection devices.
Hale (1983) is of the belief that a test will be demonstrated to
be biased if it evidences any of three types of group differences:
content, predictive, or construct validity. Submitting WISC-R scaled
scores to a principal components analysis separately for sas and race,
and rotating through a Varimax criterion of simple structure, several
investigators (Hale, 1983; Jensen, 1980; Reynolds, 1982) have concluded '
that the Wechsler scale is not a biased instrument.
In a study entitled, ”Test bias and construct validity,” Jensen
(1976) found no difference between a group of about 600 White and M00
Black children (aged 6 to 12) in California on correlation values
between raw scores and age on two measures of IQ (the Peabody Picture
Vocabulary Test (PPVT) and Raven's Progressive Matrices (Raven)). From
this fact he could proclaim that "if the tests were measuring something
quite different in both groups, it seems unlikely that the scores would
have nearly the same correlation with age in each group." The internal
consistency reliability coefficient in the PPVT was .96 for both Blacks
and Whites while the Raven reliabilities were .90 for Whites and .86
for Blacks. More space will be given to the reliability issue later.
Jensen also found that the corrected ccrrelation between rank
order of item difficulty for Blacks and Whites on the PPVT was .987;

71
for the Raven above .99. Finally, the very sensitive correlations of
fg decrements” index for the two groups on the PPVT and Raven's were
.830 and .980 respectively. This last finding led the investigator to
suggest that "if the items of these tests were culturally biased for
blacks, it would be remarkable indeed that their rank order of
difficulty between adjacent items should be so alike in both the black
and white groups," thus reaffirming the author's belief in their non-
biased nature.
Jensen (1976), as partially quoted previously, has written:
In both the Peabody and the Raven we compared a) thepoint-biserial correlations between single items andtotal score within each racial group and 2) thecorrelation (phi coefficients) between single items andthe racial dichotomy.
The first set of correlations, a, tells us how welleach item measures whatever the test as a whole ismeasuring and how well the individual item discriminatesamong persons within a given racial group. The secondset of correlations, bj tells us how much the itemsdiscriminate between the two racial. groups. It turnsout that the items that best measure individualdifferences within each racial group are the same itemsthat discriminate the most between the racial groups.These items have the highest correlations with the totalscore for both blacks and whites (p. 3M2).
Jensen and others holding his beliefs have concluded from the
previous statements that the facts provide a lack of cultural bias in
the instruments. Here, from our point of view, is where they make
their uüstake. These investigators are attempting to analyze group
behavior on the individual level. Their hypothesis ignores the upper
levels of analyses. They also do not seem to consider the fact that
the criterion of prediction may be as biased as the ypredictor
instruments themselves.”

72
Would it not follow that those items possessing a wide range of
test responses within a group would better predict ability within that
group on a highly correlated criterion of behavior? This, of course,
is sensible enough. The problem comes when one attempts to interpret
group performance differences in the same manner.
The mean of a group is but one representation of a set of scores.
When this number is compared to the mean of a second group, how can one
adequately suppose that difference in mean scores describe the lack of
ability within one group as a whole. The facts disprove this
assumption because each group is composed of an overlapping of test
performance. Only when one forces the individual level of analysis
upon higher level constructs could such an error be made. This is the
error described by Mohs (1982) printed herein above: "to confuse
within-group and between-group behavior."
Mercer (1979), a sociologist, has developed what she terms a
System of Multicultural Pluralistic Assessment (SOMPA). This battery
includes an evaluation of the testee's social/environmental systems.
Mercer believes that one can make inferences about a student's probable
learning potential only with the analysis of these higher-order, distal
variables. Standardized tests can be assumed to be valid predictors,
in isolation, only when several assumptions are met. Weiner and
Stewart (198¤) lists the SOMPA assumptions:
o IF two persons have had equal opportunities to learn thematerial in a test, and
o IF they have been equally motivated and reinforced forlearning the materials in a test, and —
o IF they are equally familiar with tests and test—takingsituations, and ~

73
o IF they are equally free of anxiety, fears, or emotionaldisturbances that might interfere with learning or with testperformance, and
o IF they are equally free of physical, sensory, or motordisabilities that might interfere with learning or with testperformance,
o THEN significant differences in their test performance may beinterpreted as reflecting differences in their learningpotential, i.e., their intelligence.
o IF all things are not equal, NO inference can be made thatdifferences in the phenotypic performance on the test arenecessarily related to differences in innate ability, i.e.,the genotype.
Spindle (1975) argues that cultures have to be understood from
within, on their own terms and by their own standards. How can one
even appear to meet this requirement when only out-culture norms areV
used as an analysis of behavior? Culture has been variously defined,
but a simple usable definition for the present purpose is: Cutlure is
everything that is not natural (in nature) human behavior - it is
everything a group does that is not innate. From this viewpoint any
group differences can be labelled as cultural. Eating is not a
cultural property, as all humans eat; but eating with silverware and
chopsticks is cultural.
Cultural-Relativity, Identity Development, and Bi—Culturality
Individuals are assumed, by Western thought, to: (1) have some
human characteristics in common with all other individual humans, (2)
have certain characteristics in common with certain other individuals
but not with all individuals, and (3) to have some specific traits
unique to themselves. This model of conceptualization can also be
applied to different cultures, that is: (1) all cultures possess

· 74
certain behaviors common to every culture, (2) some cultures share
certain behaviors with certain other like cultures, and (3) certain
cultural behaviors are unique to each culture.
Once we accept this perspective of cultural relativity we may
proceed; in either of two directions. One, we may compare different
cultures to some arbitrary standard of behavior, or two, we may examine
and try to understand each culture independent of other forms of human
social construction. The two paths will lead us to vastly different
‘conclusions and beliefs about any one specific culture.
The first alternative, comparing cultures to a certain cultural
norm, has led Western science down a road to ethnocentrism and the
development of the "deficit model" of comparison. Under this system,
differences in cultural behavior are seen as deficient if not
corresponding exactly to some arbitrarily assigned cultural standard
(usually ours). This view has led mental health professionals to
assign Black cultural behavioral expressions such as concentration on
the present (as opposed to a future-orientation) as an inability to
defer gratification, a negatively value laden term describing a basic
lack of cultural development. Herein lies much of the trouble found in
cross-cultural assessment.
The second perspective, a defining and search for understanding of
a culture from within its own value system can be described as a
"cultural difference mode." In this type of system, each culture is
examined based on the adaptiveness of behavior within its ecological
frame. The Black present-orientation would become more than a deficit,
it would now be viewed as a cultural adaptation to the larger social

75
fabric. Blacks live in the present based on two ecological factors:
(1) hostile historical reality of life in America has assured the
perpetuation of this mode of behavior by disallowing the peaceful
striving for future security and economic stability within the Black
community and (2) the West African heritage of oneness with nature and
an acceptance of man's place in the universe without the mind-set of
conquering and subduing the cosmos. When Black cultural propensities
are analyzed in this fashion, forced assimilation and change is
unwarranted for such adaptive and satisfying behavioral ekpressions of
a people.
The second (ecological) perspective is an emic approach whereas
the first discussed, comparison method, is clearly etic in
orientation. The position of this paper, and the basis for culturally
relevant assessment with Blacks is the emic response and would lead to
the formulation of a macro-level/cultural pluralistic perspective.
Maslow (1970) has developed a system for describing behavior based
on certain needs which motivate responding in humans. These needs are
conceptualized as being hierarchical in that "1ower" needs must be
satisfied before we are motivated to satisfy "higher" needs. If we
accept his understanding of behavior, personality, and motivation, we
can begin to understand how all cultures are related and what _gll
cultures have in common.
The lower motivators such as (1) physiological needs (need to eat,
drink, and reproduce) and (2) safety (need to security, protect the
young) can surely· be assumed to be shared by all cultures. As the
lower needs are taken care of and a culture begins to formulate

76
behaviors addressing the higher needs in the hierarchy (belonging,
esteem), culturally specific adaptations to environmental and social-
evolutionary forces can cause divergent forms of responding to appear.
As was stated earlier, some cultures will still be expected to be
in agreement with respect to some behaviors even if all cultures are
not in agreement. These mid-level motivational forces can, therefore,
be viewed as allowing for freer behavioral expression than the lowest
motivators, yet still oircumscribed to some extent. Time orientation
could easily be conceptualized as lying in the mid-range of motivated
needs under the esteem category proposed by Maslow. Here we see the
Oriental cultures placing much value on the past, gaining esteem for
self through reverence of one's ancestors. In the Black and American-
Indian cultures, esteem is gained through present-oriented, behavior;
masculine deeds of strength and action in men and feminine deeds such
as motherhood and family in females. In the Euro-American culture,
esteem is gained by future—directed behavior such as striving for
economic security and the compilation of material goods.
To elaborate on what was already stated, some individuals
identified as Black by skin color may or may not be involved in the
Black cultural experience (to a greater or lesser degree). Because
Blacks must function in the mainstream American supra—culture in order
to reap the same rewards of jobs, housing, and schooling as do Whites,
Blacks develop in two cultures and are, therefore, bi-cultural. This
fact is important in our understanding why major-culture based test
items differentiating intra-group "abilities" also differentiates inter-
group performance.I

77
4 Several systems depicting Black, and other minority, identity
development have been proposed. Atkinson, Morten and Sue (1979) have
tried to incorporate all elements of previous models in their Minority
Identity Development (MID) Model. They outline five stages of self-
concept formation for minorities in a multi-cultural society such as
ours.
Stage 1 - Conformity, is depicted as a self-depreciating, in-group-
depreciating, and majority-group-appreciating attitudinal
constellation. Attitudes can be operationalized here to include all
behaviors, both physical and psychical. Depreciating attitudes can be
described behaviorally as those actions (both physical and psychic)
which ignore, down-grade, or go against (are not compatible with)
behaviors in which they find opposition. Appreciating attitudes are
conversely those responses (both physical and psychic) which are in
harmony‘ with actions taken by significant others (including oneself-
ego) in one's social environment. Therefore, in Stage 1, the Black
individual acts against himself and Black cultural expression in overt
and covert ways, while behaving in resonance with White cultural
performance. This stage corresponds to Cross' (1971) Pre-Encounter
State of Awareness, where the Black individual is seen as having anti-
or non-Black world view while fully embracing the dominant White
American cultural ideal. Jackson (1975) calls his corresponding first
stage the Passive Acceptance Stage, in which the Black simply takes the
route of least resistance and passively "plays the game."
In Stage 2 ·- Dissonance (Atkinson et al., 1979), or what Cross
(1971) calls the Encounter Stage, Blacks begin to become aware of the _

78
independently rich Black culture. The individual Black begins to start
engaging in Black culturally sanctioned behavior; she begins to speak,
dress, groom, and move in Black mode (overt behavior) and validate-
herself according to Black ideals (covert behavior). This stage is
froth with anxiety and tensions build up because the individual still
has, and utilizes, the learned White behavioral patterns which are not
always synchronous with their Black behavioral counterparts.
Stage 3 - Resistance and Immersion, represents a behavioral
repertoire that is totally Black. The Black person in this stage has
entirely rejected White response patterns, values, mores, beliefs and
° all other physical and psychic forms of behavior. He is totally
immersed in Blackness and as strongly rejecting of Whiteness. The
White tester will have a difficult time in even getting this type of
individual to sit through an entire assessment session. Often referral
to a Black colleague is the procedure of choice in order not to "lose"
this individual, especially in terms of motivational vality.
In Stage N - Introspection (Atkins et al., 1979), Internalization
(Cross, 1971), or Redirection (Jackson, 1975), the Black client will
evidence Black cultural values and actions even more naturally than the
previously described Stage 3. The reason for this is that her behavior
is now guided solely by the rewards of being Black and no longer
directed by the pleasure involved in Blackness bound with a rejection
of Whiteness. The person will be driven by action motives alone, free
of any reactive influences. The Black client will feel free to enjoy
her culture and become able to allow others the freedom to be what they
are — be it White or Red or Yellow.I
l

79
The final stage of awareness for the minority client, Stage 5 —
Synergetic Articulation and Awareness (Atkinson et al., 1979) or what
Jackson (1975) calls the Internalization Stage, is an identity built on
multi-cultural behavior. Here the client behaves basically as a Black
but with out-culture behaviors added to form a truly bi-cultural
adaptive personality. The person values the Black experience (psychic
behavior), engages in overwhelmingly Black expressive patterns
(physical behavior) but has incorporated specific dominant cultural
behaviors into his performance inventory (both attitudinal and
overt·behavioral). This could be thought of as the "ideal" Black (or
minority) Identity Development. Behavior will be judged on its
individual merit by this person; those suggested for growth, be they
White or Black oriented, will be judged by their usefulness to the
client.
One final point to keep in mind concerning the above described
stages of Black (or minority) identity development: they are not
necessarily discrete nor does one necessarily progress from one through
two on up to the final stage in order. An individual Black may be
raised as a Stage ll or 5 person, never having learned or even been
exposed to the cultural expectancies and mannerisms associated with the
lower stages. Any Black may also incorporate aspects of different
stages within his or her personality make-up, or a Black person may
alternate between Stages temporarily and situationally. These
quadruplet and quintuplet formulations are meant only to aid in
understanding specific behavioral presentations of the Black_ (or
minority) subject, not for stereotyping the individual.l l
_

80
Only when the scientist is well aware of the minority member's
stage of identity development, and the behavior modality necessary for
successful operation in the supra—culture dominated workplace and
larger society, can he fully understand or be of aid in the assessment
and/or adjustment of the "total" individual. Only when the scientist
is bi-cultural (and has a mature identity) can he guide the minority
person seeking relief toward a final resolution of life's problems
presented to a person of color in a larger colorless environment. The
bi-cultural therapist is also more adept at resolving troubled personal
relationships within the sub-culture of the service receiver.
The model of Minority Identity Development put forth by Atkinson
et al. (1979) seems to provide both a system for empowering individual
minority members to succeed in the workplace as well as suggest
behavioral interventions aimed at reducing frictions within the
subjects own sub-cultural milieu. This model also has potential for
research projects designed to empirically catalogue differences in
those Blacks accepted and ascendant in the White-dominated corporate,
academic, and political spheres of American society and those Blacks
observed to be not so successful.
It is suggested that a "Stage-5" level of Minority Identity
Development is necessary for both economic, professional, and personal
success and fulfillment. Black individuals operating at "lower" stages
of identity development may find ascendency and satisfaction in certain
life arenas but will utlimately fail to prosper in all of life's
cultural milieus until the attainment of a mature identity. V _

81
While Stage-1 (Conformity) may allow a Black to enjoy the rewards
of material success through corporate advancement, personal worth and
intra-racial relationship satisfaction will remain low. While the
Stage—3 (Resistance and Immersion) individual may) develop strong and
satisfying community bonds, his ability to function in the larger
society (and thereby reap the rewards of that interaction in the form
of employment and advancement) will be greatly reduced. Only the Stage-
5 (Synergetic Articulation and Awareness) Black person is able to be
Black naturally while at the same time understand the functionality of
behaving in agreement with the larger society when it is beneficial to
his or her total-life's goals.
Minturn (1983) sums up the problem best in the statement:
I simply do not believe, despite the assembled evidence,that White, American, Middle class males are better atvirtually everything than any ”Brand X" comparisonsample (p. 5). .
Minturn's humility should provide an example for other major-
culture investigators. Blacks and other minorities are forced to live
a life of "bi-culturalism" in our multi-cultural comunity (Sue,
1981). The fact that some Blacks score high on IQ tests and that these
same Blacks score well on criterion measures, be they academic
performance or job skills, while other Blacks perform poorly on the
same measures may signify either of two things: (1) the high
correlation between predictor— and criterion could signify innate
ability, or (2) it could be a gauge of one's integration into the
dominant fabric of society. Probably both explanations hold some truth.

82
When one considers (or contrasts) groups however, only the second
alternative is tenable, from our perspective. This, of course, is our
assumption. It is no more or less a valid assumption than that made by
others, until the weight of evidence decides.
Test Reliability
But let us return at this point to the questions raised by Jensen
(1976) concerning test reliability, specifically the high internal
measures he examined. As previously recorded, Jensen found·reliability
coefficient of .96 for both racial groups on the PPVT and .90 (Whites)
and .86 (Blacks) on the Ravens. From this he reasoned:
If one group were more careless than the other in takingthe tests, or made more haphazard guesses at theanswers, or otherwise contaminated their performance, weshould expect quite different internal consistencyreliabilities. But we see that the reliabilities arehighly comparable for whites and blacks (p. 3ü2).
Micro-level difficulties. Besides being incorrect from a meta-
analysis point of view, the above statement is even incorrect on the
micro-level. Drasgow (1982) has developed a model for analyzing the
effects of biased items on overall test validity correlations for
minority groups. He begins with the assumption that every test is
composed of a finite number of sub-tests (or factors), all loading on
the main construct measured by the test,_g. He goes on to show how
that even substantial percentages of biased items, and therefore,
equivalent percentages of random answers from a majority of minority
members, would have negligible effect in producing statistically
different validity coefficients unless the populations tested are

83
extremely large (i.e., in the tens of thousands). The study claims
that both parallel reliability and between-group validity could remain
high even when a good proportion of test items could be identified as
biased. Says Drasgow:
Test items measuring knowledge or skills available onlyto the majority group would produce random responses byminority group members. ... If random responses to alarge proportion of test items produced only anegligible decrease in test validity, more realistictypes of bias are likely to produce even smallerdecreases in validity. Note that this would mean theempirical finding that differential validity rarelyoccurs should not be taken as evidence that test biasdoes not exist (p. 526-527).
The author was responding to the lack of significance between two
hypothesized groups of 100 individuals each on a biased test consisting
of M parallel sections of 25 items each. The minority groups is(
expected to respond randomly to one of the sections while the majority
group has access to all the test tapped knowledge and, therefore,
responds at a steady 60% mean rate on all subsections. The mean(
minority group response is equivalent to the majority group on the
three subtests that are considered non-biased. Finally, the ”criterion
Z is assumed to be unbiased, and the distribution of criterion scores
are taken to be identical across majority and minority subpopulations."
Using the formulas, Uy=kUx, for the majority mean performance and,
Uy=(k-1)Ux+m/c, for the minority mean performance (where k=subtests,
Ux=subtest means, m=subtest multiple choice items, and c=number of
options per question), and the following hypothetical data, the writer

84 ,
was able to derive group means:
k=M; m:25; n=100; c=5;
i Ux=15; Ü- x2:11.O8;·
Pxx•:.75; Pxz:.36.
Group means thus derived were: (1) for the majority group_ ) uy=¤<15)=60;and (2) for the minority group
uy=3<15>tg;;5o.5
It should be noted that since all four subtests are considered to
be parallel for the majority population while only three are for the
minority population, with one 25-item factor eliciting random
responding (25/5) for the minority group, this "type of bias is
unrealistic in that it is too strong." As Drasgow posits:
The probability of correct responses to biased items by
minority group members may (under normal circumstances)be lower than the probability for majority group
members, but responses by minority group members are
unlikely to be entirely random (p. 526).
Without going through the complete series of equations, the author
found reliability for the majority group and minority group to equal
.92 and .86 respectively; test validity equal to .399 and .385; and the
two regression equations to be
(.033)Yi [MAJORITY] and
21:2.06 + (.ou13>Y1 [M1NoR1·rY].
The bottom line to this experiment is that, in the words of the
author, "There is no difference between population correlations."

85
Additionally:
...it appears that subtest reliability is very important
in determining the effects of bias. If subtests are,
reasonably reliable, then introducing a subtest with
random responses will have little effect on the
validity coefficient. In contrast, a biased subtest can
have a large effect if the test has a total of only two
or three subsections and if the parallel subsections
have the uncommon combination of low reliability and
high validity (p. 529).
It is unlikely, based on the methodology of test design, that such
a fortuitous combination will readily be found and thus lend itself to
easily identified item bias in an assessment measure. In the
overwhelming number of cases, test bias will remain undetected by
conventional methods even when purposely written into an index. The
problem here is that the micro-level methods used to measure individual
differences within groups are just not sensitive enough to detect macro-
system influences on these performance measures.
In those cases where significant group differences are detected,
the amount of variance accounted for by group-by-item interactions is
often considered negligible and discounted. In the report by Jensen
(1976) just discussed, a significant race x items interaction was
uncovered in the Peabody Picture Vocabulary Test and the Raven's
Matrices but could only account for a little less than 1% of the total
variance in both batteries. Therefore, Jensen, using the logic of the
micro-level racial—hereditarians, could argue that "black/white
differences in test performance can be closely simulated,
quantitatively and qualitatively, by comparing groups of younger and
older white children."U
_
86
In a recent study investigating item bias on the WISC-R with four
sociocultural groups (Anglo, Black, Chicano, and Native-American Papago
(NAP)), Ross-Reynolds and Reschly (1983) found several interesting
results. One, the rank order correlations of item 2 values for the
six combinations of sociocultural groups (Anglo-Black, Anglo-Chicano,
Anglo-NAP, Black-Chicano, Black—NAP, Chicano—NAP) on the six subtests
the authors chose to focus on (I, S, A, V, C, and PC) were very high;
greater than or equal to .97. This result would tend to indicate that
the 2 values for each subtest were in virtually the same order for
each of the groups. Remember: the authors chose to study only 6 or
the 11 WISC-R subtests because: "The other subtests...scoring
l
rules...allowed for wide variations in point total for each item (e.g.,
Block Design and Object Assembly) or because the subtest was largely
speed rather than power (Coding)." Ross-Reynolds and Reschly (1983)
also recalibrated some subtests: "On the verbal subtests with O, 1, or
2 point scoring, item scores of 1 or 2 were scored as 1 to facilitate
the analyses."
4
Even so, a second rank order correlation based on differences in
the 2 values of adjacent items gave considerably lower correlations.
The investigators place the range of median correlations for Black,
Chicano, and White children between .68 and .72. Median correlations
for the combinations of NAP and other three groups varied between J15
and .65. Conclude Ross-Reynolds and Reschly (1983):
The correlations based on differences in 2 values of
adjacent items indicate that the progression of item
difficulty was not as consistent as the rank order
correlations would imply, particularly for NAPs, and
that item by group interactions might exist (p. U15).

87
These results are in conflict with results of adjacent item
difficulty correlations in adult populations comparing Blacks and
Whites. Since the Ross-Reynolds and Reschly paper was at the time,
only the second of two reported empirical analysis of item bias
conducted on the WISC—R (see also Sandoval, 1979) with minority
children, the premature comparison of childhood and adult difference on
the Wechsler scales can only be tentative. It is interesting to note
more bias can be measured on the WISC-R than on the WAIS—R. This would
be predicted from a Cultural-Distance view, since access to those
responses coded "correct" on the Wechsler scales would increase with
one's exposure to major culture norms (school system participation) and
thus the detection of group biased items would reduce with mean group
age.
The final interesting result of the Ross-Reynolds and Reschly
paper was the finding that no items on the six studied subtests were
biased against the Black sample and only one item was biased against
the Chicano sample (both groups compared to the White sample). This
determination was made through the use of an intricate series of
decisions and computations. To quote the author again:
...examination of specific items for bias, usedtransformed item difficulties and outlier analysis.These techniques...are conceptually equivalent to thecriterion of items by group interaction but do notrequire the use of numerous a priori comparisons or posthoc tests. Items on which the percentage correct forthe four groups was greater than 95 or less than 5 wereexcluded from the outlier analyses...Items weredetermined to be biased if they deviated from the *45°theoretical regression line, by more than .75 g_
where g;(Z1-Z2)/ —J 2... (P. THH-1U5). ·

88
Fuller treatment of this type of statistical method may be found
in Anastasi (1976). At present, let it be noted that the use of a
° theoretical regression line lying on the ¤5th degree can have an
unwarranted equaling effect on group performance differences. The
exclusion of undoubtedly easy and difficult items would also reduce any
possible group responding differences lf items at either end of the
spectrum were proportionally more biased than mid-range items. In all,
this technique reduces the ability of the investigator to identify bias
and could explain why results using this method are at odds with
earlier reports using different statistical methods in the same study
(i.e., rank order correlations).
The interesting point to come out of the outlier analyses is that
"nearly one third of the items on the Verbal Scale subtests would be
considered to be biased against NAPs.” Even with the “ceiling" rules
excluding the questions below and above the 5% and 95% Points
respectively, the NAP participants were definitely at a cultural
disadvantage. Even so, once again:
The items that were clearly biased against NAPs were
among the best discriminators of high and low
performance for the group, an ironic result found not
infrequently in studies of item bias (Ross-Reynolds and
Reschly, 1983; p. 1ß6).
Macro-level fallacies . This result is not so ironic when one
looks at a culture and not just individuals. IQ tests only measure
‘those behaviors (item domain) valued by the major-culture, therefore,
those biased items are differentiating between NAP enculturation at the
individual level, not intellectual ability (as in major culture
individuals). These results, replicated in study after study,) should

89
convince the stauchest backer of intelligence testing that only* one
ideal of intelligence is being examined on these tests, and that this
view is not equally held by all cultures, and that the interpretationU
must be tempered by distance of each culture from this ideal and the
relative standing of individuals within cultures (see also Gordon and
Rubain, 1980). .
Jensen (1976) posits that there is a genetically coded
developmental gap separating the mental maturity of chronologically
equal Blacks and Whites. By calling upon substantiated developmental
in-group differences, he completely dismisses equally (but, different)
valid between-group differences. Is this not truly the behavior of a
target group engulfing the perceptual field (Jones & Nisbett, 1972) of
an out-group investigator?
The Cultural-Distance (CD) hypothesis would interpret like
findings to suggest that those behaviors measured by IQ and other
assessment devices display inequality of group performance because
minority group members are more distant from the "cultural standard" on
which the tests are based. The so-called "developmental lag" can more
rightly (from our perspective) be viewed as an inaccessibility of
norming information to ethnic minorities. Therefore, knowledge valued
by the supra-culture (and included on test of intelligence) is attained
at a later age for minority individuals than majority individuals
solely because of factors of access.
Our assumption is not without preoedence. Males and females
(within cultures) are presently considered to carry equal genetic
endowment of general intelligence. Test constructors apply (this ·"!‘ule"

90
of equality when compiling test questions (Taylor, 1976). Common
acceptance of this social "fact" even affects law. An instructive
example may prove enlightening (Girls outsmart boys, 1983):
Until 1982, girls in the Swiss canton of Vaud had toearn higher scores than boys to be admitted to highschool. Each year, girls were performing better thanboys on the entrance exams, even though they had tolearn home arts like sewing, leaving less time forintellectual pursuits. To keep the admittance ration at50/50, requirements were set higher for girls (p. 12).
The exosystem of cultural beliefs has not accepted racial
intellectual equivalence. White (198M) reviews the “now famous Larry
P. Case." In 1972, the Bay Area Black Psychology Association went to
court to protest the over representation of Blacks in classes for the
mentally retarded (based on intelligence test results). They· argued
that although only 28.5 percent of the San Francisco school districts'
population was Black in 1971, 60 percent of the pupils in the educable
mentally retarded (EMR) classes were Black. On the California state
level, 9.1 percent of students were Black in the same year, while 27.5
percent of the EMR designated school population was Black. The outcome
of the suite resulted in a massive 131-page opinion by Chief U.S.
District Judge Robert F. Peckham stating that:
because of cultural and racial bias IQ tests cannot beused as valid measure of intellectual retardation forBlacks, and that Black children had beendisproportionately assigned to inferior dead·endeducation as a result of invalid assessment (a permanentban on such assessment was issued covering the entirestate) (p. 112).
Law certainly cannot be accepted as scientific fact even though‘
this oase was judged on scientific evidence. Vburing the trial,
testimony was heard from test designers, geneticists, psychologists and

91
specialists on education for the handicapped” (Mercer, 1982). The
judge ruled, after weighing all the evidence, that "while many think of
the IQ as an objective measure of innate, fixed intelligence", the
truth derived from the presentations was that such a "conception of the
IQ is erroneous" and that such tests only measure specific skills.
Judge Peokham went on to charge that IQ tests were racially
discriminatory, being developed on White—American populations and
unadjusted for certain racial-ethnic groups (Blacks and Hispanics)
(Judge bans use of IQ tests..., 1979).
A more telling argument against the equivalent use of assessment
measures with Black and White groups is given by the results of a six-
year study concerning the sources of bias in the prediction of job
performance conducted by the Educational Testing Service (ETS) (An
Investigation of sources of b1as..., 1972). Most often when bias
testing is considered it is the position of the regression line Y-axis
intercept that differentiates Black and White groups, Whites over
Blacks (An Approach for identifying ..., 1980). Both regression lines
(for Blacks and Whites) usually have the same slope and dispersion
properties, leading many investigators to the conclusion that the tests
and criterion are as fair for the Black group as the White group. The
only difference they see is the fact that the minority group scores
lower consistently on both measures. The fallacy of this argument has
been discussed above and shall not concern us here.
ETS (An Approach;.., 1980) compared several forms of assessment
for their predictive ability on several forms of job evaluations for
three racial groups: Blacks, Whites, and Mexican-American.Ü The

92
findings did demonstrate regression-line y-intercept differences
favoring White (if each racial group was confined to its own regression
formula). The study, which involved medical technicians, cartographic
technicians, and inventory managers, also found slope differences when
many of the different forms of aptitude test scores were used to
predict certain work performance criterion measure scores (learning”
ability rating, job knowledge test score, work sample). Often the
slopes of Black prediction would intersect the White slope at the high
end of the distribution. This would suggest that as Blacks and Whites
(as measured by the predictor variable) become more proficient at a
task, there (1) exists less inter-group differences, and (2) therel
exists more intra-group differences (between these extreme performers
and their own co-racials). In fact, since the regression line for
Blacks in this area is above that of Whites, to use the White standard
as an assessment tool would penalize these minority persons. This is
at odds with what is often used as an argument against test fairness:
that use of the ‘White standard overpredicts Black performance, thus
giving minorities an advantage (Clearly, Humphreys, Kledrivick, and
Wesman, 1975; Cole, 1981; Hunter and Schmidt, 1976).
Jensen's statement (1976) that "the items that best measure
individual differences within each racial group are the same items that
discriminate the most between the racial groups" does not hold up when
higher scoring Blacks and Whites are considered. The racial-genetic
point of view gives no clue as to why this might be the case. Cultural-
distance would anticipate such a finding because our .underlying

93
assumption that more knowledge of the information on the norming scale
signifles less distance between individuals, Black or White.
One final difference in the regression lines of the various groups
noted in the ETS findings was dispersion about the line of regression.
The difference led to the conclusion that "with significant differences
in the dispersions, it is inconclusive whether the ·location of the
lines would be significantly different, (and)...this does appear to be
an instance where...tests may be biased...in predicting the Work Sample
criterion." .
The ETS study also dealt with another important concern. They
determined to see whether co-racials who supervised workers would give
job performance ratings equal to out-group supervisors. Their findings
showed that the correlation of Learning Ability ratings with all of the
objective measures for each rater-ratee combination was best where the
rater and ratee were of the same race. They state most forcefully that
"the high validity overall for the Black-rating-Black combination is
striking" (see Table 7, Table 8, and Figure 3). Are the Black
supervisors attuned to some aspect of their Black charges not sensed by
the White supervisors of Blacks? ETS let the issue drop at this point
with the observation, "I think there is little doubt that ethnic group
of rater and ratee does make a difference."
Evidence that this indeed is the case comes from an entirely
different source and setting. Recently Brazziel (1983) reported on the
differences between Black students receiving their Baccalaureate degree
at Black institutions and White institutions. He lwas interested in
whether either group of students would outrank the other as measured by·

944
TABLE 7
CORRELATION OF LEARNING ABILITY RATINGS
WITH APTITUDE TESTS, JOB KNOWLEDGE TEST,
AND WORK SAMLES BY RACE OF RATER
AND RACE or RATER *Cartographic Technicians (Tech)/(TOPOCOM Samples)
Black (Black-American)/White (White-American)MexAm (Mexican—American)
RACE OF TECH: Black White MexAm White Black MexAm WhiteRACE OF RATER: Black Black MexAm MexAm White White White
N=20 N=53 N=97 N=26 N=99 N=99 N=240Coordination .47 -.04 .15 .07 .11 .14 .21Hidden Figures .33 .32 .37 .36 .22 .35 .21Vocabulary .48 .06 .03 .21 .13 .03 .02Object-Number .42 .08 .03 .46 .14 .14 .04Card Rotation .42 .35 .27 .44 .21 .08 .29Arithmetic .59 .20 .31 .36 .37 .26 .22Map Planning .51 .33 .35 .53 .28 .29 .37Surface Develop .36 .26 .31 .61 .36 .27 .32Maze Tracing .51 .32 .33 .57 .16 .22 .29Following OralDirections .44 .19 .24 .51 .28 .31 .32Identical Pict .34 .26 .26 .40 .31 .19 .17Extended RangeVocabulary .22 -.09 .05 .09 .12 .13 -.08Necessary ArithOperations .55 .23 .33 .46 .26 .31 .29Job Knowledge .48 .55 .42 .66 .30 .46 .38GeometricRestitution .11 .12 .19 .48 _ .11 .22 .20LogicalContouring .43 -.06 .33 .38 .13 .24 .11Pull-up .67 .41 .44 .41 .15 .33 .24
*Raprinted hy permission from Educational Testing Service

95
TABLE 8
AVERAGE CORRELATION OF LEARNING ABILITY
RATING WITH OBJECTIVE MEASURES
BY RACE OF RATER.AND RACE OF RATEE*
ETHNIC GROUP OF RATERETHNIC GROUP
OCCUPATION OF RAIEE BLACK MEX-AMERICAN CAUCASIAN
Medical Black .27 .25 _Technician
Caucasian .17 .23
Cartograph Black .44 .22Technician ‘
-(TOPOCOM) Mex—American .22 .26 .24
Caucasian .22 .42 .22
Cartograph Black .59 .27Technician
(C & G ) Caucasian .47 .27
Inventory Black .40 .26Manager
Mex-American .28
Caucasian .28 .20
Total Black .44 .25
Mex-American .26 .26
Caucasian .28 .42 .25
*Reprinted by permission Iron Educational Testing Service _

96
1 11 11 1{ {I I I1 1{ {
1 1I ° I{ {1 17 .{ 9 {1
° { 1I 56 .·'°°° ,0 . II E
·‘ ,/ II „ ..........___ II II 3 5 II I I1 E II Blocks Roted by Block Supervisor: N¤50 II 3 4
° -········· Blocks Roted by Coucosion Supervisor: N•l46 II —-·····
-— Coucosions Roted by Block Supervisor: N•40 II
-———— Coucosion: Roted by Coucosion Supervisor: N¤276 IA Meon »
{ 43 0 Stondord Deviotion I‘
I Intervol I1 {{I
20 30 40 50 _ II Job Knowledge Test Score _ I{ {{ {1 11 1 14 I . . . II Hgure 3: Pred1ct.1on of Job Knowledge Rating || from Job Knowledge Test. Score |1 Inznxcnr TECHNICIANS)‘ 11 9 1
*Repr:Lnted by permission from Educational Testing Service4

_ 97
continuation toward and completion of a Doctoral degree. The outcome
of his study of the 8232 doctorates earned by Black candidates from
1975 to 1980 were surprising. Brazziel focused primarily on Black
Americans, reducing the total for analysis to 6320. Of this number,
3¤55 had received their undergraduate degree from a Black college or
university while only 2865 had received this degree from White
institutions. A Chi-square analysis of the difference is presented in
Table 9. Black doctorates were signifioantly more likely to have
matriculated at a formerly all Black institution. Why should this be
the case? It is not that these students were "given" their doctorates
by these Black colleges. The fact is that most Black colleges do not
even offer doctoral degrees, and these students for the most part,
earned their terminal degrees at formerly all-White colleges and
universities.
Table 10 shows the ranking of the ten top Black doctoral producing
undergraduate schools in the nation, for 1978-1980. All are formerly
all-Black institutions, some quite small. Table 10 also includes the
ratio of doctorates to baccalaureates graduated from these colleges and
universities. The figures are impressive as Brazziel makes known in
the following passage from the article:
The productivity ratio (for Talladega College) is thus
1:12, a rather remarkable figure. The exercise whenapplied to data for all American institutions yields a
ratio of 1:25 or one graduate in 25 (all races but
mostly White) going on to win a doctoral degree of any
kind (p. 105).
Brazziel rightly concludes the Black colleges and universities
contribute substantially to the nation's Black doctorate pool. Nearly

98
I
G)
W4.1 cucl U4) •1·-4
-1-4 *+-4U-1-4*4-1~1-4 UE)OU xD Q -1-4·1¢ 0 ao m o.¤·1-1
QQJZ • • • Sm-1-4:: Q Q O
¤J1—4 In Q O"¤*•-1
· -1-4 UCU 1-I :2OH HU II!O¢DO 1-4
9-1E-4 0100} 0>AJ GOG)GS Q)-·|0 1-4H CI 1-41-4Z! bD•1-4 [email protected] U-
1-4 •r-4@+-4*-1 MCDU WO OJ:U·1-4 4044@14*-4-1 1-4Q O 1¤«*-*
In Ih Ih O N*4-1+-la) Ih NO NQG 1: Q oo cn ::4.1
Gd) Q
N:111-11-4
U- -1-4¤'opac: mg-'U @ U
1:-41--414.1 000o ~1-1 -1-4
¤.c:¤U -1-4-1-IN°‘
E-1 111-1-1¢¤1-4 00
co N ÖH;.[-1 00 o c~ 1::;*:09rxUE"OH N N O 0*+-1
oo 014.1 1-1oo10*-•
nn ¤:¤n94* DUON _ 11:1-1¤1-1 1.11-19O q)Q•I'¢
m :>0g4.1 z 1- cn o 0-aQ 4**1 N'U4J
10 1~ 0114*4-1-1 4.109-1-43
1%*312na 0 08-P0 0) _HU•¤4.1 1-1 00+*111 1-1 0 0 •4.1.¤-41.1 0 on no 3O U 0 0 UO!
4.1 1-1 1-1 1-11¤•¤0 11-1 1-1 1-4 0 9o o 0 o Ulßvcs U U 0-0:5
0 c:¤¤'¤2 .2 0 1-11090 0 4.1 ¢1:·-11-1+10 £—1 111 ·1-1 4.1.1:1-1¤·1-1 1-1
FQ E—*·kU

99
3'8Välgé
ää0:3.30
SSmg $3 ZB EI 2* S? 3 *3 3 *3 °°•• •• •• •• •• •• •• •• •• ••O og 1- 1- 1- 1- 1- 1- 1- 1- 1- 1··
0 0Q0OS-•0
113*Izu'8 gi 5II: ·•-•
0~3. *3S 53Q b 0~ O N Q M M4*0 N I- 0* N0* GU N1- 00 UI $-1E-1 N Du-I Qz~ ·•-•0
o~ oo ••1- $1
E 2Q .E ä'é° 1:S -3Qaß
q$4••-1 I-1Q 0 +9 0-•ß$4 ·•-• ¤•
E •S >, 4-4 o .¤0 0 aß >• ¤ > aßM U U 0 ••-1 -9 D -r—|
° .3 .3 3, EP 5* 2 11 4• S•-4 •-I 0 •-1 0 ·•-• 0 $4 aß -18 0 «-4 r-4 Q 0 b 0 S 0 3O •-4 0 0 $4 --1 > aß0 0 O r-! 0 ¤ ·«1 cn 8 *0-14 U 0 O •-I P D G 0aß Q 0 0 0 ·•-• t: U} 00 5 G O O G 'E 5+> ·0 0 E «-1 ::~ $4 I2 ¤ •¤·•-• 0 „¤ 0 M 0 0 ·•-1 0 0aß •-• 0 «—1 $4 M «-1 ·•·• Q $4*°"‘
'* 8. ¤ ,3 -2 $4* * 3 '“ °*•-• Ä Ä cn c- 0 ::4 0 Ä :> Ä Ä · .4; .

100
55 percent of this country's Black doctorate recipients receive their
first post-secondary training at 87 traditionally Black colleges and
universities.
"The nature of the undergraduate experiences in these institutions
is far from clear," is how Brazziel ends his discussion of his
finding. He does venture to suggest that the experiences on these
highly productive Black campuses may somehow share qualities with "good
colleges" everywhere. This author's inclination would be to think that
these Black colleges are providing their Black undergraduates with
something different than they could receive on White campuses. From a
cultural-distance perspective it could be imagined that these
institutions were teaching their charges in a more culturally relevant
fashion while still importing the behavioral skills and knowledge sets
needed by all students pursuing advanced degrees. This, however,
awaits investigation.
If nothing else can be learned from the Brazziel paper we must at
least recognize the superior validity of Black colleges' admission
policies for Black students. Using Black doctoral recipients as a
criterion of successful admissions procedures, we see that Blacks are
better able to prediot future Black performance than Whites. This
corroborates the Educational Testing Service findings given earlier.
Why are Blacks able to predict "ability to learn" better than
Whites for Black subjects? Because, as Spindler (1975) states, a
culture has to be understood from within, on their own terms and by
their own standards. This modest statement seems to fit so well the
data.l ·
·

101
Attempting to predict or understand Black behavior or potential by
l
use of the White standard will only be marginally useful. Blacks are
members of the total society and therefore, ggggg understanding and
prediction using "societal“ norms is possible. But so much more
understanding is possible if first we know the norms of the sub-culture.
The two studies described below were conducted in order to increase
this understanding.

METHOD
Study II consisted of further analyses of the data already
obtained from the Master's thesis described herein (Grubb, 1983), with
the addition of new information obtained from these subjects.
Study—II
Subjects '
The subjects for this study were 80 post-secondard school adults,
primarily college undergraduates attending Virginia Polytechnic
Institute and State University. A total of M8 White subjects (2M
males, 2M females) and 32 Black subjects (16 males, 16 females) were
recruited and tested during the months May through August 1983 as part
of the original study (Study—I). The additional data required for
Study-II was obtained during May and June, 198M.
Instruments
Cultural variables . The subjects were given a M3-question
Personal Data Questionnaire (see Appendix A) prior to being given the
series of tests. The questions in this schedule were based in part on
the U.S. Census Bureau's classification system of occupations (see
Appendix B), and a Parent Interview Schedule developed by Greenberg and
Davidson (1972) (see Appendix C). The majority of items were based on
102 ‘ «

103
research findings discussed in the thesis and the theory underlying it -
Cultural-Distance . The information obtained from this question-
naire provided the cultural factors which were used to test Hypothesis
III of the previous study - Study I: that certain socio-cultural
variables could account for the differences in IQ performance between
the racial groups (see Appendix D).
Intellectual/performance measures . The following measures of
IQ, learning, and performance were given each subject:
(1) Wechsler Adult Intelligence Scale — Revised (WAIS-R),(2) Peabody Picture Vocabulary Test (PPVT),(3) Booklet Category Test (BCT),(M) Memory Drum Recall Test (MD #1),(5) Memory Drum Recognition Test (MD #2).
The WAIS-R was chosen for inclusion in this study because of its
wide use and acceptance in measuring intelligence. The PPVT was chosen
to be a part of this investigation because of its acceptable
reliability (parallel forms, A and B, g;77) and wide spread use. The
Booklet Category Test (BCT) is a newly developed redesign of the
Halstead-Reitan Categories Test (part of a total neurological test
battery). The BCT consists of 208 black-and-white and colored plates,
arranged in seven separate sub-tests. Within each sub-test there is
one concept which will allow the subject to choose a number between one
and four that correctly represents the visual stimulus. The BCT is
designed to assess brain damage but was chosen for inclusion in this
study because it is a problem-solving task. Results are reported in
number of errors (50 being a cut-off score of serious neurological
dysfunction). The BCT was included in order tonassess subjects cn
Level-11 (transformation) 1m,e11ec1:ua1 abillties (Jensen, 1973) Wi1=h¤¤1=
104
the hypothesized interference of culturally weighted material found in
standardized tests of IQ. The two Memory ·Drum tasks, Recall and
Recognition, were not used in this re-analysis of the original data.
Procedure
The 80 subjects were divided into four groups based on race and
sex: (1) Black males; (2) White males; (3) Black females; (11) White
females. Four examiners, 2-Black males and 2—White males, graduate
students in Clinical Psychology or Educational Counseling, _served as
experimenters. The tester—testee breakdown is presented in Appendix E.l
All subjects were given the five dependent measures of intelligent
behavior in two settings according to the following formula. Each
examiner gave half the subjects in each cell the WAIS—R on the first
sitting, the other subjects within that cell received the WAIS-R
administration during the second session (the WAIS-R, because of time
constraints, was always administered alone during a session). The
other three measures (PPVT, BTC, and the verbal learning and memory
tests) were given within a single session, order of administration
being counterbalanced to avoid practice and learning confounds (see
Appendix F). Other procedures utilized in order to minimize tester-
testee interactions and test situation confounds are described in the
section describing Study III.l
New analyses . The following reanalyses of the data from the
original study (Grubb, 1983) were completed. All statistically
biased (_p<.O5, two-tailed) items (and/or sub-tests) on the WAIS-R,
_ PPVT, and BCT were ldentified. After this, two adjusted measures of e

105
the WAIS-R and PPVT were created. Each test generated the following:
(1) a standardized version of the test (no change); (2) a version of
the test with all biased items removed; and (3) a version of the test
with equal numbers of Black and White biased numbers retained (this was
impossible, however, for the WAIS-R because of the pattern of biased
items).
Subjects who originally participated in the previous study were
contacted and information on their grade point averages (QCA) and
Scholastic Aptitude Test (SAT) scores were obtained (see Appendix G
for permission form). Using the five IQ measures (WAIS-R; WAIS-R
without biased items; PPVT; PPVT without biased items; PPVT with
balanced number of biased items), the Level-II learning task measure
(BCT) and SAT scores (Combined, Math, and Verbal) as predictor
variables and the grade point averages as criterion, the rank order of
predictive validity of the former measures regressed on the latter was
determined. This was determined for the total sample, as well as
Blacks and Whites alone. Identical analyses using culturally-levelled
IQs, based on those variables found to weigh heavily in these measures,
were also run. Only grades earned at the Blacksburg campus of Virginia
Tech were used in these analyses.
Study II was basically conducted to determine exactly which items
(and sub-tests) on the two IQ tests (WAIS-R and PPVT) and the Level-II
learning/performance tasks (BCT) were biased, and in which direction.
Non—biased, biased-balanced, and culturally-levelled IQs were also
compared for predictive validity of academic achievement to the
standard measures.·
·

106
Study-III
Subjects
The subjects of this study were 80 post-secondary school adults
(MO Blacks; NO Whites), primarily undergraduate students at Virginia
Polytechnic Institute and State University. Half of each racial group
were male and half were female.
Instruments -
Cultural and performance variables . The subjects were given
the revised Personal Data Questionnaire (PDQ-R) prior to the series of
tests (see Appendix H). The Personal Data Questionnaire (PDQ) (Grubb,
1983) (see Appendix A for original instrument) also used in the
previous work was reworked based on the outcome of the previous study
and improved by incorporating additional items measuring the socio-
cultural determinants of intelligence.
A Social Performance Questionnaire (SPQ) (see Appendix I) was also
filled out by each subject, including such information as college
standing, major, courses taken, QCA, years in college, personal
problems, counseling center visits, classes dropped, summer attendance,
and hours carried per quarter. Information such as present dating
habits, social and family networks, diversity of interests, sports
activity, hobbies, living arrangements (alone or with a roommate/on
campus or off), part—time work, and other social and non-academic
questions relating to current functioning was also assessed·as a part
of the Social Performance Questionnaire.
l
_

107
Measures of intelligence . The following measures of IQ were
given each student:
(1) Wechsler Adult Intelligence Scale-Revised (WAIS-R),(2) Peabody Picture Vocabulary Test (PPVT),(3) Booklet Categories Test (BCT).
All of these tests were given to the students in Study I (see
Grubb, 1983), and group performance on these measures in this study was
meant to serve as a cross-validation of previous outcomes and
conclusions.
Personality inventory . The Gordon Personal Profile (GPP), a
standardized instrument used to measure five areas of personality
development (1-Ascendancy; 2-Responsibility; 3-Emotional Stability; N-
Sociability; and 5—Self-Esteem) was administered to each subject. This
inventory (GPP) provided a "simply obtained measure of (important)
aspects of personality that are significant in the daily functioning of
the normal person" (Gordon, 1978).
The GPP ‘was standardized on 5,8N7 college students, principally
freshmen and sophomores. The instrument has alpha and split-half
reliability coefficients, on all sub-scales, within aoceptable ranges
(all E-values greater than .80).
This instrument was chosen for inclusion in this study in order to
explore aspects of personality, and its relationship with social-
adjustment, enculturation, and intelligence. The five factors of the
GPP were hypothesized to have specific relationships with the other
measures in the assessment package (see hypotheses below).

108
Procedure
The 80 subjects were divided into four groups based on race and
sex: (1) Black males; (2) White males; (3) Black females; (N) White
females. Two examiners, one Black male and one White male, both
graduate students in Clinical Psychology, tested an equal number of
subjects in each cell.
All subjects were given the dependent measures in two settings
according to the following formula. Each examiner gave half the
subjects of one race and sex the WAIS-R on the first setting, the other
subjects within that racial/sexual group received the WAIS—R
administration during the second session. Prior to the administration
of the WAIS—R, each subject was required to fill out the SPQ.
The PPVT, BCT, and GPP were administered together in the
additional required session. Their order was counterbalanced within
racial/sexual testee groups. During this session each subject was also
requested to fill out the PDQ-R prior to intellectual testing.
The WAIS-R, PPVT, BCT, and GPP were administered and scored laccording to standard instructions. The derived measures were
calculated by a set formula adopted after Study-II was completed (see
previous sub-section, Study—II).
Times of testing varied (morning/afternoon/evening and day of
week) within and between groups randomly. The two experimenters were
also assigned times and subjects on a random basis. Testers wore
similar clothing, one color suits with ties devoid of jewelry or other
ornamentation. Testers also acted uniformly in the delivery of social
praise durlng testing. Encouragement was given only when the subject _

109
seemed confused as to whether his/her answer was sufficient and only
included the phrases: "that's good," "um uh," or "okay," in order to
encourage the subject to proceed. No culturally relevant remarks or
gestures were performed by examiners which might have differentially
affected responding either racially or sexually. Very little prompting
was found to be required, since the subjects were undergraduate college
students accustomed to being tested.
Both testers were familiarized with the instruments prior to the
start of actual subject testing. Practice on every test was begun two
weeks prior to subject use. Review of acceptable answers and scoring
was also emphasized prior to actual subject contact. Throughout the
several months of actual testing (May through August 198ü), bi—weekly
informal meetings were held in order to go over testing issues and to
present and resolve scoring difficulties. Each tester was also
required to score eight complete test batteries (two randomly chosen
batteries from each racial/ sexual testee category) which were given
to the subject (but unscored) by his investigative colleague. This
technique was instituted in order to increase inter-tester reliability
(which showed no significant inter-tester differences in Study-I).
The dual tester (administration/scoring) tests were discussed by
the investigators at the bi-weekly meetings. Questions concerning
recorded answers and score interpretations were discussed and
resolved. The inter—rater reliability was not determined in the
traditional sense of comparing two different sets of scores through
differential statistical techniques. The scoring disagreement rate was
A never more than a few items per assessment package and always resolved·

110
to tester agreement with the provision of more complete test responses
or the clarification of criterion used for specific item quantifi-
cation. In this fashion, disagreement lead to increased reliability
over the course of the study. The last several assessment batteries
produced no disagreements. A The hypotheses of the study were never
openly discussed with the tester assisting the author, but there was no
effort made to keep him totally blind (the second experimenter was also
involved in the previous study).
The consent form (Appendix J) signed by each subject and the
General Instructions for testing (Appendix K) read to each subject
contains some pertinent information. The subjects were told that a
"test is being conducted to determine the suitability of IQ tests with
certain populations based on certain demographic data and family
histories." Test sessions were conducted in small windowless and
sparsely furnished rooms. A brief "get acquainted" time was allowed
prior to commencement of testing. This period varied from subject to
subject and from session to session depending on the requirements of
the testee. Subjects were allowedan
rest period between the tests:
ten minutes when requested.
Prior to any testing, during the first session, each subject was
asked to sign permission slips allowing the investigation team to have
access to their official SAT scores and transcripts (for both High
School and college QCA verification) in addition to High School class
size and standing, and college field of study (see Appendix L). At the I
commencement of all testing, during the second session, subjects were
Siven a raclal-specific question to answer using a 7-point Llkkert_

lll
scale. For the White subjects the question read: "How strongly do you
identify with the White middle-class American value system?" The Black
subjects were asked to respond to the following: "How strongly do you
identify with the Black-American sub—culture?", followed by the
question, "How strongly do you identify with the White middle-class
American value system?" (see Appendix M for copies of both questions
and response scale). These questions were added in order to assess
each subjects subjective in-group (and in the case of Black subjects,
out-group) affiliation. -
‘VHYPOTHESES
In line with the "cultural-distance" interpretation of racial
group comparisons, the following predictions were made:
Hypotheses of Study—II
Hypothesis-I:
Analysis of raw IQ data scores will reveal a greater abundance of
White-biased items than 'B1ack-biased items. Each racial group will
evidence a specific sub-score pattern as a result of the distribution
of biased items. Those sub-tests showing the highest frequency of
biased items will evidence the largest discrepencies between groups.
Hypothesis-II:
There will appear no separate sub-score patterns for the two
racial groups on the Level II learning/performance task (BCT).
Hypothesis-III: »
Certain of the 9—social¥cultura1 variables will show a significant
difference between the two racial groups; creating specific racial PDQ
sub-score patterns.
112

113
Hypothesis—IV:
Prediction of Black academic performance will be better using the
PDQ as a. ”cultural-levelling scale" with the standardized IQ tests,
using the Level-II performance measure (BCT), or using the derived IQ
scales (bias manipulation), than the traditional WAIS—R, PPVT, or SAT
scales (Combined, Verbal and Math).
Hypotheses of Study-III
Hypothesis-I:
Study-III's results will repllcate the results of the previous
study (Grubb, 1983; see Appendix D).
Hypothesis-II:
There will appear the same racial sub-score patterns on the
dependent measures as seen in Study-II.
Hypothesis—III:
The PDQ-R will be more sensitive to "cultural-distance" than the
original PDQ and therefore be able to reduce the difference in IQ
scores of Blacks and Whites on all measures of IQ. The racial
difference on the PPVT will be reduced below the level of significance
(this was not the case in the previous study). Therefore, the PDQ-R
will be a more effective cultural-levelling scale.

114
Hypothesis-IV:
The ”culturally-levelled" IQs will be better predictors of
academic functioning than the standardized versions for Black subjects.
Hypothesis-V:
The learning/performance measure of intelligence (BCT) will be
able to predict Black academic functioning better than traditional IQ
instruments.
Hypothesis-VI:
The learning/performance measure of intelligence (BCT) will be
able to predict White academic functioning as well as traditional IQ
instruments.
Hypothesis-VII:
The correlation of positive personality characteristics, as
measured by the Gordon Personality Profile, and academic performance
and IQ assessment is predicted for all subjects.
Hypothesis—VIII:
Intelligence test scores will also correlate with social
adjustment to college, as measured by the Social Performance
Questionnaire (SPQ).
Hypothesis-IX:
Social adjustment will correlate with college academic functioning

115
based on the Cu1tura1—Distance Perspective 's assumption that
increased socialization and system enculturation fosters the
development of in-group behavior.

_ RESULTSStudy-11
Item Bias
Chi-squared tests of homogeneity (Brown & Hollander, 1977) between
the Black and White racial groups were calculated for every item on the
two measures of IQ: (1) the Peabody Picture Vocabulary Test (PPVT) and
the (2) Wechsler Adult Intelligence Scale-Revised (WAIS-R) with one
exception, noted below. Twenty items on the PPVT were found to be
biased favoring the White group while only one item was determined to
be biased toward the Black group (at the pf.05 confidence level).
Table 11 lists those items which were found to reject the null
hypothesis of racial group performance equivalence on the PPVT and the
level of confidence placed on the observed discrepancies. Also marked
are those items whose expected cell frequencies rendered item bias
interpretation unreliable (statistically). Those chi-squared
computations which are marked in Table 11 as presenting "discontinuity
difficulty" (items 91, 97, 98, 99, 101, 102, and 105) have cell
expectancy values of 5 or less in at least one cell. Because such low
frequency cells violate one of the major underlying assumptions to the
use of this statistical technique when EE=1, a corrected chi-square
using Yates' correction (see McNemar, 1969; p. 262-263) was performed
on each calculation.
It is also suggested that chi-squared analyses with Es between 5
and 10 (inclusive) be subjected to Yates' correction (McNemar, 1969),
116

117
0) AA A A AU Ulm U1 Ch U:
ZZ Z Z Zgwwgwxv O
UQQQGNQOO Insb
*1-1O1-11-101-1OO O~q¤|
••••••• •
OOOOOOO O•|
-1-1cn
A •U AJJ Q1-1-1 .9 0gd: 'OJ-1
C116 Gd:0 JJ: QsDQ sb O
•O•1-1 U QNQ O Q¢|}|«|-JH-| Qq}
••• • •
:> -1-1 HI 1.~1<1·c~1 :-1c•-1
xää"‘°”°
00-1-116-1-11:/)
1-1JJ¤3¤l*J-1~/:110
'J ?~•JJ¤‘1-1 JJ
A3 ää ”é'-1*11:**0 GJ-|1-¤>1·J •1"11•1:3111 JJ: U1mn-1-:1 do :11
s./Q Qq-1 p-1 ·
*1-1 Gi U11-1OJJv 111*1-1¤1‘ -1-1-1-I11101171 ZQ
-1¢
UE-1-1-1-1¢
U1 -k
*-1-1<BJJ 0 _ O
O1·'1O U ‘_ ‘ ·K ·•
:1¤• 5-1: -1: -1: -1:-1: -1:¤„¤>~• -1: -11-1:-1: -1:-1:-1:-1:-1:-1:-1: -1:-1:-1:-1: VOGUS UV'1 GN1-11-h ¢'*'1OG\¤~1-hsbln C~Jr-IQQ-1-1U -IO 1—1<"'1O NO-4-1—1Q1—1¢*1 ÖGFÜFÜ Q-
JJO>~• *1-1O OOO OOOOOOO OOOO¤1>JJ -1-1• ••• ••••••• ••••\
r-1 -1-1 O OOO OOOOOOO OOOO -1tSIUG) ·• . ·K '•¤|-1:
-1-11-1
:11:1111 :11 _ o _
JJJ-11:0•
UJUO .111-1-1E V
O9-1O .H S 0 ¤-0}-1 1-1
o„¤ :1-1:
-,91-*sbwsb Ih
:*13*-. t1)OsbsbQ Ol-f1wNNv'1Q<|'O®QN 1-1Olh O••I• •I¤•••l•l••• ••* l
11-1U 3-1-1 wQQl¤ V0 gl! 1-1 1-1 1-1
>~•·-1 U _¤•
HE—• JJ
° E1JJ ·~ 0¤1¤.1¤.1¤1¤1¤J¤) NUUUUQUUUUU
.5 JJJJJJJJJJJJJJJJ JJJJJJJJUJJJJJJJJJJJJ U-1-1*1-1
gg éééééééé éééééééééég 11-1-1m
E1)
¢¤F=1 _‘ *1;
é11-191
° IIJJ A
9-1

1118
.and since the majority of the crosstabulations presented in Table 11
were in this range (PPVT questions 109, 112, 116, 123, 12N, 136, 1¤2,
and 1¤5), such additional statistics were performed on those items
fitting this requirement. Where a change in significance was noted
because of the added computational component (PPVT item #1¤2), the
change is presented in Table 11. Minimal E values in the remaining
PPVT questions (113, 126, 1¤3, 1MB, 1¤6, and 1¤7) were all above 10 and
therefore the origlnal raw chi-squared values were accepted without
further manipulation.
As can be seen from an examination of Table 11, White biased items
(those correctly answered by Whites significantly more often than by
Blacks) outnumbered Black biased items by 20 (questions 91, 97, 98, 99,
101, 102, 106, 109, 112, 116, 123, 12M, 126, 136, 1¤2, 1¤3, 1¤¤, 1M5,
1¤6, and 1ß7) to 1 (question 113). Even with the removal of items not
attaining significance after the utilization of Yates' correction
procedure, the ratio (White to Black) remains 15:1.
Chi-square analyses were also performed on all the items of the
Wechsler Adult Intellignece Scale-Revised (WAIS-R) with the exception
of the Digit Symbol subtest (since this test is a measure of overall
speed of performance and the total score on this sub-test is the only
true indicator derivable from its measurement). Table 12 presents the
results of the manipulations. As with the PPVT, for those items
presenting problems of distributional normality (with at least one cell
E<5 or, in the cases where h_>1, with _tEE_ distributions that are
skewed), the Yates' correctional technique was used to further analyze
the crosstabulation. Five items met this criterion: Information-9,

119
rxeäfs f\ rx rx
U)!/If/1 V} U) U)
zzz z z | zQ-1-I¢VVV V V V·HO¢NIhIh N Ih O
¤<I*®d>¢D ~0 w OGÖÖC Ö Ö r-4
UZOOOO O O O
/%U TDU 'UH
AQG QIQ0:::11 :.1:1 :*1
•—I
UOU U OIN
•r<|·r|•v-4 GU) • •
é-uu-1 HI :*1 612%** 32
‘•5 OUQ¤‘••-I —‘
> VJ .f'\-¥¤G‘*·*
QUIO OI-UV) •H4-1
v—II-41-I -1-Jg-!¤¤<l¤J -55-#:3> „¤<.1
~/Q ·rI•1-IQ Q Q Q
u A 1-nu-10 0 0 0 0U'¤ ·I-*'·¤P" W P" Z P"
QGOG}·I¢ -I< ·-It
Mu: ·I¢ -1< -I¢ -1: -1:
OUQ«—IO
OOOO OOOOOOOOOOOOOOOOOO O
2UJO <nOOOO OOOOOOOOOOOOOOOOOO VU
Q-
°¤Ü0
H-It
5::0+1 BG! ·-1:
OH-:-I §:1c\I~¤¤ wr-I•—I
Ihn-! O
NUM1-Iu -1-4 «-I r-I1-I 1-—Ir-I V
550 J: ' Q-
-QI-·|G UGU O ·I¢
U11-IIh
(BBG}
·•gg:~1mIn1-I,C2Q
-1-I
UH1:.*
00Q
·-430 4-15 0•¤ J-I QO
•1-I
:¤>~„ 0--1u-1
E-•„¤·¤ £—•u --11:15
.¤¤1 «·-Ir-In-I1-IN¤|v-Il -16161 I-Ir-1 -1-1
0 55 ¤¤ 5 ·-1IH rn C-' EOmu:u1 ua
0)-1-4004) I1:
EIUHHHHI-1QQ~4n-Iw¢:uaJu O:1
um suuu ·¢/JU EEG EG 555 EE;-IQJIUGIGS IlI-IE-I HHH H •U
v

120
Information-13, Information-1N, Picture Arrangement-7, and
‘ Similarities-2.
Those items with minimum cell frequencies between 5 and 10 and/or
having less than 2 degrees of freedom associated with the original
calculation (Information-11, Information—20, Picture Complet1on—19, and
Picture ~Arrangement—6) were also recalculated and are presented in
Table 12 if this additional computation made a difference in the level
° of signifioance (Information-11 and Picture Completion—19). The final
column of Table 12 shows six of the original twenty-three biased items
were found to describe non-significant racial differences after the
seoondary manipulations, leaving 1¤ White-biased (favoring Whites)
items and 3 Black-biased (favoring Blacks) items (one item with a
minimal cell means less than 5, Information-9, showed no change). This
ratio of White-to-Black-biased items (White:Black = ¤.67; 1¤ to 3)
compares favorably to the ratio described by Wrobel (1982) and
discussed in the body of this paper. Prior to the secondary
manipulation the ratio equalled 3.83 (23:6), calculated in the same
fashion.
Sub-Score Scatter
Calculation of racial group performance differences using t-tests
was completed on each sub-test of the Standard WAIS-R (the PPVT does
not have specific sub-tests). Whites significantly outperformed Blacks
on three of the eleven sub—tests (Arithmetic, Block Design, and Object
Assembly) while Blacks were not significantly superior to Whites on any

121
rsubtests. Table 13 and Figure N demonstrate the various sub-score
. patterns for the two racial groups and the total sample.
It can be readily seen (Figure M) that the racial group
performances follow the same proportional pattern with the exception of
q the Picture Arrangement (PA) and Block Design (BD) area of histographic
representation. Both are performance measures, the part of the WAIS-R
(Performance) on which two of the three White over Black significant
differences (Block Design-BD and Object Assembly-OA) are found. It
should also be remembered that Blacks and Whites scored equivalently on
the WAIS-R Performance IQ difference, whereas there was a significant
White over Black WAIS-R Verbal IQ difference, while the present results
only show one Verbal sub-test displaying this significant difference
(Arithmetic-A).
The seven sections of the Booklet Category Test (BCT) were
subjected to _t -tests comparing the means of the two ethnic
groups. Just as in the above reported intellectual sub-test
comparisons, the pooled variance estimate of the two samples was
utilixed because of the independence of group means and the assumption
of variance equality. Only one statistically significant difference
was noted, on the last sub-test, BCT-7. This specific sub-test is a
measure of delayed recall/recognition and here Whites were better
performers (made fewer errors) that Blacks No other
significant differences were noted, and as, described previously, the
Black and White groups were recorded as having equal overall amounts of
the Level-II intelligence measured by the BCT. Very little group-
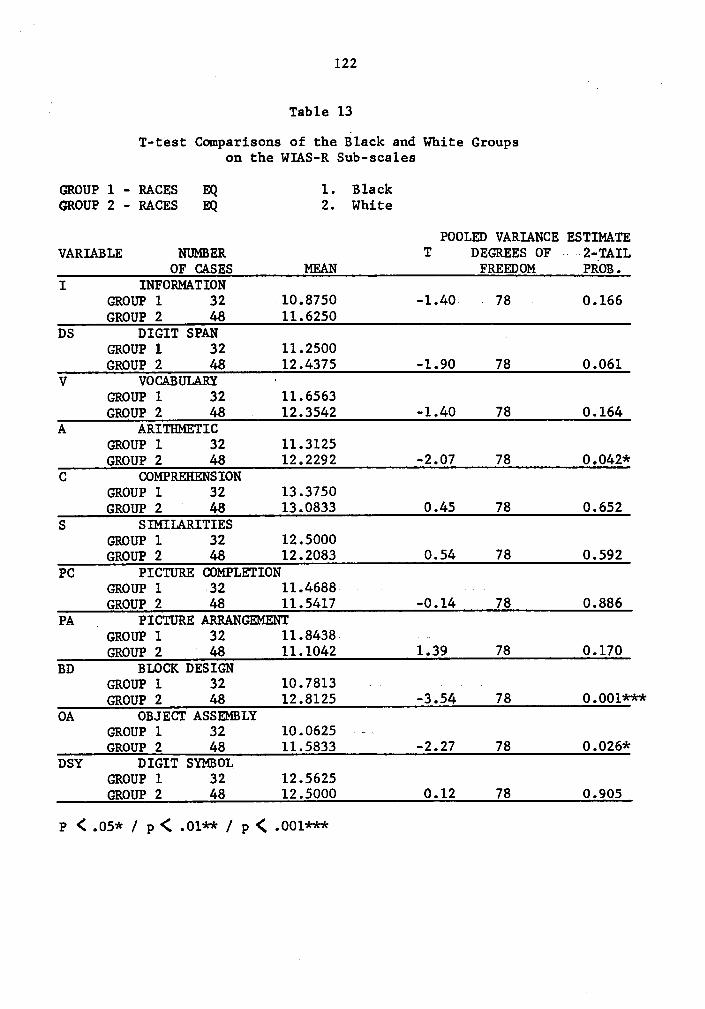
n 122
· Table 13
T-test Comparisons of the Black and White Groupson the WIAS-R Sub-scales
GROUP 1 - RACES EQ 1. BlackGROUP 2 - RACES EQ 2. White
POOLED VARIANCE ESTIMATEVARIABLE NUMER T DEGREES OF —--2-TAIL
OF CASES MEAN FREEDOM PROB.I INFORMATION
GROUP 1 32 -10.8750 -1.40 - 78 - 0.166GROUP 2 48 11.6250
DS DIGIT SPAN nGROUP 1 32 11.2500GROUP 2 48 12.4375 -1.90 78 0.061
V VOCABULARY ·GROUP 1 32 11.6563GROUP 2 48 . 12.3542 -1.40 78 0.164
A ARITHMETICGROUP 1 32 11.3125GROUP 2 48 12.2292 -2.07 78 0.042*
C COMPREHENSIONGROUP 1 32 13.3750GROUP 2
048 13.0833 0.45 78 0.652
S SIMILARITIESGROUP 1 32 12.5000GROUP 2 48 12.2083 0.54 78 0.592
PC PICTURE COMPLETIONGROUP 1 -32 11.4688 ~GROUP 2 48 11.5417 -0.14 78 0.886
PA _ PICTURE ARRANGEMNTGROUP 1 32 11.8438 -GROUP 2 ‘ 48 11.1042 1.39 78 0.170
BD BLOCK DESIGNGROUP 1 32 10.7813 - „ -GROUP 2 48 12.8125 -3.54 78 0.001***
OA OBJECT ASSEMBLYGROUP 1 32 10.0625 ---GROUP 2 48 11.5833 -2.27 78 0.026*
DSY DIGIT SYMOLGROUP 1 32 12.5625GROUP 2 48 12.5000 0.12 78 0.905
P (.05* / p< .01**/ p < .001***

A .
A
123
·ä"’ xa
Q5
~
F
32
~
X
\
2F
‘2
U
~•E
\•
czgt
Ix'}¤ x <
O
O
2.,;
x~ ¤ X ·
3;
3xFQ
ää
3*‘ °
.„‘\=·‘· *
ul
/
’
5-1
'
v ~:
-3 3
I"
E °
Q-T
l.
F
°’ > n
’0
g
1,
K
Qboü
·X¤•
••·I’¤
°"I':-•u U
,’
v:
ää*'
‘2:
ma;~
'-h
u
~
a
ä*
‘„¤ 0
••
_
O ¤
'Ü‘
FX
·O Q
{
I
‘•·•«-••
I
<
Wm>
Q ¤
U
4
1X
hg;
•
sa
I
3_
•
>
8
°‘ ° ¤
m
‘.
1
=
0
'S
\‘Q
U}_—;—’
•Ü X
“*
Q‘
‘g uväw

124
_)
specific performance scatter was observed; even on the BCT-7 (thel
difference in means (Dm) was only 0.51 error.
Table 1*4 displays the groups' mean responses to the social-
cultural variables surveyed by the Personal Data Questionnaire (PDQ).
The White group scored significantly higher on the measures of family
income (2<.01), combined parental educational attainment (2 <.01),
and the occupation strata of the father's vocation (2<.05).
Further, the Black group had an average of 1.18 more siblings per
family than the White group (2:2.73; 2<.01). Other differences,
though statistically non-significant, can be seen in Table 1*4. Fathers
are more apt to be absent from Black homes than White homes. Black
parents are measured as less invested in formal education (Parental
Attitude Toward Formal Ed) and the White subjects had a greater variety
of social learning (Varied Social Experience). Dwelling conditions in
the testees' home of origin and parental supervision styles in those
homes also evidenced group specific patterns.‘
Comparisons of Academic and Aptitude Measures
Table 15 displays the group means, standard deviations, and 2-
value comparisons of the groups on grade point averages (QCA) and the
three Scholastic Aptitude Test (SAT) indices; Verbal (SATV), Math
(SATM), and Combined (SATCOMB). No sub-populativon differences reached
the 95$ confidence level.V
Whites, as a group, tended to score higher on all three SAT
measures as expected. Unexpectedly, the Black group mean grade point

125
. _ Table 14T—Test Comparisons of the Black and White groups on
the Personal Data Questionnaire Variables
GROUP 1 - RACES EQ 1. BLACKGROUP 2 - RACES EQ 2. WHITE' POOLED VARIANCE ESTIMATEVARIABLE NUMER STANDARD T DEGREES OF 2-TAIL
OF CASES MEAN DEVIATION VALUE FREEDOM PROB.SIBS NUMEER OF suBJEcr's SIBLINGS
GROUP 1 32 3.4063 2.2562.73 78 0.008**
GROUP 2 48 2.2292 1.601DADSOC OCCUPATION LEVEL OF FATHER
gGROUP 1 32 4.3438— 1.619 - '-2.49 78 0.015*
GROUP 2 48 5.1667 1.326PARED COMBINED LEVEL OF PARENTS' EDUCATION
GROUP 1 32 10.9375 3.331‘ -2.96 78 0.004**GROUP 2 48 12.8958 2.570
INCOME INCOMEGROUP 1 32 6.0000 2.896
-2.88 78' 0.005**GROUP 2 48 7.7917 2.601
DADPRESS YEARS OF FATHER'S PRESENCEGROUP 1 . 32 16.5000 4.000
_ -0.82 78 ~ 0.413GROUP 2 48 17.1042 2.578
DWELL DWELLING CONDITIONSGROUP 1 32 10.7813 1.385· -1.82 78 0.072GROUP 2 48 11.2917 1.110
SUPAINT PARENTAL SUPERVISION-INTERVENTIONGROUP 1 32 10.1563 2.157
-1.59 78 0.117GROUP 2 48 10.8750 1.864 ·
PARATTED PARENTAL ATTITUDE TOWARD FORMAL EDGROUP 1 32 29.0000 9.514‘
-1.83 78 0.071· ·GROUP~2- - 48 33.9792 13.238
SOCEX VARIED SOCIAL EXPERIENCEGROUP 1 32 6.8750 3.367 . '
-0.76 78 0.452GROUP 2 48 7.5417 4.161
p < 0.05*/ p < 0.01**/ p < 0.001***

126
G1$7
r-IND
N
'
•
"‘•=¤3 3 °i c
gcQ
~ O
HM •O
Q E QM ¤'5 ä@ g ggQ 6 R
Qgirl
Ü No
I-I(jk;wu;
M m'
O
qg 4 Q
•—4N
3;., >
»o «—•
·
#= ME T A T
äg N ag • „—«u
qg 'J*-1
OI
¤<
1:12 O ;>cz cnmw
E
m
¢¤""
O q- "I O
.265Q ¤ .6 «—
6 R gz
,¤gz
" ¤o· "‘ •~ Q· ° ~¤
säg M2 R 6 R g é m $ m
uääp ° o Q
0 N ·-4 N
WH,..4
(Y1°ä Mää
Q ¤ 8 E 8
gä ”¤§QM E ¤ 3
~ S M
ä·¤ ¤ ¤¤ E ¤¤ S ~ 3 · Q2
w¤ oä §°‘In "* •
' N" co
Z ° N No ‘^
an O -1ln V7
¤-16 -*~ gg
Q
U
Q4
QQ'!co!-ÜN,<r"'
*-'mmh!
N 00<rZ
Q
Inmmm
QM NT
I"
“m2" Mg
8
1-IQrO'
4 M<2
EV
rl mm UG Ä.;§ S ¤•'gä g 66 ~é** °“:N68 E6 ~äT
ggg gmääg
UEäg ämg
6 ¤ 2 M 5
MO 0 M ns Qäu
vZ
U Ü
.II
m‘O
¤"
N"J"‘
Q:> E <:
g['*
¢ V}gc, g 6 6 =~¤ <:ns 0Eäw >
A 127
average was however, slightly greater than the White mean (2.598H to
„ 2.5769 respectively). Both groups were in the"C”
range of teacher
evaluated academic performance.
Prediction of Academic Performance
Accuracy of prediction of current academic functioning, as
measured by the students' QCAs, was determined by means of regression
equations using the standardized aptitude (SATV; SATM; SATCOMB) and
intelligence tests (PPVT; WAIS-RFS; WAIS-RV; WAIS—RP), as well as the
bias—manipulated IQ measures (PPVT-minus bias; PPVT-bias balanced; WAIS-
RFS-minus bias; WAIS-RV-minus bias; WAIS-RP-minus bias) and the
Culturally-Levelled IQs as predictor variables. In Table 16 are
presented the results of these manipulations, plus the results of the
Level-II learning task (BCT) regressed on QCA.
The IQ measures labelled "bias removed" in Table 16 (WAIS-RFS;
WAIS-RV; WAIS—RP; PPVT) were created by equalizing all subjects'
performances on each biased item. This was accomplished by the
arbitrary assignment of the maximum score receivable on these questions
to all testees, thereby eliminating the differential describing the
groups.
The "bias balanced" PPVT in Table 16 was formed by equalizing the
bias items in the same fashion as described above for the "blas
removed" schedule except that pairs of items assumed to measure
equivalent difficulty were retained in their originality. This method
allowed for equivalence in number and difficulty of Black and White
biased items. On the PPVT this entailed the retention of questions

128
' cnmmcnm In· 2222222 2 2 z 2 2 2 2 2 E2cn
Q1 0~¤~¤m0NA N w 0 co co A Ih G Ol-O*1 N~¤0~¤In•-4In A A M 0 0 Q G ¤-4 MG§"" Q°°°f'TQ'T'T Q Q Q Q "1 Q Q Q QQvz NANNAN~o N N N Io N A A A AGu21
· [-4I-4ä 0o¤NIn~0w 0 N Io G In oo A A GNN G\¢¤Qlh<'1I-HN I-0 Q Q 0*1 M N N N NO$-4 QGGGGGA G G G A A A A A NO
Auggg -kQ mmmcn cn cn cn ux va cn rn ua mm:2:0 tx-RZZZZ Z Z Z Z Z Z Z Z ZZQ••-4 cnI-IQ HII-‘•9|
äwa-I •-;Gm¢*I~¤m•·-IN w -4 Ih M Q A -4 0 MGIvo coGAA~oAN G co ~¤ Ih N Q N Q ~¤GES «>"' Q"QQQ"1Q Q "i Q Q Q Q Q Q 'TQ-•-42-0¤'IQGGGG G G G G G A A A AGcn M -4
SS QE5 E ;•¤
NQ¤o¤-4NQ«-4 G ~o N N A In_N N NO*4-Im N ¢'¤¤—4¢"IO•-IOO O O O O O GN Q O GNO •-4IDOU I- NMAGGGG G G G G G N N cn NO Gg-| Q••••••• • • • • • • • • ••
Q.ISSE ‘
*3.-*78 I IL[-sw}-4 - mmmcn cn cn cn cn co cn mmgg -)¢ZZZZ Z Z Z -l¢ -1< Z Z Z ZZ \Qätlg [-4
S QSman A o 40 N N Ih 0 A QQ ~m·¤ gnu--In~o¢•‘•NNAG m A N N Q 0 Q 0 A~oS3 m QQQQQQQ 'T Q Q "I Q Q Q "1 Q"!"an--I 0G~oAAAm A A G Q Q A A A A9 n.wu A A
nän- .A xq_‘<l < _kOU-I ~¤0NGAmG N Q G G 0 ~¤ G 0 QN Ih0 N GANNNAQ N N A In Q 0 G 00 GG G3-
"‘"!"1QQQQQ Q Q Q Q Q Q **1 Q "IQ 'Aw 4gg
Q-
I-IGI A A QA A A tuS E E SCr-1 [:1 40-II-I Q A A ·•-II'¤ O I - I Q> > >-4 >4 coG G O G A A ·-II-I >Q- E E A> Q- A InO cnnänä cn ¢0‘-Iéßä nä Q4-* kann F=•nä§> Q- nä n¤F=• I I Ou >EMU’.I¢D nä nä nd Maca-1mA QS SSSSZS Swémémpmamégäéäéüä n2 :2“:==ä:E:E:E2§2§:6= = 222 „n- In 2 ¤•2 2 2 ¤- ¤- 2 n- ¤¤ 2

n 129 "
.#112 (White biased) and #113 (Black biased) in their original state.
It was impossible to balance the bias on the Wechsler scale in this
fashion because of the non-equivalent locations of the sub-populations'
biased items. Therefore, "biased removed" WAIS-R IQs were not
constructable for this particular sample of adults. ”Culturally-
levelled" measures in Table 16 were formulated by regression of the
standard index on the current college performance and then entering the
five social-cultural variables (Grubb, 1983) previously found to be
significant cultural carriers as a second step in the overall
equation. These five socio-cultural variables, and their acceptance as
significant socio-cultural factors was discussed in the original study
(study-1).
The five variables that appeared most often in the ...regression equations were selected to be used inanalyses of covariance of the seven dependentperformance measures. They were (with number ofappearances in the seven regression equations given inparentheses): varied social experience (6); dwellingcondition of parental home (5); father's occupationallevel (5); parental attitude toward formal education(5); and parental supervision and intervention in ‘the
. subject's childhood (5). The other four socio-culturalvariables appeared in three or less of the regressionequations (Grubb, 1983; p. 79).
Finally it should be noted that all originally identified biased
items were used in calculating the above described "manipulated"
scores. The reason for such liberality has been discussed previously
herein under the rubric of difficulty in bias identification (i.e., the
difficulty of group item-bias identification in samples numbering less
than thousands).

‘ 130
I Table 16 shows that of the 13 IQ measures, only the standard PPVT,‘
TPVT-bias removed, and PPVT—bias balanced indicies were useful
predictors of student college performance. For the total sample and
White group, both the bias-manipulated scales were able to predict
performance in school at the 95% level of confidence. Still, only 13%
of the White group variance could be accounted for by either of these
artificially created tests (slightly more than the variance accounted
for by the standardized PPVT). None of the IQ measures (standard,
bias-removed, or bias—balanced) were useful in the prediction of Black
scholastic performance.
For the Black group of students, the SAT and its two factors were
found to be adequate predictors of collegiate functioning. The verbal
section of the SAT was accountable for almost 1ß% of the Black group's
variance in grades, being significant at a p_value less than 0.001.
The SAT—combined (pf.01) and SAT-math scores (pf.05) were less
predictive but still statistically relevant (thus making the SAT scores
reliable indicators of the total sample's university academic test
tapped abilities). No other reliable predictors were found.
One further analysis using constructed measures was performed. A
culturally-levelled measure of the PPVT was formed using the five
social-cultural variables found most influential in differentiating
Black and White groups. The reasoning for this secondary analysis is
described in Study-I (Grubb, 1983):
Since the five "overall" most heavily· weighted socio-cultural variables: (1) varied social experience, (2)
dwelling conditions, (3) father's occupation, (M)V parental attitude toward education, and (5) parental
supervision/intervention, were able to account for the
· 131
l_ racial group differences in all three WAIS-R measures
· _ but...(not) the White over Black difference on the PPVT
V IQ. ...the following...post-hoc ana1ys(i)s (was)‘undertaken... (A)n analysis of covariance was performedon the PPVT using the five most heavily weighted socio-cultural variables determined by its individualregression equation: (1) father's presence; (2) variedsocial experience; (3) family income; (Ä) dwellingcondition; and (5) father's occupational level. ...The F-
value for the main—effect of race, while stillsignificant, F=N.O39 (p=.O¤8), is reduced from itsprevious level of significance (p. 81-82).
Results of this specific culturally-levelled PPVT IQ when
regressed on QCA are presented in Table 17. The culturally-levelled IQ
performs a, more accurate reading of White testee school performance
( E_ :3.57; g_ <.01) than any of the previously comented on
achievement, intellectual, or performance measures (refer back to Table
16). Over a third of all the White group variance on the QCA can be
accounted for by the underlying construct measured by this new adjusted
reading of intelligence.
Black performance on university based testing is little correlated
with this specifically created predictor however; even less so than its
weak relationship with the culturally-levelled PPVT IQ based on general
socio-cultural variables presented in Table 16. Still, 2¤$ of the
Black group's variance is accounted for by the use of this measure in
the regression equation. It should also be noted that for the Black
population the degrees of freedom were 6 and 25 compared to the White
group's df;6/H1. More on this effect of g_will be presented later.

132
3•K
SQ_xv
L2•
'¥gg,
0 0-SQ Q\
«1"Q'5=·¤ Q
· 3
uf. V2
°° H36
ä „ Q
U--1H
<r4-lu
Q°° V
111Q
°¤-
U
nä
\eu
-1:
.¤,Q
3
“äE
·
LSEä
¤¤"
1~u •·:
1-*
-1,24g
Q °‘
GJ;-LJua
1-4°ä"’3Üc
Q
E-1äH<:
\—rU
D PJ
Q •,.4
cl}Ü
I q;3¤
”"<n°
QDä1°¤I
T6
1-«"‘‘
Q1°°P
oo¤
‘”:>0
:~xQ
na
.wä
FN
H
o'UQ
gg
I
:~1 Z
SH
r-1N
""==% 2] “
"fman$21-1

‘ 133
_ Study-III
Replication of Study-I
Untreated IQ and performance data. Analysis of variance
(ANOVAs) were performed on each of the measures of IQ (PPVT, WAIS-RV,
WAIS—RP, and WAIS—RFS) and the level—II intellectual learning task
(BCT). Initially, three-way ANOVAS (race of subject X sex of subject X
race of examiner) were run on each of the five dependent measures.Q
Table 18 shows the various means of the different racial and8
sexual groups, and the grand means for the PPVT, WAIS-R Verbal, WAIS-R
Performance, and WAIS-R Full Scale IQ scores. Also listed are the
means of the raw scores of the same categories on the BCT (error
scores) and the racial main effects which were determined to have been
significant at the .05 level or above.
Whites as a group outperformed the Blacks on all four dependent
measures of IQ. The significance of the difference in racial means on
the Wechsler scales were as follows: WAIS-R Verbal (p<.05)§ WAIS—R
Performance (p<.01); and WAIS-R Full Scale (p<.001). The
significance of the racial mean comparisons on the WAIS-R Performance
and Full Scale IQs (_p<.01) was greater than observed in the original
study and more in line with the typical literature report. Although
the WAIS-R Verbal group difference was only significant to the _g_<.05
level of significance, the actual probability value was .01¤ and the V
‘ difference in IQ points was 5.2 (more on the significance of these
differences in results of Study—I and -III will be presented in the
discussion section).

134
- rx r\1 1 2 2 2_ pg v xr
. LD E1 N In QZ U <1· Ih N -
- pg • • •-
Z Q IN GN —U)ä
N N NIJ
E1 3: „ •)¢ =Z
‘ „ ‘ ·)¢ ·)<klU) Ih Q IDG Q ING Ih In
<l' Q 1-hu-1 O \¤\0 Q QQ} gg] [gg • • •• • •• • •
U Q4 Ih 1-1 1hQ G'1 1—|\0 Q N[:1 1-1 1-1 e-1O 1-1 N1-1 rdQ 1-1 1-1 1-de-I F1 F11-1 ed F1
„,.g .*1-I-1-I
‘-
¤ · m -bu E-1 nä ‘
^•1·-I U1 I- . U} U}mu - 1*::1 cn - Z Z
u - E1 1-1 ·. ·1< » -1< v*1-10 4 - ·)< ·kQ-1-1 . G' 3 Q Q LH!-h I-O Ih!-H G Ih_¤
1 I-I Ih Ih OSQ N \0Q Q Qpg; gg • • •• • •• • •„-g
wm ed rx O4 In 1h<t M mc> 1-1 Q 1-1c 1-1 1-1-1 1-1 OO
:1)*461 1-1 ed 1-11-1 1-I 1-1•-1 1-1 1-1•
qu - V2 S3
I °‘nä - §
0 •~ g · ·)¢ ·)¢ § 3:1-1 GU-IQ - Q Q G!-H IN IDG Q Q,¤ >
N In I~<l' oo Nlh <t mx¤
Q I II I II I I
E1 OI-lv Ih N I-hdä I\ 1-14* Q •-11-1HU
‘ 1 1-I 1-1 •-IO ed Ned 1-1 edGQ4) 1-1 1-I 1-lr! 1-I e-led 1-1
1-I•
'·I-I
edc . _ CL
NN . r‘
VJ U}
1-1*-1-1· 3: InNO E Q 1-H OG G Ihlh Q QG4.1 Q M 1-no oo 1—1<r 10 1n•Q ß„g • • •p • •• • •
:-1 o ~o mm m ~o1-1 m oV1 N 1-1 v-11-1 N NN 1-1 N
II-1 1-1 e-1 1-11-1 1-I 1-11-d 1-1 1·—1¤1
O 'K
W
¤
. .
N \
rx2 UZZ-„.—Z ..——.pZ-.-——.„..N
0
*4-Iä BJ
V H
E 1-T äU cn qu;
U)BJ Id 1
[-1 cn :014 0:1-1 cncO va rw: cn 1::1 Fr-'IO::1 1-1 Z FJ 1:1 1-1 cn 1-11:*1 gg. 0 gvä O :1 :1: cncn E—1 1=¤ :3 r=•Z

135
. All three of the WAIS-R scales indicated a significant Examiner
effect on the three—way ANOVAs (p_<.01). Table 19 contains a
breakdown of group performing on the WAIS-R Full Scale by race of
subject (RACES) by sex of subject (SEXS) by race of examiner (RACEX).
In all the other WAIS-R scales (Verbal and Performance), the same
pattern emerged; the White examiner obtained consistently higher
measured performance from all subjects regardless of race or sex (this
of course posed no interpretative problems for the race of subject
differences). On the WAIS-R Verbal and WAIS-R Full Scale, a third main
effect was evident, sex of subject. Table 19 also describes the cause
of this significant sexual difference at the 99% confidence level;
males outperformed females in both racial categories. No two-way nor
three-way interactions were noted on the Wechsler scales.
l
On the PPVT, Whites also outperformed Blacks (p_<.001) but there
was a higher order effect, race of subject by sex of subject (_p_<.05),
which disallowed valid interpretation of the main effect of race
(especially since there is no recorded significant sexual-difference
main. effect.) Table 20 displays the complete results of the ANOVA with
levels of significance marked. Table 21 shows a breakdown of group
performance on the PPVT by race of subject by sex of subject by race of
examiner. The ordering of racial/sexual groups on this measure is
clearly: (1) White males G:-:126.15); (2) White females (§=121.*15);
(3) Black females (1?=119.60); and (Z1) Black males (£113•1Ü)• It 1s
also obvious from Table 21 that nearly all of the racial group
differences on the Peabody is accounted for by male differences. The
mean differences between White and Black males equals 13.05 IQ points

136
1 1^ ^^^8 888 88·88 888V wwww www wwww www
0M Ö<I‘I\rI I~I~0~ Gxmn-401 w•—¢•~UM
lh®G•·-•4Gw OG:-iw GHGGG N«—•G«-• c~G<D
Gr~•-•¢¤mv-•G¢¤N
¤nOwc\ m4r~gN•-4 •-••-•«-•
N G Mm ¤nGlngg wr~4-¤~o •-•¤nm4 c4G an-•r~4 ¤o|~¤o ·M dälne-4w N<tN r~•—l0\<!' •-«GI~I Olli DOG OOOI QDI
•—4 •-• •-• ¤·-••-• 1
O O OOO OOOO OOOgg gogo OOO I-HOOO OOG0 0•n NI-OOO OOO I~v1OO OOOcz E4covncu-•-2In •-•¤h0~¤—• QMN c\¤-•r~¤h Gßln -“ ”‘
SSSS SSS SSSS SES0 r·* ‘«-1D
O OO OOO OOOO OOO8.ogoo OOO OQOO OOO -Q- 45.; K/JO OOOO OOQ OOOO OCC ^0% ..¤ US5; Q OOOQ OOO OOCEQ
U) G Mu-4cxN N¢*10~ M•—·•<|'r~ NNV3 '•"0 GMN
Q N 4mcN —•c•-« z~4·—•N MON,.¤ 0 Em; cxHW coH G gg,N
° momo°*" O •„U v-I
IM°· ät:‘”
u‘··‘<: ·¤ 0 030 0330 030 0
uuu 44004-I uuu •··*eg mau--: ••-I¤¤••-I~•-I¤¤••·4 •¤-I0~•-I M00Q MMM M MM M
gg •-•
,)g G)
·§«-••-•«-•N N•—•N N-·•«·-1N Ne-1N Fgmu: ><o ;'
u M
ug ::1 ¤·•-IGe$-10 O '¤¤¤·¤ ¤. W
NN NN ¤>G0 MW I3-‘||Z:'| 0G0 0: UO OU UO OO 0O3So Su méé mäé mäé méä Sum ,¤¤ :*3 >< >< :4 W0.:: mw ua :::1 :1::::1 ::1
4-•u ·•-•
num cn lirlltß cn O:2 ää ° ° E"O >F¤

137 . .
1 ·‘ Table 20.
.. M - Analysis ofVariancePPVT
Peabody Picture Vocabulary Testby RACEX Race of Examiner
RACES Race of Subject.. ...SEXS,.Sgx.Source
of variationSS df MS F P
Main effects 1422.700 3 474.233 4.937 0.004RACEX 296.450 1 296.450 3.086 0.083 .RACES 1110.050 1 1110.050 11.557 0.001***SEXS 16.200 1 16.200 0.169 0.683
2-way iuteractions 757.450 3 252.583 2.629 0.057RACEX RACES 130.050 1 130.050 1.354 0.248RACEX SEXS 0.200 1 0.200 0.002 0.964
RACES SEXS 627.200 l 627.200 °6.530 0.013*
3-way iuteractious 9.800 1 9.800 0.102 0.750RACEX RACES SEXS 9.800 1 9.800 0.102 0.750
Explained 2189.950 7 312.850 3.257 0.005
Residual 6915.600 72 96.050
Total ... .. . M 9105.550.- .79 .Mll5.260..p
4 .05* / p4 .01**/ p< .001***

138
‘ A AAAA AAA AAAA AAAZ O OOOO OOO OOOO OOO
0 ,-4 ¤\b~<D<|' •-4QI~ 64000 !\O•-4U O •—40kb <I‘OOO MO4—•G 0 c~4nOONH
In MMOO Y\NkD ,-4NOO MOw
3 S GZSZ! °"3‘*°"‘°°" 22;*
> Ch NOkbM Mvhkb ,-4 cxln NOM0 Ih chßkbbk OMCD OOOO <I'OMQ M I-h<!'¤\O wG~M kb:-4<l'G\ I~N0
U I~IIIII II I I II III
JJ c Qccc c~—40 cs•oooo OOO:0 ,-4 ,-4,-4,-4,-4 ,-4 ¤) u-lr-In-4
0G G OOOO OOO OOOO OOO0 ¤I O OOOO OOO OOOO OOO
0 In I-OOOO OOO OIHOO IHOOJ; Z I~ M:-4NO 0,-4-4 ®r4¤-IN <fNI~
I IIII I I I III I III
,-4 O kbMOkb b4kbM Mkblhß «-4:-4¤-4D N ¤-4•—4¤—4¤—4 1-44-4N NNNN NNN8. :-4 ,-4,-·4¤4,-4 «—4«-·4«-• F4:-4r-In-4 F4--4•—4¤•
11*, 3U: E O OOOO OOO OOO OO
0 5 O OOOO OOO OOOO OOO«-4 *%-4 U1 O OOOO OOO OOOO OOO,„£ O O OOOO OOO OOOO OOO
I IIII II I IIII III
E-4 G kb <I'NNO Ned:-4 NM,-4N ¤\NI~O O lÜ*°G\9 0\kbM ¤hN¤nI~ N•—4«-4
·•-4 kb kbN«-4«-4 M¤—4N G\l!1NN ¢NNJ;. Gx <I'N•-4,-4 Nav-4 <I'N¤-4:-4 N:-4,-4·«-4
3 1,*3 *3Q --4 .2.2.20 020 0.2.20 0.20
' UUQJJ JJOJJ JJUUJJ JJUJJ2-,* 333** **3.%* **33** **3**
-4 ¤¤E¤¤§ éßlßéßlmé:3
Cf}Erl 0
-8 •-4,-4,-4N N,-4N N,-4,-4N N:-4Nmämé <.>
G
O
II2 zä 2. „. 2> NN 4¤
G 0 ::1::1 uu uu 0G0 H UO UO UOx 0 U1 U1-,-4o _ ,-4 JJ :1: cn >< >< ,-4HH 2 .¤ cz >< gi Erl Erl eu0,b · 0 0 :/)::1 mm rn JJJJ Erl:/J U) Erl OU 0 :-4O > FH

1 139(1 standard-deviation) while the difference between Black and White
females equals 1.85 IQ points (chance level). No other significant
main effects or interactions were noted. A separate t_-test of
racial differences on the PPVT, run as part of other analyses to be
described later did confirm_ a significant racial group difference
(p§.01), but it is apparent that the difference is a racial/sexual
one in this sample of subjects (unlike the clear main effect of race
uncovered in the original study — Study I).
Subjects of both races and sexes scored equivalently on the one
learning/performance test retained in this study, the Booklet Category
Test (BCT). No main effects reached a level of significance, nor were
there any significant higher order interactions. Blacks scored fewer
errors (Eé27.55) than Whites (§é29.28) on this measure of Level-II
learning ability but the p_ value of the difference was less than
chance (.657).
Regression of the socio-cultural variables. Regression .
equations were run on the five intelligence and performance measures
(as ln Study-I), using the twenty—two new socio-cultural variables, a
bi-cultural score, and a Cultural-Distance index (total score) derived-
from the PDQ—R (see Appendix H, the formula for calculating the twenty-
four variables is included at the end of the PDQ-R). The five socio-
cultural variables weighing most heavily on score performance for the
total 80 subject pool on each dependent measure, in their order of
loading were: (1) PPVT; parental level of education, religiosity,
friendship patterns, varied social exposure, and emotional vitality;
(2) WAIS-RV; religiosity, parental level of education,
140
resilience/revitalization, emotional vitality, and father's presence in
the home; (3)_WAIS-RP; family make-up, Cultural-Distance index, shared ‘
participatory space, father/father-substitute presence in the home,
andfatherpresence in the home; (N) WAIS-R FS; religiosity, family make-
up, friendship patterns, parental level of education, and shared
participatory space; (5) BCT; time perspective, parental
supervision/intervention in child's life, Cultural—Distance index,
number of siblings, and father/father-substitute presence in the home
(see Table 22).
The five variables that appeared most often in the above described
regression equations were selected to be used in analyses of covariance
of the five dependent performance measures. The number of variables
entered into the analyses of covariance was limited to five in order to
allow for 15 subjects per variable (a conservative statistical
manipulation). The six variables (two variables tied for fifth place)
occupying the five most numerous appearances were (with number of
appearances in the five regression equations given in parentheses): ·
emotional vitality (M); religiosity (3); father's presence in the home
(3); parental educational level (3); friendship patterns (2); and
shared space (2). The other socio-cultural variables appeared in one
or none of the regression equations.
When the original analyses of variance were rerun, this time as
analyses of covariance, partialling out the effects of the five most
heavily weighted socio-cultural factors (the fifth variable was chosen V
for each ANCOVA based on its appearance in the previously obtained
regression analyses of the dependent measures) from the race and sex

141
.Ä\G
-1 0 GO .> c-,-1 „¤-,-1 -,-1-1- 1 5-1-1 0G ,-10 0 00
E 0 -,-10 00 on ¤00 Z> 1-G G 1-11:*,1:1:1 Q, 1-1 :10 -,-1 00- 00 00 uu ,-1 ,1:0
E1- :1,1- ,-0 .¤ 1-0· -,-10 GG :1--1 -,-1 01-Hm mr-1 un ur, zum
E?lk'! ¤,,-1 gf -,-1 :1M3 ,O .1:0 ,-101 m 0G 0-1mm >«:1 *01- uu ·¤>~, 1-1 ¤¤ ,-, 1:0 ä0 00,-1 <:,-1 : -,-10 01- 0 1-0
T' SS ·» 22 T‘2 2-2 22.nu M mz num mnr:1 mmM ÄQ
_.
3,.1: ,¤S21? Tg .i•,, 2,, ,,,,ban:-'1-1-1 nn ¤, 00 · IU -0G 0 1-1 >,¤ 1-G *0 HG 1-G-,-11-1-10 <:O ,-11 :30 00 00 00,::o••—, 3::, -,-10 uu 1-0 ,::0 ,::0B0 ..¤ M Ex ,-0 00 1-0 1.10··-10:1 Bl _00 :1••-1 ,1:21:, 01- NI-1ggm m mz UQ mm Fam num
—,-1,-1 Ü 1 Ä0:--1 . ·1l!N< ,
N ,-1:1vN
,¤¤‘G0h-10 O0 -,-1 0 -,-1
~ ss; ä zu7% >~,-1,,, cu,-1*··‘
ss ou ,-,H 00 1<: °*
,-10 G-1 0>~, 00,-100 1:/nä 2 0-,-1 0,-1 qu -000:: 1-1 uu -,-10 0-,-1 HGI-15-1 4:11:1
°°G0 ,-u -,-1,-1 00:11:01-1 3> "" 00 -,-1-,-1 -00 .:0
:,25 T? 23 22 °2 23:1 ·¤ M mm mm :E:> mn-2,22ÄO4-1O,
Ä
*:,*,:8O-,-1 >_Äcn U ch0 1:: *·" -,-1 ,-1:> ,-1o
3 .1:0 • 0:>~.T2 1 E ST2 —· °°E -,,,5 82m 1:0
°°-20 0 -,-1,-
0 m 00 *0 0,., ·,-1- um12 22 T? T22 23 °2mm M r-,¤, :>m :E:>
Ä 0
¤ NO ,-1 N M Q' InÄ
1-0>

’142
. coefficients, the significant difference between the racial groups was
found to be non-reliable on the WAIS-R Verbal Scale (Table 23). The
main effect of examiner (since there was only one examiner of each
race, the effect may have been individually based rather than racial)
and sex of subject remained unchanged from the original ANCOVA (see
previous section for discussion of the cause of these differences).
The ANCOVA investigation of the WAIS-RP and WAIS-R Full Scale
measures did not reduce the group responding differences to below
significance levels. Table 2*4 displays the levels of significance
between the two racial groups prior to and after "culturally-level1ing”
the various intellectual/performance measures. The 2 value
associated with the Black-White difference on the WAIS-R Performance
scale was basically unchanged before and after covarying out the effect
of the five most heavily weighted socio-cultural variables (2:.002
before; 2:.00*4 after). The holding constant of the same socio-
cultural variables across race on the WAIS-R Full Scale did reduce the
level of significance from the 99.9% level of confidence (2:.000) to
the 95% level after manipulation (2:.019), but most of the variance
remained unaccounted for still.
Using the 2-test data on the racial performance difference as
a baseline, analyses of covariance was run on the PPVT to: (1)
determine if the racial difference could be accounted for through
cultural-distance and (2) determine if the race of subject x sex of
subject effect could in like manner be explained. Results of such
statistical manipulation proved useless. The race of subject by sex of
subject stat1stical difference remained (2<.O5) as well as the

143
4Table 23
Analysis of Variance
WAISRVby RACEX '
RACESSEXS
with EMOT Emotional VitalityRELIG ReligiousityDADPRES Father's Presence
' PARED - Parental EducationSPACE Shared Space
Sum of Mean SignifSource of Variation Squares df Square F of F
Covariates 2830.386 5 566.077 8.263 0.000EMDT 233.595 1 233.595 3.410 0.069RELIG 1183.356 1 1183.356 17.274 0.000DADPRES 175.723 1 175.723 2.565 0.114PARED 719.919 1 719.919 10.509 0.002SPACE 59.005 1 59.005 0.861 0.357
Main effects 1744.339 3 581.446 8.488 0.000RACEX 1051.814 1 1051.814 15.354 0.000**RACES 42.897 1 42.897 0.626 0.432SEXS 557.922 1 557.922 8.144 0.006**
2-way interactions 189.009 3 63.003 0.920 0.436RACEX RACES 138.351 1 138.351 2.020 0.160RACEX SEXS 1.764 1 1.764 0.026 0.873RACES SEXS 51.176 1 51.176 0.747 0.390
3-way interactions 150.395 1 150.395 2.195 0.143RACEX RACES SEXS 150.395 1 150.395 2.195 0.143
Explained 14914.129 12 409.511 5.978 0.000
Residual 4589.820 67 68.505
Total 9503.950 - 79 120.303
p (.05* / p4 .01**/ pé .001***

1/+4Y
I I I
· III I IY0 I I
,:I-! I I‘4-II-I I I~I-IO I IBU I INQ I I
I I|·I I I
Q es I A A Izu In I In In I¤ Z I Z Z I
:3 " I " " Iaa>I-I I-I I Ih Ih I
>~I 00 I~ I IO I-I II-¤ ITIIH O : I-! O :'EII SS
°‘I
"‘ "’I
GO I-Ia! II I Il Il II
”-hgEE In I In In
IEo OmIvcnu II-I:}IJ G
04:wwIna-II:wu
GU ^¤• ·¤ I U3:3.I:I-I Z253 I5 II " I2 IU3 :>«I-I <I· Io I-IFIIn
I-I oo N I~ <I·I-I••¤J I-I-c IN I IO In <r¤r\I·-! NU
• • • • I-!·I-I.x,¤ I-II-I In 0 c~ Io 0oow :II-I 0I¤I¤·I-I um Il II II II • ’
<I· ME: gä In Y In In InN oH> UI-1 Z.0 III I-I III-!>I¤ "’
· \,¤ Ivou I IIu .¤ ¤IHI-Iso I\ I ,8 MIIE II ‘~
I I, IIä: I RXIS I ä I I VI-I > I-I
In‘4 • oo 0 cI NIIIIIII: III ~I In In co I-• N II-“°ä‘”‘“
EI:‘ ‘I I' 6 6 I4 6
bb III I-! I-!O--II: ·•-I ll Iu II II II II ·I=I:I-III I-I £I InI¤¤¤ 0 In I In In In In 0
II-I¤-III‘
V-I-IO:}
‘I: u
‘„n.I.
3I-44 -,4III ev II-Iä ä EIJ In ao
In ·I-I§ II:
E I De I 2·¤ ns ns ns IIG I I I0 In In In rxIT Ile E 2 2 S 2I: In 3 3 3 In v

Y145
juninterpretable subject racial group main effect (although at a reduced
confldence level, £<.os> .
At this point it seemed as if the results of Study-III were
dissimilar from those of Study I. A review of the methodologies of the
two studies could produce only three differences, and two of those were
planned in advance. One, the number of investigators was reduced from
four (2 Black and 2 White) to two (1 Black and 1 White) because no
tester-testee racial interactional effects were noted in the original
study. This also proved to be the case in the present study so this
possible source of confounding was eliminated. Secondly, the number of
Black and White subjects was different in the two studies: in Study-I
there were 748 White (274 males, 274 females) and 32 Black (16 males, 16
females) subjects, while Study-III enlisted 740 White (20 males, 20
females) and 740 Black (20 males, 20 females) subjects. Theoretically
this was a design improvement and would not, per se, change the outcome.
One aspect of. the equalization of racial numbers did however have
an unforseen effect on the outcome performance measures: length of
time7in
college. All but a very few of the subjects in the original
study were recruited from "Introduction to Psychology" classes as part
of the general "subject pool" of the university. Because of this
technique, fewer Black than White subjects were obtained and nearly all
the students were freshmen (Black and White). In Study-III more
assertive recruitment of Black subjects was undertaken, specifically to
increase the number of minority subjects and equalize the size of the
samples; which was done. Blacks were actively recruited from upper
level undergraduate courses (1.e., a Senior Seminar on Black

146
·Psychology, Motivation of Behavior, Psychology of Learning, and other
courses) and included in the study, whereas most of the White subjects
were again freshmen enrolled in "Introduction to Psychology" sections.
T-test analyses were run on all the subject variables collected
and two related demographic variables indicated the groups to be non-
equivalent. The class standing and the years in college differentiated
Blacks from Whites, as indicated in Table 25, to the _p§.O1 level.
Blacks were reliably more likely to have been upperclassmen at the time
of testing than their White counterparts. When the effect of years in
college was statistically held constant, as had been done in the
earlier study through selection methods, the racial differences on all
assessment devices were now reduced to non-significance through the
process of cultural-levelling (refer back to Table 24). No higher
order effects were noted in the new ANCOVAs. Thus, be removing
differences in years in college (class standing) between the two sub-
groups, the 5 socio-cultural variables listed above were able to
account for the racial-groups' IQ performance differences.
Replication of Study-II
Sub—score scatter on the WAIS-R. Calculation of racial group
performance differences using E-tests was completed on each sub-test
of the standard WAIS-R. Whites significantly outperformed Blacks on
two of the eleven sub-tests (Block Design and Object Assembly) while
Blacks were not significantly superior to Whites on any subtests.
Table 26 and Figure 5 demonstrate the various sub-score patterns for
the two racial groups and the total sample.
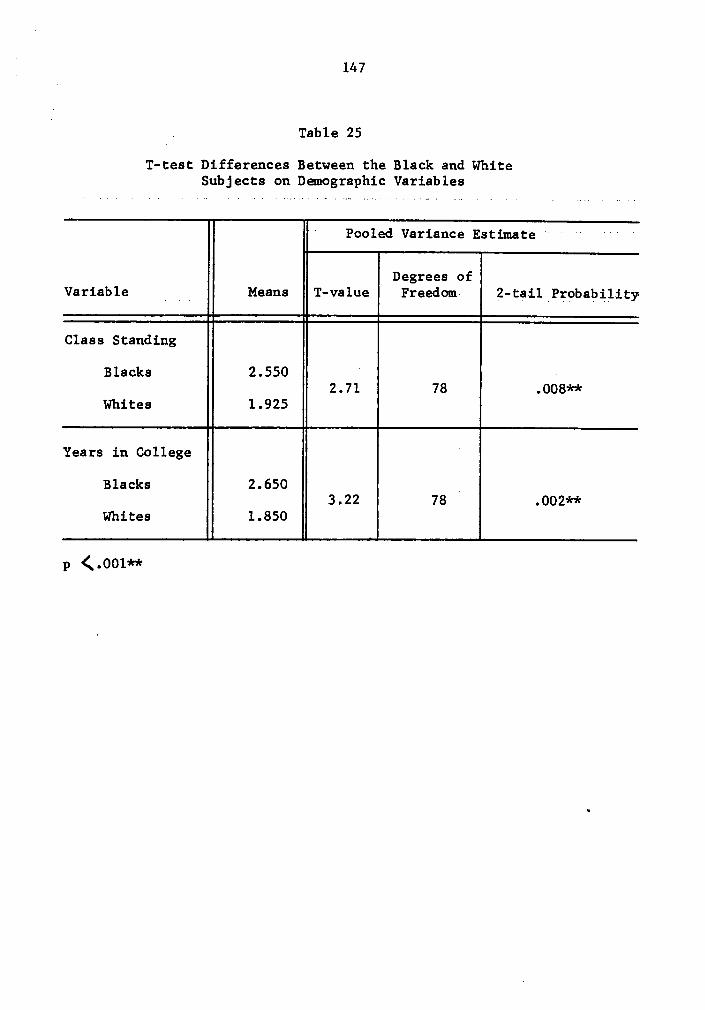
1 147
A 1. Table 25
T-test Differences Between the Black and WhiteSubjects on Demographic Variables
|‘ Pooled Variance Estimate‘“" ‘ ""“
Degrees ofVariable _ 1_ _ Means T-value Freedom _ 2-tai1_Probabllity
Claas Standing
Blacks 2.550 V2.71 78 .008**
Whites 1.925
Years in College °
Blacks 2.6503.22 78 .002**
Whites 1.850
p < .0o1==··~=

l 148
T-test Oomparisons of the Black and White groups onthe WAIS-R Sub—sca1es
GROUP 1 - RACES EQ 1. Blackl
GROUP 2 - RACES EQ 2. White ·
Variable N Mean Standard Standard T df 2-tail‘ Degataog E;;or Value Qgb,
I GROUP 1 40 10.8500 1.955 0.309GROUP 2 gg 11,222g 1,281 g,212 -g,82 18 ,221
DS GROUP 1 407 10.9250 2.336 0.369GROUP 2 gg 11,22gO 2,g2g g,282 -g,@ 18 ,g28
V GROUP 1 40 11.1250 2.028 0.321GROUP 2 gg 11,§120 2,212 g,22g -1,18 12 ,22g
A GROUP 1 40 10.8250 1.866 0.295GROUP 2 gg 11,§2@
’]„,2§g,212 -1,22 18 ,g22
C GROUP 1 40 13.0750 2.390 0.378GROUP 2 gg 12,1000 2,121 g,22§ 0,jy, 18 ,g§1
S GROUP 1 40 11.8750 2.198 0.347G@§ 2 gg 12,QQ 2,12§ g,228 -g,2g 18 ,@
PC GROUP 1 40 10.5750 2.308 0.365GROUP 2 gg 1g,22@ 1,2§1 0,21g —g,18 18 ,g2§
PA · GROUP 1 40 11.2750 2.460 0.389GROUP 2 gg 11,22Q 1,216 0.202 -0,12 7*18 ,§12
BD GROUP 1R40
11.2750 2.276 0.360GROUP 2 gg 12,QQ 2,g2§ 0,222 -2,ß 18 ,gg8**
OA GROUP 1 40 10.0000 2.651 0.419GROUP 2 gg 11,1220 2,§_g1 g,gg2 -2,82 18 ,g0§**
DSYM GROUP 1 440 12.4500 2.521 0.399GROUP 2 gg 12,2gOO 2,g62· g,2§2 g,21 18 ,188
B 4.05*7 p ( .01**

'149
V I
V
ij{•
Q‘·
1;“‘
Ill
__I
[0V
,_'°
I WIXIKÄI^' ·—
IIÄZI

„ 150
,It can be readily seen (Figure 5) that the racial group ~
lperformances follow the same proportional pattern with minor movement
discrepencies in the Picture Arrangement (PA) area of the histographic
representation (similar to that found in Study-II, yet less striking).
A difference between the Black and White samples in Study-III from
those in Study—II is that Blacks scored significantly different (White
over Black) on the WAIS-R Performance measure in the present study but
equivalently in the previous study, even though fewer performance sub-
tests evidenced a significant group difference. Also, no WAIS-R Verbal
sub-tests significantly predicted racial grouping in Study-III whereas
a significant White performance superiority was noted on the Arithmetic
(A) sub-test in Study-II.
Sub-test performance on the BCT and PDQ-R. The seven sections
of the) Booklet Category Test (BCT) were subjected to E-tests
comparing the group means of the two ethnic groups. Just as in the
above reported intellectual sub-test comparisons, the pooled variance
estimate of the two samples was utilized because of the independence of
group means and the assumption of variance equality. No statistically
significant differences were noted, as described previously, the Black
and White groups were recorded as having equal amounts of Level-II
intelligence measured by the BCT. Very little group-specific
performance scatter was observed, as would be expected.
Table 27 displays the groups' mean responses to the social-
cultural variables surveyed by the Personal Data Questionnaire-Revised
(PDQ-R). The White group scored significantly higher on the measures
of parental educational level (2;,05); family income (p§•05); and

1 151
22.1:1:.21T—test Comparisons of the Black and White groups
on the Personal Dlta Questionnaire-Revised PDQ-R)Variables
GROUP 1 = BLACKSGROUP 2 = WHXTES
POOLED VARIANCE ESTIMATESTANDARD
VARIABLE N *14EAN DEVIATIQI T-VALUE Q: 2·TAIL PROB..
SIBS GRGIP 1 /.0 2.6250 3.372
HOMES GROUP 1 LO 3.8750 7.511GROUP 2 AQ 2·§5Q 2,2gg Q,§ Z§ $22 'FAM GROUP T 40 8.7000 3.646
FRIEND GROUP 1 40 77.6250 81.740GRGIP 1
DADPR GROUP1 15.8500 5.036 ‘GRGIP
ma 3.8250 *10.1../.6 6 PM V. 1GROUP
DAlX)C„ GROUP1 4.8000 1.3631-
GROUP ..
MOM00 GRGIP 3.1.652GROUPPARED GROUP 1 40 11.4250 3.426
p _ es
INCOME GROUP 1 40 7.1750 2.678Q , er
BWEI.L”f.‘1;IGR(lIP 1· 1,0 13.3750 2.519ROUP •
*Table 27 continued on following page)

5152
5 E Table 27- (continued fx·om_p1·evious page)
’.-_ . STANDARD POOLED VARIANCE ESTIMATEVARIABLE N EAN DEVIATION T-VALUE -TAIL
PROBSUPDIT(GROUP 1 40 13.5750 2.510DIOT GRQIP1 40 13.1000 2.898
RELIG GROUP 1 1.0 13.1500 3.378
RESIL GROUP 1 40 9.4500 2.112
PATTE0 GROUP 1 40 31.7500 8.276
WRIT GROUP 1 40 4.1750 1.678GROUP 2 Q g,51Q 2,gQ, Q,g1 15 ,§5§
ORAL GROUP 1 40 3.7250 1.921u
GROUP g gg 5,215g 1,812 Q,§g 1§ ,552BIOULT GRGTP 1 40 6.0500 2.353GROUP g Q §,}5Q ],8§1 -g,§} lg ,552CONECT GRLIIP 1 40 27.6750 5.423GROUP 2 gg 25,25Q 5,511 ],ß 1g ,QZ1TIME ‘
GRGIP1 40 5.6250 3.052GROUP 2 Q §,g5Q 2,§§ Q,§§ 18 ,51] °SPACE GROUP 1 1.0 7.4750 2.689G@§ Q Q 1,}g50 g,g21 g,g1 1§ ,1gQVARSOC GROUP 1 40 13.2750 5.316GROUP 2 Q 13,315g 5,ggg g,8] 18 ,ggQHAND GROUP 1 40 1.3750 0.705GRWP 2 gg ],315g g,ßg g,Q 1g 1,ßpCDTOT SRCIJP 1 40 445.6750 87.556
8 1

153
- dwelling condition of the family home<B‘•O5)•
Further, the Black
group was more religious than the White group ( 2_=2.8¤; _2}.01).
Other differences, though statistically non-significant, can be seen in
Table 27. Black students are more likely to come from larger families
(SIBS) and have closer ties with the members of their family of origin
(CONNECT), while White father's of these subjects have attained higher
occupational status than the fathers of the Black subjects. The
ability to overcome hardships and positive out-look on life (RESIL) and
parental attitude toward formal education (PATTED) also evidence group
specific patterns.
Comparison of Academic and Aptitude Measures. Table 28 displays
the group means, standard deviations, and jyvalue comparisons of the
groups on the students' Virginia Polytechnic Institute and State
University grade point averages (VATQCA), the three Scholastic Aptitude
Test (SAT) indices (Verbal, SATV; Math, SATM; Combined SATCOMB), the
students' high school grade point averages (HSQCA), and the students'
high school standing (HSSTND) as a ratio of their class ranking divided
by the number of graduating seniors. Whites obtained a significant
group performance superiority on the three SAT tests (SATV, 2}.001;
SATM, _2}.O1; SATCOMB, 2}.05) and received significantly better
grades in college (2}.05), although both groups were rated by
teachers as doing "C" level work (Blacks, 2.2ü; Whites, 2.5M). Blacks
and Whites received equivalent grades in high school (HSQCA) (Blacks,
3.26; Whites, 3.3N), both groups being“B”
students. The position of
the subjects in their graduating classes (per unit number of
classmates) was also non-significant for race, Blacks placimg in the

154-
;' =•¤ zu• zu ¤•= zu3 E E äh é R2 22 . 2 . 1 2gn o o °en °
l
2g 3§* E 2 2 2 2 2 2E E
5 5 5 5 5 5goug *8äii *2* *2 2 2 2%S-2* "‘l
1* 9* 1* 9o·¤SS 2Mo°”ä
*2:„ 2. *2 *2 *1 *1 -1*: 2:2·I-•3 O O O2 Q N • ¢"\ Q O • N •
äg m ~o ¤o ¤¤ o N • «-" 1*
8:: :4·•¤° lr-ää 6 - 8 3 8 8 9 § § 8$5 B UN UN •no eu hm 2 ·<v oz ¤o***2 2 "é *6 • ol ci 6 6 VN
N ·U\ 21- ~0 •1- Q*7 VN 0* 1-
1*
2gg Z 3 9 ° 3 ’ 3 9 E2 ° 3 Q2: VSg I- « 1- 1- «1- VF- · 1- Quu Q g ¤• g ¤• ¤• g ä g gä
::2 *‘—~ 2 22 2 2 2 2 222 2 2 222 13ggQg . .
u_
V .222 2 E1 2 2-- 2 2 2 2

1‘ 155
16.8 percentile of their respective classes and Whites placing in the
17.¤ percentile (unreversed peroentiles; i.e., peroentiles from the
top).
Prediction of academic performance. Accuracy of prediction of ·
current academic functioning, as measured by the students' college
QCAs, was determined by means of regression equations using the
standardized aptitude (SATV; SATM; SATCOMB) and
intelligence/performance measures (WAIS-RV; WAIS-RP; WAIS-R FS;
BCT), as well as the Culturally-Levelled IQs as predictor variables.
Other variables utilized as predictors in the same fashion were high
school QCA, high school standing, and the racial identification
questions (both questions (BQ and WQ) for the Black group and the White
Question (WQ) for the White group). In Table 29 are presented the
results of these manipulations. "Bias removed" and “bias balanced” IQs
were not retained from Study-II because of these measures dismal
predictive abilities and the fact (cited in the text) that item bias is
an extremely elusive phenomenom, statistically. "Culturally-levelled"
measures in Table 29 were formulated in the same fashion utilized in
Study—II, however.
Table 29 shows that of the 8 standardized IQ/Performance measures,
all but the WAIS-R Performance measure were useful predictors of
student college performance. This is in disagreement with the results
obtained from Study-II, where only the PPVT was statistically reliable
as a predictor for that sample of undergraduates.
For the total sample in the present study, the WAIS-R Full Scale
and the WAIS—R verbal measures were able to predict performance in

Ä A . 156
‘
ua ° * *
9•
2*
··¤·°f__ F"
„
ä•
Ä ••
°U\
S 0‘
°• A-
C2
2 Z1 2
{• U
:2+‘··*~¤: =+ 2
oa..._____
° ° Ö
3A :2 .—————--..__ Ä
+7 2 2 @2522ää <§ A
1
'°L · .. ,
‘¤•
lt:• QI
25.“‘ Ä
P4; OL L• Ä
‘ ,__ • *
ää·
• '• .°•§
¤ *---2:-•
·•Ä ° ° °
·Ä §
6-• g W
—"———A-_______'
*8% +5 ·
‘“‘·—·——5X
6
2§$2 5% · ·ä 2
gg•
• • Ä ·‘ • •. *'__<
ä 2 'Ä “° ·
• °2Ä v
go 1 ~
Ä ¤•
ä
OL‘
•j
_
1I
_ .
m
• • ' qW
wk —Il\
:3 __°
v
‘=• " “"""———.. ca.0 Q
··——-_____l—-_—__
2 ä Ä 52E
'Ä
8
3 5¤¤· Eää
G
3äzaäéa
5=.¤¤¤ 2
ZS js
ua
¤ ; ==B:3gg=¤§j°;g1=§>
5
p°I°^°'I'T¤·!¤4I¤Oé

157
Oollege at the 95% and 99% levels of confidence, respectively. For
both racial groups, however, none of the WAIS-R scales were useful,
indicating a possible higher—order effect which would limit the
interpretability of the total sample results. Of the IQ measures, only
the PPVT was a valid indicator of academic functioning for the total
sample (_p_<.01) and a racial sub-group (White; p_<.O1). The PPVT,
like the Wechsler scales, still was unable to predict Black school
performance. Finally, the standardized Level-II intelligence
indicator, the BCT, was determined to have predictive validity to the
99% level of confidence with the total sample and White sub-group.
Again no usefulness was 'seen in predicting future Black classroom
behavior.
For this Black group of students, the SAT-V was found to be
an adequate predictor of collegiate functioning (g_<.O5), accounting
for over 17% of the Black group's variance in grades. The SAT-M and
SAT-Combined scales were not found to be significantly relevant in the
Black·sample, but were for predicting the total sample's (g_<.0O1) and
White sample's (_p_<.O01) level of work. The SAT—V was also reliable
when applied to the total (p_<.0O1) and White (_g<.O5) regression
equations.
The "culturally-levelled" IQs increased predictive validity of the
standardized measures in uthose cases where they were already valid
predictors. The WAIS-R Full Scale (when "cu1turally—levelled") became
more able to predict the performance of the total sample when compared
to the standardized WAIS-R FS (change: p_<.05; £2=.O8 to
g< . 001 ; _r;2= . 32) . The WAIS-R Verbal (when "cu1tur'allY—

158
·1evelled") also showed increased ability to account for variance in
Wteacher-rated) performance in the total sample (change: £<.O1;
L2=.O7 to _p_<.O01; £2=•27)• Cultural-levelling of the PPVT
also evidenced increased efficiency over its standardized version for
the total sample of students (change: L<.O1; L2=.11 to p_<.001;
L2 .29), and the White sample (change: L<.05; L2=.10 to
p_<.01; L2=.lI2).
A second effect that cultural-levelling (partialling out the
effects of culture) had on some of the IQ measures, for some of the
subject categories, was to make the instrument a reliable predictor of
college test-tapped behavior where previously the standardized
instrument was found to be statistically useless.
For the Black subjects, the WAIS-R Verbal IQ now became a valid
predictor of college QCA (L<.O1), accounting for almost !t1% of the
variance in the criterion. The White group college functioning was
also validly described by the regression equation utilizing WAIS-R
Verbal as a predictor (L<.01), with an equivalent amount of variance
accounted for (38%) now. The WAIS-R Full Scale also was able to
predict White college performance after being culturally-levelled
(L<.O1; L2-JI1); something the standardized WAIS-R FS was unable
to do.
Regression equations were also calculated to determine how well
group identification could predict school success. Neither the
question assessing identification with the "White middle—class American
value system" (White Question - WQ) nor the question measuring strength

( 159
’of identity with ”the Black—American sub-culture" (Black Question -BQ)
(see Appendix M) showed any correlation to academic functioning in the
total or Black subject pools. The single question administered to the
White students (WQ) was also found to be a non-significant predictor of
college behavior.
Besides the standardized SAT—V and culturally-levelled version of
the WAIS-R Verbal (already described), only the student's high school
grade point average (HSQCA) was a reliable predictor of college grade
point average for all three student groupings (total, 2}.001; Black,
_2}.O1; White, _2}.001). The relative high school graduating
position of the students (HS STANDING) was unable to predict future
Black school performance, but did significantly account for much of the
future White (2}.01) and total sample (2}.001) variability on
college tests and other teacher evaluated projects. No other reliable
predictors were found.
Personality Characteristics and Measured Intelligence
Pearson partial correlational analyses were performed comparing
the five indices of personality assessed by the Gordon Personal Profile
(GPP) (1-Ascendancy, GPPA; 2-Responsibility, GPPR; 3—Emotional
Stability, GPPE; M-Sociability, GPPS; and 5-Self—Esteem GPPSE), and the
measures of intellectual (PPVT, WAIS-RV, WAIS-RP, WAIS—R FS, BCT) and
academic (VATQCA, SATV, SATM, SATCOMB, HSQCA, HSSTND) functioning.
Tables 30 and 31 present the results of these analyses for the
TOTAL subject gvoup. For the PPVT, two GPP scales correlated to a
significant degree with this measure of verbal intelligence; Emotional

V160
‘ .'!a.hl9..3.Q -Relationship of Personality Variables to IQ
PEARSON CORRELATION COEFFICIENTS(rom. SAMPLE)
GPPA GPPR GPPE GPPS GPPSEPPVT ·—0.131? -0.0029 0.2271 -0.207; -0.0161
( 80 ( 80 ( 80) ( 80 ( 80)P: jzz P: gnä P:nQg1* P: nQ32* P: nggn
WAISRV -0.1777 -0.1681 0.1338Ü
-0.1157Y
-0.1023I
( 80) ( 80) ( 80) ( 80) ( 80)P: .057 P: .068 P:.118 P: .153 P: .183
WAISRP -0.1552 -0.2427 _ -0.0888 -0.1517 -0.2537( 80) ( 80) ( 80) ( 80) ( 80)P: .085 P: .015* P: .334 P: .090 P: .0};%* .
WAISRFS -0.1954 -0.21.30 0.0490 -0.1517 -0.2033( 80) ( 80) ( 80) ( 80) ( 80)P: .041* P: .015* P:.333 P: .090 P: .035*
BCT - 0.1263 -0.0264 -0.1151 0.1510 0.0625( 80) ( 80) ( 80) ( 80) ( 80)knjgg P: ngnQ8 P: n155 P=nQQ1 P:ngQ1
(Coefficiont / (Cases) / Significance)
p‘<
.05*/ p < .01**/ p < .001***

161
l V Table 31Relationship of Personality Variables to Academic Assessment
Pearson Correlatiou Coefficients(Total Sample)
VATQCA SATV SATM SATCOM HSQCA HSSTN
GPPA -0.0884 -0.2159 -0.2022 -0.2418 0.0066 -0.0131( 80) ( 80) ( 80) ( 80) ( 80) ( 80)p= .218 p= .027* p= .036* p= .015* p= .477 p= .454
GPPR 0.1850 -0.1039 0.0291 -0.0388 0.0715 -0.0352( 80) ( 80) ( 80) ( 80) ( 80) ( 80)p= .050* p= .180 p= .399 p= .366 p= .264 p= .378
GPPE 0.2615 0.2404 0.2589 0.2899 0.2545 -0.2139( 80) ( 80) ( 80) ( 80) ( 80) ( 80)
p= .010* p= .016* p= .010** p= .005** p= .011* p= .028*‘
GPPS -0.1356 -0.2674 -0.2519 -0.3002 -0.0433 0.0105( 80) ( 80) ( 80) ( 80) ( 80) ( 80)p= .115 p= .008** p= .012* p= .003** p= .351 p= .463
GPPSE 0.0598 -0.0992 -0.0770 -0.1013 0.1098 -0.1042( 80) ( 80) ( 80) ( 80) ( 80) ( 80)p= .299 p= .191 p= .249 p= .186 p= .166 p= .179
(Coefficient / (Cases) / Significance)
p (.05* / p < .01** / p < .001***

V 162
Stability (positively, 2}.05) and Sociability (negatively, £S•Ü5)•
Two personality scales also correlated (negatively) significantly with
the WAIS-RP (Responsibility, 2}.05; Self-Esteem, £S•Ü5)• Finally,
for the Total sample of subjects, Ascendancy, Responsibility, and Self-
Esteem were negatively related to performance on the WAIS—R Full Scale
(2}.05).
In Table 31, it can be readily seen that for the entire 80-subject
testee population Emotional Stability correlates positively to all
measures of teacher assessed skills (VATQCA, 2}.01; and HSQCA,
2}.05) plus the SAT triad (V, P, Combined; 2}.05 or .01). Only a
significant negative relationship between GPPE and high school standing
(HSSTND) is witnessed (2}.05), which because of non-reversal of high
school standing percentile scores is actually a positive relationship.
Other significant correlations in this table are overwhelmingly
negative: GPPA and SATV (2}.05); GPPA and SATM (2}.05); GPPA and
SATCOMB (2}.05); GPPS and SATV (2}.01); GPPS and SATM (2}.05);
GPPS. and SATCOMB (£$•Ü1)• Only the remaining significant
relationship between GPPR and VATQCA was found to be positive (2}.05).
In Tables 32 and 33 are presented the equivalent analyses
performed on the Black subject sample. In Table 32 all mathematically
relevant relationships are negative. A significant relationship can be
seen to exist between the GPP construct of Responsibility (R) and all
three WAIS-R scales (V, 2}.05; P, 2}.05; FS, 2}.01). The only
other relationship to reach significance in Table 31 is between Self-
Esteen (GPASE) and the WAIS—R Performance IQ (2}.05). In Table 33,
Black subjects' high school standing (HHSTND) positively correlates

163
A4 l
Table 32Relationship of Personality Variables to IQ
Pearson Correlation oefficients(Black Subjects)
GPPA GPPR GPPE GPPS GPPSE
PPVT -0.0547 -0.1751 0.0182 0.0335 0.0133( 40) ( 40) ( 40) ( 40) ( 40)p= .369 p= .140 p= .456 p= .419 p= .467
WAISRV -0.1908 -0.2833 0.0489 0.0029 -0.0649( 40) ( 40) ( 40) ( 40) ( 40)p= .119 p= .038* p= .382 p= .493 p= .345
WAISRP -0.2246 -0.3493 0.0441 -0.1836 -0.3192( 40) ( 40) ( 40) ( 40) ( »40)p= .082 p= .014* p= .393 p= .128 p= .022*
WAISRFS -0.2451 -0.3845 0.0265 -0.1080 -0.2356( 40) ( 40) ( 40) ( 40) ( 40)p= .064 p= .007** (p= .436 p= .254 p= .072
BCT 0.1792 0.1018 0.1180 0.1713 0.2191( 40) ( 40) ( 40) ( 40) ( 40)p= .134 p= .266 p= .234 p= .145 p= .087
(Coefficient / (Cases) / Significance)
‘p <.os* / p< .01** / p<.001***

164
Table 33Relationship of Personality Variables to Academic Assessment
Pearson Correlation Coefficients(Black Sample)
::::::::::::::::::::::::::::::::::::::::::::::::::::::::::::::::::::::::::::
VATQCA SATV SATM SATCOM HSQCA HSSTND
CPPA -0.1986 -0.1262 -0.1441 -0.1682 -0.0622 0.0539( 40) ( 40) < 40) < 40) ( 40) < 40)p= .110 p= .219 p= .188 p= .150 p= .351 p= .371
GPPR 0.20015
-0.2242 0.0026 A-0.1251 0.1950 -0.2700( 40) ( 40) ( 40) ( 40) ( 40) ( 40)p= .108 p= .082 p= .494 p= .221 p= .114 p= .046*
GPPE 0.2314 0.1178 0.2924 0.2631 0.2807 -0.2764( 40) ( 40) ( 40) ( 40) ( 40) ( 40)p= .075 p= .235 p= 034* p= .050* p= .040* p= .042*
GPPS -0.1683 0.0277 -0.1335 -0.0740 -0.0706 0.0458( 40) ( 40) ( 40) ( 40) ( 40) ( 40)p= .150 p= .433 p= .206 p= .325 p= .333 p= .390
GPPSE 0.0284 -0.0147 0.0141 0.0011 0.1299 -0.1901( 40) ( 40) ( 40) ( 40) ( 40) ( 40)p= .431 p= .464 p= .466 p= .497 p= .212 p= .120
(Coefficient / (Cases) / Significance)
p (.05* / p (.01** / p( .001***
165
with _ both responsibility (GPPR) (p_<.O5) and emotional stability
(GPPS) (p<.05) as measured by the GPP. The Gordon index of Emotional
Stability also positively relates to the SAT-Math and SAT-Combined
scores as well as HSQCA. No other correlations were uncovered for the
Black group.
For the *40 White subjects only two correlations were found between
standardized IQ measures and personality characteristics measured by
the GPP. Table 3*4 displays the two relationships. The measure of
sociability (GPPS) was negatively related to the PPVT IQ (p<.05),
while Emotional Stability (GPPE) and the_same verbal IQ related in a
highly significant positive manner (_p<.001). -T‘able 35, again
displays a strong tendency for the measure of emotional stability
(GPPE) to change within a group relative to the SAT scalings (SATV,
p_<.01; SATM, _p_<.05; SATCOMB, p<.O1) and teacher ratings (VATQCA,
p_<.05). Finally, for the White sample Sociability (GPPS) is
negatively related to two SAT SCORES (Verbal, p<.05; Combined,
p<.05).
Intelligence and Social Adjustment to College
The Social Performance Questionnaire (SPQ) provided the means of
indexing the degree of student adjustment to campus life. Sixteen
measures of adjustment were derived from this schedule (see Appendix
I) plus two demographic scales (Class Standing - Class; and Years in
College - Years). Table 36, 37 and 38 present the degree of
correlation between these 18 indices and performance on the
1nte11ectua1/learning measures for the Total subject population, the

j‘
166 '
4 nTable 34
Relationship of Personality Variables to IQPearson Correlation Coefficients
(White Subjects)
GPPA GPPR GPPE GPPS GPPSE
PPVT -0.0469 0.1843 0.4898 -0.2925 0.1238( 40) ( 40) ( 40) ( 40) ( 40)
a p= .387 p= .127 p= .001*** p= .034* p= .223
WAISRV -0.0738 -0.0663 0.2330 -0.0952 -0.0374( 40) ( 40) ( 40) ( 40) ( 40)p= .325 p= .342 p= .074 p= .280 p= .409
WAISRP 0.0254 -0.1567 -0.1121 0.0747 -0.0933( 40) ( 40) ( 40) ( 40) ( 40)p= .438 p= .167 p= .246 p= .323 p= .284
WAISRFS -0.0310 -0.1287 0.0996 -0.0001 -0.0591( 40) ( 40) ( 40) ( 40) ( 40)p= .425 p= .214 p= .270 p= .500 p= .359
BCT 0.1277 -0.1005 -0.2355 0.1922 0.0014( 40) ( 40) ( 40) ( 40) ( 40)p= .216 p= .269 p= .072 p= .117 p= .496
(Coefficient / (Cases) / Significance)
p (.05* / p (.01** / p (.001***

167
Table 35Relationship of Personality Variables to Academic Assessment
Pearson Correlation Coefficients(White Sample)
VATQCA SATV SATM SATCOMB HSOCA HSSTND
GPPA 0.0600 -0.1225 -0.1362 -0.1504 0.1131 -0.0460( 40) ( 40) ( 40) ( 40) ( 40) ( 40)p= .356 p= .226 p= .201 p= .177 p= .244 p= .389
GPPR 0.1896 -0.0284 0.0556 0.0201 -0.0622 0.1279( 40) ( 40) ( 40) ( 40) ( 40) ( 40)p= .121 p= 431 p= .367 p= .451 p= .352 p= .216
GPPE 0.3084 0.4004 0.2785 0.3864 0.2435 -0.1748( 40) ( 40) ( 40) ( 40) ( 40) ( 40)p= .026* p= .005** p= .041* p= .007** p= .065 p= .140
GPPS 0.0056 -0.3198 -0.2187 , -0.3062 0.0488 -0.0064( 40) ( 40) ( 40) ( 40) ( 40) ( 40)p= .486 p= .022* p= .088 p= .027* p= .382 p= .484
GPPSE 0.1737 0.0083 -0.0279 -0.0132 0.1320 -0.0471( 40) ( 40) ( 40) ( 40) ( 40) ( -40)p= .142 p= .480 p= .432 p= .468 p= .200 p= .386
(Coefficieut / (Cases) / Significance)
p 4.05* / p 4 .01** / p (.001***

.I 1-I
;:
168
^
1E-I1
, u
•—a¢¤,_,2/\
I I
Va. 5·
mO‘^
61
.„
MM:35
I
U1rx
Ö
NCW
_— 1::1
<rOn
,
,.1¤¤__,oo
1
6
.NQ
IV},
N
I
o¤¤$.I~
-1:
¤. 5 ·
1I
¤•Q
°
ch(W
¤_
Icn1-I1
OA
cn5
·
ooON
c— 1 S
Sog
QII
O°°~
S55
,_,
1ns
•-Imcg^
1:.5
1
Is,¢IIB1-Q
'
Qwqx
\.zII
U)
1
Qu
Q,FI
¤·
\/
ß
I
<I‘
I
°·
¤•
Q,¤o1
IO <I·
^‘¥
O N
I
O
l
O
Noogco
°‘ O
$5I
VS‘
·Z€°
VS
W2,I
VL 6•
go
c•‘1 UQ
IV!
MA
wu,
Mcq-
Ecv-II
Q°
(Www
"’ ¤¤¤I
°°¤oOoo
• llO M
"‘¤·•-¢¤-
IO
Nc
„,^*
V5
• .
.¤
„o{
¤-1
•„
oO
O
W
O
Zoom»¤
„_,I1
E"-¤[_,
I
VII.
OMgq-
cz-
°‘ O'
goog
N
-.°BoE—•
6
I 5
•ZOO
ää
1M
1
O
Zoomc
O
o¤¤·
'VII
O~o^
'„,,I1’
S
1
¤„ 5
OO
V
fu
•-1u~^
°‘ O
Noog<I·
¤
cn
mon
VII
_
qgm
O
D
cx.5
•N°°„_,
-.-1
O
"‘-—•
,..5*
¤1;
O<I·
4.1
cn1-I
‘
'vs
ON^
Vu
ev
I
o. 5·
¤.nO§Q
¤.
¤¤
6
I
•"°°o
O,.„-1:
I
VII.5
·
ÜOO
,
,.1oog~o
SS5
VL 5·
SGM
II ä
*S$H
·I
OSS
“ II
IO
O
N
na O I
6 I
O
uaN
III.
I
cn
VII•
°°Q<|'I:
· 1O
Ocn
n^*
O-O
°
Owcx
·•-I
1
• .mcm
1""
Q3
= 1
o
„¤_x
6%*.
_ O
I
¤-o
N
1
‘@
¤‘,3
1 I
¤·o
·;;g„..1
Q
E
IVII,
Owan
g
I
¤‘Q u
"‘ -4-5
>
-/II°‘O
°¤
1-1
nu
VII
c:
<I
Mm
Q-
••'I
3
uain
u
1-IM
1::
4
o
3va
0
HEE:0
Hcn
O0“‘ 2
as6

169 -·
V OAm m8{ {Am -•AB mAH•-4 <rcc~1 —•m·-o mcc mcw mc<rOON B •N MON OON BON
AQ
-Q
-Q
-Q • Q
O II O ll O ll O II O Ilgvg, gvp, uva, uvg, O9,
M \0A{ IRA{ AIR OA{ MAIRW IROO MOO ~DO¤-4 IRO-4 MOIDW IROO MOM {OM IROM MOM9-• •·-I • O • IR • O • O
O II O II O ll O ll O IIZ uva- Vn- vn- vn- vn-
-·«A{E-I MO!-R MA-I. OAIR BAO OAMrn
-—•m<t Bcm mcm MOB mcmD O
• IROO HOH IROO MOM'1 6 n -4 • -—•
~ H • O¤V9- O Il O II O ll- O II
x/Q, O9, x/Q., |x.1¤„
qxAB {AN MAM {A-I {AOOOO NON HO\D OOO BOBIOOO NO{ BON NO{ OON
VJ -4 • O • O • O • O •
A ,4 • •-
•-0 4 O II O II O II O II O II
go 9-• uvn- Ivn- V9- Vn- •v9-
9-A ·l¢
·)¢ ·l< ·)¢zu mAO OAIR BAB BAO MAI-h5 mcm
mc-• mcm IROH BccO BOO {OO IROO MOO OOO•; H • N • H • N • N •
O GJ H O Il O II O II O ll O IIM li Fu V9- V9- V9- V9- Iv9-U"‘
ä,.¤ NAM BAO BAO {AO OA{G! H IRO-—I IDOIR OOO OOM MOM[-• •~•-•
mmm Bmc Nm<!· mm-• Q •
0 O O ll O II O II O II O ll9 3 •I9- uvn- V9- IV9- Iv9-
Eu -)<9 cxAB IRAO BA{ BA-I NAOO OOM OON {OO NON BO{ AU W OOO NO{ MOON NO{
¤—•O{ Q)·v N • Q
-Q
-Q
-QO
O ll O Il O II O II O II WM IVD- IV9- vn- V9- V9-IH
••" ut!MAID HAM OA~D OAO OAIR CI O<tO<t mc-• 61cB NOM Bcc OD c
UI {OM NO{ OOO OON IROM ~•-I •
M O • O • H • O • O • VJpg] _• •
-
•-
\/W O II O ll O II O II O II \9-a V9- IV9- V9- V9- IV9- 9-
A
MAO MAN MAM MAO {AM ¢¤ ·l¢\0O{ OOI-R HOIR MOH IU ·)¢MON {mm {mm •—•md· mmm O
-•
[4. O • O • O • O • O • v OX O ll O Il O II O ll O II \lr.] V9- IV9- V9- IVD- ._IV9-
u JC'- 9-0••-I \U •)¢
VJ·•-I IR
>9·• F!-• W O
M M M W·[-•
U1 U1 U) 0
> H H H [-I O Q¤- 4 4 4U¤-
2 2 2 ¤¤ ¤·

6
6326~„
6
6 ·236 2;
"‘o§§ ,.^"JÄ
6'
g**
$4• °¥$9,6
ÜM·~L6,g
_66 @6
cv’$~t
Q
83
•n :~¤:,.„
au'
•
H6 · QS6s~6§’4°~o
4
oval6- 6-
ux„-
{Q
_°6'~L
6 ·§3f
22
‘* 'vä 6
O]
•• Ö
GFV
C
·•-•
4O¤0
rn
l‘ Ü
•
FXOE
QH 6 °XSE
ag
nä
eval 6• ggg
$3*Im O
<!
ln
vl
•• UI
1-¤t\
M
'3
QÜ
6ogg
Zgcv¤¤,„
"’¢u 6°
o‘*$34
Qä6 ° *38 QS: 6
?~L Q E‘ $3
gg
6.
o„
'”£ 6 'NSS ägw
~‘
äm‘ $3S
6„'~L
6‘ PSS
$36
J:
OFX
Q"
E6
‘ $6S$^6
°~LQ 1
äc
E«»6
H666
$996
¤•="¢L$
° °o**m
anQ
ra
Ü}6
·*:662;
*H^6 6°*HL B *7 °f
Sg 3
'VÄÄ 6 ~°
¤= C?ä'
z~
SSS°^ä
QéQoä
QQQ Eägä 6
g
Q 6
¤~L 36*6 2S·¤
'~L 6 °RSS
3^%
QV£Qqgg
a¢
°
,-
QväQ Q 2
„33 6A 3
SE
~°~L E °
Qä3&¤
a2
3
666. 6 vä
6
L O<=2
E-•
Sig
3

3 3o~^
17
Q1
ä:
S
VQ
3„
E
2A'332
°
6
§#6
'~;
§„
an
V
'
„„o*
3E
3M
”<6
*
.6
N
Ä
6
P
Ai
[Ä.;
mg"
"••·
2
dvg
Ji
;‘2^
ggE
3
Ä
§6
gg
ä
3
sg;
2:3
“2
3
6,%
,Ä
§„,
5ä
M
Ji
3A
N3
I
2
,*5
g„
=§
ll:6
3
V
>Ä
,*
Ĥ^
9
Q
3
$8
9
S
‘68
6*
2
ääö
öjä
,
6,*
Ä
3^°
S
Ä ga
%$*
äga
$3ä
Ö¤
Öqä
o”E
Siä
«
V3@6
E3
6
ä
_~t§>„
„_,
c
”
o"Esn
AI J
§
m
I
g,
2
’*
\
E
V
6
3
AL J
¤«3
>
3
~CL

172 *
·!¢ •)¢I |\a·~¢•‘I0a·xd\®a~0Qax¤-•¢*!a~ d\a·~N¢•1axN¢"iax¥D0a~I!1I s-•NcsxIxOc¤NQ•-•~0O¤1a:Qc~ s-·Ic¤C>I~«-•QsxcsOc~In¤x1·
|-I • • • • • ,,] • • • •
MG IG IG IG IG I 30 IG IIG IG III
[-•sV Ixa IV IV V IV IV sxa Ixa
I Iha~¤\s-·Ia·xI\lt\a•s¤DQa·x•-•0a·x MIhaxNI\a·xQ¢ax|\Qa~W‘ c~Qc¤~0¢¤««Q~o<t·QO<¤cm NI-•c¤nMO•-•No•-•«-IQO
I S2‘*"‘$1‘*‘%2‘*"f°«;'§‘*°Z.Z‘•‘*°‘ E£‘*‘%8‘*"Z2‘*‘I3‘*"2pg • • • • • • •I <G IG IG IIG IG I äo IG IIG IG I
IQIV IV V Ixa xa xa sxa xa xa
I Q/~I~¤ha~Il\¢"Ir~0¢*1a·xwNa·s0 \Da%®¢'7a·x\D•-|a\'~0Na~|\
äq Q•@ nq •N • age •g—| •@ •@ •
I I•
I I I I
· MG IG IG IIG nc II Q0 IIG IG IG IIO,
IQqsxa Ixa xa sxa xa 4sxa xa xa xa
Ht ·)¢
A
OUGGQGMGIGMMONOGM ¤00•—•\¤G•-I\D0<•1I~G<•'I
I•Q
nl-|•g¤d
•.-I•
ggf)•|-|
•p| Ignl•
I I I I I I I O I¤·• I gc IG IIG IG IIG II <G IG IG IIG IW | 4 xa xa xa xa sxa Qqsw Ixa sw xax/Q I
nä Ivv I ·1¢¤"~·¢I•-¤<JI GGIhI¤G~0I~Gx1'@GNI\0<¤ \0G~0N0¢"1I~0•-ING¤\In-I I Wlh<|'G¢<!'G\0<I'¢"b®¢e—Ix‘I'x‘X'¤-I •-Ix1'<I'¢¤¢GI\Q'¢*$•-4<'GU:
•N •Q •@ •¢\| •
I I I I I I I I I IIG! I OG IG IG IG IG I HG IG IG IIG I>Q I : w I xa xa xa sxa pg xa xa xa xa
gäluax·¤|:.‘¤ /xGI•-Ia·x<!·~0a~<|'<.1'a·xI~r-t'Iaxlf\ 0a·xx't<!'a~N0a·xN¢'*$a·sN
UNOI NONIt1G<*7|~G<'1lf\0®¤\G<*1 <'GG••<I'G®GG¤0I~G~0•—•·8••-•u I •Q •@ •@ •Q • ä@ •(Q •y¤: •q •I I I I I I
[-Iäs-Ié I MG IG IG IIG ll G I OG IG IG IG Igew; Q xa sxa sxa xa Ixa 3 xa Ixa Ixa sxa<u I ·•-MSIIII Max<t'Nax<'¤\a~<|'QA~¤ Qaxxf Qa~0¤-4a~GMa~Q<'a~Q**¤ I ~9G®N0O\¢G•-IGGINFIGGN I~0•-4QG€¤WG<*1•··IG<I'a~00 . •-1 xt-II-•<rcc«<r•-«¢•1x1·<><l·<I·¢·*» k1~¤x1·QQxtx1·~¤<I·mNx1·x1 0 .8}:
ggü IQ •|—I •(s]•@ • gg?} •@ •@ •Q •
äI I I I I I I O IIB I OG IG IG IIG I G I g0 IG IIG IG I Q-••-Iqg usw sxa sxa Ixa xa sxa xa sxa sxaG9-•
äQ.
••·•'•" I A ä 3S I OV! I QGGOGG\¤—IGd\l-¤G<*1xTOd\ lt\0\¤GIGN¤'1G\¤<'G®r-II:
I¢ßG\x‘I'GG<I'<'G<!'<I'<*I<I'Q'x‘I'<|'¢*'I Cf}:-4<!'x1'®x1‘¤-IGQ'N¤\<!'
••-I
O xn•Q •Q •Q •Q • gc •,-4 •,-s •Q N 0
•I-I • • • • • Q • • • • WHJ-I I EG IG IIG IIG II G I MG IG IIG IG IIn xa xa sxa w xa ¤.•sxa sxa -xa IV Q
Q I OM ä E
Nax¢¤Na~I~r4rxlf\Na¤t¤ Iha~<!' Iha·~<*§<|‘ax•-|<'a~G#0a-xII"I 5. <f000ON<!'GG|\Glf1~¤00 <D0¤\¤00GOGIhI~GI~ G
Mx? •G •¤-I ••·-• -0 • 0 •¤-I •0 -0 N la* I I I O I I I I
I EO no Iso no II c II äo no so uc I 0O V V V V V0. rd V IV xa Ixa 0
I Q>
D-• > ¤-I I2In
M M M M M M Ug W U3 U1 E In W VJ •·*¤• E 2 2 53 ¤• 2 E 2 *8¤-• 3 3 :2 ¤¤ ¤-• 3 I: 3

173
1 0\»·ssh·|-OCCOI-Z¢•‘\<I'<|'»-IO ~A •SG I1
G
la‘|I~GQ¤J<|'<l'¤-1
pl O
EG II
E•<l'GGUJ®¢<")
E° °. QG llsv
'•-1zxNGG•-1QQM
2° °<G II .
^ ¤·a V .02:*
’EG- O/xs-*
I~GG'C¤<I"G
; Bü•
Q HG II--1 hsv
QäM!-1 In/sdä
Q, NGO0 «-•<r<rS5 E3 ° »wi-1 QQG II9*1-4 3 G
'U
3G QAG fs
·-1 VXGO 0u ¤·Jsn<r•-1 0G wr-• • G0 ,":> • 0 E
V ·Q QG • 0G m v ~•·1
· *1-1 •-1
E 8gg •
d'z·slh •s-1onooo cn 4]
¢IJG\<I'O1MO
• \ ¤•Q
•
HO II rs \|1s!V 3sa E.O G
n-Ozss-1 v •snG¤~
ä<l'<rm \ VG •U nl§G ll GLu sv .9 \
Q ?A*1-1 Q0B ·o V
G U#3 V ¤•

174
black sample, and the White sample respectively. The 16 adjustment
measures, with their abbreviated representations as listed in the
tables (presented here in parentheses) are: (1) Counseling Center
. visits (COUSL); (2) number of classes dropped (DROP); (3) average
number of hours carried per quarter (HOURS); (11) number of courses
taken, academic exposure (ACDEMEX); (5) variety of social problems
faced (PROBS); (6) dating habits/frequency (DATES); (7) number of trips
home divided by miles to parents' residence (TRIPMI); (8) number of
phone calls to family of origin divided by miles (CALLMI); (9) degree
of involvement in extracurricular activities (EXTACT); (10) extent of
peer network on campus (PEERS); (11) living situation while at college
(HOUSE); (12) part-time employment (WORK); (13) subjective experience
of enjoyment and comfort in college (FIT); (111) number of pre-college
friends also attending Virginia Tech (PALS); (15) mean subjective
rating of college adjustment for each year attended (ADJUST); and (16)
new peer group formation, determined by subtracting number of home town
pals from total number in present campus peer support system (NEWPEER).
The BCT correlated very little with any of the social adjustment
measures. One relationship was between the BCT and the students'
subjective rating of college enjoyment/comfort (FIT). For the White
sample FIT was positively related to BCT mastery (negatively related to
the BCT measured errors) at the 99.9$—level of confidence. The total
sample measured relationship between these two variables was less
(_p_<.O5) because no significant relationship was described by Black
performing. Black BCT measured ability did correlate negatively with
new peer group formations (NEWPEER, p_<.O5) and positively with number

175
of pre-college friends on campus (PALS, p<.O5) in addition to social
living arrangements on campus (HOUSE, p_<.05).
Other Black social adjustment scores correlated with one or more
of the Wechsler scales or the PPVT. Number of clases dropped (DROP)
was negatively associated with PPVT performance (_p_<.O5), while hours
per quarter (HOURS) and total hours taken (ACDEMEX) were negatively
associated with various Wechsler scales (see Table 37). Also, WORK and
PALS were positively correlated to Black WAIS-R Performance IQ
(_p<.05), and PEERS was related in the same fashion to WAIS-R Full
Scale scoring.
Fewer significant correlations were found between the Social
Performance Questionnaire indices and intellectual performance within
the White sample, (Table 38). Besides the positive relationship
between the demographic variables, class standing (CLASS) and years in
college (xmas), ana aavx (£<.o1); Acvaraax (p_<.o1), aousa
(_p<.O1), and PALS (p<.05) also seem to relate to the PPVT-IQ (the
second two negatively). Number of travel miles home for visitation
(TRIPMI) was also negatively correlated to WAIS-RP (p_<.05) and WAIS-R
FS (_p<.05) responding, while college FIT moved in harmony with the
WAIS-R Verbal (p<.05).
In Table 36 are presented the correlations for the combined Black
and White subjects. Measures relating to increased college involvement
are positively related to intellectual performance while those
tapping difficulty with collegiate integration show negative
176
ucorrelations with measured IQ. The cne major exception is the
previously described amount of time in college (CLASS, YEARS, and
Ac¤EM1=:x)~.
Social Adjustment and Academic Performance
Hypothesis-IX of Study-III states: "Social adjustment will
correlate with college academic functioning based on the Cultural-
Distance Perspective's assumption that increased socialization and
system enculturation fosters the development of in-group behavior."
Table 39 displays the degree of correlation between the 18 variables
derived from the SPQ, for the three student groupings (all subjects,
Black subjects, and White subjects), and college grade point average
(Virginia Tech Academic Functioninß (QCA)).
For both the Black and White samples, number of ·visits to the
ccuseling center (const) was negatively oorrelated to teacher tested
scholastic achievement (2}.05). Both groups also agreed that
increased average hours taken per quarter (HOURS) and subject
assessment of personal adjustment to college (ADJUST) were factors
significantly related to good academic performing (Blacks; HOURS,
2}.05; ADJUST, 2}.05; Whites; HOURS, 2}.01; ADJUST, 2}.05).
Three additional measures of social performance were significantly
tied (negatively) to academic testing for the White samples. Number of
classes dropped during one's university career (DROP, 2}.05), and
number of problems admitted to (PROBS) (i.e., dating, study habits,
money, health, family, etc.) while in college (2f.Ü5) both seem to
have a negative impact of White student performance. It should be

177
” Table 39
Pearson Correlation Coefficients of Social Performance QuestionnaireV -. (SPQ) and College Academic Functioning (VATQCA)~„- .. . A.
_ Virginia Tech Academic Functioning QQCA)
Variäble A11 Subjects Black Subjects White SubjectsCLASS 0.0029 0.2520 -0.0738
p= .490 p= .058 p= .325YEARS -0.0296 0.2232 -0.1141.„ . ( 80) ( 40) . .. .. .49) . ..
p= .397 p= .083 p= .242COUSL -0.3480 -0.3574 -0.3276
“
. . ( .39) . 49). . . ...„.(. -49)„„.
p= .001*** p= .012* gr .020*DROP -0.3266 -0.2482 -0.3413
(. .80) ( 40). . . ( . .40)..p= .002** p= .061 p= .016*
HOURS 0.3987 0.2797 0.4328( 80) - ( 40) ( 40)p=0.000*** p= .040* Qp= .003**
ACDEMEX 0.0025 0.0028 0.1094( 80) ( 40) ( 40)g= .491 p= .493 g= .251
PROBS -0.2923 -0.2496 -0.3149. ' ( 80) ( 40) ( 40)
p= .004** g= .060 p= .024*DATES 0.0166 0.0265 -0.0713
„ ( 80) ( 40) ( 40)g= .442 p= .436 p= .331
TRIPMI -0.1853 -0.0102 -0.3021( 80) ( 40) ( 40)p= .050* p= .475 p= .029*
CALLMI -0.1629 -0.1016 -0.1960( 80) ( 40) ( 40)p= .074 p= .266 p= .113
EXTACT -0.1062 -0.0581 -0.1701( 80) ( 40) ( 40)p= .174 p= .361 p= .147
PEERS -0.0828 -0.1786 -0.1205( 80) ( 40) ( 40)p= .233 p= .135 p= .230
(Continued on next page)

178
l· Table 39
7 (Coutiuued from previous page )
HOUSE 0.0403 -0.1035 0.0963.7 7 1 ..7 ( 80). 7. 7 40). 7--.7 7 .77(7 40)_ .
g= .361 p= .263 p= .277WORK -0.2106 -0.2242 -0.21287- -7. .7 .7 -7 7(..-80). 777.777 7. ( 740)g=
.030* p= .082 p= .094FIT 0.1816 0.0537 0.2109
7 -7 71.-7 7-. ( .780)7..777(. -40).7 7.-777771.( 7 40) ..-p= .053 p= .371 p= .096
PALS 0.0217 -0.1169 0.1465-7 7 7. 7 ( .80) 7 7 (740)p=
.424 p= .236 p= .184ADJUST 0.3534 0.3568 0.3205
7 7.. .77. 7 ( _80)7 7. 7 7 (7 740)7 7 77.77 77(7 140),.7.7-1p= .001*** gp= .012* p= .022*
NEWPEER -0.0273 -0.0114 -0.105277 .7 7 ( 80) 7 7 7. (7 .40) 77 -7 .7(7 .40) 7.7.
p= .405 g= .472 p= .249
(Coefficient / (Cases) / Significauce)
p < .05* / p (.01** / p < .001***

179
noted that a like, though non-significant, trend was seen among the
Black students as regards the variables DROP and PROBS in relation to
QCA (2:.6 for both relationships). Finally, for whites the number
of travel miles accumulated per quarter on trips to their parents'
homes (TRIPMI) was also related to QCA in a fashion which might suggest
less involvement with the family of origin fosters higher college
grades (;=-0.3021, 2<.06). All the above described relationships
are also reflected in column 1 of Table 39, the total sample
statistics. Those correlations where the Black and.White sub—samples
agree in statistical significance, are highly significant when the two
groups are combined.
One additional significant relationship was uncovered in the total
sample that did not reach significance for either of the racial
groups. Working while in college (WORK) was negatively related to
course grades for all subjects and all three groups presented in Table
39, but reached a reliable level of interpretability only when all 80
students were considered (p_<.05). It should also be noted the first
two variables listed, CLASS and YEARS, do not correlate with academic
functioning for any of the three sub-divisions of the students,
although they were both significantly related to IQ test performance
(negatively) as mentioned earlier. q

UDISCUSSION
Study-II
It will be recalled that the purpose of this study was to
determine the degree of item and sub-test bias in the various measures
of IQ used in Study-I and to determine if ”cu1tural-levelling" of those
indices would positively affect predictive validity (as measured by
college grade point average) for
‘the
two racial sub—groups. The
discussion of the obtained results will be undertaken in the order of
the originally generated hypotheses.
Hypothesis-I
The chi-squared tests of homogeneity between the Black and White
racial groups on the items of the Peabody Picture Vocabulary Test
(PPVT) and the Wechsler Adult Intelligence Scale—Revised (WAIS—R)
(excluding Digit Symbol), found 16 items on the former and 17 items on
the latter· to be racially biased. Of the 16 PPVT items showing a
· significant racial correct response rate, all but one question were
biased in favor of the White race (White-biased). In a like view, 1H
of the WAIS-R items evidencing statistically reliable group performance
differences were White-biased, leaving only 3 items favoring Blacks
(Black-biased).
The ratio of White-to-Black—biased items for the WAIS-R was 1ß:3
or ¤.67 (White/Black), and as noted previously, this ratio compares to
previously published reports of a White-to-Black-biased item ratio
180

181
around 5.0. The White-Black item bias ratio of the PPVT was even more
disproportionate at 15.0, suggesting that the PPVT is at least 3 times
more culturally-biased against Blacks than the WAIS-R. This fact could
help explain why the socio-cultural variables used to “level” cultural-
distance in the original study (Grubb, 1983) were ineffective in
completely bridging the chasm between the two races as measured by the
PPVT. When one considers that the Personal Data Questionnaire (PDQ)
variables were able to reduce the originally significant racial
difference on the WAIS-R, with its five to one ratio of racially
relevant material, to non-significance, the difficulty encountered in
the PPVT can more rightly be laid upon inherent test-culture interweave
than with lack of "variable-X" identification. Even so, as will be
discussed below, reformulation and augmentation of the original socio-
cultural variables were effective in obviating the test pattern
sequelea of built-in racial-bias.
Each racial group displayed a specific sub-test pattern of WAIS—R
responding (refer back to Figure M). No significant racial group
differences were uncovered in the Verbal portion of the WAIS-R, and
Black sub-test performance was roughly equivalent to White sub-test
scatter in this area (Verbal IQ). Only one sub-test reached the 95%
level of confidencez Arithmetic, favoring Whites over Blacks.
The two racial groups differed markedly on the Performance half of
the WAIS-R however. Two of the five sub-tests revealed significant
racial differences (Table 13) White over Black (Block Design amd Object
Assembly), and the histographic representation of successive sub-test
administration sequence (Figure H) displays three cross-points in the

182
two racial sub-score pattern plots (between Picture Completion and
lPicture Arrangement; between Picture Arrangement and Block Design; and
between Object Assembly and Digit Symbol). The performance section of
the WAIS-R produced identifiable racial group sub-score profiles,
whereas the six verbal sub-tests were poorer differentiators between
the two student samples. It would seem that, relative to Whites,
Blacks are slightly less able to answer specific questions involving
mathematical computations without the aid of pencil and paper, as well
as being reliably less apt to correctly reproduce geometric figures
using bi-colored blocks or putting novel "jig-saw-like" puzzles
together under time constraints. While two of the three significant
White over Black sub-tests were part of the Performance IQ,
onlyitemsin all the five performance sub-tests reliably differentiated the
two groups, and one of those favored Blacks (refer back to Table 12).
This leaves 13 biased items in the WAIS—R Verbal. How are these facts
to be explained?
For one thing, over half of the biased Verbal items are in two
lengthy sub-tests, Information (*4 White-biased items) and Vocabulary (3
White-biased items). Secondly, the single White-biased item in the
Similarities sub-test is equalled by one Black-biased question in the
same sub-test. Another Black-biased item can be found in the
Comprehension section (the only biased item in that sub-test) and a
single White-biased item is in like manner isolated in the Digit Span
(backwards - 6). Finally, two White-biased items were identified as
Arithmetic problems. Those sub-tests displaying significant racial
differences were those sub-tests with a higher frequency of White-

l 183
biased items, as predicted in Hypothesis-I. One of the four questions
in the Object Assembly sub-test (25$ biased items) and two of the nine
Block Design questions (22% biased items) were White-biased. Over 1*4%
of the Arithmetic sub-test consisted of White-biased items (2 out of
1*4), causing this sub-test to show the White superior performance
described above. No other sub-tests approached these levels with the
exception of Vocabulary, with its 13.7 White—biased question
percentage. The other WAIS-R sub-tests ranged from zero (Picture
Completion) to 7% (Digit Symbol) in White-biased item content.
When examinedu in this fashion, a few isolated biased items seem
much more ominous. When one or two questions can account for a quarter
of the points received in a sub-test and result in reliable racial
group responding differences, how can their continuance in such
measures be justified? Surely replacement could be incorporated which
did not bear the mark of favoritism, yet would discriminate
equivalently between high and low functioning intellects, and in such a
fashion more accurately represent the item domain (Haertel, 1985). In
any event, Hypothesis-I was upheld in regards to all three of its
predictions: (1) analysis of raw IQ data would reveal a greater
abundance of White-biased items than Black—biased items; (2) each
racial group would evidence a specific sub-score pattern as a result of
the distribution of biased items; and (3) those sub-tests showing the
highest frequency of biased items would describe the largest
discrepencies between the groups.

184
Hypothesis-II
In the same fashion that the sub—tests of the WAIS-R were
analyzed, the sub-sections of the Booklet Category Test (BCT) were
subjected to tytests comparing the group means of the two ethnic
groups. Only one statistically significant difference was discovered.
The last sub-section, BCT-7, showed a slight White over Black
performance superiority (0.51 fewer mean errors). No other significant
differences were noted and as previously mentioned in the text; Blacks
and Whites performed equivalently on this measure (BCT) of level-II
intelligence. _ _ „U
It should be noted that the seventh sub—section of the BCT is also
the shortest, therefore a difference in group means of .5 item would
have more effect than in a sub-section with twice the number of
questions. By merely increasing the number of items (or rejecting
those reliably identifying racial membership) sub-test differences
could be eliminated (assuming mean difference remained constant).
Hypothesis-II was upheld in the main: no specific racial sub-score
patterns were identified even though their was a significant difference
on the final sub-test of the BCT.
Hypothesis—III
For the social-cultural variables to be adequate descriptors of
cultural-distance, they would of necessity be required to produce
significant differences between the races on several dimensions.
Therefore, it was hypothesized that "certain of the 9 social-cultural
variables (would) show a significant difference between the two racial

185
Ügroups; creating specific racial PDQ sub—score patterns.” This was
indeed the case.
_T —test analyses identified Blacks as originating from families
with more siblings than Whites (Blacks, 3.¤1; Whites, 2.23). Whites
were significantly more likely to come from families where the father's
occupation was more prestigious, family income was higher, and the
level of education obtained by the parents was higher than the Black
counterpart. Other variables in the Personal Data Questionnaire (PDQ)
approached a level significance: (1) Whites came from homes equipped
with better facilities for play and study and (2) White students had
parents who expressed more positive attitudes toward formal education
than Black students. From the above, confidence in the ability of the
PDQ to measure the cultural gulf between the races is substantiated.
Hypothesis-IV
Regression analyses were performed on students' QCA using the
various standardized measures of IQ (PPVT, WAIS—R Verbal, WAIS-R
Performance, WAIS-R Full Scale), the college entrance exams used at the
university from which the subject population was taken (SAT-Verbal, SAT-
Math, SAT—Combined), and the Level-II learning task (BCT). Culturally
levelled IQs were also regressed on college QCA, as well as bias-
manipulated IQs (bias—removed IQ versions of the PPVT, WAIS-RV, WAIS-
RP, and WAIS-RFS; a bias-balanced version of PPVT-IQ).
Only the "bias-removed" and "bias-balanced" PPVT IQs were
effective predictors of college grade point average for the total 80-
subject population. Besides these contrived scores, the SAT trio

186
(Verbal, Math, and Combined) were the only other assessment instruments
showing reliable predictive validity for the total student sample.
The reason for the two sets of variables being over-all (total 80
subject sample) effective in predicting collegiate performance have
different sub-group bases. The PPVT bias-manipulated scales were
effective in predicting the White student QCA but less useful for
describing Black student academic attainment. The standardized version
of the PPVT was also effective in predicting the White group's
criterion performance but less able to account for sub-group variance
than the PPVT bias—removed measure or the PPVT bias-balanced measure,
thus accounting for the total group non-significance of the
standardized PPVT. The non-significant predictive utility of the PPVT
for the Black group was unchanged by bias-manipulation. The WAIS-R IQs
(standardized, bias-manipulated, and culturally-levelled) were unable
to predict any of the three group's (total, Black, or White) response
pattern, nor was the culturally—levelled PPVT and the ”non-biased"
level-II learning task (BCT).
Hypothesis-IV was therefore ngt upheld: (1) prediction of Black
academic functioning was not better using the PDQ as a "cultural—
levelling scale" with the standardized IQ tests than the traditional
WAIS—R, PPVT, or SAT scales; (2) prediction of Black academic
functioning was not better using the Level-II performance measure
(BCT) than the traditional IQ tests or college entrance exams; and (3)
prediction of Black academic functioning was not better using the
derived IQ scales (bias-manipulated) than the traditional measures. In
fact, the reason for the total—subject predictive validity of the SAT

187
triad_of scores was the fact that all three of these scales reliably
predicted Black school tested ability, while unable to significantly
relate to the college performance of the White group. How are these
unforeseen results interpreted? .
One, it must be remembered that none of the original IQ scores
(PPVT; WAIS—R Verbal; WAIS-R Performance; WAIS-R Full Scale) were shown
to reliably predict Black academic functioning, as measured by' QCA.
Apparently reducing the cultural-distance between White and Black
groups on these measures would not be expectd to compensate for any pre-
existing poor predictor-criterion relationship. For this particular
sample of subjects, IQ as measured by the WAIS-R scales are
insignificantly related to school performance for both Black and White
subjects. Cultural-levelling nor bias-manipulation could alter these
facts.
Now the PPVT did show a reliable ability to predict White school
grades. Neither cultural-levelling nor bias—manipulation could render
it suitable for similar predictive purposes with the Black sample. The
culturally—levelled PPVT did account for almost 30% of the variance in
Black QCA responding whereas the standard-version PPVT could account
for only 0.1% of the variance of the criterion. In fact the culturally-
levelled PPVT accounted for more Black sub-group variance than did the
standard PPVT regressed on the White sub-group. A definite trend
toward significance was developing but because of the small subject
size of the Black population ( n_=32) and the prohibitive §_ required
based on degrees of freedom (6 and 25), even more variance
accountability was required.

188
The White sub-group had a similar difficulty as regards the PPVT.
The original covarying out of the five most general socio-cultural
variables and the regressing of this "culturally—levelled" IQ onto the
„ criterion measure produced a non-significant finding, yet accounted for
almost twice as much White group QCA variance as did the standard
. index (refer back to Table 16). Sample size and required Q had again
been prohibitive.
In Study-I (Grubb, 1983) it was hypothesized that the PPVT,
"Unlike the broad Level II intellectual abilities assessed by the WAIS-
R IQ scales (was) tapping a singular trait that could either be
biological in nature or the result of a particularly restricted set of
sub-cultural factors." Study-I proceeded to demonstrate the
probability of the second alternative by analyzing group differences
when the PPVT's specific five high-loading PDQ sooio-culturals were
removed. In this study (II), we again used this technique, forming a
culturally-levelled measure of the PPVT using the five social-cultural
variables found most influential in differentiating Black and White
ethnicity. When this specific culturally-levelled PPVT (IQ was
regressed on QCA, White group prediction was significantly increased
(Table 17). This is as expected and again shows the specificity of
this IQ. Black performance again was not reliably predicted for the
same reasons given previously. It seems apparent that cultural-
levelling increased predictive validity in those measures already
possessing some degree of predictor-criterion relationship. If such is
the case, what is the need for this cultural content of tests? There
is no need, would be the position of the Cultural-Distance Hypothesis.

189
”Study-II provided some empirical evidence for the benefits of bias-
item removal in addition to the cultural-levelling just described. By
removing all biased items from the PPVT (biased—removed PPVT) and
removing all but one racially equivalent pair of biased items from the
PPVT (biased-balanced PPVT), the originally non—significant Total QCA-
PPVT relationship was increased to the point of reliable predictive
validity. For the Black sample no change in reliability was noted and
no increase in variability accounted for was evidenced. In the White
sub-group, a small increase in ability to account for variance was
noted although the significant relationship remained at the 95% level
of confidence. The real point of this is that the non-biased PPVTs are
at least as good as predictors of this White sample's college
performance as the original biased PPVT. Also the mixed·raced sample
is improved, suggesting that at least some Blacks could be predicted
with the new measure. And if only White predictive validity is
enhanced, what cause is there to retain the 20 non—functional biased
items .on the PPVT? As the office for Minority Education of the
Educational Testing Service (ETS) has predicted (An Approach for ...,
1980):
If the test is made more fair for minorities, it isincidentally likely to become more fair for majoritymembers, and the hoped—for closing of the majority—minority discrepancy may not occur. There will,however, be less unfairness to the minority groups,because the assessment will be more accurate to thefacts, and those who are qualified are more likely to berecognized as such (p. 13).

190
1 . Study-III
To refresh the reader's memory, Study-III was conducted in order
to: (1) replicate the findings in Study-I and Study-II; (2) evaluate
the ability of the revised PDQ to account for Cultural—Distance ; (3)
investigate the relationship of personality characteristics to academic
achievement and IQ assessment; (M) investigate the relationship of
intelligence test scores and academic performance to college adaptation
and enculturation; and, (5) determine if the IQ assessment indices,
when culturally-levelled by the PDQ—R, are able to better predict
college grade measured proficiency than the standardized measures.
This review will follow the same format introduced in the discussion
of Study-II.
Hypothesis-I
The analyses of variance (ANOVA) of the four IQ measures showed a
reliable White over Black performance difference cn all scales. The
Peabody Picture Vocabulary Test (PPVT) had Whites scoring about 7-1/2
IQ points above Blacks. The difference between the two groups on the
WAIS—R Full Scale was also extremely reliable, there being a 7-1/N IQ
point discrepency on this measure. The difference between the racial
groups was less within the Wechsler sub-scales. On the WAIS—R Verbal
and Performance IQs, Whites outperformed Blacks at the 95% and 99%
levels of confidence, respectively (refer back to Table 18).
The racial differences observed in Study-III therefore replicated
the results found in Study-I. The present findings are even more in

191
line nwith the usually observed differences between random samples of
Blacks and Whites, approaching the 1-standard deviation difference
traditionally observed between the races in IQ performance. This
sample of students were less self-selected since a vigorous effort was
made to recruit equal numbers of Blacks and Whites for ‘the present
undertaking. It is possible that both groups were in this fashion more
normalized; in addition to other extraneous variables at work to
regress the current results toward the national group means. In any
case, both Blacks and Whites evidenced lowered mean group responding on
all the dependent measures when compared to the original study's
results (with the single exception of Black BCT performance; Table
NO). A second result of this more characteristic relationship of group
scores is that a reliable white over Black difference on the WAIS—R
Performance measure was found this time; compared to the marginally
significant difference uncovered in Study-I.
The significant Black-White difference of the three-way ANOVA
(race of subject x sex of subject x race of examiner) on the PPVT was
rendered uninterpretable by a second-order effect, race of subject x
sex of subject, which reached significance (refer back to
Tables 18, 20, and 21). There was no significant main effect of sex
on this measure, therefore all the racial difference was identified as
being a White male over Black male advantage (13.05 IQ points). This
particular sample of students proved once again how much more
representative they were of the population in the literature. Here, on
the PPVT, is demonstrated the racial-sexual interaction of culture and

192
Table 40
Comparison of the Groups' Mean Performanceon the 5 Dependent Measures used in
Both Study·I and Study-III
Dependent Measures
Subject IQ Tests Learning Task
Class PPVT WAIS-RV WAIS-RP WAIS-RFS BCT
Blacksl 1
Study-I °° ”117.67” 114.25 109.0lA 114.06
‘”‘”” 28.9l‘”“””
BlacksStudy·III 116.35 112.58 107.58 111.83- 27.55
WhitesStudy-I 124.06 120.35 115.54 120.77. 22.90
Whites
1
Study-III 123.80 117,87; -~115,25,— 119.08 29.28
TotalStudy-I 121.432 117.91 113.29 118.09 25.30
TotalStudy-III 120.08 115.23 111.58 115.45 28.42

1 193
cross-cultural contact. This subject was discussed in the Introduction
and described more fully in Study-I (Grubb, 1983):
...Black·American boys...are being taught a more distant
intelligence (as measured from the supra-culture's
norm) than are Black-American girls. That is to say,
the sub-culture of the black-American male is more
distant from that of the American super-culture (or
White sub-culture) than is the sub-culture of the Black-
American female. ... Thus, it seems that both race and
sex influence the learning to which one is exposed and
the behaviors which are learned. Sex plays a role in
determining cultural-distance (pp. H9-50).
Many reported cases of the type presented by the PPVT racial-
sexual group configuration are recorded in the archives (Arinoldo,
1981; Carter and Walsh, 1980; also see Sowell, 1977), so was not
totally unexpected. With this in mind, it can safely be stated that
this study replicated the results of Study-I as regards intelligence
test performance.
Study-III also replicated Study-I in a second major way. Blacks
and Whites scored equally well on the Booklet Category Test (BCT),
according to similar three—way (race of subject by sex of subject by
· race of examiner) ANOVA. Further, no higher order interactions were
discovered. Once again, independent evidence is presented for the
equivalency of Black-White level—II intellectual functioning,
suggesting inherent bias in the standardized assessment devices.
Stoddard (198M) demonstrates how cultural biases can be innocently
incorporated into the most “culture-free appearing” tests:
Case in point: when native Indian children are asked to
draw a person, they do poorly; but they excel when asked‘
to draw a horse. Hopi Indians score an IQ of 12¤ on the‘
"draw a man" test, yet Arabs score only 60 because of
their cultural. belief that reproducing a picture of a

194
4 « human being brings misfortune to the reproducer, and
„captures the spirit of the poser (p. 20).
In order to be certain of our assessment that cultural-distance
was indeed at the base of the observed racial IQ differences (and
absent from the non-biased level-II learning task), Study-III also
attempted to replicate the removal of this group distance in a fashion
similar to that done in Study-I. Analyses of covariance (ANCOVAs) were
conducted on all four dependent measures using the five most frequently
included socio-cultural variables in regression equations on all
dependent measures. When the ANCOVA was run on the WAIS-R Verbal IQ,
the previous significance of the White above Black responding dif-
ference was rendered non-significant. This change tends to support the
contention that culture is at the root of the oft-observed Black-White
IQ performance difference, at least on the WAIS-R Verbal.
Reanalysis of the PPVT and WAIS-R Performance and Full Scale IQs
did not meet with the hypothesized results. Only when the one variable
resulting from more active recruitment of Blacks (number of years
attending college, or class standing) was also covaried out of the
analyses of covariance (ANCOVAs), therefore holding this variable
constant as was the case in Study-I, did the removal of cultural-
distance also equalize test performance. Blacks and Whites, as sampled
in Study-III, were determined to possess equal amounts of intelligence
measured by all four IQ schedules, once cultural-distance and “t1me in
college” were removed (see Tables 24 and 25). Thus, Study-III
replicated all the results found in Study-I.

w 195 n
’·A few words should be given to the unexpected results of
7recruiting more Black subjects in order to have equal sub-group
participation in Study-III.(As
has already been explained in the
Results section, one of the ways Study-III was able to gain more Black
subjects (MO) over that of Study-I (32) was through active recruitment
of Blacks in upper level classes. This was necessary because of the
relatively small number of Black students at Virginia Tech compared to
White students. Also, as already described, this had the unforseen
effect of increasing the difficulty of reducing the Black-White
difference through cultural-levelling. The question now is why;
One study by Firestone and Brody (1975), which was aimed at
determining educational quality and its relationship to school size,
sociological variables, and funding issues showed that sophomores in
large secondary schools performed significantly better on standardized
tests than their fellow class mates. In, Study-III it is therefore
interesting to note that the mean of the White sub-group on the
demographic variable asking for class standing was 1.925, or the
Sophomore level, while the mean response of the Black sub-group was at
the junior level (2.550). Might length of college attendance also
affect motivational aspects of standardized IQ testing? l Further
investigation of this matter remains to be undertaken.
Very little on the interaction of test-taking and class standing
could be found in the literature. A study by Madrayo-Peterson and
Rodrigues (1976) demonstrated that Black freshmen felt less stress and
reported more interpersonal satisfaction than upperclass Black
students. Might there be either an "upperclass slump” affecting all
196
student performance or a "freshman glow" at work on Black underclass
performance that is at work universally? Maybe both these little
research effects were the cause of the present curious results. As in
most research, new questions were raised that now await further
empirical investigation.
1 Perhaps, the inability of the researchers to provide meaningful
grade-related reinforcement for study participation (all subjects were
given extra credit points regardless of IQ scores received) had a
differential effect on freshmen and upperclassmen, as proposed by Kvale
(198H):
An intrinsic motivation for learning at the start ofschool is, through grading, transformed to an extrinsicmotivation, with an accompanying disinterest in theprocess and content of learning.
It is possible that the grading of learning creates avicious cycle: when an originally interesting activityis graded, it may become less interesting, and then astronger grading pressure is required to ensure furtherlearning, which becomes still duller, requiring stillmore external pressure, etc. And when such a, Vicious
cycle has been started, the common argument that grades1 are necessary to motivate pupils to learn, has its
validity (p. 5).
As has been described herein, high school grades best predict
college grades for all subjects and little difference in grade
performance was noted between groups. Also, class standing/years in
college did not significantly correlate with QCA as it did with IQ test
performance. In all, as was stated in Study-I (Grubb, 1983) "When all
the above is considered, a fairly strong case can be established for
the legitimacy of the Cultural-Distance perspective."

197
Hypothesis-II
Hypothesis-II stated that ”there (would) appear the same racial
and sub-score patterns on the dependent measures as seen in Study-II."
Comparing Figures B (Study—II) and 5 (Study—III) will quickly allow the
reader to see the stable sub-score patterns of both racial groups on
the WAIS-R. Even though both groups scored somewhat lower overall in
Study-III than what is reported for Study-II, the) same basic
relationships both intra-racially and inter-racially remain.
Both Blacks and Whites scored highest on the Verbal sub—test of
Comprehension (C) in Table R and 5, with Blacks slightly more
proficient each time. The poorest Black performance was in both cases
the Performance measure, Object Assembly (OA), where (again in both
studies) a significant White over Black difference was found.
The most variable area of the WAIS—R performance histograph
appears located on the Performance IQ and centered around the area of
Picture Arrangement (PA) and Block Design (BD). The White PA sub—test
performance on Study-III was less depressed relative to other White sub-
test performance than in Study-II, while Black BD performance also
evidenced the same change from Study—II to Study-III. Otherwise, the
graphic representations are almost exact replications and it appears
that specific racial-cultural profiles are being presented.
This finding is another area for continued study. It follows on
work begun in the 1960s with the introduction of the ”ethnic-profile
hypothesis." Ruch (198¤) states that this hypothesis holds that
”different ethnic groups may have consistently different patterns of
thought." Lesser, Fifer, and Clark (1965) looked at 320 Black, Jewish,

198
Puerto Rican, and Chinese children in New York City. They found
specific sub-scale relative ability for each of the four groups. Jews
and Blacks scored both absolutely and relatively higher in verbal
abilities than Puerto Rican and Chinese (although tests were modified .
and given in the childrens' primary language to equalize for English
proficiency). Blacks were also noted to be the lowest scoring group in
math abilities, a result replicated by the present studies. Werner,
Simonian, and Smith (1968) examined the intellectual profiles of 635
ten-year-old Hawaiian children (Anglo, Japanese, Filipino, Portuguese,
and Native I-Iawaiian) on the Primary Mental Abilities test. They found
White children to have high verbal and abstract reasoning skills but
relatively less demonstrated spacial and numerical ability. This
profile is also reproduced in our WAIS-R representations (high Verbal
and Comprehension sub-test scores and low Picture Completion, Picture
Arrangement, and Arithmetic sub-test scores). Movement of these racial—
cultural intellectual reliances over time may tell educators a great
deal about what skills are deemed important in the different American
sub·cultures during different historical periods, and curriculum could
possibly be developed around these culturally relevant strengths.
It should also be noted that the Booklet Category Test (BCT) was
subject to sub-test analyses and as was found in Study-II, very little
sub-score difference was seen between the races on this measure of
level-II intelligence. Blacks and Whites thus evidenced equivalent
performance profiles on this a priori assumed non—biased intellectual
index. Study-III even found no reliable difference in ethnic
performance on the 7th sub-test, where Study-II uncovered a slightly ·

199
·significant White over Black superiority. In fact, Blacks were
slightly better (non-significantly) on the BCT in Study-III (also a
reversal from Study-II). Since all differences (except as noted in the
= one exception above) centered around zero (correlationally), no valid
interpretations can be made, only interested notice taken.
Hypothesis-III
The revised Personal Data Questionnaire (PDQ-R) was able to
account for the racial-ethnic differences on all the IQ scales, even
the Peabody. This was an improvement over the performance of the
original PDQ. This difference was accounted for with the combination
of class standing and the PDQ-R socio-cultural variables in the ANCOVA
comparing the racial groups. Because of this fact, the New Personal
Data Questionnaire (PDQ-R) was more effective in accounting for
cultural-distance than the original scale (PDQ), and therefore Study-
III's third hypothesis was also upheld. This improvement of "cultural-
distance" measurement moves the idea, of a, "cultural-levelling scale"
one further jot toward becoming a viable option in culture-free testing.
Bersoff (1979) has followed the development of two pressures
forcing school personnel, to greater awareness of possible test bias:
(1) legal prcceedings challenging the disproportionate tracking of
Black and other minorities into special education classes, and (2)
federal mandates such as P.L. 9¤-1¤2, which require among other things,
an assessment of a child°s adaptive behavior and cultural background.
Hopefully, research in the area of cultural measurement and levelling

‘
200willreduce the likelihood of the former while increasing the reality
of the 1atter.‘ l
Hypothesis-IV
The only standardized IQ or aptitude measure able to predict Black
college grade point average (QCA) in Study-III was the Verbal section
of the Scholastic Aptitude Test. With cultural-levelling the WAIS—R
Verbal IQ also was able to reliably predict Black college performance,
accounting for a sizeable percentage of criterion variance (M11).
Hypothesis-IV was upheld in that "the 'culturally—levelled' IQs (were)
better predictors of academic functioning than standardized versions
for Black subjects." Although only the culturally-levelled WAIS-R
Verbal IQ reached a significant level of reliability, all measures
witnessed as increased _§yvalue and criterion variance accountability
through cultural-levelling (refer back to Table 29).
Hypotheses-V & VI
The predictive validity of the BCT was useless in regards to the
Black subject pool but highly reliable for the White and Total
samples. Hypothesis V was therefore not upheld concerning the BCT and
Black college grade predictive ability but hypothesis VI, dealing with
the same question related to White performance, was upheld. The BCT
was a more valid an indicator of White college proficiency than any of
the standardized IQ tests.
It is uncertain why the BCT was able to accurately predict White
(and total group) academic level in this study when no statistically

201
’significant results were seen in any group in Study-II. It may just be
an artifact of this specific White subject sample, especially when you
consider that none of the WAIS-R scales adequately described their
pattern of college test responding (also replicative of Study-II). It
is clear that such a non-biased measure as the BCT does not predict
Black college tested abilities.
It also may be true, as Kvale (198M) alleges, that school grade
measured learning is more a level-I performance than a level-II
ability. Ausubel and Robinson (1969) state that rote learning (level-I
intelligence) replaces deep learning (level-II intelligence) when three
conditions are present: (1) learning under anxiety and with
expectations of failure; (2) requirements of verbathm reproduction of
learned materials; and, (3) with pressure to display knowledge on a
superficial level (without need for practical application). Kvale
(198ü) states that the school grading system therefore furthers level-I
learning. He states that:
- Learning for an examination often involves anxiety, andwith grading along the normal curve about half thepupils must expect to fall below average. Thus,according to these conditions, the grading system againappears to promote an inefficient rote learning (p. 6).
Kvale's theorizing has been upheld by analyses of test
construction (Ba1ch, 196¤; Kirkland, 1971); experimentation contrasting
demand expectations (grading) and relaxed (non-graded) conditions
(Fransson, 1977; Marton & Saljo, 1976); and student surveys (Becker,
Geer and Hughes, 1968). States one respondent to the Becker et al.
(1968) study: „
202
( _ I've gone into classes where that's all you could do ismemorize...memorize and memorize. And then you go in to
'take the final and you put it all down on the paper,everything you've memorized, and then you forget it.You walk out of the class and your mind is purged.Perfectly clean. There's nothing in it. Someone asksyou the next week what you learned in class and youcouldn't tell them anything, because you didn't learnanything. l
It is possible that the more years of college experience of the
Black group had increased the amount of relianoe of level-I learning in
order to progress from class to class and therefore, a level-II
intellectual measure such as the BCT would not be expected to correlate
with such a different strategy of criterion measured performance in
hthis group. The results of the two studies which looked at IQ test and
BCT predictive validity towards school grades (Study II & III) found
conflicting results however, and therefore, this ”examination amnesia"
hypothesis (Kvale, 1985) requires more investigation.
One thing is apparent from Study-III, high school grades (HSQCA)
predict college grades very well for both White and Black subjects (see
Table.29), accounting for more Total population and sub-group variance
than any other measure. Whereas the extremely reliable SAT-combined
scale accounted for about 25% of the Total and White group variance,
the high school graduating QCA of both groups accounted for 32% and ¤3%
of college grade variance respectively.
For the Black group only the SAT-Verbal quotient (of the 3 SAT
scores) was an effective prediotor of college level work, but high
school QCA was still the best non-manipulated prediotor of this group's
college performance, accounting for 2M% of the college grade variance.
Davis and Temp (1971) found that of 19 institutions of higher

h 203I
education studied, SAT scores predicted White college performance to a
statistically acceptable level of accuracy in 18 of the 19 colleges or
universities (95% institutional hit rate). For Blacks in the same
institutions, only 63% institutional accuracy was seen (12 out of 19).
Further, as Williams and Mitchell's (1980) literature review shows, SAT
scores are not used to determine college success but only first year
scholastic performance. They cogently stress that "it would be
instructive to determine what the prediction would be for the overall
success in college." Might the predictive validity of the SAT-scales
decline with time in college, based on the grade learning/motivational
issues previously discussed. This -avenue of inquiry may prove
practioally useful and be the basis of the Black-White cross-over
effects of the SAT measures' predictive validity witnessed from Study-
II to Study-III. The big question is why the supposed need for an
independent measure of knowledge such as the SAT or WAIS-R, when such
measures account for only between 5 and 25 percent of the variance in
scholastic performance (Sternberg, 198ü), and when the best possible
measure (high school scholastic performance) is a constructually valid
predictor, easily assessable, and empirically most descriptive?
Hypothesis-VII
Prior to beginning the present study, the author assummed that
”the correlation of positive personality characteristics, as measured
by the Gordon Personality Profile (GPP) and academic performance and IQ
assessment (would be uncovered) for all subjects.“ In researching the
archives for previous understanding in this area, it was early

204
realiz.ed that this hypothesis would not be upheld. Much informationl
from prior werk in many areas convinced this investigator that even
those traits given positive valence may be contraindicative of other
positively valued traits. Bowles and Cintis (1977) for example, found ·
submissiveness and an extrinsic learning motivation to correlate
positively with high school grades while creativity and independenoe
were negatively correlated. Thus, we see two personality
characteristics which are negatively valued by Western culture
(submissiveness and extrinsic learning) to seemingly improve grade-
tested academic performance, while two positively valued personal
traits (creativity and independence) appear to hamper school ascendancy.
Study-III showed similar results. Emotional stability, as
measured by the GPP, was positively correlated to high school and
college QCA, the SAT triad of scholastic tests, the PPVT,
and high school standing (refer back to Tables 30 ,
31, 32, 33, 3*I, and 35). Sociability and Ascendancy were found to be
negatively correlated with grades and the results of the SAT measures.
As far as personality lcharacteristics and IQ performance were
determined, Self-Esteem was negatively correlated with WAIS-R scores as
was the Gordon Personality Profile measure of Responsibility and the
WAIS-R. Ascendancy also evidenced a negative relationship with the
WAIS-R, gaining significance on the Full Scale in the total subject
pool. As in the Bowles and Cintis (1977) study cited above,
personality characteristics measuring independence or creativity (Self-
esteem and Ascendancy) were negatively related to school performance
and standardized testing while measures of conformity (Emotional

205
stability and Responsibility) were significantly related to test
performance and/or grades.
Once again it appears that the socialization process is at work.
V Those subjects more socialized (conservative and conforming) to accept
further socialization (school instruction) appear to report higher
levels of socialization (test abilities) and are graded as possessing
more culturally-valued knowledge (collegiate grade point averages).
Blacks and Whites seem to be rewarded and punished in parallel fashion
by the supra-culture on the development of these personality
dimensions. It appears that one has to become increasingly more
academically enculturated to progress through our school systems (see
lalso Longstreet, 1978). As others have stated, education is a national
culture shared by all. This seems to be very true.
But what does this scholastic enculturation do to the individual
ego (which is really the manifestation of its particular sub-cultural
matrix)? Well, as we see in Tables 30 through 35, self-esteem is not
maximized, in fact, high self-esteem is negatively related to high
academic performance. This fact reaches significant proportions in the
Black subjects studied (and is reflected in the Total Sample), possibly
because of the greater adjustment from sub-cultural self-esteem to
supra—cultural (academic) self-esteem required of them over their White
counterparts. In both cases however, self (or sub-culture, Black and
. White) is sacrificed to the national (or at least institutional) norm.
This readjustment would be hypothesizmd as being more difficult
for more culturally-distant groups. This is what the present findings
seem to indicate and what other investigations have uncovered.

206
Information provided in the review section has shown that: (1) Blacks
are better predictors of Black performance; (2) Blacks progress toward
a terminal doctoral degree in greater numbers if gradually moved into
mainstream academia by attendance at formerly all—Black undergraduate
institutions; and, (3) Mexican-Americans often display academic and job
performance profiles mid-way between Blacks and Whites. Finally, a
study concerning attitudes of minority students toward a large Southern
university (Patterson and Sedlack, 1979) demonstrated the adjustment of
cultural self to academic self. This study found that Asian-Americans
and Hispanics tended to feel more comfortable in the predominantly-
White academic environment and held more positive perceptions of the
university and its services than did Black-Americans. From the
Cultural-Distance Perspective, the farther distance of Blacks from the
supra-cultural norm would have been predicted and thus the results
expected; the effect on positive personality characteristics should
also have been anticipated. With the above now more clearly
unders.tood, we shall focus in on social adjustment.
Hypothesis-VIII
Tables 36, 37, and 38 show the correlations between the social
adjustment variables measured by the Social Performance Questionnaire
(SPQ) and the intellectual and academic performance measures. For the
Black sample, many significant relationships between social adjustment
variables and standardized measures of IQ were negative. Besides the
already discussed negative correlation between class standing/years in
college, Black academic performance was negatively related to: (1)

207
number. of classes dropped; (2) credit hours taken per quarter; and the
class standingrelated variable - total number of academic credit hours
completed. Significant positive relationships included: (1) the
WAIS-R Performance IQ with part-time employment and pre-college on-
going campus friendships and (2) the WAIS-R Full Scale IQ with total
peer relationship on campus.
White subjects' WAIS—R Performance and Full Scale IQs were
negatively related to semester miles travelled visiting their family of
origin. Also subjective assessment of college fit was positively
related to IQ (WAIS-V and BCT) for the White sample, while living off-
campus and/or alone and pre-college friends at the university showed a
negative correlation (PPVT). Less White group adjustment-IQ
relationships reached a level of significance, possibly suggesting a
ceiling affect at work in this group. This would be expected from a
Cultural-Distance Perspective, since little normative distance would be
expected between the university universe and the average White
subjects' "home sub-culture" (Gordon and Tresmaine, 1980).
Table 36 is witness to the total 80-subject sample. It is clear
from these results that those variables measuring increase campus
involvement and enculturation are positively related to IQ achievement
(number of dates per week and subjective evaluation of college fit)
while those variables signifying poor college adjustment are negatively
correlated with measured IQ (counseling center visits, classes dropped,
and living off campus and/or along). What is more noticeable about
social adjustment and IQ correlation (Tables 36, 37, and 38), is the
fact that once the demographic variables (class standing, years in

208
eollege, and hours taken) are eliminated, how few significant
relationships remain.
I-Iypothesis-IX
More significant and cross-group consistent relationships are
evidenced by Table 39. Here are listed the Pearson correlational
coefficients of the SPQ variables and college academic functioning
(QCA). Seven relationships reached a significant level for the total
subject pool. These relationships (with one exception) were also
repeated in either one or both of the ethnic sub-groups, therefore, the
attention of this section will be focused on the merged group (column
1, Table 39).
For this 80-subject sampling of college students, social
adjustment was very clearly related to academic functioning. Number of
counseling center visits, number of classes dropped, and social-
adjustment problems encountered on campus were negatively correlated
with QCA for all students (significantly). These are surely measures
of collegiate adaptation difficulties. To underscore the validity of
this interpretation we need only note that subjective assessment of
ones college adjustment formed a significant and positive relationship
with grades for all subjects (and all subject categories). These
students were not only well aware of their college milieu enculturation
but made moves to adjust their academic/social lives in order to better
fit-in (notice that perceived student college match_ (FIT) approaches
significance) in the same manner as the variable - ADJUST).

209
j Table 39 also shows that those students more involved in out-side‘
relat-ionships (and thus less apt to be as fully involved in college
life) performed less well grade-wise. Working had a slightly negative
effect on grade point average, as did trip—miles travelled to one's
family home per quarter. Both are easily recognized as either: (1)
the retention of pre-college sub-cultural attachment (the family unit),
and/or (2) the influence of competing sub-cultural systems for the
time, attention, and behavioral (both overt and covert) control of the
student (the family and the work—place).
It would appear that college life enculturation is fostered by
complete and increasing involvement. Unlike the effect class standing
and years in college had on IQ—test performance (lowering performance),
these variables were unrelated to college grades. The conceptually
related measure, number of credit hours carried per quarter (HOURS) was
however, positively related to academic performance. Once again,
students seemed well able to Judge their own ability for university
success.
Miller and Parlett (1970) have stated that good grades may not
only reflect intellectual understanding, but social learning as well.
They report finding a repeated relationship between such social
awareness factors as efforts toward making a good impression on
instructors and students social sensitivity to teacher expectations.
Are these social learning descriptors anything different from the
variables in our present social adjustment assessment? Probably one in
the same. In fact, the original intent of the Jesuits, who introduced
the grading system in Europe during the 16th century, was threefold:

‘210
j (1) discipline; (2) competition; and, (3) diligence (Kvale, 1985).
Acccrding to Durkheim (1977) this method of instruction had the
intended twin effect of increasing inter-group competition and
superficial rote learning. Today, although our espoused aims of
education have changed, the original behavioral system apparently still
leads to the original educational conclusions.
One final note on the matter of school-system enculturation.
Neither the White nor Black identification questions held any
predictive validity for school ascendancy or test-taking ability,
underscoring the foreignness of our American educational system to both
sub-cultures. This may be one of the most meaningful results to come
out of this investigation.
Limitations
Many of the limitations of this study are the same as those listed
in Study·I (Grubb, 1983). For the White subjects and a large
percentage of the Black population, this study utilized self—selected
college students. The high mean scores of both Black and White groups
on the measures of IQ may be interpreted by some as reducing the
external validity of this project, even though replication of Study-I's
results would indicate fairly good validity within a large university
population. Only further research on more randomly constructed samples
will be able to adequately counter this argument.
The difference in sub-group selection methods may also have
reduced the clear interpretability of the witnessed Black—White
difterences. As was clear fr the material presented herein, the

211(
Vactive recruitment of Black students to equalize_g size, resulted in
the 'two racial groups being different in a very important fashion.
Other differences created as a result of such experimenter subject-
selection may not have been identified and still affected the observed
outcomes.
The small sample size ( N_=80) also could in like fashion be
called to account for the predicted results. Future comparisons of
racial groups using the conceptualizations put forth in this paper with
larger samples will surely have to be conducted before its validity can
truly‘ be accepted. In addition, studies utilizing various different
racial-cultural groups not included in this project are needed.
Culture would be expected to account for Oriental, Hispanic, and Native-
American group differences on IQ measures when these groups are
contrasted one against another or the two groups in this study. The
Cultural-Distance (CD) hypothesis, to be accepted as accurately
measuring ”cultural-distance", would be expected to account for the
disparity of all sub-groups' intellectual and academic performance.
”This study gives added weight to the Cultural-Distance Hypothesis'
argument that factor-X can be measured and useful in accounting for
racial-ethnic-cultural group differences. In developing this study
some old flaws were eliminated only to have new problems arise (i.e.,
the equalization of sub-group numbers creating selection
inequalities). What is more pertinent for the evolution of this theory
is the number of new questions raised. To be viable, the CD_hypothesis
must answer the following questions and incorporate„ the resultant
knowledge into its data base.

‘212
( Why is the academic grade-based system of learning"foreign" to even White students (and how)?
What socio-cultural values foster easy sub-cultural toscholastic identity adaptation?
How is it that cultural-distance can account forstandardized test performance, yet the equalizationprocess bespeak little of future school performance?
Why (and how) does progress through the college systemenhance grade performance (rote learning) while reducing-
_ standardized test performance (non-rewarded level-IIintelligence)?
Answers to some of these questions were attempted in the Discussion
section. These answers were based on the 'QQ perspective, with
corroborating research cited to enhance the arguments. Others could
however propose different explanations for some of the findings.
As an example, the racial-genetic viewpoint holds that group
performance differences between ‘Blacks and Whites on standardized IQ
tests are probably the result of inborn racially transmitted
quantitative intellectual capacity discrepancies. The specific sub-
score scatter on the WAIS—R IQ index could be interpreted in a manner
suggestive of this position. Tables 13 and 26 describe the racial
group differences on the eleven sub-scales for Study-II and Study-III
respectively.
Whites significantly outperformed Blacks on two performance scales
(Block Design and Object Assembly) in both Study-II and Study-III. The
White over Black superiority in Arithmetic skills (a verbal sub-scale)
was statistically· significant in Study-II and showed the same trend
(though not reaching the 95% level of confidence) in Study-III.
Figures H and 5 also display the above mentioned differences but also

213
allows us to examine the relationship of the non-significant group sub-
soore patterns.- Blacks can be seen to outperform (nonsignificantly)
Whites in both studies on the measure of social understanding
(Comprehension). This and two other sub-scales which show equivalence
of supra-cultural reasoning ability (Picture Completion) and construct
usage (Similarities) inter-racially could be interpreted by some as an
indication of a shared culture in which Blacks and Whites are equally
experienced.
Since the groups seem to hold the same "cultural" views on social
relations and responsibilities (as measured by the items on the
Comprehension sub-test), view behavior as meaningful temporally and
moving unidireotionally (i.e., Picture Completion), and categorize the
environment in similar fashion (Similarities) while Whites clearly test
better on tasks which appear "non-cultural" (i.e., Block Design, Object
Assembly, and Arithmetic), the above described hereditarian viewpoint
is a viable option for understanding the WAIS-R sub-score patterns. In
this lnstance, the argument put forth in this paper's hypothesis, that
cultural-distance best describes any inter-group differences, looks at
first glance to be severely lacking. Throughout this dissertation
reference has been made to the usually observed fact that those
questions differentiating intelligence intra-racially are the same
items that best describe inter-group differences. From the Cultural-
Distance perspective this fact can be easily explained as an artifact
of the measuring instruments: _
. . . minority member performance on testsbased and
validated on the major culture (or even validated on
members of the society according to percentage

214
representation of all sub-cultures in the supra-V culture) will show characteristic patterns of group
responding which are different from those of the norming
sample. These response patterns are indications of what
is salient to each minority sub-culture on the tests and
within the major culture, and what is not. The tests
are not responsive to what is salient to the sub-culture
but absent in the major culture, however (Grubb, 1983;
p.26).
Black performance on the WAIS-R reflects those areas of the
national cultural experience which are required of Blacks in a
predominantly White learning environment (Virginia Polytechnic
Institute and State University). In such a situation, and in the role
of undergraduates, Blacks would be by definition required to understand
and, use the meta-learning strategies and have knowledge of specific
constructs, categories, and social relationships valued by the supra-
culture. Thus, it would be expected that Black students in a formerly
all-White (and currently predominantly all-White) university would do
as well as their white counterparts on Intellectual scales measuring
those skills necessitated by the roles occupied. In this instance, the
student role (Black or White) requires certain behaviors and therefore
minority students' ”response patterns are indications of what is
salient to (the) minority sub—culture on the tests and within the major
culture, and what is not.”
Those test differences which were significantly in the White group
favor (Arithmetic, Block Design, and Object Assembly; all timed
tests) can be seen as specific competencies useful for specific
student majors but not equally required of all. Also, the sub-tests
representing Black-White differences are timed, giving subjects added
credit for quick responding. By Cultural-Distance definition then,

A 215
'these sub-tests are indicators of "what is not" particularly salient
for these samples of Black undergraduate college students.
Another important point to remember is that a theory must not only
describe and predict certain affirming phenomena but deal with all
available information to be accepted as truely viable. Therefore,
although the sub-scale scatter of the two racial groups on the WAIS-R
can be interpreted as either genetically or environmentally
(culturally) determined, other findings presented herein and elsewhere
can not. This is the test that we must use: universality.
It was reported early in this paper how Jensen and others found
low-IQ Blacks scoring much higher than expected, based on intelligence
scores, on learning/performance measures. These differences in”low
intelligence” Blacks were noted while equivalent "low intelligence"
Whites also tested poorly on the same learning tasks. These findings
with non-student populations underlies the universality of the
Cultural-Distance ( Q;Q ) hypothesis. The g;g viewpoint would
predict such an occurrence, because it assumes an inherent bias in the
standardizd IQ tests which "measure" intellectual capacity* unequally
between the groups. Both Study-I and Study-III demonstrated this
underrepresentation of Black general intelligence on standardized
indices while displaying no difference in learning task tapped level-II
intelligence.
The cultural and exo-system analysis put forth here also presented
evidence on Black-White standardized test taking equivalency at the
lower end of the Gaussian ourve. This fact would not be expected from
a purely micro—level genetic determination. From the QZQ perspective

216
Öit is entirely logical: those members of the general population least
able to benefit from socio-cultural learning (the severely and
profoundly' retarded) would display a uniformity across racial groups
not seen in more normal segments.
Some theorists have even proposed a ”two-group" theory of mental
retardation to explain the underprediction of the frequency of
retardates in the severely/profoundly range (see Weiner, 1982; chapter
3). These are the retardates considered to have some organic
deficiency and are often known as untrainable or custodial
respectively. This is also the group of mental defectives, those known
to have some heritable genetic basis, where the frequency of Blacks and
Whites show nc differences. Where would one most expect to find racial
group differences than in this group? How can the genetic viewpoint
be reconciled to these facts?
One final bit of information should be useful in comparing our
group-difference hypothesis with that of the racial-geneticists.
Weiner (1982; chapter 3) reviews the literature on the ”two-group"
theory of mental retardation. Besides the "defective“ retardates
described above (IQ<50), this theory ascribes to a second group of
retardates described as ”familial" or "normal.“ These people have no
identified genetic defect and usually test out in the mildly to
moderately range of IQ (50 to 70). These individuals are also
classified by our educational system as educable and trainable mental
retardates respectively. Thus we can assume, and research proves, that
these retardates are influenced by educational and cultural influences
(i.e., the environment).

217
‘It is in the mildly/moderately retarded groups that we again
witness an overrepresentation of Black and other minorities. This fact
would be expected from the Cultural-Distance perspective since we now
find the influence of cultural factors at work on the subjects and
within the test batteries. This is why we find an overrepresentation
of Blacks and Chicanos in special education classes and why the area of
the normal bell-shaped curve bounding this population (3_S Standard
Deviations < 2) conforms to expected frequencies for the general
population.
"Factor-X" is at work in this area (of the distribution curve) and
within these populations in the same fashion and with the same results
as within the greater percentage of the population lying nearer the
mean national test performance. Therefore, we observe the same 1-
standard deviation "shift" of Blacks toward the low end of the curve
and the total (Black and White) population actual distribution closely
following the "normal—curve" frequency distribution.
IFurther evidence in the artificialness of the Black "developmental
lag", witnessed on IQ tests with groups possessing normal intelligence
(IQ Z_70) and suffering familial (or normal) retardation (50 $_IQ<70)
while being absent in the organic retarded (IQ<50) category, is the
fact that up to 55% of the Black mildly and moderately retarded
population can be redesignated normal when the American Association for
Mental Deficiency (AAMD) criteria for mental retardation is evoked:
significant subaverage general intellectual functioning existing
concurrently with deficits in adaptive behavior. Using developmental

218
adaptation scales measuring self-care, social knowledge, employment and
economic information, and other skills necessary for everyday
independent living and problem solving, many authors (see Weiner, 1982;
chapter 3) have repeatedly reported the significant difference between
racial groups (Blacks over White) on these measures and some have
concluded (as did the state of California) that these ”false-Black
retardates" are merely a product of our testing system. Weiner (1982)
explains that these studies:
. . . suggest that standard tests of intelligence do not
adequately measure the functioning ability of
socioculturally· disadvantaged youngsters, most probably
because they require skills that receive relatively
little emphasis in their home and school environments.
Conversely, most advantaged children appear able to draw
on past learning at home and in school to earn
intelligence test scores above 70, unless they are
handicapped by the kinds of organic pathology that
reduce IQ below 50 (p. 86).
Weiner (1982) further argues that strict application of AAMD's two-
dimensional definition of mental retardation will help reduce the
prevalence of mental retardation ”primarily among disadvantaged
segments of the population, who can frequently give a better account of
themselves on measures of adaptation than on IQ tests."
These are all results described and predicted by the main tenants
of the Cultural-Distance hypothesis. To quote part of the original
C-D definition again:
. . .(standardized IQ) tests are not responsive to what
is salient to the sub-culture but absent in the major
culture, however (Grubb, 1983, p. 26).

219
l_With all of the information presented from various sources and
disciplinesj a good case can be made for the Cultural-Distance
hypothesis.
Final decisions on the correctness of the opinions await
carefully planned and discharged experimentation. Till that time, the
Cultural-Distance hypothesis shall continue to provide a new focus for
"group-differences" investigations and the mill of potentially major
discoveries and developments in the area of intellectual assessment,
cross-cultural understanding, and several related fields in social-
learning/enculturation .

CONCLUDING REMARKS
The implications of this study are several. First, it replicated
the original study and went beyond it in demonstrating the reality and
very real effect of cultural-distance in group IQ comparisons. In this
sense, it even more foroefully underlines the points enunciated in
Study-I (Grubb, 1983) concerning the relevancy of the Cultural-
Distance Perspective.
The increased variance accounted for by the new Personal Data
Questionnaire (PDQ-R) demonstrates an increased robustness of the
instrument. The added variables augment, and in some instances
supplant, some of the original PDQ socio-cultural variables. Factor
analytical techniques and empirical testing with larger sample sizes
will no doubt refine these preliminary variables into a few significant
universal indices having even more explanatory power.
The fact that Blacks and Whites again scored equivalently on the
Booklet Category Test (BCT), a level-II intelligence measure,
corroborates the hypothesis that the significant White over Black
performance difference on standardized IQ tests is not a result of
innate superiority-inferiority status relationships, but an
artificially constructed by-product of inherent test-biases. Too often
our cultural myopia has fostered the view that differences between
groups within. nation-states, thus groups sharing the "same national"
culture, must be the result of biology and not environment (physical or
social). This slip of logic has been described by Harkness (1980) as
the "invisibility of the culture in psychology theory." Possibly this
l 220

221
study will help psychology to examine itself within a cultural
framework; thus allowing it to view culture at work in its subjects of
investigation, even when these subjects are members of a larger shared
culture. As Brislin (1983) observed:
Since so many aspects of culture are not assessed in thetypical study within any one country, the study'sresults are too often attributed to genetic factors orto some supposed universal process (p. 368).
Group intelligence (racial, ethnic, national) is neither
genetically determined nor universally defineable. Some within-culture
individual difference can be accounted for by genetic factors but, as
the focus of this paper continually attempted to demonstrate, higher
level analyses (above the individual) are needed to understand group
behavior. Merlin (1981-82) has evoked the categorical concept of
Aufhebung in discussing the different levels of material development.
This concept is also useful for comparing the effects of the different
levels of social reality in which mankind operates.
The Aufhebung philosophical concept proposes that “the laws of a
higher level 'abolish' the conditions of a lower 1evel.“ Merlin
further elaborates by suggesting:
...that the same human property is both typical (in the _
sense of being lawfully determined), if we regard it inconnection with other properties at the same
hierarchical level, and individual, in relationship‘ toproperties at another hierarchial level...
At the higher hierarchical levels in human beings...thetypical exists along with the socially typical (p. 53).
Therefore, one of the obvious difficulties with group IQ (or any
performance) difference interpretation revolves around the issue of
"not being able to see the forest for the trees.” Hopefully the three

222
ustudies presented in this paper will give other psychologists the
desire to back up and take a larger view of things. Perhaps, other
scientists will recognize the socially typical distal factors
overriding the individually typical proximal factors when large group
comparisons are undertaken. And as long as there are different
cultures defining reality, this functional scientific viewpoint will be
necessary. Pure racial, sexual, or other group differences (and
characteristics) can only exist at a stochastic level. But to view
human behavior from such a restricted subject-item analysis simply
reifies the response and ignores the respondent; and such a tragic
error!
Recent investigations of cultural concepts of intelligence
demonstrate the exo- and macro-system effects on learned behavior.
Gill and Keats (1980) found that Malaysians described intelligence in
terms of social skills while Australians emphasized academic skills
such as reading, writing and verbal behavior. This type of cross-
national study is applicable within modern nation-states, as
demonstrated by the present report.
Someday this nation may enjoin all its citizens to belong to one
totally equal uni-culture. This has always been the American ideal and
has always been the fallacy over which American science has tripped.
It may become a reality at last. Recent reports have seen test
performance on standardized college entrance measures more equalized
between racial groups (Black youths..., 1985; Jones, 198*4). The age-
old "intellectual" gap is gradually being narrowed. With it, I would
suspect, so is the Black-White cultural distance. Someday cross-

g 223
cultural investigators may have to cross frontiers in order to ply
their trade, but at present one need not approach the border: the work
remains here at home, and so do the questions.
Most important of these questions could be; how might
investigators develop a cultural perspective and identify their own
cultural cache of untested assumptions? The answers will be slow in
coming, as is all scientific knowledge. Some wrong turns will be made
along the way, some dead ends encountered. This author's belief that
positive personality characteristics would correlate with college grade
ascendancy was found to be untenable. Besides the reasons given within
for this incorrect prediction, other· more personal confounds can be
shown to have set the author up for this mistake.
His personal sub-cultural (or supra-cultural) belief structure was
lat the root of this prediction. Just the term "positive” should have
alerted one to the cultural value attached to these scale
qualifications. First, what is positive about ascendancy, emotional-
stability, responsibility, sociability, and self-esteem is all
culturally determined. Apparently, what was deemed positive or
valuable on the personal level was not what the academic sub-culture
deemed valuable. Secondly, the author assumed his cultural—baggage was
toted by everyone: that his knowledge was universal. These are the
two common mistakes of micro-level investigators described above. This
humiliating example demonstrates how seductive the trap is, even to
those accustomed to working from the macro-level. But all is not lost
if one allows these foibles to instruct, to underscore the all
encomposing problem of investigator-investigatee cultural emmeshment.

224
A_ One's culture is very strong; mistakes will be make. If one can
at least read unexpected results from the higher analyses and accept
one's cultural interference as it becomes apparent, progress can still
be made. It is hoped that this study will foster such self-critical
evaluations while encouraging active meta-analytical cross-cultural
investigations. Sensitivity is the by-word here. As example, Flaugher
(1978) describes very different results that are naturally derived from
viewing intelligence as a stable trait (aptitude) or a variable
determined by external influence (achievement):
If test performance is low and it is seen as an index of
achievement, then there is pressure to increase the
application of society's educational resources to
improve achievement. If the test result is seen as an
index of aptitude, however, then the same low test score
may be justification of the withdrawal of educational
resources (p. 672).
Again is ‘witnessed the effect of the macro-level societal value
systmm, and its effect on lower-order systems. This study hopes to
forward the culturally transmitted knowledge of cultural awareness in
the general sense. In the more immediate frame, it hopes to increase
awareness of the cultural influences determining group IQ performance
both in origin (sub—culturally specific adaptive behavior and system
enculturation) and observation (supra-culturally held norms of our
scientific community). Further investigation is needed, and based on
the favorable results contained herein, further investigation is
warranted. The Cultural-Distance Hypothesis has proven its
usefulness.
W
The elusive (i.e., overlooked) ”factor-X" has been identified. We
are the cause of the Black-White difference in measured IQ. We as a

Ä225
Ä nation, based on certain principles of equality and individual
freedom/responsibility; we as separate racial/ethnic groups, bound to
the national whole by history, each with a place of separate
functioning which fostered_ the evolution of sub-culturally specific,
complex, and exquisite behavioral patterns; we as different cultural
groups, with our different systems of values, beliefs, and mores; gig
scientists, with our professional identity and magical ability to
reduce and quantify; we as lay public, with our personal prejudices and
fears, with our unquestioning faith in the professionals; we all are
the cause because we all are the sum total of all our supra- and sub-
cultures. Through us, our many different cultural heritages speak, and
this diversity of cultures is the source of Cultural—Distance , the
elusive "Factor-X."

"AUNT AGGY“• A VIRGINIA SLAVE IN THE 18L0s*
You t'inks I'm mistaken, honey! But I know t'ings dat de wite folkswid all dar larnin' nebber fin's out, an' nebber sarches fo'nudder...
No honey! De good Lawd doan gib ebery—ting to his wite chilluns.He's gib' em de wite skin, an' larnin'.
An•he's made 'em rich
and free. But de brack folks is his chilluns, too, an' he gibs —us de brack skin an' no larnin', an' hab makes us t' work fo' dewite folks. But de good Lawd gib us eyes t' see t'ings dey doansee, an' tells ne be patient, 'cause dar's no wite nor brack inhebben. An' de time's commin' when he'l1 make his brack chillunsfree in dis yere worl', an gib! en larnin', an' good homes, an'good times. Ah! honey, I knows, I knows!
*Liver¤¤re, M. !189'7). H¤r!=f¤=‘d• ¤¤¤¤·•pp. 306-307.
226

Ä REFERENCE NOTES
llndividualized Data Base Project of the Pacific State Hospital,Pomona, California (as of June 30, 1975). Data obtained from thePresident's Committee on Mental Retardation, Washington, DC 20201.
Zlnformation obtained from Bureau of the Census; 1970 figures.
227

4 ‘ REFERENCES
Abrams, H. G., & Jernigan, L. P. (1984). Academic support servicesand the success of highrisk college students. The AmericanEducational Research Journal, 21(Z), 261-274.
Adams, B. N. (1972). Birth order: A Critical review. Sociometpy, 22,411-439.
Albee, G. W., Back, K. W., Carter, L. F., Chin, R., Clark, K. B.,Deutsch, M., Gamson, W. A., Gerard, H. B., Hammond, K. R.,Hefner, R., Hollander, E. P., Kahn, R., Maccaby, N., Pettigrew,T. F., Proshansky, H., Smith, M. B., White, R. K., & Zimbardo,P. G. (For the Society for the Psychological Study of SocialIssues) (1969). The SPSSI Statement. Harvard EducationalReview, 22, 625-627.
Alvin, D. F., & Thornton, A. (1984). Family origins and theschooling process: Early versus late influence of parentalcharacteristics. American Sociological Review, Q2, 784-802.
Anastasi, A. (1976). Psychological testing (4th Ed.). New York:Macmillan.
Anderson, E. N., Jr. (1969). The social factors have been ignored.Harvard Educational Review, 22(B), 581-585.
An approach for identifying and minimizing bias in standardized tests: Aset of guidelines. (1980). Princeton, NJ: Educational TestingService.
Arend, R„ Gove, F. L., & Sroufe, L. A. (1979). Continuity ofindividual adaptation from infancy to kindergarten: A predictivestudy of ego-resiliency and curiosity in preschoolers. ChildDevelopment, 22, 950-959.
Arinoldo, C. G. (1981). Black-white differences in the general cogni-tive index of the McCarthy scales and in the full scale IQ's ofWechsler's scales. Journal of Clinical Psychology, 2193), 630-638.
Atkinson, D. R., Morten, G., & Sue, D. W. (1979). CounselingAmerican minorities: A cross-cultural perspective. Dubuque, IO:Wm. C. Brown.
228

1229
lAusubel, D. P., & Robinson, F. G. (1969). School learning: Ap
· introduction to educational psychology. New York: Holt, Rinehart,& Winston.
Balch, J. (1964). The influence of the evaluating instrument onstudents' learning. American Educational Research Journal, 1,169-182.
Baraty, J. C. (1969). A bi-dialectal task for determining languageproficiency in economically disadvantaged Negro children. ChildDevelopment, 40(3), 889-901.
Bartlett, C. J., Bobko, P., Mosier, S. G., & Hannan, R. (1978).Testing for fairness with a moderated multiple regression strategy:An alternative to differential analysis. Personnel Psychology, 31,233-241.
Becker, H., Geer, B., & Hughes, F. (1968). Making the grade. NewYork: Wiley.
Begley, S., Dallas, R., & Carey, J. (1982). A biological basis forIQ. Newsweek, October 18, pp. 112.
Bell, S. M. (1970). The development of the concept of object asrelated to infant-mother attachment. Child Development, 41,291-311.
Bely, H. F., & Geary, D. C. (1984). Father's occupation and socialbackground: Relation to SAT scores. American EducationalResearch Journal, g1(2), 472-478.
Bernstein, G. S. (1982). Training behavior change agents: A con-’ceptual review. Behavior Therapy, 11, 1-23.
Bersoff, D. (1979). Regarding psychologist testily: Legal regulationof psychological assessment in the public schools. Magyland LawReview, Q2, 27-120.
Bersoff, D. N. (1971). "Current functioning" myth: An overlookedfallacy in psychological assessment. Journal of Consulting andClinical Psychology, gZ(3), 391-393.
Bhatia, C. M. (1976). The concept of intelligence ---— Its presentstatus. Indian Journal of Psychology,_§1(3), 202-211.
Black youths, girls, test well in math. (1985). Black Issues inHigher Education, 1(5), 6.
Bobko, P., & Kehoe, J. R. (1983). On the fair use of bias: Acoment on drasgow. Psychological Bulletin, 9§(3), 604-608.

230
4Bowles, S., & Gintis, H. (1976). Schooling in capitalist America.
Loudon: Routledge and Kegan Paul.
Brazziel, W. F. (1983). Baccalaureate college of origin of blackdoctorate recipients. The Journal of Negro Education, 33(2), 102-109.
Brislin, R. W. (1983). Cross-cultural research in psychology. AnnualReview of Psychology, 36, 363-400.
Brown, R. L. (1969). Who's being "reasonab1e" now? HarvardEducational Review, 33, 591-594.
Brown, W., Jr., & Hollander, M. (1977). Statistics: A biomedicalintroduction. New York: John Wiley & Sons.
Cantor, J. R. (1976). What is funny to whom? The role of gender.Journal of Communication, 36, 164-172.
Carey, J., & King, P. (1982). The rebirth of ps 61. Newsweek,October 4, pp. 65.
Carter, D. E., & Walsh, J. A. (1980). Father absence and the blackchild: A multivariate analysis. Journal of Negro Education,63(2), 134-143.
Circirelli, V. G. (1978). The relationship of sibling structure tointellectual abilities and achievement. Review of EducationalResearch, 66, 365-379.
Cleary, T. A., Humphreys, L. G., Kendrick, S. A., & Wesman, A. (1975).Educational uses of tests with disadvantaged students. American
· Psychologist, 36, 15-41.
Cole, M., & Bruner, J. S. (1971). Cultural differences and inferencesabout psychological processes. American Psychologist, 36(9),867-875.
Cole, N.S. (1981). Bias in testing. American Psychologist, 36,1067-1077.
Coleman, J. C. (1976). Abnormal psychology and modern life. (5thEd.). Dallas, TX: Scott, Foresman & Co.
Conwill, W. L. (1980). The inheritance of IQ and scholasticachievement: Further comments on the Jensen article. Journalof Negro Education, 63(1), 97-104. 6
Cross, W. E. (1971). Negro-to-black conversion experience. BlackWorld, 36, 13-27.

”231
° Das, J. P. (1977). Cyril Burt: The inaccurate scientist. IndianJournal of Psychology, 52(2), 103-107.
Davis, J. A., & Temp, G.--(1975). Is the SAT biases against Blackstudents? College Board Review,_§1, 4-9.
Deutsch, J. (1970). Minority group and class status as related tosocial and personality factors in scholastic achievement.Monographs of Sociology and Applied Anthropology, 2, 1-32.
Drasgow, F. (1982). Biased test items and differential validity.Psychological Bulletin, 2g(5), 526-431.
Durkheim, E. (1977). The evolution of educational thought. London:Routledge and Kegan Paul.
Educational Testing Service (ETS). (1980). Testing use and validity.Princeton, NJ: Educational Testing Service.
Ellis, H. C., Bennett, T. L., Daniel, T. C., & Rickert, E. J. (1979).Psychology of learning and memopy. New York: Brooks/Cole.
Eyferth, K. (1961). Leistunger verschiedener gruppen von besat-zungskindern im Hamburg Wechsler intellignztest fur kinder(HAWIK). Archiv fur die Gesamte Psychologie, ll3(2/3), 222-241.
Eysench, H. J. (1982). A model for intelligence. New York: Springer.
Eysenck, H. K. (1983). The psychophysiology of intelligence.International Academy of Professional Counseling & PsychotherapyNewsletter, Fall/Winter, 3.
Firestone, G., & Brody, N. (1975). Longitudinal investigation ofteacher·student interactions and their relationship to academicperformance. Journal of Educational Psychology, 61, 544-550.
Flaugher, R. L. (1978). The many definitions of test bias. AmericanPsychologist, Q3, 671-679.
Flynn, J. R. (1980). Race, IQ and Jensen. London: Routledge and
Kegan Paul.
Fransson, A. (1977). On qualitative differences in learning: IV -Effects of intrinsic motivation and extrinsic test anxiety onprocess and outcome. British Journal of Educational Psychology,41, 244-257.
Fu, V. R., Korslund, M. K., & Hinkle, D. E. (1980). Ethnic self-concept during middle childhood. The Journal of Psychology, gg(2), 309-320.
232
Gardner, H. (1983). Frames of mind: The theory of multipleintelligence. New York: Basic Books, Inc.
Gill, R., & Keats, D. (1980). Elements of intellectual competencejudgments by Australian and Maloy university students. Journalof Cross—Cu1tural Psychology, lr, 233-243.
Girls outsmart boys. (1983). Parade Magazine, Sunday, 19 June, pp.
Gordon, E. W., & Rubain, T. J..„(1980)- Bias and alternatives inpsychological testing. Journal of Negro Education, 49(3),350-360.
Gordon, E. W., & Tresmaine, J. R. (1980). Bias and alternatives inpsychological testing. Journal of Negro Education, 42(3), 350-360.
‘ _
Gordon, L. V. (1978). Gordon personal profile-inventory. New York:The Psychological Corporation .
Great IQ debate. (1983). The economist, 24 December, pp. 80-84,87-88. V
Greenbaum, P. E. (1985). Nonverbal differences in comunicationstyle between American Indian and Anglo elementary classrooms.American Educational Research Journal, gg(1), 101-115.
‘
Greenberg, J. W., & Davidson, H. H. (1972). Home background andschool achievement of Black urban ghetto children. AmericanJournal of Orthopsychiatry, 4g(5), 803-810.
Grubb, H. J. (1986). Intelligence at the low end of the curve: Whereare the racial differences? The Journal of Black Psychology, (in
press).
Grubb, H. J. (1983). The cultural-distance perspective: An explora-tory analysis of its effects on learning and intelligence.Unpublished Masters Thesis, Virginia Polytechnic Institute &
State University.
Haertel, E. (1985). Construc validity and criterion-referencedtesting. Review of Educational Research, 5Q(l), 23-46.
Hale, R. L. (1983. An examination for construct bias in the WISC-Racross socioeconomic status. Journal of School Psychology,Qi, 153-156.
. . 233
V Hall, W. S., Rader, S., & Cole, M. (1975). Story recall in youngBlack and White children: Effects of racial group membership,race of experimenter, and dialect. Developmental Psychology,II(5), 628-634.
Hamilton, W. D. (1969). The genetical evolution of social behavior(I). The Journal of Theoretical Biology, Q2, 320-322.
Hardy, J. B., Welcher, D. W., Mellits, E. D., & Kagan, J. (1976).Pitfalls in the measurement of intelligence: Are standard
intelligence tests valid instruments for measuring the intellec-tual potential of urban children? The Journal of Psychology, 24,43-51.
Harkness, S. (1980). The culture context of child development. New
Directions in Child Development, 8, 7-13.
Hauser, R. M., & Sewell, W. H. (1985). Birth order and educationalattainment in full sibships. American Educational Research
‘
Journal, 22(l), 1-23.
Hays, J. R., & Smith, A. L. (1980). Comparison of WISC-R and Culture
Fair Intelligence test scores for three ethnic groups of juvenile
delinquents. Psychological Reports, 46, 931-934.
Herberg, E. N. (1982). Ethnic family characteristics and educationalattainment. Multiculturalism, Q(3), 20-23.
Herzog, E., Newcomb, C., & Cisin, I. H. (1972). But some are more
poor than others: SES differences in a preschool enrichmentprogram. American Journal of Orthopsychiatgy, 42(l), 4-22.
Hilliard, A. G. (1980). Cultural diversity and special education.Exceptional Children, 4Q(8), 584-588.
Howard, J. H., III. (1970). A challenge to Black psychologistsz Howto end colonial domination of Black Americans. Negro Digest, XIX(3), 4-10, 66-69.
Hunter, J. E., & Schmidt, F. L. (1976). Critical analysis of thestandard and athical implications of various definitions of testbiss. Psychological Bulletin, §3(6), 1053-1071.
An Investigation of sources of bias in the prediction of job perfor-
mance: A six year study;(l972). In L. A. Crooks (Ed.), Pfg-ceedings of an Invitational Conference. Princeton, NJ:Educational Testing Service.
IQ: Find no racial differences. (1972). World, 19 December, pp. 61.

234
Jackson, B. (1975). Black identity development. Journal ofEducational Diversity, 1, 19-25.
Jackson, G. D. (1975). On the report of the ad hoc comittee oneducational uses of tests with disadvantaged students (anotherpsychological view from the association of Black psychologists).American Psychologists, QQ, 88-93.
Jensen, A. R. (1980). Biss in mental testing. New York: The FreePress. ~
Jensen, A. R. (1973a). Educability and group differences. London:Methuen.
Jensen, A. R. (1977). An examination of cultural biss in the WonderlicPersonnel Test. Intelligence, 1, 51-64.
Jensen, A. R. (1971)., How much can we boost IQ and scholasticachievement? Atlantic Monthly, September, pp. 43-64.
Jensen, A. R. (1969a). How much can we boost IQ and scholasticachievement? Harvard Educational Review, Q2(1), 1-123.
Jensen, A. R. (1973b). Level I and Level II abilities in threeethnic groups. American Educational Research Journal, 1Q,263-276.
Jensen, A. R. (1969b). Race, class, and intelligence. PsychologyToday, October, pp. 253-260.
Jensen, A. R. (1968). Social class, race, genetics:- Implications for_ education. American Educational Research Journal, ä(l), 1-42.
Jensen, A. R. (1976). Test biss and construct validity. Phi DeltaKappan, Qä, 340-346.
Jensen, A. R., & Inouye, A. R. (1980). Level and Level II abilitiesin Asian, White, and Black children. Intelligence, 4, 41-49.
Jones, E., & Nisbett, R. E. (1972). Attribution: Perceiving the_causes of behavior. New York: General Learning Press.
Jones, L. V. (1984). White-Black achievement differences: The_ narrowing gap. American Psychologist, 39(ll), 1207-1213.
Jones, R. S. (1971). The sociology of knowledge: Proving Blacksinferior, 1870-1930. Black World, Febryary, pp. 4-19.
Judge bans use of IQ tests for placement: Calls them racially biased.(1979). mu Delta Kagpan, §1(4).

235
Kaufman, A. S., & Kaufman, N. L. (1973). Black-white differencesat 2%-8% on the McCarthy scales of children's abilities. Journalof School Psychology, 33, 196-206.
Kirkland, M1 cl (1971). The effects of tests on students and schools.Review of Educational Research, jl, 303-350.
Knapp, P. A., & Seagram, G. N. (1981). Visual memory in AustralianAboriginal children and children of European descent. Inter-national Journal of Psychology, 30, 213-231.
Koutrelakos, J. (1971). Perceived parental attitudes and demographicvariables as related to maladjustment. Perceptual and MotorSkills, 33, 371-382.
Kureshi, A., & Husain, A. (1981). Death anxiety and dominance amongthe Indian and Palestinian students: A cross-cultural comparison.Japanese Psychological Research, 33(2), 55-60.
Kvale, S. (1984). What is learned by measuring learning in grades?Transformation, 3(3), 2-13.
Lesser, G. S., Fifer, G., & Clark, D. H. (1965). Mental abilities ofchildren from different social-class and cultural groups.Monographs of the Society for Research in Child Development, 30(No. 4).
Levidow, L. (1978). A Marxist critique of the IQ debate. RadicalScience Journal, 0(7), 12-21.
Lieblich, A., & Kugelmas, S. (1981). Patterns of intellectual abilityof Arab school children in Israel. Intelligence, 3, 311-320.
Lieblich, A., Kugelmas, S., & Ehrlich, C. (1975). Patterns ofintellectual ability in Jewish and Arab children in Israel. IIurban matched samples. Journal of Cross—cultura1 Psychology, 0,218-226.
Loehlin, J. C., Lindzey, G., & Spuhler, J. N. (1975). Race differencesin intelligence. San Francisco: W. H. Freeman & Co.
Longstreet, W. S. (1978). Aspects of ethnicity: Dnderstandingdifferences in a pluralistic classroom. New York: TeachersCollege Press.
Losco, J., & Epstein, S. (1975). Humor preference as a subtle measureof attitudes toward same and opposite sex. Journal of Personality,Q, 321-334.

236
Madrazo-Peterson, R., & Rodriquez, M. (1976). Minority students'perceptions of a university environment. Journal of CollegeStudent Personnel, l2(3), 259-263.
Marton, E., & Saljo, R. (1976). On qualitative differences in learn-ing: ~I—Outcome and process. British Journal of EducationalPsychology, gp, 4-ll.
Maslow, A. H. (1970). Motivation and personallty (2nd Ed.). NewYork: Harper & Row.
Mercer, J. (1979). System of multicultural pluralistic assessmentQSOMA): Technical manual. New York: The PsychologicalCorporation.
Mercer, M. M. (1982). Reassessing the large number of Black childrenin special education classes: A challenge for the 80's. TEENegro Educational Review,_33(1), 28-33.
Merlin, V. S. (1981-82). Problems in integrated study of individualdifferences. Soviet Psychology, gQ(2), 49-72.
Middleton, R. (1959). Negro and White reactions to racial humor.Sociometpy, 22, 175-183.
Miller, C., & Partlett, M. (1974). Up to the mark - A study of theexamination game. London: Society for Research into HigherEducation.
Miner, J. B. (1957). Intelligence in the United States. Westport, CT:Greenwood Press.
Minturn, L. (1983). ·Ethnocentrism in cross-cultural research: Andwhat to do about it. Society for Cross-Cultural ResearchNewsletter, ll(1), 5-8.
Mohs, M. (1982). IQ: New research shows that the Japanese outperformall other in intelligence tests. Are they really smarter?Discover, September, pp. 18-24.
Moore, C. L. (1981). Race: A factor in perceptual organization ofblack preschoolers. Child Study Journal, ll(2), 69-74.
Morse, J. (1914). Comparison of White and Colored children measuredby the Binet scale of intelligence. Popular Science Monthly, 5,384-389. .
Munroe, R. H., & Munroe, R. L. (1980). Infant experience and child-hood affect among the Logoliz A logitudinal study. Ethos, 8,295-315. ,

237
Munroe, R. H., & Munroe, R. L. (1984). Infant experience and child-hood cognition: A longitudinal study among the Logoli of Kenya.Ethos, l2(4), 291-306.
McGhee, P. E., & Duffey, N. S. (1983). Children's appreciation ofhumor victimizing.different-racial-ethnic«groups:- Racial-ethnicdifferences. Journal of Cross-Cultural Psychology, 14(1), 29-40.
McGurk, F. C. J. (1953). Socio-economic status and cu1turally—weightedtest scores of Negro subjects. The Journal of Applied Psychology,3l(4), 276-277.
Mackenzie, B. (1984). Explaining race differences in IQ: The logic,the methodology, and the evidence. The American Psychologist,Q2(ll), 1214-1233.
McNemar, Q. (1969). Psychological statistics (4th Ed.). New York:John Wiley and Sons, Inc.
McShane, D. A. (1980). A review of scores of American Indian childrenon the Wechsler intelligence scales. White Cloud Journal, 1(4),3-10.
McShane, D. A., & Plas, J. M. (1982). Wechsler scales performancepatterns of American Indian children. Psychology in the Schools,12, 8-17.
Oakland, T. (1983). Joint use of adaptive behavior and IQ to predictachievement. Journal of Consulting and Clinical Psychology, 51(2),298-301.
’
Olion, L., & Gillis-Olion, M. (1983). -Improving the assessment ofBlack students. The Negro Educational Review, 34(2), 52-59.
Olneck, M. R., & Bills, D. B. (1979). Family configuration andachievement: Effects of birth order and family size in a samleof brothers. Social Psychology Quarterly, 42, 135-148.
Orive, R., & Gerard, H. B. (1975). Social contact of minority parentsand their chi1dren's acceptance by classmates. Sociometgy, 3§(4),518-524.
Patterson, A. M., & Sedlack, W. E. (1979). Differences among minoritystudent backgrounds and attitudes toward a university and itsservices. ERIC Clearinghouse on Higher Education.
Pettigrew, T. F. (1978). Placing Adam's arguement in a broaderperspective: Comment on the Adam paper. Social Psychology, 41(1)58-61.

1 „ 238
Reynolds, C. R. (1980). An examination for bias in a preschool testbattery·across race and sex. Journal of Educational Measurement,11(Z), 137-146.
Reynolds, C. R. (1982). The problem of bias in psychologicalassessment. In C. R. Reynolds and Gutkin (Eds.), A Handbook forSchool Psychology. New York: John Wiley & Sons.
_ Reynolds, C. R., Gutkin, T. B., Elliott, S. N., & Witt, J. C. (1984).School psychology: Essentials of theopy and practice. New York:John Wiley and Sons.
Reynolds, C. R., & Nigl, A. J. (1981). A regression analysis ofdifferential validity in intellectual assessment for Black andWhite inner city children. Journal of Clinical Child Psychology,18, 176-179.
Robinson, J. A. (1982). Black-white job skills controversy.Michigan Chronicle, Saturday 4 September, pp. 7 (Section B).
Ross-Reynolds, J., & Reschly, D. J. (1983). An investigation ofitem bias on the WISC-R with four sociocultural groups. Journalof Consluting and Clinical Psychology, 5l(l), 144-146.
Ruch, J. C. (1984). Psychology: The personal science. Belmont,CA: Wadsworth.
Saigh, P. A. (1981). The influence of religious symbols on the digit ‘
span performance of Roman Catholic elementary school students.Journal of Clinical Psychology, 81, 851-855.
Sandoval, J. (1979). The WISC-R and internal evidence of test bias”with minority groups. Journal of Consulting and ClinicalPsychology, 41, 919-927.
Sarason, S. B. (1981). An asocial psychology and a misdirectedclinical psychology. American Psychologist, 88(8), 827-236.
Scarr, S. (1985). Constructing psychology: Making facts and fablesfor our times. American Psychologist, 4Q(5), 499-512.
Scarr, S. (1976). IQ test performance of Black children adopted byWhite families. American Psychologist, 81(l0), 726-739.
Schofield, J. W. (1982). Black and White in school: Trust, tension,or tolerance? New York: Praeger.
Schooler, C. (1972). Birth order effects: N0t there ----- not now.Psychological Bulletin, 18, 161-175.

'239
ISewell, T. E. (1979). Intelligence and learning tasks as predictors
of scholastic achievement in Black and White first-grade children.Journal of School Psychology, 11(4), 325-332.
Simmons, R. G. (1978). Blacks and high self-esteem: A puzzle. SocialPsychology, j1(l), 54-57.
Sowell, T. (1977). New light on Black IQ. The New York TimesMagazine, 27 March, pp. 47-50.
Spindler, L. G. (1975). In T. R. Williams (Ed.), PsychologicalAnthropology. The Hague: Mouton.
Sternberg, R. J., & Salter. (1982). Conceptions of intelligence. InR. Sternberg (Ed.), Handbook of Human Intelligence. Cambridge,England: Cambridge University Press.
Sternberg, R. L. (1984). What should intelligence tests test?Implications of a triarchic theory of intelligence for intelli-gence testing. Educational Researcher, 18(l), 5-15.
Stoddard, A. H. (1984). Intelligence testing revisited. The NegroEducational Review, 88(l), 17-24.
Storfer, M. D. (1985). The neurobiology of excellence. MensaResearch Journal, 18, 43-46.
Stuckert, R. P. (1964). Race mixture: The African ancestry of WhiteAmericans. In P. Hammond (Ed.), Physical Anthropology andArcheology: Selected Readings. New York: Macmillan.
Sue, D. W. (1981). Counseling the culturally different: Theogy and· practice. New York: John Wiley & Sons.
Taylor, H. F. (1976). IQ heritability: A checklist of methodologicalfallacies. The Journal of Afro-American Issues, 4(l), 35-49.
Taylor, M. C., & Walsh, E. J. (1979). Explanations of Black self-esteem: Some empirical tests. Social Psychology Quarterly, Q8(3),242-253.
Terrell, F., Terrell, S. L., & Taylor, J. (1980). Effects of race ofexaminer and type of reinforcement on the intelligence testperformance of lower class Black children. Psychology in theSchools, 11, 270-272.
Thomas, A., & Sillen, S. (l972).” Racism and psychiatpy (2nd Ed.).New York: Brunner/Mayel, Inc.

1 l 240 ·
Turner, S. M., & Jones, R. T. (1982). Behavior m.di;i..g1.„ in Blackpopulations. New York: Plenum Press.
Watson, P. -(1970). Society at work: How race affects IQ. NewSociety, lp, 102-105.
Wechsler, D. (1981). Manual for the Wechsler intelligence scale-revised. New York: The Psychological Corporation.
Weiner, E. A., & Stewart, B. J. (1984). Assessing individuals:Psychological and educational tests and measurements. Boston:Little, Brown and Company.
Weiner, I. B. (1982). Child and adolescent psychopathology. NewYork: John Wiley & Sons.
Weiss, G. (1981). The tragedy of ethnocide: A reply to Hippler.American Anthropologist, §Q(4), 899-900.
Werner, E. E., Simonian, K., & Smith, R. S. (1968). Ethic andsocioeconomic status difference in abilities and achievementamong preschool and school-age children in Hawaii. Journal ofSchool Psychology, Z5, 43-59.
White, J. L. (1984). The psychology of Blacks: An Afro—Americanperspective. Englewood Cliffs, NJ: Prentice Hall Inc.
Williams, D. A., Foote, D., Ellis, W., King, P., & Burgower, B. (1982).Go to the head of the class. Newsweek, October 4, pp. 64-65.
Williams, R. L. (1972). Problems of match and mismatch in testingBlack children. In D. Price-Williams (Chair), Research in
'Ethnic Communities: Problems and Progress. Symposium presentedat the meeting of the American Psychological Association,Honolulu, Hawaii, September.
Williams, R. L., & Mitchell, H. (1980). The testing game. InR. L. Jones (Ed.), Black Psychology (2nd Ed). New York:Harper & Row.
Wilson, C. (1984). A criminal histopy of mankind. New York: Putnam.
Wrobel, T. A., & Howells, N. R. (1982). Sex and race bias in theWAIS-R: A content and empirical analysis. Paper presented atthe meeting of the Midwestern Psychological Association,Minneapolis, Minnesota.
Yarrow, L. J., Pedersen, F. A., & Rubenstein, J. (1977). Mother-infantinteraction and development in infancy. In P. H. Leiderman, S. R.Tulkin, & A. Rosenfeld (Eds.), Culture and Infancy: Variations inLßgäggßägggggpgg, 539-564. New York: Academic Press.

APPENDICES
24 1

APPENDIX A
242

243
Personal Data Questionnaire
Name Date of Birth Sex
Address Race Nationality
Phone #
l. What is your present class standing and major?
2. What are your immediate post—undergraduate career plans?
3. How many brothers and sisters do (did) you have? (please listeach with his/her age)
IADD TOTAL SIBLINGS
4. Where did you grow up? (city and state, province, or country)(you may list more than one locality if your parents moved ·prior to your 18th birthday)

A . 244 ·
5. What was the religion in which you were raised? (mark thecategory and list the denomination, if called for)
L Catholic
L Protestantl
L Orthodox lL Jewish
L Buddist
__ Hindu nn
L Moslem‘
L Other
6. What is your present religious affilitation?
___ Catholic4
L Protestant
___ Orthodox
___ Jewish _
__ Budidst
L HinduÜ
___ MoslemL Other · '7. What is (was) your father's main occupation? (mark the category
and also list the job title)‘
L Professional and technical workers
L Managers, officials, proprietors, farm managers, and farmowners
4__ Clerical and sales workers
L Craftsmen, foremen, and operatives4
L Private household andrservice workers A
l
L_ Laborers - farm and non—farm

_245
8. What is (was) your mother's main occupation? (mark thecategory and also list the job title)
L Professional and technical workers
__ Managers, officials, proprietors, farm managers, andfarm owners
___ Clerical and sales workers
___ Private household and service workers
__ Laborers · farm and non-farm ,
9. Level of Educational Attainment
Parent: Father L
Mother L
L 0 years schooling
_z_ 1-6 years
L 7-9 years
10-l2 years (attended high school)
L completed high school or equivalent
L attended college (undergraduate) or technical school
L graduate from college (undergraduate) or technical school
L some graduate school or professional school experience
L holds master, professional, or Ph.D. degree·

246
10. In which category would you place your family's income?
L less than $5,000 per year
L between $5,000 and $10,000 per year '
L between $10,000 and $15,000 per year
L between $15,000 and $20,000 per year
_i_ between $20,000 and $25,000 per year
L between $25,000 and $30,000 per year „
L between $30,000 and $35,000 per year
V
, L between $35,000 and $40,000 per year
L between $40,000 and $45,000 per year
LQ between $45,000 and $50,000 per year -
_L_]; more than $50,000 per year
11. Between your birth and your eighteenth birthday, how manyyears was your father present (living and residing) inthe home in which you lived?
__ 0-years
L 1-5 years
L 6-10 years
__ 11-15 yearsf 2
__ 16-18 years —
12. If your father was not present the entire period of yourchildhood, at what age were you when he left (or died)?
ACTUAL NUMBER OF YEARS PRESENTH l H l
‘5

W 247
13.l
In what type of household were you raised? (if you lived inmore than one type of dwelling during your childhood, ages0-18, describe the one where you lived the most time or theone most memorable to you)·
Dwelling Conditions
Type of Dwelling Rent OvmU
L Project R 1 0 G
L Trailer R 2 O 3__ Apartment R 3
0-4
__ Condo R 4 O 5
L Duplex R 5 O 6__ House
4R 5 0 7
Care of Dwelling
_3__ Clean, neat, and orderly
L Not clean, neat, and orderly
Room/Person Ratio
L 1.5+ rooms per person
1.0 — 1.4 rooms per person
L Less than 1 room per person
Comments:14.
Was your mother home when you came home from school as achild?
L Always L Sometimes _Q_ Never

248 ·'
l
15. Did the family eat supper together?
_2_ Frequently
_]__ Seldom
_Q_‘Never V
16. Did you have a specific time to be in at night?
_Z; Yes” _]__
Sometimes (explain) ·
_Q_ No
17. Did you have to tell your parents where you weregoing when you went out at night? V
_2__ Yes
_]__Sometimes(explain)_Q_
No

249
L18. "Did you_have any specific chores around the house?
L Yes ‘
L At times (explain)
L NoL
19. Did the family do things together on weekends?
L Quite often
L Seldom · ·L
L Never
20. Did you attend Sunday school or other religious services
l regularly as a child?
L Yes ‘ '
L No
21. Of the following, which statement best describes the attitudeof your father held toward your school achievement?
L It was all important that I do wellU
L It was important that I do well
L He expressed no attitude on the subject
It was relativelyunimportantL
Education was worthless in the "real world" .. 22. Did your father volunteer aid when you did schoolwork?
L Often (more than 752 of the time)A
L Frequently (between 25% and 75% of the time)
L Seldom (less than 25% of the time)
L Never (0)

’250
23. ”How much time do (did) your father and you spend as leisureactivities (hobbies)?
#3 A great deal '
2 Some
1 Very little ~ _0 we never do (did)
24. How often does (did) your father read books (to your knowledge ·in your presence)?
14 Everyday °'
3 At least once a week
2 At least once a month
l A few times a year
0 Never ,
25. ‘Give me an estimate of the nuber of books your father reads(read) a year. SPECIAL CODING
26. Does (did) your father read newspapers, or other reading material?
3 Everyday
2 Often _”
1 Seldom LO Never
27. Öf the following, which statement would best describe the _ .attitude your mother held toward your school achievement?
4 It was all important that I do well ·3 It was important that I do well2 She expressed no attitude on the subject
A ”
1 It was really unimportantO Education was worthless in the "real world"
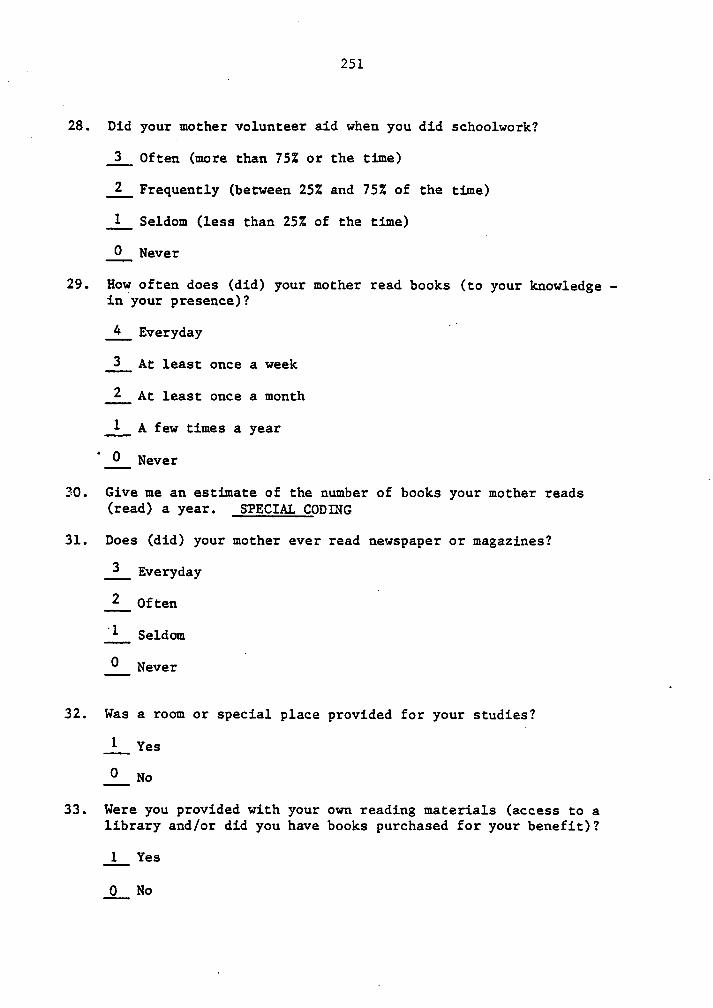
251
28. Did your mother volunteer aid when you did schoolwork?
L Often (more than 75% or the time)
L Frequently (between 25% and 75% of the time)
L Seldom (less than 25% of the time)
L Never
29. How often does (did) your mother read books (to your knowledge -in your presence)?
lL Everyday
ll
L At least once a week
L At least once a month
L A few times a year
‘L Never
30. Give me an estimate of the number of books your mother readsI
(read) a year. SPECIAL CODING
31. Does (did) your mother ever read newspaper or magazines?
L EverydayL Often l LL Seldom
L Nevern
32. Was a room or special place provided for your studies?
L Yes
L No
33. Were you provided with your own reading materials (access to alibrary and/or did you have books purchased for your benefit)?
L Yes
L No

252
34. -Did you own many personal possessions (toys, games, clothing)as a child?1 Yes
Q No
35. Did you have your own bedroom? -
2 YesDo NG 1 Part of my childhood V
° 36. What was your parents reaction when you got a bad mark inschool? (explain)
ANY REACTION = 1 [ NO REACTION =0e
37. What was your parents reaction when you misbehaved? (explain)7
ANY REACTION •1 / NO REACTION
-0
38. Which did you attend in elementary school?
A private school ' -A church school .
A public school ( _Other
39. Which did you attend in high school?
A private school _A church school
. A public school · ‘
Other
40. How many and to which clubs, societies, and organizationsdo you belong?
ADD TOTAL NO.

253
44l. How many of the SO states have you been to?
1 the one I'm in now
2 two to nine
3 ten to thirty—five
4 thirty—five to forty—nine
5 all fifty
42. Have you ever been abroad? Where? ADD NO. OF COUNTRIES
aa. Aiée ye}?
1 right—handed
2 ambidextrous (explain key uses of each hand)
3 left-handed

254
1' CODING OF THE NINE SOCIO-CULTURAL VARIABLES
I. NUMBER OF SIBLINGS
transfer total no. of siblings directly from Q.3II. FATHER'S OCCUPATIONAL LEVEL
question 7
III. PARENTAL EDUCATION
question 9; give credit for each parent's backgroundIV. FAMILY INCOME ~
question 10
V. FATHR PRESENCEV
transfer total years of Father's presence from Q.l2VI. DWELLING CONDITIONS
total numbers in Q.l3 '
VII. SUPERVISION AND INTERVENTION, PARENTAL
total responses from Q.l4—20
VIII. PARENTAL ATTITUDE TOWARD SCHOOL ACHIEVEMENT
total responses from Q.2l-37 _
Questions 25 and 30 are to be valued as follows:4
0 books O point
l-9 books V l point
· 10-19 books 2 pointsl
20-29 books 3 points”
etc. · .IX. VARIED SOCIAL EXPOSURE
total responses from Q.40-42 ‘

APPENDIX B
255

l 256
VV Appendix B
U.S. Census Bureau's Classification
System for Occupations
— Professional and technical workers '
- Managers, officials, proprietors, farm managers/owners
- Clerical and sales workers
- Craftsmen, foremen, and operativesU
· Private household and service workers
- Laborers -farm and non-farm

APPENDIX C
25 7

258 -
Aogendix C*
Parent Interview Schedule
The questions asked in the interview with the parent or parentsubstitute and the observation checklist used by the social worker arereproduced below. The questions have been grouned for presentationhere into the five categories that were considered in the sumaryratings of family characteristics. Questions used to obtain specific
· factusl information, and the checklist for noting living conditions arelisted separately. Scoring procedures are described herein but resultsare given in Chapter 5, Tables 18 and 19.
. I. Questions used for Summary Ratings '
A. Structure and Orderliness of the Home
1. What does X do when he comes home from school?2. Are you at home when the children come home from school?3. How much time does he spend watching TV?6. Does he bring friends home with him?S. Who eats supper with X?6. We'd like to get some idea of what you let X do and what
you don': let him do. Could you tell me?7. Does X have a specific time to be in at night?8. Does X tell you where he's going when he goes out?9. Does X have any jobs around the house? What?
10. Do you ask X to help with his younger brothers and sisters?11. Does the family do anything together on weekends?12. Did you send X to Sunday school?
Note: Observations on the care of the apartment and clothingwere also considered in rating this dimension.
B. Awareness of the Child as an Individual
„ 13. Tell me something about X.16. What would make you proudest of X?
- 15. What would ggg like him to be? What do you think gg wouldlike to be?
16. Does X spend much time with his friends?17. Are there any special activities after school (hobbies, clubs,
lessons, After School Study Center) .18. Does he have homework? ”19. What TV shows does X like best?20. Do you have to keep after him to get him to do the things
he's supposed to do? «21. What does he do when he has difficulty with a task?22. Who does most of the talking at supper? About what?23. How are X's brothers and sisters doing in school? Does X
look up to them?26. I wonder if you could tell me more about how you and X get
along?
Note: Item 6 was also considered in rating this dimension.*From: Davidson and Gr¤e¤b¢¥s- $¤h¤¤l Achievers from a Deprived Background. NY:Associated Ed. Servs. Corp., ]967, ERIC# EDO]3869. Reprinted by permission.

259 .
C. Concern for Education
25. How is X making out in school?26. How far would you like X to go in school? How far do you
think X will go in school? °
27. What kind of high school: a vocational or academic H.S?28. Have you discusaed plans for college with X?29. What do you think of the school X goes to? What do you
think of X's teacher?30. Do you visit the school?31. How well do you think the school is preparing X for the
future?32. How do you think a good education will help X?33. What subjects does X like best? Least?34. What would you do if X got a good mark in school?35. Did X know any of his numbers or how to write his name before
he started school? Who taught him?36. Did X go to nursery school before kindergarten?37. Did X ask you to read to him when he was younger? What age?38. How much time does he usually spend on his homework?39. Does ayone help him with his homework?
‘
40. Where does he do his homework?41. Do you have any books that he can look things up in?
”
42. Does be have a library card?43. Which of your relativcs has gone farthest in school? Does
X know him or look up to him?44. Are there any other adults that X is friendly with that he
_ looks up to?4S. What organizations do you belong to? PTA?46. Would you like X to have a life different in any way from yours?
* In what ways?
Note: Item 14 was also considered in rating this dimension.
D. General Social Awareness
47. Do you think conditions are better now than thev were 5 years- ago?
48. What organizations do you belong to?49. What ncwspapcrs and/or magazines do you read?50. Do you watch the news on TV?S1. What do you think of the civil rights groups?52. Which one do you think is doing the best job? ·
Note: Items 45 and 46 were also considered in rating this dimension.
E. Rationalitv of Discioline
53. What would you do if X got a bad mark in school?54. What do you do when X misbehaves?

260
II. Factual Questions on Home and Familv
1. What grade did you complete in school? What grade did X':father complete?
2. Are you (mother) working? Part—time or ful1·time? Whatkind of work do you do?
3. What kind of work does X': father do? Is he living at home?4. How many children do you have? Age? Sex? Occupation?S. Did X have any problem: with health when he was growing up?6. How old were you when he was born? Any problems connected
with his birth?7. Are your parents living with you? Are any married children
or other children living with you? ‘ ”
8. How many rooms do you have? How many bedrooma? Do you haveyour own bathroom?Do you have your own kitchen?
III. Observation Checklist ·
, 1. Apartment: 2. Condition of Building:Old Tenement AdequateNew Project DeterioratedRooming House Poorly cared for
3. Care of Apartment: 4. Books in Home:Clean and neat Yes NoPoorly cared for
TV in Home:Yes No
(5. Heating: 6. Ventilation:
Adequate Adequate ·Inadequate Inadequate
7. Clothing:Adequate Eor weather Cared forInadequate Neglected
' 8. People present at interview:

261 .
Scoring Procedure for Analysis of Variance
1. Score values are listed below to the right of each categorydeveloped for the family and school background status items. Thehighest score indicated the presumed most favorable end of the scale.The percentages of children in each of the four subgroups who fellinto each category are given in Chapter 5, Table 18.
Item Score Item Score
Adult Male in Home Educational Level+Father 2 High School Graduate 7Relative or other male 1 Some high school 6No male 0 Junior high graduate 5
Some junior high school 5Adult Female in Home Elementary school
Mother 2 5th, 6th grades 3-Relative or other Female 1 3rd, 5th grades 2
No female 0 1st, 2nd grades 1
Number of Children ·(Actual number of children Work Status of Mother -in family) . Full-time 2
Part—t:I.me 1Birth Order Not working ° 0
Oldest or only 2Middle 1 Attendance at Nursery and/Youngest 0 or Kindergarten
. Yes 1Type of Dwelling No 0
Living in Project 1Not in project 0 Number of Different Schools
AttendedCare of Apartment
Clean and Neat 1 1-Z schools 7,6Not clean; not neat 0 3-5 schools 5,5,3
6-7 schools 2,1_ Room/Person Ratio
(Number rooms, exclusive of Days Absent Annuallybathroom, divided by number Under 20 days 2of people in family) . 20 - 30 days 1
+Over 30 days 0
Occupational Level ,Skilled: manual 8 clerical 6,7,8,9*Semi-skilled: manual 8 ·
clerical 3,5,5* 1Unskilled: service _ Z
“
Not working 1
4-Based on the level reached by either mother or father, if living at'home.whichever was higher.
‘
*The numerical values correspond to the levels designated bv Hamburger (53).
I

’262
2. The actual ratings assigned for the psychological dimensions ofthe home were used in the analysis of variante procedure. Each of thefollowing dimensions was rated from 1. to S, with 5 representing thegreatest "amount."
A. Structure and Orderliness D. General Social Awarenessof the Home
B. Awareness of the Child as E. Rationality of Discipilinean Individual 1. Re Poor School Marks
A C. Concern for Education 2. Re Misbehavior
The percentage of agreement (within one scale point) between two ratersfor a sample of 24 cases ranged from 832 to 1002 for the five scales. ‘

APPENDIX D
263

264
~ (Hypotheses of Study I — Grubb, 1983)
Hypotheses of the present study
In line with the entire orientation of this paper, based on the "cultural
distance" interpretation of racial group comparisons, the following
predictions are made:
Hypothesis I:
Analysis of the raw IQ data scores between Black and White groups will
show the usual significant differences favoring Whites on the four
measures of IQ.
Hypothesis II:
There will be no initial difference between the racial groups on the
three memory/problem solving tasks.
Hypothesis III:
When certain cultural factors are covaried out of the test data, Black
and White differences will dissipate below the level of significance.

APPENDIX E
265
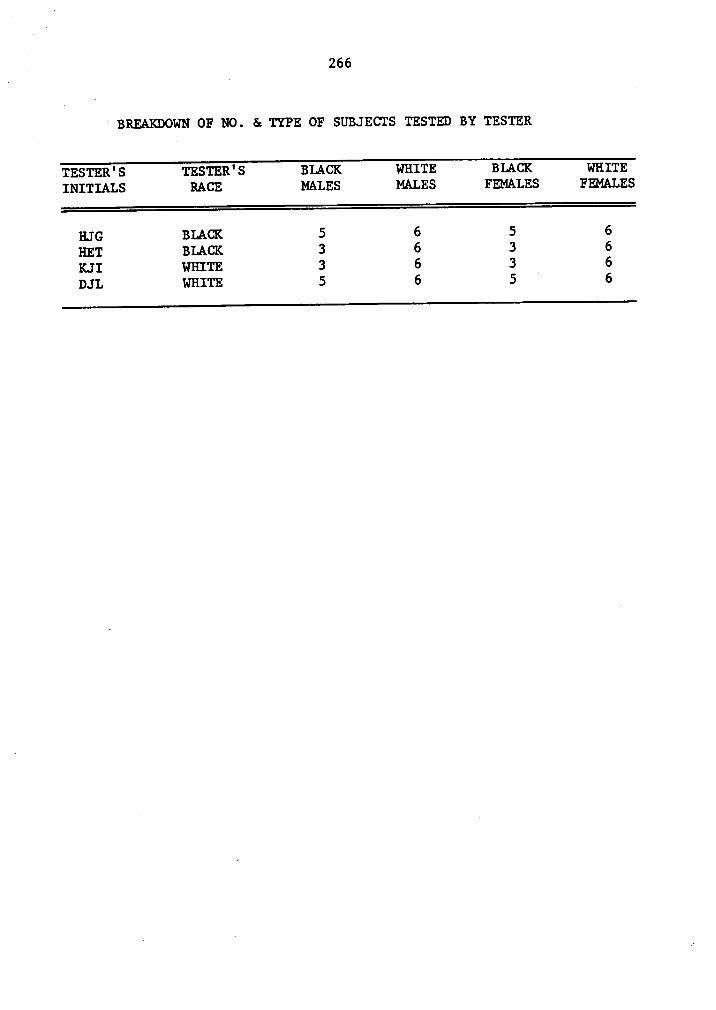
l266
A ‘ BREAKDOWN OF NO. & TYPE OF SUBJECTS TESTED BY TESTER
'1‘ESTER' S TESTER' S BLACK WHITE BLACK WHITEINITIALS RACE MALES MALES FEMALES FEMALES
HJG BLACK 5 6 5 6
HET BLACK 3 6 3 6
KJI WHITE 3 6 3 6
DJL WHITE 5 6 S 6

APPENDIX F
2676
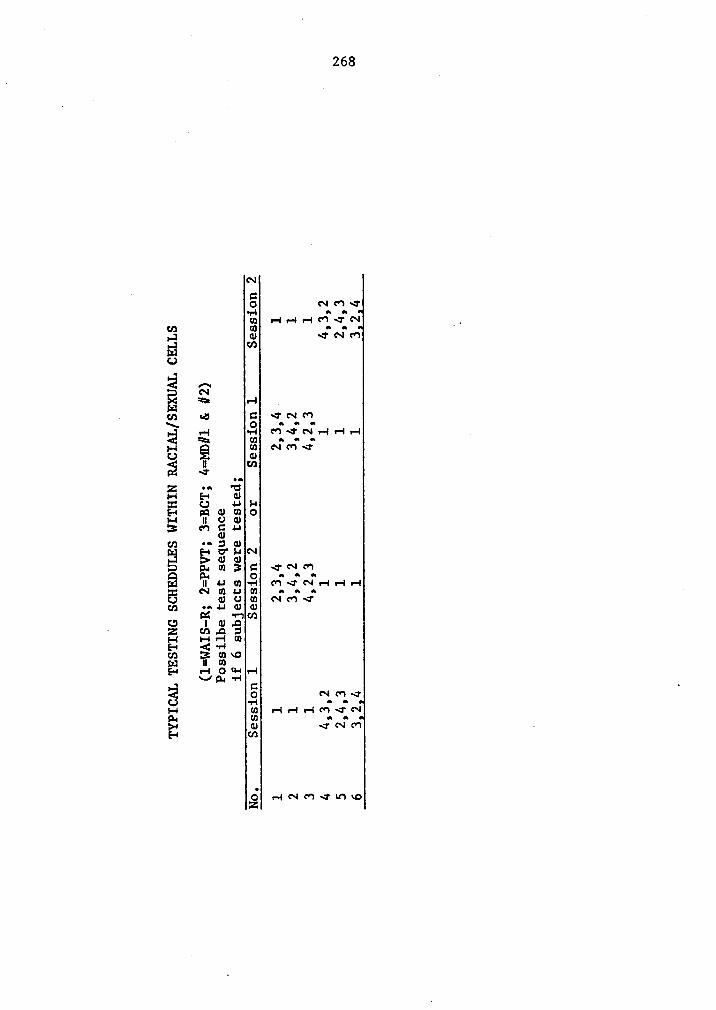
268
N
GO NMQ
•r-I anm r-lv-In-I¢"7Q€*|
Iß O) ••• ·'
Q eu <r~mU'}U
Ä ¢~g u-I
Fil« co ·a ¤ <r~m
Q Q an;
ä u-I •e-I ¢’IQN«-In-In-I‘°~äUI
••••• '
H Q U) NMQU Q)
é ll VJQ
OQ
Z •• 'UI" E dl
Q UI-4MQIWO
H IIUQJ3 mäuU: ••~¤aI;¤'l-IN
UG)¤-•¤¤3:-‘ <a-Nm
Q ße O•••
kl l|Um·¤·I OWQNI-In-Iv-I
äXUIJJW l••
mum NMQUI •~J-IGJQI
M ••'1<I1CD l¤„I„¤
' Z m.¤:II-( Hv-Im
ä §E§„¤lll IlmE·•
~H anH U) v-lv-Ir-l¢'1QN
ä 3 „;„·„„E-I cn
‘
O
O HNMQIOZ ND

APPENDIX G
269

270
l ‘ Phone #
Phone Instructions
You were involved in a psychology experiment last Spring (1983)which was useful in determining the relationship between IQ scores,intelligence, and school performance. The experiment was conducted byProfessor Henry Grubb in the Psychology Department.
Today, I'm calling in order to get two pieces of additionalinformation from you in order to complete some further analyses relatedto this project. We would appreciate your allowing us access to your(1) Spring 1983 QCA (grade point average) at Virginia Tech and (2) yourhigh school SAT scores.
Would you be willing to give me these two items of information nowor could we arrange a time to meet and disucss this further? Yourealize of course, that this information will be handled in thestrictest confidence and in no way will you ever be identified with iteither to the school or at any future time in the literature.
If possible we would like to have your permission to access thisinformation from the university computer because we fined that studentsoften are unable to remember their QCA after the passage of a year andalso usually do not bring copies of SAT scores with them to campus.
I: ApproveName
Does not ApproveAddress
Signature (if possible) Witness (or contact)
(QCA-Spring 1983)Overall Major (score) Major (title)
(SAT Scores)‘ Verbal Math Combined

„ APPENDIX H
27 1

A,272
4”Culture History Inventory of Learning Distance
E
4 (cuxw)l
[Personal. Data Questionuaire (PDQ) Coding Form:]
SOCIO-CUL‘11JR.AL VARIABLE RAW SCORE SCALED SCORE
I. SIBLINGS ·
-
(B)
BB. BBBBB— _ (B)
III. FAMILY MAKE—UP—
(B)
IV. FRIENDSHIP PATTERNS
_
(B)
V. FATHER PRESENCE (W)
VI. FATHER/FATHER-SUBPRESENCE*VII.FATHER'S OCCUPATION
—(W)
VIII. MOTHER'S OCCUPATION—
(W)
IX. PARENTAL EDUCATION—
(W)
X. FAMILY INCOME—
(W)
XI. DWELLING CONDITIONS
_
(W)
XII. SUPERVISION/INTERVENTION, PARENTAL—
(W)
XIII . OPENNESS/IMOTIONALITY
-
(B)
XIV . RELIGIOUSITY—
(B)
XV . RESILIENCE/REVITALIZATION—
(B)
XVI. PARENTAL ATIITIJDE/SCHOOL ACHIEVEMENT (W)
XVII. ORAL/WRITTEN TRADITION (Positive/Oral) + (B)
. ORAL/WRITTEN TRADITION (Negative/Wrt.) (W)
. B1—CULTURALISM*— '(W) (13)
XVIII. CONNECTEDNESS/E}(TENDED FAMILY ·—
(B)
XIX. FLUID/FIXED TIME PERSPECTIVE4
_
(B)
XX. SHARED SPACE/EXPERIENCE (B)
XXI. VARIED SOCIAL EXPOSURE—
(W)
Bm.TOTAL SCORE** (W) (B)_;‘D0
NOT ADD IN THETOTAL**ADD"(W)°° SCALED AND "(B)" SCALED SCORES SEPARATELY, SUBTPBACT
'°(B)" TOTAL FROM "(W)" TOTAL IO GET GRAND TOTAL (WAND TOTAL)

273
4‘ PERSONAL DATA QUESTIONNAIRE
(PDQ) Coding Form
Variable Question Score Total
I 3
II 4
III 5V u
6 (m. gran) 4 ·
4 6 (p. gran) _l_ A
° 6 (a, u, o) ___ ____
IV 7 (lx ) =
(2>< __) = _._
(2x ___) = _...
_ (lx __.) = .._
(2x ___) = ._.
(3x __> = ___ _..
V 9 __ __
8
10 __; ____ W

”274
-2*' ‘ PAGE 2
VII 11
VIII 12
IX 13 (f)
(M); ____
X 14l
‘
XI 1S (type)
1S (care)
15 (r/p) ______l
15 (bed)
· XII ' 16
17 .
18
19
20E
21
22 -l

275
· — PAGE 3V
XIII 23‘
24(f) ________.....
24 (m)
24 (b) _______________
24 (s)
24 (bf)
Conversion Scale
-9 -7 -5 -3 0 3 5 7 9I_I_I_I__I_I_I_I_I_I_I__I_I_I_I__I_I_I__II I I ,I I I I I I0 2 4 6 9 12 14 16 18
XIV 25 ' *
*All signs 26 *
must match
Conversion Scale-8 -4 0 4 8|_I_I_I_I_I_I_I_I_I_|__I_I_I_I_I_I
’ IIIIIIIIIIIIIIIIIO 4 8 12 16
XV 28* (+ ) + (·· ) = ( )*Add "+" and ‘ I"-“
seperately
~I

276‘ PAGE 4XV! 29
*Special 30
Coding 31
0 books 0 pt. 32
1-9 b. 1 pt. 33*
10-19b. 2 pt. 34
20-29b. 6 pe;. as
30-39b. 4 pt. 36
etc. 37
38*u
39‘
40l
41
·42 ________________
43- -
44
45
n Conversion Scale
O 2/8 4/8 6/8 1 2 3·4 5 6 7 8 >”
I_I_I_I_|_I_I_|_l_I_I_|_|__|_I_I__IIIIIIIIIIIIIIIIII
U _ 0 1 2 3 4 5 6 7 8 7 6 5 4 3 2 1 O
xv11 46*‘ . + (B) = I I
*record "-" and·—· = (B1-C)
"+" seperately - (W) + 1 = | |

l277_' PAGE S
XVIII _
4748
49
50a
SOb
_ 50cSOd
50e .
50f
50qu
50h
50i
50j
I SOk
50m
50:1
500
50pXIXl Sl$2
53A
.
S4E
___XX
55
S6S7
S8

» 278
” _ PAGE 6
xx1 S9 ___________
60
61
62 +.l-—T
XXII 63 __________ ....i.i.—-

A 279
PP•·11„onal Data Questionnaire (PDQ)
(Revised)
(Please ansvex all the following questions as they pertained to the aajoglty
ot your chilohooo; age: hirth to 1f- years) .
Name Date of Firth __________ Sex _________
Adaress (läowc) Face ____ n;,(_jm,,,1;,(_}· ___
__________________________________ }·l¤One· Hu. __________________________—
1. What is your px c-sent s-ajor(:=) and class year?
major (s) ___________________________ class year ___________________l
2. What is you: QCF, overall ano in your najor(:=)?
overall CC; ______ ___ _____ ¤-ajor(s) QCI- __ ______ ___
3. How many bxothexs ami sisters do (dia) you have? (please list eacn
with his/hex age)
-........-..-...-..-.... ...... -.ADl>.T;QL^L·_NAl‘£B.§”*~ _
41. where diü you grow up? (city and state, province, or country) (you uay
list more than on•· locali.1; ii your garents noveo prior to your 'Iotn
birthuay) .. llacc F ge Place Age
(1st)____ (öth) _______________ _____
(2nö) ________________________ ______ (7th) ____________________ ______
(3rd) ___________ ___; (bth) ___________+__i ____
(üth) _________________ ____ (9th) _____l_l___ __
(5th)b.
ln you; chilaöhooai none (2) any of the following; "exten•Ze«; :ami1y“
L•0l••l•€It> also 1<·:=iCe at any tin-e? (cntck those tnet apply)_____{_ __ G1érl1Ö}•a1'£·I•t5 (s)
2 Unclt-(sz)/I~uI:t (5)2 Couns-in (1 )
_____LOI•(]<•)-tive 1—i!·(s)
3 i*i¢·tiv•;· fin (nc-¤«!·ers of the fauilyunxelateé- L; l-lt-on? anti not
TOTAL aöo;~t«—(-)

V 280
PAGL 2 _
a, nid yad visit the folloving “extended ta¤ily” members (and nos orten)as a t‘\•i1d?°'uaternal or«.nd[a.rent:- _
°never vi:-ited_ X visited infrequently(less than once a year)___Q__ vi:.it•·d xegularly(at least once a year)
(l·etvt·en 7 and (•times a year)__ 4 visited 01 ten
(rore than 6 times a year or livedvith then)
Paternnl (—ren•f‘-arents _ 0 never Viiiitth__1__ vrsited inireguently__ 2 visited regularly_ 3 visited rreguently__ 4 visited often
aunts, Uncle:-., and Uthers _ 0 never visited~ __ X visited inireryuintlg
i___g__ visited regularly_ 3 visited ireguently_ 4 visited o1te·n ‘ -
7. Of the h iene; you had in childhood, how r-any fit into the followingCar.•·g0|;ies? (kiite I.\1|•-l-er)
_ same age (school grade) fIi€|n(.I.S2x older friends2x ye-UI-ga-1 ftieluit;
ir
y; __ sam-sex friendsg; _ ey-[osite-sex friends3x relative: a:— iriends (L-rothers, si: ters, cousins, e tc.)
8. Between your 1-irth and your eighreenth birthday, how many years ua;your father present (living and residing) in the home in uhrch youlivedé °_j__ 0 — years
l 1 - 1- years ‘2 6 - 10 years
· 3 11 - 11- years__j__ 1e. - 1L years
9. 11 you: fat!-er was not y~r:«-sent the entire [•éI'iOG or your chilcnoc-6, at ,I
what age were yon when he left (or: öied)?NUHBER OF YEARS PR£SH:l‘—_ __ _
10. now many year:. of your cl-ilrnood were spent in a hoL.• bhere a reale•'father-!'i.ger•-“ wa: present (if your Liological or aeoptive father va:not alualzs greselzt)?
0 L - year:l_ 1 · £~ years2 (
· 10 years3 11 · 11} years-_J•_ 10 — ‘Z{'
yx-ar:—

_ 281
A PAGE 3
-
11. hhat is (was) your father's main occupation? (nark the category andalso list the job title)__§__ Professional and technical workers ___ _____ __
5 Managers, ofiicials, proprietors, farm uanagers, andiaru owners __ __
__Q__ Clerical and sales workers ________ ___
3 Craftsmen, foremen, and operatives _2 Private household and service workers ___L__ Lahorers · farm and non—farm __ _______ _______
12. what is (was) your mother's main occupation? (mark the category dhd
also list the job title)_ 6 Professional and technical workers __ _____________
5 Managers, ofricials, proprietors, faru wanagers, andfarm owners _^ Clerical and sales workers _______ ________ __
_____ Craftsnen, forenen, and operatives __ __
2 Private housenold and service workers ___L__ Lahorers - farm and non-farm ____ _____ ______
13. Level of Educational Attainment:Parent: Father X
Mother 0 __
__L__ 0 years schooling2 1 - 6 years3 7 — S years6 _ 9 — 11 years (attended high school) -
__Q__ completed high school or eguivlent6 attendeo college (undergraduate) or technical school
__l__ graduate fror college (undergraduate) or technical school8 sone graduate school or professional school experience9 holds masters degree
_iQ__ holds professional, hd.D., Ph.D. or other terninal degree
1M. In which category would you place your family‘s income?__L__ less than $$,000 ger year__§__·netween $5,000 and $10,000 per year
3 between $10,000 and $15,000 per year__Q__ between $15,000 and 120,000 per year
5 between $20,000 and $25,000 per year6 between $25,000 and $30,000 per year
_ 7 between $30,000 and $35,000 per year__Q__ between $35,000 and $¤0,000 per year
9 between $L0,000 and §¤5,000 per yeél
]Q between $¤5,000 and $50,000 per year11 more than $50,000 per year

282
· PM;}. 11
15. ln what type oi household were you raiseu? (if you liveu in more thanone type of °d‘we1ling during your childhood, ages 0-18, describe the onewhere you livcd the host tine or the one host ¤e¤•orab1e_to you).
bwelling Conditions '
Type of Dwelling heut ownProject R 1 0 0
_ 1"rail•.·r 1: 2 0 3Apart:-ent F 3 0 4Condo F 4 0 5Duplex R 5 0 6House R 5 0 7
Care 01 Dwelling (mark all that apply)
1 Clean__ I Neal
1 Grderly
Room/Person Fatio____L 2.0+ rooas per person
3 1.5 - 7.0 roots per person___L_ 1.0 - 1.13 rooms per person__; 0.5 - 0.9 room per person
Ü Less thai: 0.51‘L•<·I• [ve! [~0ISOx¤
Sleeping Arrangements (the najority of your childhood)0 blept in multi—purpose room (example: slept on fold-out
couch in family room)___L Shared bed with sibling (s) or other relative(s)
2 Shared bedroom (but not bed) with sihling (s)or other relative (5)
___}__ Bad private hedroom
16. Has your mother hoae when you care home iron. school as a child?__L_ Always ·_ 1 Sonetines (explain) _ __
C Never
17. Did the ranily eat supper together?_ 2 Frequently___1__ Seloor.
0 Never
18. Did you have a specific time to be in at night?2 ve-e5l Sonnetim-x= (explain) ______ __ ___
__Q__ ho
19. uid yov have to te-ll your parents where you were going when you weht ·out at night?____L Ye?__J__ $o1=·etir.es (explain) ___________________________
0 No

283
- ·PAGL 5
20. At what hgU“Y0lP you first granted couplute ireedom to set all personal
' linits (sucH:as hour to he home at night, freedom to choose adult past-
tines such as drinking and smoking, etc.)?___L_ 21 years or older
6 20 years old5 19 years old
__JL_ 18 years old3 17 years oldi 10 years old
___L_ 13 · 15 years oldyounger than 13·years old
21. Did you have any speciric chorcs around the house?
2 lief;
1 at times (explain) ______ __ _____
O no
22. Did the family do things together on weekends?Z quite oftenl seldom
__j[_ never
23. Here you anle to talk openly to your parents about chircnood pronlems
such as dating, sex, drinking, or your emotions?
0 neverK
1 very little2 some; or as I got older
3 guite often and on certain topics
L very much so and always
2u. now would you describv the relationship you had with the rollovrrg
people:Father (or suhstitute male):__‘l_ very open and close (geniune)
2_ open but formal
1 distant0 very distant or no relationship
Mother (or substitute female):
3 Vet} open and C]0Se (génilllne)
' 2 open but formal___L_ distant
Q very distant or no relationship
Brother(s) (or male shustitutes):
3 very open and close (geniune)___g_ open hut formal
] distahtQ_ very distant or no relationship
Sister(s) (or female sehstitutes):
3 very open and close (genuine)
2 open Lut formal1 distant0 very distant or no relationship
Your rest Trient:___}_ very open and close (genuine)___Q_ open·Lut ferrtl
] distantG very distant er no relationshil

284
25. uid you utte-nu Sunday school or other religious services regularly as achild? "
* yes (2 ur -2, dependtng on valence in f 26 L 27)
0 ho
2b. What uns th•~ religion: in which you were raised? (sark tht category and
list the denon-ination, if called for)'1_ Catholic
1·rot•.·1-tant-1 Orthodox
_______________i__________;_1__ Jewish_g__ |‘uddi:.r__Q__ Hindu
| EoslenQ (ltlnelt
__
27. Hhat is your present religious. affiliatiou? nos often do you attend?
-1 Catholic , _Q_ tore often than once a week| f·rot•.·s.tant
____ _§__ every wa-ek_·1 orthooo: _ ___ 4 _ at least tvice „ luhila
-_;L__ Jewish X 3 at least once a month
0 Izuduis t_Z__ about ever y other month
0 Hindu__1__ betueen once end five Like:. a year
1 rloslen_<L_ less than once a year
0 Other
28. Hhich of the following sayings sost closely fit your religious orphilosophical outlook on life? (check all those you agree with)
‘1 what goes around oones around V
. ;__ you can never go hose again
- 1 ve have all sinned and are only saved hy ood-1 if nankino works at it, this earth could he a jiäiadise
1 there is a better tine to cose
··l if you make your bed, sleep in it1 ue are all one before the Lord
-1 nobody can really knos another person___1___ you can•t keep a good aan down _
-1 h(·rV•-I ö lehdet lr0l‘ it 1·(»l‘I0\•éI.' ht:
1 live life as it cose:--] one added strau can hreak a carel's hack
] all I have is tine-1 each s-an should carry bis ovn weight
y death is a part of life
· -] you must plan for progress
29. of the follosing, which stateaelzt best describes the attitudr- your
rather held tosard your school acnievenent?
g It was all in-yortant that I do sell__j__ lt wa:. important that 1 do well
Z lie eipressed no attitude on the subject
} lt was relatively unispor tant__Q___ Education eas uothless in the "real. vor ld"
30. Did your father voluntoer aid when yot did schoolvork?
3 Often (more than 757- of the tise)
2 Fregutntly (t·«·t•«o«—n 25; and 75; of tl-e tive)__L_ Seloon (less than 25; of thc time)__£__
Never (U)

285
.PAGE 7
31. Hov auch tiar do (did) your father and you spend at leisure activities(naanxae) ·¢_ °‘
3 k great dealZ Sone) very littleQ Ne never do (did)
32. now often does (did) your father read books (to your knowledge - in
your presence)?Q Everyday3 nt least once a weekZ At least once a month
1 L fen times a year_ Q Never
33. Give ue an estinnte of the number of books your rather reads (read) a
Year34.
Does (did) your father read nevespapers, or other reading aaterial?__;L_ Everyday
2 often1 SeldomG Never
35. Ot the following, which statevent would best describe the attitude your
nother held tovard your school achieveaent?L lt was all important that I do well
3 It was important that I do vell_
Z She expressed no attitude ou the subject
1 lt was relatively unimportantQ Education vae worthless in the "real world"
36. Did your mother volunteer aid when you did schoolvork?
3 often (nore than 752 01 the time)
Z Freguently (between 252 and 75% of the tiae)
] Seldor (less than Z5? of the time)
Q Never
37. Bou orten does (did) your mother read books (to your Küblledgk— in
ycut presence) ?4 tveryöay .3 At least once a veek
· 2 At least once a month
1 A few times a yearQ never
38. Give me an estimate of the nunhc: of books your mother reads (read) a
year Sggcial Coding . „
39. Does (did) your mother ever read newspaper or aagazines?3 Everyday2 Ufton1 Seldou
__JL_ never
40. nas a room or special place provided for your studies?1 Yes___Q_ no

_ 286
PAGL 8„ M1. here you provided with your ovn reading materials (access to a libraryand(or did {du have books purchased for your benetit)?
Yes'Ü No
N2. which most nearly describes your ymrents reaction to yoor schoolgrades?_ 3 extremely upset and vocal
Z upset1 little reaction_ 0 no big deal
Q3. which most nearly describes your parents reaction lu reported bacbehavior in school?3 extremely upset and vocalZ upset] little reactionQ no big deal
uu. which did you attend in eleoentary school?3 A private school2_ A church school1 A public school* Other (explain) Cvdß Eitbéf 1, 2• 3
M5. which did you attenu in high school?3 A private school2 Acmrdlxmmü] A public school‘·~= Other (explai ny Code Egger 1, 2, 3___
H6. pid your parents (or others) do any of the below? (check thöse‘tn¤tapply):-1_ read you “fairy—tales“ or other childrens books when you wereV ytlllhg
y tell you “ghost stories“ or other improvised tales based on folk-lore or built around certain themes___1_ sing songs with you_ 1 teach you songs hy singing them to and with you-1 teach you to read music or songs by use of music books-1 record your bahyhood in a baby book_;_l_ recount the family geneology through tales and stories1 sing with friends in your presence-1 leave written notes to you OH the refrigerator, by the phone, ozelsevhere
1 hold to the belief that "a man's word is his bond"-1 tell you to "aluays get it in writing"’-1 explain the meaning and use of a "little white lie"-1 write letters to relatives and friends-1 reguire you to write letters
1 use the telephone as a means of keeping in touch with otncrfamily members
¤7. brd (do) you and your father have many long talks?l_ }'tc$•Ü__ nt)
Mo. bid (do) you and your aorher have uauy long talks?---L- l==
Q ht.

· 287
I-AG!. 9
G9. hhich bert. e„•·sevril•e·s your chi ldhoou hohe on 6 typical evening?3 lots- dll Ctsunve-iuatiuln, vilnginnej, UIIFÄC, and/ul; unise2 sone eronveisation; oxderly di:-cu:-:—ionl very quiet, little verbal interaction ·
50. noe die? you learn he-v te-:aa Ritt- ·
l·it:}t.1tw _A_]„]__gg;ygg5_;__ Q: Sgigqp e''x‘
orZ · F-=*-·-=3I-.Tie- your ;.n•,,+- Signiftcant __ ____ __
c. Jun}- r1•}·•· jl • practice; 2 -__gb•egäig1E :__———
et. Pat H11 I, a ion. ______________________i____________;—l_
e. Cut. food vith a kniä
_ _
1''''9·h.
Dance :— —
1 . EGa'E'TEZi“'—“"°'_’“_"”"";'“"'""'“"°"°“'°°°:'_
. j. Ask 1'or a date ________:__:__________________________________
ka Fight
1. Tell time __—
a. Pla; che-cl-ers ________;____________________________
u. Fra}- a [•L(·*t·v|At
a. -:+,1111,+p.Hel}- ot.he·r:· ____ ___ ___
51. Which type- or person is (has) most like your father? (only cneck one)Q future oriented3 present oriented
' 1 past oriented
S2. Which ty}-e of person ie- (ua:.) no.-<t like your ¤·otne·r? (onl; check one)1 Analytical: I analyze things; look at the s+·}»erat+· parts one at
3 a tine____ Holistic: I feel things; look at the entire pxonlen
S3. How i••}—or·tant is (was) it {Ol your zather tc have definite plans aboutbis future?____Q_ ver y is}-e·rtn+„t___L_ ieportaant__ 3 nz little- importance!;__ unin-}„e,1·tant
SG. hot in.;-ortaxt is (1-ae:) pr‘e»n.}-tnesse tc- you: mother?0 ver; inportant___L i1}oxr«.¤·tl_ ot little- ir;.ortance=6 \llIi|'\}•Ul te ht

288
. PAGE 10
55.- Rho uade thd°najor decisions in your childhood home?0 your rather1 your mother4 sometimes either, deyending on the decision.Q_ both, as a tean
56. here the children consulted about major family oecisions?0 never1 on certain occassion3 usually4 always
57. bid your parents argue or svttle alguments in your presence?1 no, never2 sometimes3 yes, guite often
58. Here you alloweu in "adult conversations"?1 no
___Q_ sometimes, ae l got oldex3 yes, always
59. How many and to which clubs, societies, and organizations did youbelong to before coming to college (Ages 0 -1h)? (list them).
.............éQRl§LMaHEfü3.._................._.______________________
60. bid you own many personal possessions (toys, games) as a child?3 a 1 01.2 some1 only a few0 haräly any
61. How many of the 50 states have you Leen to?1 one
· Q two to nineQ} tele to bllnetecélxg twenty to twenty-nine5 thirty to thirty—hine5 forty to forty—nineZ all fifty
62. Have you even been abroad? __ hhere? __
I"63.
Are you?1 right—handedQ left-hanoed ,
amhidextrous (explain key uses o1 PÖCH hand)

i_ 289
V ' Qggigg gf the §oci0—Cultur;l Variables
I. NUMBEB OF SIBLINGStransfer total nunber of sihlings fron Question No. 3
”
ll. NUMbER OF CHILDHOOD HOMEStransfer total number of homes from Question No. H
III. PA¤lLY MAKE-UPtotal responses fron Questions No. 5 and 6
IV. PRIENDSHIP PATTELNSQuestion No. 7
V. FATHER PRESFNCEtransfer total years of father°s presence from Question No. 9
VI. FATHBR AND FATn£R—SUBSTITUTL PRESENCEtotal responses from Questions No. 8 and 10
Vll. FATH£R'S OCCUPATIONAL LEVELQuestion Ro. 11
Vlll. ¤0THER'S OCCUPATIOHAL LEVELQuestion Ho. 12
'IX. PARENTAL BDUCATIONQuestion No. 13, give credit for each parent•s background -
X. FAMILY IRCOEEQuestion No. 1¤
XI. DHELLING CORDITIONStotals from Question No. 15
XII. SUPEFVISION APD INTFEVENTIOH, PABENTALtotal responses from Questions No. 16 - 22
XIII. OPENNBSS TO FEFLINGS, BMOTIOHAL VITALITYtotal responses from Questions No. 23 and 2¤
XIV. RBLIGIOUSITYtotal responses fro» Questions Ho. 25 and 26
plus result of Question No. 27
XV. RESILIENCE nun EBVITALIZATIONtotals Lrou Question Ho. 26
XVI. PARENTAL ATTIIUTE TOWAFD SCHOOL ACHIBVEHENTtotal responses to Questions No. 29 - ¤5
Questions No. 33 and 38 are to be valued as follovs:
0 books C point1-9 books 1 point
10-19 Looks 2 points20-29 books 3 points30-39 books u points
etc.
— 290
> _ PAGE 2
XVII. IITBRGEFLRATIONAL COMMUNICATION (ORAL VS. HBITTEN)Question Io. 06
XVIII. CONNECTEDNLSS/FXTLNDED FAMILY PATTERNStotals fron Questions No. H7-S0
XIX. TIME PERSPLCTIVF (FLUID VS. FIXFD)Questions Ro. 51-5¤
XX. SHARED PARTICIFATORY SPACE/LIPERIHNCLQuestions No. 55-58
XXI. VARIED SOCIAL EXPOSUREtotal responses from Questions No. 59-62
XXII. HANDBDFESS_Question No. 63

APPENDIX I
291 · »A

6_ 292
SOCIAL PERFORMANCE QUESTIONNAIRE
·· (SPQ) ··6
Coding Form
Variable Question Score Total
I l _______ ______
II 2
III 4 _
IV _ 5 _i__ _________;
V 6 .

‘ . 293
PV
— PAGE 2
'VI 7
8 _i....9;_____VII
11
VIII 12
IX 13 =
14 trips
(13) __________ x (14) =
mileaqe
X ° 14
15 =
_ calls
(14) x (15) =
cal1—milesQ
XI 164
17
18 __________ __________

_” 294
PAGE 3
XII 19
20 ___________ __________
XIII 21
22 ___________ __________
XIV ' 23 _ '
XV 24
25 __________ __________
_ XVI 26
XVII 27 (f)
27 (s) __________
27 (3) ___._„.
27 (sr)I
avéfaqé

1 295
·PAGE 4
XVIII
(XII) - [2 x (XVI) l=

. 296
· Social Performance Questionnaire (SPQ)
Name Date of Birth Sex
Address (Local) Race Nationality
Phone No.
(Record class year:
1. what is your present major(s) and class year?”?V-?;?$°N“
_
major(s) classyear2.
How many years have you attended college? (include this
year)1 1 yr.E 2 yrs.
2 3 yrs.E 4 yrs.E 5 yrs.
~6 yrs.
3. What is your QCA, overall and in your major?‘
overall QCA major(s) QCA
M4. How many visits have you made to the Counseling Center.
‘¤ havet
L one give examples or reasons
1 two; three
E four, five, sixT seven to twelve
~ more than twelve
5. How many classes have you dropped.
. nonez one
4 twothreefour
...... Eye. 2s.¤12e.¤s_...-....._
°6. What is the average number of credit Hours you Have carried
per quarter.= 6 or less hours
- 7 or 8 hours9 hours
· 10 or 11 hours12 to 15 hours16 to 18 hours _
- 19 or more hours
7. How many courses have you taken? (give total number,
including present courses)‘“»¤o«;
A.)

· . 297
u° _ PAGE 2
8. How many courses outside your major have you taken? (give. total number) (R¤¢¤Yd 50-)
I9. How many summer sessions, of those possible (2 per summer),
have you attended? (give total number)
Tccoru lumher
10. Why do you (or don't you) attend summer sessions.
11. Which of the following are presently problems for you?
_ (check those applicable)1 dating1 leisure activities1 academics1 study habits4 family relationships
· 1 making friends4 money’ 1 health
u12. How often do youdate?1
once or less per month·· between two and four times per month= once a weeke twice a week~a more than twice a week
"°°‘"“°"“”“"“‘ ‘ ‘
1 once or less a quarter
· two or three times per quarter zi once a month \· 2 more often than once a month ‘
Ü"\14. How far do you live from your parents home in miles?
I ' «""·,.·-„‘ '¢'2.1 I
1 15. How often do you talk to your parents by telephone?
Q E once or less a quarterE two or three times a quarter
Q — once a month1 two or three times a month’ xn once a week1 —.....‘ 4. more often than once a week
16. How many organizations do you belong to now? (name them)
17. How many hobbies do you have? (name them)

„ 298
· - PAGE 3
18. What sports do you participate in at present? (name them)-_ Y‘ccora '1'oLu]. . answer:)
19. How many people can you turn to for help here when you arehaving trouble?
1 none1 one . ·1 two or three6 four or five6 six to ten -Q more than ten
20. How many people do you feel obligated to help in their time
of need (here in college)?ü none1 one3 two or threeA four or five„ six to ten; more than ten
21. Do you live alone?2 yes
2 no, with one other~ no, with more than one other
22. Do you live:X on campus?1 off-campus?
23. Do you have part·time work?5 no1 yes
24. Do you enjoy college?1 not at allL some
' L mostlyS every minute
25. Do you feel comfortalbe in college?· not at all
some of the time. most of the time2 all of the time
26. How many of your friends from High School currently attend
this college?‘ noneonetwo or threefour or five
« six to tenmore than ten

V (_ 299
u ~ PAGE 4
27. Rate your adjustment to college for each year you have
_ attended. (on a scale from 1-very poor adjustment to 7·very
good adjustment).
FI'€Sh¤\3¤-
(RECORD No. & FRACTION MARKED)
Very_ Very
Poor Poor Fair Good Good
I ·———·——·· I —·—··—·—· I ——···———— I ——-·——·—— I -——-————— I -————··—— I1 2 3 4 5 6 7
SophmoreVery
Very
Poor Poor Fair Good Good
I —··——·—·· I ·—····—·· I ·—····—·· I ·—··—···· I ·—···—·—· I ···—···—· I1 2 3 4 S 6 7
JuniorVery
Very
Poor Poor Fair Good Good
. I —··—··—·· I —·—··—·—— I ——————·—— I ————————— I ———·———·· I —·——————— I1 2 3 4 5 6 7
SeniorVery
Very
Poor Poor Fair Good Good
I —··—··—·· I —··—————· I —··—····· I ·—·—·———— I ·———————— I ·——··—·—· I1 2 3 4 5 6 7
28. What is the worst problem you have faced here at college?
29. Any other comments you may have that concern your adjustment
to college living:

' 300
-Coding gf the Social-Adaptation Variables
I. CLASS STANDINGQuantify class year from Question No. 1
II. YEARS IN COLLEGErecord number from Question No. 2 .
III. COUNSELINGQuestion No. 4
IV. DROPPED CLASSESQuestion No. 5
V. HOURS CARRIEDQuestion No. 6
VI. ACADEMIC EXPOSUREtotal from Questions No. 7, 8, and 9
VII. PROBLEMStotal responses to Question No. 11
°
VIII. DATINGQuestion No. 12
_ IX. HOME VISITS(A.) TRIPS HOME
Question No. 13/
(B.) EQUIVALENT MILEAGEresponse to Question No. 13 multiplied by
total from Question No. 14
X. HOME CALLS(A.) CALLS HOME
Question No. 15(B.) CALL-MILES
response to Question No. 15 multiplied by
_ total from Question No. 14
XI. EXTRACURRICULAR ACTIVITIES_ totals from Questions No. 16, 17, 18
XII. PEER SUPPORTtotal responses from Questions No. 19 and 20
XIII. HOUSINGtotals from Questions No. 21 and 22
XVI. WORKQuestion No. 23
XV. COLLEGE FITadd Questions No. 24 and 25

· . 301
I PAGE 2
'XVI. HOME TOWN PALSQuestion No. 26 .
XVII. COLLEGE ADJUSTMENTdetermine mean of all responses to Question No. 27
XVIII. NEW PEER GROUP FORMATIONsubtract two times Variable No. XVI (HOME TOWN PALS)
from Variable No. XII (PEER SUPPORT)

APPENDIX J
302

303
Department of Psychology - HJG-02 Subject No.
CONSENT FORM
The purpose of this research is to investigate the relationship
of IQ scores and performance on learning tasks, and to evaluate both
sets of behaviors as a function of early environmental conditions and as
predictors of later academic functioning. You will be asked to fill out
a social performance questionnaire and a personal data questionnaire
that will give the investigators a general understanding of your current
adjustment and personal learning history. You will also be required to
take two tests which are often used to assess general intelligence and
to perform a learning task which will involve memory and problem
solving. Finally, a personality inventory will be given you and per-
mission to examine your academic record requested.
The total assessment procedure will take 3-hours, divided into 2 -1% hour sessions. For your participation in this research, you will
receive 3-bonus points toward your grade in Introductory Psychology
(Psych. 2000). If you should only attend the first test session, you
will receive l-bonus point.
Your responses on the questionnaires and the three assessment
devices will be used to explore the relationships among IQ test scores,
personality measures, and performance measures with different age,
sexual, ethnic, cultural, and religious groups. All information you
provide will be kept strictly confidential and will not be seen by
anyone outside of our research staff. Your participation is voluntary
and you are free at any time during this session to discontinue your
participation without penalty.
Upon completion of all testing your name and any other identifying
information such as telephone number and address, will be removed from
your file. From that point forward only a code number will differentiate
your test responses from other students in this study. Your QCA and SAT
scores will be seen only by the majorinvestigator, and once the infor-
mation is obtained, the consent form with your name and signature will
be destroyed and the records will only be identified with your code
number.
‘ All records will be kept under lock, available to the two re-
searchers only. No other use but what has been stated above will ever
be made of the data collected. Should the results of this study ever
be published in a scientific journal, no personal identification of
any particular subject will ever be made.
If you have any questions regarding the research at this point,
please feel free to ask the experimenter for clarification. We thank
you for your help in this endeavor.

·304
_ ” ‘ Page 2
Henry J. Grubb Thomas H. Ollendick William W. Schicht
Research Director Research Advisor Human Subjects Coord.
961-5388 961-6451 961-5346
I have read the above statement and am aware of the conditions of
my participation in this research. I understand that all information I
provide will be kept confidential and I am free to withdraw my partici-
pation, or refuse to answer any question or questions, at any time.
Student's Name (please print) Student Signature
Please list the course (and Student ID#
instructor) where extra credit
will be applied.
Date

APPENDIX K
_ _ 305

W 306
U‘ General Instructions
You are going to be given two intelligence tests, a standard
personality inventory, and a learning task during this and one other
period. The total time involved is about three hours. You will also
be given a Personal Data Questionnaire and a Social Performance
Questionnaire to fill out.
The first questionnaire is about the environmental and family
aspects of your childhood, ages birth to 18; the second is concerned
with your present life at college. The entire assessment you will
undergo is to be used in determining the relationship between IQ and
social performance, and their predictive value for academic functioning
with certain populations based on demographic data and learning
histories.
We will also be reviewing your High School QCA, your SAT scores,
and your college QCA in order to determine the predictive value of these
various tests.
If you have any questions at this time please feel free to ask them.
Once the test procedures begin, I will be limited to the responses I can
make specified by the instructions and guidelines of the individual
tests.

APPENDIX L
307

_ 308
1Permission to Review Records
I grant Henry J. Grubb, M.S., when bearing this signed document,
to review my official scholastic records in order to aid a scientific
study of the effects of social forces on educational achievement. The
investigator reviewing my academic record will be interested in, and
therefore only allowed access to, four factors: (l) my QCA, (2) my SAT
scores, (3) my High School standing, and (4) my High School QCA.
Name of Student Granting Signature of Student
Permission - Please Print
Witness Signature Date
(Va Tech QCA - SPRING 1984)Overall (Score) (Major Score) (Major Title)
(SAT Scores)Verbal Math Combined °
HIGH SCHOOL — QCA& Standing QCA (FINAL) STANING (Z) STANING (No.)
Class Size

APPENDIX M
309

310
· Final Question (W)
How strongly do you identify with White middle-class American valuesystem? (Rate your identification on the seven-point scale below:l = do not identify with the value system / 7 = completely identifywith the value system).
Do not Weakly Moderately Strongly CompletelyIdentify Identify Identify Identify Identify
I----—-----I---------—I----------I----------I----------I-—--------Il 2 3 4 5 6 7

4311
' Final Question (B)
How strongly do you identify with the Black-American sub-culture?
(Note your identification on the seven-point scale below: 1 = do not
. identify with the sub-culture / 7 = completel identify with the sub-
culture).
Do not Weakly Moderately Strongly Completely
Identify Identify Identify Identify Identify
I-·--—---—-I---------—I----—---—-I---·--—---I-------——-I--·—---—-—I1 2 3 4 5 6 7

CURRICULUM VITAE
312

20