Towards production-level cardiac image analysis with grids
10
Towards Production-level Cardiac Image Analysis with Grids Ketan MAHESHWARI a,1 , Tristan GLATARD b , Joël SCHAERER b , Bertrand DELHAY b , Sorina CAMARASU-POP b , Patrick CLARYSSE b and Johan MONTAGNAT a a University of Nice – Sophia Antipolis / CNRS, I3S laboratory, 06903 Sophia Antipolis, France. b University Lyon 1, CREATIS-LRMN; CNRS UMR5220; Inserm U630; INSA-Lyon; France. Abstract. Production exploitation of cardiac image analysis tools is hampered by the lack of proper IT infrastructure in health institutions, the non trivial integration of heterogeneous codes in coherent analysis procedures, and the need to achieve complete automation of these methods. HealthGrids are promising technologies to address these difficulties. This paper details how they can be complemented by high level problem solving environments such as workflow managers to improve the performance of applications both in terms of execution time and robustness of re- sults. Two of the most important important cardiac image analysis tasks are consid- ered, namely myocardium segmentation and motion estimation in a 4D sequence. Results are shown on the corresponding pipelines, using two different execution environments on the EGEE grid production infrastructure. Keywords. Cardiac image analysis, workflow enactment, grid computing, production. 1. Production-level Cardiac Image Sequences Analysis Cardiac diseases are one of the major causes of death in industrial countries. Cardiac di- agnosis is increasingly relying on temporal sequences of 3D images acquired using fast Magnetic Resonance Imaging (MRI) sequences. Such sequences, routinely acquired in hospitals, represent wealth of imaging data which require processing to extract mean- ingful quantitative parameters useful for diagnosis. Cardiac image analysis procedures are applied to analyze the patient heart status, through e.g. studies of the heart shape (myocardium segmentation) and heart motion (myocardial motion estimation). Although analysis methods are actively developed and tested in research, image se- quences are still often exploited manually in clinics, despite the extremely tedious work involved, such as the delineation of the myocardial contours in complete time series of MR slice stacks. Usage of analysis tools in production is hampered by several factors including (F1) the integration of heterogeneous codes to conduct the analysis, (F2) the need to fine-tune analysis parameters to adapt to the variability among images and (F3) 1 Corresponding Author: Ketan Maheshwari, http://www.i3s.unice.fr/~ketan
Transcript of Towards production-level cardiac image analysis with grids

Towards Production-level Cardiac ImageAnalysis with Grids
Ketan MAHESHWARI a,1, Tristan GLATARD b, Joël SCHAERER b,Bertrand DELHAY b, Sorina CAMARASU-POP b, Patrick CLARYSSE b and
Johan MONTAGNAT a
a University of Nice – Sophia Antipolis / CNRS, I3S laboratory, 06903 Sophia Antipolis,France.
b University Lyon 1, CREATIS-LRMN; CNRS UMR5220; Inserm U630; INSA-Lyon;France.
Abstract. Production exploitation of cardiac image analysis tools is hampered bythe lack of proper IT infrastructure in health institutions, the non trivial integrationof heterogeneous codes in coherent analysis procedures, and the need to achievecomplete automation of these methods. HealthGrids are promising technologies toaddress these difficulties. This paper details how they can be complemented by highlevel problem solving environments such as workflow managers to improve theperformance of applications both in terms of execution time and robustness of re-sults. Two of the most important important cardiac image analysis tasks are consid-ered, namely myocardium segmentation and motion estimation in a 4D sequence.Results are shown on the corresponding pipelines, using two different executionenvironments on the EGEE grid production infrastructure.
Keywords. Cardiac image analysis, workflow enactment, grid computing, production.
1. Production-level Cardiac Image Sequences Analysis
Cardiac diseases are one of the major causes of death in industrial countries. Cardiac di-agnosis is increasingly relying on temporal sequences of 3D images acquired using fastMagnetic Resonance Imaging (MRI) sequences. Such sequences, routinely acquired inhospitals, represent wealth of imaging data which require processing to extract mean-ingful quantitative parameters useful for diagnosis. Cardiac image analysis proceduresare applied to analyze the patient heart status, through e.g. studies of the heart shape(myocardium segmentation) and heart motion (myocardial motion estimation).
Although analysis methods are actively developed and tested in research, image se-quences are still often exploited manually in clinics, despite the extremely tedious workinvolved, such as the delineation of the myocardial contours in complete time series ofMR slice stacks. Usage of analysis tools in production is hampered by several factorsincluding (F1) the integration of heterogeneous codes to conduct the analysis, (F2) theneed to fine-tune analysis parameters to adapt to the variability among images and (F3)
1Corresponding Author: Ketan Maheshwari, http://www.i3s.unice.fr/~ketan

the associated computing and data storage requirements when dealing with large imagedatabases.
HealthGrids are appealing to address those challenges. Concerning (F1), workflowtechnology can be considered. Pipeline-based image processing tools with a visual pro-gramming interface, such as the commercial Khoros and AVS tools, have been widelyused by non-expert end users. In the medical image analysis community, the ITK2 opensource library has become a de facto standard providing a pipeline design API. In ourwork, we study workflow technology to provide similar functionality in a HealthGridproduction environment. Unlike Khoros or AVS, the workflow managers are intrinsicallyparallel execution engines able to outsource computations on distributed units, as well asexploiting local resources. In addition, the model adopted for pipelines description is aloosely coupled workflow of application services. Unlike ITK, this does not require codeintegration and compilation in a single unit. Heterogeneous application codes are em-barked in the workflows, thus maximizing flexibility and providing easy reconfigurationfor pipeline prototyping and parameter sweep studies set up.
Regarding (F2), complete automation is a complex problem due to the difficulty toautomatically tune algorithms to adapt to various images and the need for expert valida-tion. Parameter-sweeps can be considered to cope with this issue. In HealthGrids, they al-ready have been used to perform validation (e.g, in [8] for functional MRI) or large-scalepopulation studies for instance in neuroimaging [10]. Such experiments are naturally ex-pressed in workflow languages and executed in a distributed infrastructure with engineslike Taverna [7], MOTEUR [4] or Nimrod-G [15]. Wrapper tools such as GASW [3] orSoaplab [14] facilitate the integration of tools in those environments.
Finally, (F3) can be addressed by leveraging the resources made available by pro-duction grids like EGEE3 which provides a computational back-end that is often lack-ing in clinical centers to support secured and data intensive applications. However, thoseplatforms also provide high latencies and low reliability as a downside of the comput-ing power and storage capacity. For instance, [1] reports a 55% error ratio on a metage-nomics application. In this context, exploiting local computing resources for part of theexperiment can yield better performance.
In this paper we study the ability of HealthGrids to support production-level car-diac image analysis. First, pipelines implementing myocardium segmentation and car-diac motion estimation are described. Then, parameter-sweep experiments are shown onthe segmentation pipeline to tune initialization and deformation parameters with the aimto go towards an automatic method. Finally, a performance comparison of the motionestimation pipeline running on EGEE versus local resources is presented, evaluating thetrade-off between grid and local execution.
2. Cardiac Image Sequence Analysis Pipelines
Two cardiac analysis pipelines developed in the context of the GWENDIA4 project areconsidered for experimentation (see figure 1). The myocardium segmentation pipeline is
2Insight ToolKit, http://www.kitware.com/3Enabling Grids for E-sciencE, http://www.eu-egee.org4Grid Workflows Enactment of Data Intensive Applications project, http://gwendia.polytech.
unice.fr

3D images
mhd2qc
InitModel
det3D4
Resultmesh
Transformationspace
Force factorConvertedimages
Initializedtemplate
Deformedtemplate
Templatemodel
Patient Image ID
BorderDetect ion
Image Crop
Interpolat ion
Gradient Computing
Motion Estimation
Image Pyr Decomposit ion
Results
Image Slices
Cropped Slices
3D Images
Multi level Images
Border InfoGradient Info
Results
Multi level Images
ROI
ROI
Figure 1. Myocardium segmentation (left) and motion estimation (right) pipelines.
an elastic template-based left and right myocardium extraction procedure. Segmentationis a process sensitive to initial conditions and which needs to be tuned to take into accountthe patient specific image properties. The heart Motion Estimation pipeline is a multi-step workflow extracting a dense vector field for each time instant of the sequence whichestimates the heart structure motion between successive image pairs. This pipeline fea-tures a computer intensive algorithm and is used for performance tuning. Both pipelinesare designed to process the same multislice and multiphase Cine MRI databases.
2.1. Myocardial Segmentation
To achieve automated batch processing of patient data, the segmentation pipeline stepsshould require as little human intervention as possible. Segmentation traditionally in-volves manual steps for initialization and results checking. Grid technology can help byproviding workflows management tools to perform sweeps on application parameters asexemplified in [11] for brain segmentation.
In this study, we consider the myocardium segmentation pipeline represented in fig-ure 1 (left), composed of three steps:
• mhd2qc is a conversion step working on 3D volumes produced by the interpola-tion step;
• InitModel is the initialization, during which an a priori heart model is posi-tioned close to the heart using affine transform;
• det3D4 is the segmentation step itself, which deforms the model to fit the my-ocardial borders.

The two last steps usually require human intervention: initialization is performed underuser control by interactively positioning the model in the 3D space close to the heart. Thecorrectness of the segmentation is visually checked and validated by a physician.
In addition to the data itself (3D images), this workflow requires a volumetric priortemplate mesh model representing the geometry of the heart interfaces and cavities. Thistemplate also carries mechanical properties of the heart tissues. It is first placed withinthe image close to the structure to be extracted. To achieve an automated procedure forinitialization, a random search was implemented. A transformation space (i.e. min/maxvalues for the 7 parameters describing translation and rotation in 3D as well as isotropicscaling) is randomly browsed, computing a closeness measure (energy) between themodel and the myocardium for each candidate transformation. Parameters leading to thebest energy are kept to initialize the template model for the segmentation step.
The segmentation algorithm is based on a Deformable Elastic Template [12,13]. Thetemplate mesh is deformed iteratively by applying a force field so that its edges stick tothe borders of the targeted structure. Gradient and edge information is first extracted fromthe 3D images composing the cardiac image sequence. Edge maps are derived into Gra-dient Vector Fields that guide the deformation process through a classical energy mini-mization procedure. The force field is weighted w.r.t the template prior with a parametercoined force factor: the higher the force factor, the higher influence the data has duringthe deformation process. To improve convergence speed and accuracy, a multi-resolutionapproach is implemented for both the model and the image.
2.2. Cardiac Motion Estimation
The Motion Estimation pipeline is graphically represented in Figure 1 (right). The firststep is a cropping applied to a series of DICOM slices identified by a patient ID. ARegion Of Interest (ROI) is used to crop all the images around the heart region. Next,3D images are assembled and the data set is isotropically interpolated. To speed-up andimprove robustness of the Motion Estimation process, the isotropic images are under-sampled into a multi-resolution pyramid. Gradient and edges are then extracted at eachresolution level. Finally, the motion inside the region of interest is estimated through-out the sequence based on non rigid registrations between consecutive image pairs (freeform deformations with the sum of squared difference as similarity measure) [2]. Motionestimation is a compute intensive process which execution time is unacceptable whendealing with large data sets.
2.3. Workflow Managers
Workflows presented above can be executed by MOTEUR and Taverna. In these frame-works, a workflow is described as a collection of processors connected by data links,which establish a dependency between the output(s) of a processor and the input(s) ofa subsequent one. The engine orchestrates the execution of the processors in a way thatis consistent with the dependencies. It manages the flow of data through the processors.The execution is driven by a push model: a processor’s execution is started as soon as allof its inputs are available. It is important to note that the pipelines pictured in figure 1 aredesigned for processing multiple patient image databases. Computation tasks are gener-ated for all processing steps and all images considered in the experiments. The execu-

tion of the workflows is optimized by exploiting coarse level parallelism: independentcomputing tasks and independent data sets can be processed concurrently.
MOTEUR. MOTEUR5 is a data-intensive workflow manager interfaced to EGEEthrough a Grid Application Service Wrapper (GASW). It was designed for maximal per-formance and it exploits three levels of parallelism that are implicitly expressed in theworkflow and its data sets. First, MOTEUR concurrently enacts independent branchesof the workflow. Second, it performs pipelining: the workflow stages are pipelined withdifferent data items to be processed. Third, MOTEUR exploits data parallelism: a samestage is concurrently enacted for all independent data items to be processed.
Taverna. Taverna6 version 2, is a dataflow manager developed by the myGrid consor-tium. It includes a GUI-based rich-client workbench for workflow design and a workflowenactment engine. The default enactment mode of Taverna 2 is pipelining. In additionTaverna 2 provides a so called "super-pipelining" execution mode that corresponds toMOTEUR’s data parallelism. Taverna 2 supports various processor types invocation, in-cluding local execution and Web Services. The core of Taverna 2 was extended throughan EGEE plugin that automates grid jobs submissions and data transfers to the grid nodes.
2.4. Data
A set of 10 MRI examinations on patients has been collected for this study. Cardiac cineMR images were acquired with a 1.5 T magnetic resonance Sonata scanner (Siemens, Er-langen) at the Cardiology Hospital of Lyon, France. An ECG-gated True-Fisp sequencewas used to acquire 5 to 11 short-axis cine slices covering the heart with 208-240×256pixel matrix, 5-7 mm slice thickness, 10-12 mm slice-spacing. Each sequence was com-posed of 11 to 30 frames over the cardiac cycle.
3. Parameter-sweeps for Segmentation Automation
3.1. Infrastructure setup
Experiments described in this section were performed using the MOTEUR workflowmanager for execution [4] and the VBrowser interface for data management [9]. TheEGEE Logical File Catalog (LFC) was used for data management, all the files beingstored on a single Storage Element (SE). To ease prototyping for those early experiments,jobs were submitted on a local server featuring an Intel Xeon 5410 (2.33 GHz quad core)that also hosted the workflow manager. We dedicated 3 of the 4 cores to computing jobsand 1 to the workflow manager. The server ran an SL4 EGEE User Interface with nopre-installed software (dependencies were all downloaded from the SE). Jobs were thusrunning in similar conditions than on EGEE. Scaling those experiments to the grid justrequires to switch a flag in the setup configuration.
5MOTEUR workflow manager: http://modalis.i3s.unice.fr/softwares/moteur/start6Taverna workflow manager: http://taverna.sf.net
(a) (b) (c) (d)100 / 150 / 20◦/ 2.1 100 / 200 / 20◦/ 1.9 100 / 150 / 10◦/ 2.1
Figure 2. Parameter sweep on initialization parameters. (a) 75 parameter have been tested ; (b),(c) and (d)initialization results kept for segmentation. Parameter values for Txmin / Txmax / Rzmax / Smin are shown.Image slices are in an xy plane.
3.2. Experiments and results
Using this setup, two parameter-sweep experiments have been conducted to study au-tomatic segmentation of the database. First, the bounds of the transformation space touse for initialization were investigated. Second the influence of the force factor in thedeformation process was looked into.
Experiment #1. Bounds of the transformation space are defined by 14 parameters,namely the minimal and maximal values of the translation vector coordinates, the rota-tion angles and the scaling factor. Early tests showed that the bounds of the translationalong x (Txmin and Txmax), the maximal rotation angle w.r.t z-axis (Rzmax) and themin of the scaling factor (Smin) had significant importance on the quality of the result-ing initialization. Consequently, in this experiment, Txmin was varied among 3 values,Txmax and Rzmax among 2 and Smin among 6 for one volume of a patient, leadingto 72 initializations. Figure 2-(a) shows in blue the 72 computed initializations. Amongthose, a couple only could be considered correct from a visual check. We kept the red,green and yellow results shown in (b), (c) and (d) for the segmentation step. Executiontime statistics are reported in table 1 for the InitModel workflow processor.
Experiment #2. The force factor was varied from 0.1 to 0.5 by steps of 0.1. For eachinitialization, 5 segmentations were thus performed. Due to issues with workflow iter-ation strategies, this experiment had to be performed independently from the previousone, running the workflow once for each initialization selected for segmentation. Fig-ure 3 shows segmentation results obtained from selected initialization results. Colors de-note the force factor value. Table 1 shows the corresponding execution statistics for thedet3D4 workflow processor.
3.3. Discussion
Experiment #1. Figure 2 demonstrates a significant influence of the swept parameterson the initialization results. As shown on part (a) of the figure (blue edge lines), the setof initialization results is quite widely spread. Among those, a couple of results can beconsidered as correct initializations. The selected ones for this study ((b), (c) and (d) partof the figure) have subtle but visually noticeable differences. Execution times reportedon table 1 show a significant importance of data transfers, representing more than 50%

#jobs workflow step Elapsed CPU Download Upload(see Fig. 1) (total ; µ± σ) (total ; µ± σ) (total ; µ± σ)
Exp.#1 72 InitModel 2h19’ 3h53’ ; 3’14”±59” 1h53’ ; 1’34”±29” 37’42” ; 31”±4”
Exp.#2 - (b) 5 det3D4 39’16” 32’2” ; 6’24” ±5” 2’50” ; 34”± 1” 59” ; 12” ± 1”- (c) 5 det3D4 59’5” 32’21” ; 6’28” ± 4” 2’48” ; 33” ± 1” 58” ; 12” ± 1”- (d) 5 det3D4 16’41” 32’41” ; 6’32”±13” 2’57” ; 35”±2” 59” ; 12”±1”
Table 1. Execution statistics for the segmentation experiments. Mean (resp. standard-deviation) is denoted byµ (resp. σ). Data transfers are performed between our local server and an EGEE Storage Element. Italicizedelapsed time values have been measured in shared conditions.
of the CPU time. Still, a fair speed-up of about 2 (on 3 processors) is obtained comparingthe elapsed time to the total CPU time. In the future, data transfer optimizations specificto parameter sweeps could be envisaged since most of the jobs share the same set ofinput files.
Experiment #2. Although differences among initializations (b), (c) and (d) are quitesubtle, segmentation results significantly differ, (d) being the only acceptable result froma visual point of view (see figure 3). Segmentation of the left ventricle is acceptable on(b) but the right ventricle is overestimated (see white arrow). Result (c) clearly under-estimates the myocardium, both in left and right ventricles. The force factor also has astrong influence on the quality of the results. On (d), a high force factor (red edge) bettersegment the left ventricle (leftmost arrows) whereas a small one (blue edge) better fitsthe right ventricle contours (rightmost arrows). On this slice, a force factor of 0.2 (cyanedges) seems to be the optimal. Execution times reported on table 1 show a better trade-off between CPU and transfer times, the latter representing an eighth of the former. Jobtimes are still short though compared to usual latency values on EGEE. To execute thisworkflow on EGEE, latency reduction solutions such as pilot-jobs [6] will be considered.
(b) (c) (d)
Figure 3. Parameter sweep on segmentation parameters. Five force factors have been tested for each initial-ization, as denoted by the color scale (blue: 0.1 ; cyan: 0.2 ; green: 0.3 ; yellow: 0.4 ; red: 0.5). Letters refer tofigure 2.
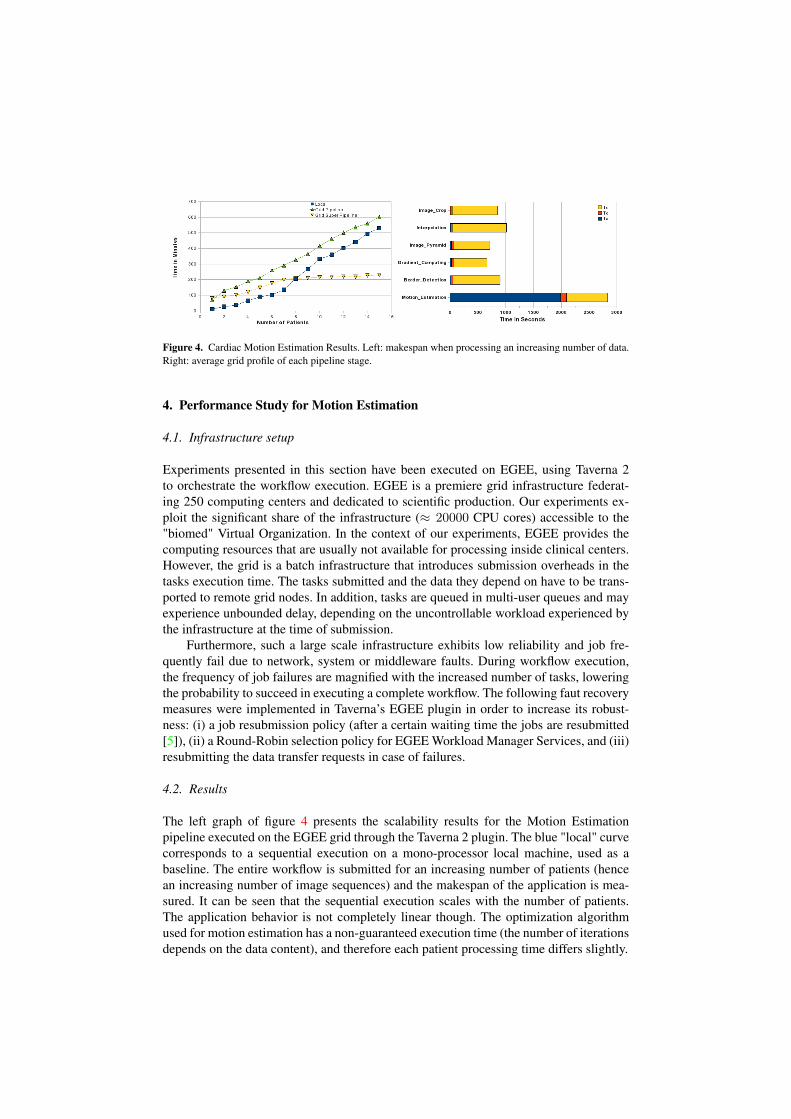
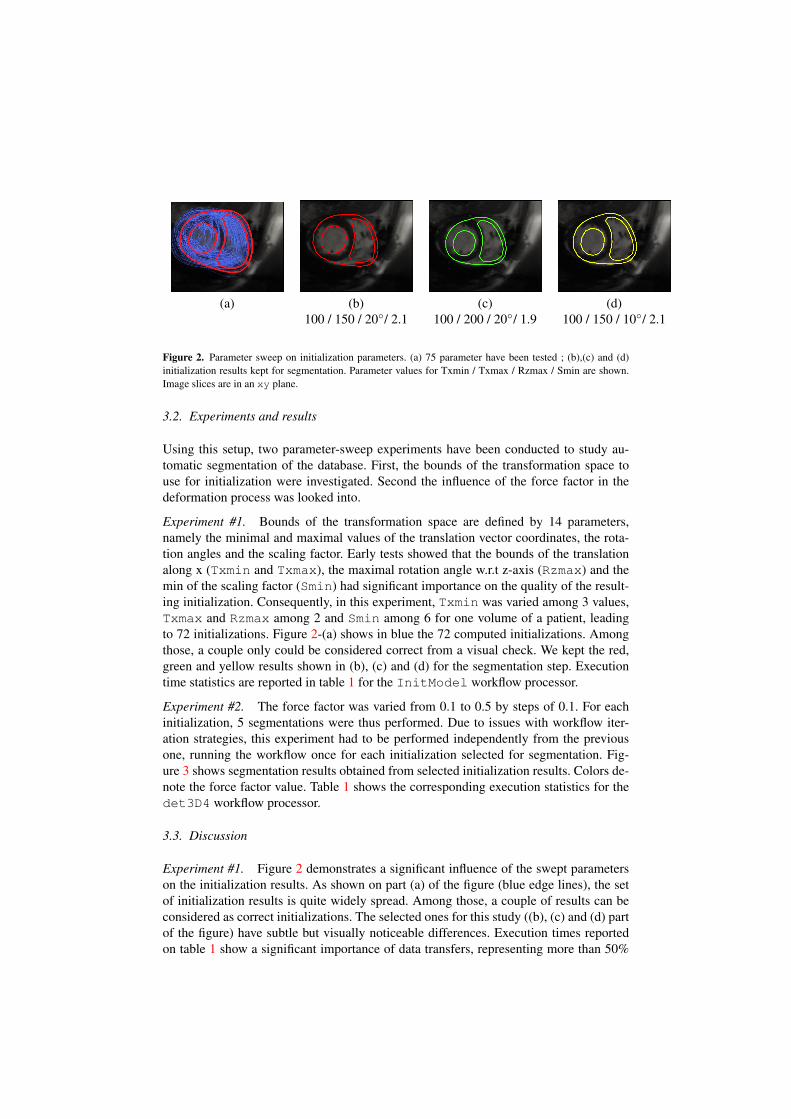
Figure 4. Cardiac Motion Estimation Results. Left: makespan when processing an increasing number of data.Right: average grid profile of each pipeline stage.
4. Performance Study for Motion Estimation
4.1. Infrastructure setup
Experiments presented in this section have been executed on EGEE, using Taverna 2to orchestrate the workflow execution. EGEE is a premiere grid infrastructure federat-ing 250 computing centers and dedicated to scientific production. Our experiments ex-ploit the significant share of the infrastructure (≈ 20000 CPU cores) accessible to the"biomed" Virtual Organization. In the context of our experiments, EGEE provides thecomputing resources that are usually not available for processing inside clinical centers.However, the grid is a batch infrastructure that introduces submission overheads in thetasks execution time. The tasks submitted and the data they depend on have to be trans-ported to remote grid nodes. In addition, tasks are queued in multi-user queues and mayexperience unbounded delay, depending on the uncontrollable workload experienced bythe infrastructure at the time of submission.
Furthermore, such a large scale infrastructure exhibits low reliability and job fre-quently fail due to network, system or middleware faults. During workflow execution,the frequency of job failures are magnified with the increased number of tasks, loweringthe probability to succeed in executing a complete workflow. The following faut recoverymeasures were implemented in Taverna’s EGEE plugin in order to increase its robust-ness: (i) a job resubmission policy (after a certain waiting time the jobs are resubmitted[5]), (ii) a Round-Robin selection policy for EGEE Workload Manager Services, and (iii)resubmitting the data transfer requests in case of failures.
4.2. Results
The left graph of figure 4 presents the scalability results for the Motion Estimationpipeline executed on the EGEE grid through the Taverna 2 plugin. The blue "local" curvecorresponds to a sequential execution on a mono-processor local machine, used as abaseline. The entire workflow is submitted for an increasing number of patients (hencean increasing number of image sequences) and the makespan of the application is mea-sured. It can be seen that the sequential execution scales with the number of patients.The application behavior is not completely linear though. The optimization algorithmused for motion estimation has a non-guaranteed execution time (the number of iterationsdepends on the data content), and therefore each patient processing time differs slightly.

The green "pipeline" curve reports the grid execution makespan using a Taverna reg-ular pipelined execution. Unexpectedly, grid execution does not improve performance inthis case, even when processing the complete data base. This result is expected when pro-cessing few data: a production grid overhead is non negligible as illustrated in the rightgraph of figure 4 which shows the average grid profile of main processes involved in theworkflow. The tasks execution time Tx is impacted by the additional overhead composedof Td, the data transfer time from grid storage to the computing units, and Tq, the timespent inside the job queue after the job has been submitted and before the start of itsexecution. However, the overhead is expected to be compensated by parallel executionfor a sufficiently large database processing. This does not happen in pipelined executionfor this experiment because of the unbalanced computation time of the pipelines stages:the motion estimation execution time (Tx) largely dominates in this workflow and it isworsen by a high data transfer time (Td) which owes to the growth of data through thepipeline (around 0.5 GB from around 1 MB on an average). In pipelined mode, the multi-ple instances of motion estimation (one per patient) are not parallelized. The parallel gainis limited by the concurrent execution of motion estimation and other pipeline stages,thus leading to a high makespan.
Finally, the "super pipeline" curve shows the performance when enabling Taverna2 "superscalar" pipeline submission.The concurrent execution of all workflow processessignificantly increases overall application performance. The application performance isthen mostly impacted by grid overhead. As soon as two or more patient datasets are pro-cessed, performance improves as compared to regular pipelining. Finally it beats the lo-cal execution after the 8th patient is processed. After this "cut-off" stage the performancedramatically improves as the concurrently executing processes start returning results al-most simultaneously.
5. Conclusions
Production-level cardiac sequences analysis is made difficult by the lack of proper ITinfrastructure in health institutions, the non trivial integration of heterogeneous compo-nents in tools analysis procedures, and the need to achieve complete automation. To-day, HealhGrids provide a production stable environment serving as a foundation fortackling the higher level difficulties. In this paper we complement the grid infrastructurewith high level workflow enactment tools that help to interface heterogeneous codes andbenefit from grid performances. Alternative solutions exists such as MOTEUR and Tav-erna workflow managers, both interfaced to the EGEE infrastructures. Care should betaken in the parameterization of such tools though, as can be seen through the inefficientperformance of the motion estimation experiment in simple pipelined mode.
Parameter sweep appears to be a good way to improve the robustness of the seg-mentation pipeline, for the initialization step as well as for the deformation. A few otherparameters of the segmentation algorithm could be similarly be considered for sweeping.Using grids to support this kind of experiment is promising to go towards an automationof the segmentation pipeline required for mass image processing. From a performancepoint of view, pilot-job frameworks will be exploited in this pipeline since segmentationtasks are still short w.r.t the average grid latency. Data transfer optimisation strategieswill also be considered since many jobs have the same set of input files in this kind ofparameter-sweep experiment.

Grid computing power and flexible pipelines management capability are a promisingcombination to reach production-level cardiac image analysis with HealthGrids.
Acknowledgments. This work is supported by the French ANR GWENDIA under con-tract number ANR-06-MDCA-009. The Région Rhônes-Alpes is gratefully acknowl-edged for its support through the project Simed of the cluster ISLE. We are grateful toMD-PhD P. Croisille for providing the MR examinations exploited in this study.
References
[1] Gabriel Aparicio, Ignacio Blanquer Espert, and Vicente Hernández García. A Highly Optimized GridDeployment: the Metagenomic Analysis Example. In Global Healthgrid: e-Science Meets BiomedicalINformatics (Healthgrid’08), pages 105 –115, Chicago, USA, May 2008. Healthgrid, IOS Press.
[2] B. Delhay, P. Clarysse, J. Lötjönen, T. Katila, and I. E. Magnin. Evaluation of two free form deformationbased motion estimators in cardiac and chest imaging. In Functional Imaging and Modeling of the Heart(FIMH), volume 3504, pages 467–476, Barcelona, Spain, 2005. Springer.
[3] Tristan Glatard, Johan Montagnat, David Emsellem, and Diane Lingrand. A Service-Oriented Archi-tecture enabling dynamic services grouping for optimizing distributed workflows execution. FutureGeneration Computer Systems, 24(7):720?–730, July 2008.
[4] Tristan Glatard, Johan Montagnat, Diane Lingrand, and Xavier Pennec. Flexible and efficient workflowdeployement of data-intensive applications on grids with MOTEUR. International Journal of HighPerformance Computing and Applications (IJHPCA), 22(3):347–360, August 2008.
[5] Diane Lingrand, Johan Montagnat, and Tristan Glatard. Estimating the execution context for refiningsubmission strategies on production grids. In Assessing Models of Networks and Distributed ComputingPlatforms (ASSESS / ModernBio) (CCgrid’08), pages 753 – 758, Lyon, May 2008. IEEE.
[6] Jakub T. Mo. Distributed analysis environment for HEP and interdisciplinary applications. NuclearInstruments and Methods in Physics Research A, 502:426–429, 2003.
[7] Tom Oinn, Matthew Addis, Justin Ferris, Darren Marvin, Martin Senger, Mark Greenwood, Tim Carver,Kevin Glover, Matthew R. Pocock, Anil Wipat, and Peter Li. Taverna: A tool for the composition andenactment of bioinformatics workflows. Bioinformatics journal, 17(20):3045–3054, 2004.
[8] Silvia Olabarriaga, Piter T. de Boer, Ketan Maheshwari, Adam Belloum, Jeroen Snel, Aart Nederveen,and Maurice Bouwhuis, editors. Virtual Lab for fMRI: Bridging the Usability Gap, Amsterdam, Decem-ber 2006. IEEE.
[9] Silvia Olabarriaga, Tristan Glatard, Kamel Boulebiar, and Piter T. de Boer. From ’low-hanging’ to’user-ready’: initial steps into a healthgrid. In HealthGrid’08, pages 70–79, Chicago, June 2008.
[10] Michael J. Pan and Arthur W. Toga. A grid enabled workflow management system for managing pa-rameter sweep applications in neuroimaging research. In Fourth International Workshop on BiomedicalComputations on the Grid (Biogrid’06), Singapore, May 2006.
[11] Erik Pernod, Jean-Christophe Souplet, Javier Rojas Balderrama, Diane Lingrand, and Xavier Pennec.Multiple Sclerosis Brain MRI Segmentation Workflow deployment on the EGEE Grid. In Silvia Olabar-riaga, Diane Lingrand, and Johan Montagnat, editors, MICCAI-Grid Workshop (MICCAI-Grid), NewYork, NY, USA, September 2008.
[12] Q.-C. Pham, F. Vincent, P. Clarysse, P. Croisille, and I. E. Magnin. A FEM-based deformable modelfor the 3D segmentation and tracking of the heart in cardiac MRI. In 2nd International Symposium onImage and Signal Processing and Analysis (ISPA 2001), volume 1, pages 250–254, Pula, Croatia, 2001.
[13] Y. Rouchdy, J. Pousin, J. Schaerer, and Patrick Clarysse. A nonlinear elastic deformable template for softstructure segmentation: application to the heart segmentation in MRI. Inverse Problems,, 23:1017–1035,2007.
[14] Martin Senger, Peter Rice, and Tom Oinn. Soaplab - a unified Sesame door to analysis tool. In UKe-Science All Hands Meeting, pages 509–513, Nottingham, September 2003.
[15] Wibke Sudholt, Kim K. Baldridge, David Abramson, Colin Enticott, Slavisa Garic, Chris Kondric, andDuy Nguyen. Application of grid computing to parameter sweeps and optimizations in molecular mod-eling. Future Generation Computer Systems, 21(1):27–35, 2005.