Toward optimizing patient-specific IMRT QA techniques in the accurate detection of dosimetrically...
16
Toward optimizing patient-specific IMRT QA techniques in the accurate detection of dosimetrically acceptable and unacceptable patient plans Elizabeth M. McKenzie, Peter A. Balter, Francesco C. Stingo, Jimmy Jones, David S. Followill, and Stephen F. Kry Citation: Medical Physics 41, 121702 (2014); doi: 10.1118/1.4899177 View online: http://dx.doi.org/10.1118/1.4899177 View Table of Contents: http://scitation.aip.org/content/aapm/journal/medphys/41/12?ver=pdfcov Published by the American Association of Physicists in Medicine Articles you may be interested in Phantomless patient-specific TomoTherapy QA via delivery performance monitoring and a secondary Monte Carlo dose calculation Med. Phys. 41, 101703 (2014); 10.1118/1.4894721 Patient-specific QA and delivery verification of scanned ion beam at NIRS-HIMAC Med. Phys. 40, 121707 (2013); 10.1118/1.4828845 Characterization of a novel 2D array dosimeter for patient-specific quality assurance with volumetric arc therapy Med. Phys. 40, 071731 (2013); 10.1118/1.4812415 Technical note: Patient-specific quality assurance methods for TomoDirectTM whole breast treatment delivery Med. Phys. 39, 4073 (2012); 10.1118/1.4722967 An Active Matrix Flat Panel Dosimeter (AMFPD) for in-phantom dosimetric measurements Med. Phys. 32, 466 (2005); 10.1118/1.1855012
Transcript of Toward optimizing patient-specific IMRT QA techniques in the accurate detection of dosimetrically...

Toward optimizing patient-specific IMRT QA techniques in the accurate detection ofdosimetrically acceptable and unacceptable patient plansElizabeth M. McKenzie, Peter A. Balter, Francesco C. Stingo, Jimmy Jones, David S. Followill, and StephenF. Kry Citation: Medical Physics 41, 121702 (2014); doi: 10.1118/1.4899177 View online: http://dx.doi.org/10.1118/1.4899177 View Table of Contents: http://scitation.aip.org/content/aapm/journal/medphys/41/12?ver=pdfcov Published by the American Association of Physicists in Medicine Articles you may be interested in Phantomless patient-specific TomoTherapy QA via delivery performance monitoring and a secondary MonteCarlo dose calculation Med. Phys. 41, 101703 (2014); 10.1118/1.4894721 Patient-specific QA and delivery verification of scanned ion beam at NIRS-HIMAC Med. Phys. 40, 121707 (2013); 10.1118/1.4828845 Characterization of a novel 2D array dosimeter for patient-specific quality assurance with volumetric arctherapy Med. Phys. 40, 071731 (2013); 10.1118/1.4812415 Technical note: Patient-specific quality assurance methods for TomoDirectTM whole breast treatment delivery Med. Phys. 39, 4073 (2012); 10.1118/1.4722967 An Active Matrix Flat Panel Dosimeter (AMFPD) for in-phantom dosimetric measurements Med. Phys. 32, 466 (2005); 10.1118/1.1855012

Toward optimizing patient-specific IMRT QA techniques in the accuratedetection of dosimetrically acceptable and unacceptable patient plans
Elizabeth M. McKenzieGraduate School of Biomedical Sciences, The University of Texas Health Science Center Houston,Houston, Texas, 77030
Peter A. BalterDepartment of Radiation Physics, The University of Texas MD Anderson Cancer Center, Houston, Texas 77030
Francesco C. StingoDepartment of Biostatistics, Department of Radiation Physics, The University of Texas MD Anderson CancerCenter, Houston, Texas 77030
Jimmy JonesPorter Adventist Hospital, Denver, Colorado 80210
David S. Followill and Stephen F. Krya)
Imaging and Radiation Oncology Core at Houston and Department of Radiation Physics, The Universityof Texas MD Anderson Cancer Center, Houston, Texas 77030
(Received 30 September 2013; revised 6 October 2014; accepted for publication 9 October 2014;published 10 November 2014)
Purpose: The authors investigated the performance of several patient-specific intensity-modulatedradiation therapy (IMRT) quality assurance (QA) dosimeters in terms of their ability to correctlyidentify dosimetrically acceptable and unacceptable IMRT patient plans, as determined by an in-house-designed multiple ion chamber phantom used as the gold standard. A further goal was toexamine optimal threshold criteria that were consistent and based on the same criteria among thevarious dosimeters.Methods: The authors used receiver operating characteristic (ROC) curves to determine the sensi-tivity and specificity of (1) a 2D diode array undergoing anterior irradiation with field-by-fieldevaluation, (2) a 2D diode array undergoing anterior irradiation with composite evaluation, (3) a 2Ddiode array using planned irradiation angles with composite evaluation, (4) a helical diode array, (5)radiographic film, and (6) an ion chamber. This was done with a variety of evaluation criteria for a setof 15 dosimetrically unacceptable and 9 acceptable clinical IMRT patient plans, where acceptabilitywas defined on the basis of multiple ion chamber measurements using independent ion chambersand a phantom. The area under the curve (AUC) on the ROC curves was used to compare dosimeterperformance across all thresholds. Optimal threshold values were obtained from the ROC curveswhile incorporating considerations for cost and prevalence of unacceptable plans.Results: Using common clinical acceptance thresholds, most devices performed very poorly in termsof identifying unacceptable plans. Grouping the detector performance based on AUC showed twosignificantly different groups. The ion chamber, radiographic film, helical diode array, and anterior-delivered composite 2D diode array were in the better-performing group, whereas the anterior-delivered field-by-field and planned gantry angle delivery using the 2D diode array performed lesswell. Additionally, based on the AUCs, there was no significant difference in the performance ofany device between gamma criteria of 2%/2 mm, 3%/3 mm, and 5%/3 mm. Finally, optimal cutoffs(e.g., percent of pixels passing gamma) were determined for each device and while clinical practicecommonly uses a threshold of 90% of pixels passing for most cases, these results showed variabilityin the optimal cutoff among devices.Conclusions: IMRT QA devices have differences in their ability to accurately detect dosimetricallyacceptable and unacceptable plans. Field-by-field analysis with a MapCheck device and use of theMapCheck with a MapPhan phantom while delivering at planned rotational gantry angles resulted ina significantly poorer ability to accurately sort acceptable and unacceptable plans compared with theother techniques examined. Patient-specific IMRT QA techniques in general should be thoroughlyevaluated for their ability to correctly differentiate acceptable and unacceptable plans. Additionally,optimal agreement thresholds should be identified and used as common clinical thresholds typicallyworked very poorly to identify unacceptable plans. C 2014 American Association of Physicists inMedicine. [http://dx.doi.org/10.1118/1.4899177]
Key words: ROC, patient-specific, IMRT, quality assurance
121702-1 Med. Phys. 41 (12), December 2014 0094-2405/2014/41(12)/121702/15/$30.00 © 2014 Am. Assoc. Phys. Med. 121702-1

121702-2 McKenzie et al.: Comparison of patient-specific IMRT QA techniques 121702-2
1. INTRODUCTION
Intensity-modulated radiation therapy (IMRT) is a commonlypracticed form of radiation therapy. Because of the complexityof this treatment technique, verification of patient plans isperformed via direct measurement known as patient-specificIMRT quality assurance (QA). Despite the widespread practiceof IMRT QA, its implementation has not been standardized,and many methods and types of equipment exist to accomplishit.1 With such heterogeneity in the field, we asked whetherthe efficacy among the various methods is equal or whetherthere are superior ways to perform IMRT QA with the goalof distinguishing between dosimetrically acceptable and unac-ceptable plans. This question is further complicated as it is notonly a question of the detector used but also of how the dataare analyzed. Whereas ion chamber measurements typicallyrely on a percent dose difference cutoff, gamma analysis forplanar QA relies on three parameters: percent dose difference,distance to agreement, and percent of pixels passing.2 Addi-tionally, multiple software packages exist for gamma analysis,which often implement the gamma calculation differently.
Insight into this question can be achieved by evaluatingvarious IMRT QA techniques using receiver operating char-acteristic (ROC) curves, which can address the question ofperformance for both hardware and the associated analysisused.3 Recently published comments have called attention tothe apt application of ROC analysis as a quantitative meansof assessing the practice of patient-specific IMRT QA.4 InROC analysis, a curve of the sensitivity and specificity ofa test is plotted as the values of the cutoff are varied. Inthis study, sensitivity is the ability of a dosimeter to accu-rately label an unacceptable plan as failing; conversely, spec-ificity is the ability to label an acceptable plan as passing.Cutoff values in this study were the percent of pixels pass-ing for gamma analysis and the percent dose difference forion chamber measurements. There is an inherent trade-off inthese two parameters: as the cutoff is rendered more stringentto increase sensitivity, the specificity decreases. A ROC curvegives the user a convenient, holistic view of these trade-offsacross all cutoffs. An example ROC curve is shown in Fig. 1,where the vertical axis is sensitivity (range: 0–1), and thehorizontal axis is 1—specificity (range: 0–1). The ROC curvefor an ideal dosimeter that perfectly sorts patient plans, whichis also shown in this figure, has an area under the curve(AUC) equal to one. In contrast, a 45◦ diagonal line (AUCequals 0.5) represents a dosimeter that sorts plans completelyrandomly. The AUC is a useful metric with which to deter-mine the performance of a device over the entire range ofcutoff values. This AUC is also equivalent to the probabilitythat for a randomly selected acceptable and unacceptableplan, the dosimeter correctly classifies the unacceptable planas worse than the acceptable plan. A detailed explanation ofROC techniques is well explained in the literature.5
One recent study examined a diode array’s optimal cut-offs through the lens of ROC analysis.6 Many other studieshave also explored this large question of optimal IMRT QAcriteria.1,7–9 However, none have applied this analysis tech-nique to study a broad range of dosimeters, comparing not
F. 1. ROC curve given as an example. This type of plot shows the abilityof a test to accurately sort incidents, where the true state is determined bya gold standard. The vertical axis shows sensitivity whereas the horizontalaxis shows specificity. The thicker line along the upper left shows a test withperfect classification whereas the thinner curved line shows what a realisticROC curve would look like for a test. The diagonal line is the ROC curve thatwould result from a test with random classification.
only the hardware but also the protocol used in the setup andanalysis. Consequently, the relative performance of variousQA techniques remains unclear. To this end, this research usesROC analysis to discover which of the commonly used QAprocedures performs most robustly in terms of their sensi-tivity and specificity and what optimal cutoffs can be gleanedfrom these ROC curves. More specifically, we investigatedthe abilities of the MapCheck2 in a variety of configura-tions, ArcCheck, radiographic film, and an ion chamber usingoriginal clinical patient plans to generate clinically relevantcomparisons.
2. METHODS
2.A. Plan selection
Twenty-four clinical step-and-shoot IMRT patient planswere selected from our institution that previously underwentpatient-specific IMRT QA. To more rigorously test the perfor-mance of various QA dosimeters, the majority (19 plans) wereselected from a group that had previously failed film and ionchamber QA at the authors’ institution (<90% pixels passingat 5%/3 mm or an ion chamber reading of >3% dose differ-ence). These plans were not modified to artificially create fail-ing cases; instead, they were true clinical IMRT plans createdwith the intent of patient delivery. Because it is highly diffi-cult to predict all possible failure modes in IMRT plan de-livery, the use of actual patient plans may be more insightful
Medical Physics, Vol. 41, No. 12, December 2014
121702-3 McKenzie et al.: Comparison of patient-specific IMRT QA techniques 121702-3
than using induced errors. The remaining five plans previ-ously passed IMRT QA. In addition, a variety of treatmentsites (thoracic, gastrointestinal, head and neck, stereotacticspine, gynecologic, mesothelioma, and genitourinary) wereselected to ensure that the scope of dosimeter performancewould reflect the variety of plans seen in the clinic. All of theplans were calculated in the 3 9.0 treatment planningsoftware () (Phillips Healthcare, Andover, MA). The couchwas removed during planning and dose calculation, and therails under the mesh-top couch were moved medially or later-ally during treatment delivery for each field to minimize beamattenuation through the couch following the method shown inPulliam et al.10 The clinical and dosimetric acceptability ofeach plan was determined on the basis of measurements in amultiple ion chamber (MIC) phantom (described in Sec. 2.B.1)and was not based on the original IMRT QA results above.Each plan was then delivered to each dosimeter using oneof two beam-matched Varian 21 iX accelerators to assess theperformance of the IMRT QA devices.
2.B. Dosimeters
2.B.1. Multiple ion chamber phantom
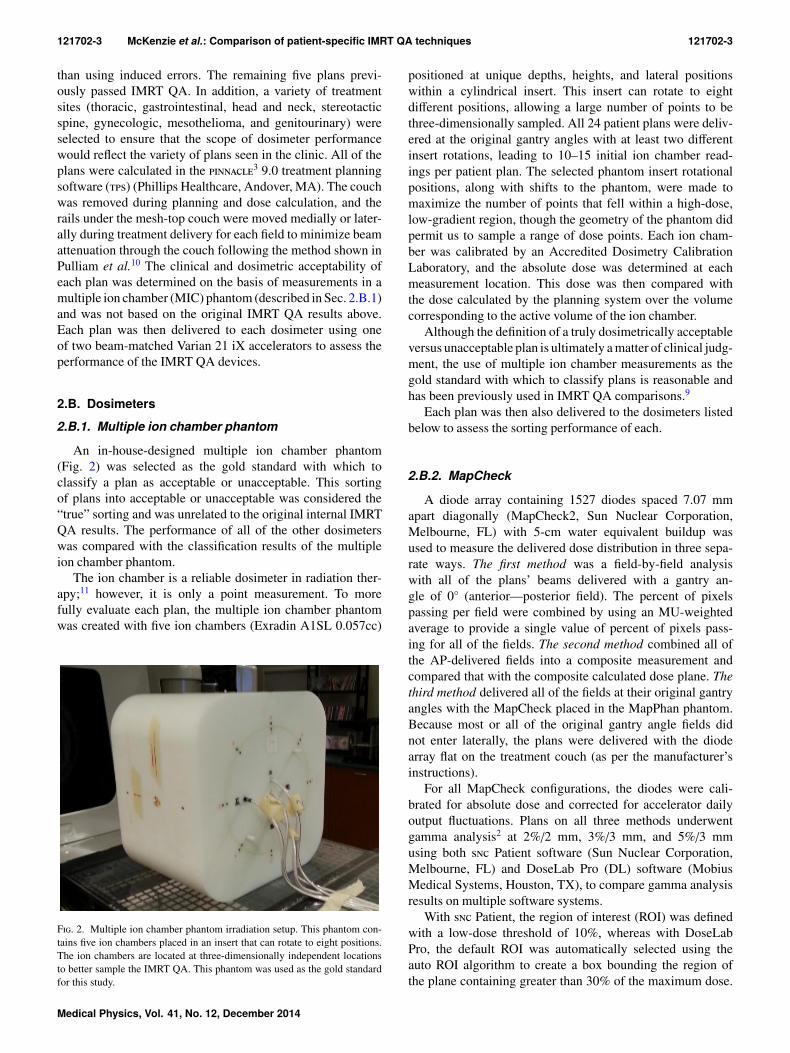
An in-house-designed multiple ion chamber phantom(Fig. 2) was selected as the gold standard with which toclassify a plan as acceptable or unacceptable. This sortingof plans into acceptable or unacceptable was considered the“true” sorting and was unrelated to the original internal IMRTQA results. The performance of all of the other dosimeterswas compared with the classification results of the multipleion chamber phantom.
The ion chamber is a reliable dosimeter in radiation ther-apy;11 however, it is only a point measurement. To morefully evaluate each plan, the multiple ion chamber phantomwas created with five ion chambers (Exradin A1SL 0.057cc)
F. 2. Multiple ion chamber phantom irradiation setup. This phantom con-tains five ion chambers placed in an insert that can rotate to eight positions.The ion chambers are located at three-dimensionally independent locationsto better sample the IMRT QA. This phantom was used as the gold standardfor this study.
positioned at unique depths, heights, and lateral positionswithin a cylindrical insert. This insert can rotate to eightdifferent positions, allowing a large number of points to bethree-dimensionally sampled. All 24 patient plans were deliv-ered at the original gantry angles with at least two differentinsert rotations, leading to 10–15 initial ion chamber read-ings per patient plan. The selected phantom insert rotationalpositions, along with shifts to the phantom, were made tomaximize the number of points that fell within a high-dose,low-gradient region, though the geometry of the phantom didpermit us to sample a range of dose points. Each ion cham-ber was calibrated by an Accredited Dosimetry CalibrationLaboratory, and the absolute dose was determined at eachmeasurement location. This dose was then compared withthe dose calculated by the planning system over the volumecorresponding to the active volume of the ion chamber.
Although the definition of a truly dosimetrically acceptableversus unacceptable plan is ultimately a matter of clinical judg-ment, the use of multiple ion chamber measurements as thegold standard with which to classify plans is reasonable andhas been previously used in IMRT QA comparisons.9
Each plan was then also delivered to the dosimeters listedbelow to assess the sorting performance of each.
2.B.2. MapCheck
A diode array containing 1527 diodes spaced 7.07 mmapart diagonally (MapCheck2, Sun Nuclear Corporation,Melbourne, FL) with 5-cm water equivalent buildup wasused to measure the delivered dose distribution in three sepa-rate ways. The first method was a field-by-field analysiswith all of the plans’ beams delivered with a gantry an-gle of 0◦ (anterior—posterior field). The percent of pixelspassing per field were combined by using an MU-weightedaverage to provide a single value of percent of pixels pass-ing for all of the fields. The second method combined all ofthe AP-delivered fields into a composite measurement andcompared that with the composite calculated dose plane. Thethird method delivered all of the fields at their original gantryangles with the MapCheck placed in the MapPhan phantom.Because most or all of the original gantry angle fields didnot enter laterally, the plans were delivered with the diodearray flat on the treatment couch (as per the manufacturer’sinstructions).
For all MapCheck configurations, the diodes were cali-brated for absolute dose and corrected for accelerator dailyoutput fluctuations. Plans on all three methods underwentgamma analysis2 at 2%/2 mm, 3%/3 mm, and 5%/3 mmusing both Patient software (Sun Nuclear Corporation,Melbourne, FL) and DoseLab Pro (DL) software (MobiusMedical Systems, Houston, TX), to compare gamma analysisresults on multiple software systems.
With Patient, the region of interest (ROI) was definedwith a low-dose threshold of 10%, whereas with DoseLabPro, the default ROI was automatically selected using theauto ROI algorithm to create a box bounding the region ofthe plane containing greater than 30% of the maximum dose.
Medical Physics, Vol. 41, No. 12, December 2014

121702-4 McKenzie et al.: Comparison of patient-specific IMRT QA techniques 121702-4
Then a boundary of 10% of the width and height are addedto all sides to create the final ROI. In both software packages,the was used as the evaluated distribution in the gammaanalysis and a global percent difference was used.
2.B.3. Film and ion chamber
Radiographic film (Kodak EDR2) and a single ion chamber(Wellhofer cc04) were placed in an I’mRT body phantom (IBADosimetry, Schwarzenbruck, Germany), with the film placedparallel to the beam. The plans were all delivered with theiroriginal gantry angles. Due to inherent differences in the typesof measurement, the ion chamber and film were analyzed astwo separate dosimeters, although their measurements weretaken simultaneously. The ion chamber was placed in a posi-tion with a standard deviation across the ion chamber ROI ofless than 1% of the mean dose and a mean dose of greater than70% of the maximum dose in the plan. Shifts to the phantomwere applied if necessary to satisfy these criteria. The absolutedose from the chamber was corrected for daily fluctuations inthe output of the accelerator as well as for temperature andpressure and was compared with the dose calculated by theplanning system over the volume corresponding to the activevolume of the ion chamber.
The film evaluated a transverse plane of the delivereddose distribution. It then underwent gamma analysis in theOmniPro I’mRT software (IBA Dosimetry, Schwarzenbruck,Germany) at 2%/2 mm, 3%/3 mm, and 5%/3 mm (using aglobal percent dose difference). In this software, the ROI wasbased on a 10% low-dose threshold and a manual selectionof the area of the film contained within the phantom. The was selected to be the reference distribution in the gammaanalysis. The film optical density was converted to dose withuse of a batch-specific calibration curve and spatially regis-tered with use of pinpricks. The film was then used as a rela-tive dosimeter with the normalization point manually selectedto maximize agreement with the calculated plane. This rela-tive measurement is the method employed at the authors’institution and was chosen to study the performance of one ofmany ways one could use film to reach the desired endpointof determining if the plan is acceptable or unacceptable.
2.B.4. ArcCheck
The ArcCheck (Sun Nuclear Corporation, Melbourne, FL)cylindrical diode array containing 1386 diodes spaced 1 cmapart was treated with the electronics facing away from thelinear accelerator. As with the MapCheck, the array was cal-ibrated for absolute dose. If necessary, shifts were appliedto the ArcCheck to avoid irradiating the electronics. Com-plete plans were delivered with their original gantry anglesto the ArcCheck, and the cumulative measurements wereunwrapped to perform a 2D gamma analysis. Gamma anal-ysis was performed in the Patient software at 2%/2 mm,3%/3 mm, and 5%/3 mm (global percent dose difference),with a 10% low-dose threshold.
2.C. Data analysis
First, we defined which plans were dosimetrically accept-able and which were unacceptable based on the multiple ionchamber measurements. This study strove to find a gold stan-dard that offered high dosimetric accuracy (ADCL calibratedion chambers) and sampled broadly from the plan. Since thisis an endpoint analysis, ultimately the gold standard neededto provide a binary result (acceptable versus unacceptable) foreach plan, so that the endpoint (fail versus pass) of each QAdosimeter system could be evaluated. By performing an anal-ysis with the endpoint, dosimeters with differing implementa-tions could be compared. Conceptually, a gold standard, suchas the one defined for our study, need not be infallible, but itmust be considerably more accurate than, and independent of,the tests being evaluated.5
At least ten measurements were made for each IMRT planon the multiple ion chamber phantom. The ion chambers ofthe gold standard were placed in a low-dose gradient regionto maintain the integrity of the ion chamber measurement.However, some of these measurements were excluded basedon measurement location. Out of concern for setup uncer-tainty in high gradients, a standard deviation criterion wasplaced on the ion chambers. For the central ion chamber, ameasurement was only included in this analysis if the stan-dard deviation of the dose across the active volume ROI wasless than 3% of the mean dose across the ROI. Since the fiveion chambers are located at different radii from the centerof the rotatable cylindrical insert, there was more positionaluncertainty in the peripheral points than in the central ionchamber. Therefore, we scaled standard deviation exclusioncriteria based on the arc length associated with a 1◦ rotationalsetup uncertainty. This led to more stringent requirements ofdose homogeneity for ion chambers with more uncertainty insetup (as low as 1.5% for the outermost ion chamber). Addi-tionally, we also excluded points that contained less than 20%of the plan’s maximum dose, in order to measure the moreclinically relevant points of the plan.
After the pruning of high gradient and low-dose points,we were left with N points per plan. The local percent dosedifference between the measured value and the dose pre-dicted by the treatment planning software were calculated foreach of these N points. The percent dose differences greaterthan 3% for any applicable points were summed together anddivided by N in order to normalize by the number of pointsleft after pruningN
k=1DD>3%(mk)
N=Multi ion chamber metric,
where DD>3% is the dose difference in percent (between mea-surement and ) for points with a dose difference greaterthan 3% for each chamber reading m, and N is the number ofpoints remaining after the dose and standard deviation-basedexclusion. If all points in a plan had dose deviations of lessthan 3%, then the MIC metric would be zero.
This final value is in essence an average deviation metricand was the metric that was used to summarize the ion chamber
Medical Physics, Vol. 41, No. 12, December 2014

121702-5 McKenzie et al.: Comparison of patient-specific IMRT QA techniques 121702-5
measurements for each plan into one value, accounting for thevarying number of points per plan.
In addition to clinical judgment, statistical tests weredone to determine which plans were acceptable and whichwere unacceptable. Based on k-means hierarchical cluster-ing12 of the multiple ion chamber metrics, distinct acceptableand unacceptable groups existed among the IMRT plans. Tofurther distinguish these groups, we used repeated ion cham-ber measurements13 to estimate the 95% confidence inter-vals of the MIC metric using bootstrapping techniques (using100 000 replicates) onto the MIC metrics across all plans.This analysis showed that two distinct groups did indeedexist (in agreement with the clustering). In the group withthe lower MIC metrics (better performing plans), the 95%confidence intervals were all overlapping with each other andat the zero line (indicating an acceptable plan, i.e., all ionchamber points had less than or equal to a 3% dose differ-ence) (See Fig. 3). With this combined information, the plansin the group with the lower MIC metric values were clas-sified as acceptable while those in the higher MIC metricgroup were classified as unacceptable. The sorting providedby the statistical processes above were also seen to be consis-tent with reasonable clinical judgment, in that plans deemedunacceptable showed large and or multiple deviations be-tween measurement and calculation. Interestingly, multi-ple ion chamber readings were also used as a gold standard
by Kruse, in which he classified a plan as failing if any indi-vidual ion chamber measurements differed by greater than4%;9 his methodology sorts our data set’s plans in the sameway as the method used in our study.
Once the plans were sorted as acceptable and unacceptable,the ability of each alternate dosimeter to correctly sort the planscould be conducted. This was done by using ROC analysis.ROC curves were formed by comparing the passing and failingresults of each dosimeter system on the set of 24 acceptable andunacceptable patient plans. These curves have a staircase-likepattern due to the finite number of cases considered. Becauseof its independence from the prevalence of unacceptable plans,sensitivity weighting, and specificity weighting, the AUC sta-tistic is commonly used to compare different ROC curves,3
which was used here to compare each device’s discriminatingcapabilities. Confidence intervals were calculated with the useof the bootstrap method implemented in the pROC R pack-age.14 Bootstrapping was also applied to compare the AUCsusing the “Z” statistic thereby obtaining p-values to determinewhether pairs of AUCs were significantly different.14
ROC curves are generated by considering all possiblethresholds (e.g., all ion chamber dose difference thresholds,or all percent of pixels passing for a given dose difference anddistance to agreement criteria). Once a ROC curve has beengenerated, a natural follow-up is to find the value on the curve(e.g., what percent of pixels passing threshold) that provides
F. 3. Multiple ion chamber metrics for each of the 24 IMRT QA plans investigated with 95% confidence intervals. This figure displays the combined resultsof the MIC measurements for each plan. The shape of the points shows whether the plan was ultimately sorted as acceptable or unacceptable. It can be seenfrom this figure that the acceptable plans all had MIC metrics close to zero; zero indicating a plan whose ion chamber measurements all had dose differences ofless than ±3% from the planned value.
Medical Physics, Vol. 41, No. 12, December 2014

121702-6 McKenzie et al.: Comparison of patient-specific IMRT QA techniques 121702-6
the best discriminatory power. Optimal cutoff criteria and theiraccompanying confidence intervals were calculated in the Rstatistical packages pROC (Ref. 14) and ThresholdROC.15 TheYouden index method was used, which finds the point alongthe curve farthest from the diagonal random guess line.16 TheYouden index has been shown to be a more robust optimizationmethod than other methods (such as finding the point closestto perfect classification).16 While the mathematically optimalcutoff can be found with the Youden index, this approach ig-nores the relative cost of a false positive and false negative, aswell as prevalence. Therefore, this optimal point may not accu-rately reflect practical realities. For example, if the prevalenceof a failing plan is low, having an overly sensitive cutoff couldlead to an excessive number of false positives (i.e., acceptableplans labeled as failing), wasting time in the clinic. Conversely,if the cost related to passing an unacceptable plan is high, asensitive cutoff would be favored over one with high spec-ificity. This issue was explored by examining a cost-drivenoptimal cutoff; the optimal cutoff values were calculated withuse of the ThresholdROC R package by minimizing a costfunction that incorporates the cost of false negatives and theprevalence rate of unacceptable plans.15 The prevalence of anunacceptable plan was estimated at 3% based on the workby Dong.17 The cost values are, in reality, dependent on thesituation at a particular clinic and can include such factors asthe risks of delivering a failing plan to a patient, tempered bythe extra time demanded in the clinic if an acceptable plan isfalsely labeled as failing. While actually solving the relative
actuarial costs can be challenging and subjective, a reason-able clinical cost was estimated in the following manner: therelative cost of a false positive versus a false negative wasvaried until the optimal cutoff of 3% was generated for thecc04 ion chamber,18 3% being a common clinical acceptancecriterion. This allowed us to work backward from a desiredcutoff, deriving the cost weighting which would lead to a 3%dose difference optimal ion chamber cutoff. This same costweighting was then used to determine the weighted optimalthresholds for the other dosimeters examined.
3. RESULTS
Each of the 24 plans was delivered to the multi-ion cham-ber phantom. After pruning data points to exclude those withhigh dose gradients and low-dose, the average number ofion chamber measurements per patient plan was 7.4, with aminimum of 4 and a maximum of 10. The dose differencebetween ion chamber measurement and treatment planningsystem calculation (after pruning) is shown in Table I. Thepruned points in this table come from a range of 40% to100% of each plan’s maximum dose (most commonly be-tween 75% and 95%). This gold standard ultimately sortedthe 24 plans into 9 acceptable and 15 unacceptable plans,yielding a good distribution of plan challenge levels on whichto rigorously test the different QA systems. Sorting of pass-ing versus failing plans was based on clinical interpretation
T I. Local percent dose differences between the multiple ion chamber phantom measurements and the planning system calculations at different locationswithin the 24 plans. Measurements which were greater than ±3% different from the planned dose are in italics, those that differ by more than 4% are inbold.
Percent differences between measured and calculated doses
Plan 1 2 3 4 5 6 7 8 9 10 Acceptable (Y/N)
GI 1 4.2% 6.0% 5.9% 5.7% 6.1% 3.5% 3.1% 5.4% 0.7% NGI 2 5.1% 6.6% 4.8% 1.2% 2.0% 6.2% 5.4% 5.2% 1.4% 2.3% NGI 3 −0.7% 2.0% 1.2% 5.5% 5.1% −1.2% NGI 4 −0.4% −0.1% 0.8% 0.9% 0.7% 1.0% 1.3% 0.8% 1.0% YGI 5 −2.7% −1.2% −0.4% −3.2% −1.0% −2.1% −1.8% −0.7% YGU −2.8% −2.1% −1.6% −2.8% −2.8% −0.8% −3.3% YGyn 1 −2.1% −1.8% −2.7% −0.8% −1.2% −1.9% 0.5% −0.8% −1.3% YGyn 2 2.9% 1.6% 3.1% 1.7% 2.7% 2.7% 1.5% 7.4% NHN 1 −3.3% −1.7% −2.0% −3.4% −2.5% −1.4% −1.5% YHN 2 0.4% −1.1% −2.0% −0.2% 0.7% 1.3% −0.2% −1.2% YHN 3 −0.7% −0.8% −0.9% −0.9% 0.3% −2.4% YHN 4 −1.7% −2.7% −5.1% −1.0% −2.9% 0.0% −5.5% NHN 5 −2.6% −0.6% −2.1% −2.1% −1.4% 3.6% −0.1% YLung stereo −1.7% −4.7% −1.7% −4.9% NMantle −2.7% −0.9% −7.3% −5.5% −6.2% NMeso 1 4.3% 5.3% 6.3% 4.0% 1.6% 5.3% 2.4% 5.3% 4.8% 4.7% NMeso 2 7.4% 4.8% 5.2% 1.6% 5.4% 4.5% 3.2% 2.3% NMeso 3 3.8% 3.6% 1.7% 3.1% 4.1% 2.0% 4.3% 2.2% NMeso 4 6.8% 4.6% 3.4% 2.8% 1.3% 7.5% 4.0% 5.7% NRib stereo −2.1% −4.4% −4.9% −3.4% NSpine stereo −6.8% −2.3% −4.8% −5.0% NThoracic 1 −5.2% −5.2% −0.2% −6.3% −5.4% −8.0% −4.4% NThoracic 2 −3.5% −2.9% −2.6% −3.5% −4.9% −1.6% −1.3% −3.4% 0.1% NThoracic 3 −2.1% −1.4% −1.2% −2.5% −3.1% −1.2% −1.8% −0.3% −3.3% −0.4% Y
Medical Physics, Vol. 41, No. 12, December 2014

121702-7 McKenzie et al.: Comparison of patient-specific IMRT QA techniques 121702-7
T II. Information on the complexity of the 24 IMRT plans investigated. The number of segments per field(average and range across all fields in the plan), whether the plan involved a carriage split, and the total numberof fields are shown. Additionally, the last column shows how the plans were sorted based on the gold standard.
IMRT planAverage number of
segmentsRange ofsegments
Carriage split(Y/N)
No. offields
Acceptable?(Y/N)
GI 1 14.9 (12, 17) Y 15 NGI 2 10.0 (7, 12) Y 13 NGI 3 4.9 (2, 8) Y 14 NGI 4 5.6 (4, 8) N 9 YGI 5 17.7 (13, 20) N 6 YGU 6.9 (5, 8) N 8 YGYN 1 6.0 (5, 7) N 8 YGYN 2 10.5 (8, 15) Y 12 NHN 1 12.2 (9, 15) N 9 YHN 2 15.2 (12, 18) N 6 YHN 3 10.8 (8, 19) N 9 YHN 4 8.9 (7, 11) N 9 NHN 5 14.8 (12, 17) N 8 YLung stereo 8.3 (5, 11) N 6 NMantle 8.8 (21, 155) N 5 NMeso 1 12.5 (7, 21) Y 14 NMeso 2 12.4 (10, 15) Y 14 NMeso 3 9.2 (5, 14) Y 13 NMeso 4 10.0 (8, 12) Y 14 NRib stereo 10.0 (7, 14) N 7 NSpine stereo 7.3 (5, 9) N 9 NThoracic 1 11.0 (5, 15) N 6 NThoracic 2 9.8 (7, 11) N 5 NThoracic 3 10.0 (9, 11) N 5 Y
as well as statistical results, which are shown in Fig. 3 andindicate the statistical grouping into acceptable and unaccept-able plans.
Table II is a characterization of the complexity of eachplan in terms of the average number of segments, range of thenumber of segments, whether there was a carriage split, andthe total number of fields.
After delivery of the 24 plans to each QA device, thesensitivity and specificity of each device were evaluated. Asa first, simple analysis, the sensitivity and specificity of eachdevice were calculated using the common clinical criteria of±3% (ion chamber) and >90% of pixels passing 3%/3 mm(planar devices). The results of this simple analysis are shownin Table III.
In general, sensitivity was very low at clinically usedthresholds for IMRT QA. In fact, the MapCheck field-by-fieldshowed 0% sensitivity using 90% of pixels passing a 3%/3 mmcriteria, indicating that it declared all of the unacceptable plansin Table I to be “passing”, some of which show clear and largedose differences with the MIC measurements. On the otherhand, all IMRT QA devices showed good specificity, meaningif the MIC measurements declared a plan to be acceptable, theQA device found the plan to pass. Given the poor measuredsensitivity of these devices at common thresholds, yet highspecificity, Table III shows a preference for QA devices topass the plans used in this study at common thresholds.
Table III is limited in that it only evaluates a single accep-tance criterion for each device. Therefore, ROC curves were
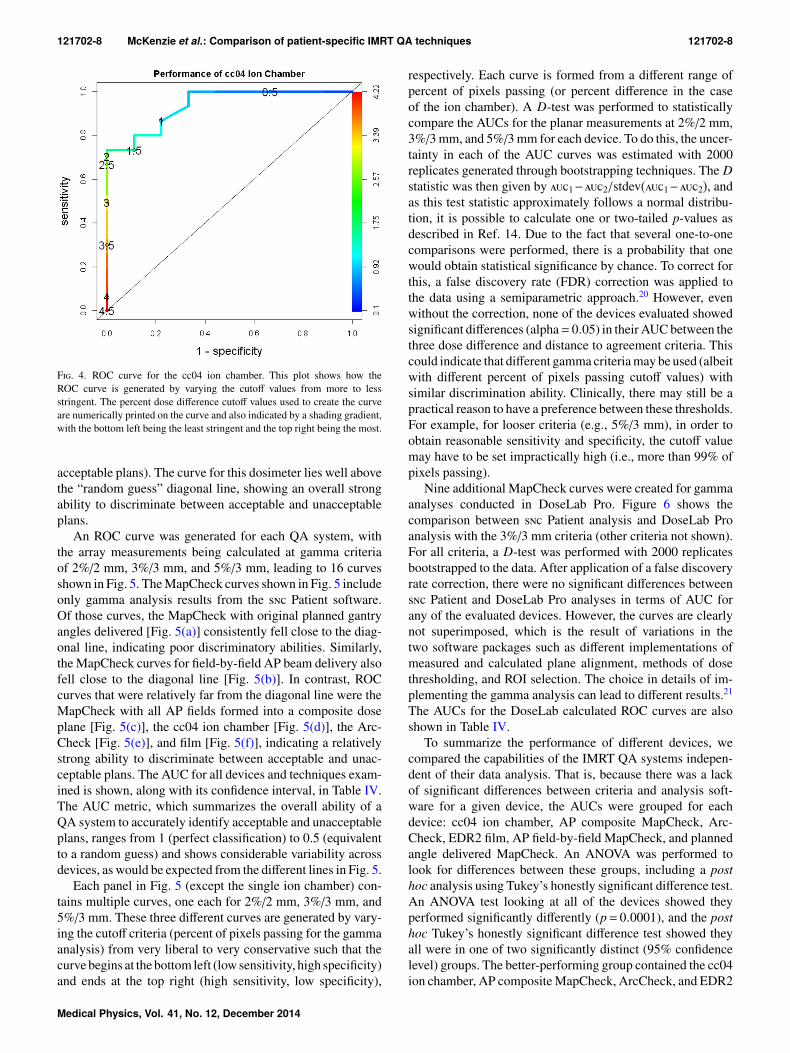
created after delivery of the 24 plans to each QA device. Asan example, Fig. 4 shows the ROC curve generated for the sin-gle cc04 ion chamber in the I’mRT phantom.19 The numbersprinted on the curve are the cutoff values (in % dose differ-ence). Across the 24 patient plans, the percent difference forthe ion chamber ranged from 0% to 4.5%. As would be ex-pected, as the cutoff was changed from more liberal (4.5%) tomore stringent (0.5%), the sensitivity increased (i.e., the de-vice was better at failing unacceptable plans). Concurrently, thespecificity decreased (i.e., the device was less adept at passing
T III. The sensitivity and specificity of the QA devices to detect ac-ceptable and unacceptable plans as measured by the gold standard. Thesevalues are calculated at selected common QA thresholds (3%/3 mm with90% of pixels passing for the 2D devices and 3% dose difference for thecc04 ion chamber). Each QA device (and field arrangement if relevant) islisted with the analysis software in parenthesis (if relevant): DL = DoseLabPro, = Sun Nuclear Patient, OmniPro = OmniPro I’mRT.
Device Sensitivity (%) Specificity (%)
cc04 ion chamber 47 100AP composite MapCheck (DL) 33 100AP composite MapCheck () 27 100ArcCheck () 60 89EDR2 film (OmniPro) 60 89Planned angle MapCheck (DL) 33 78Planned angle MapCheck () 47 89AP field-by-field MapCheck (DL) 0 100AP field-by-field MapCheck () 0 89
Medical Physics, Vol. 41, No. 12, December 2014
121702-8 McKenzie et al.: Comparison of patient-specific IMRT QA techniques 121702-8
F. 4. ROC curve for the cc04 ion chamber. This plot shows how theROC curve is generated by varying the cutoff values from more to lessstringent. The percent dose difference cutoff values used to create the curveare numerically printed on the curve and also indicated by a shading gradient,with the bottom left being the least stringent and the top right being the most.
acceptable plans). The curve for this dosimeter lies well abovethe “random guess” diagonal line, showing an overall strongability to discriminate between acceptable and unacceptableplans.
An ROC curve was generated for each QA system, withthe array measurements being calculated at gamma criteriaof 2%/2 mm, 3%/3 mm, and 5%/3 mm, leading to 16 curvesshown in Fig. 5. The MapCheck curves shown in Fig. 5 includeonly gamma analysis results from the Patient software.Of those curves, the MapCheck with original planned gantryangles delivered [Fig. 5(a)] consistently fell close to the diag-onal line, indicating poor discriminatory abilities. Similarly,the MapCheck curves for field-by-field AP beam delivery alsofell close to the diagonal line [Fig. 5(b)]. In contrast, ROCcurves that were relatively far from the diagonal line were theMapCheck with all AP fields formed into a composite doseplane [Fig. 5(c)], the cc04 ion chamber [Fig. 5(d)], the Arc-Check [Fig. 5(e)], and film [Fig. 5(f)], indicating a relativelystrong ability to discriminate between acceptable and unac-ceptable plans. The AUC for all devices and techniques exam-ined is shown, along with its confidence interval, in Table IV.The AUC metric, which summarizes the overall ability of aQA system to accurately identify acceptable and unacceptableplans, ranges from 1 (perfect classification) to 0.5 (equivalentto a random guess) and shows considerable variability acrossdevices, as would be expected from the different lines in Fig. 5.
Each panel in Fig. 5 (except the single ion chamber) con-tains multiple curves, one each for 2%/2 mm, 3%/3 mm, and5%/3 mm. These three different curves are generated by vary-ing the cutoff criteria (percent of pixels passing for the gammaanalysis) from very liberal to very conservative such that thecurve begins at the bottom left (low sensitivity, high specificity)and ends at the top right (high sensitivity, low specificity),
respectively. Each curve is formed from a different range ofpercent of pixels passing (or percent difference in the caseof the ion chamber). A D-test was performed to statisticallycompare the AUCs for the planar measurements at 2%/2 mm,3%/3 mm, and 5%/3 mm for each device. To do this, the uncer-tainty in each of the AUC curves was estimated with 2000replicates generated through bootstrapping techniques. The Dstatistic was then given by 1−2/stdev(1−2), andas this test statistic approximately follows a normal distribu-tion, it is possible to calculate one or two-tailed p-values asdescribed in Ref. 14. Due to the fact that several one-to-onecomparisons were performed, there is a probability that onewould obtain statistical significance by chance. To correct forthis, a false discovery rate (FDR) correction was applied tothe data using a semiparametric approach.20 However, evenwithout the correction, none of the devices evaluated showedsignificant differences (alpha= 0.05) in their AUC between thethree dose difference and distance to agreement criteria. Thiscould indicate that different gamma criteria may be used (albeitwith different percent of pixels passing cutoff values) withsimilar discrimination ability. Clinically, there may still be apractical reason to have a preference between these thresholds.For example, for looser criteria (e.g., 5%/3 mm), in order toobtain reasonable sensitivity and specificity, the cutoff valuemay have to be set impractically high (i.e., more than 99% ofpixels passing).
Nine additional MapCheck curves were created for gammaanalyses conducted in DoseLab Pro. Figure 6 shows thecomparison between Patient analysis and DoseLab Proanalysis with the 3%/3 mm criteria (other criteria not shown).For all criteria, a D-test was performed with 2000 replicatesbootstrapped to the data. After application of a false discoveryrate correction, there were no significant differences between Patient and DoseLab Pro analyses in terms of AUC forany of the evaluated devices. However, the curves are clearlynot superimposed, which is the result of variations in thetwo software packages such as different implementations ofmeasured and calculated plane alignment, methods of dosethresholding, and ROI selection. The choice in details of im-plementing the gamma analysis can lead to different results.21
The AUCs for the DoseLab calculated ROC curves are alsoshown in Table IV.
To summarize the performance of different devices, wecompared the capabilities of the IMRT QA systems indepen-dent of their data analysis. That is, because there was a lackof significant differences between criteria and analysis soft-ware for a given device, the AUCs were grouped for eachdevice: cc04 ion chamber, AP composite MapCheck, Arc-Check, EDR2 film, AP field-by-field MapCheck, and plannedangle delivered MapCheck. An ANOVA was performed tolook for differences between these groups, including a posthoc analysis using Tukey’s honestly significant difference test.An ANOVA test looking at all of the devices showed theyperformed significantly differently (p= 0.0001), and the posthoc Tukey’s honestly significant difference test showed theyall were in one of two significantly distinct (95% confidencelevel) groups. The better-performing group contained the cc04ion chamber, AP composite MapCheck, ArcCheck, and EDR2
Medical Physics, Vol. 41, No. 12, December 2014

121702-9 McKenzie et al.: Comparison of patient-specific IMRT QA techniques 121702-9
F. 5. ROC curves generated for each analysis, grouped by dosimetric system. For each planar or array dosimeter, each panel contains a ROC curve for2%/2 mm, 3%/3 mm, and 5%/3 mm as the criteria for the gamma analysis. For this figure, all MapCheck gamma analyses were performed using Patientsoftware.
film whereas the AP field-by-field and planned angle deliveredMapCheck were in the poorer-performing group. The meanAUC of each device are shown in Table V, with the thick lineshowing the divide between the two groups.
In addition to describing the overall performance of theQA devices, in terms of their ability to distinguish acceptableand unacceptable plans, the ROC curves can also be usedto evaluate the optimal cutoff criteria. Cutoff criteria in theclinic (e.g., a 3% ion chamber criterion or 90% of pixelspassing gamma) are based on what has emerged as tradi-tional practice. However, ROC curves allow mathematically
optimal criteria to be determined. For example, a percentof pixels passing threshold can be selected to provide theoptimal sensitivity and specificity for a device at a 3%/3 mmcriteria. The optimal cutoffs were calculated for all devicesand analysis methods from the Youden index. The resultsare shown in Table VI along with 95% confidence intervals,each calculated from 500 bootstrapped replicates using theempirical method outlined by Skaltsa.15 Planar and array sys-tems at 2%/2 mm had optimal thresholds that ranged from68% to 90% percent of pixels passing, at 3%/3 mm it rangedfrom 85% to 98%, and at 5%/3 mm it ranged from 96%
Medical Physics, Vol. 41, No. 12, December 2014

121702-10 McKenzie et al.: Comparison of patient-specific IMRT QA techniques 121702-10
T IV. The AUCs for all dosimetric systems and analysis techniques,with accompanying bootstrapped 95% confidence intervals. The MapCheckgamma analysis was performed in both the patient software () andDL. All film analyses were performed in OmniPro I’mRT software. In thecolumn labeled IMRT QA method, the delivery technique is listed first (forMapCheck irradiations), then the type of dosimeter used, and finally thesoftware used for the gamma analysis (when relevant). The devices analyzedwith gamma analysis are grouped by their dose difference and distance toagreement criteria and ordered by their AUC within this grouping.
IMRT QA method AUC C.I.
cc04 ion chamber 0.94 (0.82–1)2%/2 mm
AP composite MapCheck (DL) 0.85 (0.67–0.99)ArcCheck () 0.81 (0.61–0.95)AP field-by-field MapCheck (DL) 0.80 (0.61–0.98)AP composite MapCheck () 0.80 (0.6–0.95)EDR2 film (OmniPro) 0.76 (0.55–0.93)Planned angle MapCheck () 0.65 (0.41–0.85)AP field-by-field MapCheck () 0.61 (0.36–0.85)Planned angle MapCheck (DL) 0.59 (0.35–0.83)3%/3 mm
AP composite MapCheck (DL) 0.89 (0.73–1)AP composite MapCheck () 0.85 (0.66–1)EDR2 film (OmniPro) 0.84 (0.66–0.97)ArcCheck () 0.84 (0.67–0.99)AP field-by-field MapCheck (DL) 0.76 (0.51–0.97)Planned angle MapCheck () 0.69 (0.44–0.89)AP field-by-field MapCheck () 0.59 (0.35–0.84)Planned angle MapCheck (DL) 0.58 (0.33–0.81)5%/3 mm
AP composite MapCheck (DL) 0.93 (0.8–1)ArcCheck () 0.87 (0.71–0.99)EDR2 film (OmniPro) 0.84 (0.66–1)AP composite MapCheck () 0.78 (0.57–0.92)Planned angle MapCheck () 0.75 (0.51–0.94)Planned angle MapCheck (DL) 0.67 (0.44–0.89)AP field-by-field MapCheck (DL) 0.65 (0.38–0.9)AP field-by-field MapCheck () 0.55 (0.31–0.79)
to 99.8%. These findings demonstrated the reasonable,general trend that looser gamma criteria require a more strin-gent cutoff (and vice versa). Some systems, in conjunctionwith loose gamma criteria (high dose difference/high dis-tance to agreement), have “optimal” thresholds that may beclinically unreasonably high. For example, the AP field-by-field MapCheck at 5%/3 mm () and the AP compositeMapCheck at 5%/3 mm (DL) had optimal cutoffs of 98.7%and 99.7%, respectively. For the AP composite MapCheckat 5%/3 mm, three quarters of the plans measured had 99%of pixels passing or higher, requiring an optimal thresholdslightly above 99% in order to most accurately sort plans forthe AP composite MapCheck. This very high threshold willbe generally true for liberal dose difference and distance toagreement criteria. Therefore, the performance of the ROCcurves and calculated optimal cutoffs must be tempered byclinical realities.
F. 6. Comparing gamma calculations between DoseLab Pro (solid line)and Patient (dashed line) for ROC curves created from the MapCheckmeasurements analyzed at 3%/3 mm.
Medical Physics, Vol. 41, No. 12, December 2014

121702-11 McKenzie et al.: Comparison of patient-specific IMRT QA techniques 121702-11
T V. Average AUC for each device, irrespective of analysis method.The thick line indicates where the devices were grouped into significantlybetter and worse performing groups based on AUC. The AUC listed in thistable is an average of the AUCs from all three gamma analyses (2%/2 mm,3%/3 mm, and 5%/3 mm) for the planar/array dosimeters, as well as both and DoseLab software packages for the MapCheck measurements.
QA system Average AUC across all analysis systems
Cc04 ion chamber 0.94AP composite MapCheck 0.85ArcCheck 0.84EDR2 film 0.82
AP field-by-field MapCheck 0.66Planned angle MapCheck 0.65
Of note, when using the Youden index, the cc04 ion cham-ber was calculated to have an optimal cutoff of 1.6%, which isconsiderably tighter than the 3% threshold commonly used inthe clinic. The 3% ion chamber criteria that are commonly usedclinically are substantially more likely to pass acceptable plans(favorable for efficiency), but also substantially more likelyto pass unacceptable plans (detrimental for patient care), thanthe mathematically optimized threshold of 1.6%. However,this Youden index based optimal cutoff was obtained without
consideration of prevalence of unacceptable plans or cost ofa false positive. Different cutoffs may be obtained by varyingthese weighting factors. When the cost was manipulated tosolve for an optimal threshold of 3% for the ion chamber, thisresulted in a cost of passing an unacceptable plan that was 0.06times (about 1/16) the cost of failing a truly acceptable plan.That is, in order for 3% to be the optimal cutoff for single ionchamber IMRT QA, this technique must be heavily weightedto preferentially pass plans—passing an unacceptable planmust be much less punitive than failing an acceptable plan.This is a surprising finding and is in opposition to reasonableclinical goals, which are generally to err on the side of caution(i.e., preferentially failing plans to ensure no unacceptableplans are passed). Nevertheless, for the sake of comparingcriteria for other QA methods, this same weighting (0.06) wasused for all other devices to create the percent of pixels passingcriteria that were equivalent (in weighting) to the 3% criteriafor the ion chamber (Table VI). As would be expected with thisweighting strategy, the weighted thresholds show lower (lessstringent) percent of pixels passing values than the unweightedthresholds. The amount that the thresholds decreased variedamong devices. Some showed substantial lowering, whereasothers changed only modestly.
T VI. Optimal cutoffs (percent of pixels passing gamma for planar/array dosimeters or percent difference for the cc04 single ion chamber) given for alldosimetric systems, both with and without weighting by the prevalence of a failing plan and the cost of falsely labeling a failing plan as passing. This table isordered by the Youden index (no weighting) optimal thresholds for percent of pixels passing. The calculation of confidence intervals was based on a normalapproximation, so there is an opportunity to exceed 100% of pixels passing.
Youden index (no weighting) Weighted optimal cutoff
Device
Threshold (dose difference for ion chamber;% of pixels passing for all else) with 95%
confidence intervals
Threshold (dose difference for ion chamber; % ofpixels passing for all else) with 95% confidence
intervals
cc04 ion chamber 1.6 ± 1.1 3.0 ± 0.7EDR2 film at 2%/2 mm 68 ± 15 60 ± 6.4Planned angle MapCheck at 2%/2 mm () 69 ± 19 54 ± 13ArcCheck at 2%/2 mm () 74 ± 14 49 ± 11Planned angle MapCheck at 2%/2 mm (DL) 80 ± 20 48 ± 23AP composite MapCheck at 2%/2 mm () 82 ± 9 66 ± 10AP field-by-field MapCheck at 2%/2 mm () 85 ± 8 72 ± 17Planned angle MapCheck at 3%/3 mm (DL) 85 ± 14 69 ± 16AP composite MapCheck at 2%/2 mm (DL) 89 ± 7 62 ± 19AP field-by-field MapCheck at 2%/2 mm (DL) 90 ± 4 78 ± 6ArcCheck at 3%/3 mm () 92 ± 7 69 ± 14Planned angle MapCheck at 3%/3 mm () 94.9 ± 9.5 70 ± 13ArcCheck at 5%/3 mm () 96 ± 2 92 ± 6AP field-by-field MapCheck at 3%/3 mm () 96 ± 4.6 90 ± 7.2EDR2 film at 3%/3 mm 97 ± 9.7 76 ± 8AP composite MapCheck at 3%/3 mm (DL) 98 ± 2 82 ± 13AP composite MapCheck at 3%/3 mm () 98 ± 2 83 ± 13AP field-by-field MapCheck at 3%/3 mm (DL) 98 ± 2.6 92 ± 4.4Planned angle MapCheck at 5%/3 mm (DL) 98 ± 5 85 ± 9.3Planned angle MapCheck at 5%/3 mm () 98.5 ± 7.2 83 ± 12AP field-by-field MapCheck at 5%/3 mm () 98.7 ± 1.9 96 ± 2.4AP field-by-field MapCheck at 5%/3 mm (DL) 99.4 ± 1.1 98 ± 1.6AP composite MapCheck at 5%/3 mm () 99.6 ± 0.4 98.5 ± 0.7AP composite MapCheck at 5%/3 mm (DL) 99.7 ± 0.4 96 ± 3EDR2 film at 5%/3 mm 99.8 ± 1.5 91 ± 6
Medical Physics, Vol. 41, No. 12, December 2014

121702-12 McKenzie et al.: Comparison of patient-specific IMRT QA techniques 121702-12
4. DISCUSSION
This research showed that not all of the IMRT QA sys-tems analyzed in this work can equally differentiate betweendosimetrically acceptable and unacceptable patient plans. Thiscould be a reflection of the differing measurement geometries,resolution of the measurements, and implementations of thedata analyses. In fact, none of the devices sorted the plans inthe exact same manner as the gold standard, which was cho-sen to be a more rigorous benchmark against which the otherdevices could compare the same endpoint: the acceptability ofa given plan. This study used a multiple ion chamber phantomwith planned gantry angle delivery as the gold standard. Suchan approach has been used before,9 but is certainly not theonly possible gold standard that could be used for such a study.The validity of our gold standard, at least for standard clinicalcriteria, is evident from the data in Tables I and III. Table Ishows that the multiple ion chamber phantom identified plansthat had clear dosimetric problems, whereas the low sensi-tivity of many test QA systems (in Table III) indicate that theyoften failed to identify these same problematic plans (the MICwas superior in sensitivity to the test devices). Importantly,in Table III, the devices being evaluated were found to havehigh specificity (93% on average). This indicates that they didnot identify failing plans that may have been missed by themulti-ion chamber phantom; the multi-ion chamber phantomidentified the vast majority of the errors. This might seem asurprising result, as the MIC does not sample at the edge of thefield. However, the high specificity indicates that at the edge ofthe field, either plans did not fail often (which is consistent withthe findings of IROC Houston’s phantom program, where 90%of phantom failures were identified by point dosimeters in thetarget22), or the gamma analysis used with the planar devicesalso failed to identify the error. While our multi-ion cham-ber phantom worked as a gold standard for our experimentper Table III, other gold standards could also be conceived forthis sort of evaluation. For example, AAPM Task Group 120(Ref. 23) discusses how an ideal IMRT dosimeter would beable to truly sample a plan three dimensionally; however, suchdosimeters have not yet been proven clinically viable.
When evaluated at clinical criteria (Table III), all of theevaluated devices performed poorly at identifying unaccept-able plans. As can be seen from Table I, many of the clinicalplans used in this study showed substantial dosimetric errorsin the planning system calculation. Yet, the vast majority ofplans were declared as passing by the QA devices. This isa concerning result as it undermines the purpose of IMRTQA—to detect dosimetrically problematic plans. To separatethe effects of the detector system from the choice of threshold,ROC analysis was performed to evaluate all thresholds. Us-ing this analysis, the various QA systems were found to sortinto two groups with significantly different abilities to accu-rately classify plans. The better performers included the cc04ion chamber, AP composite MapCheck, radiographic film,and ArcCheck, whereas the field-by-field and planned angleMapCheck performed relatively poorly. The AUC averagesin the better-performing group ranged from 0.82 to 0.94 (Ta-ble V). A guideline for assigning a qualitative assessment
to the AUC values states that 0.5 < AUC ≤ 0.7 is “less accu-rate,” 0.7 < AUC ≤ 0.9 is “moderately accurate,” and 0.9< AUC < 1 is “highly accurate.”24 The better-performinggroup is therefore moderately to highly accurate, whereas thepoorer-performing group (ranging from 0.65 to 0.66) wouldqualify as less accurate. Of note, specific analysis and process-ing methods were used for each device (e.g., absolute versusrelative dosimetry, region of interest for gamma analysis, etc.),and further study is warranted for other methods of analysisto determine how they affect the performance of the device. Astrength of this study is that it is an endpoint analysis; it distillsa range of methods down to a binary analysis of whether a planwas sorted correctly as passing or failing. This has allowed thecomparison of a range of differing methodologies and opensthe opportunity to do similar analyses with the many other QAoptions available.
The better-performing IMRT QA techniques encompasseda wide range of different devices and analysis methodologies.They included some arrays, film, and even the single ionchamber. The single ion chamber, in particular, is unique andworth consideration as no device performed better than thesingle ion chamber. The limitations of a single point doseto assess a plan are obvious, in that most of the plan is notsampled by this dosimeter. The high AUC is, in that sense,somewhat surprising. (Of course it is essential to rememberthat the AUC performance incorporates all thresholds, andthe common clinical 3% threshold resulted in a poor perfor-mance, as common thresholds did for most detectors.) Whilesome bias could be imagined between the cc04 single ionchamber measurement and the multiple ion chamber goldstandard, the ion chamber volumes, phantom geometry, andlocations of measurement(s) were completely different be-tween these systems. The reasonable performance of a pointdosimeter is consistent with the literature. When compar-ing multiple ion chamber readings in a plan during IMRTQA (averaged over 458 clinical plans) Dong et al.17 foundonly a 1.1% standard deviation in the percent dose differ-ence, indicating that for most plans, a single point dose actu-ally described the plan reasonably well. Additionally, 90% ofIROC Houston head and neck phantom failures were iden-tified by the point dosimeters in the target, only 10% wereidentified by planar dosimetry alone.22 Moreover, when anin-house QA device was used to predict a failing irradia-tion of the head and neck phantom, no QA device outper-formed a single ion chamber.25 Finally, an extensive IMRTQA series of over 13 000 patients using film and ion chamberfound that all follow-up (including remeasurement or planadjustment) resulted from the ion chamber measurements andnever from the planar detector.26 These previous studies sup-port the current findings that, while a single ion chamber isclearly imperfect, no device was superior to it.
Some insight is also available on the QA techniques thatperformed less well under the ROC analysis. The field-by-field MapCheck is particularly interesting because it showeda much poorer ability to correctly sort plans compared withthe composite MapCheck, despite being derived from thesame measurement data. The differences in their ability toclassify plans stem entirely from the method of analysis.
Medical Physics, Vol. 41, No. 12, December 2014

121702-13 McKenzie et al.: Comparison of patient-specific IMRT QA techniques 121702-13
When AP-delivered beams were analyzed field-by-field onthe diode array, most fields scored high on a gamma analysisfor both failing and passing plans. However, when summedinto a composite plane, there was a greater differential be-tween acceptable and unacceptable plans (though the dosedistribution in the composite measurement has little geomet-rical relationship to where the dose will be deposited withinthe patient volume). Publications by Kruse9 and Nelms27
have demonstrated some of the shortcomings of field-by-field dosimetry, notably an inability to distinguish betweenclinically acceptable and unacceptable plans on the basis ofpercent of pixels passing. The poor performance of field-by-field analysis in our study is therefore not surprising in thatit agrees with these previous studies. However, the relativelybetter performance of the AP composite measurements wasan unexpected result because it is comprised of the sameunderlying data. When exploring the IMRT plans used inthis study, some of the plans had fields in which there wasa small bias in each plane (e.g., each field was slightly hot),while others demonstrated agreement in the majority of theirfields with one field having a relatively large error. Becausethe set of plans used in this analysis were unmodified clin-ical treatment plans and did not have induced errors, thecauses of dosimetric unacceptability in this data are hetero-geneous, and so too were dosimetric manners in which theseerrors manifested. This means the data set is more reflectiveof the various issues one might encounter in the clinic. Asfor the cause of the different AUCs, the superior AUC ofthe composite analysis stemmed from both superior sensi-tivity and specificity of this method. The superior speci-ficity is reasonable; a deviation on one field could easilybe removed or washed-out in the composite image, lead-ing to a preferential passing of a plan in composite analysis(i.e., heightened specificity). However, composite analysisalso offered superior sensitivity. One difference between theanalysis methods was the exact points included within thelow-dose ROI. Low-dose regions were pruned in this anal-ysis, but this pruning occurred either field-by-field or forthe composite dose distribution. When combining multiplefields, the field edges will never be exactly the same betweenfields. Therefore there will be some regions in the compos-ite plan that are “low-dose” and will be pruned that wouldnot be pruned during the field-by-field analysis. Because thefield-by-field analysis will therefore include more low-dosepoints, and because low-dose points can have large errorsand still pass gamma analysis based on a global dose differ-ence, this could make it harder for the field-by-field analysisto detect unacceptable plans. The ability of global normal-ization to inflate the percent of pixels passing gamma hasbeen noted in the literature.28 The poorer performance ofthe field-by-field analysis is particularly interesting because asurvey of QA practice based on MapCheck devices1 showedthat 64.1% of clinics use AP field-by-field measurements,whereas 32.8% use AP composite methods most of the time.Therefore, the question of field-by-field sensitivity is highlyrelevant to today’s QA practices. Further study is warrantedto more fully understand the observed differences in perfor-mance, and in general, to optimize methods for IMRT QA.
In addition to the performance of the field-by-field anal-ysis, composite diode array dosimetry performed with theoriginal planned gantry angles also did not have a strongability to correctly discriminate plans. While the device wasused in this study according to the manufacturer recommen-dations, the manufacturer does caution that non-normal inci-dence can lead to errors of in the 2D information because thearray appears 1D to the beams eye view, and the air cavitiesperturb the fluence (SunNuclear, MapCheck for RotationalDosimetry, 2007). This issue of directional dependence is apossible explanation for the relatively poorer performance ofthe MapCheck when all beams were delivered at their orig-inal gantry angles.
The final column in Table VI shows the optimal thresh-olds for each device and analysis technique examined in thisstudy and are based on the prevalence and cost weightingwhich was used to solve for a 3% dose difference optimalcutoff in the ion chamber. These values establish thresholdsbased on the clinical history of a 3% dose difference thresholdfor ion chamber-based IMRT plan verification.18 However,the clinical appropriateness of the underlying cost weightingshould be questioned because this weighting indicates that thecost of misclassifying an unacceptable plan as acceptable is1/16 (0.06 times) that of misclassifying an acceptable plan asunacceptable—that is, passing an unacceptable plan carriesless risk according to this weighting. This is contrary to clinicalgoals. It must be recalled that the 3% ion chamber thresholdwas not devised with detailed analysis of this cost weighting,but rather appears to reflect an underlying priority of efficiencyin the clinic. This is clearly not an optimal solution but its originmakes sense: it is a challenge determining the cost of poten-tially delivering an unacceptable plan to a patient, whereasit is easy to determine the cost of failing an acceptable plan(in terms of equipment and personnel costs). Delivering anunacceptable plan with gross errors would lead to an imme-diate cost to the patient’s health, however the cost associatedwith smaller errors would be less evident, as they may onlybe manifested in the long term health of the patient. Detailedanalysis of this cost weighting would be of great value to themedical physics community so that optimal thresholds can bedetermined based on realistic cost functions. Recognizing thelimitation of this cost function, the same weighting was usedon other devices in Table VI. The planar and array dosimetersrevealed weighted thresholds that are generally consistent withclinical experience. At a 3%/3 mm criteria, 90% of pixelspassing was often within the confidence interval of the optimalthreshold. This means that using a criteria of 90% of pixelspassing 3%/3 mm would, in this case, be consistent with theweighting used for an ion chamber criteria of 3%. However,this does not actually indicate that an absolute optimum hasbeen found. As illustrated previously in Table III, at commonclinical thresholds, the devices performed poorly. Using theweighted optimal threshold, some QA methods (such as theArcCheck at 3%/3 mm) showed a weighted threshold that waswell below 90% of pixels passing. If, in a case such as this,a clinic used 90% as its threshold (or any value greater thanthe threshold listed in the last column of Table VI), this couldbe interpreted as more preferential weighting toward failing an
Medical Physics, Vol. 41, No. 12, December 2014

121702-14 McKenzie et al.: Comparison of patient-specific IMRT QA techniques 121702-14
acceptable plan; that is, it would err more on the side of cautionby being less likely to pass an unacceptable plan. This is clin-ically reasonable, and therefore selection of a threshold abovethe weighted value (or below in the case of dose differencefor the ion chamber) in Table VI is likely a clinically sounddecision, whereas a threshold below (or above for ion cham-ber dose difference) the weighted value is more representativeof a liberal cutoff that may excessively pass plans, includingunacceptable ones.
Future work can and should be done by the physics commu-nity to expand upon this research. This should include moreprecisely determining AUC and optimal cutoffs and deter-mining optimal methods for performing IMRT QA in termsof sensitivity and specificity. This can include the use of anexpanded set of patient plans to yield tighter confidence inter-vals. Such work should also be done in the context of exploringdifferent gold standards for verifying IMRT plan acceptability,as many gold standards are conceivable and all have limita-tions. In general, compared with the wide range of devices andanalysis techniques used by the physics community, this workhas only measured a small subset of IMRT QA methods. How-ever, the techniques described above can be used to study othermethods and determine a clinically relevant cutoff thresholdfor any particular IMRT QA dosimeter and analysis technique.This could be done to meet the sensitivity, specificity, andfinancial cost needs of the clinic. As always, regardless of theIMRT QA method used, it is up to the scrutiny of the clinicalteam to apply good judgment in determining the acceptabilityof a plan prior to treatment.
5. CONCLUSION
Several commercial patient-specific IMRT QA dosimetersand methods were investigated for their ability to discrimi-nate between acceptable and unacceptable plans on a set ofclinical patient plans. A ROC analysis was applied to trackthe performance of the various methods as a function of thecutoff values (% dose difference for point measurements, %of pixels passing for planar measurements). ROC analysiswas also used to determine the optimal cutoff values for thevarious methods being investigated, including when weightedfor different costs for falsely failing an acceptable plan versusfalsely passing an unacceptable plan.
Using common clinical criteria, all evaluated QA dosime-ters were found to offer poor sensitivity. Based on the areasunder the ROC curves (which is independent of the cut-off value chosen), different devices performed significantlypoorer or better than others. When averaging all analysistechniques for each QA method, the ion chamber, AP com-posite MapCheck, ArcCheck, and radiographic film all per-formed well (and equivalently so), whereas the AP field-by-field and planned angle delivered MapCheck performed morepoorly.
The classification abilities for each device at 2%/2 mm,3%/3 mm, and 5%/3 mm gamma criteria were not statisticallysignificantly different in this study. Naturally, at these dif-ferent criteria, a different percent of pixels passing cutoff
would be necessary. For example, at the more liberal 5%/3 mm,a very high cutoff would be needed to have an adequate sensi-tivity. Similarly, different analysis softwares did not lead tostatistically significantly different results for a given deviceand gamma criteria.
Optimal cutoffs (% dose difference or % of pixels pass-ing) were determined for each dosimeter evaluated. This wasdone with and without weighting of false positives versusfalse negatives. Surprisingly, in order to match clinical prac-tice, the cost of passing an unacceptable plan needed to bemuch less than the cost of failing an acceptable plan, con-trary to what would be expected and desired in clinical prac-tice. Nevertheless, consistent cutoffs were created for eachdosimeter that could be used for IMRT QA. However, with acost-benefit analysis balancing the cost of falsely detecting anunacceptable or acceptable plan, an optimal cutoff could betailored for an individual clinic’s needs.
This work shows that depending on the QA system beingused, different considerations need to be made. The same cut-off criteria do not yield the same classification abilities acrossall devices. Also, this work has shown that QA systems havedifferent abilities to accurately sort acceptable and unaccept-able plans. This information can help guide clinics to makingmore informed decisions when considering how and whichpatient-specific IMRT QA devices to use in the detection ofplan errors.
ACKNOWLEDGMENTS
This work was supported by Public Health Service GrantNo. CA010953 awarded by the National Cancer Institute,United States Department of Health and Human Services.Also this research is supported in part by the National Insti-tutes of Health through MD Anderson’s Cancer Center Sup-port Grant No. CA016672.
a)Author to whom correspondence should be addressed. Electronic mail:[email protected]; Telephone: (713) 745-8939; Fax: (713) 794-1364.
1B. E. Nelms and J. A. Simon, “A survey on planar IMRT QA analysis,” J.Appl. Clin. Med. Phys. 8(3), 76–90 (2007).
2D. A. Low, W. B. Harms, S. Mutic, and J. A. Purdy, “A technique for thequantitative evaluation of dose distributions,” Med. Phys. 25(5), 656–661(1998).
3E. R. DeLong, D. M. DeLong, and D. L. Clarke-Pearson, “Comparing theareas under two or more correlated receiver operating characteristic curves:A nonparametric approach,” Biometrics 44(3), 837–845 (1988).
4J. Gordon and J. Siebers, “Addressing a Gap in current IMRT quality assur-ance,” Int. J. Radiat. Oncol., Biol., Phys. 87(1), 20–21 (2013).
5C. E. Metz, “Basic principles of ROC analysis,” Semin. Nucl. Med. 8(4),283–298 (1978).
6M. Carlone, C. Cruje, A. Rangel, R. McCabe, M. Nielsen, and M. Macpher-son, “ROC analysis in patient specific quality assurance,” Med. Phys. 40(4),042103 (7pp.) (2013).
7E. E. Wilcox, G. M. Daskalov, G. Pavlonnis III, R. Shumway, B. Kaplan, andE. VanRooy, “Dosimetric verification of intensity modulated radiation ther-apy of 172 patients treated for various disease sites: Comparison of EBT filmdosimetry, ion chamber measurements, and independent MU calculations,”Med. Dosim. 33(4), 303–309 (2008).
8R. M. Howell, I. P. Smith, and C. S. Jarrio, “Establishing action levels forEPID-based QA for IMRT,” J. Appl. Clin. Med. Phys. 9(3), 16–25 (2008).
9J. J. Kruse, “On the insensitivity of single field planar dosimetry to IMRTinaccuracies,” Med. Phys. 37(6), 2516–2524 (2010).
Medical Physics, Vol. 41, No. 12, December 2014

121702-15 McKenzie et al.: Comparison of patient-specific IMRT QA techniques 121702-15
10K. B. Pulliam, R. M. Howell, D. Followill, D. Luo, R. A. White, and S.F. Kry, “The clinical impact of the couch top and rails on IMRT and arctherapy,” Phys. Med. Biol. 56(23), 7435–7447 (2011).
11L. Bogner, J. Scherer, M. Treutwein, M. Hartmann, F. Gum, and A.Amediek, “Verification of IMRT: Techniques and problems,” Strahlenther.Onkol. 180(6), 340–350 (2004).
12T. Hastie, R. Tibshirani, and J. H. Friedman, The Elements of StatisticalLearning: Data Mining, Inference, and Prediction, 2nd ed. (Springer, NewYork, NY, 2009).
13E. McKenzie, P. Balter, F. Stingo, J. Jones, D. Followill, and S. Kry, “Repro-ducibility in patient-specific IMRT QA,” J. Appl. Clin. Med. Phys. 15(3),241–251 (2014).
14X. Robin, N. Turck, A. Hainard, N. Tiberti, F. Lisacek, J. C. Sanchez, andM. Muller, “pROC: An open-source package for R and S plus to analyze andcompare ROC curves,” BMC Bioinf. 12:77 (2011).
15K. Skaltsa, L. Jover, and J. L. Carrasco, “Estimation of the diagnosticthreshold accounting for decision costs and sampling uncertainty,” Biom. J.52(5), 676–697 (2010).
16N. J. Perkins and E. F. Schisterman, “The inconsistency of optimal cutpointsobtained using two criteria based on the receiver operating characteristiccurve,” Am. J. Epidemiol. 163(7), 670–675 (2006).
17L. Dong, J. Antolak, M. Salehpour, K. Forster, L. O’Neill, R. Kendall, andI. Rosen, “Patient-specific point dose measurement for IMRT monitor unitverification,” Int. J. Radiat. Oncol., Biol., Phys. 56(3), 867–877 (2003).
18G. A. Ezzell, J. M. Galvin, D. Low, J. R. Palta, I. Rosen, M. B. Sharpe, P. Xia,Y. Xiao, L. Xing, and C. X. Yu, “Guidance document on delivery, treatmentplanning, and clinical implementation of IMRT: Report of the IMRT Sub-committee of the AAPM radiation therapy Committee,” Med. Phys. 30(8),2089–2115 (2003).
19T. Sing, O. Sander, N. Beerenwinkel, and T. Lengauer, “ROCR: Visualizingclassifier performance in R,” Bioinformatics 21(20), 3940–3941 (2005).
20K. Strimmer, “A unified approach to false discovery rate estimation,” BMCBioinf. 9:303 (2008).
21G. A. Ezzell, J. W. Burmeister, N. Dogan, T. J. LoSasso, J. G. Mechalakos, D.Mihailidis, A. Molineu, J. R. Palta, C. R. Ramsey, B. J. Salter, J. Shi, P. Xia,N. J. Yue, and Y. Xiao, “IMRT commissioning: Multiple institution planningand dosimetry comparisons, a report from AAPM Task Group 119,” Med.Phys. 36(11), 5359–5373 (2009).
22A. Molineu, N. Hernandez, T. Nguyen, G. Ibbott, and D. S Followill, “Cre-dentialing results from IMRT irradiations of an anthropomorphic head andneck phantom,” Med. Phys. 40, 022101 (8pp.) (2013).
23D. A. Low, J. M. Moran, J. F. Dempsey, L. Dong, and M. Oldham, “Dosim-etry tools and techniques for IMRT,” Med. Phys. 38(3), 1313–1338 (2011).
24M. Greiner, D. Pfeiffer, and R. D. Smith, “Principles and practical appli-cation of the receiver-operating characteristic analysis for diagnostic tests,”Prev. Vet. Med. 45(1–2), 23–41 (2000).
25S. F. Kry, A. Molineu, J. Kerns, A. Faught, J. Y. Huang, K. Pulliam, J. Toni-gan, P. Alvarez, F. Stingo, and D. Followill, “Institutional patient-specificintensity-modulated radiation therapy quality assurance does not predictunacceptable plan delivery as measured by imaging and radiation onoclogycore at houston’s head and neck phantom,” Int. J. Radiat. Oncol., Biol., Phys.(in press).
26K. B. Pulliam, D. S. Followill, L. Court, L. Dong, M. T. Gillin, K. Prado, andS. F. Kry, “A 6-year hisotry of more than 13,000 patient-specific IMRT QAresults from 13 different treatment sites,” J. Appl. Clin. Med. Phys. 15(5),196–206 (2014).
27B. E. Nelms, H. Zhen, and W. A. Tome, “Per-beam, planar IMRT QA pass-ing rates do not predict clinically relevant patient dose errors,” Med. Phys.38(2), 1037–1044 (2011).
28B. E. Nelms et al., “Evaluating IMRT and VMAT dose accuracy: Practicalexamples of failure to detect systematic errors when applying a commonlyused metric and action levels,” Med. Phys. 40, 111722 (15pp.) (2013).
Medical Physics, Vol. 41, No. 12, December 2014