Acceptable Phosphorus Concentrations in Soils and Impact ...

Bioorganic & Medicinal Chemistry Letters 20 (2010) 2344–2349
Contents lists available at ScienceDirect
Bioorganic & Medicinal Chemistry Letters
journal homepage: www.elsevier .com/ locate/bmcl
Design of potent and selective GSK3b inhibitors with acceptable safetyprofile and pharmacokinetics
Dominique Lesuisse a,*, Gilles Tiraboschi c, Alain Krick d, Pierre-Yves Abecassis d, Gilles Dutruc-Rosset a,Didier Babin a, Frank Halley a, Fabienne Châtreau a, Sylvette Lachaud a, Alain Chevalier a,Dominique Quarteronet b, Marie-Claude Burgevin b, Céline Amara d, Philippe Bertrand b, Thomas Rooney b
a Medicinal Chemistry, Sanofi-aventis, 13 Quai Jules Guesde, 94300 Vitry-sur-Seine, Franceb CNS Department, Sanofi-aventis, 13 Quai Jules Guesde, 94300 Vitry-sur-Seine, Francec Molecular Modelling, Sanofi-aventis, 13 Quai Jules Guesde, 94300 Vitry-sur-Seine, Franced DMPKS, Sanofi-aventis, 13 Quai Jules Guesde, 94300 Vitry-sur-Seine, France
a r t i c l e i n f o a b s t r a c t
Article history:Received 1 December 2009Revised 25 January 2010Accepted 27 January 2010Available online 2 February 2010
Keywords:GSK3betaTau phosphorylationAmide hydrolysisMetabolic stabilityKinase
0960-894X/$ - see front matter � 2010 Elsevier Ltd.doi:10.1016/j.bmcl.2010.01.132
* Corresponding author. Tel.: +33 1 58 93 37 71; faE-mail address: dominique.lesuisse@sanofi-aventis
From potent and selective inhibitors of GSK3b displaying CYP1A2 inhibition and poor PK properties,mostly linked to metabolic instability and in vivo hydrolysis of the amide bond, we were able to obtainsafe and orally available inhibitors with good half lives.
� 2010 Elsevier Ltd. All rights reserved.
Glycogen synthase kinase beta (GSK3b)1 is involved in phos-phorylation of at least two physiologically important proteins,tau2 and glycogen synthase.3 These proteins have been shown tobe intimately associated with some pathological processes, suchas Alzheimer’s disease4 and diabetes, respectively. In the courseof a programme aimed at finding inhibitors of this enzyme, weconducted a high throughput and identified a hit 1 with inhibitoryactivity in the micromolar range. The optimisation of the potencyand the selectivity of this hit led to the identification of two potentaminoindazoles 4 and 5.5 However, as is often the case in medici-nal chemistry, optimization of the potency was paralleled by a de-crease of the physicochemical properties of the compounds.Table 1 illustrates how some of these properties, such as solubility,lipophilicity and protein binding got worse through each step ofpotency optimization from 1 to 4 and 5. We therefore anticipatedthat there could be potential ADME issues to solve with these firstleads. The object of the present paper is to describe how we trans-formed these potent leads into safe and orally available com-pounds with acceptable PK properties, including brain exposure.
One of the important hurdles in medicinal chemistry is to iden-tify compounds with a good safety profile. Inhibition of hepatic
All rights reserved.
x: +33 1 58 93 34 50..com (D. Lesuisse).
cytochrome P450 enzymes and the hERG potassium channel areamong the most serious safety issues, since this can result indrug–drug interactions7 and cardiac toxicity (QT prolongation8),respectively. We also analyzed our compounds in assays predictiveof genotoxicity or clastogenicity. In order to gain insight into theoptimization for these series, we profiled 4 and 5 in a series of earlyADME and toxicity assays. The results are displayed in Table 2.
Although the stability in human S9 hepatic fractions was good,the metabolic stability in mice S9 hepatic fractions was poor and sothe optimization of this parameter, predictive of high clearance inrodents, was undertaken. No problem was anticipated regardinghERG channel inhibition, Ames, CYP 3A4, 2D6, 2C9 and 2C19 inhi-bition. However, the compounds displayed potent CYP1A2 inhibi-tion. The chemical optimization programme was therefore alsofocused on lowering this CYP1A2 inhibition.
After evaluation of �60 GSK3b inhibitors on a panel of hepaticCYP isoforms (human recombinant), about two thirds displayedinhibition of Cyp1A2, whereas inhibition of the other Cyp isoformsdid not appear to represent a major issue (Table 3). Inhibition ofCyp1A2 was therefore identified as a persistent series-related issuethat would need to be addressed early on.
In addition to the screening CYP panel used above, we evaluatedsome of the most potent GSK3b inhibitors on a kinetic CYP1A2assay to confirm their inhibition9 and check for potential

Table 2Full early ADME-T profile of 4 and 5
Compd Sol (mg/ml) Met staba,b Met staba,c Caco2 CYP1A2d CYP3A4
d CYP2D6d CYP2C9
d CYP2C19d Ames hErg
% Transp/h IC50 (lM) IC50 (lM) IC50 (lM) IC50 (lM) IC50 (lM) % inh 10 lM
4 <0.019 10 91 NRd 0.07 >10 >10 >10 >10 NRe 75 <0.016 40 91 3.9 0.08 >10 >10 >10 >10 Negative 24
a Percent of compound remaining after 15 min of S9 fraction exposure.b Mouse S9 hepatic fraction.c Human S9 hepatic fraction.d Human recombinant CYP enzymes.e No result.
Table 3Statistics of CYP isoforms inhibition by the first inhibitors of the programme
CYP isoform Number of compounds
IC50 > 10 lM IC50 < 10 lM IC50 < 1 lM
3A4 60 6 01A2 26 29 222C9 31 7 02D6 57 6 02C19 57 7 0
Table 1Evolution of the physicochemical properties of the compounds along the optimization process
NH
N
NH
O
ClCOOH N
H
N
NH
O
Cl NH
N
NH
O
HOPh NH
N
NH
O
HOPh
Br
NH
N
NH
O
Cl
Ph
Compd 1 2 3 4 5
GSK3b (lM)6 0.94 0.44 0.040 0.005 0.006Sol (mg/ml) 0.716 0.168 0.067 <0.001 <0.001Log D pH 7.4 <1 2.2 3.05 3.86 4.39% HSA binding <90 92.8 97.3 99.3 99.4
Table 4CYP1A2 inhibition of 5- and 6-substituted aminoindazoles8,9
NH
R1
R2
R1 R2 Compd GSK3b (l
Br 4-HOPh 4 0.005Ph Cl 5 0.0064-H2NPh Cl 6 0.0074-HOPh Cl 7 0.0083-Furyl Cl 8 0.0114-MePh Cl 9 0.0124-FPh Cl 10 0.0164-NO2Ph Cl 11 0.0174-BnOPh Cl 12 0.022Br Cl 13 0.055H 4-HOPh 3 0.036H 3-Thienyl 14 0.93H Ph 15 1.28H 3,5-F2-Ph 16 2.9H 3-Py 17 11
a CYP1A2 screening panel.b CYP1A2 kinetic assay.8c % IC50/min.
D. Lesuisse et al. / Bioorg. Med. Chem. Lett. 20 (2010) 2344–2349 2345
time-dependency.10 The trend for CYP1A2 inhibition wasparticularly pronounced in our most interesting series of GSK3binhibitors,11 as can be seen from Table 4. In addition, some of ourpotent GSK3b inhibitors displayed time-dependent kinetics ofCYP1A2 inhibition, suggesting a mechanism-based inhibition lead-ing to covalent binding to the enzyme. One of these compounds (8)incorporated a furan ring in the molecule. This motif has beenreported to lead to covalent binding to CYP enzymes via formationof reactive intermediates, such as epoxides and oxirenes, or theproduction of open 1,4-diketone derivatives.12 The phenol
N
NH
O
M) CYP1A2a (lM) CYP1A2
b
(lM) Slopec
>10 0.07 �1<0.4 0.08 �10.98
0.08 �2<0.4 0.03 �31.750.83 0.13 14.46>100.55>50 22 �21.9>10 0.39 013.8 2.7 �31.2 5.9 0
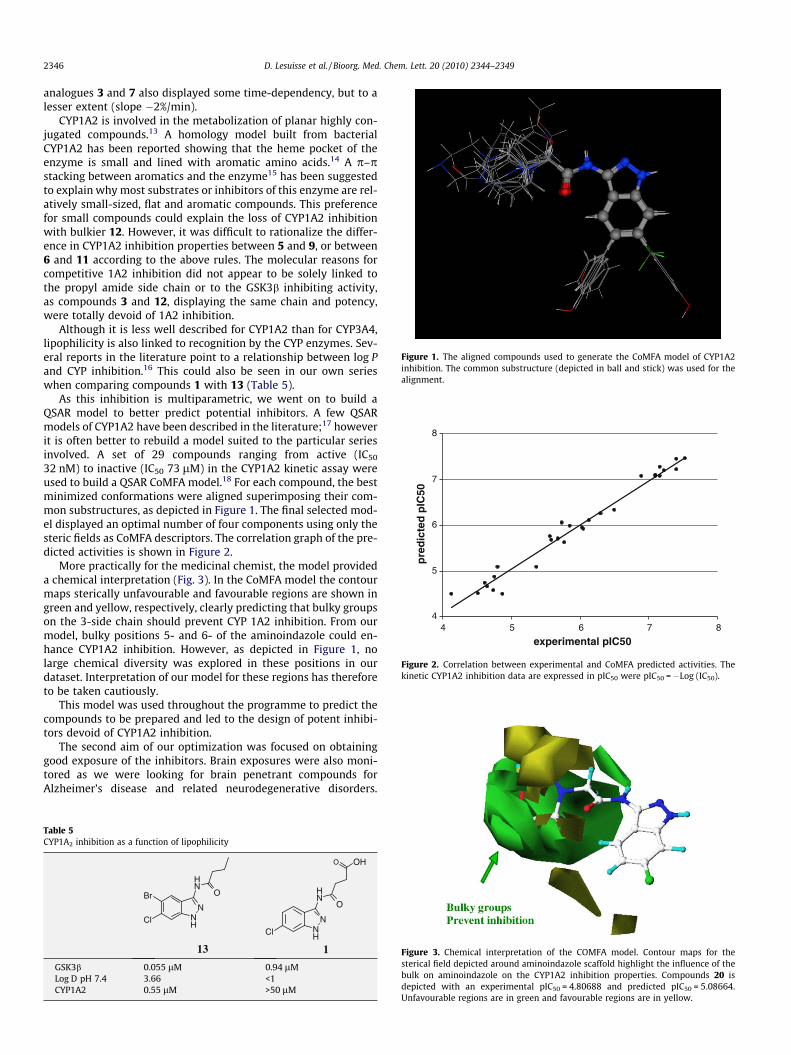
Figure 1. The aligned compounds used to generate the CoMFA model of CYP1A2inhibition. The common substructure (depicted in ball and stick) was used for thealignment.
4
5
6
7
8
4 5 6 7 8
experimental pIC50
pre
dic
ted
pIC
50
Figure 2. Correlation between experimental and CoMFA predicted activities. Thekinetic CYP1A2 inhibition data are expressed in pIC50 were pIC50 = �Log (IC50).
2346 D. Lesuisse et al. / Bioorg. Med. Chem. Lett. 20 (2010) 2344–2349
analogues 3 and 7 also displayed some time-dependency, but to alesser extent (slope �2%/min).
CYP1A2 is involved in the metabolization of planar highly con-jugated compounds.13 A homology model built from bacterialCYP1A2 has been reported showing that the heme pocket of theenzyme is small and lined with aromatic amino acids.14 A p–pstacking between aromatics and the enzyme15 has been suggestedto explain why most substrates or inhibitors of this enzyme are rel-atively small-sized, flat and aromatic compounds. This preferencefor small compounds could explain the loss of CYP1A2 inhibitionwith bulkier 12. However, it was difficult to rationalize the differ-ence in CYP1A2 inhibition properties between 5 and 9, or between6 and 11 according to the above rules. The molecular reasons forcompetitive 1A2 inhibition did not appear to be solely linked tothe propyl amide side chain or to the GSK3b inhibiting activity,as compounds 3 and 12, displaying the same chain and potency,were totally devoid of 1A2 inhibition.
Although it is less well described for CYP1A2 than for CYP3A4,lipophilicity is also linked to recognition by the CYP enzymes. Sev-eral reports in the literature point to a relationship between log Pand CYP inhibition.16 This could also be seen in our own serieswhen comparing compounds 1 with 13 (Table 5).
As this inhibition is multiparametric, we went on to build aQSAR model to better predict potential inhibitors. A few QSARmodels of CYP1A2 have been described in the literature;17 howeverit is often better to rebuild a model suited to the particular seriesinvolved. A set of 29 compounds ranging from active (IC50
32 nM) to inactive (IC50 73 lM) in the CYP1A2 kinetic assay wereused to build a QSAR CoMFA model.18 For each compound, the bestminimized conformations were aligned superimposing their com-mon substructures, as depicted in Figure 1. The final selected mod-el displayed an optimal number of four components using only thesteric fields as CoMFA descriptors. The correlation graph of the pre-dicted activities is shown in Figure 2.
More practically for the medicinal chemist, the model provideda chemical interpretation (Fig. 3). In the CoMFA model the contourmaps sterically unfavourable and favourable regions are shown ingreen and yellow, respectively, clearly predicting that bulky groupson the 3-side chain should prevent CYP 1A2 inhibition. From ourmodel, bulky positions 5- and 6- of the aminoindazole could en-hance CYP1A2 inhibition. However, as depicted in Figure 1, nolarge chemical diversity was explored in these positions in ourdataset. Interpretation of our model for these regions has thereforeto be taken cautiously.
This model was used throughout the programme to predict thecompounds to be prepared and led to the design of potent inhibi-tors devoid of CYP1A2 inhibition.
The second aim of our optimization was focused on obtaininggood exposure of the inhibitors. Brain exposures were also moni-tored as we were looking for brain penetrant compounds forAlzheimer’s disease and related neurodegenerative disorders.
Table 5CYP1A2 inhibition as a function of lipophilicity
NNH
NH
Br O
Cl
13
NNH
NH
O
Cl
OHO
1
GSK3b 0.055 lM 0.94 lMLog D pH 7.4 3.66 <1CYP1A2 0.55 lM >50 lM
Figure 3. Chemical interpretation of the COMFA model. Contour maps for thesterical field depicted around aminoindazole scaffold highlight the influence of thebulk on aminoindazole on the CYP1A2 inhibition properties. Compounds 20 isdepicted with an experimental pIC50 = 4.80688 and predicted pIC50 = 5.08664.Unfavourable regions are in green and favourable regions are in yellow.

D. Lesuisse et al. / Bioorg. Med. Chem. Lett. 20 (2010) 2344–2349 2347
Compounds 4 and 5 along with several related analogs were eval-uated in vivo in mouse preliminary pharmacokinetic studies to as-sess the general pharmacokinetic parameters of this series. Toincrease the throughput we used cassette dosing so the data haveto be viewed as preliminary pharmacokinetic results. The results ofsome of these studies (Table 6) showed that at least some of thecompounds (e.g., 5, 8, 13 and 18) displayed good or acceptablebrain/plasma ratios, indicating that this parameter was not limit-ing for these series. However, the data also pointed to very lowexposure and low, or non-measurable, bioavailability for all com-pounds. As the permeability of the compounds was generally good,as shown by their results in the Caco2 assay, these liabilities werehypothesized to be mainly linked to their poor metabolic stabilityin mice, as reflected by their high clearances. However, this param-eter was not the only driver of poor exposure, as shown by com-pound 13 which, despite good permeability and metabolicstability in mice, displayed extremely high clearance and low plas-ma exposure. Even compound 19 with acceptable clearance, inagreement with its in vitro metabolic stability, displayed a shorthalf-life.
The emphasis of the optimization program was therefore fo-cused on understanding and improving the parameters controllingthe rodent half-life and exposure, especially the metabolic stabili-ties of these compounds.
The compounds that had been optimized for potency andselectivity were very lipophilic and poorly soluble. Even thoughthe correlation is not absolute, these properties have beenshown to be generally associated with high uptake by livermetabolizing enzymes (CYP’s), resulting in higher metabolismand clearance.19 Modulation of these properties via the 3-posi-tion chain was in theory possible, as it had been shown to be ex-posed to the solvent area of the kinase and therefore largemodifications should be possible without changing the potency.5
An acidic moiety is ideal to solubilise and protect from metabo-lism,20 but the ability of an acidic compound to penetrate the brainby passive diffusion is limited, as was confirmed on 1 (Table 7)which displayed brain levels at the limit of detection. Earlierdata on 20 incorporating a basic side chain, showed better brainexposure but the short half-life was not predicted by the
Table 6Full ADME and pharmacokinetic (PK)a profile of 5-, 6- and 7-substituted aminoindazoles
NH
R1
R2
R3
R1 R2 R3 Compd GSK3b(lM)
Solb
(lg/ml)Log DpH 7.4
Met
Hd
Br 4-HOPh 4 0.005 <20 4.4 91Ph Cl 5 0.006 <20 3.7 914-HOPh Cl 7 0.008 <20 3.9 NR3-Furyl Cl 8 0.011 <20 4.1 45Br Cl 13 0.024 <20 4.4 97
4-HOPh 3 0.055 67 3.7 58Ph F F 18 0.005 4 2.4 86
F F 19 0.270 54 3.0 98
a Mice 1 mg/kg oral and iv cassette dosing.b Nephelometry.c Percent of compound remaining after 15 min of S9 fraction exposure.d Human.e Mice.f Oral dosing.g Plasma, iv dosing.h iv dosing.
metabolic stability and was not acceptable for in vivo dosing.Two analogues of 5, 21 and 22, incorporating such basic sidechains were also investigated and displayed very short half-livesdespite high metabolic stability (Table 7).
The absence of correlation between S9 mice metabolism andin vivo clearance posed a problem. At least two types of chemicalmodification could account for this discrepancy. The first is a directglucuroconjugation of the compound on any of its nucleophilicpositions. In the case of our series it could be the N1 or N3 posi-tions of the aminoindazole. There are precedents in the literaturesupporting direct N-glucuroconjugation on several heterocycles,such as imidazoles and triazoles.21 One way to quantitate the ex-tent of oxidative (phase I) versus glucuroconjugation (phase II)metabolism is to compare their transformation in mouse livermicrosomes in the presence and absence of NADPH and UDPGA,the co-factors necessary for the oxidative and conjugative metabo-lism, respectively. This experiment was performed on a few se-lected compounds (data not shown) and the results suggestedthat, at least for these compounds, direct glucuroconjugation wasnot involved in the metabolization.
The second type of chemical modification that could be respon-sible for the poor half-life is hydrolysis of the amide bond.Throughout the program, the clearance data obtained with amideswere in relatively good agreement with the expected ease of amidechemical hydrolysis, that is, primary > secondary > aromatic. Invivo this hydrolysis could be achieved by several processes: phaseI metabolism (CYP enzymes,22 hydrolases, peptidases) or evenchemically. The compounds were shown to be stable to chemicalhydrolyses and in mouse plasma (data not shown). To avoid a pos-sible issue of amide hydrolysis, we explored replacement of thisfunction by non-hydrolysable substitutions. Some examples aredisplayed in Table 8. Complete removal of the amide group, as in23, or replacement by alkyl or aryl groups, such as compounds24–28, proved detrimental to activity, as predicted by molecularmodelling, since the carbonyl function had been shown to makea hydrogen bond accepting interaction with the hinge binding por-tion of the kinase.5 More stable replacements able to keep thisinteraction, such as carbamates 29–32 and ureas 33–35, displayedbetter inhibitory activity.
N
NH
O
stabc Caco2
(T/h)Cpmax
f
(ng/ml)Cbmax
f
(ng/g)Clg
(l/h/kg)T1/2
g
(h)B/Ph F (%)
Me
10 NR 12 3.3 0.3 140 3.9 11 8 6.9 0.2 1.219 8.02 5 8 1.3
4 12.3 6 15.5 0.3 0.587 17.25 1 9 0.1 2
4 15.25 14 2.7 0.4 0.156 nd 34 50 4.5 0.3 1.793 16.33 172 56 1.2 0.3 0.3 18
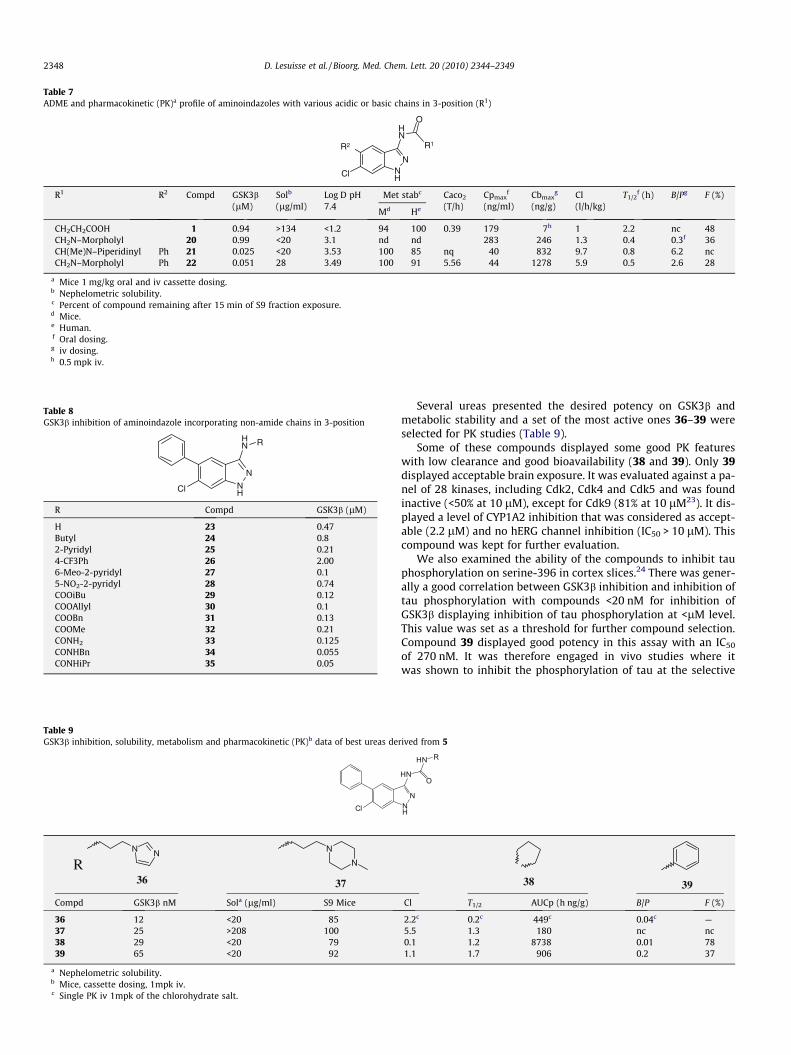
Table 7ADME and pharmacokinetic (PK)a profile of aminoindazoles with various acidic or basic chains in 3-position (R1)
NH
N
NH
Cl
O
R2 R1
R1 R2 Compd GSK3b(lM)
Solb
(lg/ml)Log D pH7.4
Met stabc Caco2
(T/h)Cpmax
f
(ng/ml)Cbmax
g
(ng/g)Cl(l/h/kg)
T1/2f (h) B/Pg F (%)
Md He
CH2CH2COOH 1 0.94 >134 <1.2 94 100 0.39 179 7h 1 2.2 nc 48CH2N–Morpholyl 20 0.99 <20 3.1 nd nd 283 246 1.3 0.4 0.3f 36CH(Me)N–Piperidinyl Ph 21 0.025 <20 3.53 100 85 nq 40 832 9.7 0.8 6.2 ncCH2N–Morpholyl Ph 22 0.051 28 3.49 100 91 5.56 44 1278 5.9 0.5 2.6 28
a Mice 1 mg/kg oral and iv cassette dosing.b Nephelometric solubility.c Percent of compound remaining after 15 min of S9 fraction exposure.d Mice.e Human.f Oral dosing.g iv dosing.h 0.5 mpk iv.
Table 8GSK3b inhibition of aminoindazole incorporating non-amide chains in 3-position
NH
N
NH R
Cl
R Compd GSK3b (lM)
H 23 0.47Butyl 24 0.82-Pyridyl 25 0.214-CF3Ph 26 2.006-Meo-2-pyridyl 27 0.15-NO2-2-pyridyl 28 0.74COOiBu 29 0.12COOAllyl 30 0.1COOBn 31 0.13COOMe 32 0.21CONH2 33 0.125CONHBn 34 0.055CONHiPr 35 0.05
Table 9GSK3b inhibition, solubility, metabolism and pharmacokinetic (PK)b data of best ureas de
Cl
RN N
36
N
N
37
Compd GSK3b nM Sola (lg/ml) S9 Mice
36 12 <20 8537 25 >208 10038 29 <20 7939 65 <20 92
a Nephelometric solubility.b Mice, cassette dosing, 1mpk iv.c Single PK iv 1mpk of the chlorohydrate salt.
2348 D. Lesuisse et al. / Bioorg. Med. Chem. Lett. 20 (2010) 2344–2349
Several ureas presented the desired potency on GSK3b andmetabolic stability and a set of the most active ones 36–39 wereselected for PK studies (Table 9).
Some of these compounds displayed some good PK featureswith low clearance and good bioavailability (38 and 39). Only 39displayed acceptable brain exposure. It was evaluated against a pa-nel of 28 kinases, including Cdk2, Cdk4 and Cdk5 and was foundinactive (<50% at 10 lM), except for Cdk9 (81% at 10 lM23). It dis-played a level of CYP1A2 inhibition that was considered as accept-able (2.2 lM) and no hERG channel inhibition (IC50 > 10 lM). Thiscompound was kept for further evaluation.
We also examined the ability of the compounds to inhibit tauphosphorylation on serine-396 in cortex slices.24 There was gener-ally a good correlation between GSK3b inhibition and inhibition oftau phosphorylation with compounds <20 nM for inhibition ofGSK3b displaying inhibition of tau phosphorylation at <lM level.This value was set as a threshold for further compound selection.Compound 39 displayed good potency in this assay with an IC50
of 270 nM. It was therefore engaged in vivo studies where itwas shown to inhibit the phosphorylation of tau at the selective
rived from 5
NH
N
HN
HN
O
R
38 39
Cl T1/2 AUCp (h ng/g) B/P F (%)
2.2c 0.2c 449c 0.04c —5.5 1.3 180 nc nc0.1 1.2 8738 0.01 781.1 1.7 906 0.2 37
D. Lesuisse et al. / Bioorg. Med. Chem. Lett. 20 (2010) 2344–2349 2349
GSK-3b epitope (pSer396/404) by 21–53% for up to 2 h whenadministered by oral route at 10 mg/kg.
The CYP1A2 inhibition and metabolic clearance of a series of 3-aminoindazoles was optimized by chemical variations at the 3-po-sition. It was shown that the hydrolysis of the amide bond partlyaccounts for the high clearance of some of these compounds.
Acknowledgements
We are grateful to the analytical department for compoundanalyses.
Supplementary data
Supplementary data associated with this article can be found, inthe online version, at doi:10.1016/j.bmcl.2010.01.132.
References and notes
1. Frame, S.; Cohen, P. Biochem. J. 2001, 359, 1. and references cited therein.2. Flaherty, D. B.; Soria, J. P.; Tomasiewicz, H. G.; Wood, J. G. J. Neurosci. Res. 2000,
62, 463.3. Ferrer, J. C.; Favre, C.; Gomis, R. R.; Fernandez-Novell, J. M.; Garcia-Rocha, M.;
De La Iglesia, N.; Cid, E.; Guinovart, J. J. FEBS Lett. 2003, 546, 127.4. Maccioni, R. B.; Munoz, J. P.; Barbeito, L. Arch. Med. Res. 2001, 32, 367.5. Lesuisse, D.; Dutruc-Rosset, G.; Tiraboschi, G.; Dreyer, M. K.; Maignan, S.;
Chevalier, A.; Halley, F.; Bertrand, P.; Burgevin, M.-C.; Quarteronet, D.; Rooney,T. Bioorg. Med. Chem. Lett. 2010, 20, 1985.
6. Technical note: measurement of GSK3b enzymatic activity by ScintillationProximity Assay (SPA). Partially purified recombinant human GSK3b enzyme isincubated for 30 min at 20 �C in 96-W microplates with 1 lM ATP (including50 nCi c-[33P]-33P]-ATP/well) and 0.8 lM of pGS-2 peptide substrate (UpstateBiotechnology Inc.) in the presence of tested compound, and in HEPES buffer(40 mM, pH 7.4, supplemented with 200 lM EDTA, 10 mM MgCl2, 1 mM DTTand 0.1 mg/ml BSA). Enzymatic reaction is stopped by adding SPA-streptavidine beads (GE Healthcare) concentrated (6 mg/ml) in PBS(containing 20 mM ATP, 25 mM EDTA and 0.2% triton X-100) under 10 min.agitation. Radioactivity is measured by using a scintillation liquid reader (1450Microbeta™, Perkin–Elmer). IC50 values are calculated by non-linear regressionanalysis with Excel/XL fit software (IDBS).
7. Murray, M. Int. J. Mol. Med. 1999, 3, 227.8. Jalaie, M.; Holsworth, D. D. Mini-Rev. Med. Chem. 2005, 5, 1083.9. Data from screening panel have to be taken cautiously as false negative results
could be obtained with insoluble compounds. This can be seen for instancewith compounds 4 and 15.
10. Two protocols were used to determine CYP1A2 inhibition (Supplementary data2). Briefly: Panel rhCYP1A2 assay: evaluation of the inhibitory potency of newchemical entities using human recombinant CYP’s. Probe substrate bydetermination of IC50’s, in order, to investigate potential drug–druginteractions. CYP1A2 probe substrate 3-cyano-7-ethoxycoumarine (CEC)concentration: 0.4–50 lM. Fluorescent: Ex-410 nm Em-460 nm. KineticrhCYP1A2 assay: evaluation of the reversible and irreversible inhibitorypotency of new chemical entities using human recombinant CYP’s. Probesubstrate kinetics IC50 determination from 0 to 15 min in order to investigatepotential drug–drug interactions. Potential for irreversible inhibition beingdetermined as IC50 time course variation; CYP1A2 probe substrate 3-cyano-7-ethoxycoumarine (CEC) concentration: 0.002–40 lM. Fluorescent: Ex-410 nmEm-460 nm.
11. The synthesis of the compounds is described in: Dutruc-Rosset, G.; Lesuisse, D.;Rooney, T.; Halley, F. FR 2836915 A1; PCT Patent Publication No. WO2003/078403 A2; Chem. Abstr. 2003, 139, 246027.; Lesuisse, D.; Dutruc-Rosset, G.;Halley, F.; Babin, D.; Rooney, T.; Tiraboschi, G. PCT Patent Publication No.WO2004/062662 A1; Chem. Abstr. 2004, 141, 140438.; Lesuisse, D.; Dutruc-Rosset, G.; Halley, F.; Babin, D.; Rooney, T. PCT Patent Publication No. WO2004/022544 A; Chem. Abstr. 2004, 140, 253562.
12. Fontana, E.; Dansette, P. M.; Poli, S. M. Curr. Drug Metab. 2005, 6, 413; Zhou, S.;Chan, S. Y.; Goh, B. C.; Chan, E. i.; Duan, W.; Huang, M.; McLeod, H. L. Clin.Pharmacokinet. 2005, 44, 279.
13. Lopez-de-Brinas, E.; Lozano, J. J.; Centeno, N. B.; Segura, J.; Gonzalez, M.; de laTorre, R.; Sanz, F. Molecular Modeling and Prediction of Bioactivity, InProceedings of the European Symposium on Quantitative Structure–ActivityRelationships: Molecular Modeling and Prediction of Bioactivity, 12th ed.;Copenhagen, Denmark, Aug. 23–28, 1998 (2000), Meeting Date 1998, 141–146. Kluwer Academic/Plenum: New York, NY.
14. Lewis, D. F.; Lake, B. G.; George, S. G.; Dickins, M.; Eddershaw, P. J.; Tarbit, M.H.; Beresford, A. P.; Goldfarb, P. S.; Guengerich, F. P. Toxicology 1999, 139, 53.
15. Lewis, D. F. V.; Modi, S.; Dickins, M. Drug Metab. Rev. 2002, 34, 69.16. Riley, R. J.; Parker, A. J.; Trigg, S.; Manners, C. N. Pharm. Res. 2001, 18, 652.17. See for instance: Korhonen, L. E.; Rahnasto, M.; Maehoenen, N. J.; Wittekindt,
C.; Poso, A.; Juvonen, R. O.; Raunio, H. J. Med. Chem. 2005, 48, 3808; Lewis, D. F.V.; Lake, B. G.; Dickins, M. Xenobiotica 2004, 34, 501.
18. The compounds were ionized simulating a water solution at pH 7.5 using thepKa predicted with ACD/pKa DB (ACD/pKa DB version 8.0. Advanced ChemistryDevelopment Inc., Toronto ON, Canada, www.acdlabs.com, 2004). Aconformational search was performed using the MMF94s forcefield asimplemented in Molecular Operating Environment (MOE) software. (MOE,2004.03; Chemical Computing Group Inc.: Montreal, Quebec Canada, 2004).The 3D QSAR models were generated by the standard CoMFA methodimplemented in SYBYL 7.0 (SYBYL�, version 7.0, 1699, Tripos Inc., SouthHanley, St. Louis, Missouri 63144). A series of regression analysis wereperformed using the partial least square method and cross validated using theleave-one-out method using steric or electrostatic or both calculated fields asdescriptors. IC50’s obtained in the kinetic CYP1A2 assay were converted in pIC50
(where pIC50 = �Log (IC50)) and taken as dependent variables to generate themodels. The final selected model displayed an optimal number of fourcomponents (r2 = 0.97; q2 = 0.87; SD = 0.2) using only the steric fields asCoMFA descriptors). The list the of compounds and their predicted pIC50 arereported in Supplementary data Table 1. Due to the limited number ofavailable data no external validation set could be designed.
19. van de Waterbeemd, H.; Smith, D. A.; Beaumont, K.; Walker, Don K. J. Med.Chem. 2001, 44, 1313.
20. Gleeson, M. P. J. Med. Chem. 2008, 51, 817.21. Huskey, S.-E. W.; Doss, G. A.; Miller, R. R.; Schoen, W. R.; Chiu, S.-Hing. Drug
Metab. Disposit. 1994, 22, 651.22. Lewis, D. F. V. Guide to Cytochrome P450. Structure and Function, Taylor & Francis
(August 2001) p 77.23. This particular assay is performed at very low ATP concentration (1 lM) and
any IC50 above 50 nM is considered safe versus transcription inhibition.24. Briefly, brain slices (300 lm) are prepared from cerebral cortex of 10 week-old
rats, and slice suspension (50 ll/microtube) is incubated in DMEM (containingpyruvate and 4.5 g/l glucose) with tested compound in a final volume of 500 ll,for 120 min at 37 �C under mild agitation. Incubation is stopped bycentrifugation, followed by lysis and sonication at 4 �C. Lysates are thencentrifuged (18,000g, 15 min, 4 �C), and the supernatants are used for proteindosage, and subsequent western blotting analysis. SDS–PAGE electrophoresis isperformed in MOPS–SDS denaturating conditions; the phosphorylation of tauprotein is detected by using AD2 mouse monoclonal antibody specific forSer396/404 phosphoepitope as primary antibody, and peroxydase-labelledmouse antiserum as secondary antibody for measuring signal bychemioluminescence. Analysis of autoradiogrammes by ‘GeneTools’ software(Syngene, GeneGnome, Ozyme) was performed for IC50 estimation.
Copyright © 2022 FDOKUMEN